UNITED STATES
SECURITIES AND EXCHANGE COMMISSION
Washington, D.C. 20549
FORM N-CSR
CERTIFIED SHAREHOLDER REPORT OF REGISTERED
MANAGEMENT INVESTMENT COMPANIES
Investment Company Act file number 811-04367
Columbia Funds Series Trust I
(Exact name of registrant as specified in charter)
225 Franklin Street
Boston, Massachusetts 02110
(Address of principal executive offices) (Zip code)
Christopher O. Petersen, Esq.
c/o Columbia Management Investment Advisers, LLC
225 Franklin Street
Boston, Massachusetts 02110
Ryan C. Larrenaga, Esq.
c/o Columbia Management Investment Advisers, LLC
225 Franklin Street
Boston, MA 02110
(Name and address of agent for service)
Registrant’s telephone number, including area code: (800) 345-6611
Date of fiscal year end: April 30
Date of reporting period: April 30, 2018
Form N-CSR is to be used by management investment companies to file reports with the Commission not later than 10 days after the transmission to stockholders of any report that is required to be transmitted to stockholders under Rule 30e-1 under the Investment Company Act of 1940 (17 CFR 270.30e-1). The Commission may use the information provided on Form N-CSR in its regulatory, disclosure review, inspection, and policymaking roles.
A registrant is required to disclose the information specified by Form N-CSR, and the Commission will make this information public. A registrant is not required to respond to the collection of information contained in Form N-CSR unless the Form displays a currently valid Office of Management and Budget (“OMB”) control number. Please direct comments concerning the accuracy of the information collection burden estimate and any suggestions for reducing the burden to Secretary, Securities and Exchange Commission, 450 Fifth Street, NW, Washington, DC 20549-0609. The OMB has reviewed this collection of information under the clearance requirements of 44 U.S.C. § 3507.
EXPLANATORY NOTE - The Registrant is filing this amendment to its Form N-CSR for the period ended April 30, 2018, originally filed with the Securities and Exchange Commission on July 3, 2018 (Accession Number 0001193125-18-212081) to amend the financial highlights of series S000012097. The purpose of this amendment is to correct the headers displayed above the financial information in the financial highlights table.
Item 1. Reports to Stockholders.

Annual Report
April 30, 2018
Not FDIC Insured • No bank guarantee • May lose value
Dear Shareholders,
The year 2017 was an extraordinary year in the financial markets. The S&P 500 Index didn’t experience a single down month and returned over 20%. Continuing this trend, January 2018 marked the fastest start for the index ever. Low volatility, which had been a feature of the U.S. equity market for several years, along with the surge in the S&P 500 Index, drove investor sentiment to very high levels. This arguably set the stage for an overdue correction, which we witnessed in February 2018.
A return to volatility
There have been few periods of market upheaval such as were experienced in the first part of 2018. While investors were taken by surprise by the sudden and pronounced market swings, the return to some level of volatility actually marked a resumption of relatively normal market conditions. Having said that, it’s important to distinguish between a good technical correction where excess enthusiasm in the marketplace is being let out, versus a real change in the underlying fundamentals – things like an underperforming economy or weaker corporate earnings. Our view is that the recent market volatility falls into the former category, and the fundamentals remain strong. We’re continuing to see improvements in global economic activity, and we’re seeing corporate earnings expectations continue to rise – and not just because of tax reform.
Consistency is more important than ever
It’s important to keep in mind that when it comes to long-term investing, it’s the destination, not the journey that matters most. If you have a financial goal that you’ve worked out with your financial advisor, and you have a good asset allocation plan to reach it, it’s a question of sticking with your plan rather than become focused on near-term volatility. Bouts of volatility are normal. After all, it’s hard to cross the ocean without hitting an occasional rough patch. You need to focus on the destination.
One final thought. In weathering volatility, it’s the consistency of the return that is essential. Investors who chase higher returns are usually the first to sell when an investment goes through a bad patch, and they therefore don’t tend to benefit from the recovery. More disciplined investors who perhaps panic less or not at all during periods of volatility, tend to have improved long-term results and are more likely to reach their financial goals. Nothing is more important to us than making sure those who have entrusted us to protect and grow their assets are able to do what matters most to them.
Your success is our priority. Talk to your financial advisor about how working with Columbia Threadneedle Investments may help you position your portfolio for consistent, sustainable outcomes, no matter the market conditions.
Sincerely,
Christopher O. Petersen
President, Columbia Funds
The S&P 500 Index, an unmanaged index, measures the performance of 500 widely held, large-capitalization U.S. stocks and is frequently used as a general measure of market performance. Past performance is no guarantee of future results.
Columbia Funds are distributed by Columbia Management Investment Distributors, Inc., member FINRA, and managed by Columbia Management Investment Advisers, LLC.
© 2018 Columbia Management Investment Advisers, LLC. All rights reserved.
Columbia Bond Fund | Annual Report 2018
Columbia Bond Fund | Annual Report 2018
Investment objective
Columbia Bond Fund (the Fund) seeks current income, consistent with minimal fluctuation of principal.
Portfolio management
Jason Callan
Lead Portfolio Manager
Managed Fund since 2016
Gene Tannuzzo, CFA
Portfolio Manager
Managed Fund since November 2017
| Average annual total returns (%) (for the period ended April 30, 2018) |
| | | Inception | 1 Year | 5 Years | 10 Years |
| Class A | Excluding sales charges | 03/31/08 | -0.33 | 1.18 | 3.44 |
| | Including sales charges | | -5.04 | 0.20 | 2.94 |
| Advisor Class* | 11/08/12 | -0.08 | 1.43 | 3.70 |
| Class C | Excluding sales charges | 03/31/08 | -1.08 | 0.46 | 2.73 |
| | Including sales charges | | -2.05 | 0.46 | 2.73 |
| Institutional Class | 01/09/86 | -0.08 | 1.43 | 3.70 |
| Institutional 2 Class* | 11/08/12 | 0.13 | 1.54 | 3.76 |
| Institutional 3 Class* | 07/15/09 | 0.19 | 1.62 | 3.83 |
| Class R* | 11/16/11 | -0.58 | 0.92 | 3.12 |
| Class T* | Excluding sales charges | 09/27/10 | -0.33 | 1.18 | 3.46 |
| | Including sales charges | | -2.85 | 0.67 | 3.20 |
| Class V* | Excluding sales charges | 03/07/11 | -0.23 | 1.28 | 3.55 |
| | Including sales charges | | -4.95 | 0.30 | 3.05 |
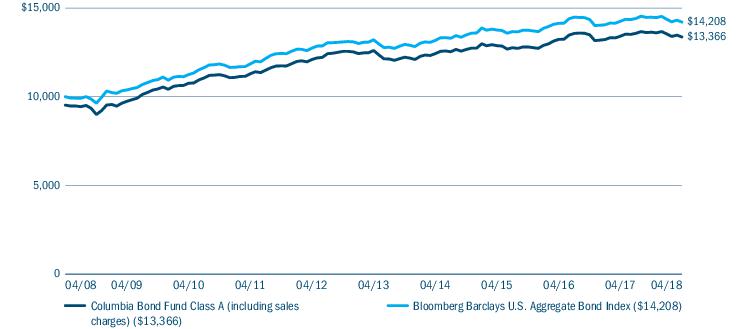
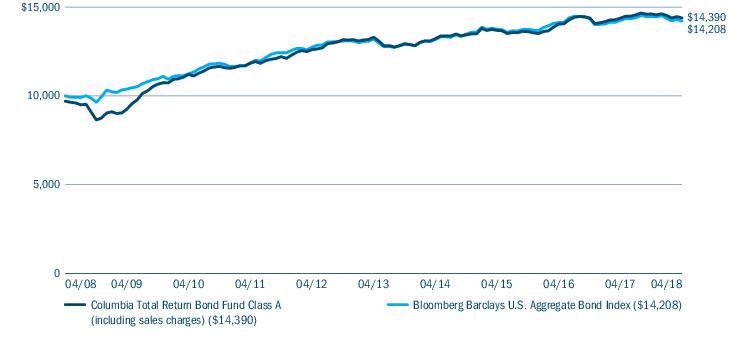
| Bloomberg Barclays U.S. Aggregate Bond Index | | -0.32 | 1.47 | 3.57 |
Returns for Class A and Class V shares are shown with and without the maximum initial sales charge of 4.75%. Returns for Class C shares are shown with and without the 1.00% contingent deferred sales charges for the first year only. The returns for Class T shares are shown with and without the maximum initial sales charge of 2.50% per transaction. The Fund’s other classes are not subject to sales charges and have limited eligibility. Effective November 1, 2017, Class R4, Class R5, Class Y and Class Z shares were renamed Advisor Class, Institutional 2 Class, Institutional 3 Class and Institutional Class shares, respectively. Please see the Fund’s prospectus for details. Performance for different share classes will vary based on differences in sales charges and fees associated with each class. All results shown assume reinvestment of distributions during the period. Returns do not reflect the deduction of taxes that a shareholder may pay on Fund distributions or on the redemption of Fund shares. Performance results reflect the effect of any fee waivers or reimbursements of Fund expenses by Columbia Management Investment Advisers, LLC and/or any of its affiliates. Absent these fee waivers or expense reimbursement arrangements, performance results would have been lower.
The performance information shown represents past performance and is not a guarantee of future results. The investment return and principal value of your investment will fluctuate so that your shares, when redeemed, may be worth more or less than their original cost. Current performance may be lower or higher than the performance information shown. You may obtain performance information current to the most recent month-end by contacting your financial intermediary, visiting columbiathreadneedleus.com/investor/ or calling 800.345.6611.
| * | The returns shown for periods prior to the share class inception date (including returns for the Life of the Fund, if shown, which are since Fund inception) include the returns of the Fund’s oldest share class. These returns are adjusted to reflect any higher class-related operating expenses of the newer share classes, as applicable. Please visit columbiathreadneedleus.com/investor/investment-products/mutual-funds/appended-performance for more information. |
The Bloomberg Barclays U.S. Aggregate Bond Index is a broad-based benchmark that measures the investment-grade, U.S. dollar-denominated, fixed-rate taxable bond market, including Treasuries, government-related and corporate securities, mortgage-backed securities (agency fixed-rate and hybrid adjustable-rate mortgage passthroughs), asset-backed securities, and commercial mortgage-backed securities.
Indices are not available for investment, are not professionally managed and do not reflect sales charges, fees, brokerage commissions, taxes or other expenses of investing. Securities in the Fund may not match those in an index.
| 2 | Columbia Bond Fund | Annual Report 2018 |
Fund at a Glance (continued)
Performance of a hypothetical $10,000 investment (April 30, 2008 — April 30, 2018)
The chart above shows the change in value of a hypothetical $10,000 investment in Class A shares of Columbia Bond Fund during the stated time period, and does not reflect the deduction of taxes that a shareholder may pay on Fund distributions or on the redemption of Fund shares.
| Portfolio breakdown (%) (at April 30, 2018) |
| Asset-Backed Securities — Agency | 3.9 |
| Asset-Backed Securities — Non-Agency | 22.3 |
| Commercial Mortgage-Backed Securities - Agency | 2.6 |
| Commercial Mortgage-Backed Securities - Non-Agency | 5.3 |
| Common Stocks | 0.0 (a) |
| Corporate Bonds & Notes | 20.3 |
| Foreign Government Obligations | 0.6 |
| Money Market Funds | 2.2 |
| Municipal Bonds | 0.3 |
| Residential Mortgage-Backed Securities - Agency | 23.8 |
| Residential Mortgage-Backed Securities - Non-Agency | 14.3 |
| U.S. Government & Agency Obligations | 3.3 |
| U.S. Treasury Obligations | 1.1 |
| Total | 100.0 |
Percentages indicated are based upon total investments. The Fund’s portfolio composition is subject to change.
| Quality breakdown (%) (at April 30, 2018) |
| AAA rating | 62.7 |
| AA rating | 7.4 |
| A rating | 9.2 |
| BBB rating | 14.3 |
| Not rated | 6.4 |
| Total | 100.0 |
Percentages indicated are based upon total fixed income investments (excluding Money Market Funds).
Bond ratings apply to the underlying holdings of the Fund and not the Fund itself and are divided into categories ranging from highest to lowest credit quality, determined by using the middle rating of Moody’s, S&P and Fitch, after dropping the highest and lowest available ratings. When ratings are available from only two rating agencies, the lower rating is used. When a rating is available from only one rating agency, that rating is used. When a bond is not rated by any rating agency, it is designated as “Not rated.” Credit quality ratings assigned by a rating agency are subjective opinions, not statements of fact, and are subject to change, including daily. The ratings assigned by credit rating agencies are but one of the considerations that the Investment Manager and/or Fund’s subadviser incorporates into its credit analysis process, along with such other issuer-specific factors as cash flows, capital structure and leverage ratios, ability to de-leverage (repay) through free cash flow, quality of management, market positioning and access to capital, as well as such security-specific factors as the terms of the security (e.g., interest rate and time to maturity) and the amount and type of any collateral.
Columbia Bond Fund | Annual Report 2018
| 3 |
Manager Discussion of Fund Performance
For the 12-month period that ended April 30, 2018, the Fund’s Class A shares returned -0.33% excluding sales charges. The Fund’s benchmark, the Bloomberg Barclays U.S. Aggregate Bond Index, returned -0.32% for the same period. The Fund’s relative performance was aided by positioning with respect to interest rates, allocation across segments of the bond market, and overall security selection.
Credit outperformed as Treasury yields rose
Performance across fixed-income markets for the 12 months ended April 30, 2018 was constrained by an upward move in Treasury yields, which weighed on bond prices. For much of the period, sentiment with respect to credit-oriented segments of the market continued to be supported by positive economic data and the Federal Reserve’s (the Fed) maintenance of an incremental approach as it seeks to restore interest rates to more historically normal levels.
Against a backdrop of strong corporate earnings growth and what is considered to be full employment, the U.S. economy posted annualized growth in the 3% range over each of the last three quarters of 2017. As 2017 drew to a close, risk sentiment was further boosted with the passage of legislation that lowered the maximum corporate tax rate from 35% to 21% and provided a temporary window for companies to accelerate the expensing of capital investments.
The Fed implemented a series of three 25 basis point rate hikes at its June 2017, December 2017 and March 2018 Open Market Committee meetings, which together raised the upper target for the federal funds rate to 1.75%. In addition, in October of 2017, the Fed began the process of allowing its mortgage-backed security and Treasury holdings acquired in the wake of the 2008 financial crisis to gradually roll off its balance sheet. The Fed’s tapering plan was well-signaled, and the markets had little reaction to the actual launch.
As 2018 opened, bond markets continued to rally on the back of the tax reform bill and quiescent inflation indicators. However, January wage growth data surprised to the upside, raising concerns that signs of a potential acceleration in inflation would lead the Fed to step up the pace of its rate hikes. While jitters around inflation eased fairly quickly, the markets were jarred again in early March as President Trump threatened tariffs on Chinese imports, raising the specter of a trade war with the potential to derail global growth. In late April, first quarter 2018 growth was reported at 2.3%, with the drop off from the prior three quarters generally attributed to seasonal factors.
Yields rose along the U.S. Treasury curve over the 12-month period ended April 30, 2018, and the yield curve flattened notably as shorter maturities experienced greater yield increases. To illustrate, the two-year Treasury yield rose 121 basis points from 1.28% to 2.49%, the 10-year rose 66 basis points from 2.29% to 2.95%, the 20-year rose 34 basis points from 2.67% to 3.01%, and the 30-year yield rose 15 basis points from 2.96% to 3.11%. Credit spreads (the incremental yield provided by lower rated bonds relative to comparable maturity U.S. Treasury bonds) narrowed modestly over the 12 months.
Contributors and detractors
The Fund’s performance in the period benefited from an underweighting of U.S. Treasuries, which were most directly and negatively impacted by the upward move in interest rates over the period. In turn, the Fund had overweight exposure to credit-oriented segments of the market, with respect to which sentiment was supported by the ongoing economic recovery and passage of tax reform legislation. In particular, a tilt toward non-agency residential mortgage-backed securities added to relative performance, as these issues benefited from the ongoing strengthening of the housing market and consumer balance sheets.
Security selection within investment-grade corporate securities added to performance, including a modest out-of-benchmark position in preferred securities that were more sensitive to changes in risk sentiment. With respect to the Fund’s allocation to asset-backed securities, performance benefited from a focus on floating rate issues, which experienced strong interest from investors concerned about the potential for higher interest rates.
The Fund’s below-benchmark positioning during the period with respect to overall portfolio duration (and corresponding sensitivity to interest rates) had a modestly positive impact on performance in a rising interest rate environment. In addition, the Fund was underweight in the 2-5 year segment of the yield curve, which was most impacted by rising interest rates.
| 4 | Columbia Bond Fund | Annual Report 2018 |
Manager Discussion of Fund Performance (continued)
We invested in highly-liquid, widely-traded Treasury futures and interest rate swap contracts to help manage portfolio duration. These enabled us to efficiently implement our yield curve opinions and offset unintended yield curve impacts from other investments in the portfolio. We also used indexed exposure to credit default swaps to manage the Fund’s overall level of credit risk. On a standalone basis, the Fund’s use of derivatives had a negative impact on performance during the period.
At period’s end
While the Fed is in the process of tightening monetary conditions, the stimulus baton has been picked up by fiscal policy in the form of lower taxes. This argues for the view that the current period of positive U.S. economic growth has some additional running room. That said, given the extended duration of the economic recovery, we adopted a somewhat cautious stance with respect to corporate credit. We view corporate America as displaying late-cycle characteristics as evidenced by an uptick in the use of leverage to finance mergers and acquisition activity in certain segments, such as food and beverage.
With the improvements in employment conditions and housing prices, the consumer appeared to us to be in an earlier stage of the credit cycle relative to corporations. In this vein, the Fund emphasized segments such as non-agency mortgage-backed securities and asset-backed securities, along with commercial mortgage-backed securities. With the recent rise in interest rates and the Fed continuing to pursue a gradual approach to interest rate normalization, we moved to an essentially neutral stance with respect to duration, as well as with respect to positioning along the yield curve.
Market risk may affect a single issuer, sector of the economy, industry or the market as a whole. Mortgage- and asset-backedsecurities are affected by interest rates, financial health of issuers/originators, creditworthiness of entities providing credit enhancements and the value of underlying assets. Fixed-income securities present issuer default risk. A rise in interest rates may result in a price decline of fixed-income instruments held by the Fund, negatively impacting its performance and NAV. Falling rates may result in the Fund investing in lower yielding debt instruments, lowering the Fund’s income and yield. These risks may be heightened for longer maturity and duration securities. Non-investment-grade (high-yield or junk) securities present greater price volatility and more risk to principal and income than higher rated securities. Prepayment and extension risk exists because the timing of payments on a loan, bond or other investment may accelerate when interest rates fall or decelerate when interest rates rise which may reduce investment opportunities and potential returns. Investing in derivatives is a specialized activity that involves special risks that subject the Fund to significant loss potential, including when used as leverage, and may result in greater fluctuation in Fund value. See the Fund’s prospectus for more information on these and other risks.
The views expressed in this report reflect the current views of the respective parties. These views are not guarantees of future performance and involve certain risks, uncertainties and assumptions that are difficult to predict, so actual outcomes and results may differ significantly from the views expressed. These views are subject to change at any time based upon economic, market or other conditions and the respective parties disclaim any responsibility to update such views. These views may not be relied on as investment advice and, because investment decisions for a Columbia fund are based on numerous factors, may not be relied on as an indication of trading intent on behalf of any particular Columbia fund. References to specific securities should not be construed as a recommendation or investment advice.
Columbia Bond Fund | Annual Report 2018
| 5 |
Understanding Your Fund’s Expenses
(Unaudited)
As an investor, you incur two types of costs. There are transaction costs, which generally include sales charges on purchases and may include redemption fees. There are also ongoing costs, which generally include management fees, distribution and/or service fees, and other fund expenses. The following information is intended to help you understand your ongoing costs (in dollars) of investing in the Fund and to help you compare these costs with the ongoing costs of investing in other mutual funds.
Analyzing your Fund’s expenses
To illustrate these ongoing costs, we have provided examples and calculated the expenses paid by investors in each share class of the Fund during the period. The actual and hypothetical information in the table is based on an initial investment of $1,000 at the beginning of the period indicated and held for the entire period. Expense information is calculated two ways and each method provides you with different information. The amount listed in the “Actual” column is calculated using the Fund’s actual operating expenses and total return for the period. You may use the Actual information, together with the amount invested, to estimate the expenses that you paid over the period. Simply divide your account value by $1,000 (for example, an $8,600 account value divided by $1,000 = 8.6), then multiply the results by the expenses paid during the period under the “Actual” column. The amount listed in the “Hypothetical” column assumes a 5% annual rate of return before expenses (which is not the Fund’s actual return) and then applies the Fund’s actual expense ratio for the period to the hypothetical return. You should not use the hypothetical account values and expenses to estimate either your actual account balance at the end of the period or the expenses you paid during the period. See “Compare with other funds” below for details on how to use the hypothetical data.
Compare with other funds
Since all mutual funds are required to include the same hypothetical calculations about expenses in shareholder reports, you can use this information to compare the ongoing cost of investing in the Fund with other funds. To do so, compare the hypothetical example with the 5% hypothetical examples that appear in the shareholder reports of other funds. As you compare hypothetical examples of other funds, it is important to note that hypothetical examples are meant to highlight the ongoing costs of investing in a fund only and do not reflect any transaction costs, such as sales charges, or redemption or exchange fees. Therefore, the hypothetical calculations are useful in comparing ongoing costs only, and will not help you determine the relative total costs of owning different funds. If transaction costs were included in these calculations, your costs would be higher.
| November 1, 2017 — April 30, 2018 |
| | Account value at the
beginning of the
period ($) | Account value at the
end of the
period ($) | Expenses paid during
the period ($) | Fund’s annualized
expense ratio (%) |
| | Actual | Hypothetical | Actual | Hypothetical | Actual | Hypothetical | Actual |
| Class A | 1,000.00 | 1,000.00 | 980.00 | 1,020.53 | 4.22 | 4.31 | 0.86 |
| Advisor Class | 1,000.00 | 1,000.00 | 981.20 | 1,021.77 | 3.00 | 3.06 | 0.61 |
| Class C | 1,000.00 | 1,000.00 | 977.50 | 1,016.81 | 7.89 | 8.05 | 1.61 |
| Institutional Class | 1,000.00 | 1,000.00 | 981.30 | 1,021.77 | 3.00 | 3.06 | 0.61 |
| Institutional 2 Class | 1,000.00 | 1,000.00 | 982.80 | 1,022.27 | 2.51 | 2.56 | 0.51 |
| Institutional 3 Class | 1,000.00 | 1,000.00 | 983.20 | 1,022.51 | 2.26 | 2.31 | 0.46 |
| Class R | 1,000.00 | 1,000.00 | 978.80 | 1,019.29 | 5.45 | 5.56 | 1.11 |
| Class T | 1,000.00 | 1,000.00 | 980.10 | 1,020.53 | 4.22 | 4.31 | 0.86 |
| Class V | 1,000.00 | 1,000.00 | 981.60 | 1,021.03 | 3.73 | 3.81 | 0.76 |
Expenses paid during the period are equal to the annualized expense ratio for each class as indicated above, multiplied by the average account value over the period and then multiplied by the number of days in the Fund’s most recent fiscal half year and divided by 365.
Expenses do not include fees and expenses incurred indirectly by the Fund from its investment in underlying funds, including affiliated and non-affiliated pooled investment vehicles, such as mutual funds and exchange-traded funds.
Had Columbia Management Investment Advisers, LLC and/or certain of its affiliates not waived/reimbursed certain fees and expenses, account value at the end of the period would have been reduced.
| 6 | Columbia Bond Fund | Annual Report 2018 |
Portfolio of Investments
April 30, 2018
(Percentages represent value of investments compared to net assets)
Investments in securities
| Asset-Backed Securities — Agency 4.5% |
| Issuer | Coupon
Rate | | Principal
Amount ($) | Value ($) |
| United States Small Business Administration |
| Series 2012-20G Class 1 |
| 07/01/2032 | 2.380% | | 234,424 | 229,224 |
| Series 2012-20I Class 1 |
| 09/01/2032 | 2.200% | | 243,011 | 235,947 |
| Series 2012-20J Class 1 |
| 10/01/2032 | 2.180% | | 919,811 | 891,995 |
| Series 2012-20L Class 1 |
| 12/01/2032 | 1.930% | | 267,143 | 257,110 |
| Series 2013-20E Class 1 |
| 05/01/2033 | 2.070% | | 153,839 | 148,412 |
| Series 2015-20C Class 1 |
| 03/01/2035 | 2.720% | | 85,572 | 84,080 |
| Series 2015-20E Class 1 |
| 05/01/2035 | 2.770% | | 366,995 | 354,003 |
| Series 2016-20K Class 1 |
| 11/01/2036 | 2.570% | | 3,483,674 | 3,389,267 |
| Series 2016-20L Class 1 |
| 12/01/2036 | 2.810% | | 2,244,083 | 2,204,738 |
| Series 2017-20A Class 1 |
| 01/01/2037 | 2.800% | | 3,810,988 | 3,694,062 |
| Series 2017-20B Class 1 |
| 02/01/2037 | 2.820% | | 1,264,524 | 1,224,314 |
| Series 2017-20E Class 1 |
| 05/01/2037 | 2.880% | | 180,742 | 176,370 |
| Series 2017-20G Class 1 |
| 07/01/2037 | 2.980% | | 1,171,298 | 1,142,060 |
| Series 2017-20H Class 1 |
| 08/01/2037 | 2.750% | | 1,003,390 | 968,884 |
| Series 2017-20I Class 1 |
| 09/01/2037 | 2.590% | | 1,758,964 | 1,682,032 |
| Series 2017-20K Class 1 |
| 11/01/2037 | 2.790% | | 1,855,000 | 1,795,958 |
Total Asset-Backed Securities — Agency
(Cost $18,981,891) | 18,478,456 |
|
| Asset-Backed Securities — Non-Agency 25.7% |
| | | | |
| Ally Master Owner Trust |
| Series 2015-3 Class A |
| 05/15/2020 | 1.630% | | 875,000 | 874,636 |
| Avis Budget Rental Car Funding AESOP LLC(a) |
| Series 2015-2A Class A |
| 12/20/2021 | 2.630% | | 1,195,000 | 1,175,756 |
| Asset-Backed Securities — Non-Agency (continued) |
| Issuer | Coupon
Rate | | Principal
Amount ($) | Value ($) |
| Bain Capital Credit CLO(a),(b) |
| Series 2018-1A Class B |
3-month USD LIBOR + 1.400%
04/23/2031 | 3.762% | | 2,000,000 | 1,994,216 |
| BMW Floorplan Master Owner Trust(a),(b) |
| Series 2015-1A Class A |
1-month USD LIBOR + 0.500%
07/15/2020 | 2.397% | | 981,000 | 981,619 |
| Cabela’s Credit Card Master Note Trust |
| Series 2015-2 Class A1 |
| 07/17/2023 | 2.250% | | 990,000 | 974,079 |
| Capital One Multi-Asset Execution Trust |
| Series 2015-A8 Class A8 |
| 08/15/2023 | 2.050% | | 1,075,000 | 1,053,174 |
| Series 2017-A3 Class A3 |
| 01/15/2025 | 2.430% | | 2,320,000 | 2,268,310 |
| Carlyle Group LP(a),(b) |
| Series 2017-5A Class A2 |
3-month USD LIBOR + 1.400%
01/20/2030 | 3.130% | | 2,000,000 | 1,986,094 |
| CarMax Auto Owner Trust |
| Series 2015-3 Class A3 |
| 05/15/2020 | 1.630% | | 606,196 | 603,895 |
| Series 2016-4 Class A2 |
| 11/15/2019 | 1.210% | | 226,368 | 225,948 |
| Cent CLO Ltd.(a),(b),(c),(d),(e) |
| Series 20 18-C17A Class A2R |
3-month USD LIBOR + 1.600%
04/30/2031 | 3.200% | | 1,800,000 | 1,799,100 |
| Chase Issuance Trust |
| Series 2012-A4 Class A4 |
| 08/16/2021 | 1.580% | | 860,000 | 848,057 |
| Chesapeake Funding II LLC(a) |
| Series 2016-1A Class A1 |
| 03/15/2028 | 2.110% | | 249,452 | 248,754 |
| Series 2016-2A Class A1 |
| 06/15/2028 | 1.880% | | 300,917 | 299,252 |
| Chesapeake Funding II LLC(a),(b) |
| Series 2016-2A Class A2 |
1-month USD LIBOR + 1.000%
06/15/2028 | 2.897% | | 481,467 | 483,038 |
| Series 2017-3A Class A2 |
1-month USD LIBOR + 0.340%
08/15/2029 | 2.237% | | 839,810 | 840,273 |
| Series 2017-4A Class A2 |
1-month USD LIBOR + 0.340%
11/15/2029 | 2.207% | | 910,000 | 908,967 |
The accompanying Notes to Financial Statements are an integral part of this statement.
Columbia Bond Fund | Annual Report 2018
| 7 |
Portfolio of Investments (continued)
April 30, 2018
| Asset-Backed Securities — Non-Agency (continued) |
| Issuer | Coupon
Rate | | Principal
Amount ($) | Value ($) |
| Chrysler Capital Auto Receivables Trust(a) |
| Series 2016-BA Class A2 |
| 01/15/2020 | 1.360% | | 28,480 | 28,462 |
| Citibank Credit Card Issuance Trust |
| Series 2014-A1 Class A1 |
| 01/23/2023 | 2.880% | | 3,455,000 | 3,450,567 |
| Series 2014-A6 Class A6 |
| 07/15/2021 | 2.150% | | 475,000 | 472,169 |
| CLUB Credit Trust(a) |
| Series 2017-P2 Class A |
| 01/15/2024 | 2.610% | | 2,796,573 | 2,786,455 |
| Series 2018-NP1 Class A |
| 05/15/2024 | 2.990% | | 2,536,569 | 2,535,229 |
| Conn’s Receivables Funding LLC(a) |
| Series 2017-B Class A |
| 07/15/2020 | 2.730% | | 2,614,791 | 2,613,295 |
| Consumer Loan Underlying Bond Credit Trust(a) |
| Series 2017-NP2 Class A |
| 01/16/2024 | 2.550% | | 994,294 | 993,345 |
| Dell Equipment Finance Trust(a),(b) |
| Series 2017-2 Class A2B |
1-month USD LIBOR + 0.300%
02/24/2020 | 2.198% | | 410,000 | 410,248 |
| Discover Card Execution Note Trust |
| Series 2017-A2 Class A2 |
| 07/15/2024 | 2.390% | | 1,125,000 | 1,098,505 |
| Dryden 57 CLO Ltd.(a),(b) |
| Series 2018-57A Class B |
3-month USD LIBOR + 1.350%
05/15/2031 | 3.240% | | 1,250,000 | 1,236,714 |
| Enterprise Fleet Financing LLC(a) |
| Series 2015-2 Class A2 |
| 02/22/2021 | 1.590% | | 54,746 | 54,711 |
| Ford Credit Auto Lease Trust |
| Series 2017-A Class A3 |
| 04/15/2020 | 1.880% | | 500,000 | 496,732 |
| Ford Credit Auto Owner Trust(a) |
| Series 2015-2 Class A |
| 01/15/2027 | 2.440% | | 970,000 | 958,568 |
| Series 2016-1 Class A |
| 08/15/2027 | 2.310% | | 4,830,000 | 4,731,328 |
| Series 2017-1 Class A |
| 08/15/2028 | 2.620% | | 2,000,000 | 1,960,817 |
| Series 2017-2 Class A |
| 03/15/2029 | 2.360% | | 1,225,000 | 1,182,894 |
| Ford Credit Floorplan Master Owner Trust(a) |
| Series 2013-2 Class A |
| 03/15/2022 | 2.090% | | 1,570,000 | 1,545,026 |
| Asset-Backed Securities — Non-Agency (continued) |
| Issuer | Coupon
Rate | | Principal
Amount ($) | Value ($) |
| Ford Credit Floorplan Master Owner Trust |
| Series 2017-3 Class A |
| 09/15/2024 | 2.480% | | 1,525,000 | 1,481,121 |
| GM Financial Automobile Leasing Trust |
| Series 2015-3 Class A3 |
| 03/20/2019 | 1.690% | | 88,027 | 87,976 |
| Series 2016-3 Class A2A |
| 02/20/2019 | 1.350% | | 62,851 | 62,816 |
| Series 2017-3 Class A3 |
| 11/20/2020 | 2.010% | | 251,000 | 248,156 |
| GM Financial Consumer Automobile Receivables Trust(a) |
| Series 2017-3A Class A3 |
| 05/16/2022 | 1.970% | | 1,690,000 | 1,663,257 |
| GMF Floorplan Owner Revolving Trust(a),(b) |
| Series 2016-1 Class A2 |
1-month USD LIBOR + 0.850%
05/17/2021 | 2.747% | | 730,000 | 734,847 |
| Harley-Davidson Motorcycle Trust |
| Series 2015-1 Class A3 |
| 06/15/2020 | 1.410% | | 92,943 | 92,689 |
| Hertz Fleet Lease Funding LP(a),(b) |
| Series 2016-1 Class A1 |
1-month USD LIBOR + 1.100%
04/10/2030 | 2.997% | | 1,367,709 | 1,372,284 |
| Series 2017-1 Class A1 |
1-month USD LIBOR + 0.650%
04/10/2031 | 2.547% | | 505,000 | 505,378 |
| Hertz Vehicle Financing II LP(a) |
| Series 2015-3A Class A |
| 09/25/2021 | 2.670% | | 1,000,000 | 984,260 |
| Series 2016-2A Class A |
| 03/25/2022 | 2.950% | | 700,000 | 688,470 |
| Honda Auto Receivables Owner Trust |
| Series 2015-2 Class A3 |
| 02/21/2019 | 1.040% | | 22 | 22 |
| Hyundai Auto Receivables Trust |
| Series 2017-A Class A2A |
| 02/18/2020 | 1.480% | | 813,508 | 810,733 |
| Hyundai Floorplan Master Owner Trust(a),(b) |
| Series 2016-1A Class A1 |
1-month USD LIBOR + 0.900%
03/15/2021 | 2.797% | | 330,000 | 332,013 |
| Kubota Credit Owner Trust(a) |
| Series 2016-1A Class A2 |
| 04/15/2019 | 1.250% | | 52,129 | 52,087 |
| Madison Park Funding XXVII Ltd.(a),(b) |
| Series 2018-27A Class A2 |
3-month USD LIBOR + 1.350%
04/20/2030 | 3.397% | | 3,700,000 | 3,660,980 |
The accompanying Notes to Financial Statements are an integral part of this statement.
| 8 | Columbia Bond Fund | Annual Report 2018 |
Portfolio of Investments (continued)
April 30, 2018
| Asset-Backed Securities — Non-Agency (continued) |
| Issuer | Coupon
Rate | | Principal
Amount ($) | Value ($) |
| Marlette Funding Trust(a) |
| Series 2018-1A Class A |
| 03/15/2028 | 2.610% | | 3,263,305 | 3,255,873 |
| Mercedes-Benz Auto Lease Trust |
| Series 2016-B Class A2 |
| 01/15/2019 | 1.150% | | 14,929 | 14,922 |
| New York City Tax Lien Trust(a) |
| Series 2016-A Class A |
| 11/10/2029 | 1.470% | | 74,324 | 73,662 |
| NextGear Floorplan Master Owner Trust(a),(b) |
| Series 2017-2A Class A1 |
1-month USD LIBOR + 0.680%
10/17/2022 | 2.577% | | 440,000 | 434,364 |
| NextGear Floorplan Master Owner Trust(a) |
| Series 2017-2A Class A2 |
| 10/17/2022 | 2.560% | | 730,000 | 718,230 |
| Nissan Auto Lease Trust |
| Series 2016-B Class A2A |
| 12/17/2018 | 1.260% | | 36,568 | 36,552 |
| Series 2017-B Class A3 |
| 09/15/2020 | 2.050% | | 870,000 | 860,809 |
| Nissan Auto Receivables Owner Trust |
| Series 2016-A Class A3 |
| 10/15/2020 | 1.340% | | 467,311 | 463,999 |
| Nissan Master Owner Trust Receivables(b) |
| Series 2017-A Class A |
1-month USD LIBOR + 0.310%
04/15/2021 | 2.207% | | 1,445,000 | 1,446,519 |
| Octagon Investment Partners 35 Ltd.(a),(b) |
| Series 2018-1A Class A2 |
3-month USD LIBOR + 1.400%
01/20/2031 | 3.148% | | 1,820,000 | 1,818,387 |
| Octagon Investment Partners XV Ltd.(a),(b) |
| Series 2013-1A Class A1AR |
3-month USD LIBOR + 1.210%
07/19/2030 | 3.565% | | 2,500,000 | 2,504,795 |
| Octagon Investment Partners XXII Ltd.(a),(b) |
| Series 2014-1A Class BRR |
3-month USD LIBOR + 1.450%
01/22/2030 | 3.812% | | 4,000,000 | 3,972,924 |
| OneMain Financial Issuance Trust(a) |
| Series 2018-1A Class A |
| 03/14/2029 | 3.300% | | 2,140,000 | 2,133,804 |
| OZLM XXI(a),(b) |
| Series 2017-21A Class A1 |
3-month USD LIBOR + 1.150%
01/20/2031 | 2.903% | | 2,500,000 | 2,500,295 |
| Prosper Marketplace Issuance Trust(a) |
| Series 2018-1A Class A |
| 06/17/2024 | 3.110% | | 4,500,000 | 4,496,013 |
| Asset-Backed Securities — Non-Agency (continued) |
| Issuer | Coupon
Rate | | Principal
Amount ($) | Value ($) |
| RR 3 Ltd.(a),(b) |
| Series 2014-14A Class A1R2 |
3-month USD LIBOR + 1.090%
01/15/2030 | 3.438% | | 4,500,000 | 4,513,549 |
| SoFi Consumer Loan Program LLC(a) |
| Series 2017-3 Class A |
| 05/25/2026 | 2.770% | | 1,282,009 | 1,269,456 |
| SoFi Consumer Loan Program Trust(a) |
| Series 20 18-2 Class A1 |
| 04/26/2027 | 2.930% | | 3,000,000 | 2,999,763 |
| Series 2018-1 Class A1 |
| 02/25/2027 | 2.550% | | 1,920,750 | 1,912,529 |
| SoFi Professional Loan Program LLC(a) |
| Series 2016-A |
| 12/26/2036 | 2.760% | | 715,688 | 706,553 |
| Stewart Park CLO Ltd.(a),(b) |
| Series 2017-1A Class A2R |
3-month USD LIBOR + 1.250%
01/15/2030 | 3.598% | | 3,000,000 | 3,015,570 |
| Synchrony Credit Card Master Note Trust |
| Series 2016-1 Class A |
| 03/15/2022 | 2.040% | | 1,295,000 | 1,288,262 |
| Series 2017-2 Class A |
| 10/15/2025 | 2.620% | | 800,000 | 777,898 |
| USAA Auto Owner Trust |
| Series 2017-1 Class A3 |
| 05/17/2021 | 1.700% | | 565,000 | 558,072 |
| Volvo Financial Equipment LLC(a) |
| Series 2015-1A Class A3 |
| 06/17/2019 | 1.510% | | 120,522 | 120,410 |
| Volvo Financial Equipment Master Owner Trust(a),(b) |
| Series 2017-A Class A |
1-month USD LIBOR + 0.500%
11/15/2022 | 2.397% | | 450,000 | 451,146 |
| Voya Ltd.(a),(b) |
| Series 2012-4A Class A1R |
3-month USD LIBOR + 1.450%
10/15/2028 | 3.798% | | 1,500,000 | 1,505,955 |
| Wheels SPV 2 LLC(a) |
| Series 2016-1A Class A2 |
| 05/20/2025 | 1.590% | | 144,539 | 143,725 |
| World Financial Network Credit Card Master Trust |
| Series 2012-D Class A |
| 04/17/2023 | 2.150% | | 790,000 | 784,149 |
| Series 2015-B Class A |
| 06/17/2024 | 2.550% | | 1,815,000 | 1,792,106 |
| World Omni Auto Receivables Trust |
| Series 2017-A Class A3 |
| 09/15/2022 | 1.930% | | 1,440,000 | 1,419,650 |
The accompanying Notes to Financial Statements are an integral part of this statement.
Columbia Bond Fund | Annual Report 2018
| 9 |
Portfolio of Investments (continued)
April 30, 2018
| Asset-Backed Securities — Non-Agency (continued) |
| Issuer | Coupon
Rate | | Principal
Amount ($) | Value ($) |
| World Omni Automobile Lease Securitization Trust(b) |
| Series 2016-A2B Class A2B |
1-month USD LIBOR + 0.410%
02/15/2019 | 2.307% | | 78,897 | 78,924 |
Total Asset-Backed Securities — Non-Agency
(Cost $105,712,293) | 104,966,187 |
|
| Commercial Mortgage-Backed Securities - Agency 2.9% |
| | | | |
| Federal Home Loan Mortgage Corp. |
| Series K724 Class A1 |
| 03/25/2023 | 2.776% | | 5,338,796 | 5,289,297 |
| Federal Home Loan Mortgage Corp. Multifamily Structured Pass-Through Certificates(f) |
| Series 2017-K070 Class A2 |
| 11/25/2027 | 3.303% | | 2,150,000 | 2,125,846 |
| Federal National Mortgage Association(f) |
| Series 2017-M15 Class ATS2 |
| 11/25/2027 | 3.196% | | 4,750,000 | 4,620,366 |
Total Commercial Mortgage-Backed Securities - Agency
(Cost $12,441,986) | 12,035,509 |
|
| Commercial Mortgage-Backed Securities - Non-Agency 6.1% |
| | | | |
| American Homes 4 Rent Trust(a) |
| Series 2014-SFR2 Class A |
| 10/17/2036 | 3.786% | | 2,567,543 | 2,582,158 |
| Series 2014-SFR3 Class A |
| 12/17/2036 | 3.678% | | 2,923,945 | 2,923,340 |
| Series 2015-SFR2 Class A |
| 10/17/2045 | 3.732% | | 258,468 | 258,825 |
| BX Commercial Mortgage Trust(a),(b) |
| Series 2018-BIOA Class A |
1-month USD LIBOR + 0.671%
03/15/2037 | 2.321% | | 2,000,000 | 1,998,082 |
| CHT 2017-COSMO Mortgage Trust(a),(b) |
| Series 2017-CSMO Class C |
1-month USD LIBOR + 1.500%
11/15/2036 | 3.397% | | 1,600,000 | 1,605,971 |
| Colony Multifamily Mortgage Trust(a) |
| Series 2014-1 Class A |
| 04/20/2050 | 2.543% | | 458,083 | 455,520 |
| Credit Suisse Mortgage Capital Trust(a) |
| Series 2014-USA Class A2 |
| 09/15/2037 | 3.953% | | 1,700,000 | 1,705,007 |
| Invitation Homes Trust(a),(b),(e) |
| Series 2018-SFR2 Class A |
1-month USD LIBOR + 0.800%
06/17/2037 | 2.796% | | 2,850,000 | 2,851,672 |
| JPMBB Commercial Mortgage Securities Trust |
| Series 2013-C14 Class A4 |
| 08/15/2046 | 4.133% | | 1,305,000 | 1,347,203 |
| Commercial Mortgage-Backed Securities - Non-Agency (continued) |
| Issuer | Coupon
Rate | | Principal
Amount ($) | Value ($) |
| JPMorgan Chase Commercial Mortgage Securities Trust |
| Series 2012-C6 Class A3 |
| 05/15/2045 | 3.507% | | 1,231,134 | 1,236,434 |
| Morgan Stanley Bank of America Merrill Lynch Trust |
| Series 2013-C12 Class A4 |
| 10/15/2046 | 4.259% | | 2,608,000 | 2,701,635 |
| Progress Residential Trust(a) |
| Series 2017-SFR1 Class A |
| 08/17/2034 | 2.768% | | 718,306 | 705,825 |
| Series 2018-SFR1 Class A |
| 03/17/2035 | 3.255% | | 1,685,000 | 1,653,023 |
| UBS Commercial Mortgage Trust(a),(b) |
| Series 2018-NYCH Class A |
1-month USD LIBOR + 0.850%
02/15/2032 | 2.747% | | 2,000,000 | 2,010,017 |
| Series 2018-NYCH Class B |
1-month USD LIBOR + 1.250%
02/15/2032 | 3.147% | | 900,000 | 904,453 |
Total Commercial Mortgage-Backed Securities - Non-Agency
(Cost $25,222,763) | 24,939,165 |
| Common Stocks 0.0% |
| Issuer | Shares | Value ($) |
| Consumer Staples —% |
| Beverages —% |
| Crimson Wine Group Ltd.(g) | 3 | 28 |
| Total Consumer Staples | 28 |
| Financials —% |
| Diversified Financial Services —% |
| Leucadia National Corp. | 39 | 937 |
| Total Financials | 937 |
Total Common Stocks
(Cost $—) | 965 |
| Corporate Bonds & Notes 23.4% |
| Issuer | Coupon
Rate | | Principal
Amount ($) | Value ($) |
| Aerospace & Defense 0.8% |
| Lockheed Martin Corp. |
| 03/01/2045 | 3.800% | | 525,000 | 485,687 |
| 09/15/2052 | 4.090% | | 310,000 | 294,196 |
| Northrop Grumman Corp. |
| 01/15/2025 | 2.930% | | 1,090,000 | 1,032,644 |
| 01/15/2028 | 3.250% | | 685,000 | 641,551 |
| 10/15/2047 | 4.030% | | 730,000 | 679,847 |
| Total | 3,133,925 |
The accompanying Notes to Financial Statements are an integral part of this statement.
| 10 | Columbia Bond Fund | Annual Report 2018 |
Portfolio of Investments (continued)
April 30, 2018
| Corporate Bonds & Notes (continued) |
| Issuer | Coupon
Rate | | Principal
Amount ($) | Value ($) |
| Automotive 0.3% |
| Ford Motor Co. |
| 12/08/2046 | 5.291% | | 420,000 | 403,413 |
| Ford Motor Credit Co. LLC |
| 11/02/2020 | 2.343% | | 860,000 | 837,288 |
| Total | 1,240,701 |
| Banking 3.7% |
| Bank of America Corp.(h) |
| 01/20/2028 | 3.824% | | 2,690,000 | 2,618,282 |
| Capital One Financial Corp. |
| 05/12/2020 | 2.500% | | 1,150,000 | 1,132,839 |
| HBOS PLC(a) |
| Subordinated |
| 05/21/2018 | 6.750% | | 1,395,000 | 1,398,043 |
| HSBC Holdings PLC |
| 01/14/2022 | 4.875% | | 515,000 | 538,777 |
| JPMorgan Chase & Co.(h) |
| 02/01/2028 | 3.782% | | 6,265,000 | 6,071,468 |
| JPMorgan Chase & Co.(b) |
| Junior Subordinated |
3-month USD LIBOR + 0.950%
02/02/2037 | 2.728% | | 362,000 | 329,601 |
| Wells Fargo & Co. |
| 01/30/2020 | 2.150% | | 855,000 | 843,445 |
| 10/23/2026 | 3.000% | | 2,320,000 | 2,137,432 |
| Total | 15,069,887 |
| Cable and Satellite 0.3% |
| Charter Communications Operating LLC/Capital Corp. |
| 10/23/2035 | 6.384% | | 535,000 | 583,447 |
| Comcast Corp. |
| 08/15/2047 | 4.000% | | 720,000 | 661,167 |
| Total | 1,244,614 |
| Chemicals 0.3% |
| LYB International Finance BV |
| 07/15/2043 | 5.250% | | 270,000 | 289,154 |
| LYB International Finance II BV |
| 03/02/2027 | 3.500% | | 737,000 | 699,101 |
| LyondellBasell Industries NV |
| 04/15/2024 | 5.750% | | 343,000 | 372,699 |
| Total | 1,360,954 |
| Consumer Cyclical Services 0.3% |
| Amazon.com, Inc.(a) |
| 02/22/2023 | 2.400% | | 1,135,000 | 1,088,782 |
| Corporate Bonds & Notes (continued) |
| Issuer | Coupon
Rate | | Principal
Amount ($) | Value ($) |
| Electric 3.1% |
| Baltimore Gas & Electric Co. |
| 06/15/2033 | 5.200% | | 285,000 | 311,873 |
| CMS Energy Corp. |
| 03/01/2024 | 3.875% | | 485,000 | 485,771 |
| 02/15/2027 | 2.950% | | 15,000 | 13,757 |
| 08/15/2027 | 3.450% | | 405,000 | 387,520 |
| Commonwealth Edison Co. |
| 03/15/2036 | 5.900% | | 325,000 | 403,041 |
| Consolidated Edison Co. of New York, Inc. |
| 08/15/2037 | 6.300% | | 315,000 | 402,492 |
| DTE Energy Co. |
| 10/01/2026 | 2.850% | | 1,585,000 | 1,441,290 |
| Duke Energy Corp. |
| 08/15/2027 | 3.150% | | 585,000 | 546,102 |
| Duke Energy Florida Project Finance LLC |
| 09/01/2029 | 2.538% | | 1,525,000 | 1,403,302 |
| Duke Energy Progress LLC |
| 09/15/2047 | 3.600% | | 260,000 | 242,297 |
| Duke Energy Progress, Inc. |
| 08/15/2045 | 4.200% | | 68,000 | 69,597 |
| E.ON International Finance BV(a) |
| 04/30/2038 | 6.650% | | 325,000 | 410,378 |
| Emera U.S. Finance LP |
| 06/15/2046 | 4.750% | | 1,720,000 | 1,712,317 |
| Enel Finance International NV(a) |
| 05/25/2047 | 4.750% | | 515,000 | 515,708 |
| Indiana Michigan Power Co. |
| 07/01/2047 | 3.750% | | 206,000 | 190,850 |
| Nevada Power Co. |
| 09/15/2040 | 5.375% | | 314,000 | 364,978 |
| Pacific Gas & Electric Co.(a) |
| 12/01/2027 | 3.300% | | 1,194,000 | 1,113,848 |
| 12/01/2047 | 3.950% | | 955,000 | 869,522 |
| Southern Co. (The) |
| 07/01/2026 | 3.250% | | 612,000 | 574,475 |
| 07/01/2036 | 4.250% | | 350,000 | 350,852 |
| WEC Energy Group, Inc. |
| 06/15/2025 | 3.550% | | 150,000 | 147,634 |
| Xcel Energy, Inc. |
| 06/01/2025 | 3.300% | | 665,000 | 644,431 |
| Total | 12,602,035 |
The accompanying Notes to Financial Statements are an integral part of this statement.
Columbia Bond Fund | Annual Report 2018
| 11 |
Portfolio of Investments (continued)
April 30, 2018
| Corporate Bonds & Notes (continued) |
| Issuer | Coupon
Rate | | Principal
Amount ($) | Value ($) |
| Finance Companies 1.1% |
| GE Capital International Funding Co. Unlimited Co. |
| 11/15/2020 | 2.342% | | 2,885,000 | 2,820,939 |
| 11/15/2035 | 4.418% | | 1,720,000 | 1,648,556 |
| Total | 4,469,495 |
| Food and Beverage 1.4% |
| Anheuser-Busch InBev Finance, Inc. |
| 02/01/2046 | 4.900% | | 787,000 | 815,380 |
| Anheuser-Busch InBev Worldwide, Inc. |
| 04/15/2058 | 4.750% | | 271,000 | 271,103 |
| Bacardi Ltd.(a) |
| 05/15/2048 | 5.300% | | 2,050,000 | 2,022,399 |
| Kraft Heinz Foods Co. |
| 06/01/2046 | 4.375% | | 1,708,000 | 1,525,883 |
| Molson Coors Brewing Co. |
| 07/15/2046 | 4.200% | | 877,000 | 803,222 |
| Tyson Foods, Inc.(b) |
3-month USD LIBOR + 0.450%
08/21/2020 | 2.342% | | 460,000 | 460,742 |
| Total | 5,898,729 |
| Health Care 1.2% |
| Becton Dickinson and Co.(b) |
3-month USD LIBOR + 1.030%
06/06/2022 | 3.055% | | 963,000 | 968,205 |
| Becton Dickinson and Co. |
| 06/06/2027 | 3.700% | | 570,000 | 540,541 |
| 05/15/2044 | 4.875% | | 575,000 | 554,809 |
| Cardinal Health, Inc. |
| 06/15/2027 | 3.410% | | 810,000 | 752,099 |
| 06/15/2047 | 4.368% | | 520,000 | 485,910 |
| CVS Health Corp. |
| 03/25/2048 | 5.050% | | 645,000 | 658,678 |
| Express Scripts Holding Co. |
| 07/15/2046 | 4.800% | | 705,000 | 692,413 |
| New York and Presbyterian Hospital (The) |
| 08/01/2036 | 3.563% | | 245,000 | 231,105 |
| Total | 4,883,760 |
| Independent Energy 0.3% |
| Canadian Natural Resources Ltd. |
| 06/30/2033 | 6.450% | | 110,000 | 129,420 |
| Hess Corp. |
| 02/15/2041 | 5.600% | | 180,000 | 182,118 |
| Noble Energy, Inc. |
| 04/01/2027 | 8.000% | | 809,000 | 988,137 |
| Total | 1,299,675 |
| Corporate Bonds & Notes (continued) |
| Issuer | Coupon
Rate | | Principal
Amount ($) | Value ($) |
| Integrated Energy 0.2% |
| Cenovus Energy, Inc. |
| 11/15/2039 | 6.750% | | 855,000 | 972,057 |
| Life Insurance 0.9% |
| Brighthouse Financial, Inc.(a) |
| 06/22/2047 | 4.700% | | 875,000 | 767,682 |
| Massachusetts Mutual Life Insurance Co.(a) |
| Subordinated |
| 04/15/2065 | 4.500% | | 300,000 | 287,952 |
| MetLife, Inc.(a),(h) |
| Junior Subordinated |
| 04/08/2068 | 9.250% | | 41,000 | 55,903 |
| Northwestern Mutual Life Insurance Co. (The)(a) |
| Subordinated |
| 09/30/2047 | 3.850% | | 650,000 | 604,150 |
| Teachers Insurance & Annuity Association of America(a) |
| Subordinated |
| 09/15/2044 | 4.900% | | 110,000 | 117,332 |
| 05/15/2047 | 4.270% | | 745,000 | 724,890 |
| Voya Financial, Inc. |
| 06/15/2026 | 3.650% | | 650,000 | 621,203 |
| 06/15/2046 | 4.800% | | 329,000 | 326,720 |
| Total | 3,505,832 |
| Media and Entertainment 0.0% |
| Discovery Communications LLC |
| 09/20/2047 | 5.200% | | 132,000 | 129,155 |
| Midstream 0.9% |
| Kinder Morgan Energy Partners LP |
| 03/15/2032 | 7.750% | | 190,000 | 234,673 |
| 01/15/2038 | 6.950% | | 195,000 | 230,718 |
| 11/15/2040 | 7.500% | | 350,000 | 427,572 |
| Kinder Morgan, Inc. |
| 02/15/2046 | 5.050% | | 1,155,000 | 1,110,405 |
| Plains All American Pipeline LP/Finance Corp. |
| 10/15/2023 | 3.850% | | 660,000 | 642,386 |
| 05/15/2036 | 6.700% | | 226,000 | 242,187 |
| 06/01/2042 | 5.150% | | 405,000 | 379,817 |
| 02/15/2045 | 4.900% | | 371,000 | 340,709 |
| Southern Natural Gas Co. LLC |
| 03/01/2032 | 8.000% | | 195,000 | 250,789 |
| Total | 3,859,256 |
| Natural Gas 0.8% |
| Boston Gas Co.(a) |
| 08/01/2027 | 3.150% | | 800,000 | 758,408 |
The accompanying Notes to Financial Statements are an integral part of this statement.
| 12 | Columbia Bond Fund | Annual Report 2018 |
Portfolio of Investments (continued)
April 30, 2018
| Corporate Bonds & Notes (continued) |
| Issuer | Coupon
Rate | | Principal
Amount ($) | Value ($) |
| NiSource, Inc. |
| 02/15/2023 | 3.850% | | 685,000 | 688,481 |
| 02/15/2044 | 4.800% | | 50,000 | 52,276 |
| 05/15/2047 | 4.375% | | 991,000 | 980,435 |
| Sempra Energy |
| 11/15/2025 | 3.750% | | 565,000 | 556,373 |
| 06/15/2027 | 3.250% | | 92,000 | 86,326 |
| Total | 3,122,299 |
| Other Industry 0.4% |
| Massachusetts Institute of Technology |
| 07/01/2116 | 3.885% | | 300,000 | 272,642 |
| President and Fellows of Harvard College |
| 10/01/2037 | 3.619% | | 315,000 | 309,718 |
| 07/15/2046 | 3.150% | | 314,000 | 280,252 |
| 07/15/2056 | 3.300% | | 685,000 | 621,698 |
| Total | 1,484,310 |
| Pharmaceuticals 1.8% |
| AbbVie, Inc. |
| 05/14/2020 | 2.500% | | 635,000 | 627,254 |
| Allergan Funding SCS |
| 03/15/2025 | 3.800% | | 1,681,000 | 1,615,296 |
| Amgen, Inc. |
| 05/22/2019 | 2.200% | | 2,911,000 | 2,895,458 |
| 05/01/2045 | 4.400% | | 325,000 | 315,333 |
| 06/15/2048 | 4.563% | | 277,000 | 274,007 |
| Celgene Corp. |
| 02/20/2048 | 4.550% | | 350,000 | 329,744 |
| Gilead Sciences, Inc. |
| 09/20/2019 | 1.850% | | 445,000 | 439,297 |
| Johnson & Johnson |
| 12/05/2033 | 4.375% | | 427,000 | 456,476 |
| 03/03/2037 | 3.625% | | 525,000 | 512,292 |
| Total | 7,465,157 |
| Property & Casualty 0.4% |
| CNA Financial Corp. |
| 08/15/2027 | 3.450% | | 1,748,000 | 1,638,332 |
| Railroads 0.6% |
| Canadian National Railway Co. |
| 02/03/2020 | 2.400% | | 955,000 | 947,787 |
| CSX Corp. |
| 06/01/2027 | 3.250% | | 330,000 | 311,975 |
| 05/30/2042 | 4.750% | | 168,000 | 174,939 |
| 11/01/2046 | 3.800% | | 270,000 | 243,816 |
| 11/01/2066 | 4.250% | | 638,000 | 566,163 |
| Total | 2,244,680 |
| Corporate Bonds & Notes (continued) |
| Issuer | Coupon
Rate | | Principal
Amount ($) | Value ($) |
| Restaurants 0.1% |
| McDonald’s Corp. |
| 03/01/2047 | 4.450% | | 520,000 | 522,151 |
| Supermarkets 0.4% |
| Kroger Co. (The) |
| 04/15/2042 | 5.000% | | 172,000 | 169,341 |
| 01/15/2048 | 4.650% | | 1,358,000 | 1,274,782 |
| Total | 1,444,123 |
| Technology 1.9% |
| Apple, Inc. |
| 09/12/2027 | 2.900% | | 632,000 | 594,775 |
| 09/12/2047 | 3.750% | | 385,000 | 359,452 |
| Broadcom Corp./Cayman Finance Ltd. |
| 01/15/2027 | 3.875% | | 3,770,000 | 3,599,559 |
| Cisco Systems, Inc.(b) |
3-month USD LIBOR + 0.340%
09/20/2019 | 2.542% | | 1,430,000 | 1,435,148 |
| Oracle Corp. |
| 11/15/2027 | 3.250% | | 1,355,000 | 1,303,855 |
| 11/15/2047 | 4.000% | | 545,000 | 529,162 |
| Total | 7,821,951 |
| Tobacco 0.3% |
| BAT Capital Corp.(a) |
| 08/14/2020 | 2.297% | | 1,150,000 | 1,125,245 |
| Transportation Services 0.4% |
| ERAC U.S.A. Finance LLC(a) |
| 12/01/2026 | 3.300% | | 480,000 | 454,178 |
| 03/15/2042 | 5.625% | | 443,000 | 494,277 |
| 11/01/2046 | 4.200% | | 287,000 | 264,255 |
| FedEx Corp. |
| 04/01/2046 | 4.550% | | 600,000 | 590,930 |
| Total | 1,803,640 |
| Wireless 0.7% |
| America Movil SAB de CV |
| 03/30/2020 | 5.000% | | 1,515,000 | 1,561,765 |
| Sprint Spectrum Co. I/II/III LLC(a) |
| 09/20/2021 | 3.360% | | 1,473,500 | 1,468,517 |
| Total | 3,030,282 |
| Wirelines 0.8% |
| AT&T, Inc. |
| 03/01/2037 | 5.250% | | 940,000 | 961,122 |
| 03/01/2047 | 5.450% | | 745,000 | 761,587 |
| 08/14/2058 | 5.300% | | 330,000 | 333,885 |
The accompanying Notes to Financial Statements are an integral part of this statement.
Columbia Bond Fund | Annual Report 2018
| 13 |
Portfolio of Investments (continued)
April 30, 2018
| Corporate Bonds & Notes (continued) |
| Issuer | Coupon
Rate | | Principal
Amount ($) | Value ($) |
| Deutsche Telekom International Finance BV |
| 06/01/2032 | 9.250% | | 190,000 | 285,481 |
| Verizon Communications, Inc. |
| 08/10/2033 | 4.500% | | 1,000,000 | 983,311 |
| Total | 3,325,386 |
Total Corporate Bonds & Notes
(Cost $98,535,070) | 95,786,413 |
|
| Foreign Government Obligations(i) 0.7% |
| | | | |
| Mexico 0.4% |
| Mexico Government International Bond |
| 03/08/2044 | 4.750% | | 250,000 | 235,014 |
| Petroleos Mexicanos |
| 09/21/2023 | 4.625% | | 639,000 | 630,826 |
| 03/13/2027 | 6.500% | | 402,000 | 416,478 |
| 06/15/2035 | 6.625% | | 435,000 | 431,945 |
| 09/21/2047 | 6.750% | | 115,000 | 111,000 |
| Total | 1,825,263 |
| Panama 0.1% |
| Panama Government International Bond |
| 01/26/2036 | 6.700% | | 220,000 | 271,892 |
| Peru 0.1% |
| Peruvian Government International Bond |
| 03/14/2037 | 6.550% | | 385,000 | 485,147 |
| Philippines 0.1% |
| Philippine Government International Bond |
| 10/23/2034 | 6.375% | | 275,000 | 346,075 |
| Uruguay 0.0% |
| Uruguay Government International Bond |
| 11/20/2045 | 4.125% | | 165,000 | 147,541 |
Total Foreign Government Obligations
(Cost $3,144,273) | 3,075,918 |
|
| Municipal Bonds 0.3% |
| Issue Description | Coupon
Rate | | Principal
Amount ($) | Value ($) |
| Local General Obligation 0.0% |
| City of Chicago |
| Unlimited Tax General Obligation Bonds |
| Series 2015B |
| 01/01/2033 | 7.375% | | 100,000 | 107,462 |
| Municipal Bonds (continued) |
| Issue Description | Coupon
Rate | | Principal
Amount ($) | Value ($) |
| Water & Sewer 0.3% |
| City of Chicago Waterworks |
| Revenue Bonds |
| Build America Bonds |
| Series 2010 |
| 11/01/2040 | 6.742% | | 865,000 | 1,089,865 |
Total Municipal Bonds
(Cost $964,348) | 1,197,327 |
|
| Residential Mortgage-Backed Securities - Agency 27.4% |
| Issuer | Coupon
Rate | | Principal
Amount ($) | Value ($) |
| Federal Home Loan Mortgage Corp. |
03/01/2021-
05/01/2041 | 5.000% | | 575,234 | 613,097 |
09/01/2025-
10/01/2029 | 7.500% | | 23,218 | 25,456 |
11/01/2025-
12/01/2035 | 7.000% | | 224,133 | 249,997 |
| 06/01/2026 | 8.000% | | 285 | 312 |
| 06/01/2043 | 4.000% | | 4,237,434 | 4,354,625 |
01/01/2046-
08/01/2046 | 3.500% | | 4,000,472 | 3,994,790 |
| Federal Home Loan Mortgage Corp.(e) |
| 05/14/2048 | 4.000% | | 7,500,000 | 7,641,797 |
| Federal National Mortgage Association |
10/01/2020-
12/01/2020 | 10.000% | | 3,180 | 3,197 |
08/01/2029-
09/01/2045 | 3.000% | | 10,197,999 | 10,041,275 |
| 10/01/2029 | 7.500% | | 11,310 | 12,924 |
12/01/2029-
05/01/2030 | 8.000% | | 86,279 | 95,699 |
| 01/01/2031 | 2.500% | | 1,301,978 | 1,271,179 |
| 07/01/2038 | 6.000% | | 1,600,555 | 1,783,919 |
| 01/01/2040 | 5.500% | | 2,236,871 | 2,435,599 |
| 09/01/2040 | 5.000% | | 1,647,088 | 1,770,308 |
05/01/2043-
11/01/2046 | 3.500% | | 19,592,776 | 19,517,375 |
| 11/01/2045 | 4.000% | | 2,545,621 | 2,610,335 |
| Federal National Mortgage Association(e) |
| 05/17/2033 | 2.500% | | 4,100,000 | 3,987,810 |
05/17/2033-
05/14/2048 | 3.000% | | 7,478,000 | 7,278,275 |
05/17/2033-
05/14/2048 | 3.500% | | 9,000,000 | 9,011,180 |
| 05/14/2048 | 4.000% | | 11,500,000 | 11,712,929 |
| 05/14/2048 | 4.500% | | 3,000,000 | 3,124,922 |
| Federal National Mortgage Association(j) |
| 08/01/2040 | 4.500% | | 4,047,842 | 4,260,007 |
The accompanying Notes to Financial Statements are an integral part of this statement.
| 14 | Columbia Bond Fund | Annual Report 2018 |
Portfolio of Investments (continued)
April 30, 2018
| Residential Mortgage-Backed Securities - Agency (continued) |
| Issuer | Coupon
Rate | | Principal
Amount ($) | Value ($) |
| Government National Mortgage Association |
| 08/15/2020 | 9.500% | | 535 | 537 |
11/15/2022-
02/15/2030 | 7.000% | | 75,839 | 80,639 |
05/15/2023-
12/15/2031 | 6.500% | | 88,578 | 99,077 |
06/15/2025-
01/15/2030 | 8.000% | | 116,088 | 127,626 |
04/15/2026-
03/15/2030 | 7.500% | | 96,460 | 98,158 |
| 03/20/2028 | 6.000% | | 37,297 | 42,599 |
| 06/15/2030 | 9.000% | | 16,086 | 16,988 |
| Government National Mortgage Association(b) |
07/20/2021-
07/20/2022 | 2.750% | | 16,394 | 16,670 |
04/20/2022-
06/20/2028 | 2.625% | | 64,056 | 65,107 |
| Government National Mortgage Association(e) |
| 05/21/2048 | 3.500% | | 11,740,000 | 11,754,675 |
| 05/21/2048 | 4.500% | | 4,000,000 | 4,150,312 |
Total Residential Mortgage-Backed Securities - Agency
(Cost $114,048,163) | 112,249,395 |
|
| Residential Mortgage-Backed Securities - Non-Agency 16.5% |
| | | | |
| Ajax Mortgage Loan Trust(a) |
| Series 2017-B Class A |
| 09/25/2056 | 3.163% | | 1,907,691 | 1,878,205 |
| American Mortgage Trust(c),(d),(f) |
| CMO Series 2093-3 Class 3A |
| 07/27/2023 | 8.188% | | 2,887 | 1,750 |
| Angel Oak Mortgage Trust I LLC(a),(f) |
| CMO Series 2018-1 Class A1 |
| 04/27/2048 | 3.258% | | 3,923,401 | 3,947,155 |
| Angel Oak Mortgage Trust LLC(a),(f) |
| CMO Series 2017-3 Class A2 |
| 11/25/2047 | 2.883% | | 3,909,913 | 3,887,478 |
| Bayview Opportunity Master Fund IV Trust(a) |
| CMO Series 2018-RN2 Class A1 |
| 02/25/2033 | 3.598% | | 2,283,114 | 2,284,678 |
| Bayview Opportunity Master Fund IVa Trust(a) |
| CMO Series 2018-RN1 Class A1 |
| 01/28/2033 | 3.278% | | 3,930,073 | 3,930,068 |
| Bayview Opportunity Master Fund IVb Trust(a) |
| CMO Series 2017-SPL3 Class A |
| 11/28/2053 | 4.000% | | 3,795,194 | 3,861,244 |
| BCAP LLC Trust(a),(f) |
| CMO Series 2012-RR10 Class 9A1 |
| 10/26/2035 | 3.619% | | 293,421 | 293,964 |
| Citigroup Mortgage Loan Trust(a),(f) |
| CMO Series 2018-RP2 Class A1 |
| 02/25/2058 | 3.500% | | 995,319 | 995,048 |
| Residential Mortgage-Backed Securities - Non-Agency (continued) |
| Issuer | Coupon
Rate | | Principal
Amount ($) | Value ($) |
| Citigroup Mortgage Loan Trust, Inc.(a),(f) |
| CMO Series 2015-A Class A4 |
| 06/25/2058 | 4.250% | | 423,067 | 426,127 |
| COLT Mortgage Loan Trust(a),(f) |
| CMO Series 2017-1 Class A1 |
| 05/27/2047 | 2.614% | | 1,191,122 | 1,156,595 |
| CMO Series 2017-2 Class A3A |
| 10/25/2047 | 2.773% | | 1,207,633 | 1,184,167 |
| COLT Mortgage Loan Trust(a) |
| CMO Series 2018-1 Class A1 |
| 02/25/2048 | 2.930% | | 2,913,767 | 2,893,157 |
| Credit Suisse Mortgage Trust(a),(f) |
| CMO Series 2010-8R Class 1A3 |
| 03/26/2036 | 3.750% | | 308,402 | 307,983 |
| CMO Series 2010-8R Class 1A4 |
| 03/26/2036 | 3.750% | | 3,000,000 | 3,006,153 |
| Deephaven Residential Mortgage Trust(a) |
| CMO Series 2018-1A Class A3 |
| 12/25/2057 | 3.202% | | 3,725,322 | 3,725,174 |
| Grand Avenue Mortgage Loan Trust(a) |
| CMO Series 2017-RPL1 Class A1 |
| 08/25/2064 | 3.250% | | 4,092,705 | 4,020,949 |
| MFA Trust(a),(f) |
| CMO Series 2017-RPL1 Class A1 |
| 02/25/2057 | 2.588% | | 815,988 | 804,669 |
| Mill City Mortgage Loan Trust(a),(f) |
| CMO Series 2018-1 Class A1 |
| 05/25/2062 | 3.250% | | 2,000,000 | 1,992,200 |
| Mill City Mortgage Trust(a) |
| CMO Series 2016-1 Class A1 |
| 04/25/2057 | 2.500% | | 783,498 | 769,278 |
| New Residential Mortgage Loan Trust(a) |
| CMO Series 2014-1A Class A |
| 01/25/2054 | 3.750% | | 1,037,285 | 1,040,543 |
| CMO Series 2016-3A Class A1 |
| 09/25/2056 | 3.750% | | 631,824 | 634,538 |
| Series 2014-2A Class A3 |
| 05/25/2054 | 3.750% | | 500,606 | 502,188 |
| NRZ Excess Spread-Collateralized Notes(a) |
| CMO Series 2018-PLS2 Class A |
| 02/25/2023 | 3.265% | | 2,171,331 | 2,160,694 |
| Series 2018-PLS1 Class A |
| 01/25/2023 | 3.193% | | 2,864,109 | 2,846,312 |
| Preston Ridge Partners Mortgage LLC(a) |
| CMO Series 2018-1A Class A1 |
| 04/25/2023 | 3.750% | | 2,000,000 | 1,990,922 |
| Towd Point Mortgage Trust(a) |
| CMO Series 2016-2 Class A1 |
| 08/25/2055 | 3.000% | | 1,201,266 | 1,189,208 |
The accompanying Notes to Financial Statements are an integral part of this statement.
Columbia Bond Fund | Annual Report 2018
| 15 |
Portfolio of Investments (continued)
April 30, 2018
| Residential Mortgage-Backed Securities - Non-Agency (continued) |
| Issuer | Coupon
Rate | | Principal
Amount ($) | Value ($) |
| Vendee Mortgage Trust(f),(k) |
| CMO Series 1998-1 Class 2IO |
| 03/15/2028 | 0.253% | | 1,574,880 | 10,042 |
| CMO Series 1998-3 Class IO |
| 03/15/2029 | 0.103% | | 2,059,224 | 2,164 |
| Verus Securitization Trust(a),(f) |
| CMO Series 2017-2A Class A1 |
| 07/25/2047 | 2.485% | | 523,459 | 517,811 |
| Verus Securitization Trust(a) |
| CMO Series 2017-SG1A Class A1 |
| 11/25/2047 | 2.690% | | 2,867,040 | 2,836,810 |
| CMO Series 2018-1 Class A1 |
| 02/25/2048 | 2.929% | | 4,051,184 | 4,045,098 |
| CMO Series 2018-1 Class A2 |
| 02/25/2048 | 3.031% | | 3,768,543 | 3,768,180 |
| Verus Securitization Trust(a),(d),(f) |
| CMO Series 2018-INV1 Class A1 |
| 03/25/2058 | 3.626% | | 2,800,000 | 2,800,000 |
| WaMu Mortgage Pass-Through Certificates Trust(f) |
| CMO Series 2003-AR8 Class A |
| 08/25/2033 | 3.221% | | 1,634,625 | 1,657,842 |
Total Residential Mortgage-Backed Securities - Non-Agency
(Cost $67,735,549) | 67,368,394 |
|
| U.S. Government & Agency Obligations 3.8% |
| | | | |
| Residual Funding Corp.(l) |
| STRIPS |
| 01/15/2030 | 0.000% | | 3,342,000 | 2,244,397 |
| 04/15/2030 | 0.000% | | 19,725,000 | 13,143,162 |
Total U.S. Government & Agency Obligations
(Cost $16,584,232) | 15,387,559 |
|
| U.S. Treasury Obligations 1.3% |
| Issuer | Coupon
Rate | | Principal
Amount ($) | Value ($) |
| U.S. Treasury(l) |
| STRIPS |
| 02/15/2040 | 0.000% | | 9,861,000 | 5,129,261 |
Total U.S. Treasury Obligations
(Cost $3,539,628) | 5,129,261 |
| Money Market Funds 2.6% |
| | Shares | Value ($) |
| Columbia Short-Term Cash Fund, 1.889%(m),(n) | 10,597,693 | 10,596,633 |
Total Money Market Funds
(Cost $10,596,633) | 10,596,633 |
Total Investments in Securities
(Cost: $477,506,829) | 471,211,182 |
| Other Assets & Liabilities, Net | | (62,079,058) |
| Net Assets | 409,132,124 |
At April 30, 2018, securities and/or cash totaling $399,245 were pledged as collateral.
Investments in derivatives
| Long futures contracts |
| Description | Number of
contracts | Expiration
date | Trading
currency | Notional
amount | Value/Unrealized
appreciation ($) | Value/Unrealized
depreciation ($) |
| U.S. Treasury 5-Year Note | 342 | 06/2018 | USD | 38,912,018 | — | (203,151) |
| U.S. Ultra Bond | 81 | 06/2018 | USD | 12,900,235 | 150,030 | — |
| Total | | | | | 150,030 | (203,151) |
The accompanying Notes to Financial Statements are an integral part of this statement.
| 16 | Columbia Bond Fund | Annual Report 2018 |
Portfolio of Investments (continued)
April 30, 2018
| Short futures contracts |
| Description | Number of
contracts | Expiration
date | Trading
currency | Notional
amount | Value/Unrealized
appreciation ($) | Value/Unrealized
depreciation ($) |
| U.S. Long Bond | (42) | 06/2018 | USD | (6,089,690) | — | (33,233) |
| U.S. Treasury 10-Year Note | (126) | 06/2018 | USD | (15,155,120) | 121,855 | — |
| U.S. Treasury 10-Year Note | (33) | 06/2018 | USD | (3,969,198) | — | (2,641) |
| U.S. Treasury 2-Year Note | (22) | 06/2018 | USD | (4,677,122) | 9,935 | — |
| Total | | | | | 131,790 | (35,874) |
Notes to Portfolio of Investments
| (a) | Represents privately placed and other securities and instruments exempt from SEC registration (collectively, private placements), such as Section 4(a)(2) and Rule 144A eligible securities, which are often sold only to qualified institutional buyers. The Fund may invest in private placements determined to be liquid as well as those determined to be illiquid. Private placements may be determined to be liquid under guidelines established by the Fund’s Board of Trustees. At April 30, 2018, the value of these securities amounted to $180,186,698, which represents 44.04% of net assets. |
| (b) | Variable rate security. The interest rate shown was the current rate as of April 30, 2018. |
| (c) | Represents fair value as determined in good faith under procedures approved by the Board of Trustees. At April 30, 2018, the value of these securities amounted to $1,800,850, which represents 0.44% of net assets. |
| (d) | Valuation based on significant unobservable inputs. |
| (e) | Represents a security purchased on a when-issued basis. |
| (f) | Variable or floating rate security, the interest rate of which adjusts periodically based on changes in current interest rates and prepayments on the underlying pool of assets. The interest rate shown was the current rate as of April 30, 2018. |
| (g) | Non-income producing investment. |
| (h) | Represents a variable rate security with a step coupon where the rate adjusts according to a schedule for a series of periods, typically lower for an initial period and then increasing to a higher coupon rate thereafter. The interest rate shown was the current rate as of April 30, 2018. |
| (i) | Principal and interest may not be guaranteed by the government. |
| (j) | This security or a portion of this security has been pledged as collateral in connection with derivative contracts. |
| (k) | Represents interest only securities which have the right to receive the monthly interest payments on an underlying pool of mortgage loans. |
| (l) | Zero coupon bond. |
| (m) | The rate shown is the seven-day current annualized yield at April 30, 2018. |
| (n) | As defined in the Investment Company Act of 1940, an affiliated company is one in which the Fund owns 5% or more of the company’s outstanding voting securities, or a company which is under common ownership or control with the Fund. Holdings and transactions in these affiliated companies during the year ended April 30, 2018 are as follows: |
| Issuer | Beginning
shares | Shares
purchased | Shares
sold | Ending
shares | Realized gain
(loss) —
affiliated
issuers ($) | Net change in
unrealized
appreciation
(depreciation) —
affiliated
issuers ($) | Dividends —
affiliated
issuers ($) | Value —
affiliated
issuers
at end of
period ($) |
| Columbia Short-Term Cash Fund, 1.889% |
| | 2,633,674 | 227,607,433 | (219,643,414) | 10,597,693 | 1,410 | (263) | 108,127 | 10,596,633 |
Abbreviation Legend
| CMO | Collateralized Mortgage Obligation |
| STRIPS | Separate Trading of Registered Interest and Principal Securities |
Currency Legend
Fair value measurements
The Fund categorizes its fair value measurements according to a three-level hierarchy that maximizes the use of observable inputs and minimizes the use of unobservable inputs by prioritizing that the most observable input be used when available. Observable inputs are those that market participants would use in pricing an investment based on market data obtained from sources independent of the reporting entity. Unobservable inputs are those that reflect the Fund’s assumptions about the information market participants would use in
The accompanying Notes to Financial Statements are an integral part of this statement.
Columbia Bond Fund | Annual Report 2018
| 17 |
Portfolio of Investments (continued)
April 30, 2018
Fair value measurements (continued)
pricing an investment. An investment’s level within the fair value hierarchy is based on the lowest level of any input that is deemed significant to the asset’s or liability’s fair value measurement. The input levels are not necessarily an indication of the risk or liquidity associated with investments at that level. For example, certain U.S. government securities are generally high quality and liquid, however, they are reflected as Level 2 because the inputs used to determine fair value may not always be quoted prices in an active market.
Fair value inputs are summarized in the three broad levels listed below:
| ■ | Level 1 — Valuations based on quoted prices for investments in active markets that the Fund has the ability to access at the measurement date. Valuation adjustments are not applied to Level 1 investments. |
| ■ | Level 2 — Valuations based on other significant observable inputs (including quoted prices for similar securities, interest rates, prepayment speeds, credit risks, etc.). |
| ■ | Level 3 — Valuations based on significant unobservable inputs (including the Fund’s own assumptions and judgment in determining the fair value of investments). |
Inputs that are used in determining fair value of an investment may include price information, credit data, volatility statistics, and other factors. These inputs can be either observable or unobservable. The availability of observable inputs can vary between investments, and is affected by various factors such as the type of investment, and the volume and level of activity for that investment or similar investments in the marketplace. The inputs will be considered by the Investment Manager, along with any other relevant factors in the calculation of an investment’s fair value. The Fund uses prices and inputs that are current as of the measurement date, which may include periods of market dislocations. During these periods, the availability of prices and inputs may be reduced for many investments. This condition could cause an investment to be reclassified between the various levels within the hierarchy.
Certain investments that have been measured at fair value using the net asset value (NAV) per share (or its equivalent) are not categorized in the fair value hierarchy. The fair value amounts presented in the table are intended to reconcile the fair value hierarchy to the amounts presented in the Portfolio of Investments. The Columbia Short-Term Cash Fund seeks to provide shareholders with maximum current income consistent with liquidity and stability of principal. Columbia Short-Term Cash Fund prices its shares with a floating NAV and no longer seeks to maintain a stable NAV.
Investments falling into the Level 3 category are primarily supported by quoted prices from brokers and dealers participating in the market for those investments. However, these may be classified as Level 3 investments due to lack of market transparency and corroboration to support these quoted prices. Additionally, valuation models may be used as the pricing source for any remaining investments classified as Level 3. These models may rely on one or more significant unobservable inputs and/or significant assumptions by the Investment Manager. Inputs used in valuations may include, but are not limited to, financial statement analysis, capital account balances, discount rates and estimated cash flows, and comparable company data.
Under the direction of the Fund’s Board of Trustees (the Board), the Investment Manager’s Valuation Committee (the Committee) is responsible for overseeing the valuation procedures approved by the Board. The Committee consists of voting and non-voting members from various groups within the Investment Manager’s organization, including operations and accounting, trading and investments, compliance, risk management and legal.
The Committee meets at least monthly to review and approve valuation matters, which may include a description of specific valuation determinations, data regarding pricing information received from approved pricing vendors and brokers and the results of Board-approved valuation control policies and procedures (the Policies). The Policies address, among other things, instances when market quotations are or are not readily available, including recommendations of third party pricing vendors and a determination of appropriate pricing methodologies; events that require specific valuation determinations and assessment of fair value techniques; securities with a potential for stale pricing, including those that are illiquid, restricted, or in default; and the effectiveness of third party pricing vendors, including periodic reviews of vendors. The Committee meets more frequently, as needed, to discuss additional valuation matters, which may include the need to review back-testing results, review time-sensitive information or approve related valuation actions. The Committee reports to the Board, with members of the Committee meeting with the Board at each of its regularly scheduled meetings to discuss valuation matters and actions during the period, similar to those described earlier.
For investments categorized as Level 3, the Committee monitors information similar to that described above, which may include: (i) data specific to the issuer or comparable issuers, (ii) general market or specific sector news and (iii) quoted prices and specific or similar security transactions. The Committee considers this data and any changes from prior periods in order to assess the reasonableness of observable and unobservable inputs, any assumptions or internal models used to value those securities and changes in fair value. This data is also used to corroborate, when available, information received from approved pricing vendors and brokers. Various factors impact the frequency of monitoring this information (which may occur as often as daily). However, the Committee may determine that changes to inputs, assumptions and models are not required as a result of the monitoring procedures performed.
The following table is a summary of the inputs used to value the Fund’s investments at April 30, 2018:
| | Level 1
quoted prices
in active
markets for
identical
assets ($) | Level 2
other
significant
observable
inputs ($) | Level 3
significant
unobservable
inputs ($) | Investments
measured at
net asset
value ($) | Total ($) |
| Investments in Securities | | | | | |
| Asset-Backed Securities — Agency | — | 18,478,456 | — | — | 18,478,456 |
| Asset-Backed Securities — Non-Agency | — | 103,167,087 | 1,799,100 | — | 104,966,187 |
| Commercial Mortgage-Backed Securities - Agency | — | 12,035,509 | — | — | 12,035,509 |
| Commercial Mortgage-Backed Securities - Non-Agency | — | 24,939,165 | — | — | 24,939,165 |
| Common Stocks | | | | | |
| Consumer Staples | 28 | — | — | — | 28 |
| Financials | 937 | — | — | — | 937 |
| Total Common Stocks | 965 | — | — | — | 965 |
| Corporate Bonds & Notes | — | 95,786,413 | — | — | 95,786,413 |
| Foreign Government Obligations | — | 3,075,918 | — | — | 3,075,918 |
| Municipal Bonds | — | 1,197,327 | — | — | 1,197,327 |
The accompanying Notes to Financial Statements are an integral part of this statement.
| 18 | Columbia Bond Fund | Annual Report 2018 |
Portfolio of Investments (continued)
April 30, 2018
Fair value measurements (continued)
| | Level 1
quoted prices
in active
markets for
identical
assets ($) | Level 2
other
significant
observable
inputs ($) | Level 3
significant
unobservable
inputs ($) | Investments
measured at
net asset
value ($) | Total ($) |
| Residential Mortgage-Backed Securities - Agency | — | 112,249,395 | — | — | 112,249,395 |
| Residential Mortgage-Backed Securities - Non-Agency | — | 62,575,722 | 4,792,672 | — | 67,368,394 |
| U.S. Government & Agency Obligations | — | 15,387,559 | — | — | 15,387,559 |
| U.S. Treasury Obligations | — | 5,129,261 | — | — | 5,129,261 |
| Money Market Funds | — | — | — | 10,596,633 | 10,596,633 |
| Total Investments in Securities | 965 | 454,021,812 | 6,591,772 | 10,596,633 | 471,211,182 |
| Investments in Derivatives | | | | | |
| Asset | | | | | |
| Futures Contracts | 281,820 | — | — | — | 281,820 |
| Liability | | | | | |
| Futures Contracts | (239,025) | — | — | — | (239,025) |
| Total | 43,760 | 454,021,812 | 6,591,772 | 10,596,633 | 471,253,977 |
See the Portfolio of Investments for all investment classifications not indicated in the table.
The Fund’s assets assigned to the Level 2 input category are generally valued using the market approach, in which a security’s value is determined through reference to prices and information from market transactions for similar or identical assets.
Derivative instruments are valued at unrealized appreciation (depreciation).
There were no transfers of financial assets between Levels 1 and 2 during the period.
Financial assets were transferred from Level 3 to Level 2 as observable market inputs were utilized and management determined that there was sufficient, reliable and observable market data to value these assets as of period end.
Transfers between levels are determined based on the fair value at the beginning of the period for security positions held throughout the period.
The following table is a reconciliation of Level 3 assets for which significant observable and unobservable inputs were used to determine fair value:
| Investments in securities | Balance
as of
04/30/2017
($) | Increase
(decrease)
in accrued
discounts/
premiums
($) | Realized
gain (loss)
($) | Change
in unrealized
appreciation
(depreciation)(a)
($) | Purchases
($) | Sales
($) | Transfers
into
Level 3
($) | Transfers
out of
Level 3
($) | Balance
as of
04/30/2018
($) |
| Asset-Backed Securities — Non-Agency | — | — | — | (900) | 1,800,000 | — | — | — | 1,799,100 |
| Residential Mortgage-Backed Securities — Non-Agency | 2,212,152 | 294 | — | 30 | 4,790,883 | (726) | — | (2,209,961) | 4,792,672 |
| Total | 2,212,152 | 294 | — | (870) | 6,590,883 | (726) | — | (2,209,961) | 6,591,772 |
(a) Change in unrealized appreciation (depreciation) relating to securities held at April 30, 2018 was $(870), which is comprised of Asset-Backed Securities — Non-Agency of $(900) and Residential Mortgage-Backed Securities — Non-Agency of $30.
The Fund’s assets assigned to the Level 3 category are valued utilizing the valuation technique deemed the most appropriate in the circumstances. Certain asset backed securities and residential mortgage backed securities classified as Level 3 securities are valued using the market approach. To determine fair value for these securities, management considered various factors which may have included, but were not limited to, estimated cash flows of the securities, single market quotations, observable transactions for identical or similar assets in the market and the distressed nature of the security. The appropriateness of fair values for these securities is monitored on an ongoing basis which may include results of back testing, manual price reviews and other control procedures. Significant increases (decreases) to any of these inputs would result in a significantly lower (higher) fair value measurement.
The accompanying Notes to Financial Statements are an integral part of this statement.
Columbia Bond Fund | Annual Report 2018
| 19 |
Statement of Assets and Liabilities
April 30, 2018
| Assets | |
| Investments in securities, at value | |
| Unaffiliated issuers (cost $466,910,196) | $460,614,549 |
| Affiliated issuers (cost $10,596,633) | 10,596,633 |
| Receivable for: | |
| Investments sold | 784,929 |
| Investments sold on a delayed delivery basis | 1,942,948 |
| Capital shares sold | 609,889 |
| Dividends | 16,503 |
| Interest | 1,953,406 |
| Foreign tax reclaims | 13,237 |
| Variation margin for futures contracts | 85,000 |
| Expense reimbursement due from Investment Manager | 3,987 |
| Prepaid expenses | 639 |
| Trustees’ deferred compensation plan | 179,968 |
| Total assets | 476,801,688 |
| Liabilities | |
| Due to custodian | 59,829 |
| Payable for: | |
| Investments purchased | 498,680 |
| Investments purchased on a delayed delivery basis | 65,607,308 |
| Capital shares purchased | 259,311 |
| Distributions to shareholders | 853,727 |
| Variation margin for futures contracts | 43,328 |
| Management services fees | 16,802 |
| Distribution and/or service fees | 1,669 |
| Transfer agent fees | 16,786 |
| Compensation of board members | 62,444 |
| Compensation of chief compliance officer | 18 |
| Other expenses | 69,694 |
| Trustees’ deferred compensation plan | 179,968 |
| Total liabilities | 67,669,564 |
| Net assets applicable to outstanding capital stock | $409,132,124 |
| Represented by | |
| Paid in capital | 416,806,704 |
| Excess of distributions over net investment income | (331,222) |
| Accumulated net realized loss | (1,090,506) |
| Unrealized appreciation (depreciation) on: | |
| Investments - unaffiliated issuers | (6,295,647) |
| Futures contracts | 42,795 |
| Total - representing net assets applicable to outstanding capital stock | $409,132,124 |
The accompanying Notes to Financial Statements are an integral part of this statement.
| 20 | Columbia Bond Fund | Annual Report 2018 |
Statement of Assets and Liabilities (continued)
April 30, 2018
| Class A | |
| Net assets | $50,845,168 |
| Shares outstanding | 6,139,103 |
| Net asset value per share | $8.28 |
| Maximum sales charge | 4.75% |
| Maximum offering price per share (calculated by dividing the net asset value per share by 1.0 minus the maximum sales charge for Class A shares) | $8.69 |
| Advisor Class | |
| Net assets | $496,924 |
| Shares outstanding | 60,073 |
| Net asset value per share | $8.27 |
| Class C | |
| Net assets | $6,000,648 |
| Shares outstanding | 725,571 |
| Net asset value per share | $8.27 |
| Institutional Class | |
| Net assets | $56,556,081 |
| Shares outstanding | 6,829,215 |
| Net asset value per share | $8.28 |
| Institutional 2 Class | |
| Net assets | $863,653 |
| Shares outstanding | 104,614 |
| Net asset value per share | $8.26 |
| Institutional 3 Class | |
| Net assets | $284,875,975 |
| Shares outstanding | 34,329,871 |
| Net asset value per share | $8.30 |
| Class R | |
| Net assets | $549,868 |
| Shares outstanding | 66,402 |
| Net asset value per share | $8.28 |
| Class T | |
| Net assets | $9,434 |
| Shares outstanding | 1,138 |
| Net asset value per share | $8.29 |
| Maximum sales charge | 2.50% |
| Maximum offering price per share (calculated by dividing the net asset value per share by 1.0 minus the maximum sales charge per transaction for Class T shares) | $8.50 |
| Class V | |
| Net assets | $8,934,373 |
| Shares outstanding | 1,080,681 |
| Net asset value per share | $8.27 |
| Maximum sales charge | 4.75% |
| Maximum offering price per share (calculated by dividing the net asset value per share by 1.0 minus the maximum sales charge for Class V shares) | $8.68 |
The accompanying Notes to Financial Statements are an integral part of this statement.
Columbia Bond Fund | Annual Report 2018
| 21 |
Statement of Operations
Year Ended April 30, 2018
| Net investment income | |
| Income: | |
| Dividends — unaffiliated issuers | $4,818 |
| Dividends — affiliated issuers | 108,127 |
| Interest | 11,876,322 |
| Total income | 11,989,267 |
| Expenses: | |
| Management services fees | 2,235,758 |
| Distribution and/or service fees | |
| Class A | 131,733 |
| Class B | 260 |
| Class C | 76,836 |
| Class R | 3,677 |
| Class T | 25 |
| Class V | 14,709 |
| Transfer agent fees | |
| Class A | 93,131 |
| Advisor Class | 929 |
| Class B | 50 |
| Class C | 13,405 |
| Institutional Class | 278,964 |
| Institutional 2 Class | 539 |
| Institutional 3 Class | 17,587 |
| Class R | 1,281 |
| Class T | 17 |
| Class V | 17,136 |
| Compensation of board members | 29,221 |
| Custodian fees | 41,546 |
| Printing and postage fees | 32,174 |
| Registration fees | 135,890 |
| Audit fees | 48,515 |
| Legal fees | 11,354 |
| Compensation of chief compliance officer | 175 |
| Other | 22,245 |
| Total expenses | 3,207,157 |
| Fees waived or expenses reimbursed by Investment Manager and its affiliates | (578,904) |
| Expense reduction | (1,400) |
| Total net expenses | 2,626,853 |
| Net investment income | 9,362,414 |
| Realized and unrealized gain (loss) — net | |
| Net realized gain (loss) on: | |
| Investments — unaffiliated issuers | 3,798,678 |
| Investments — affiliated issuers | 1,410 |
| Futures contracts | (1,628,834) |
| Swap contracts | (229,603) |
| Net realized gain | 1,941,651 |
| Net change in unrealized appreciation (depreciation) on: | |
| Investments — unaffiliated issuers | (11,071,073) |
| Investments — affiliated issuers | (263) |
| Futures contracts | 260,472 |
| Swap contracts | 77,548 |
| Net change in unrealized appreciation (depreciation) | (10,733,316) |
| Net realized and unrealized loss | (8,791,665) |
| Net increase in net assets resulting from operations | $570,749 |
The accompanying Notes to Financial Statements are an integral part of this statement.
| 22 | Columbia Bond Fund | Annual Report 2018 |
Statement of Changes in Net Assets
| | Year Ended
April 30, 2018 | Year Ended
April 30, 2017 |
| Operations | | |
| Net investment income | $9,362,414 | $10,754,592 |
| Net realized gain | 1,941,651 | 7,962,116 |
| Net change in unrealized appreciation (depreciation) | (10,733,316) | (11,191,369) |
| Net increase in net assets resulting from operations | 570,749 | 7,525,339 |
| Distributions to shareholders | | |
| Net investment income | | |
| Class A | (942,650) | (1,034,173) |
| Advisor Class | (10,833) | (9,804) |
| Class B | (57) | (3,217) |
| Class C | (76,260) | (117,504) |
| Class I | — | (202) |
| Institutional Class | (2,541,221) | (8,545,326) |
| Institutional 2 Class | (16,537) | (4,047) |
| Institutional 3 Class | (5,347,730) | (685,915) |
| Class R | (10,836) | (22,179) |
| Class T | (173) | (180) |
| Class V | (183,614) | (203,922) |
| Net realized gains | | |
| Class A | (75,008) | (1,373,217) |
| Advisor Class | (853) | (11,833) |
| Class B | — | (7,527) |
| Class C | (10,560) | (265,520) |
| Class I | — | (233) |
| Institutional Class | (90,275) | (9,771,071) |
| Institutional 2 Class | (1,071) | (2,265) |
| Institutional 3 Class | (433,349) | (694,144) |
| Class R | (989) | (33,217) |
| Class T | (14) | (233) |
| Class V | (13,938) | (249,031) |
| Total distributions to shareholders | (9,755,968) | (23,034,760) |
| Decrease in net assets from capital stock activity | (54,398,897) | (63,208,077) |
| Total decrease in net assets | (63,584,116) | (78,717,498) |
| Net assets at beginning of year | 472,716,240 | 551,433,738 |
| Net assets at end of year | $409,132,124 | $472,716,240 |
| Excess of distributions over net investment income | $(331,222) | $(430,579) |
The accompanying Notes to Financial Statements are an integral part of this statement.
Columbia Bond Fund | Annual Report 2018
| 23 |
Statement of Changes in Net Assets (continued)
| | Year Ended | Year Ended |
| | April 30, 2018 | April 30, 2017 |
| | Shares | Dollars ($) | Shares | Dollars ($) |
| Capital stock activity |
| Class A | | | | |
| Subscriptions | 1,350,192 | 11,470,191 | 1,659,903 | 14,441,255 |
| Distributions reinvested | 85,634 | 725,098 | 204,954 | 1,737,972 |
| Redemptions | (1,441,277) | (12,209,797) | (2,033,377) | (17,389,013) |
| Net decrease | (5,451) | (14,508) | (168,520) | (1,209,786) |
| Advisor Class | | | | |
| Subscriptions | 27,203 | 231,020 | 29,554 | 255,853 |
| Distributions reinvested | 1,354 | 11,459 | 2,501 | 21,197 |
| Redemptions | (29,409) | (248,447) | (15,879) | (135,528) |
| Net increase (decrease) | (852) | (5,968) | 16,176 | 141,522 |
| Class B | | | | |
| Subscriptions | 4 | 23 | 3,079 | 27,031 |
| Distributions reinvested | 2 | 21 | 897 | 7,588 |
| Redemptions | (15,629) | (134,084) | (30,359) | (258,002) |
| Net decrease | (15,623) | (134,040) | (26,383) | (223,383) |
| Class C | | | | |
| Subscriptions | 86,917 | 738,369 | 343,687 | 2,998,865 |
| Distributions reinvested | 9,354 | 79,126 | 37,211 | 314,028 |
| Redemptions | (489,094) | (4,148,309) | (510,105) | (4,370,918) |
| Net decrease | (392,823) | (3,330,814) | (129,207) | (1,058,025) |
| Class I | | | | |
| Redemptions | — | — | (1,136) | (9,587) |
| Net decrease | — | — | (1,136) | (9,587) |
| Institutional Class | | | | |
| Subscriptions | 911,392 | 7,780,317 | 3,688,460 | 31,717,666 |
| Distributions reinvested | 139,701 | 1,184,004 | 324,263 | 2,754,026 |
| Redemptions | (37,800,189) | (323,756,482) | (10,890,599) | (93,345,156) |
| Net decrease | (36,749,096) | (314,792,161) | (6,877,876) | (58,873,464) |
| Institutional 2 Class | | | | |
| Subscriptions | 29,375 | 246,181 | 80,727 | 679,688 |
| Distributions reinvested | 2,060 | 17,385 | 695 | 5,861 |
| Redemptions | (13,880) | (117,045) | (394) | (3,647) |
| Net increase | 17,555 | 146,521 | 81,028 | 681,902 |
| Institutional 3 Class | | | | |
| Subscriptions | 34,266,000 | 294,261,409 | 195,872 | 1,674,782 |
| Distributions reinvested | 3,709 | 31,371 | 1,059 | 9,025 |
| Redemptions | (3,447,893) | (29,201,714) | (349,914) | (3,114,746) |
| Net increase (decrease) | 30,821,816 | 265,091,066 | (152,983) | (1,430,939) |
| Class R | | | | |
| Subscriptions | 8,977 | 76,045 | 13,908 | 120,270 |
| Distributions reinvested | 1,380 | 11,705 | 6,405 | 54,269 |
| Redemptions | (52,854) | (448,562) | (111,998) | (956,730) |
| Net decrease | (42,497) | (360,812) | (91,685) | (782,191) |
| Class T | | | | |
| Distributions reinvested | — | — | 1 | 9 |
| Redemptions | (1) | (10) | — | — |
| Net increase (decrease) | (1) | (10) | 1 | 9 |
The accompanying Notes to Financial Statements are an integral part of this statement.
| 24 | Columbia Bond Fund | Annual Report 2018 |
Statement of Changes in Net Assets (continued)
| | Year Ended | Year Ended |
| | April 30, 2018 | April 30, 2017 |
| | Shares | Dollars ($) | Shares | Dollars ($) |
| Class V | | | | |
| Subscriptions | 15,486 | 131,303 | 13,760 | 118,220 |
| Distributions reinvested | 16,881 | 142,768 | 39,128 | 331,591 |
| Redemptions | (150,794) | (1,272,242) | (103,950) | (893,946) |
| Net decrease | (118,427) | (998,171) | (51,062) | (444,135) |
| Total net decrease | (6,485,399) | (54,398,897) | (7,401,647) | (63,208,077) |
The accompanying Notes to Financial Statements are an integral part of this statement.
Columbia Bond Fund | Annual Report 2018
| 25 |
The following table is intended to help you understand the Fund’s financial performance. Certain information reflects financial results for a single share of a class held for the periods shown. Per share net investment income (loss) amounts are calculated based on average shares outstanding during the period. Total return assumes reinvestment of all dividends and distributions, if any. Total return does not reflect payment of sales charges, if any. Total return and portfolio turnover are not annualized for periods of less than one year. The portfolio turnover rate is calculated without regard to purchase and sales transactions of short-term instruments and certain derivatives, if any. If such transactions were included, the Fund’s portfolio turnover rate may be higher.
| | Net asset value,
beginning of
period | Net
investment
income | Net
realized
and
unrealized
gain (loss) | Total from
investment
operations | Distributions
from net
investment
income | Distributions
from net
realized
gains |
| Class A |
| Year Ended 4/30/2018 | $8.47 | 0.16 | (0.19) | (0.03) | (0.15) | (0.01) |
| Year Ended 4/30/2017 | $8.72 | 0.16 | (0.05) | 0.11 | (0.15) | (0.21) |
| Year Ended 4/30/2016 | $8.91 | 0.16 | 0.07 | 0.23 | (0.21) | (0.21) |
| Year Ended 4/30/2015 | $8.86 | 0.17 | 0.15 | 0.32 | (0.16) | (0.11) |
| Year Ended 4/30/2014 | $9.46 | 0.16 | (0.30) | (0.14) | (0.17) | (0.29) |
| Advisor Class |
| Year Ended 4/30/2018 | $8.46 | 0.18 | (0.18) | 0.00 (e) | (0.18) | (0.01) |
| Year Ended 4/30/2017 | $8.72 | 0.18 | (0.06) | 0.12 | (0.17) | (0.21) |
| Year Ended 4/30/2016 | $8.91 | 0.18 | 0.07 | 0.25 | (0.23) | (0.21) |
| Year Ended 4/30/2015 | $8.85 | 0.19 | 0.16 | 0.35 | (0.18) | (0.11) |
| Year Ended 4/30/2014 | $9.45 | 0.18 | (0.30) | (0.12) | (0.19) | (0.29) |
| Class C |
| Year Ended 4/30/2018 | $8.46 | 0.09 | (0.18) | (0.09) | (0.09) | (0.01) |
| Year Ended 4/30/2017 | $8.71 | 0.10 | (0.05) | 0.05 | (0.09) | (0.21) |
| Year Ended 4/30/2016 | $8.90 | 0.09 | 0.07 | 0.16 | (0.14) | (0.21) |
| Year Ended 4/30/2015 | $8.85 | 0.10 | 0.16 | 0.26 | (0.10) | (0.11) |
| Year Ended 4/30/2014 | $9.45 | 0.11 | (0.31) | (0.20) | (0.11) | (0.29) |
| Institutional Class |
| Year Ended 4/30/2018 | $8.47 | 0.15 | (0.15) | 0.00 (e) | (0.18) | (0.01) |
| Year Ended 4/30/2017 | $8.72 | 0.18 | (0.05) | 0.13 | (0.17) | (0.21) |
| Year Ended 4/30/2016 | $8.91 | 0.18 | 0.07 | 0.25 | (0.23) | (0.21) |
| Year Ended 4/30/2015 | $8.86 | 0.19 | 0.15 | 0.34 | (0.18) | (0.11) |
| Year Ended 4/30/2014 | $9.46 | 0.19 | (0.31) | (0.12) | (0.19) | (0.29) |
| Institutional 2 Class |
| Year Ended 4/30/2018 | $8.44 | 0.19 | (0.18) | 0.01 | (0.18) | (0.01) |
| Year Ended 4/30/2017 | $8.70 | 0.17 | (0.04) | 0.13 | (0.18) | (0.21) |
| Year Ended 4/30/2016 | $8.89 | 0.19 | 0.07 | 0.26 | (0.24) | (0.21) |
| Year Ended 4/30/2015 | $8.84 | 0.20 | 0.15 | 0.35 | (0.19) | (0.11) |
| Year Ended 4/30/2014 | $9.45 | 0.19 | (0.31) | (0.12) | (0.20) | (0.29) |
The accompanying Notes to Financial Statements are an integral part of this statement.
| 26 | Columbia Bond Fund | Annual Report 2018 |
Total
distributions to
shareholders | Net
asset
value,
end of
period | Total
return | Total gross
expense
ratio to
average
net assets(a) | Total net
expense
ratio to
average
net assets(a),(b) | Net investment
income
ratio to
average
net assets | Portfolio
turnover | Net
assets,
end of
period
(000’s) |
| |
| (0.16) | $8.28 | (0.33%) | 1.00% | 0.86% (c) | 1.84% | 257% | $50,845 |
| (0.36) | $8.47 | 1.34% | 0.98% (d) | 0.82% (c),(d) | 1.86% | 375% | $52,029 |
| (0.42) | $8.72 | 2.74% | 1.02% | 0.86% (c) | 1.83% | 428% | $55,058 |
| (0.27) | $8.91 | 3.63% | 1.01% | 0.90% (c) | 1.85% | 350% | $52,256 |
| (0.46) | $8.86 | (1.42%) | 0.98% | 0.96% (c) | 1.83% | 360% | $61,159 |
| |
| (0.19) | $8.27 | (0.08%) | 0.75% | 0.61% (c) | 2.09% | 257% | $497 |
| (0.38) | $8.46 | 1.48% | 0.73% (d) | 0.57% (c),(d) | 2.10% | 375% | $516 |
| (0.44) | $8.72 | 3.01% | 0.77% | 0.61% (c) | 2.07% | 428% | $390 |
| (0.29) | $8.91 | 4.00% | 0.76% | 0.64% (c) | 2.12% | 350% | $26 |
| (0.48) | $8.85 | (1.18%) | 0.74% | 0.70% (c) | 1.99% | 360% | $28 |
| |
| (0.10) | $8.27 | (1.08%) | 1.75% | 1.61% (c) | 1.04% | 257% | $6,001 |
| (0.30) | $8.46 | 0.59% | 1.73% (d) | 1.57% (c),(d) | 1.11% | 375% | $9,461 |
| (0.35) | $8.71 | 1.98% | 1.77% | 1.61% (c) | 1.08% | 428% | $10,870 |
| (0.21) | $8.90 | 2.91% | 1.76% | 1.60% (c) | 1.15% | 350% | $9,406 |
| (0.40) | $8.85 | (2.01%) | 1.73% | 1.56% (c) | 1.23% | 360% | $10,917 |
| |
| (0.19) | $8.28 | (0.08%) | 0.74% | 0.61% (c) | 1.74% | 257% | $56,556 |
| (0.38) | $8.47 | 1.60% | 0.73% (d) | 0.58% (c),(d) | 2.11% | 375% | $369,017 |
| (0.44) | $8.72 | 3.00% | 0.77% | 0.61% (c) | 2.08% | 428% | $440,059 |
| (0.29) | $8.91 | 3.88% | 0.75% | 0.65% (c) | 2.10% | 350% | $550,803 |
| (0.48) | $8.86 | (1.17%) | 0.73% | 0.71% (c) | 2.07% | 360% | $659,538 |
| |
| (0.19) | $8.26 | 0.13% | 0.64% | 0.51% | 2.20% | 257% | $864 |
| (0.39) | $8.44 | 1.58% | 0.63% (d) | 0.49% (d) | 1.99% | 375% | $735 |
| (0.45) | $8.70 | 3.11% | 0.60% | 0.50% | 2.14% | 428% | $52 |
| (0.30) | $8.89 | 4.04% | 0.56% | 0.50% | 2.25% | 350% | $413 |
| (0.49) | $8.84 | (1.10%) | 0.57% | 0.57% | 2.09% | 360% | $471 |
Columbia Bond Fund | Annual Report 2018
| 27 |
Financial Highlights (continued)
| | Net asset value,
beginning of
period | Net
investment
income | Net
realized
and
unrealized
gain (loss) | Total from
investment
operations | Distributions
from net
investment
income | Distributions
from net
realized
gains |
| Institutional 3 Class |
| Year Ended 4/30/2018 | $8.48 | 0.21 | (0.19) | 0.02 | (0.19) | (0.01) |
| Year Ended 4/30/2017 | $8.74 | 0.19 | (0.05) | 0.14 | (0.19) | (0.21) |
| Year Ended 4/30/2016 | $8.92 | 0.19 | 0.09 | 0.28 | (0.25) | (0.21) |
| Year Ended 4/30/2015 | $8.87 | 0.20 | 0.15 | 0.35 | (0.19) | (0.11) |
| Year Ended 4/30/2014 | $9.47 | 0.20 | (0.30) | (0.10) | (0.21) | (0.29) |
| Class R |
| Year Ended 4/30/2018 | $8.47 | 0.13 | (0.18) | (0.05) | (0.13) | (0.01) |
| Year Ended 4/30/2017 | $8.72 | 0.14 | (0.05) | 0.09 | (0.13) | (0.21) |
| Year Ended 4/30/2016 | $8.91 | 0.14 | 0.07 | 0.21 | (0.19) | (0.21) |
| Year Ended 4/30/2015 | $8.86 | 0.14 | 0.16 | 0.30 | (0.14) | (0.11) |
| Year Ended 4/30/2014 | $9.46 | 0.14 | (0.31) | (0.17) | (0.14) | (0.29) |
| Class T |
| Year Ended 4/30/2018 | $8.48 | 0.16 | (0.19) | (0.03) | (0.15) | (0.01) |
| Year Ended 4/30/2017 | $8.73 | 0.16 | (0.05) | 0.11 | (0.15) | (0.21) |
| Year Ended 4/30/2016 | $8.92 | 0.16 | 0.07 | 0.23 | (0.21) | (0.21) |
| Year Ended 4/30/2015 | $8.87 | 0.17 | 0.15 | 0.32 | (0.16) | (0.11) |
| Year Ended 4/30/2014 | $9.47 | 0.17 | (0.31) | (0.14) | (0.17) | (0.29) |
| Class V |
| Year Ended 4/30/2018 | $8.46 | 0.16 | (0.18) | (0.02) | (0.16) | (0.01) |
| Year Ended 4/30/2017 | $8.71 | 0.17 | (0.05) | 0.12 | (0.16) | (0.21) |
| Year Ended 4/30/2016 | $8.90 | 0.17 | 0.07 | 0.24 | (0.22) | (0.21) |
| Year Ended 4/30/2015 | $8.85 | 0.17 | 0.16 | 0.33 | (0.17) | (0.11) |
| Year Ended 4/30/2014 | $9.45 | 0.17 | (0.30) | (0.13) | (0.18) | (0.29) |
| Notes to Financial Highlights |
| (a) | In addition to the fees and expenses that the Fund bears directly, the Fund indirectly bears a pro rata share of the fees and expenses of any other funds in which it invests. Such indirect expenses are not included in the Fund’s reported expense ratios. |
| (b) | Total net expenses include the impact of certain fee waivers/expense reimbursements made by the Investment Manager and certain of its affiliates, if applicable. |
| (c) | The benefits derived from expense reductions had an impact of less than 0.01%. |
| (d) | Expenses have been reduced due to a reimbursement of expenses overbilled by a third party. If the reimbursement had been excluded, the expense ratios would have been higher by the percentages shown for each class in the table below. All fee waivers and expense reimbursements by the Investment Manager and its affiliates were applied before giving effect to this third party reimbursement. |
| Year Ended | Class A | Advisor
Class | Class C | Institutional
Class | Institutional 2
Class | Institutional 3
Class | Class R | Class T | Class V |
| 04/30/2017 | 0.04 % | 0.04 % | 0.04 % | 0.03 % | 0.02 % | 0.03 % | 0.03 % | 0.03 % | 0.03 % |
The accompanying Notes to Financial Statements are an integral part of this statement.
| 28 | Columbia Bond Fund | Annual Report 2018 |
Total
distributions to
shareholders | Net
asset
value,
end of
period | Total
return | Total gross
expense
ratio to
average
net assets(a) | Total net
expense
ratio to
average
net assets(a),(b) | Net investment
income
ratio to
average
net assets | Portfolio
turnover | Net
assets,
end of
period
(000’s) |
| |
| (0.20) | $8.30 | 0.19% | 0.59% | 0.46% | 2.46% | 257% | $284,876 |
| (0.40) | $8.48 | 1.63% | 0.54% (d) | 0.42% (d) | 2.26% | 375% | $29,756 |
| (0.46) | $8.74 | 3.28% | 0.56% | 0.45% | 2.24% | 428% | $31,981 |
| (0.30) | $8.92 | 4.05% | 0.54% | 0.48% | 2.27% | 350% | $27,155 |
| (0.50) | $8.87 | (0.99%) | 0.53% | 0.53% | 2.27% | 360% | $25,147 |
| |
| (0.14) | $8.28 | (0.58%) | 1.25% | 1.11% (c) | 1.54% | 257% | $550 |
| (0.34) | $8.47 | 1.09% | 1.23% (d) | 1.08% (c),(d) | 1.62% | 375% | $922 |
| (0.40) | $8.72 | 2.49% | 1.27% | 1.11% (c) | 1.57% | 428% | $1,750 |
| (0.25) | $8.91 | 3.37% | 1.26% | 1.15% (c) | 1.59% | 350% | $2,009 |
| (0.43) | $8.86 | (1.66%) | 1.23% | 1.21% (c) | 1.59% | 360% | $2,498 |
| |
| (0.16) | $8.29 | (0.33%) | 0.99% | 0.86% (c) | 1.83% | 257% | $9 |
| (0.36) | $8.48 | 1.34% | 1.01% (d) | 0.83% (c),(d) | 1.85% | 375% | $10 |
| (0.42) | $8.73 | 2.74% | 1.03% | 0.86% (c) | 1.83% | 428% | $10 |
| (0.27) | $8.92 | 3.62% | 1.00% | 0.90% (c) | 1.85% | 350% | $10 |
| (0.46) | $8.87 | (1.40%) | 0.90% | 0.90% (c) | 1.92% | 360% | $10 |
| |
| (0.17) | $8.27 | (0.23%) | 0.90% | 0.76% (c) | 1.92% | 257% | $8,934 |
| (0.37) | $8.46 | 1.44% | 0.88% (d) | 0.73% (c),(d) | 1.95% | 375% | $10,139 |
| (0.43) | $8.71 | 2.85% | 0.92% | 0.76% (c) | 1.93% | 428% | $10,887 |
| (0.28) | $8.90 | 3.73% | 0.91% | 0.80% (c) | 1.95% | 350% | $11,885 |
| (0.47) | $8.85 | (1.32%) | 0.88% | 0.86% (c) | 1.94% | 360% | $12,351 |
Columbia Bond Fund | Annual Report 2018
| 29 |
Notes to Financial Statements
April 30, 2018
Note 1. Organization
Columbia Bond Fund (the Fund), a series of Columbia Funds Series Trust I (the Trust), is a diversified fund. The Trust is registered under the Investment Company Act of 1940, as amended (the 1940 Act), as an open-end management investment company organized as a Massachusetts business trust.
Fund shares
The Trust may issue an unlimited number of shares (without par value). Although all share classes generally have identical voting, dividend and liquidation rights, each share class votes separately when required by the Trust’s organizational documents or by law. Different share classes pay different distribution amounts to the extent the expenses of such share classes differ, and distributions in liquidation will be proportional to the net asset value of each share class. Each share class has its own expense and sales charge structure. The Fund offers each of the share classes identified below.
Class A shares are subject to a maximum front-end sales charge of 4.75% based on the initial investment amount. Class A shares purchased without an initial sales charge in accounts aggregating $1 million to $50 million at the time of purchase are subject to a contingent deferred sales charge (CDSC) if the shares are sold within 18 months after purchase, charged as follows: 1.00% CDSC if redeemed within 12 months after purchase, and 0.50% CDSC if redeemed more than 12, but less than 18, months after purchase.
Advisor Class shares are not subject to sales charges and are generally available only to omnibus retirement plans and certain investors as described in the Fund’s prospectus. Prior to November 1, 2017, Advisor Class shares were known as Class R4 shares.
Class B shares of the Fund are no longer offered for sale. When available, Class B shares were subject to a maximum CDSC of 5.00% based upon the holding period after purchase. Effective July 17, 2017, Class B shares were automatically converted to Class A shares without a CDSC. On August 4, 2017, the capital owned by Columbia Management Investment Advisers, LLC in Class B shares was redeemed without a CDSC.
Class C shares are subject to a 1.00% CDSC on shares redeemed within 12 months after purchase.
Institutional Class shares are not subject to sales charges and are generally available only to eligible investors, which are subject to different investment minimums as described in the Fund’s prospectus. Prior to November 1, 2017, Institutional Class shares were known as Class Z shares.
Institutional 2 Class shares are not subject to sales charges and are generally available only to investors purchasing through authorized investment professionals and omnibus retirement plans as described in the Fund’s prospectus. Prior to November 1, 2017, Institutional 2 Class shares were known as Class R5 shares.
Institutional 3 Class shares are not subject to sales charges and are available to institutional and certain other investors as described in the Fund’s prospectus. Prior to November 1, 2017, Institutional 3 Class shares were known as Class Y shares.
Class R shares are not subject to sales charges and are generally available only to certain retirement plans and other investors as described in the Fund’s prospectus.
Class T shares are subject to a maximum front-end sales charge of 2.50% per transaction and must be purchased through financial intermediaries that, by written agreement with Columbia Management Investment Distributors, Inc., are specifically authorized to sell Class T shares.
Class V shares are subject to a maximum front-end sales charge of 4.75% based on the investment amount. Class V shares purchased without an initial sales charge in accounts aggregating $1 million to $50 million at the time of purchase are subject to a CDSC if the shares are sold within 18 months after purchase, charged as follows: 1.00% CDSC if redeemed within 12 months after purchase, and 0.50% CDSC if redeemed more than 12, but less than 18, months after purchase. Class V shares are available only to investors who received (and who have continuously held) Class V shares in connection with previous fund reorganizations.
| 30 | Columbia Bond Fund | Annual Report 2018 |
Notes to Financial Statements (continued)
April 30, 2018
Note 2. Summary of significant accounting policies
Basis of preparation
The Fund is an investment company that applies the accounting and reporting guidance in the Financial Accounting Standards Board (FASB) Accounting Standards Codification Topic 946, Financial Services - Investment Companies (ASC 946). The financial statements are prepared in accordance with U.S. generally accepted accounting principles (GAAP), which requires management to make certain estimates and assumptions that affect the reported amounts of assets and liabilities, the disclosure of contingent assets and liabilities at the date of the financial statements and the reported amounts of income and expenses during the reporting period. Actual results could differ from those estimates.
The following is a summary of significant accounting policies followed by the Fund in the preparation of its financial statements.
Security valuation
All equity securities are valued at the close of business of the New York Stock Exchange. Equity securities are valued at the last quoted sales price on the principal exchange or market on which they trade, except for securities traded on the NASDAQ Stock Market, which are valued at the NASDAQ official close price. Unlisted securities or listed securities for which there were no sales during the day are valued at the mean of the latest quoted bid and ask prices on such exchanges or markets.
Debt securities generally are valued by pricing services approved by the Board of Trustees based upon market transactions for normal, institutional-size trading units of similar securities. The services may use various pricing techniques that take into account, as applicable, factors such as yield, quality, coupon rate, maturity, type of issue, trading characteristics and other data, as well as approved independent broker-dealer quotes. Debt securities for which quotations are not readily available or not believed to be reflective of market value may also be valued based upon a bid quote from an approved independent broker-dealer. Debt securities maturing in 60 days or less are valued primarily at amortized cost value, unless this method results in a valuation that management believes does not approximate market value.
Asset- and mortgage-backed securities are generally valued by pricing services, which utilize pricing models that incorporate the securities’ cash flow and loan performance data. These models also take into account available market data, including trades, market quotations, and benchmark yield curves for identical or similar securities. Factors used to identify similar securities may include, but are not limited to, issuer, collateral type, vintage, prepayment speeds, collateral performance, credit ratings, credit enhancement and expected life. Asset-backed securities for which quotations are readily available may also be valued based upon an over-the-counter or exchange bid quote from an approved independent broker-dealer.
Investments in open-end investment companies, including money market funds, are valued at their latest net asset value.
Futures and options on futures contracts are valued based upon the settlement price at the close of regular trading on their principal exchanges or, in the absence of transactions, at the mean of the latest quoted bid and ask prices.
Investments for which market quotations are not readily available, or that have quotations which management believes are not reflective of market value or reliable, are valued at fair value as determined in good faith under procedures approved by and under the general supervision of the Board of Trustees. If a security or class of securities (such as foreign securities) is valued at fair value, such value is likely to be different from the quoted or published price for the security.
The determination of fair value often requires significant judgment. To determine fair value, management may use assumptions including but not limited to future cash flows and estimated risk premiums. Multiple inputs from various sources may be used to determine fair value.
GAAP requires disclosure regarding the inputs and valuation techniques used to measure fair value and any changes in valuation inputs or techniques. In addition, investments shall be disclosed by major category. This information is disclosed following the Fund’s Portfolio of Investments.
Columbia Bond Fund | Annual Report 2018
| 31 |
Notes to Financial Statements (continued)
April 30, 2018
Derivative instruments
The Fund invests in certain derivative instruments, as detailed below, to meet its investment objectives. Derivatives are instruments whose values depend on, or are derived from, in whole or in part, the value of one or more securities, currencies, commodities, indices, or other assets or instruments. Derivatives may be used to increase investment flexibility (including to maintain cash reserves while maintaining desired exposure to certain assets), for risk management (hedging) purposes, to facilitate trading, to reduce transaction costs and to pursue higher investment returns. The Fund may also use derivative instruments to mitigate certain investment risks, such as foreign currency exchange rate risk, interest rate risk and credit risk. Derivatives may involve various risks, including the potential inability of the counterparty to fulfill its obligations under the terms of the contract, the potential for an illiquid secondary market (making it difficult for the Fund to sell or terminate, including at favorable prices) and the potential for market movements which may expose the Fund to gains or losses in excess of the amount shown in the Statement of Assets and Liabilities. The notional amounts of derivative instruments, if applicable, are not recorded in the financial statements.
A derivative instrument may suffer a marked-to-market loss if the value of the contract decreases due to an unfavorable change in the market rates or values of the underlying instrument. Losses can also occur if the counterparty does not perform its obligations under the contract. The Fund’s risk of loss from counterparty credit risk on over-the-counter derivatives is generally limited to the aggregate unrealized gain netted against any collateral held by the Fund and the amount of any variation margin held by the counterparty, plus any replacement costs or related amounts. With exchange-traded or centrally cleared derivatives, there is reduced counterparty credit risk to the Fund since the clearinghouse or central counterparty (CCP) provides some protection in the case of clearing member default. The clearinghouse or CCP stands between the buyer and the seller of the contract; therefore, additional counterparty credit risk is failure of the clearinghouse or CCP. However, credit risk still exists in exchange-traded or centrally cleared derivatives with respect to initial and variation margin that is held in a broker’s customer account. While brokers are required to segregate customer margin from their own assets, in the event that a broker becomes insolvent or goes into bankruptcy and at that time there is a shortfall in the aggregate amount of margin held by the broker for all its clients, U.S. bankruptcy laws will typically allocate that shortfall on a pro-rata basis across all the broker’s customers (including the Fund), potentially resulting in losses to the Fund.
In order to better define its contractual rights and to secure rights that will help the Fund mitigate its counterparty risk, the Fund may enter into an International Swaps and Derivatives Association, Inc. Master Agreement (ISDA Master Agreement) or similar agreement with its derivatives contract counterparties. An ISDA Master Agreement is an agreement between the Fund and a counterparty that governs over-the-counter derivatives and typically contains, among other things, collateral posting terms and netting provisions in the event of a default and/or termination event. Under an ISDA Master Agreement, the Fund may, under certain circumstances, offset with the counterparty certain derivative instrument’s payables and/or receivables with collateral held and/or posted and create one single net payment. The provisions of the ISDA Master Agreement typically permit a single net payment in the event of default (close-out netting), including the bankruptcy or insolvency of the counterparty. Note, however, that bankruptcy or insolvency laws of a particular jurisdiction may impose restrictions on or prohibitions against the right of offset or netting in bankruptcy, insolvency or other events.
Collateral (margin) requirements differ by type of derivative. Margin requirements are established by the clearinghouse or CCP for exchange-traded and centrally cleared derivatives. Brokers can ask for margin in excess of the minimum in certain circumstances. Collateral terms are contract specific for over-the-counter derivatives. For over-the-counter derivatives traded under an ISDA Master Agreement, the collateral requirements are typically calculated by netting the marked-to-market amount for each transaction under such agreement and comparing that amount to the value of any variation margin currently pledged by the Fund and/or the counterparty. Generally, the amount of collateral due from or to a party has to exceed a minimum transfer amount threshold (e.g., $250,000) before a transfer has to be made. To the extent amounts due to the Fund from its counterparties are not fully collateralized, contractually or otherwise, the Fund bears the risk of loss from counterparty nonperformance. The Fund may also pay interest expense on cash collateral received from the broker. Any interest expense paid by the Fund is shown on the Statement of Operations. The Fund attempts to mitigate counterparty risk by only entering into agreements with counterparties that it believes have the financial resources to honor their obligations and by monitoring the financial stability of those counterparties.
| 32 | Columbia Bond Fund | Annual Report 2018 |
Notes to Financial Statements (continued)
April 30, 2018
Certain ISDA Master Agreements allow counterparties of over-the-counter derivatives transactions to terminate derivatives contracts prior to maturity in the event the Fund’s net asset value declines by a stated percentage over a specified time period or if the Fund fails to meet certain terms of the ISDA Master Agreement, which would cause the Fund to accelerate payment of any net liability owed to the counterparty. The Fund also has termination rights if the counterparty fails to meet certain terms of the ISDA Master Agreement. In addition to considering counterparty credit risk, the Fund would consider terminating the derivatives contracts based on whether termination would result in a net liability owed from the counterparty.
For financial reporting purposes, the Fund does not offset derivative assets and derivative liabilities that are subject to netting arrangements in the Statement of Assets and Liabilities.
Futures contracts
Futures contracts are exchange-traded and represent commitments for the future purchase or sale of an asset at a specified price on a specified date. The Fund bought and sold futures contracts to manage the duration and yield curve exposure of the Fund versus the benchmark. These instruments may be used for other purposes in future periods. Upon entering into futures contracts, the Fund bears risks that it may not achieve the anticipated benefits of the futures contracts and may realize a loss. Additional risks include counterparty credit risk, the possibility of an illiquid market, and that a change in the value of the contract or option may not correlate with changes in the value of the underlying asset.
Upon entering into a futures contract, the Fund deposits cash or securities with the broker, known as a futures commission merchant (FCM), in an amount sufficient to meet the initial margin requirement. The initial margin deposit must be maintained at an established level over the life of the contract. Cash deposited as initial margin is recorded in the Statement of Assets and Liabilities as margin deposits. Securities deposited as initial margin are designated in the Portfolio of Investments. Subsequent payments (variation margin) are made or received by the Fund each day. The variation margin payments are equal to the daily change in the contract value and are recorded as variation margin receivable or payable and are offset in unrealized gains or losses. The Fund recognizes a realized gain or loss when the contract is closed or expires. Futures contracts involve, to varying degrees, risk of loss in excess of the variation margin disclosed in the Statement of Assets and Liabilities.
Swap contracts
Swap contracts are negotiated in the over-the-counter market and may be entered into as a bilateral contract or centrally cleared (centrally cleared swap contract). In a centrally cleared swap contract, immediately following execution of the swap contract with a broker, the swap contract is novated to a central counterparty (the CCP) and the CCP becomes the Fund’s counterparty to the centrally cleared swap contract. The Fund is required to deposit initial margin with the futures commission merchant (FCM), which pledges it through to the CCP in the form of cash or securities in an amount that varies depending on the size and risk profile of the particular swap contract. Securities deposited as initial margin are designated in the Portfolio of Investments and cash deposited is recorded in the Statement of Assets and Liabilities as margin deposits. Unlike a bilateral swap contract, for centrally cleared swap contracts, the Fund has minimal credit exposure to the FCM because the CCP stands between the Fund and the relevant buyer/seller on the other side of the contract. Swap contracts are marked-to-market daily and changes in value are recorded as unrealized appreciation (depreciation). The daily change in valuation of centrally cleared swap contracts, if any, is recorded as a receivable or payable for variation margin in the Statement of Assets and Liabilities.
Entering into these contracts involves, to varying degrees, elements of interest, liquidity and counterparty credit risk in excess of the amounts recognized in the Statement of Assets and Liabilities. Such risks involve the possibility that there may be unfavorable changes in interest rates, market conditions or other conditions, that it may be difficult to initiate a swap transaction or liquidate a position at an advantageous time or price which may result in significant losses, and that the FCM or CCP may not fulfill its obligation under the contract.
Credit default swap contracts
The Fund entered into credit default swap contracts to increase or decrease its credit exposure to an index and increase or decrease its credit exposure to a single issuer of debt securities. These instruments may be used for other purposes in future periods. Credit default swap contracts are agreements in which one party pays fixed periodic payments to a
Columbia Bond Fund | Annual Report 2018
| 33 |
Notes to Financial Statements (continued)
April 30, 2018
counterparty in consideration for an agreement from the counterparty to make a specific payment should a specified credit event(s) take place. Although specified credit events are contract specific, credit events are generally defined as bankruptcy, failure to pay, restructuring, obligation acceleration, obligation default, or repudiation/moratorium.
As the purchaser of a credit default swap contract, the Fund purchases protection by paying a periodic interest rate on the notional amount to the counterparty. The interest amount is accrued daily as a component of unrealized appreciation (depreciation) and is recorded as a realized loss upon payment. If a credit event as specified in the contract occurs, the Fund may have the option either to deliver the reference obligation to the seller in exchange for a cash payment of its par amount, or to receive a net cash settlement equal to the par amount less an agreed-upon value of the reference obligation as of the date of the credit event. The difference between the value of the obligation or cash delivered and the notional amount received will be recorded as a realized gain (loss).
As the seller of a credit default swap contract, the Fund sells protection to a buyer and will generally receive a periodic interest rate on a notional amount. The interest amount is accrued daily as a component of unrealized appreciation (depreciation) and is recorded as a realized gain upon receipt of the payment. If a credit event as specified in the contract with the counterparty occurs, the Fund may either be required to accept the reference obligation from the buyer in exchange for a cash payment of its notional amount, or to pay the buyer a net cash settlement equal to the notional amount less an agreed-upon value of the reference obligation (recovery value) as of the date of the credit event. The difference between the value of the obligation or cash received and the notional amount paid will be recorded as a realized gain (loss). The maximum potential amount of undiscounted future payments the Fund could be required to make as the seller of protection under a credit default swap contract is equal to the notional amount of the reference obligation. These potential amounts may be partially offset by any recovery values of the respective reference obligations or upfront receipts upon entering into the agreement. The notional amounts and market values of all credit default swap contracts in which the Fund is the seller of protection, if any, are disclosed in the Credit Default Swap Contracts Outstanding schedule following the Portfolio of Investments.
As a protection seller, the Fund bears the risk of loss from the credit events specified in the contract with the counterparty. For credit default swap contracts on credit indices, quoted market prices and resulting market values serve as an indicator of the current status of the payment/performance risk. Increasing market values, in absolute terms when compared to the notional amount of the swap, represent a deterioration of the reference entity’s credit soundness and a greater likelihood or risk of default or other credit event occurring as defined under the terms of the contract.
Effects of derivative transactions in the financial statements
The following tables are intended to provide additional information about the effect of derivatives on the financial statements of the Fund, including: the fair value of derivatives by risk category and the location of those fair values in the Statement of Assets and Liabilities; and the impact of derivative transactions over the period in the Statement of Operations, including realized and unrealized gains (losses). The derivative instrument schedules following the Portfolio of Investments present additional information regarding derivative instruments outstanding at the end of the period, if any.
The following table is a summary of the fair value of derivative instruments (not considered to be hedging instruments for accounting disclosure purposes) at April 30, 2018:
| | Asset derivatives | |
Risk exposure
category | Statement
of assets and liabilities
location | Fair value ($) |
| Interest rate risk | Net assets — unrealized appreciation on futures contracts | 281,820* |
| | Liability derivatives | |
Risk exposure
category | Statement
of assets and liabilities
location | Fair value ($) |
| Interest rate risk | Net assets — unrealized depreciation on futures contracts | 239,025* |
| 34 | Columbia Bond Fund | Annual Report 2018 |
Notes to Financial Statements (continued)
April 30, 2018
| * | Includes cumulative appreciation (depreciation) as reported in the tables following the Portfolio of Investments. Only the current day’s variation margin is reported in receivables or payables in the Statement of Assets and Liabilities. |
The following table indicates the effect of derivative instruments (not considered to be hedging instruments for accounting disclosure purposes) in the Statement of Operations for the year ended April 30, 2018:
| Amount of realized gain (loss) on derivatives recognized in income |
| Risk exposure category | Futures
contracts
($) | Swap
contracts
($) | Total
($) |
| Credit risk | — | (229,603) | (229,603) |
| Interest rate risk | (1,628,834) | — | (1,628,834) |
| Total | (1,628,834) | (229,603) | (1,858,437) |
| |
| Change in unrealized appreciation (depreciation) on derivatives recognized in income |
| Risk exposure category | Futures
contracts
($) | Swap
contracts
($) | Total
($) |
| Credit risk | — | 77,548 | 77,548 |
| Interest rate risk | 260,472 | — | 260,472 |
| Total | 260,472 | 77,548 | 338,020 |
The following table is a summary of the average outstanding volume by derivative instrument for the year ended April 30, 2018:
| Derivative instrument | Average notional
amounts ($)* |
| Futures contracts — long | 63,414,207 |
| Futures contracts — short | 28,449,824 |
| Credit default swap contracts — buy protection | 14,048,750 |
| Credit default swap contracts — sell protection | 6,015,000 |
| * | Based on the ending quarterly outstanding amounts for the year ended April 30, 2018. |
Asset- and mortgage-backed securities
The Fund may invest in asset-backed and mortgage-backed securities. The maturity dates shown represent the original maturity of the underlying obligation. Actual maturity may vary based upon prepayment activity on these obligations. All, or a portion, of the obligation may be prepaid at any time because the underlying asset may be prepaid. As a result, decreasing market interest rates could result in an increased level of prepayment. An increased prepayment rate will have the effect of shortening the maturity of the security. Unless otherwise noted, the coupon rates presented are fixed rates.
Delayed delivery securities
The Fund may trade securities on other than normal settlement terms, including securities purchased or sold on a “when-issued” or "forward commitment" basis. This may increase risk to the Fund since the other party to the transaction may fail to deliver, which could cause the Fund to subsequently invest at less advantageous prices. The Fund designates cash or liquid securities in an amount equal to the delayed delivery commitment.
To be announced securities
The Fund may trade securities on a To Be Announced (TBA) basis. As with other delayed-delivery transactions, a seller agrees to issue a TBA security at a future date. However, the seller does not specify the particular securities to be delivered. Instead, the Fund agrees to accept any security that meets specified terms.
Columbia Bond Fund | Annual Report 2018
| 35 |
Notes to Financial Statements (continued)
April 30, 2018
In some cases, Master Securities Forward Transaction Agreements (MSFTAs) may be used to govern transactions of certain forward-settling agency mortgage-backed securities, such as delayed-delivery and TBAs, between the Fund and counterparty. The MSFTA maintains provisions for, among other things, initiation and confirmation, payment and transfer, events of default, termination, and maintenance of collateral relating to such transactions.
Mortgage dollar roll transactions
The Fund may enter into mortgage “dollar rolls” in which the Fund sells securities for delivery in the current month and simultaneously contracts with the same counterparty to repurchase similar but not identical securities (same type, coupon and maturity) on a specified future date. During the roll period, the Fund loses the right to receive principal and interest paid on the securities sold. However, the Fund will benefit because it receives negotiated amounts in the form of reductions of the purchase price for the future purchase plus the interest earned on the cash proceeds of the securities sold until the settlement date of the forward purchase. The Fund records the incremental difference between the forward purchase and sale of each forward roll as a realized gain or loss. Unless any realized gains exceed the income, capital appreciation, and gain or loss due to mortgage prepayments that would have been realized on the securities sold as part of the mortgage dollar roll, the use of this technique will diminish the investment performance of the Fund compared to what the performance would have been without the use of mortgage dollar rolls. All cash proceeds will be invested in instruments that are permissible investments for the Fund. The Fund identifies cash or liquid securities in an amount equal to the forward purchase price.
For financial reporting and tax purposes, the Fund treats “to be announced” mortgage dollar rolls as two separate transactions, one involving the purchase of a security and a separate transaction involving a sale. These transactions may increase the Fund’s portfolio turnover rate. The Fund does not currently enter into mortgage dollar rolls that are accounted for as financing transactions.
Mortgage dollar rolls involve the risk that the market value of the securities the Fund is obligated to repurchase may decline below the repurchase price, or that the counterparty may default on its obligations.
Interest only and principal only securities
The Fund may invest in Interest Only (IO) or Principal Only (PO) securities. IOs are stripped securities entitled to receive all of the security’s interest, but none of its principal. IOs are particularly sensitive to changes in interest rates and therefore subject to greater fluctuations in price than typical interest bearing debt securities. IOs are also subject to credit risk because the Fund may not receive all or part of the interest payments if the issuer, obligor, guarantor or counterparty defaults on its obligation. Payments received for IOs are included in interest income on the Statement of Operations. Because no principal will be received at the maturity of an IO, adjustments are made to the cost of the security on a monthly basis until maturity. These adjustments are included in interest income on the Statement of Operations. POs are stripped securities entitled to receive the principal from the underlying obligation, but not the interest. POs are particularly sensitive to changes in interest rates and therefore are subject to fluctuations in price. POs are also subject to credit risk because the Fund may not receive all or part of its principal if the issuer, obligor, guarantor or counterparty defaults on its obligation. The Fund may also invest in IO or PO stripped mortgage-backed securities. Payments received for POs are treated as reductions to the cost and par value of the securities.
Security transactions
Security transactions are accounted for on the trade date. Cost is determined and gains (losses) are based upon the specific identification method for both financial statement and federal income tax purposes.
Income recognition
Interest income is recorded on an accrual basis. Market premiums and discounts, including original issue discounts, are amortized and accreted, respectively, over the expected life of the security on all debt securities, unless otherwise noted. The Fund classifies gains and losses realized on prepayments received on mortgage-backed securities as adjustments to interest income.
| 36 | Columbia Bond Fund | Annual Report 2018 |
Notes to Financial Statements (continued)
April 30, 2018
The Fund may place a debt security on non-accrual status and reduce related interest income when it becomes probable that the interest will not be collected and the amount of uncollectible interest can be reasonably estimated. A defaulted debt security is removed from non-accrual status when the issuer resumes interest payments or when collectibility of interest is reasonably assured.
Corporate actions and dividend income are recorded on the ex-dividend date.
The Fund may receive distributions from holdings in equity securities, business development companies (BDCs), exchange-traded funds (ETFs), limited partnerships (LPs), other regulated investment companies (RICs), and real estate investment trusts (REITs), which report information on the tax character of their distributions annually. These distributions are allocated to dividend income, capital gain and return of capital based on actual information reported. Return of capital is recorded as a reduction of the cost basis of securities held. If the Fund no longer owns the applicable securities, return of capital is recorded as a realized gain. With respect to REITs, to the extent actual information has not yet been reported, estimates for return of capital are made by the Fund’s management. Management’s estimates are subsequently adjusted when the actual character of the distributions is disclosed by the REITs, which could result in a proportionate change in return of capital to shareholders.
Awards from class action litigation are recorded as a reduction of cost basis if the Fund still owns the applicable securities on the payment date. If the Fund no longer owns the applicable securities, the proceeds are recorded as realized gains.
Expenses
General expenses of the Trust are allocated to the Fund and other funds of the Trust based upon relative net assets or other expense allocation methodologies determined by the nature of the expense. Expenses directly attributable to the Fund are charged to the Fund. Expenses directly attributable to a specific class of shares are charged to that share class.
Determination of class net asset value
All income, expenses (other than class-specific expenses, which are charged to that share class, as shown in the Statement of Operations) and realized and unrealized gains (losses) are allocated to each class of the Fund on a daily basis, based on the relative net assets of each class, for purposes of determining the net asset value of each class.
Federal income tax status
The Fund intends to qualify each year as a regulated investment company under Subchapter M of the Internal Revenue Code, as amended, and will distribute substantially all of its investment company taxable income and net capital gain, if any, for its tax year, and as such will not be subject to federal income taxes. In addition, the Fund intends to distribute in each calendar year substantially all of its ordinary income, capital gain net income and certain other amounts, if any, such that the Fund should not be subject to federal excise tax. Therefore, no federal income or excise tax provision is recorded.
Foreign taxes
The Fund may be subject to foreign taxes on income, gains on investments or currency repatriation, a portion of which may be recoverable. The Fund will accrue such taxes and recoveries, as applicable, based upon its current interpretation of tax rules and regulations that exist in the markets in which it invests.
Realized gains in certain countries may be subject to foreign taxes at the Fund level, based on statutory rates. The Fund accrues for such foreign taxes on realized and unrealized gains at the appropriate rate for each jurisdiction, as applicable. The amount, if any, is disclosed as a liability on the Statement of Assets and Liabilities.
Distributions to shareholders
Distributions from net investment income, if any, are declared daily and paid monthly. Net realized capital gains, if any, are distributed at least annually. Income distributions and capital gain distributions are determined in accordance with federal income tax regulations, which may differ from GAAP.
Columbia Bond Fund | Annual Report 2018
| 37 |
Notes to Financial Statements (continued)
April 30, 2018
Guarantees and indemnifications
Under the Trust’s organizational documents and, in some cases, by contract, its officers and trustees are indemnified against certain liabilities arising out of the performance of their duties to the Trust or its funds. In addition, certain of the Fund’s contracts with its service providers contain general indemnification clauses. The Fund’s maximum exposure under these arrangements is unknown since the amount of any future claims that may be made against the Fund cannot be determined, and the Fund has no historical basis for predicting the likelihood of any such claims.
Recent accounting pronouncement
Accounting Standards Update 2017-08 Premium Amortization on Purchased Callable Debt Securities
In March 2017, the Financial Accounting Standards Board issued Accounting Standards Update (ASU) No. 2017-08 Premium Amortization on Purchased Callable Debt Securities. ASU No. 2017-08 updates the accounting standards to shorten the amortization period for certain purchased callable debt securities, held at a premium, to be amortized to the earliest call date. The update applies to securities with explicit, noncontingent call features that are callable at fixed prices and on preset dates. The standard is effective for annual periods beginning after December 15, 2018 and interim periods within those fiscal years. At this time, management is evaluating the implication of this guidance and the impact it will have on the financial statement amounts and footnote disclosures, if any.
Note 3. Fees and other transactions with affiliates
Management services fees
The Fund has entered into a Management Agreement with Columbia Management Investment Advisers, LLC (the Investment Manager), a wholly-owned subsidiary of Ameriprise Financial, Inc. (Ameriprise Financial). Under the Management Agreement, the Investment Manager provides the Fund with investment research and advice, as well as administrative and accounting services. The management services fee is an annual fee that is equal to a percentage of the Fund’s daily net assets that declines from 0.50% to 0.34% as the Fund’s net assets increase. The effective management services fee rate for the year ended April 30, 2018 was 0.50% of the Fund’s average daily net assets.
Compensation of board members
Members of the Board of Trustees who are not officers or employees of the Investment Manager or Ameriprise Financial are compensated for their services to the Fund as disclosed in the Statement of Operations. These members of the Board of Trustees may participate in a Deferred Compensation Plan (the Plan) which may be terminated at any time. Obligations of the Plan will be paid solely out of the Fund’s assets, and all amounts payable under the Plan constitute a general unsecured obligation of the Fund.
Compensation of Chief Compliance Officer
The Board of Trustees has appointed a Chief Compliance Officer to the Fund in accordance with federal securities regulations. As disclosed in the Statement of Operations, a portion of the Chief Compliance Officer’s total compensation is allocated to the Fund, along with other allocations to affiliated funds governed by the Board of Trustees, based on relative net assets.
Transfer agency fees
Under a Transfer and Dividend Disbursing Agent Agreement, Columbia Management Investment Services Corp. (the Transfer Agent), an affiliate of the Investment Manager and a wholly-owned subsidiary of Ameriprise Financial, is responsible for providing transfer agency services to the Fund. The Transfer Agent has contracted with DST Asset Manager Solutions, Inc. (DST) to serve as sub-transfer agent. The Transfer Agent pays the fees of DST for services as sub-transfer agent and DST is not entitled to reimbursement for such fees from the Fund (with the exception of out-of-pocket fees).
| 38 | Columbia Bond Fund | Annual Report 2018 |
Notes to Financial Statements (continued)
April 30, 2018
The Fund pays the Transfer Agent a monthly transfer agency fee based on the number or the average value of accounts, depending on the type of account. In addition, the Fund pays the Transfer Agent a fee for shareholder services based on the number of accounts or on a percentage of the average aggregate value of the Fund’s shares maintained in omnibus accounts up to the lesser of the amount charged by the financial intermediary or a cap established by the Board of Trustees from time to time.
The Transfer Agent also receives compensation from the Fund for various shareholder services and reimbursements for certain out-of-pocket fees. Effective August 1, 2017, total transfer agency fees for Institutional 2 Class and Institutional 3 Class shares are subject to an annual limitation of not more than 0.07% and 0.02%, respectively, of the average daily net assets attributable to each share class. Prior to August 1, 2017, these limitations were 0.075% for Institutional 2 Class shares and 0.025% for Institutional 3 Class shares.
For the year ended April 30, 2018, the Fund’s effective transfer agency fee rates as a percentage of average daily net assets of each class were as follows:
| | Effective rate (%) |
| Class A | 0.18 |
| Advisor Class | 0.17 |
| Class B | 0.05 (a) |
| Class C | 0.17 |
| Institutional Class | 0.18 |
| Institutional 2 Class | 0.07 |
| Institutional 3 Class | 0.01 |
| Class R | 0.17 |
| Class T | 0.17 |
| Class V | 0.17 |
An annual minimum account balance fee of $20 may apply to certain accounts with a value below the applicable share class’s initial minimum investment requirements to reduce the impact of small accounts on transfer agency fees. These minimum account balance fees are remitted to the Fund and recorded as part of expense reductions in the Statement of Operations. For the year ended April 30, 2018, these minimum account balance fees reduced total expenses of the Fund by $1,400.
Distribution and service fees
The Fund has entered into an agreement with Columbia Management Investment Distributors, Inc. (the Distributor), an affiliate of the Investment Manager and a wholly-owned subsidiary of Ameriprise Financial, for distribution and shareholder services. The Board of Trustees has approved, and the Fund has adopted, distribution and shareholder service plans (the Plans) applicable to certain share classes, which set the distribution and service fees for the Fund. These fees are calculated daily and are intended to compensate the Distributor and/or eligible selling and/or servicing agents for selling shares of the Fund and providing services to investors.
Under the Plans, the Fund pays a monthly service fee to the Distributor at the maximum annual rate of 0.25% of the average daily net assets attributable to Class A, Class B, Class C and Class T shares of the Fund. Also under the Plans, the Fund pays a monthly distribution fee to the Distributor at the maximum annual rates of 0.75%, 0.75%, 0.50% and 0.25% of the average daily net assets attributable to Class B, Class C, Class R and Class T shares of the Fund, respectively. As a result of all Class B shares of the Fund being redeemed or converted to Class A shares, August 4, 2017 was the last day the Fund paid a service fee or distribution fee for Class B shares.
Although the Fund may pay a distribution fee up to 0.25% of the Fund’s average daily net assets attributable to Class T shares and a service fee of up to 0.25% of the Fund’s average daily net assets attributable to Class T shares, the aggregate fee shall not exceed 0.25% of the Fund’s average daily net assets attributable to Class T shares.
Columbia Bond Fund | Annual Report 2018
| 39 |
Notes to Financial Statements (continued)
April 30, 2018
Shareholder services fees
The Fund has adopted a shareholder services plan that permits it to pay for certain services provided to Class V shareholders by their selling and/or servicing agents. The Fund may pay shareholder servicing fees up to an aggregate annual rate of 0.40% of the Fund’s average daily net assets attributable to Class V shares (comprised of up to 0.20% for shareholder liaison services and up to 0.20% for administrative support services). These fees are currently limited to an aggregate annual rate of not more than 0.15% of the Fund’s average daily net assets attributable to Class V shares.
Sales charges (unaudited)
Sales charges, including front-end charges and CDSCs, received by the Distributor for distributing Fund shares for the year ended April 30, 2018, if any, are listed below:
| | Amount ($) |
| Class A | 75,329 |
| Class C | 803 |
| Class V | 1,070 |
Expenses waived/reimbursed by the Investment Manager and its affiliates
The Investment Manager and certain of its affiliates have contractually agreed to waive fees and/or reimburse expenses (excluding certain fees and expenses described below) for the period(s) disclosed below, unless sooner terminated at the sole discretion of the Board of Trustees, so that the Fund’s net operating expenses, after giving effect to fees waived/expenses reimbursed and any balance credits and/or overdraft charges from the Fund’s custodian, do not exceed the following annual rate(s) as a percentage of the class’ average daily net assets:
| | Fee rate(s) contractual
through
August 31, 2018 |
| Class A | 0.86% |
| Advisor Class | 0.61 |
| Class C | 1.61 |
| Institutional Class | 0.61 |
| Institutional 2 Class | 0.51 |
| Institutional 3 Class | 0.46 |
| Class R | 1.11 |
| Class T | 0.86 |
| Class V | 0.76 |
Under the agreement governing these fee waivers and/or expense reimbursement arrangements, the following fees and expenses are excluded from the waiver/reimbursement commitment, and therefore will be paid by the Fund, if applicable: taxes (including foreign transaction taxes), expenses associated with investments in affiliated and non-affiliated pooled investment vehicles (including mutual funds and exchange-traded funds), transaction costs and brokerage commissions, costs related to any securities lending program, dividend expenses associated with securities sold short, inverse floater program fees and expenses, transaction charges and interest on borrowed money, interest, infrequent and/or unusual expenses and any other expenses the exclusion of which is specifically approved by the Board of Trustees. This agreement may be modified or amended only with approval from the Investment Manager, certain of its affiliates and the Fund. Any fees waived and/or expenses reimbursed under the expense reimbursement arrangements described above are not recoverable by the Investment Manager or its affiliates in future periods.
Note 4. Federal tax information
The timing and character of income and capital gain distributions are determined in accordance with income tax regulations, which may differ from GAAP because of temporary or permanent book to tax differences.
| 40 | Columbia Bond Fund | Annual Report 2018 |
Notes to Financial Statements (continued)
April 30, 2018
At April 30, 2018, these differences were primarily due to differing treatment for deferral/reversal of wash sale losses, derivative investments, tax straddles, post-October capital losses, trustees’ deferred compensation, distributions, principal and/or interest from fixed income securities and distribution reclassifications. To the extent these differences were permanent, reclassifications were made among the components of the Fund’s net assets in the Statement of Assets and Liabilities. Temporary differences do not require reclassifications.
In the Statement of Assets and Liabilities the following reclassifications were made:
Excess of distributions
over net investment
income ($) | Accumulated
net realized
(loss) ($) | Paid in
capital ($) |
| (133,146) | 131,905 | 1,241 |
Net investment income (loss) and net realized gains (losses), as disclosed in the Statement of Operations, and net assets were not affected by this reclassification.
The tax character of distributions paid during the years indicated was as follows:
| Year Ended April 30, 2018 | Year Ended April 30, 2017 |
Ordinary
income ($) | Long-term
capital gains ($) | Total ($) | Ordinary
income ($) | Long-term
capital gains ($) | Total ($) |
| 9,279,750 | 476,218 | 9,755,968 | 20,442,769 | 2,591,991 | 23,034,760 |
Short-term capital gain distributions, if any, are considered ordinary income distributions for tax purposes.
At April 30, 2018, the components of distributable earnings on a tax basis were as follows:
Undistributed
ordinary income ($) | Undistributed
long-term
capital gains ($) | Capital loss
carryforwards ($) | Net unrealized
(depreciation) ($) |
| 765,367 | — | — | (6,833,866) |
At April 30, 2018, the cost of all investments for federal income tax purposes along with the aggregate gross unrealized appreciation and depreciation based on that cost was:
Federal
tax cost ($) | Gross unrealized
appreciation ($) | Gross unrealized
(depreciation) ($) | Net unrealized
(depreciation) ($) |
| 478,087,843 | 2,396,157 | (9,230,023) | (6,833,866) |
Tax cost of investments and unrealized appreciation/(depreciation) may also include timing differences that do not constitute adjustments to tax basis.
Under current tax rules, regulated investment companies can elect to treat certain late-year ordinary losses incurred and post-October capital losses (capital losses realized after October 31) as arising on the first day of the following taxable year. As of April 30, 2018, the Fund will elect to treat the following late-year ordinary losses and post-October capital losses as arising on May 1, 2018.
Late year
ordinary losses ($) | Post-October
capital losses ($) |
| — | 509,491 |
Management of the Fund has concluded that there are no significant uncertain tax positions in the Fund that would require recognition in the financial statements. However, management’s conclusion may be subject to review and adjustment at a later date based on factors including, but not limited to, new tax laws, regulations, and administrative interpretations (including relevant court decisions). Generally, the Fund’s federal tax returns for the prior three fiscal years remain subject to examination by the Internal Revenue Service.
Columbia Bond Fund | Annual Report 2018
| 41 |
Notes to Financial Statements (continued)
April 30, 2018
Note 5. Portfolio information
The cost of purchases and proceeds from sales of securities, excluding short-term investments and derivatives, if any, aggregated to $1,247,540,154 and $1,291,217,613, respectively, for the year ended April 30, 2018, of which $929,999,251 and $1,029,091,509, respectively, were U.S. government securities. The amount of purchase and sale activity impacts the portfolio turnover rate reported in the Financial Highlights.
Note 6. Affiliated money market fund
The Fund invests in Columbia Short-Term Cash Fund, an affiliated money market fund established for the exclusive use by the Fund and other affiliated funds (the Affiliated MMF). The income earned by the Fund from such investments is included as Dividends - affiliated issuers in the Statement of Operations. As an investing fund, the Fund indirectly bears its proportionate share of the expenses of the Affiliated MMF. The Affiliated MMF prices its shares with a floating net asset value. In addition, the Board of Trustees of the Affiliated MMF may impose a fee on redemptions (sometimes referred to as a liquidity fee) or temporarily suspend redemptions (sometimes referred to as imposing a redemption gate) in the event its liquidity falls below regulatory limits.
Note 7. Line of credit
The Fund has access to a revolving credit facility with a syndicate of banks led by Citibank, N.A., HSBC Bank USA, N.A. and JPMorgan Chase Bank, N.A. whereby the Fund may borrow for the temporary funding of shareholder redemptions or for other temporary or emergency purposes. The credit facility, which is a collective agreement between the Fund and certain other funds managed by the Investment Manager, severally and not jointly, permits collective borrowings up to $1 billion. Interest is charged to each participating fund based on its borrowings at a rate equal to the higher of (i) the overnight federal funds rate plus 1.00% or (ii) the one-month LIBOR rate plus 1.00%. Each borrowing under the credit facility matures no later than 60 days after the date of borrowing. The Fund also pays a commitment fee equal to its pro rata share of the amount of the credit facility at a rate of 0.15% per annum. The commitment fee is included in other expenses in the Statement of Operations.
The Fund had no borrowings during the year ended April 30, 2018.
Note 8. Significant risks
Credit risk
Credit risk is the risk that the value of debt securities in the Fund’s portfolio may decline because the issuer may default and fail to pay interest or repay principal when due. Rating agencies assign credit ratings to debt securities to indicate their credit risk. Lower rated or unrated debt securities held by the Fund may present increased credit risk as compared to higher-rated debt securities.
Interest rate risk
Interest rate risk is the risk of losses attributable to changes in interest rates. In general, if prevailing interest rates rise, the values of debt securities tend to fall, and if interest rates fall, the values of debt securities tend to rise. Actions by governments and central banking authorities can result in increases in interest rates. Increasing interest rates may negatively affect the value of debt securities held by the Fund, resulting in a negative impact on the Fund’s performance and net asset value per share. In general, the longer the maturity or duration of a debt security, the greater its sensitivity to changes in interest rates.
Liquidity risk
Liquidity risk is the risk associated with a lack of marketability of investments which may make it difficult to sell the investment at a desirable time or price. Changing regulatory, market or other conditions or environments (for example, the interest rate or credit environments) may adversely affect the liquidity of the Fund’s investments. The Fund may have to accept a lower selling price for the holding, sell other investments, or forego another, more appealing investment opportunity.
| 42 | Columbia Bond Fund | Annual Report 2018 |
Notes to Financial Statements (continued)
April 30, 2018
Generally, the less liquid the market at the time the Fund sells a portfolio investment, the greater the risk of loss or decline of value to the Fund. A less liquid market can lead to an increase in Fund redemptions, which may negatively impact Fund performance and net asset value per share, including, for example, if the Fund is forced to sell securities in a down market.
Mortgage- and other asset-backed securities risk
The value of any mortgage-backed and other asset-backed securities held by the Fund may be affected by, among other things, changes or perceived changes in: interest rates; factors concerning the interests in and structure of the issuer or the originator of the mortgages or other assets; the creditworthiness of the entities that provide any supporting letters of credit, surety bonds or other credit enhancements; or the market’s assessment of the quality of underlying assets. Payment of principal and interest on some mortgage-backed securities (but not the market value of the securities themselves) may be guaranteed by the full faith and credit of a particular U.S. Government agency, authority, enterprise or instrumentality, and some, but not all, are also insured or guaranteed by the U.S. Government. Mortgage-backed securities issued by non-governmental issuers (such as commercial banks, savings and loan institutions, private mortgage insurance companies, mortgage bankers and other secondary market issuers) may entail greater risk than obligations guaranteed by the U.S. Government. Mortgage- and other asset-backed securities are subject to prepayment risk, which is the possibility that the underlying mortgage or other asset may be refinanced or prepaid prior to maturity during periods of declining or low interest rates, causing the Fund to have to reinvest the money received in securities that have lower yields. Rising or high interest rates tend to extend the duration of mortgage- and other asset-backed securities, making their prices more volatile and more sensitive to changes in interest rates.
Shareholder concentration risk
At April 30, 2018, one unaffiliated shareholder of record owned 74.7% of the outstanding shares of the Fund in one or more accounts. The Fund has no knowledge about whether any portion of those shares was owned beneficially. Subscription and redemption activity by concentrated accounts may have a significant effect on the operations of the Fund. In the case of a large redemption, the Fund may be forced to sell investments at inopportune times, including its liquid positions, which may result in Fund losses and the Fund holding a higher percentage of less liquid positions. Large redemptions could result in decreased economies of scale and increased operating expenses for non-redeeming Fund shareholders.
Note 9. Subsequent events
Management has evaluated the events and transactions that have occurred through the date the financial statements were issued and noted no items requiring adjustment of the financial statements or additional disclosure.
Note 10. Information regarding pending and settled legal proceedings
Ameriprise Financial and certain of its affiliates have historically been involved in a number of legal, arbitration and regulatory proceedings, including routine litigation, class actions, and governmental actions, concerning matters arising in connection with the conduct of their business activities. Ameriprise Financial believes that the Fund is not currently the subject of, and that neither Ameriprise Financial nor any of its affiliates are the subject of, any pending legal, arbitration or regulatory proceedings that are likely to have a material adverse effect on the Fund or the ability of Ameriprise Financial or its affiliates to perform under their contracts with the Fund. Ameriprise Financial is required to make quarterly (10-Q), annual (10-K) and, as necessary, 8-K filings with the Securities and Exchange Commission (SEC) on legal and regulatory matters that relate to Ameriprise Financial and its affiliates. Copies of these filings may be obtained by accessing the SEC website at www.sec.gov.
There can be no assurance that these matters, or the adverse publicity associated with them, will not result in increased Fund redemptions, reduced sale of Fund shares or other adverse consequences to the Fund. Further, although we believe proceedings are not likely to have a material adverse effect on the Fund or the ability of Ameriprise Financial or its affiliates to perform under their contracts with the Fund, these proceedings are subject to uncertainties and, as such, we are unable to estimate the possible loss or range of loss that may result. An adverse outcome in one or more of these proceedings could result in adverse judgments, settlements, fines, penalties or other relief that could have a material adverse effect on the consolidated financial condition or results of operations of Ameriprise Financial.
Columbia Bond Fund | Annual Report 2018
| 43 |
Report of Independent Registered Public Accounting Firm
To the Board of Trustees of Columbia Funds Series Trust I and Shareholders of Columbia Bond Fund
Opinion on the Financial Statements
We have audited the accompanying statement of assets and liabilities, including the portfolio of investments, of Columbia Bond Fund (one of the funds constituting Columbia Funds Series Trust I, referred to hereafter as the "Fund") as of April 30, 2018, the related statement of operations for the year ended April 30, 2018, the statement of changes in net assets for each of the two years in the period ended April 30, 2018, including the related notes, and the financial highlights for each of the five years in the period ended April 30, 2018 (collectively referred to as the “financial statements”). In our opinion, the financial statements present fairly, in all material respects, the financial position of the Fund as of April 30, 2018, the results of its operations for the year then ended, the changes in its net assets for each of the two years in the period ended April 30, 2018 and the financial highlights for each of the five years in the period ended April 30, 2018 in conformity with accounting principles generally accepted in the United States of America.
Basis for Opinion
These financial statements are the responsibility of the Fund’s management. Our responsibility is to express an opinion on the Fund’s financial statements based on our audits. We are a public accounting firm registered with the Public Company Accounting Oversight Board (United States) (“PCAOB”) and are required to be independent with respect to the Fund in accordance with the U.S. federal securities laws and the applicable rules and regulations of the Securities and Exchange Commission and the PCAOB.
We conducted our audits of these financial statements in accordance with the standards of the PCAOB. Those standards require that we plan and perform the audit to obtain reasonable assurance about whether the financial statements are free of material misstatement, whether due to error or fraud.
Our audits included performing procedures to assess the risks of material misstatement of the financial statements, whether due to error or fraud, and performing procedures that respond to those risks. Such procedures included examining, on a test basis, evidence regarding the amounts and disclosures in the financial statements. Our audits also included evaluating the accounting principles used and significant estimates made by management, as well as evaluating the overall presentation of the financial statements. Our procedures included confirmation of securities owned as of April 30, 2018 by correspondence with the custodian, transfer agent and brokers; when replies were not received from brokers, we performed other auditing procedures. We believe that our audits provide a reasonable basis for our opinion.
/s/PricewaterhouseCoopers LLP
Minneapolis, Minnesota
June 21, 2018
We have served as auditors of one or more investment companies within the Columbia Funds Complex since 1977.
| 44 | Columbia Bond Fund | Annual Report 2018 |
Federal Income Tax Information
(Unaudited)
The Fund hereby designates the following tax attributes for the fiscal year ended April 30, 2018. Shareholders will be notified in early 2019 of the amounts for use in preparing 2018 income tax returns.
Capital
gain
dividend | |
| $500,029 | |
Capital gain dividend. The Fund designates as a capital gain dividend the amount reflected above, or if subsequently determined to be different, the net capital gain of such fiscal period.
Columbia Bond Fund | Annual Report 2018
| 45 |
Shareholders elect the Board that oversees the Fund’s operations. The Board appoints officers who are responsible for day-to-day business decisions based on policies set by the Board. The following table provides basic biographical information about the Fund’s Trustees, including their principal occupations during the past five years, although specific titles for individuals may have varied over the period. The year set forth beneath Length of Service in the table below is the year in which the Trustee was first appointed or elected as Trustee to any Fund currently in the Columbia Funds Complex or a predecessor thereof. Under current Board policy, members serve terms of indefinite duration.
Independent trustees
| Name, address, year of birth | Position held with the Trust and length of service | Principal occupation(s) during the past five years and other relevant professional experience | Number of Funds in the Columbia Fund Complex overseen | Other directorships held by Trustee during the past five years |
Janet Langford Carrig
c/o Columbia Management
Investment Advisers, LLC
225 Franklin Street
Mail Drop BX32 05228
Boston, MA 02110
1957 | Trustee
1996 | Senior Vice President, General Counsel and Corporate Secretary, ConocoPhillips (independent energy company) since September 2007 | 71 | None |
Douglas A. Hacker
c/o Columbia Management
Investment Advisers, LLC
225 Franklin Street
Mail Drop BX32 05228
Boston, MA 02110
1955 | Trustee and Chairman of the Board
1996 | Independent business executive since May 2006; Executive Vice President — Strategy of United Airlines from December 2002 to May 2006; President of UAL Loyalty Services (airline marketing company) from September 2001 to December 2002; Executive Vice President and Chief Financial Officer of United Airlines from July 1999 to September 2001 | 71 | Spartan Nash Company, (food distributor); Nash Finch Company (food distributor) from 2005 to 2013; Aircastle Limited (aircraft leasing); SeaCube Container Leasing Ltd. (container leasing) from 2010 to 2013; and Travelport Worldwide Limited (travel information technology) |
Nancy T. Lukitsh
c/o Columbia Management
Investment Advisers, LLC
225 Franklin Street
Mail Drop BX32 05228
Boston, MA 02110
1956 | Trustee
2011 | Senior Vice President, Partner and Director of Marketing, Wellington Management Company, LLP (investment adviser) from 1997 to 2010; Chair, Wellington Management Portfolios (commingled non-U.S. investment pools) from 2007 to 2010; Director, Wellington Trust Company, NA and other Wellington affiliates from 1997 to 2010 | 71 | None |
David M. Moffett
c/o Columbia Management
Investment Advisers, LLC
225 Franklin Street
Mail Drop BX32 05228
Boston, MA 02110
1952 | Trustee
2011 | Retired. Consultant to Bridgewater and Associates | 71 | Director, CSX Corporation; Genworth Financial, Inc. (financial and insurance products and services); PayPal Holdings Inc. (payment and data processing services); Trustee, University of Oklahoma Foundation; former Director, eBay Inc. (online trading community), 2007-2015; and former Director, CIT Bank, CIT Group Inc. (commercial and consumer finance), 2010-2016 |
John J. Neuhauser
c/o Columbia Management
Investment Advisers, LLC
225 Franklin Street
Mail Drop BX32 05228
Boston, MA 02110
1943 | Trustee
1984 | President, Saint Michael’s College since August 2007; Director or Trustee of several non-profit organizations, including University of Vermont Medical Center; Academic Vice President and Dean of Faculties, Boston College from August 1999 to October 2005; University Professor, Boston College from November 2005 to August 2007 | 71 | Liberty All-Star Equity Fund and Liberty All- Star Growth Fund (closed-end funds) |
| 46 | Columbia Bond Fund | Annual Report 2018 |
TRUSTEES AND OFFICERS (continued)
Independent trustees (continued)
| Name, address, year of birth | Position held with the Trust and length of service | Principal occupation(s) during the past five years and other relevant professional experience | Number of Funds in the Columbia Fund Complex overseen | Other directorships held by Trustee during the past five years |
Patrick J. Simpson
c/o Columbia Management
Investment Advisers, LLC
225 Franklin Street
Mail Drop BX32 05228
Boston, MA 02110
1944 | Trustee
2000 | Of Counsel, Perkins Coie LLP (law firm) since 2015; Partner, Perkins Coie LLP from 1988 to 2014 | 71 | None |
Anne-Lee Verville
c/o Columbia Management
Investment Advisers, LLC
225 Franklin Street
Mail Drop BX32 05228
Boston, MA 02110
1945 | Trustee
1998 | Retired. General Manager, Global Education Industry from 1994 to 1997, President – Application Systems Division from 1991 to 1994, Chief Financial Officer – US Marketing & Services from 1988 to 1991, and Chief Information Officer from 1987 to 1988, IBM Corporation (computer and technology) | 71 | Enesco Group, Inc. (producer of giftware and home and garden decor products) from 2001 to 2006 |
Consultants to the Independent Trustees*
| Name, address, year of birth | Position held with the Trust and length of service | Principal occupation(s) during the past five years and other relevant professional experience | Number of Funds in the Columbia Funds complex overseen | Other directorships held by Trustee during the past five years |
J. Kevin Connaughton
c/o Columbia
Management Investment
Advisers, LLC,
225 Franklin Street
Mail Drop BX32 05228,
Boston, MA 02110
1964 | Independent Trustee Consultant
2016 | Independent Trustee Consultant, Columbia Funds since March 2016; Adjunct Professor of Finance, Bentley University since November 2017; Managing Director and General Manager of Mutual Fund Products, Columbia Management Investment Advisers, LLC from May 2010 to February 2015; President, Columbia Funds from 2009 to 2015; and senior officer of Columbia Funds and affiliated funds from 2003 to 2015 | 71 | Director, The Autism Project since March 2015; former Trustee, New Century Portfolios, March 2015-December 2017; formerly on Board of Governors, Gateway Healthcare, January 2016 – December 2017 |
Natalie A. Trunow
c/o Columbia
Management Investment
Advisers, LLC,
225 Franklin Street
Mail Drop BX32 05228,
Boston, MA 02110
1967 | Independent Trustee Consultant
2016 | Independent Trustee Consultant, Columbia Funds since September 2016; Chief Executive Officer, Millennial Portfolio Solutions LLC (asset management and consulting services) since January 2016; Director of Investments, Casey Family Programs from April 2016 to September 2016; Senior Vice President and Chief Investment Officer, Calvert Investments from August 2008 to January 2016; Section Head and Portfolio Manager, General Motors Asset Management from June 1997 to August 2008 | 71 | Director, Health Services for Children with Special Needs, Inc.; Director, Guidewell Financial Solutions |
| * | J. Kevin Connaughton was appointed consultant to the Independent Trustees effective March 1, 2016. Natalie A. Trunow was appointed consultant to the Independent Trustees effective September 1, 2016. Shareholders of the Funds are expected to be asked to elect each of Mr. Connaughton and Ms. Trunow as a Trustee at a future shareholder meeting. |
Columbia Bond Fund | Annual Report 2018
| 47 |
TRUSTEES AND OFFICERS (continued)
Interested trustee affiliated with Investment Manager*
| Name, address, year of birth | Position held with the Trust and length of service | Principal occupation(s) during the past five years and other relevant professional experience | Number of Funds in the Columbia Funds Complex overseen | Other directorships held by Trustee during the past five years |
William F. Truscott
c/o Columbia Management
Investment Advisers, LLC
225 Franklin Street
Boston, MA 02110
1960 | Trustee
2012 | Chairman of the Board and President, Columbia Management Investment Advisers, LLC since May 2010 and February 2012, respectively; Chief Executive Officer, Global Asset Management, Ameriprise Financial, Inc. since September 2012 (previously Chief Executive Officer, U.S. Asset Management & President, Annuities, May 2010-September 2012); Director and Chief Executive Officer, Columbia Management Investment Distributors, Inc. since May 2010 and February 2012, respectively; Chairman of the Board and Chief Executive Officer, RiverSource Distributors, Inc. since 2006; Director, Threadneedle Asset Management Holdings, SARL since 2014; President and Chief Executive Officer, Ameriprise Certificate Company, 2006-August 2012 | 196 | Chairman of the Board, Columbia Management Investment Advisers, LLC since May 2010; Director, Columbia Management Investment Distributors, Inc. since May 2010; former Director, Ameriprise Certificate Company, 2006 - January 2013 |
| * | Interested person (as defined under the 1940 Act) by reason of being an officer, director, security holder and/or employee of the Investment Manager or Ameriprise Financial. |
The Statement of Additional Information has additional information about the Fund’s Board members and is available, without charge, upon request by calling 800.345.6611, visiting columbiathreadneedleus.com/investor/ or contacting your financial intermediary.
| 48 | Columbia Bond Fund | Annual Report 2018 |
TRUSTEES AND OFFICERS (continued)
The Board has appointed officers who are responsible for day-to-day business decisions based on policies it has established. The officers serve at the pleasure of the Board. The following table provides basic information about the Officers of the Fund, including principal occupations during the past five years, although their specific titles may have varied over the period. In addition to Mr. Truscott, who is Senior Vice President, the Fund’s other officers are:
Fund officers
Name,
address and
year of birth | Position and year
first appointed to
position for any Fund
in the Columbia
Funds complex or a
predecessor thereof | Principal occupation(s) during past five years |
Christopher O. Petersen
5228 Ameriprise
Financial Center
Minneapolis, MN 55474
Born 1970 | President and Principal Executive Officer (2015) | Vice President and Lead Chief Counsel, Ameriprise Financial, Inc. since January 2015 (previously, Vice President and Chief Counsel, January 2010 - December 2014; officer of Columbia Funds and affiliated funds since 2007. |
Michael G. Clarke
225 Franklin Street
Boston, MA 02110
Born 1969 | Treasurer (2011), Chief Financial Officer (2009) and Chief Accounting Officer (2015) | Vice President — Mutual Fund Administration, Columbia Management Investment Advisers, LLC, since May 2010; senior officer of Columbia Funds and affiliated funds since 2002. |
Paul B. Goucher
100 Park Avenue
New York, NY 10017
Born 1968 | Senior Vice President (2011) and Assistant Secretary (2008) | Senior Vice President and Assistant General Counsel, Ameriprise Financial, Inc. since January 2017 (previously Vice President and Lead Chief Counsel, November 2008 - January 2017 and January 2013 - January 2017, respectively; and Chief Counsel, January 2010 - January 2013); Vice President, Chief Legal Officer and Assistant Secretary, Columbia Management Investment Advisers, LLC since May 2010. |
Thomas P. McGuire
225 Franklin Street
Boston, MA 02110
Born 1972 | Senior Vice President and Chief Compliance Officer (2012) | Vice President — Asset Management Compliance, Ameriprise Financial, Inc., since May 2010; Chief Compliance Officer, Ameriprise Certificate Company since September 2010. |
Colin Moore
225 Franklin Street
Boston, MA 02110
Born 1958 | Senior Vice President (2010) | Executive Vice President and Global Chief Investment Officer, Ameriprise Financial, Inc., since July 2013; Executive Vice President and Global Chief Investment Officer, Columbia Management Investment Advisers, LLC since July 2013 (previously Director and Global Chief Investment Officer, 2010 - 2013). |
Ryan C. Larrenaga
225 Franklin Street
Boston, MA 02110
Born 1970 | Senior Vice President (2017), Chief Legal Officer (2017) and Secretary (2015) | Vice President and Group Counsel, Ameriprise Financial, Inc. since August 2011; officer of Columbia Funds and affiliated funds since 2005. |
Michael E. DeFao
225 Franklin Street
Boston, MA 02110
Born 1968 | Vice President (2011) and Assistant Secretary (2010) | Vice President and Chief Counsel, Ameriprise Financial, Inc. since May 2010. |
Amy Johnson
5228 Ameriprise
Financial Center
Minneapolis, MN 55474
Born 1965 | Vice President (2006) | Managing Director and Global Head of Operations, Columbia Management Investment Advisers, LLC since April 2016 (previously Managing Director and Chief Operating Officer, 2010 - 2016). |
Lyn Kephart-Strong
5228 Ameriprise
Financial Center
Minneapolis, MN 55474
Born 1960 | Vice President (2015) | President, Columbia Management Investment Services Corp. since October 2014; Vice President & Resolution Officer, Ameriprise Trust Company since August 2009. |
Columbia Bond Fund | Annual Report 2018
| 49 |
The Fund mails one shareholder report to each shareholder address. If you would like more than one report, please call shareholder services at 800.345.6611 and additional reports will be sent to you.
Proxy voting policies and procedures
The policy of the Board of Trustees is to vote the proxies of the companies in which the Fund holds investments consistent with the procedures as stated in the Statement of Additional Information (SAI). You may obtain a copy of the SAI without charge by calling 800.345.6611; contacting your financial intermediary; visiting columbiathreadneedleus.com/investor/; or searching the website of the Securities and Exchange Commission (SEC) at sec.gov. Information regarding how the Fund voted proxies relating to portfolio securities is filed with the SEC by August 31st for the most recent 12-month period ending June 30th of that year, and is available without charge by visiting columbiathreadneedleus.com/investor/, or searching the website of the SEC at sec.gov.
Quarterly schedule of investments
The Fund files a complete schedule of portfolio holdings with the SEC for the first and third quarters of each fiscal year on Form N-Q. The Fund’s Form N-Q is available on the SEC’s website at sec.gov and may be reviewed and copied at the SEC’s Public Reference Room in Washington, D.C. Information on the operation of the Public Reference Room may be obtained by calling 800.SEC.0330. The Fund’s complete schedule of portfolio holdings, as filed on Form N-Q, can also be obtained without charge, upon request, by calling 800.345.6611.
Additional Fund information
For more information about the Fund, please visit columbiathreadneedleus.com/investor/ or call 800.345.6611. Customer Service Representatives are available to answer your questions Monday through Friday from 8 a.m. to 7 p.m. Eastern time.
Fund investment manager
Columbia Management Investment Advisers, LLC
225 Franklin Street
Boston, MA 02110
Fund distributor
Columbia Management Investment Distributors, Inc.
225 Franklin Street
Boston, MA 02110
Fund transfer agent
Columbia Management Investment Services Corp.
P.O. Box 8081
Boston, MA 02266-8081
| 50 | Columbia Bond Fund | Annual Report 2018 |
[THIS PAGE INTENTIONALLY LEFT BLANK]
[THIS PAGE INTENTIONALLY LEFT BLANK]
[THIS PAGE INTENTIONALLY LEFT BLANK]
Columbia Bond Fund
P.O. Box 8081
Boston, MA 02266-8081
Please read and consider the investment objectives, risks, charges and expenses for any fund carefully before investing. For a prospectus and summary prospectus, which contains this and other important information about the Fund, go to
columbiathreadneedleus.com/investor/. The Fund is distributed by Columbia Management Investment Distributors, Inc., member FINRA, and managed by Columbia Management Investment Advisers, LLC.
Columbia Threadneedle Investments (Columbia Threadneedle) is the global brand name of the Columbia and Threadneedle group of companies. All rights reserved. Columbia Management Investment Distributors, Inc., 225 Franklin Street, Boston, MA 02110-2804
© 2018 Columbia Management Investment Advisers, LLC.
columbiathreadneedleus .com/investor/

Annual Report
April 30, 2018
Columbia Small Cap Value Fund I
Not FDIC Insured • No bank guarantee • May lose value
Dear Shareholders,
The year 2017 was an extraordinary year in the financial markets. The S&P 500 Index didn’t experience a single down month and returned over 20%. Continuing this trend, January 2018 marked the fastest start for the index ever. Low volatility, which had been a feature of the U.S. equity market for several years, along with the surge in the S&P 500 Index, drove investor sentiment to very high levels. This arguably set the stage for an overdue correction, which we witnessed in February 2018.
A return to volatility
There have been few periods of market upheaval such as were experienced in the first part of 2018. While investors were taken by surprise by the sudden and pronounced market swings, the return to some level of volatility actually marked a resumption of relatively normal market conditions. Having said that, it’s important to distinguish between a good technical correction where excess enthusiasm in the marketplace is being let out, versus a real change in the underlying fundamentals – things like an underperforming economy or weaker corporate earnings. Our view is that the recent market volatility falls into the former category, and the fundamentals remain strong. We’re continuing to see improvements in global economic activity, and we’re seeing corporate earnings expectations continue to rise – and not just because of tax reform.
Consistency is more important than ever
It’s important to keep in mind that when it comes to long-term investing, it’s the destination, not the journey that matters most. If you have a financial goal that you’ve worked out with your financial advisor, and you have a good asset allocation plan to reach it, it’s a question of sticking with your plan rather than become focused on near-term volatility. Bouts of volatility are normal. After all, it’s hard to cross the ocean without hitting an occasional rough patch. You need to focus on the destination.
One final thought. In weathering volatility, it’s the consistency of the return that is essential. Investors who chase higher returns are usually the first to sell when an investment goes through a bad patch, and they therefore don’t tend to benefit from the recovery. More disciplined investors who perhaps panic less or not at all during periods of volatility, tend to have improved long-term results and are more likely to reach their financial goals. Nothing is more important to us than making sure those who have entrusted us to protect and grow their assets are able to do what matters most to them.
Your success is our priority. Talk to your financial advisor about how working with Columbia Threadneedle Investments may help you position your portfolio for consistent, sustainable outcomes, no matter the market conditions.
Sincerely,
Christopher O. Petersen
President, Columbia Funds
The S&P 500 Index, an unmanaged index, measures the performance of 500 widely held, large-capitalization U.S. stocks and is frequently used as a general measure of market performance. Past performance is no guarantee of future results.
Columbia Funds are distributed by Columbia Management Investment Distributors, Inc., member FINRA, and managed by Columbia Management Investment Advisers, LLC.
© 2018 Columbia Management Investment Advisers, LLC. All rights reserved.
Columbia Small Cap Value Fund I | Annual Report 2018
Columbia Small Cap Value Fund I | Annual Report 2018
Investment objective
Columbia Small Cap Value Fund I (the Fund) seeks long-term capital appreciation.
Portfolio management
Jeremy Javidi, CFA
Portfolio Manager
Managed Fund since 2005
Morningstar style boxTM
The Morningstar Style Box is based on a fund’s portfolio holdings. For equity funds, the vertical axis shows the market capitalization of the stocks owned, and the horizontal axis shows investment style (value, blend, or growth). Information shown is based on the most recent data provided by Morningstar.
© 2018 Morningstar, Inc. All rights reserved. The Morningstar information contained herein: (1) is proprietary to Morningstar and/or its content providers; (2) may not be copied or distributed; and (3) is not warranted to be accurate, complete or timely. Neither Morningstar nor its content providers are responsible for any damages or losses arising from any use of this information.
| Average annual total returns (%) (for the period ended April 30, 2018) |
| | | Inception | 1 Year | 5 Years | 10 Years |
| Class A | Excluding sales charges | 07/25/86 | 10.03 | 11.43 | 8.66 |
| | Including sales charges | | 3.70 | 10.12 | 8.02 |
| Advisor Class* | 11/08/12 | 10.34 | 11.72 | 8.82 |
| Class C | Excluding sales charges | 01/15/96 | 9.24 | 10.61 | 7.85 |
| �� | Including sales charges | | 8.32 | 10.61 | 7.85 |
| Institutional Class | 07/31/95 | 10.32 | 11.72 | 8.94 |
| Institutional 2 Class* | 11/08/12 | 10.45 | 11.88 | 8.90 |
| Institutional 3 Class* | 07/15/09 | 10.50 | 11.93 | 9.09 |
| Class R* | 09/27/10 | 9.77 | 11.16 | 8.40 |
| Russell 2000 Value Index | | 6.53 | 10.36 | 8.46 |
Returns for Class A shares are shown with and without the maximum initial sales charge of 5.75%. Returns for Class C shares are shown with and without the 1.00% contingent deferred sales charges for the first year only. The Fund’s other classes are not subject to sales charges and have limited eligibility. Effective November 1, 2017, Class R4, Class R5, Class Y and Class Z shares were renamed Advisor Class, Institutional 2 Class, Institutional 3 Class and Institutional Class shares, respectively. Please see the Fund’s prospectus for details. Performance for different share classes will vary based on differences in sales charges and fees associated with each class. All results shown assume reinvestment of distributions during the period. Returns do not reflect the deduction of taxes that a shareholder may pay on Fund distributions or on the redemption of Fund shares. Performance results reflect the effect of any fee waivers or reimbursements of Fund expenses by Columbia Management Investment Advisers, LLC and/or any of its affiliates. Absent these fee waivers or expense reimbursement arrangements, performance results would have been lower.
The performance information shown represents past performance and is not a guarantee of future results. The investment return and principal value of your investment will fluctuate so that your shares, when redeemed, may be worth more or less than their original cost. Current performance may be lower or higher than the performance information shown. You may obtain performance information current to the most recent month-end by contacting your financial intermediary, visiting columbiathreadneedleus.com/investor/ or calling 800.345.6611.
| * | The returns shown for periods prior to the share class inception date (including returns for the Life of the Fund, if shown, which are since Fund inception) include the returns of the Fund’s oldest share class. These returns are adjusted to reflect any higher class-related operating expenses of the newer share classes, as applicable. Please visit columbiathreadneedleus.com/investor/investment-products/mutual-funds/appended-performance for more information. |
The Russell 2000 Value Index, an unmanaged index, tracks the performance of those Russell 2000 Index companies with lower price-to-book ratios and lower forecasted growth values.
Indices are not available for investment, are not professionally managed and do not reflect sales charges, fees, brokerage commissions, taxes or other expenses of investing. Securities in the Fund may not match those in an index.
| 2 | Columbia Small Cap Value Fund I | Annual Report 2018 |
Fund at a Glance (continued)
Performance of a hypothetical $10,000 investment (April 30, 2008 — April 30, 2018)
The chart above shows the change in value of a hypothetical $10,000 investment in Class A shares of Columbia Small Cap Value Fund I during the stated time period, and does not reflect the deduction of taxes that a shareholder may pay on Fund distributions or on the redemption of Fund shares.
| Top 10 holdings (%) (at April 30, 2018) |
| Delek U.S. Holdings, Inc. | 1.4 |
| Radian Group, Inc. | 1.3 |
| FirstCash, Inc. | 1.3 |
| Sunstone Hotel Investors, Inc. | 1.1 |
| UMB Financial Corp. | 1.1 |
| RLJ Lodging Trust | 1.0 |
| BankUnited, Inc. | 1.0 |
| Boston Beer Co., Inc. (The), Class A | 1.0 |
| CenterState Bank Corp. | 1.0 |
| American Equity Investment Life Holding Co. | 1.0 |
Percentages indicated are based upon total investments (excluding Money Market Funds).
For further detail about these holdings, please refer to the section entitled “Portfolio of Investments.”
Fund holdings are as of the date given, are subject to change at any time, and are not recommendations to buy or sell any security.
| Portfolio breakdown (%) (at April 30, 2018) |
| Common Stocks | 99.8 |
| Money Market Funds | 0.2 |
| Total | 100.0 |
Percentages indicated are based upon total investments. The Fund’s portfolio composition is subject to change.
| Equity sector breakdown (%) (at April 30, 2018) |
| Consumer Discretionary | 9.9 |
| Consumer Staples | 6.7 |
| Energy | 8.4 |
| Financials | 31.9 |
| Health Care | 8.4 |
| Industrials | 12.1 |
| Information Technology | 7.4 |
| Materials | 6.9 |
| Real Estate | 6.9 |
| Telecommunication Services | 0.6 |
| Utilities | 0.8 |
| Total | 100.0 |
Percentages indicated are based upon total equity investments. The Fund’s portfolio composition is subject to change.
Columbia Small Cap Value Fund I | Annual Report 2018
| 3 |
Manager Discussion of Fund Performance
For the 12-month period that ended April 30, 2018, the Fund’s Class A shares returned 10.03% excluding sales charges. The Fund outperformed its benchmark, the Russell 2000 Value Index, which returned 6.53% over the same period. Investors believed that small cap stocks would be among the greatest beneficiaries of a lower corporate tax rate. Against this backdrop, holdings in the health care, industrials, real estate and materials sectors drove the Fund’s performance advantage over the benchmark. Stock selection and sector allocation both figured into positive relative results.
Equity markets moved higher despite late period setback
Despite political tumult and rising tensions with North Korea and Iran, investors focused on prospects for stronger economic growth and lower taxes, driving U.S. financial markets higher over the 12-month period ended April 30, 2018. U.S. economic growth picked up, and the unemployment rate fell to 3.9%. The labor market added an average of more than 190,000 new jobs per month during the period, even though jobs were lost as a result of hurricane disruptions during the third quarter of 2017. Wage growth was modest, but the tightening labor situation has the potential to pressure employers going forward. Synchronous global growth and a weaker U.S. dollar boosted exports. However, in the final months of the period, U.S. equity markets pulled back, producing the first real correction in over a year. Enthusiasm turned to anxiety as the market contended with heightened rhetoric regarding trade policy and a major security breach from Facebook, which pressured technology companies.
In March, the Federal Reserve raised the target range on its key short-term interest rate, the federal funds rate, to 1.50% - 1.75%, citing solid job and economic growth and the recent achievement of its 2.0% inflation target. The 10-year Treasury yield closed the period at 2.95%. The S&P 500 Index, a broad-based measure of U.S. equity returns, gained 13.27% for the 12 months ended April 30, 2018. The Bloomberg Barclays U.S. Aggregate Bond Index, which tracks returns of U.S. investment-grade government and corporate bonds, lost 0.32%. Small-cap value stocks trailed all other segments of the equity market.
Contributors and detractors
The Fund was overweight in health care and underweight in real estate, both of which figured into its performance advantage over the benchmark. Health care was the leading sector for the year, and the Fund’s overweight combined with strong stock selection bolstered results. Real estate positions in the benchmark lost ground, but the Fund’s real estate holdings were positive performers for the period. We focused on companies with good balance sheets and cash flow, avoiding the retail and office segments, which were negative performers. In the health care sector, we believe we were in the right place at the right time. We identified a number of biotechnology companies that were trading at a discount, by our estimates. Several of these received a significant amount of positive data over the year, which translated into sharp gains. Dynavax received Federal Drug Administration (FDA) approval for its hepatitis B vaccine, which offers both cost and convenience advantages because it is a two-series regimen compared to the current three-series vaccine. Puma Biotechnology won FDA approval for its breast cancer therapy. The two companies delivered triple-digit gains for the year.
In addition to health care and real estate, the Fund outperformed the benchmark in industrials and materials for the 12-month period. In the industrials sector, DMC Global benefited from continued improvement in demand from higher energy prices and from customer adoption of its innovative product designed to help customers, especially in the shale industry, unlock productivity and efficiency. General Cable, a global leader in wire and cable manufacturing, announced that it would be acquired by Prysmian Group, an Italian company, which would help expansion efforts in the United States. Executive search firm KornFerry, a newer name in the portfolio, benefited from a tight labor market and from the integration of a merger that had masked some of its strength in the high-level search market, where it operates.
Gains from these positions more than offset the Fund’s shortfall in the consumer discretionary sector, where stock selection and an underweight detracted from relative results. Some of the retail companies to which the Fund had no exposure experienced strong positive returns due to tax reform. However, we believe the ongoing online retaill threat has the potential to continue to erode mall-based retailers, and we currently intend to stay with our longer-term view on the segment. On an individual basis, a position in AMC, the movie theater giant, detracted from returns as there were no big block-buster movies for the year. We retained the stock.
| 4 | Columbia Small Cap Value Fund I | Annual Report 2018 |
Manager Discussion of Fund Performance (continued)
At period’s end
At period end, the Fund was weighted toward higher quality companies (consistent with our philosophy), which we believe are trading below their intrinsic value. Tactically, we have tilted the portfolio toward higher statistical volatility and a lower earnings yield with a shift from utilities to an increased weight in health care. We believe that the earnings yield on health care has the potential to increase over the next three to five years (our investment horizon), and the increase in volatility from this shift is offset by the potential for higher long-term returns. We continue to helm the Fund with the same high-quality focused philosophy we have had since the value strategies team began to manage the Fund’s portfolio in June 2002. We believe that the market has currently presented us with a number of high quality value opportunities, and we look forward to sharing our results with shareholders.
Market risk may affect a single issuer, sector of the economy, industry or the market as a whole. Foreign investments subject the Fund to risks, including political, economic, market, social and others within a particular country, as well as to currency instabilities and less stringent financial and accounting standards generally applicable to U.S. issuers. Investments in small-cap companies may be subject to greater volatility and price fluctuations because they may be thinly traded and less liquid. Value securities may be unprofitable if the market fails to recognize their intrinsic worth or the portfolio manager misgauged that worth. The Fund may invest significantly in issuers within a particular sector, which may be negatively affected by market, economic or other conditions, making the Fund more vulnerable to unfavorable developments in the sector. See the Fund’s prospectus for more information on these and other risks.
The views expressed in this report reflect the current views of the respective parties. These views are not guarantees of future performance and involve certain risks, uncertainties and assumptions that are difficult to predict, so actual outcomes and results may differ significantly from the views expressed. These views are subject to change at any time based upon economic, market or other conditions and the respective parties disclaim any responsibility to update such views. These views may not be relied on as investment advice and, because investment decisions for a Columbia fund are based on numerous factors, may not be relied on as an indication of trading intent on behalf of any particular Columbia fund. References to specific securities should not be construed as a recommendation or investment advice.
Columbia Small Cap Value Fund I | Annual Report 2018
| 5 |
Understanding Your Fund’s Expenses
(Unaudited)
As an investor, you incur two types of costs. There are transaction costs, which generally include sales charges on purchases and may include redemption fees. There are also ongoing costs, which generally include management fees, distribution and/or service fees, and other fund expenses. The following information is intended to help you understand your ongoing costs (in dollars) of investing in the Fund and to help you compare these costs with the ongoing costs of investing in other mutual funds.
Analyzing your Fund’s expenses
To illustrate these ongoing costs, we have provided examples and calculated the expenses paid by investors in each share class of the Fund during the period. The actual and hypothetical information in the table is based on an initial investment of $1,000 at the beginning of the period indicated and held for the entire period. Expense information is calculated two ways and each method provides you with different information. The amount listed in the “Actual” column is calculated using the Fund’s actual operating expenses and total return for the period. You may use the Actual information, together with the amount invested, to estimate the expenses that you paid over the period. Simply divide your account value by $1,000 (for example, an $8,600 account value divided by $1,000 = 8.6), then multiply the results by the expenses paid during the period under the “Actual” column. The amount listed in the “Hypothetical” column assumes a 5% annual rate of return before expenses (which is not the Fund’s actual return) and then applies the Fund’s actual expense ratio for the period to the hypothetical return. You should not use the hypothetical account values and expenses to estimate either your actual account balance at the end of the period or the expenses you paid during the period. See “Compare with other funds” below for details on how to use the hypothetical data.
Compare with other funds
Since all mutual funds are required to include the same hypothetical calculations about expenses in shareholder reports, you can use this information to compare the ongoing cost of investing in the Fund with other funds. To do so, compare the hypothetical example with the 5% hypothetical examples that appear in the shareholder reports of other funds. As you compare hypothetical examples of other funds, it is important to note that hypothetical examples are meant to highlight the ongoing costs of investing in a fund only and do not reflect any transaction costs, such as sales charges, or redemption or exchange fees. Therefore, the hypothetical calculations are useful in comparing ongoing costs only, and will not help you determine the relative total costs of owning different funds. If transaction costs were included in these calculations, your costs would be higher.
| November 1, 2017 — April 30, 2018 |
| | Account value at the
beginning of the
period ($) | Account value at the
end of the
period ($) | Expenses paid during
the period ($) | Fund’s annualized
expense ratio (%) |
| | Actual | Hypothetical | Actual | Hypothetical | Actual | Hypothetical | Actual |
| Class A | 1,000.00 | 1,000.00 | 997.00 | 1,018.25 | 6.54 | 6.61 | 1.32 |
| Advisor Class | 1,000.00 | 1,000.00 | 998.30 | 1,019.49 | 5.30 | 5.36 | 1.07 |
| Class C | 1,000.00 | 1,000.00 | 993.40 | 1,014.53 | 10.23 | 10.34 | 2.07 |
| Institutional Class | 1,000.00 | 1,000.00 | 998.40 | 1,019.49 | 5.30 | 5.36 | 1.07 |
| Institutional 2 Class | 1,000.00 | 1,000.00 | 998.90 | 1,020.08 | 4.71 | 4.76 | 0.95 |
| Institutional 3 Class | 1,000.00 | 1,000.00 | 999.20 | 1,020.33 | 4.46 | 4.51 | 0.90 |
| Class R | 1,000.00 | 1,000.00 | 995.80 | 1,017.01 | 7.77 | 7.85 | 1.57 |
Expenses paid during the period are equal to the annualized expense ratio for each class as indicated above, multiplied by the average account value over the period and then multiplied by the number of days in the Fund’s most recent fiscal half year and divided by 365.
Expenses do not include fees and expenses incurred indirectly by the Fund from its investment in underlying funds, including affiliated and non-affiliated pooled investment vehicles, such as mutual funds and exchange-traded funds.
Had Columbia Management Investment Advisers, LLC and/or certain of its affiliates not waived/reimbursed certain fees and expenses, account value at the end of the period would have been reduced.
| 6 | Columbia Small Cap Value Fund I | Annual Report 2018 |
Portfolio of Investments
April 30, 2018
(Percentages represent value of investments compared to net assets)
Investments in securities
| Common Stocks 99.7% |
| Issuer | Shares | Value ($) |
| Consumer Discretionary 9.8% |
| Auto Components 2.3% |
| Cooper Tire & Rubber Co. | 123,886 | 3,029,013 |
| Gentherm, Inc.(a) | 78,816 | 2,663,981 |
| Modine Manufacturing Co.(a) | 163,137 | 2,805,956 |
| Visteon Corp.(a) | 46,180 | 5,746,639 |
| Total | | 14,245,589 |
| Diversified Consumer Services 0.4% |
| Carriage Services, Inc. | 101,760 | 2,648,813 |
| Household Durables 2.3% |
| Cavco Industries, Inc.(a) | 24,137 | 4,111,738 |
| Ethan Allen Interiors, Inc. | 157,640 | 3,475,962 |
| Hamilton Beach Brands Holding Co. | 80,565 | 1,792,571 |
| Hooker Furniture Corp. | 53,480 | 2,018,870 |
| Lifetime Brands, Inc. | 125,467 | 1,493,057 |
| Pico Holdings, Inc. | 122,227 | 1,472,836 |
| Total | | 14,365,034 |
| Leisure Products 0.6% |
| Acushnet Holdings Corp. | 44,503 | 1,075,193 |
| Malibu Boats, Inc., Class A(a) | 87,182 | 2,938,033 |
| Total | | 4,013,226 |
| Media 0.9% |
| AMC Entertainment Holdings, Inc., Class A | 131,099 | 2,287,677 |
| Criteo SA, ADR(a) | 72,915 | 1,879,020 |
| Liberty Latin America Ltd., Class C(a) | 93,594 | 1,690,308 |
| Total | | 5,857,005 |
| Multiline Retail 0.4% |
| Hudson’s Bay Co. | 345,946 | 2,446,504 |
| Specialty Retail 2.2% |
| Aaron’s, Inc. | 109,231 | 4,562,579 |
| Sally Beauty Holdings, Inc.(a) | 168,000 | 2,904,720 |
| Signet Jewelers Ltd. | 125,171 | 4,866,648 |
| Vitamin Shoppe, Inc.(a) | 227,350 | 1,125,383 |
| Total | | 13,459,330 |
| Common Stocks (continued) |
| Issuer | Shares | Value ($) |
| Textiles, Apparel & Luxury Goods 0.7% |
| Skechers U.S.A., Inc., Class A(a) | 63,520 | 1,810,320 |
| Steven Madden Ltd. | 58,485 | 2,821,901 |
| Total | | 4,632,221 |
| Total Consumer Discretionary | 61,667,722 |
| Consumer Staples 6.7% |
| Beverages 1.0% |
| Boston Beer Co., Inc. (The), Class A(a) | 27,900 | 6,253,785 |
| Food & Staples Retailing 3.2% |
| Andersons, Inc. (The) | 108,355 | 3,537,791 |
| Natural Grocers by Vitamin Cottage, Inc.(a) | 338,810 | 2,422,491 |
| Smart & Final Stores, Inc.(a) | 444,089 | 2,264,854 |
| SpartanNash Co. | 130,030 | 2,363,945 |
| United Natural Foods, Inc.(a) | 122,440 | 5,512,249 |
| Weis Markets, Inc. | 82,655 | 3,803,783 |
| Total | | 19,905,113 |
| Food Products 1.9% |
| Fresh Del Monte Produce, Inc. | 106,586 | 5,238,702 |
| Hain Celestial Group, Inc. (The)(a) | 130,090 | 3,789,522 |
| Sanderson Farms, Inc. | 26,900 | 2,990,204 |
| Total | | 12,018,428 |
| Personal Products 0.6% |
| Inter Parfums, Inc. | 78,572 | 4,022,886 |
| Total Consumer Staples | 42,200,212 |
| Energy 8.4% |
| Energy Equipment & Services 1.3% |
| Aspen Aerogels, Inc.(a) | 220,280 | 991,260 |
| Dawson Geophysical Co.(a) | 404,442 | 2,911,983 |
| Natural Gas Services Group, Inc.(a) | 115,671 | 2,787,671 |
| Smart Sand, Inc.(a) | 135,270 | 990,176 |
| Total | | 7,681,090 |
| Oil, Gas & Consumable Fuels 7.1% |
| Callon Petroleum Co.(a) | 328,161 | 4,564,720 |
| Carrizo Oil & Gas, Inc.(a) | 120,835 | 2,425,158 |
| Delek U.S. Holdings, Inc. | 188,764 | 8,941,751 |
| Earthstone Energy, Inc., Class A(a) | 178,393 | 1,824,960 |
The accompanying Notes to Financial Statements are an integral part of this statement.
Columbia Small Cap Value Fund I | Annual Report 2018
| 7 |
Portfolio of Investments (continued)
April 30, 2018
| Common Stocks (continued) |
| Issuer | Shares | Value ($) |
| Gulfport Energy Corp.(a) | 332,150 | 3,088,995 |
| Jagged Peak Energy, Inc.(a) | 292,082 | 4,185,535 |
| Laredo Petroleum, Inc.(a) | 375,620 | 4,131,820 |
| Pacific Ethanol, Inc.(a) | 272,770 | 954,695 |
| Range Resources Corp. | 218,510 | 3,026,364 |
| SM Energy Co. | 207,260 | 4,963,877 |
| Southwestern Energy Co.(a) | 323,570 | 1,326,637 |
| WildHorse Resource Development Corp.(a) | 200,607 | 5,245,873 |
| Total | | 44,680,385 |
| Total Energy | 52,361,475 |
| Financials 31.8% |
| Banks 16.4% |
| BancFirst Corp. | 88,004 | 5,029,429 |
| BankUnited, Inc. | 159,636 | 6,323,182 |
| Banner Corp. | 84,921 | 4,874,465 |
| Boston Private Financial Holdings, Inc. | 299,727 | 4,810,618 |
| Bridge Bancorp, Inc. | 75,827 | 2,494,708 |
| Brookline Bancorp, Inc. | 270,663 | 4,493,006 |
| Capital City Bank Group, Inc. | 152,209 | 3,406,437 |
| CenterState Bank Corp. | 213,809 | 6,196,185 |
| Columbia Banking System, Inc. | 120,333 | 4,838,590 |
| Community Trust Bancorp, Inc. | 67,237 | 3,227,376 |
| FCB Financial Holdings, Inc., Class A(a) | 101,563 | 5,870,341 |
| First BanCorp(a) | 582,490 | 4,205,578 |
| First Citizens BancShares Inc., Class A | 13,527 | 5,847,587 |
| First Financial Corp. | 69,210 | 2,958,728 |
| First of Long Island Corp. (The) | 116,060 | 3,075,590 |
| Heritage Financial Corp. | 73,553 | 2,184,524 |
| Investors Bancorp, Inc. | 350,732 | 4,689,287 |
| National Bank Holdings Corp., Class A | 94,810 | 3,335,416 |
| Northrim BanCorp, Inc. | 109,920 | 3,869,184 |
| OFG Bancorp | 143,920 | 1,942,920 |
| Popular, Inc. | 34,275 | 1,586,590 |
| Sierra Bancorp | 63,842 | 1,778,638 |
| Towne Bank | 160,990 | 4,813,601 |
| UMB Financial Corp. | 86,970 | 6,660,163 |
| Union Bankshares Corp. | 113,074 | 4,275,328 |
| Total | | 102,787,471 |
| Common Stocks (continued) |
| Issuer | Shares | Value ($) |
| Capital Markets 1.9% |
| GAIN Capital Holdings, Inc. | 306,460 | 2,500,714 |
| INTL FCStone, Inc.(a) | 115,840 | 5,191,949 |
| Moelis & Co., ADR, Class A | 78,692 | 4,233,629 |
| Total | | 11,926,292 |
| Consumer Finance 2.0% |
| Enova International, Inc.(a) | 164,162 | 4,809,947 |
| FirstCash, Inc. | 91,908 | 7,968,423 |
| Total | | 12,778,370 |
| Insurance 6.6% |
| American Equity Investment Life Holding Co. | 200,701 | 6,061,170 |
| Baldwin & Lyons, Inc., Class B | 96,641 | 2,251,735 |
| EMC Insurance Group, Inc. | 93,051 | 2,417,465 |
| Employers Holdings, Inc. | 103,194 | 4,220,634 |
| FBL Financial Group, Inc., Class A | 66,116 | 5,140,519 |
| Global Indemnity Ltd | 58,278 | 2,382,987 |
| Heritage Insurance Holdings, Inc. | 182,521 | 2,865,580 |
| Horace Mann Educators Corp. | 76,641 | 3,425,853 |
| National Western Life Group, Inc., Class A | 12,104 | 3,841,931 |
| Navigators Group, Inc. (The) | 79,430 | 4,487,795 |
| United Fire Group, Inc. | 84,430 | 4,245,985 |
| Total | | 41,341,654 |
| Thrifts & Mortgage Finance 4.9% |
| HomeStreet, Inc.(a) | 168,008 | 4,284,204 |
| MGIC Investment Corp.(a) | 486,600 | 4,875,732 |
| Provident Financial Holdings, Inc. | 88,110 | 1,616,819 |
| Radian Group, Inc. | 569,430 | 8,142,849 |
| Washington Federal, Inc. | 150,063 | 4,764,500 |
| Western New England Bancorp, Inc. | 343,579 | 3,710,653 |
| WSFS Financial Corp. | 67,022 | 3,357,802 |
| Total | | 30,752,559 |
| Total Financials | 199,586,346 |
| Health Care 8.3% |
| Biotechnology 5.0% |
| ACADIA Pharmaceuticals, Inc.(a) | 66,454 | 1,050,638 |
| Alder Biopharmaceuticals, Inc.(a) | 182,827 | 2,596,144 |
| Ardelyx, Inc.(a) | 312,440 | 1,499,712 |
| Atara Biotherapeutics, Inc.(a) | 64,800 | 2,614,680 |
The accompanying Notes to Financial Statements are an integral part of this statement.
| 8 | Columbia Small Cap Value Fund I | Annual Report 2018 |
Portfolio of Investments (continued)
April 30, 2018
| Common Stocks (continued) |
| Issuer | Shares | Value ($) |
| Coherus Biosciences, Inc.(a) | 172,300 | 2,084,830 |
| Dynavax Technologies Corp.(a) | 136,779 | 2,318,404 |
| Eagle Pharmaceuticals, Inc.(a) | 36,179 | 1,881,670 |
| Immunomedics, Inc.(a) | 158,790 | 2,891,566 |
| Intercept Pharmaceuticals, Inc.(a) | 34,440 | 2,342,264 |
| Keryx Biopharmaceuticals, Inc.(a) | 338,567 | 1,499,852 |
| Momenta Pharmaceuticals, Inc.(a) | 123,610 | 2,571,088 |
| Novavax, Inc.(a) | 1,057,540 | 1,649,762 |
| Puma Biotechnology, Inc.(a) | 23,640 | 1,507,050 |
| Spark Therapeutics, Inc.(a) | 24,220 | 1,848,470 |
| TESARO, Inc.(a) | 55,670 | 2,834,160 |
| Total | | 31,190,290 |
| Health Care Equipment & Supplies 1.2% |
| iRadimed Corp.(a) | 245,918 | 4,291,269 |
| Quotient Ltd.(a) | 415,803 | 1,733,898 |
| Sientra, Inc.(a) | 142,549 | 1,878,796 |
| Total | | 7,903,963 |
| Pharmaceuticals 2.1% |
| Aerie Pharmaceuticals, Inc.(a) | 31,350 | 1,605,120 |
| BioDelivery Sciences International, Inc.(a) | 739,545 | 1,479,090 |
| Flex Pharma, Inc.(a) | 283,573 | 1,361,150 |
| Horizon Pharma PLC(a) | 194,870 | 2,580,079 |
| Impax Laboratories, Inc.(a) | 123,240 | 2,316,912 |
| Supernus Pharmaceuticals, Inc.(a) | 47,171 | 2,212,320 |
| TherapeuticsMD, Inc.(a) | 302,690 | 1,664,795 |
| Total | | 13,219,466 |
| Total Health Care | 52,313,719 |
| Industrials 12.1% |
| Airlines 0.4% |
| Spirit Airlines, Inc.(a) | 78,550 | 2,805,806 |
| Building Products 1.8% |
| Apogee Enterprises, Inc. | 39,310 | 1,616,034 |
| Caesarstone Ltd. | 114,696 | 2,116,141 |
| Simpson Manufacturing Co., Inc. | 67,511 | 3,691,502 |
| Universal Forest Products, Inc. | 123,000 | 3,921,240 |
| Total | | 11,344,917 |
| Commercial Services & Supplies 0.8% |
| Unifirst Corp. | 30,515 | 4,900,709 |
| Common Stocks (continued) |
| Issuer | Shares | Value ($) |
| Construction & Engineering 0.4% |
| Northwest Pipe Co.(a) | 121,565 | 2,398,477 |
| Electrical Equipment 0.9% |
| Encore Wire Corp. | 101,826 | 5,361,139 |
| Machinery 5.0% |
| Albany International Corp., Class A | 47,171 | 2,790,165 |
| DMC Global Inc | 113,312 | 4,385,174 |
| EnPro Industries, Inc. | 48,326 | 3,631,699 |
| Gorman-Rupp Co. | 81,675 | 2,571,129 |
| LB Foster Co., Class A(a) | 103,129 | 2,428,688 |
| Lydall, Inc.(a) | 51,173 | 2,282,316 |
| Mueller Industries, Inc. | 128,632 | 3,496,218 |
| Standex International Corp. | 42,744 | 4,144,031 |
| Titan International, Inc. | 241,044 | 2,482,753 |
| Wabash National Corp. | 167,350 | 3,357,041 |
| Total | | 31,569,214 |
| Professional Services 0.9% |
| Korn/Ferry International | 108,570 | 5,804,152 |
| Road & Rail 0.9% |
| Heartland Express, Inc. | 129,450 | 2,308,093 |
| Werner Enterprises, Inc. | 97,899 | 3,357,936 |
| Total | | 5,666,029 |
| Trading Companies & Distributors 1.0% |
| Houston Wire & Cable Co.(a) | 272,516 | 1,962,115 |
| Textainer Group Holdings Ltd.(a) | 145,139 | 2,496,391 |
| Transcat, Inc.(a) | 96,490 | 1,592,085 |
| Total | | 6,050,591 |
| Total Industrials | 75,901,034 |
| Information Technology 7.4% |
| Communications Equipment 1.6% |
| Acacia Communications, Inc.(a) | 56,440 | 1,588,786 |
| Digi International, Inc.(a) | 216,001 | 2,484,012 |
| Lumentum Holdings, Inc.(a) | 46,150 | 2,328,268 |
| Netscout Systems, Inc.(a) | 135,150 | 3,669,322 |
| Total | | 10,070,388 |
The accompanying Notes to Financial Statements are an integral part of this statement.
Columbia Small Cap Value Fund I | Annual Report 2018
| 9 |
Portfolio of Investments (continued)
April 30, 2018
| Common Stocks (continued) |
| Issuer | Shares | Value ($) |
| Electronic Equipment, Instruments & Components 1.1% |
| AVX Corp. | 173,010 | 2,553,627 |
| MTS Systems Corp. | 45,237 | 2,298,040 |
| OSI Systems, Inc.(a) | 33,910 | 2,170,918 |
| Total | | 7,022,585 |
| IT Services 1.4% |
| Euronet Worldwide, Inc.(a) | 24,010 | 1,875,421 |
| Mantech International Corp., Class A | 83,447 | 4,930,883 |
| TTEC Holdings, Inc. | 70,637 | 2,260,384 |
| Total | | 9,066,688 |
| Semiconductors & Semiconductor Equipment 1.9% |
| Adesto Technologies Corp.(a) | 311,512 | 2,803,608 |
| Entegris, Inc. | 115,142 | 3,707,572 |
| MACOM Technology Solutions Holdings, Inc.(a) | 317,771 | 5,281,354 |
| Total | | 11,792,534 |
| Software 0.6% |
| MicroStrategy, Inc., Class A(a) | 31,360 | 3,997,146 |
| Technology Hardware, Storage & Peripherals 0.8% |
| Electronics for Imaging, Inc.(a) | 114,180 | 3,162,786 |
| Stratasys Ltd.(a) | 78,904 | 1,512,590 |
| Total | | 4,675,376 |
| Total Information Technology | 46,624,717 |
| Materials 6.9% |
| Chemicals 0.6% |
| Flotek Industries, Inc.(a) | 480,036 | 1,713,729 |
| Tronox Ltd., Class A | 138,067 | 2,371,991 |
| Total | | 4,085,720 |
| Construction Materials 0.2% |
| Forterra, Inc.(a) | 178,098 | 1,307,239 |
| Containers & Packaging 0.5% |
| Greif, Inc., Class A | 50,579 | 2,959,883 |
| Metals & Mining 4.2% |
| Allegheny Technologies, Inc.(a) | 182,047 | 4,836,989 |
| Capstone Mining Corp.(a) | 1,824,493 | 1,591,520 |
| Centerra Gold, Inc.(a) | 367,650 | 2,244,928 |
| Commercial Metals Co. | 175,700 | 3,691,457 |
| Ferroglobe PLC(a) | 246,011 | 2,779,924 |
| Common Stocks (continued) |
| Issuer | Shares | Value ($) |
| Olympic Steel, Inc. | 128,888 | 3,022,424 |
| TimkenSteel Corp.(a) | 158,480 | 2,660,879 |
| Universal Stainless & Alloy Products, Inc.(a) | 181,355 | 5,320,956 |
| Total | | 26,149,077 |
| Paper & Forest Products 1.4% |
| Domtar Corp. | 62,250 | 2,732,775 |
| Louisiana-Pacific Corp. | 206,988 | 5,863,970 |
| Total | | 8,596,745 |
| Total Materials | 43,098,664 |
| Real Estate 6.9% |
| Equity Real Estate Investment Trusts (REITS) 6.5% |
| Chesapeake Lodging Trust | 184,084 | 5,437,841 |
| CoreCivic, Inc. | 78,690 | 1,586,390 |
| DDR Corp. | 258,070 | 1,871,007 |
| Farmland Partners, Inc. | 263,310 | 2,006,422 |
| Front Yard Residential Corp. | 225,429 | 2,213,713 |
| InfraREIT, Inc. | 150,613 | 3,209,563 |
| Mack-Cali Realty Corp. | 264,460 | 4,540,778 |
| National Health Investors, Inc. | 29,480 | 2,012,600 |
| PotlatchDeltic Corp. | 85,816 | 4,449,560 |
| RLJ Lodging Trust | 315,240 | 6,547,535 |
| Sunstone Hotel Investors, Inc. | 454,775 | 7,094,490 |
| Total | | 40,969,899 |
| Real Estate Management & Development 0.4% |
| St. Joe Co. (The)(a) | 138,750 | 2,393,438 |
| Total Real Estate | 43,363,337 |
| Telecommunication Services 0.6% |
| Wireless Telecommunication Services 0.6% |
| Shenandoah Telecommunications Co. | 91,826 | 3,466,431 |
| Total Telecommunication Services | 3,466,431 |
| Utilities 0.8% |
| Gas Utilities 0.5% |
| Southwest Gas Holdings, Inc. | 47,715 | 3,482,718 |
| Water Utilities 0.3% |
| Consolidated Water Co., Ltd. | 125,619 | 1,777,509 |
| Total Utilities | 5,260,227 |
Total Common Stocks
(Cost $409,848,733) | 625,843,884 |
|
The accompanying Notes to Financial Statements are an integral part of this statement.
| 10 | Columbia Small Cap Value Fund I | Annual Report 2018 |
Portfolio of Investments (continued)
April 30, 2018
| Money Market Funds 0.2% |
| | Shares | Value ($) |
| Columbia Short-Term Cash Fund, 1.889%(b),(c) | 949,669 | 949,574 |
Total Money Market Funds
(Cost $949,574) | 949,574 |
Total Investments in Securities
(Cost: $410,798,307) | 626,793,458 |
| Other Assets & Liabilities, Net | | 644,050 |
| Net Assets | 627,437,508 |
Notes to Portfolio of Investments
| (a) | Non-income producing investment. |
| (b) | The rate shown is the seven-day current annualized yield at April 30, 2018. |
| (c) | As defined in the Investment Company Act of 1940, an affiliated company is one in which the Fund owns 5% or more of the company’s outstanding voting securities, or a company which is under common ownership or control with the Fund. Holdings and transactions in these affiliated companies during the year ended April 30, 2018 are as follows: |
| Issuer | Beginning
shares | Shares
purchased | Shares
sold | Ending
shares | Realized gain
(loss) —
affiliated
issuers ($) | Net change in
unrealized
appreciation
(depreciation) —
affiliated
issuers ($) | Dividends —
affiliated
issuers ($) | Value —
affiliated
issuers
at end of
period ($) |
| Columbia Short-Term Cash Fund, 1.889% |
| | 3,566,306 | 143,649,406 | (146,266,043) | 949,669 | (1,331) | (234) | 88,566 | 949,574 |
Abbreviation Legend
| ADR | American Depositary Receipt |
Fair value measurements
The Fund categorizes its fair value measurements according to a three-level hierarchy that maximizes the use of observable inputs and minimizes the use of unobservable inputs by prioritizing that the most observable input be used when available. Observable inputs are those that market participants would use in pricing an investment based on market data obtained from sources independent of the reporting entity. Unobservable inputs are those that reflect the Fund’s assumptions about the information market participants would use in pricing an investment. An investment’s level within the fair value hierarchy is based on the lowest level of any input that is deemed significant to the asset’s or liability’s fair value measurement. The input levels are not necessarily an indication of the risk or liquidity associated with investments at that level. For example, certain U.S. government securities are generally high quality and liquid, however, they are reflected as Level 2 because the inputs used to determine fair value may not always be quoted prices in an active market.
Fair value inputs are summarized in the three broad levels listed below:
| ■ | Level 1 — Valuations based on quoted prices for investments in active markets that the Fund has the ability to access at the measurement date. Valuation adjustments are not applied to Level 1 investments. |
| ■ | Level 2 — Valuations based on other significant observable inputs (including quoted prices for similar securities, interest rates, prepayment speeds, credit risks, etc.). |
| ■ | Level 3 — Valuations based on significant unobservable inputs (including the Fund’s own assumptions and judgment in determining the fair value of investments). |
Inputs that are used in determining fair value of an investment may include price information, credit data, volatility statistics, and other factors. These inputs can be either observable or unobservable. The availability of observable inputs can vary between investments, and is affected by various factors such as the type of investment, and the volume and level of activity for that investment or similar investments in the marketplace. The inputs will be considered by the Investment Manager, along with any other relevant factors in the calculation of an investment’s fair value. The Fund uses prices and inputs that are current as of the measurement date, which may include periods of market dislocations. During these periods, the availability of prices and inputs may be reduced for many investments. This condition could cause an investment to be reclassified between the various levels within the hierarchy.
Certain investments that have been measured at fair value using the net asset value (NAV) per share (or its equivalent) are not categorized in the fair value hierarchy. The fair value amounts presented in the table are intended to reconcile the fair value hierarchy to the amounts presented in the Portfolio of Investments. The Columbia Short-Term Cash Fund seeks to provide shareholders with maximum current income consistent with liquidity and stability of principal. Columbia Short-Term Cash Fund prices its shares with a floating NAV and no longer seeks to maintain a stable NAV.
Investments falling into the Level 3 category are primarily supported by quoted prices from brokers and dealers participating in the market for those investments. However, these may be classified as Level 3 investments due to lack of market transparency and corroboration to support these quoted prices. Additionally, valuation models may be used as the pricing source for any remaining investments classified as Level 3. These models may rely on one or more significant unobservable inputs and/or significant assumptions by the Investment Manager. Inputs used in valuations may include, but are not limited to, financial statement analysis, capital account balances, discount rates and estimated cash flows, and comparable company data.
The accompanying Notes to Financial Statements are an integral part of this statement.
Columbia Small Cap Value Fund I | Annual Report 2018
| 11 |
Portfolio of Investments (continued)
April 30, 2018
Fair value measurements (continued)
Under the direction of the Fund’s Board of Trustees (the Board), the Investment Manager’s Valuation Committee (the Committee) is responsible for overseeing the valuation procedures approved by the Board. The Committee consists of voting and non-voting members from various groups within the Investment Manager’s organization, including operations and accounting, trading and investments, compliance, risk management and legal.
The Committee meets at least monthly to review and approve valuation matters, which may include a description of specific valuation determinations, data regarding pricing information received from approved pricing vendors and brokers and the results of Board-approved valuation control policies and procedures (the Policies). The Policies address, among other things, instances when market quotations are or are not readily available, including recommendations of third party pricing vendors and a determination of appropriate pricing methodologies; events that require specific valuation determinations and assessment of fair value techniques; securities with a potential for stale pricing, including those that are illiquid, restricted, or in default; and the effectiveness of third party pricing vendors, including periodic reviews of vendors. The Committee meets more frequently, as needed, to discuss additional valuation matters, which may include the need to review back-testing results, review time-sensitive information or approve related valuation actions. The Committee reports to the Board, with members of the Committee meeting with the Board at each of its regularly scheduled meetings to discuss valuation matters and actions during the period, similar to those described earlier.
For investments categorized as Level 3, the Committee monitors information similar to that described above, which may include: (i) data specific to the issuer or comparable issuers, (ii) general market or specific sector news and (iii) quoted prices and specific or similar security transactions. The Committee considers this data and any changes from prior periods in order to assess the reasonableness of observable and unobservable inputs, any assumptions or internal models used to value those securities and changes in fair value. This data is also used to corroborate, when available, information received from approved pricing vendors and brokers. Various factors impact the frequency of monitoring this information (which may occur as often as daily). However, the Committee may determine that changes to inputs, assumptions and models are not required as a result of the monitoring procedures performed.
The following table is a summary of the inputs used to value the Fund’s investments at April 30, 2018:
| | Level 1
quoted prices
in active
markets for
identical
assets ($) | Level 2
other
significant
observable
inputs ($) | Level 3
significant
unobservable
inputs ($) | Investments
measured at
net asset
value ($) | Total ($) |
| Investments in Securities | | | | | |
| Common Stocks | | | | | |
| Consumer Discretionary | 61,667,722 | — | — | — | 61,667,722 |
| Consumer Staples | 42,200,212 | — | — | — | 42,200,212 |
| Energy | 52,361,475 | — | — | — | 52,361,475 |
| Financials | 199,586,346 | — | — | — | 199,586,346 |
| Health Care | 52,313,719 | — | — | — | 52,313,719 |
| Industrials | 75,901,034 | — | — | — | 75,901,034 |
| Information Technology | 46,624,717 | — | — | — | 46,624,717 |
| Materials | 43,098,664 | — | — | — | 43,098,664 |
| Real Estate | 43,363,337 | — | — | — | 43,363,337 |
| Telecommunication Services | 3,466,431 | — | — | — | 3,466,431 |
| Utilities | 5,260,227 | — | — | — | 5,260,227 |
| Total Common Stocks | 625,843,884 | — | — | — | 625,843,884 |
| Money Market Funds | — | — | — | 949,574 | 949,574 |
| Total Investments in Securities | 625,843,884 | — | — | 949,574 | 626,793,458 |
See the Portfolio of Investments for all investment classifications not indicated in the table.
There were no transfers of financial assets between levels during the period.
The accompanying Notes to Financial Statements are an integral part of this statement.
| 12 | Columbia Small Cap Value Fund I | Annual Report 2018 |
Statement of Assets and Liabilities
April 30, 2018
| Assets | |
| Investments in securities, at value | |
| Unaffiliated issuers (cost $409,848,733) | $625,843,884 |
| Affiliated issuers (cost $949,574) | 949,574 |
| Receivable for: | |
| Capital shares sold | 1,501,934 |
| Dividends | 67,101 |
| Foreign tax reclaims | 3,927 |
| Expense reimbursement due from Investment Manager | 1,247 |
| Prepaid expenses | 795 |
| Trustees’ deferred compensation plan | 139,530 |
| Total assets | 628,507,992 |
| Liabilities | |
| Due to custodian | 266 |
| Payable for: | |
| Investments purchased | 323,947 |
| Capital shares purchased | 392,175 |
| Management services fees | 44,718 |
| Distribution and/or service fees | 7,212 |
| Transfer agent fees | 97,313 |
| Compensation of chief compliance officer | 21 |
| Other expenses | 65,302 |
| Trustees’ deferred compensation plan | 139,530 |
| Total liabilities | 1,070,484 |
| Net assets applicable to outstanding capital stock | $627,437,508 |
| Represented by | |
| Paid in capital | 399,439,354 |
| Excess of distributions over net investment income | (139,530) |
| Accumulated net realized gain | 12,142,836 |
| Unrealized appreciation (depreciation) on: | |
| Investments - unaffiliated issuers | 215,995,151 |
| Foreign currency translations | (303) |
| Total - representing net assets applicable to outstanding capital stock | $627,437,508 |
The accompanying Notes to Financial Statements are an integral part of this statement.
Columbia Small Cap Value Fund I | Annual Report 2018
| 13 |
Statement of Assets and Liabilities (continued)
April 30, 2018
| Class A | |
| Net assets | $248,265,614 |
| Shares outstanding | 6,099,230 |
| Net asset value per share | $40.70 |
| Maximum sales charge | 5.75% |
| Maximum offering price per share (calculated by dividing the net asset value per share by 1.0 minus the maximum sales charge for Class A shares) | $43.18 |
| Advisor Class | |
| Net assets | $11,733,800 |
| Shares outstanding | 252,011 |
| Net asset value per share | $46.56 |
| Class C | |
| Net assets | $22,791,669 |
| Shares outstanding | 827,390 |
| Net asset value per share | $27.55 |
| Institutional Class | |
| Net assets | $209,821,716 |
| Shares outstanding | 4,638,367 |
| Net asset value per share | $45.24 |
| Institutional 2 Class | |
| Net assets | $15,738,600 |
| Shares outstanding | 337,944 |
| Net asset value per share | $46.57 |
| Institutional 3 Class | |
| Net assets | $115,295,749 |
| Shares outstanding | 2,536,564 |
| Net asset value per share | $45.45 |
| Class R | |
| Net assets | $3,790,360 |
| Shares outstanding | 93,338 |
| Net asset value per share | $40.61 |
The accompanying Notes to Financial Statements are an integral part of this statement.
| 14 | Columbia Small Cap Value Fund I | Annual Report 2018 |
Statement of Operations
Year Ended April 30, 2018
| Net investment income | |
| Income: | |
| Dividends — unaffiliated issuers | $7,682,978 |
| Dividends — affiliated issuers | 88,566 |
| Foreign taxes withheld | (10,693) |
| Total income | 7,760,851 |
| Expenses: | |
| Management services fees | 5,297,823 |
| Distribution and/or service fees | |
| Class A | 633,918 |
| Class B | 128 |
| Class C | 243,609 |
| Class R | 18,836 |
| Transfer agent fees | |
| Class A | 463,932 |
| Advisor Class | 14,261 |
| Class B | 26 |
| Class C | 44,521 |
| Institutional Class | 383,513 |
| Institutional 2 Class | 9,573 |
| Institutional 3 Class | 8,657 |
| Class R | 6,892 |
| Compensation of board members | 26,759 |
| Custodian fees | 18,582 |
| Printing and postage fees | 86,073 |
| Registration fees | 120,833 |
| Audit fees | 38,257 |
| Legal fees | 15,361 |
| Line of credit interest | 940 |
| Compensation of chief compliance officer | 243 |
| Other | 27,418 |
| Total expenses | 7,460,155 |
| Fees waived or expenses reimbursed by Investment Manager and its affiliates | (96,248) |
| Expense reduction | (2,966) |
| Total net expenses | 7,360,941 |
| Net investment income | 399,910 |
| Realized and unrealized gain (loss) — net | |
| Net realized gain (loss) on: | |
| Investments — unaffiliated issuers | 51,276,974 |
| Investments — affiliated issuers | (1,331) |
| Foreign currency translations | (921) |
| Net realized gain | 51,274,722 |
| Net change in unrealized appreciation (depreciation) on: | |
| Investments — unaffiliated issuers | 4,585,677 |
| Investments — affiliated issuers | (234) |
| Foreign currency translations | 440 |
| Net change in unrealized appreciation (depreciation) | 4,585,883 |
| Net realized and unrealized gain | 55,860,605 |
| Net increase in net assets resulting from operations | $56,260,515 |
The accompanying Notes to Financial Statements are an integral part of this statement.
Columbia Small Cap Value Fund I | Annual Report 2018
| 15 |
Statement of Changes in Net Assets
| | Year Ended
April 30, 2018 | Year Ended
April 30, 2017 |
| Operations | | |
| Net investment income | $399,910 | $1,322,065 |
| Net realized gain | 51,274,722 | 77,113,102 |
| Net change in unrealized appreciation (depreciation) | 4,585,883 | 57,799,104 |
| Net increase in net assets resulting from operations | 56,260,515 | 136,234,271 |
| Distributions to shareholders | | |
| Net investment income | | |
| Class A | (18,184) | (402,914) |
| Advisor Class | (13,885) | (15,647) |
| Class I | — | (303,984) |
| Institutional Class | (304,253) | (743,137) |
| Institutional 2 Class | (43,338) | (34,589) |
| Institutional 3 Class | (297,861) | (37,836) |
| Net realized gains | | |
| Class A | (28,669,109) | (29,365,698) |
| Advisor Class | (657,999) | (489,083) |
| Class B | (2,295) | (124,956) |
| Class C | (3,898,260) | (4,281,190) |
| Class I | — | (6,695,481) |
| Institutional Class | (22,546,874) | (25,774,096) |
| Institutional 2 Class | (1,434,065) | (795,145) |
| Institutional 3 Class | (9,015,214) | (891,840) |
| Class R | (428,212) | (342,834) |
| Total distributions to shareholders | (67,329,549) | (70,298,430) |
| Increase (decrease) in net assets from capital stock activity | 45,988,516 | (62,712,941) |
| Total increase in net assets | 34,919,482 | 3,222,900 |
| Net assets at beginning of year | 592,518,026 | 589,295,126 |
| Net assets at end of year | $627,437,508 | $592,518,026 |
| Excess of distributions over net investment income | $(139,530) | $(117,872) |
The accompanying Notes to Financial Statements are an integral part of this statement.
| 16 | Columbia Small Cap Value Fund I | Annual Report 2018 |
Statement of Changes in Net Assets (continued)
| | Year Ended | Year Ended |
| | April 30, 2018 | April 30, 2017 |
| | Shares | Dollars ($) | Shares | Dollars ($) |
| Capital stock activity |
| Class A | | | | |
| Subscriptions | 920,218 | 38,379,646 | 785,638 | 31,247,604 |
| Distributions reinvested | 669,214 | 26,619,925 | 759,710 | 27,717,081 |
| Redemptions | (1,384,027) | (57,190,812) | (2,035,269) | (80,478,189) |
| Net increase (decrease) | 205,405 | 7,808,759 | (489,921) | (21,513,504) |
| Advisor Class | | | | |
| Subscriptions | 189,924 | 9,051,506 | 52,682 | 2,384,146 |
| Distributions reinvested | 14,407 | 659,916 | 12,209 | 504,495 |
| Redemptions | (53,162) | (2,469,831) | (60,234) | (2,743,341) |
| Net increase | 151,169 | 7,241,591 | 4,657 | 145,300 |
| Class B | | | | |
| Subscriptions | — | — | 608 | 14,678 |
| Distributions reinvested | 87 | 2,035 | 5,061 | 115,903 |
| Redemptions | (4,982) | (125,117) | (38,466) | (979,775) |
| Net decrease | (4,895) | (123,082) | (32,797) | (849,194) |
| Class C | | | | |
| Subscriptions | 100,638 | 2,864,612 | 137,450 | 3,992,173 |
| Distributions reinvested | 137,152 | 3,756,727 | 141,810 | 3,750,457 |
| Redemptions | (304,603) | (8,725,399) | (335,761) | (9,675,452) |
| Net decrease | (66,813) | (2,104,060) | (56,501) | (1,932,822) |
| Class I | | | | |
| Distributions reinvested | — | — | 175,328 | 6,999,185 |
| Redemptions | — | — | (1,657,130) | (73,016,567) |
| Net decrease | — | — | (1,481,802) | (66,017,382) |
| Institutional Class | | | | |
| Subscriptions | 1,537,671 | 70,110,949 | 1,608,782 | 69,670,796 |
| Distributions reinvested | 319,427 | 14,050,529 | 405,179 | 16,020,336 |
| Redemptions | (2,454,402) | (107,882,281) | (2,617,833) | (110,557,484) |
| Net decrease | (597,304) | (23,720,803) | (603,872) | (24,866,352) |
| Institutional 2 Class | | | | |
| Subscriptions | 404,771 | 19,476,501 | 71,221 | 3,222,086 |
| Distributions reinvested | 32,215 | 1,477,164 | 20,143 | 829,496 |
| Redemptions | (293,881) | (13,543,669) | (67,404) | (2,948,653) |
| Net increase | 143,105 | 7,409,996 | 23,960 | 1,102,929 |
| Institutional 3 Class | | | | |
| Subscriptions | 1,269,676 | 54,863,783 | 1,417,765 | 62,312,773 |
| Distributions reinvested | 171,483 | 7,611,681 | 23,533 | 929,435 |
| Redemptions | (305,177) | (13,828,311) | (286,153) | (11,968,088) |
| Net increase | 1,135,982 | 48,647,153 | 1,155,145 | 51,274,120 |
| Class R | | | | |
| Subscriptions | 35,543 | 1,464,682 | 8,532 | 342,347 |
| Distributions reinvested | 10,767 | 428,212 | 9,429 | 342,834 |
| Redemptions | (25,801) | (1,063,932) | (18,652) | (741,217) |
| Net increase (decrease) | 20,509 | 828,962 | (691) | (56,036) |
| Total net increase (decrease) | 987,158 | 45,988,516 | (1,481,822) | (62,712,941) |
The accompanying Notes to Financial Statements are an integral part of this statement.
Columbia Small Cap Value Fund I | Annual Report 2018
| 17 |
The following table is intended to help you understand the Fund’s financial performance. Certain information reflects financial results for a single share of a class held for the periods shown. Per share net investment income (loss) amounts are calculated based on average shares outstanding during the period. Total return assumes reinvestment of all dividends and distributions, if any. Total return does not reflect payment of sales charges, if any. Total return and portfolio turnover are not annualized for periods of less than one year. The portfolio turnover rate is calculated without regard to purchase and sales transactions of short-term instruments and certain derivatives, if any. If such transactions were included, the Fund’s portfolio turnover rate may be higher.
| | Net asset value,
beginning of
period | Net
investment
income
(loss) | Net
realized
and
unrealized
gain (loss) | Total from
investment
operations | Distributions
from net
investment
income | Distributions
from net
realized
gains |
| Class A |
| Year Ended 4/30/2018 | $41.62 | (0.03) | 3.95 | 3.92 | (0.01) | (4.83) |
| Year Ended 4/30/2017 | $37.50 | 0.05 | 8.85 | 8.90 | (0.06) | (4.72) |
| Year Ended 4/30/2016 | $43.03 | 0.11 | (1.13) | (1.02) | (0.12) | (4.39) |
| Year Ended 4/30/2015 | $48.23 | 0.13 | 1.32 | 1.45 | (0.18) | (6.47) |
| Year Ended 4/30/2014 | $45.66 | 0.14 | 9.96 | 10.10 | (0.30) | (7.23) |
| Advisor Class |
| Year Ended 4/30/2018 | $46.89 | 0.10 | 4.48 | 4.58 | (0.08) | (4.83) |
| Year Ended 4/30/2017 | $41.66 | 0.15 | 9.94 | 10.09 | (0.14) | (4.72) |
| Year Ended 4/30/2016 | $47.24 | 0.24 | (1.24) | (1.00) | (0.19) | (4.39) |
| Year Ended 4/30/2015 | $52.31 | 0.27 | 1.43 | 1.70 | (0.30) | (6.47) |
| Year Ended 4/30/2014 | $48.96 | 0.27 | 10.73 | 11.00 | (0.42) | (7.23) |
| Class C |
| Year Ended 4/30/2018 | $29.86 | (0.24) | 2.76 | 2.52 | — | (4.83) |
| Year Ended 4/30/2017 | $28.24 | (0.19) | 6.44 | 6.25 | — | (4.63) |
| Year Ended 4/30/2016 | $33.63 | (0.13) | (0.87) | (1.00) | — | (4.39) |
| Year Ended 4/30/2015 | $39.24 | (0.17) | 1.03 | 0.86 | — | (6.47) |
| Year Ended 4/30/2014 | $38.36 | (0.19) | 8.30 | 8.11 | — | (7.23) |
| Institutional Class |
| Year Ended 4/30/2018 | $45.70 | 0.08 | 4.37 | 4.45 | (0.08) | (4.83) |
| Year Ended 4/30/2017 | $40.71 | 0.14 | 9.71 | 9.85 | (0.14) | (4.72) |
| Year Ended 4/30/2016 | $46.28 | 0.23 | (1.22) | (0.99) | (0.19) | (4.39) |
| Year Ended 4/30/2015 | $51.37 | 0.27 | 1.41 | 1.68 | (0.30) | (6.47) |
| Year Ended 4/30/2014 | $48.21 | 0.27 | 10.55 | 10.82 | (0.43) | (7.23) |
| Institutional 2 Class |
| Year Ended 4/30/2018 | $46.88 | 0.17 | 4.46 | 4.63 | (0.11) | (4.83) |
| Year Ended 4/30/2017 | $41.64 | 0.23 | 9.92 | 10.15 | (0.19) | (4.72) |
| Year Ended 4/30/2016 | $47.21 | 0.31 | (1.25) | (0.94) | (0.24) | (4.39) |
| Year Ended 4/30/2015 | $52.27 | 0.33 | 1.46 | 1.79 | (0.38) | (6.47) |
| Year Ended 4/30/2014 | $48.93 | 0.32 | 10.75 | 11.07 | (0.50) | (7.23) |
| Institutional 3 Class |
| Year Ended 4/30/2018 | $45.86 | 0.17 | 4.37 | 4.54 | (0.12) | (4.83) |
| Year Ended 4/30/2017 | $40.83 | 0.09 | 9.87 | 9.96 | (0.21) | (4.72) |
| Year Ended 4/30/2016 | $46.37 | 0.29 | (1.18) | (0.89) | (0.26) | (4.39) |
| Year Ended 4/30/2015 | $51.46 | 0.36 | 1.42 | 1.78 | (0.40) | (6.47) |
| Year Ended 4/30/2014 | $48.26 | 0.31 | 10.63 | 10.94 | (0.51) | (7.23) |
The accompanying Notes to Financial Statements are an integral part of this statement.
| 18 | Columbia Small Cap Value Fund I | Annual Report 2018 |
Total
distributions to
shareholders | Net
asset
value,
end of
period | Total
return | Total gross
expense
ratio to
average
net assets(a) | Total net
expense
ratio to
average
net assets(a),(b) | Net investment
income (loss)
ratio to
average
net assets | Portfolio
turnover | Net
assets,
end of
period
(000’s) |
| |
| (4.84) | $40.70 | 10.03% | 1.35% (c) | 1.33% (c),(d) | (0.07%) | 51% | $248,266 |
| (4.78) | $41.62 | 26.02% | 1.38% (c) | 1.37% (c),(d) | 0.12% | 50% | $245,315 |
| (4.51) | $37.50 | (2.60%) | 1.36% | 1.36% (d) | 0.29% | 65% | $239,419 |
| (6.65) | $43.03 | 3.48% | 1.33% | 1.33% (d) | 0.29% | 42% | $306,663 |
| (7.53) | $48.23 | 22.95% | 1.31% (c) | 1.31% (c),(d) | 0.28% | 38% | $411,968 |
| |
| (4.91) | $46.56 | 10.34% | 1.10% (c) | 1.08% (c),(d) | 0.20% | 51% | $11,734 |
| (4.86) | $46.89 | 26.30% | 1.13% (c) | 1.12% (c),(d) | 0.34% | 50% | $4,729 |
| (4.58) | $41.66 | (2.31%) | 1.11% | 1.11% (d) | 0.56% | 65% | $4,007 |
| (6.77) | $47.24 | 3.71% | 1.08% | 1.08% (d) | 0.53% | 42% | $9,840 |
| (7.65) | $52.31 | 23.26% | 1.06% (c) | 1.06% (c),(d) | 0.51% | 38% | $9,620 |
| |
| (4.83) | $27.55 | 9.24% | 2.10% (c) | 2.08% (c),(d) | (0.83%) | 51% | $22,792 |
| (4.63) | $29.86 | 25.05% | 2.12% (c) | 2.12% (c),(d) | (0.65%) | 50% | $26,703 |
| (4.39) | $28.24 | (3.32%) | 2.12% | 2.11% (d) | (0.45%) | 65% | $26,846 |
| (6.47) | $33.63 | 2.72% | 2.08% | 2.08% (d) | (0.47%) | 42% | $32,642 |
| (7.23) | $39.24 | 22.03% | 2.06% (c) | 2.06% (c),(d) | (0.48%) | 38% | $37,568 |
| |
| (4.91) | $45.24 | 10.32% | 1.10% (c) | 1.08% (c),(d) | 0.17% | 51% | $209,822 |
| (4.86) | $45.70 | 26.33% | 1.13% (c) | 1.12% (c),(d) | 0.34% | 50% | $239,246 |
| (4.58) | $40.71 | (2.34%) | 1.11% | 1.11% (d) | 0.54% | 65% | $237,720 |
| (6.77) | $46.28 | 3.75% | 1.08% | 1.08% (d) | 0.54% | 42% | $654,100 |
| (7.66) | $51.37 | 23.24% | 1.06% (c) | 1.06% (c),(d) | 0.53% | 38% | $819,275 |
| |
| (4.94) | $46.57 | 10.45% | 0.97% (c) | 0.96% (c) | 0.35% | 51% | $15,739 |
| (4.91) | $46.88 | 26.50% | 0.97% (c) | 0.97% (c) | 0.52% | 50% | $9,135 |
| (4.63) | $41.64 | (2.19%) | 0.96% | 0.96% | 0.74% | 65% | $7,115 |
| (6.85) | $47.21 | 3.90% | 0.93% | 0.93% | 0.67% | 42% | $4,150 |
| (7.73) | $52.27 | 23.44% | 0.91% (c) | 0.91% (c) | 0.61% | 38% | $2,494 |
| |
| (4.95) | $45.45 | 10.50% | 0.93% (c) | 0.91% (c) | 0.37% | 51% | $115,296 |
| (4.93) | $45.86 | 26.57% | 0.92% (c) | 0.92% (c) | 0.22% | 50% | $64,230 |
| (4.65) | $40.83 | (2.13%) | 0.91% | 0.91% | 0.70% | 65% | $10,022 |
| (6.87) | $46.37 | 3.95% | 0.88% | 0.88% | 0.74% | 42% | $9,261 |
| (7.74) | $51.46 | 23.50% | 0.87% (c) | 0.87% (c) | 0.61% | 38% | $10,234 |
Columbia Small Cap Value Fund I | Annual Report 2018
| 19 |
Financial Highlights (continued)
| | Net asset value,
beginning of
period | Net
investment
income
(loss) | Net
realized
and
unrealized
gain (loss) | Total from
investment
operations | Distributions
from net
investment
income | Distributions
from net
realized
gains |
| Class R |
| Year Ended 4/30/2018 | $41.63 | (0.13) | 3.94 | 3.81 | — | (4.83) |
| Year Ended 4/30/2017 | $37.54 | (0.06) | 8.87 | 8.81 | — | (4.72) |
| Year Ended 4/30/2016 | $43.09 | 0.02 | (1.13) | (1.11) | (0.05) | (4.39) |
| Year Ended 4/30/2015 | $48.28 | 0.01 | 1.32 | 1.33 | (0.05) | (6.47) |
| Year Ended 4/30/2014 | $45.70 | 0.01 | 9.98 | 9.99 | (0.18) | (7.23) |
| Notes to Financial Highlights |
| (a) | In addition to the fees and expenses that the Fund bears directly, the Fund indirectly bears a pro rata share of the fees and expenses of any other funds in which it invests. Such indirect expenses are not included in the Fund’s reported expense ratios. |
| (b) | Total net expenses include the impact of certain fee waivers/expense reimbursements made by the Investment Manager and certain of its affiliates, if applicable. |
| (c) | Ratios include line of credit interest expense which is less than 0.01%. |
| (d) | The benefits derived from expense reductions had an impact of less than 0.01%. |
The accompanying Notes to Financial Statements are an integral part of this statement.
| 20 | Columbia Small Cap Value Fund I | Annual Report 2018 |
Total
distributions to
shareholders | Net
asset
value,
end of
period | Total
return | Total gross
expense
ratio to
average
net assets(a) | Total net
expense
ratio to
average
net assets(a),(b) | Net investment
income (loss)
ratio to
average
net assets | Portfolio
turnover | Net
assets,
end of
period
(000’s) |
| |
| (4.83) | $40.61 | 9.77% | 1.60% (c) | 1.58% (c),(d) | (0.31%) | 51% | $3,790 |
| (4.72) | $41.63 | 25.71% | 1.63% (c) | 1.62% (c),(d) | (0.15%) | 50% | $3,032 |
| (4.44) | $37.54 | (2.83%) | 1.61% | 1.61% (d) | 0.06% | 65% | $2,760 |
| (6.52) | $43.09 | 3.22% | 1.58% | 1.58% (d) | 0.01% | 42% | $3,671 |
| (7.41) | $48.28 | 22.65% | 1.56% (c) | 1.56% (c),(d) | 0.01% | 38% | $3,360 |
Columbia Small Cap Value Fund I | Annual Report 2018
| 21 |
Notes to Financial Statements
April 30, 2018
Note 1. Organization
Columbia Small Cap Value Fund I (the Fund), a series of Columbia Funds Series Trust I (the Trust), is a diversified fund. The Trust is registered under the Investment Company Act of 1940, as amended (the 1940 Act), as an open-end management investment company organized as a Massachusetts business trust.
Fund shares
The Trust may issue an unlimited number of shares (without par value). Although all share classes generally have identical voting, dividend and liquidation rights, each share class votes separately when required by the Trust’s organizational documents or by law. Different share classes pay different distribution amounts to the extent the expenses of such share classes differ, and distributions in liquidation will be proportional to the net asset value of each share class. Each share class has its own expense and sales charge structure. The Fund offers each of the share classes identified below.
Class A shares are subject to a maximum front-end sales charge of 5.75% based on the initial investment amount. Class A shares purchased without an initial sales charge in accounts aggregating $1 million to $50 million at the time of purchase are subject to a contingent deferred sales charge (CDSC) if the shares are sold within 18 months after purchase, charged as follows: 1.00% CDSC if redeemed within 12 months after purchase, and 0.50% CDSC if redeemed more than 12, but less than 18, months after purchase.
Advisor Class shares are not subject to sales charges and are generally available only to omnibus retirement plans and certain investors as described in the Fund’s prospectus. Prior to November 1, 2017, Advisor Class shares were known as Class R4 shares.
Class B shares of the Fund are no longer offered for sale. When available, Class B shares were subject to a maximum CDSC of 5.00% based upon the holding period after purchase. Effective July 17, 2017, Class B shares were automatically converted to Class A shares without a CDSC. On August 4, 2017, the capital owned by Columbia Management Investment Advisers, LLC in Class B shares was redeemed without a CDSC.
Class C shares are subject to a 1.00% CDSC on shares redeemed within 12 months after purchase.
Institutional Class shares are not subject to sales charges and are generally available only to eligible investors, which are subject to different investment minimums as described in the Fund’s prospectus. Prior to November 1, 2017, Institutional Class shares were known as Class Z shares.
Institutional 2 Class shares are not subject to sales charges and are generally available only to investors purchasing through authorized investment professionals and omnibus retirement plans as described in the Fund’s prospectus. Prior to November 1, 2017, Institutional 2 Class shares were known as Class R5 shares.
Institutional 3 Class shares are not subject to sales charges and are available to institutional and certain other investors as described in the Fund’s prospectus. Prior to November 1, 2017, Institutional 3 Class shares were known as Class Y shares.
Class R shares are not subject to sales charges and are generally available only to certain retirement plans and other investors as described in the Fund’s prospectus.
Note 2. Summary of significant accounting policies
Basis of preparation
The Fund is an investment company that applies the accounting and reporting guidance in the Financial Accounting Standards Board (FASB) Accounting Standards Codification Topic 946, Financial Services - Investment Companies (ASC 946). The financial statements are prepared in accordance with U.S. generally accepted accounting principles (GAAP), which requires management to make certain estimates and assumptions that affect the reported amounts of assets and liabilities, the disclosure of contingent assets and liabilities at the date of the financial statements and the reported amounts of income and expenses during the reporting period. Actual results could differ from those estimates.
| 22 | Columbia Small Cap Value Fund I | Annual Report 2018 |
Notes to Financial Statements (continued)
April 30, 2018
The following is a summary of significant accounting policies followed by the Fund in the preparation of its financial statements.
Security valuation
All equity securities are valued at the close of business of the New York Stock Exchange. Equity securities are valued at the last quoted sales price on the principal exchange or market on which they trade, except for securities traded on the NASDAQ Stock Market, which are valued at the NASDAQ official close price. Unlisted securities or listed securities for which there were no sales during the day are valued at the mean of the latest quoted bid and ask prices on such exchanges or markets.
Foreign equity securities are valued based on the closing price on the foreign exchange in which such securities are primarily traded. If any foreign equity security closing prices are not readily available, the securities are valued at the mean of the latest quoted bid and ask prices on such exchanges or markets. Foreign currency exchange rates are generally determined at 4:00 p.m. Eastern (U.S.) time. Many securities markets and exchanges outside the U.S. close prior to the close of the New York Stock Exchange; therefore, the closing prices for securities in such markets or on such exchanges may not fully reflect events that occur after such close but before the close of the New York Stock Exchange. In those situations, foreign securities will be fair valued pursuant to a policy adopted by the Board of Trustees, including, if available, utilizing a third party pricing service to determine these fair values. The third party pricing service takes into account multiple factors, including, but not limited to, movements in the U.S. securities markets, certain depositary receipts, futures contracts and foreign exchange rates that have occurred subsequent to the close of the foreign exchange or market, to determine a good faith estimate that reasonably reflects the current market conditions as of the close of the New York Stock Exchange. The fair value of a security is likely to be different from the quoted or published price, if available.
Investments in open-end investment companies, including money market funds, are valued at their latest net asset value.
Investments for which market quotations are not readily available, or that have quotations which management believes are not reflective of market value or reliable, are valued at fair value as determined in good faith under procedures approved by and under the general supervision of the Board of Trustees. If a security or class of securities (such as foreign securities) is valued at fair value, such value is likely to be different from the quoted or published price for the security.
The determination of fair value often requires significant judgment. To determine fair value, management may use assumptions including but not limited to future cash flows and estimated risk premiums. Multiple inputs from various sources may be used to determine fair value.
GAAP requires disclosure regarding the inputs and valuation techniques used to measure fair value and any changes in valuation inputs or techniques. In addition, investments shall be disclosed by major category. This information is disclosed following the Fund’s Portfolio of Investments.
Foreign currency transactions and translations
The values of all assets and liabilities denominated in foreign currencies are generally translated into U.S. dollars at exchange rates determined at the close of regular trading on the New York Stock Exchange. Net realized and unrealized gains (losses) on foreign currency transactions and translations include gains (losses) arising from the fluctuation in exchange rates between trade and settlement dates on securities transactions, gains (losses) arising from the disposition of foreign currency and currency gains (losses) between the accrual and payment dates on dividends, interest income and foreign withholding taxes.
For financial statement purposes, the Fund does not distinguish that portion of gains (losses) on investments which is due to changes in foreign exchange rates from that which is due to changes in market prices of the investments. Such fluctuations are included with the net realized and unrealized gains (losses) on investments in the Statement of Operations.
Security transactions
Security transactions are accounted for on the trade date. Cost is determined and gains (losses) are based upon the specific identification method for both financial statement and federal income tax purposes.
Columbia Small Cap Value Fund I | Annual Report 2018
| 23 |
Notes to Financial Statements (continued)
April 30, 2018
Income recognition
Corporate actions and dividend income are generally recorded net of any non-reclaimable tax withholdings, on the ex-dividend date or upon receipt of ex-dividend notification in the case of certain foreign securities.
The Fund may receive distributions from holdings in equity securities, business development companies (BDCs), exchange-traded funds (ETFs), limited partnerships (LPs), other regulated investment companies (RICs), and real estate investment trusts (REITs), which report information on the tax character of their distributions annually. These distributions are allocated to dividend income, capital gain and return of capital based on actual information reported. Return of capital is recorded as a reduction of the cost basis of securities held. If the Fund no longer owns the applicable securities, return of capital is recorded as a realized gain. With respect to REITs, to the extent actual information has not yet been reported, estimates for return of capital are made by the Fund’s management. Management’s estimates are subsequently adjusted when the actual character of the distributions is disclosed by the REITs, which could result in a proportionate change in return of capital to shareholders.
Awards from class action litigation are recorded as a reduction of cost basis if the Fund still owns the applicable securities on the payment date. If the Fund no longer owns the applicable securities, the proceeds are recorded as realized gains.
Expenses
General expenses of the Trust are allocated to the Fund and other funds of the Trust based upon relative net assets or other expense allocation methodologies determined by the nature of the expense. Expenses directly attributable to the Fund are charged to the Fund. Expenses directly attributable to a specific class of shares are charged to that share class.
Determination of class net asset value
All income, expenses (other than class-specific expenses, which are charged to that share class, as shown in the Statement of Operations) and realized and unrealized gains (losses) are allocated to each class of the Fund on a daily basis, based on the relative net assets of each class, for purposes of determining the net asset value of each class.
Federal income tax status
The Fund intends to qualify each year as a regulated investment company under Subchapter M of the Internal Revenue Code, as amended, and will distribute substantially all of its investment company taxable income and net capital gain, if any, for its tax year, and as such will not be subject to federal income taxes. In addition, the Fund intends to distribute in each calendar year substantially all of its ordinary income, capital gain net income and certain other amounts, if any, such that the Fund should not be subject to federal excise tax. Therefore, no federal income or excise tax provision is recorded.
Foreign taxes
The Fund may be subject to foreign taxes on income, gains on investments or currency repatriation, a portion of which may be recoverable. The Fund will accrue such taxes and recoveries, as applicable, based upon its current interpretation of tax rules and regulations that exist in the markets in which it invests.
Realized gains in certain countries may be subject to foreign taxes at the Fund level, based on statutory rates. The Fund accrues for such foreign taxes on realized and unrealized gains at the appropriate rate for each jurisdiction, as applicable. The amount, if any, is disclosed as a liability on the Statement of Assets and Liabilities.
Distributions to shareholders
Distributions from net investment income, if any, are declared and paid semi-annually. Net realized capital gains, if any, are distributed at least annually. Income distributions and capital gain distributions are determined in accordance with federal income tax regulations, which may differ from GAAP.
| 24 | Columbia Small Cap Value Fund I | Annual Report 2018 |
Notes to Financial Statements (continued)
April 30, 2018
Guarantees and indemnifications
Under the Trust’s organizational documents and, in some cases, by contract, its officers and trustees are indemnified against certain liabilities arising out of the performance of their duties to the Trust or its funds. In addition, certain of the Fund’s contracts with its service providers contain general indemnification clauses. The Fund’s maximum exposure under these arrangements is unknown since the amount of any future claims that may be made against the Fund cannot be determined, and the Fund has no historical basis for predicting the likelihood of any such claims.
Recent accounting pronouncement
Accounting Standards Update 2017-08 Premium Amortization on Purchased Callable Debt Securities
In March 2017, the Financial Accounting Standards Board issued Accounting Standards Update (ASU) No. 2017-08 Premium Amortization on Purchased Callable Debt Securities. ASU No. 2017-08 updates the accounting standards to shorten the amortization period for certain purchased callable debt securities, held at a premium, to be amortized to the earliest call date. The update applies to securities with explicit, noncontingent call features that are callable at fixed prices and on preset dates. The standard is effective for annual periods beginning after December 15, 2018 and interim periods within those fiscal years. At this time, management is evaluating the implication of this guidance and the impact it will have on the financial statement amounts and footnote disclosures, if any.
Note 3. Fees and other transactions with affiliates
Management services fees
The Fund has entered into a Management Agreement with Columbia Management Investment Advisers, LLC (the Investment Manager), a wholly-owned subsidiary of Ameriprise Financial, Inc. (Ameriprise Financial). Under the Management Agreement, the Investment Manager provides the Fund with investment research and advice, as well as administrative and accounting services. The management services fee is an annual fee that is equal to a percentage of the Fund’s daily net assets that declines from 0.87% to 0.75% as the Fund’s net assets increase. The effective management services fee rate for the year ended April 30, 2018 was 0.86% of the Fund’s average daily net assets.
Compensation of board members
Members of the Board of Trustees who are not officers or employees of the Investment Manager or Ameriprise Financial are compensated for their services to the Fund as disclosed in the Statement of Operations. These members of the Board of Trustees may participate in a Deferred Compensation Plan (the Plan) which may be terminated at any time. Obligations of the Plan will be paid solely out of the Fund’s assets, and all amounts payable under the Plan constitute a general unsecured obligation of the Fund.
Compensation of Chief Compliance Officer
The Board of Trustees has appointed a Chief Compliance Officer to the Fund in accordance with federal securities regulations. As disclosed in the Statement of Operations, a portion of the Chief Compliance Officer’s total compensation is allocated to the Fund, along with other allocations to affiliated funds governed by the Board of Trustees, based on relative net assets.
Transfer agency fees
Under a Transfer and Dividend Disbursing Agent Agreement, Columbia Management Investment Services Corp. (the Transfer Agent), an affiliate of the Investment Manager and a wholly-owned subsidiary of Ameriprise Financial, is responsible for providing transfer agency services to the Fund. The Transfer Agent has contracted with DST Asset Manager Solutions, Inc. (DST) to serve as sub-transfer agent. The Transfer Agent pays the fees of DST for services as sub-transfer agent and DST is not entitled to reimbursement for such fees from the Fund (with the exception of out-of-pocket fees).
Columbia Small Cap Value Fund I | Annual Report 2018
| 25 |
Notes to Financial Statements (continued)
April 30, 2018
The Fund pays the Transfer Agent a monthly transfer agency fee based on the number or the average value of accounts, depending on the type of account. In addition, the Fund pays the Transfer Agent a fee for shareholder services based on the number of accounts or on a percentage of the average aggregate value of the Fund’s shares maintained in omnibus accounts up to the lesser of the amount charged by the financial intermediary or a cap established by the Board of Trustees from time to time.
The Transfer Agent also receives compensation from the Fund for various shareholder services and reimbursements for certain out-of-pocket fees. Effective August 1, 2017, total transfer agency fees for Institutional 2 Class and Institutional 3 Class shares are subject to an annual limitation of not more than 0.07% and 0.02%, respectively, of the average daily net assets attributable to each share class. Prior to August 1, 2017, these limitations were 0.075% for Institutional 2 Class shares and 0.025% for Institutional 3 Class shares.
For the year ended April 30, 2018, the Fund’s effective transfer agency fee rates as a percentage of average daily net assets of each class were as follows:
| | Effective rate (%) |
| Class A | 0.18 |
| Advisor Class | 0.19 |
| Class B | 0.05 (a) |
| Class C | 0.18 |
| Institutional Class | 0.18 |
| Institutional 2 Class | 0.06 |
| Institutional 3 Class | 0.01 |
| Class R | 0.18 |
An annual minimum account balance fee of $20 may apply to certain accounts with a value below the applicable share class’s initial minimum investment requirements to reduce the impact of small accounts on transfer agency fees. These minimum account balance fees are remitted to the Fund and recorded as part of expense reductions in the Statement of Operations. For the year ended April 30, 2018, these minimum account balance fees reduced total expenses of the Fund by $2,966.
Distribution and service fees
The Fund has entered into an agreement with Columbia Management Investment Distributors, Inc. (the Distributor), an affiliate of the Investment Manager and a wholly-owned subsidiary of Ameriprise Financial, for distribution and shareholder services. The Board of Trustees has approved, and the Fund has adopted, distribution and shareholder service plans (the Plans) applicable to certain share classes, which set the distribution and service fees for the Fund. These fees are calculated daily and are intended to compensate the Distributor and/or eligible selling and/or servicing agents for selling shares of the Fund and providing services to investors.
Under the Plans, the Fund pays a monthly service fee to the Distributor at the maximum annual rate of 0.25% of the average daily net assets attributable to Class A, Class B and Class C shares of the Fund. Also under the Plans, the Fund pays a monthly distribution fee to the Distributor at the maximum annual rates of 0.75%, 0.75% and 0.50% of the average daily net assets attributable to Class B, Class C and Class R shares of the Fund, respectively. As a result of all Class B shares of the Fund being redeemed or converted to Class A shares, August 4, 2017 was the last day the Fund paid a service fee or distribution fee for Class B shares.
Sales charges (unaudited)
Sales charges, including front-end charges and CDSCs, received by the Distributor for distributing Fund shares for the year ended April 30, 2018, if any, are listed below:
| | Amount ($) |
| Class A | 211,013 |
| Class C | 1,200 |
| 26 | Columbia Small Cap Value Fund I | Annual Report 2018 |
Notes to Financial Statements (continued)
April 30, 2018
Expenses waived/reimbursed by the Investment Manager and its affiliates
The Investment Manager and certain of its affiliates have contractually agreed to waive fees and/or reimburse expenses (excluding certain fees and expenses described below) for the period(s) disclosed below, unless sooner terminated at the sole discretion of the Board of Trustees, so that the Fund’s net operating expenses, after giving effect to fees waived/expenses reimbursed and any balance credits and/or overdraft charges from the Fund’s custodian, do not exceed the following annual rate(s) as a percentage of the class’ average daily net assets:
| | September 1, 2017
through
August 31, 2018 | Prior to
September 1, 2017 |
| Class A | 1.32% | 1.37% |
| Advisor Class | 1.07 | 1.12 |
| Class C | 2.07 | 2.12 |
| Institutional Class | 1.07 | 1.12 |
| Institutional 2 Class | 0.95 | 1.02 |
| Institutional 3 Class | 0.90 | 0.97 |
| Class R | 1.57 | 1.62 |
Under the agreement governing these fee waivers and/or expense reimbursement arrangements, the following fees and expenses are excluded from the waiver/reimbursement commitment, and therefore will be paid by the Fund, if applicable: taxes (including foreign transaction taxes), expenses associated with investments in affiliated and non-affiliated pooled investment vehicles (including mutual funds and exchange-traded funds), transaction costs and brokerage commissions, costs related to any securities lending program, dividend expenses associated with securities sold short, inverse floater program fees and expenses, transaction charges and interest on borrowed money, interest, infrequent and/or unusual expenses and any other expenses the exclusion of which is specifically approved by the Board of Trustees. This agreement may be modified or amended only with approval from the Investment Manager, certain of its affiliates and the Fund. Any fees waived and/or expenses reimbursed under the expense reimbursement arrangements described above are not recoverable by the Investment Manager or its affiliates in future periods.
Note 4. Federal tax information
The timing and character of income and capital gain distributions are determined in accordance with income tax regulations, which may differ from GAAP because of temporary or permanent book to tax differences.
At April 30, 2018, these differences were primarily due to differing treatment for deferral/reversal of wash sale losses, re-characterization of distributions for investments, trustees’ deferred compensation, foreign currency transactions, earnings and profits distributed to shareholders on the redemption of shares and distribution reclassifications. To the extent these differences were permanent, reclassifications were made among the components of the Fund’s net assets in the Statement of Assets and Liabilities. Temporary differences do not require reclassifications.
In the Statement of Assets and Liabilities the following reclassifications were made:
Excess of distributions
over net investment
income ($) | Accumulated
net realized
gain ($) | Paid in
capital ($) |
| 255,953 | (4,259,150) | 4,003,197 |
Net investment income (loss) and net realized gains (losses), as disclosed in the Statement of Operations, and net assets were not affected by this reclassification.
Columbia Small Cap Value Fund I | Annual Report 2018
| 27 |
Notes to Financial Statements (continued)
April 30, 2018
The tax character of distributions paid during the years indicated was as follows:
| Year Ended April 30, 2018 | Year Ended April 30, 2017 |
Ordinary
income ($) | Long-term
capital gains ($) | Total ($) | Ordinary
income ($) | Long-term
capital gains ($) | Total ($) |
| 938,077 | 66,391,472 | 67,329,549 | 9,014,200 | 61,284,230 | 70,298,430 |
Short-term capital gain distributions, if any, are considered ordinary income distributions for tax purposes.
At April 30, 2018, the components of distributable earnings on a tax basis were as follows:
Undistributed
ordinary income ($) | Undistributed
long-term
capital gains ($) | Capital loss
carryforwards ($) | Net unrealized
appreciation ($) |
| — | 14,145,937 | — | 213,992,051 |
At April 30, 2018, the cost of all investments for federal income tax purposes along with the aggregate gross unrealized appreciation and depreciation based on that cost was:
Federal
tax cost ($) | Gross unrealized
appreciation ($) | Gross unrealized
(depreciation) ($) | Net unrealized
appreciation ($) |
| 412,801,407 | 230,431,641 | (16,439,590) | 213,992,051 |
Tax cost of investments and unrealized appreciation/(depreciation) may also include timing differences that do not constitute adjustments to tax basis.
Management of the Fund has concluded that there are no significant uncertain tax positions in the Fund that would require recognition in the financial statements. However, management’s conclusion may be subject to review and adjustment at a later date based on factors including, but not limited to, new tax laws, regulations, and administrative interpretations (including relevant court decisions). Generally, the Fund’s federal tax returns for the prior three fiscal years remain subject to examination by the Internal Revenue Service.
Note 5. Portfolio information
The cost of purchases and proceeds from sales of securities, excluding short-term investments and derivatives, if any, aggregated to $310,371,596 and $330,261,534, respectively, for the year ended April 30, 2018. The amount of purchase and sale activity impacts the portfolio turnover rate reported in the Financial Highlights.
Note 6. Affiliated money market fund
The Fund invests in Columbia Short-Term Cash Fund, an affiliated money market fund established for the exclusive use by the Fund and other affiliated funds (the Affiliated MMF). The income earned by the Fund from such investments is included as Dividends - affiliated issuers in the Statement of Operations. As an investing fund, the Fund indirectly bears its proportionate share of the expenses of the Affiliated MMF. The Affiliated MMF prices its shares with a floating net asset value. In addition, the Board of Trustees of the Affiliated MMF may impose a fee on redemptions (sometimes referred to as a liquidity fee) or temporarily suspend redemptions (sometimes referred to as imposing a redemption gate) in the event its liquidity falls below regulatory limits.
Note 7. Line of credit
The Fund has access to a revolving credit facility with a syndicate of banks led by Citibank, N.A., HSBC Bank USA, N.A. and JPMorgan Chase Bank, N.A. whereby the Fund may borrow for the temporary funding of shareholder redemptions or for other temporary or emergency purposes. The credit facility, which is a collective agreement between the Fund and certain other funds managed by the Investment Manager, severally and not jointly, permits collective borrowings up to $1 billion. Interest is charged to each participating fund based on its borrowings at a rate equal to the higher of (i) the overnight federal funds rate
| 28 | Columbia Small Cap Value Fund I | Annual Report 2018 |
Notes to Financial Statements (continued)
April 30, 2018
plus 1.00% or (ii) the one-month LIBOR rate plus 1.00%. Each borrowing under the credit facility matures no later than 60 days after the date of borrowing. The Fund also pays a commitment fee equal to its pro rata share of the amount of the credit facility at a rate of 0.15% per annum. The commitment fee is included in other expenses in the Statement of Operations.
For the year ended April 30, 2018, the average daily loan balance outstanding on days when borrowing existed was $2,450,000 at a weighted average interest rate of 2.33%. Interest expense incurred by the Fund is recorded as a line of credit interest expense in the Statement of Operations. The Fund had no outstanding borrowings at April 30, 2018.
Note 8. Significant risks
Financial sector risk
The Fund may be more susceptible to the particular risks that may affect companies in the financial services sector than if it were invested in a wider variety of companies in unrelated sectors. Companies in the financial services sector are subject to certain risks, including the risk of regulatory change, decreased liquidity in credit markets and unstable interest rates. Such companies may have concentrated portfolios, such as a high level of loans to real estate developers, which makes them vulnerable to economic conditions that affect that industry. Performance of such companies may be affected by competitive pressures and exposure to investments or agreements that, under certain circumstances, may lead to losses (e.g., subprime loans). Companies in the financial services sector are subject to extensive governmental regulation that may limit the amount and types of loans and other financial commitments they can make, and interest rates and fees that they may charge. In addition, profitability of such companies is largely dependent upon the availability and the cost of capital.
Shareholder concentration risk
At April 30, 2018, one unaffiliated shareholder of record owned 18.5% of the outstanding shares of the Fund in one or more accounts. The Fund has no knowledge about whether any portion of those shares was owned beneficially. Affiliated shareholders of record owned 16.4% of the outstanding shares of the Fund in one or more accounts. Subscription and redemption activity by concentrated accounts may have a significant effect on the operations of the Fund. In the case of a large redemption, the Fund may be forced to sell investments at inopportune times, including its liquid positions, which may result in Fund losses and the Fund holding a higher percentage of less liquid positions. Large redemptions could result in decreased economies of scale and increased operating expenses for non-redeeming Fund shareholders.
Note 9. Subsequent events
Management has evaluated the events and transactions that have occurred through the date the financial statements were issued and noted no items requiring adjustment of the financial statements or additional disclosure.
Note 10. Information regarding pending and settled legal proceedings
Ameriprise Financial and certain of its affiliates have historically been involved in a number of legal, arbitration and regulatory proceedings, including routine litigation, class actions, and governmental actions, concerning matters arising in connection with the conduct of their business activities. Ameriprise Financial believes that the Fund is not currently the subject of, and that neither Ameriprise Financial nor any of its affiliates are the subject of, any pending legal, arbitration or regulatory proceedings that are likely to have a material adverse effect on the Fund or the ability of Ameriprise Financial or its affiliates to perform under their contracts with the Fund. Ameriprise Financial is required to make quarterly (10-Q), annual (10-K) and, as necessary, 8-K filings with the Securities and Exchange Commission (SEC) on legal and regulatory matters that relate to Ameriprise Financial and its affiliates. Copies of these filings may be obtained by accessing the SEC website at www.sec.gov.
There can be no assurance that these matters, or the adverse publicity associated with them, will not result in increased Fund redemptions, reduced sale of Fund shares or other adverse consequences to the Fund. Further, although we believe proceedings are not likely to have a material adverse effect on the Fund or the ability of Ameriprise Financial or its affiliates to perform under their contracts with the Fund, these proceedings are subject to uncertainties and, as such, we are unable to estimate the possible loss or range of loss that may result. An adverse outcome in one or more of these proceedings could result in adverse judgments, settlements, fines, penalties or other relief that could have a material adverse effect on the consolidated financial condition or results of operations of Ameriprise Financial.
Columbia Small Cap Value Fund I | Annual Report 2018
| 29 |
Report of Independent Registered Public Accounting Firm
To the Board of Trustees of Columbia Funds Series Trust I and Shareholders of Columbia Small Cap Value Fund I
Opinion on the Financial Statements
We have audited the accompanying statement of assets and liabilities, including the portfolio of investments, of Columbia Small Cap Value Fund I (one of the funds constituting Columbia Funds Series Trust I, referred to hereafter as the "Fund") as of April 30, 2018, the related statement of operations for the year ended April 30, 2018, the statement of changes in net assets for each of the two years in the period ended April 30, 2018, including the related notes, and the financial highlights for each of the five years in the period ended April 30, 2018 (collectively referred to as the “financial statements”). In our opinion, the financial statements present fairly, in all material respects, the financial position of the Fund as of April 30, 2018, the results of its operations for the year then ended, the changes in its net assets for each of the two years in the period ended April 30, 2018 and the financial highlights for each of the five years in the period ended April 30, 2018 in conformity with accounting principles generally accepted in the United States of America.
Basis for Opinion
These financial statements are the responsibility of the Fund’s management. Our responsibility is to express an opinion on the Fund’s financial statements based on our audits. We are a public accounting firm registered with the Public Company Accounting Oversight Board (United States) (“PCAOB”) and are required to be independent with respect to the Fund in accordance with the U.S. federal securities laws and the applicable rules and regulations of the Securities and Exchange Commission and the PCAOB.
We conducted our audits of these financial statements in accordance with the standards of the PCAOB. Those standards require that we plan and perform the audit to obtain reasonable assurance about whether the financial statements are free of material misstatement, whether due to error or fraud.
Our audits included performing procedures to assess the risks of material misstatement of the financial statements, whether due to error or fraud, and performing procedures that respond to those risks. Such procedures included examining, on a test basis, evidence regarding the amounts and disclosures in the financial statements. Our audits also included evaluating the accounting principles used and significant estimates made by management, as well as evaluating the overall presentation of the financial statements. Our procedures included confirmation of securities owned as of April 30, 2018 by correspondence with the custodian, transfer agent and brokers; when replies were not received from brokers, we performed other auditing procedures. We believe that our audits provide a reasonable basis for our opinion.
/s/PricewaterhouseCoopers LLP
Minneapolis, Minnesota
June 21, 2018
We have served as auditors of one or more investment companies within the Columbia Funds Complex since 1977.
| 30 | Columbia Small Cap Value Fund I | Annual Report 2018 |
Federal Income Tax Information
(Unaudited)
The Fund hereby designates the following tax attributes for the fiscal year ended April 30, 2018. Shareholders will be notified in early 2019 of the amounts for use in preparing 2018 income tax returns.
Qualified
dividend
income | Dividends
received
deduction | Capital
gain
dividend |
| 100.00% | 100.00% | $49,164,934 |
Qualified dividend income. For taxable, non-corporate shareholders, the percentage of ordinary income distributed during the fiscal year that represents qualified dividend income subject to reduced tax rates.
Dividends received deduction. The percentage of ordinary income distributed during the fiscal year that qualifies for the corporate dividends received deduction.
Capital gain dividend. The Fund designates as a capital gain dividend the amount reflected above, or if subsequently determined to be different, the net capital gain of such fiscal period.
Columbia Small Cap Value Fund I | Annual Report 2018
| 31 |
Shareholders elect the Board that oversees the Fund’s operations. The Board appoints officers who are responsible for day-to-day business decisions based on policies set by the Board. The following table provides basic biographical information about the Fund’s Trustees, including their principal occupations during the past five years, although specific titles for individuals may have varied over the period. The year set forth beneath Length of Service in the table below is the year in which the Trustee was first appointed or elected as Trustee to any Fund currently in the Columbia Funds Complex or a predecessor thereof. Under current Board policy, members serve terms of indefinite duration.
Independent trustees
| Name, address, year of birth | Position held with the Trust and length of service | Principal occupation(s) during the past five years and other relevant professional experience | Number of Funds in the Columbia Fund Complex overseen | Other directorships held by Trustee during the past five years |
Janet Langford Carrig
c/o Columbia Management
Investment Advisers, LLC
225 Franklin Street
Mail Drop BX32 05228
Boston, MA 02110
1957 | Trustee
1996 | Senior Vice President, General Counsel and Corporate Secretary, ConocoPhillips (independent energy company) since September 2007 | 71 | None |
Douglas A. Hacker
c/o Columbia Management
Investment Advisers, LLC
225 Franklin Street
Mail Drop BX32 05228
Boston, MA 02110
1955 | Trustee and Chairman of the Board
1996 | Independent business executive since May 2006; Executive Vice President — Strategy of United Airlines from December 2002 to May 2006; President of UAL Loyalty Services (airline marketing company) from September 2001 to December 2002; Executive Vice President and Chief Financial Officer of United Airlines from July 1999 to September 2001 | 71 | Spartan Nash Company, (food distributor); Nash Finch Company (food distributor) from 2005 to 2013; Aircastle Limited (aircraft leasing); SeaCube Container Leasing Ltd. (container leasing) from 2010 to 2013; and Travelport Worldwide Limited (travel information technology) |
Nancy T. Lukitsh
c/o Columbia Management
Investment Advisers, LLC
225 Franklin Street
Mail Drop BX32 05228
Boston, MA 02110
1956 | Trustee
2011 | Senior Vice President, Partner and Director of Marketing, Wellington Management Company, LLP (investment adviser) from 1997 to 2010; Chair, Wellington Management Portfolios (commingled non-U.S. investment pools) from 2007 to 2010; Director, Wellington Trust Company, NA and other Wellington affiliates from 1997 to 2010 | 71 | None |
David M. Moffett
c/o Columbia Management
Investment Advisers, LLC
225 Franklin Street
Mail Drop BX32 05228
Boston, MA 02110
1952 | Trustee
2011 | Retired. Consultant to Bridgewater and Associates | 71 | Director, CSX Corporation; Genworth Financial, Inc. (financial and insurance products and services); PayPal Holdings Inc. (payment and data processing services); Trustee, University of Oklahoma Foundation; former Director, eBay Inc. (online trading community), 2007-2015; and former Director, CIT Bank, CIT Group Inc. (commercial and consumer finance), 2010-2016 |
John J. Neuhauser
c/o Columbia Management
Investment Advisers, LLC
225 Franklin Street
Mail Drop BX32 05228
Boston, MA 02110
1943 | Trustee
1984 | President, Saint Michael’s College since August 2007; Director or Trustee of several non-profit organizations, including University of Vermont Medical Center; Academic Vice President and Dean of Faculties, Boston College from August 1999 to October 2005; University Professor, Boston College from November 2005 to August 2007 | 71 | Liberty All-Star Equity Fund and Liberty All- Star Growth Fund (closed-end funds) |
| 32 | Columbia Small Cap Value Fund I | Annual Report 2018 |
TRUSTEES AND OFFICERS (continued)
Independent trustees (continued)
| Name, address, year of birth | Position held with the Trust and length of service | Principal occupation(s) during the past five years and other relevant professional experience | Number of Funds in the Columbia Fund Complex overseen | Other directorships held by Trustee during the past five years |
Patrick J. Simpson
c/o Columbia Management
Investment Advisers, LLC
225 Franklin Street
Mail Drop BX32 05228
Boston, MA 02110
1944 | Trustee
2000 | Of Counsel, Perkins Coie LLP (law firm) since 2015; Partner, Perkins Coie LLP from 1988 to 2014 | 71 | None |
Anne-Lee Verville
c/o Columbia Management
Investment Advisers, LLC
225 Franklin Street
Mail Drop BX32 05228
Boston, MA 02110
1945 | Trustee
1998 | Retired. General Manager, Global Education Industry from 1994 to 1997, President – Application Systems Division from 1991 to 1994, Chief Financial Officer – US Marketing & Services from 1988 to 1991, and Chief Information Officer from 1987 to 1988, IBM Corporation (computer and technology) | 71 | Enesco Group, Inc. (producer of giftware and home and garden decor products) from 2001 to 2006 |
Consultants to the Independent Trustees*
| Name, address, year of birth | Position held with the Trust and length of service | Principal occupation(s) during the past five years and other relevant professional experience | Number of Funds in the Columbia Funds complex overseen | Other directorships held by Trustee during the past five years |
J. Kevin Connaughton
c/o Columbia
Management Investment
Advisers, LLC,
225 Franklin Street
Mail Drop BX32 05228,
Boston, MA 02110
1964 | Independent Trustee Consultant
2016 | Independent Trustee Consultant, Columbia Funds since March 2016; Adjunct Professor of Finance, Bentley University since November 2017; Managing Director and General Manager of Mutual Fund Products, Columbia Management Investment Advisers, LLC from May 2010 to February 2015; President, Columbia Funds from 2009 to 2015; and senior officer of Columbia Funds and affiliated funds from 2003 to 2015 | 71 | Director, The Autism Project since March 2015; former Trustee, New Century Portfolios, March 2015-December 2017; formerly on Board of Governors, Gateway Healthcare, January 2016 – December 2017 |
Natalie A. Trunow
c/o Columbia
Management Investment
Advisers, LLC,
225 Franklin Street
Mail Drop BX32 05228,
Boston, MA 02110
1967 | Independent Trustee Consultant
2016 | Independent Trustee Consultant, Columbia Funds since September 2016; Chief Executive Officer, Millennial Portfolio Solutions LLC (asset management and consulting services) since January 2016; Director of Investments, Casey Family Programs from April 2016 to September 2016; Senior Vice President and Chief Investment Officer, Calvert Investments from August 2008 to January 2016; Section Head and Portfolio Manager, General Motors Asset Management from June 1997 to August 2008 | 71 | Director, Health Services for Children with Special Needs, Inc.; Director, Guidewell Financial Solutions |
| * | J. Kevin Connaughton was appointed consultant to the Independent Trustees effective March 1, 2016. Natalie A. Trunow was appointed consultant to the Independent Trustees effective September 1, 2016. Shareholders of the Funds are expected to be asked to elect each of Mr. Connaughton and Ms. Trunow as a Trustee at a future shareholder meeting. |
Columbia Small Cap Value Fund I | Annual Report 2018
| 33 |
TRUSTEES AND OFFICERS (continued)
Interested trustee affiliated with Investment Manager*
| Name, address, year of birth | Position held with the Trust and length of service | Principal occupation(s) during the past five years and other relevant professional experience | Number of Funds in the Columbia Funds Complex overseen | Other directorships held by Trustee during the past five years |
William F. Truscott
c/o Columbia Management
Investment Advisers, LLC
225 Franklin Street
Boston, MA 02110
1960 | Trustee
2012 | Chairman of the Board and President, Columbia Management Investment Advisers, LLC since May 2010 and February 2012, respectively; Chief Executive Officer, Global Asset Management, Ameriprise Financial, Inc. since September 2012 (previously Chief Executive Officer, U.S. Asset Management & President, Annuities, May 2010-September 2012); Director and Chief Executive Officer, Columbia Management Investment Distributors, Inc. since May 2010 and February 2012, respectively; Chairman of the Board and Chief Executive Officer, RiverSource Distributors, Inc. since 2006; Director, Threadneedle Asset Management Holdings, SARL since 2014; President and Chief Executive Officer, Ameriprise Certificate Company, 2006-August 2012 | 196 | Chairman of the Board, Columbia Management Investment Advisers, LLC since May 2010; Director, Columbia Management Investment Distributors, Inc. since May 2010; former Director, Ameriprise Certificate Company, 2006 - January 2013 |
| * | Interested person (as defined under the 1940 Act) by reason of being an officer, director, security holder and/or employee of the Investment Manager or Ameriprise Financial. |
The Statement of Additional Information has additional information about the Fund’s Board members and is available, without charge, upon request by calling 800.345.6611, visiting columbiathreadneedleus.com/investor/ or contacting your financial intermediary.
| 34 | Columbia Small Cap Value Fund I | Annual Report 2018 |
TRUSTEES AND OFFICERS (continued)
The Board has appointed officers who are responsible for day-to-day business decisions based on policies it has established. The officers serve at the pleasure of the Board. The following table provides basic information about the Officers of the Fund, including principal occupations during the past five years, although their specific titles may have varied over the period. In addition to Mr. Truscott, who is Senior Vice President, the Fund’s other officers are:
Fund officers
Name,
address and
year of birth | Position and year
first appointed to
position for any Fund
in the Columbia
Funds complex or a
predecessor thereof | Principal occupation(s) during past five years |
Christopher O. Petersen
5228 Ameriprise
Financial Center
Minneapolis, MN 55474
Born 1970 | President and Principal Executive Officer (2015) | Vice President and Lead Chief Counsel, Ameriprise Financial, Inc. since January 2015 (previously, Vice President and Chief Counsel, January 2010 - December 2014; officer of Columbia Funds and affiliated funds since 2007. |
Michael G. Clarke
225 Franklin Street
Boston, MA 02110
Born 1969 | Treasurer (2011), Chief Financial Officer (2009) and Chief Accounting Officer (2015) | Vice President — Mutual Fund Administration, Columbia Management Investment Advisers, LLC, since May 2010; senior officer of Columbia Funds and affiliated funds since 2002. |
Paul B. Goucher
100 Park Avenue
New York, NY 10017
Born 1968 | Senior Vice President (2011) and Assistant Secretary (2008) | Senior Vice President and Assistant General Counsel, Ameriprise Financial, Inc. since January 2017 (previously Vice President and Lead Chief Counsel, November 2008 - January 2017 and January 2013 - January 2017, respectively; and Chief Counsel, January 2010 - January 2013); Vice President, Chief Legal Officer and Assistant Secretary, Columbia Management Investment Advisers, LLC since May 2010. |
Thomas P. McGuire
225 Franklin Street
Boston, MA 02110
Born 1972 | Senior Vice President and Chief Compliance Officer (2012) | Vice President — Asset Management Compliance, Ameriprise Financial, Inc., since May 2010; Chief Compliance Officer, Ameriprise Certificate Company since September 2010. |
Colin Moore
225 Franklin Street
Boston, MA 02110
Born 1958 | Senior Vice President (2010) | Executive Vice President and Global Chief Investment Officer, Ameriprise Financial, Inc., since July 2013; Executive Vice President and Global Chief Investment Officer, Columbia Management Investment Advisers, LLC since July 2013 (previously Director and Global Chief Investment Officer, 2010 - 2013). |
Ryan C. Larrenaga
225 Franklin Street
Boston, MA 02110
Born 1970 | Senior Vice President (2017), Chief Legal Officer (2017) and Secretary (2015) | Vice President and Group Counsel, Ameriprise Financial, Inc. since August 2011; officer of Columbia Funds and affiliated funds since 2005. |
Michael E. DeFao
225 Franklin Street
Boston, MA 02110
Born 1968 | Vice President (2011) and Assistant Secretary (2010) | Vice President and Chief Counsel, Ameriprise Financial, Inc. since May 2010. |
Amy Johnson
5228 Ameriprise
Financial Center
Minneapolis, MN 55474
Born 1965 | Vice President (2006) | Managing Director and Global Head of Operations, Columbia Management Investment Advisers, LLC since April 2016 (previously Managing Director and Chief Operating Officer, 2010 - 2016). |
Lyn Kephart-Strong
5228 Ameriprise
Financial Center
Minneapolis, MN 55474
Born 1960 | Vice President (2015) | President, Columbia Management Investment Services Corp. since October 2014; Vice President & Resolution Officer, Ameriprise Trust Company since August 2009. |
Columbia Small Cap Value Fund I | Annual Report 2018
| 35 |
The Fund mails one shareholder report to each shareholder address. If you would like more than one report, please call shareholder services at 800.345.6611 and additional reports will be sent to you.
Proxy voting policies and procedures
The policy of the Board of Trustees is to vote the proxies of the companies in which the Fund holds investments consistent with the procedures as stated in the Statement of Additional Information (SAI). You may obtain a copy of the SAI without charge by calling 800.345.6611; contacting your financial intermediary; visiting columbiathreadneedleus.com/investor/; or searching the website of the Securities and Exchange Commission (SEC) at sec.gov. Information regarding how the Fund voted proxies relating to portfolio securities is filed with the SEC by August 31st for the most recent 12-month period ending June 30th of that year, and is available without charge by visiting columbiathreadneedleus.com/investor/, or searching the website of the SEC at sec.gov.
Quarterly schedule of investments
The Fund files a complete schedule of portfolio holdings with the SEC for the first and third quarters of each fiscal year on Form N-Q. The Fund’s Form N-Q is available on the SEC’s website at sec.gov and may be reviewed and copied at the SEC’s Public Reference Room in Washington, D.C. Information on the operation of the Public Reference Room may be obtained by calling 800.SEC.0330. The Fund’s complete schedule of portfolio holdings, as filed on Form N-Q, can also be obtained without charge, upon request, by calling 800.345.6611.
Additional Fund information
For more information about the Fund, please visit columbiathreadneedleus.com/investor/ or call 800.345.6611. Customer Service Representatives are available to answer your questions Monday through Friday from 8 a.m. to 7 p.m. Eastern time.
Fund investment manager
Columbia Management Investment Advisers, LLC
225 Franklin Street
Boston, MA 02110
Fund distributor
Columbia Management Investment Distributors, Inc.
225 Franklin Street
Boston, MA 02110
Fund transfer agent
Columbia Management Investment Services Corp.
P.O. Box 8081
Boston, MA 02266-8081
| 36 | Columbia Small Cap Value Fund I | Annual Report 2018 |
[THIS PAGE INTENTIONALLY LEFT BLANK]
Columbia Small Cap Value Fund I
P.O. Box 8081
Boston, MA 02266-8081
Please read and consider the investment objectives, risks, charges and expenses for any fund carefully before investing. For a prospectus and summary prospectus, which contains this and other important information about the Fund, go to
columbiathreadneedleus.com/investor/. The Fund is distributed by Columbia Management Investment Distributors, Inc., member FINRA, and managed by Columbia Management Investment Advisers, LLC.
Columbia Threadneedle Investments (Columbia Threadneedle) is the global brand name of the Columbia and Threadneedle group of companies. All rights reserved. Columbia Management Investment Distributors, Inc., 225 Franklin Street, Boston, MA 02110-2804
© 2018 Columbia Management Investment Advisers, LLC.
columbiathreadneedleus .com/investor/

Annual Report
April 30, 2018
Columbia U.S. Treasury Index Fund
Not FDIC Insured • No bank guarantee • May lose value
Dear Shareholders,
The year 2017 was an extraordinary year in the financial markets. The S&P 500 Index didn’t experience a single down month and returned over 20%. Continuing this trend, January 2018 marked the fastest start for the index ever. Low volatility, which had been a feature of the U.S. equity market for several years, along with the surge in the S&P 500 Index, drove investor sentiment to very high levels. This arguably set the stage for an overdue correction, which we witnessed in February 2018.
A return to volatility
There have been few periods of market upheaval such as were experienced in the first part of 2018. While investors were taken by surprise by the sudden and pronounced market swings, the return to some level of volatility actually marked a resumption of relatively normal market conditions. Having said that, it’s important to distinguish between a good technical correction where excess enthusiasm in the marketplace is being let out, versus a real change in the underlying fundamentals – things like an underperforming economy or weaker corporate earnings. Our view is that the recent market volatility falls into the former category, and the fundamentals remain strong. We’re continuing to see improvements in global economic activity, and we’re seeing corporate earnings expectations continue to rise – and not just because of tax reform.
Consistency is more important than ever
It’s important to keep in mind that when it comes to long-term investing, it’s the destination, not the journey that matters most. If you have a financial goal that you’ve worked out with your financial advisor, and you have a good asset allocation plan to reach it, it’s a question of sticking with your plan rather than become focused on near-term volatility. Bouts of volatility are normal. After all, it’s hard to cross the ocean without hitting an occasional rough patch. You need to focus on the destination.
One final thought. In weathering volatility, it’s the consistency of the return that is essential. Investors who chase higher returns are usually the first to sell when an investment goes through a bad patch, and they therefore don’t tend to benefit from the recovery. More disciplined investors who perhaps panic less or not at all during periods of volatility, tend to have improved long-term results and are more likely to reach their financial goals. Nothing is more important to us than making sure those who have entrusted us to protect and grow their assets are able to do what matters most to them.
Your success is our priority. Talk to your financial advisor about how working with Columbia Threadneedle Investments may help you position your portfolio for consistent, sustainable outcomes, no matter the market conditions.
Sincerely,
Christopher O. Petersen
President, Columbia Funds
The S&P 500 Index, an unmanaged index, measures the performance of 500 widely held, large-capitalization U.S. stocks and is frequently used as a general measure of market performance. Past performance is no guarantee of future results.
Columbia Funds are distributed by Columbia Management Investment Distributors, Inc., member FINRA, and managed by Columbia Management Investment Advisers, LLC.
© 2018 Columbia Management Investment Advisers, LLC. All rights reserved.
Columbia U.S. Treasury Index Fund | Annual Report 2018
Columbia U.S. Treasury Index Fund | Annual Report 2018
Investment objective
Columbia U.S. Treasury Index Fund (the Fund) seeks total return that corresponds to the total return of the FTSE Bond U.S. Treasury Index, before fees and expenses.
Portfolio management
Alan Erickson, CFA
Portfolio Manager
Managed Fund since 2017
| Average annual total returns (%) (for the period ended April 30, 2018) |
| | | Inception | 1 Year | 5 Years | 10 Years |
| Class A | 11/25/02 | -1.35 | 0.35 | 2.43 |
| Class C | Excluding sales charges | 11/25/02 | -2.03 | -0.32 | 1.78 |
| | Including sales charges | | -3.00 | -0.32 | 1.78 |
| Institutional Class | 06/04/91 | -1.20 | 0.53 | 2.65 |
| Institutional 2 Class* | 11/08/12 | -1.20 | 0.51 | 2.65 |
| Institutional 3 Class* | 03/01/17 | -1.27 | 0.51 | 2.64 |
| Class T* | Excluding sales charges | 06/18/12 | -1.53 | 0.26 | 2.30 |
| | Including sales charges | | -3.97 | -0.26 | 2.04 |
| FTSE Bond U.S. Treasury Index | | -1.05 | 0.71 | 2.81 |
Returns for Class C shares are shown with and without the 1.00% contingent deferred sales charge for the first year only. The returns for Class T shares are shown with and without the maximum applicable sales charge of 2.50% per transaction. The Fund’s other classes are not subject to sales charges and have limited eligibility. Effective November 1, 2017, Class R5, Class Y and Class Z shares were renamed Institutional 2 Class, Institutional 3 Class and Institutional Class shares, respectively. Please see the Fund’s prospectus for details. Performance for different share classes will vary based on differences in sales charges and fees associated with each class. All results shown assume reinvestment of distributions during the period. Returns do not reflect the deduction of taxes that a shareholder may pay on Fund distributions or on the redemption of Fund shares. Performance results reflect the effect of any fee waivers or reimbursements of Fund expenses by Columbia Management Investment Advisers, LLC and/or any of its affiliates. Absent these fee waivers or expense reimbursement arrangements, performance results would have been lower.
The performance information shown represents past performance and is not a guarantee of future results. The investment return and principal value of your investment will fluctuate so that your shares, when redeemed, may be worth more or less than their original cost. Current performance may be lower or higher than the performance information shown. You may obtain performance information current to the most recent month-end by contacting your financial intermediary, visiting columbiathreadneedleus.com/investor/ or calling 800.345.6611.
| * | The returns shown for periods prior to the share class inception date (including returns for the Life of the Fund, if shown, which are since Fund inception) include the returns of the Fund’s oldest share class. These returns are adjusted to reflect any higher class-related operating expenses of the newer share classes, as applicable. Please visit columbiathreadneedleus.com/investor/investment-products/mutual-funds/appended-performance for more information. |
The FTSE Bond U.S. Treasury Index is an index composed of all U.S. Treasury notes and bonds with remaining maturities of at least one year and outstanding principal of at least $25 million that are included in the Citi Broad Investment-Grade Bond Index.
Indices are not available for investment, are not professionally managed and do not reflect sales charges, fees, brokerage commissions, taxes or other expenses of investing. Securities in the Fund may not match those in an index.
| 2 | Columbia U.S. Treasury Index Fund | Annual Report 2018 |
Fund at a Glance (continued)
Performance of a hypothetical $10,000 investment (April 30, 2008 — April 30, 2018)
The chart above shows the change in value of a hypothetical $10,000 investment in Class A shares of Columbia U.S. Treasury Index Fund during the stated time period, and does not reflect the deduction of taxes that a shareholder may pay on Fund distributions or on the redemption of Fund shares.
| Portfolio breakdown (%) (at April 30, 2018) |
| Money Market Funds | 0.3 |
| U.S. Treasury Obligations | 99.7 |
| Total | 100.0 |
Percentages indicated are based upon total investments. The Fund’s portfolio composition is subject to change.
| Quality breakdown (%) (at April 30, 2018) |
| AAA rating | 100.0 |
| Total | 100.0 |
Percentages indicated are based upon total fixed income investments (excluding Money Market Funds).
Bond ratings apply to the underlying holdings of the Fund and not the Fund itself and are divided into categories ranging from highest to lowest credit quality, determined by using the middle rating of Moody’s, S&P and Fitch, after dropping the highest and lowest available ratings. When ratings are available from only two rating agencies, the lower rating is used. When a rating is available from only one rating agency, that rating is used. When a bond is not rated by any rating agency, it is designated as “Not rated.” Credit quality ratings assigned by a rating agency are subjective opinions, not statements of fact, and are subject to change, including daily. The ratings assigned by credit rating agencies are but one of the considerations that the Investment Manager and/or Fund’s subadviser incorporates into its credit analysis process, along with such other issuer-specific factors as cash flows, capital structure and leverage ratios, ability to de-leverage (repay) through free cash flow, quality of management, market positioning and access to capital, as well as such security-specific factors as the terms of the security (e.g., interest rate and time to maturity) and the amount and type of any collateral.
Columbia U.S. Treasury Index Fund | Annual Report 2018
| 3 |
Manager Discussion of Fund Performance
At April 30, 2018, approximately 74.9% of the Fund’s shares were owned in the aggregate by affiliated funds-of-funds managed by Columbia Management Investment Advisers, LLC (the Investment Manager). As a result of asset allocation decisions by the Investment Manager, it is possible that the Fund may experience relatively large purchases or redemptions from affiliated funds-of-funds. The Investment Manager seeks to minimize the impact of these transactions by structuring them over a reasonable period of time. The Fund may experience increased expenses as it buys and sells securities as a result of purchases or redemptions by affiliated funds-of-funds.
For the 12-month period that ended April 30, 2018, the Fund’s Class A shares returned -1.35%. The FTSE Bond U.S. Treasury Index returned -1.05% over the same period. The Fund underperformed the benchmark in a period when Treasuries generally traded in a range (between consistent high and low prices for a period of time) until December 2017, when investor sentiment shifted to higher growth and inflation expectations following the passage of federal tax overhaul.
Calm Treasury market gave way to headwinds
Over the past 12 months, U.S. Treasury yield levels were mainly impacted by political and legislative developments in Washington, D.C. Through most of 2017, U.S. interest rates had remained relatively stable, and several measures of market volatility hit historically low levels. However, with the passage of federal tax reform in December 2017, investors began to “price in” stronger economic growth and marginally higher inflation, which subsequently pushed rates higher and out of their previous range. In order to help fund significantly larger anticipated budget deficits stemming from reduced federal taxes, the U.S. Treasury signaled a potential 60% net increase in 2018 issuance compared with 2017. This expected surge in supply, combined with the continuing execution of the U.S. Federal Reserve’s (the Fed) plan to reduce its balance sheet, helped to create significant headwinds for U.S. Treasuries over the full 12-month period.
In addition, the Fed maintained its program of gradually normalizing short-term interest rates by raising the federal funds rate three more times during the period, bringing the total number of 25-basis-point rate hikes since the end of the financial crisis to six. Higher overnight rates, increased supply and Fed forecasts for additional rate hikes made a large impact on the front end of the yield curve, as short- to intermediate-term yields moved higher by 100 basis points or more. However, yields of 30-year Treasuries remained close to 3.0%, moving only 20 basis points higher over the 12-month period. The resulting flattening of the yield curve was typical within a credit tightening cycle. The market perceived that the Fed was acting credibly within its dual mandate of seeking low U.S. unemployment and stable inflation.
At period’s end
It is tempting to state that most of the “bad news” has already priced into the Treasury market. At the close of the reporting period, additional supply had been absorbed, inflation was not accelerating and, in our opinion, the economy did not appear to be in danger of overheating. Geopolitical risks obviously remained but we believe these risks are supportive of U.S. Treasury prices, as U.S. Treasuries have traditionally been viewed as a “safe haven” for investors.
Market risk may affect a single issuer, sector of the economy, industry or the market as a whole. The U.S. government may be unable or unwilling to honor its financial obligations. Securities issued or guaranteed by federal agencies and U.S. government-sponsored instrumentalities may or may not be backed by the full faith and credit of the U.S. government. A rise in interest rates may result in a price decline of fixed-income instruments held by the Fund, negatively impacting its performance and NAV. Falling rates may result in the Fund investing in lower yielding debt instruments, lowering the Fund’s income and yield. These risks may be heightened for longer maturity and duration securities. The Fund’s net value will generally decline when the performance of its targeted index declines. See the Fund’s prospectus for more information on these and other risks.
The views expressed in this report reflect the current views of the respective parties. These views are not guarantees of future performance and involve certain risks, uncertainties and assumptions that are difficult to predict, so actual outcomes and results may differ significantly from the views expressed. These views are subject to change at any time based upon economic, market or other conditions and the respective parties disclaim any responsibility to update such views. These views may not be relied on as investment advice and, because investment decisions for a Columbia fund are based on numerous factors, may not be relied on as an indication of trading intent on behalf of any particular Columbia fund. References to specific securities should not be construed as a recommendation or investment advice.
| 4 | Columbia U.S. Treasury Index Fund | Annual Report 2018 |
Understanding Your Fund’s Expenses
(Unaudited)
As an investor, you incur two types of costs. There are transaction costs, which generally include sales charges on purchases and may include redemption fees. There are also ongoing costs, which generally include management fees, distribution and/or service fees, and other fund expenses. The following information is intended to help you understand your ongoing costs (in dollars) of investing in the Fund and to help you compare these costs with the ongoing costs of investing in other mutual funds.
Analyzing your Fund’s expenses
To illustrate these ongoing costs, we have provided examples and calculated the expenses paid by investors in each share class of the Fund during the period. The actual and hypothetical information in the table is based on an initial investment of $1,000 at the beginning of the period indicated and held for the entire period. Expense information is calculated two ways and each method provides you with different information. The amount listed in the “Actual” column is calculated using the Fund’s actual operating expenses and total return for the period. You may use the Actual information, together with the amount invested, to estimate the expenses that you paid over the period. Simply divide your account value by $1,000 (for example, an $8,600 account value divided by $1,000 = 8.6), then multiply the results by the expenses paid during the period under the “Actual” column. The amount listed in the “Hypothetical” column assumes a 5% annual rate of return before expenses (which is not the Fund’s actual return) and then applies the Fund’s actual expense ratio for the period to the hypothetical return. You should not use the hypothetical account values and expenses to estimate either your actual account balance at the end of the period or the expenses you paid during the period. See “Compare with other funds” below for details on how to use the hypothetical data.
Compare with other funds
Since all mutual funds are required to include the same hypothetical calculations about expenses in shareholder reports, you can use this information to compare the ongoing cost of investing in the Fund with other funds. To do so, compare the hypothetical example with the 5% hypothetical examples that appear in the shareholder reports of other funds. As you compare hypothetical examples of other funds, it is important to note that hypothetical examples are meant to highlight the ongoing costs of investing in a fund only and do not reflect any transaction costs, such as sales charges, or redemption or exchange fees. Therefore, the hypothetical calculations are useful in comparing ongoing costs only, and will not help you determine the relative total costs of owning different funds. If transaction costs were included in these calculations, your costs would be higher.
| November 1, 2017 — April 30, 2018 |
| | Account value at the
beginning of the
period ($) | Account value at the
end of the
period ($) | Expenses paid during
the period ($) | Fund’s annualized
expense ratio (%) |
| | Actual | Hypothetical | Actual | Hypothetical | Actual | Hypothetical | Actual |
| Class A | 1,000.00 | 1,000.00 | 980.50 | 1,023.06 | 1.72 | 1.76 | 0.35 |
| Class C | 1,000.00 | 1,000.00 | 977.10 | 1,019.59 | 5.15 | 5.26 | 1.05 |
| Institutional Class | 1,000.00 | 1,000.00 | 981.20 | 1,023.80 | 0.98 | 1.00 | 0.20 |
| Institutional 2 Class | 1,000.00 | 1,000.00 | 981.20 | 1,023.80 | 0.98 | 1.00 | 0.20 |
| Institutional 3 Class | 1,000.00 | 1,000.00 | 980.50 | 1,023.80 | 0.98 | 1.00 | 0.20 |
| Class T | 1,000.00 | 1,000.00 | 980.00 | 1,022.56 | 2.21 | 2.26 | 0.45 |
Expenses paid during the period are equal to the annualized expense ratio for each class as indicated above, multiplied by the average account value over the period and then multiplied by the number of days in the Fund’s most recent fiscal half year and divided by 365.
Expenses do not include fees and expenses incurred indirectly by the Fund from its investment in underlying funds, including affiliated and non-affiliated pooled investment vehicles, such as mutual funds and exchange-traded funds.
Had Columbia Management Investment Advisers, LLC and/or certain of its affiliates not waived/reimbursed certain fees and expenses, account value at the end of the period would have been reduced.
Columbia U.S. Treasury Index Fund | Annual Report 2018
| 5 |
Portfolio of Investments
April 30, 2018
(Percentages represent value of investments compared to net assets)
Investments in securities
| U.S. Treasury Obligations 99.1% |
| Issuer | Coupon
Rate | | Principal
Amount ($) | Value ($) |
| U.S. Treasury |
| 04/30/2019 | 1.625% | | 9,364,000 | 9,304,318 |
| 07/31/2019 | 0.875% | | 8,847,000 | 8,685,993 |
| 07/31/2019 | 1.375% | | 12,094,000 | 11,948,045 |
| 07/31/2019 | 1.625% | | 9,443,000 | 9,358,131 |
| 08/15/2019 | 0.750% | | 18,101,000 | 17,729,797 |
| 09/30/2019 | 1.375% | | 21,259,000 | 20,955,893 |
| 09/30/2019 | 1.750% | | 9,096,000 | 9,012,986 |
| 10/31/2019 | 1.500% | | 11,122,000 | 10,971,794 |
| 01/31/2020 | 1.250% | | 9,350,000 | 9,158,341 |
| 02/15/2020 | 1.375% | | 15,422,000 | 15,127,937 |
| 02/29/2020 | 1.250% | | 9,015,000 | 8,817,741 |
| 02/29/2020 | 1.375% | | 10,753,000 | 10,542,922 |
| 03/31/2020 | 1.125% | | 4,716,000 | 4,596,715 |
| 03/31/2020 | 1.375% | | 8,644,000 | 8,466,042 |
| 04/30/2020 | 1.375% | | 5,675,000 | 5,551,420 |
| 05/31/2020 | 1.500% | | 921,000 | 902,035 |
| 06/15/2020 | 1.500% | | 6,194,000 | 6,064,344 |
| 07/15/2020 | 1.500% | | 27,385,000 | 26,780,644 |
| 07/31/2020 | 1.625% | | 4,545,000 | 4,455,092 |
| 08/15/2020 | 2.625% | | 5,175,000 | 5,184,247 |
| 08/15/2020 | 8.750% | | 8,400,000 | 9,553,574 |
| 08/31/2020 | 1.375% | | 2,655,000 | 2,584,643 |
| 08/31/2020 | 2.125% | | 1,000,000 | 990,313 |
| 09/15/2020 | 1.375% | | 6,088,000 | 5,924,325 |
| 09/30/2020 | 1.375% | | 16,225,000 | 15,775,411 |
| 09/30/2020 | 2.000% | | 1,935,000 | 1,909,491 |
| 10/31/2020 | 1.375% | | 5,191,000 | 5,040,713 |
| 10/31/2020 | 1.750% | | 2,285,000 | 2,239,309 |
| 11/30/2020 | 1.625% | | 6,670,000 | 6,510,234 |
| 11/30/2020 | 2.000% | | 4,845,000 | 4,774,065 |
| 12/15/2020 | 1.875% | | 5,625,000 | 5,524,544 |
| 12/31/2020 | 1.750% | | 1,375,000 | 1,345,239 |
| 01/31/2021 | 1.375% | | 23,682,000 | 22,911,294 |
| 02/28/2021 | 1.125% | | 29,111,000 | 27,931,810 |
| 03/31/2021 | 1.250% | | 8,594,000 | 8,263,836 |
| 03/31/2021 | 2.250% | | 1,500,000 | 1,484,231 |
| 05/15/2021 | 3.125% | | 2,205,000 | 2,235,495 |
| 05/31/2021 | 1.375% | | 3,598,000 | 3,462,667 |
| 07/31/2021 | 2.250% | | 2,300,000 | 2,269,965 |
| 08/31/2021 | 1.125% | | 11,200,000 | 10,647,098 |
| 08/31/2021 | 2.000% | | 2,650,000 | 2,592,235 |
| 09/30/2021 | 2.125% | | 3,025,000 | 2,969,221 |
| 11/30/2021 | 1.750% | | 4,188,000 | 4,052,697 |
| 11/30/2021 | 1.875% | | 10,229,000 | 9,946,440 |
| 12/31/2021 | 2.125% | | 3,550,000 | 3,478,527 |
| 01/31/2022 | 1.500% | | 7,550,000 | 7,224,387 |
| 01/31/2022 | 1.875% | | 2,200,000 | 2,134,428 |
| 02/15/2022 | 2.000% | | 3,000,000 | 2,923,292 |
| 02/28/2022 | 1.750% | | 9,964,000 | 9,615,505 |
| 03/31/2022 | 1.750% | | 5,679,000 | 5,474,075 |
| 04/30/2022 | 1.750% | | 3,320,000 | 3,196,886 |
| 05/31/2022 | 1.875% | | 5,857,000 | 5,664,513 |
| 06/30/2022 | 1.750% | | 14,618,000 | 14,052,690 |
| 06/30/2022 | 2.125% | | 6,412,000 | 6,258,649 |
| U.S. Treasury Obligations (continued) |
| Issuer | Coupon
Rate | | Principal
Amount ($) | Value ($) |
| 07/31/2022 | 1.875% | | 2,811,000 | 2,712,846 |
| 07/31/2022 | 2.000% | | 2,630,000 | 2,552,128 |
| 08/15/2022 | 1.625% | | 3,725,000 | 3,556,341 |
| 08/31/2022 | 1.875% | | 5,303,000 | 5,113,825 |
| 09/30/2022 | 1.750% | | 9,280,000 | 8,892,177 |
| 09/30/2022 | 1.875% | | 6,120,000 | 5,896,238 |
| 10/31/2022 | 1.875% | | 2,532,000 | 2,437,216 |
| 10/31/2022 | 2.000% | | 4,646,000 | 4,496,016 |
| 11/30/2022 | 2.000% | | 7,409,000 | 7,165,921 |
| 12/31/2022 | 2.125% | | 6,523,000 | 6,337,968 |
| 01/31/2023 | 1.750% | | 3,340,000 | 3,187,696 |
| 01/31/2023 | 2.375% | | 12,214,000 | 11,994,613 |
| 02/28/2023 | 1.500% | | 13,362,000 | 12,588,509 |
| 03/31/2023 | 1.500% | | 9,898,000 | 9,312,978 |
| 04/30/2023 | 1.625% | | 2,236,000 | 2,114,155 |
| 05/15/2023 | 1.750% | | 10,140,000 | 9,641,714 |
| 05/31/2023 | 1.625% | | 11,218,000 | 10,593,938 |
| 08/15/2023 | 2.500% | | 8,850,000 | 8,713,965 |
| 08/31/2023 | 1.375% | | 9,873,000 | 9,169,391 |
| 10/31/2023 | 1.625% | | 4,662,000 | 4,379,002 |
| 11/15/2023 | 2.750% | | 3,757,000 | 3,742,118 |
| 02/15/2024 | 2.750% | | 3,580,000 | 3,561,544 |
| 03/31/2024 | 2.125% | | 5,818,000 | 5,587,963 |
| 05/15/2024 | 2.500% | | 3,886,000 | 3,807,818 |
| 07/31/2024 | 2.125% | | 10,143,000 | 9,710,178 |
| 08/15/2024 | 2.375% | | 8,476,000 | 8,232,679 |
| 11/15/2024 | 2.250% | | 12,973,000 | 12,481,834 |
| 11/30/2024 | 2.125% | | 346,000 | 330,237 |
| 12/31/2024 | 2.250% | | 11,042,000 | 10,613,885 |
| 02/15/2025 | 2.000% | | 7,074,000 | 6,684,574 |
| 05/15/2025 | 2.125% | | 8,307,000 | 7,896,138 |
| 08/15/2025 | 2.000% | | 8,944,000 | 8,410,752 |
| 11/15/2025 | 2.250% | | 10,328,000 | 9,862,773 |
| 02/15/2026 | 1.625% | | 22,845,000 | 20,789,670 |
| 02/15/2026 | 6.000% | | 3,290,000 | 4,000,198 |
| 08/15/2026 | 1.500% | | 14,343,000 | 12,838,829 |
| 11/15/2026 | 2.000% | | 10,471,000 | 9,735,974 |
| 02/15/2027 | 2.250% | | 3,189,000 | 3,020,436 |
| 05/15/2027 | 2.375% | | 4,243,000 | 4,055,653 |
| 08/15/2027 | 2.250% | | 7,202,000 | 6,801,625 |
| 11/15/2027 | 2.250% | | 14,704,000 | 13,865,412 |
| 02/15/2028 | 2.750% | | 1,985,000 | 1,953,681 |
| 11/15/2028 | 5.250% | | 550,000 | 664,548 |
| 02/15/2029 | 5.250% | | 1,357,000 | 1,645,353 |
| 05/15/2030 | 6.250% | | 1,800,000 | 2,398,700 |
| 02/15/2031 | 5.375% | | 1,250,000 | 1,570,969 |
| 02/15/2036 | 4.500% | | 3,680,000 | 4,455,151 |
| 02/15/2039 | 3.500% | | 7,599,000 | 8,173,123 |
| 11/15/2039 | 4.375% | | 2,197,000 | 2,664,755 |
| 05/15/2040 | 4.375% | | 2,173,000 | 2,638,555 |
| 11/15/2040 | 4.250% | | 3,693,000 | 4,415,260 |
| 02/15/2041 | 4.750% | | 1,113,000 | 1,423,330 |
| 05/15/2041 | 4.375% | | 3,558,000 | 4,335,233 |
| 08/15/2041 | 3.750% | | 2,049,000 | 2,284,416 |
| 02/15/2042 | 3.125% | | 568,000 | 574,041 |
The accompanying Notes to Financial Statements are an integral part of this statement.
| 6 | Columbia U.S. Treasury Index Fund | Annual Report 2018 |
Portfolio of Investments (continued)
April 30, 2018
| U.S. Treasury Obligations (continued) |
| Issuer | Coupon
Rate | | Principal
Amount ($) | Value ($) |
| 02/15/2043 | 3.125% | | 10,652,000 | 10,740,459 |
| 05/15/2043 | 2.875% | | 9,632,000 | 9,287,286 |
| 08/15/2043 | 3.625% | | 2,570,000 | 2,814,641 |
| 11/15/2043 | 3.750% | | 5,367,000 | 5,997,618 |
| 02/15/2044 | 3.625% | | 3,185,000 | 3,490,110 |
| 05/15/2044 | 3.375% | | 3,305,000 | 3,475,228 |
| 08/15/2044 | 3.125% | | 3,062,000 | 3,082,733 |
| 11/15/2044 | 3.000% | | 9,765,000 | 9,607,543 |
| 02/15/2045 | 2.500% | | 10,383,000 | 9,261,851 |
| 05/15/2045 | 3.000% | | 4,084,000 | 4,016,129 |
| 08/15/2045 | 2.875% | | 5,095,000 | 4,889,676 |
| 11/15/2045 | 3.000% | | 2,500,000 | 2,457,400 |
| 02/15/2046 | 2.500% | | 5,872,000 | 5,219,571 |
| 08/15/2046 | 2.250% | | 8,752,000 | 7,358,951 |
| 11/15/2046 | 2.875% | | 5,014,000 | 4,802,787 |
| 02/15/2047 | 3.000% | | 4,515,000 | 4,433,223 |
| 05/15/2047 | 3.000% | | 4,920,000 | 4,829,271 |
| 08/15/2047 | 2.750% | | 9,717,000 | 9,067,880 |
| U.S. Treasury Obligations (continued) |
| Issuer | Coupon
Rate | | Principal
Amount ($) | Value ($) |
| 11/15/2047 | 2.750% | | 2,373,000 | 2,214,093 |
Total U.S. Treasury Obligations
(Cost $888,833,515) | 867,706,731 |
| Money Market Funds 0.3% |
| | Shares | Value ($) |
| Columbia Short-Term Cash Fund, 1.889%(a),(b) | 2,439,997 | 2,439,753 |
Total Money Market Funds
(Cost $2,439,923) | 2,439,753 |
Total Investments in Securities
(Cost: $891,273,438) | 870,146,484 |
| Other Assets & Liabilities, Net | | 5,077,235 |
| Net Assets | 875,223,719 |
Notes to Portfolio of Investments
| (a) | The rate shown is the seven-day current annualized yield at April 30, 2018. |
| (b) | As defined in the Investment Company Act of 1940, an affiliated company is one in which the Fund owns 5% or more of the company’s outstanding voting securities, or a company which is under common ownership or control with the Fund. Holdings and transactions in these affiliated companies during the year ended April 30, 2018 are as follows: |
| Issuer | Beginning
shares | Shares
purchased | Shares
sold | Ending
shares | Realized gain
(loss) —
affiliated
issuers ($) | Net change in
unrealized
appreciation
(depreciation) —
affiliated
issuers ($) | Dividends —
affiliated
issuers ($) | Value —
affiliated
issuers
at end of
period ($) |
| Columbia Short-Term Cash Fund, 1.889% |
| | 4,962,263 | 69,844,974 | (72,367,240) | 2,439,997 | 180 | (259) | 35,171 | 2,439,753 |
Fair value measurements
The Fund categorizes its fair value measurements according to a three-level hierarchy that maximizes the use of observable inputs and minimizes the use of unobservable inputs by prioritizing that the most observable input be used when available. Observable inputs are those that market participants would use in pricing an investment based on market data obtained from sources independent of the reporting entity. Unobservable inputs are those that reflect the Fund’s assumptions about the information market participants would use in pricing an investment. An investment’s level within the fair value hierarchy is based on the lowest level of any input that is deemed significant to the asset’s or liability’s fair value measurement. The input levels are not necessarily an indication of the risk or liquidity associated with investments at that level. For example, certain U.S. government securities are generally high quality and liquid, however, they are reflected as Level 2 because the inputs used to determine fair value may not always be quoted prices in an active market.
Fair value inputs are summarized in the three broad levels listed below:
| ■ | Level 1 — Valuations based on quoted prices for investments in active markets that the Fund has the ability to access at the measurement date. Valuation adjustments are not applied to Level 1 investments. |
| ■ | Level 2 — Valuations based on other significant observable inputs (including quoted prices for similar securities, interest rates, prepayment speeds, credit risks, etc.). |
| ■ | Level 3 — Valuations based on significant unobservable inputs (including the Fund’s own assumptions and judgment in determining the fair value of investments). |
Inputs that are used in determining fair value of an investment may include price information, credit data, volatility statistics, and other factors. These inputs can be either observable or unobservable. The availability of observable inputs can vary between investments, and is affected by various factors such as the type of investment, and the volume and level of activity for that investment or similar investments in the marketplace. The inputs will be considered by the Investment Manager, along with any other relevant factors in the calculation of an investment’s fair value. The Fund uses prices and inputs that are current as of the measurement date, which may include periods of market dislocations. During these periods, the availability of prices and inputs may be reduced for many investments. This condition could cause an investment to be reclassified between the various levels within the hierarchy.
Certain investments that have been measured at fair value using the net asset value (NAV) per share (or its equivalent) are not categorized in the fair value hierarchy. The fair value amounts presented in the table are intended to reconcile the fair value hierarchy to the amounts presented in the Portfolio of Investments. The Columbia Short-Term Cash Fund seeks to provide shareholders with maximum current income consistent with liquidity and stability of principal. Columbia Short-Term Cash Fund prices its shares with a floating NAV and no longer seeks to maintain a stable NAV.
The accompanying Notes to Financial Statements are an integral part of this statement.
Columbia U.S. Treasury Index Fund | Annual Report 2018
| 7 |
Portfolio of Investments (continued)
April 30, 2018
Fair value measurements (continued)
Investments falling into the Level 3 category are primarily supported by quoted prices from brokers and dealers participating in the market for those investments. However, these may be classified as Level 3 investments due to lack of market transparency and corroboration to support these quoted prices. Additionally, valuation models may be used as the pricing source for any remaining investments classified as Level 3. These models may rely on one or more significant unobservable inputs and/or significant assumptions by the Investment Manager. Inputs used in valuations may include, but are not limited to, financial statement analysis, capital account balances, discount rates and estimated cash flows, and comparable company data.
Under the direction of the Fund’s Board of Trustees (the Board), the Investment Manager’s Valuation Committee (the Committee) is responsible for overseeing the valuation procedures approved by the Board. The Committee consists of voting and non-voting members from various groups within the Investment Manager’s organization, including operations and accounting, trading and investments, compliance, risk management and legal.
The Committee meets at least monthly to review and approve valuation matters, which may include a description of specific valuation determinations, data regarding pricing information received from approved pricing vendors and brokers and the results of Board-approved valuation control policies and procedures (the Policies). The Policies address, among other things, instances when market quotations are or are not readily available, including recommendations of third party pricing vendors and a determination of appropriate pricing methodologies; events that require specific valuation determinations and assessment of fair value techniques; securities with a potential for stale pricing, including those that are illiquid, restricted, or in default; and the effectiveness of third party pricing vendors, including periodic reviews of vendors. The Committee meets more frequently, as needed, to discuss additional valuation matters, which may include the need to review back-testing results, review time-sensitive information or approve related valuation actions. The Committee reports to the Board, with members of the Committee meeting with the Board at each of its regularly scheduled meetings to discuss valuation matters and actions during the period, similar to those described earlier.
For investments categorized as Level 3, the Committee monitors information similar to that described above, which may include: (i) data specific to the issuer or comparable issuers, (ii) general market or specific sector news and (iii) quoted prices and specific or similar security transactions. The Committee considers this data and any changes from prior periods in order to assess the reasonableness of observable and unobservable inputs, any assumptions or internal models used to value those securities and changes in fair value. This data is also used to corroborate, when available, information received from approved pricing vendors and brokers. Various factors impact the frequency of monitoring this information (which may occur as often as daily). However, the Committee may determine that changes to inputs, assumptions and models are not required as a result of the monitoring procedures performed.
The following table is a summary of the inputs used to value the Fund’s investments at April 30, 2018:
| | Level 1
quoted prices
in active
markets for
identical
assets ($) | Level 2
other
significant
observable
inputs ($) | Level 3
significant
unobservable
inputs ($) | Investments
measured at
net asset
value ($) | Total ($) |
| Investments in Securities | | | | | |
| U.S. Treasury Obligations | 867,706,731 | — | — | — | 867,706,731 |
| Money Market Funds | — | — | — | 2,439,753 | 2,439,753 |
| Total Investments in Securities | 867,706,731 | — | — | 2,439,753 | 870,146,484 |
See the Portfolio of Investments for all investment classifications not indicated in the table.
There were no transfers of financial assets between levels during the period.
The accompanying Notes to Financial Statements are an integral part of this statement.
| 8 | Columbia U.S. Treasury Index Fund | Annual Report 2018 |
Statement of Assets and Liabilities
April 30, 2018
| Assets | |
| Investments in securities, at value | |
| Unaffiliated issuers (cost $888,833,515) | $867,706,731 |
| Affiliated issuers (cost $2,439,923) | 2,439,753 |
| Receivable for: | |
| Investments sold | 10,566,761 |
| Capital shares sold | 1,532,472 |
| Dividends | 2,247 |
| Interest | 4,724,601 |
| Expense reimbursement due from Investment Manager | 14,599 |
| Trustees’ deferred compensation plan | 66,609 |
| Other assets | 721 |
| Total assets | 887,054,494 |
| Liabilities | |
| Payable for: | |
| Investments purchased | 10,212,605 |
| Capital shares purchased | 150,579 |
| Distributions to shareholders | 1,371,153 |
| Management services fees | 28,701 |
| Distribution and/or service fees | 857 |
| Other expenses | 271 |
| Trustees’ deferred compensation plan | 66,609 |
| Total liabilities | 11,830,775 |
| Net assets applicable to outstanding capital stock | $875,223,719 |
| Represented by | |
| Paid in capital | 900,729,257 |
| Excess of distributions over net investment income | (167,768) |
| Accumulated net realized loss | (4,210,816) |
| Unrealized appreciation (depreciation) on: | |
| Investments - unaffiliated issuers | (21,126,784) |
| Investments - affiliated issuers | (170) |
| Total - representing net assets applicable to outstanding capital stock | $875,223,719 |
The accompanying Notes to Financial Statements are an integral part of this statement.
Columbia U.S. Treasury Index Fund | Annual Report 2018
| 9 |
Statement of Assets and Liabilities (continued)
April 30, 2018
| Class A | |
| Net assets | $45,073,551 |
| Shares outstanding | 4,193,749 |
| Net asset value per share | $10.75 |
| Class C | |
| Net assets | $4,142,935 |
| Shares outstanding | 385,476 |
| Net asset value per share | $10.75 |
| Institutional Class | |
| Net assets | $392,889,385 |
| Shares outstanding | 36,548,348 |
| Net asset value per share | $10.75 |
| Institutional 2 Class | |
| Net assets | $30,709,615 |
| Shares outstanding | 2,862,560 |
| Net asset value per share | $10.73 |
| Institutional 3 Class | |
| Net assets | $401,767,932 |
| Shares outstanding | 37,155,915 |
| Net asset value per share | $10.81 |
| Class T | |
| Net assets | $640,301 |
| Shares outstanding | 59,595 |
| Net asset value per share | $10.74 |
| Maximum sales charge | 2.50% |
| Maximum offering price per share (calculated by dividing the net asset value per share by 1.0 minus the maximum sales charge per transaction for Class T shares) | $11.02 |
The accompanying Notes to Financial Statements are an integral part of this statement.
| 10 | Columbia U.S. Treasury Index Fund | Annual Report 2018 |
Statement of Operations
Year Ended April 30, 2018
| Net investment income | |
| Income: | |
| Dividends — affiliated issuers | $35,171 |
| Interest | 13,494,669 |
| Total income | 13,529,840 |
| Expenses: | |
| Management services fees | 2,926,477 |
| Distribution and/or service fees | |
| Class A | 122,031 |
| Class B | 30 |
| Class C | 54,192 |
| Class T | 2,620 |
| Compensation of board members | 29,357 |
| Other | 4,724 |
| Total expenses | 3,139,431 |
| Fees waived or expenses reimbursed by Investment Manager and its affiliates | (1,497,321) |
| Fees waived by distributor | |
| Class A | (48,812) |
| Class B | (3) |
| Class C | (8,129) |
| Expense reduction | (780) |
| Total net expenses | 1,584,386 |
| Net investment income | 11,945,454 |
| Realized and unrealized gain (loss) — net | |
| Net realized gain (loss) on: | |
| Investments — unaffiliated issuers | (1,674,142) |
| Investments — affiliated issuers | 180 |
| Net realized loss | (1,673,962) |
| Net change in unrealized appreciation (depreciation) on: | |
| Investments — unaffiliated issuers | (19,229,797) |
| Investments — affiliated issuers | (259) |
| Net change in unrealized appreciation (depreciation) | (19,230,056) |
| Net realized and unrealized loss | (20,904,018) |
| Net decrease in net assets resulting from operations | $(8,958,564) |
The accompanying Notes to Financial Statements are an integral part of this statement.
Columbia U.S. Treasury Index Fund | Annual Report 2018
| 11 |
Statement of Changes in Net Assets
| | Year Ended
April 30, 2018 | Year Ended
April 30, 2017 (a) |
| Operations | | |
| Net investment income | $11,945,454 | $10,756,308 |
| Net realized loss | (1,673,962) | (588,563) |
| Net change in unrealized appreciation (depreciation) | (19,230,056) | (18,664,198) |
| Net decrease in net assets resulting from operations | (8,958,564) | (8,496,453) |
| Distributions to shareholders | | |
| Net investment income | | |
| Class A | (720,758) | (614,613) |
| Class B | (18) | (2,183) |
| Class C | (41,678) | (53,021) |
| Class I | — | (3,359,934) |
| Institutional Class | (6,320,441) | (4,463,607) |
| Institutional 2 Class | (458,453) | (252,968) |
| Institutional 3 Class | (4,314,937) | (389,283) |
| Class T | (14,159) | (1,639,877) |
| Net realized gains | | |
| Class A | — | (142,080) |
| Class B | — | (1,298) |
| Class C | — | (30,129) |
| Class I | — | (728,815) |
| Institutional Class | — | (886,366) |
| Institutional 2 Class | — | (70,784) |
| Class T | — | (509,041) |
| Total distributions to shareholders | (11,870,444) | (13,143,999) |
| Increase in net assets from capital stock activity | 181,178,272 | 4,458,877 |
| Total increase (decrease) in net assets | 160,349,264 | (17,181,575) |
| Net assets at beginning of year | 714,874,455 | 732,056,030 |
| Net assets at end of year | $875,223,719 | $714,874,455 |
| Excess of distributions over net investment income | $(167,768) | $(242,778) |
| (a) | Institutional 3 Class shares are based on operations from March 1, 2017 (commencement of operations) through the stated period end. |
The accompanying Notes to Financial Statements are an integral part of this statement.
| 12 | Columbia U.S. Treasury Index Fund | Annual Report 2018 |
Statement of Changes in Net Assets (continued)
| | Year Ended | Year Ended |
| | April 30, 2018 | April 30, 2017 (a) |
| | Shares | Dollars ($) | Shares | Dollars ($) |
| Capital stock activity |
| Class A | | | | |
| Subscriptions | 1,596,036 | 17,578,648 | 3,863,235 | 43,355,098 |
| Distributions reinvested | 29,486 | 324,150 | 44,549 | 498,648 |
| Redemptions | (1,799,809) | (19,759,588) | (3,234,468) | (36,102,518) |
| Net increase (decrease) | (174,287) | (1,856,790) | 673,316 | 7,751,228 |
| Class B | | | | |
| Subscriptions | — | — | 49 | 554 |
| Distributions reinvested | — | — | 243 | 2,709 |
| Redemptions | (1,043) | (11,579) | (62,848) | (698,957) |
| Net decrease | (1,043) | (11,579) | (62,556) | (695,694) |
| Class C | | | | |
| Subscriptions | 54,103 | 600,168 | 220,702 | 2,508,461 |
| Distributions reinvested | 3,667 | 40,316 | 7,299 | 81,345 |
| Redemptions | (299,567) | (3,305,094) | (473,184) | (5,240,743) |
| Net decrease | (241,797) | (2,664,610) | (245,183) | (2,650,937) |
| Class I | | | | |
| Subscriptions | — | — | 11,378,487 | 128,340,323 |
| Distributions reinvested | — | — | 341,612 | 3,830,880 |
| Redemptions | — | — | (27,220,089) | (300,370,806) |
| Net decrease | — | — | (15,499,990) | (168,199,603) |
| Institutional Class | | | | |
| Subscriptions | 8,157,172 | 90,001,075 | 16,430,198 | 183,419,304 |
| Distributions reinvested | 506,632 | 5,564,004 | 391,515 | 4,377,733 |
| Redemptions | (6,514,138) | (71,988,194) | (6,644,450) | (74,669,741) |
| Net increase | 2,149,666 | 23,576,885 | 10,177,263 | 113,127,296 |
| Institutional 2 Class | | | | |
| Subscriptions | 1,267,931 | 13,894,932 | 2,424,536 | 27,644,692 |
| Distributions reinvested | 5,577 | 61,149 | 4,975 | 55,477 |
| Redemptions | (660,841) | (7,215,644) | (524,698) | (5,828,543) |
| Net increase | 612,667 | 6,740,437 | 1,904,813 | 21,871,626 |
| Institutional 3 Class | | | | |
| Subscriptions | 18,967,087 | 206,143,368 | 23,401,826 | 259,058,736 |
| Distributions reinvested | 391,100 | 4,314,719 | 35,010 | 389,258 |
| Redemptions | (4,877,119) | (53,811,468) | (761,989) | (8,469,233) |
| Net increase | 14,481,068 | 156,646,619 | 22,674,847 | 250,978,761 |
| Class T | | | | |
| Subscriptions | 6 | 63 | 1,205,525 | 13,703,764 |
| Distributions reinvested | 1,273 | 14,020 | 191,167 | 2,148,760 |
| Redemptions | (114,693) | (1,266,773) | (21,101,986) | (233,576,324) |
| Net decrease | (113,414) | (1,252,690) | (19,705,294) | (217,723,800) |
| Total net increase (decrease) | 16,712,860 | 181,178,272 | (82,784) | 4,458,877 |
| (a) | Institutional 3 Class shares are based on operations from March 1, 2017 (commencement of operations) through the stated period end. |
The accompanying Notes to Financial Statements are an integral part of this statement.
Columbia U.S. Treasury Index Fund | Annual Report 2018
| 13 |
The following table is intended to help you understand the Fund’s financial performance. Certain information reflects financial results for a single share of a class held for the periods shown. Per share net investment income (loss) amounts are calculated based on average shares outstanding during the period. Total return assumes reinvestment of all dividends and distributions, if any. Total return does not reflect payment of sales charges, if any. Total return and portfolio turnover are not annualized for periods of less than one year. The portfolio turnover rate is calculated without regard to purchase and sales transactions of short-term instruments and certain derivatives, if any. If such transactions were included, the Fund’s portfolio turnover rate may be higher.
| | Net asset value,
beginning of
period | Net
investment
income | Net
realized
and
unrealized
gain (loss) | Total from
investment
operations | Distributions
from net
investment
income | Distributions
from net
realized
gains |
| Class A |
| Year Ended 4/30/2018 | $11.06 | 0.16 | (0.31) | (0.15) | (0.16) | — |
| Year Ended 4/30/2017 | $11.34 | 0.14 | (0.25) | (0.11) | (0.14) | (0.03) |
| Year Ended 4/30/2016 | $11.28 | 0.14 | 0.12 | 0.26 | (0.14) | (0.06) |
| Year Ended 4/30/2015 | $11.03 | 0.15 | 0.26 | 0.41 | (0.15) | (0.01) |
| Year Ended 4/30/2014 | $11.52 | 0.14 | (0.36) | (0.22) | (0.15) | (0.12) |
| Class C |
| Year Ended 4/30/2018 | $11.06 | 0.09 | (0.31) | (0.22) | (0.09) | — |
| Year Ended 4/30/2017 | $11.34 | 0.06 | (0.24) | (0.18) | (0.07) | (0.03) |
| Year Ended 4/30/2016 | $11.28 | 0.07 | 0.12 | 0.19 | (0.07) | (0.06) |
| Year Ended 4/30/2015 | $11.02 | 0.07 | 0.27 | 0.34 | (0.07) | (0.01) |
| Year Ended 4/30/2014 | $11.52 | 0.07 | (0.37) | (0.30) | (0.08) | (0.12) |
| Institutional Class |
| Year Ended 4/30/2018 | $11.06 | 0.18 | (0.31) | (0.13) | (0.18) | — |
| Year Ended 4/30/2017 | $11.34 | 0.16 | (0.25) | (0.09) | (0.16) | (0.03) |
| Year Ended 4/30/2016 | $11.28 | 0.16 | 0.12 | 0.28 | (0.16) | (0.06) |
| Year Ended 4/30/2015 | $11.02 | 0.17 | 0.27 | 0.44 | (0.17) | (0.01) |
| Year Ended 4/30/2014 | $11.52 | 0.17 | (0.38) | (0.21) | (0.17) | (0.12) |
| Institutional 2 Class |
| Year Ended 4/30/2018 | $11.04 | 0.18 | (0.31) | (0.13) | (0.18) | — |
| Year Ended 4/30/2017 | $11.32 | 0.16 | (0.25) | (0.09) | (0.16) | (0.03) |
| Year Ended 4/30/2016 | $11.26 | 0.16 | 0.12 | 0.28 | (0.16) | (0.06) |
| Year Ended 4/30/2015 | $11.01 | 0.17 | 0.26 | 0.43 | (0.17) | (0.01) |
| Year Ended 4/30/2014 | $11.51 | 0.17 | (0.38) | (0.21) | (0.17) | (0.12) |
| Institutional 3 Class |
| Year Ended 4/30/2018 | $11.13 | 0.18 | (0.32) | (0.14) | (0.18) | — |
| Year Ended 4/30/2017(d) | $11.02 | 0.03 | 0.11 (e) | 0.14 | (0.03) | — |
The accompanying Notes to Financial Statements are an integral part of this statement.
| 14 | Columbia U.S. Treasury Index Fund | Annual Report 2018 |
Total
distributions to
shareholders | Net
asset
value,
end of
period | Total
return | Total gross
expense
ratio to
average
net assets(a) | Total net
expense
ratio to
average
net assets(a),(b) | Net investment
income
ratio to
average
net assets | Portfolio
turnover | Net
assets,
end of
period
(000’s) |
| |
| (0.16) | $10.75 | (1.35%) | 0.65% | 0.35% (c) | 1.49% | 27% | $45,074 |
| (0.17) | $11.06 | (0.94%) | 0.65% | 0.35% (c) | 1.27% | 50% | $48,312 |
| (0.20) | $11.34 | 2.38% | 0.66% | 0.35% (c) | 1.30% | 91% | $41,893 |
| (0.16) | $11.28 | 3.70% | 0.66% | 0.38% (c) | 1.33% | 65% | $31,946 |
| (0.27) | $11.03 | (1.92%) | 0.66% | 0.45% (c) | 1.24% | 76% | $22,163 |
| |
| (0.09) | $10.75 | (2.03%) | 1.41% | 1.05% (c) | 0.78% | 27% | $4,143 |
| (0.10) | $11.06 | (1.63%) | 1.40% | 1.05% (c) | 0.56% | 50% | $6,938 |
| (0.13) | $11.34 | 1.67% | 1.41% | 1.05% (c) | 0.59% | 91% | $9,892 |
| (0.08) | $11.28 | 3.11% | 1.41% | 1.05% (c) | 0.66% | 65% | $7,124 |
| (0.20) | $11.02 | (2.59%) | 1.41% | 1.05% (c) | 0.64% | 76% | $6,417 |
| |
| (0.18) | $10.75 | (1.20%) | 0.40% | 0.20% (c) | 1.64% | 27% | $392,889 |
| (0.19) | $11.06 | (0.79%) | 0.40% | 0.20% (c) | 1.42% | 50% | $380,519 |
| (0.22) | $11.34 | 2.54% | 0.41% | 0.20% (c) | 1.44% | 91% | $274,641 |
| (0.18) | $11.28 | 3.98% | 0.41% | 0.20% (c) | 1.51% | 65% | $247,434 |
| (0.29) | $11.02 | (1.76%) | 0.41% | 0.20% (c) | 1.49% | 76% | $194,297 |
| |
| (0.18) | $10.73 | (1.20%) | 0.40% | 0.20% | 1.65% | 27% | $30,710 |
| (0.19) | $11.04 | (0.80%) | 0.41% | 0.20% | 1.45% | 50% | $24,839 |
| (0.22) | $11.32 | 2.54% | 0.41% | 0.20% | 1.45% | 91% | $3,906 |
| (0.18) | $11.26 | 3.89% | 0.41% | 0.20% | 1.50% | 65% | $2,600 |
| (0.29) | $11.01 | (1.76%) | 0.41% | 0.20% | 1.52% | 76% | $1,431 |
| |
| (0.18) | $10.81 | (1.27%) | 0.40% | 0.20% | 1.66% | 27% | $401,768 |
| (0.03) | $11.13 | 1.24% | 0.40% (f) | 0.20% (f) | 1.52% (f) | 50% | $252,341 |
Columbia U.S. Treasury Index Fund | Annual Report 2018
| 15 |
Financial Highlights (continued)
| | Net asset value,
beginning of
period | Net
investment
income | Net
realized
and
unrealized
gain (loss) | Total from
investment
operations | Distributions
from net
investment
income | Distributions
from net
realized
gains |
| Class T |
| Year Ended 4/30/2018 | $11.06 | 0.15 | (0.32) | (0.17) | (0.15) | — |
| Year Ended 4/30/2017 | $11.33 | 0.13 | (0.24) | (0.11) | (0.13) | (0.03) |
| Year Ended 4/30/2016 | $11.27 | 0.13 | 0.12 | 0.25 | (0.13) | (0.06) |
| Year Ended 4/30/2015 | $11.02 | 0.13 | 0.27 | 0.40 | (0.14) | (0.01) |
| Year Ended 4/30/2014 | $11.52 | 0.14 | (0.37) | (0.23) | (0.15) | (0.12) |
| Notes to Financial Highlights |
| (a) | In addition to the fees and expenses that the Fund bears directly, the Fund indirectly bears a pro rata share of the fees and expenses of any other funds in which it invests. Such indirect expenses are not included in the Fund’s reported expense ratios. |
| (b) | Total net expenses include the impact of certain fee waivers/expense reimbursements made by the Investment Manager and certain of its affiliates, if applicable. |
| (c) | The benefits derived from expense reductions had an impact of less than 0.01%. |
| (d) | Institutional 3 Class shares commenced operations on March 1, 2017. Per share data and total return reflect activity from that date. |
| (e) | Calculation of the net gain (loss) per share (both realized and unrealized) does not correlate to the aggregate realized and unrealized gain (loss) presented in the Statement of Operations due to the timing of subscriptions and redemptions of Fund shares in relation to fluctuations in the market value of the portfolio. |
| (f) | Annualized. |
The accompanying Notes to Financial Statements are an integral part of this statement.
| 16 | Columbia U.S. Treasury Index Fund | Annual Report 2018 |
Total
distributions to
shareholders | Net
asset
value,
end of
period | Total
return | Total gross
expense
ratio to
average
net assets(a) | Total net
expense
ratio to
average
net assets(a),(b) | Net investment
income
ratio to
average
net assets | Portfolio
turnover | Net
assets,
end of
period
(000’s) |
| |
| (0.15) | $10.74 | (1.53%) | 0.66% | 0.45% (c) | 1.37% | 27% | $640 |
| (0.16) | $11.06 | (0.95%) | 0.65% | 0.45% (c) | 1.15% | 50% | $1,913 |
| (0.19) | $11.33 | 2.28% | 0.65% | 0.45% (c) | 1.17% | 91% | $225,255 |
| (0.15) | $11.27 | 3.63% | 0.65% | 0.45% (c) | 1.20% | 65% | $74,873 |
| (0.27) | $11.02 | (2.00%) | 0.66% | 0.45% (c) | 1.24% | 76% | $12,167 |
Columbia U.S. Treasury Index Fund | Annual Report 2018
| 17 |
Notes to Financial Statements
April 30, 2018
Note 1. Organization
Columbia U.S. Treasury Index Fund (the Fund), a series of Columbia Funds Series Trust I (the Trust), is a diversified fund. The Trust is registered under the Investment Company Act of 1940, as amended (the 1940 Act), as an open-end management investment company organized as a Massachusetts business trust.
Fund shares
The Trust may issue an unlimited number of shares (without par value). Although all share classes generally have identical voting, dividend and liquidation rights, each share class votes separately when required by the Trust’s organizational documents or by law. Different share classes pay different distribution amounts to the extent the expenses of such share classes differ, and distributions in liquidation will be proportional to the net asset value of each share class. Each share class has its own expense and sales charge structure. The Fund offers each of the share classes identified below.
Class A shares are not subject to any front-end sales charge or contingent deferred sales charge (CDSC).
Class B shares of the Fund are no longer offered for sale. When available, Class B shares were subject to a maximum CDSC of 5.00% based upon the holding period after purchase. Effective July 17, 2017, Class B shares were automatically converted to Class A shares without a CDSC. On August 4, 2017, the capital owned by Columbia Management Investment Advisers, LLC in Class B shares was redeemed without a CDSC.
Class C shares are subject to a 1.00% CDSC on shares redeemed within 12 months after purchase.
Institutional Class shares are not subject to sales charges and are generally available only to eligible investors, which are subject to different investment minimums as described in the Fund’s prospectus. Prior to November 1, 2017, Institutional Class shares were known as Class Z shares.
Institutional 2 Class shares are not subject to sales charges and are generally available only to investors purchasing through authorized investment professionals and omnibus retirement plans as described in the Fund’s prospectus. Prior to November 1, 2017, Institutional 2 Class shares were known as Class R5 shares.
Institutional 3 Class shares are not subject to sales charges and are available to institutional and certain other investors as described in the Fund’s prospectus. Prior to November 1, 2017, Institutional 3 Class shares were known as Class Y shares.
Class T shares are subject to a maximum front-end sales charge of 2.50% per transaction and must be purchased through financial intermediaries that, by written agreement with Columbia Management Investment Distributors, Inc., are specifically authorized to sell Class T shares.
Note 2. Summary of significant accounting policies
Basis of preparation
The Fund is an investment company that applies the accounting and reporting guidance in the Financial Accounting Standards Board (FASB) Accounting Standards Codification Topic 946, Financial Services - Investment Companies (ASC 946). The financial statements are prepared in accordance with U.S. generally accepted accounting principles (GAAP), which requires management to make certain estimates and assumptions that affect the reported amounts of assets and liabilities, the disclosure of contingent assets and liabilities at the date of the financial statements and the reported amounts of income and expenses during the reporting period. Actual results could differ from those estimates.
The following is a summary of significant accounting policies followed by the Fund in the preparation of its financial statements.
Security valuation
Debt securities generally are valued by pricing services approved by the Board of Trustees based upon market transactions for normal, institutional-size trading units of similar securities. The services may use various pricing techniques that take into account, as applicable, factors such as yield, quality, coupon rate, maturity, type of issue, trading characteristics and other data, as well as approved independent broker-dealer quotes. Debt securities for which quotations are not readily available or
| 18 | Columbia U.S. Treasury Index Fund | Annual Report 2018 |
Notes to Financial Statements (continued)
April 30, 2018
not believed to be reflective of market value may also be valued based upon a bid quote from an approved independent broker-dealer. Debt securities maturing in 60 days or less are valued primarily at amortized cost value, unless this method results in a valuation that management believes does not approximate market value.
Investments in open-end investment companies, including money market funds, are valued at their latest net asset value.
Investments for which market quotations are not readily available, or that have quotations which management believes are not reflective of market value or reliable, are valued at fair value as determined in good faith under procedures approved by and under the general supervision of the Board of Trustees. If a security or class of securities (such as foreign securities) is valued at fair value, such value is likely to be different from the quoted or published price for the security.
The determination of fair value often requires significant judgment. To determine fair value, management may use assumptions including but not limited to future cash flows and estimated risk premiums. Multiple inputs from various sources may be used to determine fair value.
GAAP requires disclosure regarding the inputs and valuation techniques used to measure fair value and any changes in valuation inputs or techniques. In addition, investments shall be disclosed by major category. This information is disclosed following the Fund’s Portfolio of Investments.
Security transactions
Security transactions are accounted for on the trade date. Cost is determined and gains (losses) are based upon the specific identification method for both financial statement and federal income tax purposes.
Income recognition
Interest income is recorded on an accrual basis. Market premiums and discounts, including original issue discounts, are amortized and accreted, respectively, over the expected life of the security on all debt securities, unless otherwise noted.
The Fund may place a debt security on non-accrual status and reduce related interest income when it becomes probable that the interest will not be collected and the amount of uncollectible interest can be reasonably estimated. A defaulted debt security is removed from non-accrual status when the issuer resumes interest payments or when collectibility of interest is reasonably assured.
Dividend income is recorded on the ex-dividend date.
Expenses
General expenses of the Trust are allocated to the Fund and other funds of the Trust based upon relative net assets or other expense allocation methodologies determined by the nature of the expense. Expenses directly attributable to the Fund are charged to the Fund. Expenses directly attributable to a specific class of shares are charged to that share class.
Determination of class net asset value
All income, expenses (other than class-specific expenses, which are charged to that share class, as shown in the Statement of Operations) and realized and unrealized gains (losses) are allocated to each class of the Fund on a daily basis, based on the relative net assets of each class, for purposes of determining the net asset value of each class.
Federal income tax status
The Fund intends to qualify each year as a regulated investment company under Subchapter M of the Internal Revenue Code, as amended, and will distribute substantially all of its investment company taxable income and net capital gain, if any, for its tax year, and as such will not be subject to federal income taxes. In addition, the Fund intends to distribute in each calendar year substantially all of its ordinary income, capital gain net income and certain other amounts, if any, such that the Fund should not be subject to federal excise tax. Therefore, no federal income or excise tax provision is recorded.
Columbia U.S. Treasury Index Fund | Annual Report 2018
| 19 |
Notes to Financial Statements (continued)
April 30, 2018
Distributions to shareholders
Distributions from net investment income, if any, are declared daily and paid monthly. Net realized capital gains, if any, are distributed at least annually. Income distributions and capital gain distributions are determined in accordance with federal income tax regulations, which may differ from GAAP.
Guarantees and indemnifications
Under the Trust’s organizational documents and, in some cases, by contract, its officers and trustees are indemnified against certain liabilities arising out of the performance of their duties to the Trust or its funds. In addition, certain of the Fund’s contracts with its service providers contain general indemnification clauses. The Fund’s maximum exposure under these arrangements is unknown since the amount of any future claims that may be made against the Fund cannot be determined, and the Fund has no historical basis for predicting the likelihood of any such claims.
Recent accounting pronouncement
Accounting Standards Update 2017-08 Premium Amortization on Purchased Callable Debt Securities
In March 2017, the Financial Accounting Standards Board issued Accounting Standards Update (ASU) No. 2017-08 Premium Amortization on Purchased Callable Debt Securities. ASU No. 2017-08 updates the accounting standards to shorten the amortization period for certain purchased callable debt securities, held at a premium, to be amortized to the earliest call date. The update applies to securities with explicit, noncontingent call features that are callable at fixed prices and on preset dates. The standard is effective for annual periods beginning after December 15, 2018 and interim periods within those fiscal years. At this time, management is evaluating the implication of this guidance and the impact it will have on the financial statement amounts and footnote disclosures, if any.
Note 3. Fees and other transactions with affiliates
Management services fees
The Fund has entered into a Management Agreement with Columbia Management Investment Advisers, LLC (the Investment Manager), a wholly-owned subsidiary of Ameriprise Financial, Inc. (Ameriprise Financial). Under the Management Agreement, the Investment Manager provides the Fund with investment research and advice, as well as administrative and accounting services. The management services fee is an annual fee that is equal to 0.40% of the Fund’s daily net assets.
The Investment Manager, from the management services fee it receives from the Fund, pays all operating expenses of the Fund, with the exception of brokerage fees and commissions, taxes, interest, fees and expenses of Board of Trustees who are not officers, directors or employees of the Investment Manager or its affiliates, distribution and/or shareholder servicing and any extraordinary non-recurring expenses that may arise, including litigation fees.
Compensation of board members
Members of the Board of Trustees who are not officers or employees of the Investment Manager or Ameriprise Financial are compensated for their services to the Fund as disclosed in the Statement of Operations. These members of the Board of Trustees may participate in a Deferred Compensation Plan (the Plan) which may be terminated at any time. Obligations of the Plan will be paid solely out of the Fund’s assets, and all amounts payable under the Plan constitute a general unsecured obligation of the Fund.
Compensation of Chief Compliance Officer
The Board of Trustees has appointed a Chief Compliance Officer to the Fund in accordance with federal securities regulations. A portion of the Chief Compliance Officer’s total compensation is allocated to the Fund, along with other allocations to affiliated funds governed by the Board of Trustees, based on relative net assets. The expenses of the Chief Compliance Officer allocated to the Fund are payable by the Investment Manager.
| 20 | Columbia U.S. Treasury Index Fund | Annual Report 2018 |
Notes to Financial Statements (continued)
April 30, 2018
Transfer agency fees
Under a Transfer and Dividend Disbursing Agent Agreement, Columbia Management Investment Services Corp. (the Transfer Agent), an affiliate of the Investment Manager and a wholly-owned subsidiary of Ameriprise Financial, is responsible for providing transfer agency services to the Fund. The Transfer Agent has contracted with DST Asset Manager Solutions, Inc. (DST) to serve as sub-transfer agent.
The transfer agency fees are payable by the Investment Manager. The Transfer Agent pays the fees of DST for services as sub-transfer agent and DST is not entitled to reimbursement for such fees from the Fund. The Transfer Agent also receives compensation from the Investment Manager for various shareholder services and reimbursements for certain out-of-pocket expenses.
An annual minimum account balance fee of $20 may apply to certain accounts with a value below the applicable share class’s initial minimum investment requirements to reduce the impact of small accounts on transfer agency fees. These minimum account balance fees are remitted to the Fund and recorded as part of expense reductions in the Statement of Operations. For the year ended April 30, 2018, these minimum account balance fees reduced total expenses of the Fund by $780.
Distribution and service fees
The Fund has entered into an agreement with Columbia Management Investment Distributors, Inc. (the Distributor), an affiliate of the Investment Manager and a wholly-owned subsidiary of Ameriprise Financial, for distribution and shareholder services. The Board of Trustees has approved, and the Fund has adopted, distribution and shareholder service plans (the Plans) applicable to certain share classes, which set the distribution and service fees for the Fund. These fees are calculated daily and are intended to compensate the Distributor and/or eligible selling and/or servicing agents for selling shares of the Fund and providing services to investors.
Under the Plans, the Fund pays a monthly service fee to the Distributor at the maximum annual rate of 0.25% of the average daily net assets attributable to Class A, Class B, Class C and Class T shares of the Fund. Also under the Plans, the Fund pays a monthly distribution fee to the Distributor at the maximum annual rates of 0.75%, 0.75% and 0.25% of the average daily net assets attributable to Class B, Class C and Class T shares of the Fund, respectively. As a result of all Class B shares of the Fund being redeemed or converted to Class A shares, August 4, 2017 was the last day the Fund paid a service fee or distribution fee for Class B shares.
Although the Fund may pay a distribution fee up to 0.25% of the Fund’s average daily net assets attributable to Class T shares and a service fee of up to 0.25% of the Fund’s average daily net assets attributable to Class T shares, the aggregate fee shall not exceed 0.25% of the Fund’s average daily net assets attributable to Class T shares.
The Distributor has voluntarily agreed to waive a portion of the service fee for Class A and Class C shares so that the service fee does not exceed 0.15% annually of the average daily net assets attributable to each such share class. This arrangement may be modified or terminated by the Distributor at any time.
The Distributor had voluntarily agreed to waive a portion of the service fee for Class B shares so that the service fee did not exceed 0.15% annually of the average daily net assets attributable to each such share class. This arrangement was in effect through August 4, 2017.
The Distributor has voluntarily agreed to waive a portion of the distribution fee for Class C shares so that the distribution fee does not exceed 0.70% annually of the average daily net assets attributable to Class C shares. This arrangement may be modified or terminated by the Distributor at any time.
Sales charges (unaudited)
Sales charges, including front-end charges and CDSCs, received by the Distributor for distributing Fund shares for the year ended April 30, 2018, if any, are listed below:
Columbia U.S. Treasury Index Fund | Annual Report 2018
| 21 |
Notes to Financial Statements (continued)
April 30, 2018
Expenses waived/reimbursed by the Investment Manager and its affiliates
The Investment Manager and certain of its affiliates have contractually agreed to waive fees and/or reimburse expenses (excluding certain fees and expenses described below) for the period(s) disclosed below, unless sooner terminated at the sole discretion of the Board of Trustees, so that the Fund’s net operating expenses, after giving effect to fees waived/expenses reimbursed and any balance credits and/or overdraft charges from the Fund’s custodian, do not exceed the following annual rate(s) as a percentage of the class’ average daily net assets:
| | Fee rate(s) contractual
through
August 31, 2018 |
| Class A | 0.45% |
| Class C | 1.20 |
| Institutional Class | 0.20 |
| Institutional 2 Class | 0.20 |
| Institutional 3 Class | 0.20 |
| Class T | 0.45 |
Under the agreement governing these fee waivers and/or expense reimbursement arrangements, the following fees and expenses are excluded from the waiver/reimbursement commitment, and therefore will be paid by the Fund, if applicable: taxes (including foreign transaction taxes), expenses associated with investments in affiliated and non-affiliated pooled investment vehicles (including mutual funds and exchange-traded funds), transaction costs and brokerage commissions, costs related to any securities lending program, dividend expenses associated with securities sold short, inverse floater program fees and expenses, transaction charges and interest on borrowed money, interest, infrequent and/or unusual expenses and any other expenses the exclusion of which is specifically approved by the Board of Trustees. This agreement may be modified or amended only with approval from the Investment Manager, certain of its affiliates and the Fund. Any fees waived and/or expenses reimbursed under the expense reimbursement arrangements described above are not recoverable by the Investment Manager or its affiliates in future periods. Class A and Class C distribution fees waived by the Distributor, as discussed above, are in addition to the waiver/reimbursement commitment under the agreement.
Note 4. Federal tax information
The timing and character of income and capital gain distributions are determined in accordance with income tax regulations, which may differ from GAAP because of temporary or permanent book to tax differences.
At April 30, 2018, these differences were primarily due to differing treatment for deferral/reversal of wash sale losses, capital loss carryforwards, trustees’ deferred compensation, distributions and principal and/or interest of fixed income securities. To the extent these differences were permanent, reclassifications were made among the components of the Fund’s net assets in the Statement of Assets and Liabilities. Temporary differences do not require reclassifications.
The Fund did not have any permanent differences; therefore, no reclassifications were made to the Statement of Assets and Liabilities.
The tax character of distributions paid during the years indicated was as follows:
| Year Ended April 30, 2018 | Year Ended April 30, 2017 |
Ordinary
income ($) | Long-term
capital gains ($) | Total ($) | Ordinary
income ($) | Long-term
capital gains ($) | Total ($) |
| 11,870,444 | — | 11,870,444 | 11,973,448 | 1,170,551 | 13,143,999 |
Short-term capital gain distributions, if any, are considered ordinary income distributions for tax purposes.
| 22 | Columbia U.S. Treasury Index Fund | Annual Report 2018 |
Notes to Financial Statements (continued)
April 30, 2018
At April 30, 2018, the components of distributable earnings on a tax basis were as follows:
Undistributed
ordinary income ($) | Undistributed
long-term
capital gains ($) | Capital loss
carryforwards ($) | Net unrealized
(depreciation) ($) |
| 1,158,975 | — | (2,916,730) | (22,421,040) |
At April 30, 2018, the cost of all investments for federal income tax purposes along with the aggregate gross unrealized appreciation and depreciation based on that cost was:
Federal
tax cost ($) | Gross unrealized
appreciation ($) | Gross unrealized
(depreciation) ($) | Net unrealized
(depreciation) ($) |
| 892,567,524 | 1,099,215 | (23,520,255) | (22,421,040) |
Tax cost of investments and unrealized appreciation/(depreciation) may also include timing differences that do not constitute adjustments to tax basis.
The following capital loss carryforwards, determined at April 30, 2018, may be available to reduce taxable income arising from future net realized gains on investments, if any, to the extent permitted by the Internal Revenue Code. Capital loss carryforwards with no expiration are required to be utilized prior to any capital losses which carry an expiration date. As a result of this ordering rule, capital loss carryforwards which carry an expiration date may be more likely to expire unused. In addition, for the year ended April 30, 2018, capital loss carryforwards utilized, expired unused and permanently lost, if any, were as follows:
| 2019 ($) | No expiration
short-term ($) | No expiration
long-term ($) | Total ($) | Utilized ($) | Expired ($) | Permanently
lost ($) |
| — | 2,916,730 | — | 2,916,730 | — | — | — |
Management of the Fund has concluded that there are no significant uncertain tax positions in the Fund that would require recognition in the financial statements. However, management’s conclusion may be subject to review and adjustment at a later date based on factors including, but not limited to, new tax laws, regulations, and administrative interpretations (including relevant court decisions). Generally, the Fund’s federal tax returns for the prior three fiscal years remain subject to examination by the Internal Revenue Service.
Note 5. Portfolio information
The cost of purchases and proceeds from sales of securities, excluding short-term investments and derivatives, if any, aggregated to $373,332,353 and $192,943,658, respectively, for the year ended April 30, 2018, of which $373,332,353 and $192,943,658, respectively, were U.S. government securities. The amount of purchase and sale activity impacts the portfolio turnover rate reported in the Financial Highlights.
Note 6. Affiliated money market fund
The Fund invests in Columbia Short-Term Cash Fund, an affiliated money market fund established for the exclusive use by the Fund and other affiliated funds (the Affiliated MMF). The income earned by the Fund from such investments is included as Dividends - affiliated issuers in the Statement of Operations. As an investing fund, the Fund indirectly bears its proportionate share of the expenses of the Affiliated MMF. The Affiliated MMF prices its shares with a floating net asset value. In addition, the Board of Trustees of the Affiliated MMF may impose a fee on redemptions (sometimes referred to as a liquidity fee) or temporarily suspend redemptions (sometimes referred to as imposing a redemption gate) in the event its liquidity falls below regulatory limits.
Note 7. Line of credit
The Fund has access to a revolving credit facility with a syndicate of banks led by Citibank, N.A., HSBC Bank USA, N.A. and JPMorgan Chase Bank, N.A. whereby the Fund may borrow for the temporary funding of shareholder redemptions or for other temporary or emergency purposes. The credit facility, which is a collective agreement between the Fund and certain other funds managed by the Investment Manager, severally and not jointly, permits collective borrowings up to $1 billion. Interest is
Columbia U.S. Treasury Index Fund | Annual Report 2018
| 23 |
Notes to Financial Statements (continued)
April 30, 2018
charged to each participating fund based on its borrowings at a rate equal to the higher of (i) the overnight federal funds rate plus 1.00% or (ii) the one-month LIBOR rate plus 1.00%. Each borrowing under the credit facility matures no later than 60 days after the date of borrowing. The Fund also pays a commitment fee equal to its pro rata share of the amount of the credit facility at a rate of 0.15% per annum. The commitment fee is included in other expenses in the Statement of Operations.
The Fund had no borrowings during the year ended April 30, 2018.
Note 8. Significant risks
Credit risk
Credit risk is the risk that the value of debt securities in the Fund’s portfolio may decline because the issuer may default and fail to pay interest or repay principal when due. Rating agencies assign credit ratings to debt securities to indicate their credit risk. Lower rated or unrated debt securities held by the Fund may present increased credit risk as compared to higher-rated debt securities.
Interest rate risk
Interest rate risk is the risk of losses attributable to changes in interest rates. In general, if prevailing interest rates rise, the values of debt securities tend to fall, and if interest rates fall, the values of debt securities tend to rise. Actions by governments and central banking authorities can result in increases in interest rates. Increasing interest rates may negatively affect the value of debt securities held by the Fund, resulting in a negative impact on the Fund’s performance and net asset value per share. In general, the longer the maturity or duration of a debt security, the greater its sensitivity to changes in interest rates.
Shareholder concentration risk
At April 30, 2018, affiliated shareholders of record owned 78.9% of the outstanding shares of the Fund in one or more accounts. Subscription and redemption activity by concentrated accounts may have a significant effect on the operations of the Fund. In the case of a large redemption, the Fund may be forced to sell investments at inopportune times, including its liquid positions, which may result in Fund losses and the Fund holding a higher percentage of less liquid positions. Large redemptions could result in decreased economies of scale and increased operating expenses for non-redeeming Fund shareholders.
Note 9. Subsequent events
Management has evaluated the events and transactions that have occurred through the date the financial statements were issued and noted no items requiring adjustment of the financial statements or additional disclosure.
Note 10. Information regarding pending and settled legal proceedings
Ameriprise Financial and certain of its affiliates have historically been involved in a number of legal, arbitration and regulatory proceedings, including routine litigation, class actions, and governmental actions, concerning matters arising in connection with the conduct of their business activities. Ameriprise Financial believes that the Fund is not currently the subject of, and that neither Ameriprise Financial nor any of its affiliates are the subject of, any pending legal, arbitration or regulatory proceedings that are likely to have a material adverse effect on the Fund or the ability of Ameriprise Financial or its affiliates to perform under their contracts with the Fund. Ameriprise Financial is required to make quarterly (10-Q), annual (10-K) and, as necessary, 8-K filings with the Securities and Exchange Commission (SEC) on legal and regulatory matters that relate to Ameriprise Financial and its affiliates. Copies of these filings may be obtained by accessing the SEC website at www.sec.gov.
There can be no assurance that these matters, or the adverse publicity associated with them, will not result in increased Fund redemptions, reduced sale of Fund shares or other adverse consequences to the Fund. Further, although we believe proceedings are not likely to have a material adverse effect on the Fund or the ability of Ameriprise Financial or its affiliates to perform under their contracts with the Fund, these proceedings are subject to uncertainties and, as such, we are unable to
| 24 | Columbia U.S. Treasury Index Fund | Annual Report 2018 |
Notes to Financial Statements (continued)
April 30, 2018
estimate the possible loss or range of loss that may result. An adverse outcome in one or more of these proceedings could result in adverse judgments, settlements, fines, penalties or other relief that could have a material adverse effect on the consolidated financial condition or results of operations of Ameriprise Financial.
Columbia U.S. Treasury Index Fund | Annual Report 2018
| 25 |
Report of Independent Registered Public Accounting Firm
To the Board of Trustees of Columbia Funds Series Trust I and Shareholders of Columbia U.S. Treasury Index Fund
Opinion on the Financial Statements
We have audited the accompanying statement of assets and liabilities, including the portfolio of investments, of Columbia U.S. Treasury Index Fund (one of the funds constituting Columbia Funds Series Trust I, referred to hereafter as the "Fund") as of April 30, 2018, the related statement of operations for the year ended April 30, 2018, the statement of changes in net assets for each of the two years in the period ended April 30, 2018, including the related notes, and the financial highlights for each of periods indicated therein (collectively referred to as the “financial statements”). In our opinion, the financial statements present fairly, in all material respects, the financial position of the Fund as of April 30, 2018, the results of its operations for the year then ended, the changes in its net assets for each of the two years in the period ended April 30, 2018 and the financial highlights for each of the periods indicated therein in conformity with accounting principles generally accepted in the United States of America.
Basis for Opinion
These financial statements are the responsibility of the Fund’s management. Our responsibility is to express an opinion on the Fund’s financial statements based on our audits. We are a public accounting firm registered with the Public Company Accounting Oversight Board (United States) (“PCAOB”) and are required to be independent with respect to the Fund in accordance with the U.S. federal securities laws and the applicable rules and regulations of the Securities and Exchange Commission and the PCAOB.
We conducted our audits of these financial statements in accordance with the standards of the PCAOB. Those standards require that we plan and perform the audit to obtain reasonable assurance about whether the financial statements are free of material misstatement, whether due to error or fraud.
Our audits included performing procedures to assess the risks of material misstatement of the financial statements, whether due to error or fraud, and performing procedures that respond to those risks. Such procedures included examining, on a test basis, evidence regarding the amounts and disclosures in the financial statements. Our audits also included evaluating the accounting principles used and significant estimates made by management, as well as evaluating the overall presentation of the financial statements. Our procedures included confirmation of securities owned as of April 30, 2018 by correspondence with the custodian, transfer agent and brokers; when replies were not received from brokers, we performed other auditing procedures. We believe that our audits provide a reasonable basis for our opinion.
/s/PricewaterhouseCoopers LLP
Minneapolis, Minnesota
June 21, 2018
We have served as the auditor of one or more investment companies in the Columbia Funds Complex since 1977.
| 26 | Columbia U.S. Treasury Index Fund | Annual Report 2018 |
Shareholders elect the Board that oversees the Fund’s operations. The Board appoints officers who are responsible for day-to-day business decisions based on policies set by the Board. The following table provides basic biographical information about the Fund’s Trustees, including their principal occupations during the past five years, although specific titles for individuals may have varied over the period. The year set forth beneath Length of Service in the table below is the year in which the Trustee was first appointed or elected as Trustee to any Fund currently in the Columbia Funds Complex or a predecessor thereof. Under current Board policy, members serve terms of indefinite duration.
Independent trustees
| Name, address, year of birth | Position held with the Trust and length of service | Principal occupation(s) during the past five years and other relevant professional experience | Number of Funds in the Columbia Fund Complex overseen | Other directorships held by Trustee during the past five years |
Janet Langford Carrig
c/o Columbia Management
Investment Advisers, LLC
225 Franklin Street
Mail Drop BX32 05228
Boston, MA 02110
1957 | Trustee
1996 | Senior Vice President, General Counsel and Corporate Secretary, ConocoPhillips (independent energy company) since September 2007 | 71 | None |
Douglas A. Hacker
c/o Columbia Management
Investment Advisers, LLC
225 Franklin Street
Mail Drop BX32 05228
Boston, MA 02110
1955 | Trustee and Chairman of the Board
1996 | Independent business executive since May 2006; Executive Vice President — Strategy of United Airlines from December 2002 to May 2006; President of UAL Loyalty Services (airline marketing company) from September 2001 to December 2002; Executive Vice President and Chief Financial Officer of United Airlines from July 1999 to September 2001 | 71 | Spartan Nash Company, (food distributor); Nash Finch Company (food distributor) from 2005 to 2013; Aircastle Limited (aircraft leasing); SeaCube Container Leasing Ltd. (container leasing) from 2010 to 2013; and Travelport Worldwide Limited (travel information technology) |
Nancy T. Lukitsh
c/o Columbia Management
Investment Advisers, LLC
225 Franklin Street
Mail Drop BX32 05228
Boston, MA 02110
1956 | Trustee
2011 | Senior Vice President, Partner and Director of Marketing, Wellington Management Company, LLP (investment adviser) from 1997 to 2010; Chair, Wellington Management Portfolios (commingled non-U.S. investment pools) from 2007 to 2010; Director, Wellington Trust Company, NA and other Wellington affiliates from 1997 to 2010 | 71 | None |
David M. Moffett
c/o Columbia Management
Investment Advisers, LLC
225 Franklin Street
Mail Drop BX32 05228
Boston, MA 02110
1952 | Trustee
2011 | Retired. Consultant to Bridgewater and Associates | 71 | Director, CSX Corporation; Genworth Financial, Inc. (financial and insurance products and services); PayPal Holdings Inc. (payment and data processing services); Trustee, University of Oklahoma Foundation; former Director, eBay Inc. (online trading community), 2007-2015; and former Director, CIT Bank, CIT Group Inc. (commercial and consumer finance), 2010-2016 |
John J. Neuhauser
c/o Columbia Management
Investment Advisers, LLC
225 Franklin Street
Mail Drop BX32 05228
Boston, MA 02110
1943 | Trustee
1984 | President, Saint Michael’s College since August 2007; Director or Trustee of several non-profit organizations, including University of Vermont Medical Center; Academic Vice President and Dean of Faculties, Boston College from August 1999 to October 2005; University Professor, Boston College from November 2005 to August 2007 | 71 | Liberty All-Star Equity Fund and Liberty All- Star Growth Fund (closed-end funds) |
Columbia U.S. Treasury Index Fund | Annual Report 2018
| 27 |
TRUSTEES AND OFFICERS (continued)
Independent trustees (continued)
| Name, address, year of birth | Position held with the Trust and length of service | Principal occupation(s) during the past five years and other relevant professional experience | Number of Funds in the Columbia Fund Complex overseen | Other directorships held by Trustee during the past five years |
Patrick J. Simpson
c/o Columbia Management
Investment Advisers, LLC
225 Franklin Street
Mail Drop BX32 05228
Boston, MA 02110
1944 | Trustee
2000 | Of Counsel, Perkins Coie LLP (law firm) since 2015; Partner, Perkins Coie LLP from 1988 to 2014 | 71 | None |
Anne-Lee Verville
c/o Columbia Management
Investment Advisers, LLC
225 Franklin Street
Mail Drop BX32 05228
Boston, MA 02110
1945 | Trustee
1998 | Retired. General Manager, Global Education Industry from 1994 to 1997, President – Application Systems Division from 1991 to 1994, Chief Financial Officer – US Marketing & Services from 1988 to 1991, and Chief Information Officer from 1987 to 1988, IBM Corporation (computer and technology) | 71 | Enesco Group, Inc. (producer of giftware and home and garden decor products) from 2001 to 2006 |
Consultants to the Independent Trustees*
| Name, address, year of birth | Position held with the Trust and length of service | Principal occupation(s) during the past five years and other relevant professional experience | Number of Funds in the Columbia Funds complex overseen | Other directorships held by Trustee during the past five years |
J. Kevin Connaughton
c/o Columbia
Management Investment
Advisers, LLC,
225 Franklin Street
Mail Drop BX32 05228,
Boston, MA 02110
1964 | Independent Trustee Consultant
2016 | Independent Trustee Consultant, Columbia Funds since March 2016; Adjunct Professor of Finance, Bentley University since November 2017; Managing Director and General Manager of Mutual Fund Products, Columbia Management Investment Advisers, LLC from May 2010 to February 2015; President, Columbia Funds from 2009 to 2015; and senior officer of Columbia Funds and affiliated funds from 2003 to 2015 | 71 | Director, The Autism Project since March 2015; former Trustee, New Century Portfolios, March 2015-December 2017; formerly on Board of Governors, Gateway Healthcare, January 2016 – December 2017 |
Natalie A. Trunow
c/o Columbia
Management Investment
Advisers, LLC,
225 Franklin Street
Mail Drop BX32 05228,
Boston, MA 02110
1967 | Independent Trustee Consultant
2016 | Independent Trustee Consultant, Columbia Funds since September 2016; Chief Executive Officer, Millennial Portfolio Solutions LLC (asset management and consulting services) since January 2016; Director of Investments, Casey Family Programs from April 2016 to September 2016; Senior Vice President and Chief Investment Officer, Calvert Investments from August 2008 to January 2016; Section Head and Portfolio Manager, General Motors Asset Management from June 1997 to August 2008 | 71 | Director, Health Services for Children with Special Needs, Inc.; Director, Guidewell Financial Solutions |
| * | J. Kevin Connaughton was appointed consultant to the Independent Trustees effective March 1, 2016. Natalie A. Trunow was appointed consultant to the Independent Trustees effective September 1, 2016. Shareholders of the Funds are expected to be asked to elect each of Mr. Connaughton and Ms. Trunow as a Trustee at a future shareholder meeting. |
| 28 | Columbia U.S. Treasury Index Fund | Annual Report 2018 |
TRUSTEES AND OFFICERS (continued)
Interested trustee affiliated with Investment Manager*
| Name, address, year of birth | Position held with the Trust and length of service | Principal occupation(s) during the past five years and other relevant professional experience | Number of Funds in the Columbia Funds Complex overseen | Other directorships held by Trustee during the past five years |
William F. Truscott
c/o Columbia Management
Investment Advisers, LLC
225 Franklin Street
Boston, MA 02110
1960 | Trustee
2012 | Chairman of the Board and President, Columbia Management Investment Advisers, LLC since May 2010 and February 2012, respectively; Chief Executive Officer, Global Asset Management, Ameriprise Financial, Inc. since September 2012 (previously Chief Executive Officer, U.S. Asset Management & President, Annuities, May 2010-September 2012); Director and Chief Executive Officer, Columbia Management Investment Distributors, Inc. since May 2010 and February 2012, respectively; Chairman of the Board and Chief Executive Officer, RiverSource Distributors, Inc. since 2006; Director, Threadneedle Asset Management Holdings, SARL since 2014; President and Chief Executive Officer, Ameriprise Certificate Company, 2006-August 2012 | 196 | Chairman of the Board, Columbia Management Investment Advisers, LLC since May 2010; Director, Columbia Management Investment Distributors, Inc. since May 2010; former Director, Ameriprise Certificate Company, 2006 - January 2013 |
| * | Interested person (as defined under the 1940 Act) by reason of being an officer, director, security holder and/or employee of the Investment Manager or Ameriprise Financial. |
The Statement of Additional Information has additional information about the Fund’s Board members and is available, without charge, upon request by calling 800.345.6611, visiting columbiathreadneedleus.com/investor/ or contacting your financial intermediary.
Columbia U.S. Treasury Index Fund | Annual Report 2018
| 29 |
TRUSTEES AND OFFICERS (continued)
The Board has appointed officers who are responsible for day-to-day business decisions based on policies it has established. The officers serve at the pleasure of the Board. The following table provides basic information about the Officers of the Fund, including principal occupations during the past five years, although their specific titles may have varied over the period. In addition to Mr. Truscott, who is Senior Vice President, the Fund’s other officers are:
Fund officers
Name,
address and
year of birth | Position and year
first appointed to
position for any Fund
in the Columbia
Funds complex or a
predecessor thereof | Principal occupation(s) during past five years |
Christopher O. Petersen
5228 Ameriprise
Financial Center
Minneapolis, MN 55474
Born 1970 | President and Principal Executive Officer (2015) | Vice President and Lead Chief Counsel, Ameriprise Financial, Inc. since January 2015 (previously, Vice President and Chief Counsel, January 2010 - December 2014; officer of Columbia Funds and affiliated funds since 2007. |
Michael G. Clarke
225 Franklin Street
Boston, MA 02110
Born 1969 | Treasurer (2011), Chief Financial Officer (2009) and Chief Accounting Officer (2015) | Vice President — Mutual Fund Administration, Columbia Management Investment Advisers, LLC, since May 2010; senior officer of Columbia Funds and affiliated funds since 2002. |
Paul B. Goucher
100 Park Avenue
New York, NY 10017
Born 1968 | Senior Vice President (2011) and Assistant Secretary (2008) | Senior Vice President and Assistant General Counsel, Ameriprise Financial, Inc. since January 2017 (previously Vice President and Lead Chief Counsel, November 2008 - January 2017 and January 2013 - January 2017, respectively; and Chief Counsel, January 2010 - January 2013); Vice President, Chief Legal Officer and Assistant Secretary, Columbia Management Investment Advisers, LLC since May 2010. |
Thomas P. McGuire
225 Franklin Street
Boston, MA 02110
Born 1972 | Senior Vice President and Chief Compliance Officer (2012) | Vice President — Asset Management Compliance, Ameriprise Financial, Inc., since May 2010; Chief Compliance Officer, Ameriprise Certificate Company since September 2010. |
Colin Moore
225 Franklin Street
Boston, MA 02110
Born 1958 | Senior Vice President (2010) | Executive Vice President and Global Chief Investment Officer, Ameriprise Financial, Inc., since July 2013; Executive Vice President and Global Chief Investment Officer, Columbia Management Investment Advisers, LLC since July 2013 (previously Director and Global Chief Investment Officer, 2010 - 2013). |
Ryan C. Larrenaga
225 Franklin Street
Boston, MA 02110
Born 1970 | Senior Vice President (2017), Chief Legal Officer (2017) and Secretary (2015) | Vice President and Group Counsel, Ameriprise Financial, Inc. since August 2011; officer of Columbia Funds and affiliated funds since 2005. |
Michael E. DeFao
225 Franklin Street
Boston, MA 02110
Born 1968 | Vice President (2011) and Assistant Secretary (2010) | Vice President and Chief Counsel, Ameriprise Financial, Inc. since May 2010. |
Amy Johnson
5228 Ameriprise
Financial Center
Minneapolis, MN 55474
Born 1965 | Vice President (2006) | Managing Director and Global Head of Operations, Columbia Management Investment Advisers, LLC since April 2016 (previously Managing Director and Chief Operating Officer, 2010 - 2016). |
Lyn Kephart-Strong
5228 Ameriprise
Financial Center
Minneapolis, MN 55474
Born 1960 | Vice President (2015) | President, Columbia Management Investment Services Corp. since October 2014; Vice President & Resolution Officer, Ameriprise Trust Company since August 2009. |
| 30 | Columbia U.S. Treasury Index Fund | Annual Report 2018 |
The Fund mails one shareholder report to each shareholder address. If you would like more than one report, please call shareholder services at 800.345.6611 and additional reports will be sent to you.
Proxy voting policies and procedures
The policy of the Board of Trustees is to vote the proxies of the companies in which the Fund holds investments consistent with the procedures as stated in the Statement of Additional Information (SAI). You may obtain a copy of the SAI without charge by calling 800.345.6611; contacting your financial intermediary; visiting columbiathreadneedleus.com/investor/; or searching the website of the Securities and Exchange Commission (SEC) at sec.gov. Information regarding how the Fund voted proxies relating to portfolio securities is filed with the SEC by August 31st for the most recent 12-month period ending June 30th of that year, and is available without charge by visiting columbiathreadneedleus.com/investor/, or searching the website of the SEC at sec.gov.
Quarterly schedule of investments
The Fund files a complete schedule of portfolio holdings with the SEC for the first and third quarters of each fiscal year on Form N-Q. The Fund’s Form N-Q is available on the SEC’s website at sec.gov and may be reviewed and copied at the SEC’s Public Reference Room in Washington, D.C. Information on the operation of the Public Reference Room may be obtained by calling 800.SEC.0330. The Fund’s complete schedule of portfolio holdings, as filed on Form N-Q, can also be obtained without charge, upon request, by calling 800.345.6611.
Additional Fund information
For more information about the Fund, please visit columbiathreadneedleus.com/investor/ or call 800.345.6611. Customer Service Representatives are available to answer your questions Monday through Friday from 8 a.m. to 7 p.m. Eastern time.
Fund investment manager
Columbia Management Investment Advisers, LLC
225 Franklin Street
Boston, MA 02110
Fund distributor
Columbia Management Investment Distributors, Inc.
225 Franklin Street
Boston, MA 02110
Fund transfer agent
Columbia Management Investment Services Corp.
P.O. Box 8081
Boston, MA 02266-8081
Columbia U.S. Treasury Index Fund | Annual Report 2018
| 31 |
[THIS PAGE INTENTIONALLY LEFT BLANK]
[THIS PAGE INTENTIONALLY LEFT BLANK]
Columbia U.S. Treasury Index Fund
P.O. Box 8081
Boston, MA 02266-8081
Please read and consider the investment objectives, risks, charges and expenses for any fund carefully before investing. For a prospectus and summary prospectus, which contains this and other important information about the Fund, go to
columbiathreadneedleus.com/investor/. The Fund is distributed by Columbia Management Investment Distributors, Inc., member FINRA, and managed by Columbia Management Investment Advisers, LLC.
Columbia Threadneedle Investments (Columbia Threadneedle) is the global brand name of the Columbia and Threadneedle group of companies. All rights reserved. Columbia Management Investment Distributors, Inc., 225 Franklin Street, Boston, MA 02110-2804
© 2018 Columbia Management Investment Advisers, LLC.
columbiathreadneedleus .com/investor/

Annual Report
April 30, 2018
Columbia Corporate Income Fund
Not FDIC Insured • No bank guarantee • May lose value
Dear Shareholders,
The year 2017 was an extraordinary year in the financial markets. The S&P 500 Index didn’t experience a single down month and returned over 20%. Continuing this trend, January 2018 marked the fastest start for the index ever. Low volatility, which had been a feature of the U.S. equity market for several years, along with the surge in the S&P 500 Index, drove investor sentiment to very high levels. This arguably set the stage for an overdue correction, which we witnessed in February 2018.
A return to volatility
There have been few periods of market upheaval such as were experienced in the first part of 2018. While investors were taken by surprise by the sudden and pronounced market swings, the return to some level of volatility actually marked a resumption of relatively normal market conditions. Having said that, it’s important to distinguish between a good technical correction where excess enthusiasm in the marketplace is being let out, versus a real change in the underlying fundamentals – things like an underperforming economy or weaker corporate earnings. Our view is that the recent market volatility falls into the former category, and the fundamentals remain strong. We’re continuing to see improvements in global economic activity, and we’re seeing corporate earnings expectations continue to rise – and not just because of tax reform.
Consistency is more important than ever
It’s important to keep in mind that when it comes to long-term investing, it’s the destination, not the journey that matters most. If you have a financial goal that you’ve worked out with your financial advisor, and you have a good asset allocation plan to reach it, it’s a question of sticking with your plan rather than become focused on near-term volatility. Bouts of volatility are normal. After all, it’s hard to cross the ocean without hitting an occasional rough patch. You need to focus on the destination.
One final thought. In weathering volatility, it’s the consistency of the return that is essential. Investors who chase higher returns are usually the first to sell when an investment goes through a bad patch, and they therefore don’t tend to benefit from the recovery. More disciplined investors who perhaps panic less or not at all during periods of volatility, tend to have improved long-term results and are more likely to reach their financial goals. Nothing is more important to us than making sure those who have entrusted us to protect and grow their assets are able to do what matters most to them.
Your success is our priority. Talk to your financial advisor about how working with Columbia Threadneedle Investments may help you position your portfolio for consistent, sustainable outcomes, no matter the market conditions.
Sincerely,
Christopher O. Petersen
President, Columbia Funds
The S&P 500 Index, an unmanaged index, measures the performance of 500 widely held, large-capitalization U.S. stocks and is frequently used as a general measure of market performance. Past performance is no guarantee of future results.
Columbia Funds are distributed by Columbia Management Investment Distributors, Inc., member FINRA, and managed by Columbia Management Investment Advisers, LLC.
© 2018 Columbia Management Investment Advisers, LLC. All rights reserved.
Columbia Corporate Income Fund | Annual Report 2018
Columbia Corporate Income Fund | Annual Report 2018
Investment objective
Columbia Corporate Income Fund (the Fund) seeks total return, consisting primarily of current income and secondarily of capital appreciation.
Portfolio management
Tom Murphy, CFA
Lead Portfolio Manager
Managed Fund since 2011
Timothy Doubek, CFA
Portfolio Manager
Managed Fund since December 2011
| Average annual total returns (%) (for the period ended April 30, 2018) |
| | | Inception | 1 Year | 5 Years | 10 Years |
| Class A | Excluding sales charges | 07/31/00 | 0.22 | 1.89 | 5.26 |
| | Including sales charges | | -4.51 | 0.91 | 4.76 |
| Advisor Class* | 11/08/12 | 0.46 | 2.17 | 5.53 |
| Class C | Excluding sales charges | 07/15/02 | -0.38 | 1.29 | 4.63 |
| | Including sales charges | | -1.36 | 1.29 | 4.63 |
| Institutional Class | 03/05/86 | 0.47 | 2.15 | 5.52 |
| Institutional 2 Class* | 11/08/12 | 0.67 | 2.29 | 5.60 |
| Institutional 3 Class* | 11/08/12 | 0.62 | 2.34 | 5.63 |
| Class T* | Excluding sales charges | 09/27/10 | 0.22 | 1.89 | 5.26 |
| | Including sales charges | | -2.29 | 1.38 | 5.00 |
| Blended Benchmark | | 1.05 | 2.81 | 5.64 |
| Bloomberg Barclays U.S. Corporate Bond Index | | 0.67 | 2.46 | 5.23 |
Returns for Class A shares are shown with and without the maximum initial sales charge of 4.75%. Returns for Class C shares are shown with and without the 1.00% contingent deferred sales charge for the first year only. Returns for Class T shares are shown with and without the maximum initial sales charge of 2.50% per transaction. The Fund’s other classes are not subject to sales charges and have limited eligibility. Effective November 1, 2017, Class R4, Class R5, Class Y and Class Z shares were renamed Advisor Class, Institutional 2 Class, Institutional 3 Class and Institutional Class shares, respectively. Please see the Fund’s prospectus for details. Performance for different share classes will vary based on differences in sales charges and fees associated with each share class. All results shown assume reinvestment of distributions during the period. Returns do not reflect the deduction of taxes that a shareholder may pay on Fund distributions or on the redemption of Fund shares. Performance results reflect the effect of any fee waivers or reimbursements of Fund expenses by Columbia Management Investment Advisers, LLC and/or any of its affiliates. Absent these fee waivers or expense reimbursement arrangements, performance results would have been lower.
The performance information shown represents past performance and is not a guarantee of future results. The investment return and principal value of your investment will fluctuate so that your shares, when redeemed, may be worth more or less than their original cost. Current performance may be lower or higher than the performance information shown. You may obtain performance information current to the most recent month-end by contacting your financial intermediary, visiting columbiathreadneedleus.com/investor/ or calling 800.345.6611.
| * | The returns shown for periods prior to the share class inception date (including returns for the Life of the Fund, if shown, which are since Fund inception) include the returns of the Fund’s oldest share class. These returns are adjusted to reflect any higher class-related operating expenses of the newer share classes, as applicable. Please visit columbiathreadneedleus.com/investor/investment-products/mutual-funds/appended-performance for more information. |
The Blended Benchmark is a weighted custom benchmark, established by the Investment Manager, consisting of an 85% weighting in the Bloomberg Barclays U.S. Corporate Bond Index and a 15% weighting in the ICE Bank of America Merrill Lynch (ICE BofAML) U.S. Cash Pay High Yield Constrained Index tracks the performance of U.S. dollar-denominated below investment grade corporate debt, currently in a coupon paying period that is publicly issued in the U.S. domestic market.
The Bloomberg Barclays U.S. Corporate Bond Index measures the investment-grade, fixed-rate, taxable, corporate bond market.
Indices are not available for investment, are not professionally managed and do not reflect sales charges, fees, brokerage commissions, taxes or other expenses of investing. Securities in the Fund may not match those in an index.
| 2 | Columbia Corporate Income Fund | Annual Report 2018 |
Fund at a Glance (continued)
Performance of a hypothetical $10,000 investment (April 30, 2008 — April 30, 2018)
The chart above shows the change in value of a hypothetical $10,000 investment in Class A shares of Columbia Corporate Income Fund during the stated time period, and does not reflect the deduction of taxes that a shareholder may pay on Fund distributions or on the redemption of Fund shares.
| Portfolio breakdown (%) (at April 30, 2018) |
| Common Stocks | 0.0 (a) |
| Corporate Bonds & Notes | 94.6 |
| Foreign Government Obligations | 0.1 |
| Money Market Funds | 4.9 |
| Senior Loans | 0.0 (a) |
| U.S. Treasury Obligations | 0.4 |
| Total | 100.0 |
Percentages indicated are based upon total investments. The Fund’s portfolio composition is subject to change.
| Quality breakdown (%) (at April 30, 2018) |
| AAA rating | 1.0 |
| AA rating | 4.6 |
| A rating | 24.8 |
| BBB rating | 58.2 |
| BB rating | 4.6 |
| B rating | 5.7 |
| CCC rating | 1.1 |
| Total | 100.0 |
Percentages indicated are based upon total fixed income investments (excluding Money Market Funds).
Bond ratings apply to the underlying holdings of the Fund and not the Fund itself and are divided into categories ranging from highest to lowest credit quality, determined by using the middle rating of Moody’s, S&P and Fitch, after dropping the highest and lowest available ratings. When ratings are available from only two rating agencies, the lower rating is used. When a rating is available from only one rating agency, that rating is used. When a bond is not rated by any rating agency, it is designated as “Not rated.” Credit quality ratings assigned by a rating agency are subjective opinions, not statements of fact, and are subject to change, including daily. The ratings assigned by credit rating agencies are but one of the considerations that the Investment Manager and/or Fund’s subadviser incorporates into its credit analysis process, along with such other issuer-specific factors as cash flows, capital structure and leverage ratios, ability to de-leverage (repay) through free cash flow, quality of management, market positioning and access to capital, as well as such security-specific factors as the terms of the security (e.g., interest rate and time to maturity) and the amount and type of any collateral.
Columbia Corporate Income Fund | Annual Report 2018
| 3 |
Manager Discussion of Fund Performance
For the 12-month period that ended April 30, 2018, the Fund’s Class A shares returned 0.22% excluding sales charges. During the same 12-month period, the Fund underperformed its Blended Benchmark, which returned 1.05%, as well as the Bloomberg Barclays U.S. Corporate Index, which returned 0.67%. During the period, the largest positive contributions to the Fund’s performance came from positioning with respect to interest rates and an overweight allocation to the utilities sector. Underweights to financials and industrials detracted, as did a bias toward higher quality issues within below investment-grade, high-yield corporate bonds.
Credit outperformed as Treasury yields rose
Performance across fixed-income markets for the 12 months ended April 30, 2018 was constrained by an upward move in Treasury yields, which weighed on bond prices. For much of the period, sentiment with respect to credit-oriented segments of the market continued to be supported by positive economic data and the Federal Reserve’s (the Fed) maintenance of an incremental approach as it sought to restore interest rates to more historically normal levels.
Against a backdrop of strong corporate earnings growth and substantially full employment, the U.S. economy posted annualized growth in the 3% range over each of the last three quarters of 2017. As 2017 drew to a close, risk sentiment was further boosted with the passage of legislation that lowered the maximum corporate tax rate from 35% to 21% and provided a temporary window for companies to accelerate the expensing of capital investments.
The Fed implemented a series of three 25 basis point rate hikes at its June 2017, December 2017 and March 2018 Open Market Committee meetings, which together raised the upper target for the federal funds rate to 1.75%. In addition, in October of 2017, the Fed began the process of allowing its mortgage-backed security and Treasury holdings acquired in the wake of the 2008 financial crisis to gradually roll off its balance sheet. The Fed’s tapering plan was well-signaled, and the markets had little reaction to the actual launch.
As 2018 opened, bond markets continued to rally on the back of the tax reform bill and quiescent inflation indicators. However, January wage growth data surprised to the upside, raising concerns that signs of a potential acceleration in inflation would lead the Fed to step up the pace of its rate hikes. While jitters around inflation eased fairly quickly, the markets were jarred again in early March as President Trump threatened tariffs on Chinese imports, raising the specter of a trade war with the potential to derail global growth. In late April, first quarter 2018 growth was reported at 2.3%, with the drop off from the prior three quarters generally attributed to seasonal factors.
Yields rose along the U.S. Treasury curve over the 12-month period ended April 30, 2018, and the yield curve flattened notably as shorter maturities experienced greater yield increases. To illustrate, the two-year Treasury yield rose 121 basis points from 1.28% to 2.49%, the 10-year rose 66 basis points from 2.29% to 2.95%, the 20-year rose 34 basis points from 2.67% to 3.01%, and the 30-year yield rose 15 basis points from 2.96% to 3.11%. Credit spreads (the incremental yield provided by lower rated bonds relative to comparable maturity U.S. Treasury bonds) narrowed modestly over the 12 months.
Contributors and detractors
In terms of sector allocation, the Fund’s performance relative to the benchmark benefited from overweight exposure to utilities. Conversely, underweight allocations to financials and industrials acted as constraints on relative return. Security selection within both consumer non-cyclical and life insurance issues benefited performance.
Relative to the Blended Benchmark, our underweighting of below investment-grade, high-yield corporate bonds detracted from performance, as the segment outperformed investment-grade bonds. The high-yield allocation was approximately 9.6% at the end of the period, versus 15% for the Blended Benchmark. With respect to security selection, a bias toward higher quality issues within high-yield corporates detracted, as riskier segments of the market outperformed.
The Fund’s positioning with respect to interest rates added to relative performance. Specifically, a below-benchmark stance with respect to duration (and correspondingly reduced interest rate sensitivity) helped returns as Treasury yields rose over the period. In addition, the Fund’s performance benefited from our being positioned in anticipation that the yield curve would flatten, with an underweight to the 2-10 year area of the curve.
| 4 | Columbia Corporate Income Fund | Annual Report 2018 |
Manager Discussion of Fund Performance (continued)
At period’s end
Since the narrowing to the tightest point of the calendar year in late January 2018, investment grade credit spreads have widened modestly across the curve. This has primarily been driven by concerns around elevated supply and lower demand from non-U.S. investors. Economic growth has been solid and earnings have been strong, with the tailwind from U.S. tax law changes beginning to be reflected in corporate results.
Given that recent spread widening has not been caused by deteriorating corporate or U.S. economic fundamentals, we maintained a favorable view of corporate credit at the close of the reporting period. As high-yield corporate bonds have dramatically outperformed their investment-grade counterparts, we entered the new fiscal period with an underweight to high yield relative to the Blended Benchmark.
From a sector positioning standpoint, we were overweight in sectors that we believed had attractive risk-adjusted return potential, including electric utilities, life insurance, food and beverage, and midstream pipelines. We viewed these sectors as less economically sensitive and therefore less vulnerable should the current expansion, which is the second longest on record, come to an unexpected halt. The Fund was underweight in banking and technology based on relative value concerns, as well as retailers based on an unfavorable view of business fundamentals for the sector.
The Fed is in the process of normalizing the target range for its overnight lending rate and allowing its holdings of longer term bonds to shrink. We have seen a quite dramatic sell-off in U.S. Treasury bonds, with yields on the short end of the curve reaching levels not seen since 2008-2009 and intermediate Treasuries at yields not seen since 2011. Given the increase in Treasury yields, the Fund moved to a duration roughly in line with the benchmark by period end.
Market risk may affect a single issuer, sector of the economy, industry or the market as a whole. Fixed-income securities present issuer default risk. A rise in interest rates may result in a price decline of fixed-income instruments held by the Fund, negatively impacting its performance and NAV. Falling rates may result in the Fund investing in lower yielding debt instruments, lowering the Fund’s income and yield. These risks may be heightened for longer maturity and duration securities. Non-investment-grade (high-yield or junk) securities present greater price volatility and more risk to principal and income than higher rated securities. Prepayment and extension risk exists because the timing of payments on a loan, bond or other investment may accelerate when interest rates fall or decelerate when interest rates rise which may reduce investment opportunities and potential returns. Investing in derivatives is a specialized activity that involves special risks that subject the Fund to significant loss potential, including when used as leverage, and may result in greater fluctuation in fund value. Liquidity risk is associated with the difficulty of selling underlying investments at a desirable time or price. See the Fund’s prospectus for more information on these and other risks.
The views expressed in this report reflect the current views of the respective parties. These views are not guarantees of future performance and involve certain risks, uncertainties and assumptions that are difficult to predict, so actual outcomes and results may differ significantly from the views expressed. These views are subject to change at any time based upon economic, market or other conditions and the respective parties disclaim any responsibility to update such views. These views may not be relied on as investment advice and, because investment decisions for a Columbia fund are based on numerous factors, may not be relied on as an indication of trading intent on behalf of any particular Columbia fund. References to specific securities should not be construed as a recommendation or investment advice.
Columbia Corporate Income Fund | Annual Report 2018
| 5 |
Understanding Your Fund’s Expenses
(Unaudited)
As an investor, you incur two types of costs. There are transaction costs, which generally include sales charges on purchases and may include redemption fees. There are also ongoing costs, which generally include management fees, distribution and/or service fees, and other fund expenses. The following information is intended to help you understand your ongoing costs (in dollars) of investing in the Fund and to help you compare these costs with the ongoing costs of investing in other mutual funds.
Analyzing your Fund’s expenses
To illustrate these ongoing costs, we have provided examples and calculated the expenses paid by investors in each share class of the Fund during the period. The actual and hypothetical information in the table is based on an initial investment of $1,000 at the beginning of the period indicated and held for the entire period. Expense information is calculated two ways and each method provides you with different information. The amount listed in the “Actual” column is calculated using the Fund’s actual operating expenses and total return for the period. You may use the Actual information, together with the amount invested, to estimate the expenses that you paid over the period. Simply divide your account value by $1,000 (for example, an $8,600 account value divided by $1,000 = 8.6), then multiply the results by the expenses paid during the period under the “Actual” column. The amount listed in the “Hypothetical” column assumes a 5% annual rate of return before expenses (which is not the Fund’s actual return) and then applies the Fund’s actual expense ratio for the period to the hypothetical return. You should not use the hypothetical account values and expenses to estimate either your actual account balance at the end of the period or the expenses you paid during the period. See “Compare with other funds” below for details on how to use the hypothetical data.
Compare with other funds
Since all mutual funds are required to include the same hypothetical calculations about expenses in shareholder reports, you can use this information to compare the ongoing cost of investing in the Fund with other funds. To do so, compare the hypothetical example with the 5% hypothetical examples that appear in the shareholder reports of other funds. As you compare hypothetical examples of other funds, it is important to note that hypothetical examples are meant to highlight the ongoing costs of investing in a fund only and do not reflect any transaction costs, such as sales charges, or redemption or exchange fees. Therefore, the hypothetical calculations are useful in comparing ongoing costs only, and will not help you determine the relative total costs of owning different funds. If transaction costs were included in these calculations, your costs would be higher.
| November 1, 2017 — April 30, 2018 |
| | Account value at the
beginning of the
period ($) | Account value at the
end of the
period ($) | Expenses paid during
the period ($) | Fund’s annualized
expense ratio (%) |
| | Actual | Hypothetical | Actual | Hypothetical | Actual | Hypothetical | Actual |
| Class A | 1,000.00 | 1,000.00 | 973.40 | 1,020.28 | 4.45 | 4.56 | 0.91 |
| Advisor Class | 1,000.00 | 1,000.00 | 975.50 | 1,021.52 | 3.23 | 3.31 | 0.66 |
| Class C | 1,000.00 | 1,000.00 | 970.50 | 1,017.31 | 7.38 | 7.55 | 1.51 |
| Institutional Class | 1,000.00 | 1,000.00 | 974.60 | 1,021.52 | 3.23 | 3.31 | 0.66 |
| Institutional 2 Class | 1,000.00 | 1,000.00 | 975.90 | 1,021.97 | 2.79 | 2.86 | 0.57 |
| Institutional 3 Class | 1,000.00 | 1,000.00 | 975.30 | 1,022.27 | 2.50 | 2.56 | 0.51 |
| Class T | 1,000.00 | 1,000.00 | 973.40 | 1,020.28 | 4.45 | 4.56 | 0.91 |
Expenses paid during the period are equal to the annualized expense ratio for each class as indicated above, multiplied by the average account value over the period and then multiplied by the number of days in the Fund’s most recent fiscal half year and divided by 365.
Expenses do not include fees and expenses incurred indirectly by the Fund from its investment in underlying funds, including affiliated and non-affiliated pooled investment vehicles, such as mutual funds and exchange-traded funds.
Had Columbia Management Investment Advisers, LLC and/or certain of its affiliates not waived/reimbursed certain fees and expenses, account value at the end of the period would have been reduced.
| 6 | Columbia Corporate Income Fund | Annual Report 2018 |
Portfolio of Investments
April 30, 2018
(Percentages represent value of investments compared to net assets)
Investments in securities
| Common Stocks 0.0% |
| Issuer | Shares | Value ($) |
| Financials —% |
| Insurance —% |
| WMI Holdings Corp. Escrow(a),(b),(c),(d) | 1,075 | — |
| WMIH Corp.(b) | 21,388 | 29,302 |
| Total | | 29,302 |
| Total Financials | 29,302 |
Total Common Stocks
(Cost $1,077,672) | 29,302 |
| Corporate Bonds & Notes 93.2% |
| Issuer | Coupon
Rate | | Principal
Amount ($) | Value ($) |
| Aerospace & Defense 4.4% |
| Alcoa, Inc. |
| 04/15/2021 | 5.400% | | 408,000 | 420,223 |
| Boeing Co. (The) |
| 05/15/2018 | 0.950% | | 6,253,000 | 6,249,642 |
| Bombardier, Inc.(e) |
| 12/01/2021 | 8.750% | | 250,000 | 277,660 |
| 01/15/2023 | 6.125% | | 150,000 | 150,999 |
| 12/01/2024 | 7.500% | | 569,000 | 598,872 |
| Lockheed Martin Corp. |
| 11/23/2020 | 2.500% | | 6,720,000 | 6,642,700 |
| 09/15/2021 | 3.350% | | 8,150,000 | 8,197,009 |
| 01/15/2026 | 3.550% | | 16,525,000 | 16,250,982 |
| Northrop Grumman Corp. |
| 06/01/2018 | 1.750% | | 14,550,000 | 14,541,063 |
| 10/15/2047 | 4.030% | | 10,215,000 | 9,513,199 |
| TransDigm, Inc. |
| 05/15/2025 | 6.500% | | 657,000 | 667,415 |
| 06/15/2026 | 6.375% | | 1,195,000 | 1,202,705 |
| Total | 64,712,469 |
| Apartment REIT 0.1% |
| ERP Operating LP |
| 03/01/2028 | 3.500% | | 2,160,000 | 2,079,153 |
| Automotive 0.6% |
| Delphi Technologies PLC(e) |
| 10/01/2025 | 5.000% | | 258,000 | 248,571 |
| Ford Motor Co. |
| 12/08/2046 | 5.291% | | 7,406,000 | 7,113,508 |
| IHO Verwaltungs GmbH PIK(e) |
| 09/15/2023 | 4.500% | | 204,000 | 199,920 |
| Corporate Bonds & Notes (continued) |
| Issuer | Coupon
Rate | | Principal
Amount ($) | Value ($) |
| Schaeffler Finance BV(e) |
| 05/15/2023 | 4.750% | | 850,000 | 863,560 |
| Total | 8,425,559 |
| Banking 12.0% |
| Ally Financial, Inc. |
| 04/15/2021 | 4.250% | | 690,000 | 693,887 |
| 05/19/2022 | 4.625% | | 534,000 | 539,064 |
| 09/30/2024 | 5.125% | | 138,000 | 141,722 |
| American Express Co. |
| 08/01/2022 | 2.500% | | 9,590,000 | 9,209,833 |
| 02/27/2023 | 3.400% | | 4,365,000 | 4,329,822 |
| Bank of America Corp.(f) |
| 01/20/2028 | 3.824% | | 14,325,000 | 13,943,081 |
| Bank of America Corp.(e),(f) |
| 12/20/2028 | 3.419% | | 10,400,000 | 9,745,715 |
| Bank of Nova Scotia (The) |
| 04/20/2021 | 3.125% | | 9,485,000 | 9,455,720 |
| Capital One Financial Corp. |
| 05/12/2020 | 2.500% | | 4,127,000 | 4,065,413 |
| 01/30/2023 | 3.200% | | 2,765,000 | 2,683,297 |
| 01/31/2028 | 3.800% | | 4,085,000 | 3,884,300 |
| Capital One NA |
| 08/08/2022 | 2.650% | | 4,812,000 | 4,603,029 |
| Citigroup, Inc. |
| 05/01/2026 | 3.400% | | 5,115,000 | 4,834,601 |
| 10/21/2026 | 3.200% | | 13,260,000 | 12,360,269 |
| Goldman Sachs Group, Inc. (The)(f) |
| 05/01/2029 | 4.223% | | 21,650,000 | 21,303,600 |
| JPMorgan Chase & Co. |
| 10/01/2026 | 2.950% | | 8,361,000 | 7,731,442 |
| JPMorgan Chase & Co.(f) |
| 01/23/2029 | 3.509% | | 6,845,000 | 6,495,843 |
| 01/23/2049 | 3.897% | | 5,290,000 | 4,799,945 |
| Morgan Stanley |
| 07/27/2026 | 3.125% | | 4,225,000 | 3,939,589 |
| Morgan Stanley(f) |
| 01/24/2029 | 3.772% | | 14,535,000 | 13,975,839 |
| Toronto-Dominion Bank (The) |
| 01/25/2021 | 2.550% | | 9,550,000 | 9,399,970 |
| Washington Mutual Bank(a),(d),(g) |
| Subordinated |
| 01/15/2015 | 0.000% | | 6,350,000 | 9,525 |
| Wells Fargo & Co. |
| 10/23/2026 | 3.000% | | 15,435,000 | 14,220,374 |
The accompanying Notes to Financial Statements are an integral part of this statement.
Columbia Corporate Income Fund | Annual Report 2018
| 7 |
Portfolio of Investments (continued)
April 30, 2018
| Corporate Bonds & Notes (continued) |
| Issuer | Coupon
Rate | | Principal
Amount ($) | Value ($) |
| Wells Fargo & Co.(f) |
| 05/22/2028 | 3.584% | | 14,060,000 | 13,400,923 |
| Total | 175,766,803 |
| Brokerage/Asset Managers/Exchanges 0.0% |
| NFP Corp.(e) |
| 07/15/2025 | 6.875% | | 519,000 | 513,906 |
| VFH Parent LLC/Orchestra Co-Issuer, Inc.(e) |
| 06/15/2022 | 6.750% | | 79,000 | 82,036 |
| Total | 595,942 |
| Building Materials 0.2% |
| American Builders & Contractors Supply Co., Inc.(e) |
| 04/15/2021 | 5.625% | | 249,000 | 252,165 |
| 12/15/2023 | 5.750% | | 545,000 | 561,600 |
| Beacon Roofing Supply, Inc. |
| 10/01/2023 | 6.375% | | 57,000 | 59,931 |
| Beacon Roofing Supply, Inc.(e) |
| 11/01/2025 | 4.875% | | 361,000 | 340,933 |
| Core & Main LP(e) |
| 08/15/2025 | 6.125% | | 434,000 | 427,219 |
| HD Supply, Inc.(e) |
| 04/15/2024 | 5.750% | | 398,000 | 418,466 |
| James Hardie International Finance DAC(e) |
| 01/15/2025 | 4.750% | | 360,000 | 351,021 |
| U.S. Concrete, Inc. |
| 06/01/2024 | 6.375% | | 275,000 | 284,583 |
| Total | 2,695,918 |
| Cable and Satellite 2.8% |
| Altice U.S. Finance I Corp.(e) |
| 07/15/2023 | 5.375% | | 576,000 | 578,895 |
| 05/15/2026 | 5.500% | | 892,000 | 871,930 |
| CCO Holdings LLC/Capital Corp.(e) |
| 04/01/2024 | 5.875% | | 319,000 | 322,956 |
| 05/01/2025 | 5.375% | | 341,000 | 335,824 |
| 02/15/2026 | 5.750% | | 481,000 | 476,871 |
| 05/01/2026 | 5.500% | | 39,000 | 38,007 |
| 05/01/2027 | 5.125% | | 1,135,000 | 1,063,205 |
| Cequel Communications Holdings I LLC/Capital Corp.(e) |
| 12/15/2021 | 5.125% | | 182,000 | 182,197 |
| 04/01/2028 | 7.500% | | 480,000 | 486,573 |
| Charter Communications Operating LLC/Capital |
| 05/01/2047 | 5.375% | | 3,635,000 | 3,430,357 |
| Comcast Corp. |
| 07/15/2046 | 3.400% | | 3,263,000 | 2,721,649 |
| 08/15/2047 | 4.000% | | 5,192,000 | 4,767,751 |
| 11/01/2052 | 4.049% | | 2,210,000 | 2,017,412 |
| Corporate Bonds & Notes (continued) |
| Issuer | Coupon
Rate | | Principal
Amount ($) | Value ($) |
| CSC Holdings LLC |
| 02/15/2019 | 8.625% | | 425,000 | 442,028 |
| CSC Holdings LLC(e) |
| 10/15/2025 | 6.625% | | 562,000 | 578,985 |
| 10/15/2025 | 10.875% | | 288,000 | 337,723 |
| 04/15/2027 | 5.500% | | 229,000 | 219,908 |
| 02/01/2028 | 5.375% | | 373,000 | 349,095 |
| DISH DBS Corp. |
| 11/15/2024 | 5.875% | | 805,000 | 686,146 |
| 07/01/2026 | 7.750% | | 788,000 | 718,027 |
| Radiate HoldCo LLC/Finance, Inc.(e) |
| 02/15/2023 | 6.875% | | 99,000 | 95,892 |
| 02/15/2025 | 6.625% | | 445,000 | 412,734 |
| Sirius XM Radio, Inc.(e) |
| 07/15/2026 | 5.375% | | 993,000 | 975,681 |
| 08/01/2027 | 5.000% | | 764,000 | 729,659 |
| Sky PLC(e) |
| 09/16/2024 | 3.750% | | 11,122,000 | 11,141,108 |
| Time Warner Cable LLC |
| 09/15/2042 | 4.500% | | 2,380,000 | 2,025,899 |
| Unitymedia GmbH(e) |
| 01/15/2025 | 6.125% | | 985,000 | 1,036,012 |
| Unitymedia Hessen GmbH & Co. KG NRW(e) |
| 01/15/2025 | 5.000% | | 449,000 | 459,119 |
| Videotron Ltd. |
| 07/15/2022 | 5.000% | | 286,000 | 292,169 |
| Videotron Ltd.(e) |
| 04/15/2027 | 5.125% | | 244,000 | 239,713 |
| Virgin Media Finance PLC(e) |
| 01/15/2025 | 5.750% | | 674,000 | 644,650 |
| Virgin Media Secured Finance PLC |
| 01/15/2021 | 5.250% | | 465,000 | 477,110 |
| Virgin Media Secured Finance PLC(e) |
| 01/15/2026 | 5.250% | | 731,000 | 695,891 |
| Ziggo Bond Finance BV(e) |
| 01/15/2027 | 6.000% | | 610,000 | 569,647 |
| Ziggo Secured Finance BV(e) |
| 01/15/2027 | 5.500% | | 923,000 | 870,095 |
| Total | 41,290,918 |
| Chemicals 0.5% |
| Angus Chemical Co.(e) |
| 02/15/2023 | 8.750% | | 437,000 | 454,955 |
| Atotech U.S.A., Inc.(e) |
| 02/01/2025 | 6.250% | | 397,000 | 401,225 |
| Axalta Coating Systems LLC(e) |
| 08/15/2024 | 4.875% | | 203,000 | 204,608 |
The accompanying Notes to Financial Statements are an integral part of this statement.
| 8 | Columbia Corporate Income Fund | Annual Report 2018 |
Portfolio of Investments (continued)
April 30, 2018
| Corporate Bonds & Notes (continued) |
| Issuer | Coupon
Rate | | Principal
Amount ($) | Value ($) |
| Chemours Co. (The) |
| 05/15/2023 | 6.625% | | 570,000 | 599,110 |
| 05/15/2025 | 7.000% | | 339,000 | 364,719 |
| Huntsman International LLC |
| 11/15/2020 | 4.875% | | 840,000 | 857,552 |
| INEOS Group Holdings SA(e) |
| 08/01/2024 | 5.625% | | 329,000 | 331,756 |
| Koppers, Inc.(e) |
| 02/15/2025 | 6.000% | | 89,000 | 90,728 |
| LYB International Finance BV |
| 03/15/2044 | 4.875% | | 955,000 | 976,475 |
| Olin Corp. |
| 09/15/2027 | 5.125% | | 160,000 | 156,736 |
| 02/01/2030 | 5.000% | | 232,000 | 221,089 |
| Platform Specialty Products Corp.(e) |
| 02/01/2022 | 6.500% | | 372,000 | 381,155 |
| 12/01/2025 | 5.875% | | 424,000 | 413,626 |
| PQ Corp.(e) |
| 11/15/2022 | 6.750% | | 1,045,000 | 1,107,455 |
| 12/15/2025 | 5.750% | | 247,000 | 244,861 |
| SPCM SA(e) |
| 09/15/2025 | 4.875% | | 387,000 | 375,161 |
| Venator Finance SARL/Materials LLC(e) |
| 07/15/2025 | 5.750% | | 55,000 | 55,000 |
| WR Grace & Co.(e) |
| 10/01/2021 | 5.125% | | 331,000 | 340,672 |
| Total | 7,576,883 |
| Construction Machinery 0.2% |
| Ashtead Capital, Inc.(e) |
| 08/15/2027 | 4.375% | | 407,000 | 384,746 |
| H&E Equipment Services, Inc. |
| 09/01/2025 | 5.625% | | 112,000 | 112,506 |
| Ritchie Bros. Auctioneers, Inc.(e) |
| 01/15/2025 | 5.375% | | 679,000 | 675,551 |
| United Rentals North America, Inc. |
| 10/15/2025 | 4.625% | | 89,000 | 86,442 |
| 09/15/2026 | 5.875% | | 454,000 | 472,711 |
| 05/15/2027 | 5.500% | | 345,000 | 342,470 |
| 01/15/2028 | 4.875% | | 644,000 | 609,679 |
| Total | 2,684,105 |
| Consumer Cyclical Services 0.1% |
| APX Group, Inc. |
| 12/01/2020 | 8.750% | | 252,000 | 248,270 |
| 12/01/2022 | 7.875% | | 318,000 | 321,180 |
| 09/01/2023 | 7.625% | | 167,000 | 155,877 |
| IHS Markit Ltd.(e) |
| 11/01/2022 | 5.000% | | 594,000 | 614,983 |
| Corporate Bonds & Notes (continued) |
| Issuer | Coupon
Rate | | Principal
Amount ($) | Value ($) |
| Interval Acquisition Corp. |
| 04/15/2023 | 5.625% | | 382,000 | 397,812 |
| Total | 1,738,122 |
| Consumer Products 0.2% |
| Mattel, Inc.(e) |
| 12/31/2025 | 6.750% | | 317,000 | 309,081 |
| Newell Brands, Inc. |
| 04/01/2046 | 5.500% | | 800,000 | 828,577 |
| Prestige Brands, Inc.(e) |
| 03/01/2024 | 6.375% | | 428,000 | 430,109 |
| Scotts Miracle-Gro Co. (The) |
| 10/15/2023 | 6.000% | | 266,000 | 278,062 |
| 12/15/2026 | 5.250% | | 74,000 | 71,901 |
| Spectrum Brands, Inc. |
| 11/15/2022 | 6.625% | | 385,000 | 398,302 |
| 07/15/2025 | 5.750% | | 650,000 | 650,047 |
| Springs Industries, Inc. |
| 06/01/2021 | 6.250% | | 201,000 | 203,806 |
| Valvoline, Inc. |
| 07/15/2024 | 5.500% | | 39,000 | 39,986 |
| 08/15/2025 | 4.375% | | 227,000 | 219,459 |
| Total | 3,429,330 |
| Diversified Manufacturing 1.5% |
| Apergy Corp.(e),(h) |
| 05/01/2026 | 6.375% | | 329,000 | 333,894 |
| Gates Global LLC/Co.(e) |
| 07/15/2022 | 6.000% | | 268,000 | 271,366 |
| General Electric Co. |
| 10/09/2042 | 4.125% | | 4,730,000 | 4,310,099 |
| Honeywell International, Inc. |
| 10/30/2019 | 1.400% | | 8,325,000 | 8,161,214 |
| Siemens Financieringsmaatschappij NV(e) |
| 03/16/2020 | 2.200% | | 3,670,000 | 3,619,820 |
| SPX FLOW, Inc.(e) |
| 08/15/2024 | 5.625% | | 72,000 | 72,909 |
| 08/15/2026 | 5.875% | | 266,000 | 271,977 |
| TriMas Corp.(e) |
| 10/15/2025 | 4.875% | | 355,000 | 345,738 |
| United Technologies Corp. |
| 11/01/2046 | 3.750% | | 3,105,000 | 2,707,172 |
| Welbilt, Inc. |
| 02/15/2024 | 9.500% | | 68,000 | 75,609 |
| WESCO Distribution, Inc. |
| 12/15/2021 | 5.375% | | 775,000 | 790,655 |
| 06/15/2024 | 5.375% | | 104,000 | 105,040 |
The accompanying Notes to Financial Statements are an integral part of this statement.
Columbia Corporate Income Fund | Annual Report 2018
| 9 |
Portfolio of Investments (continued)
April 30, 2018
| Corporate Bonds & Notes (continued) |
| Issuer | Coupon
Rate | | Principal
Amount ($) | Value ($) |
| Zekelman Industries, Inc.(e) |
| 06/15/2023 | 9.875% | | 394,000 | 434,404 |
| Total | 21,499,897 |
| Electric 16.8% |
| AEP Texas, Inc. |
| 10/01/2047 | 3.800% | | 7,750,000 | 7,273,693 |
| AES Corp. |
| 03/15/2023 | 4.500% | | 320,000 | 321,613 |
| 05/15/2026 | 6.000% | | 216,000 | 225,689 |
| 09/01/2027 | 5.125% | | 161,000 | 163,242 |
| Calpine Corp. |
| 01/15/2025 | 5.750% | | 300,000 | 275,208 |
| Calpine Corp.(e) |
| 06/01/2026 | 5.250% | | 309,000 | 296,017 |
| CMS Energy Corp. |
| 03/01/2024 | 3.875% | | 8,145,000 | 8,157,951 |
| 11/15/2025 | 3.600% | | 11,314,000 | 11,058,383 |
| 02/15/2027 | 2.950% | | 16,721,000 | 15,334,879 |
| Consolidated Edison Co. of New York, Inc. |
| 06/15/2046 | 3.850% | | 900,000 | 861,985 |
| DTE Energy Co. |
| 06/01/2024 | 3.500% | | 17,549,000 | 17,226,327 |
| 10/01/2026 | 2.850% | | 26,960,000 | 24,515,564 |
| Duke Energy Corp. |
| 10/15/2023 | 3.950% | | 8,133,000 | 8,246,911 |
| 04/15/2024 | 3.750% | | 8,194,000 | 8,172,761 |
| 08/15/2027 | 3.150% | | 14,560,000 | 13,591,877 |
| Duke Energy Florida LLC |
| 01/15/2027 | 3.200% | | 3,829,000 | 3,691,975 |
| Edison International |
| 09/15/2022 | 2.400% | | 5,920,000 | 5,618,625 |
| Emera U.S. Finance LP |
| 06/15/2046 | 4.750% | | 12,833,000 | 12,775,675 |
| Eversource Energy |
| 03/15/2022 | 2.750% | | 1,235,000 | 1,203,894 |
| Indiana Michigan Power Co. |
| 07/01/2047 | 3.750% | | 5,595,000 | 5,183,538 |
| Mississippi Power Co. |
| 03/30/2028 | 3.950% | | 14,219,000 | 14,085,142 |
| 03/15/2042 | 4.250% | | 837,000 | 803,996 |
| NextEra Energy Operating Partners LP(e) |
| 09/15/2027 | 4.500% | | 293,000 | 274,293 |
| NRG Energy, Inc. |
| 05/01/2024 | 6.250% | | 35,000 | 36,088 |
| 01/15/2027 | 6.625% | | 606,000 | 623,450 |
| NRG Energy, Inc.(e) |
| 01/15/2028 | 5.750% | | 145,000 | 143,621 |
| Corporate Bonds & Notes (continued) |
| Issuer | Coupon
Rate | | Principal
Amount ($) | Value ($) |
| NRG Yield Operating LLC |
| 08/15/2024 | 5.375% | | 711,000 | 712,075 |
| 09/15/2026 | 5.000% | | 181,000 | 176,979 |
| Pacific Gas & Electric Co. |
| 02/15/2024 | 3.750% | | 3,295,000 | 3,268,235 |
| 03/15/2027 | 3.300% | | 1,476,000 | 1,384,373 |
| 02/15/2044 | 4.750% | | 2,503,000 | 2,545,906 |
| Pacific Gas & Electric Co.(e) |
| 12/01/2047 | 3.950% | | 2,410,000 | 2,194,291 |
| Pattern Energy Group, Inc.(e) |
| 02/01/2024 | 5.875% | | 544,000 | 556,761 |
| Progress Energy, Inc. |
| 04/01/2022 | 3.150% | | 20,570,000 | 20,235,470 |
| Public Service Electric & Gas Co. |
| 05/15/2027 | 3.000% | | 6,475,000 | 6,165,353 |
| Public Service Enterprise Group, Inc. |
| 11/15/2019 | 1.600% | | 3,270,000 | 3,192,720 |
| Sierra Pacific Power Co. |
| 05/01/2026 | 2.600% | | 4,900,000 | 4,530,373 |
| Southern California Edison Co. |
| 10/01/2043 | 4.650% | | 295,000 | 318,376 |
| Southern Co. (The) |
| 07/01/2046 | 4.400% | | 8,637,000 | 8,526,516 |
| TerraForm Power Operating LLC(e) |
| 01/31/2028 | 5.000% | | 761,000 | 713,763 |
| Vistra Energy Corp. |
| 11/01/2024 | 7.625% | | 250,000 | 268,584 |
| Vistra Energy Corp.(e) |
| 01/30/2026 | 8.125% | | 569,000 | 624,500 |
| WEC Energy Group, Inc. |
| 06/15/2025 | 3.550% | | 11,202,000 | 11,025,333 |
| Xcel Energy, Inc. |
| 12/01/2026 | 3.350% | | 20,895,000 | 20,079,280 |
| Total | 246,681,285 |
| Finance Companies 1.7% |
| Aircastle Ltd. |
| 03/15/2021 | 5.125% | | 733,000 | 751,812 |
| 04/01/2023 | 5.000% | | 61,000 | 62,477 |
| Avolon Holdings Funding Ltd.(e) |
| 01/15/2023 | 5.500% | | 437,000 | 434,381 |
| CIT Group, Inc. |
| 03/07/2025 | 5.250% | | 110,000 | 112,339 |
| GE Capital International Funding Co. Unlimited Co. |
| 11/15/2020 | 2.342% | | 12,001,000 | 11,734,518 |
| 11/15/2035 | 4.418% | | 7,590,000 | 7,274,734 |
| iStar, Inc. |
| 04/01/2022 | 6.000% | | 422,000 | 424,864 |
The accompanying Notes to Financial Statements are an integral part of this statement.
| 10 | Columbia Corporate Income Fund | Annual Report 2018 |
Portfolio of Investments (continued)
April 30, 2018
| Corporate Bonds & Notes (continued) |
| Issuer | Coupon
Rate | | Principal
Amount ($) | Value ($) |
| Navient Corp. |
| 03/25/2020 | 8.000% | | 34,000 | 36,210 |
| 07/26/2021 | 6.625% | | 258,000 | 267,910 |
| 06/15/2022 | 6.500% | | 248,000 | 254,868 |
| 01/25/2023 | 5.500% | | 481,000 | 473,406 |
| 10/25/2024 | 5.875% | | 578,000 | 566,041 |
| Provident Funding Associates LP/Finance Corp.(e) |
| 06/15/2025 | 6.375% | | 563,000 | 566,354 |
| Quicken Loans, Inc.(e) |
| 05/01/2025 | 5.750% | | 526,000 | 517,723 |
| 01/15/2028 | 5.250% | | 150,000 | 137,301 |
| Springleaf Finance Corp. |
| 03/15/2023 | 5.625% | | 339,000 | 339,530 |
| 03/15/2025 | 6.875% | | 337,000 | 340,242 |
| Total | 24,294,710 |
| Food and Beverage 7.7% |
| Anheuser-Busch InBev Finance, Inc. |
| 02/01/2046 | 4.900% | | 11,041,000 | 11,439,149 |
| Anheuser-Busch InBev Worldwide, Inc. |
| 04/15/2058 | 4.750% | | 1,960,000 | 1,960,743 |
| Aramark Services, Inc.(e) |
| 02/01/2028 | 5.000% | | 198,000 | 192,661 |
| B&G Foods, Inc. |
| 04/01/2025 | 5.250% | | 704,000 | 644,797 |
| Bacardi Ltd.(e) |
| 05/15/2048 | 5.300% | | 12,045,000 | 11,882,826 |
| Chobani LLC/Finance Corp., Inc.(e) |
| 04/15/2025 | 7.500% | | 498,000 | 500,502 |
| Diageo Capital PLC |
| 07/15/2020 | 4.828% | | 6,600,000 | 6,848,200 |
| FAGE International SA/U.S.A. Dairy Industry, Inc.(e) |
| 08/15/2026 | 5.625% | | 443,000 | 414,682 |
| JM Smucker Co. (The) |
| 12/06/2019 | 2.200% | | 4,135,000 | 4,085,591 |
| Kraft Heinz Foods Co. |
| 07/02/2020 | 2.800% | | 20,480,000 | 20,320,174 |
| 06/01/2046 | 4.375% | | 9,103,000 | 8,132,384 |
| Lamb Weston Holdings, Inc.(e) |
| 11/01/2024 | 4.625% | | 113,000 | 111,913 |
| 11/01/2026 | 4.875% | | 388,000 | 386,716 |
| Molson Coors Brewing Co. |
| 03/15/2019 | 1.900% | | 3,940,000 | 3,910,261 |
| 07/15/2046 | 4.200% | | 10,979,000 | 10,055,392 |
| Mondelez International, Inc.(e) |
| 10/28/2019 | 1.625% | | 9,480,000 | 9,296,723 |
| PepsiCo, Inc. |
| 05/02/2019 | 1.550% | | 6,170,000 | 6,113,760 |
| Corporate Bonds & Notes (continued) |
| Issuer | Coupon
Rate | | Principal
Amount ($) | Value ($) |
| Pinnacle Foods Finance LLC/Corp. |
| 01/15/2024 | 5.875% | | 52,000 | 53,569 |
| Post Holdings, Inc.(e) |
| 03/01/2025 | 5.500% | | 101,000 | 99,122 |
| 08/15/2026 | 5.000% | | 488,000 | 458,704 |
| 03/01/2027 | 5.750% | | 1,247,000 | 1,221,490 |
| 01/15/2028 | 5.625% | | 209,000 | 199,595 |
| Sysco Corp. |
| 07/15/2021 | 2.500% | | 2,055,000 | 2,008,023 |
| 07/15/2027 | 3.250% | | 6,400,000 | 6,037,146 |
| Tyson Foods, Inc. |
| 08/15/2019 | 2.650% | | 5,884,000 | 5,855,916 |
| 06/02/2047 | 4.550% | | 1,065,000 | 1,027,566 |
| Total | 113,257,605 |
| Gaming 0.5% |
| Boyd Gaming Corp. |
| 05/15/2023 | 6.875% | | 297,000 | 311,850 |
| 04/01/2026 | 6.375% | | 103,000 | 107,731 |
| Caesars Resort Collection LLC/CRC Finco, Inc.(e) |
| 10/15/2025 | 5.250% | | 161,000 | 153,739 |
| Eldorado Resorts, Inc. |
| 04/01/2025 | 6.000% | | 498,000 | 493,266 |
| GLP Capital LP/Financing II, Inc. |
| 11/01/2023 | 5.375% | | 292,000 | 301,760 |
| 04/15/2026 | 5.375% | | 552,000 | 556,253 |
| International Game Technology PLC(e) |
| 02/15/2022 | 6.250% | | 542,000 | 569,719 |
| 02/15/2025 | 6.500% | | 262,000 | 279,651 |
| Jack Ohio Finance LLC/1 Corp.(e) |
| 11/15/2021 | 6.750% | | 349,000 | 361,232 |
| MGM Growth Properties Operating Partnership LP/Finance Co-Issuer, Inc. |
| 05/01/2024 | 5.625% | | 104,000 | 106,081 |
| 09/01/2026 | 4.500% | | 122,000 | 115,209 |
| 01/15/2028 | 4.500% | | 301,000 | 277,342 |
| MGM Resorts International |
| 10/01/2020 | 6.750% | | 616,000 | 654,564 |
| 03/15/2023 | 6.000% | | 281,000 | 293,875 |
| 09/01/2026 | 4.625% | | 608,000 | 574,638 |
| Penn National Gaming, Inc.(e) |
| 01/15/2027 | 5.625% | | 221,000 | 212,143 |
| Rivers Pittsburgh Borrower LP/Finance Corp.(e) |
| 08/15/2021 | 6.125% | | 117,000 | 115,055 |
| Scientific Games International, Inc. |
| 12/01/2022 | 10.000% | | 523,000 | 563,538 |
| Scientific Games International, Inc.(e) |
| 10/15/2025 | 5.000% | | 882,000 | 852,307 |
| Seminole Tribe of Florida, Inc.(e) |
| 10/01/2020 | 7.804% | | 190,000 | 190,000 |
The accompanying Notes to Financial Statements are an integral part of this statement.
Columbia Corporate Income Fund | Annual Report 2018
| 11 |
Portfolio of Investments (continued)
April 30, 2018
| Corporate Bonds & Notes (continued) |
| Issuer | Coupon
Rate | | Principal
Amount ($) | Value ($) |
| Tunica-Biloxi Gaming Authority(e) |
| 12/15/2020 | 3.780% | | 268,813 | 72,580 |
| Wynn Las Vegas LLC/Capital Corp.(e) |
| 03/01/2025 | 5.500% | | 544,000 | 540,741 |
| 05/15/2027 | 5.250% | | 178,000 | 171,588 |
| Total | 7,874,862 |
| Health Care 6.3% |
| Acadia Healthcare Co., Inc. |
| 02/15/2023 | 5.625% | | 159,000 | 160,641 |
| 03/01/2024 | 6.500% | | 353,000 | 365,355 |
| Becton Dickinson and Co. |
| 12/15/2019 | 2.675% | | 9,195,000 | 9,128,971 |
| 06/06/2027 | 3.700% | | 14,840,000 | 14,073,039 |
| Cardinal Health, Inc. |
| 06/15/2027 | 3.410% | | 16,830,000 | 15,626,941 |
| Change Healthcare Holdings LLC/Finance, Inc.(e) |
| 03/01/2025 | 5.750% | | 404,000 | 395,217 |
| Charles River Laboratories International, Inc.(e) |
| 04/01/2026 | 5.500% | | 146,000 | 148,500 |
| CHS/Community Health Systems, Inc. |
| 02/01/2022 | 6.875% | | 163,000 | 88,889 |
| 03/31/2023 | 6.250% | | 596,000 | 544,311 |
| CVS Health Corp. |
| 06/01/2021 | 2.125% | | 6,910,000 | 6,665,538 |
| 07/20/2022 | 3.500% | | 3,955,000 | 3,935,379 |
| 03/25/2048 | 5.050% | | 5,920,000 | 6,045,540 |
| DaVita, Inc. |
| 07/15/2024 | 5.125% | | 608,000 | 589,760 |
| Envision Healthcare Corp.(e) |
| 12/01/2024 | 6.250% | | 495,000 | 514,771 |
| Express Scripts Holding Co. |
| 11/30/2020 | 2.600% | | 4,425,000 | 4,335,119 |
| 03/01/2027 | 3.400% | | 6,950,000 | 6,398,803 |
| 07/15/2046 | 4.800% | | 4,132,000 | 4,058,227 |
| HCA, Inc. |
| 02/01/2025 | 5.375% | | 429,000 | 426,889 |
| 04/15/2025 | 5.250% | | 1,055,000 | 1,069,410 |
| 02/15/2026 | 5.875% | | 335,000 | 339,424 |
| 02/15/2027 | 4.500% | | 327,000 | 313,054 |
| Hill-Rom Holdings, Inc.(e) |
| 02/15/2025 | 5.000% | | 337,000 | 334,302 |
| Hologic, Inc.(e) |
| 10/15/2025 | 4.375% | | 64,000 | 61,585 |
| 02/01/2028 | 4.625% | | 287,000 | 273,609 |
| IQVIA, Inc.(e) |
| 10/15/2026 | 5.000% | | 424,000 | 418,458 |
| McKesson Corp. |
| 02/16/2028 | 3.950% | | 1,995,000 | 1,948,718 |
| Corporate Bonds & Notes (continued) |
| Issuer | Coupon
Rate | | Principal
Amount ($) | Value ($) |
| Medtronic Global Holdings SCA |
| 03/28/2019 | 1.700% | | 10,255,000 | 10,171,637 |
| MPH Acquisition Holdings LLC(e) |
| 06/01/2024 | 7.125% | | 465,000 | 472,799 |
| Polaris Intermediate Corp. PIK(e) |
| 12/01/2022 | 8.500% | | 206,000 | 209,001 |
| Sotera Health Holdings LLC(e) |
| 05/15/2023 | 6.500% | | 449,000 | 450,462 |
| Teleflex, Inc. |
| 06/01/2026 | 4.875% | | 62,000 | 61,001 |
| 11/15/2027 | 4.625% | | 536,000 | 514,162 |
| Tenet Healthcare Corp. |
| 06/01/2020 | 4.750% | | 638,000 | 643,020 |
| 06/15/2023 | 6.750% | | 109,000 | 107,353 |
| Tenet Healthcare Corp.(e) |
| 07/15/2024 | 4.625% | | 362,000 | 349,994 |
| 05/01/2025 | 5.125% | | 297,000 | 288,671 |
| 08/01/2025 | 7.000% | | 334,000 | 328,330 |
| Total | 91,856,880 |
| Healthcare Insurance 1.1% |
| Aetna, Inc. |
| 08/15/2047 | 3.875% | | 862,000 | 766,609 |
| Centene Corp. |
| 05/15/2022 | 4.750% | | 440,000 | 444,800 |
| 02/15/2024 | 6.125% | | 324,000 | 339,457 |
| 01/15/2025 | 4.750% | | 91,000 | 88,481 |
| Molina Healthcare, Inc.(e) |
| 06/15/2025 | 4.875% | | 18,000 | 17,100 |
| UnitedHealth Group, Inc. |
| 10/15/2020 | 1.950% | | 7,830,000 | 7,643,975 |
| 04/15/2047 | 4.250% | | 965,000 | 965,982 |
| 10/15/2047 | 3.750% | | 5,685,000 | 5,247,744 |
| WellCare Health Plans, Inc. |
| 04/01/2025 | 5.250% | | 787,000 | 792,400 |
| Total | 16,306,548 |
| Home Construction 0.2% |
| Lennar Corp.(e) |
| 12/15/2021 | 6.250% | | 271,000 | 285,823 |
| 11/15/2024 | 5.875% | | 195,000 | 201,157 |
| 06/15/2027 | 5.000% | | 153,000 | 147,703 |
| 11/29/2027 | 4.750% | | 76,000 | 71,675 |
| Lennar Corp. |
| 04/30/2024 | 4.500% | | 562,000 | 547,734 |
| Meritage Homes Corp. |
| 06/01/2025 | 6.000% | | 444,000 | 457,056 |
| 06/06/2027 | 5.125% | | 43,000 | 40,468 |
The accompanying Notes to Financial Statements are an integral part of this statement.
| 12 | Columbia Corporate Income Fund | Annual Report 2018 |
Portfolio of Investments (continued)
April 30, 2018
| Corporate Bonds & Notes (continued) |
| Issuer | Coupon
Rate | | Principal
Amount ($) | Value ($) |
| Meritage Homes Corp.(e) |
| 06/01/2025 | 6.000% | | 65,000 | 66,875 |
| Taylor Morrison Communities, Inc./Holdings II(e) |
| 04/15/2021 | 5.250% | | 355,000 | 357,631 |
| Total | 2,176,122 |
| Independent Energy 2.0% |
| Anadarko Petroleum Corp. |
| 07/15/2044 | 4.500% | | 1,950,000 | 1,846,369 |
| Apache Corp. |
| 04/15/2043 | 4.750% | | 1,440,000 | 1,424,365 |
| Callon Petroleum Co. |
| 10/01/2024 | 6.125% | | 843,000 | 861,864 |
| Canadian Natural Resources Ltd. |
| 06/01/2047 | 4.950% | | 5,540,000 | 5,735,268 |
| Carrizo Oil & Gas, Inc. |
| 04/15/2023 | 6.250% | | 394,000 | 403,762 |
| Centennial Resource Production LLC(e) |
| 01/15/2026 | 5.375% | | 1,030,000 | 1,020,860 |
| Continental Resources, Inc. |
| 09/15/2022 | 5.000% | | 337,000 | 342,571 |
| CrownRock LP/Finance, Inc.(e) |
| 10/15/2025 | 5.625% | | 1,075,000 | 1,064,626 |
| Diamondback Energy, Inc. |
| 11/01/2024 | 4.750% | | 82,000 | 81,590 |
| 05/31/2025 | 5.375% | | 444,000 | 451,203 |
| Diamondback Energy, Inc.(e) |
| 05/31/2025 | 5.375% | | 580,000 | 587,567 |
| Endeavor Energy Resources LP/Finance, Inc.(e) |
| 01/30/2026 | 5.500% | | 56,000 | 56,174 |
| 01/30/2028 | 5.750% | | 806,000 | 810,307 |
| Extraction Oil & Gas, Inc.(e) |
| 05/15/2024 | 7.375% | | 192,000 | 201,303 |
| 02/01/2026 | 5.625% | | 178,000 | 172,484 |
| Halcon Resources Corp.(e) |
| 02/15/2025 | 6.750% | | 608,000 | 603,671 |
| Halcon Resources Corp. |
| 02/15/2025 | 6.750% | | 222,000 | 221,664 |
| Hess Corp. |
| 04/01/2047 | 5.800% | | 2,870,000 | 2,984,840 |
| Indigo Natural Resources LLC(e) |
| 02/15/2026 | 6.875% | | 207,000 | 198,521 |
| Jagged Peak Energy LLC(e),(h) |
| 05/01/2026 | 5.875% | | 356,000 | 357,480 |
| Laredo Petroleum, Inc. |
| 01/15/2022 | 5.625% | | 861,000 | 870,816 |
| Corporate Bonds & Notes (continued) |
| Issuer | Coupon
Rate | | Principal
Amount ($) | Value ($) |
| Noble Energy, Inc. |
| 11/15/2043 | 5.250% | | 3,148,000 | 3,317,602 |
| Parsley Energy LLC/Finance Corp.(e) |
| 06/01/2024 | 6.250% | | 163,000 | 170,028 |
| 01/15/2025 | 5.375% | | 195,000 | 195,386 |
| 08/15/2025 | 5.250% | | 352,000 | 351,390 |
| 10/15/2027 | 5.625% | | 369,000 | 373,848 |
| PDC Energy, Inc. |
| 09/15/2024 | 6.125% | | 371,000 | 380,387 |
| PDC Energy, Inc.(e) |
| 05/15/2026 | 5.750% | | 365,000 | 367,694 |
| RSP Permian, Inc. |
| 10/01/2022 | 6.625% | | 720,000 | 751,008 |
| 01/15/2025 | 5.250% | | 455,000 | 468,069 |
| SM Energy Co. |
| 06/01/2025 | 5.625% | | 85,000 | 82,165 |
| 09/15/2026 | 6.750% | | 954,000 | 972,067 |
| Whiting Petroleum Corp.(e) |
| 01/15/2026 | 6.625% | | 335,000 | 344,607 |
| WPX Energy, Inc. |
| 01/15/2022 | 6.000% | | 515,000 | 538,499 |
| 09/15/2024 | 5.250% | | 737,000 | 742,538 |
| Total | 29,352,593 |
| Integrated Energy 0.2% |
| Cenovus Energy, Inc. |
| 09/15/2042 | 4.450% | | 2,501,000 | 2,180,512 |
| Leisure 0.1% |
| Boyne U.S.A., Inc.(e) |
| 05/01/2025 | 7.250% | | 218,000 | 225,026 |
| Cedar Fair LP/Canada’s Wonderland Co./Magnum Management Corp./Millenium Operations LLC(e) |
| 04/15/2027 | 5.375% | | 245,000 | 243,759 |
| Live Nation Entertainment, Inc.(e) |
| 11/01/2024 | 4.875% | | 171,000 | 167,373 |
| 03/15/2026 | 5.625% | | 138,000 | 137,945 |
| LTF Merger Sub, Inc.(e) |
| 06/15/2023 | 8.500% | | 151,000 | 158,049 |
| Silversea Cruise Finance Ltd.(e) |
| 02/01/2025 | 7.250% | | 102,000 | 108,077 |
| Viking Cruises Ltd.(e) |
| 09/15/2027 | 5.875% | | 165,000 | 159,152 |
| Total | 1,199,381 |
| Life Insurance 6.8% |
| AIG Global Funding(e) |
| 07/02/2020 | 2.150% | | 2,460,000 | 2,407,381 |
The accompanying Notes to Financial Statements are an integral part of this statement.
Columbia Corporate Income Fund | Annual Report 2018
| 13 |
Portfolio of Investments (continued)
April 30, 2018
| Corporate Bonds & Notes (continued) |
| Issuer | Coupon
Rate | | Principal
Amount ($) | Value ($) |
| American International Group, Inc. |
| 07/10/2025 | 3.750% | | 3,970,000 | 3,875,311 |
| Brighthouse Financial, Inc.(e) |
| 06/22/2047 | 4.700% | | 8,950,000 | 7,852,291 |
| Five Corners Funding Trust(e) |
| 11/15/2023 | 4.419% | | 15,445,000 | 15,967,442 |
| Guardian Life Insurance Co. of America (The)(e) |
| Subordinated |
| 06/19/2064 | 4.875% | | 7,235,000 | 7,408,358 |
| Massachusetts Mutual Life Insurance Co.(e) |
| Subordinated |
| 04/01/2077 | 4.900% | | 5,162,000 | 5,250,487 |
| Metropolitan Life Global Funding I(e) |
| 06/12/2020 | 2.050% | | 7,260,000 | 7,107,446 |
| Northwestern Mutual Life Insurance Co. (The)(e) |
| Subordinated |
| 09/30/2047 | 3.850% | | 5,891,000 | 5,475,455 |
| Nuveen Finance LLC(e) |
| 11/01/2019 | 2.950% | | 19,210,000 | 19,128,876 |
| Peachtree Corners Funding Trust(e) |
| 02/15/2025 | 3.976% | | 16,462,000 | 16,195,530 |
| Teachers Insurance & Annuity Association of America(e) |
| Subordinated |
| 09/15/2044 | 4.900% | | 3,270,000 | 3,487,972 |
| 05/15/2047 | 4.270% | | 3,020,000 | 2,938,478 |
| Voya Financial, Inc. |
| 06/15/2046 | 4.800% | | 2,365,000 | 2,348,613 |
| Total | 99,443,640 |
| Lodging 0.0% |
| Hilton Domestic Operating Co., Inc. |
| 09/01/2024 | 4.250% | | 159,000 | 152,828 |
| Hilton Domestic Operating Co., Inc.(e) |
| 05/01/2026 | 5.125% | | 216,000 | 215,690 |
| Hilton Grand Vacations Borrower LLC/Inc. |
| 12/01/2024 | 6.125% | | 118,000 | 124,731 |
| Total | 493,249 |
| Media and Entertainment 0.9% |
| 21st Century Fox America, Inc. |
| 09/15/2044 | 4.750% | | 4,328,000 | 4,592,631 |
| Discovery Communications LLC |
| 09/20/2047 | 5.200% | | 1,735,000 | 1,697,611 |
| Lamar Media Corp. |
| 02/01/2026 | 5.750% | | 89,000 | 91,815 |
| Match Group, Inc. |
| 06/01/2024 | 6.375% | | 280,000 | 296,632 |
| Corporate Bonds & Notes (continued) |
| Issuer | Coupon
Rate | | Principal
Amount ($) | Value ($) |
| Match Group, Inc.(e) |
| 12/15/2027 | 5.000% | | 172,000 | 168,987 |
| MDC Partners, Inc.(e) |
| 05/01/2024 | 6.500% | | 156,000 | 153,368 |
| Netflix, Inc. |
| 02/15/2025 | 5.875% | | 325,000 | 333,765 |
| 11/15/2026 | 4.375% | | 342,000 | 320,171 |
| Netflix, Inc.(e) |
| 04/15/2028 | 4.875% | | 663,000 | 624,789 |
| 11/15/2028 | 5.875% | | 1,093,000 | 1,090,539 |
| Nielsen Luxembourg SARL(e) |
| 02/01/2025 | 5.000% | | 345,000 | 338,898 |
| Outfront Media Capital LLC/Corp. |
| 03/15/2025 | 5.875% | | 441,000 | 450,124 |
| Time Warner, Inc. |
| 12/15/2043 | 5.350% | | 2,270,000 | 2,393,647 |
| Total | 12,552,977 |
| Metals and Mining 0.5% |
| Big River Steel LLC/Finance Corp.(e) |
| 09/01/2025 | 7.250% | | 550,000 | 574,105 |
| Constellium NV(e) |
| 05/15/2024 | 5.750% | | 531,000 | 522,887 |
| 03/01/2025 | 6.625% | | 491,000 | 499,176 |
| Freeport-McMoRan, Inc. |
| 03/15/2020 | 3.100% | | 1,015,000 | 1,002,188 |
| 03/01/2022 | 3.550% | | 92,000 | 89,090 |
| 11/14/2024 | 4.550% | | 669,000 | 648,864 |
| 03/15/2043 | 5.450% | | 790,000 | 715,840 |
| Grinding Media, Inc./Moly-Cop AltaSteel Ltd.(e) |
| 12/15/2023 | 7.375% | | 341,000 | 359,807 |
| HudBay Minerals, Inc.(e) |
| 01/15/2023 | 7.250% | | 75,000 | 78,238 |
| 01/15/2025 | 7.625% | | 469,000 | 499,856 |
| Novelis Corp.(e) |
| 08/15/2024 | 6.250% | | 128,000 | 130,541 |
| 09/30/2026 | 5.875% | | 574,000 | 570,275 |
| Steel Dynamics, Inc. |
| 09/15/2025 | 4.125% | | 95,000 | 90,666 |
| Teck Resources Ltd.(e) |
| 06/01/2024 | 8.500% | | 214,000 | 238,490 |
| Teck Resources Ltd. |
| 07/15/2041 | 6.250% | | 793,000 | 841,746 |
| Total | 6,861,769 |
| Midstream 4.2% |
| Andeavor Logistics LP/Tesoro Finance Corp. |
| 01/15/2025 | 5.250% | | 155,000 | 158,858 |
The accompanying Notes to Financial Statements are an integral part of this statement.
| 14 | Columbia Corporate Income Fund | Annual Report 2018 |
Portfolio of Investments (continued)
April 30, 2018
| Corporate Bonds & Notes (continued) |
| Issuer | Coupon
Rate | | Principal
Amount ($) | Value ($) |
| Cheniere Corpus Christi Holdings LLC |
| 06/30/2027 | 5.125% | | 266,000 | 259,723 |
| Delek Logistics Partners LP(e) |
| 05/15/2025 | 6.750% | | 226,000 | 225,748 |
| Energy Transfer Equity LP |
| 03/15/2023 | 4.250% | | 260,000 | 251,133 |
| 06/01/2027 | 5.500% | | 1,146,000 | 1,142,732 |
| Enterprise Products Operating LLC |
| 02/15/2021 | 2.800% | | 6,390,000 | 6,310,643 |
| 02/15/2045 | 5.100% | | 3,609,000 | 3,840,719 |
| 02/15/2048 | 4.250% | | 4,479,000 | 4,237,362 |
| Holly Energy Partners LP/Finance Corp.(e) |
| 08/01/2024 | 6.000% | | 708,000 | 712,745 |
| Kinder Morgan Energy Partners LP |
| 03/01/2043 | 5.000% | | 7,656,000 | 7,253,011 |
| Kinder Morgan, Inc. |
| 02/15/2046 | 5.050% | | 8,295,000 | 7,974,730 |
| MPLX LP |
| 04/15/2048 | 4.700% | | 6,750,000 | 6,382,348 |
| NGPL PipeCo LLC(e) |
| 08/15/2022 | 4.375% | | 435,000 | 433,066 |
| 08/15/2027 | 4.875% | | 127,000 | 123,398 |
| 12/15/2037 | 7.768% | | 109,000 | 131,457 |
| NuStar Logistics LP |
| 04/28/2027 | 5.625% | | 247,000 | 233,979 |
| Plains All American Pipeline LP/Finance Corp. |
| 11/01/2024 | 3.600% | | 2,095,000 | 1,981,857 |
| 06/15/2044 | 4.700% | | 8,680,000 | 7,735,191 |
| Rockpoint Gas Storage Canada Ltd.(e) |
| 03/31/2023 | 7.000% | | 372,000 | 371,330 |
| Sunoco Logistics Partners Operations LP |
| 10/01/2047 | 5.400% | | 3,460,000 | 3,288,325 |
| Sunoco LP/Finance Corp.(e) |
| 01/15/2023 | 4.875% | | 116,000 | 114,086 |
| 02/15/2026 | 5.500% | | 487,000 | 472,602 |
| 03/15/2028 | 5.875% | | 121,000 | 117,528 |
| Tallgrass Energy Partners LP/Finance Corp.(e) |
| 09/15/2024 | 5.500% | | 100,000 | 101,348 |
| 01/15/2028 | 5.500% | | 631,000 | 627,916 |
| Targa Resources Partners LP/Finance Corp. |
| 11/15/2023 | 4.250% | | 262,000 | 247,891 |
| 02/01/2027 | 5.375% | | 868,000 | 831,113 |
| Targa Resources Partners LP/Finance Corp.(e) |
| 04/15/2026 | 5.875% | | 261,000 | 259,106 |
| 01/15/2028 | 5.000% | | 894,000 | 833,665 |
| TransMontaigne Partners LP/TLP Finance Corp. |
| 02/15/2026 | 6.125% | | 870,000 | 869,982 |
| Corporate Bonds & Notes (continued) |
| Issuer | Coupon
Rate | | Principal
Amount ($) | Value ($) |
| Williams Companies, Inc. (The) |
| 01/15/2023 | 3.700% | | 244,000 | 235,983 |
| 06/24/2024 | 4.550% | | 698,000 | 695,685 |
| Williams Partners LP |
| 09/15/2045 | 5.100% | | 3,584,000 | 3,542,415 |
| Total | 61,997,675 |
| Natural Gas 1.6% |
| NiSource Finance Corp. |
| 03/30/2048 | 3.950% | | 4,840,000 | 4,469,977 |
| NiSource, Inc. |
| 05/15/2047 | 4.375% | | 7,120,000 | 7,044,094 |
| Sempra Energy |
| 06/15/2024 | 3.550% | | 4,015,000 | 3,950,029 |
| 06/15/2027 | 3.250% | | 7,000,000 | 6,568,275 |
| 02/01/2028 | 3.400% | | 1,795,000 | 1,697,898 |
| Total | 23,730,273 |
| Oil Field Services 0.2% |
| Diamond Offshore Drilling, Inc. |
| 08/15/2025 | 7.875% | | 193,000 | 198,151 |
| Nabors Industries, Inc.(e) |
| 02/01/2025 | 5.750% | | 842,000 | 800,382 |
| Rowan Companies, Inc. |
| 01/15/2024 | 4.750% | | 177,000 | 151,778 |
| SESI LLC(e) |
| 09/15/2024 | 7.750% | | 427,000 | 443,185 |
| Transocean, Inc.(e) |
| 01/15/2026 | 7.500% | | 115,000 | 116,685 |
| U.S.A. Compression Partners LP/Finance Corp.(e) |
| 04/01/2026 | 6.875% | | 362,000 | 369,240 |
| Weatherford International LLC(e) |
| 03/01/2025 | 9.875% | | 83,000 | 79,030 |
| Weatherford International Ltd. |
| 06/15/2023 | 8.250% | | 243,000 | 229,048 |
| Total | 2,387,499 |
| Other Financial Institutions 0.0% |
| Icahn Enterprises LP/Finance Corp. |
| 02/01/2022 | 6.250% | | 142,000 | 145,257 |
| Other Industry 0.0% |
| KAR Auction Services, Inc.(e) |
| 06/01/2025 | 5.125% | | 442,000 | 431,455 |
The accompanying Notes to Financial Statements are an integral part of this statement.
Columbia Corporate Income Fund | Annual Report 2018
| 15 |
Portfolio of Investments (continued)
April 30, 2018
| Corporate Bonds & Notes (continued) |
| Issuer | Coupon
Rate | | Principal
Amount ($) | Value ($) |
| Other REIT 0.1% |
| CyrusOne LP/Finance Corp. |
| 03/15/2024 | 5.000% | | 159,000 | 159,670 |
| 03/15/2027 | 5.375% | | 571,000 | 571,771 |
| Total | 731,441 |
| Packaging 0.4% |
| ARD Finance SA PIK |
| 09/15/2023 | 7.125% | | 200,000 | 204,883 |
| Ardagh Packaging Finance PLC/Holdings U.S.A., Inc.(e) |
| 05/15/2023 | 4.625% | | 213,000 | 213,690 |
| 05/15/2024 | 7.250% | | 510,000 | 539,488 |
| 02/15/2025 | 6.000% | | 718,000 | 727,204 |
| Berry Global, Inc. |
| 10/15/2022 | 6.000% | | 660,000 | 686,734 |
| 07/15/2023 | 5.125% | | 480,000 | 484,132 |
| Crown Americas LLC/Capital Corp. VI(e) |
| 02/01/2026 | 4.750% | | 175,000 | 168,888 |
| Multi-Color Corp.(e) |
| 11/01/2025 | 4.875% | | 582,000 | 544,335 |
| Novolex (e) |
| 01/15/2025 | 6.875% | | 97,000 | 97,657 |
| Owens-Brockway Glass Container, Inc.(e) |
| 01/15/2025 | 5.375% | | 99,000 | 98,753 |
| Reynolds Group Issuer, Inc./LLC |
| 10/15/2020 | 5.750% | | 1,288,913 | 1,298,315 |
| Reynolds Group Issuer, Inc./LLC(e) |
| 07/15/2024 | 7.000% | | 374,000 | 389,203 |
| Total | 5,453,282 |
| Pharmaceuticals 3.7% |
| AbbVie, Inc. |
| 05/14/2020 | 2.500% | | 3,569,000 | 3,525,462 |
| 05/14/2026 | 3.200% | | 2,978,000 | 2,783,936 |
| 05/14/2046 | 4.450% | | 1,345,000 | 1,288,526 |
| Actavis Funding SCS |
| 03/12/2020 | 3.000% | | 5,027,000 | 4,988,639 |
| Allergan Funding SCS |
| 03/15/2025 | 3.800% | | 10,825,000 | 10,401,894 |
| Amgen, Inc. |
| 06/15/2051 | 4.663% | | 7,980,000 | 7,982,442 |
| Catalent Pharma Solutions, Inc.(e) |
| 01/15/2026 | 4.875% | | 519,000 | 504,951 |
| Celgene Corp. |
| 02/20/2048 | 4.550% | | 3,335,000 | 3,141,990 |
| Gilead Sciences, Inc. |
| 03/01/2047 | 4.150% | | 3,785,000 | 3,615,193 |
| Corporate Bonds & Notes (continued) |
| Issuer | Coupon
Rate | | Principal
Amount ($) | Value ($) |
| Jaguar Holding Co. II/Pharmaceutical Product Development LLC(e) |
| 08/01/2023 | 6.375% | | 791,000 | 804,941 |
| Johnson & Johnson |
| 11/10/2020 | 1.950% | | 1,840,000 | 1,802,582 |
| Mylan NV |
| 06/15/2046 | 5.250% | | 585,000 | 570,509 |
| Pfizer, Inc. |
| 12/15/2046 | 4.125% | | 1,190,000 | 1,183,710 |
| Shire Acquisitions Investments Ireland DAC |
| 09/23/2019 | 1.900% | | 8,295,000 | 8,151,181 |
| Valeant Pharmaceuticals International, Inc.(e) |
| 05/15/2023 | 5.875% | | 633,000 | 581,209 |
| 03/15/2024 | 7.000% | | 400,000 | 422,381 |
| 04/15/2025 | 6.125% | | 844,000 | 759,810 |
| 11/01/2025 | 5.500% | | 207,000 | 205,965 |
| 12/15/2025 | 9.000% | | 52,000 | 52,754 |
| 04/01/2026 | 9.250% | | 675,000 | 687,905 |
| Total | 53,455,980 |
| Property & Casualty 2.0% |
| Alleghany Corp. |
| 06/27/2022 | 4.950% | | 3,341,000 | 3,506,213 |
| CNA Financial Corp. |
| 05/15/2024 | 3.950% | | 13,546,000 | 13,531,343 |
| HUB International Ltd.(e) |
| 10/01/2021 | 7.875% | | 1,165,000 | 1,214,269 |
| 05/01/2026 | 7.000% | | 404,000 | 404,451 |
| Liberty Mutual Insurance Co.(e) |
| Subordinated |
| 10/15/2026 | 7.875% | | 8,170,000 | 10,172,165 |
| Total | 28,828,441 |
| Railroads 0.5% |
| Canadian National Railway Co. |
| 02/03/2020 | 2.400% | | 2,985,000 | 2,962,454 |
| CSX Corp. |
| 03/01/2048 | 4.300% | | 3,845,000 | 3,745,738 |
| Norfolk Southern Corp.(e) |
| 08/15/2052 | 4.050% | | 1,190,000 | 1,114,686 |
| Total | 7,822,878 |
| Restaurants 1.0% |
| 1011778 BC ULC/New Red Finance, Inc.(e) |
| 05/15/2024 | 4.250% | | 760,000 | 726,559 |
| 10/15/2025 | 5.000% | | 224,000 | 215,871 |
| IRB Holding Corp.(e) |
| 02/15/2026 | 6.750% | | 363,000 | 352,091 |
The accompanying Notes to Financial Statements are an integral part of this statement.
| 16 | Columbia Corporate Income Fund | Annual Report 2018 |
Portfolio of Investments (continued)
April 30, 2018
| Corporate Bonds & Notes (continued) |
| Issuer | Coupon
Rate | | Principal
Amount ($) | Value ($) |
| McDonald’s Corp. |
| 05/26/2020 | 2.200% | | 2,785,000 | 2,744,350 |
| 12/09/2045 | 4.875% | | 5,309,000 | 5,621,074 |
| Yum! Brands, Inc. |
| 11/01/2043 | 5.350% | | 5,950,000 | 5,381,240 |
| Total | 15,041,185 |
| Retail REIT 0.1% |
| Simon Property Group LP |
| 12/01/2027 | 3.375% | | 2,060,000 | 1,950,534 |
| Retailers 0.9% |
| Dollar Tree, Inc. |
| 03/01/2023 | 5.750% | | 509,000 | 530,976 |
| Hanesbrands, Inc.(e) |
| 05/15/2024 | 4.625% | | 137,000 | 132,879 |
| 05/15/2026 | 4.875% | | 136,000 | 131,198 |
| Home Depot, Inc. (The) |
| 09/10/2018 | 2.250% | | 1,166,000 | 1,165,159 |
| L Brands, Inc. |
| 02/01/2028 | 5.250% | | 141,000 | 132,501 |
| 11/01/2035 | 6.875% | | 310,000 | 294,079 |
| Lowe’s Companies, Inc. |
| 04/15/2026 | 2.500% | | 3,765,000 | 3,447,132 |
| Penske Automotive Group, Inc. |
| 08/15/2020 | 3.750% | | 360,000 | 358,755 |
| 12/01/2024 | 5.375% | | 96,000 | 95,220 |
| 05/15/2026 | 5.500% | | 93,000 | 90,277 |
| Target Corp. |
| 04/15/2046 | 3.625% | | 2,055,000 | 1,841,130 |
| 11/15/2047 | 3.900% | | 900,000 | 836,955 |
| Walmart, Inc. |
| 10/09/2019 | 1.750% | | 4,610,000 | 4,561,701 |
| Total | 13,617,962 |
| Supermarkets 0.6% |
| Kroger Co. (The) |
| 02/01/2047 | 4.450% | | 5,112,000 | 4,689,335 |
| 01/15/2048 | 4.650% | | 3,998,000 | 3,753,002 |
| Total | 8,442,337 |
| Technology 5.2% |
| Apple, Inc. |
| 11/13/2019 | 1.800% | | 12,005,000 | 11,858,755 |
| 02/09/2045 | 3.450% | | 6,786,000 | 6,064,438 |
| Ascend Learning LLC(e) |
| 08/01/2025 | 6.875% | | 213,000 | 216,649 |
| Broadcom Corp./Cayman Finance Ltd. |
| 01/15/2027 | 3.875% | | 11,742,000 | 11,211,145 |
| 01/15/2028 | 3.500% | | 3,190,000 | 2,942,973 |
| Corporate Bonds & Notes (continued) |
| Issuer | Coupon
Rate | | Principal
Amount ($) | Value ($) |
| Camelot Finance SA(e) |
| 10/15/2024 | 7.875% | | 831,000 | 865,727 |
| CDK Global, Inc. |
| 06/01/2027 | 4.875% | | 141,000 | 135,230 |
| Cisco Systems, Inc. |
| 09/20/2019 | 1.400% | | 7,310,000 | 7,194,326 |
| Equinix, Inc. |
| 01/01/2022 | 5.375% | | 470,000 | 485,214 |
| 01/15/2026 | 5.875% | | 84,000 | 86,928 |
| 05/15/2027 | 5.375% | | 1,182,000 | 1,200,645 |
| First Data Corp.(e) |
| 08/15/2023 | 5.375% | | 574,000 | 583,740 |
| 12/01/2023 | 7.000% | | 770,000 | 805,860 |
| 01/15/2024 | 5.750% | | 895,000 | 907,438 |
| Gartner, Inc.(e) |
| 04/01/2025 | 5.125% | | 705,000 | 708,535 |
| Informatica LLC(e) |
| 07/15/2023 | 7.125% | | 264,000 | 264,452 |
| Intel Corp. |
| 05/11/2020 | 1.850% | | 7,178,000 | 7,052,019 |
| Iron Mountain, Inc.(e) |
| 09/15/2027 | 4.875% | | 624,000 | 584,119 |
| 03/15/2028 | 5.250% | | 267,000 | 251,216 |
| Microsemi Corp.(e) |
| 04/15/2023 | 9.125% | | 128,000 | 141,139 |
| Microsoft Corp. |
| 05/01/2018 | 1.000% | | 6,152,000 | 6,151,865 |
| MSCI, Inc.(e) |
| 11/15/2024 | 5.250% | | 447,000 | 458,155 |
| 08/15/2025 | 5.750% | | 268,000 | 279,836 |
| 08/01/2026 | 4.750% | | 81,000 | 80,396 |
| Oracle Corp. |
| 09/15/2021 | 1.900% | | 6,800,000 | 6,562,184 |
| 07/15/2046 | 4.000% | | 2,575,000 | 2,493,030 |
| 11/15/2047 | 4.000% | | 2,689,000 | 2,610,855 |
| PTC, Inc. |
| 05/15/2024 | 6.000% | | 281,000 | 295,151 |
| QUALCOMM, Inc. |
| 05/20/2047 | 4.300% | | 2,025,000 | 1,838,896 |
| Qualitytech LP/QTS Finance Corp.(e) |
| 11/15/2025 | 4.750% | | 426,000 | 401,249 |
| Sensata Technologies UK Financing Co. PLC(e) |
| 02/15/2026 | 6.250% | | 200,000 | 208,244 |
| Symantec Corp.(e) |
| 04/15/2025 | 5.000% | | 545,000 | 545,647 |
| Tempo Acquisition LLC/Finance Corp.(e) |
| 06/01/2025 | 6.750% | | 340,000 | 337,613 |
The accompanying Notes to Financial Statements are an integral part of this statement.
Columbia Corporate Income Fund | Annual Report 2018
| 17 |
Portfolio of Investments (continued)
April 30, 2018
| Corporate Bonds & Notes (continued) |
| Issuer | Coupon
Rate | | Principal
Amount ($) | Value ($) |
| Vantiv LLC/Vanity Issuer Corp.(e) |
| 11/15/2025 | 4.375% | | 150,000 | 143,691 |
| VeriSign, Inc. |
| 05/01/2023 | 4.625% | | 382,000 | 382,828 |
| 07/15/2027 | 4.750% | | 279,000 | 267,915 |
| Total | 76,618,103 |
| Tobacco 0.1% |
| BAT Capital Corp.(e) |
| 08/15/2047 | 4.540% | | 1,430,000 | 1,360,167 |
| Transportation Services 1.7% |
| Avis Budget Car Rental LLC/Finance, Inc.(e) |
| 03/15/2025 | 5.250% | | 421,000 | 403,025 |
| ERAC U.S.A. Finance LLC(e) |
| 02/15/2045 | 4.500% | | 2,860,000 | 2,766,984 |
| FedEx Corp. |
| 04/01/2046 | 4.550% | | 8,235,000 | 8,110,511 |
| Hertz Corp. (The)(e) |
| 06/01/2022 | 7.625% | | 429,000 | 437,145 |
| United Parcel Service, Inc. |
| 04/01/2021 | 2.050% | | 8,335,000 | 8,124,258 |
| 11/15/2047 | 3.750% | | 4,920,000 | 4,598,193 |
| Total | 24,440,116 |
| Wireless 1.1% |
| Altice France SA(e) |
| 05/01/2026 | 7.375% | | 1,192,000 | 1,156,308 |
| America Movil SAB de CV |
| 03/30/2020 | 5.000% | | 4,750,000 | 4,896,623 |
| American Tower Corp. |
| 07/15/2027 | 3.550% | | 3,105,000 | 2,903,184 |
| SBA Communications Corp. |
| 09/01/2024 | 4.875% | | 891,000 | 857,854 |
| Sprint Communications, Inc.(e) |
| 11/15/2018 | 9.000% | | 311,000 | 320,615 |
| Sprint Communications, Inc. |
| 11/15/2022 | 6.000% | | 448,000 | 456,455 |
| Sprint Corp. |
| 09/15/2021 | 7.250% | | 624,000 | 662,327 |
| 06/15/2024 | 7.125% | | 316,000 | 327,379 |
| 02/15/2025 | 7.625% | | 322,000 | 338,904 |
| 03/01/2026 | 7.625% | | 742,000 | 781,511 |
| T-Mobile U.S.A., Inc. |
| 01/15/2026 | 6.500% | | 1,101,000 | 1,171,175 |
| 02/01/2026 | 4.500% | | 748,000 | 719,637 |
| 02/01/2028 | 4.750% | | 324,000 | 312,036 |
| Vodafone Group PLC |
| 02/19/2043 | 4.375% | | 1,635,000 | 1,498,108 |
| Corporate Bonds & Notes (continued) |
| Issuer | Coupon
Rate | | Principal
Amount ($) | Value ($) |
| Wind Tre SpA(e) |
| 01/20/2026 | 5.000% | | 340,000 | 284,376 |
| Total | 16,686,492 |
| Wirelines 2.4% |
| AT&T, Inc. |
| 06/15/2045 | 4.350% | | 12,112,000 | 10,661,976 |
| 03/01/2047 | 5.450% | | 4,475,000 | 4,574,631 |
| CenturyLink, Inc. |
| 03/15/2022 | 5.800% | | 45,000 | 44,777 |
| 12/01/2023 | 6.750% | | 687,000 | 684,852 |
| 04/01/2025 | 5.625% | | 155,000 | 142,442 |
| Frontier Communications Corp. |
| 01/15/2023 | 7.125% | | 108,000 | 77,205 |
| 04/15/2024 | 7.625% | | 143,000 | 94,000 |
| 01/15/2025 | 6.875% | | 527,000 | 322,520 |
| Frontier Communications Corp.(e) |
| 04/01/2026 | 8.500% | | 238,000 | 230,968 |
| Level 3 Financing, Inc. |
| 08/15/2022 | 5.375% | | 422,000 | 423,649 |
| Telecom Italia Capital SA |
| 09/30/2034 | 6.000% | | 520,000 | 540,215 |
| Telecom Italia SpA(e) |
| 05/30/2024 | 5.303% | | 171,000 | 173,893 |
| Telefonica Emisiones SAU |
| 03/08/2027 | 4.103% | | 4,370,000 | 4,316,026 |
| Verizon Communications, Inc. |
| 03/15/2055 | 4.672% | | 12,527,600 | 11,471,323 |
| Zayo Group LLC/Capital, Inc.(e) |
| 01/15/2027 | 5.750% | | 781,000 | 774,973 |
| Total | 34,533,450 |
Total Corporate Bonds & Notes
(Cost $1,397,810,413) | 1,364,701,759 |
|
| Foreign Government Obligations(i) 0.1% |
| | | | |
| Canada 0.0% |
| NOVA Chemicals Corp.(e) |
| 06/01/2024 | 4.875% | | 236,000 | 228,924 |
| 06/01/2027 | 5.250% | | 50,000 | 48,103 |
| Total | 277,027 |
The accompanying Notes to Financial Statements are an integral part of this statement.
| 18 | Columbia Corporate Income Fund | Annual Report 2018 |
Portfolio of Investments (continued)
April 30, 2018
| Foreign Government Obligations(i) (continued) |
| Issuer | Coupon
Rate | | Principal
Amount ($) | Value ($) |
| Mexico 0.1% |
| Petroleos Mexicanos |
| 06/27/2044 | 5.500% | | 334,000 | 281,709 |
| 09/21/2047 | 6.750% | | 666,000 | 642,834 |
| Total | 924,543 |
Total Foreign Government Obligations
(Cost $1,254,150) | 1,201,570 |
|
| Senior Loans 0.0% |
| Borrower | Weighted
Average Coupon | | Principal
Amount ($) | Value ($) |
| Property & Casualty 0.0% |
| Hub International Limited(j),(k),(l) |
| Term Loan |
3-month USD LIBOR + 3.000%
04/25/2025 | | | 124,000 | 124,723 |
| Technology 0.0% |
| Ascend Learning LLC(k),(l) |
| Term Loan |
3-month USD LIBOR + 3.000%
07/12/2024 | 4.901% | | 44,775 | 44,915 |
| Hyland Software, Inc.(k),(l) |
| Tranche 3 1st Lien Term Loan |
3-month USD LIBOR + 3.250%
07/01/2022 | 5.141% | | 64,875 | 65,402 |
| Misys Ltd.(k),(l) |
| 1st Lien Term Loan |
3-month USD LIBOR + 3.500%
06/13/2024 | 5.484% | | 146,057 | 145,908 |
| Total | 256,225 |
Total Senior Loans
(Cost $378,301) | 380,948 |
|
| U.S. Treasury Obligations 0.4% |
| Issuer | Coupon
Rate | | Principal
Amount ($) | Value ($) |
| U.S. Treasury |
| 08/15/2047 | 2.750% | | 6,661,000 | 6,216,029 |
Total U.S. Treasury Obligations
(Cost $6,584,970) | 6,216,029 |
| Money Market Funds 4.8% |
| | Shares | Value ($) |
| Columbia Short-Term Cash Fund, 1.889%(m),(n) | 70,389,494 | 70,382,455 |
Total Money Market Funds
(Cost $70,384,868) | 70,382,455 |
Total Investments in Securities
(Cost: $1,477,490,374) | 1,442,912,063 |
| Other Assets & Liabilities, Net | | 21,799,866 |
| Net Assets | 1,464,711,929 |
At April 30, 2018, securities and/or cash totaling $1,587,062 were pledged as collateral.
Investments in derivatives
| Long futures contracts |
| Description | Number of
contracts | Expiration
date | Trading
currency | Notional
amount | Value/Unrealized
appreciation ($) | Value/Unrealized
depreciation ($) |
| U.S. Treasury 5-Year Note | 1,498 | 06/2018 | USD | 170,439,189 | — | (880,805) |
The accompanying Notes to Financial Statements are an integral part of this statement.
Columbia Corporate Income Fund | Annual Report 2018
| 19 |
Portfolio of Investments (continued)
April 30, 2018
| Short futures contracts |
| Description | Number of
contracts | Expiration
date | Trading
currency | Notional
amount | Value/Unrealized
appreciation ($) | Value/Unrealized
depreciation ($) |
| U.S. Long Bond | (140) | 06/2018 | USD | (20,298,968) | — | (110,705) |
| U.S. Treasury 10-Year Note | (298) | 06/2018 | USD | (35,843,062) | 190,041 | — |
| U.S. Treasury Ultra 10-Year Note | (608) | 06/2018 | USD | (78,576,886) | 348,027 | — |
| U.S. Ultra Bond | (277) | 06/2018 | USD | (44,115,618) | — | (104,550) |
| Total | | | | | 538,068 | (215,255) |
Notes to Portfolio of Investments
| (a) | Represents fair value as determined in good faith under procedures approved by the Board of Trustees. At April 30, 2018, the value of these securities amounted to $9,525, which represents less than 0.01% of net assets. |
| (b) | Non-income producing investment. |
| (c) | Negligible market value. |
| (d) | Valuation based on significant unobservable inputs. |
| (e) | Represents privately placed and other securities and instruments exempt from SEC registration (collectively, private placements), such as Section 4(a)(2) and Rule 144A eligible securities, which are often sold only to qualified institutional buyers. The Fund may invest in private placements determined to be liquid as well as those determined to be illiquid. Private placements may be determined to be liquid under guidelines established by the Fund’s Board of Trustees. At April 30, 2018, the value of these securities amounted to $242,404,301, which represents 16.55% of net assets. |
| (f) | Represents a variable rate security with a step coupon where the rate adjusts according to a schedule for a series of periods, typically lower for an initial period and then increasing to a higher coupon rate thereafter. The interest rate shown was the current rate as of April 30, 2018. |
| (g) | Represents securities that have defaulted on payment of interest. The Fund has stopped accruing interest on these securities. At April 30, 2018, the value of these securities amounted to $9,525, which represents less than 0.01% of net assets. |
| (h) | Represents a security purchased on a when-issued basis. |
| (i) | Principal and interest may not be guaranteed by the government. |
| (j) | Represents a security purchased on a forward commitment basis. |
| (k) | Senior loans have interest rates that float periodically based primarily on the London Interbank Offered Rate (“LIBOR”) and other short-term rates. The interest rate shown reflects the weighted average coupon as of April 30, 2018. The interest rate for senior loans purchased on a when-issued or delayed delivery basis will be determined upon settlement therefore no weighted average coupon rate is disclosed. Remaining maturities of senior loans may be less than the stated maturities shown as a result of contractual or optional prepayments by the borrower. Such prepayments cannot be predicted. |
| (l) | Variable rate security. The interest rate shown was the current rate as of April 30, 2018. |
| (m) | The rate shown is the seven-day current annualized yield at April 30, 2018. |
| (n) | As defined in the Investment Company Act of 1940, an affiliated company is one in which the Fund owns 5% or more of the company’s outstanding voting securities, or a company which is under common ownership or control with the Fund. Holdings and transactions in these affiliated companies during the year ended April 30, 2018 are as follows: |
| Issuer | Beginning
shares | Shares
purchased | Shares
sold | Ending
shares | Realized gain
(loss) —
affiliated
issuers ($) | Net change in
unrealized
appreciation
(depreciation) —
affiliated
issuers ($) | Dividends —
affiliated
issuers ($) | Value —
affiliated
issuers
at end of
period ($) |
| Columbia Short-Term Cash Fund, 1.889% |
| | 88,021,127 | 738,741,047 | (756,372,680) | 70,389,494 | (3,993) | (3,004) | 1,035,640 | 70,382,455 |
Abbreviation Legend
Currency Legend
Fair value measurements
The Fund categorizes its fair value measurements according to a three-level hierarchy that maximizes the use of observable inputs and minimizes the use of unobservable inputs by prioritizing that the most observable input be used when available. Observable inputs are those that market participants would use in pricing an investment based on market data obtained from sources independent of the reporting entity. Unobservable inputs are those that reflect the Fund’s assumptions about the information market participants would use in
The accompanying Notes to Financial Statements are an integral part of this statement.
| 20 | Columbia Corporate Income Fund | Annual Report 2018 |
Portfolio of Investments (continued)
April 30, 2018
Fair value measurements (continued)
pricing an investment. An investment’s level within the fair value hierarchy is based on the lowest level of any input that is deemed significant to the asset’s or liability’s fair value measurement. The input levels are not necessarily an indication of the risk or liquidity associated with investments at that level. For example, certain U.S. government securities are generally high quality and liquid, however, they are reflected as Level 2 because the inputs used to determine fair value may not always be quoted prices in an active market.
Fair value inputs are summarized in the three broad levels listed below:
| ■ | Level 1 — Valuations based on quoted prices for investments in active markets that the Fund has the ability to access at the measurement date. Valuation adjustments are not applied to Level 1 investments. |
| ■ | Level 2 — Valuations based on other significant observable inputs (including quoted prices for similar securities, interest rates, prepayment speeds, credit risks, etc.). |
| ■ | Level 3 — Valuations based on significant unobservable inputs (including the Fund’s own assumptions and judgment in determining the fair value of investments). |
Inputs that are used in determining fair value of an investment may include price information, credit data, volatility statistics, and other factors. These inputs can be either observable or unobservable. The availability of observable inputs can vary between investments, and is affected by various factors such as the type of investment, and the volume and level of activity for that investment or similar investments in the marketplace. The inputs will be considered by the Investment Manager, along with any other relevant factors in the calculation of an investment’s fair value. The Fund uses prices and inputs that are current as of the measurement date, which may include periods of market dislocations. During these periods, the availability of prices and inputs may be reduced for many investments. This condition could cause an investment to be reclassified between the various levels within the hierarchy.
Certain investments that have been measured at fair value using the net asset value (NAV) per share (or its equivalent) are not categorized in the fair value hierarchy. The fair value amounts presented in the table are intended to reconcile the fair value hierarchy to the amounts presented in the Portfolio of Investments. The Columbia Short-Term Cash Fund seeks to provide shareholders with maximum current income consistent with liquidity and stability of principal. Columbia Short-Term Cash Fund prices its shares with a floating NAV and no longer seeks to maintain a stable NAV.
Investments falling into the Level 3 category are primarily supported by quoted prices from brokers and dealers participating in the market for those investments. However, these may be classified as Level 3 investments due to lack of market transparency and corroboration to support these quoted prices. Additionally, valuation models may be used as the pricing source for any remaining investments classified as Level 3. These models may rely on one or more significant unobservable inputs and/or significant assumptions by the Investment Manager. Inputs used in valuations may include, but are not limited to, financial statement analysis, capital account balances, discount rates and estimated cash flows, and comparable company data.
Under the direction of the Fund’s Board of Trustees (the Board), the Investment Manager’s Valuation Committee (the Committee) is responsible for overseeing the valuation procedures approved by the Board. The Committee consists of voting and non-voting members from various groups within the Investment Manager’s organization, including operations and accounting, trading and investments, compliance, risk management and legal.
The Committee meets at least monthly to review and approve valuation matters, which may include a description of specific valuation determinations, data regarding pricing information received from approved pricing vendors and brokers and the results of Board-approved valuation control policies and procedures (the Policies). The Policies address, among other things, instances when market quotations are or are not readily available, including recommendations of third party pricing vendors and a determination of appropriate pricing methodologies; events that require specific valuation determinations and assessment of fair value techniques; securities with a potential for stale pricing, including those that are illiquid, restricted, or in default; and the effectiveness of third party pricing vendors, including periodic reviews of vendors. The Committee meets more frequently, as needed, to discuss additional valuation matters, which may include the need to review back-testing results, review time-sensitive information or approve related valuation actions. The Committee reports to the Board, with members of the Committee meeting with the Board at each of its regularly scheduled meetings to discuss valuation matters and actions during the period, similar to those described earlier.
For investments categorized as Level 3, the Committee monitors information similar to that described above, which may include: (i) data specific to the issuer or comparable issuers, (ii) general market or specific sector news and (iii) quoted prices and specific or similar security transactions. The Committee considers this data and any changes from prior periods in order to assess the reasonableness of observable and unobservable inputs, any assumptions or internal models used to value those securities and changes in fair value. This data is also used to corroborate, when available, information received from approved pricing vendors and brokers. Various factors impact the frequency of monitoring this information (which may occur as often as daily). However, the Committee may determine that changes to inputs, assumptions and models are not required as a result of the monitoring procedures performed.
The following table is a summary of the inputs used to value the Fund’s investments at April 30, 2018:
| | Level 1
quoted prices
in active
markets for
identical
assets ($) | Level 2
other
significant
observable
inputs ($) | Level 3
significant
unobservable
inputs ($) | Investments
measured at
net asset
value ($) | Total ($) |
| Investments in Securities | | | | | |
| Common Stocks | | | | | |
| Financials | 29,302 | — | — | — | 29,302 |
| Corporate Bonds & Notes | — | 1,364,692,234 | 9,525 | — | 1,364,701,759 |
| Foreign Government Obligations | — | 1,201,570 | — | — | 1,201,570 |
| Senior Loans | — | 380,948 | — | — | 380,948 |
| U.S. Treasury Obligations | 6,216,029 | — | — | — | 6,216,029 |
| Money Market Funds | — | — | — | 70,382,455 | 70,382,455 |
| Total Investments in Securities | 6,245,331 | 1,366,274,752 | 9,525 | 70,382,455 | 1,442,912,063 |
| Investments in Derivatives | | | | | |
| Asset | | | | | |
| Futures Contracts | 538,068 | — | — | — | 538,068 |
The accompanying Notes to Financial Statements are an integral part of this statement.
Columbia Corporate Income Fund | Annual Report 2018
| 21 |
Portfolio of Investments (continued)
April 30, 2018
Fair value measurements (continued)
| | Level 1
quoted prices
in active
markets for
identical
assets ($) | Level 2
other
significant
observable
inputs ($) | Level 3
significant
unobservable
inputs ($) | Investments
measured at
net asset
value ($) | Total ($) |
| Liability | | | | | |
| Futures Contracts | (1,096,060) | — | — | — | (1,096,060) |
| Total | 5,687,339 | 1,366,274,752 | 9,525 | 70,382,455 | 1,442,354,071 |
See the Portfolio of Investments for all investment classifications not indicated in the table.
The Fund’s assets assigned to the Level 2 input category are generally valued using the market approach, in which a security’s value is determined through reference to prices and information from market transactions for similar or identical assets.
Derivative instruments are valued at unrealized appreciation (depreciation).
There were no transfers of financial assets between levels during the period.
The Fund does not hold any significant investments (greater than one percent of net assets) categorized as Level 3.
The Fund’s assets assigned to the Level 3 category are valued utilizing the valuation technique deemed the most appropriate in the circumstances. Certain corporate bonds and common stocks classified as Level 3 are valued using an income approach. To determine fair value for these securities, management considered estimates of future distributions from the liquidation of company assets or potential actions related to the respective company’s bankruptcy filing. Significant increases (decreases) to any of these inputs would result in a significantly lower (higher) fair value measurement. Generally, a change in the bankruptcy filings would result in a directionally similar change to estimates of future distributions.
The accompanying Notes to Financial Statements are an integral part of this statement.
| 22 | Columbia Corporate Income Fund | Annual Report 2018 |
Statement of Assets and Liabilities
April 30, 2018
| Assets | |
| Investments in securities, at value | |
| Unaffiliated issuers (cost $1,407,105,506) | $1,372,529,608 |
| Affiliated issuers (cost $70,384,868) | 70,382,455 |
| Cash | 52,525 |
| Margin deposits on: | |
| Futures contracts | 1,587,062 |
| Receivable for: | |
| Investments sold | 15,431,188 |
| Capital shares sold | 4,523,233 |
| Dividends | 61,819 |
| Interest | 13,804,314 |
| Foreign tax reclaims | 75,780 |
| Variation margin for futures contracts | 93,625 |
| Expense reimbursement due from Investment Manager | 2,973 |
| Prepaid expenses | 1,720 |
| Trustees’ deferred compensation plan | 121,514 |
| Total assets | 1,478,667,816 |
| Liabilities | |
| Payable for: | |
| Investments purchased | 7,660,130 |
| Investments purchased on a delayed delivery basis | 813,129 |
| Capital shares purchased | 897,680 |
| Distributions to shareholders | 3,716,843 |
| Variation margin for futures contracts | 488,781 |
| Management services fees | 59,088 |
| Distribution and/or service fees | 1,856 |
| Transfer agent fees | 129,135 |
| Compensation of chief compliance officer | 39 |
| Other expenses | 67,692 |
| Trustees’ deferred compensation plan | 121,514 |
| Total liabilities | 13,955,887 |
| Net assets applicable to outstanding capital stock | $1,464,711,929 |
| Represented by | |
| Paid in capital | 1,501,210,634 |
| Excess of distributions over net investment income | (497,291) |
| Accumulated net realized loss | (865,111) |
| Unrealized appreciation (depreciation) on: | |
| Investments - unaffiliated issuers | (34,575,898) |
| Investments - affiliated issuers | (2,413) |
| Futures contracts | (557,992) |
| Total - representing net assets applicable to outstanding capital stock | $1,464,711,929 |
The accompanying Notes to Financial Statements are an integral part of this statement.
Columbia Corporate Income Fund | Annual Report 2018
| 23 |
Statement of Assets and Liabilities (continued)
April 30, 2018
| Class A | |
| Net assets | $63,283,249 |
| Shares outstanding | 6,404,247 |
| Net asset value per share | $9.88 |
| Maximum sales charge | 4.75% |
| Maximum offering price per share (calculated by dividing the net asset value per share by 1.0 minus the maximum sales charge for Class A shares) | $10.37 |
| Advisor Class | |
| Net assets | $9,008,789 |
| Shares outstanding | 912,956 |
| Net asset value per share | $9.87 |
| Class C | |
| Net assets | $7,856,027 |
| Shares outstanding | 795,281 |
| Net asset value per share | $9.88 |
| Institutional Class | |
| Net assets | $760,048,110 |
| Shares outstanding | 76,927,237 |
| Net asset value per share | $9.88 |
| Institutional 2 Class | |
| Net assets | $1,781,678 |
| Shares outstanding | 180,596 |
| Net asset value per share | $9.87 |
| Institutional 3 Class | |
| Net assets | $622,383,392 |
| Shares outstanding | 63,005,119 |
| Net asset value per share | $9.88 |
| Class T | |
| Net assets | $350,684 |
| Shares outstanding | 35,502 |
| Net asset value per share | $9.88 |
| Maximum sales charge | 2.50% |
| Maximum offering price per share (calculated by dividing the net asset value per share by 1.0 minus the maximum sales charge per transaction for Class T shares) | $10.13 |
The accompanying Notes to Financial Statements are an integral part of this statement.
| 24 | Columbia Corporate Income Fund | Annual Report 2018 |
Statement of Operations
Year Ended April 30, 2018
| Net investment income | |
| Income: | |
| Dividends — affiliated issuers | $1,035,640 |
| Interest | 44,097,337 |
| Total income | 45,132,977 |
| Expenses: | |
| Management services fees | 6,472,921 |
| Distribution and/or service fees | |
| Class A | 178,666 |
| Class B | 92 |
| Class C | 91,459 |
| Class T | 1,169 |
| Transfer agent fees | |
| Class A | 126,628 |
| Advisor Class | 22,027 |
| Class B | 18 |
| Class C | 16,157 |
| Institutional Class | 1,152,610 |
| Institutional 2 Class | 1,346 |
| Institutional 3 Class | 46,391 |
| Class T | 836 |
| Compensation of board members | 38,078 |
| Custodian fees | 16,589 |
| Printing and postage fees | 65,349 |
| Registration fees | 143,641 |
| Audit fees | 36,840 |
| Legal fees | 32,947 |
| Compensation of chief compliance officer | 514 |
| Other | 37,090 |
| Total expenses | 8,481,368 |
| Fees waived or expenses reimbursed by Investment Manager and its affiliates | (349,553) |
| Fees waived by distributor | |
| Class C | (13,719) |
| Expense reduction | (1,111) |
| Total net expenses | 8,116,985 |
| Net investment income | 37,015,992 |
| Realized and unrealized gain (loss) — net | |
| Net realized gain (loss) on: | |
| Investments — unaffiliated issuers | 14,670,067 |
| Investments — affiliated issuers | (3,993) |
| Futures contracts | (871,369) |
| Net realized gain | 13,794,705 |
| Net change in unrealized appreciation (depreciation) on: | |
| Investments — unaffiliated issuers | (47,564,312) |
| Investments — affiliated issuers | (3,004) |
| Futures contracts | 1,003,298 |
| Net change in unrealized appreciation (depreciation) | (46,564,018) |
| Net realized and unrealized loss | (32,769,313) |
| Net increase in net assets resulting from operations | $4,246,679 |
The accompanying Notes to Financial Statements are an integral part of this statement.
Columbia Corporate Income Fund | Annual Report 2018
| 25 |
Statement of Changes in Net Assets
| | Year Ended
April 30, 2018 | Year Ended
April 30, 2017 |
| Operations | | |
| Net investment income | $37,015,992 | $34,149,238 |
| Net realized gain | 13,794,705 | 20,682,917 |
| Net change in unrealized appreciation (depreciation) | (46,564,018) | (7,817,212) |
| Net increase in net assets resulting from operations | 4,246,679 | 47,014,943 |
| Distributions to shareholders | | |
| Net investment income | | |
| Class A | (1,786,467) | (2,443,839) |
| Advisor Class | (339,982) | (395,656) |
| Class B | (153) | (3,674) |
| Class C | (174,113) | (230,634) |
| Class I | — | (14,395,993) |
| Institutional Class | (18,361,849) | (14,072,183) |
| Institutional 2 Class | (53,659) | (48,908) |
| Institutional 3 Class | (16,090,918) | (2,012,755) |
| Class T | (11,678) | (638,588) |
| Total distributions to shareholders | (36,818,819) | (34,242,230) |
| Increase in net assets from capital stock activity | 259,941,438 | 25,143,113 |
| Total increase in net assets | 227,369,298 | 37,915,826 |
| Net assets at beginning of year | 1,237,342,631 | 1,199,426,805 |
| Net assets at end of year | $1,464,711,929 | $1,237,342,631 |
| Excess of distributions over net investment income | $(497,291) | $(832,959) |
The accompanying Notes to Financial Statements are an integral part of this statement.
| 26 | Columbia Corporate Income Fund | Annual Report 2018 |
Statement of Changes in Net Assets (continued)
| | Year Ended | Year Ended |
| | April 30, 2018 | April 30, 2017 |
| | Shares | Dollars ($) | Shares | Dollars ($) |
| Capital stock activity |
| Class A | | | | |
| Subscriptions | 1,314,435 | 13,401,483 | 2,661,800 | 26,871,945 |
| Distributions reinvested | 154,930 | 1,575,651 | 219,359 | 2,215,780 |
| Redemptions | (3,155,903) | (32,210,159) | (4,607,041) | (46,250,920) |
| Net decrease | (1,686,538) | (17,233,025) | (1,725,882) | (17,163,195) |
| Advisor Class | | | | |
| Subscriptions | 383,689 | 3,917,082 | 397,814 | 4,019,165 |
| Distributions reinvested | 30,317 | 308,553 | 39,173 | 395,322 |
| Redemptions | (742,496) | (7,542,377) | (743,789) | (7,471,630) |
| Net decrease | (328,490) | (3,316,742) | (306,802) | (3,057,143) |
| Class B | | | | |
| Subscriptions | — | — | 69 | 694 |
| Distributions reinvested | 7 | 70 | 262 | 2,649 |
| Redemptions | (5,626) | (57,200) | (23,703) | (238,226) |
| Net decrease | (5,619) | (57,130) | (23,372) | (234,883) |
| Class C | | | | |
| Subscriptions | 66,232 | 674,141 | 178,692 | 1,805,033 |
| Distributions reinvested | 15,638 | 158,965 | 19,825 | 200,195 |
| Redemptions | (329,534) | (3,347,445) | (329,880) | (3,320,899) |
| Net decrease | (247,664) | (2,514,339) | (131,363) | (1,315,671) |
| Class I | | | | |
| Subscriptions | — | — | 4,912,447 | 49,090,606 |
| Distributions reinvested | — | — | 1,324,044 | 13,378,500 |
| Redemptions | — | — | (60,219,392) | (604,314,340) |
| Net decrease | — | — | (53,982,901) | (541,845,234) |
| Institutional Class | | | | |
| Subscriptions | 36,690,440 | 372,560,422 | 28,223,895 | 284,012,408 |
| Distributions reinvested | 987,118 | 10,014,707 | 499,597 | 5,042,676 |
| Redemptions | (18,801,452) | (191,212,986) | (18,786,474) | (188,654,977) |
| Net increase | 18,876,106 | 191,362,143 | 9,937,018 | 100,400,107 |
| Institutional 2 Class | | | | |
| Subscriptions | 46,008 | 463,904 | 92,431 | 933,838 |
| Distributions reinvested | 5,256 | 53,363 | 4,819 | 48,589 |
| Redemptions | (76,320) | (774,435) | (37,794) | (378,847) |
| Net increase (decrease) | (25,056) | (257,168) | 59,456 | 603,580 |
| Institutional 3 Class | | | | |
| Subscriptions | 12,517,308 | 125,062,262 | 54,296,656 | 544,617,060 |
| Distributions reinvested | 1,581,157 | 16,063,573 | 192,871 | 1,948,281 |
| Redemptions | (4,797,907) | (48,869,106) | (2,616,675) | (26,220,613) |
| Net increase | 9,300,558 | 92,256,729 | 51,872,852 | 520,344,728 |
| Class T | | | | |
| Subscriptions | 2 | 22 | 877,265 | 8,836,124 |
| Distributions reinvested | 1,122 | 11,423 | 63,161 | 638,332 |
| Redemptions | (30,483) | (310,475) | (4,201,825) | (42,063,632) |
| Net decrease | (29,359) | (299,030) | (3,261,399) | (32,589,176) |
| Total net increase | 25,853,938 | 259,941,438 | 2,437,607 | 25,143,113 |
The accompanying Notes to Financial Statements are an integral part of this statement.
Columbia Corporate Income Fund | Annual Report 2018
| 27 |
The following table is intended to help you understand the Fund’s financial performance. Certain information reflects financial results for a single share of a class held for the periods shown. Per share net investment income (loss) amounts are calculated based on average shares outstanding during the period. Total return assumes reinvestment of all dividends and distributions, if any. Total return does not reflect payment of sales charges, if any. Total return and portfolio turnover are not annualized for periods of less than one year. The portfolio turnover rate is calculated without regard to purchase and sales transactions of short-term instruments and certain derivatives, if any. If such transactions were included, the Fund’s portfolio turnover rate may be higher.
| | Net asset value,
beginning of
period | Net
investment
income | Net
realized
and
unrealized
gain (loss) | Total from
investment
operations | Distributions
from net
investment
income | Distributions
from net
realized
gains |
| Class A |
| Year Ended 4/30/2018 | $10.11 | 0.26 | (0.23) | 0.03 | (0.26) | — |
| Year Ended 4/30/2017 | $10.00 | 0.26 | 0.11 | 0.37 | (0.26) | — |
| Year Ended 4/30/2016 | $10.18 | 0.31 | (0.18) | 0.13 | (0.31) | — |
| Year Ended 4/30/2015 | $10.20 | 0.28 | (0.02) | 0.26 | (0.28) | — |
| Year Ended 4/30/2014 | $10.67 | 0.29 | (0.14) | 0.15 | (0.29) | (0.33) |
| Advisor Class |
| Year Ended 4/30/2018 | $10.10 | 0.28 | (0.23) | 0.05 | (0.28) | — |
| Year Ended 4/30/2017 | $9.99 | 0.28 | 0.11 | 0.39 | (0.28) | — |
| Year Ended 4/30/2016 | $10.16 | 0.33 | (0.17) | 0.16 | (0.33) | — |
| Year Ended 4/30/2015 | $10.19 | 0.31 | (0.03) | 0.28 | (0.31) | — |
| Year Ended 4/30/2014 | $10.65 | 0.31 | (0.13) | 0.18 | (0.31) | (0.33) |
| Class C |
| Year Ended 4/30/2018 | $10.11 | 0.20 | (0.23) | (0.03) | (0.20) | — |
| Year Ended 4/30/2017 | $10.00 | 0.20 | 0.11 | 0.31 | (0.20) | — |
| Year Ended 4/30/2016 | $10.18 | 0.25 | (0.18) | 0.07 | (0.25) | — |
| Year Ended 4/30/2015 | $10.20 | 0.22 | (0.02) | 0.20 | (0.22) | — |
| Year Ended 4/30/2014 | $10.67 | 0.22 | (0.13) | 0.09 | (0.23) | (0.33) |
| Institutional Class |
| Year Ended 4/30/2018 | $10.11 | 0.28 | (0.23) | 0.05 | (0.28) | — |
| Year Ended 4/30/2017 | $10.00 | 0.28 | 0.11 | 0.39 | (0.28) | — |
| Year Ended 4/30/2016 | $10.18 | 0.33 | (0.18) | 0.15 | (0.33) | — |
| Year Ended 4/30/2015 | $10.20 | 0.31 | (0.02) | 0.29 | (0.31) | — |
| Year Ended 4/30/2014 | $10.67 | 0.31 | (0.14) | 0.17 | (0.31) | (0.33) |
| Institutional 2 Class |
| Year Ended 4/30/2018 | $10.09 | 0.29 | (0.22) | 0.07 | (0.29) | — |
| Year Ended 4/30/2017 | $9.98 | 0.29 | 0.11 | 0.40 | (0.29) | — |
| Year Ended 4/30/2016 | $10.16 | 0.34 | (0.18) | 0.16 | (0.34) | — |
| Year Ended 4/30/2015 | $10.19 | 0.32 | (0.03) | 0.29 | (0.32) | — |
| Year Ended 4/30/2014 | $10.65 | 0.33 | (0.13) | 0.20 | (0.33) | (0.33) |
| Institutional 3 Class |
| Year Ended 4/30/2018 | $10.11 | 0.30 | (0.23) | 0.07 | (0.30) | — |
| Year Ended 4/30/2017 | $10.00 | 0.29 | 0.12 | 0.41 | (0.30) | — |
| Year Ended 4/30/2016 | $10.18 | 0.35 | (0.18) | 0.17 | (0.35) | — |
| Year Ended 4/30/2015 | $10.20 | 0.33 | (0.02) | 0.31 | (0.33) | — |
| Year Ended 4/30/2014 | $10.66 | 0.33 | (0.13) | 0.20 | (0.33) | (0.33) |
The accompanying Notes to Financial Statements are an integral part of this statement.
| 28 | Columbia Corporate Income Fund | Annual Report 2018 |
Total
distributions to
shareholders | Net
asset
value,
end of
period | Total
return | Total gross
expense
ratio to
average
net assets(a) | Total net
expense
ratio to
average
net assets(a),(b) | Net investment
income
ratio to
average
net assets | Portfolio
turnover | Net
assets,
end of
period
(000’s) |
| |
| (0.26) | $9.88 | 0.22% | 0.95% | 0.92% (c) | 2.52% | 78% | $63,283 |
| (0.26) | $10.11 | 3.72% | 0.98% (d) | 0.91% (c),(d) | 2.56% | 76% | $81,802 |
| (0.31) | $10.00 | 1.38% | 1.00% | 0.93% (c) | 3.15% | 50% | $98,149 |
| (0.28) | $10.18 | 2.59% | 0.97% | 0.96% (c) | 2.75% | 78% | $129,902 |
| (0.62) | $10.20 | 1.60% | 0.96% | 0.96% (c) | 2.80% | 105% | $120,603 |
| |
| (0.28) | $9.87 | 0.46% | 0.70% | 0.67% (c) | 2.75% | 78% | $9,009 |
| (0.28) | $10.10 | 3.98% | 0.73% (d) | 0.66% (c),(d) | 2.81% | 76% | $12,534 |
| (0.33) | $9.99 | 1.73% | 0.75% | 0.68% (c) | 3.42% | 50% | $15,459 |
| (0.31) | $10.16 | 2.74% | 0.72% | 0.71% (c) | 3.01% | 78% | $18,384 |
| (0.64) | $10.19 | 1.95% | 0.72% | 0.71% (c) | 3.13% | 105% | $11,454 |
| |
| (0.20) | $9.88 | (0.38%) | 1.70% | 1.52% (c) | 1.92% | 78% | $7,856 |
| (0.20) | $10.11 | 3.10% | 1.73% (d) | 1.51% (c),(d) | 1.96% | 76% | $10,543 |
| (0.25) | $10.00 | 0.78% | 1.75% | 1.53% (c) | 2.55% | 50% | $11,740 |
| (0.22) | $10.18 | 1.98% | 1.72% | 1.56% (c) | 2.15% | 78% | $15,359 |
| (0.56) | $10.20 | 0.99% | 1.71% | 1.56% (c) | 2.20% | 105% | $15,587 |
| |
| (0.28) | $9.88 | 0.47% | 0.69% | 0.66% (c) | 2.78% | 78% | $760,048 |
| (0.28) | $10.11 | 3.98% | 0.73% (d) | 0.66% (c),(d) | 2.81% | 76% | $586,861 |
| (0.33) | $10.00 | 1.64% | 0.75% | 0.68% (c) | 3.40% | 50% | $481,013 |
| (0.31) | $10.18 | 2.84% | 0.72% | 0.71% (c) | 3.01% | 78% | $596,908 |
| (0.64) | $10.20 | 1.85% | 0.71% | 0.71% (c) | 3.05% | 105% | $462,215 |
| |
| (0.29) | $9.87 | 0.67% | 0.59% | 0.57% | 2.86% | 78% | $1,782 |
| (0.29) | $10.09 | 4.09% | 0.57% (d) | 0.55% (d) | 2.92% | 76% | $2,076 |
| (0.34) | $9.98 | 1.76% | 0.57% | 0.56% | 3.53% | 50% | $1,459 |
| (0.32) | $10.16 | 2.89% | 0.57% | 0.57% | 3.14% | 78% | $1,790 |
| (0.66) | $10.19 | 2.09% | 0.57% | 0.57% | 3.17% | 105% | $1,630 |
| |
| (0.30) | $9.88 | 0.62% | 0.53% | 0.51% | 2.93% | 78% | $622,383 |
| (0.30) | $10.11 | 4.14% | 0.54% (d) | 0.51% (d) | 2.91% | 76% | $542,814 |
| (0.35) | $10.00 | 1.81% | 0.52% | 0.51% | 3.60% | 50% | $18,312 |
| (0.33) | $10.18 | 3.04% | 0.52% | 0.52% | 3.24% | 78% | $12,581 |
| (0.66) | $10.20 | 2.14% | 0.51% | 0.51% | 3.30% | 105% | $28 |
Columbia Corporate Income Fund | Annual Report 2018
| 29 |
Financial Highlights (continued)
| | Net asset value,
beginning of
period | Net
investment
income | Net
realized
and
unrealized
gain (loss) | Total from
investment
operations | Distributions
from net
investment
income | Distributions
from net
realized
gains |
| Class T |
| Year Ended 4/30/2018 | $10.11 | 0.26 | (0.23) | 0.03 | (0.26) | — |
| Year Ended 4/30/2017 | $10.00 | 0.26 | 0.11 | 0.37 | (0.26) | — |
| Year Ended 4/30/2016 | $10.18 | 0.30 | (0.17) | 0.13 | (0.31) | — |
| Year Ended 4/30/2015 | $10.20 | 0.28 | (0.02) | 0.26 | (0.28) | — |
| Year Ended 4/30/2014 | $10.67 | 0.29 | (0.14) | 0.15 | (0.29) | (0.33) |
| Notes to Financial Highlights |
| (a) | In addition to the fees and expenses that the Fund bears directly, the Fund indirectly bears a pro rata share of the fees and expenses of any other funds in which it invests. Such indirect expenses are not included in the Fund’s reported expense ratios. |
| (b) | Total net expenses include the impact of certain fee waivers/expense reimbursements made by the Investment Manager and certain of its affiliates, if applicable. |
| (c) | The benefits derived from expense reductions had an impact of less than 0.01%. |
| (d) | Expenses have been reduced due to a reimbursement of expenses overbilled by a third party. If the reimbursement had been excluded, the expense ratios would have been higher by the percentages shown for each class in the table below. All fee waivers and expense reimbursements by the Investment Manager and its affiliates were applied before giving effect to this third party reimbursement. |
| Year Ended | Class A | Advisor
Class | Class C | Institutional
Class | Institutional 2
Class | Institutional 3
Class | Class T |
| 04/30/2017 | 0.01 % | 0.01 % | 0.01 % | 0.01 % | 0.01 % | 0.01 % | 0.01 % |
The accompanying Notes to Financial Statements are an integral part of this statement.
| 30 | Columbia Corporate Income Fund | Annual Report 2018 |
Total
distributions to
shareholders | Net
asset
value,
end of
period | Total
return | Total gross
expense
ratio to
average
net assets(a) | Total net
expense
ratio to
average
net assets(a),(b) | Net investment
income
ratio to
average
net assets | Portfolio
turnover | Net
assets,
end of
period
(000’s) |
| |
| (0.26) | $9.88 | 0.22% | 0.95% | 0.92% (c) | 2.52% | 78% | $351 |
| (0.26) | $10.11 | 3.71% | 0.98% (d) | 0.91% (c),(d) | 2.60% | 76% | $656 |
| (0.31) | $10.00 | 1.39% | 1.00% | 0.94% (c) | 3.09% | 50% | $33,250 |
| (0.28) | $10.18 | 2.59% | 0.97% | 0.96% (c) | 2.75% | 78% | $125,035 |
| (0.62) | $10.20 | 1.60% | 0.96% | 0.96% (c) | 2.81% | 105% | $132,166 |
Columbia Corporate Income Fund | Annual Report 2018
| 31 |
Notes to Financial Statements
April 30, 2018
Note 1. Organization
Columbia Corporate Income Fund (the Fund), a series of Columbia Funds Series Trust I (the Trust), is a diversified fund. The Trust is registered under the Investment Company Act of 1940, as amended (the 1940 Act), as an open-end management investment company organized as a Massachusetts business trust.
Fund shares
The Trust may issue an unlimited number of shares (without par value). Although all share classes generally have identical voting, dividend and liquidation rights, each share class votes separately when required by the Trust’s organizational documents or by law. Different share classes pay different distribution amounts to the extent the expenses of such share classes differ, and distributions in liquidation will be proportional to the net asset value of each share class. Each share class has its own expense and sales charge structure. The Fund offers each of the share classes identified below.
Class A shares are subject to a maximum front-end sales charge of 4.75% based on the initial investment amount. Class A shares purchased without an initial sales charge in accounts aggregating $1 million to $50 million at the time of purchase are subject to a contingent deferred sales charge (CDSC) if the shares are sold within 18 months after purchase, charged as follows: 1.00% CDSC if redeemed within 12 months after purchase, and 0.50% CDSC if redeemed more than 12, but less than 18, months after purchase.
Advisor Class shares are not subject to sales charges and are generally available only to omnibus retirement plans and certain investors as described in the Fund’s prospectus. Prior to November 1, 2017, Advisor Class shares were known as Class R4 shares.
Class B shares of the Fund are no longer offered for sale. When available, Class B shares were subject to a maximum CDSC of 5.00% based upon the holding period after purchase. Effective July 17, 2017, Class B shares were automatically converted to Class A shares without a CDSC. On August 4, 2017, the capital owned by Columbia Management Investment Advisers, LLC in Class B shares was redeemed without a CDSC.
Class C shares are subject to a 1.00% CDSC on shares redeemed within 12 months after purchase.
Institutional Class shares are not subject to sales charges and are generally available only to eligible investors, which are subject to different investment minimums as described in the Fund’s prospectus. Prior to November 1, 2017, Institutional Class shares were known as Class Z shares.
Institutional 2 Class shares are not subject to sales charges and are generally available only to investors purchasing through authorized investment professionals and omnibus retirement plans as described in the Fund’s prospectus. Prior to November 1, 2017, Institutional 2 Class shares were known as Class R5 shares.
Institutional 3 Class shares are not subject to sales charges and are available to institutional and certain other investors as described in the Fund’s prospectus. Prior to November 1, 2017, Institutional 3 Class shares were known as Class Y shares.
Class T shares are subject to a maximum front-end sales charge of 2.50% per transaction and must be purchased through financial intermediaries that, by written agreement with Columbia Management Investment Distributors, Inc., are specifically authorized to sell Class T shares.
Note 2. Summary of significant accounting policies
Basis of preparation
The Fund is an investment company that applies the accounting and reporting guidance in the Financial Accounting Standards Board (FASB) Accounting Standards Codification Topic 946, Financial Services - Investment Companies (ASC 946). The financial statements are prepared in accordance with U.S. generally accepted accounting principles (GAAP), which requires management to make certain estimates and assumptions that affect the reported amounts of assets and liabilities, the disclosure of contingent assets and liabilities at the date of the financial statements and the reported amounts of income
| 32 | Columbia Corporate Income Fund | Annual Report 2018 |
Notes to Financial Statements (continued)
April 30, 2018
and expenses during the reporting period. Actual results could differ from those estimates. The Fund received a reimbursement for expenses overbilled by a third party. Such reimbursement is included as an offset to other expenses on the Statement of Operations. All fee waivers and expense reimbursements by Columbia Management Investment Advisers, LLC and its affiliates were applied before giving effect to the third party reimbursement.
The following is a summary of significant accounting policies followed by the Fund in the preparation of its financial statements.
Security valuation
All equity securities are valued at the close of business of the New York Stock Exchange. Equity securities are valued at the last quoted sales price on the principal exchange or market on which they trade, except for securities traded on the NASDAQ Stock Market, which are valued at the NASDAQ official close price. Unlisted securities or listed securities for which there were no sales during the day are valued at the mean of the latest quoted bid and ask prices on such exchanges or markets.
Debt securities generally are valued by pricing services approved by the Board of Trustees based upon market transactions for normal, institutional-size trading units of similar securities. The services may use various pricing techniques that take into account, as applicable, factors such as yield, quality, coupon rate, maturity, type of issue, trading characteristics and other data, as well as approved independent broker-dealer quotes. Debt securities for which quotations are not readily available or not believed to be reflective of market value may also be valued based upon a bid quote from an approved independent broker-dealer. Debt securities maturing in 60 days or less are valued primarily at amortized cost value, unless this method results in a valuation that management believes does not approximate market value.
Senior loan securities for which reliable market quotations are readily available are generally valued by pricing services at the average of the bids received.
Investments in open-end investment companies, including money market funds, are valued at their latest net asset value.
Futures and options on futures contracts are valued based upon the settlement price at the close of regular trading on their principal exchanges or, in the absence of transactions, at the mean of the latest quoted bid and ask prices.
Investments for which market quotations are not readily available, or that have quotations which management believes are not reflective of market value or reliable, are valued at fair value as determined in good faith under procedures approved by and under the general supervision of the Board of Trustees. If a security or class of securities (such as foreign securities) is valued at fair value, such value is likely to be different from the quoted or published price for the security.
The determination of fair value often requires significant judgment. To determine fair value, management may use assumptions including but not limited to future cash flows and estimated risk premiums. Multiple inputs from various sources may be used to determine fair value.
GAAP requires disclosure regarding the inputs and valuation techniques used to measure fair value and any changes in valuation inputs or techniques. In addition, investments shall be disclosed by major category. This information is disclosed following the Fund’s Portfolio of Investments.
Derivative instruments
The Fund invests in certain derivative instruments, as detailed below, to meet its investment objectives. Derivatives are instruments whose values depend on, or are derived from, in whole or in part, the value of one or more securities, currencies, commodities, indices, or other assets or instruments. Derivatives may be used to increase investment flexibility (including to maintain cash reserves while maintaining desired exposure to certain assets), for risk management (hedging) purposes, to facilitate trading, to reduce transaction costs and to pursue higher investment returns. The Fund may also use derivative instruments to mitigate certain investment risks, such as foreign currency exchange rate risk, interest rate risk and credit risk. Derivatives may involve various risks, including the potential inability of the counterparty to fulfill its obligations under the terms of the contract, the potential for an illiquid secondary market (making it difficult for the Fund to sell or
Columbia Corporate Income Fund | Annual Report 2018
| 33 |
Notes to Financial Statements (continued)
April 30, 2018
terminate, including at favorable prices) and the potential for market movements which may expose the Fund to gains or losses in excess of the amount shown in the Statement of Assets and Liabilities. The notional amounts of derivative instruments, if applicable, are not recorded in the financial statements.
A derivative instrument may suffer a marked-to-market loss if the value of the contract decreases due to an unfavorable change in the market rates or values of the underlying instrument. Losses can also occur if the counterparty does not perform its obligations under the contract. The Fund’s risk of loss from counterparty credit risk on over-the-counter derivatives is generally limited to the aggregate unrealized gain netted against any collateral held by the Fund and the amount of any variation margin held by the counterparty, plus any replacement costs or related amounts. With exchange-traded or centrally cleared derivatives, there is reduced counterparty credit risk to the Fund since the clearinghouse or central counterparty (CCP) provides some protection in the case of clearing member default. The clearinghouse or CCP stands between the buyer and the seller of the contract; therefore, additional counterparty credit risk is failure of the clearinghouse or CCP. However, credit risk still exists in exchange-traded or centrally cleared derivatives with respect to initial and variation margin that is held in a broker’s customer account. While brokers are required to segregate customer margin from their own assets, in the event that a broker becomes insolvent or goes into bankruptcy and at that time there is a shortfall in the aggregate amount of margin held by the broker for all its clients, U.S. bankruptcy laws will typically allocate that shortfall on a pro-rata basis across all the broker’s customers (including the Fund), potentially resulting in losses to the Fund.
In order to better define its contractual rights and to secure rights that will help the Fund mitigate its counterparty risk, the Fund may enter into an International Swaps and Derivatives Association, Inc. Master Agreement (ISDA Master Agreement) or similar agreement with its derivatives contract counterparties. An ISDA Master Agreement is an agreement between the Fund and a counterparty that governs over-the-counter derivatives and typically contains, among other things, collateral posting terms and netting provisions in the event of a default and/or termination event. Under an ISDA Master Agreement, the Fund may, under certain circumstances, offset with the counterparty certain derivative instrument’s payables and/or receivables with collateral held and/or posted and create one single net payment. The provisions of the ISDA Master Agreement typically permit a single net payment in the event of default (close-out netting), including the bankruptcy or insolvency of the counterparty. Note, however, that bankruptcy or insolvency laws of a particular jurisdiction may impose restrictions on or prohibitions against the right of offset or netting in bankruptcy, insolvency or other events.
Collateral (margin) requirements differ by type of derivative. Margin requirements are established by the clearinghouse or CCP for exchange-traded and centrally cleared derivatives. Brokers can ask for margin in excess of the minimum in certain circumstances. Collateral terms are contract specific for over-the-counter derivatives. For over-the-counter derivatives traded under an ISDA Master Agreement, the collateral requirements are typically calculated by netting the marked-to-market amount for each transaction under such agreement and comparing that amount to the value of any variation margin currently pledged by the Fund and/or the counterparty. Generally, the amount of collateral due from or to a party has to exceed a minimum transfer amount threshold (e.g., $250,000) before a transfer has to be made. To the extent amounts due to the Fund from its counterparties are not fully collateralized, contractually or otherwise, the Fund bears the risk of loss from counterparty nonperformance. The Fund may also pay interest expense on cash collateral received from the broker. Any interest expense paid by the Fund is shown on the Statement of Operations. The Fund attempts to mitigate counterparty risk by only entering into agreements with counterparties that it believes have the financial resources to honor their obligations and by monitoring the financial stability of those counterparties.
Certain ISDA Master Agreements allow counterparties of over-the-counter derivatives transactions to terminate derivatives contracts prior to maturity in the event the Fund’s net asset value declines by a stated percentage over a specified time period or if the Fund fails to meet certain terms of the ISDA Master Agreement, which would cause the Fund to accelerate payment of any net liability owed to the counterparty. The Fund also has termination rights if the counterparty fails to meet certain terms of the ISDA Master Agreement. In addition to considering counterparty credit risk, the Fund would consider terminating the derivatives contracts based on whether termination would result in a net liability owed from the counterparty.
For financial reporting purposes, the Fund does not offset derivative assets and derivative liabilities that are subject to netting arrangements in the Statement of Assets and Liabilities.
| 34 | Columbia Corporate Income Fund | Annual Report 2018 |
Notes to Financial Statements (continued)
April 30, 2018
Futures contracts
Futures contracts are exchange-traded and represent commitments for the future purchase or sale of an asset at a specified price on a specified date. The Fund bought and sold futures contracts to manage the duration and yield curve exposure of the Fund versus the benchmark and to manage exposure to movements in interest rates. These instruments may be used for other purposes in future periods. Upon entering into futures contracts, the Fund bears risks that it may not achieve the anticipated benefits of the futures contracts and may realize a loss. Additional risks include counterparty credit risk, the possibility of an illiquid market, and that a change in the value of the contract or option may not correlate with changes in the value of the underlying asset.
Upon entering into a futures contract, the Fund deposits cash or securities with the broker, known as a futures commission merchant (FCM), in an amount sufficient to meet the initial margin requirement. The initial margin deposit must be maintained at an established level over the life of the contract. Cash deposited as initial margin is recorded in the Statement of Assets and Liabilities as margin deposits. Securities deposited as initial margin are designated in the Portfolio of Investments. Subsequent payments (variation margin) are made or received by the Fund each day. The variation margin payments are equal to the daily change in the contract value and are recorded as variation margin receivable or payable and are offset in unrealized gains or losses. The Fund recognizes a realized gain or loss when the contract is closed or expires. Futures contracts involve, to varying degrees, risk of loss in excess of the variation margin disclosed in the Statement of Assets and Liabilities.
Effects of derivative transactions in the financial statements
The following tables are intended to provide additional information about the effect of derivatives on the financial statements of the Fund, including: the fair value of derivatives by risk category and the location of those fair values in the Statement of Assets and Liabilities; and the impact of derivative transactions over the period in the Statement of Operations, including realized and unrealized gains (losses). The derivative instrument schedules following the Portfolio of Investments present additional information regarding derivative instruments outstanding at the end of the period, if any.
The following table is a summary of the fair value of derivative instruments (not considered to be hedging instruments for accounting disclosure purposes) at April 30, 2018:
| | Asset derivatives | |
Risk exposure
category | Statement
of assets and liabilities
location | Fair value ($) |
| Interest rate risk | Net assets — unrealized appreciation on futures contracts | 538,068 |
| | Liability derivatives | |
Risk exposure
category | Statement
of assets and liabilities
location | Fair value ($) |
| Interest rate risk | Net assets — unrealized depreciation on futures contracts | 1,096,060 |
Columbia Corporate Income Fund | Annual Report 2018
| 35 |
Notes to Financial Statements (continued)
April 30, 2018
The following table indicates the effect of derivative instruments (not considered to be hedging instruments for accounting disclosure purposes) in the Statement of Operations for the year ended April 30, 2018:
| Amount of realized gain (loss) on derivatives recognized in income |
| Risk exposure category | | | | | | Futures
contracts
($) |
| Interest rate risk | | | | | | (871,369) |
| |
| Change in unrealized appreciation (depreciation) on derivatives recognized in income |
| Risk exposure category | | | | | | Futures
contracts
($) |
| Interest rate risk | | | | | | 1,003,298 |
The following table is a summary of the average outstanding volume by derivative instrument for the year ended April 30, 2018:
| Derivative instrument | Average notional
amounts ($)* |
| Futures contracts — long | 187,645,611 |
| Futures contracts — short | 192,479,400 |
| * | Based on the ending quarterly outstanding amounts for the year ended April 30, 2018. |
Investments in senior loans
The Fund may invest in senior loan assignments. When the Fund purchases an assignment of a senior loan, the Fund typically has direct rights against the borrower; provided, however, that the Fund’s rights may be more limited than the lender from which it acquired the assignment and the Fund may be able to enforce its rights only through an administrative agent. Although certain senior loan assignments are secured by collateral, the Fund could experience delays or limitations in realizing such collateral or have its interest subordinated to other indebtedness of the obligor. In the event that the administrator or collateral agent of a loan becomes insolvent or enters into receivership or bankruptcy, the Fund may incur costs and delays in realizing payment or may suffer a loss of principal and/or interest. The risk of loss is greater for unsecured or subordinated loans. In addition, senior loan assignments are vulnerable to market, economic or other conditions or events that may reduce the demand for senior loan assignments and certain senior loan assignments which were liquid when purchased, may become illiquid.
The Fund may enter into senior loan assignments where all or a portion of the loan may be unfunded. The Fund is obligated to fund these commitments at the borrower’s discretion. These commitments, if any, are generally traded and priced in the same manner as other senior loan securities and are disclosed as unfunded senior loan commitments in the Fund’s Portfolio of Investments with a corresponding payable for investments purchased. The Fund designates cash or liquid securities to cover these commitments.
Delayed delivery securities
The Fund may trade securities on other than normal settlement terms, including securities purchased or sold on a “when-issued” or "forward commitment" basis. This may increase risk to the Fund since the other party to the transaction may fail to deliver, which could cause the Fund to subsequently invest at less advantageous prices. The Fund designates cash or liquid securities in an amount equal to the delayed delivery commitment.
Forward Sale Commitments
The Fund may enter into forward sale commitments to hedge its portfolio positions or to sell mortgage-backed securities it owns under delayed delivery arrangements. Proceeds of forward sale commitments are not received until the contractual settlement date. While a forward sale commitment is outstanding, equivalent deliverable securities or an offsetting forward purchase commitment deliverable on or before the sale commitment date, are used to satisfy the commitment.
| 36 | Columbia Corporate Income Fund | Annual Report 2018 |
Notes to Financial Statements (continued)
April 30, 2018
Unsettled forward sale commitments are valued at the current market value of the underlying securities, generally according to the procedures described under “Security Valuation” above. The forward sale commitment is “marked-to-market” daily and the change in market value is recorded by the Fund as an unrealized gain or loss. If the forward sale commitment is closed through the acquisition of an offsetting purchase commitment, the Fund realizes a gain or loss. If the Fund delivers securities under the commitment, the Fund realizes a gain or a loss from the sale of the securities based upon the market price established at the date the commitment was entered into.
Security transactions
Security transactions are accounted for on the trade date. Cost is determined and gains (losses) are based upon the specific identification method for both financial statement and federal income tax purposes.
The trade date for senior loans purchased in the primary market is the date on which the loan is allocated. The trade date for senior loans purchased in the secondary market is the date on which the transaction is entered into.
Income recognition
Interest income is recorded on an accrual basis. Market premiums and discounts, including original issue discounts, are amortized and accreted, respectively, over the expected life of the security on all debt securities, unless otherwise noted. The Fund classifies gains and losses realized on prepayments received on mortgage-backed securities as adjustments to interest income.
The Fund may place a debt security on non-accrual status and reduce related interest income when it becomes probable that the interest will not be collected and the amount of uncollectible interest can be reasonably estimated. A defaulted debt security is removed from non-accrual status when the issuer resumes interest payments or when collectibility of interest is reasonably assured.
Dividend income is recorded on the ex-dividend date.
Corporate actions and dividend income are recorded on the ex-dividend date.
The Fund may receive other income from senior loans, including amendment fees, consent fees and commitment fees. These fees are recorded as income when received by the Fund. These amounts are included in Interest Income in the Statement of Operations.
Expenses
General expenses of the Trust are allocated to the Fund and other funds of the Trust based upon relative net assets or other expense allocation methodologies determined by the nature of the expense. Expenses directly attributable to the Fund are charged to the Fund. Expenses directly attributable to a specific class of shares are charged to that share class.
Determination of class net asset value
All income, expenses (other than class-specific expenses, which are charged to that share class, as shown in the Statement of Operations) and realized and unrealized gains (losses) are allocated to each class of the Fund on a daily basis, based on the relative net assets of each class, for purposes of determining the net asset value of each class.
Federal income tax status
The Fund intends to qualify each year as a regulated investment company under Subchapter M of the Internal Revenue Code, as amended, and will distribute substantially all of its investment company taxable income and net capital gain, if any, for its tax year, and as such will not be subject to federal income taxes. In addition, the Fund intends to distribute in each calendar year substantially all of its ordinary income, capital gain net income and certain other amounts, if any, such that the Fund should not be subject to federal excise tax. Therefore, no federal income or excise tax provision is recorded.
Columbia Corporate Income Fund | Annual Report 2018
| 37 |
Notes to Financial Statements (continued)
April 30, 2018
Foreign taxes
The Fund may be subject to foreign taxes on income, gains on investments or currency repatriation, a portion of which may be recoverable. The Fund will accrue such taxes and recoveries, as applicable, based upon its current interpretation of tax rules and regulations that exist in the markets in which it invests.
Realized gains in certain countries may be subject to foreign taxes at the Fund level, based on statutory rates. The Fund accrues for such foreign taxes on realized and unrealized gains at the appropriate rate for each jurisdiction, as applicable. The amount, if any, is disclosed as a liability on the Statement of Assets and Liabilities.
Distributions to shareholders
Distributions from net investment income, if any, are declared daily and paid monthly. Net realized capital gains, if any, are distributed at least annually. Income distributions and capital gain distributions are determined in accordance with federal income tax regulations, which may differ from GAAP.
Guarantees and indemnifications
Under the Trust’s organizational documents and, in some cases, by contract, its officers and trustees are indemnified against certain liabilities arising out of the performance of their duties to the Trust or its funds. In addition, certain of the Fund’s contracts with its service providers contain general indemnification clauses. The Fund’s maximum exposure under these arrangements is unknown since the amount of any future claims that may be made against the Fund cannot be determined, and the Fund has no historical basis for predicting the likelihood of any such claims.
Recent accounting pronouncement
Accounting Standards Update 2017-08 Premium Amortization on Purchased Callable Debt Securities
In March 2017, the Financial Accounting Standards Board issued Accounting Standards Update (ASU) No. 2017-08 Premium Amortization on Purchased Callable Debt Securities. ASU No. 2017-08 updates the accounting standards to shorten the amortization period for certain purchased callable debt securities, held at a premium, to be amortized to the earliest call date. The update applies to securities with explicit, noncontingent call features that are callable at fixed prices and on preset dates. The standard is effective for annual periods beginning after December 15, 2018 and interim periods within those fiscal years. At this time, management is evaluating the implication of this guidance and the impact it will have on the financial statement amounts and footnote disclosures, if any.
Note 3. Fees and other transactions with affiliates
Management services fees
The Fund has entered into a Management Agreement with Columbia Management Investment Advisers, LLC (the Investment Manager), a wholly-owned subsidiary of Ameriprise Financial, Inc. (Ameriprise Financial). Under the Management Agreement, the Investment Manager provides the Fund with investment research and advice, as well as administrative and accounting services. The management services fee is an annual fee that is equal to a percentage of the Fund’s daily net assets that declines from 0.50% to 0.34% as the Fund’s net assets increase. The effective management services fee rate for the year ended April 30, 2018 was 0.49% of the Fund’s average daily net assets.
Compensation of board members
Members of the Board of Trustees who are not officers or employees of the Investment Manager or Ameriprise Financial are compensated for their services to the Fund as disclosed in the Statement of Operations. These members of the Board of Trustees may participate in a Deferred Compensation Plan (the Plan) which may be terminated at any time. Obligations of the Plan will be paid solely out of the Fund’s assets, and all amounts payable under the Plan constitute a general unsecured obligation of the Fund.
| 38 | Columbia Corporate Income Fund | Annual Report 2018 |
Notes to Financial Statements (continued)
April 30, 2018
Compensation of Chief Compliance Officer
The Board of Trustees has appointed a Chief Compliance Officer to the Fund in accordance with federal securities regulations. As disclosed in the Statement of Operations, a portion of the Chief Compliance Officer’s total compensation is allocated to the Fund, along with other allocations to affiliated funds governed by the Board of Trustees, based on relative net assets.
Transactions with affiliates
For the year ended April 30, 2018, the Fund engaged in purchase and/or sale transactions with affiliates and/or accounts that have a common investment manager (or affiliated investment managers), common directors/trustees, and/or common officers. Those purchase and sale transactions complied with provisions of Rule 17a-7 under the 1940 Act and were $19,949,551 and $0, respectively.
Transfer agency fees
Under a Transfer and Dividend Disbursing Agent Agreement, Columbia Management Investment Services Corp. (the Transfer Agent), an affiliate of the Investment Manager and a wholly-owned subsidiary of Ameriprise Financial, is responsible for providing transfer agency services to the Fund. The Transfer Agent has contracted with DST Asset Manager Solutions, Inc. (DST) to serve as sub-transfer agent. The Transfer Agent pays the fees of DST for services as sub-transfer agent and DST is not entitled to reimbursement for such fees from the Fund (with the exception of out-of-pocket fees).
The Fund pays the Transfer Agent a monthly transfer agency fee based on the number or the average value of accounts, depending on the type of account. In addition, the Fund pays the Transfer Agent a fee for shareholder services based on the number of accounts or on a percentage of the average aggregate value of the Fund’s shares maintained in omnibus accounts up to the lesser of the amount charged by the financial intermediary or a cap established by the Board of Trustees from time to time.
The Transfer Agent also receives compensation from the Fund for various shareholder services and reimbursements for certain out-of-pocket fees. Effective August 1, 2017, total transfer agency fees for Institutional 2 Class and Institutional 3 Class shares are subject to an annual limitation of not more than 0.07% and 0.02%, respectively, of the average daily net assets attributable to each share class. Prior to August 1, 2017, these limitations were 0.075% for Institutional 2 Class shares and 0.025% for Institutional 3 Class shares.
For the year ended April 30, 2018, the Fund’s effective transfer agency fee rates as a percentage of average daily net assets of each class were as follows:
| | Effective rate (%) |
| Class A | 0.18 |
| Advisor Class | 0.18 |
| Class B | 0.05 (a) |
| Class C | 0.18 |
| Institutional Class | 0.17 |
| Institutional 2 Class | 0.07 |
| Institutional 3 Class | 0.01 |
| Class T | 0.18 |
An annual minimum account balance fee of $20 may apply to certain accounts with a value below the applicable share class’s initial minimum investment requirements to reduce the impact of small accounts on transfer agency fees. These minimum account balance fees are remitted to the Fund and recorded as part of expense reductions in the Statement of Operations. For the year ended April 30, 2018, these minimum account balance fees reduced total expenses of the Fund by $1,111.
Columbia Corporate Income Fund | Annual Report 2018
| 39 |
Notes to Financial Statements (continued)
April 30, 2018
Distribution and service fees
The Fund has entered into an agreement with Columbia Management Investment Distributors, Inc. (the Distributor), an affiliate of the Investment Manager and a wholly-owned subsidiary of Ameriprise Financial, for distribution and shareholder services. The Board of Trustees has approved, and the Fund has adopted, distribution and shareholder service plans (the Plans) applicable to certain share classes, which set the distribution and service fees for the Fund. These fees are calculated daily and are intended to compensate the Distributor and/or eligible selling and/or servicing agents for selling shares of the Fund and providing services to investors.
Under the Plans, the Fund pays a monthly service fee to the Distributor at the maximum annual rate of 0.25% of the average daily net assets attributable to Class A, Class B, Class C and Class T shares of the Fund. Also under the Plans, the Fund pays a monthly distribution fee to the Distributor at the maximum annual rates of 0.75%, 0.75% and 0.25% of the average daily net assets attributable to Class B, Class C and Class T shares of the Fund, respectively. As a result of all Class B shares of the Fund being redeemed or converted to Class A shares, August 4, 2017 was the last day the Fund paid a service fee or distribution fee for Class B shares.
Although the Fund may pay a distribution fee up to 0.25% of the Fund’s average daily net assets attributable to Class T shares and a service fee of up to 0.25% of the Fund’s average daily net assets attributable to Class T shares, the aggregate fee shall not exceed 0.25% of the Fund’s average daily net assets attributable to Class T shares.
The Distributor has voluntarily agreed to waive a portion of the distribution fee for Class C shares so that the distribution fee does not exceed 0.60% annually of the average daily net assets attributable to Class C shares. This arrangement may be modified or terminated by the Distributor at any time.
Sales charges (unaudited)
Sales charges, including front-end charges and CDSCs, received by the Distributor for distributing Fund shares for the year ended April 30, 2018, if any, are listed below:
| | Amount ($) |
| Class A | 74,066 |
| Class C | 613 |
Expenses waived/reimbursed by the Investment Manager and its affiliates
The Investment Manager and certain of its affiliates have contractually agreed to waive fees and/or reimburse expenses (excluding certain fees and expenses described below) for the period(s) disclosed below, unless sooner terminated at the sole discretion of the Board of Trustees, so that the Fund’s net operating expenses, after giving effect to fees waived/expenses reimbursed and any balance credits and/or overdraft charges from the Fund’s custodian, do not exceed the following annual rate(s) as a percentage of the class’ average daily net assets:
| | September 1, 2017
through
August 31, 2018 | Prior to
September 1, 2017 |
| Class A | 0.92% | 0.92% |
| Advisor Class | 0.67 | 0.67 |
| Class C | 1.67 | 1.67 |
| Institutional Class | 0.67 | 0.67 |
| Institutional 2 Class | 0.57 | 0.56 |
| Institutional 3 Class | 0.51 | 0.51 |
| Class T | 0.92 | 0.92 |
Under the agreement governing these fee waivers and/or expense reimbursement arrangements, the following fees and expenses are excluded from the waiver/reimbursement commitment, and therefore will be paid by the Fund, if applicable: taxes (including foreign transaction taxes), expenses associated with investments in affiliated and non-affiliated pooled investment vehicles (including mutual funds and exchange-traded funds), transaction costs and brokerage
| 40 | Columbia Corporate Income Fund | Annual Report 2018 |
Notes to Financial Statements (continued)
April 30, 2018
commissions, costs related to any securities lending program, dividend expenses associated with securities sold short, inverse floater program fees and expenses, transaction charges and interest on borrowed money, interest, infrequent and/or unusual expenses and any other expenses the exclusion of which is specifically approved by the Board of Trustees. This agreement may be modified or amended only with approval from the Investment Manager, certain of its affiliates and the Fund. In addition to the contractual agreement, the Investment Manager and certain of its affiliates have voluntarily agreed to waive fees and/or reimburse Fund expenses (excluding certain fees and expenses described above) so that Fund level expenses (expenses directly attributable to the Fund and not to a specific share class) are waived proportionately across all share classes, but the Fund’s net operating expenses shall not exceed the contractual annual rates listed in the table above. This arrangement may be revised or discontinued at any time. Any fees waived and/or expenses reimbursed under the expense reimbursement arrangements described above are not recoverable by the Investment Manager or its affiliates in future periods. Class C distribution fees waived by the Distributor, as discussed above, are in addition to the waiver/reimbursement commitment under the agreement.
Note 4. Federal tax information
The timing and character of income and capital gain distributions are determined in accordance with income tax regulations, which may differ from GAAP because of temporary or permanent book to tax differences.
At April 30, 2018, these differences were primarily due to differing treatment for deferral/reversal of wash sale losses, derivative investments, tax straddles, trustees’ deferred compensation, distributions, principal and/or interest from fixed income securities and distribution reclassifications. To the extent these differences were permanent, reclassifications were made among the components of the Fund’s net assets in the Statement of Assets and Liabilities. Temporary differences do not require reclassifications.
In the Statement of Assets and Liabilities the following reclassifications were made:
Excess of distributions
over net investment
income ($) | Accumulated
net realized
(loss) ($) | Paid in
capital ($) |
| 138,495 | (138,495) | — |
Net investment income (loss) and net realized gains (losses), as disclosed in the Statement of Operations, and net assets were not affected by this reclassification.
The tax character of distributions paid during the years indicated was as follows:
| Year Ended April 30, 2018 | Year Ended April 30, 2017 |
Ordinary
income ($) | Long-term
capital gains ($) | Total ($) | Ordinary
income ($) | Long-term
capital gains ($) | Total ($) |
| 36,818,819 | — | 36,818,819 | 34,242,230 | — | 34,242,230 |
Short-term capital gain distributions, if any, are considered ordinary income distributions for tax purposes.
At April 30, 2018, the components of distributable earnings on a tax basis were as follows:
Undistributed
ordinary income ($) | Undistributed
long-term
capital gains ($) | Capital loss
carryforwards ($) | Net unrealized
(depreciation) ($) |
| 3,867,494 | — | — | (36,527,842) |
At April 30, 2018, the cost of all investments for federal income tax purposes along with the aggregate gross unrealized appreciation and depreciation based on that cost was:
Federal
tax cost ($) | Gross unrealized
appreciation ($) | Gross unrealized
(depreciation) ($) | Net unrealized
(depreciation) ($) |
| 1,478,881,913 | 7,431,378 | (43,959,220) | (36,527,842) |
Columbia Corporate Income Fund | Annual Report 2018
| 41 |
Notes to Financial Statements (continued)
April 30, 2018
Tax cost of investments and unrealized appreciation/(depreciation) may also include timing differences that do not constitute adjustments to tax basis.
The following capital loss carryforwards, determined at April 30, 2018, may be available to reduce taxable income arising from future net realized gains on investments, if any, to the extent permitted by the Internal Revenue Code. Capital loss carryforwards with no expiration are required to be utilized prior to any capital losses which carry an expiration date. As a result of this ordering rule, capital loss carryforwards which carry an expiration date may be more likely to expire unused. In addition, for the year ended April 30, 2018, capital loss carryforwards utilized, expired unused and permanently lost, if any, were as follows:
| 2019 ($) | No expiration
short-term ($) | No expiration
long-term ($) | Total ($) | Utilized ($) | Expired ($) | Permanently
lost ($) |
| — | — | — | — | 13,814,802 | — | — |
Management of the Fund has concluded that there are no significant uncertain tax positions in the Fund that would require recognition in the financial statements. However, management’s conclusion may be subject to review and adjustment at a later date based on factors including, but not limited to, new tax laws, regulations, and administrative interpretations (including relevant court decisions). Generally, the Fund’s federal tax returns for the prior three fiscal years remain subject to examination by the Internal Revenue Service.
Note 5. Portfolio information
The cost of purchases and proceeds from sales of securities, excluding short-term investments and derivatives, if any, aggregated to $1,206,733,106 and $944,458,491, respectively, for the year ended April 30, 2018, of which $11,892,545 and $34,636,226, respectively, were U.S. government securities. The amount of purchase and sale activity impacts the portfolio turnover rate reported in the Financial Highlights.
Note 6. Affiliated money market fund
The Fund invests in Columbia Short-Term Cash Fund, an affiliated money market fund established for the exclusive use by the Fund and other affiliated funds (the Affiliated MMF). The income earned by the Fund from such investments is included as Dividends - affiliated issuers in the Statement of Operations. As an investing fund, the Fund indirectly bears its proportionate share of the expenses of the Affiliated MMF. The Affiliated MMF prices its shares with a floating net asset value. In addition, the Board of Trustees of the Affiliated MMF may impose a fee on redemptions (sometimes referred to as a liquidity fee) or temporarily suspend redemptions (sometimes referred to as imposing a redemption gate) in the event its liquidity falls below regulatory limits.
Note 7. Line of credit
The Fund has access to a revolving credit facility with a syndicate of banks led by Citibank, N.A., HSBC Bank USA, N.A. and JPMorgan Chase Bank, N.A. whereby the Fund may borrow for the temporary funding of shareholder redemptions or for other temporary or emergency purposes. The credit facility, which is a collective agreement between the Fund and certain other funds managed by the Investment Manager, severally and not jointly, permits collective borrowings up to $1 billion. Interest is charged to each participating fund based on its borrowings at a rate equal to the higher of (i) the overnight federal funds rate plus 1.00% or (ii) the one-month LIBOR rate plus 1.00%. Each borrowing under the credit facility matures no later than 60 days after the date of borrowing. The Fund also pays a commitment fee equal to its pro rata share of the amount of the credit facility at a rate of 0.15% per annum. The commitment fee is included in other expenses in the Statement of Operations.
The Fund had no borrowings during the year ended April 30, 2018.
| 42 | Columbia Corporate Income Fund | Annual Report 2018 |
Notes to Financial Statements (continued)
April 30, 2018
Note 8. Significant risks
Credit risk
Credit risk is the risk that the value of debt securities in the Fund’s portfolio may decline because the issuer may default and fail to pay interest or repay principal when due. Rating agencies assign credit ratings to debt securities to indicate their credit risk. Lower rated or unrated debt securities held by the Fund may present increased credit risk as compared to higher-rated debt securities.
Interest rate risk
Interest rate risk is the risk of losses attributable to changes in interest rates. In general, if prevailing interest rates rise, the values of debt securities tend to fall, and if interest rates fall, the values of debt securities tend to rise. Actions by governments and central banking authorities can result in increases in interest rates. Increasing interest rates may negatively affect the value of debt securities held by the Fund, resulting in a negative impact on the Fund’s performance and net asset value per share. In general, the longer the maturity or duration of a debt security, the greater its sensitivity to changes in interest rates.
Liquidity risk
Liquidity risk is the risk associated with a lack of marketability of investments which may make it difficult to sell the investment at a desirable time or price. Changing regulatory, market or other conditions or environments (for example, the interest rate or credit environments) may adversely affect the liquidity of the Fund’s investments. The Fund may have to accept a lower selling price for the holding, sell other investments, or forego another, more appealing investment opportunity. Generally, the less liquid the market at the time the Fund sells a portfolio investment, the greater the risk of loss or decline of value to the Fund. A less liquid market can lead to an increase in Fund redemptions, which may negatively impact Fund performance and net asset value per share, including, for example, if the Fund is forced to sell securities in a down market.
Shareholder concentration risk
At April 30, 2018, one unaffiliated shareholder of record owned 11.2% of the outstanding shares of the Fund in one or more accounts. The Fund has no knowledge about whether any portion of those shares was owned beneficially. Affiliated shareholders of record owned 70.8% of the outstanding shares of the Fund in one or more accounts. Subscription and redemption activity by concentrated accounts may have a significant effect on the operations of the Fund. In the case of a large redemption, the Fund may be forced to sell investments at inopportune times, including its liquid positions, which may result in Fund losses and the Fund holding a higher percentage of less liquid positions. Large redemptions could result in decreased economies of scale and increased operating expenses for non-redeeming Fund shareholders.
Note 9. Subsequent events
Management has evaluated the events and transactions that have occurred through the date the financial statements were issued and noted no items requiring adjustment of the financial statements or additional disclosure.
Note 10. Information regarding pending and settled legal proceedings
Ameriprise Financial and certain of its affiliates have historically been involved in a number of legal, arbitration and regulatory proceedings, including routine litigation, class actions, and governmental actions, concerning matters arising in connection with the conduct of their business activities. Ameriprise Financial believes that the Fund is not currently the subject of, and that neither Ameriprise Financial nor any of its affiliates are the subject of, any pending legal, arbitration or regulatory proceedings that are likely to have a material adverse effect on the Fund or the ability of Ameriprise Financial or its affiliates to perform under their contracts with the Fund. Ameriprise Financial is required to make quarterly (10-Q), annual (10-K) and, as necessary, 8-K filings with the Securities and Exchange Commission (SEC) on legal and regulatory matters that relate to Ameriprise Financial and its affiliates. Copies of these filings may be obtained by accessing the SEC website at www.sec.gov.
There can be no assurance that these matters, or the adverse publicity associated with them, will not result in increased Fund redemptions, reduced sale of Fund shares or other adverse consequences to the Fund. Further, although we believe proceedings are not likely to have a material adverse effect on the Fund or the ability of Ameriprise Financial or its affiliates to
Columbia Corporate Income Fund | Annual Report 2018
| 43 |
Notes to Financial Statements (continued)
April 30, 2018
perform under their contracts with the Fund, these proceedings are subject to uncertainties and, as such, we are unable to estimate the possible loss or range of loss that may result. An adverse outcome in one or more of these proceedings could result in adverse judgments, settlements, fines, penalties or other relief that could have a material adverse effect on the consolidated financial condition or results of operations of Ameriprise Financial.
| 44 | Columbia Corporate Income Fund | Annual Report 2018 |
Report of Independent Registered Public Accounting Firm
To the Board of Trusteess of Columbia Funds Series Trust I and Shareholders of Columbia Corporate Income Fund
Opinion on the Financial Statements
We have audited the accompanying statement of assets and liabilities, including the portfolio of investments, of Columbia Corporate Income Fund (one of the funds constituting Columbia Funds Series Trust I, referred to hereafter as the "Fund") as of April 30, 2018, the related statement of operations for the year ended April 30, 2018, the statement of changes in net assets for each of the two years in the period ended April 30, 2018, including the related notes, and the financial highlights for each of the five years in the period ended April 30, 2018 (collectively referred to as the “financial statements”). In our opinion, the financial statements present fairly, in all material respects, the financial position of the Fund as of April 30, 2018, the results of its operations for the year then ended, the changes in its net assets for each of the two years in the period ended April 30, 2018 and the financial highlights for each of the five years in the period ended April 30, 2018 in conformity with accounting principles generally accepted in the United States of America.
Basis for Opinion
These financial statements are the responsibility of the Fund’s management. Our responsibility is to express an opinion on the Fund’s financial statements based on our audits. We are a public accounting firm registered with the Public Company Accounting Oversight Board (United States) (“PCAOB”) and are required to be independent with respect to the Fund in accordance with the U.S. federal securities laws and the applicable rules and regulations of the Securities and Exchange Commission and the PCAOB.
We conducted our audits of these financial statements in accordance with the standards of the PCAOB. Those standards require that we plan and perform the audit to obtain reasonable assurance about whether the financial statements are free of material misstatement, whether due to error or fraud.
Our audits included performing procedures to assess the risks of material misstatement of the financial statements, whether due to error or fraud, and performing procedures that respond to those risks. Such procedures included examining, on a test basis, evidence regarding the amounts and disclosures in the financial statements. Our audits also included evaluating the accounting principles used and significant estimates made by management, as well as evaluating the overall presentation of the financial statements. Our procedures included confirmation of securities owned as of April 30, 2018 by correspondence with the custodian, transfer agent, brokers and agent banks; when replies were not received from brokers, we performed other auditing procedures. We believe that our audits provide a reasonable basis for our opinion.
/s/PricewaterhouseCoopers LLP
Minneapolis, Minnesota
June 21, 2018
We have served as auditors of one or more investment companies within the Columbia Funds Complex since 1977.
Columbia Corporate Income Fund | Annual Report 2018
| 45 |
Shareholders elect the Board that oversees the Fund’s operations. The Board appoints officers who are responsible for day-to-day business decisions based on policies set by the Board. The following table provides basic biographical information about the Fund’s Trustees, including their principal occupations during the past five years, although specific titles for individuals may have varied over the period. The year set forth beneath Length of Service in the table below is the year in which the Trustee was first appointed or elected as Trustee to any Fund currently in the Columbia Funds Complex or a predecessor thereof. Under current Board policy, members serve terms of indefinite duration.
Independent trustees
| Name, address, year of birth | Position held with the Trust and length of service | Principal occupation(s) during the past five years and other relevant professional experience | Number of Funds in the Columbia Fund Complex overseen | Other directorships held by Trustee during the past five years |
Janet Langford Carrig
c/o Columbia Management
Investment Advisers, LLC
225 Franklin Street
Mail Drop BX32 05228
Boston, MA 02110
1957 | Trustee
1996 | Senior Vice President, General Counsel and Corporate Secretary, ConocoPhillips (independent energy company) since September 2007 | 71 | None |
Douglas A. Hacker
c/o Columbia Management
Investment Advisers, LLC
225 Franklin Street
Mail Drop BX32 05228
Boston, MA 02110
1955 | Trustee and Chairman of the Board
1996 | Independent business executive since May 2006; Executive Vice President — Strategy of United Airlines from December 2002 to May 2006; President of UAL Loyalty Services (airline marketing company) from September 2001 to December 2002; Executive Vice President and Chief Financial Officer of United Airlines from July 1999 to September 2001 | 71 | Spartan Nash Company, (food distributor); Nash Finch Company (food distributor) from 2005 to 2013; Aircastle Limited (aircraft leasing); SeaCube Container Leasing Ltd. (container leasing) from 2010 to 2013; and Travelport Worldwide Limited (travel information technology) |
Nancy T. Lukitsh
c/o Columbia Management
Investment Advisers, LLC
225 Franklin Street
Mail Drop BX32 05228
Boston, MA 02110
1956 | Trustee
2011 | Senior Vice President, Partner and Director of Marketing, Wellington Management Company, LLP (investment adviser) from 1997 to 2010; Chair, Wellington Management Portfolios (commingled non-U.S. investment pools) from 2007 to 2010; Director, Wellington Trust Company, NA and other Wellington affiliates from 1997 to 2010 | 71 | None |
David M. Moffett
c/o Columbia Management
Investment Advisers, LLC
225 Franklin Street
Mail Drop BX32 05228
Boston, MA 02110
1952 | Trustee
2011 | Retired. Consultant to Bridgewater and Associates | 71 | Director, CSX Corporation; Genworth Financial, Inc. (financial and insurance products and services); PayPal Holdings Inc. (payment and data processing services); Trustee, University of Oklahoma Foundation; former Director, eBay Inc. (online trading community), 2007-2015; and former Director, CIT Bank, CIT Group Inc. (commercial and consumer finance), 2010-2016 |
John J. Neuhauser
c/o Columbia Management
Investment Advisers, LLC
225 Franklin Street
Mail Drop BX32 05228
Boston, MA 02110
1943 | Trustee
1984 | President, Saint Michael’s College since August 2007; Director or Trustee of several non-profit organizations, including University of Vermont Medical Center; Academic Vice President and Dean of Faculties, Boston College from August 1999 to October 2005; University Professor, Boston College from November 2005 to August 2007 | 71 | Liberty All-Star Equity Fund and Liberty All- Star Growth Fund (closed-end funds) |
| 46 | Columbia Corporate Income Fund | Annual Report 2018 |
TRUSTEES AND OFFICERS (continued)
Independent trustees (continued)
| Name, address, year of birth | Position held with the Trust and length of service | Principal occupation(s) during the past five years and other relevant professional experience | Number of Funds in the Columbia Fund Complex overseen | Other directorships held by Trustee during the past five years |
Patrick J. Simpson
c/o Columbia Management
Investment Advisers, LLC
225 Franklin Street
Mail Drop BX32 05228
Boston, MA 02110
1944 | Trustee
2000 | Of Counsel, Perkins Coie LLP (law firm) since 2015; Partner, Perkins Coie LLP from 1988 to 2014 | 71 | None |
Anne-Lee Verville
c/o Columbia Management
Investment Advisers, LLC
225 Franklin Street
Mail Drop BX32 05228
Boston, MA 02110
1945 | Trustee
1998 | Retired. General Manager, Global Education Industry from 1994 to 1997, President – Application Systems Division from 1991 to 1994, Chief Financial Officer – US Marketing & Services from 1988 to 1991, and Chief Information Officer from 1987 to 1988, IBM Corporation (computer and technology) | 71 | Enesco Group, Inc. (producer of giftware and home and garden decor products) from 2001 to 2006 |
Consultants to the Independent Trustees*
| Name, address, year of birth | Position held with the Trust and length of service | Principal occupation(s) during the past five years and other relevant professional experience | Number of Funds in the Columbia Funds complex overseen | Other directorships held by Trustee during the past five years |
J. Kevin Connaughton
c/o Columbia
Management Investment
Advisers, LLC,
225 Franklin Street
Mail Drop BX32 05228,
Boston, MA 02110
1964 | Independent Trustee Consultant
2016 | Independent Trustee Consultant, Columbia Funds since March 2016; Adjunct Professor of Finance, Bentley University since November 2017; Managing Director and General Manager of Mutual Fund Products, Columbia Management Investment Advisers, LLC from May 2010 to February 2015; President, Columbia Funds from 2009 to 2015; and senior officer of Columbia Funds and affiliated funds from 2003 to 2015 | 71 | Director, The Autism Project since March 2015; former Trustee, New Century Portfolios, March 2015-December 2017; formerly on Board of Governors, Gateway Healthcare, January 2016 – December 2017 |
Natalie A. Trunow
c/o Columbia
Management Investment
Advisers, LLC,
225 Franklin Street
Mail Drop BX32 05228,
Boston, MA 02110
1967 | Independent Trustee Consultant
2016 | Independent Trustee Consultant, Columbia Funds since September 2016; Chief Executive Officer, Millennial Portfolio Solutions LLC (asset management and consulting services) since January 2016; Director of Investments, Casey Family Programs from April 2016 to September 2016; Senior Vice President and Chief Investment Officer, Calvert Investments from August 2008 to January 2016; Section Head and Portfolio Manager, General Motors Asset Management from June 1997 to August 2008 | 71 | Director, Health Services for Children with Special Needs, Inc.; Director, Guidewell Financial Solutions |
| * | J. Kevin Connaughton was appointed consultant to the Independent Trustees effective March 1, 2016. Natalie A. Trunow was appointed consultant to the Independent Trustees effective September 1, 2016. Shareholders of the Funds are expected to be asked to elect each of Mr. Connaughton and Ms. Trunow as a Trustee at a future shareholder meeting. |
Columbia Corporate Income Fund | Annual Report 2018
| 47 |
TRUSTEES AND OFFICERS (continued)
Interested trustee affiliated with Investment Manager*
| Name, address, year of birth | Position held with the Trust and length of service | Principal occupation(s) during the past five years and other relevant professional experience | Number of Funds in the Columbia Funds Complex overseen | Other directorships held by Trustee during the past five years |
William F. Truscott
c/o Columbia Management
Investment Advisers, LLC
225 Franklin Street
Boston, MA 02110
1960 | Trustee
2012 | Chairman of the Board and President, Columbia Management Investment Advisers, LLC since May 2010 and February 2012, respectively; Chief Executive Officer, Global Asset Management, Ameriprise Financial, Inc. since September 2012 (previously Chief Executive Officer, U.S. Asset Management & President, Annuities, May 2010-September 2012); Director and Chief Executive Officer, Columbia Management Investment Distributors, Inc. since May 2010 and February 2012, respectively; Chairman of the Board and Chief Executive Officer, RiverSource Distributors, Inc. since 2006; Director, Threadneedle Asset Management Holdings, SARL since 2014; President and Chief Executive Officer, Ameriprise Certificate Company, 2006-August 2012 | 196 | Chairman of the Board, Columbia Management Investment Advisers, LLC since May 2010; Director, Columbia Management Investment Distributors, Inc. since May 2010; former Director, Ameriprise Certificate Company, 2006 - January 2013 |
| * | Interested person (as defined under the 1940 Act) by reason of being an officer, director, security holder and/or employee of the Investment Manager or Ameriprise Financial. |
The Statement of Additional Information has additional information about the Fund’s Board members and is available, without charge, upon request by calling 800.345.6611, visiting columbiathreadneedleus.com/investor/ or contacting your financial intermediary.
| 48 | Columbia Corporate Income Fund | Annual Report 2018 |
TRUSTEES AND OFFICERS (continued)
The Board has appointed officers who are responsible for day-to-day business decisions based on policies it has established. The officers serve at the pleasure of the Board. The following table provides basic information about the Officers of the Fund, including principal occupations during the past five years, although their specific titles may have varied over the period. In addition to Mr. Truscott, who is Senior Vice President, the Fund’s other officers are:
Fund officers
Name,
address and
year of birth | Position and year
first appointed to
position for any Fund
in the Columbia
Funds complex or a
predecessor thereof | Principal occupation(s) during past five years |
Christopher O. Petersen
5228 Ameriprise
Financial Center
Minneapolis, MN 55474
Born 1970 | President and Principal Executive Officer (2015) | Vice President and Lead Chief Counsel, Ameriprise Financial, Inc. since January 2015 (previously, Vice President and Chief Counsel, January 2010 - December 2014; officer of Columbia Funds and affiliated funds since 2007. |
Michael G. Clarke
225 Franklin Street
Boston, MA 02110
Born 1969 | Treasurer (2011), Chief Financial Officer (2009) and Chief Accounting Officer (2015) | Vice President — Mutual Fund Administration, Columbia Management Investment Advisers, LLC, since May 2010; senior officer of Columbia Funds and affiliated funds since 2002. |
Paul B. Goucher
100 Park Avenue
New York, NY 10017
Born 1968 | Senior Vice President (2011) and Assistant Secretary (2008) | Senior Vice President and Assistant General Counsel, Ameriprise Financial, Inc. since January 2017 (previously Vice President and Lead Chief Counsel, November 2008 - January 2017 and January 2013 - January 2017, respectively; and Chief Counsel, January 2010 - January 2013); Vice President, Chief Legal Officer and Assistant Secretary, Columbia Management Investment Advisers, LLC since May 2010. |
Thomas P. McGuire
225 Franklin Street
Boston, MA 02110
Born 1972 | Senior Vice President and Chief Compliance Officer (2012) | Vice President — Asset Management Compliance, Ameriprise Financial, Inc., since May 2010; Chief Compliance Officer, Ameriprise Certificate Company since September 2010. |
Colin Moore
225 Franklin Street
Boston, MA 02110
Born 1958 | Senior Vice President (2010) | Executive Vice President and Global Chief Investment Officer, Ameriprise Financial, Inc., since July 2013; Executive Vice President and Global Chief Investment Officer, Columbia Management Investment Advisers, LLC since July 2013 (previously Director and Global Chief Investment Officer, 2010 - 2013). |
Ryan C. Larrenaga
225 Franklin Street
Boston, MA 02110
Born 1970 | Senior Vice President (2017), Chief Legal Officer (2017) and Secretary (2015) | Vice President and Group Counsel, Ameriprise Financial, Inc. since August 2011; officer of Columbia Funds and affiliated funds since 2005. |
Michael E. DeFao
225 Franklin Street
Boston, MA 02110
Born 1968 | Vice President (2011) and Assistant Secretary (2010) | Vice President and Chief Counsel, Ameriprise Financial, Inc. since May 2010. |
Amy Johnson
5228 Ameriprise
Financial Center
Minneapolis, MN 55474
Born 1965 | Vice President (2006) | Managing Director and Global Head of Operations, Columbia Management Investment Advisers, LLC since April 2016 (previously Managing Director and Chief Operating Officer, 2010 - 2016). |
Lyn Kephart-Strong
5228 Ameriprise
Financial Center
Minneapolis, MN 55474
Born 1960 | Vice President (2015) | President, Columbia Management Investment Services Corp. since October 2014; Vice President & Resolution Officer, Ameriprise Trust Company since August 2009. |
Columbia Corporate Income Fund | Annual Report 2018
| 49 |
The Fund mails one shareholder report to each shareholder address. If you would like more than one report, please call shareholder services at 800.345.6611 and additional reports will be sent to you.
Proxy voting policies and procedures
The policy of the Board of Trustees is to vote the proxies of the companies in which the Fund holds investments consistent with the procedures as stated in the Statement of Additional Information (SAI). You may obtain a copy of the SAI without charge by calling 800.345.6611; contacting your financial intermediary; visiting columbiathreadneedleus.com/investor/; or searching the website of the Securities and Exchange Commission (SEC) at sec.gov. Information regarding how the Fund voted proxies relating to portfolio securities is filed with the SEC by August 31st for the most recent 12-month period ending June 30th of that year, and is available without charge by visiting columbiathreadneedleus.com/investor/, or searching the website of the SEC at sec.gov.
Quarterly schedule of investments
The Fund files a complete schedule of portfolio holdings with the SEC for the first and third quarters of each fiscal year on Form N-Q. The Fund’s Form N-Q is available on the SEC’s website at sec.gov and may be reviewed and copied at the SEC’s Public Reference Room in Washington, D.C. Information on the operation of the Public Reference Room may be obtained by calling 800.SEC.0330. The Fund’s complete schedule of portfolio holdings, as filed on Form N-Q, can also be obtained without charge, upon request, by calling 800.345.6611.
Additional Fund information
For more information about the Fund, please visit columbiathreadneedleus.com/investor/ or call 800.345.6611. Customer Service Representatives are available to answer your questions Monday through Friday from 8 a.m. to 7 p.m. Eastern time.
Fund investment manager
Columbia Management Investment Advisers, LLC
225 Franklin Street
Boston, MA 02110
Fund distributor
Columbia Management Investment Distributors, Inc.
225 Franklin Street
Boston, MA 02110
Fund transfer agent
Columbia Management Investment Services Corp.
P.O. Box 8081
Boston, MA 02266-8081
| 50 | Columbia Corporate Income Fund | Annual Report 2018 |
[THIS PAGE INTENTIONALLY LEFT BLANK]
[THIS PAGE INTENTIONALLY LEFT BLANK]
[THIS PAGE INTENTIONALLY LEFT BLANK]
Columbia Corporate Income Fund
P.O. Box 8081
Boston, MA 02266-8081
Please read and consider the investment objectives, risks, charges and expenses for any fund carefully before investing. For a prospectus and summary prospectus, which contains this and other important information about the Fund, go to
columbiathreadneedleus.com/investor/. The Fund is distributed by Columbia Management Investment Distributors, Inc., member FINRA, and managed by Columbia Management Investment Advisers, LLC.
Columbia Threadneedle Investments (Columbia Threadneedle) is the global brand name of the Columbia and Threadneedle group of companies. All rights reserved. Columbia Management Investment Distributors, Inc., 225 Franklin Street, Boston, MA 02110-2804
© 2018 Columbia Management Investment Advisers, LLC.
columbiathreadneedleus .com/investor/

Annual Report
April 30, 2018
Multi-Manager Directional Alternative Strategies Fund
Not FDIC Insured • No bank guarantee • May lose value
Dear Shareholders,
The year 2017 was an extraordinary year in the financial markets. The S&P 500 Index didn’t experience a single down month and returned over 20%. Continuing this trend, January 2018 marked the fastest start for the index ever. Low volatility, which had been a feature of the U.S. equity market for several years, along with the surge in the S&P 500 Index, drove investor sentiment to very high levels. This arguably set the stage for an overdue correction, which we witnessed in February 2018.
A return to volatility
There have been few periods of market upheaval such as were experienced in the first part of 2018. While investors were taken by surprise by the sudden and pronounced market swings, the return to some level of volatility actually marked a resumption of relatively normal market conditions. Having said that, it’s important to distinguish between a good technical correction where excess enthusiasm in the marketplace is being let out, versus a real change in the underlying fundamentals – things like an underperforming economy or weaker corporate earnings. Our view is that the recent market volatility falls into the former category, and the fundamentals remain strong. We’re continuing to see improvements in global economic activity, and we’re seeing corporate earnings expectations continue to rise – and not just because of tax reform.
Consistency is more important than ever
It’s important to keep in mind that when it comes to long-term investing, it’s the destination, not the journey that matters most. If you have a financial goal that you’ve worked out with your financial advisor, and you have a good asset allocation plan to reach it, it’s a question of sticking with your plan rather than become focused on near-term volatility. Bouts of volatility are normal. After all, it’s hard to cross the ocean without hitting an occasional rough patch. You need to focus on the destination.
One final thought. In weathering volatility, it’s the consistency of the return that is essential. Investors who chase higher returns are usually the first to sell when an investment goes through a bad patch, and they therefore don’t tend to benefit from the recovery. More disciplined investors who perhaps panic less or not at all during periods of volatility, tend to have improved long-term results and are more likely to reach their financial goals. Nothing is more important to us than making sure those who have entrusted us to protect and grow their assets are able to do what matters most to them.
Your success is our priority. Talk to your financial advisor about how working with Columbia Threadneedle Investments may help you position your portfolio for consistent, sustainable outcomes, no matter the market conditions.
Sincerely,
Christopher O. Petersen
President, Columbia Funds
The S&P 500 Index, an unmanaged index, measures the performance of 500 widely held, large-capitalization U.S. stocks and is frequently used as a general measure of market performance. Past performance is no guarantee of future results.
Columbia Funds are distributed by Columbia Management Investment Distributors, Inc., member FINRA, and managed by Columbia Management Investment Advisers, LLC.
© 2018 Columbia Management Investment Advisers, LLC. All rights reserved.
Multi-Manager Directional Alternative Strategies Fund | Annual Report 2018
Multi-Manager Directional Alternative Strategies Fund | Annual Report 2018
Investment objective
Multi-Manager Directional Alternative Strategies Fund (the Fund) seeks capital appreciation.
Portfolio management
Boston Partners Global Investors, Inc
Joseph Feeney, Jr., CFA
Eric Connerly, CFA
AQR Capital Management, LLC
Michele Aghassi, Ph.D.
Andrea Frazzini, Ph.D., M.S.
Jacques Friedman, M.S.
Analytic Investors, LLC
Harindra de Silva, CFA
Dennis Bein, CFA
David Krider, CFA
| Average annual total returns (%) (for the period ended April 30, 2018) |
| | | Inception | 1 Year | Life |
| Class A | 10/17/16 | 7.46 | 9.04 |
| Institutional Class* | 01/03/17 | 7.67 | 9.25 |
| HFRX Equity Hedge Index | | 6.98 | 7.77 |
| Wilshire Liquid Alternative Equity Hedge Index | | 2.51 | 4.70 |
| MSCI World Index (Net) | | 13.22 | 16.99 |
All results shown assume reinvestment of distributions during the period. Returns do not reflect the deduction of taxes that a shareholder may pay on Fund distributions or on the redemption of Fund shares. Performance results reflect the effect of any fee waivers or reimbursements of Fund expenses by Columbia Management Investment Advisers, LLC and/or any of its affiliates. Absent these fee waivers or expense reimbursement arrangements, performance results would have been lower.
The performance information shown represents past performance and is not a guarantee of future results. The investment return and principal value of your investment will fluctuate so that your shares, when redeemed, may be worth more or less than their original cost. Current performance may be lower or higher than the performance information shown. You may obtain performance information current to the most recent month-end by contacting your financial intermediary, visiting columbiathreadneedleus.com/investor/ or calling 800.345.6611.
| * | The returns shown for periods prior to the share class inception date (including returns for the Life of the Fund, if shown, which are since Fund inception) include the returns of the Fund’s oldest share class. These returns are adjusted to reflect any higher class-related operating expenses of the newer share classes, as applicable. Please visit columbiathreadneedleus.com/investor/investment-products/mutual-funds/appended-performance for more information. |
The HFRX Equity Hedge Index strategies maintain positions both long and short in primarily equity and equity derivative securities. Equity Hedge managers would typically maintain at least 50%, and may in some cases be substantially entirely invested in equities, both long and short. Hedge Fund Research, Inc. (HFR) utilizes a UCITSIII compliant methodology to construct the HFRX Hedge Fund Indices. The methodology is based on defined and predetermined rules and objective criteria to select and rebalance components to maximize representation of the Hedge Fund Universe. HFRX Indices utilize state-of-the-art quantitative techniques and analysis; multi-level screening, cluster analysis, Monte-Carlo simulations and optimization techniques ensure that each Index is a pure representation of its corresponding investment focus.
The Wilshire Liquid Alternative Equity Hedge Index measures the performance of the equity hedge strategy component of the Wilshire Liquid Alternative IndexSM. Equity hedge investment strategies predominantly invest in long and short equities. The Wilshire Liquid Alternative Equity Hedge Index (WLIQAEH) is designed to provide a broad measure of the liquid alternative equity hedge market.
The MSCI World Index (Net) is a free float-adjusted market capitalization weighted index that is designed to measure the equity market performance of developed markets.
Indices are not available for investment, are not professionally managed and do not reflect sales charges, fees, brokerage commissions, taxes (except the MSCI World Index (Net), which reflect reinvested dividends net of withholding taxes) or other expenses of investing. Securities in the Fund may not match those in an index.
| 2 | Multi-Manager Directional Alternative Strategies Fund | Annual Report 2018 |
Fund at a Glance (continued)
Performance of a hypothetical $10,000 investment (October 17, 2016 — April 30, 2018)
The chart above shows the change in value of a hypothetical $10,000 investment in Class A shares of Multi-Manager Directional Alternative Strategies Fund during the stated time period, and does not reflect the deduction of taxes that a shareholder may pay on Fund distributions or on the redemption of Fund shares.
| Portfolio breakdown — long positions (%) (at April 30, 2018) |
| Common Stocks | 121.0 |
| Limited Partnerships | 0.2 |
| Preferred Stocks | 0.5 |
| Short-Term Investments Segregated in Connection with Open Derivatives Contracts(a) | 29.0 |
| Total | 150.7 |
| (a) | Includes investments in Money Market Funds (amounting to $50.8 million) which have been segregated to cover obligations relating to the Fund’s investment in derivatives which provide exposure to multiple markets. For a description of the Fund’s investments in derivatives, see Investments in derivatives following the Portfolio of Investments and Note 2 to the Notes to Financial Statements. |
Percentages indicated are based upon total investments, net of investments sold short. The Fund’s portfolio composition is subject to change.
| Portfolio breakdown — short positions (%) (at April 30, 2018) |
| Common Stocks | (50.5) |
| Preferred Stocks | (0.2) |
| Total | (50.7) |
Percentages indicated are based upon total investments, net of investments sold short. The Fund’s portfolio composition is subject to change.
| Equity sector breakdown — long positions (%) (at April 30, 2018) |
| Consumer Discretionary | 12.9 |
| Consumer Staples | 6.4 |
| Energy | 8.5 |
| Financials | 13.0 |
| Health Care | 10.0 |
| Industrials | 18.3 |
| Information Technology | 22.6 |
| Materials | 4.8 |
| Real Estate | 1.0 |
| Telecommunication Services | 0.5 |
| Utilities | 2.0 |
| Total | 100.0 |
Percentages indicated are based upon total long equity investments. The Fund’s portfolio composition is subject to change.
Multi-Manager Directional Alternative Strategies Fund | Annual Report 2018
| 3 |
Fund at a Glance (continued)
| Equity sector breakdown — short positions (%) (at April 30, 2018) |
| Consumer Discretionary | (13.8) |
| Consumer Staples | (3.0) |
| Energy | (19.0) |
| Financials | (9.2) |
| Health Care | (12.3) |
| Industrials | (12.6) |
| Information Technology | (10.4) |
| Materials | (9.2) |
| Real Estate | (4.0) |
| Telecommunication Services | (5.7) |
| Utilities | (0.8) |
| Total | (100.0) |
Percentages indicated are based upon total short equity investments. The Fund’s portfolio composition is subject to change.
| Market exposure through derivatives investments (% of notional exposure) (at April 30, 2018)(a) |
| | Long | Short | Net |
| Equity Derivative Contracts | 245.0 | (171.2) | 73.8 |
| Foreign Currency Derivative Contracts | 47.8 | (21.6) | 26.2 |
| Total Notional Market Value of Derivative Contracts | 292.8 | (192.8) | 100.0 |
(a) The Fund has market exposure (long and/or short) to equity and foreign currency through its investments in derivatives. The notional exposure of a financial instrument is the nominal or face amount that is used to calculate payments made on that instrument and/or changes in value for the instrument. The notional exposure is a hypothetical underlying quantity upon which payment obligations are computed. Notional exposures provide a gauge for how the Fund may behave given changes in individual markets. For a description of the Fund’s investments in derivatives, see Investments in derivatives following the Portfolio of Investments, and Note 2 to the Notes to Financial Statements.
| 4 | Multi-Manager Directional Alternative Strategies Fund | Annual Report 2018 |
Manager Discussion of Fund Performance
During the 12-month period ended April 30, 2018, the Fund was managed by three independent money management firms and each invested a portion of the portfolio’s assets. As of April 30, 2018, Analytic Investors, LLC (Analytic), AQR Capital Management, LLC (AQR) and Boston Partners Global Investors, Inc doing business as Boston Partners (Boston Partners) managed approximately 29.9%, 31.2% and 38.9% of the Fund’s assets, respectively.
For the 12-month period that ended April 30, 2018, the Fund’s Class A shares returned 7.46%. The Fund outperformed its benchmark, the HFRX Equity Hedge Index, which returned 6.98%. During the same time period, the Wilshire Liquid Alternative Equity Hedge Index returned 2.51%, and the MSCI World Index (Net) returned 13.22%. The Fund’s relative performance can be attributed to the performance of the Fund’s Subadvisers, who employ a variety of alternative investment strategies, involving strategies, techniques and practices designed to seek capital appreciation through participation in the broad equity and other markets while hedging overall market exposure relative to traditional long-only equity strategies. Generally, the Fund seeks to provide higher risk-adjusted returns with lower volatility compared to equity markets.
Global equity markets climbed despite increased volatility and geopolitical risk
The 12-month period ended April 30, 2018 was marked by strong performance for developed equity markets globally, despite weakness and heightened volatility during the first quarter of 2018. Early in the period, developed equity markets rose largely on improved global economic growth, subdued inflation, rebounding commodity prices, still-accommodative monetary policies, and strong corporate fundamentals. U.S. equity markets in particular reached all-time highs amid historically low volatility. Performance across major equity indices was more muted as the year progressed, however, as markets responded to risks surrounding the French election, the U.S. FBI Director’s dismissal and escalating tensions with North Korea. Several developed equity markets rallied again in the fourth quarter of 2017 to end the year higher. U.S. markets rose especially strongly on better than expected economic growth data and the signing into law of a tax reform bill. Indeed, stocks moved higher even as the U.S. Federal Reserve (the Fed) raised interest rates twice more — in June and December 2017.
In the first quarter of 2018, the stable and sustained bullish environment that had dominated the prior calendar year began to show signs of strain, giving rise to a dramatic increase in equity market volatility and disappointing returns across asset classes. U.S. equities rallied in January, aided by better than expected corporate earnings reports and ongoing optimism around tax reform, only to decline in early February on concerns about rising bonds yields, increasing wages, inflationary pressures, prospects of new regulations on technology firms, and a potentially faster pace of interest rate increases by the Fed. Increased global trade tensions also weighed on equity market performance through March 2018, as equities ended the quarter well below their January 2018 highs. The MSCI World Index (Net) posted its first negative quarter since the fourth quarter of 2016. Even with another interest rate increase by the Fed in March 2018, albeit well-telegraphed, equity market performance turned around slightly in April, as most markets posted positive returns. Despite better than expected corporate earnings, U.S. equity market returns were muted by higher yields, a stronger U.S. dollar weighing on export prospects, and concerns around potential peak economic growth.
Stock selection strategies overall supported relative results
Analytic: Our portion of the Fund outperformed the Fund benchmark during the period due primarily to effective stock selection. Our model’s factor positioning helped across all categories, led by an emphasis on estimate revisions and quality factors, which investors generally favored during the period.
From a sector perspective, having an underweight position in consumer staples helped relative returns, as the sector underperformed the MSCI World Index during the period. Stock selection within the consumer staples sector also added value. Similarly, having an underweight allocation to and effective stock selection in the comparatively weak consumer discretionary sector contributed positively. Having an overweight to information technology further aided relative results, as this was the strongest performing sector in the MSCI World Index during the period. Conversely, having an underweight allocation to financials detracted from relative results, as the sector outperformed the MSCI World Index during the annual period. Stock selection within financials also hurt. Having overweight allocations to health care and utilities dampened relative results, as each sector underperformed the benchmark during the period.
The top individual contributors to our portion of the Fund’s results during the annual period were long positions in U.S. pharmaceuticals company AbbVie and Japanese semiconductor company Tokyo Electron and short positions in Swiss-based multinational oilfield services company Weatherford International and U.S.-based globally diversified technology and financial
Multi-Manager Directional Alternative Strategies Fund | Annual Report 2018
| 5 |
Manager Discussion of Fund Performance (continued)
services conglomerate General Electric. The biggest individual detractors from our portion of the Fund’s results were long positions in Japanese social media website operator Mixi, U.S.-based global biopharmaceutical company Celgene and U.S. pharmaceutical and health care company Merck.
The top contributing countries on a relative basis were Spain, Sweden and Singapore, where effective allocation positioning in each drove results. Having underweights to Spain and Sweden, which posted positive absolute returns but lagged the MSCI World Index, and an overweight to Singapore, which outperformed the MSCI World Index during the period, proved especially effective. Conversely, underweight positions in France and Italy, which each outperformed the MSCI World Index during the period, and an overweight allocation to Australia, which posted an absolute gain but underperformed the MSCI World Index during the period, detracted from the Fund’s relative results.
AQR: Our portion of the Fund outperformed the Fund benchmark during the period due to a combination of passive market exposure and effective global stock selection. Tactical market exposure also contributed positively, albeit more modestly. From a theme perspective within the global stock selection component of our portion of the Fund’s strategy, stability and momentum factors were the best performing, while valuation factors were the weakest.
From a sector perspective, it is important to note that our process implements a market neutral model that does not think in benchmark relative terms, along with a static passive exposure via futures. It targets a portfolio beta of zero, but has a perennial long dollar bias associated with low beta signals in its stability theme. We equilibrate the portfolio beta by running more Fund assets long than short. While net sector exposures in a long-only portfolio are zero sum and can imply a view-based forecast, this is not the case within our process. All that said, consumer discretionary, industrials and financials were the strongest positive contributors. Conversely, information technology, consumer staples and utilities were the sectors that detracted most.
The top individual contributors to our portion of the Fund’s results during the period were U.S.-based diversified infrastructure businesses operator Macquarie Infrastructure, Ireland-based pharmaceuticals company Alkermes and Netherlands-based cable and mobile telephony services provider Altice. The biggest individual detractors from our portion of the Fund’s results during the period were U.S. mobile payment solutions provider Square, Japanese convenience store chain operator FamilyMart and U.K. food retailer Tesco. It is important to keep in mind that our process is a systematic one in which securities are held based on their characteristics against hundreds of individual factors used by our investment model. Decisions to add or remove positions are based on relative attractiveness across all factors and themes as well as optimization indications of marginal risk and trading costs. We do not make security level weight decisions based on data points of individual stocks in isolation. We attempt to diversify away more idiosyncratic risk by holding hundreds of securities with position-sized constraints.
Similarly with countries, our process is a market neutral model that takes essentially no relative country or currency views. Still, within the global stock selection component, the U.S., the U.K. and the Netherlands were the largest positive contributors to returns. Conversely, Japan, France and Sweden were the biggest detractors from results during the period.
Boston Partners: Our portion of the Fund slightly underperformed the Fund benchmark during the period. Even as the U.S. equity market favored growth companies over value companies, our portion of the Fund’s value-oriented long positions outperformed its short positions in expensive stocks. The most important factors in our portion of the Fund’s return during the period were a bias to value on the long side and effective stock selection in the information technology and financials sectors. On an absolute basis, our portion of the Fund posted solid returns due to its net long positioning amid a strongly rising stock market.
The sectors that contributed most positively to our portion of the Fund’s results were information technology, financials and energy on the long side of the portfolio. Within the information technology sector, gains primarily came from large-cap, mature businesses as well as from mid-cap semiconductor businesses benefiting from industry consolidation and increased demand from end-markets. In financials, long positions in banks and financial services firms benefiting from a gradually rising yield environment and accelerated capital return plans helped most. In energy, long positions in exploration and production companies added to our portion of the Fund’s performance most, as oil prices climbed and positions in high quality/low cost operators reported good free cash flow and production growth.
| 6 | Multi-Manager Directional Alternative Strategies Fund | Annual Report 2018 |
Manager Discussion of Fund Performance (continued)
Conversely, our portion of the Fund’s short positions rose in price overall but lagged its long positions’ performance and thus detracted from results. The rise in price of lower quality, i.e. those companies with weak profitability and poor capital efficiency, and more expensive stocks was a headwind during the period. The short positions rose in price given that we generally short expensive stocks that tend to reside in growth sectors. More specifically, short positions in the information technology sector were the leading detractors during the period. Losses were primarily in smaller cap software and electronics businesses where we see value and earnings risks. A short position in the consumer services market segment also detracted, with soft goods retailers rising in price on improved sentiment.
The top individual contributors to our portion of the Fund’s absolute returns during the period were YY, DXC Technology and Harris. YY is a China-based live streaming platform that enables users to interact in live online group activities through voice, text and video. YY benefited during the period from investor recognition of the asset values of its less popular yet strong return website business models. In our view, YY’s valuation remained attractive at the end of the period and continued to deliver strong profitability. DXC Technology is a U.S.-based information technology services provider. Its merger with Hewlett Packard Enterprise’s services business was completed during the period, and expected synergy targets were cheered by investors. Harris, an international communications equipment company for the aerospace and defense industries, saw its shares rise during the period on news of a favorable contract with the Department of Defense’s radio modernization program.
The biggest individual detractors from our portion of the Fund’s absolute returns during the period were short positions in Cimpress, a Netherlands-based online supplier of graphic design and customized printed products, and Juno Therapeutics, a U.S. clinical-stage biotechnology company, as well as a long position in Liberty Global, a U.K. media communications company.
Purchases and sales drove portfolio changes
Analytic: During the period, our portion of the Fund increased its relative exposures to consumer discretionary, energy and industrials, while decreasing its relative weights to health care, materials and telecommunication services. Notable purchases made during the period include long positions in U.S.-based fast-food restaurant retailer McDonald’s, U.S. technology-based outsourcing solutions provider to the financial services industry Broadridge Financial Solutions and Spain-based toll road operator Abertis Infraestructuras. Notable sales made during the period in our portion of the Fund include long positions in real estate investment trust Annaly Capital Management, Canadian automotive systems and components manufacturer Magna International and U.S.-based non-durable consumer products company Clorox. From a country perspective, our portion of the Fund increased exposure to Spain and Singapore and decreased exposure to Canada and Australia during the annual period.
At the end of the period, our portion of the Fund was most overweight in information technology, consumer discretionary and industrials and most underweight in financials, telecommunication services and materials relative to the MSCI World Index. Our portion of the Fund was rather neutrally weighted to real estate, consumer staples and utilities compared to the MSCI World Index at the end of the period. Geographically, our portion of the Fund was most overweight relative to the MSCI World Index in the U.S., Japan and Singapore; was most underweight the U.K., France and Canada; and was rather neutrally allocated to Norway and Hong Kong at the end of the period.
AQR: Our strategy’s systematic investment process utilizes a model that ranks securities preferences along hundreds of factors on a daily basis. The securities most desired for inclusion in that model view are ones that display characteristics that rank well on the suite of factors as a whole, rather than upon a single metric, narrative or catalyst. The strategy rebalances periodically, attempting to stay close to the model while adhering to prospectus constraints and minimizing turnover, trading costs and other undesired effects.
The majority of themes in our investment model evaluate companies on an industry-neutral basis. Our model does not take industry or sector views by construction, and sector overweights and underweights are driven by our momentum signals. With that, during the period, our portion of the Fund’s exposure to consumer discretionary, consumer staples, information technology and materials increased and its exposures to financials, health care and utilities decreased. The strategy does not take active country allocation risk and no meaningful shifts in country weightings were made during the period relative to the benchmark.
Multi-Manager Directional Alternative Strategies Fund | Annual Report 2018
| 7 |
Manager Discussion of Fund Performance (continued)
At the end of the period, our portion of the Fund was most overweight financials, industrials and consumer discretionary relative to the MSCI World Index. Conversely, our portion of the Fund was most underweight the MSCI World Index in energy, consumer staples and telecommunication services. Since our portion of the Fund does not take active country allocation risk, country positioning at the end of the period was neutrally-weighted relative to the MSCI World Index.
Boston Partners: Within health care, we added health care services provider McKesson to our portion of the Fund during the period. In our view, McKesson’s business appears to be stabilizing, as comparisons ease in a slower drug price inflation environment and its re-contracting specialty business should offset general deflation. We sold our portion of the Fund’s position in technology giant Apple as its neared our target price and on iPhone sales weakness.
From a sector perspective, our portion of the Fund’s positioning increased in the information technology and financials sectors on the long side of the portfolio and in real estate investment trusts on the short side of the portfolio. Our portion of the Fund’s exposure to the information technology and financials sectors decreased on the short side of the portfolio.
At the end of the period, our portion of the Fund’s largest long exposures were in information technology and financials. Within information technology, there was a tilt toward large-cap companies successfully transitioning to cloud-subscription models and toward electronics distributors and semiconductor companies transitioning away from personal computer/consumer electronics toward autos, industrial and health care end-markets. Within financials, there was a tilt toward the largest U.S. banks and large-cap insurance companies exhibiting what we view as attractive valuations, strong balance sheets and accelerating capital return. Our portion of the Fund’s largest short exposures at the end of the period similarly included information technology and financials. Within information technology, we believed we were finding opportunities to take short positions in small-to-mid-cap software and equipment companies. Within financials, we found what we saw as opportunities in financial services companies, banks with Asian exposure, and regional banks trading at extreme valuations with declining returns on equity.
Derivative positions
Analytic: Our portion of the Fund did not invest in derivatives during the period.
AQR: Our portion of the Fund utilized equity swaps, equity index futures and currency forwards during the period. We used equity derivative instruments as a substitute for investing in conventional securities and for investment purposes to increase economic exposure to a particular security or index in a cost-effective manner. Typically, our portion of the Fund invests in common stocks and swaps on individual common stocks. Additionally, our portion of Fund uses both equity index futures and currency forwards to gain passive equity market exposure. Our portion of the Fund’s passive market exposure and tactical market exposure components are implemented entirely using derivatives. The global stock selection component is implemented using both physical equities and equity swaps. All three components contributed positively to our portion of the Fund’s results during the period.
Boston Partners: Our portion of the Fund utilized several total return swaps during the period, though they represented a rather small portion of the portfolio and thus had a minimal effect on performance. Derivatives were used to gain short exposure when 1) exchanges forbid cash short sales; 2) taxes or other market features made cash long purchases or sales expensive; and 3) additional return was sought when implied volatilities were sufficiently high and stocks held long were near their target price.
Market risk may affect a single issuer, sector of the economy, industry or the market as a whole. The Fund is managed by multiple advisers independently of one another, which may result in contradicting trades (i.e., with no net benefit to the Fund), while increasing transaction costs. As a non-diversified fund, fewer investments could have a greater effect on performance. Alternative investments cover a broad range of strategies and structures designed to be low or non-correlated to traditional equity and fixed-income markets with along-term expectation of illiquidity. Alternative investments involve substantial risks and are more volatile than traditional investments, making them more suitable for investors with an above-average tolerance for risk. Investing in derivatives is a specialized activity that involves special risks that subject the Fund to significant loss potential, including when used as leverage, and may result in greater fluctuation in fund value. Short positions (where the underlying asset is not owned) can create unlimited risk. The Fund’s use of leverage allows for investment exposure in excess of net assets, thereby magnifying volatility of returns and risk of loss. Foreign investments subject the Fund to risks, including political, economic, market, social and others within a particular country, as well as to currency instabilities and less stringent financial and accounting standards generally applicable to U.S. issuers. Risks are enhanced for emerging market issuers. A rise in interest rates may result in a price decline of fixed-income instruments held by the Fund, negatively impacting its performance and NAV. Falling rates may result in the Fund investing in lower
| 8 | Multi-Manager Directional Alternative Strategies Fund | Annual Report 2018 |
Manager Discussion of Fund Performance (continued)
yielding debt instruments, lowering the Fund’s income and yield. These risks may be heightened for longer maturity and duration securities. Fixed-income securities present issuer default risk. Non-investment-grade (high-yield or junk) securities present greater price volatility and more risk to principal and income than higher rated securities.See the Fund’s prospectus for more information on these and other risks.
The views expressed in this report reflect the current views of the respective parties. These views are not guarantees of future performance and involve certain risks, uncertainties and assumptions that are difficult to predict, so actual outcomes and results may differ significantly from the views expressed. These views are subject to change at any time based upon economic, market or other conditions and the respective parties disclaim any responsibility to update such views. These views may not be relied on as investment advice and, because investment decisions for a Columbia fund are based on numerous factors, may not be relied on as an indication of trading intent on behalf of any particular Columbia fund. References to specific securities should not be construed as a recommendation or investment advice.
Multi-Manager Directional Alternative Strategies Fund | Annual Report 2018
| 9 |
Understanding Your Fund’s Expenses
(Unaudited)
As an investor, you incur two types of costs. There are transaction costs, which may include redemption fees. There are also ongoing costs, which generally include management fees, distribution and/or service fees, and other fund expenses. The following information is intended to help you understand your ongoing costs (in dollars) of investing in the Fund and to help you compare these costs with the ongoing costs of investing in other mutual funds.
Analyzing your Fund’s expenses
To illustrate these ongoing costs, we have provided examples and calculated the expenses paid by investors in each share class of the Fund during the period. The actual and hypothetical information in the table is based on an initial investment of $1,000 at the beginning of the period indicated and held for the entire period. Expense information is calculated two ways and each method provides you with different information. The amount listed in the “Actual” column is calculated using the Fund’s actual operating expenses and total return for the period. You may use the Actual information, together with the amount invested, to estimate the expenses that you paid over the period. Simply divide your account value by $1,000 (for example, an $8,600 account value divided by $1,000 = 8.6), then multiply the results by the expenses paid during the period under the “Actual” column. The amount listed in the “Hypothetical” column assumes a 5% annual rate of return before expenses (which is not the Fund’s actual return) and then applies the Fund’s actual expense ratio for the period to the hypothetical return. You should not use the hypothetical account values and expenses to estimate either your actual account balance at the end of the period or the expenses you paid during the period. See “Compare with other funds” below for details on how to use the hypothetical data.
Compare with other funds
Since all mutual funds are required to include the same hypothetical calculations about expenses in shareholder reports, you can use this information to compare the ongoing cost of investing in the Fund with other funds. To do so, compare the hypothetical example with the 5% hypothetical examples that appear in the shareholder reports of other funds. As you compare hypothetical examples of other funds, it is important to note that hypothetical examples are meant to highlight the ongoing costs of investing in a fund only and do not reflect any transaction costs, such as redemption or exchange fees. Therefore, the hypothetical calculations are useful in comparing ongoing costs only, and will not help you determine the relative total costs of owning different funds. If transaction costs were included in these calculations, your costs would be higher.
| November 1, 2017 — April 30, 2018 |
| | Account value at the
beginning of the
period ($) | Account value at the
end of the
period ($) | Expenses paid during
the period ($) | Fund’s annualized
expense ratio (%) |
| | Actual | Hypothetical | Actual | Hypothetical | Actual | Hypothetical | Actual |
| Class A | 1,000.00 | 1,000.00 | 1,008.20 | 1,012.74 | 12.10 | 12.13 | 2.43 |
| Institutional Class | 1,000.00 | 1,000.00 | 1,008.30 | 1,013.84 | 11.00 | 11.03 | 2.21 |
Expenses paid during the period are equal to the annualized expense ratio for each class as indicated above, multiplied by the average account value over the period and then multiplied by the number of days in the Fund’s most recent fiscal half year and divided by 365.
Expenses do not include fees and expenses incurred indirectly by the Fund from its investment in underlying funds, including affiliated and non-affiliated pooled investment vehicles, such as mutual funds and exchange-traded funds.
The Fund is offered only through certain wrap fee programs sponsored and/or managed by Ameriprise Financial, Inc. or its affiliates. Participants in wrap fee programs pay other fees that are not included in the above table. Please refer to the wrap program documents for information about the fees charged.
| 10 | Multi-Manager Directional Alternative Strategies Fund | Annual Report 2018 |
Portfolio of Investments
April 30, 2018
(Percentages represent value of investments compared to net assets)
Investments in securities
| Common Stocks 72.8% |
| Issuer | Shares | Value ($) |
| Consumer Discretionary 9.2% |
| Auto Components 0.4% |
| BorgWarner, Inc. | 12,526 | 613,022 |
| Lear Corp. | 1,074 | 200,806 |
| Linamar Corp | 7,564 | 423,872 |
| Total | | 1,237,700 |
| Automobiles 0.2% |
| Fiat Chrysler Automobiles NV | 8,908 | 197,925 |
| Fiat Chrysler Automobiles NV | 14,752 | 322,036 |
| Total | | 519,961 |
| Hotels, Restaurants & Leisure 2.4% |
| Aristocrat Leisure Ltd. | 12,668 | 254,127 |
| Autogrill SpA | 22,035 | 280,829 |
| Crown Resorts Ltd. | 58,108 | 563,992 |
| Darden Restaurants, Inc.(a) | 18,247 | 1,694,416 |
| Flight Centre Travel Group Ltd. | 4,039 | 169,200 |
| Genting Singapore PLC | 1,037,700 | 909,146 |
| McDonald’s Corp.(a) | 14,172 | 2,372,960 |
| Six Flags Entertainment Corp. | 5,443 | 344,215 |
| Unibet Group PLC | 17,844 | 230,127 |
| Wyndham Worldwide Corp. | 2,742 | 313,164 |
| Total | | 7,132,176 |
| Household Durables 1.3% |
| NVR, Inc.(a),(b) | 455 | 1,410,500 |
| Persimmon PLC | 34,024 | 1,270,981 |
| PulteGroup, Inc. | 6,987 | 212,125 |
| Sony Corp. | 4,800 | 224,189 |
| Toll Brothers, Inc.(a) | 14,619 | 616,337 |
| Total | | 3,734,132 |
| Internet & Direct Marketing Retail 0.9% |
| Booking Holdings, Inc.(a),(b) | 87 | 189,486 |
| Qurate Retail Group, Inc. QVC Group(b) | 27,423 | 641,973 |
| Rakuten, Inc. | 31,800 | 225,989 |
| Start Today Co., Ltd. | 49,000 | 1,414,823 |
| Total | | 2,472,271 |
| Common Stocks (continued) |
| Issuer | Shares | Value ($) |
| Leisure Products 0.1% |
| BRP, Inc. | 1,797 | 72,695 |
| Hasbro, Inc. | 3,924 | 345,665 |
| Total | | 418,360 |
| Media 1.3% |
| 21st Century Fox, Inc., Class A | 13,865 | 506,904 |
| Comcast Corp., Class A(a) | 29,320 | 920,355 |
| Interpublic Group of Companies, Inc. (The) | 13,184 | 311,011 |
| Liberty Global PLC, Class C(a),(b) | 31,153 | 906,552 |
| Liberty Latin America Ltd., Class C(b) | 9,072 | 163,840 |
| Omnicom Group, Inc. | 3,736 | 275,194 |
| Time Warner, Inc. | 6,518 | 617,906 |
| Total | | 3,701,762 |
| Multiline Retail 0.4% |
| Canadian Tire Corp., Ltd., Class A | 1,265 | 172,397 |
| Dollar General Corp.(a) | 4,050 | 390,947 |
| Dollarama, Inc. | 5,398 | 621,383 |
| Total | | 1,184,727 |
| Specialty Retail 0.7% |
| Best Buy Co., Inc.(a) | 985 | 75,382 |
| Gap, Inc. (The)(a) | 42,929 | 1,255,244 |
| TJX Companies, Inc. (The) | 7,285 | 618,132 |
| Total | | 1,948,758 |
| Textiles, Apparel & Luxury Goods 1.5% |
| lululemon athletica, Inc.(a),(b) | 3,757 | 374,949 |
| Michael Kors Holdings Ltd.(a),(b) | 19,891 | 1,360,942 |
| Moncler SpA | 4,966 | 223,827 |
| Swatch Group AG (The), Registered Shares | 6,859 | 611,162 |
| VF Corp.(a) | 22,814 | 1,844,968 |
| Total | | 4,415,848 |
| Total Consumer Discretionary | 26,765,695 |
The accompanying Notes to Financial Statements are an integral part of this statement.
Multi-Manager Directional Alternative Strategies Fund | Annual Report 2018
| 11 |
Portfolio of Investments (continued)
April 30, 2018
| Common Stocks (continued) |
| Issuer | Shares | Value ($) |
| Consumer Staples 4.7% |
| Beverages 1.5% |
| Asahi Group Holdings Ltd. | 10,000 | 505,858 |
| Coca-Cola European Partners PLC | 15,971 | 626,063 |
| Heineken Holding NV | 9,489 | 963,233 |
| Kirin Holdings Co., Ltd. | 17,600 | 494,015 |
| Monster Beverage Corp.(a),(b) | 23,168 | 1,274,240 |
| PepsiCo, Inc.(a) | 5,486 | 553,757 |
| Total | | 4,417,166 |
| Food & Staples Retailing 1.2% |
| CVS Health Corp. | 9,071 | 633,428 |
| Empire Co., Ltd., Class A | 84,800 | 1,639,927 |
| Koninklijke Ahold Delhaize NV | 13,857 | 334,293 |
| Tesco PLC | 107,191 | 347,185 |
| Wm Morrison Supermarkets PLC | 115,953 | 386,722 |
| Total | | 3,341,555 |
| Food Products 0.8% |
| Chocoladefabriken Lindt & Spruengli AG | 108 | 694,229 |
| Leroy Seafood Group ASA | 53,180 | 390,092 |
| Nomad Foods Ltd.(b) | 44,106 | 727,308 |
| SalMar ASA | 8,420 | 392,384 |
| Suedzucker AG | 9,251 | 153,757 |
| Total | | 2,357,770 |
| Personal Products 0.7% |
| Estee Lauder Companies, Inc. (The), Class A(a) | 14,088 | 2,086,292 |
| Tobacco 0.5% |
| Altria Group, Inc. | 10,686 | 599,591 |
| Imperial Brands PLC | 13,047 | 466,817 |
| Philip Morris International, Inc. | 4,791 | 392,862 |
| Total | | 1,459,270 |
| Total Consumer Staples | 13,662,053 |
| Energy 6.1% |
| Energy Equipment & Services 0.3% |
| Cactus, Inc., Class A(b) | 17,648 | 506,674 |
| Saipem SpA(b) | 3,752 | 14,330 |
| Superior Energy Services, Inc.(b) | 43,198 | 463,514 |
| Total | | 984,518 |
| Common Stocks (continued) |
| Issuer | Shares | Value ($) |
| Oil, Gas & Consumable Fuels 5.8% |
| Anadarko Petroleum Corp. | 13,364 | 899,664 |
| Andeavor | 5,356 | 740,842 |
| Caltex Australia Ltd. | 1,641 | 38,161 |
| Chevron Corp. | 4,878 | 610,287 |
| Cimarex Energy Co. | 4,589 | 461,608 |
| ConocoPhillips | 13,155 | 861,652 |
| Diamondback Energy, Inc.(b) | 4,055 | 520,865 |
| Energen Corp.(b) | 4,265 | 279,102 |
| Enerplus Corp. | 46,768 | 542,734 |
| EQT Corp. | 12,653 | 635,054 |
| HollyFrontier Corp.(a) | 9,356 | 567,816 |
| Hurricane Energy PLC(b) | 759,364 | 448,065 |
| Jagged Peak Energy, Inc.(b) | 23,070 | 330,593 |
| JXTG Holdings, Inc. | 204,200 | 1,331,132 |
| Marathon Oil Corp. | 22,038 | 402,194 |
| Marathon Petroleum Corp. | 1,898 | 142,179 |
| Neste OYJ | 13,406 | 1,128,873 |
| Parsley Energy, Inc., Class A(b) | 19,498 | 585,525 |
| Peabody Energy Corp. | 8,734 | 321,848 |
| Phillips 66(a) | 16,205 | 1,803,779 |
| Pioneer Natural Resources Co. | 4,793 | 966,029 |
| Showa Shell Sekiyu KK | 36,100 | 509,753 |
| Targa Resources Corp. | 7,245 | 340,298 |
| Valero Energy Corp.(a) | 21,339 | 2,367,135 |
| Total | | 16,835,188 |
| Total Energy | 17,819,706 |
| Financials 9.5% |
| Banks 3.8% |
| Bank of America Corp.(a) | 49,250 | 1,473,560 |
| BB&T Corp. | 5,202 | 274,666 |
| Citigroup, Inc.(a) | 19,482 | 1,330,036 |
| Citizens Financial Group, Inc. | 13,613 | 564,803 |
| DNB ASA | 20,535 | 384,032 |
| East West Bancorp, Inc. | 6,924 | 461,277 |
| Fifth Third Bancorp | 13,581 | 450,482 |
| Huntington Bancshares, Inc. | 42,417 | 632,438 |
| Intesa Sanpaolo SpA(b) | 186,633 | 738,947 |
| JPMorgan Chase & Co.(a) | 12,721 | 1,383,790 |
The accompanying Notes to Financial Statements are an integral part of this statement.
| 12 | Multi-Manager Directional Alternative Strategies Fund | Annual Report 2018 |
Portfolio of Investments (continued)
April 30, 2018
| Common Stocks (continued) |
| Issuer | Shares | Value ($) |
| KeyCorp | 30,590 | 609,353 |
| Lloyds Banking Group PLC | 398,456 | 353,409 |
| Regions Financial Corp. | 33,941 | 634,697 |
| Sumitomo Mitsui Financial Group, Inc. | 5,200 | 216,727 |
| SunTrust Banks, Inc. | 5,384 | 359,651 |
| U.S. Bancorp | 2,858 | 144,186 |
| United Overseas Bank Ltd. | 12,100 | 273,995 |
| Wells Fargo & Co.(a) | 18,195 | 945,412 |
| Total | | 11,231,461 |
| Capital Markets 1.3% |
| Charles Schwab Corp. (The) | 8,697 | 484,249 |
| CI Financial Corp. | 27,400 | 576,617 |
| Goldman Sachs Group, Inc. (The) | 1,581 | 376,800 |
| Moody’s Corp. | 1,906 | 309,153 |
| Morgan Stanley | 6,144 | 317,153 |
| Raymond James Financial, Inc. | 6,186 | 555,194 |
| S&P Global, Inc. | 2,300 | 433,780 |
| State Street Corp. | 4,058 | 404,907 |
| TD Ameritrade Holding Corp. | 8,130 | 472,272 |
| Total | | 3,930,125 |
| Consumer Finance 1.0% |
| American Express Co. | 2,584 | 255,170 |
| Capital One Financial Corp. | 2,622 | 237,606 |
| Discover Financial Services | 11,955 | 851,794 |
| Navient Corp. | 21,101 | 279,799 |
| SLM Corp.(b) | 52,287 | 600,255 |
| Synchrony Financial | 16,785 | 556,758 |
| Total | | 2,781,382 |
| Diversified Financial Services 0.2% |
| Berkshire Hathaway, Inc., Class B(b) | 3,319 | 642,990 |
| First Pacific Co., Ltd. | 132,000 | 67,593 |
| Total | | 710,583 |
| Insurance 2.4% |
| Alleghany Corp. | 732 | 420,658 |
| Allstate Corp. (The) | 5,849 | 572,149 |
| American International Group, Inc. | 9,035 | 505,960 |
| Aon PLC | 3,067 | 436,955 |
| ASR Nederland NV | 19,026 | 897,338 |
| Common Stocks (continued) |
| Issuer | Shares | Value ($) |
| Aviva PLC | 80,147 | 582,322 |
| Chubb Ltd. | 4,484 | 608,344 |
| Everest Re Group Ltd. | 1,296 | 301,540 |
| Marsh & McLennan Companies, Inc. | 5,501 | 448,332 |
| Power Corp. of Canada | 19,500 | 463,371 |
| Sompo Holdings, Inc. | 9,700 | 406,140 |
| Swiss Re AG | 3,897 | 371,265 |
| Talanx AG | 3,069 | 138,274 |
| Travelers Companies, Inc. (The) | 2,633 | 346,503 |
| Xl Group Ltd. | 6,743 | 374,843 |
| Total | | 6,873,994 |
| Mortgage Real Estate Investment Trusts (REITS) 0.8% |
| AGNC Investment Corp.(a) | 116,349 | 2,201,323 |
| Total Financials | 27,728,868 |
| Health Care 7.3% |
| Biotechnology 0.5% |
| Celgene Corp.(a),(b) | 9,347 | 814,124 |
| Gilead Sciences, Inc. | 3,623 | 261,689 |
| United Therapeutics Corp.(a),(b) | 2,728 | 300,380 |
| Total | | 1,376,193 |
| Health Care Equipment & Supplies 1.8% |
| Align Technology, Inc.(a),(b) | 4,441 | 1,109,584 |
| Cooper Companies, Inc. (The)(a) | 5,628 | 1,287,180 |
| DiaSorin SpA | 2,926 | 275,704 |
| GN Store Nord | 14,671 | 515,451 |
| Hoya Corp. | 3,100 | 165,617 |
| Medtronic PLC | 5,179 | 414,993 |
| Varian Medical Systems, Inc.(a),(b) | 12,535 | 1,448,921 |
| Total | | 5,217,450 |
| Health Care Providers & Services 3.1% |
| Anthem, Inc.(a) | 8,302 | 1,959,189 |
| Cardinal Health, Inc. | 7,893 | 506,494 |
| CIGNA Corp. | 2,252 | 386,938 |
| Express Scripts Holding Co.(a),(b) | 28,731 | 2,174,937 |
| Fresenius SE & Co. KGaA | 3,593 | 273,622 |
| Humana, Inc.(a) | 5,728 | 1,685,063 |
| Laboratory Corp. of America Holdings(b) | 3,476 | 593,527 |
| McKesson Corp.(a) | 4,475 | 699,040 |
The accompanying Notes to Financial Statements are an integral part of this statement.
Multi-Manager Directional Alternative Strategies Fund | Annual Report 2018
| 13 |
Portfolio of Investments (continued)
April 30, 2018
| Common Stocks (continued) |
| Issuer | Shares | Value ($) |
| UnitedHealth Group, Inc. | 2,172 | 513,461 |
| Universal Health Services, Inc., Class B | 3,231 | 368,980 |
| Total | | 9,161,251 |
| Life Sciences Tools & Services 0.2% |
| ICON PLC(b) | 1,989 | 233,966 |
| Waters Corp.(b) | 1,999 | 376,632 |
| Total | | 610,598 |
| Pharmaceuticals 1.7% |
| H Lundbeck A/S | 3,477 | 201,428 |
| Jazz Pharmaceuticals PLC(b) | 2,253 | 342,546 |
| Johnson & Johnson(a) | 14,818 | 1,874,329 |
| Merck & Co., Inc.(a) | 16,554 | 974,534 |
| Novartis AG, ADR | 8,313 | 637,524 |
| Pfizer, Inc. | 17,377 | 636,172 |
| Roche Holding AG, Genusschein Shares | 1,154 | 256,404 |
| Total | | 4,922,937 |
| Total Health Care | 21,288,429 |
| Industrials 13.4% |
| Aerospace & Defense 3.7% |
| Arconic, Inc. | 4,857 | 86,503 |
| BAE Systems PLC | 33,690 | 282,667 |
| Boeing Co. (The)(a) | 749 | 249,836 |
| General Dynamics Corp.(a) | 4,659 | 937,903 |
| Harris Corp.(a) | 5,770 | 902,543 |
| Huntington Ingalls Industries, Inc.(a) | 2,639 | 641,831 |
| L3 Technologies, Inc. | 2,051 | 401,750 |
| Lockheed Martin Corp.(a) | 7,174 | 2,301,706 |
| Northrop Grumman Corp. | 2,212 | 712,353 |
| Raytheon Co.(a) | 5,611 | 1,149,918 |
| Spirit AeroSystems Holdings, Inc., Class A(a) | 14,429 | 1,159,659 |
| Textron, Inc.(a) | 18,550 | 1,152,697 |
| United Technologies Corp. | 5,791 | 695,789 |
| Total | | 10,675,155 |
| Air Freight & Logistics 0.7% |
| bpost SA | 13,857 | 304,051 |
| Expeditors International of Washington, Inc.(a) | 27,866 | 1,779,523 |
| Total | | 2,083,574 |
| Common Stocks (continued) |
| Issuer | Shares | Value ($) |
| Airlines 1.7% |
| Air Canada(b) | 98,601 | 1,938,307 |
| Delta Air Lines, Inc. | 6,364 | 332,328 |
| Deutsche Lufthansa AG, Registered Shares | 76,025 | 2,209,684 |
| Qantas Airways Ltd. | 11,953 | 51,694 |
| Southwest Airlines Co. | 4,168 | 220,196 |
| United Continental Holdings, Inc.(b) | 2,358 | 159,259 |
| Total | | 4,911,468 |
| Building Products 0.3% |
| Masco Corp. | 15,409 | 583,539 |
| Owens Corning | 3,020 | 197,780 |
| Total | | 781,319 |
| Construction & Engineering 0.2% |
| Taisei Corp. | 7,300 | 393,805 |
| Tutor Perini Corp.(b) | 11,901 | 245,756 |
| Total | | 639,561 |
| Electrical Equipment 1.0% |
| ABB Ltd., ADR | 16,452 | 382,838 |
| AMETEK, Inc. | 9,488 | 662,263 |
| Eaton Corp. PLC | 6,543 | 490,921 |
| EnerSys | 3,102 | 212,673 |
| GrafTech International Ltd.(b) | 36,302 | 580,106 |
| Philips Lighting NV | 19,635 | 597,137 |
| Total | | 2,925,938 |
| Industrial Conglomerates 0.4% |
| Honeywell International, Inc. | 4,728 | 684,047 |
| Rheinmetall AG | 4,514 | 589,895 |
| Total | | 1,273,942 |
| Machinery 1.5% |
| Cummins, Inc.(a) | 12,227 | 1,954,608 |
| Daifuku Co., Ltd. | 2,000 | 106,916 |
| Dover Corp. | 2,491 | 230,916 |
| Georg Fischer AG, Registered Shares | 72 | 89,500 |
| PACCAR, Inc. | 4,764 | 303,324 |
| Parker-Hannifin Corp. | 2,508 | 412,867 |
| Sumitomo Heavy Industries Ltd. | 11,000 | 420,313 |
The accompanying Notes to Financial Statements are an integral part of this statement.
| 14 | Multi-Manager Directional Alternative Strategies Fund | Annual Report 2018 |
Portfolio of Investments (continued)
April 30, 2018
| Common Stocks (continued) |
| Issuer | Shares | Value ($) |
| Weichai Power Co., Ltd., Class H | 260,000 | 300,988 |
| Yangzijiang Shipbuilding Holdings Ltd. | 754,000 | 658,426 |
| Total | | 4,477,858 |
| Professional Services 1.8% |
| Adecco Group AG, Registered Shares | 11,322 | 749,802 |
| Dun & Bradstreet Corp. (The) | 4,843 | 558,446 |
| Hays PLC | 169,133 | 416,798 |
| ManpowerGroup, Inc.(a) | 13,667 | 1,308,205 |
| Robert Half International, Inc.(a) | 28,912 | 1,756,404 |
| Teleperformance SA | 2,066 | 332,011 |
| Total | | 5,121,666 |
| Road & Rail 1.0% |
| DSV A/S | 24,808 | 1,964,689 |
| Nippon Express Co., Ltd. | 6,900 | 521,296 |
| Union Pacific Corp. | 2,172 | 290,245 |
| Total | | 2,776,230 |
| Trading Companies & Distributors 0.1% |
| Air Lease Corp. | 4,036 | 168,261 |
| Bunzl PLC | 5,187 | 150,405 |
| Total | | 318,666 |
| Transportation Infrastructure 1.0% |
| Abertis Infraestructuras SA | 117,326 | 2,586,674 |
| Atlantia SpA | 2,534 | 83,875 |
| Flughafen Zurich AG, Registered Shares | 81 | 16,915 |
| Fraport AG Frankfurt Airport Services Worldwide | 143 | 13,839 |
| Kamigumi Co., Ltd. | 12,700 | 285,897 |
| Total | | 2,987,200 |
| Total Industrials | 38,972,577 |
| Information Technology 16.6% |
| Communications Equipment 1.1% |
| Arista Networks, Inc.(a),(b) | 1,551 | 410,317 |
| Cisco Systems, Inc. | 21,868 | 968,534 |
| CommScope Holding Co., Inc.(b) | 7,555 | 288,752 |
| F5 Networks, Inc.(a),(b) | 8,981 | 1,464,711 |
| Total | | 3,132,314 |
| Common Stocks (continued) |
| Issuer | Shares | Value ($) |
| Electronic Equipment, Instruments & Components 1.6% |
| Arrow Electronics, Inc.(b) | 11,484 | 858,314 |
| Avnet, Inc. | 10,714 | 420,310 |
| Belden, Inc. | 6,686 | 411,858 |
| CDW Corp. | 4,451 | 317,312 |
| Flex Ltd.(a),(b) | 50,447 | 655,811 |
| IPG Photonics Corp.(a),(b) | 4,064 | 865,754 |
| Jabil, Inc. | 5,829 | 155,052 |
| TE Connectivity Ltd.(a) | 10,307 | 945,667 |
| Total | | 4,630,078 |
| Internet Software & Services 3.1% |
| Alibaba Group Holding Ltd., ADR(a),(b) | 5,376 | 959,831 |
| Alphabet, Inc., Class A(a),(b) | 2,191 | 2,231,709 |
| Alphabet, Inc., Class C(b) | 560 | 569,705 |
| Baidu, Inc., ADR(b) | 2,853 | 715,818 |
| eBay, Inc.(a),(b) | 33,673 | 1,275,533 |
| Facebook, Inc., Class A(a),(b) | 2,918 | 501,896 |
| Mixi, Inc. | 24,100 | 792,091 |
| NetEase, Inc., ADR | 2,020 | 519,281 |
| VeriSign, Inc.(a),(b) | 12,252 | 1,438,630 |
| Total | | 9,004,494 |
| IT Services 4.2% |
| Accenture PLC, Class A(a) | 9,822 | 1,485,086 |
| Alliance Data Systems Corp. | 1,340 | 272,087 |
| Amdocs Ltd. | 11,399 | 766,583 |
| AtoS | 2,685 | 362,475 |
| Broadridge Financial Solutions, Inc.(a) | 20,479 | 2,195,554 |
| Capgemini SE | 6,561 | 902,570 |
| CGI Group, Inc., Class A(b) | 13,800 | 799,657 |
| Cognizant Technology Solutions Corp., Class A(a) | 10,964 | 897,074 |
| DXC Technology Co.(a) | 12,440 | 1,282,066 |
| Equiniti Group PLC(c) | 29,647 | 111,830 |
| Leidos Holdings, Inc. | 13,434 | 862,866 |
| Otsuka Corp. | 3,400 | 157,547 |
| Total System Services, Inc.(a) | 18,425 | 1,548,806 |
| Western Union Co. (The) | 30,125 | 594,969 |
| Total | | 12,239,170 |
The accompanying Notes to Financial Statements are an integral part of this statement.
Multi-Manager Directional Alternative Strategies Fund | Annual Report 2018
| 15 |
Portfolio of Investments (continued)
April 30, 2018
| Common Stocks (continued) |
| Issuer | Shares | Value ($) |
| Semiconductors & Semiconductor Equipment 2.6% |
| ASM International NV | 4,290 | 257,570 |
| Broadcom, Inc.(a) | 5,271 | 1,209,273 |
| Disco Corp. | 900 | 157,750 |
| KLA-Tencor Corp. | 7,125 | 724,898 |
| Lam Research Corp.(a) | 231 | 42,749 |
| Marvell Technology Group Ltd. | 42,002 | 842,560 |
| Micron Technology, Inc.(a),(b) | 21,067 | 968,661 |
| ON Semiconductor Corp.(b) | 23,802 | 525,548 |
| Qorvo, Inc.(b) | 2,206 | 148,684 |
| Rohm Co., Ltd. | 1,900 | 176,060 |
| Skyworks Solutions, Inc.(a) | 9,136 | 792,639 |
| STMicroelectronics NV | 11,225 | 245,032 |
| Tokyo Electron Ltd. | 6,400 | 1,229,140 |
| Versum Materials, Inc. | 11,591 | 407,771 |
| Total | | 7,728,335 |
| Software 2.6% |
| Blackberry Ltd.(b) | 3,600 | 37,684 |
| CA, Inc.(a) | 25,408 | 884,198 |
| Cadence Design Systems, Inc.(a),(b) | 10,442 | 418,306 |
| Constellation Software, Inc. | 200 | 142,939 |
| Fortinet, Inc.(a),(b) | 26,730 | 1,479,773 |
| Micro Focus International PLC, ADR(a) | 8,322 | 144,137 |
| Microsoft Corp.(a) | 17,988 | 1,682,238 |
| Oracle Corp.(a) | 22,157 | 1,011,910 |
| Oracle Corp. Japan | 3,900 | 320,376 |
| Software AG | 8,195 | 402,854 |
| Take-Two Interactive Software, Inc.(a),(b) | 395 | 39,385 |
| Temenos Group AG | 7,846 | 987,246 |
| Total | | 7,551,046 |
| Technology Hardware, Storage & Peripherals 1.4% |
| Brother Industries Ltd. | 23,600 | 506,210 |
| Canon, Inc. | 10,100 | 347,432 |
| Hewlett Packard Enterprise Co. | 42,703 | 728,086 |
| HP, Inc. | 27,605 | 593,231 |
| Common Stocks (continued) |
| Issuer | Shares | Value ($) |
| NetApp, Inc.(a) | 17,665 | 1,176,136 |
| Xerox Corp. | 21,980 | 691,271 |
| Total | | 4,042,366 |
| Total Information Technology | 48,327,803 |
| Materials 3.5% |
| Chemicals 1.5% |
| Celanese Corp., Class A | 3,100 | 336,877 |
| Covestro AG | 13,335 | 1,211,683 |
| DowDuPont, Inc. | 4,780 | 302,287 |
| FMC Corp. | 4,749 | 378,638 |
| Methanex Corp. | 8,644 | 521,017 |
| Mitsubishi Gas Chemical Co., Inc. | 10,100 | 236,698 |
| Nutrien Ltd. | 11,843 | 539,212 |
| PQ Group Holdings, Inc.(b) | 16,667 | 231,671 |
| Tosoh Corp. | 7,300 | 129,125 |
| Trinseo SA | 7,695 | 561,350 |
| Total | | 4,448,558 |
| Construction Materials 0.3% |
| Cemex SAB de CV, ADR(b) | 66,860 | 415,201 |
| CRH PLC | 12,213 | 433,452 |
| Total | | 848,653 |
| Containers & Packaging 0.6% |
| Berry Global Group, Inc.(b) | 7,101 | 390,555 |
| Graphic Packaging Holding Co. | 58,663 | 838,881 |
| WestRock Co. | 9,312 | 550,898 |
| Total | | 1,780,334 |
| Metals & Mining 0.8% |
| Barrick Gold Corp. | 1,729 | 23,270 |
| Boliden AB | 26,774 | 927,709 |
| Ivanhoe Mines Ltd., Class A(b) | 70,549 | 145,609 |
| Kinross Gold Corp.(b) | 3,545 | 13,722 |
| Lundin Mining Corp. | 22,414 | 148,385 |
| Rio Tinto PLC, ADR | 2,853 | 156,772 |
| Salzgitter AG | 1,467 | 80,561 |
| SSAB AB, Class A | 5,573 | 31,510 |
| Steel Dynamics, Inc. | 6,518 | 292,072 |
| Stornoway Diamond Corp.(b) | 488,029 | 220,458 |
The accompanying Notes to Financial Statements are an integral part of this statement.
| 16 | Multi-Manager Directional Alternative Strategies Fund | Annual Report 2018 |
Portfolio of Investments (continued)
April 30, 2018
| Common Stocks (continued) |
| Issuer | Shares | Value ($) |
| Teck Resources Ltd., Class B | 3,311 | 83,113 |
| Warrior Met Coal, Inc. | 10,922 | 253,937 |
| Total | | 2,377,118 |
| Paper & Forest Products 0.3% |
| Holmen AB, Class B | 4,396 | 108,393 |
| West Fraser Timber Co., Ltd. | 9,645 | 653,316 |
| Total | | 761,709 |
| Total Materials | 10,216,372 |
| Real Estate 0.7% |
| Equity Real Estate Investment Trusts (REITS) 0.5% |
| CapitaLand Mall Trust | 409,400 | 646,511 |
| H&R Real Estate Investment Trust | 21,600 | 346,892 |
| Smart Real Estate Investment Trust | 16,900 | 379,081 |
| Total | | 1,372,484 |
| Real Estate Management & Development 0.2% |
| Kerry Properties Ltd. | 153,500 | 733,810 |
| Total Real Estate | 2,106,294 |
| Telecommunication Services 0.4% |
| Diversified Telecommunication Services 0.2% |
| Verizon Communications, Inc. | 11,638 | 574,335 |
| Wireless Telecommunication Services 0.2% |
| Vodafone Group PLC | 170,679 | 498,078 |
| Total Telecommunication Services | 1,072,413 |
| Utilities 1.4% |
| Electric Utilities 1.1% |
| American Electric Power Co., Inc.(a) | 36,385 | 2,546,222 |
| Entergy Corp.(a) | 2,508 | 204,628 |
| Exelon Corp.(a) | 11,208 | 444,734 |
| Total | | 3,195,584 |
| Multi-Utilities 0.3% |
| A2A SpA | 429,276 | 863,165 |
| Atco Ltd., Class I | 5,052 | 152,864 |
| Total | | 1,016,029 |
| Total Utilities | 4,211,613 |
Total Common Stocks
(Cost $183,304,124) | 212,171,823 |
|
| Limited Partnerships 0.1% |
| Issuer | Shares | Value ($) |
| Energy 0.1% |
| Oil, Gas & Consumable Fuels 0.1% |
| Viper Energy Partners LP | 11,412 | 328,666 |
| Total Energy | 328,666 |
Total Limited Partnerships
(Cost $171,343) | 328,666 |
| Preferred Stocks 0.3% |
| Issuer | | Shares | Value ($) |
| Consumer Discretionary 0.3% |
| Automobiles 0.3% |
| BMW AG | | 8,853 | 854,744 |
| Total Consumer Discretionary | 854,744 |
Total Preferred Stocks
(Cost $765,678) | 854,744 |
| Money Market Funds 17.4% |
| | Shares | Value ($) |
| Columbia Short-Term Cash Fund, 1.889%(d),(e) | 50,848,193 | 50,843,108 |
Total Money Market Funds
(Cost $50,843,331) | 50,843,108 |
Total Investments
(Cost $235,084,476) | 264,198,341 |
|
| Investments in securities sold short |
| |
| Common Stocks (30.4)% |
| Issuer | Shares | Value ($) |
| Consumer Discretionary (4.2)% |
| Auto Components (0.1)% |
| Brembo SpA | (25,538) | (376,240) |
| Automobiles (0.5)% |
| Harley-Davidson, Inc. | (8,852) | (364,083) |
| Tesla, Inc.(b) | (3,229) | (949,003) |
| Thor Industries, Inc. | (1,789) | (189,884) |
| Total | | (1,502,970) |
| Diversified Consumer Services (0.2)% |
| Chegg, Inc.(b) | (23,106) | (536,290) |
| Hotels, Restaurants & Leisure (0.6)% |
| Chipotle Mexican Grill, Inc.(b) | (722) | (305,644) |
| Cracker Barrel Old Country Store, Inc. | (1,474) | (242,606) |
| Domino’s Pizza Enterprises Ltd. | (5,183) | (164,079) |
The accompanying Notes to Financial Statements are an integral part of this statement.
Multi-Manager Directional Alternative Strategies Fund | Annual Report 2018
| 17 |
Portfolio of Investments (continued)
April 30, 2018
| Common Stocks (continued) |
| Issuer | Shares | Value ($) |
| Norwegian Cruise Line Holdings Ltd.(b) | (4,853) | (259,490) |
| Papa John’s International, Inc. | (5,100) | (316,200) |
| Planet Fitness, Inc., Class A(b) | (5,894) | (237,469) |
| Restaurant Brands International, Inc. | (318) | (17,305) |
| Wendy’s Co. (The) | (14,198) | (237,675) |
| Total | | (1,780,468) |
| Internet & Direct Marketing Retail (0.4)% |
| Wayfair, Inc., Class A(b) | (4,323) | (269,323) |
| Zalando SE(b),(c) | (19,041) | (979,787) |
| Total | | (1,249,110) |
| Leisure Products (0.3)% |
| Amer Sports Oyj | (17,069) | (522,127) |
| Mattel, Inc. | (13,762) | (203,678) |
| Total | | (725,805) |
| Media (1.1)% |
| Altice NV, Class A(b) | (53,654) | (513,524) |
| Altice U.S.A., Inc., Class A(b) | (11,755) | (210,414) |
| Dentsu, Inc. | (4,900) | (232,126) |
| Discovery, Inc., Class C(b) | (18,556) | (412,314) |
| Eutelsat Communications SA | (8,214) | (177,891) |
| Meredith Corp. | (5,031) | (260,606) |
| Pearson PLC | (48,121) | (551,690) |
| Schibsted ASA, Class A | (12,606) | (367,559) |
| SES SA FDR | (16,991) | (262,152) |
| Telenet Group Holding NV(b) | (3,850) | (224,993) |
| Total | | (3,213,269) |
| Specialty Retail (0.6)% |
| CarMax, Inc.(b) | (3,530) | (220,625) |
| Fielmann AG | (1,714) | (140,752) |
| Floor & Decor Holdings, Inc., Class A(b) | (4,670) | (259,605) |
| Hennes & Mauritz AB, Class B | (2,083) | (35,795) |
| Inditex | (7,301) | (226,318) |
| Kingfisher PLC | (51,022) | (212,784) |
| L Brands, Inc. | (6,652) | (232,221) |
| Murphy U.S.A., Inc.(b) | (3,533) | (221,060) |
| Ulta Salon Cosmetics & Fragrance, Inc.(b) | (901) | (226,070) |
| Total | | (1,775,230) |
| Common Stocks (continued) |
| Issuer | Shares | Value ($) |
| Textiles, Apparel & Luxury Goods (0.4)% |
| Cie Financiere Richemont SA, Class A, Registered Shares | (2,441) | (232,038) |
| Gildan Activewear, Inc. | (8,738) | (254,538) |
| Pandora Media, Inc. | (241) | (26,772) |
| PRADA SpA | (52,400) | (265,873) |
| Under Armour, Inc., Class A(b) | (19,022) | (337,831) |
| Total | | (1,117,052) |
| Total Consumer Discretionary | (12,276,434) |
| Consumer Staples (0.9)% |
| Beverages (0.2)% |
| Anheuser-Busch InBev SA/NV | (592) | (58,806) |
| Treasury Wine Estates Ltd. | (18,766) | (268,053) |
| Tsingtao Brewery Co., Ltd., Class H | (28,000) | (144,967) |
| Total | | (471,826) |
| Food & Staples Retailing (0.1)% |
| Casey’s General Stores, Inc. | (3,319) | (320,615) |
| Metro, Inc. | (586) | (18,594) |
| Total | | (339,209) |
| Food Products (0.4)% |
| Aryzta AG(b) | (730) | (15,386) |
| B&G Foods, Inc. | (6,760) | (153,790) |
| Calbee, Inc. | (8,600) | (289,605) |
| Chocoladefabriken Lindt & Spruengli AG | (24) | (154,273) |
| Hain Celestial Group, Inc. (The)(b) | (3,426) | (99,799) |
| Hormel Foods Corp. | (7,591) | (275,174) |
| Marine Harvest ASA | (13,662) | (297,393) |
| Total | | (1,285,420) |
| Household Products (0.1)% |
| Kimberly-Clark de Mexico SAB de SV, Class A | (80,900) | (146,599) |
| Personal Products (0.1)% |
| Coty, Inc., Class A | (23,917) | (414,960) |
| Total Consumer Staples | (2,658,014) |
The accompanying Notes to Financial Statements are an integral part of this statement.
| 18 | Multi-Manager Directional Alternative Strategies Fund | Annual Report 2018 |
Portfolio of Investments (continued)
April 30, 2018
| Common Stocks (continued) |
| Issuer | Shares | Value ($) |
| Energy (5.8)% |
| Energy Equipment & Services (1.8)% |
| Core Laboratories NV | (1,908) | (233,635) |
| Helmerich & Payne | (6,841) | (475,792) |
| National Oilwell Varco, Inc. | (8,685) | (335,849) |
| SBM Offshore NV | (13,981) | (234,590) |
| Tenaris SA | (179,472) | (3,363,528) |
| Weatherford International PLC(b) | (155,995) | (460,185) |
| Total | | (5,103,579) |
| Oil, Gas & Consumable Fuels (4.0)% |
| AltaGas, Ltd. | (23,296) | (449,064) |
| Antero Resources Corp.(b) | (17,635) | (335,065) |
| Apache Corp. | (5,687) | (232,883) |
| Cameco Corp. | (54,819) | (577,244) |
| Cameco Corp. | (14,337) | (150,969) |
| Cenovus Energy, Inc. | (35,917) | (360,248) |
| Cenovus Energy, Inc. | (9,649) | (96,644) |
| Cheniere Energy, Inc.(b) | (25,831) | (1,502,331) |
| Continental Resources, Inc.(b) | (16,627) | (1,098,380) |
| Devon Energy Corporation | (14,449) | (524,932) |
| Enbridge, Inc. | (22,001) | (666,396) |
| Hess Corp. | (9,609) | (547,617) |
| Imperial Oil Ltd. | (17,025) | (529,466) |
| Inter Pipeline Ltd. | (2,738) | (49,367) |
| Keyera Corp. | (12,445) | (335,078) |
| Kinder Morgan Canada Ltd.(c) | (12,411) | (160,170) |
| Koninklijke Vopak NV | (10,183) | (502,176) |
| Murphy Oil Corp. | (16,657) | (501,542) |
| Noble Energy, Inc. | (39,780) | (1,345,757) |
| Pembina Pipeline Corp. | (2,344) | (74,649) |
| Peyto Exploration & Development Corp. | (19,107) | (180,661) |
| PrairieSky Royalty, Ltd. | (21,521) | (477,202) |
| Range Resources Corp. | (17,660) | (244,591) |
| Seven Generations Energy Ltd., Class A(b) | (1,552) | (22,145) |
| TransCanada Corp. | (11,209) | (475,266) |
| TransCanada Corp. | (8,309) | (352,717) |
| Total | | (11,792,560) |
| Total Energy | (16,896,139) |
| Common Stocks (continued) |
| Issuer | Shares | Value ($) |
| Financials (2.8)% |
| Banks (2.0)% |
| Aozora Bank Ltd. | (4,600) | (185,571) |
| Bankinter SA | (25,615) | (267,706) |
| CaixaBank SA | (36,412) | (177,067) |
| Canadian Western Bank | (9,614) | (255,110) |
| Commonwealth Bank of Australia | (3,602) | (193,948) |
| Community Bank System, Inc. | (5,935) | (333,844) |
| Cullen/Frost Bankers, Inc. | (2,062) | (235,996) |
| CVB Financial Corp. | (13,070) | (289,500) |
| First Financial Bankshares, Inc. | (13,453) | (666,596) |
| First Republic Bank | (2,138) | (198,556) |
| Glacier Bancorp, Inc. | (7,379) | (273,244) |
| Independent Bank Corp. | (2,857) | (206,561) |
| Investors Bancorp, Inc. | (14,924) | (199,534) |
| Metro Bank PLC(b) | (3,600) | (163,421) |
| People’s United Financial, Inc. | (9,544) | (174,560) |
| Prosperity Bancshares, Inc. | (4,065) | (291,745) |
| Standard Chartered PLC | (18,141) | (190,554) |
| Trustmark Corp. | (8,286) | (259,435) |
| UMB Financial Corp. | (3,151) | (241,304) |
| United Bankshares, Inc. | (6,002) | (203,768) |
| Valley National Bancorp | (14,901) | (187,007) |
| Westamerica Bancorporation | (8,437) | (470,869) |
| Total | | (5,665,896) |
| Capital Markets (0.4)% |
| Brookfield Asset Management, Inc., Class A | (1,044) | (41,380) |
| Credit Suisse Group AG, Registered Shares | (14,220) | (239,838) |
| Deutsche Bank AG | (27,664) | (378,204) |
| Factset Research Systems, Inc. | (1,394) | (263,619) |
| MarketAxess Holdings, Inc. | (1,140) | (226,438) |
| WisdomTree Investments, Inc. | (13,547) | (143,192) |
| Total | | (1,292,671) |
| Consumer Finance (0.0)% |
| Acom Co., Ltd. | (13,000) | (58,853) |
The accompanying Notes to Financial Statements are an integral part of this statement.
Multi-Manager Directional Alternative Strategies Fund | Annual Report 2018
| 19 |
Portfolio of Investments (continued)
April 30, 2018
| Common Stocks (continued) |
| Issuer | Shares | Value ($) |
| Diversified Financial Services (0.0)% |
| Element Fleet Management Corp. | (10,905) | (41,192) |
| Onex Corp. | (335) | (24,813) |
| Total | | (66,005) |
| Insurance (0.3)% |
| Cincinnati Financial Corp. | (2,305) | (162,134) |
| Markel Corp.(b) | (285) | (322,061) |
| RLI Corp. | (6,339) | (401,132) |
| Total | | (885,327) |
| Thrifts & Mortgage Finance (0.1)% |
| New York Community Bancorp, Inc. | (15,809) | (187,811) |
| Total Financials | (8,156,563) |
| Health Care (3.6)% |
| Biotechnology (1.7)% |
| Alnylam Pharmaceuticals, Inc.(b) | (5,786) | (546,951) |
| Biomarin Pharmaceutical, Inc.(b) | (18,124) | (1,513,535) |
| Genmab A/S(b) | (2,149) | (433,879) |
| Incyte Corp., Ltd.(b) | (10,723) | (664,183) |
| Seattle Genetics, Inc.(b) | (22,304) | (1,141,742) |
| TESARO, Inc.(b) | (12,751) | (649,153) |
| Total | | (4,949,443) |
| Health Care Equipment & Supplies (0.5)% |
| Coloplast A/S, Class B | (2,850) | (241,434) |
| Getinge AB | (2,258) | (21,038) |
| Insulet Corp.(b) | (2,590) | (222,740) |
| Nevro Corp.(b) | (2,426) | (216,787) |
| NuVasive, Inc.(b) | (1,756) | (93,437) |
| Penumbra, Inc.(b) | (1,927) | (239,622) |
| West Pharmaceutical Services | (2,180) | (192,298) |
| Wright Medical Group NV(b) | (9,460) | (185,511) |
| Total | | (1,412,867) |
| Health Care Technology (0.3)% |
| Cerner Corp.(b) | (3,144) | (183,138) |
| Medidata Solutions, Inc.(b) | (7,021) | (501,018) |
| Teladoc, Inc.(b) | (6,091) | (261,913) |
| Total | | (946,069) |
| Life Sciences Tools & Services (0.0)% |
| QIAGEN NV(b) | (1,231) | (40,268) |
| Common Stocks (continued) |
| Issuer | Shares | Value ($) |
| Pharmaceuticals (1.1)% |
| Allergan PLC | (5,792) | (889,941) |
| Ono Pharmaceutical Co., Ltd. | (12,000) | (277,383) |
| Orion Oyj, Class B | (787) | (23,870) |
| Recordati SpA | (763) | (27,217) |
| Taisho Pharmaceutical Holdings Co., Ltd. | (3,600) | (344,342) |
| Vifor Pharma AG | (10,431) | (1,646,129) |
| Total | | (3,208,882) |
| Total Health Care | (10,557,529) |
| Industrials (3.9)% |
| Aerospace & Defense (0.9)% |
| Airbus Group SE | (2,301) | (270,099) |
| Arconic, Inc. | (78,369) | (1,395,752) |
| Bombardier, Inc., Class B(b) | (46,567) | (143,986) |
| Leonardo SpA | (5,851) | (67,606) |
| MTU Aero Engines AG | (2,430) | (417,986) |
| Rolls-Royce Holdings PLC | (33,321) | (384,829) |
| Rolls-Royce Holdings PLC(b),(f),(g) | (2,365,791) | (3,257) |
| Total | | (2,683,515) |
| Air Freight & Logistics (0.1)% |
| Panalpina Welttransport Holding AG, Registered Shares | (2,402) | (304,020) |
| Commercial Services & Supplies (0.8)% |
| Bilfinger SE | (3,665) | (174,427) |
| Cimpress NV(b) | (918) | (132,017) |
| Edenred | (7,385) | (254,417) |
| Mobile Mini, Inc. | (3,248) | (136,416) |
| Multi-Color Corp. | (3,803) | (247,005) |
| Ritchie Bros. Auctioneers, Inc. | (12,621) | (413,085) |
| Ritchie Bros. Auctioneers, Inc. | (8,111) | (265,071) |
| Rollins, Inc. | (5,120) | (248,422) |
| Societe BIC SA | (2,434) | (248,224) |
| Stericycle, Inc.(b) | (2,238) | (131,393) |
| Total | | (2,250,477) |
| Construction & Engineering (0.0)% |
| Boskalis Westminster | (2,670) | (79,097) |
| SNC-Lavalin Group, Inc. | (702) | (30,776) |
| Total | | (109,873) |
The accompanying Notes to Financial Statements are an integral part of this statement.
| 20 | Multi-Manager Directional Alternative Strategies Fund | Annual Report 2018 |
Portfolio of Investments (continued)
April 30, 2018
| Common Stocks (continued) |
| Issuer | Shares | Value ($) |
| Electrical Equipment (0.1)% |
| Acuity Brands, Inc. | (2,184) | (261,578) |
| Industrial Conglomerates (0.6)% |
| General Electric Co. | (121,999) | (1,716,526) |
| Machinery (0.7)% |
| Flowserve Corp. | (10,681) | (474,343) |
| GEA Group AG | (11,451) | (447,083) |
| John Bean Technologies Corp. | (2,255) | (242,976) |
| Manitowoc Co., Inc. (The)(b) | (8,539) | (210,486) |
| Middleby Corp.(b) | (2,889) | (363,552) |
| Sun Hydraulics Corp. | (3,866) | (187,772) |
| Wabtec Corp. | (2,417) | (214,654) |
| Total | | (2,140,866) |
| Marine (0.2)% |
| AP Moller - Maersk A/S, Class B | (352) | (563,903) |
| Professional Services (0.4)% |
| Costar Group, Inc.(b) | (1,499) | (549,623) |
| Stantec, Inc. | (8,359) | (212,694) |
| Verisk Analytics, Inc.(b) | (2,426) | (258,248) |
| Total | | (1,020,565) |
| Road & Rail (0.1)% |
| Heartland Express, Inc. | (9,370) | (167,067) |
| Total Industrials | (11,218,390) |
| Information Technology (3.2)% |
| Communications Equipment (0.5)% |
| Telefonaktiebolaget LM Ericsson | (176,257) | (1,343,690) |
| Viasat, Inc.(b) | (2,595) | (166,028) |
| Total | | (1,509,718) |
| Electronic Equipment, Instruments & Components (0.2)% |
| Knowles Corp.(b) | (23,518) | (301,031) |
| National Instruments Corp. | (7,642) | (312,481) |
| Total | | (613,512) |
| Common Stocks (continued) |
| Issuer | Shares | Value ($) |
| Internet Software & Services (0.5)% |
| 2U, Inc.(b) | (4,330) | (348,522) |
| 58.Com, Inc., ADR(b) | (2,896) | (253,081) |
| Just Eat PLC(b) | (29,678) | (315,949) |
| MINDBODY, Inc., Class A(b) | (10,286) | (407,840) |
| Total | | (1,325,392) |
| IT Services (0.0)% |
| Wirecard AG | (349) | (47,220) |
| Semiconductors & Semiconductor Equipment (0.3)% |
| Advanced Micro Devices, Inc.(b) | (13,007) | (141,516) |
| ams AG | (1,623) | (133,860) |
| Cree, Inc.(b) | (10,334) | (385,665) |
| Infineon Technologies AG | (11,660) | (298,562) |
| Total | | (959,603) |
| Software (1.7)% |
| ACI Worldwide, Inc.(b) | (19,565) | (454,886) |
| Blackbaud, Inc. | (4,314) | (452,797) |
| Dassault Systemes | (3,087) | (400,044) |
| Ellie Mae, Inc.(b) | (4,785) | (463,523) |
| Guidewire Software, Inc.(b) | (3,090) | (261,476) |
| HubSpot, Inc.(b) | (4,119) | (436,202) |
| Manhattan Associates, Inc.(b) | (8,800) | (378,928) |
| Open Text Corp. | (834) | (29,445) |
| Oracle Corp Japan | (4,000) | (328,591) |
| Proofpoint, Inc.(b) | (3,575) | (421,636) |
| Ultimate Software Group, Inc.(b) | (1,809) | (434,015) |
| Workday, Inc., Class A(b) | (3,379) | (421,834) |
| Zendesk, Inc.(b) | (7,576) | (369,330) |
| Total | | (4,852,707) |
| Total Information Technology | (9,308,152) |
| Materials (2.8)% |
| Chemicals (1.3)% |
| Air Liquide SA | (2,563) | (333,129) |
| Balchem Corp. | (4,348) | (383,668) |
| HB Fuller Co. | (4,249) | (210,198) |
| International Flavors & Fragrances, Inc. | (1,425) | (201,296) |
| Newmarket Corp. | (977) | (370,820) |
| Nutrien Ltd. | (42,100) | (1,916,543) |
The accompanying Notes to Financial Statements are an integral part of this statement.
Multi-Manager Directional Alternative Strategies Fund | Annual Report 2018
| 21 |
Portfolio of Investments (continued)
April 30, 2018
| Common Stocks (continued) |
| Issuer | Shares | Value ($) |
| OCI NV(b) | (4,036) | (95,780) |
| Quaker Chemical Corp. | (1,765) | (259,437) |
| Total | | (3,770,871) |
| Construction Materials (0.1)% |
| James Hardie Industries PLC | (16,031) | (283,098) |
| Containers & Packaging (0.3)% |
| Amcor Ltd. | (14,485) | (149,268) |
| AptarGroup, Inc. | (4,162) | (389,147) |
| CCL Industries, Inc., Class B | (267) | (12,951) |
| Huhtamaki OYJ | (1,179) | (47,956) |
| Sonoco Products Co. | (5,643) | (289,824) |
| Total | | (889,146) |
| Metals & Mining (1.1)% |
| Agnico Eagle Mines Ltd. | (386) | (16,243) |
| Antofagasta PLC | (27,386) | (365,902) |
| Compass Minerals International, Inc. | (2,152) | (144,830) |
| Eldorado Gold Corp. | (68,446) | (65,037) |
| First Quantum Minerals Ltd. | (73,704) | (1,061,976) |
| Franco-Nevada Corp. | (407) | (28,869) |
| Goldcorp, Inc. | (51,900) | (688,793) |
| Turquoise Hill Resources Ltd.(b) | (151,700) | (448,974) |
| Wheaton Precious Metals Corp. | (14,617) | (303,394) |
| Yamana Gold, Inc. | (32,953) | (94,705) |
| Total | | (3,218,723) |
| Total Materials | (8,161,838) |
| Real Estate (1.2)% |
| Equity Real Estate Investment Trusts (REITS) (1.2)% |
| Extra Space Storage, Inc. | (5,199) | (465,778) |
| Invitation Homes, Inc. | (79,347) | (1,836,090) |
| Iron Mountain, Inc. | (8,510) | (288,829) |
| Lamar Advertising Co., Class A | (4,168) | (265,543) |
| Public Storage | (1,529) | (308,522) |
| Washington Prime Group, Inc. | (57,401) | (371,385) |
| Total | | (3,536,147) |
| Real Estate Management & Development (0.0)% |
| Mitsubishi Estate Co., Ltd. | (2,500) | (45,681) |
| Total Real Estate | (3,581,828) |
| Common Stocks (continued) |
| Issuer | Shares | Value ($) |
| Telecommunication Services (1.7)% |
| Diversified Telecommunication Services (1.2)% |
| CenturyLink, Inc. | (63,297) | (1,176,058) |
| Cogent Communications Group | (9,221) | (434,770) |
| Telefonica SA | (7,404) | (75,450) |
| Telefonica SA, ADR | (17,711) | (179,767) |
| Zayo Group Holdings, Inc.(b) | (42,978) | (1,560,102) |
| Total | | (3,426,147) |
| Wireless Telecommunication Services (0.5)% |
| Millicom International Cellular SA, SDR | (5,388) | (356,894) |
| Softbank Corp. | (16,700) | (1,276,025) |
| Total | | (1,632,919) |
| Total Telecommunication Services | (5,059,066) |
| Utilities (0.3)% |
| Electric Utilities (0.3)% |
| El Paso Electric Co. | (4,585) | (234,064) |
| Emera, Inc. | (1,219) | (37,967) |
| IDACORP, Inc. | (4,321) | (401,853) |
| Total | | (673,884) |
| Independent Power and Renewable Electricity Producers (0.0)% |
| Northland Power, Inc. | (940) | (16,949) |
| Total Utilities | (690,833) |
Total Common Stocks
(Proceeds $87,557,329) | (88,564,786) |
| Preferred Stocks (0.1)% |
| Issuer | | Shares | Value ($) |
| Health Care (0.1)% |
| Health Care Equipment & Supplies (0.1)% |
| Sartorius AG | | (2,300) | (353,282) |
| Total Health Care | (353,282) |
Total Preferred Stocks
(Proceeds $209,946) | (353,282) |
Total Investments in Securities Sold Short
(Proceeds $87,767,275) | (88,918,068) |
| Total Investments in Securities, Net of Securities Sold Short | 175,280,273 |
| Other Assets & Liabilities, Net | | 116,190,902 |
| Net Assets | 291,471,175 |
The accompanying Notes to Financial Statements are an integral part of this statement.
| 22 | Multi-Manager Directional Alternative Strategies Fund | Annual Report 2018 |
Portfolio of Investments (continued)
April 30, 2018
At April 30, 2018, securities and/or cash totaling $196,228,998 were pledged as collateral.
Investments in derivatives
| Forward foreign currency exchange contracts |
Currency to
be sold | Currency to
be purchased | Counterparty | Settlement
date | Unrealized
appreciation ($) | Unrealized
depreciation ($) |
| 369,200 AUD | 292,518 USD | Citi | 06/20/2018 | 14,525 | — |
| 875,600 CAD | 696,135 USD | Citi | 06/20/2018 | 13,374 | — |
| 188,400 CAD | 145,306 USD | Citi | 06/20/2018 | — | (1,602) |
| 392,000 CHF | 425,849 USD | Citi | 06/20/2018 | 28,546 | — |
| 630,800 DKK | 106,268 USD | Citi | 06/20/2018 | 3,625 | — |
| 1,283,200 EUR | 1,608,961 USD | Citi | 06/20/2018 | 53,405 | — |
| 554,000 GBP | 779,733 USD | Citi | 06/20/2018 | 15,175 | — |
| 1,191,200 HKD | 152,542 USD | Citi | 06/20/2018 | 588 | — |
| 37,600 ILS | 10,756 USD | Citi | 06/20/2018 | 277 | — |
| 111,797,600 JPY | 1,062,588 USD | Citi | 06/20/2018 | 36,388 | — |
| 880,000 NOK | 112,962 USD | Citi | 06/20/2018 | 3,070 | — |
| 21,600 NZD | 15,885 USD | Citi | 06/20/2018 | 689 | — |
| 1,100,800 SEK | 138,659 USD | Citi | 06/20/2018 | 12,458 | — |
| 76,000 SGD | 57,733 USD | Citi | 06/20/2018 | 355 | — |
| 744,286 USD | 962,400 AUD | Citi | 06/20/2018 | — | (19,638) |
| 462,529 USD | 594,800 CAD | Citi | 06/20/2018 | 1,275 | — |
| 873,689 USD | 1,108,400 CAD | Citi | 06/20/2018 | — | (9,399) |
| 931,687 USD | 864,400 CHF | Citi | 06/20/2018 | — | (55,593) |
| 230,118 USD | 1,376,400 DKK | Citi | 06/20/2018 | — | (6,154) |
| 3,208,209 USD | 2,583,200 EUR | Citi | 06/20/2018 | — | (76,731) |
| 1,971,491 USD | 1,398,800 GBP | Citi | 06/20/2018 | — | (41,051) |
| 403,377 USD | 3,150,000 HKD | Citi | 06/20/2018 | — | (1,550) |
| 111,624 USD | 387,200 ILS | Citi | 06/20/2018 | — | (3,715) |
| 2,736,772 USD | 290,727,600 JPY | Citi | 06/20/2018 | — | (68,157) |
| 13,207 USD | 102,800 NOK | Citi | 06/20/2018 | — | (370) |
| 25,349 USD | 34,800 NZD | Citi | 06/20/2018 | — | (867) |
| 401,918 USD | 3,237,600 SEK | Citi | 06/20/2018 | — | (30,744) |
| 262,529 USD | 346,800 SGD | Citi | 06/20/2018 | — | (703) |
| 553,800 AUD | 438,776 USD | JPMorgan | 06/20/2018 | 21,787 | — |
| 1,313,400 CAD | 1,044,201 USD | JPMorgan | 06/20/2018 | 20,060 | — |
| 282,600 CAD | 217,958 USD | JPMorgan | 06/20/2018 | — | (2,403) |
| 588,000 CHF | 638,773 USD | JPMorgan | 06/20/2018 | 42,819 | — |
| 946,200 DKK | 159,401 USD | JPMorgan | 06/20/2018 | 5,438 | — |
| 1,924,800 EUR | 2,413,439 USD | JPMorgan | 06/20/2018 | 80,104 | — |
| 831,000 GBP | 1,172,537 USD | JPMorgan | 06/20/2018 | 25,700 | — |
| 1,786,800 HKD | 228,813 USD | JPMorgan | 06/20/2018 | 882 | — |
| 56,400 ILS | 16,134 USD | JPMorgan | 06/20/2018 | 415 | — |
| 167,696,400 JPY | 1,593,880 USD | JPMorgan | 06/20/2018 | 54,580 | — |
| 1,320,000 NOK | 169,443 USD | JPMorgan | 06/20/2018 | 4,604 | — |
| 32,400 NZD | 23,827 USD | JPMorgan | 06/20/2018 | 1,033 | — |
| 1,651,200 SEK | 207,988 USD | JPMorgan | 06/20/2018 | 18,686 | — |
| 114,000 SGD | 86,600 USD | JPMorgan | 06/20/2018 | 532 | — |
| 1,116,431 USD | 1,443,600 AUD | JPMorgan | 06/20/2018 | — | (29,458) |
| 693,794 USD | 892,200 CAD | JPMorgan | 06/20/2018 | 1,911 | — |
| 1,310,535 USD | 1,662,600 CAD | JPMorgan | 06/20/2018 | — | (14,100) |
| 1,397,532 USD | 1,296,600 CHF | JPMorgan | 06/20/2018 | — | (83,392) |
| 345,178 USD | 2,064,600 DKK | JPMorgan | 06/20/2018 | — | (9,232) |
| 4,812,320 USD | 3,874,800 EUR | JPMorgan | 06/20/2018 | — | (115,102) |
| 2,957,239 USD | 2,098,200 GBP | JPMorgan | 06/20/2018 | — | (61,580) |
| 605,066 USD | 4,725,000 HKD | JPMorgan | 06/20/2018 | — | (2,326) |
| 167,436 USD | 580,800 ILS | JPMorgan | 06/20/2018 | — | (5,573) |
| 4,105,162 USD | 436,091,400 JPY | JPMorgan | 06/20/2018 | — | (102,241) |
| 19,811 USD | 154,200 NOK | JPMorgan | 06/20/2018 | — | (554) |
The accompanying Notes to Financial Statements are an integral part of this statement.
Multi-Manager Directional Alternative Strategies Fund | Annual Report 2018
| 23 |
Portfolio of Investments (continued)
April 30, 2018
| Forward foreign currency exchange contracts (continued) |
Currency to
be sold | Currency to
be purchased | Counterparty | Settlement
date | Unrealized
appreciation ($) | Unrealized
depreciation ($) |
| 38,024 USD | 52,200 NZD | JPMorgan | 06/20/2018 | — | (1,300) |
| 602,878 USD | 4,856,400 SEK | JPMorgan | 06/20/2018 | — | (46,116) |
| 393,795 USD | 520,200 SGD | JPMorgan | 06/20/2018 | — | (1,054) |
| Total | | | | 462,301 | (790,705) |
| Long futures contracts |
| Description | Number of
contracts | Expiration
date | Trading
currency | Notional
amount | Value/Unrealized
appreciation ($) | Value/Unrealized
depreciation ($) |
| Amsterdam IDX | 6 | 05/2018 | EUR | 663,540 | 12,061 | — |
| CAC40 Index | 27 | 05/2018 | EUR | 1,477,710 | 59,359 | — |
| DAX Index | 3 | 06/2018 | EUR | 945,825 | 34,882 | — |
| FTSE 100 Index | 26 | 06/2018 | GBP | 1,939,600 | 129,641 | — |
| FTSE/MIB Index | 3 | 06/2018 | EUR | 353,970 | 23,943 | — |
| Hang Seng Index | 2 | 05/2018 | HKD | 3,066,500 | 5,271 | — |
| IBEX 35 Index | 5 | 05/2018 | EUR | 498,670 | 12,820 | — |
| OMXS30 Index | 34 | 05/2018 | SEK | 5,321,000 | 14,731 | — |
| S&P 500 E-mini | 178 | 06/2018 | USD | 23,558,300 | — | (1,079,729) |
| S&P/TSX 60 Index | 10 | 06/2018 | CAD | 1,839,800 | 4,200 | — |
| SPI 200 Index | 10 | 06/2018 | AUD | 1,491,500 | — | (2,186) |
| TOPIX Index | 23 | 06/2018 | JPY | 409,285,000 | 217,589 | — |
| Total | | | | | 514,497 | (1,081,915) |
| Short futures contracts |
| Description | Number of
contracts | Expiration
date | Trading
currency | Notional
amount | Value/Unrealized
appreciation ($) | Value/Unrealized
depreciation ($) |
| MSCI Singapore IX ETS | (1) | 05/2018 | SGD | (41,135) | — | (686) |
| Total return swap contracts |
| Fund receives | Fund pays | Payment
frequency | Counterparty | Maturity
date | Notional
currency | Notional
amount | Value
($) | Periodic
payments
receivable
(payable)
($) | Upfront
payments | Upfront
receipts | Unrealized
appreciation
($) | Unrealized
depreciation
($) |
| Total return on a portfolio of long and short positions† | AUD BBSW 1-month, HKD HIBOR 1-month, or JPY LIBOR 1-month based on the local currencies of the positions within the swap | Monthly | JPMorgan | 01/14/2021 | USD | 55,441,232 | (223,078) | — | — | — | — | (223,078) |
| Total return on Samsung Electronics Co., Ltd.†† | 1-month USD LIBOR plus 0.800% | Monthly | Macquarie | 09/18/2018 | USD | 1,538,675 | 83,069 | 7,527 | — | — | 90,596 | — |
| 1-month USD LIBOR minus 4.000% | Total return on Celltrion, Inc. | Monthly | Macquarie | 09/18/2018 | USD | 443,269 | 34,105 | (337) | — | — | 33,768 | — |
| 1-month USD LIBOR minus 3.500% | Total return on PT Unilever Indonesia Tbk | Monthly | Macquarie | 09/18/2018 | USD | 199,581 | 22,098 | (116) | — | — | 21,982 | — |
The accompanying Notes to Financial Statements are an integral part of this statement.
| 24 | Multi-Manager Directional Alternative Strategies Fund | Annual Report 2018 |
Portfolio of Investments (continued)
April 30, 2018
| Total return swap contracts (continued) |
| Fund receives | Fund pays | Payment
frequency | Counterparty | Maturity
date | Notional
currency | Notional
amount | Value
($) | Periodic
payments
receivable
(payable)
($) | Upfront
payments | Upfront
receipts | Unrealized
appreciation
($) | Unrealized
depreciation
($) |
| 1-month USD LIBOR minus 7.000% | Total return on AU Optronics Corp. | Monthly | Macquarie | 09/18/2018 | USD | 390,405 | 15,161 | (710) | — | — | 14,451 | — |
| 1-month USD LIBOR minus 0.750% | Total return on Innolux Corp. | Monthly | Macquarie | 09/18/2018 | USD | 242,251 | 13,022 | 100 | — | — | 13,122 | — |
| Total return on Royal Dutch Shell PLC | 1-month GBP LIBOR plus 0.500% | Monthly | Macquarie | 09/18/2018 | GBP | 622,193 | 7,572 | (122) | — | — | 7,450 | — |
| 1-month HKD HIBOR minus 0.500% | Total return on China Resources Beer Holdings Co., Ltd. | Monthly | Macquarie | 09/18/2018 | HKD | 1,408,000 | 7,117 | 25 | — | — | 7,142 | — |
| 1-month HKD HIBOR minus 7.000% | Total return on Semiconductor Manufacturing International Corp. | Monthly | Macquarie | 09/18/2018 | HKD | 168,299 | 1,508 | (28) | — | — | 1,480 | — |
| Total return on Samsung Electronics Co., Ltd.†† | 1-month USD LIBOR plus 0.800% | Monthly | Macquarie | 09/18/2018 | USD | 31,027 | 1,062 | (16) | — | — | 1,046 | — |
| 1-month USD LIBOR minus 3.500% | Total return on PT Unilever Indonesia Tbk | Monthly | Macquarie | 09/18/2018 | USD | 8,777 | 800 | (3) | — | — | 797 | — |
| 1-month USD LIBOR minus 5.000% | Total return on Innolux Corp. | Monthly | Macquarie | 09/18/2018 | USD | 11,012 | 593 | 2 | — | — | 595 | — |
| 1-month USD LIBOR minus 6.000% | Total return on AU Optronics Corp. | Monthly | Macquarie | 09/18/2018 | USD | 16,948 | 453 | (19) | — | — | 434 | — |
| 1-month HKD HIBOR minus 0.500% | Total return on China Resources Beer Holdings Co., Ltd. | Monthly | Macquarie | 09/18/2018 | HKD | 135,518 | 39 | 2 | — | — | 41 | — |
| 1-month USD LIBOR minus 4.000% | Total return on Feng Tay Enterprise Co., Ltd. | Monthly | Macquarie | 09/18/2018 | USD | 9,072 | (54) | — | — | — | — | (54) |
| 1-month USD LIBOR minus 5.000% | Total return on Eclat Textile Co., Ltd. | Monthly | Macquarie | 09/18/2018 | USD | 36,263 | (190) | — | — | — | — | (190) |
| 1-month USD LIBOR minus 6.000% | Total return on Celltrion, Inc. | Monthly | Macquarie | 09/18/2018 | USD | 17,769 | (294) | (8) | — | — | — | (302) |
| 1-month HKD HIBOR minus 0.500% | Total return on Bank of East Asia Ltd. (The) | Monthly | Macquarie | 09/18/2018 | HKD | 87,028 | (328) | — | — | — | — | (328) |
The accompanying Notes to Financial Statements are an integral part of this statement.
Multi-Manager Directional Alternative Strategies Fund | Annual Report 2018
| 25 |
Portfolio of Investments (continued)
April 30, 2018
| Total return swap contracts (continued) |
| Fund receives | Fund pays | Payment
frequency | Counterparty | Maturity
date | Notional
currency | Notional
amount | Value
($) | Periodic
payments
receivable
(payable)
($) | Upfront
payments | Upfront
receipts | Unrealized
appreciation
($) | Unrealized
depreciation
($) |
| 1-month USD LIBOR minus 0.500% | Total return on AmorePacific Corp. | Monthly | Macquarie | 09/18/2018 | USD | 14,394 | (572) | 4 | — | — | — | (568) |
| 1-month USD LIBOR minus 0.500% | Total return on AmorePacific Corp. | Monthly | Macquarie | 09/18/2018 | USD | 329,284 | (8,441) | 166 | — | — | — | (8,275) |
| 1-month HKD HIBOR minus 1.000% | Total return on Bank of East Asia Ltd. (The) | Monthly | Macquarie | 09/18/2018 | HKD | 1,780,614 | (10,064) | (9) | — | — | — | (10,073) |
| Total return on RPC Group PLC | 1-month GBP LIBOR plus 0.500% | Monthly | Macquarie | 09/18/2018 | GBP | 445,274 | (19,162) | (87) | — | — | — | (19,249) |
| 1-month HKD HIBOR minus 7.000% | Total return on Semiconductor Manufacturing International Corp. | Monthly | Macquarie | 09/18/2018 | HKD | 3,232,294 | (26,215) | (896) | — | — | — | (27,111) |
| Total return on Glencore PLC | 1-month GBP LIBOR plus 0.500% | Monthly | Macquarie | 09/18/2018 | GBP | 486,243 | (37,094) | (95) | — | — | — | (37,189) |
| Total return on a portfolio of long and short positions† | FEDEF 1-day, EONIA 1-day, or SONIA 1-day based on the local currencies of the positions within the swap | Monthly | Morgan Stanley International | 10/30/2019 | USD | 171,466,982 | (2,002,819) | — | — | — | — | (2,002,819) |
| Total | | | | | | | (2,141,712) | 5,380 | — | — | 192,904 | (2,329,236) |
| † | By investing in the total return swap contract, the Fund gains exposure to the underlying investments that make up the custom basket/index without having to own the underlying investments directly. The components of the custom basket/index are available on Multi-Manager Directional Alternative Strategies Fund’s page of columbiathreadneedleus.com website. |
| †† | Represents fair value as determined in good faith under procedures approved by the Board of Trustees. At April 30, 2018, the value of these swap contracts amounted to $84,131, which represents 0.03% of net assets. |
| Total return swap contracts on futures |
| Reference instrument* | Counterparty | Expiration
date | Trading
currency | Notional amount
long(short) | Upfront
payments ($) | Upfront
receipts ($) | Value/Unrealized
appreciation
($) | Value/Unrealized
depreciation
($) |
| MSCI Singapore IX ETS May 18 | Morgan Stanley International | 05/2018 | SGD | 82,270 | — | — | 1,228 | — |
| Swiss Market Index Jun 18 | Morgan Stanley International | 06/2018 | CHF | 1,237,180 | — | — | 11,765 | — |
| Total | | | | | — | — | 12,993 | — |
| * | If the notional amount of the swap contract is long and the swap contract’s value is positive (negative), the Fund will receive (pay) the total return. If the notional amount of the swap contract is short and the swap contract’s value is positive (negative), the Fund will pay (receive) the total return. Receipts and payments occur upon termination of the contract. |
The accompanying Notes to Financial Statements are an integral part of this statement.
| 26 | Multi-Manager Directional Alternative Strategies Fund | Annual Report 2018 |
Portfolio of Investments (continued)
April 30, 2018
Notes to Portfolio of Investments
| (a) | This security or a portion of this security has been pledged as collateral in connection with investments sold short. |
| (b) | Non-income producing investment. |
| (c) | Represents privately placed and other securities and instruments exempt from SEC registration (collectively, private placements), such as Section 4(a)(2) and Rule 144A eligible securities, which are often sold only to qualified institutional buyers. The Fund may invest in private placements determined to be liquid as well as those determined to be illiquid. Private placements may be determined to be liquid under guidelines established by the Fund’s Board of Trustees. At April 30, 2018, the value of these securities amounted to $1,251,787, which represents 0.43% of net assets. |
| (d) | The rate shown is the seven-day current annualized yield at April 30, 2018. |
| (e) | As defined in the Investment Company Act of 1940, an affiliated company is one in which the Fund owns 5% or more of the company’s outstanding voting securities, or a company which is under common ownership or control with the Fund. Holdings and transactions in these affiliated companies during the year ended April 30, 2018 are as follows: |
| Issuer | Beginning
shares | Shares
purchased | Shares
sold | Ending
shares | Realized gain
(loss) —
affiliated
issuers ($) | Net change in
unrealized
appreciation
(depreciation) —
affiliated
issuers ($) | Dividends —
affiliated
issuers ($) | Value —
affiliated
issuers
at end of
period ($) |
| Columbia Short-Term Cash Fund, 1.889% |
| | 187,098,394 | 427,019,960 | (563,270,161) | 50,848,193 | (14,916) | (726) | 2,157,708 | 50,843,108 |
| (f) | Represents fair value as determined in good faith under procedures approved by the Board of Trustees. At April 30, 2018, the value of these securities amounted to $3,257, which represents less than 0.01% of net assets. |
| (g) | Valuation based on significant unobservable inputs. |
Abbreviation Legend
| ADR | American Depositary Receipt |
| SDR | Swedish Depositary Receipt |
Currency Legend
| AUD | Australian Dollar |
| CAD | Canada Dollar |
| CHF | Swiss Franc |
| DKK | Danish Krone |
| EUR | Euro |
| GBP | British Pound |
| HKD | Hong Kong Dollar |
| ILS | New Israeli Sheqel |
| JPY | Japanese Yen |
| NOK | Norwegian Krone |
| NZD | New Zealand Dollar |
| SEK | Swedish Krona |
| SGD | Singapore Dollar |
| USD | US Dollar |
Fair value measurements
The Fund categorizes its fair value measurements according to a three-level hierarchy that maximizes the use of observable inputs and minimizes the use of unobservable inputs by prioritizing that the most observable input be used when available. Observable inputs are those that market participants would use in pricing an investment based on market data obtained from sources independent of the reporting entity. Unobservable inputs are those that reflect the Fund’s assumptions about the information market participants would use in pricing an investment. An investment’s level within the fair value hierarchy is based on the lowest level of any input that is deemed significant to the asset’s or liability’s fair value measurement. The input levels are not necessarily an indication of the risk or liquidity associated with investments at that level. For example, certain U.S. government securities are generally high quality and liquid, however, they are reflected as Level 2 because the inputs used to determine fair value may not always be quoted prices in an active market.
Fair value inputs are summarized in the three broad levels listed below:
| ■ | Level 1 — Valuations based on quoted prices for investments in active markets that the Fund has the ability to access at the measurement date. Valuation adjustments are not applied to Level 1 investments. |
The accompanying Notes to Financial Statements are an integral part of this statement.
Multi-Manager Directional Alternative Strategies Fund | Annual Report 2018
| 27 |
Portfolio of Investments (continued)
April 30, 2018
Fair value measurements (continued)
| ■ | Level 2 — Valuations based on other significant observable inputs (including quoted prices for similar securities, interest rates, prepayment speeds, credit risks, etc.). |
| ■ | Level 3 — Valuations based on significant unobservable inputs (including the Fund’s own assumptions and judgment in determining the fair value of investments). |
Inputs that are used in determining fair value of an investment may include price information, credit data, volatility statistics, and other factors. These inputs can be either observable or unobservable. The availability of observable inputs can vary between investments, and is affected by various factors such as the type of investment, and the volume and level of activity for that investment or similar investments in the marketplace. The inputs will be considered by the Investment Manager, along with any other relevant factors in the calculation of an investment’s fair value. The Fund uses prices and inputs that are current as of the measurement date, which may include periods of market dislocations. During these periods, the availability of prices and inputs may be reduced for many investments. This condition could cause an investment to be reclassified between the various levels within the hierarchy.
Foreign equity securities actively traded in markets where there is a significant delay in the local close relative to the New York Stock Exchange are classified as Level 2. The values of these securities may include an adjustment to reflect the impact of significant market movements following the close of local trading, as described in Note 2 to the financial statements – Security valuation.
Certain investments that have been measured at fair value using the net asset value (NAV) per share (or its equivalent) are not categorized in the fair value hierarchy. The fair value amounts presented in the table are intended to reconcile the fair value hierarchy to the amounts presented in the Portfolio of Investments. The Columbia Short-Term Cash Fund seeks to provide shareholders with maximum current income consistent with liquidity and stability of principal. Columbia Short-Term Cash Fund prices its shares with a floating NAV and no longer seeks to maintain a stable NAV.
Investments falling into the Level 3 category are primarily supported by quoted prices from brokers and dealers participating in the market for those investments. However, these may be classified as Level 3 investments due to lack of market transparency and corroboration to support these quoted prices. Additionally, valuation models may be used as the pricing source for any remaining investments classified as Level 3. These models may rely on one or more significant unobservable inputs and/or significant assumptions by the Investment Manager. Inputs used in valuations may include, but are not limited to, financial statement analysis, capital account balances, discount rates and estimated cash flows, and comparable company data.
Under the direction of the Fund’s Board of Trustees (the Board), the Investment Manager’s Valuation Committee (the Committee) is responsible for overseeing the valuation procedures approved by the Board. The Committee consists of voting and non-voting members from various groups within the Investment Manager’s organization, including operations and accounting, trading and investments, compliance, risk management and legal.
The Committee meets at least monthly to review and approve valuation matters, which may include a description of specific valuation determinations, data regarding pricing information received from approved pricing vendors and brokers and the results of Board-approved valuation control policies and procedures (the Policies). The Policies address, among other things, instances when market quotations are or are not readily available, including recommendations of third party pricing vendors and a determination of appropriate pricing methodologies; events that require specific valuation determinations and assessment of fair value techniques; securities with a potential for stale pricing, including those that are illiquid, restricted, or in default; and the effectiveness of third party pricing vendors, including periodic reviews of vendors. The Committee meets more frequently, as needed, to discuss additional valuation matters, which may include the need to review back-testing results, review time-sensitive information or approve related valuation actions. The Committee reports to the Board, with members of the Committee meeting with the Board at each of its regularly scheduled meetings to discuss valuation matters and actions during the period, similar to those described earlier.
For investments categorized as Level 3, the Committee monitors information similar to that described above, which may include: (i) data specific to the issuer or comparable issuers, (ii) general market or specific sector news and (iii) quoted prices and specific or similar security transactions. The Committee considers this data and any changes from prior periods in order to assess the reasonableness of observable and unobservable inputs, any assumptions or internal models used to value those securities and changes in fair value. This data is also used to corroborate, when available, information received from approved pricing vendors and brokers. Various factors impact the frequency of monitoring this information (which may occur as often as daily). However, the Committee may determine that changes to inputs, assumptions and models are not required as a result of the monitoring procedures performed.
The following table is a summary of the inputs used to value the Fund’s investments at April 30, 2018:
| | Level 1
quoted prices
in active
markets for
identical
assets ($) | Level 2
other
significant
observable
inputs ($) | Level 3
significant
unobservable
inputs ($) | Investments
measured at
net asset
value ($) | Total ($) |
| Investments in Securities | | | | | |
| Common Stocks | | | | | |
| Consumer Discretionary | 20,189,378 | 6,576,317 | — | — | 26,765,695 |
| Consumer Staples | 8,533,468 | 5,128,585 | — | — | 13,662,053 |
| Energy | 14,349,392 | 3,470,314 | — | — | 17,819,706 |
| Financials | 23,298,826 | 4,430,042 | — | — | 27,728,868 |
| Health Care | 19,600,203 | 1,688,226 | — | — | 21,288,429 |
| Industrials | 25,845,300 | 13,127,277 | — | — | 38,972,577 |
| Information Technology | 41,371,620 | 6,956,183 | — | — | 48,327,803 |
| Materials | 7,057,241 | 3,159,131 | — | — | 10,216,372 |
| Real Estate | 725,973 | 1,380,321 | — | — | 2,106,294 |
The accompanying Notes to Financial Statements are an integral part of this statement.
| 28 | Multi-Manager Directional Alternative Strategies Fund | Annual Report 2018 |
Portfolio of Investments (continued)
April 30, 2018
Fair value measurements (continued)
| | Level 1
quoted prices
in active
markets for
identical
assets ($) | Level 2
other
significant
observable
inputs ($) | Level 3
significant
unobservable
inputs ($) | Investments
measured at
net asset
value ($) | Total ($) |
| Telecommunication Services | 574,335 | 498,078 | — | — | 1,072,413 |
| Utilities | 3,348,448 | 863,165 | — | — | 4,211,613 |
| Total Common Stocks | 164,894,184 | 47,277,639 | — | — | 212,171,823 |
| Limited Partnerships | | | | | |
| Energy | 328,666 | — | — | — | 328,666 |
| Preferred Stocks | | | | | |
| Consumer Discretionary | — | 854,744 | — | — | 854,744 |
| Money Market Funds | — | — | — | 50,843,108 | 50,843,108 |
| Total Investments in Securities | 165,222,850 | 48,132,383 | — | 50,843,108 | 264,198,341 |
| Investments in Securities Sold Short | | | | | |
| Common Stocks | | | | | |
| Consumer Discretionary | (6,763,934) | (5,512,500) | — | — | (12,276,434) |
| Consumer Staples | (1,429,531) | (1,228,483) | — | — | (2,658,014) |
| Energy | (12,795,845) | (4,100,294) | — | — | (16,896,139) |
| Financials | (6,301,401) | (1,855,162) | — | — | (8,156,563) |
| Health Care | (7,501,969) | (3,055,560) | — | — | (10,557,529) |
| Industrials | (8,003,442) | (3,211,691) | (3,257) | — | (11,218,390) |
| Information Technology | (6,440,236) | (2,867,916) | — | — | (9,308,152) |
| Materials | (6,886,705) | (1,275,133) | — | — | (8,161,838) |
| Real Estate | (3,536,147) | (45,681) | — | — | (3,581,828) |
| Telecommunication Services | (3,350,697) | (1,708,369) | — | — | (5,059,066) |
| Utilities | (690,833) | — | — | — | (690,833) |
| Total Common Stocks | (63,700,740) | (24,860,789) | (3,257) | — | (88,564,786) |
| Preferred Stocks | | | | | |
| Health Care | — | (353,282) | — | — | (353,282) |
| Total Investments in Securities Sold Short | (63,700,740) | (25,214,071) | (3,257) | — | (88,918,068) |
| Total Investments in Securities, Net of Securities Sold Short | 101,522,110 | 22,918,312 | (3,257) | 50,843,108 | 175,280,273 |
| Investments in Derivatives | | | | | |
| Asset | | | | | |
| Forward Foreign Currency Exchange Contracts | — | 462,301 | — | — | 462,301 |
| Futures Contracts | 514,497 | — | — | — | 514,497 |
| Swap Contracts | — | 205,897 | — | — | 205,897 |
| Liability | | | | | |
| Forward Foreign Currency Exchange Contracts | — | (790,705) | — | — | (790,705) |
| Futures Contracts | (1,082,601) | — | — | — | (1,082,601) |
| Swap Contracts | — | (2,329,236) | — | — | (2,329,236) |
| Total | 100,954,006 | 20,466,569 | (3,257) | 50,843,108 | 172,260,426 |
See the Portfolio of Investments for all investment classifications not indicated in the table.
The Fund’s assets assigned to the Level 2 input category are generally valued using the market approach, in which a security’s value is determined through reference to prices and information from market transactions for similar or identical assets. These assets include certain foreign securities for which a third party statistical pricing service may be employed for purposes of fair market valuation. The model utilized by such third party statistical pricing service takes into account a security’s correlation to available market data including, but not limited to, intraday index, ADR, and exchange-traded fund movements.
Derivative instruments are valued at unrealized appreciation (depreciation).
There were no transfers of financial assets between levels during the period.
The Fund does not hold any significant investments (greater than one percent of net assets) categorized as Level 3.
The Fund’s assets assigned to the Level 3 category are valued utilizing the valuation technique deemed the most appropriate in the circumstances. Certain common stocks classified as Level 3 are valued using an income approach. To determine fair value for these securities, management considered estimates of future distributions from the company assets or potential actions related to the respective company’s restructuring. Significant increases (decreases) to any of these inputs would result in a significantly lower (higher) fair value measurement.
The accompanying Notes to Financial Statements are an integral part of this statement.
Multi-Manager Directional Alternative Strategies Fund | Annual Report 2018
| 29 |
Statement of Assets and Liabilities
April 30, 2018
| Assets | |
| Investments in securities, at value | |
| Unaffiliated issuers (cost $184,241,145) | $213,355,233 |
| Affiliated issuers (cost $50,843,331) | 50,843,108 |
| Foreign currency (cost $495,989) | 489,944 |
| Cash collateral held at broker for: | |
| Forward foreign currency exchange contracts | 290,000 |
| Swap contracts | 14,960,000 |
| Securities sold short | 96,232,473 |
| Other (a) | 4,550,000 |
| Margin deposits on: | |
| Futures contracts | 1,766,770 |
| Unrealized appreciation on forward foreign currency exchange contracts | 462,301 |
| Unrealized appreciation on swap contracts | 205,897 |
| Receivable for: | |
| Investments sold | 686,677 |
| Capital shares sold | 277,686 |
| Dividends | 410,188 |
| Interest | 48,945 |
| Foreign tax reclaims | 303,869 |
| Variation margin for futures contracts | 32,697 |
| Prepaid expenses | 1,442 |
| Trustees’ deferred compensation plan | 10,318 |
| Total assets | 384,927,548 |
| Liabilities | |
| Securities sold short, at value (proceeds $87,767,275) | 88,918,068 |
| Due to custodian | 116,982 |
| Unrealized depreciation on forward foreign currency exchange contracts | 790,705 |
| Unrealized depreciation on swap contracts | 2,329,236 |
| Payable for: | |
| Investments purchased | 600,903 |
| Capital shares purchased | 243,127 |
| Dividends and interest on securities sold short | 3,318 |
| Variation margin for futures contracts | 226,266 |
| Management services fees | 38,525 |
| Distribution and/or service fees | 17 |
| Transfer agent fees | 54,007 |
| Compensation of chief compliance officer | 25 |
| Other expenses | 124,876 |
| Trustees’ deferred compensation plan | 10,318 |
| Total liabilities | 93,456,373 |
| Net assets applicable to outstanding capital stock | $291,471,175 |
| Represented by | |
| Paid in capital | 189,523,869 |
| Undistributed net investment income | 3,694,808 |
| Accumulated net realized gain | 72,951,661 |
| Unrealized appreciation (depreciation) on: | |
| Investments - unaffiliated issuers | 29,114,088 |
| Investments - affiliated issuers | (223) |
| Foreign currency translations | 357,612 |
| Forward foreign currency exchange contracts | (328,404) |
| Futures contracts | (568,104) |
| Securities sold short | (1,150,793) |
| Swap contracts | (2,123,339) |
| Total - representing net assets applicable to outstanding capital stock | $291,471,175 |
The accompanying Notes to Financial Statements are an integral part of this statement.
| 30 | Multi-Manager Directional Alternative Strategies Fund | Annual Report 2018 |
Statement of Assets and Liabilities (continued)
April 30, 2018
| Class A | |
| Net assets | $804,867 |
| Shares outstanding | 74,127 |
| Net asset value per share | $10.86 |
| Institutional Class | |
| Net assets | $290,666,308 |
| Shares outstanding | 26,854,255 |
| Net asset value per share | $10.82 |
| (a) | Includes collateral related to forward foreign currency exchange contracts and swap contracts . |
The accompanying Notes to Financial Statements are an integral part of this statement.
Multi-Manager Directional Alternative Strategies Fund | Annual Report 2018
| 31 |
Statement of Operations
Year Ended April 30, 2018
| Net investment income | |
| Income: | |
| Dividends — unaffiliated issuers | $12,562,992 |
| Dividends — affiliated issuers | 2,157,708 |
| Foreign taxes withheld | (435,425) |
| Total income | 14,285,275 |
| Expenses: | |
| Management services fees | 14,976,807 |
| Distribution and/or service fees | |
| Class A | 2,754 |
| Transfer agent fees | |
| Class A | 2,968 |
| Institutional Class | 2,758,071 |
| Compensation of board members | 33,172 |
| Custodian fees | 155,482 |
| Printing and postage fees | 219,121 |
| Registration fees | 81,807 |
| Audit fees | 64,882 |
| Legal fees | 25,826 |
| Dividends and interest on securities sold short | 3,703,420 |
| Compensation of chief compliance officer | 390 |
| Other | 62,460 |
| Total expenses | 22,087,160 |
| Net investment loss | (7,801,885) |
| Realized and unrealized gain (loss) — net | |
| Net realized gain (loss) on: | |
| Investments — unaffiliated issuers | 140,908,695 |
| Investments — affiliated issuers | (14,916) |
| Foreign currency translations | 3,412,965 |
| Forward foreign currency exchange contracts | 5,121,824 |
| Futures contracts | 19,021,989 |
| Securities sold short | (61,414,335) |
| Swap contracts | 15,135,667 |
| Net realized gain | 122,171,889 |
| Net change in unrealized appreciation (depreciation) on: | |
| Investments — unaffiliated issuers | (31,388,704) |
| Investments — affiliated issuers | (726) |
| Foreign currency translations | (165,014) |
| Forward foreign currency exchange contracts | (1,154,003) |
| Futures contracts | (2,130,141) |
| Securities sold short | 23,219,849 |
| Swap contracts | (5,353,266) |
| Net change in unrealized appreciation (depreciation) | (16,972,005) |
| Net realized and unrealized gain | 105,199,884 |
| Net increase in net assets resulting from operations | $97,397,999 |
The accompanying Notes to Financial Statements are an integral part of this statement.
| 32 | Multi-Manager Directional Alternative Strategies Fund | Annual Report 2018 |
Statement of Changes in Net Assets
| | Year Ended
April 30, 2018 | Year Ended
April 30, 2017 (a),(b) |
| Operations | | |
| Net investment loss | $(7,801,885) | $(6,041,446) |
| Net realized gain | 122,171,889 | 27,478,347 |
| Net change in unrealized appreciation (depreciation) | (16,972,005) | 42,272,842 |
| Net increase in net assets resulting from operations | 97,397,999 | 63,709,743 |
| Distributions to shareholders | | |
| Net investment income | | |
| Class A | (11,114) | (652,003) |
| Institutional Class | (16,920,019) | — |
| Net realized gains | | |
| Class A | (35,856) | — |
| Institutional Class | (41,542,556) | — |
| Total distributions to shareholders | (58,509,545) | (652,003) |
| Increase (decrease) in net assets from capital stock activity | (799,308,117) | 988,813,098 |
| Total increase (decrease) in net assets | (760,419,663) | 1,051,870,838 |
| Net assets at beginning of year | 1,051,890,838 | 20,000 |
| Net assets at end of year | $291,471,175 | $1,051,890,838 |
| Undistributed net investment income | $3,694,808 | $4,886,041 |
| (a) | Class A shares are based on operations from October 17, 2016 (commencement of operations) through the stated period end. |
| (b) | Institutional Class shares are based on operations from January 3, 2017 (commencement of operations) through the stated period end. |
The accompanying Notes to Financial Statements are an integral part of this statement.
Multi-Manager Directional Alternative Strategies Fund | Annual Report 2018
| 33 |
Statement of Changes in Net Assets (continued)
| | Year Ended | Year Ended |
| | April 30, 2018 | April 30, 2017 (a),(b) |
| | Shares | Dollars ($) | Shares | Dollars ($) |
| Capital stock activity |
| Class A | | | | |
| Subscriptions | 11,118 | 119,634 | 113,001,284 | 1,133,473,560 |
| Distributions reinvested | 4,170 | 46,285 | 63,300 | 651,990 |
| Redemptions | (123,701) | (1,343,721) | (112,884,044) | (1,200,600,106) |
| Net increase (decrease) | (108,413) | (1,177,802) | 180,540 | (66,474,556) |
| Institutional Class | | | | |
| Subscriptions | 13,102,353 | 145,580,451 | 102,126,850 | 1,088,107,135 |
| Distributions reinvested | 5,285,933 | 58,462,427 | — | — |
| Redemptions | (90,567,409) | (1,002,173,193) | (3,093,472) | (32,819,481) |
| Net increase (decrease) | (72,179,123) | (798,130,315) | 99,033,378 | 1,055,287,654 |
| Total net increase (decrease) | (72,287,536) | (799,308,117) | 99,213,918 | 988,813,098 |
| (a) | Class A shares are based on operations from October 17, 2016 (commencement of operations) through the stated period end. |
| (b) | Institutional Class shares are based on operations from January 3, 2017 (commencement of operations) through the stated period end. |
The accompanying Notes to Financial Statements are an integral part of this statement.
| 34 | Multi-Manager Directional Alternative Strategies Fund | Annual Report 2018 |
[THIS PAGE INTENTIONALLY LEFT BLANK]
Multi-Manager Directional Alternative Strategies Fund | Annual Report 2018
| 35 |
The following table is intended to help you understand the Fund’s financial performance. Certain information reflects financial results for a single share of a class held for the periods shown. Per share net investment income (loss) amounts are calculated based on average shares outstanding during the period. Total return assumes reinvestment of all dividends and distributions, if any. Total return does not reflect payment of sales charges, if any. Total return and portfolio turnover are not annualized for periods of less than one year. The portfolio turnover rate is calculated without regard to purchase and sales transactions of short-term instruments and certain derivatives, if any. If such transactions were included, the Fund’s portfolio turnover rate may be higher.
| | Net asset value,
beginning of
period | Net
investment
income
(loss) | Net
realized
and
unrealized
gain | Total from
investment
operations | Distributions
from net
investment
income | Distributions
from net
realized
gains |
| Class A |
| Year Ended 4/30/2018 | $10.62 | (0.11) | 0.91 | 0.80 | (0.13) | (0.43) |
| Year Ended 4/30/2017(d) | $10.00 | (0.07) | 0.70 | 0.63 | (0.01) | — |
| Institutional Class |
| Year Ended 4/30/2018 | $10.60 | (0.09) | 0.92 | 0.83 | (0.18) | (0.43) |
| Year Ended 4/30/2017(f) | $10.25 | (0.01) | 0.36 | 0.35 | — | — |
| Notes to Financial Highlights |
| (a) | In addition to the fees and expenses that the Fund bears directly, the Fund indirectly bears a pro rata share of the fees and expenses of any other funds in which it invests. Such indirect expenses are not included in the Fund’s reported expense ratios. |
| (b) | Total net expenses include the impact of certain fee waivers/expense reimbursements made by the Investment Manager and certain of its affiliates, if applicable. |
| (c) | Ratios include dividends and interest on securities sold short. If dividends and interest on securities sold short had been excluded, expenses would have been lower by: |
| Class | 4/30/2018 | 4/30/2017 |
| Class A | 0.47% | 0.54% |
| Institutional Class | 0.40% | 0.46% |
| (d) | Class A shares commenced operations on October 17, 2016. Per share data and total return reflect activity from that date. |
| (e) | Annualized. |
| (f) | Institutional Class shares commenced operations on January 3, 2017. Per share data and total return reflect activity from that date. |
The accompanying Notes to Financial Statements are an integral part of this statement.
| 36 | Multi-Manager Directional Alternative Strategies Fund | Annual Report 2018 |
Total
distributions to
shareholders | Net
asset
value,
end of
period | Total
return | Total gross
expense
ratio to
average
net assets(a) | Total net
expense
ratio to
average
net assets(a),(b) | Net investment
income (loss)
ratio to
average
net assets | Portfolio
turnover | Net
assets,
end of
period
(000’s) |
| |
| (0.56) | $10.86 | 7.46% | 2.61% (c) | 2.61% (c) | (0.98%) | 158% | $805 |
| (0.01) | $10.62 | 6.27% | 2.82% (c),(e) | 2.81% (c),(e) | (1.32%) (e) | 100% | $1,939 |
| |
| (0.61) | $10.82 | 7.67% | 2.36% (c) | 2.36% (c) | (0.83%) | 158% | $290,666 |
| — | $10.60 | 3.41% | 2.49% (c),(e) | 2.29% (c),(e) | (0.05%) (e) | 100% | $1,049,952 |
Multi-Manager Directional Alternative Strategies Fund | Annual Report 2018
| 37 |
Notes to Financial Statements
April 30, 2018
Note 1. Organization
Multi-Manager Directional Alternative Strategies Fund (the Fund), a series of Columbia Funds Series Trust I (the Trust), is a non-diversified fund. The Trust is registered under the Investment Company Act of 1940, as amended (the 1940 Act), as an open-end management investment company organized as a Massachusetts business trust.
Fund shares
The Trust may issue an unlimited number of shares (without par value). The Fund is offered only through certain wrap fee programs sponsored and/or managed by Ameriprise Financial, Inc. (Ameriprise Financial) or its affiliates. The Fund offers each of the share classes identified below.
Class A shares are not subject to any front-end sales charge or contingent deferred sales charge.
Institutional Class shares are not subject to any front-end sales charge or contingent deferred sales charge. Prior to November 1, 2017, Institutional Class shares were known as Class Z shares.
Note 2. Summary of significant accounting policies
Basis of preparation
The Fund is an investment company that applies the accounting and reporting guidance in the Financial Accounting Standards Board (FASB) Accounting Standards Codification Topic 946, Financial Services - Investment Companies (ASC 946). The financial statements are prepared in accordance with U.S. generally accepted accounting principles (GAAP), which requires management to make certain estimates and assumptions that affect the reported amounts of assets and liabilities, the disclosure of contingent assets and liabilities at the date of the financial statements and the reported amounts of income and expenses during the reporting period. Actual results could differ from those estimates.
The following is a summary of significant accounting policies followed by the Fund in the preparation of its financial statements.
Security valuation
All equity securities are valued at the close of business of the New York Stock Exchange. Equity securities are valued at the last quoted sales price on the principal exchange or market on which they trade, except for securities traded on the NASDAQ Stock Market, which are valued at the NASDAQ official close price. Unlisted securities or listed securities for which there were no sales during the day are valued at the mean of the latest quoted bid and ask prices on such exchanges or markets.
Foreign equity securities are valued based on the closing price on the foreign exchange in which such securities are primarily traded. If any foreign equity security closing prices are not readily available, the securities are valued at the mean of the latest quoted bid and ask prices on such exchanges or markets. Foreign currency exchange rates are generally determined at 4:00 p.m. Eastern (U.S.) time. Many securities markets and exchanges outside the U.S. close prior to the close of the New York Stock Exchange; therefore, the closing prices for securities in such markets or on such exchanges may not fully reflect events that occur after such close but before the close of the New York Stock Exchange. In those situations, foreign securities will be fair valued pursuant to a policy adopted by the Board of Trustees, including, if available, utilizing a third party pricing service to determine these fair values. The third party pricing service takes into account multiple factors, including, but not limited to, movements in the U.S. securities markets, certain depositary receipts, futures contracts and foreign exchange rates that have occurred subsequent to the close of the foreign exchange or market, to determine a good faith estimate that reasonably reflects the current market conditions as of the close of the New York Stock Exchange. The fair value of a security is likely to be different from the quoted or published price, if available.
Investments in open-end investment companies, including money market funds, are valued at their latest net asset value.
Forward foreign currency exchange contracts are marked-to-market based upon foreign currency exchange rates provided by a pricing service.
| 38 | Multi-Manager Directional Alternative Strategies Fund | Annual Report 2018 |
Notes to Financial Statements (continued)
April 30, 2018
Futures and options on futures contracts are valued based upon the settlement price at the close of regular trading on their principal exchanges or, in the absence of transactions, at the mean of the latest quoted bid and ask prices.
Swap transactions are valued through an independent pricing service or broker, or if neither is available, through an internal model based upon observable inputs.
Investments for which market quotations are not readily available, or that have quotations which management believes are not reflective of market value or reliable, are valued at fair value as determined in good faith under procedures approved by and under the general supervision of the Board of Trustees. If a security or class of securities (such as foreign securities) is valued at fair value, such value is likely to be different from the quoted or published price for the security.
The determination of fair value often requires significant judgment. To determine fair value, management may use assumptions including but not limited to future cash flows and estimated risk premiums. Multiple inputs from various sources may be used to determine fair value.
GAAP requires disclosure regarding the inputs and valuation techniques used to measure fair value and any changes in valuation inputs or techniques. In addition, investments shall be disclosed by major category. This information is disclosed following the Fund’s Portfolio of Investments.
Foreign currency transactions and translations
The values of all assets and liabilities denominated in foreign currencies are generally translated into U.S. dollars at exchange rates determined at the close of regular trading on the New York Stock Exchange. Net realized and unrealized gains (losses) on foreign currency transactions and translations include gains (losses) arising from the fluctuation in exchange rates between trade and settlement dates on securities transactions, gains (losses) arising from the disposition of foreign currency and currency gains (losses) between the accrual and payment dates on dividends, interest income and foreign withholding taxes.
For financial statement purposes, the Fund does not distinguish that portion of gains (losses) on investments which is due to changes in foreign exchange rates from that which is due to changes in market prices of the investments. Such fluctuations are included with the net realized and unrealized gains (losses) on investments in the Statement of Operations.
Derivative instruments
The Fund invests in certain derivative instruments, as detailed below, to meet its investment objectives. Derivatives are instruments whose values depend on, or are derived from, in whole or in part, the value of one or more securities, currencies, commodities, indices, or other assets or instruments. Derivatives may be used to increase investment flexibility (including to maintain cash reserves while maintaining desired exposure to certain assets), for risk management (hedging) purposes, to facilitate trading, to reduce transaction costs and to pursue higher investment returns. The Fund may also use derivative instruments to mitigate certain investment risks, such as foreign currency exchange rate risk, interest rate risk and credit risk. Derivatives may involve various risks, including the potential inability of the counterparty to fulfill its obligations under the terms of the contract, the potential for an illiquid secondary market (making it difficult for the Fund to sell or terminate, including at favorable prices) and the potential for market movements which may expose the Fund to gains or losses in excess of the amount shown in the Statement of Assets and Liabilities. The notional amounts of derivative instruments, if applicable, are not recorded in the financial statements.
A derivative instrument may suffer a marked-to-market loss if the value of the contract decreases due to an unfavorable change in the market rates or values of the underlying instrument. Losses can also occur if the counterparty does not perform its obligations under the contract. The Fund’s risk of loss from counterparty credit risk on over-the-counter derivatives is generally limited to the aggregate unrealized gain netted against any collateral held by the Fund and the amount of any variation margin held by the counterparty, plus any replacement costs or related amounts. With exchange-traded or centrally cleared derivatives, there is reduced counterparty credit risk to the Fund since the clearinghouse or central counterparty (CCP) provides some protection in the case of clearing member default. The clearinghouse or CCP stands between the buyer and the seller of the contract; therefore, additional counterparty credit risk is failure of the clearinghouse or CCP. However, credit risk still exists in exchange-traded or centrally cleared derivatives with respect to initial and variation margin that is held in a broker’s customer account. While brokers are required to segregate customer margin from their own assets, in the event
Multi-Manager Directional Alternative Strategies Fund | Annual Report 2018
| 39 |
Notes to Financial Statements (continued)
April 30, 2018
that a broker becomes insolvent or goes into bankruptcy and at that time there is a shortfall in the aggregate amount of margin held by the broker for all its clients, U.S. bankruptcy laws will typically allocate that shortfall on a pro-rata basis across all the broker’s customers (including the Fund), potentially resulting in losses to the Fund.
In order to better define its contractual rights and to secure rights that will help the Fund mitigate its counterparty risk, the Fund may enter into an International Swaps and Derivatives Association, Inc. Master Agreement (ISDA Master Agreement) or similar agreement with its derivatives contract counterparties. An ISDA Master Agreement is an agreement between the Fund and a counterparty that governs over-the-counter derivatives and typically contains, among other things, collateral posting terms and netting provisions in the event of a default and/or termination event. Under an ISDA Master Agreement, the Fund may, under certain circumstances, offset with the counterparty certain derivative instrument’s payables and/or receivables with collateral held and/or posted and create one single net payment. The provisions of the ISDA Master Agreement typically permit a single net payment in the event of default (close-out netting), including the bankruptcy or insolvency of the counterparty. Note, however, that bankruptcy or insolvency laws of a particular jurisdiction may impose restrictions on or prohibitions against the right of offset or netting in bankruptcy, insolvency or other events.
Collateral (margin) requirements differ by type of derivative. Margin requirements are established by the clearinghouse or CCP for exchange-traded and centrally cleared derivatives. Brokers can ask for margin in excess of the minimum in certain circumstances. Collateral terms are contract specific for over-the-counter derivatives. For over-the-counter derivatives traded under an ISDA Master Agreement, the collateral requirements are typically calculated by netting the marked-to-market amount for each transaction under such agreement and comparing that amount to the value of any variation margin currently pledged by the Fund and/or the counterparty. Generally, the amount of collateral due from or to a party has to exceed a minimum transfer amount threshold (e.g., $250,000) before a transfer has to be made. To the extent amounts due to the Fund from its counterparties are not fully collateralized, contractually or otherwise, the Fund bears the risk of loss from counterparty nonperformance. The Fund may also pay interest expense on cash collateral received from the broker. Any interest expense paid by the Fund is shown on the Statement of Operations. The Fund attempts to mitigate counterparty risk by only entering into agreements with counterparties that it believes have the financial resources to honor their obligations and by monitoring the financial stability of those counterparties.
Certain ISDA Master Agreements allow counterparties of over-the-counter derivatives transactions to terminate derivatives contracts prior to maturity in the event the Fund’s net asset value declines by a stated percentage over a specified time period or if the Fund fails to meet certain terms of the ISDA Master Agreement, which would cause the Fund to accelerate payment of any net liability owed to the counterparty. The Fund also has termination rights if the counterparty fails to meet certain terms of the ISDA Master Agreement. In addition to considering counterparty credit risk, the Fund would consider terminating the derivatives contracts based on whether termination would result in a net liability owed from the counterparty.
For financial reporting purposes, the Fund does not offset derivative assets and derivative liabilities that are subject to netting arrangements in the Statement of Assets and Liabilities.
Forward foreign currency exchange contracts
Forward foreign currency exchange contracts are over-the-counter agreements between two parties to buy and sell a currency at a set price on a future date. The Fund utilized forward foreign currency exchange contracts to hedge the currency exposure associated with some or all of the Fund’s securities, to shift U.S. dollar exposure to achieve a representative weighted mix of major currencies in its benchmark and to recover an underweight country exposure in its portfolio. These instruments may be used for other purposes in future periods.
The values of forward foreign currency exchange contracts fluctuate daily with changes in foreign currency exchange rates. Changes in the value of these contracts are recorded as unrealized appreciation or depreciation until the contract is exercised or has expired. The Fund will realize a gain or loss when the forward foreign currency exchange contract is closed or expires.
The use of forward foreign currency exchange contracts does not eliminate fluctuations in the prices of the Fund’s portfolio securities. The risks of forward foreign currency exchange contracts include movement in the values of the foreign currencies relative to the U.S. dollar (or other foreign currencies) and the possibility that counterparties will not complete their contractual obligations, which may be in excess of the amount reflected, if any, in the Statement of Assets and Liabilities.
| 40 | Multi-Manager Directional Alternative Strategies Fund | Annual Report 2018 |
Notes to Financial Statements (continued)
April 30, 2018
Futures contracts
Futures contracts are exchange-traded and represent commitments for the future purchase or sale of an asset at a specified price on a specified date. The Fund bought and sold futures contracts to manage exposure to the securities market. These instruments may be used for other purposes in future periods. Upon entering into futures contracts, the Fund bears risks that it may not achieve the anticipated benefits of the futures contracts and may realize a loss. Additional risks include counterparty credit risk, the possibility of an illiquid market, and that a change in the value of the contract or option may not correlate with changes in the value of the underlying asset.
Upon entering into a futures contract, the Fund deposits cash or securities with the broker, known as a futures commission merchant (FCM), in an amount sufficient to meet the initial margin requirement. The initial margin deposit must be maintained at an established level over the life of the contract. Cash deposited as initial margin is recorded in the Statement of Assets and Liabilities as margin deposits. Securities deposited as initial margin are designated in the Portfolio of Investments. Subsequent payments (variation margin) are made or received by the Fund each day. The variation margin payments are equal to the daily change in the contract value and are recorded as variation margin receivable or payable and are offset in unrealized gains or losses. The Fund recognizes a realized gain or loss when the contract is closed or expires. Futures contracts involve, to varying degrees, risk of loss in excess of the variation margin disclosed in the Statement of Assets and Liabilities.
Swap contracts
Swap contracts are negotiated in the over-the-counter market and may be entered into as a bilateral contract or centrally cleared (centrally cleared swap contract). In a centrally cleared swap contract, immediately following execution of the swap contract with a broker, the swap contract is novated to a central counterparty (the CCP) and the CCP becomes the Fund’s counterparty to the centrally cleared swap contract. The Fund is required to deposit initial margin with the futures commission merchant (FCM), which pledges it through to the CCP in the form of cash or securities in an amount that varies depending on the size and risk profile of the particular swap contract. Securities deposited as initial margin are designated in the Portfolio of Investments and cash deposited is recorded in the Statement of Assets and Liabilities as margin deposits. Unlike a bilateral swap contract, for centrally cleared swap contracts, the Fund has minimal credit exposure to the FCM because the CCP stands between the Fund and the relevant buyer/seller on the other side of the contract. Swap contracts are marked-to-market daily and changes in value are recorded as unrealized appreciation (depreciation). The daily change in valuation of centrally cleared swap contracts, if any, is recorded as a receivable or payable for variation margin in the Statement of Assets and Liabilities.
Entering into these contracts involves, to varying degrees, elements of interest, liquidity and counterparty credit risk in excess of the amounts recognized in the Statement of Assets and Liabilities. Such risks involve the possibility that there may be unfavorable changes in interest rates, market conditions or other conditions, that it may be difficult to initiate a swap transaction or liquidate a position at an advantageous time or price which may result in significant losses, and that the FCM or CCP may not fulfill its obligation under the contract.
Total return basket swap contracts
The Fund entered into total return basket swap transactions. These instruments allow the Fund to manage exposure to a custom basket of securities and foreign markets (both long and short exposures) without owning or taking physical custody of such securities. Under the terms of the contract, payments made by the Fund or the counterparty are based on the total return of the reference assets within the basket in return for a specified interest rate. The contract allows the Investment Manager of the Fund to alter the composition of the custom basket by trading in and out of the notional reference security positions at its discretion.
The total return basket swap is valued daily, and the change in value is recorded as unrealized appreciation (depreciation). The swap resets monthly at which time the Fund settles in cash with the counterparty. Payments received (or made) by the Fund are recorded as realized gains (losses). Total return basket swaps are subject to the risk associated with the investment in the reference securities within the basket. The risk in the case of short swaps transactions is unlimited based on the potential for unlimited increases in the market value of the reference securities in the basket. The risk may be offset if the Fund holds any of the reference securities. The risk in the case of long swap transactions is limited to the current notional amount of the swap.
Multi-Manager Directional Alternative Strategies Fund | Annual Report 2018
| 41 |
Notes to Financial Statements (continued)
April 30, 2018
Total return swap contracts
The Fund entered into total return swap contracts to manage long or short exposure to the total return on a specified reference security in return for periodic payments based on a fixed or variable interest rate. These instruments may be used for other purposes in future periods. Total return swap contracts may be used to obtain exposure to an underlying reference security, instrument, or other asset or index or market without owning, taking physical custody of, or short selling any such security, instrument or asset in a market.
Total return swap contracts are valued daily, and the change in value is recorded as unrealized appreciation (depreciation) until the termination of the swap, at which time the Fund will realize a gain (loss). Periodic payments received (or made) by the Fund over the term of the contract are recorded as realized gains (losses). Total return swap contracts are subject to the risk associated with the investment in the underlying reference security, instrument or asset. The risk in the case of short total return swap contracts is unlimited based on the potential for unlimited increases in the market value of the underlying reference security, instrument or asset. This risk may be offset if the Fund holds any of the underlying reference security, instrument or asset. The risk in the case of long total return swap contracts is limited to the current notional amount of the total return swap contract.
Effects of derivative transactions in the financial statements
The following tables are intended to provide additional information about the effect of derivatives on the financial statements of the Fund, including: the fair value of derivatives by risk category and the location of those fair values in the Statement of Assets and Liabilities; and the impact of derivative transactions over the period in the Statement of Operations, including realized and unrealized gains (losses). The derivative instrument schedules following the Portfolio of Investments present additional information regarding derivative instruments outstanding at the end of the period, if any.
The following table is a summary of the fair value of derivative instruments (not considered to be hedging instruments for accounting disclosure purposes) at April 30, 2018:
| | Asset derivatives | |
Risk exposure
category | Statement
of assets and liabilities
location | Fair value ($) |
| Equity risk | Net assets — unrealized appreciation on futures contracts | 514,497* |
| Equity risk | Net assets — unrealized appreciation on swap contracts | 205,897* |
| Foreign exchange risk | Unrealized appreciation on forward foreign currency exchange contracts | 462,301 |
| Total | | 1,182,695 |
| | Liability derivatives | |
Risk exposure
category | Statement
of assets and liabilities
location | Fair value ($) |
| Equity risk | Net assets — unrealized depreciation on futures contracts | 1,082,601* |
| Equity risk | Net assets — unrealized depreciation on swap contracts | 2,329,236* |
| Foreign exchange risk | Unrealized depreciation on forward foreign currency exchange contracts | 790,705 |
| Total | | 4,202,542 |
| * | Includes cumulative appreciation (depreciation) as reported in the tables following the Portfolio of Investments. Only the current day’s variation margin is reported in receivables or payables in the Statement of Assets and Liabilities. |
| 42 | Multi-Manager Directional Alternative Strategies Fund | Annual Report 2018 |
Notes to Financial Statements (continued)
April 30, 2018
The following table indicates the effect of derivative instruments (not considered to be hedging instruments for accounting disclosure purposes) in the Statement of Operations for the year ended April 30, 2018:
| Amount of realized gain (loss) on derivatives recognized in income |
| Risk exposure category | Forward
foreign
currency
exchange
contracts
($) | Futures
contracts
($) | Swap
contracts
($) | Total
($) |
| Equity risk | — | 19,021,989 | 15,135,667 | 34,157,656 |
| Foreign exchange risk | 5,121,824 | — | — | 5,121,824 |
| Total | 5,121,824 | 19,021,989 | 15,135,667 | 39,279,480 |
| |
| Change in unrealized appreciation (depreciation) on derivatives recognized in income |
| Risk exposure category | Forward
foreign
currency
exchange
contracts
($) | Futures
contracts
($) | Swap
contracts
($) | Total
($) |
| Equity risk | — | (2,130,141) | (5,353,266) | (7,483,407) |
| Foreign exchange risk | (1,154,003) | — | — | (1,154,003) |
| Total | (1,154,003) | (2,130,141) | (5,353,266) | (8,637,410) |
The following table is a summary of the average outstanding volume by derivative instrument for the year ended April 30, 2018:
| Derivative instrument | Average notional
amounts ($) |
| Futures contracts — long | 128,156,950* |
| Futures contracts — short | 419** |
| Derivative instrument | Average unrealized
appreciation ($)* | Average unrealized
depreciation ($)* |
| Forward foreign currency exchange contracts | 1,550,704 | (750,279) |
| Total return swap contracts | 354,901 | (1,520,941) |
| * | Based on the ending quarterly outstanding amounts for the year ended April 30, 2018. |
| ** | Based on the ending daily outstanding amounts for the year ended April 30, 2018. |
Short Sales
The Fund may sell a security it does not own in anticipation of a decline in the fair value of the security. When the Fund sells a security short, it must borrow the security sold short and deliver it to the broker-dealer through which it made the short sale. The Fund is required to maintain a margin account with the broker and to pledge assets to the broker as collateral for the borrowed security. Securities pledged as collateral are designated in the Portfolio of Investments. In addition, cash collateral is recorded as cash collateral held at broker in the Statement of Assets and Liabilities. The Fund can purchase the same security at the current market price and deliver it to the broker to close out the short sale. The Fund is obligated to pay the broker a fee for borrowing the security. The fee is included in "Dividends and interest on securities sold short" in the Statement of Operations and a short position is reported as a liability at fair value in the Statement of Assets and Liabilities. The Fund must also pay the broker for any dividends accrued (recognized on ex-date) on the borrowed security. This amount is recorded as an expense in the Statement of Operations. The Fund will record a gain if the security declines in value, and will realize a loss if the security appreciates. Such gain, limited to the price at which the Fund sold the security short, or such loss, potentially unlimited in size because the short position loses value as the market price of the security sold short increases, will be recognized upon the termination of a short sale.
Multi-Manager Directional Alternative Strategies Fund | Annual Report 2018
| 43 |
Notes to Financial Statements (continued)
April 30, 2018
Offsetting of assets and liabilities
The following table presents the Fund’s gross and net amount of assets and liabilities available for offset under netting arrangements as well as any related collateral received or pledged by the Fund as of April 30, 2018:
| | Citi ($) | JPMorgan ($) (a) | JPMorgan ($) (a) | Macquarie ($) | Morgan
Stanley ($) | Morgan
Stanley
International ($) | Total ($) |
| Assets | | | | | | | |
| Forward foreign currency exchange contracts | 183,750 | - | 278,551 | - | - | - | 462,301 |
| OTC total return swap contracts (b) | - | - | - | 192,904 | | - | 192,904 |
| OTC total return swap contracts on futures (b) | - | - | - | - | - | 12,993 | 12,993 |
| Total assets | 183,750 | - | 278,551 | 192,904 | - | 12,993 | 668,198 |
| Liabilities | | | | | | | |
| Forward foreign currency exchange contracts | 316,274 | - | 474,431 | - | - | - | 790,705 |
| OTC total return swap contracts (b) | - | - | 223,078 | 103,339 | - | 2,002,819 | 2,329,236 |
| Securities loaned | - | 29,677,122 | - | - | 59,240,946 | - | 88,918,068 |
| Total liabilities | 316,274 | 29,677,122 | 697,509 | 103,339 | 59,240,946 | 2,002,819 | 92,038,009 |
| Total financial and derivative net assets | (132,524) | (29,677,122) | (418,958) | 89,565 | (59,240,946) | (1,989,826) | (91,369,811) |
| Total collateral received (pledged) (c) | (132,524) | (29,677,122) | (418,958) | - | (59,240,946) | (1,989,826) | (91,459,376) |
| Net amount (d) | - | - | - | 89,565 | - | - | 89,565 |
| (a) | Exposure can only be netted across transactions governed under the same master agreement with the same legal entity. |
| (b) | Over-the-Counter (OTC) swap contracts are presented at market value plus periodic payments receivable (payable), which is comprised of unrealized appreciation, unrealized depreciation, upfront payments and upfront receipts. |
| (c) | In some instances, the actual collateral received and/or pledged may be more than the amount shown due to overcollateralization. |
| (d) | Represents the net amount due from/(to) counterparties in the event of default. |
Security transactions
Security transactions are accounted for on the trade date. Cost is determined and gains (losses) are based upon the specific identification method for both financial statement and federal income tax purposes.
Income recognition
Corporate actions and dividend income are generally recorded net of any non-reclaimable tax withholdings, on the ex-dividend date or upon receipt of ex-dividend notification in the case of certain foreign securities.
The Fund may receive distributions from holdings in equity securities, business development companies (BDCs), exchange-traded funds (ETFs), limited partnerships (LPs), other regulated investment companies (RICs), and real estate investment trusts (REITs), which report information on the tax character of their distributions annually. These distributions are allocated to dividend income, capital gain and return of capital based on actual information reported. Return of capital is recorded as a reduction of the cost basis of securities held. If the Fund no longer owns the applicable securities, return of capital is recorded as a realized gain. With respect to REITs, to the extent actual information has not yet been reported, estimates for return of capital are made by the Fund’s management. Management’s estimates are subsequently adjusted when the actual character of the distributions is disclosed by the REITs, which could result in a proportionate change in return of capital to shareholders.
Awards from class action litigation are recorded as a reduction of cost basis if the Fund still owns the applicable securities on the payment date. If the Fund no longer owns the applicable securities, the proceeds are recorded as realized gains.
| 44 | Multi-Manager Directional Alternative Strategies Fund | Annual Report 2018 |
Notes to Financial Statements (continued)
April 30, 2018
Expenses
General expenses of the Trust are allocated to the Fund and other funds of the Trust based upon relative net assets or other expense allocation methodologies determined by the nature of the expense. Expenses directly attributable to the Fund are charged to the Fund. Expenses directly attributable to a specific class of shares are charged to that share class.
Determination of class net asset value
All income, expenses (other than class-specific expenses, which are charged to that share class, as shown in the Statement of Operations) and realized and unrealized gains (losses) are allocated to each class of the Fund on a daily basis, based on the relative net assets of each class, for purposes of determining the net asset value of each class.
Federal income tax status
The Fund intends to qualify each year as a regulated investment company under Subchapter M of the Internal Revenue Code, as amended, and will distribute substantially all of its investment company taxable income and net capital gain, if any, for its tax year, and as such will not be subject to federal income taxes. In addition, the Fund intends to distribute in each calendar year substantially all of its ordinary income, capital gain net income and certain other amounts, if any, such that the Fund should not be subject to federal excise tax. Therefore, no federal income or excise tax provision is recorded.
Foreign taxes
The Fund may be subject to foreign taxes on income, gains on investments or currency repatriation, a portion of which may be recoverable. The Fund will accrue such taxes and recoveries, as applicable, based upon its current interpretation of tax rules and regulations that exist in the markets in which it invests.
Realized gains in certain countries may be subject to foreign taxes at the Fund level, based on statutory rates. The Fund accrues for such foreign taxes on realized and unrealized gains at the appropriate rate for each jurisdiction, as applicable. The amount, if any, is disclosed as a liability on the Statement of Assets and Liabilities.
Distributions to shareholders
Distributions from net investment income, if any, are declared and paid annually. Net realized capital gains, if any, are distributed at least annually. Income distributions and capital gain distributions are determined in accordance with federal income tax regulations, which may differ from GAAP.
Guarantees and indemnifications
Under the Trust’s organizational documents and, in some cases, by contract, its officers and trustees are indemnified against certain liabilities arising out of the performance of their duties to the Trust or its funds. In addition, certain of the Fund’s contracts with its service providers contain general indemnification clauses. The Fund’s maximum exposure under these arrangements is unknown since the amount of any future claims that may be made against the Fund cannot be determined, and the Fund has no historical basis for predicting the likelihood of any such claims.
Recent accounting pronouncement
Accounting Standards Update 2017-08 Premium Amortization on Purchased Callable Debt Securities
In March 2017, the Financial Accounting Standards Board issued Accounting Standards Update (ASU) No. 2017-08 Premium Amortization on Purchased Callable Debt Securities. ASU No. 2017-08 updates the accounting standards to shorten the amortization period for certain purchased callable debt securities, held at a premium, to be amortized to the earliest call date. The update applies to securities with explicit, noncontingent call features that are callable at fixed prices and on preset dates. The standard is effective for annual periods beginning after December 15, 2018 and interim periods within those fiscal years. At this time, management is evaluating the implication of this guidance and the impact it will have on the financial statement amounts and footnote disclosures, if any.
Multi-Manager Directional Alternative Strategies Fund | Annual Report 2018
| 45 |
Notes to Financial Statements (continued)
April 30, 2018
Note 3. Fees and other transactions with affiliates
Management services fees
The Fund has entered into a Management Agreement with Columbia Management Investment Advisers, LLC (the Investment Manager), a wholly-owned subsidiary of Ameriprise Financial, Inc. (Ameriprise Financial). Under the Management Agreement, the Investment Manager provides the Fund with investment research and advice, as well as administrative and accounting services. The Investment Manager is responsible for the ultimate oversight of investments made by the Fund. The Fund’s subadvisers (see Subadvisory agreement below) have the primary responsibility for the day-to-day portfolio management of their portion of the Fund. The management services fee is equal to 1.60% of the Fund’s daily net assets.
Subadvisory agreement
The Investment Manager has entered into Subadvisory Agreements with Boston Partners Global Investors, Inc, AQR Capital Management, LLC and Analytic Investors, LLC, each of which subadvises a portion of the assets of the Fund. New investments in the Fund, net of any redemptions, are allocated in accordance with the Investment Manager’s determination, subject to the oversight of the Fund’s Board of Trustees. Each subadviser’s proportionate share of investments in the Fund will vary due to market fluctuations. The Investment Manager compensates each subadviser to manage the investment of the Fund’s assets.
Compensation of board members
Members of the Board of Trustees who are not officers or employees of the Investment Manager or Ameriprise Financial are compensated for their services to the Fund as disclosed in the Statement of Operations. These members of the Board of Trustees may participate in a Deferred Compensation Plan (the Plan) which may be terminated at any time. Obligations of the Plan will be paid solely out of the Fund’s assets, and all amounts payable under the Plan constitute a general unsecured obligation of the Fund.
Compensation of Chief Compliance Officer
The Board of Trustees has appointed a Chief Compliance Officer to the Fund in accordance with federal securities regulations. As disclosed in the Statement of Operations, a portion of the Chief Compliance Officer’s total compensation is allocated to the Fund, along with other allocations to affiliated funds governed by the Board of Trustees, based on relative net assets.
Transfer agency fees
Under a Transfer and Dividend Disbursing Agent Agreement, Columbia Management Investment Services Corp. (the Transfer Agent), an affiliate of the Investment Manager and a wholly-owned subsidiary of Ameriprise Financial, is responsible for providing transfer agency services to the Fund. The Transfer Agent has contracted with DST Asset Manager Solutions, Inc. (DST) to serve as sub-transfer agent. The Transfer Agent pays the fees of DST for services as sub-transfer agent and DST is not entitled to reimbursement for such fees from the Fund (with the exception of out-of-pocket fees).
The Fund pays the Transfer Agent a monthly transfer agency fee based on the number or the average value of accounts, depending on the type of account. In addition, the Fund pays the Transfer Agent a fee for shareholder services based on the number of accounts or on a percentage of the average aggregate value of the Fund’s shares maintained in omnibus accounts up to the lesser of the amount charged by the financial intermediary or a cap established by the Board of Trustees from time to time.
The Transfer Agent also receives compensation from the Fund for various shareholder services and reimbursements for certain out-of-pocket fees.
| 46 | Multi-Manager Directional Alternative Strategies Fund | Annual Report 2018 |
Notes to Financial Statements (continued)
April 30, 2018
For the year ended April 30, 2018, the Fund’s effective transfer agency fee rates as a percentage of average daily net assets of each class were as follows:
| | Effective rate (%) |
| Class A | 0.29 |
| Institutional Class | 0.29 |
Distribution and service fees
The Fund has entered into an agreement with Columbia Management Investment Distributors, Inc. (the Distributor), an affiliate of the Investment Manager and a wholly-owned subsidiary of Ameriprise Financial, for distribution and shareholder services. The Board of Trustees has approved, and the Fund has adopted, distribution and shareholder service plans (the Plans) applicable to certain share classes, which set the distribution and service fees for the Fund. These fees are calculated daily and are intended to compensate the Distributor and/or eligible selling and/or servicing agents for selling shares of the Fund and providing services to investors.
The Fund may pay distribution fee of up to 0.25% of the Fund’s average daily net assets attributable to Class A shares and a service fee of up to 0.25% of the Fund’s average daily net assets attributable to Class A shares, provided that the aggregate fee shall not exceed 0.25% of the Fund’s average daily net assets attributable to Class A shares.
Expenses waived/reimbursed by the Investment Manager and its affiliates
The Investment Manager and certain of its affiliates have contractually agreed to waive fees and/or reimburse expenses (excluding certain fees and expenses described below) for the period(s) disclosed below, unless sooner terminated at the sole discretion of the Board of Trustees, so that the Fund’s net operating expenses, after giving effect to fees waived/expenses reimbursed and any balance credits and/or overdraft charges from the Fund’s custodian, do not exceed the following annual rate(s) as a percentage of the class’ average daily net assets:
| | September 1, 2017
through
August 31, 2018 | Prior to
September 1, 2017 |
| Class A | 2.20% | 2.29% |
| Institutional Class | 1.95 | 2.04 |
Under the agreement governing these fee waivers and/or expense reimbursement arrangements, the following fees and expenses are excluded from the waiver/reimbursement commitment, and therefore will be paid by the Fund, if applicable: taxes (including foreign transaction taxes), expenses associated with investments in affiliated and non-affiliated pooled investment vehicles (including mutual funds and exchange-traded funds), transaction costs and brokerage commissions, costs related to any securities lending program, dividend expenses associated with securities sold short, inverse floater program fees and expenses, transaction charges and interest on borrowed money, interest, infrequent and/or unusual expenses and any other expenses the exclusion of which is specifically approved by the Board of Trustees. This agreement may be modified or amended only with approval from the Investment Manager, certain of its affiliates and the Fund. Any fees waived and/or expenses reimbursed under the expense reimbursement arrangements described above are not recoverable by the Investment Manager or its affiliates in future periods.
Note 4. Federal tax information
The timing and character of income and capital gain distributions are determined in accordance with income tax regulations, which may differ from GAAP because of temporary or permanent book to tax differences.
At April 30, 2018, these differences were primarily due to differing treatment for deferral/reversal of wash sale losses, passive foreign investment company (PFIC) holdings, re-characterization of distributions for investments, derivative investments, tax straddles, swap investments, post-October capital losses, trustees’ deferred compensation, foreign currency transactions, non-deductible expenses, investments in partnerships, swap reclassifications and constructive sales
Multi-Manager Directional Alternative Strategies Fund | Annual Report 2018
| 47 |
Notes to Financial Statements (continued)
April 30, 2018
of appreciated financial positions. To the extent these differences were permanent, reclassifications were made among the components of the Fund’s net assets in the Statement of Assets and Liabilities. Temporary differences do not require reclassifications.
In the Statement of Assets and Liabilities the following reclassifications were made:
Undistributed net
investment
income ($) | Accumulated
net realized
gain ($) | Paid in
capital ($) |
| 23,541,785 | (23,540,673) | (1,112) |
Net investment income (loss) and net realized gains (losses), as disclosed in the Statement of Operations, and net assets were not affected by this reclassification.
The tax character of distributions paid during the years indicated was as follows:
| Year Ended April 30, 2018 | Year Ended April 30, 2017 |
Ordinary
income ($) | Long-term
capital gains ($) | Total ($) | Ordinary
income ($) | Long-term
capital gains ($) | Total ($) |
| 44,442,224 | 14,067,321 | 58,509,545 | 652,003 | — | 652,003 |
Short-term capital gain distributions, if any, are considered ordinary income distributions for tax purposes.
At April 30, 2018, the components of distributable earnings on a tax basis were as follows:
Undistributed
ordinary income ($) | Undistributed
long-term
capital gains ($) | Capital loss
carryforwards ($) | Net unrealized
appreciation ($) |
| 1,499,848 | 78,377,849 | — | 24,583,385 |
At April 30, 2018, the cost of all investments for federal income tax purposes along with the aggregate gross unrealized appreciation and depreciation based on that cost was:
Federal
tax cost ($) | Gross unrealized
appreciation ($) | Gross unrealized
(depreciation) ($) | Net unrealized
appreciation ($) |
| 147,677,041 | 39,951,077 | (15,367,692) | 24,583,385 |
Tax cost of investments and unrealized appreciation/(depreciation) may also include timing differences that do not constitute adjustments to tax basis.
Under current tax rules, regulated investment companies can elect to treat certain late-year ordinary losses incurred and post-October capital losses (capital losses realized after October 31) as arising on the first day of the following taxable year. As of April 30, 2018, the Fund will elect to treat the following late-year ordinary losses and post-October capital losses as arising on May 1, 2018.
Late year
ordinary losses ($) | Post-October
capital losses ($) |
| — | 2,680,651 |
Management of the Fund has concluded that there are no significant uncertain tax positions in the Fund that would require recognition in the financial statements. However, management’s conclusion may be subject to review and adjustment at a later date based on factors including, but not limited to, new tax laws, regulations, and administrative interpretations (including relevant court decisions). Generally, the Fund’s federal tax returns for the prior three fiscal years remain subject to examination by the Internal Revenue Service.
| 48 | Multi-Manager Directional Alternative Strategies Fund | Annual Report 2018 |
Notes to Financial Statements (continued)
April 30, 2018
Note 5. Portfolio information
The cost of purchases and proceeds from sales of securities, excluding short-term investments and derivatives, if any, aggregated to $1,496,069,029 and $1,872,394,047, respectively, for the year ended April 30, 2018. The amount of purchase and sale activity impacts the portfolio turnover rate reported in the Financial Highlights.
Note 6. Affiliated money market fund
The Fund invests in Columbia Short-Term Cash Fund, an affiliated money market fund established for the exclusive use by the Fund and other affiliated funds (the Affiliated MMF). The income earned by the Fund from such investments is included as Dividends - affiliated issuers in the Statement of Operations. As an investing fund, the Fund indirectly bears its proportionate share of the expenses of the Affiliated MMF. The Affiliated MMF prices its shares with a floating net asset value. In addition, the Board of Trustees of the Affiliated MMF may impose a fee on redemptions (sometimes referred to as a liquidity fee) or temporarily suspend redemptions (sometimes referred to as imposing a redemption gate) in the event its liquidity falls below regulatory limits.
Note 7. Line of credit
The Fund has access to a revolving credit facility with a syndicate of banks led by Citibank, N.A., HSBC Bank USA, N.A. and JPMorgan Chase Bank, N.A. whereby the Fund may borrow for the temporary funding of shareholder redemptions or for other temporary or emergency purposes. The credit facility, which is a collective agreement between the Fund and certain other funds managed by the Investment Manager, severally and not jointly, permits collective borrowings up to $1 billion. Interest is charged to each participating fund based on its borrowings at a rate equal to the higher of (i) the overnight federal funds rate plus 1.00% or (ii) the one-month LIBOR rate plus 1.00%. Each borrowing under the credit facility matures no later than 60 days after the date of borrowing. The Fund also pays a commitment fee equal to its pro rata share of the amount of the credit facility at a rate of 0.15% per annum. The commitment fee is included in other expenses in the Statement of Operations.
The Fund had no borrowings during the year ended April 30, 2018.
Note 8. Significant risks
Derivatives risk
Losses involving derivative instruments may be substantial, because a relatively small price movement in the underlying security(ies), commodity, currency or index or other instrument or asset may result in a substantial loss for the Fund. In addition to the potential for increased losses, the use of derivative instruments may lead to increased volatility within the Fund. Derivatives will typically increase the Fund’s exposure to principal risks to which it is otherwise exposed, and may expose the Fund to additional risks, including correlation risk, counterparty risk, hedging risk, leverage risk and liquidity risk.
Foreign securities and emerging market countries risk
Investing in foreign securities may include certain risks and considerations not typically associated with investing in U.S. securities, such as fluctuating currency values and changing local and regional economic, political and social conditions, which may result in greater market volatility. In addition, certain foreign securities may not be as liquid as U.S. securities. Investing in emerging markets may accentuate these risks. These countries are also more likely to experience high levels of inflation, deflation or currency devaluation which could hurt their economies and securities markets. To the extent that the Fund concentrates its investment exposure to any one or a few specific countries, the Fund will be particularly susceptible to the various conditions, events or other factors impacting those countries and may, therefore, have a greater risk than that of a fund which is more geographically diversified.
Non-diversification risk
A non-diversified fund is permitted to invest a greater percentage of its total assets in fewer issuers than a diversified fund. The Fund may, therefore, have a greater risk of loss from a few issuers than a similar fund that invests more broadly.
Multi-Manager Directional Alternative Strategies Fund | Annual Report 2018
| 49 |
Notes to Financial Statements (continued)
April 30, 2018
Shareholder concentration risk
At April 30, 2018, affiliated shareholders of record owned 100.0% of the outstanding shares of the Fund in one or more accounts. Subscription and redemption activity by concentrated accounts may have a significant effect on the operations of the Fund. In the case of a large redemption, the Fund may be forced to sell investments at inopportune times, including its liquid positions, which may result in Fund losses and the Fund holding a higher percentage of less liquid positions. Large redemptions could result in decreased economies of scale and increased operating expenses for non-redeeming Fund shareholders.
Short Selling Risk
Leverage occurs when the Fund increases its assets available for investment using borrowings, short sales, derivatives, or similar instruments or techniques. Because short sales involve borrowing securities and then selling them, the Fund’s short sales effectively leverage the Fund’s assets. The Fund’s assets that are used as collateral to secure the Fund’s obligations to return the securities sold short may decrease in value while the short positions are outstanding, which may force the Fund to use its other assets to increase the collateral. Leverage can create an interest expense that may lower the Fund’s overall returns. Leverage presents the opportunity for increased net income and capital gains, but may also exaggerate the Fund’s volatility and risk of loss. There can be no guarantee that a leveraging strategy will be successful.
Note 9. Subsequent events
Management has evaluated the events and transactions that have occurred through the date the financial statements were issued and noted no items requiring adjustment of the financial statements or additional disclosure.
Note 10. Information regarding pending and settled legal proceedings
Ameriprise Financial and certain of its affiliates have historically been involved in a number of legal, arbitration and regulatory proceedings, including routine litigation, class actions, and governmental actions, concerning matters arising in connection with the conduct of their business activities. Ameriprise Financial believes that the Fund is not currently the subject of, and that neither Ameriprise Financial nor any of its affiliates are the subject of, any pending legal, arbitration or regulatory proceedings that are likely to have a material adverse effect on the Fund or the ability of Ameriprise Financial or its affiliates to perform under their contracts with the Fund. Ameriprise Financial is required to make quarterly (10-Q), annual (10-K) and, as necessary, 8-K filings with the Securities and Exchange Commission (SEC) on legal and regulatory matters that relate to Ameriprise Financial and its affiliates. Copies of these filings may be obtained by accessing the SEC website at www.sec.gov.
There can be no assurance that these matters, or the adverse publicity associated with them, will not result in increased Fund redemptions, reduced sale of Fund shares or other adverse consequences to the Fund. Further, although we believe proceedings are not likely to have a material adverse effect on the Fund or the ability of Ameriprise Financial or its affiliates to perform under their contracts with the Fund, these proceedings are subject to uncertainties and, as such, we are unable to estimate the possible loss or range of loss that may result. An adverse outcome in one or more of these proceedings could result in adverse judgments, settlements, fines, penalties or other relief that could have a material adverse effect on the consolidated financial condition or results of operations of Ameriprise Financial.
| 50 | Multi-Manager Directional Alternative Strategies Fund | Annual Report 2018 |
Report of Independent Registered Public Accounting Firm
To the Board of Trustees of Columbia Funds Series Trust I and Shareholders of Multi-Manager Directional Alternative Strategies Fund
Opinion on the Financial Statements
We have audited the accompanying statement of assets and liabilities, including the portfolio of investments, of Multi-Manager Directional Alternative Strategies Fund (one of the funds constituting Columbia Funds Series Trust I, referred to hereafter as the "Fund") as of April 30, 2018, the related statement of operations for the year ended April 30, 2018, the statement of changes in net assets for each of the two years in the period ended April 30, 2018, including the related notes, and the financial highlights for each of periods indicated therein (collectively referred to as the “financial statements”). In our opinion, the financial statements present fairly, in all material respects, the financial position of the Fund as of April 30, 2018, the results of its operations for the year then ended, the changes in its net assets for each of the two years in the period ended April 30, 2018 and the financial highlights for each of the periods indicated therein in conformity with accounting principles generally accepted in the United States of America.
Basis for Opinion
These financial statements are the responsibility of the Fund’s management. Our responsibility is to express an opinion on the Fund’s financial statements based on our audits. We are a public accounting firm registered with the Public Company Accounting Oversight Board (United States) (“PCAOB”) and are required to be independent with respect to the Fund in accordance with the U.S. federal securities laws and the applicable rules and regulations of the Securities and Exchange Commission and the PCAOB.
We conducted our audits of these financial statements in accordance with the standards of the PCAOB. Those standards require that we plan and perform the audit to obtain reasonable assurance about whether the financial statements are free of material misstatement, whether due to error or fraud.
Our audits included performing procedures to assess the risks of material misstatement of the financial statements, whether due to error or fraud, and performing procedures that respond to those risks. Such procedures included examining, on a test basis, evidence regarding the amounts and disclosures in the financial statements. Our audits also included evaluating the accounting principles used and significant estimates made by management, as well as evaluating the overall presentation of the financial statements. Our procedures included confirmation of securities owned as of April 30, 2018 by correspondence with the custodian, transfer agent and brokers; when replies were not received from brokers, we performed other auditing procedures. We believe that our audits provide a reasonable basis for our opinion.
/s/PricewaterhouseCoopers LLP
Minneapolis, Minnesota
June 21, 2018
We have served as auditors of one or more investment companies within the Columbia Funds Complex since 1977.
Multi-Manager Directional Alternative Strategies Fund | Annual Report 2018
| 51 |
Federal Income Tax Information
(Unaudited)
The Fund hereby designates the following tax attributes for the fiscal year ended April 30, 2018. Shareholders will be notified in early 2019 of the amounts for use in preparing 2018 income tax returns.
Qualified
dividend
income | Dividends
received
deduction | Capital
gain
dividend |
| 38.24% | 22.79% | $89,236,863 |
Qualified dividend income. For taxable, non-corporate shareholders, the percentage of ordinary income distributed during the fiscal year that represents qualified dividend income subject to reduced tax rates.
Dividends received deduction. The percentage of ordinary income distributed during the fiscal year that qualifies for the corporate dividends received deduction.
Capital gain dividend. The Fund designates as a capital gain dividend the amount reflected above, or if subsequently determined to be different, the net capital gain of such fiscal period.
| 52 | Multi-Manager Directional Alternative Strategies Fund | Annual Report 2018 |
Shareholders elect the Board that oversees the Fund’s operations. The Board appoints officers who are responsible for day-to-day business decisions based on policies set by the Board. The following table provides basic biographical information about the Fund’s Trustees, including their principal occupations during the past five years, although specific titles for individuals may have varied over the period. The year set forth beneath Length of Service in the table below is the year in which the Trustee was first appointed or elected as Trustee to any Fund currently in the Columbia Funds Complex or a predecessor thereof. Under current Board policy, members serve terms of indefinite duration.
Independent trustees
| Name, address, year of birth | Position held with the Trust and length of service | Principal occupation(s) during the past five years and other relevant professional experience | Number of Funds in the Columbia Fund Complex overseen | Other directorships held by Trustee during the past five years |
Janet Langford Carrig
c/o Columbia Management
Investment Advisers, LLC
225 Franklin Street
Mail Drop BX32 05228
Boston, MA 02110
1957 | Trustee
1996 | Senior Vice President, General Counsel and Corporate Secretary, ConocoPhillips (independent energy company) since September 2007 | 71 | None |
Douglas A. Hacker
c/o Columbia Management
Investment Advisers, LLC
225 Franklin Street
Mail Drop BX32 05228
Boston, MA 02110
1955 | Trustee and Chairman of the Board
1996 | Independent business executive since May 2006; Executive Vice President — Strategy of United Airlines from December 2002 to May 2006; President of UAL Loyalty Services (airline marketing company) from September 2001 to December 2002; Executive Vice President and Chief Financial Officer of United Airlines from July 1999 to September 2001 | 71 | Spartan Nash Company, (food distributor); Nash Finch Company (food distributor) from 2005 to 2013; Aircastle Limited (aircraft leasing); SeaCube Container Leasing Ltd. (container leasing) from 2010 to 2013; and Travelport Worldwide Limited (travel information technology) |
Nancy T. Lukitsh
c/o Columbia Management
Investment Advisers, LLC
225 Franklin Street
Mail Drop BX32 05228
Boston, MA 02110
1956 | Trustee
2011 | Senior Vice President, Partner and Director of Marketing, Wellington Management Company, LLP (investment adviser) from 1997 to 2010; Chair, Wellington Management Portfolios (commingled non-U.S. investment pools) from 2007 to 2010; Director, Wellington Trust Company, NA and other Wellington affiliates from 1997 to 2010 | 71 | None |
David M. Moffett
c/o Columbia Management
Investment Advisers, LLC
225 Franklin Street
Mail Drop BX32 05228
Boston, MA 02110
1952 | Trustee
2011 | Retired. Consultant to Bridgewater and Associates | 71 | Director, CSX Corporation; Genworth Financial, Inc. (financial and insurance products and services); PayPal Holdings Inc. (payment and data processing services); Trustee, University of Oklahoma Foundation; former Director, eBay Inc. (online trading community), 2007-2015; and former Director, CIT Bank, CIT Group Inc. (commercial and consumer finance), 2010-2016 |
John J. Neuhauser
c/o Columbia Management
Investment Advisers, LLC
225 Franklin Street
Mail Drop BX32 05228
Boston, MA 02110
1943 | Trustee
1984 | President, Saint Michael’s College since August 2007; Director or Trustee of several non-profit organizations, including University of Vermont Medical Center; Academic Vice President and Dean of Faculties, Boston College from August 1999 to October 2005; University Professor, Boston College from November 2005 to August 2007 | 71 | Liberty All-Star Equity Fund and Liberty All- Star Growth Fund (closed-end funds) |
Multi-Manager Directional Alternative Strategies Fund | Annual Report 2018
| 53 |
TRUSTEES AND OFFICERS (continued)
Independent trustees (continued)
| Name, address, year of birth | Position held with the Trust and length of service | Principal occupation(s) during the past five years and other relevant professional experience | Number of Funds in the Columbia Fund Complex overseen | Other directorships held by Trustee during the past five years |
Patrick J. Simpson
c/o Columbia Management
Investment Advisers, LLC
225 Franklin Street
Mail Drop BX32 05228
Boston, MA 02110
1944 | Trustee
2000 | Of Counsel, Perkins Coie LLP (law firm) since 2015; Partner, Perkins Coie LLP from 1988 to 2014 | 71 | None |
Anne-Lee Verville
c/o Columbia Management
Investment Advisers, LLC
225 Franklin Street
Mail Drop BX32 05228
Boston, MA 02110
1945 | Trustee
1998 | Retired. General Manager, Global Education Industry from 1994 to 1997, President – Application Systems Division from 1991 to 1994, Chief Financial Officer – US Marketing & Services from 1988 to 1991, and Chief Information Officer from 1987 to 1988, IBM Corporation (computer and technology) | 71 | Enesco Group, Inc. (producer of giftware and home and garden decor products) from 2001 to 2006 |
Consultants to the Independent Trustees*
| Name, address, year of birth | Position held with the Trust and length of service | Principal occupation(s) during the past five years and other relevant professional experience | Number of Funds in the Columbia Funds complex overseen | Other directorships held by Trustee during the past five years |
J. Kevin Connaughton
c/o Columbia
Management Investment
Advisers, LLC,
225 Franklin Street
Mail Drop BX32 05228,
Boston, MA 02110
1964 | Independent Trustee Consultant
2016 | Independent Trustee Consultant, Columbia Funds since March 2016; Adjunct Professor of Finance, Bentley University since November 2017; Managing Director and General Manager of Mutual Fund Products, Columbia Management Investment Advisers, LLC from May 2010 to February 2015; President, Columbia Funds from 2009 to 2015; and senior officer of Columbia Funds and affiliated funds from 2003 to 2015 | 71 | Director, The Autism Project since March 2015; former Trustee, New Century Portfolios, March 2015-December 2017; formerly on Board of Governors, Gateway Healthcare, January 2016 – December 2017 |
Natalie A. Trunow
c/o Columbia
Management Investment
Advisers, LLC,
225 Franklin Street
Mail Drop BX32 05228,
Boston, MA 02110
1967 | Independent Trustee Consultant
2016 | Independent Trustee Consultant, Columbia Funds since September 2016; Chief Executive Officer, Millennial Portfolio Solutions LLC (asset management and consulting services) since January 2016; Director of Investments, Casey Family Programs from April 2016 to September 2016; Senior Vice President and Chief Investment Officer, Calvert Investments from August 2008 to January 2016; Section Head and Portfolio Manager, General Motors Asset Management from June 1997 to August 2008 | 71 | Director, Health Services for Children with Special Needs, Inc.; Director, Guidewell Financial Solutions |
| * | J. Kevin Connaughton was appointed consultant to the Independent Trustees effective March 1, 2016. Natalie A. Trunow was appointed consultant to the Independent Trustees effective September 1, 2016. Shareholders of the Funds are expected to be asked to elect each of Mr. Connaughton and Ms. Trunow as a Trustee at a future shareholder meeting. |
| 54 | Multi-Manager Directional Alternative Strategies Fund | Annual Report 2018 |
TRUSTEES AND OFFICERS (continued)
Interested trustee affiliated with Investment Manager*
| Name, address, year of birth | Position held with the Trust and length of service | Principal occupation(s) during the past five years and other relevant professional experience | Number of Funds in the Columbia Funds Complex overseen | Other directorships held by Trustee during the past five years |
William F. Truscott
c/o Columbia Management
Investment Advisers, LLC
225 Franklin Street
Boston, MA 02110
1960 | Trustee
2012 | Chairman of the Board and President, Columbia Management Investment Advisers, LLC since May 2010 and February 2012, respectively; Chief Executive Officer, Global Asset Management, Ameriprise Financial, Inc. since September 2012 (previously Chief Executive Officer, U.S. Asset Management & President, Annuities, May 2010-September 2012); Director and Chief Executive Officer, Columbia Management Investment Distributors, Inc. since May 2010 and February 2012, respectively; Chairman of the Board and Chief Executive Officer, RiverSource Distributors, Inc. since 2006; Director, Threadneedle Asset Management Holdings, SARL since 2014; President and Chief Executive Officer, Ameriprise Certificate Company, 2006-August 2012 | 196 | Chairman of the Board, Columbia Management Investment Advisers, LLC since May 2010; Director, Columbia Management Investment Distributors, Inc. since May 2010; former Director, Ameriprise Certificate Company, 2006 - January 2013 |
| * | Interested person (as defined under the 1940 Act) by reason of being an officer, director, security holder and/or employee of the Investment Manager or Ameriprise Financial. |
The Statement of Additional Information has additional information about the Fund’s Board members and is available, without charge, upon request by calling 800.345.6611, visiting columbiathreadneedleus.com/investor/ or contacting your financial intermediary.
Multi-Manager Directional Alternative Strategies Fund | Annual Report 2018
| 55 |
TRUSTEES AND OFFICERS (continued)
The Board has appointed officers who are responsible for day-to-day business decisions based on policies it has established. The officers serve at the pleasure of the Board. The following table provides basic information about the Officers of the Fund, including principal occupations during the past five years, although their specific titles may have varied over the period. In addition to Mr. Truscott, who is Senior Vice President, the Fund’s other officers are:
Fund officers
Name,
address and
year of birth | Position and year
first appointed to
position for any Fund
in the Columbia
Funds complex or a
predecessor thereof | Principal occupation(s) during past five years |
Christopher O. Petersen
5228 Ameriprise
Financial Center
Minneapolis, MN 55474
Born 1970 | President and Principal Executive Officer (2015) | Vice President and Lead Chief Counsel, Ameriprise Financial, Inc. since January 2015 (previously, Vice President and Chief Counsel, January 2010 - December 2014; officer of Columbia Funds and affiliated funds since 2007. |
Michael G. Clarke
225 Franklin Street
Boston, MA 02110
Born 1969 | Treasurer (2011), Chief Financial Officer (2009) and Chief Accounting Officer (2015) | Vice President — Mutual Fund Administration, Columbia Management Investment Advisers, LLC, since May 2010; senior officer of Columbia Funds and affiliated funds since 2002. |
Paul B. Goucher
100 Park Avenue
New York, NY 10017
Born 1968 | Senior Vice President (2011) and Assistant Secretary (2008) | Senior Vice President and Assistant General Counsel, Ameriprise Financial, Inc. since January 2017 (previously Vice President and Lead Chief Counsel, November 2008 - January 2017 and January 2013 - January 2017, respectively; and Chief Counsel, January 2010 - January 2013); Vice President, Chief Legal Officer and Assistant Secretary, Columbia Management Investment Advisers, LLC since May 2010. |
Thomas P. McGuire
225 Franklin Street
Boston, MA 02110
Born 1972 | Senior Vice President and Chief Compliance Officer (2012) | Vice President — Asset Management Compliance, Ameriprise Financial, Inc., since May 2010; Chief Compliance Officer, Ameriprise Certificate Company since September 2010. |
Colin Moore
225 Franklin Street
Boston, MA 02110
Born 1958 | Senior Vice President (2010) | Executive Vice President and Global Chief Investment Officer, Ameriprise Financial, Inc., since July 2013; Executive Vice President and Global Chief Investment Officer, Columbia Management Investment Advisers, LLC since July 2013 (previously Director and Global Chief Investment Officer, 2010 - 2013). |
Ryan C. Larrenaga
225 Franklin Street
Boston, MA 02110
Born 1970 | Senior Vice President (2017), Chief Legal Officer (2017) and Secretary (2015) | Vice President and Group Counsel, Ameriprise Financial, Inc. since August 2011; officer of Columbia Funds and affiliated funds since 2005. |
Michael E. DeFao
225 Franklin Street
Boston, MA 02110
Born 1968 | Vice President (2011) and Assistant Secretary (2010) | Vice President and Chief Counsel, Ameriprise Financial, Inc. since May 2010. |
Amy Johnson
5228 Ameriprise
Financial Center
Minneapolis, MN 55474
Born 1965 | Vice President (2006) | Managing Director and Global Head of Operations, Columbia Management Investment Advisers, LLC since April 2016 (previously Managing Director and Chief Operating Officer, 2010 - 2016). |
Lyn Kephart-Strong
5228 Ameriprise
Financial Center
Minneapolis, MN 55474
Born 1960 | Vice President (2015) | President, Columbia Management Investment Services Corp. since October 2014; Vice President & Resolution Officer, Ameriprise Trust Company since August 2009. |
| 56 | Multi-Manager Directional Alternative Strategies Fund | Annual Report 2018 |
The Fund mails one shareholder report to each shareholder address. If you would like more than one report, please call shareholder services at 800.345.6611 and additional reports will be sent to you.
Proxy voting policies and procedures
The policy of the Board of Trustees is to vote the proxies of the companies in which the Fund holds investments consistent with the procedures as stated in the Statement of Additional Information (SAI). You may obtain a copy of the SAI without charge by calling 800.345.6611; contacting your financial intermediary; visiting columbiathreadneedleus.com/investor/; or searching the website of the Securities and Exchange Commission (SEC) at sec.gov. Information regarding how the Fund voted proxies relating to portfolio securities is filed with the SEC by August 31st for the most recent 12-month period ending June 30th of that year, and is available without charge by visiting columbiathreadneedleus.com/investor/, or searching the website of the SEC at sec.gov.
Quarterly schedule of investments
The Fund files a complete schedule of portfolio holdings with the SEC for the first and third quarters of each fiscal year on Form N-Q. The Fund’s Form N-Q is available on the SEC’s website at sec.gov and may be reviewed and copied at the SEC’s Public Reference Room in Washington, D.C. Information on the operation of the Public Reference Room may be obtained by calling 800.SEC.0330. The Fund’s complete schedule of portfolio holdings, as filed on Form N-Q, can also be obtained without charge, upon request, by calling 800.345.6611.
Additional Fund information
For more information about the Fund, please visit columbiathreadneedleus.com/investor/ or call 800.345.6611. Customer Service Representatives are available to answer your questions Monday through Friday from 8 a.m. to 7 p.m. Eastern time.
You may obtain the current net asset value (NAV) of Fund shares at no cost by calling 800.345.6611 or by sending an e-mail to serviceinquiries@columbiathreadneedle.com.
Fund investment manager
Columbia Management Investment Advisers, LLC
225 Franklin Street
Boston, MA 02110
Fund distributor
Columbia Management Investment Distributors, Inc.
225 Franklin Street
Boston, MA 02110
Fund transfer agent
Columbia Management Investment Services Corp.
P.O. Box 8081
Boston, MA 02266-8081
Multi-Manager Directional Alternative Strategies Fund | Annual Report 2018
| 57 |
Multi-Manager Directional Alternative Strategies Fund
P.O. Box 8081
Boston, MA 02266-8081
Please read and consider the investment objectives, risks, charges and expenses for any fund carefully before investing. For a prospectus and summary prospectus, which contains this and other important information about the Fund, go to
columbiathreadneedleus.com/investor/. The Fund is distributed by Columbia Management Investment Distributors, Inc., member FINRA, and managed by Columbia Management Investment Advisers, LLC.
Columbia Threadneedle Investments (Columbia Threadneedle) is the global brand name of the Columbia and Threadneedle group of companies. All rights reserved. Columbia Management Investment Distributors, Inc., 225 Franklin Street, Boston, MA 02110-2804
© 2018 Columbia Management Investment Advisers, LLC.
columbiathreadneedleus .com/investor/

Annual Report
April 30, 2018
Columbia Total Return Bond Fund
Not FDIC Insured • No bank guarantee • May lose value
Dear Shareholders,
The year 2017 was an extraordinary year in the financial markets. The S&P 500 Index didn’t experience a single down month and returned over 20%. Continuing this trend, January 2018 marked the fastest start for the index ever. Low volatility, which had been a feature of the U.S. equity market for several years, along with the surge in the S&P 500 Index, drove investor sentiment to very high levels. This arguably set the stage for an overdue correction, which we witnessed in February 2018.
A return to volatility
There have been few periods of market upheaval such as were experienced in the first part of 2018. While investors were taken by surprise by the sudden and pronounced market swings, the return to some level of volatility actually marked a resumption of relatively normal market conditions. Having said that, it’s important to distinguish between a good technical correction where excess enthusiasm in the marketplace is being let out, versus a real change in the underlying fundamentals – things like an underperforming economy or weaker corporate earnings. Our view is that the recent market volatility falls into the former category, and the fundamentals remain strong. We’re continuing to see improvements in global economic activity, and we’re seeing corporate earnings expectations continue to rise – and not just because of tax reform.
Consistency is more important than ever
It’s important to keep in mind that when it comes to long-term investing, it’s the destination, not the journey that matters most. If you have a financial goal that you’ve worked out with your financial advisor, and you have a good asset allocation plan to reach it, it’s a question of sticking with your plan rather than become focused on near-term volatility. Bouts of volatility are normal. After all, it’s hard to cross the ocean without hitting an occasional rough patch. You need to focus on the destination.
One final thought. In weathering volatility, it’s the consistency of the return that is essential. Investors who chase higher returns are usually the first to sell when an investment goes through a bad patch, and they therefore don’t tend to benefit from the recovery. More disciplined investors who perhaps panic less or not at all during periods of volatility, tend to have improved long-term results and are more likely to reach their financial goals. Nothing is more important to us than making sure those who have entrusted us to protect and grow their assets are able to do what matters most to them.
Your success is our priority. Talk to your financial advisor about how working with Columbia Threadneedle Investments may help you position your portfolio for consistent, sustainable outcomes, no matter the market conditions.
Sincerely,
Christopher O. Petersen
President, Columbia Funds
The S&P 500 Index, an unmanaged index, measures the performance of 500 widely held, large-capitalization U.S. stocks and is frequently used as a general measure of market performance. Past performance is no guarantee of future results.
Columbia Funds are distributed by Columbia Management Investment Distributors, Inc., member FINRA, and managed by Columbia Management Investment Advisers, LLC.
© 2018 Columbia Management Investment Advisers, LLC. All rights reserved.
Columbia Total Return Bond Fund | Annual Report 2018
Columbia Total Return Bond Fund | Annual Report 2018
Investment objective
Columbia Total Return Bond Fund (the Fund) seeks total return, consisting of current income and capital appreciation.
Portfolio management
Jason Callan
Lead Portfolio Manager
Managed Fund since 2016
Gene Tannuzzo, CFA
Portfolio Manager
Managed Fund since November 2017
| Average annual total returns (%) (for the period ended April 30, 2018) |
| | | Inception | 1 Year | 5 Years | 10 Years |
| Class A | Excluding sales charges | 07/31/00 | 0.08 | 1.58 | 4.02 |
| | Including sales charges | | -2.93 | 0.97 | 3.71 |
| Advisor Class* | 11/08/12 | 0.44 | 1.83 | 4.28 |
| Class C | Excluding sales charges | 02/01/02 | -0.67 | 0.88 | 3.35 |
| | Including sales charges | | -1.64 | 0.88 | 3.35 |
| Institutional Class | 12/05/78 | 0.44 | 1.86 | 4.29 |
| Institutional 2 Class* | 11/08/12 | 0.38 | 1.90 | 4.32 |
| Institutional 3 Class* | 11/08/12 | 0.55 | 1.97 | 4.36 |
| Class R | 01/23/06 | -0.17 | 1.33 | 3.76 |
| Class T* | Excluding sales charges | 09/27/10 | 0.19 | 1.56 | 4.04 |
| | Including sales charges | | -2.30 | 1.05 | 3.78 |
| Bloomberg Barclays U.S. Aggregate Bond Index | | -0.32 | 1.47 | 3.57 |
Returns for Class A shares are shown with and without the maximum initial sales charge of 3.00%. Returns for Class C shares are shown with and without the 1.00% contingent deferred sales charge for the first year only. Returns for Class T shares are shown with and without the maximum initial sales charge of 2.50% per transaction. The Fund’s other classes are not subject to sales charges and have limited eligibility. Effective November 1, 2017, Class R4, Class R5, Class Y and Class Z shares were renamed Advisor Class, Institutional 2 Class, Institutional 3 Class and Institutional Class shares, respectively. Please see the Fund’s prospectus for details. Performance for different share classes will vary based on differences in sales charges and fees associated with each share class. All results shown assume reinvestment of distributions during the period. Returns do not reflect the deduction of taxes that a shareholder may pay on Fund distributions or on the redemption of Fund shares. Performance results reflect the effect of any fee waivers or reimbursements of Fund expenses by Columbia Management Investment Advisers, LLC and/or any of its affiliates. Absent these fee waivers or expense reimbursement arrangements, performance results would have been lower.
The performance information shown represents past performance and is not a guarantee of future results. The investment return and principal value of your investment will fluctuate so that your shares, when redeemed, may be worth more or less than their original cost. Current performance may be lower or higher than the performance information shown. You may obtain performance information current to the most recent month-end by contacting your financial intermediary, visiting columbiathreadneedleus.com/investor/ or calling 800.345.6611.
| * | The returns shown for periods prior to the share class inception date (including returns for the Life of the Fund, if shown, which are since Fund inception) include the returns of the Fund’s oldest share class. These returns are adjusted to reflect any higher class-related operating expenses of the newer share classes, as applicable. Please visit columbiathreadneedleus.com/investor/investment-products/mutual-funds/appended-performance for more information. |
The Bloomberg Barclays U.S. Aggregate Bond Index, is a broad-based benchmark that measures the investment-grade, U.S. dollar-denominated, fixed-rate taxable bond market, including Treasuries, government-related and corporate securities, mortgage-backed securities (agency fixed-rate and hybrid adjustable-rate mortgage passthroughs), asset-backed securities, and commercial mortgage-backed securities.
Indices are not available for investment, are not professionally managed and do not reflect sales charges, fees, brokerage commissions, taxes or other expenses of investing. Securities in the Fund may not match those in an index.
| 2 | Columbia Total Return Bond Fund | Annual Report 2018 |
Fund at a Glance (continued)
Performance of a hypothetical $10,000 investment (April 30, 2008 — April 30, 2018)
The chart above shows the change in value of a hypothetical $10,000 investment in Class A shares of Columbia Total Return Bond Fund during the stated time period, and does not reflect the deduction of taxes that a shareholder may pay on Fund distributions or on the redemption of Fund shares.
| Portfolio breakdown (%) (at April 30, 2018) |
| Asset-Backed Securities — Agency | 2.9 |
| Asset-Backed Securities — Non-Agency | 21.9 |
| Commercial Mortgage-Backed Securities - Agency | 2.9 |
| Commercial Mortgage-Backed Securities - Non-Agency | 6.0 |
| Common Stocks | 0.0 (a) |
| Corporate Bonds & Notes | 25.0 |
| Foreign Government Obligations | 1.0 |
| Money Market Funds | 4.1 |
| Municipal Bonds | 0.1 |
| Options Purchased Puts | 0.3 |
| Residential Mortgage-Backed Securities - Agency | 19.7 |
| Residential Mortgage-Backed Securities - Non-Agency | 14.8 |
| Senior Loans | 0.0 (a) |
| U.S. Treasury Obligations | 1.3 |
| Total | 100.0 |
Percentages indicated are based upon total investments. The Fund’s portfolio composition is subject to change.
| Quality breakdown (%) (at April 30, 2018) |
| AAA rating | 45.1 |
| AA rating | 7.9 |
| A rating | 6.6 |
| BBB rating | 16.9 |
| BB rating | 4.3 |
| B rating | 3.2 |
| CCC rating | 0.7 |
| C rating | 0.0 (a) |
| Not rated | 15.3 |
| Total | 100.0 |
Percentages indicated are based upon total fixed income investments (excluding Money Market Funds).
Bond ratings apply to the underlying holdings of the Fund and not the Fund itself and are divided into categories ranging from highest to lowest credit quality, determined by using the middle rating of Moody’s, S&P and Fitch, after dropping the highest and lowest available ratings. When ratings are available from only two rating agencies, the lower rating is used. When a rating is available from only one rating agency, that rating is used. When a bond is not rated by any rating agency, it is designated as “Not rated.” Credit quality ratings assigned by a rating agency are subjective opinions, not statements of fact, and are subject to change, including daily. The ratings assigned by credit rating agencies are but one of the considerations that the Investment Manager and/or Fund’s subadviser incorporates into its credit analysis process, along with such other issuer-specific factors as cash flows, capital structure and leverage ratios, ability to de-leverage (repay) through free cash flow, quality of management, market positioning and access to capital, as well as such security-specific factors as the terms of the security (e.g., interest rate and time to maturity) and the amount and type of any collateral.
Columbia Total Return Bond Fund | Annual Report 2018
| 3 |
Fund at a Glance (continued)
| Market exposure through derivatives investments (% of notional exposure) (at April 30, 2018)(a) |
| | Long | Short | Net |
| Fixed Income Derivative Contracts | 109.4 | (9.4) | 100.0 |
| Total Notional Market Value of Derivative Contracts | 109.4 | (9.4) | 100.0 |
(a) The Fund has market exposure (long and/or short) to fixed income through its investments in derivatives. The notional exposure of a financial instrument is the nominal or face amount that is used to calculate payments made on that instrument and/or changes in value for the instrument. The notional exposure is a hypothetical underlying quantity upon which payment obligations are computed. Notional exposures provide a gauge for how the Fund may behave given changes in individual markets. For a description of the Fund’s investments in derivatives, see Investments in derivatives following the Portfolio of Investments, and Note 2 to the Notes to Financial Statements.
| 4 | Columbia Total Return Bond Fund | Annual Report 2018 |
Manager Discussion of Fund Performance
For the 12-month period that ended April 30, 2018, the Fund’s Class A shares returned 0.08% excluding sales charges. The Fund’s benchmark, the Bloomberg Barclays U.S. Aggregate Bond Index, returned -0.32% for the same period. The Fund’s relative performance was aided by positioning with respect to interest rates, allocation across segments of the bond market, and overall security selection.
Credit outperformed as Treasury yields rose
Performance across fixed-income markets for the 12 months ended April 30, 2018 was constrained by an upward move in Treasury yields which weighed on bond prices. For much of the period, sentiment with respect to credit-oriented segments of the market continued to be supported by positive economic data and the Federal Reserve’s (the Fed) maintenance of an incremental approach as it seeks to restore interest rates to more historically normal levels.
Against a backdrop of strong corporate earnings growth and essentially full employment, the U.S. economy posted growth in the 3% range over each of the last three quarters of 2017. As 2017 drew to a close, risk sentiment was further boosted with the passage of legislation that lowered the maximum corporate tax rate from 35% to 21% and provided a temporary window for companies to accelerate the expensing of capital investments.
The Fed implemented a series of three 25 basis point rate hikes at its June 2017, December 2017 and March 2018 Open Market Committee meetings, which together raised the upper target for the fed funds rate to 1.75%. In addition, in October of 2017 the Fed began the process of allowing its mortgage-backed security and Treasury holdings acquired in the wake of the 2008 financial crisis to gradually roll off its balance sheet. The Fed’s tapering plan was well-signaled, and the markets had little reaction to the actual launch.
As 2018 opened, bond markets continued to rally on the back of the tax reform bill and quiescent inflation indicators. However, January wage growth data surprised to the upside, raising concerns that signs of a potential acceleration in inflation would lead the Fed to step up the pace of its rate hikes. While jitters around inflation eased fairly quickly, the markets were jarred again in early March as President Trump threatened tariffs on Chinese imports, raising the specter of a trade war with the potential to derail global growth. In late April, first quarter 2018 growth was reported at 2.3%, with the drop off from the prior three quarters generally attributed to seasonal factors.
Yields rose along the U.S. Treasury curve over the 12-month period ended April 30, 2018, and the yield curve flattened notably as shorter maturities experienced greater yield increases. To illustrate, the two-year Treasury yield rose 121 basis points from 1.28% to 2.49%, the 10-year rose 66 basis points from 2.29% to 2.95%, the 20-year rose 34 basis points from 2.67% to 3.01%, and the 30-year yield rose 15 basis points from 2.96% to 3.11%.
Contributors and detractors
The Fund’s performance in the period benefited from an underweighting of U.S. Treasuries, which were most directly and negatively impacted by the upward move in interest rates over the period. In turn, the Fund had overweight exposure to credit-oriented segments of the market, with respect to which sentiment was supported by the ongoing economic recovery and passage of tax reform legislation. In particular, a tilt toward non-agency residential mortgage-backed securities added to relative performance, as these issues benefited from the ongoing strengthening of the housing market and consumer balance sheets.
Security selection within investment-grade corporate securities added to performance, including a modest out-of-benchmark position in preferred securities that are more sensitive to changes in risk sentiment. With respect to the Fund’s allocation to asset-backed securities, performance benefited from a focus on floating rate issues which experienced strong interest from investors concerned about the potential for higher interest rates.
The Fund’s below-benchmark positioning during the period with respect to overall portfolio duration (and corresponding sensitivity to interest rates) had a modest positive impact on performance in a rising rate environment. In addition, the Fund was underweight the 2-5 year segment of the yield curve which was most impacted by rising interest rates.
Columbia Total Return Bond Fund | Annual Report 2018
| 5 |
Manager Discussion of Fund Performance (continued)
We invested in highly-liquid, widely-traded Treasury futures and interest rate swap contracts to help manage portfolio duration. These enabled us to efficiently implement our yield curve opinions and offset unintended yield curve impacts from other investments in the portfolio. We also used indexed exposure to credit default swaps to manage the Fund’s overall level of credit risk. On a standalone basis, the Fund’s use of derivatives negatively impacted performance during the period.
At period’s end
While the Fed is in the process of tightening monetary conditions, the stimulus baton has been picked up by fiscal policy in the form of lower taxes. This argues for the view that the current period of positive U.S. economic growth has some additional running room. That said, given the extended duration of the economic recovery, we adopted a somewhat cautious stance with respect to corporate credit. We view corporate America as displaying late-cycle characteristics as evidenced by an uptick in the use of leverage to finance mergers and acquisition activity in certain segments such as food and beverage.
With the improvements in employment conditions and house prices, the consumer appeared to us to be in an earlier stage of the credit cycle relative to corporations. In this vein, the Fund emphasized segments such as non-agency mortgage-backed securities and asset-backed securities, along with commercial mortgage-backed securities. With the recent rise in interest rates and the Fed continuing to pursue a gradual approach to interest rate normalization, we moved to an essentially neutral stance with respect to duration, as well as with respect to positioning along the yield curve.
Market risk may affect a single issuer, sector of the economy, industry or the market as a whole. Fixed-income securities present issuer default risk. A rise in interest rates may result in a price decline of fixed-income securities held by the Fund. Falling rates may result in the Fund investing in lower yielding securities, lowering the Fund’s income and yield. Prepayment and extension risk exists because the timing of payments on a loan, bond or other investment may accelerate when interest rates fall or decelerate when interest rates rise which may reduce investment opportunities and potential returns. Investing in derivatives is a specialized activity that involves special risks that subject the Fund to significant loss potential, including when used as leverage, and may result in greater fluctuation in fund value. Liquidity risk is associated with the difficulty of selling underlying investments at a desirable time or price. See the Fund’s prospectus for more information on these and other risks.
The views expressed in this report reflect the current views of the respective parties. These views are not guarantees of future performance and involve certain risks, uncertainties and assumptions that are difficult to predict, so actual outcomes and results may differ significantly from the views expressed. These views are subject to change at any time based upon economic, market or other conditions and the respective parties disclaim any responsibility to update such views. These views may not be relied on as investment advice and, because investment decisions for a Columbia fund are based on numerous factors, may not be relied on as an indication of trading intent on behalf of any particular Columbia fund. References to specific securities should not be construed as a recommendation or investment advice.
| 6 | Columbia Total Return Bond Fund | Annual Report 2018 |
Understanding Your Fund’s Expenses
(Unaudited)
As an investor, you incur two types of costs. There are transaction costs, which generally include sales charges on purchases and may include redemption fees. There are also ongoing costs, which generally include management fees, distribution and/or service fees, and other fund expenses. The following information is intended to help you understand your ongoing costs (in dollars) of investing in the Fund and to help you compare these costs with the ongoing costs of investing in other mutual funds.
Analyzing your Fund’s expenses
To illustrate these ongoing costs, we have provided examples and calculated the expenses paid by investors in each share class of the Fund during the period. The actual and hypothetical information in the table is based on an initial investment of $1,000 at the beginning of the period indicated and held for the entire period. Expense information is calculated two ways and each method provides you with different information. The amount listed in the “Actual” column is calculated using the Fund’s actual operating expenses and total return for the period. You may use the Actual information, together with the amount invested, to estimate the expenses that you paid over the period. Simply divide your account value by $1,000 (for example, an $8,600 account value divided by $1,000 = 8.6), then multiply the results by the expenses paid during the period under the “Actual” column. The amount listed in the “Hypothetical” column assumes a 5% annual rate of return before expenses (which is not the Fund’s actual return) and then applies the Fund’s actual expense ratio for the period to the hypothetical return. You should not use the hypothetical account values and expenses to estimate either your actual account balance at the end of the period or the expenses you paid during the period. See “Compare with other funds” below for details on how to use the hypothetical data.
Compare with other funds
Since all mutual funds are required to include the same hypothetical calculations about expenses in shareholder reports, you can use this information to compare the ongoing cost of investing in the Fund with other funds. To do so, compare the hypothetical example with the 5% hypothetical examples that appear in the shareholder reports of other funds. As you compare hypothetical examples of other funds, it is important to note that hypothetical examples are meant to highlight the ongoing costs of investing in a fund only and do not reflect any transaction costs, such as sales charges, or redemption or exchange fees. Therefore, the hypothetical calculations are useful in comparing ongoing costs only, and will not help you determine the relative total costs of owning different funds. If transaction costs were included in these calculations, your costs would be higher.
| November 1, 2017 — April 30, 2018 |
| | Account value at the
beginning of the
period ($) | Account value at the
end of the
period ($) | Expenses paid during
the period ($) | Fund’s annualized
expense ratio (%) |
| | Actual | Hypothetical | Actual | Hypothetical | Actual | Hypothetical | Actual |
| Class A | 1,000.00 | 1,000.00 | 984.60 | 1,020.53 | 4.23 | 4.31 | 0.86 |
| Advisor Class | 1,000.00 | 1,000.00 | 986.90 | 1,021.77 | 3.01 | 3.06 | 0.61 |
| Class C | 1,000.00 | 1,000.00 | 981.00 | 1,016.81 | 7.91 | 8.05 | 1.61 |
| Institutional Class | 1,000.00 | 1,000.00 | 987.00 | 1,021.77 | 3.01 | 3.06 | 0.61 |
| Institutional 2 Class | 1,000.00 | 1,000.00 | 986.10 | 1,022.07 | 2.71 | 2.76 | 0.55 |
| Institutional 3 Class | 1,000.00 | 1,000.00 | 987.50 | 1,022.32 | 2.46 | 2.51 | 0.50 |
| Class R | 1,000.00 | 1,000.00 | 983.40 | 1,019.29 | 5.46 | 5.56 | 1.11 |
| Class T | 1,000.00 | 1,000.00 | 985.70 | 1,020.53 | 4.23 | 4.31 | 0.86 |
Expenses paid during the period are equal to the annualized expense ratio for each class as indicated above, multiplied by the average account value over the period and then multiplied by the number of days in the Fund’s most recent fiscal half year and divided by 365.
Expenses do not include fees and expenses incurred indirectly by the Fund from its investment in underlying funds, including affiliated and non-affiliated pooled investment vehicles, such as mutual funds and exchange-traded funds.
Had Columbia Management Investment Advisers, LLC and/or certain of its affiliates not waived/reimbursed certain fees and expenses, account value at the end of the period would have been reduced.
Columbia Total Return Bond Fund | Annual Report 2018
| 7 |
Portfolio of Investments
April 30, 2018
(Percentages represent value of investments compared to net assets)
Investments in securities
| Asset-Backed Securities — Agency 3.4% |
| Issuer | Coupon
Rate | | Principal
Amount ($) | Value ($) |
| United States Small Business Administration |
| Series 2012-20C Class 1 |
| 03/01/2032 | 2.510% | | 666,132 | 655,953 |
| Series 2012-20G Class 1 |
| 07/01/2032 | 2.380% | | 1,103,973 | 1,079,485 |
| Series 2012-20L Class 1 |
| 12/01/2032 | 1.930% | | 1,258,949 | 1,211,665 |
| Series 2013-20A Class 1 |
| 01/01/2033 | 2.130% | | 2,768,268 | 2,676,609 |
| Series 2013-20C Class 1 |
| 03/01/2033 | 2.220% | | 6,327,926 | 6,129,779 |
| Series 2015-20C Class 1 |
| 03/01/2035 | 2.720% | | 1,244,679 | 1,222,979 |
| Series 2016-20F Class 1 |
| 06/01/2036 | 2.180% | | 12,977,894 | 12,351,016 |
| Series 2016-20K Class 1 |
| 11/01/2036 | 2.570% | | 8,467,862 | 8,238,383 |
| Series 2016-20L Class 1 |
| 12/01/2036 | 2.810% | | 10,364,619 | 10,182,902 |
| Series 2017-20E Class 1 |
| 05/01/2037 | 2.880% | | 820,665 | 800,815 |
| Series 2017-20G Class 1 |
| 07/01/2037 | 2.980% | | 5,464,104 | 5,327,709 |
| Series 2017-20H Class 1 |
| 08/01/2037 | 2.750% | | 4,691,581 | 4,530,239 |
| Series 2017-20I Class 1 |
| 09/01/2037 | 2.590% | | 8,250,965 | 7,890,087 |
| Series 2017-20K Class 1 |
| 11/01/2037 | 2.790% | | 8,581,000 | 8,307,878 |
Total Asset-Backed Securities — Agency
(Cost $72,878,598) | 70,605,499 |
|
| Asset-Backed Securities — Non-Agency 24.9% |
| | | | |
| Ally Master Owner Trust |
| Series 2015-3 Class A |
| 05/15/2020 | 1.630% | | 4,330,000 | 4,328,197 |
| ARES XLVI CLO Ltd.(a),(b) |
| Series 2017-46A Class B1 |
3-month USD LIBOR + 1.350%
01/15/2030 | 3.698% | | 7,780,000 | 7,760,433 |
| ARI Fleet Lease Trust(a) |
| Series 2018-A Class A2 |
| 10/15/2026 | 2.550% | | 3,700,000 | 3,677,765 |
| Asset-Backed Securities — Non-Agency (continued) |
| Issuer | Coupon
Rate | | Principal
Amount ($) | Value ($) |
| Birchwood Park CLO Ltd.(a),(b) |
| Series 2014-1A Class AR |
3-month USD LIBOR + 1.180%
07/15/2026 | 3.528% | | 2,500,000 | 2,501,675 |
| BMW Floorplan Master Owner Trust(a),(b) |
| Series 2015-1A Class A |
1-month USD LIBOR + 0.500%
07/15/2020 | 2.397% | | 1,200,000 | 1,200,757 |
| Carlyle Group LP(a),(b) |
| Series 2017-5A Class A2 |
3-month USD LIBOR + 1.400%
01/20/2030 | 3.130% | | 11,810,000 | 11,727,885 |
| CarMax Auto Owner Trust |
| Series 2016-4 Class A2 |
| 11/15/2019 | 1.210% | | 868,673 | 867,060 |
| Cent CLO Ltd.(a),(b),(c),(d),(e) |
| Series 20 18-C17A Class A2R |
3-month USD LIBOR + 1.600%
04/30/2031 | 3.200% | | 9,300,000 | 9,295,350 |
| Chesapeake Funding II LLC(a),(b) |
| Series 2016-2A Class A2 |
1-month USD LIBOR + 1.000%
06/15/2028 | 2.897% | | 3,129,533 | 3,139,747 |
| Series 2017-3A Class A2 |
1-month USD LIBOR + 0.340%
08/15/2029 | 2.237% | | 4,271,450 | 4,273,804 |
| Series 2017-4A Class A2 |
1-month USD LIBOR + 0.340%
11/15/2029 | 2.207% | | 5,390,000 | 5,383,879 |
| Chrysler Capital Auto Receivables Trust(a) |
| Series 2016-BA Class A2 |
| 01/15/2020 | 1.360% | | 108,742 | 108,673 |
| CLUB Credit Trust(a) |
| Series 2017-P2 Class A |
| 01/15/2024 | 2.610% | | 13,583,357 | 13,534,211 |
| Series 2018-NP1 Class A |
| 05/15/2024 | 2.990% | | 11,707,242 | 11,701,059 |
| Series 2018-NP1 Class B |
| 05/15/2024 | 3.670% | | 4,900,000 | 4,892,775 |
| Subordinated, Series 2017-P2 Class B |
| 01/15/2024 | 3.560% | | 5,250,000 | 5,220,208 |
| Conn’s Receivables Funding LLC(a) |
| Series 2017-A Class A |
| 07/15/2019 | 2.730% | | 166,439 | 166,432 |
| Series 2017-A Class B |
| 02/15/2020 | 5.110% | | 1,500,000 | 1,509,497 |
The accompanying Notes to Financial Statements are an integral part of this statement.
| 8 | Columbia Total Return Bond Fund | Annual Report 2018 |
Portfolio of Investments (continued)
April 30, 2018
| Asset-Backed Securities — Non-Agency (continued) |
| Issuer | Coupon
Rate | | Principal
Amount ($) | Value ($) |
| Series 2017-B Class A |
| 07/15/2020 | 2.730% | | 14,538,239 | 14,529,920 |
| Subordinated, Series 2017-B Class B |
| 11/15/2020 | 4.520% | | 6,600,000 | 6,637,600 |
| Consumer Loan Underlying Bond Credit Trust(a) |
| Series 2017-NP2 Class A |
| 01/16/2024 | 2.550% | | 5,634,330 | 5,628,956 |
| Series 2017-NP2 Class B |
| 01/16/2024 | 3.500% | | 2,500,000 | 2,492,022 |
| Dell Equipment Finance Trust(a),(b) |
| Series 2017-2 Class A2B |
1-month USD LIBOR + 0.300%
02/24/2020 | 2.198% | | 2,240,000 | 2,241,356 |
| DRB Prime Student Loan Trust(a) |
| Series 2016-B Class A2 |
| 06/25/2040 | 2.890% | | 2,804,329 | 2,742,977 |
| Dryden 33 Senior Loan Fund(a),(b) |
| Series 2014-33A Class AR |
3-month USD LIBOR + 1.430%
10/15/2028 | 3.778% | | 9,000,000 | 9,035,739 |
| Dryden 57 CLO Ltd.(a),(b) |
| Series 2018-57A Class B |
3-month USD LIBOR + 1.350%
05/15/2031 | 3.240% | | 7,000,000 | 6,925,597 |
| Enterprise Fleet Financing LLC(a) |
| Series 2015-2 Class A2 |
| 02/22/2021 | 1.590% | | 314,791 | 314,589 |
| Ford Credit Auto Owner Trust(a) |
| Series 2015-2 Class A |
| 01/15/2027 | 2.440% | | 5,695,000 | 5,627,879 |
| Series 2016-1 Class A |
| 08/15/2027 | 2.310% | | 11,955,000 | 11,710,771 |
| Series 2016-2 Class A |
| 12/15/2027 | 2.030% | | 19,300,000 | 18,665,565 |
| Series 2017-1 Class A |
| 08/15/2028 | 2.620% | | 17,000,000 | 16,666,941 |
| Series 2017-2 Class A |
| 03/15/2029 | 2.360% | | 3,300,000 | 3,186,571 |
| Ford Credit Floorplan Master Owner Trust |
| Series 2017-3 Class A |
| 09/15/2024 | 2.480% | | 6,000,000 | 5,827,360 |
| GM Financial Automobile Leasing Trust |
| Series 2016-3 Class A2A |
| 02/20/2019 | 1.350% | | 325,876 | 325,692 |
| GMF Floorplan Owner Revolving Trust(a),(b) |
| Series 2016-1 Class A2 |
1-month USD LIBOR + 0.850%
05/17/2021 | 2.747% | | 3,440,000 | 3,462,839 |
| Asset-Backed Securities — Non-Agency (continued) |
| Issuer | Coupon
Rate | | Principal
Amount ($) | Value ($) |
| Goldentree Loan Opportunities XI Ltd.(a),(b) |
| Series 2015-11A Class BR2 |
3-month USD LIBOR + 1.350%
01/18/2031 | 3.705% | | 5,000,000 | 4,949,135 |
| Harley-Davidson Motorcycle Trust |
| Series 2015-1 Class A3 |
| 06/15/2020 | 1.410% | | 441,171 | 439,965 |
| Hertz Fleet Lease Funding LP(a),(b) |
| Series 2015-1 Class A |
1-month USD LIBOR + 0.570%
07/10/2029 | 2.467% | | 2,340,939 | 2,341,085 |
| Series 2016-1 Class A1 |
1-month USD LIBOR + 1.100%
04/10/2030 | 2.997% | | 5,856,680 | 5,876,269 |
| Series 2017-1 Class A1 |
1-month USD LIBOR + 0.650%
04/10/2031 | 2.547% | | 3,020,000 | 3,022,259 |
| Hertz Vehicle Financing II LP(a) |
| Series 2015-1A Class A |
| 03/25/2021 | 2.730% | | 6,800,000 | 6,729,830 |
| Series 2015-3A Class A |
| 09/25/2021 | 2.670% | | 2,870,000 | 2,824,827 |
| Series 2016-1A Class A |
| 03/25/2020 | 2.320% | | 2,600,000 | 2,586,013 |
| Series 2016-2A Class A |
| 03/25/2022 | 2.950% | | 7,730,000 | 7,602,682 |
| Subordinated Series 2016-3A Class D |
| 07/25/2020 | 5.410% | | 3,775,000 | 3,787,033 |
| Hyundai Floorplan Master Owner Trust(a),(b) |
| Series 2016-1A Class A1 |
1-month USD LIBOR + 0.900%
03/15/2021 | 2.797% | | 1,425,000 | 1,433,694 |
| Kubota Credit Owner Trust(a) |
| Series 2016-1A Class A2 |
| 04/15/2019 | 1.250% | | 246,927 | 246,727 |
| Madison Park Funding XVIII Ltd.(a),(b) |
| Series 2015-18A Class A1R |
3-month USD LIBOR + 1.190%
10/21/2030 | 3.552% | | 3,500,000 | 3,510,147 |
| Madison Park Funding XXVII Ltd.(a),(b) |
| Series 2018-27A Class A2 |
3-month USD LIBOR + 1.350%
04/20/2030 | 3.397% | | 21,000,000 | 20,778,534 |
| Marlette Funding Trust(a) |
| Series 2018-1A Class A |
| 03/15/2028 | 2.610% | | 17,022,105 | 16,983,339 |
| Series 2018-1A Class B |
| 03/15/2028 | 3.190% | | 4,900,000 | 4,864,771 |
The accompanying Notes to Financial Statements are an integral part of this statement.
Columbia Total Return Bond Fund | Annual Report 2018
| 9 |
Portfolio of Investments (continued)
April 30, 2018
| Asset-Backed Securities — Non-Agency (continued) |
| Issuer | Coupon
Rate | | Principal
Amount ($) | Value ($) |
| Mercedes-Benz Auto Lease Trust |
| Series 2016-B Class A2 |
| 01/15/2019 | 1.150% | | 57,443 | 57,417 |
| New Residential Advance Receivables Trust Advance Receivables-Backed Notes(a) |
| Series 2017-T1 Class AT1 |
| 02/15/2051 | 3.214% | | 5,400,000 | 5,355,438 |
| New York City Tax Lien Trust(a) |
| Series 2016-A Class A |
| 11/10/2029 | 1.470% | | 349,895 | 346,778 |
| NextGear Floorplan Master Owner Trust(a),(b) |
| Series 2017-2A Class A1 |
1-month USD LIBOR + 0.680%
10/17/2022 | 2.577% | | 2,420,000 | 2,389,000 |
| Nissan Auto Lease Trust |
| Series 2016-B Class A2A |
| 12/17/2018 | 1.260% | | 189,665 | 189,585 |
| Nissan Master Owner Trust Receivables(b) |
| Series 2017-A Class A |
1-month USD LIBOR + 0.310%
04/15/2021 | 2.207% | | 8,610,000 | 8,619,048 |
| Octagon Investment Partners 35 Ltd.(a),(b) |
| Series 2018-1A Class A2 |
3-month USD LIBOR + 1.400%
01/20/2031 | 3.148% | | 9,350,000 | 9,341,716 |
| Octagon Investment Partners XXII Ltd.(a),(b) |
| Series 2014-1A Class BRR |
3-month USD LIBOR + 1.450%
01/22/2030 | 3.812% | | 22,000,000 | 21,851,082 |
| Ocwen Master Advance Receivables Trust(a) |
| Series 2016-T1 Class AT1 |
| 08/17/2048 | 2.521% | | 7,500,000 | 7,488,281 |
| Series 2017-T1 Class AT1 |
| 09/15/2048 | 2.499% | | 2,410,000 | 2,414,960 |
| OneMain Direct Auto Receivables Trust(a) |
| Series 2016-1A Class A |
| 01/15/2021 | 2.040% | | 254,309 | 254,150 |
| OneMain Financial Issuance Trust(a) |
| Series 2015-1A Class A |
| 03/18/2026 | 3.190% | | 3,663,284 | 3,668,943 |
| Series 2015-2A Class A |
| 07/18/2025 | 2.570% | | 2,448,137 | 2,446,841 |
| Series 2018-1A Class A |
| 03/14/2029 | 3.300% | | 11,100,000 | 11,067,863 |
| OZLM Funding IV Ltd.(a),(b) |
| Series 2013-4A Class D2R |
3-month USD LIBOR + 7.250%
10/22/2030 | 9.612% | | 1,000,000 | 1,021,631 |
| Asset-Backed Securities — Non-Agency (continued) |
| Issuer | Coupon
Rate | | Principal
Amount ($) | Value ($) |
| OZLM XXI(a),(b) |
| Series 2017-21A Class A1 |
3-month USD LIBOR + 1.150%
01/20/2031 | 2.903% | | 12,900,000 | 12,901,522 |
| Series 2017-21A Class A2 |
3-month USD LIBOR + 1.450%
01/20/2031 | 2.750% | | 11,475,000 | 11,396,591 |
| Prosper Marketplace Issuance Trust(a) |
| Series 2018-1A Class A |
| 06/17/2024 | 3.110% | | 9,500,000 | 9,491,584 |
| Series 2018-1A Class B |
| 06/17/2024 | 3.900% | | 7,500,000 | 7,492,528 |
| Series 2018-1A Class C |
| 06/17/2024 | 4.870% | | 4,400,000 | 4,392,140 |
| Subordinated, Series 2017-1A Class C |
| 06/15/2023 | 5.800% | | 2,900,000 | 2,949,490 |
| Subordinated, Series 2017-2A Class C |
| 09/15/2023 | 5.370% | | 4,000,000 | 4,036,845 |
| RR 3 Ltd.(a),(b) |
| Series 2014-14A Class A2R2 |
3-month USD LIBOR + 1.400%
01/15/2030 | 3.748% | | 14,625,000 | 14,475,650 |
| Sierra Timeshare Receivables Funding LLC(a) |
| Series 2016-2A Class A |
| 07/20/2033 | 2.330% | | 1,351,766 | 1,321,221 |
| SoFi Consumer Loan Program LLC(a) |
| Series 2017-3 Class A |
| 05/25/2026 | 2.770% | | 6,281,847 | 6,220,334 |
| SoFi Consumer Loan Program Trust(a) |
| Series 20 18-2 Class A1 |
| 04/26/2027 | 2.930% | | 5,500,000 | 5,499,565 |
| Series 2018-1 Class A1 |
| 02/25/2027 | 2.550% | | 10,040,282 | 9,997,313 |
| Series 2018-1 Class A2 |
| 02/25/2027 | 3.140% | | 5,200,000 | 5,158,135 |
| SoFi Professional Loan Program LLC(a),(c),(d),(f),(g) |
| Series 2015-D Class RC |
| 10/26/2037 | 0.000% | | 2 | 946,667 |
| Series 2016-A Class RIO |
| 01/25/2038 | 0.000% | | 3 | 810,000 |
| Series 2016-A Class RPO |
| 01/25/2038 | 0.000% | | 4 | 2,080,000 |
| Series 2016-B Class RC |
| 04/25/2037 | 0.000% | | 1 | 390,000 |
| Series 2017-A Class R |
| 03/26/2040 | 0.000% | | 12,500 | 837,813 |
The accompanying Notes to Financial Statements are an integral part of this statement.
| 10 | Columbia Total Return Bond Fund | Annual Report 2018 |
Portfolio of Investments (continued)
April 30, 2018
| Asset-Backed Securities — Non-Agency (continued) |
| Issuer | Coupon
Rate | | Principal
Amount ($) | Value ($) |
| SoFi Professional Loan Program LLC(a) |
| Series 2016-A |
| 12/26/2036 | 2.760% | | 4,272,764 | 4,218,228 |
| Springleaf Funding Trust(a) |
| Series 2016-AA Class A |
| 11/15/2029 | 2.900% | | 5,400,000 | 5,368,363 |
| SPS Servicer Advance Receivables Trust(a) |
| Series 2016-T2 Class AT2 |
| 11/15/2049 | 2.750% | | 7,500,000 | 7,401,569 |
| SPS Servicer Advance Receivables Trust Advance Receivables Backed Notes(a) |
| Series 2016-T1 Class AT1 |
| 11/16/2048 | 2.530% | | 1,500,000 | 1,497,188 |
| Stewart Park CLO Ltd.(a),(b) |
| Series 2017-1A Class A2R |
3-month USD LIBOR + 1.250%
01/15/2030 | 3.598% | | 4,000,000 | 4,020,760 |
| Series 2017-1A Class BR |
3-month USD LIBOR + 1.370%
01/15/2030 | 3.718% | | 5,828,571 | 5,776,067 |
| Symphony CLO V Ltd.(a),(b) |
| Series 2007-5A Class A1 |
3-month USD LIBOR + 0.750%
01/15/2024 | 3.098% | | 3,411,064 | 3,413,025 |
| Synchrony Credit Card Master Note Trust |
| Series 2017-2 Class A |
| 10/15/2025 | 2.620% | | 6,400,000 | 6,223,184 |
| TAL Advantage V LLC(a) |
| Series 2014-2A Class A1 |
| 05/20/2039 | 1.700% | | 1,131 | 1,131 |
| Voya Ltd.(a),(b) |
| Series 2012-4A Class A1R |
3-month USD LIBOR + 1.450%
10/15/2028 | 3.798% | | 10,000,000 | 10,039,700 |
| VSE VOI Mortgage LLC(a) |
| Series 2016-A Class A |
| 07/20/2033 | 2.540% | | 3,642,171 | 3,560,660 |
Total Asset-Backed Securities — Non-Agency
(Cost $527,772,742) | 523,718,097 |
|
| Commercial Mortgage-Backed Securities - Agency 3.3% |
| | | | |
| Federal Home Loan Mortgage Corp. |
| Series K026 Class A2 |
| 11/25/2022 | 2.510% | | 4,910,000 | 4,797,450 |
| Series K027 Class A2 |
| 01/25/2023 | 2.637% | | 4,161,000 | 4,067,695 |
| Series K722 Class A2 |
| 03/25/2023 | 2.406% | | 3,000,000 | 2,904,930 |
| Federal Home Loan Mortgage Corp. Multifamily Structured Pass-Through Certificates(h) |
| Series 2017-K070 Class A2 |
| 11/25/2027 | 3.303% | | 13,745,000 | 13,590,583 |
| Commercial Mortgage-Backed Securities - Agency (continued) |
| Issuer | Coupon
Rate | | Principal
Amount ($) | Value ($) |
| Federal Home Loan Mortgage Corp. Multifamily Structured Pass-Through Certificates |
| Series K071 Class A2 |
| 11/25/2050 | 3.286% | | 14,000,000 | 13,810,570 |
| Federal National Mortgage Association(h) |
| Series 2017-M15 Class ATS2 |
| 11/25/2027 | 3.196% | | 22,600,000 | 21,983,214 |
| FRESB Mortgage Trust(h) |
| Series 2018-SB45 Class A10F |
| 11/25/2027 | 3.160% | | 7,987,567 | 7,848,531 |
Total Commercial Mortgage-Backed Securities - Agency
(Cost $71,604,433) | 69,002,973 |
|
| Commercial Mortgage-Backed Securities - Non-Agency 6.8% |
| | | | |
| American Homes 4 Rent Trust(a) |
| Series 2014-SFR3 Class A |
| 12/17/2036 | 3.678% | | 1,504,280 | 1,503,969 |
| Series 2015-SFR2 Class A |
| 10/17/2045 | 3.732% | | 4,379,610 | 4,385,654 |
| BX Commercial Mortgage Trust(a),(b) |
| Series 2018-BIOA Class A |
1-month USD LIBOR + 0.671%
03/15/2037 | 2.321% | | 10,000,000 | 9,990,410 |
| Capmark Mortgage Securities, Inc.(h),(i) |
| CMO Series 1997-C1 Class X |
| 07/15/2029 | 1.569% | | 798,395 | 14,137 |
| CHT 2017-COSMO Mortgage Trust(a),(b) |
| Series 2017-CSMO Class C |
1-month USD LIBOR + 1.500%
11/15/2036 | 3.397% | | 10,000,000 | 10,037,319 |
| Series 2017-CSMO Class E |
1-month USD LIBOR + 3.000%
11/15/2036 | 4.897% | | 13,000,000 | 13,097,887 |
| Citigroup Commercial Mortgage Trust |
| Series 2015-GC29 Class A3 |
| 04/10/2048 | 2.935% | | 2,215,000 | 2,122,257 |
| COMM Mortgage Trust |
| Series 2013-CR8 Class A4 |
| 06/10/2046 | 3.334% | | 2,600,000 | 2,590,889 |
| Credit Suisse Mortgage Capital Certificates OA LLC(a) |
| Subordinated, Series 2014-USA Class E |
| 09/15/2037 | 4.373% | | 2,285,000 | 2,021,789 |
| Subordinated, Series 2014-USA Class F |
| 09/15/2037 | 4.373% | | 1,500,000 | 1,242,259 |
| Credit Suisse Mortgage Capital Trust(a) |
| Series 2014-USA Class A2 |
| 09/15/2037 | 3.953% | | 8,800,000 | 8,825,919 |
| DBUBS Mortgage Trust(a) |
| Series 2017-BRBK Class A |
| 10/10/2034 | 3.452% | | 3,300,000 | 3,247,450 |
The accompanying Notes to Financial Statements are an integral part of this statement.
Columbia Total Return Bond Fund | Annual Report 2018
| 11 |
Portfolio of Investments (continued)
April 30, 2018
| Commercial Mortgage-Backed Securities - Non-Agency (continued) |
| Issuer | Coupon
Rate | | Principal
Amount ($) | Value ($) |
| Direxion Daily Retail Bull(a),(b) |
| Series 2018-RVP Class C |
1-month USD LIBOR + 2.050%
03/15/2033 | 3.947% | | 10,000,000 | 10,059,280 |
| General Electric Capital Assurance Co.(a) |
| Series 2003-1 Class A5 |
| 05/12/2035 | 5.743% | | 919,980 | 928,095 |
| Hilton U.S.A. Trust(a) |
| Series 2016-HHV Class A |
| 11/05/2038 | 3.719% | | 4,700,000 | 4,654,088 |
| Series 2016-SFP Class A |
| 11/05/2035 | 2.828% | | 3,000,000 | 2,903,272 |
| Subordinated, Series 2016-SFP Class E |
| 11/05/2035 | 5.519% | | 1,500,000 | 1,520,941 |
| Hilton U.S.A. Trust(a),(h) |
| Series 2016-HHV Class F |
| 11/05/2038 | 4.333% | | 2,500,000 | 2,212,938 |
| Invitation Homes Trust(a),(b),(e) |
| Series 2018-SFR2 Class A |
1-month USD LIBOR + 0.800%
06/17/2037 | 2.796% | | 15,475,000 | 15,484,079 |
| Invitation Homes Trust(a),(b) |
| Subordinated, Series 2015-SFR2 Class E |
1-month USD LIBOR + 3.150%
06/17/2032 | 5.047% | | 749,000 | 748,997 |
| Subordinated, Series 2015-SFR2 Class F |
1-month USD LIBOR + 3.700%
06/17/2032 | 5.597% | | 800,000 | 805,568 |
| JPMBB Commercial Mortgage Securities Trust |
| Series 2013-C14 Class A4 |
| 08/15/2046 | 4.133% | | 4,300,000 | 4,439,059 |
| Series 2014-C26 Class A3 |
| 01/15/2048 | 3.231% | | 765,000 | 750,608 |
| Morgan Stanley Bank of America Merrill Lynch Trust |
| Series 2013-C12 Class A4 |
| 10/15/2046 | 4.259% | | 2,340,000 | 2,424,013 |
| Morgan Stanley Capital I Trust(a) |
| Series 2014-150E Class A |
| 09/09/2032 | 3.912% | | 4,080,000 | 4,120,133 |
| Progress Residential Trust(a) |
| Series 2017-SFR1 Class A |
| 08/17/2034 | 2.768% | | 4,409,601 | 4,332,982 |
| Series 2018-SFR1 Class A |
| 03/17/2035 | 3.255% | | 9,040,000 | 8,868,442 |
| Rialto Real Estate Fund LLC(a) |
| Subordinated, Series 2015-LT7 Class B |
| 12/25/2032 | 5.071% | | 1,095,951 | 1,095,952 |
| Commercial Mortgage-Backed Securities - Non-Agency (continued) |
| Issuer | Coupon
Rate | | Principal
Amount ($) | Value ($) |
| UBS Commercial Mortgage Trust(a),(b) |
| Series 2018-NYCH Class A |
1-month USD LIBOR + 0.850%
02/15/2032 | 2.747% | | 3,500,000 | 3,517,529 |
| Series 2018-NYCH Class B |
1-month USD LIBOR + 1.250%
02/15/2032 | 3.147% | | 4,800,000 | 4,823,749 |
| Series 2018-NYCH Class E |
1-month USD LIBOR + 2.900%
02/15/2032 | 4.797% | | 7,587,000 | 7,561,301 |
| UBS-Barclays Commercial Mortgage Trust |
| Series 2012-C4 Class A5 |
| 12/10/2045 | 2.850% | | 2,550,000 | 2,493,378 |
Total Commercial Mortgage-Backed Securities - Non-Agency
(Cost $144,798,840) | 142,824,343 |
| Common Stocks 0.0% |
| Issuer | Shares | Value ($) |
| Financials —% |
| Insurance —% |
| WMI Holdings Corp. Escrow(c),(d),(j),(k) | 2,725 | — |
| WMIH Corp.(j) | 54,217 | 74,278 |
| Total | | 74,278 |
| Total Financials | 74,278 |
| Industrials —% |
| Airlines —% |
| United Continental Holdings, Inc.(j) | 1,493 | 100,837 |
| Total Industrials | 100,837 |
Total Common Stocks
(Cost $1,511,104) | 175,115 |
| Corporate Bonds & Notes 28.5% |
| Issuer | Coupon
Rate | | Principal
Amount ($) | Value ($) |
| Aerospace & Defense 1.2% |
| Bombardier, Inc.(a) |
| 12/01/2021 | 8.750% | | 162,000 | 179,924 |
| 12/01/2024 | 7.500% | | 538,000 | 566,245 |
| Lockheed Martin Corp. |
| 12/15/2042 | 4.070% | | 1,790,000 | 1,732,718 |
| 09/15/2052 | 4.090% | | 2,110,000 | 2,002,428 |
| Northrop Grumman Corp. |
| 06/01/2018 | 1.750% | | 7,765,000 | 7,760,230 |
| 01/15/2025 | 2.930% | | 5,840,000 | 5,532,699 |
| 01/15/2028 | 3.250% | | 3,625,000 | 3,395,070 |
| 10/15/2047 | 4.030% | | 3,815,000 | 3,552,898 |
The accompanying Notes to Financial Statements are an integral part of this statement.
| 12 | Columbia Total Return Bond Fund | Annual Report 2018 |
Portfolio of Investments (continued)
April 30, 2018
| Corporate Bonds & Notes (continued) |
| Issuer | Coupon
Rate | | Principal
Amount ($) | Value ($) |
| TransDigm, Inc. |
| 06/15/2026 | 6.375% | | 1,209,000 | 1,216,796 |
| Total | 25,939,008 |
| Automotive 0.7% |
| Delphi Technologies PLC(a) |
| 10/01/2025 | 5.000% | | 160,000 | 154,153 |
| Ford Motor Co. |
| 02/01/2029 | 6.375% | | 1,857,000 | 2,045,872 |
| 12/08/2046 | 5.291% | | 1,040,000 | 998,926 |
| Ford Motor Credit Co. LLC |
| 11/02/2020 | 2.343% | | 4,580,000 | 4,459,047 |
| Schaeffler Finance BV(a) |
| 05/15/2023 | 4.750% | | 7,720,000 | 7,843,157 |
| Total | 15,501,155 |
| Banking 2.4% |
| Ally Financial, Inc. |
| 09/30/2024 | 5.125% | | 268,000 | 275,229 |
| Banco de Bogota SA(a) |
| Subordinated |
| 05/12/2026 | 6.250% | | 1,555,000 | 1,618,497 |
| Banco Mercantil del Norte SA(a),(l) |
| Subordinated |
| 10/04/2031 | 5.750% | | 1,240,000 | 1,194,762 |
| Bank of New York Mellon Corp. (The) |
| 05/15/2019 | 5.450% | | 3,325,000 | 3,420,910 |
| BBVA Bancomer SA(a),(l) |
| Subordinated |
| 11/12/2029 | 5.350% | | 1,405,000 | 1,369,174 |
| Capital One Financial Corp. |
| 05/12/2020 | 2.500% | | 5,505,000 | 5,422,849 |
| Discover Financial Services |
| 04/27/2022 | 5.200% | | 3,712,000 | 3,871,775 |
| HBOS PLC(a) |
| Subordinated |
| 05/21/2018 | 6.750% | | 8,382,000 | 8,400,283 |
| JPMorgan Chase & Co.(l) |
| 02/01/2028 | 3.782% | | 365,000 | 353,725 |
| JPMorgan Chase & Co.(b) |
| Junior Subordinated |
3-month USD LIBOR + 0.950%
02/02/2037 | 2.728% | | 15,662,000 | 14,260,251 |
| U.S. Bancorp |
| Subordinated |
| 04/27/2026 | 3.100% | | 3,025,000 | 2,842,541 |
| Washington Mutual Bank(c),(d),(m) |
| Subordinated |
| 01/15/2015 | 0.000% | | 27,379,000 | 41,069 |
| Corporate Bonds & Notes (continued) |
| Issuer | Coupon
Rate | | Principal
Amount ($) | Value ($) |
| Wells Fargo & Co. |
| 01/30/2020 | 2.150% | | 4,555,000 | 4,493,444 |
| 10/23/2026 | 3.000% | | 3,855,000 | 3,551,637 |
| Total | 51,116,146 |
| Brokerage/Asset Managers/Exchanges 0.0% |
| NFP Corp.(a) |
| 07/15/2025 | 6.875% | | 269,000 | 266,360 |
| Building Materials 0.2% |
| American Builders & Contractors Supply Co., Inc.(a) |
| 12/15/2023 | 5.750% | | 534,000 | 550,265 |
| Beacon Roofing Supply, Inc. |
| 10/01/2023 | 6.375% | | 169,000 | 177,690 |
| Beacon Roofing Supply, Inc.(a) |
| 11/01/2025 | 4.875% | | 353,000 | 333,377 |
| Cemex SAB de CV(a) |
| 04/16/2026 | 7.750% | | 2,465,000 | 2,701,810 |
| Core & Main LP(a) |
| 08/15/2025 | 6.125% | | 80,000 | 78,750 |
| HD Supply, Inc.(a) |
| 04/15/2024 | 5.750% | | 203,000 | 213,439 |
| James Hardie International Finance DAC(a) |
| 01/15/2025 | 4.750% | | 275,000 | 268,141 |
| Total | 4,323,472 |
| Cable and Satellite 0.4% |
| Altice U.S. Finance I Corp.(a) |
| 05/15/2026 | 5.500% | | 816,000 | 797,640 |
| CCO Holdings LLC/Capital Corp.(a) |
| 05/01/2027 | 5.875% | | 1,614,000 | 1,585,229 |
| Cequel Communications Holdings I LLC/Capital Corp.(a) |
| 04/01/2028 | 7.500% | | 324,000 | 328,437 |
| Charter Communications Operating LLC/Capital |
| 10/23/2045 | 6.484% | | 425,000 | 456,829 |
| CSC Holdings LLC(a) |
| 10/15/2025 | 6.625% | | 524,000 | 539,836 |
| 02/01/2028 | 5.375% | | 850,000 | 795,526 |
| DISH DBS Corp. |
| 07/01/2026 | 7.750% | | 1,398,000 | 1,273,860 |
| Radiate HoldCo LLC/Finance, Inc.(a) |
| 02/15/2023 | 6.875% | | 91,000 | 88,143 |
| 02/15/2025 | 6.625% | | 254,000 | 235,583 |
| Sirius XM Radio, Inc.(a) |
| 04/15/2025 | 5.375% | | 139,000 | 138,643 |
| 07/15/2026 | 5.375% | | 56,000 | 55,023 |
| 08/01/2027 | 5.000% | | 921,000 | 879,602 |
The accompanying Notes to Financial Statements are an integral part of this statement.
Columbia Total Return Bond Fund | Annual Report 2018
| 13 |
Portfolio of Investments (continued)
April 30, 2018
| Corporate Bonds & Notes (continued) |
| Issuer | Coupon
Rate | | Principal
Amount ($) | Value ($) |
| Unitymedia Hessen GmbH & Co. KG NRW(a) |
| 01/15/2025 | 5.000% | | 528,000 | 539,899 |
| Videotron Ltd.(a) |
| 04/15/2027 | 5.125% | | 155,000 | 152,277 |
| Virgin Media Finance PLC(a) |
| 01/15/2025 | 5.750% | | 140,000 | 133,904 |
| Virgin Media Secured Finance PLC(a) |
| 01/15/2026 | 5.250% | | 370,000 | 352,230 |
| Ziggo Bond Finance BV(a) |
| 01/15/2027 | 6.000% | | 335,000 | 312,839 |
| Ziggo Secured Finance BV(a) |
| 01/15/2027 | 5.500% | | 563,000 | 530,730 |
| Total | 9,196,230 |
| Chemicals 0.5% |
| Angus Chemical Co.(a) |
| 02/15/2023 | 8.750% | | 165,000 | 171,779 |
| Atotech U.S.A., Inc.(a) |
| 02/01/2025 | 6.250% | | 251,000 | 253,671 |
| Axalta Coating Systems LLC(a) |
| 08/15/2024 | 4.875% | | 279,000 | 281,211 |
| Chemours Co. (The) |
| 05/15/2023 | 6.625% | | 208,000 | 218,623 |
| INEOS Group Holdings SA(a) |
| 08/01/2024 | 5.625% | | 372,000 | 375,116 |
| Koppers, Inc.(a) |
| 02/15/2025 | 6.000% | | 145,000 | 147,816 |
| LYB International Finance BV |
| 07/15/2043 | 5.250% | | 1,445,000 | 1,547,508 |
| LYB International Finance II BV |
| 03/02/2027 | 3.500% | | 3,876,000 | 3,676,684 |
| LyondellBasell Industries NV |
| 04/15/2024 | 5.750% | | 2,104,000 | 2,286,175 |
| Olin Corp. |
| 02/01/2030 | 5.000% | | 260,000 | 247,772 |
| Platform Specialty Products Corp.(a) |
| 02/01/2022 | 6.500% | | 140,000 | 143,445 |
| 12/01/2025 | 5.875% | | 388,000 | 378,507 |
| PQ Corp.(a) |
| 11/15/2022 | 6.750% | | 331,000 | 350,783 |
| 12/15/2025 | 5.750% | | 236,000 | 233,957 |
| Total | 10,313,047 |
| Construction Machinery 0.1% |
| Ritchie Bros. Auctioneers, Inc.(a) |
| 01/15/2025 | 5.375% | | 126,000 | 125,360 |
| Corporate Bonds & Notes (continued) |
| Issuer | Coupon
Rate | | Principal
Amount ($) | Value ($) |
| United Rentals North America, Inc. |
| 09/15/2026 | 5.875% | | 438,000 | 456,051 |
| 05/15/2027 | 5.500% | | 140,000 | 138,973 |
| 01/15/2028 | 4.875% | | 790,000 | 747,899 |
| Total | 1,468,283 |
| Consumer Cyclical Services 0.4% |
| Amazon.com, Inc.(a) |
| 02/22/2023 | 2.400% | | 6,015,000 | 5,770,063 |
| 08/22/2037 | 3.875% | | 2,180,000 | 2,152,491 |
| APX Group, Inc. |
| 12/01/2022 | 7.875% | | 207,000 | 209,070 |
| 09/01/2023 | 7.625% | | 155,000 | 144,676 |
| Interval Acquisition Corp. |
| 04/15/2023 | 5.625% | | 249,000 | 259,307 |
| Total | 8,535,607 |
| Consumer Products 0.1% |
| Mattel, Inc.(a) |
| 12/31/2025 | 6.750% | | 211,000 | 205,729 |
| Prestige Brands, Inc.(a) |
| 03/01/2024 | 6.375% | | 280,000 | 281,380 |
| Scotts Miracle-Gro Co. (The) |
| 10/15/2023 | 6.000% | | 267,000 | 279,107 |
| 12/15/2026 | 5.250% | | 76,000 | 73,844 |
| Spectrum Brands, Inc. |
| 07/15/2025 | 5.750% | | 404,000 | 404,029 |
| Springs Industries, Inc. |
| 06/01/2021 | 6.250% | | 184,000 | 186,569 |
| Valvoline, Inc. |
| 08/15/2025 | 4.375% | | 156,000 | 150,818 |
| Total | 1,581,476 |
| Diversified Manufacturing 0.0% |
| Apergy Corp.(a),(e) |
| 05/01/2026 | 6.375% | | 221,000 | 224,287 |
| Gates Global LLC/Co.(a) |
| 07/15/2022 | 6.000% | | 133,000 | 134,671 |
| SPX FLOW, Inc.(a) |
| 08/15/2024 | 5.625% | | 116,000 | 117,464 |
| TriMas Corp.(a) |
| 10/15/2025 | 4.875% | | 25,000 | 24,348 |
| Zekelman Industries, Inc.(a) |
| 06/15/2023 | 9.875% | | 188,000 | 207,279 |
| Total | 708,049 |
The accompanying Notes to Financial Statements are an integral part of this statement.
| 14 | Columbia Total Return Bond Fund | Annual Report 2018 |
Portfolio of Investments (continued)
April 30, 2018
| Corporate Bonds & Notes (continued) |
| Issuer | Coupon
Rate | | Principal
Amount ($) | Value ($) |
| Electric 3.1% |
| AES Corp. |
| 03/15/2023 | 4.500% | | 342,000 | 343,724 |
| 09/01/2027 | 5.125% | | 117,000 | 118,630 |
| Calpine Corp. |
| 01/15/2025 | 5.750% | | 96,000 | 88,067 |
| Calpine Corp.(a) |
| 06/01/2026 | 5.250% | | 345,000 | 330,504 |
| CMS Energy Corp. |
| 03/01/2024 | 3.875% | | 1,590,000 | 1,592,528 |
| 02/15/2027 | 2.950% | | 95,000 | 87,125 |
| 08/15/2027 | 3.450% | | 1,325,000 | 1,267,813 |
| Consolidated Edison Co. of New York, Inc. |
| 06/15/2047 | 3.875% | | 4,570,000 | 4,377,384 |
| DTE Energy Co. |
| 10/01/2026 | 2.850% | | 11,572,000 | 10,522,778 |
| Duke Energy Corp. |
| 08/15/2027 | 3.150% | | 2,825,000 | 2,637,160 |
| Duke Energy Progress LLC |
| 03/30/2044 | 4.375% | | 1,635,000 | 1,715,664 |
| 09/15/2047 | 3.600% | | 1,385,000 | 1,290,697 |
| Duke Energy Progress, Inc. |
| 08/15/2045 | 4.200% | | 1,505,000 | 1,540,342 |
| E.ON International Finance BV(a) |
| 04/30/2038 | 6.650% | | 1,885,000 | 2,380,191 |
| Emera U.S. Finance LP |
| 06/15/2046 | 4.750% | | 9,190,000 | 9,148,948 |
| Enel Finance International NV(a) |
| 05/25/2047 | 4.750% | | 2,735,000 | 2,738,761 |
| Energuate Trust(a) |
| 05/03/2027 | 5.875% | | 1,810,000 | 1,783,393 |
| Exelon Corp. |
| 04/15/2046 | 4.450% | | 1,815,000 | 1,815,040 |
| Indiana Michigan Power Co. |
| 07/01/2047 | 3.750% | | 993,000 | 919,974 |
| NextEra Energy Operating Partners LP(a) |
| 09/15/2027 | 4.500% | | 390,000 | 365,100 |
| NRG Energy, Inc. |
| 01/15/2027 | 6.625% | | 295,000 | 303,495 |
| NRG Energy, Inc.(a) |
| 01/15/2028 | 5.750% | | 279,000 | 276,346 |
| NRG Yield Operating LLC |
| 08/15/2024 | 5.375% | | 345,000 | 345,522 |
| 09/15/2026 | 5.000% | | 325,000 | 317,781 |
| Pacific Gas & Electric Co.(a) |
| 12/01/2027 | 3.300% | | 579,000 | 540,132 |
| 12/01/2047 | 3.950% | | 7,360,000 | 6,701,236 |
| Corporate Bonds & Notes (continued) |
| Issuer | Coupon
Rate | | Principal
Amount ($) | Value ($) |
| Pattern Energy Group, Inc.(a) |
| 02/01/2024 | 5.875% | | 227,000 | 232,325 |
| Southern Co. (The) |
| 07/01/2026 | 3.250% | | 6,293,000 | 5,907,145 |
| 07/01/2036 | 4.250% | | 1,275,000 | 1,278,103 |
| TerraForm Power Operating LLC(a) |
| 01/31/2028 | 5.000% | | 194,000 | 181,958 |
| Vistra Energy Corp. |
| 11/01/2024 | 7.625% | | 85,000 | 91,318 |
| Vistra Energy Corp.(a) |
| 01/30/2026 | 8.125% | | 502,000 | 550,965 |
| WEC Energy Group, Inc. |
| 06/15/2025 | 3.550% | | 700,000 | 688,960 |
| Xcel Energy, Inc. |
| 06/01/2025 | 3.300% | | 3,165,000 | 3,067,103 |
| Total | 65,546,212 |
| Finance Companies 1.5% |
| Aircastle Ltd. |
| 02/15/2022 | 5.500% | | 7,386,000 | 7,681,935 |
| Avolon Holdings Funding Ltd.(a) |
| 01/15/2023 | 5.500% | | 322,000 | 320,070 |
| CIT Group, Inc. |
| 03/07/2025 | 5.250% | | 81,000 | 82,722 |
| GE Capital International Funding Co. Unlimited Co. |
| 11/15/2020 | 2.342% | | 10,000,000 | 9,777,950 |
| 11/15/2035 | 4.418% | | 11,580,000 | 11,099,001 |
| iStar, Inc. |
| 04/01/2022 | 6.000% | | 169,000 | 170,147 |
| Navient Corp. |
| 06/15/2022 | 6.500% | | 830,000 | 852,987 |
| Provident Funding Associates LP/Finance Corp.(a) |
| 06/15/2025 | 6.375% | | 136,000 | 136,810 |
| Quicken Loans, Inc.(a) |
| 05/01/2025 | 5.750% | | 308,000 | 303,154 |
| Springleaf Finance Corp. |
| 03/15/2023 | 5.625% | | 73,000 | 73,114 |
| 03/15/2025 | 6.875% | | 304,000 | 306,925 |
| Unifin Financiera SAB de CV SOFOM ENR(a) |
| 01/15/2025 | 7.000% | | 1,440,000 | 1,400,409 |
| Total | 32,205,224 |
| Food and Beverage 2.0% |
| Anheuser-Busch InBev Finance, Inc. |
| 02/01/2046 | 4.900% | | 4,808,000 | 4,981,381 |
| Anheuser-Busch InBev Worldwide, Inc. |
| 04/15/2058 | 4.750% | | 1,017,000 | 1,017,385 |
The accompanying Notes to Financial Statements are an integral part of this statement.
Columbia Total Return Bond Fund | Annual Report 2018
| 15 |
Portfolio of Investments (continued)
April 30, 2018
| Corporate Bonds & Notes (continued) |
| Issuer | Coupon
Rate | | Principal
Amount ($) | Value ($) |
| Aramark Services, Inc.(a) |
| 02/01/2028 | 5.000% | | 546,000 | 531,277 |
| B&G Foods, Inc. |
| 04/01/2025 | 5.250% | | 289,000 | 264,697 |
| Bacardi Ltd.(a) |
| 05/15/2048 | 5.300% | | 10,345,000 | 10,205,715 |
| Chobani LLC/Finance Corp., Inc.(a) |
| 04/15/2025 | 7.500% | | 254,000 | 255,276 |
| FAGE International SA/U.S.A. Dairy Industry, Inc.(a) |
| 08/15/2026 | 5.625% | | 378,000 | 353,837 |
| Kraft Heinz Foods Co. |
| 06/01/2046 | 4.375% | | 8,908,000 | 7,958,176 |
| Lamb Weston Holdings, Inc.(a) |
| 11/01/2024 | 4.625% | | 92,000 | 91,115 |
| 11/01/2026 | 4.875% | | 175,000 | 174,421 |
| MARB BondCo PLC(a) |
| 03/15/2024 | 7.000% | | 1,050,000 | 1,004,954 |
| MHP SE(a) |
| 05/10/2024 | 7.750% | | 1,515,000 | 1,563,797 |
| Molson Coors Brewing Co. |
| 07/15/2046 | 4.200% | | 4,653,000 | 4,261,566 |
| Mondelez International, Inc.(a) |
| 10/28/2019 | 1.625% | | 6,000,000 | 5,884,002 |
| Post Holdings, Inc.(a) |
| 08/15/2026 | 5.000% | | 529,000 | 497,242 |
| 03/01/2027 | 5.750% | | 882,000 | 863,957 |
| 01/15/2028 | 5.625% | | 92,000 | 87,860 |
| Tyson Foods, Inc.(b) |
3-month USD LIBOR + 0.450%
08/21/2020 | 2.342% | | 2,200,000 | 2,203,549 |
| Total | 42,200,207 |
| Gaming 0.2% |
| Boyd Gaming Corp. |
| 05/15/2023 | 6.875% | | 198,000 | 207,900 |
| Caesars Resort Collection LLC/CRC Finco, Inc.(a) |
| 10/15/2025 | 5.250% | | 99,000 | 94,535 |
| Eldorado Resorts, Inc. |
| 04/01/2025 | 6.000% | | 187,000 | 185,222 |
| GLP Capital LP/Financing II, Inc. |
| 04/15/2026 | 5.375% | | 227,000 | 228,749 |
| International Game Technology PLC(a) |
| 02/15/2022 | 6.250% | | 515,000 | 541,338 |
| 02/15/2025 | 6.500% | | 275,000 | 293,527 |
| Jack Ohio Finance LLC/1 Corp.(a) |
| 11/15/2021 | 6.750% | | 159,000 | 164,573 |
| MGM Growth Properties Operating Partnership LP/Finance Co-Issuer, Inc. |
| 09/01/2026 | 4.500% | | 238,000 | 224,751 |
| Corporate Bonds & Notes (continued) |
| Issuer | Coupon
Rate | | Principal
Amount ($) | Value ($) |
| MGM Resorts International |
| 03/15/2023 | 6.000% | | 506,000 | 529,184 |
| 09/01/2026 | 4.625% | | 170,000 | 160,672 |
| Penn National Gaming, Inc.(a) |
| 01/15/2027 | 5.625% | | 546,000 | 524,119 |
| Rivers Pittsburgh Borrower LP/Finance Corp.(a) |
| 08/15/2021 | 6.125% | | 185,000 | 181,925 |
| Scientific Games International, Inc. |
| 12/01/2022 | 10.000% | | 255,000 | 274,765 |
| Scientific Games International, Inc.(a) |
| 10/15/2025 | 5.000% | | 699,000 | 675,468 |
| Tunica-Biloxi Gaming Authority(a) |
| 12/15/2020 | 3.780% | | 764,067 | 206,298 |
| Wynn Las Vegas LLC/Capital Corp.(a) |
| 03/01/2025 | 5.500% | | 288,000 | 286,275 |
| 05/15/2027 | 5.250% | | 115,000 | 110,857 |
| Total | 4,890,158 |
| Health Care 1.6% |
| Acadia Healthcare Co., Inc. |
| 03/01/2024 | 6.500% | | 369,000 | 381,915 |
| Amsurg Corp. |
| 07/15/2022 | 5.625% | | 91,000 | 91,276 |
| Becton Dickinson and Co.(b) |
3-month USD LIBOR + 1.030%
06/06/2022 | 3.055% | | 4,916,000 | 4,942,571 |
| Becton Dickinson and Co. |
| 05/15/2044 | 4.875% | | 2,430,000 | 2,344,670 |
| Cardinal Health, Inc. |
| 06/15/2027 | 3.410% | | 4,920,000 | 4,568,304 |
| 06/15/2047 | 4.368% | | 2,480,000 | 2,317,416 |
| Change Healthcare Holdings LLC/Finance, Inc.(a) |
| 03/01/2025 | 5.750% | | 348,000 | 340,434 |
| Charles River Laboratories International, Inc.(a) |
| 04/01/2026 | 5.500% | | 99,000 | 100,695 |
| CHS/Community Health Systems, Inc. |
| 02/01/2022 | 6.875% | | 162,000 | 88,344 |
| 03/31/2023 | 6.250% | | 152,000 | 138,818 |
| CVS Health Corp. |
| 03/25/2048 | 5.050% | | 3,275,000 | 3,344,450 |
| DaVita, Inc. |
| 07/15/2024 | 5.125% | | 138,000 | 133,860 |
| 05/01/2025 | 5.000% | | 559,000 | 529,919 |
| Envision Healthcare Corp.(a) |
| 12/01/2024 | 6.250% | | 4,000 | 4,160 |
| Express Scripts Holding Co. |
| 07/15/2046 | 4.800% | | 4,564,000 | 4,482,514 |
The accompanying Notes to Financial Statements are an integral part of this statement.
| 16 | Columbia Total Return Bond Fund | Annual Report 2018 |
Portfolio of Investments (continued)
April 30, 2018
| Corporate Bonds & Notes (continued) |
| Issuer | Coupon
Rate | | Principal
Amount ($) | Value ($) |
| HCA, Inc. |
| 04/15/2025 | 5.250% | | 873,000 | 884,924 |
| Hill-Rom Holdings, Inc.(a) |
| 02/15/2025 | 5.000% | | 138,000 | 136,895 |
| Hologic, Inc.(a) |
| 10/15/2025 | 4.375% | | 40,000 | 38,491 |
| 02/01/2028 | 4.625% | | 263,000 | 250,728 |
| IQVIA, Inc.(a) |
| 10/15/2026 | 5.000% | | 86,000 | 84,876 |
| Memorial Sloan-Kettering Cancer Center |
| 07/01/2052 | 4.125% | | 6,945,000 | 6,871,466 |
| MPH Acquisition Holdings LLC(a) |
| 06/01/2024 | 7.125% | | 517,000 | 525,671 |
| Polaris Intermediate Corp. PIK(a) |
| 12/01/2022 | 8.500% | | 83,000 | 84,209 |
| Sotera Health Holdings LLC(a) |
| 05/15/2023 | 6.500% | | 228,000 | 228,742 |
| Teleflex, Inc. |
| 11/15/2027 | 4.625% | | 80,000 | 76,741 |
| Tenet Healthcare Corp.(a) |
| 07/15/2024 | 4.625% | | 235,000 | 227,206 |
| 05/01/2025 | 5.125% | | 122,000 | 118,579 |
| 08/01/2025 | 7.000% | | 183,000 | 179,893 |
| Total | 33,517,767 |
| Healthcare Insurance 0.1% |
| Centene Corp. |
| 01/15/2025 | 4.750% | | 557,000 | 541,579 |
| Molina Healthcare, Inc.(a) |
| 06/15/2025 | 4.875% | | 8,000 | 7,600 |
| WellCare Health Plans, Inc. |
| 04/01/2025 | 5.250% | | 524,000 | 527,596 |
| Total | 1,076,775 |
| Home Construction 0.1% |
| Lennar Corp.(a) |
| 11/15/2024 | 5.875% | | 173,000 | 178,462 |
| 11/29/2027 | 4.750% | | 131,000 | 123,544 |
| Meritage Homes Corp. |
| 04/01/2022 | 7.000% | | 213,000 | 234,006 |
| Meritage Homes Corp.(a) |
| 06/01/2025 | 6.000% | | 307,000 | 315,856 |
| Taylor Morrison Communities, Inc./Holdings II(a) |
| 04/15/2023 | 5.875% | | 156,000 | 159,941 |
| Total | 1,011,809 |
| Corporate Bonds & Notes (continued) |
| Issuer | Coupon
Rate | | Principal
Amount ($) | Value ($) |
| Independent Energy 0.6% |
| Callon Petroleum Co. |
| 10/01/2024 | 6.125% | | 162,000 | 165,625 |
| Canadian Natural Resources Ltd. |
| 06/30/2033 | 6.450% | | 855,000 | 1,005,945 |
| Carrizo Oil & Gas, Inc. |
| 04/15/2023 | 6.250% | | 238,000 | 243,897 |
| Centennial Resource Production LLC(a) |
| 01/15/2026 | 5.375% | | 50,000 | 49,556 |
| Continental Resources, Inc. |
| 04/15/2023 | 4.500% | | 186,000 | 188,246 |
| 06/01/2024 | 3.800% | | 1,165,000 | 1,133,709 |
| CrownRock LP/Finance, Inc.(a) |
| 10/15/2025 | 5.625% | | 579,000 | 573,413 |
| Diamondback Energy, Inc. |
| 05/31/2025 | 5.375% | | 3,282,000 | 3,335,244 |
| Endeavor Energy Resources LP/Finance, Inc.(a) |
| 01/30/2026 | 5.500% | | 22,000 | 22,068 |
| 01/30/2028 | 5.750% | | 582,000 | 585,110 |
| Extraction Oil & Gas, Inc.(a) |
| 05/15/2024 | 7.375% | | 127,000 | 133,153 |
| 02/01/2026 | 5.625% | | 205,000 | 198,648 |
| Halcon Resources Corp.(a) |
| 02/15/2025 | 6.750% | | 443,000 | 439,846 |
| Halcon Resources Corp. |
| 02/15/2025 | 6.750% | | 104,000 | 103,843 |
| Hess Corp. |
| 02/15/2041 | 5.600% | | 945,000 | 956,118 |
| 04/01/2047 | 5.800% | | 3,000 | 3,120 |
| Indigo Natural Resources LLC(a) |
| 02/15/2026 | 6.875% | | 190,000 | 182,217 |
| Jagged Peak Energy LLC(a),(e) |
| 05/01/2026 | 5.875% | | 243,000 | 244,010 |
| Laredo Petroleum, Inc. |
| 03/15/2023 | 6.250% | | 357,000 | 361,553 |
| Parsley Energy LLC/Finance Corp.(a) |
| 08/15/2025 | 5.250% | | 408,000 | 407,293 |
| 10/15/2027 | 5.625% | | 70,000 | 70,920 |
| PDC Energy, Inc. |
| 09/15/2024 | 6.125% | | 232,000 | 237,870 |
| PDC Energy, Inc.(a) |
| 05/15/2026 | 5.750% | | 275,000 | 277,030 |
| RSP Permian, Inc. |
| 01/15/2025 | 5.250% | | 321,000 | 330,220 |
| SM Energy Co. |
| 09/15/2026 | 6.750% | | 685,000 | 697,973 |
The accompanying Notes to Financial Statements are an integral part of this statement.
Columbia Total Return Bond Fund | Annual Report 2018
| 17 |
Portfolio of Investments (continued)
April 30, 2018
| Corporate Bonds & Notes (continued) |
| Issuer | Coupon
Rate | | Principal
Amount ($) | Value ($) |
| Whiting Petroleum Corp.(a) |
| 01/15/2026 | 6.625% | | 234,000 | 240,710 |
| WPX Energy, Inc. |
| 01/15/2022 | 6.000% | | 107,000 | 111,882 |
| 09/15/2024 | 5.250% | | 313,000 | 315,352 |
| Total | 12,614,571 |
| Integrated Energy 0.2% |
| Cenovus Energy, Inc. |
| 11/15/2039 | 6.750% | | 4,530,000 | 5,150,198 |
| Leisure 0.0% |
| Boyne U.S.A., Inc.(a) |
| 05/01/2025 | 7.250% | | 150,000 | 154,835 |
| Cedar Fair LP/Canada’s Wonderland Co./Magnum Management Corp./Millenium Operations LLC(a) |
| 04/15/2027 | 5.375% | | 157,000 | 156,205 |
| Live Nation Entertainment, Inc.(a) |
| 11/01/2024 | 4.875% | | 108,000 | 105,709 |
| 03/15/2026 | 5.625% | | 92,000 | 91,963 |
| LTF Merger Sub, Inc.(a) |
| 06/15/2023 | 8.500% | | 102,000 | 106,761 |
| Viking Cruises Ltd.(a) |
| 09/15/2027 | 5.875% | | 115,000 | 110,924 |
| Total | 726,397 |
| Life Insurance 1.3% |
| Brighthouse Financial, Inc.(a) |
| 06/22/2047 | 4.700% | | 4,240,000 | 3,719,968 |
| Massachusetts Mutual Life Insurance Co.(a) |
| Subordinated |
| 04/15/2065 | 4.500% | | 1,095,000 | 1,051,026 |
| MetLife, Inc.(a),(l) |
| Junior Subordinated |
| 04/08/2068 | 9.250% | | 5,458,000 | 7,441,961 |
| Northwestern Mutual Life Insurance Co. (The)(a) |
| Subordinated |
| 09/30/2047 | 3.850% | | 3,690,000 | 3,429,711 |
| Peachtree Corners Funding Trust(a) |
| 02/15/2025 | 3.976% | | 2,705,000 | 2,661,214 |
| Teachers Insurance & Annuity Association of America(a) |
| Subordinated |
| 09/15/2044 | 4.900% | | 395,000 | 421,330 |
| 05/15/2047 | 4.270% | | 5,145,000 | 5,006,116 |
| Voya Financial, Inc. |
| 06/15/2026 | 3.650% | | 1,592,000 | 1,521,468 |
| 06/15/2046 | 4.800% | | 1,858,000 | 1,845,126 |
| Total | 27,097,920 |
| Corporate Bonds & Notes (continued) |
| Issuer | Coupon
Rate | | Principal
Amount ($) | Value ($) |
| Lodging 0.1% |
| Grupo Posadas SAB de CV(a) |
| 06/30/2022 | 7.875% | | 2,210,000 | 2,295,996 |
| Hilton Domestic Operating Co., Inc. |
| 09/01/2024 | 4.250% | | 237,000 | 227,801 |
| Hilton Domestic Operating Co., Inc.(a) |
| 05/01/2026 | 5.125% | | 151,000 | 150,783 |
| Total | 2,674,580 |
| Media and Entertainment 0.2% |
| Discovery Communications LLC |
| 09/20/2047 | 5.200% | | 846,000 | 827,769 |
| Match Group, Inc. |
| 06/01/2024 | 6.375% | | 334,000 | 353,839 |
| Match Group, Inc.(a) |
| 12/15/2027 | 5.000% | | 21,000 | 20,632 |
| MDC Partners, Inc.(a) |
| 05/01/2024 | 6.500% | | 115,000 | 113,060 |
| Netflix, Inc. |
| 11/15/2026 | 4.375% | | 230,000 | 215,320 |
| Netflix, Inc.(a) |
| 04/15/2028 | 4.875% | | 1,039,000 | 979,118 |
| 11/15/2028 | 5.875% | | 338,000 | 337,239 |
| Nielsen Luxembourg SARL(a) |
| 02/01/2025 | 5.000% | | 187,000 | 183,693 |
| Outfront Media Capital LLC/Corp. |
| 03/15/2025 | 5.875% | | 369,000 | 376,634 |
| Total | 3,407,304 |
| Metals and Mining 0.1% |
| Big River Steel LLC/Finance Corp.(a) |
| 09/01/2025 | 7.250% | | 304,000 | 317,324 |
| Constellium NV(a) |
| 05/15/2024 | 5.750% | | 381,000 | 375,179 |
| 02/15/2026 | 5.875% | | 280,000 | 276,952 |
| Freeport-McMoRan, Inc. |
| 11/14/2024 | 4.550% | | 351,000 | 340,435 |
| 03/15/2043 | 5.450% | | 772,000 | 699,530 |
| Grinding Media, Inc./Moly-Cop AltaSteel Ltd.(a) |
| 12/15/2023 | 7.375% | | 86,000 | 90,743 |
| HudBay Minerals, Inc.(a) |
| 01/15/2025 | 7.625% | | 222,000 | 236,606 |
| Novelis Corp.(a) |
| 09/30/2026 | 5.875% | | 230,000 | 228,507 |
| Teck Resources Ltd. |
| 07/15/2041 | 6.250% | | 427,000 | 453,248 |
| Total | 3,018,524 |
The accompanying Notes to Financial Statements are an integral part of this statement.
| 18 | Columbia Total Return Bond Fund | Annual Report 2018 |
Portfolio of Investments (continued)
April 30, 2018
| Corporate Bonds & Notes (continued) |
| Issuer | Coupon
Rate | | Principal
Amount ($) | Value ($) |
| Midstream 1.1% |
| Andeavor Logistics LP/Tesoro Finance Corp. |
| 01/15/2025 | 5.250% | | 137,000 | 140,410 |
| Delek Logistics Partners LP(a) |
| 05/15/2025 | 6.750% | | 143,000 | 142,840 |
| Energy Transfer Equity LP |
| 06/01/2027 | 5.500% | | 1,230,000 | 1,226,492 |
| Enterprise Products Operating LLC |
| 02/15/2045 | 5.100% | | 1,837,000 | 1,954,946 |
| Holly Energy Partners LP/Finance Corp.(a) |
| 08/01/2024 | 6.000% | | 528,000 | 531,539 |
| Kinder Morgan Energy Partners LP |
| 03/15/2032 | 7.750% | | 990,000 | 1,222,768 |
| 01/15/2038 | 6.950% | | 360,000 | 425,942 |
| 11/15/2040 | 7.500% | | 1,555,000 | 1,899,639 |
| Kinder Morgan, Inc. |
| 02/15/2046 | 5.050% | | 5,900,000 | 5,672,201 |
| NGPL PipeCo LLC(a) |
| 08/15/2022 | 4.375% | | 66,000 | 65,707 |
| 08/15/2027 | 4.875% | | 80,000 | 77,731 |
| 12/15/2037 | 7.768% | | 98,000 | 118,191 |
| NuStar Logistics LP |
| 04/28/2027 | 5.625% | | 159,000 | 150,618 |
| Plains All American Pipeline LP/Finance Corp. |
| 10/15/2023 | 3.850% | | 1,715,000 | 1,669,230 |
| 06/01/2042 | 5.150% | | 2,134,000 | 2,001,308 |
| 06/15/2044 | 4.700% | | 2,840,000 | 2,530,869 |
| 02/15/2045 | 4.900% | | 380,000 | 348,974 |
| Rockpoint Gas Storage Canada Ltd.(a) |
| 03/31/2023 | 7.000% | | 214,000 | 213,615 |
| Sunoco LP/Finance Corp.(a) |
| 01/15/2023 | 4.875% | | 104,000 | 102,284 |
| 02/15/2026 | 5.500% | | 343,000 | 332,859 |
| 03/15/2028 | 5.875% | | 107,000 | 103,930 |
| Tallgrass Energy Partners LP/Finance Corp.(a) |
| 01/15/2028 | 5.500% | | 548,000 | 545,322 |
| Targa Resources Partners LP/Finance Corp.(a) |
| 04/15/2026 | 5.875% | | 118,000 | 117,144 |
| 01/15/2028 | 5.000% | | 90,000 | 83,926 |
| Targa Resources Partners LP/Finance Corp. |
| 02/01/2027 | 5.375% | | 1,341,000 | 1,284,011 |
| TransMontaigne Partners LP/TLP Finance Corp. |
| 02/15/2026 | 6.125% | | 234,000 | 233,995 |
| Total | 23,196,491 |
| Natural Gas 0.9% |
| Boston Gas Co.(a) |
| 08/01/2027 | 3.150% | | 2,295,000 | 2,175,683 |
| Corporate Bonds & Notes (continued) |
| Issuer | Coupon
Rate | | Principal
Amount ($) | Value ($) |
| NiSource, Inc. |
| 02/15/2023 | 3.850% | | 3,305,000 | 3,321,796 |
| 05/15/2047 | 4.375% | | 4,850,000 | 4,798,294 |
| Sempra Energy |
| 11/15/2020 | 2.850% | | 5,135,000 | 5,074,962 |
| 11/15/2025 | 3.750% | | 3,620,000 | 3,564,726 |
| 06/15/2027 | 3.250% | | 302,000 | 283,374 |
| Total | 19,218,835 |
| Oil Field Services 0.1% |
| Diamond Offshore Drilling, Inc. |
| 08/15/2025 | 7.875% | | 134,000 | 137,576 |
| Nabors Industries, Inc.(a) |
| 02/01/2025 | 5.750% | | 555,000 | 527,568 |
| Rowan Companies, Inc. |
| 01/15/2024 | 4.750% | | 159,000 | 136,343 |
| SESI LLC(a) |
| 09/15/2024 | 7.750% | | 282,000 | 292,689 |
| Transocean, Inc.(a) |
| 01/15/2026 | 7.500% | | 105,000 | 106,538 |
| U.S.A. Compression Partners LP/Finance Corp.(a) |
| 04/01/2026 | 6.875% | | 245,000 | 249,900 |
| Weatherford International LLC(a) |
| 03/01/2025 | 9.875% | | 60,000 | 57,130 |
| Weatherford International Ltd. |
| 02/15/2024 | 9.875% | | 153,000 | 146,923 |
| 08/01/2036 | 6.500% | | 45,000 | 34,244 |
| Total | 1,688,911 |
| Other Industry 0.4% |
| KAR Auction Services, Inc.(a) |
| 06/01/2025 | 5.125% | | 346,000 | 337,745 |
| Massachusetts Institute of Technology |
| 07/01/2114 | 4.678% | | 2,869,000 | 3,078,271 |
| 07/01/2116 | 3.885% | | 1,510,000 | 1,372,296 |
| President and Fellows of Harvard College |
| 07/15/2046 | 3.150% | | 1,454,000 | 1,297,728 |
| 07/15/2056 | 3.300% | | 2,495,000 | 2,264,435 |
| Total | 8,350,475 |
| Other REIT 0.0% |
| CyrusOne LP/Finance Corp. |
| 03/15/2024 | 5.000% | | 159,000 | 159,670 |
| 03/15/2027 | 5.375% | | 453,000 | 453,611 |
| Total | 613,281 |
| Packaging 0.1% |
| Ardagh Packaging Finance PLC/Holdings U.S.A., Inc.(a) |
| 02/15/2025 | 6.000% | | 501,000 | 507,422 |
The accompanying Notes to Financial Statements are an integral part of this statement.
Columbia Total Return Bond Fund | Annual Report 2018
| 19 |
Portfolio of Investments (continued)
April 30, 2018
| Corporate Bonds & Notes (continued) |
| Issuer | Coupon
Rate | | Principal
Amount ($) | Value ($) |
| Crown Americas LLC/Capital Corp. VI(a) |
| 02/01/2026 | 4.750% | | 161,000 | 155,377 |
| Multi-Color Corp.(a) |
| 11/01/2025 | 4.875% | | 159,000 | 148,710 |
| Novolex (a) |
| 01/15/2025 | 6.875% | | 93,000 | 93,630 |
| Reynolds Group Issuer, Inc./LLC(a) |
| 07/15/2024 | 7.000% | | 159,000 | 165,464 |
| Total | 1,070,603 |
| Pharmaceuticals 1.9% |
| AbbVie, Inc. |
| 05/14/2020 | 2.500% | | 3,380,000 | 3,338,767 |
| Allergan Funding SCS |
| 03/15/2025 | 3.800% | | 5,558,000 | 5,340,760 |
| Amgen, Inc. |
| 05/22/2019 | 2.200% | | 15,367,000 | 15,284,955 |
| 05/01/2045 | 4.400% | | 1,805,000 | 1,751,310 |
| 06/15/2048 | 4.563% | | 2,383,000 | 2,357,249 |
| Catalent Pharma Solutions, Inc.(a) |
| 01/15/2026 | 4.875% | | 158,000 | 153,723 |
| Celgene Corp. |
| 02/20/2048 | 4.550% | | 1,870,000 | 1,761,776 |
| Gilead Sciences, Inc. |
| 09/20/2019 | 1.850% | | 2,190,000 | 2,161,935 |
| Jaguar Holding Co. II/Pharmaceutical Product Development LLC(a) |
| 08/01/2023 | 6.375% | | 346,000 | 352,098 |
| Johnson & Johnson |
| 12/05/2033 | 4.375% | | 1,798,000 | 1,922,116 |
| 03/03/2037 | 3.625% | | 2,815,000 | 2,746,863 |
| Valeant Pharmaceuticals International, Inc.(a) |
| 03/15/2024 | 7.000% | | 114,000 | 120,379 |
| 04/15/2025 | 6.125% | | 1,216,000 | 1,094,703 |
| 11/01/2025 | 5.500% | | 551,000 | 548,245 |
| 04/01/2026 | 9.250% | | 360,000 | 366,883 |
| Total | 39,301,762 |
| Property & Casualty 0.5% |
| CNA Financial Corp. |
| 08/15/2027 | 3.450% | | 7,772,000 | 7,284,392 |
| HUB International Ltd.(a) |
| 10/01/2021 | 7.875% | | 514,000 | 535,738 |
| 05/01/2026 | 7.000% | | 260,000 | 260,290 |
| Liberty Mutual Group, Inc.(a) |
| 05/01/2042 | 6.500% | | 1,150,000 | 1,419,565 |
| Total | 9,499,985 |
| Corporate Bonds & Notes (continued) |
| Issuer | Coupon
Rate | | Principal
Amount ($) | Value ($) |
| Railroads 0.5% |
| Canadian National Railway Co. |
| 02/03/2020 | 2.400% | | 5,115,000 | 5,076,366 |
| CSX Corp. |
| 05/30/2042 | 4.750% | | 1,335,000 | 1,390,141 |
| 11/01/2046 | 3.800% | | 710,000 | 641,146 |
| 11/01/2066 | 4.250% | | 4,481,000 | 3,976,453 |
| Total | 11,084,106 |
| Restaurants 0.0% |
| 1011778 BC ULC/New Red Finance, Inc.(a) |
| 05/15/2024 | 4.250% | | 213,000 | 203,628 |
| 10/15/2025 | 5.000% | | 200,000 | 192,742 |
| IRB Holding Corp.(a) |
| 02/15/2026 | 6.750% | | 113,000 | 109,604 |
| KFC Holding Co./Pizza Hut Holdings LLC/Taco Bell of America LLC(a) |
| 06/01/2026 | 5.250% | | 222,000 | 223,110 |
| Total | 729,084 |
| Retail REIT 0.2% |
| Kimco Realty Corp. |
| 03/01/2024 | 2.700% | | 3,369,000 | 3,136,916 |
| Retailers 0.1% |
| Cencosud SA(a) |
| 02/12/2045 | 6.625% | | 880,000 | 936,553 |
| L Brands, Inc. |
| 02/01/2028 | 5.250% | | 180,000 | 169,150 |
| 11/01/2035 | 6.875% | | 200,000 | 189,728 |
| Penske Automotive Group, Inc. |
| 12/01/2024 | 5.375% | | 73,000 | 72,407 |
| 05/15/2026 | 5.500% | | 130,000 | 126,194 |
| Total | 1,494,032 |
| Supermarkets 0.4% |
| Kroger Co. (The) |
| 04/15/2042 | 5.000% | | 1,527,000 | 1,503,397 |
| 01/15/2048 | 4.650% | | 6,723,000 | 6,311,015 |
| Total | 7,814,412 |
| Technology 2.1% |
| Apple, Inc. |
| 09/12/2027 | 2.900% | | 3,645,000 | 3,430,309 |
| 09/12/2047 | 3.750% | | 1,965,000 | 1,834,606 |
| Ascend Learning LLC(a) |
| 08/01/2025 | 6.875% | | 60,000 | 61,028 |
| Broadcom Corp./Cayman Finance Ltd. |
| 01/15/2027 | 3.875% | | 17,880,000 | 17,071,647 |
The accompanying Notes to Financial Statements are an integral part of this statement.
| 20 | Columbia Total Return Bond Fund | Annual Report 2018 |
Portfolio of Investments (continued)
April 30, 2018
| Corporate Bonds & Notes (continued) |
| Issuer | Coupon
Rate | | Principal
Amount ($) | Value ($) |
| Camelot Finance SA(a) |
| 10/15/2024 | 7.875% | | 357,000 | 371,919 |
| CDK Global, Inc. |
| 06/01/2027 | 4.875% | | 92,000 | 88,235 |
| Cisco Systems, Inc.(b) |
3-month USD LIBOR + 0.340%
09/20/2019 | 2.542% | | 7,345,000 | 7,371,442 |
| Equinix, Inc. |
| 01/15/2026 | 5.875% | | 187,000 | 193,519 |
| 05/15/2027 | 5.375% | | 931,000 | 945,686 |
| First Data Corp.(a) |
| 12/01/2023 | 7.000% | | 556,000 | 581,894 |
| Gartner, Inc.(a) |
| 04/01/2025 | 5.125% | | 347,000 | 348,740 |
| Informatica LLC(a) |
| 07/15/2023 | 7.125% | | 205,000 | 205,351 |
| Iron Mountain, Inc.(a) |
| 03/15/2028 | 5.250% | | 283,000 | 266,270 |
| Oracle Corp. |
| 11/15/2027 | 3.250% | | 7,070,000 | 6,803,143 |
| 11/15/2047 | 4.000% | | 3,030,000 | 2,941,945 |
| PTC, Inc. |
| 05/15/2024 | 6.000% | | 220,000 | 231,079 |
| Qualitytech LP/QTS Finance Corp.(a) |
| 11/15/2025 | 4.750% | | 554,000 | 521,812 |
| Sensata Technologies UK Financing Co. PLC(a) |
| 02/15/2026 | 6.250% | | 152,000 | 158,265 |
| Symantec Corp.(a) |
| 04/15/2025 | 5.000% | | 535,000 | 535,635 |
| Tempo Acquisition LLC/Finance Corp.(a) |
| 06/01/2025 | 6.750% | | 139,000 | 138,024 |
| Vantiv LLC/Vanity Issuer Corp.(a) |
| 11/15/2025 | 4.375% | | 58,000 | 55,561 |
| VeriSign, Inc. |
| 07/15/2027 | 4.750% | | 180,000 | 172,848 |
| Total | 44,328,958 |
| Tobacco 0.3% |
| BAT Capital Corp.(a) |
| 08/14/2020 | 2.297% | | 5,505,000 | 5,386,499 |
| Transportation Services 0.5% |
| Avis Budget Car Rental LLC/Finance, Inc.(a) |
| 03/15/2025 | 5.250% | | 213,000 | 203,906 |
| ERAC U.S.A. Finance LLC(a) |
| 12/01/2026 | 3.300% | | 2,705,000 | 2,559,482 |
| 03/15/2042 | 5.625% | | 2,332,000 | 2,601,929 |
| 11/01/2046 | 4.200% | | 1,523,000 | 1,402,299 |
| Corporate Bonds & Notes (continued) |
| Issuer | Coupon
Rate | | Principal
Amount ($) | Value ($) |
| FedEx Corp. |
| 04/01/2046 | 4.550% | | 2,860,000 | 2,816,765 |
| Hertz Corp. (The)(a) |
| 06/01/2022 | 7.625% | | 116,000 | 118,203 |
| Total | 9,702,584 |
| Wireless 1.1% |
| Altice France SA(a) |
| 05/01/2026 | 7.375% | | 1,131,000 | 1,097,135 |
| America Movil SAB de CV |
| 03/30/2020 | 5.000% | | 8,090,000 | 8,339,722 |
| Comunicaciones Celulares SA Via Comcel Trust(a) |
| 02/06/2024 | 6.875% | | 855,000 | 888,648 |
| Millicom International Cellular SA(a) |
| 01/15/2028 | 5.125% | | 315,000 | 297,767 |
| SBA Communications Corp. |
| 09/01/2024 | 4.875% | | 469,000 | 451,553 |
| Sprint Corp. |
| 06/15/2024 | 7.125% | | 124,000 | 128,465 |
| 02/15/2025 | 7.625% | | 1,259,000 | 1,325,095 |
| 03/01/2026 | 7.625% | | 295,000 | 310,708 |
| Sprint Spectrum Co. I/II/III LLC(a) |
| 09/20/2021 | 3.360% | | 8,133,125 | 8,105,619 |
| T-Mobile U.S.A., Inc. |
| 01/15/2026 | 6.500% | | 1,034,000 | 1,099,905 |
| 02/01/2026 | 4.500% | | 172,000 | 165,478 |
| 02/01/2028 | 4.750% | | 286,000 | 275,439 |
| Wind Tre SpA(a) |
| 01/20/2026 | 5.000% | | 138,000 | 115,423 |
| Total | 22,600,957 |
| Wirelines 1.2% |
| AT&T, Inc. |
| 03/01/2037 | 5.250% | | 3,610,000 | 3,691,117 |
| 03/01/2047 | 5.450% | | 2,445,000 | 2,499,436 |
| 08/14/2058 | 5.300% | | 2,200,000 | 2,225,898 |
| CenturyLink, Inc. |
| 03/15/2022 | 5.800% | | 48,000 | 47,762 |
| 12/01/2023 | 6.750% | | 560,000 | 558,249 |
| Deutsche Telekom International Finance BV |
| 06/01/2032 | 9.250% | | 1,100,000 | 1,652,789 |
| Frontier Communications Corp. |
| 01/15/2023 | 7.125% | | 371,000 | 265,212 |
| Frontier Communications Corp.(a) |
| 04/01/2026 | 8.500% | | 169,000 | 164,006 |
| Level 3 Financing, Inc. |
| 05/01/2025 | 5.375% | | 191,000 | 187,850 |
The accompanying Notes to Financial Statements are an integral part of this statement.
Columbia Total Return Bond Fund | Annual Report 2018
| 21 |
Portfolio of Investments (continued)
April 30, 2018
| Corporate Bonds & Notes (continued) |
| Issuer | Coupon
Rate | | Principal
Amount ($) | Value ($) |
| Liquid Telecommunications Financing PLC(a) |
| 07/13/2022 | 8.500% | | 1,905,000 | 2,009,971 |
| Telecom Italia Capital SA |
| 09/30/2034 | 6.000% | | 465,000 | 483,076 |
| Telecom Italia SpA(a) |
| 05/30/2024 | 5.303% | | 250,000 | 254,230 |
| Verizon Communications, Inc. |
| 08/10/2033 | 4.500% | | 5,615,000 | 5,521,291 |
| Zayo Group LLC/Capital, Inc.(a) |
| 01/15/2027 | 5.750% | | 5,568,000 | 5,525,032 |
| Total | 25,085,919 |
Total Corporate Bonds & Notes
(Cost $633,973,555) | 598,390,289 |
|
| Foreign Government Obligations(n) 1.2% |
| | | | |
| Argentina 0.3% |
| Argentine Republic Government International Bond |
| 01/26/2027 | 6.875% | | 2,600,000 | 2,593,438 |
| Provincia de Buenos Aires(a) |
| 06/15/2027 | 7.875% | | 2,800,000 | 2,850,394 |
| Provincia de Cordoba(a) |
| 08/01/2027 | 7.125% | | 1,300,000 | 1,260,674 |
| Total | 6,704,506 |
| Belarus 0.0% |
| Republic of Belarus International Bond(a) |
| 02/28/2023 | 6.875% | | 660,000 | 692,308 |
| Canada 0.0% |
| NOVA Chemicals Corp.(a) |
| 06/01/2024 | 4.875% | | 152,000 | 147,442 |
| Colombia 0.1% |
| Ecopetrol SA |
| 09/18/2043 | 7.375% | | 820,000 | 939,753 |
| Dominican Republic 0.0% |
| Dominican Republic International Bond(a) |
| 01/25/2027 | 5.950% | | 785,000 | 804,626 |
| Egypt 0.1% |
| Egypt Government International Bond(a) |
| 01/31/2047 | 8.500% | | 1,015,000 | 1,090,165 |
| Honduras 0.1% |
| Honduras Government International Bond(a) |
| 03/15/2024 | 7.500% | | 1,710,000 | 1,866,337 |
| Foreign Government Obligations(n) (continued) |
| Issuer | Coupon
Rate | | Principal
Amount ($) | Value ($) |
| Ivory Coast 0.1% |
| Ivory Coast Government International Bond(a) |
| 03/03/2028 | 6.375% | | 2,510,000 | 2,529,623 |
| Kazakhstan 0.1% |
| KazMunayGas National Co., JSC(a) |
| 05/05/2020 | 7.000% | | 2,055,000 | 2,200,977 |
| Mexico 0.1% |
| Petroleos Mexicanos |
| 03/13/2027 | 6.500% | | 2,241,000 | 2,321,707 |
| 09/21/2047 | 6.750% | | 95,000 | 91,696 |
| Total | 2,413,403 |
| Nigeria 0.0% |
| Nigeria Government International Bond(a) |
| 02/16/2032 | 7.875% | | 503,000 | 541,497 |
| Paraguay 0.1% |
| Paraguay Government International Bond(a) |
| 03/13/2048 | 5.600% | | 898,000 | 890,282 |
| Russian Federation 0.1% |
| Gazprom OAO Via Gaz Capital SA(a) |
| 02/06/2028 | 4.950% | | 1,320,000 | 1,302,884 |
| Sberbank of Russia Via SB Capital SA(a) |
| Subordinated |
| 10/29/2022 | 5.125% | | 490,000 | 486,523 |
| Total | 1,789,407 |
| Senegal 0.0% |
| Senegal Government International Bond(a) |
| 05/23/2033 | 6.250% | | 855,000 | 825,117 |
| Trinidad and Tobago 0.1% |
| Petroleum Co. of Trinidad & Tobago Ltd.(a) |
| 08/14/2019 | 9.750% | | 1,690,000 | 1,779,850 |
Total Foreign Government Obligations
(Cost $26,475,564) | 25,215,293 |
|
| Municipal Bonds 0.1% |
| Issue Description | Coupon
Rate | | Principal
Amount ($) | Value ($) |
| Local General Obligation 0.1% |
| City of Chicago |
| Unlimited Tax General Obligation Bonds |
| Series 2011-C1 |
| 01/01/2035 | 7.781% | | 545,000 | 595,276 |
| Series 2015B |
| 01/01/2033 | 7.375% | | 415,000 | 445,968 |
The accompanying Notes to Financial Statements are an integral part of this statement.
| 22 | Columbia Total Return Bond Fund | Annual Report 2018 |
Portfolio of Investments (continued)
April 30, 2018
| Municipal Bonds (continued) |
| Issue Description | Coupon
Rate | | Principal
Amount ($) | Value ($) |
| Unlimited Tax General Obligation Refunding Bonds |
| Series 2014B |
| 01/01/2044 | 6.314% | | 705,000 | 693,424 |
| Total | 1,734,668 |
| Water & Sewer 0.0% |
| City of Chicago Waterworks |
| Revenue Bonds |
| Build America Bonds |
| Series 2010 |
| 11/01/2040 | 6.742% | | 840,000 | 1,058,366 |
Total Municipal Bonds
(Cost $2,457,239) | 2,793,034 |
|
| Residential Mortgage-Backed Securities - Agency 22.4% |
| Issuer | Coupon
Rate | | Principal
Amount ($) | Value ($) |
| Federal Home Loan Mortgage Corp. |
| 04/01/2021 | 9.000% | | 388 | 390 |
03/01/2022-
11/01/2026 | 8.500% | | 54,579 | 59,630 |
08/01/2024-
02/01/2025 | 8.000% | | 43,442 | 46,648 |
10/01/2028-
07/01/2032 | 7.000% | | 589,078 | 654,775 |
10/01/2031-
09/01/2033 | 6.000% | | 33,422 | 36,943 |
| 06/01/2033 | 5.500% | | 435,320 | 480,470 |
01/01/2046-
12/01/2046 | 3.500% | | 33,628,275 | 33,516,531 |
| 04/01/2046 | 4.000% | | 12,524,542 | 12,815,225 |
| Federal Home Loan Mortgage Corp.(e) |
| 05/14/2048 | 4.000% | | 18,000,000 | 18,340,312 |
| Federal Home Loan Mortgage Corp.(b),(i) |
| CMO Series 3922 Class SH |
1-month USD LIBOR + 5.900%
09/15/2041 | 4.003% | | 1,099,472 | 136,877 |
| CMO Series 4097 Class ST |
1-month USD LIBOR + 6.050%
08/15/2042 | 4.153% | | 2,341,184 | 368,362 |
| CMO STRIPS Series 2012-278 Class S1 |
1-month USD LIBOR + 6.050%
09/15/2042 | 4.153% | | 3,965,961 | 592,567 |
| CMO STRIPS Series 309 Class S4 |
1-month USD LIBOR + 5.970%
08/15/2043 | 4.073% | | 1,307,138 | 211,737 |
| Federal Home Loan Mortgage Corp.(i) |
| CMO Series 4176 Class BI |
| 03/15/2043 | 3.500% | | 2,877,843 | 537,798 |
| CMO Series 4182 Class DI |
| 05/15/2039 | 3.500% | | 8,681,185 | 956,354 |
| Residential Mortgage-Backed Securities - Agency (continued) |
| Issuer | Coupon
Rate | | Principal
Amount ($) | Value ($) |
| Federal Home Loan Mortgage Corp.(h),(i) |
| CMO Series 4620 Class AS |
| 11/15/2042 | 1.442% | | 2,715,031 | 166,579 |
| Federal National Mortgage Association |
| 09/01/2018 | 10.000% | | 353 | 353 |
| 04/01/2023 | 8.500% | | 1,780 | 1,791 |
| 06/01/2024 | 9.000% | | 6,969 | 7,297 |
02/01/2025-
08/01/2027 | 8.000% | | 80,296 | 87,854 |
03/01/2026-
08/01/2032 | 7.000% | | 1,464,527 | 1,639,755 |
04/01/2027-
06/01/2032 | 7.500% | | 161,346 | 177,716 |
05/01/2029-
08/01/2038 | 6.000% | | 2,879,301 | 3,167,543 |
| 01/01/2031 | 2.500% | | 7,852,209 | 7,666,464 |
| 08/01/2034 | 5.500% | | 103,837 | 114,488 |
10/01/2040-
07/01/2041 | 4.500% | | 6,267,690 | 6,577,660 |
05/01/2043-
03/01/2046 | 3.500% | | 15,852,372 | 15,802,296 |
08/01/2043-
06/01/2047 | 4.000% | | 32,729,570 | 33,527,187 |
| 12/01/2043 | 3.000% | | 23,665,438 | 23,052,850 |
| CMO Series 2017-72 Class B |
| 09/25/2047 | 3.000% | | 17,504,370 | 17,166,855 |
| Federal National Mortgage Association(b) |
6-month USD LIBOR + 1.415%
06/01/2032 | 3.040% | | 3,428 | 3,435 |
1-year CMT + 2.305%
07/01/2037 | 3.367% | | 115,928 | 115,547 |
| Federal National Mortgage Association(e) |
| 05/17/2033 | 2.500% | | 27,000,000 | 26,261,191 |
05/17/2033-
05/14/2048 | 3.000% | | 46,500,000 | 45,728,201 |
| 05/14/2048 | 3.500% | | 21,000,000 | 20,849,063 |
| 05/14/2048 | 4.000% | | 39,750,000 | 40,485,995 |
| 05/14/2048 | 4.500% | | 12,500,000 | 13,020,508 |
| Federal National Mortgage Association(o) |
| 11/01/2046 | 3.500% | | 31,047,657 | 31,012,483 |
| Federal National Mortgage Association(p) |
| 04/15/2048 | 4.000% | | 23,300,000 | 23,787,844 |
| Federal National Mortgage Association(i) |
| CMO Series 2012-118 Class BI |
| 12/25/2039 | 3.500% | | 4,435,446 | 651,203 |
| Federal National Mortgage Association(b),(i) |
| CMO Series 2013-101 Class CS |
1-month USD LIBOR + 5.900%
10/25/2043 | 4.003% | | 5,742,144 | 1,000,764 |
| CMO Series 2014-93 Class ES |
1-month USD LIBOR + 6.150%
01/25/2045 | 4.253% | | 3,199,439 | 532,422 |
The accompanying Notes to Financial Statements are an integral part of this statement.
Columbia Total Return Bond Fund | Annual Report 2018
| 23 |
Portfolio of Investments (continued)
April 30, 2018
| Residential Mortgage-Backed Securities - Agency (continued) |
| Issuer | Coupon
Rate | | Principal
Amount ($) | Value ($) |
| CMO Series 2016-31 Class VS |
1-month USD LIBOR + 6.000%
06/25/2046 | 4.103% | | 3,102,824 | 538,790 |
| Government National Mortgage Association |
12/15/2023-
07/20/2028 | 7.500% | | 128,946 | 138,802 |
| 02/15/2025 | 8.500% | | 15,668 | 17,305 |
| 01/15/2030 | 7.000% | | 185,653 | 210,544 |
| Government National Mortgage Association(b) |
1-year CMT + 1.500%
07/20/2025 | 2.750% | | 14,538 | 14,915 |
| Government National Mortgage Association(e) |
| 05/21/2048 | 3.500% | | 64,500,000 | 64,580,625 |
| 05/21/2048 | 4.500% | | 23,000,000 | 23,864,296 |
| Government National Mortgage Association(i) |
| CMO Series 2014-184 Class CI |
| 11/16/2041 | 3.500% | | 7,089,602 | 1,167,891 |
Total Residential Mortgage-Backed Securities - Agency
(Cost $478,817,534) | 471,893,131 |
|
| Residential Mortgage-Backed Securities - Non-Agency 16.8% |
| | | | |
| Ajax Mortgage Loan Trust(a) |
| CMO Series 2016-C Class A |
| 10/25/2057 | 4.000% | | 1,285,490 | 1,291,463 |
| CMO Series 2017-A Class A |
| 04/25/2057 | 3.470% | | 3,895,828 | 3,963,053 |
| Series 2017-B Class A |
| 09/25/2056 | 3.163% | | 11,446,148 | 11,269,227 |
| American Mortgage Trust(c),(d),(h) |
| CMO Series 2093-3 Class 3A |
| 07/27/2023 | 8.188% | | 1,903 | 1,154 |
| Angel Oak Mortgage Trust LLC(a) |
| CMO Series 2015-1 |
| 11/25/2045 | 4.500% | | 94,302 | 94,421 |
| 11/25/2045 | 5.500% | | 1,500,000 | 1,501,004 |
| Angel Oak Mortgage Trust LLC(a),(h) |
| CMO Series 2017-3 Class A3 |
| 11/25/2047 | 2.986% | | 6,173,547 | 6,139,265 |
| ASG Resecuritization Trust(a),(h) |
| CMO Series 2009-2 Class G70 |
| 05/24/2036 | 3.489% | | 1,306,799 | 1,302,094 |
| CMO Series 2009-2 Class G75 |
| 05/24/2036 | 3.489% | | 4,335,000 | 4,290,546 |
| Bayview Opportunity Master Fund IIIa Trust(a) |
| CMO Series 2017-RN7 Class A1 |
| 09/28/2032 | 3.105% | | 1,782,504 | 1,783,183 |
| Series 2017-RN8 Class A1 |
| 11/28/2032 | 3.352% | | 9,381,056 | 9,380,428 |
| Residential Mortgage-Backed Securities - Non-Agency (continued) |
| Issuer | Coupon
Rate | | Principal
Amount ($) | Value ($) |
| Bayview Opportunity Master Fund IIIb Trust(a) |
| CMO Series 2017-RN3 Class A1 |
| 05/28/2032 | 3.228% | | 563,853 | 563,945 |
| Bayview Opportunity Master Fund IV Trust(a) |
| CMO Series 2018-RN2 Class A1 |
| 02/25/2033 | 3.598% | | 11,872,195 | 11,880,324 |
| Bayview Opportunity Master Fund IVa Trust(a) |
| CMO Series 2018-RN1 Class A1 |
| 01/28/2033 | 3.278% | | 10,218,189 | 10,218,176 |
| CMO Series 2018-RN3 Class A1 |
| 03/28/2033 | 3.672% | | 3,950,257 | 3,950,255 |
| Bayview Opportunity Master Fund IVA Trust(a) |
| Subordinated, CMO Series 2016-SPL1 Class B3 |
| 04/28/2055 | 5.500% | | 1,000,000 | 1,007,612 |
| Bayview Opportunity Master Fund IVb Trust(a) |
| CMO Series 2017-RPL1 Class A1 |
| 07/28/2032 | 3.105% | | 1,314,860 | 1,308,575 |
| BCAP LLC Trust(a),(h) |
| CMO Series 2010-RR11 Class 8A1 |
| 05/27/2037 | 4.001% | | 2,601,404 | 2,599,449 |
| CMO Series 2012-RR10 Class 9A1 |
| 10/26/2035 | 3.619% | | 159,065 | 159,360 |
| CMO Series 2014-RR3 Class 3A1 |
| 07/26/2036 | 1.917% | | 68,552 | 68,314 |
| BCAP LLC Trust(a) |
| CMO Series 2013-RR5 Class 1A1 |
| 10/26/2036 | 3.500% | | 215,465 | 214,608 |
| CMO Series 2013-RR5 Class 3A1 |
| 09/26/2036 | 3.500% | | 996,081 | 989,501 |
| CIM Trust(a) |
| CMO Series 2017-6 Class A1 |
| 06/25/2057 | 3.015% | | 6,792,721 | 6,595,902 |
| Citigroup Mortgage Loan Trust(a),(h) |
| CMO Series 2018-RP2 Class A1 |
| 02/25/2058 | 3.500% | | 4,976,595 | 4,975,243 |
| Citigroup Mortgage Loan Trust(a) |
| Subordinated, CMO Series 2014-C Class B1 |
| 02/25/2054 | 4.097% | | 5,000,000 | 5,040,567 |
| Citigroup Mortgage Loan Trust, Inc.(a),(h) |
| CMO Series 2013-11 Class 3A3 |
| 09/25/2034 | 3.507% | | 709,528 | 711,865 |
| CMO Series 2013-2 Class 1A1 |
| 11/25/2037 | 3.716% | | 652,954 | 655,300 |
| CMO Series 2014-12 Class 3A1 |
| 10/25/2035 | 3.758% | | 3,378,702 | 3,422,253 |
| CMO Series 2014-C Class A |
| 02/25/2054 | 3.250% | | 752,150 | 736,492 |
The accompanying Notes to Financial Statements are an integral part of this statement.
| 24 | Columbia Total Return Bond Fund | Annual Report 2018 |
Portfolio of Investments (continued)
April 30, 2018
| Residential Mortgage-Backed Securities - Non-Agency (continued) |
| Issuer | Coupon
Rate | | Principal
Amount ($) | Value ($) |
| CMO Series 2015-A Class A4 |
| 06/25/2058 | 4.250% | | 2,279,302 | 2,295,788 |
| CMO Series 2015-A Class B3 |
| 06/25/2058 | 4.500% | | 932,992 | 889,934 |
| Citigroup Mortgage Loan Trust, Inc.(a),(b) |
| CMO Series 2014-11 Class 3A3 |
1-month USD LIBOR + 0.160%
09/25/2036 | 2.032% | | 423,259 | 420,521 |
| Citigroup Mortgage Loan Trust, Inc.(a),(i) |
| CMO Series 2015-A Class A1IO |
| 06/25/2058 | 1.000% | | 10,960,291 | 256,714 |
| COLT LLC(a),(b),(d) |
| CMO Series 15-1 Class A2 |
1-month USD LIBOR + 3.750%
12/26/2045 | 5.647% | | 83,607 | 83,659 |
| COLT Mortgage Loan Trust(a) |
| CMO Series 2016-1 Class A2 |
| 05/25/2046 | 3.500% | | 272,693 | 273,871 |
| CMO Series 2018-1 Class A2 |
| 02/25/2048 | 2.981% | | 1,547,939 | 1,536,995 |
| COLT Mortgage Loan Trust(a),(h) |
| CMO Series 2017-2 Class B1 |
| 10/25/2047 | 4.563% | | 1,000,000 | 959,385 |
| Credit Suisse Mortgage Capital Certificates(a),(h) |
| CMO Series 2009-14R Class 4A9 |
| 10/26/2035 | 3.715% | | 7,521,255 | 7,891,235 |
| CMO Series 2010-8R Class 1A5 |
| 03/26/2036 | 3.755% | | 4,500,000 | 4,548,211 |
| CMO Series 2011-12R Class 3A1 |
| 07/27/2036 | 3.569% | | 1,253,327 | 1,260,353 |
| CMO Series 2017-RPL3 Class A1 |
| 08/01/2057 | 4.000% | | 12,915,360 | 12,994,708 |
| Credit Suisse Mortgage Capital Certificates(a) |
| CMO Series 2010-9R Class 1A5 |
| 08/27/2037 | 4.000% | | 774,529 | 780,722 |
| Credit Suisse Mortgage Trust(a) |
| CMO Series 2018-RPL2 Class A1 |
| 08/25/2062 | 4.030% | | 2,684,519 | 2,677,677 |
| Deephaven Residential Mortgage Trust(a),(d) |
| CMO Series 2016-1A Class A2 |
| 07/25/2046 | 5.500% | | 835,390 | 835,912 |
| Deephaven Residential Mortgage Trust(a),(h) |
| CMO Series 2017-2A Class M1 |
| 06/25/2047 | 3.897% | | 500,000 | 498,149 |
| Deephaven Residential Mortgage Trust(a) |
| CMO Series 2017-3A Class M1 |
| 10/25/2047 | 3.511% | | 423,000 | 422,925 |
| CMO Series 2018-1A Class M1 |
| 12/25/2057 | 3.939% | | 3,000,000 | 2,999,750 |
| Residential Mortgage-Backed Securities - Non-Agency (continued) |
| Issuer | Coupon
Rate | | Principal
Amount ($) | Value ($) |
| GCAT LLC(a) |
| CMO Series 2017-2 Class A1 |
| 04/25/2047 | 3.500% | | 4,808,063 | 4,809,588 |
| CMO Series 2017-3 Class A1 |
| 04/25/2047 | 3.352% | | 3,587,440 | 3,588,240 |
| Grand Avenue Mortgage Loan Trust(a) |
| CMO Series 2017-RPL1 Class A1 |
| 08/25/2064 | 3.250% | | 20,936,496 | 20,569,425 |
| JPMorgan Resecuritization Trust(a),(h) |
| CMO Series 2014-1 Class 1016 |
| 03/26/2036 | 3.741% | | 2,966,325 | 2,957,649 |
| JPMorgan Resecuritization Trust(a) |
| CMO Series 2014-5 Class 6A |
| 09/27/2036 | 4.000% | | 1,169,352 | 1,166,840 |
| Legacy Mortgage Asset Trust(a) |
| CMO Series 2017-GS1 Class A1 |
| 01/25/2057 | 3.500% | | 5,562,136 | 5,501,388 |
| CMO Series 2017-GS1 Class A2 |
| 01/25/2057 | 3.500% | | 1,298,000 | 1,201,117 |
| LVII Resecuritization Trust(a),(h) |
| Subordinated, CMO Series 2009-3 Class B3 |
| 11/27/2037 | 5.777% | | 8,000,000 | 8,235,645 |
| Mill City Mortgage Loan Trust(a),(h) |
| CMO Series 2018-1 Class A1 |
| 05/25/2062 | 3.250% | | 10,400,000 | 10,359,440 |
| Morgan Stanley Re-Remic Trust(a),(h) |
| CMO Series 2010-R1 Class 2B |
| 07/26/2035 | 3.631% | | 588,097 | 588,127 |
| Nomura Resecuritization Trust(a),(b) |
| CMO Series 2014-6R Class 3A1 |
1-month USD LIBOR + 0.260%
01/26/2036 | 2.392% | | 2,284,297 | 2,260,384 |
| NRZ Excess Spread-Collateralized Notes(a) |
| CMO Series 2018-PLS2 Class A |
| 02/25/2023 | 3.265% | | 5,569,937 | 5,542,650 |
| Series 2018-PLS1 Class A |
| 01/25/2023 | 3.193% | | 15,152,062 | 15,057,907 |
| Series 2018-PLS1 Class C |
| 01/25/2023 | 3.981% | | 10,162,968 | 10,072,432 |
| Subordinated CMO Series 2018-PLS2 Class C |
| 02/25/2023 | 4.102% | | 6,608,400 | 6,568,255 |
| Subordinated CMO Series 2018-PLS2 Class D |
| 02/25/2023 | 4.593% | | 9,440,571 | 9,384,716 |
| Oaktown Re Ltd.(a),(b),(d) |
| CMO Series 2017-1A Class M1 |
1-month USD LIBOR + 2.250%
04/25/2027 | 4.147% | | 4,361,298 | 4,365,437 |
The accompanying Notes to Financial Statements are an integral part of this statement.
Columbia Total Return Bond Fund | Annual Report 2018
| 25 |
Portfolio of Investments (continued)
April 30, 2018
| Residential Mortgage-Backed Securities - Non-Agency (continued) |
| Issuer | Coupon
Rate | | Principal
Amount ($) | Value ($) |
| PNMAC GMSR Issuer Trust(a),(b),(d) |
| CMO Series 2017-GT2 Class A |
1-month USD LIBOR + 4.000%
08/25/2023 | 5.897% | | 6,200,000 | 6,269,750 |
| PNMAC GMSR Issuer Trust(a),(b) |
| CMO Series 2018-GT1 Class A |
1-month USD LIBOR + 2.850%
02/25/2023 | 4.747% | | 9,800,000 | 9,861,157 |
| Preston Ridge Partners Mortgage LLC(a) |
| CMO Series 2017-2A Class A2 |
| 09/25/2022 | 5.000% | | 4,500,000 | 4,466,940 |
| Preston Ridge Partners Mortgage LLC(a),(h) |
| CMO Series 2017-3A Class A1 |
| 11/25/2022 | 3.470% | | 10,205,262 | 10,164,863 |
| CMO Series 2017-3A Class A2 |
| 11/25/2022 | 5.000% | | 3,000,000 | 2,978,034 |
| Preston Ridge Partners Mortgage LLC(a),(d) |
| CMO Series 2018-1A Class A1 |
| 04/25/2023 | 3.750% | | 9,670,000 | 9,626,109 |
| Pretium Mortgage Credit Partners I LLC(a),(h) |
| CMO Series 2017-NPL3 Class A1 |
| 06/29/2032 | 3.250% | | 5,395,470 | 5,361,324 |
| Pretium Mortgage Credit Partners I LLC(a) |
| CMO Series 2018-NPL1 Class A1 |
| 01/27/2033 | 3.375% | | 13,272,022 | 13,211,295 |
| Pretium Mortgage Credit Partners LLC(a),(h) |
| CMO Series 2017-NPL5 Class A1 |
| 12/30/2032 | 3.327% | | 5,259,820 | 5,238,573 |
| SGR Residential Mortgage Trust(a) |
| CMO Series 2016-1 Class A1 |
| 11/25/2046 | 3.750% | | 357,699 | 356,751 |
| Sunset Mortgage Loan Co., LLC(a) |
| CMO Series 2017-NPL1 Class A |
| 06/15/2047 | 3.500% | | 783,912 | 784,365 |
| U.S. Residential Opportunity Fund IV Trust(a) |
| Series 2017-1III Class A |
| 11/27/2037 | 3.352% | | 5,109,155 | 5,086,079 |
| Verus Securitization Trust(a) |
| CMO Series 2017-SG1A Class A1 |
| 11/25/2047 | 2.690% | | 12,696,891 | 12,563,014 |
| Subordinated, CMO Series 2017-SG1A Class B1 |
| 11/25/2047 | 3.615% | | 3,000,000 | 2,985,927 |
| Verus Securitization Trust(a),(d),(h) |
| CMO Series 2018-INV1 Class A1 |
| 03/25/2058 | 3.626% | | 14,300,000 | 14,300,000 |
Total Residential Mortgage-Backed Securities - Non-Agency
(Cost $354,570,885) | 353,223,509 |
|
| Senior Loans 0.0% |
| Borrower | Weighted
Average Coupon | | Principal
Amount ($) | Value ($) |
| Consumer Products 0.0% |
| Serta Simmons Bedding LLC(b),(q) |
| 2nd Lien Term Loan |
3-month USD LIBOR + 8.000%
11/08/2024 | 10.331% | | 171,615 | 136,004 |
| Property & Casualty 0.0% |
| Hub International Limited(b),(p),(q) |
| Term Loan |
3-month USD LIBOR + 3.000%
04/25/2025 | | | 84,000 | 84,490 |
| Technology 0.0% |
| Ascend Learning LLC(b),(q) |
| Term Loan |
3-month USD LIBOR + 3.000%
07/12/2024 | 4.901% | | 28,855 | 28,945 |
| Information Resources, Inc.(b),(q) |
| 2nd Lien Term Loan |
3-month USD LIBOR + 8.250%
01/20/2025 | 10.194% | | 125,000 | 125,313 |
| Misys Ltd.(b),(q) |
| 1st Lien Term Loan |
3-month USD LIBOR + 3.500%
06/13/2024 | 5.484% | | 94,433 | 94,337 |
| Total | 248,595 |
Total Senior Loans
(Cost $498,627) | 469,089 |
|
| U.S. Treasury Obligations 1.5% |
| Issuer | Coupon
Rate | | Principal
Amount ($) | Value ($) |
| U.S. Treasury |
| 10/31/2024 | 2.250% | | 25,461,000 | 24,507,920 |
| U.S. Treasury(o) |
| 08/15/2027 | 2.250% | | 6,872,500 | 6,490,443 |
Total U.S. Treasury Obligations
(Cost $32,164,699) | 30,998,363 |
| Options Purchased Puts 0.3% |
| | | | | Value ($) |
| (Cost $4,312,500) | 6,867,375 |
The accompanying Notes to Financial Statements are an integral part of this statement.
| 26 | Columbia Total Return Bond Fund | Annual Report 2018 |
Portfolio of Investments (continued)
April 30, 2018
| Money Market Funds 4.6% |
| | Shares | Value ($) |
| Columbia Short-Term Cash Fund, 1.889%(r),(s) | 97,258,162 | 97,248,436 |
Total Money Market Funds
(Cost $97,248,594) | 97,248,436 |
Total Investments in Securities
(Cost: $2,449,084,914) | 2,393,424,546 |
| Other Assets & Liabilities, Net | | (290,948,654) |
| Net Assets | 2,102,475,892 |
At April 30, 2018, securities and/or cash totaling $13,010,394 were pledged as collateral.
Investments in derivatives
| Long futures contracts |
| Description | Number of
contracts | Expiration
date | Trading
currency | Notional
amount | Value/Unrealized
appreciation ($) | Value/Unrealized
depreciation ($) |
| U.S. Treasury 10-Year Note | 1,181 | 06/2018 | USD | 142,049,180 | — | (549,792) |
| U.S. Treasury 5-Year Note | 1,331 | 06/2018 | USD | 151,438,292 | — | (785,206) |
| U.S. Ultra Bond | 534 | 06/2018 | USD | 85,045,993 | — | (283,795) |
| Total | | | | | — | (1,618,793) |
| Put option contracts purchased |
| Description | Counterparty | Trading
currency | Notional
amount | Number of
contracts | Exercise
price/Rate | Expiration
date | Cost ($) | Value ($) |
| 10-Year OTC interest rate swap with Citi to receive 3-Month USD LIBOR BBA and pay exercise rate | Citi | USD | 150,000,000 | 150,000,000 | 2.85 | 01/2021 | 4,312,500 | 6,867,375 |
| Cleared credit default swap contracts - buy protection |
Reference
entity | Counterparty | Maturity
date | Pay
fixed
rate
(%) | Payment
frequency | Notional
currency | Notional
amount | Value
($) | Upfront
payments
($) | Upfront
receipts
($) | Unrealized
appreciation
($) | Unrealized
depreciation
($) |
| Markit CDX North America Investment Grade Index, Series 29 | Morgan Stanley | 12/20/2022 | 1.000 | Quarterly | USD | 69,332,000 | (271,603) | — | — | — | (271,603) |
| Credit default swap contracts - sell protection |
Reference
entity | Counterparty | Maturity
date | Receive
fixed
rate
(%) | Payment
frequency | Implied
credit
spread
(%)* | Notional
currency | Notional
amount | Value
($) | Periodic
payments
receivable
(payable)
($) | Upfront
payments
($) | Upfront
receipts
($) | Unrealized
appreciation
($) | Unrealized
depreciation
($) |
| Bank of America Corp. | Barclays | 06/20/2018 | 1.000 | Quarterly | 0.034% | USD | 15,565,000 | 21,224 | 18,159 | 12,952 | — | 26,431 | — |
| Citigroup, Inc. | Barclays | 06/20/2018 | 1.000 | Quarterly | 0.023% | USD | 15,340,000 | 21,152 | 17,897 | 10,668 | — | 28,381 | — |
| Markit CMBX North America Index, Series 7 BBB- | Credit Suisse | 01/17/2047 | 3.000 | Monthly | 5.072% | USD | 7,500,000 | (692,250) | 3,750 | — | (621,309) | — | (67,191) |
| Markit CMBX North America Index, Series 7 BBB- | Credit Suisse | 01/17/2047 | 3.000 | Monthly | 5.072% | USD | 7,500,000 | (692,250) | 3,750 | — | (551,564) | — | (136,936) |
| Markit CMBX North America Index, Series 7 BBB- | Credit Suisse | 01/17/2047 | 3.000 | Monthly | 5.072% | USD | 6,000,000 | (553,800) | 3,000 | — | (378,059) | — | (172,741) |
The accompanying Notes to Financial Statements are an integral part of this statement.
Columbia Total Return Bond Fund | Annual Report 2018
| 27 |
Portfolio of Investments (continued)
April 30, 2018
| Credit default swap contracts - sell protection (continued) |
Reference
entity | Counterparty | Maturity
date | Receive
fixed
rate
(%) | Payment
frequency | Implied
credit
spread
(%)* | Notional
currency | Notional
amount | Value
($) | Periodic
payments
receivable
(payable)
($) | Upfront
payments
($) | Upfront
receipts
($) | Unrealized
appreciation
($) | Unrealized
depreciation
($) |
| Citigroup, Inc. | Goldman Sachs International | 06/20/2018 | 1.000 | Quarterly | 0.023% | USD | 7,800,000 | 10,755 | 9,100 | 4,883 | — | 14,972 | — |
| Bank of America Corp. | JPMorgan | 06/20/2018 | 1.000 | Quarterly | 0.034% | USD | 23,480,000 | 32,017 | 27,393 | 16,958 | — | 42,452 | — |
| Cenovus Energy, Inc. | JPMorgan | 06/20/2018 | 1.000 | Quarterly | 0.959% | USD | 5,145,000 | 4,399 | 6,003 | 2,831 | — | 7,571 | — |
| Citigroup, Inc. | JPMorgan | 06/20/2018 | 1.000 | Quarterly | 0.023% | USD | 23,350,000 | 32,197 | 27,242 | 20,075 | — | 39,364 | — |
| Citigroup, Inc. | JPMorgan | 06/20/2018 | 1.000 | Quarterly | 0.023% | USD | 15,280,000 | 21,069 | 17,827 | 12,090 | — | 26,806 | — |
| Citigroup, Inc. | JPMorgan | 06/20/2018 | 1.000 | Quarterly | 0.023% | USD | 7,825,000 | 10,790 | 9,129 | 5,867 | — | 14,052 | — |
| Markit CMBX North America Index, Series 10 BBB- | JPMorgan | 11/17/2059 | 3.000 | Monthly | 4.463% | USD | 3,200,000 | (296,710) | 1,600 | — | (309,503) | 14,393 | — |
| Markit CMBX North America Index, Series 7 BBB- | JPMorgan | 01/17/2047 | 3.000 | Monthly | 5.072% | USD | 3,000,000 | (276,900) | 1,500 | — | (253,870) | — | (21,530) |
| Bank of America Corp. | Morgan Stanley | 06/20/2018 | 1.000 | Quarterly | 0.034% | USD | 7,800,000 | 10,636 | 9,100 | 4,776 | — | 14,960 | — |
| Bank of America Corp. | Morgan Stanley | 06/20/2018 | 1.000 | Quarterly | 0.034% | USD | 7,875,000 | 10,739 | 9,187 | 5,255 | — | 14,671 | — |
| Markit CMBX North America Index, Series 6 BBB- | Morgan Stanley | 05/11/2063 | 3.000 | Monthly | 6.520% | USD | 3,500,000 | (439,600) | 1,750 | — | (364,792) | — | (73,058) |
| Markit CMBX North America Index, Series 6 BBB- | Morgan Stanley | 05/11/2063 | 3.000 | Monthly | 6.520% | USD | 2,300,000 | (288,880) | 1,150 | — | (171,935) | — | (115,795) |
| Markit CMBX North America Index, Series 7 BBB- | Morgan Stanley | 01/17/2047 | 3.000 | Monthly | 5.072% | USD | 3,000,000 | (276,900) | 1,500 | — | (352,080) | 76,680 | — |
| Markit CMBX North America Index, Series 7 BBB- | Morgan Stanley | 01/17/2047 | 3.000 | Monthly | 5.072% | USD | 4,100,000 | (378,430) | 2,050 | — | (450,911) | 74,531 | — |
| Total | | | | | | | | | 171,087 | 96,355 | (3,454,023) | 395,264 | (587,251) |
| * | Implied credit spreads, represented in absolute terms, utilized in determining the market value of credit default swap agreements on corporate or sovereign issues as of period end serve as an indicator of the current status of the payment/performance risk and represent the likelihood or risk of default for the credit derivative. The implied credit spread of a particular referenced entity reflects the cost of buying/selling protection and may include upfront payments required to be made to enter into the agreement. Wider credit spreads represent a deterioration of the referenced entity’s credit soundness and a greater likelihood or risk of default or other credit event occurring as defined under the terms of the agreement. |
| Cleared credit default swap contracts - sell protection |
Reference
entity | Counterparty | Maturity
date | Receive
fixed
rate
(%) | Payment
frequency | Implied
credit
spread
(%)* | Notional
currency | Notional
amount | Value
($) | Upfront
payments
($) | Upfront
receipts
($) | Unrealized
appreciation
($) | Unrealized
depreciation
($) |
| Markit CDX North America High Yield Index, Series 21 | Morgan Stanley | 12/20/2018 | 5.000 | Quarterly | 1.511% | USD | 106,697,040 | 1,459,088 | — | — | 1,459,088 | — |
| * | Implied credit spreads, represented in absolute terms, utilized in determining the market value of credit default swap agreements on corporate or sovereign issues as of period end serve as an indicator of the current status of the payment/performance risk and represent the likelihood or risk of default for the credit derivative. The implied credit spread of a particular referenced entity reflects the cost of buying/selling protection and may include upfront payments required to be made to enter into the agreement. Wider credit spreads represent a deterioration of the referenced entity’s credit soundness and a greater likelihood or risk of default or other credit event occurring as defined under the terms of the agreement. |
The accompanying Notes to Financial Statements are an integral part of this statement.
| 28 | Columbia Total Return Bond Fund | Annual Report 2018 |
Portfolio of Investments (continued)
April 30, 2018
Notes to Portfolio of Investments
| (a) | Represents privately placed and other securities and instruments exempt from SEC registration (collectively, private placements), such as Section 4(a)(2) and Rule 144A eligible securities, which are often sold only to qualified institutional buyers. The Fund may invest in private placements determined to be liquid as well as those determined to be illiquid. Private placements may be determined to be liquid under guidelines established by the Fund’s Board of Trustees. At April 30, 2018, the value of these securities amounted to $1,169,276,966, which represents 55.61% of net assets. |
| (b) | Variable rate security. The interest rate shown was the current rate as of April 30, 2018. |
| (c) | Represents fair value as determined in good faith under procedures approved by the Board of Trustees. At April 30, 2018, the value of these securities amounted to $14,402,053, which represents 0.69% of net assets. |
| (d) | Valuation based on significant unobservable inputs. |
| (e) | Represents a security purchased on a when-issued basis. |
| (f) | Represents shares owned in the residual interest of an asset-backed securitization. |
| (g) | Zero coupon bond. |
| (h) | Variable or floating rate security, the interest rate of which adjusts periodically based on changes in current interest rates and prepayments on the underlying pool of assets. The interest rate shown was the current rate as of April 30, 2018. |
| (i) | Represents interest only securities which have the right to receive the monthly interest payments on an underlying pool of mortgage loans. |
| (j) | Non-income producing investment. |
| (k) | Negligible market value. |
| (l) | Represents a variable rate security with a step coupon where the rate adjusts according to a schedule for a series of periods, typically lower for an initial period and then increasing to a higher coupon rate thereafter. The interest rate shown was the current rate as of April 30, 2018. |
| (m) | Represents securities that have defaulted on payment of interest. The Fund has stopped accruing interest on these securities. At April 30, 2018, the value of these securities amounted to $41,069, which represents less than 0.01% of net assets. |
| (n) | Principal and interest may not be guaranteed by the government. |
| (o) | This security or a portion of this security has been pledged as collateral in connection with derivative contracts. |
| (p) | Represents a security purchased on a forward commitment basis. |
| (q) | Senior loans have interest rates that float periodically based primarily on the London Interbank Offered Rate (“LIBOR”) and other short-term rates. The interest rate shown reflects the weighted average coupon as of April 30, 2018. The interest rate for senior loans purchased on a when-issued or delayed delivery basis will be determined upon settlement therefore no weighted average coupon rate is disclosed. Remaining maturities of senior loans may be less than the stated maturities shown as a result of contractual or optional prepayments by the borrower. Such prepayments cannot be predicted. |
| (r) | The rate shown is the seven-day current annualized yield at April 30, 2018. |
| (s) | As defined in the Investment Company Act of 1940, an affiliated company is one in which the Fund owns 5% or more of the company’s outstanding voting securities, or a company which is under common ownership or control with the Fund. Holdings and transactions in these affiliated companies during the year ended April 30, 2018 are as follows: |
| Issuer | Beginning
shares | Shares
purchased | Shares
sold | Ending
shares | Realized gain
(loss) —
affiliated
issuers ($) | Net change in
unrealized
appreciation
(depreciation) —
affiliated
issuers ($) | Dividends —
affiliated
issuers ($) | Value —
affiliated
issuers
at end of
period ($) |
| Columbia Short-Term Cash Fund, 1.889% |
| | 6,149,431 | 1,589,961,986 | (1,498,853,255) | 97,258,162 | 1,471 | (592) | 819,205 | 97,248,436 |
Abbreviation Legend
| CMO | Collateralized Mortgage Obligation |
| PIK | Payment In Kind |
| STRIPS | Separate Trading of Registered Interest and Principal Securities |
Currency Legend
Fair value measurements
The Fund categorizes its fair value measurements according to a three-level hierarchy that maximizes the use of observable inputs and minimizes the use of unobservable inputs by prioritizing that the most observable input be used when available. Observable inputs are those that market participants would use in pricing an investment based on market data obtained from sources independent of the reporting entity. Unobservable inputs are those that reflect the Fund’s assumptions about the information market participants would use in
The accompanying Notes to Financial Statements are an integral part of this statement.
Columbia Total Return Bond Fund | Annual Report 2018
| 29 |
Portfolio of Investments (continued)
April 30, 2018
Fair value measurements (continued)
pricing an investment. An investment’s level within the fair value hierarchy is based on the lowest level of any input that is deemed significant to the asset’s or liability’s fair value measurement. The input levels are not necessarily an indication of the risk or liquidity associated with investments at that level. For example, certain U.S. government securities are generally high quality and liquid, however, they are reflected as Level 2 because the inputs used to determine fair value may not always be quoted prices in an active market.
Fair value inputs are summarized in the three broad levels listed below:
| ■ | Level 1 — Valuations based on quoted prices for investments in active markets that the Fund has the ability to access at the measurement date. Valuation adjustments are not applied to Level 1 investments. |
| ■ | Level 2 — Valuations based on other significant observable inputs (including quoted prices for similar securities, interest rates, prepayment speeds, credit risks, etc.). |
| ■ | Level 3 — Valuations based on significant unobservable inputs (including the Fund’s own assumptions and judgment in determining the fair value of investments). |
Inputs that are used in determining fair value of an investment may include price information, credit data, volatility statistics, and other factors. These inputs can be either observable or unobservable. The availability of observable inputs can vary between investments, and is affected by various factors such as the type of investment, and the volume and level of activity for that investment or similar investments in the marketplace. The inputs will be considered by the Investment Manager, along with any other relevant factors in the calculation of an investment’s fair value. The Fund uses prices and inputs that are current as of the measurement date, which may include periods of market dislocations. During these periods, the availability of prices and inputs may be reduced for many investments. This condition could cause an investment to be reclassified between the various levels within the hierarchy.
Certain investments that have been measured at fair value using the net asset value (NAV) per share (or its equivalent) are not categorized in the fair value hierarchy. The fair value amounts presented in the table are intended to reconcile the fair value hierarchy to the amounts presented in the Portfolio of Investments. The Columbia Short-Term Cash Fund seeks to provide shareholders with maximum current income consistent with liquidity and stability of principal. Columbia Short-Term Cash Fund prices its shares with a floating NAV and no longer seeks to maintain a stable NAV.
Investments falling into the Level 3 category are primarily supported by quoted prices from brokers and dealers participating in the market for those investments. However, these may be classified as Level 3 investments due to lack of market transparency and corroboration to support these quoted prices. Additionally, valuation models may be used as the pricing source for any remaining investments classified as Level 3. These models may rely on one or more significant unobservable inputs and/or significant assumptions by the Investment Manager. Inputs used in valuations may include, but are not limited to, financial statement analysis, capital account balances, discount rates and estimated cash flows, and comparable company data.
Under the direction of the Fund’s Board of Trustees (the Board), the Investment Manager’s Valuation Committee (the Committee) is responsible for overseeing the valuation procedures approved by the Board. The Committee consists of voting and non-voting members from various groups within the Investment Manager’s organization, including operations and accounting, trading and investments, compliance, risk management and legal.
The Committee meets at least monthly to review and approve valuation matters, which may include a description of specific valuation determinations, data regarding pricing information received from approved pricing vendors and brokers and the results of Board-approved valuation control policies and procedures (the Policies). The Policies address, among other things, instances when market quotations are or are not readily available, including recommendations of third party pricing vendors and a determination of appropriate pricing methodologies; events that require specific valuation determinations and assessment of fair value techniques; securities with a potential for stale pricing, including those that are illiquid, restricted, or in default; and the effectiveness of third party pricing vendors, including periodic reviews of vendors. The Committee meets more frequently, as needed, to discuss additional valuation matters, which may include the need to review back-testing results, review time-sensitive information or approve related valuation actions. The Committee reports to the Board, with members of the Committee meeting with the Board at each of its regularly scheduled meetings to discuss valuation matters and actions during the period, similar to those described earlier.
For investments categorized as Level 3, the Committee monitors information similar to that described above, which may include: (i) data specific to the issuer or comparable issuers, (ii) general market or specific sector news and (iii) quoted prices and specific or similar security transactions. The Committee considers this data and any changes from prior periods in order to assess the reasonableness of observable and unobservable inputs, any assumptions or internal models used to value those securities and changes in fair value. This data is also used to corroborate, when available, information received from approved pricing vendors and brokers. Various factors impact the frequency of monitoring this information (which may occur as often as daily). However, the Committee may determine that changes to inputs, assumptions and models are not required as a result of the monitoring procedures performed.
The following table is a summary of the inputs used to value the Fund’s investments at April 30, 2018:
| | Level 1
quoted prices
in active
markets for
identical
assets ($) | Level 2
other
significant
observable
inputs ($) | Level 3
significant
unobservable
inputs ($) | Investments
measured at
net asset
value ($) | Total ($) |
| Investments in Securities | | | | | |
| Asset-Backed Securities — Agency | — | 70,605,499 | — | — | 70,605,499 |
| Asset-Backed Securities — Non-Agency | — | 509,358,267 | 14,359,830 | — | 523,718,097 |
| Commercial Mortgage-Backed Securities - Agency | — | 69,002,973 | — | — | 69,002,973 |
| Commercial Mortgage-Backed Securities - Non-Agency | — | 142,824,343 | — | — | 142,824,343 |
| Common Stocks | | | | | |
| Financials | 74,278 | — | — | — | 74,278 |
| Industrials | 100,837 | — | — | — | 100,837 |
| Total Common Stocks | 175,115 | — | — | — | 175,115 |
| Corporate Bonds & Notes | — | 598,349,220 | 41,069 | — | 598,390,289 |
| Foreign Government Obligations | — | 25,215,293 | — | — | 25,215,293 |
| Municipal Bonds | — | 2,793,034 | — | — | 2,793,034 |
The accompanying Notes to Financial Statements are an integral part of this statement.
| 30 | Columbia Total Return Bond Fund | Annual Report 2018 |
Portfolio of Investments (continued)
April 30, 2018
Fair value measurements (continued)
| | Level 1
quoted prices
in active
markets for
identical
assets ($) | Level 2
other
significant
observable
inputs ($) | Level 3
significant
unobservable
inputs ($) | Investments
measured at
net asset
value ($) | Total ($) |
| Residential Mortgage-Backed Securities - Agency | — | 471,893,131 | — | — | 471,893,131 |
| Residential Mortgage-Backed Securities - Non-Agency | — | 317,741,488 | 35,482,021 | — | 353,223,509 |
| Senior Loans | — | 469,089 | — | — | 469,089 |
| U.S. Treasury Obligations | 30,998,363 | — | — | — | 30,998,363 |
| Options Purchased Puts | — | 6,867,375 | — | — | 6,867,375 |
| Money Market Funds | — | — | — | 97,248,436 | 97,248,436 |
| Total Investments in Securities | 31,173,478 | 2,215,119,712 | 49,882,920 | 97,248,436 | 2,393,424,546 |
| Investments in Derivatives | | | | | |
| Asset | | | | | |
| Swap Contracts | — | 1,854,352 | — | — | 1,854,352 |
| Liability | | | | | |
| Futures Contracts | (1,618,793) | — | — | — | (1,618,793) |
| Swap Contracts | — | (858,854) | — | — | (858,854) |
| Total | 29,554,685 | 2,216,115,210 | 49,882,920 | 97,248,436 | 2,392,801,251 |
See the Portfolio of Investments for all investment classifications not indicated in the table.
The Fund’s assets assigned to the Level 2 input category are generally valued using the market approach, in which a security’s value is determined through reference to prices and information from market transactions for similar or identical assets.
Futures contracts and swap contracts are valued at unrealized appreciation (depreciation).
There were no transfers of financial assets between Levels 1 and 2 during the period.
Financial assets were transferred from Level 3 to Level 2 as observable market inputs were utilized and management determined that there was sufficient, reliable and observable market data to value these assets as of period end.
Transfers between levels are determined based on the fair value at the beginning of the period for security positions held throughout the period.
| Investments in securities | Balance
as of
04/30/2017
($) | Increase
(decrease)
in accrued
discounts/
premiums
($) | Realized
gain (loss)
($) | Change
in unrealized
appreciation
(depreciation)(a)
($) | Purchases
($) | Sales
($) | Transfers
into
Level 3
($) | Transfers
out of
Level 3
($) | Balance
as of
04/30/2018
($) |
| Asset-Backed Securities — Non-Agency | 6,964,583 | — | — | (1,904,753) | 9,300,000 | — | — | — | 14,359,830 |
| Common Stocks | — | — | — | — | — | — | — | — | — |
| Corporate Bonds & Notes | 41,069 | — | — | — | — | — | — | — | 41,069 |
| Residential Mortgage-Backed Securities — Non-Agency | 21,047,680 | 37,255 | 10,238 | 13,230 | 30,160,851 | (9,299,687) | — | (6,487,546) | 35,482,021 |
| Total | 28,053,332 | 37,255 | 10,238 | (1,891,523) | 39,460,851 | (9,299,687) | — | (6,487,546) | 49,882,920 |
(a) Change in unrealized appreciation (depreciation) relating to securities held at April 30, 2018 was $(1,878,563), which is comprised of Asset-Backed Securities — Non-Agency of $(1,904,753) and Residential Mortgage-Backed Securities — Non-Agency of $26,190.
The Fund’s assets assigned to the Level 3 category are valued utilizing the valuation technique deemed the most appropriate in the circumstances.
Certain corporate bonds and common stocks classified as Level 3 are valued using a market approach. To determine fair value for these securities, management considered various factors which may have included, but were not limited to, trades of similar securities, estimated earnings of the respective company, market multiples derived from a set of comparable companies, and the position of the security within the respective company’s capital structure. Significant increases (decreases) to any of these inputs would result in a significantly lower (higher) fair value measurement. Generally, a change in estimated earnings of the respective company might result in change to the comparable companies and market multiples.
Certain residential and asset backed securities classified as Level 3 securities are valued using the market approach and utilize single market quotations from broker dealers which may have included, but were not limited to, observable transactions for identical or similar assets in the market and the distressed nature of the security. The appropriateness of fair values for these securities is monitored on an ongoing basis which may include results of back testing, manual price reviews and other control procedures. Significant increases (decreases) to any of these inputs would result in a significantly lower (higher) fair value measurement.
The accompanying Notes to Financial Statements are an integral part of this statement.
Columbia Total Return Bond Fund | Annual Report 2018
| 31 |
Statement of Assets and Liabilities
April 30, 2018
| Assets | |
| Investments in securities, at value | |
| Unaffiliated issuers (cost $2,347,523,820) | $2,289,308,735 |
| Affiliated issuers (cost $97,248,594) | 97,248,436 |
| Options purchased (cost $4,312,500) | 6,867,375 |
| Cash | 16,757 |
| Cash collateral held at broker for: | |
| Swap contracts | 2,310,000 |
| TBA | 710,000 |
| Margin deposits on: | |
| Swap contracts | 4,155,511 |
| Unrealized appreciation on swap contracts | 395,264 |
| Upfront payments on swap contracts | 96,355 |
| Receivable for: | |
| Investments sold | 8,444,008 |
| Investments sold on a delayed delivery basis | 36,025,209 |
| Capital shares sold | 4,002,574 |
| Dividends | 153,150 |
| Interest | 11,600,072 |
| Foreign tax reclaims | 78,602 |
| Variation margin for futures contracts | 672,625 |
| Variation margin for swap contracts | 20,462 |
| Expense reimbursement due from Investment Manager | 7,848 |
| Prepaid expenses | 3,320 |
| Trustees’ deferred compensation plan | 239,526 |
| Total assets | 2,462,355,829 |
| Liabilities | |
| Unrealized depreciation on swap contracts | 587,251 |
| Upfront receipts on swap contracts | 3,454,023 |
| Payable for: | |
| Investments purchased | 6,487,840 |
| Investments purchased on a delayed delivery basis | 339,919,952 |
| Capital shares purchased | 4,919,532 |
| Distributions to shareholders | 3,731,863 |
| Variation margin for futures contracts | 15,765 |
| Variation margin for swap contracts | 6,549 |
| Management services fees | 84,223 |
| Distribution and/or service fees | 17,950 |
| Transfer agent fees | 246,206 |
| Compensation of board members | 20,373 |
| Compensation of chief compliance officer | 95 |
| Other expenses | 148,789 |
| Trustees’ deferred compensation plan | 239,526 |
| Total liabilities | 359,879,937 |
| Net assets applicable to outstanding capital stock | $2,102,475,892 |
| Represented by | |
| Paid in capital | 2,172,058,470 |
| Excess of distributions over net investment income | (5,296,202) |
| Accumulated net realized loss | (8,002,713) |
| Unrealized appreciation (depreciation) on: | |
| Investments - unaffiliated issuers | (58,215,085) |
| Investments - affiliated issuers | (158) |
| Futures contracts | (1,618,793) |
| Options purchased | 2,554,875 |
| Swap contracts | 995,498 |
| Total - representing net assets applicable to outstanding capital stock | $2,102,475,892 |
The accompanying Notes to Financial Statements are an integral part of this statement.
| 32 | Columbia Total Return Bond Fund | Annual Report 2018 |
Statement of Assets and Liabilities (continued)
April 30, 2018
| Class A | |
| Net assets | $711,850,167 |
| Shares outstanding | 80,602,047 |
| Net asset value per share | $8.83 |
| Maximum sales charge | 3.00% |
| Maximum offering price per share (calculated by dividing the net asset value per share by 1.0 minus the maximum sales charge for Class A shares) | $9.10 |
| Advisor Class | |
| Net assets | $6,725,903 |
| Shares outstanding | 762,437 |
| Net asset value per share | $8.82 |
| Class C | |
| Net assets | $38,974,579 |
| Shares outstanding | 4,413,016 |
| Net asset value per share | $8.83 |
| Institutional Class | |
| Net assets | $1,037,100,872 |
| Shares outstanding | 117,379,786 |
| Net asset value per share | $8.84 |
| Institutional 2 Class | |
| Net assets | $31,099,368 |
| Shares outstanding | 3,524,938 |
| Net asset value per share | $8.82 |
| Institutional 3 Class | |
| Net assets | $272,331,761 |
| Shares outstanding | 30,819,425 |
| Net asset value per share | $8.84 |
| Class R | |
| Net assets | $1,636,961 |
| Shares outstanding | 185,319 |
| Net asset value per share | $8.83 |
| Class T | |
| Net assets | $2,756,281 |
| Shares outstanding | 312,199 |
| Net asset value per share | $8.83 |
| Maximum sales charge | 2.50% |
| Maximum offering price per share (calculated by dividing the net asset value per share by 1.0 minus the maximum sales charge per transaction for Class T shares) | $9.06 |
The accompanying Notes to Financial Statements are an integral part of this statement.
Columbia Total Return Bond Fund | Annual Report 2018
| 33 |
Statement of Operations
Year Ended April 30, 2018
| Net investment income | |
| Income: | |
| Dividends — unaffiliated issuers | $2,891,983 |
| Dividends — affiliated issuers | 819,205 |
| Interest | 76,007,705 |
| Foreign taxes withheld | (1,446) |
| Total income | 79,717,447 |
| Expenses: | |
| Management services fees | 11,472,735 |
| Distribution and/or service fees | |
| Class A | 1,950,891 |
| Class B | 4,320 |
| Class C | 443,726 |
| Class R | 10,364 |
| Class T | 10,704 |
| Transfer agent fees | |
| Class A | 1,150,107 |
| Advisor Class | 23,108 |
| Class B | 695 |
| Class C | 65,426 |
| Institutional Class | 1,593,458 |
| Institutional 2 Class | 21,405 |
| Institutional 3 Class | 34,736 |
| Class K | 1,537 |
| Class R | 3,069 |
| Class T | 6,372 |
| Plan administration fees | |
| Class K | 6,457 |
| Compensation of board members | 60,510 |
| Custodian fees | 72,923 |
| Printing and postage fees | 164,917 |
| Registration fees | 157,009 |
| Audit fees | 55,247 |
| Legal fees | 60,252 |
| Compensation of chief compliance officer | 906 |
| Other | 67,948 |
| Total expenses | 17,438,822 |
| Fees waived or expenses reimbursed by Investment Manager and its affiliates | (1,020,718) |
| Expense reduction | (2,219) |
| Total net expenses | 16,415,885 |
| Net investment income | 63,301,562 |
The accompanying Notes to Financial Statements are an integral part of this statement.
| 34 | Columbia Total Return Bond Fund | Annual Report 2018 |
Statement of Operations (continued)
Year Ended April 30, 2018
| Realized and unrealized gain (loss) — net | |
| Net realized gain (loss) on: | |
| Investments — unaffiliated issuers | 21,205,580 |
| Investments — affiliated issuers | 1,471 |
| Foreign currency translations | (67,628) |
| Futures contracts | (8,682,906) |
| Options purchased | 73,750 |
| Options contracts written | 2,236,750 |
| Swap contracts | (2,685,238) |
| Net realized gain | 12,081,779 |
| Net change in unrealized appreciation (depreciation) on: | |
| Investments — unaffiliated issuers | (67,968,724) |
| Investments — affiliated issuers | (592) |
| Foreign currency translations | 51,948 |
| Futures contracts | (532,616) |
| Options purchased | 2,554,875 |
| Swap contracts | (1,009,111) |
| Net change in unrealized appreciation (depreciation) | (66,904,220) |
| Net realized and unrealized loss | (54,822,441) |
| Net increase in net assets resulting from operations | $8,479,121 |
The accompanying Notes to Financial Statements are an integral part of this statement.
Columbia Total Return Bond Fund | Annual Report 2018
| 35 |
Statement of Changes in Net Assets
| | Year Ended
April 30, 2018 | Year Ended
April 30, 2017 |
| Operations | | |
| Net investment income | $63,301,562 | $83,184,976 |
| Net realized gain | 12,081,779 | 12,370,300 |
| Net change in unrealized appreciation (depreciation) | (66,904,220) | (23,851,421) |
| Net increase in net assets resulting from operations | 8,479,121 | 71,703,855 |
| Distributions to shareholders | | |
| Net investment income | | |
| Class A | (18,097,044) | (23,614,095) |
| Advisor Class | (408,283) | (369,491) |
| Class B | (7,150) | (71,803) |
| Class C | (714,362) | (967,189) |
| Class I | — | (11,324,590) |
| Institutional Class | (27,581,855) | (28,260,974) |
| Institutional 2 Class | (819,334) | (687,723) |
| Institutional 3 Class | (10,776,078) | (1,724,891) |
| Class K | (64,211) | (253,593) |
| Class R | (43,857) | (49,004) |
| Class T | (101,580) | (10,761,090) |
| Net realized gains | | |
| Class A | — | (14,462,320) |
| Advisor Class | — | (282,696) |
| Class B | — | (60,023) |
| Class C | — | (843,556) |
| Class I | — | (6,422,044) |
| Institutional Class | — | (15,192,584) |
| Institutional 2 Class | — | (361,965) |
| Institutional 3 Class | — | (291,165) |
| Class K | — | (178,228) |
| Class R | — | (35,864) |
| Class T | — | (7,513,363) |
| Return of capital | | |
| Class A | (819,817) | — |
| Advisor Class | (13,542) | — |
| Class C | (31,069) | — |
| Institutional Class | (1,299,402) | — |
| Institutional 2 Class | (39,002) | — |
| Institutional 3 Class | (502,689) | — |
| Class K | (1,355) | — |
| Class R | (1,635) | — |
| Class T | (3,502) | — |
| Total distributions to shareholders | (61,325,767) | (123,728,251) |
| Decrease in net assets from capital stock activity | (304,454,198) | (654,270,816) |
| Total decrease in net assets | (357,300,844) | (706,295,212) |
| Net assets at beginning of year | 2,459,776,736 | 3,166,071,948 |
| Net assets at end of year | $2,102,475,892 | $2,459,776,736 |
| Excess of distributions over net investment income | $(5,296,202) | $(11,436,277) |
The accompanying Notes to Financial Statements are an integral part of this statement.
| 36 | Columbia Total Return Bond Fund | Annual Report 2018 |
Statement of Changes in Net Assets (continued)
| | Year Ended | Year Ended |
| | April 30, 2018 | April 30, 2017 |
| | Shares | Dollars ($) | Shares | Dollars ($) |
| Capital stock activity |
| Class A | | | | |
| Subscriptions | 5,116,828 | 46,221,131 | 6,661,894 | 61,144,580 |
| Distributions reinvested | 2,040,194 | 18,410,244 | 3,942,127 | 35,754,633 |
| Redemptions | (17,352,715) | (156,487,295) | (26,215,905) | (237,927,346) |
| Net decrease | (10,195,693) | (91,855,920) | (15,611,884) | (141,028,133) |
| Advisor Class | | | | |
| Subscriptions | 474,552 | 4,268,927 | 1,412,732 | 12,919,784 |
| Distributions reinvested | 44,973 | 406,191 | 69,549 | 626,988 |
| Redemptions | (1,758,241) | (15,708,706) | (381,168) | (3,462,997) |
| Net increase (decrease) | (1,238,716) | (11,033,588) | 1,101,113 | 10,083,775 |
| Class B | | | | |
| Subscriptions | 92 | 836 | 12,286 | 113,871 |
| Distributions reinvested | 611 | 5,547 | 13,334 | 120,868 |
| Redemptions | (244,307) | (2,222,352) | (355,161) | (3,239,503) |
| Net decrease | (243,604) | (2,215,969) | (329,541) | (3,004,764) |
| Class C | | | | |
| Subscriptions | 416,508 | 3,753,789 | 714,416 | 6,574,669 |
| Distributions reinvested | 77,630 | 700,760 | 178,381 | 1,614,690 |
| Redemptions | (1,545,579) | (13,926,923) | (1,515,584) | (13,806,947) |
| Net decrease | (1,051,441) | (9,472,374) | (622,787) | (5,617,588) |
| Class I | | | | |
| Subscriptions | — | — | 8,248,118 | 75,149,073 |
| Distributions reinvested | — | — | 1,865,934 | 16,971,503 |
| Redemptions | — | — | (55,924,363) | (504,565,813) |
| Net decrease | — | — | (45,810,311) | (412,445,237) |
| Institutional Class | | | | |
| Subscriptions | 25,841,081 | 233,942,778 | 29,415,866 | 265,586,748 |
| Distributions reinvested | 1,985,971 | 17,919,936 | 2,394,950 | 21,738,389 |
| Redemptions | (30,353,938) | (274,053,357) | (29,190,155) | (267,928,518) |
| Net increase (decrease) | (2,526,886) | (22,190,643) | 2,620,661 | 19,396,619 |
| Institutional 2 Class | | | | |
| Subscriptions | 2,066,473 | 18,670,006 | 779,317 | 7,043,171 |
| Distributions reinvested | 95,154 | 857,131 | 115,782 | 1,049,222 |
| Redemptions | (1,714,512) | (15,466,228) | (280,143) | (2,554,494) |
| Net increase | 447,115 | 4,060,909 | 614,956 | 5,537,899 |
| Institutional 3 Class | | | | |
| Subscriptions | 5,131,929 | 46,517,075 | 49,029,754 | 440,859,174 |
| Distributions reinvested | 1,234,672 | 11,151,412 | 222,421 | 2,013,245 |
| Redemptions | (24,787,528) | (221,125,812) | (1,977,204) | (17,865,913) |
| Net increase (decrease) | (18,420,927) | (163,457,325) | 47,274,971 | 425,006,506 |
| Class K | | | | |
| Subscriptions | 19,347 | 175,445 | 108,353 | 990,928 |
| Distributions reinvested | 7,196 | 65,191 | 47,551 | 431,401 |
| Redemptions | (397,724) | (3,553,499) | (1,072,105) | (9,652,634) |
| Net decrease | (371,181) | (3,312,863) | (916,201) | (8,230,305) |
| Class R | | | | |
| Subscriptions | 99,064 | 896,388 | 141,055 | 1,301,408 |
| Distributions reinvested | 4,373 | 39,499 | 7,898 | 71,447 |
| Redemptions | (170,808) | (1,549,815) | (158,013) | (1,449,847) |
| Net decrease | (67,371) | (613,928) | (9,060) | (76,992) |
The accompanying Notes to Financial Statements are an integral part of this statement.
Columbia Total Return Bond Fund | Annual Report 2018
| 37 |
Statement of Changes in Net Assets (continued)
| | Year Ended | Year Ended |
| | April 30, 2018 | April 30, 2017 |
| | Shares | Dollars ($) | Shares | Dollars ($) |
| Class T | | | | |
| Subscriptions | 24 | 213 | 9,080,031 | 84,105,553 |
| Distributions reinvested | 11,601 | 104,835 | 2,008,338 | 18,274,032 |
| Redemptions | (494,017) | (4,467,545) | (71,410,520) | (646,272,181) |
| Net decrease | (482,392) | (4,362,497) | (60,322,151) | (543,892,596) |
| Total net decrease | (34,151,096) | (304,454,198) | (72,010,234) | (654,270,816) |
The accompanying Notes to Financial Statements are an integral part of this statement.
| 38 | Columbia Total Return Bond Fund | Annual Report 2018 |
[THIS PAGE INTENTIONALLY LEFT BLANK]
Columbia Total Return Bond Fund | Annual Report 2018
| 39 |
The following table is intended to help you understand the Fund’s financial performance. Certain information reflects financial results for a single share of a class held for the periods shown. Per share net investment income (loss) amounts are calculated based on average shares outstanding during the period. Total return assumes reinvestment of all dividends and distributions, if any. Total return does not reflect payment of sales charges, if any. Total return and portfolio turnover are not annualized for periods of less than one year. The portfolio turnover rate is calculated without regard to purchase and sales transactions of short-term instruments and certain derivatives, if any. If such transactions were included, the Fund’s portfolio turnover rate may be higher.
| | Net asset value,
beginning of
period | Net
investment
income | Net
realized
and
unrealized
gain (loss) | Total from
investment
operations | Distributions
from net
investment
income | Distributions
from net
realized
gains | Tax
return of
capital |
| Class A |
| Year Ended 4/30/2018 | $9.04 | 0.23 | (0.22) | 0.01 | (0.21) | — | (0.01) |
| Year Ended 4/30/2017 | $9.20 | 0.25 | (0.04) | 0.21 | (0.23) | (0.14) | — |
| Year Ended 4/30/2016 | $9.25 | 0.22 | 0.01 (e) | 0.23 | (0.17) | (0.11) | — |
| Year Ended 4/30/2015 | $9.15 | 0.23 | 0.09 | 0.32 | (0.22) | — | — |
| Year Ended 4/30/2014 | $9.49 | 0.24 | (0.31) | (0.07) | (0.21) | (0.06) | — |
| Advisor Class |
| Year Ended 4/30/2018 | $9.02 | 0.25 | (0.21) | 0.04 | (0.23) | — | (0.01) |
| Year Ended 4/30/2017 | $9.18 | 0.26 | (0.02) | 0.24 | (0.26) | (0.14) | — |
| Year Ended 4/30/2016 | $9.24 | 0.24 | 0.00 (e),(f) | 0.24 | (0.19) | (0.11) | — |
| Year Ended 4/30/2015 | $9.14 | 0.25 | 0.10 | 0.35 | (0.25) | — | — |
| Year Ended 4/30/2014 | $9.48 | 0.27 | (0.31) | (0.04) | (0.24) | (0.06) | — |
| Class C |
| Year Ended 4/30/2018 | $9.04 | 0.16 | (0.22) | (0.06) | (0.14) | — | (0.01) |
| Year Ended 4/30/2017 | $9.20 | 0.18 | (0.04) | 0.14 | (0.16) | (0.14) | — |
| Year Ended 4/30/2016 | $9.25 | 0.15 | 0.01 (e) | 0.16 | (0.10) | (0.11) | — |
| Year Ended 4/30/2015 | $9.15 | 0.17 | 0.09 | 0.26 | (0.16) | — | — |
| Year Ended 4/30/2014 | $9.49 | 0.19 | (0.31) | (0.12) | (0.16) | (0.06) | — |
| Institutional Class |
| Year Ended 4/30/2018 | $9.04 | 0.25 | (0.21) | 0.04 | (0.23) | — | (0.01) |
| Year Ended 4/30/2017 | $9.20 | 0.27 | (0.03) | 0.24 | (0.26) | (0.14) | — |
| Year Ended 4/30/2016 | $9.26 | 0.24 | 0.00 (e),(f) | 0.24 | (0.19) | (0.11) | — |
| Year Ended 4/30/2015 | $9.15 | 0.25 | 0.11 | 0.36 | (0.25) | — | — |
| Year Ended 4/30/2014 | $9.49 | 0.27 | (0.31) | (0.04) | (0.24) | (0.06) | — |
| Institutional 2 Class |
| Year Ended 4/30/2018 | $9.03 | 0.26 | (0.22) | 0.04 | (0.24) | — | (0.01) |
| Year Ended 4/30/2017 | $9.18 | 0.27 | (0.02) | 0.25 | (0.26) | (0.14) | — |
| Year Ended 4/30/2016 | $9.24 | 0.25 | 0.00 (e),(f) | 0.25 | (0.20) | (0.11) | — |
| Year Ended 4/30/2015 | $9.14 | 0.25 | 0.10 | 0.35 | (0.25) | — | — |
| Year Ended 4/30/2014 | $9.48 | 0.28 | (0.31) | (0.03) | (0.25) | (0.06) | — |
The accompanying Notes to Financial Statements are an integral part of this statement.
| 40 | Columbia Total Return Bond Fund | Annual Report 2018 |
Total
distributions to
shareholders | Net
asset
value,
end of
period | Total
return | Total gross
expense
ratio to
average
net assets(a) | Total net
expense
ratio to
average
net assets(a),(b) | Net investment
income
ratio to
average
net assets | Portfolio
turnover | Net
assets,
end of
period
(000’s) |
| |
| (0.22) | $8.83 | 0.08% | 0.91% | 0.86% (c) | 2.51% | 300% | $711,850 |
| (0.37) | $9.04 | 2.37% | 0.89% (d) | 0.84% (c),(d) | 2.70% | 379% | $820,441 |
| (0.28) | $9.20 | 2.58% | 0.91% | 0.86% (c) | 2.39% | 458% | $978,460 |
| (0.22) | $9.25 | 3.56% | 0.92% | 0.85% (c) | 2.45% | 316% | $1,248,168 |
| (0.27) | $9.15 | (0.62%) | 0.91% | 0.85% (c) | 2.67% | 274% | $1,473,961 |
| |
| (0.24) | $8.82 | 0.44% | 0.66% | 0.61% (c) | 2.72% | 300% | $6,726 |
| (0.40) | $9.02 | 2.63% | 0.63% (d) | 0.59% (c),(d) | 2.87% | 379% | $18,057 |
| (0.30) | $9.18 | 2.72% | 0.66% | 0.61% (c) | 2.65% | 458% | $8,265 |
| (0.25) | $9.24 | 3.82% | 0.67% | 0.60% (c) | 2.70% | 316% | $7,656 |
| (0.30) | $9.14 | (0.38%) | 0.67% | 0.60% (c) | 3.02% | 274% | $7,477 |
| |
| (0.15) | $8.83 | (0.67%) | 1.66% | 1.61% (c) | 1.75% | 300% | $38,975 |
| (0.30) | $9.04 | 1.61% | 1.64% (d) | 1.59% (c),(d) | 1.95% | 379% | $49,380 |
| (0.21) | $9.20 | 1.81% | 1.66% | 1.61% (c) | 1.65% | 458% | $55,975 |
| (0.16) | $9.25 | 2.89% | 1.67% | 1.50% (c) | 1.80% | 316% | $60,605 |
| (0.22) | $9.15 | (1.21%) | 1.66% | 1.45% (c) | 2.07% | 274% | $64,739 |
| |
| (0.24) | $8.84 | 0.44% | 0.66% | 0.61% (c) | 2.76% | 300% | $1,037,101 |
| (0.40) | $9.04 | 2.63% | 0.64% (d) | 0.59% (c),(d) | 2.94% | 379% | $1,083,917 |
| (0.30) | $9.20 | 2.72% | 0.66% | 0.61% (c) | 2.64% | 458% | $1,078,815 |
| (0.25) | $9.26 | 3.93% | 0.67% | 0.60% (c) | 2.69% | 316% | $1,175,483 |
| (0.30) | $9.15 | (0.37%) | 0.66% | 0.60% (c) | 2.92% | 274% | $1,289,621 |
| |
| (0.25) | $8.82 | 0.38% | 0.58% | 0.55% | 2.82% | 300% | $31,099 |
| (0.40) | $9.03 | 2.79% | 0.54% (d) | 0.54% (d) | 2.99% | 379% | $27,782 |
| (0.31) | $9.18 | 2.80% | 0.55% | 0.54% | 2.73% | 458% | $22,621 |
| (0.25) | $9.24 | 3.89% | 0.55% | 0.54% | 2.74% | 316% | $21,580 |
| (0.31) | $9.14 | (0.28%) | 0.51% | 0.50% | 3.15% | 274% | $15,980 |
Columbia Total Return Bond Fund | Annual Report 2018
| 41 |
Financial Highlights (continued)
| | Net asset value,
beginning of
period | Net
investment
income | Net
realized
and
unrealized
gain (loss) | Total from
investment
operations | Distributions
from net
investment
income | Distributions
from net
realized
gains | Tax
return of
capital |
| Institutional 3 Class |
| Year Ended 4/30/2018 | $9.04 | 0.26 | (0.21) | 0.05 | (0.24) | — | (0.01) |
| Year Ended 4/30/2017 | $9.20 | 0.24 | 0.01 (e) | 0.25 | (0.27) | (0.14) | — |
| Year Ended 4/30/2016 | $9.26 | 0.25 | 0.00 (e),(f) | 0.25 | (0.20) | (0.11) | — |
| Year Ended 4/30/2015 | $9.16 | 0.26 | 0.10 | 0.36 | (0.26) | — | — |
| Year Ended 4/30/2014 | $9.49 | 0.29 | (0.31) | (0.02) | (0.25) | (0.06) | — |
| Class R |
| Year Ended 4/30/2018 | $9.04 | 0.20 | (0.21) | (0.01) | (0.19) | — | (0.01) |
| Year Ended 4/30/2017 | $9.20 | 0.22 | (0.03) | 0.19 | (0.21) | (0.14) | — |
| Year Ended 4/30/2016 | $9.26 | 0.19 | 0.01 (e) | 0.20 | (0.15) | (0.11) | — |
| Year Ended 4/30/2015 | $9.15 | 0.20 | 0.11 | 0.31 | (0.20) | — | — |
| Year Ended 4/30/2014 | $9.49 | 0.22 | (0.31) | (0.09) | (0.19) | (0.06) | — |
| Class T |
| Year Ended 4/30/2018 | $9.03 | 0.23 | (0.21) | 0.02 | (0.21) | — | (0.01) |
| Year Ended 4/30/2017 | $9.21 | 0.26 | (0.07) | 0.19 | (0.23) | (0.14) | — |
| Year Ended 4/30/2016 | $9.26 | 0.22 | 0.01 (e) | 0.23 | (0.17) | (0.11) | — |
| Year Ended 4/30/2015 | $9.16 | 0.23 | 0.09 | 0.32 | (0.22) | — | — |
| Year Ended 4/30/2014 | $9.50 | 0.24 | (0.30) | (0.06) | (0.22) | (0.06) | — |
| Notes to Financial Highlights |
| (a) | In addition to the fees and expenses that the Fund bears directly, the Fund indirectly bears a pro rata share of the fees and expenses of any other funds in which it invests. Such indirect expenses are not included in the Fund’s reported expense ratios. |
| (b) | Total net expenses include the impact of certain fee waivers/expense reimbursements made by the Investment Manager and certain of its affiliates, if applicable. |
| (c) | The benefits derived from expense reductions had an impact of less than 0.01%. |
| (d) | Expenses have been reduced due to a reimbursement of expenses overbilled by a third party. If the reimbursement had been excluded, the expense ratios would have been higher by the percentages shown for each class in the table below. All fee waivers and expense reimbursements by the Investment Manager and its affiliates were applied before giving effect to this third party reimbursement. |
| Year Ended | Class A | Advisor
Class | Class C | Institutional
Class | Institutional 2
Class | Institutional 3
Class | Class R | Class T |
| 04/30/2017 | 0.02 % | 0.02 % | 0.02 % | 0.02 % | 0.02 % | 0.01 % | 0.02 % | 0.02 % |
| (e) | Calculation of the net gain (loss) per share (both realized and unrealized) does not correlate to the aggregate realized and unrealized gain (loss) presented in the Statement of Operations due to the timing of subscriptions and redemptions of Fund shares in relation to fluctuations in the market value of the portfolio. |
| (f) | Rounds to zero. |
The accompanying Notes to Financial Statements are an integral part of this statement.
| 42 | Columbia Total Return Bond Fund | Annual Report 2018 |
Total
distributions to
shareholders | Net
asset
value,
end of
period | Total
return | Total gross
expense
ratio to
average
net assets(a) | Total net
expense
ratio to
average
net assets(a),(b) | Net investment
income
ratio to
average
net assets | Portfolio
turnover | Net
assets,
end of
period
(000’s) |
| |
| (0.25) | $8.84 | 0.55% | 0.52% | 0.50% | 2.85% | 300% | $272,332 |
| (0.41) | $9.04 | 2.74% | 0.50% (d) | 0.50% (d) | 2.70% | 379% | $445,184 |
| (0.31) | $9.20 | 2.85% | 0.50% | 0.49% | 2.77% | 458% | $18,086 |
| (0.26) | $9.26 | 3.94% | 0.50% | 0.49% | 2.80% | 316% | $18,249 |
| (0.31) | $9.16 | (0.17%) | 0.51% | 0.50% | 3.21% | 274% | $15,642 |
| |
| (0.20) | $8.83 | (0.17%) | 1.16% | 1.11% (c) | 2.24% | 300% | $1,637 |
| (0.35) | $9.04 | 2.12% | 1.14% (d) | 1.09% (c),(d) | 2.43% | 379% | $2,284 |
| (0.26) | $9.20 | 2.21% | 1.16% | 1.11% (c) | 2.13% | 458% | $2,407 |
| (0.20) | $9.26 | 3.41% | 1.17% | 1.10% (c) | 2.19% | 316% | $2,769 |
| (0.25) | $9.15 | (0.87%) | 1.16% | 1.10% (c) | 2.43% | 274% | $2,750 |
| |
| (0.22) | $8.83 | 0.19% | 0.91% | 0.86% (c) | 2.49% | 300% | $2,756 |
| (0.37) | $9.03 | 2.15% | 0.88% (d) | 0.84% (c),(d) | 2.81% | 379% | $7,178 |
| (0.28) | $9.21 | 2.58% | 0.91% | 0.86% (c) | 2.41% | 458% | $562,638 |
| (0.22) | $9.26 | 3.56% | 0.92% | 0.85% (c) | 2.45% | 316% | $453,340 |
| (0.28) | $9.16 | (0.62%) | 0.91% | 0.85% (c) | 2.68% | 274% | $507,419 |
Columbia Total Return Bond Fund | Annual Report 2018
| 43 |
Notes to Financial Statements
April 30, 2018
Note 1. Organization
Columbia Total Return Bond Fund (the Fund), a series of Columbia Funds Series Trust I (the Trust), is a diversified fund. The Trust is registered under the Investment Company Act of 1940, as amended (the 1940 Act), as an open-end management investment company organized as a Massachusetts business trust.
Fund shares
The Trust may issue an unlimited number of shares (without par value). Although all share classes generally have identical voting, dividend and liquidation rights, each share class votes separately when required by the Trust’s organizational documents or by law. Different share classes pay different distribution amounts to the extent the expenses of such share classes differ, and distributions in liquidation will be proportional to the net asset value of each share class. Each share class has its own expense and sales charge structure. The Fund offers each of the share classes identified below.
Class A shares are subject to a maximum front-end sales charge of 3.00% based on the initial investment amount. Class A shares purchased without an initial sales charge in accounts aggregating $1 million to $50 million at the time of purchase are subject to a contingent deferred sales charge (CDSC) if the shares are sold within 18 months after purchase, charged as follows: 1.00% CDSC if redeemed within 12 months after purchase, and 0.50% CDSC if redeemed more than 12, but less than 18, months after purchase.
Advisor Class shares are not subject to sales charges and are generally available only to omnibus retirement plans and certain investors as described in the Fund’s prospectus. Prior to November 1, 2017, Advisor Class shares were known as Class R4 shares.
Class B shares of the Fund are no longer offered for sale. When available, Class B shares were subject to a maximum CDSC of 3.00% based upon the holding period after purchase. Effective July 17, 2017, Class B shares were automatically converted to Class A shares without a CDSC. On August 4, 2017, the capital owned by Columbia Management Investment Advisers, LLC in Class B shares was redeemed without a CDSC.
Class C shares are subject to a 1.00% CDSC on shares redeemed within 12 months after purchase.
Institutional Class shares are not subject to sales charges and are generally available only to eligible investors, which are subject to different investment minimums as described in the Fund’s prospectus. Prior to November 1, 2017, Institutional Class shares were known as Class Z shares.
Institutional 2 Class shares are not subject to sales charges and are generally available only to investors purchasing through authorized investment professionals and omnibus retirement plans as described in the Fund’s prospectus. Prior to November 1, 2017, Institutional 2 Class shares were known as Class R5 shares.
Institutional 3 Class shares are not subject to sales charges and are available to institutional and certain other investors as described in the Fund’s prospectus. Prior to November 1, 2017, Institutional 3 Class shares were known as Class Y shares.
The Fund no longer accepts investments by existing investors in Class K shares. When available, Class K shares were not subject to sales charges and were made available only to existing investors in Class K shares. On March 9, 2018, Class K shares were redeemed or exchanged for Advisor Class shares of the Fund in a tax free transaction that had no impact on fees and expenses paid by the shareholders.
Class R shares are not subject to sales charges and are generally available only to certain retirement plans and other investors as described in the Fund’s prospectus.
Class T shares are subject to a maximum front-end sales charge of 2.50% per transaction and must be purchased through financial intermediaries that, by written agreement with Columbia Management Investment Distributors, Inc., are specifically authorized to sell Class T shares.
| 44 | Columbia Total Return Bond Fund | Annual Report 2018 |
Notes to Financial Statements (continued)
April 30, 2018
Note 2. Summary of significant accounting policies
Basis of preparation
The Fund is an investment company that applies the accounting and reporting guidance in the Financial Accounting Standards Board (FASB) Accounting Standards Codification Topic 946, Financial Services - Investment Companies (ASC 946). The financial statements are prepared in accordance with U.S. generally accepted accounting principles (GAAP), which requires management to make certain estimates and assumptions that affect the reported amounts of assets and liabilities, the disclosure of contingent assets and liabilities at the date of the financial statements and the reported amounts of income and expenses during the reporting period. Actual results could differ from those estimates.
The following is a summary of significant accounting policies followed by the Fund in the preparation of its financial statements.
Security valuation
All equity securities are valued at the close of business of the New York Stock Exchange. Equity securities are valued at the last quoted sales price on the principal exchange or market on which they trade, except for securities traded on the NASDAQ Stock Market, which are valued at the NASDAQ official close price. Unlisted securities or listed securities for which there were no sales during the day are valued at the mean of the latest quoted bid and ask prices on such exchanges or markets.
Debt securities generally are valued by pricing services approved by the Board of Trustees based upon market transactions for normal, institutional-size trading units of similar securities. The services may use various pricing techniques that take into account, as applicable, factors such as yield, quality, coupon rate, maturity, type of issue, trading characteristics and other data, as well as approved independent broker-dealer quotes. Debt securities for which quotations are not readily available or not believed to be reflective of market value may also be valued based upon a bid quote from an approved independent broker-dealer. Debt securities maturing in 60 days or less are valued primarily at amortized cost value, unless this method results in a valuation that management believes does not approximate market value.
Asset- and mortgage-backed securities are generally valued by pricing services, which utilize pricing models that incorporate the securities’ cash flow and loan performance data. These models also take into account available market data, including trades, market quotations, and benchmark yield curves for identical or similar securities. Factors used to identify similar securities may include, but are not limited to, issuer, collateral type, vintage, prepayment speeds, collateral performance, credit ratings, credit enhancement and expected life. Asset-backed securities for which quotations are readily available may also be valued based upon an over-the-counter or exchange bid quote from an approved independent broker-dealer.
Senior loan securities for which reliable market quotations are readily available are generally valued by pricing services at the average of the bids received.
Investments in open-end investment companies, including money market funds, are valued at their latest net asset value.
Futures and options on futures contracts are valued based upon the settlement price at the close of regular trading on their principal exchanges or, in the absence of transactions, at the mean of the latest quoted bid and ask prices.
Option contracts are valued at the mean of the latest quoted bid and ask prices on their primary exchanges. Option contracts, including over-the-counter option contracts, with no readily available market quotations are valued using quotes obtained from independent brokers as of the close of the New York Stock Exchange.
Swap transactions are valued through an independent pricing service or broker, or if neither is available, through an internal model based upon observable inputs.
Investments for which market quotations are not readily available, or that have quotations which management believes are not reflective of market value or reliable, are valued at fair value as determined in good faith under procedures approved by and under the general supervision of the Board of Trustees. If a security or class of securities (such as foreign securities) is valued at fair value, such value is likely to be different from the quoted or published price for the security.
Columbia Total Return Bond Fund | Annual Report 2018
| 45 |
Notes to Financial Statements (continued)
April 30, 2018
The determination of fair value often requires significant judgment. To determine fair value, management may use assumptions including but not limited to future cash flows and estimated risk premiums. Multiple inputs from various sources may be used to determine fair value.
GAAP requires disclosure regarding the inputs and valuation techniques used to measure fair value and any changes in valuation inputs or techniques. In addition, investments shall be disclosed by major category. This information is disclosed following the Fund’s Portfolio of Investments.
Foreign currency transactions and translations
The values of all assets and liabilities denominated in foreign currencies are generally translated into U.S. dollars at exchange rates determined at the close of regular trading on the New York Stock Exchange. Net realized and unrealized gains (losses) on foreign currency transactions and translations include gains (losses) arising from the fluctuation in exchange rates between trade and settlement dates on securities transactions, gains (losses) arising from the disposition of foreign currency and currency gains (losses) between the accrual and payment dates on dividends, interest income and foreign withholding taxes.
For financial statement purposes, the Fund does not distinguish that portion of gains (losses) on investments which is due to changes in foreign exchange rates from that which is due to changes in market prices of the investments. Such fluctuations are included with the net realized and unrealized gains (losses) on investments in the Statement of Operations.
Derivative instruments
The Fund invests in certain derivative instruments, as detailed below, to meet its investment objectives. Derivatives are instruments whose values depend on, or are derived from, in whole or in part, the value of one or more securities, currencies, commodities, indices, or other assets or instruments. Derivatives may be used to increase investment flexibility (including to maintain cash reserves while maintaining desired exposure to certain assets), for risk management (hedging) purposes, to facilitate trading, to reduce transaction costs and to pursue higher investment returns. The Fund may also use derivative instruments to mitigate certain investment risks, such as foreign currency exchange rate risk, interest rate risk and credit risk. Derivatives may involve various risks, including the potential inability of the counterparty to fulfill its obligations under the terms of the contract, the potential for an illiquid secondary market (making it difficult for the Fund to sell or terminate, including at favorable prices) and the potential for market movements which may expose the Fund to gains or losses in excess of the amount shown in the Statement of Assets and Liabilities. The notional amounts of derivative instruments, if applicable, are not recorded in the financial statements.
A derivative instrument may suffer a marked-to-market loss if the value of the contract decreases due to an unfavorable change in the market rates or values of the underlying instrument. Losses can also occur if the counterparty does not perform its obligations under the contract. The Fund’s risk of loss from counterparty credit risk on over-the-counter derivatives is generally limited to the aggregate unrealized gain netted against any collateral held by the Fund and the amount of any variation margin held by the counterparty, plus any replacement costs or related amounts. With exchange-traded or centrally cleared derivatives, there is reduced counterparty credit risk to the Fund since the clearinghouse or central counterparty (CCP) provides some protection in the case of clearing member default. The clearinghouse or CCP stands between the buyer and the seller of the contract; therefore, additional counterparty credit risk is failure of the clearinghouse or CCP. However, credit risk still exists in exchange-traded or centrally cleared derivatives with respect to initial and variation margin that is held in a broker’s customer account. While brokers are required to segregate customer margin from their own assets, in the event that a broker becomes insolvent or goes into bankruptcy and at that time there is a shortfall in the aggregate amount of margin held by the broker for all its clients, U.S. bankruptcy laws will typically allocate that shortfall on a pro-rata basis across all the broker’s customers (including the Fund), potentially resulting in losses to the Fund.
In order to better define its contractual rights and to secure rights that will help the Fund mitigate its counterparty risk, the Fund may enter into an International Swaps and Derivatives Association, Inc. Master Agreement (ISDA Master Agreement) or similar agreement with its derivatives contract counterparties. An ISDA Master Agreement is an agreement between the Fund and a counterparty that governs over-the-counter derivatives and typically contains, among other things, collateral posting terms and netting provisions in the event of a default and/or termination event. Under an ISDA Master Agreement, the Fund may, under certain circumstances, offset with the counterparty certain derivative instrument’s payables and/or receivables
| 46 | Columbia Total Return Bond Fund | Annual Report 2018 |
Notes to Financial Statements (continued)
April 30, 2018
with collateral held and/or posted and create one single net payment. The provisions of the ISDA Master Agreement typically permit a single net payment in the event of default (close-out netting), including the bankruptcy or insolvency of the counterparty. Note, however, that bankruptcy or insolvency laws of a particular jurisdiction may impose restrictions on or prohibitions against the right of offset or netting in bankruptcy, insolvency or other events.
Collateral (margin) requirements differ by type of derivative. Margin requirements are established by the clearinghouse or CCP for exchange-traded and centrally cleared derivatives. Brokers can ask for margin in excess of the minimum in certain circumstances. Collateral terms are contract specific for over-the-counter derivatives. For over-the-counter derivatives traded under an ISDA Master Agreement, the collateral requirements are typically calculated by netting the marked-to-market amount for each transaction under such agreement and comparing that amount to the value of any variation margin currently pledged by the Fund and/or the counterparty. Generally, the amount of collateral due from or to a party has to exceed a minimum transfer amount threshold (e.g., $250,000) before a transfer has to be made. To the extent amounts due to the Fund from its counterparties are not fully collateralized, contractually or otherwise, the Fund bears the risk of loss from counterparty nonperformance. The Fund may also pay interest expense on cash collateral received from the broker. Any interest expense paid by the Fund is shown on the Statement of Operations. The Fund attempts to mitigate counterparty risk by only entering into agreements with counterparties that it believes have the financial resources to honor their obligations and by monitoring the financial stability of those counterparties.
Certain ISDA Master Agreements allow counterparties of over-the-counter derivatives transactions to terminate derivatives contracts prior to maturity in the event the Fund’s net asset value declines by a stated percentage over a specified time period or if the Fund fails to meet certain terms of the ISDA Master Agreement, which would cause the Fund to accelerate payment of any net liability owed to the counterparty. The Fund also has termination rights if the counterparty fails to meet certain terms of the ISDA Master Agreement. In addition to considering counterparty credit risk, the Fund would consider terminating the derivatives contracts based on whether termination would result in a net liability owed from the counterparty.
For financial reporting purposes, the Fund does not offset derivative assets and derivative liabilities that are subject to netting arrangements in the Statement of Assets and Liabilities.
Futures contracts
Futures contracts are exchange-traded and represent commitments for the future purchase or sale of an asset at a specified price on a specified date. The Fund bought and sold futures contracts to manage the duration and yield curve exposure of the Fund versus the benchmark and to manage exposure to movements in interest rates. These instruments may be used for other purposes in future periods. Upon entering into futures contracts, the Fund bears risks that it may not achieve the anticipated benefits of the futures contracts and may realize a loss. Additional risks include counterparty credit risk, the possibility of an illiquid market, and that a change in the value of the contract or option may not correlate with changes in the value of the underlying asset.
Upon entering into a futures contract, the Fund deposits cash or securities with the broker, known as a futures commission merchant (FCM), in an amount sufficient to meet the initial margin requirement. The initial margin deposit must be maintained at an established level over the life of the contract. Cash deposited as initial margin is recorded in the Statement of Assets and Liabilities as margin deposits. Securities deposited as initial margin are designated in the Portfolio of Investments. Subsequent payments (variation margin) are made or received by the Fund each day. The variation margin payments are equal to the daily change in the contract value and are recorded as variation margin receivable or payable and are offset in unrealized gains or losses. The Fund recognizes a realized gain or loss when the contract is closed or expires. Futures contracts involve, to varying degrees, risk of loss in excess of the variation margin disclosed in the Statement of Assets and Liabilities.
Options contracts
Options are contracts which entitle the holder to purchase or sell securities or other identified assets at a specified price, or in the case of index option contracts, to receive or pay the difference between the index value and the strike price of the index option contract. Option contracts can be either exchange-traded or over-the-counter. The Fund purchased and wrote option contracts to manage exposure to fluctuations in interest rates. These instruments may be used for other purposes in future periods. Completion of transactions for option contracts traded in the over-the-counter market depends upon the
Columbia Total Return Bond Fund | Annual Report 2018
| 47 |
Notes to Financial Statements (continued)
April 30, 2018
performance of the other party. Cash collateral may be collected or posted by the Fund to secure certain over-the-counter option contract trades. Cash collateral held or posted by the Fund for such option contract trades must be returned to the broker or the Fund upon closure, exercise or expiration of the contract.
Options contracts purchased are recorded as investments. When the Fund writes an options contract, the premium received is recorded as an asset and an amount equivalent to the premium is recorded as a liability in the Statement of Assets and Liabilities and is subsequently adjusted to reflect the current fair value of the option written. Changes in the fair value of the written option are recorded as unrealized appreciation or depreciation until the contract is exercised or has expired. The Fund will realize a gain or loss when the option contract is closed or expires. When option contracts are exercised, the proceeds on sales for a written call or purchased put option contract, or the purchase cost for a written put or purchased call option contract, is adjusted by the amount of premium received or paid.
For over-the-counter options purchased, the Fund bears the risk of loss of the amount of the premiums paid plus the positive change in market values net of any collateral held by the Fund should the counterparty fail to perform under the contracts. Option contracts written by the Fund do not typically give rise to significant counterparty credit risk, as options written generally obligate the Fund and not the counterparty to perform. The risk in writing a call option contract is that the Fund gives up the opportunity for profit if the market price of the security increases above the strike price and the option contract is exercised. The risk in writing a put option contract is that the Fund may incur a loss if the market price of the security decreases below the strike price and the option contract is exercised. Exercise of a written option could result in the Fund purchasing or selling a security or foreign currency when it otherwise would not, or at a price different from the current market value. In purchasing and writing options, the Fund bears the risk of an unfavorable change in the value of the underlying instrument or the risk that the Fund may not be able to enter into a closing transaction due to an illiquid market.
Interest rate swaption contracts
Interest rate swaption contracts entered into by the Fund typically represent an option that gives the purchaser the right, but not the obligation, to enter into an interest rate swap contract on a future date. Each interest rate swaption agreement will specify if the buyer is entitled to receive the fixed or floating rate if the interest rate is exercised. Changes in the value of a purchased interest rate swaption contracts are reported as unrealized appreciation or depreciation on options in the Statement of Assets and Liabilities. Gain or loss is recognized in the Statement of Operations when the interest rate swaption contract is closed or expires.
When the Fund writes an interest rate swaption contract, the premium received is recorded as an asset and an amount equivalent to the premium is recorded as a liability in the Statement of Assets and Liabilities and is subsequently adjusted to reflect the current fair value of the interest rate swaption contract written. Premiums received from writing interest rate swaption contracts that expire unexercised are recorded by the Fund on the expiration date as realized gains from options written in the Statement of Operations. The difference between the premium and the amount paid on effecting a closing purchase transaction, including brokerage commissions, is also recorded as realized gain, or if the premium is less than the amount paid for the closing purchase, as realized loss. These amounts are reflected as net realized gain (loss) on options written in the Statement of Operations.
Swap contracts
Swap contracts are negotiated in the over-the-counter market and may be entered into as a bilateral contract or centrally cleared (centrally cleared swap contract). In a centrally cleared swap contract, immediately following execution of the swap contract with a broker, the swap contract is novated to a central counterparty (the CCP) and the CCP becomes the Fund’s counterparty to the centrally cleared swap contract. The Fund is required to deposit initial margin with the futures commission merchant (FCM), which pledges it through to the CCP in the form of cash or securities in an amount that varies depending on the size and risk profile of the particular swap contract. Securities deposited as initial margin are designated in the Portfolio of Investments and cash deposited is recorded in the Statement of Assets and Liabilities as margin deposits. Unlike a bilateral swap contract, for centrally cleared swap contracts, the Fund has minimal credit exposure to the FCM because the CCP stands between the Fund and the relevant buyer/seller on the other side of the contract. Swap contracts are marked-to-market daily and changes in value are recorded as unrealized appreciation (depreciation). The daily change in valuation of centrally cleared swap contracts, if any, is recorded as a receivable or payable for variation margin in the Statement of Assets and Liabilities.
| 48 | Columbia Total Return Bond Fund | Annual Report 2018 |
Notes to Financial Statements (continued)
April 30, 2018
Entering into these contracts involves, to varying degrees, elements of interest, liquidity and counterparty credit risk in excess of the amounts recognized in the Statement of Assets and Liabilities. Such risks involve the possibility that there may be unfavorable changes in interest rates, market conditions or other conditions, that it may be difficult to initiate a swap transaction or liquidate a position at an advantageous time or price which may result in significant losses, and that the FCM or CCP may not fulfill its obligation under the contract.
Credit default swap contracts
The Fund entered into credit default swap contracts to increase or decrease its credit exposure to an index. These instruments may be used for other purposes in future periods. Credit default swap contracts are agreements in which one party pays fixed periodic payments to a counterparty in consideration for an agreement from the counterparty to make a specific payment should a specified credit event(s) take place. Although specified credit events are contract specific, credit events are generally defined as bankruptcy, failure to pay, restructuring, obligation acceleration, obligation default, or repudiation/moratorium.
As the purchaser of a credit default swap contract, the Fund purchases protection by paying a periodic interest rate on the notional amount to the counterparty. The interest amount is accrued daily as a component of unrealized appreciation (depreciation) and is recorded as a realized loss upon payment. If a credit event as specified in the contract occurs, the Fund may have the option either to deliver the reference obligation to the seller in exchange for a cash payment of its par amount, or to receive a net cash settlement equal to the par amount less an agreed-upon value of the reference obligation as of the date of the credit event. The difference between the value of the obligation or cash delivered and the notional amount received will be recorded as a realized gain (loss).
As the seller of a credit default swap contract, the Fund sells protection to a buyer and will generally receive a periodic interest rate on a notional amount. The interest amount is accrued daily as a component of unrealized appreciation (depreciation) and is recorded as a realized gain upon receipt of the payment. If a credit event as specified in the contract with the counterparty occurs, the Fund may either be required to accept the reference obligation from the buyer in exchange for a cash payment of its notional amount, or to pay the buyer a net cash settlement equal to the notional amount less an agreed-upon value of the reference obligation (recovery value) as of the date of the credit event. The difference between the value of the obligation or cash received and the notional amount paid will be recorded as a realized gain (loss). The maximum potential amount of undiscounted future payments the Fund could be required to make as the seller of protection under a credit default swap contract is equal to the notional amount of the reference obligation. These potential amounts may be partially offset by any recovery values of the respective reference obligations or upfront receipts upon entering into the agreement. The notional amounts and market values of all credit default swap contracts in which the Fund is the seller of protection, if any, are disclosed in the Credit Default Swap Contracts Outstanding schedule following the Portfolio of Investments.
As a protection seller, the Fund bears the risk of loss from the credit events specified in the contract with the counterparty. For credit default swap contracts on credit indices, quoted market prices and resulting market values serve as an indicator of the current status of the payment/performance risk. Increasing market values, in absolute terms when compared to the notional amount of the swap, represent a deterioration of the reference entity’s credit soundness and a greater likelihood or risk of default or other credit event occurring as defined under the terms of the contract.
Any upfront payments or receipts by the Fund upon entering into a credit default swap contract is recorded as an asset or liability, respectively, and amortized daily as a component of realized gain (loss) in the Statement of Operations. Credit default swap contracts are valued daily, and the change in value is recorded as unrealized appreciation (depreciation) until the termination of the swap, at which time a realized gain (loss) is recorded.
Credit default swap contracts can involve greater risks than if a fund had invested in the reference obligation directly since, in addition to general market risks, credit default swaps are subject to counterparty credit risk, leverage risk, hedging risk, correlation risk and liquidity risk.
Columbia Total Return Bond Fund | Annual Report 2018
| 49 |
Notes to Financial Statements (continued)
April 30, 2018
Effects of derivative transactions in the financial statements
The following tables are intended to provide additional information about the effect of derivatives on the financial statements of the Fund, including: the fair value of derivatives by risk category and the location of those fair values in the Statement of Assets and Liabilities; and the impact of derivative transactions over the period in the Statement of Operations, including realized and unrealized gains (losses). The derivative instrument schedules following the Portfolio of Investments present additional information regarding derivative instruments outstanding at the end of the period, if any.
The following table is a summary of the fair value of derivative instruments (not considered to be hedging instruments for accounting disclosure purposes) at April 30, 2018:
| | Asset derivatives | |
Risk exposure
category | Statement
of assets and liabilities
location | Fair value ($) |
| Credit risk | Net assets — unrealized appreciation on swap contracts | 1,854,352* |
| Credit risk | Upfront payments on swap contracts | 96,355 |
| Interest rate risk | Investments, at value — Options purchased | 6,867,375 |
| Total | | 8,818,082 |
| | Liability derivatives | |
Risk exposure
category | Statement
of assets and liabilities
location | Fair value ($) |
| Credit risk | Net assets — unrealized depreciation on swap contracts | 858,854* |
| Credit risk | Upfront receipts on swap contracts | 3,454,023 |
| Interest rate risk | Net assets — unrealized depreciation on futures contracts | 1,618,793* |
| Total | | 5,931,670 |
| * | Includes cumulative appreciation (depreciation) as reported in the tables following the Portfolio of Investments. Only the current day’s variation margin is reported in receivables or payables in the Statement of Assets and Liabilities. |
The following table indicates the effect of derivative instruments (not considered to be hedging instruments for accounting disclosure purposes) in the Statement of Operations for the year ended April 30, 2018:
| Amount of realized gain (loss) on derivatives recognized in income |
| Risk exposure category | Futures
contracts
($) | Options
contracts
written
($) | Options
contracts
purchased
($) | Swap
contracts
($) | Total
($) |
| Credit risk | — | — | — | (2,685,238) | (2,685,238) |
| Interest rate risk | (8,682,906) | 2,236,750 | 73,750 | — | (6,372,406) |
| Total | (8,682,906) | 2,236,750 | 73,750 | (2,685,238) | (9,057,644) |
| Change in unrealized appreciation (depreciation) on derivatives recognized in income |
| Risk exposure category | Futures
contracts
($) | Options
contracts
purchased
($) | Swap
contracts
($) | Total
($) |
| Credit risk | — | — | (1,009,111) | (1,009,111) |
| Interest rate risk | (532,616) | 2,554,875 | — | 2,022,259 |
| Total | (532,616) | 2,554,875 | (1,009,111) | 1,013,148 |
| 50 | Columbia Total Return Bond Fund | Annual Report 2018 |
Notes to Financial Statements (continued)
April 30, 2018
The following table is a summary of the average outstanding volume by derivative instrument for the year ended April 30, 2018:
| Derivative instrument | Average notional
amounts ($)* |
| Futures contracts — long | 279,388,419 |
| Futures contracts — short | 71,719,553 |
| Credit default swap contracts — buy protection | 375,013,750 |
| Credit default swap contracts — sell protection | 617,096,195 |
| Derivative instrument | Average
value ($) |
| Options contracts — purchased | 3,558,569* |
| Options contracts — written | (379,997)** |
| * | Based on the ending quarterly outstanding amounts for the year ended April 30, 2018. |
| ** | Based on the ending daily outstanding amounts for the year ended April 30, 2018. |
Investments in senior loans
The Fund may invest in senior loan assignments. When the Fund purchases an assignment of a senior loan, the Fund typically has direct rights against the borrower; provided, however, that the Fund’s rights may be more limited than the lender from which it acquired the assignment and the Fund may be able to enforce its rights only through an administrative agent. Although certain senior loan assignments are secured by collateral, the Fund could experience delays or limitations in realizing such collateral or have its interest subordinated to other indebtedness of the obligor. In the event that the administrator or collateral agent of a loan becomes insolvent or enters into receivership or bankruptcy, the Fund may incur costs and delays in realizing payment or may suffer a loss of principal and/or interest. The risk of loss is greater for unsecured or subordinated loans. In addition, senior loan assignments are vulnerable to market, economic or other conditions or events that may reduce the demand for senior loan assignments and certain senior loan assignments which were liquid when purchased, may become illiquid.
The Fund may enter into senior loan assignments where all or a portion of the loan may be unfunded. The Fund is obligated to fund these commitments at the borrower’s discretion. These commitments, if any, are generally traded and priced in the same manner as other senior loan securities and are disclosed as unfunded senior loan commitments in the Fund’s Portfolio of Investments with a corresponding payable for investments purchased. The Fund designates cash or liquid securities to cover these commitments.
Asset- and mortgage-backed securities
The Fund may invest in asset-backed and mortgage-backed securities. The maturity dates shown represent the original maturity of the underlying obligation. Actual maturity may vary based upon prepayment activity on these obligations. All, or a portion, of the obligation may be prepaid at any time because the underlying asset may be prepaid. As a result, decreasing market interest rates could result in an increased level of prepayment. An increased prepayment rate will have the effect of shortening the maturity of the security. Unless otherwise noted, the coupon rates presented are fixed rates.
Delayed delivery securities
The Fund may trade securities on other than normal settlement terms, including securities purchased or sold on a “when-issued” or "forward commitment" basis. This may increase risk to the Fund since the other party to the transaction may fail to deliver, which could cause the Fund to subsequently invest at less advantageous prices. The Fund designates cash or liquid securities in an amount equal to the delayed delivery commitment.
To be announced securities
The Fund may trade securities on a To Be Announced (TBA) basis. As with other delayed-delivery transactions, a seller agrees to issue a TBA security at a future date. However, the seller does not specify the particular securities to be delivered. Instead, the Fund agrees to accept any security that meets specified terms.
Columbia Total Return Bond Fund | Annual Report 2018
| 51 |
Notes to Financial Statements (continued)
April 30, 2018
In some cases, Master Securities Forward Transaction Agreements (MSFTAs) may be used to govern transactions of certain forward-settling agency mortgage-backed securities, such as delayed-delivery and TBAs, between the Fund and counterparty. The MSFTA maintains provisions for, among other things, initiation and confirmation, payment and transfer, events of default, termination, and maintenance of collateral relating to such transactions.
Mortgage dollar roll transactions
The Fund may enter into mortgage “dollar rolls” in which the Fund sells securities for delivery in the current month and simultaneously contracts with the same counterparty to repurchase similar but not identical securities (same type, coupon and maturity) on a specified future date. During the roll period, the Fund loses the right to receive principal and interest paid on the securities sold. However, the Fund will benefit because it receives negotiated amounts in the form of reductions of the purchase price for the future purchase plus the interest earned on the cash proceeds of the securities sold until the settlement date of the forward purchase. The Fund records the incremental difference between the forward purchase and sale of each forward roll as a realized gain or loss. Unless any realized gains exceed the income, capital appreciation, and gain or loss due to mortgage prepayments that would have been realized on the securities sold as part of the mortgage dollar roll, the use of this technique will diminish the investment performance of the Fund compared to what the performance would have been without the use of mortgage dollar rolls. All cash proceeds will be invested in instruments that are permissible investments for the Fund. The Fund identifies cash or liquid securities in an amount equal to the forward purchase price.
For financial reporting and tax purposes, the Fund treats “to be announced” mortgage dollar rolls as two separate transactions, one involving the purchase of a security and a separate transaction involving a sale. These transactions may increase the Fund’s portfolio turnover rate. The Fund does not currently enter into mortgage dollar rolls that are accounted for as financing transactions.
Mortgage dollar rolls involve the risk that the market value of the securities the Fund is obligated to repurchase may decline below the repurchase price, or that the counterparty may default on its obligations.
Interest only and principal only securities
The Fund may invest in Interest Only (IO) or Principal Only (PO) securities. IOs are stripped securities entitled to receive all of the security’s interest, but none of its principal. IOs are particularly sensitive to changes in interest rates and therefore subject to greater fluctuations in price than typical interest bearing debt securities. IOs are also subject to credit risk because the Fund may not receive all or part of the interest payments if the issuer, obligor, guarantor or counterparty defaults on its obligation. Payments received for IOs are included in interest income on the Statement of Operations. Because no principal will be received at the maturity of an IO, adjustments are made to the cost of the security on a monthly basis until maturity. These adjustments are included in interest income on the Statement of Operations. POs are stripped securities entitled to receive the principal from the underlying obligation, but not the interest. POs are particularly sensitive to changes in interest rates and therefore are subject to fluctuations in price. POs are also subject to credit risk because the Fund may not receive all or part of its principal if the issuer, obligor, guarantor or counterparty defaults on its obligation. The Fund may also invest in IO or PO stripped mortgage-backed securities. Payments received for POs are treated as reductions to the cost and par value of the securities.
| 52 | Columbia Total Return Bond Fund | Annual Report 2018 |
Notes to Financial Statements (continued)
April 30, 2018
Offsetting of assets and liabilities
The following table presents the Fund’s gross and net amount of assets and liabilities available for offset under netting arrangements as well as any related collateral received or pledged by the Fund as of April 30, 2018:
| | Barclays ($) | Citi ($) | Credit
Suisse ($) | Goldman
Sachs
International ($) | JPMorgan ($)(a) | JPMorgan ($)(a) | Morgan
Stanley ($)(a) | Morgan
Stanley ($)(a) | Total ($) |
| Assets | | | | | | | | | |
| Centrally cleared credit default swap contracts (b) | - | - | - | - | - | - | - | 20,462 | 20,462 |
| Options purchased puts | - | 6,867,375 | - | - | - | - | - | - | 6,867,375 |
| OTC credit default swap contracts (c) | 78,432 | - | - | 19,855 | 188,066 | - | 39,662 | - | 326,015 |
| Total assets | 78,432 | 6,867,375 | - | 19,855 | 188,066 | - | 39,662 | 20,462 | 7,213,852 |
| Liabilities | | | | | | | | | |
| Centrally cleared credit default swap contracts (b) | - | - | - | - | - | - | - | 6,549 | 6,549 |
| OTC credit default swap contracts (c) | - | - | 1,927,800 | - | - | 570,510 | 1,377,360 | - | 3,875,670 |
| Total liabilities | - | - | 1,927,800 | - | - | 570,510 | 1,377,360 | 6,549 | 3,882,219 |
| Total financial and derivative net assets | 78,432 | 6,867,375 | (1,927,800) | 19,855 | 188,066 | (570,510) | (1,337,698) | 13,913 | 3,331,633 |
| Total collateral received (pledged) (d) | 30,000 | 6,867,375 | (1,927,800) | - | 183,000 | (540,000) | (1,337,698) | - | 3,274,877 |
| Net amount (e) | 48,432 | - | - | 19,855 | 5,066 | (30,510) | - | 13,913 | 56,756 |
| (a) | Exposure can only be netted across transactions governed under the same master agreement with the same legal entity. |
| (b) | Centrally cleared swaps are included within payable/receivable for variation margin on the Statement of Assets and Liabilities. |
| (c) | Over-the-Counter (OTC) swap contracts are presented at market value plus periodic payments receivable (payable), which is comprised of unrealized appreciation, unrealized depreciation, upfront payments and upfront receipts. |
| (d) | In some instances, the actual collateral received and/or pledged may be more than the amount shown due to overcollateralization. |
| (e) | Represents the net amount due from/(to) counterparties in the event of default. |
Security transactions
Security transactions are accounted for on the trade date. Cost is determined and gains (losses) are based upon the specific identification method for both financial statement and federal income tax purposes.
The trade date for senior loans purchased in the primary market is the date on which the loan is allocated. The trade date for senior loans purchased in the secondary market is the date on which the transaction is entered into.
Income recognition
Interest income is recorded on an accrual basis. Market premiums and discounts, including original issue discounts, are amortized and accreted, respectively, over the expected life of the security on all debt securities, unless otherwise noted. The Fund classifies gains and losses realized on prepayments received on mortgage-backed securities as adjustments to interest income.
The Fund may place a debt security on non-accrual status and reduce related interest income when it becomes probable that the interest will not be collected and the amount of uncollectible interest can be reasonably estimated. A defaulted debt security is removed from non-accrual status when the issuer resumes interest payments or when collectibility of interest is reasonably assured.
Corporate actions and dividend income are recorded on the ex-dividend date.
Columbia Total Return Bond Fund | Annual Report 2018
| 53 |
Notes to Financial Statements (continued)
April 30, 2018
The Fund may receive distributions from holdings in equity securities, business development companies (BDCs), exchange-traded funds (ETFs), limited partnerships (LPs), other regulated investment companies (RICs), and real estate investment trusts (REITs), which report information on the tax character of their distributions annually. These distributions are allocated to dividend income, capital gain and return of capital based on actual information reported. Return of capital is recorded as a reduction of the cost basis of securities held. If the Fund no longer owns the applicable securities, return of capital is recorded as a realized gain. With respect to REITs, to the extent actual information has not yet been reported, estimates for return of capital are made by the Fund’s management. Management’s estimates are subsequently adjusted when the actual character of the distributions is disclosed by the REITs, which could result in a proportionate change in return of capital to shareholders.
Awards from class action litigation are recorded as a reduction of cost basis if the Fund still owns the applicable securities on the payment date. If the Fund no longer owns the applicable securities, the proceeds are recorded as realized gains.
The value of additional securities received as an income payment through a payment in kind, if any, is recorded as interest income and increases the cost basis of such securities.
The Fund may receive other income from senior loans, including amendment fees, consent fees and commitment fees. These fees are recorded as income when received by the Fund. These amounts are included in Interest Income in the Statement of Operations.
Expenses
General expenses of the Trust are allocated to the Fund and other funds of the Trust based upon relative net assets or other expense allocation methodologies determined by the nature of the expense. Expenses directly attributable to the Fund are charged to the Fund. Expenses directly attributable to a specific class of shares are charged to that share class.
Determination of class net asset value
All income, expenses (other than class-specific expenses, which are charged to that share class, as shown in the Statement of Operations) and realized and unrealized gains (losses) are allocated to each class of the Fund on a daily basis, based on the relative net assets of each class, for purposes of determining the net asset value of each class.
Federal income tax status
The Fund intends to qualify each year as a regulated investment company under Subchapter M of the Internal Revenue Code, as amended, and will distribute substantially all of its investment company taxable income and net capital gain, if any, for its tax year, and as such will not be subject to federal income taxes. In addition, the Fund intends to distribute in each calendar year substantially all of its ordinary income, capital gain net income and certain other amounts, if any, such that the Fund should not be subject to federal excise tax. Therefore, no federal income or excise tax provision is recorded.
Distributions to shareholders
Distributions from net investment income, if any, are declared daily and paid monthly. Net realized capital gains, if any, are distributed at least annually. Income distributions and capital gain distributions are determined in accordance with federal income tax regulations, which may differ from GAAP.
Guarantees and indemnifications
Under the Trust’s organizational documents and, in some cases, by contract, its officers and trustees are indemnified against certain liabilities arising out of the performance of their duties to the Trust or its funds. In addition, certain of the Fund’s contracts with its service providers contain general indemnification clauses. The Fund’s maximum exposure under these arrangements is unknown since the amount of any future claims that may be made against the Fund cannot be determined, and the Fund has no historical basis for predicting the likelihood of any such claims.
Recent accounting pronouncement
Accounting Standards Update 2017-08 Premium Amortization on Purchased Callable Debt Securities
| 54 | Columbia Total Return Bond Fund | Annual Report 2018 |
Notes to Financial Statements (continued)
April 30, 2018
In March 2017, the Financial Accounting Standards Board issued Accounting Standards Update (ASU) No. 2017-08 Premium Amortization on Purchased Callable Debt Securities. ASU No. 2017-08 updates the accounting standards to shorten the amortization period for certain purchased callable debt securities, held at a premium, to be amortized to the earliest call date. The update applies to securities with explicit, noncontingent call features that are callable at fixed prices and on preset dates. The standard is effective for annual periods beginning after December 15, 2018 and interim periods within those fiscal years. At this time, management is evaluating the implication of this guidance and the impact it will have on the financial statement amounts and footnote disclosures, if any.
Note 3. Fees and other transactions with affiliates
Management services fees
The Fund has entered into a Management Agreement with Columbia Management Investment Advisers, LLC (the Investment Manager), a wholly-owned subsidiary of Ameriprise Financial, Inc. (Ameriprise Financial). Under the Management Agreement, the Investment Manager provides the Fund with investment research and advice, as well as administrative and accounting services. The management services fee is an annual fee that is equal to a percentage of the Fund’s daily net assets that declines from 0.50% to 0.34% as the Fund’s net assets increase. The effective management services fee rate for the year ended April 30, 2018 was 0.48% of the Fund’s average daily net assets.
Compensation of board members
Members of the Board of Trustees who are not officers or employees of the Investment Manager or Ameriprise Financial are compensated for their services to the Fund as disclosed in the Statement of Operations. These members of the Board of Trustees may participate in a Deferred Compensation Plan (the Plan) which may be terminated at any time. Obligations of the Plan will be paid solely out of the Fund’s assets, and all amounts payable under the Plan constitute a general unsecured obligation of the Fund.
Compensation of Chief Compliance Officer
The Board of Trustees has appointed a Chief Compliance Officer to the Fund in accordance with federal securities regulations. As disclosed in the Statement of Operations, a portion of the Chief Compliance Officer’s total compensation is allocated to the Fund, along with other allocations to affiliated funds governed by the Board of Trustees, based on relative net assets.
Transfer agency fees
Under a Transfer and Dividend Disbursing Agent Agreement, Columbia Management Investment Services Corp. (the Transfer Agent), an affiliate of the Investment Manager and a wholly-owned subsidiary of Ameriprise Financial, is responsible for providing transfer agency services to the Fund. The Transfer Agent has contracted with DST Asset Manager Solutions, Inc. (DST) to serve as sub-transfer agent. The Transfer Agent pays the fees of DST for services as sub-transfer agent and DST is not entitled to reimbursement for such fees from the Fund (with the exception of out-of-pocket fees).
The Fund pays the Transfer Agent a monthly transfer agency fee based on the number or the average value of accounts, depending on the type of account. In addition, the Fund pays the Transfer Agent a fee for shareholder services based on the number of accounts or on a percentage of the average aggregate value of the Fund’s shares maintained in omnibus accounts up to the lesser of the amount charged by the financial intermediary or a cap established by the Board of Trustees from time to time.
The Transfer Agent also receives compensation from the Fund for various shareholder services and reimbursements for certain out-of-pocket fees. Effective August 1, 2017, total transfer agency fees for Class K, Institutional 2 Class and Institutional 3 Class shares are subject to an annual limitation of not more than 0.07%, 0.07% and 0.02%, respectively, of the average daily net assets attributable to each share class. Prior to August 1, 2017, these limitations were 0.075% for Class K and Institutional 2 Class shares and 0.025% for Institutional 3 Class shares.
Columbia Total Return Bond Fund | Annual Report 2018
| 55 |
Notes to Financial Statements (continued)
April 30, 2018
For the year ended April 30, 2018, the Fund’s effective transfer agency fee rates as a percentage of average daily net assets of each class were as follows:
| | Effective rate (%) |
| Class A | 0.15 |
| Advisor Class | 0.15 |
| Class B | 0.04 (a) |
| Class C | 0.15 |
| Institutional Class | 0.15 |
| Institutional 2 Class | 0.07 |
| Institutional 3 Class | 0.01 |
| Class K | 0.05 (a) |
| Class R | 0.15 |
| Class T | 0.15 |
The Fund and certain other associated investment companies have severally, but not jointly, guaranteed the performance and observance of all the terms and conditions of a lease entered into by Seligman Data Corp. (SDC), the former transfer agent, including the payment of rent by SDC (the Guaranty). SDC was the legacy Seligman funds’ former transfer agent.
The lease and the Guaranty expire in January 2019. At April 30, 2018, the Fund’s total potential future obligation over the life of the Guaranty is $2,582. The liability remaining at April 30, 2018 for non-recurring charges associated with the lease amounted to $2,830 and is recorded as a part of the payable for other expenses in the Statement of Assets and Liabilities.
An annual minimum account balance fee of $20 may apply to certain accounts with a value below the applicable share class’s initial minimum investment requirements to reduce the impact of small accounts on transfer agency fees. These minimum account balance fees are remitted to the Fund and recorded as part of expense reductions in the Statement of Operations. For the year ended April 30, 2018, these minimum account balance fees reduced total expenses of the Fund by $2,219.
Plan administration fees
Under a Plan Administration Services Agreement with the Transfer Agent, the Fund pays an annual fee at a rate of 0.25% of the Fund’s average daily net assets attributable to Class K shares for the provision of various administrative, recordkeeping, communication and educational services. As a result of all Class K shares of the Fund being redeemed or exchanged for Advisor Class shares, March 9, 2018 was the last day the Fund paid a plan administration fee for Class K shares.
Distribution and service fees
The Fund has entered into an agreement with Columbia Management Investment Distributors, Inc. (the Distributor), an affiliate of the Investment Manager and a wholly-owned subsidiary of Ameriprise Financial, for distribution and shareholder services. The Board of Trustees has approved, and the Fund has adopted, distribution and shareholder service plans (the Plans) applicable to certain share classes, which set the distribution and service fees for the Fund. These fees are calculated daily and are intended to compensate the Distributor and/or eligible selling and/or servicing agents for selling shares of the Fund and providing services to investors.
Under the Plans, the Fund pays a monthly service fee to the Distributor at the maximum annual rate of 0.25% of the average daily net assets attributable to Class A, Class B, Class C and Class T shares of the Fund. Also under the Plans, the Fund pays a monthly distribution fee to the Distributor at the maximum annual rates of 0.10%, 0.75%, 0.75%, 0.50% and 0.25% of the average daily net assets attributable to Class A, Class B, Class C, Class R and Class T shares of the Fund, respectively. As a result of all Class B shares of the Fund being redeemed or converted to Class A shares, August 4, 2017 was the last day the Fund paid a service fee or distribution fee for Class B shares.
| 56 | Columbia Total Return Bond Fund | Annual Report 2018 |
Notes to Financial Statements (continued)
April 30, 2018
Although the Fund may pay distribution and service fees up to a maximum annual rate of 0.35% of the Fund’s average daily net assets attributable to Class A shares (comprised of up to 0.10% for distribution services and up to 0.25% for shareholder liaison services), the Fund currently limits such fees to an aggregate fee of not more than 0.25% of the Fund’s average daily net assets attributable to Class A shares.
Although the Fund may pay a distribution fee up to 0.25% of the Fund’s average daily net assets attributable to Class T shares and a service fee of up to 0.25% of the Fund’s average daily net assets attributable to Class T shares, the aggregate fee shall not exceed 0.25% of the Fund’s average daily net assets attributable to Class T shares.
Sales charges (unaudited)
Sales charges, including front-end charges and CDSCs, received by the Distributor for distributing Fund shares for the year ended April 30, 2018, if any, are listed below:
| | Amount ($) |
| Class A | 211,833 |
| Class B | 85 |
| Class C | 2,016 |
Expenses waived/reimbursed by the Investment Manager and its affiliates
The Investment Manager and certain of its affiliates have contractually agreed to waive fees and/or reimburse expenses (excluding certain fees and expenses described below) for the period(s) disclosed below, unless sooner terminated at the sole discretion of the Board of Trustees, so that the Fund’s net operating expenses, after giving effect to fees waived/expenses reimbursed and any balance credits and/or overdraft charges from the Fund’s custodian, do not exceed the following annual rate(s) as a percentage of the class’ average daily net assets:
| | September 1, 2017
through
August 31, 2018 | Prior to
September 1, 2017 |
| Class A | 0.86% | 0.86% |
| Advisor Class | 0.61 | 0.61 |
| Class C | 1.61 | 1.61 |
| Institutional Class | 0.61 | 0.61 |
| Institutional 2 Class | 0.55 | 0.56 |
| Institutional 3 Class | 0.50 | 0.51 |
| Class R | 1.11 | 1.11 |
| Class T | 0.86 | 0.86 |
Under the agreement governing these fee waivers and/or expense reimbursement arrangements, the following fees and expenses are excluded from the waiver/reimbursement commitment, and therefore will be paid by the Fund, if applicable: taxes (including foreign transaction taxes), expenses associated with investments in affiliated and non-affiliated pooled investment vehicles (including mutual funds and exchange-traded funds), transaction costs and brokerage commissions, costs related to any securities lending program, dividend expenses associated with securities sold short, inverse floater program fees and expenses, transaction charges and interest on borrowed money, interest, infrequent and/or unusual expenses and any other expenses the exclusion of which is specifically approved by the Board of Trustees. This agreement may be modified or amended only with approval from the Investment Manager, certain of its affiliates and the Fund. Any fees waived and/or expenses reimbursed under the expense reimbursement arrangements described above are not recoverable by the Investment Manager or its affiliates in future periods.
Note 4. Federal tax information
The timing and character of income and capital gain distributions are determined in accordance with income tax regulations, which may differ from GAAP because of temporary or permanent book to tax differences.
Columbia Total Return Bond Fund | Annual Report 2018
| 57 |
Notes to Financial Statements (continued)
April 30, 2018
At April 30, 2018, these differences were primarily due to differing treatment for deferral/reversal of wash sale losses, derivative investments, tax straddles, post-October capital losses, late-year ordinary losses, capital loss carryforwards, trustees’ deferred compensation, distributions, principal and/or interest from fixed income securities, foreign currency transactions and investments in partnerships. To the extent these differences were permanent, reclassifications were made among the components of the Fund’s net assets in the Statement of Assets and Liabilities. Temporary differences do not require reclassifications.
In the Statement of Assets and Liabilities the following reclassifications were made:
Excess of distributions
over net investment
income ($) | Accumulated
net realized
(loss) ($) | Paid in
capital ($) |
| 1,452,267 | (1,452,267) | — |
Net investment income (loss) and net realized gains (losses), as disclosed in the Statement of Operations, and net assets were not affected by this reclassification.
The tax character of distributions paid during the years indicated was as follows:
| Year Ended April 30, 2018 | Year Ended April 30, 2017 |
Ordinary
income ($) | Long-term
capital gains ($) | Tax return
of capital ($) | Total ($) | Ordinary
income ($) | Long-term
capital gains ($) | Total ($) |
| 58,613,754 | — | 2,712,013 | 61,325,767 | 110,767,058 | 12,961,193 | 123,728,251 |
Short-term capital gain distributions, if any, are considered ordinary income distributions for tax purposes.
At April 30, 2018, the components of distributable earnings on a tax basis were as follows:
Undistributed
ordinary income ($) | Undistributed
long-term
capital gains ($) | Capital loss
carryforwards ($) | Net unrealized
(depreciation) ($) |
| — | — | (2,587,156) | (52,447,814) |
At April 30, 2018, the cost of all investments for federal income tax purposes along with the aggregate gross unrealized appreciation and depreciation based on that cost was:
Federal
tax cost ($) | Gross unrealized
appreciation ($) | Gross unrealized
(depreciation) ($) | Net unrealized
(depreciation) ($) |
| 2,445,249,065 | 17,337,152 | (69,784,966) | (52,447,814) |
Tax cost of investments and unrealized appreciation/(depreciation) may also include timing differences that do not constitute adjustments to tax basis.
The following capital loss carryforwards, determined at April 30, 2018, may be available to reduce taxable income arising from future net realized gains on investments, if any, to the extent permitted by the Internal Revenue Code. Capital loss carryforwards with no expiration are required to be utilized prior to any capital losses which carry an expiration date. As a result of this ordering rule, capital loss carryforwards which carry an expiration date may be more likely to expire unused. In addition, for the year ended April 30, 2018, capital loss carryforwards utilized, expired unused and permanently lost, if any, were as follows:
| 2019 ($) | No expiration
short-term ($) | No expiration
long-term ($) | Total ($) | Utilized ($) | Expired ($) | Permanently
lost ($) |
| — | 2,587,156 | — | 2,587,156 | — | — | — |
| 58 | Columbia Total Return Bond Fund | Annual Report 2018 |
Notes to Financial Statements (continued)
April 30, 2018
Under current tax rules, regulated investment companies can elect to treat certain late-year ordinary losses incurred and post-October capital losses (capital losses realized after October 31) as arising on the first day of the following taxable year. As of April 30, 2018, the Fund will elect to treat the following late-year ordinary losses and post-October capital losses as arising on May 1, 2018.
Late year
ordinary losses ($) | Post-October
capital losses ($) |
| 37,142 | 5,187,615 |
Management of the Fund has concluded that there are no significant uncertain tax positions in the Fund that would require recognition in the financial statements. However, management’s conclusion may be subject to review and adjustment at a later date based on factors including, but not limited to, new tax laws, regulations, and administrative interpretations (including relevant court decisions). Generally, the Fund’s federal tax returns for the prior three fiscal years remain subject to examination by the Internal Revenue Service.
Note 5. Portfolio information
The cost of purchases and proceeds from sales of securities, excluding short-term investments and derivatives, if any, aggregated to $7,761,169,158 and $8,205,609,512, respectively, for the year ended April 30, 2018, of which $5,803,555,341 and $6,367,772,161, respectively, were U.S. government securities. The amount of purchase and sale activity impacts the portfolio turnover rate reported in the Financial Highlights.
Note 6. Affiliated money market fund
The Fund invests in Columbia Short-Term Cash Fund, an affiliated money market fund established for the exclusive use by the Fund and other affiliated funds (the Affiliated MMF). The income earned by the Fund from such investments is included as Dividends - affiliated issuers in the Statement of Operations. As an investing fund, the Fund indirectly bears its proportionate share of the expenses of the Affiliated MMF. The Affiliated MMF prices its shares with a floating net asset value. In addition, the Board of Trustees of the Affiliated MMF may impose a fee on redemptions (sometimes referred to as a liquidity fee) or temporarily suspend redemptions (sometimes referred to as imposing a redemption gate) in the event its liquidity falls below regulatory limits.
Note 7. Line of credit
The Fund has access to a revolving credit facility with a syndicate of banks led by Citibank, N.A., HSBC Bank USA, N.A. and JPMorgan Chase Bank, N.A. whereby the Fund may borrow for the temporary funding of shareholder redemptions or for other temporary or emergency purposes. The credit facility, which is a collective agreement between the Fund and certain other funds managed by the Investment Manager, severally and not jointly, permits collective borrowings up to $1 billion. Interest is charged to each participating fund based on its borrowings at a rate equal to the higher of (i) the overnight federal funds rate plus 1.00% or (ii) the one-month LIBOR rate plus 1.00%. Each borrowing under the credit facility matures no later than 60 days after the date of borrowing. The Fund also pays a commitment fee equal to its pro rata share of the amount of the credit facility at a rate of 0.15% per annum. The commitment fee is included in other expenses in the Statement of Operations.
The Fund had no borrowings during the year ended April 30, 2018.
Note 8. Significant risks
Credit risk
Credit risk is the risk that the value of debt securities in the Fund’s portfolio may decline because the issuer may default and fail to pay interest or repay principal when due. Rating agencies assign credit ratings to debt securities to indicate their credit risk. Lower rated or unrated debt securities held by the Fund may present increased credit risk as compared to higher-rated debt securities.
Columbia Total Return Bond Fund | Annual Report 2018
| 59 |
Notes to Financial Statements (continued)
April 30, 2018
Derivatives risk
Losses involving derivative instruments may be substantial, because a relatively small price movement in the underlying security(ies), commodity, currency or index or other instrument or asset may result in a substantial loss for the Fund. In addition to the potential for increased losses, the use of derivative instruments may lead to increased volatility within the Fund. Derivatives will typically increase the Fund’s exposure to principal risks to which it is otherwise exposed, and may expose the Fund to additional risks, including correlation risk, counterparty risk, hedging risk, leverage risk and liquidity risk.
High-yield investments risk
Securities and other debt instruments held by the Fund that are rated below investment grade (commonly called "high-yield" or "junk" bonds) and unrated debt instruments of comparable quality expose the Fund to a greater risk of loss of principal and income than a fund that invests solely or primarily in investment grade securities. In addition, these investments have greater price fluctuations, are less liquid and are more likely to experience a default than higher-rated debt instruments. High-yield debt instruments are considered to be predominantly speculative with respect to the issuer’s capacity to pay interest and repay principal.
Interest rate risk
Interest rate risk is the risk of losses attributable to changes in interest rates. In general, if prevailing interest rates rise, the values of debt securities tend to fall, and if interest rates fall, the values of debt securities tend to rise. Actions by governments and central banking authorities can result in increases in interest rates. Increasing interest rates may negatively affect the value of debt securities held by the Fund, resulting in a negative impact on the Fund’s performance and net asset value per share. In general, the longer the maturity or duration of a debt security, the greater its sensitivity to changes in interest rates.
Liquidity risk
Liquidity risk is the risk associated with a lack of marketability of investments which may make it difficult to sell the investment at a desirable time or price. Changing regulatory, market or other conditions or environments (for example, the interest rate or credit environments) may adversely affect the liquidity of the Fund’s investments. The Fund may have to accept a lower selling price for the holding, sell other investments, or forego another, more appealing investment opportunity. Generally, the less liquid the market at the time the Fund sells a portfolio investment, the greater the risk of loss or decline of value to the Fund. A less liquid market can lead to an increase in Fund redemptions, which may negatively impact Fund performance and net asset value per share, including, for example, if the Fund is forced to sell securities in a down market.
Mortgage- and other asset-backed securities risk
The value of any mortgage-backed and other asset-backed securities held by the Fund may be affected by, among other things, changes or perceived changes in: interest rates; factors concerning the interests in and structure of the issuer or the originator of the mortgages or other assets; the creditworthiness of the entities that provide any supporting letters of credit, surety bonds or other credit enhancements; or the market’s assessment of the quality of underlying assets. Payment of principal and interest on some mortgage-backed securities (but not the market value of the securities themselves) may be guaranteed by the full faith and credit of a particular U.S. Government agency, authority, enterprise or instrumentality, and some, but not all, are also insured or guaranteed by the U.S. Government. Mortgage-backed securities issued by non-governmental issuers (such as commercial banks, savings and loan institutions, private mortgage insurance companies, mortgage bankers and other secondary market issuers) may entail greater risk than obligations guaranteed by the U.S. Government. Mortgage- and other asset-backed securities are subject to prepayment risk, which is the possibility that the underlying mortgage or other asset may be refinanced or prepaid prior to maturity during periods of declining or low interest rates, causing the Fund to have to reinvest the money received in securities that have lower yields. Rising or high interest rates tend to extend the duration of mortgage- and other asset-backed securities, making their prices more volatile and more sensitive to changes in interest rates.
| 60 | Columbia Total Return Bond Fund | Annual Report 2018 |
Notes to Financial Statements (continued)
April 30, 2018
Shareholder concentration risk
At April 30, 2018, one unaffiliated shareholder of record owned 17.3% of the outstanding shares of the Fund in one or more accounts. The Fund has no knowledge about whether any portion of those shares was owned beneficially. Affiliated shareholders of record owned 59.1% of the outstanding shares of the Fund in one or more accounts. Subscription and redemption activity by concentrated accounts may have a significant effect on the operations of the Fund. In the case of a large redemption, the Fund may be forced to sell investments at inopportune times, including its liquid positions, which may result in Fund losses and the Fund holding a higher percentage of less liquid positions. Large redemptions could result in decreased economies of scale and increased operating expenses for non-redeeming Fund shareholders.
Note 9. Subsequent events
Management has evaluated the events and transactions that have occurred through the date the financial statements were issued and noted no items requiring adjustment of the financial statements or additional disclosure.
Note 10. Information regarding pending and settled legal proceedings
Ameriprise Financial and certain of its affiliates have historically been involved in a number of legal, arbitration and regulatory proceedings, including routine litigation, class actions, and governmental actions, concerning matters arising in connection with the conduct of their business activities. Ameriprise Financial believes that the Fund is not currently the subject of, and that neither Ameriprise Financial nor any of its affiliates are the subject of, any pending legal, arbitration or regulatory proceedings that are likely to have a material adverse effect on the Fund or the ability of Ameriprise Financial or its affiliates to perform under their contracts with the Fund. Ameriprise Financial is required to make quarterly (10-Q), annual (10-K) and, as necessary, 8-K filings with the Securities and Exchange Commission (SEC) on legal and regulatory matters that relate to Ameriprise Financial and its affiliates. Copies of these filings may be obtained by accessing the SEC website at www.sec.gov.
There can be no assurance that these matters, or the adverse publicity associated with them, will not result in increased Fund redemptions, reduced sale of Fund shares or other adverse consequences to the Fund. Further, although we believe proceedings are not likely to have a material adverse effect on the Fund or the ability of Ameriprise Financial or its affiliates to perform under their contracts with the Fund, these proceedings are subject to uncertainties and, as such, we are unable to estimate the possible loss or range of loss that may result. An adverse outcome in one or more of these proceedings could result in adverse judgments, settlements, fines, penalties or other relief that could have a material adverse effect on the consolidated financial condition or results of operations of Ameriprise Financial.
Columbia Total Return Bond Fund | Annual Report 2018
| 61 |
Report of Independent Registered Public Accounting Firm
To the Board of Trustees of Columbia Funds Series Trust I and Shareholders of Columbia Total Return Bond Fund
Opinion on the Financial Statements
We have audited the accompanying statement of assets and liabilities, including the portfolio of investments, of Columbia Total Return Bond Fund (one of the funds constituting Columbia Funds Series Trust I, referred to hereafter as the "Fund") as of April 30, 2018, the related statement of operations for the year ended April 30, 2018, the statement of changes in net assets for each of the two years in the period ended April 30, 2018, including the related notes, and the financial highlights for each of the five years in the period ended April 30, 2018 (collectively referred to as the “financial statements”). In our opinion, the financial statements present fairly, in all material respects, the financial position of the Fund as of April 30, 2018, the results of its operations for the year then ended, the changes in its net assets for each of the two years in the period ended April 30, 2018 and the financial highlights for each of the five years in the period ended April 30, 2018 in conformity with accounting principles generally accepted in the United States of America.
Basis for Opinion
These financial statements are the responsibility of the Fund’s management. Our responsibility is to express an opinion on the Fund’s financial statements based on our audits. We are a public accounting firm registered with the Public Company Accounting Oversight Board (United States) (“PCAOB”) and are required to be independent with respect to the Fund in accordance with the U.S. federal securities laws and the applicable rules and regulations of the Securities and Exchange Commission and the PCAOB.
We conducted our audits of these financial statements in accordance with the standards of the PCAOB. Those standards require that we plan and perform the audit to obtain reasonable assurance about whether the financial statements are free of material misstatement, whether due to error or fraud.
Our audits included performing procedures to assess the risks of material misstatement of the financial statements, whether due to error or fraud, and performing procedures that respond to those risks. Such procedures included examining, on a test basis, evidence regarding the amounts and disclosures in the financial statements. Our audits also included evaluating the accounting principles used and significant estimates made by management, as well as evaluating the overall presentation of the financial statements. Our procedures included confirmation of securities owned as of April 30, 2018 by correspondence with the custodian, transfer agent, brokers and agent banks; when replies were not received from brokers, we performed other auditing procedures. We believe that our audits provide a reasonable basis for our opinion.
/s/PricewaterhouseCoopers LLP
Minneapolis, Minnesota
June 21, 2018
We have served as auditors of one or more investment companies within the Columbia Funds Complex since 1977.
| 62 | Columbia Total Return Bond Fund | Annual Report 2018 |
Shareholders elect the Board that oversees the Fund’s operations. The Board appoints officers who are responsible for day-to-day business decisions based on policies set by the Board. The following table provides basic biographical information about the Fund’s Trustees, including their principal occupations during the past five years, although specific titles for individuals may have varied over the period. The year set forth beneath Length of Service in the table below is the year in which the Trustee was first appointed or elected as Trustee to any Fund currently in the Columbia Funds Complex or a predecessor thereof. Under current Board policy, members serve terms of indefinite duration.
Independent trustees
| Name, address, year of birth | Position held with the Trust and length of service | Principal occupation(s) during the past five years and other relevant professional experience | Number of Funds in the Columbia Fund Complex overseen | Other directorships held by Trustee during the past five years |
Janet Langford Carrig
c/o Columbia Management
Investment Advisers, LLC
225 Franklin Street
Mail Drop BX32 05228
Boston, MA 02110
1957 | Trustee
1996 | Senior Vice President, General Counsel and Corporate Secretary, ConocoPhillips (independent energy company) since September 2007 | 71 | None |
Douglas A. Hacker
c/o Columbia Management
Investment Advisers, LLC
225 Franklin Street
Mail Drop BX32 05228
Boston, MA 02110
1955 | Trustee and Chairman of the Board
1996 | Independent business executive since May 2006; Executive Vice President — Strategy of United Airlines from December 2002 to May 2006; President of UAL Loyalty Services (airline marketing company) from September 2001 to December 2002; Executive Vice President and Chief Financial Officer of United Airlines from July 1999 to September 2001 | 71 | Spartan Nash Company, (food distributor); Nash Finch Company (food distributor) from 2005 to 2013; Aircastle Limited (aircraft leasing); SeaCube Container Leasing Ltd. (container leasing) from 2010 to 2013; and Travelport Worldwide Limited (travel information technology) |
Nancy T. Lukitsh
c/o Columbia Management
Investment Advisers, LLC
225 Franklin Street
Mail Drop BX32 05228
Boston, MA 02110
1956 | Trustee
2011 | Senior Vice President, Partner and Director of Marketing, Wellington Management Company, LLP (investment adviser) from 1997 to 2010; Chair, Wellington Management Portfolios (commingled non-U.S. investment pools) from 2007 to 2010; Director, Wellington Trust Company, NA and other Wellington affiliates from 1997 to 2010 | 71 | None |
David M. Moffett
c/o Columbia Management
Investment Advisers, LLC
225 Franklin Street
Mail Drop BX32 05228
Boston, MA 02110
1952 | Trustee
2011 | Retired. Consultant to Bridgewater and Associates | 71 | Director, CSX Corporation; Genworth Financial, Inc. (financial and insurance products and services); PayPal Holdings Inc. (payment and data processing services); Trustee, University of Oklahoma Foundation; former Director, eBay Inc. (online trading community), 2007-2015; and former Director, CIT Bank, CIT Group Inc. (commercial and consumer finance), 2010-2016 |
John J. Neuhauser
c/o Columbia Management
Investment Advisers, LLC
225 Franklin Street
Mail Drop BX32 05228
Boston, MA 02110
1943 | Trustee
1984 | President, Saint Michael’s College since August 2007; Director or Trustee of several non-profit organizations, including University of Vermont Medical Center; Academic Vice President and Dean of Faculties, Boston College from August 1999 to October 2005; University Professor, Boston College from November 2005 to August 2007 | 71 | Liberty All-Star Equity Fund and Liberty All- Star Growth Fund (closed-end funds) |
Columbia Total Return Bond Fund | Annual Report 2018
| 63 |
TRUSTEES AND OFFICERS (continued)
Independent trustees (continued)
| Name, address, year of birth | Position held with the Trust and length of service | Principal occupation(s) during the past five years and other relevant professional experience | Number of Funds in the Columbia Fund Complex overseen | Other directorships held by Trustee during the past five years |
Patrick J. Simpson
c/o Columbia Management
Investment Advisers, LLC
225 Franklin Street
Mail Drop BX32 05228
Boston, MA 02110
1944 | Trustee
2000 | Of Counsel, Perkins Coie LLP (law firm) since 2015; Partner, Perkins Coie LLP from 1988 to 2014 | 71 | None |
Anne-Lee Verville
c/o Columbia Management
Investment Advisers, LLC
225 Franklin Street
Mail Drop BX32 05228
Boston, MA 02110
1945 | Trustee
1998 | Retired. General Manager, Global Education Industry from 1994 to 1997, President – Application Systems Division from 1991 to 1994, Chief Financial Officer – US Marketing & Services from 1988 to 1991, and Chief Information Officer from 1987 to 1988, IBM Corporation (computer and technology) | 71 | Enesco Group, Inc. (producer of giftware and home and garden decor products) from 2001 to 2006 |
Consultants to the Independent Trustees*
| Name, address, year of birth | Position held with the Trust and length of service | Principal occupation(s) during the past five years and other relevant professional experience | Number of Funds in the Columbia Funds complex overseen | Other directorships held by Trustee during the past five years |
J. Kevin Connaughton
c/o Columbia
Management Investment
Advisers, LLC,
225 Franklin Street
Mail Drop BX32 05228,
Boston, MA 02110
1964 | Independent Trustee Consultant
2016 | Independent Trustee Consultant, Columbia Funds since March 2016; Adjunct Professor of Finance, Bentley University since November 2017; Managing Director and General Manager of Mutual Fund Products, Columbia Management Investment Advisers, LLC from May 2010 to February 2015; President, Columbia Funds from 2009 to 2015; and senior officer of Columbia Funds and affiliated funds from 2003 to 2015 | 71 | Director, The Autism Project since March 2015; former Trustee, New Century Portfolios, March 2015-December 2017; formerly on Board of Governors, Gateway Healthcare, January 2016 – December 2017 |
Natalie A. Trunow
c/o Columbia
Management Investment
Advisers, LLC,
225 Franklin Street
Mail Drop BX32 05228,
Boston, MA 02110
1967 | Independent Trustee Consultant
2016 | Independent Trustee Consultant, Columbia Funds since September 2016; Chief Executive Officer, Millennial Portfolio Solutions LLC (asset management and consulting services) since January 2016; Director of Investments, Casey Family Programs from April 2016 to September 2016; Senior Vice President and Chief Investment Officer, Calvert Investments from August 2008 to January 2016; Section Head and Portfolio Manager, General Motors Asset Management from June 1997 to August 2008 | 71 | Director, Health Services for Children with Special Needs, Inc.; Director, Guidewell Financial Solutions |
| * | J. Kevin Connaughton was appointed consultant to the Independent Trustees effective March 1, 2016. Natalie A. Trunow was appointed consultant to the Independent Trustees effective September 1, 2016. Shareholders of the Funds are expected to be asked to elect each of Mr. Connaughton and Ms. Trunow as a Trustee at a future shareholder meeting. |
| 64 | Columbia Total Return Bond Fund | Annual Report 2018 |
TRUSTEES AND OFFICERS (continued)
Interested trustee affiliated with Investment Manager*
| Name, address, year of birth | Position held with the Trust and length of service | Principal occupation(s) during the past five years and other relevant professional experience | Number of Funds in the Columbia Funds Complex overseen | Other directorships held by Trustee during the past five years |
William F. Truscott
c/o Columbia Management
Investment Advisers, LLC
225 Franklin Street
Boston, MA 02110
1960 | Trustee
2012 | Chairman of the Board and President, Columbia Management Investment Advisers, LLC since May 2010 and February 2012, respectively; Chief Executive Officer, Global Asset Management, Ameriprise Financial, Inc. since September 2012 (previously Chief Executive Officer, U.S. Asset Management & President, Annuities, May 2010-September 2012); Director and Chief Executive Officer, Columbia Management Investment Distributors, Inc. since May 2010 and February 2012, respectively; Chairman of the Board and Chief Executive Officer, RiverSource Distributors, Inc. since 2006; Director, Threadneedle Asset Management Holdings, SARL since 2014; President and Chief Executive Officer, Ameriprise Certificate Company, 2006-August 2012 | 196 | Chairman of the Board, Columbia Management Investment Advisers, LLC since May 2010; Director, Columbia Management Investment Distributors, Inc. since May 2010; former Director, Ameriprise Certificate Company, 2006 - January 2013 |
| * | Interested person (as defined under the 1940 Act) by reason of being an officer, director, security holder and/or employee of the Investment Manager or Ameriprise Financial. |
The Statement of Additional Information has additional information about the Fund’s Board members and is available, without charge, upon request by calling 800.345.6611, visiting columbiathreadneedleus.com/investor/ or contacting your financial intermediary.
Columbia Total Return Bond Fund | Annual Report 2018
| 65 |
TRUSTEES AND OFFICERS (continued)
The Board has appointed officers who are responsible for day-to-day business decisions based on policies it has established. The officers serve at the pleasure of the Board. The following table provides basic information about the Officers of the Fund, including principal occupations during the past five years, although their specific titles may have varied over the period. In addition to Mr. Truscott, who is Senior Vice President, the Fund’s other officers are:
Fund officers
Name,
address and
year of birth | Position and year
first appointed to
position for any Fund
in the Columbia
Funds complex or a
predecessor thereof | Principal occupation(s) during past five years |
Christopher O. Petersen
5228 Ameriprise
Financial Center
Minneapolis, MN 55474
Born 1970 | President and Principal Executive Officer (2015) | Vice President and Lead Chief Counsel, Ameriprise Financial, Inc. since January 2015 (previously, Vice President and Chief Counsel, January 2010 - December 2014; officer of Columbia Funds and affiliated funds since 2007. |
Michael G. Clarke
225 Franklin Street
Boston, MA 02110
Born 1969 | Treasurer (2011), Chief Financial Officer (2009) and Chief Accounting Officer (2015) | Vice President — Mutual Fund Administration, Columbia Management Investment Advisers, LLC, since May 2010; senior officer of Columbia Funds and affiliated funds since 2002. |
Paul B. Goucher
100 Park Avenue
New York, NY 10017
Born 1968 | Senior Vice President (2011) and Assistant Secretary (2008) | Senior Vice President and Assistant General Counsel, Ameriprise Financial, Inc. since January 2017 (previously Vice President and Lead Chief Counsel, November 2008 - January 2017 and January 2013 - January 2017, respectively; and Chief Counsel, January 2010 - January 2013); Vice President, Chief Legal Officer and Assistant Secretary, Columbia Management Investment Advisers, LLC since May 2010. |
Thomas P. McGuire
225 Franklin Street
Boston, MA 02110
Born 1972 | Senior Vice President and Chief Compliance Officer (2012) | Vice President — Asset Management Compliance, Ameriprise Financial, Inc., since May 2010; Chief Compliance Officer, Ameriprise Certificate Company since September 2010. |
Colin Moore
225 Franklin Street
Boston, MA 02110
Born 1958 | Senior Vice President (2010) | Executive Vice President and Global Chief Investment Officer, Ameriprise Financial, Inc., since July 2013; Executive Vice President and Global Chief Investment Officer, Columbia Management Investment Advisers, LLC since July 2013 (previously Director and Global Chief Investment Officer, 2010 - 2013). |
Ryan C. Larrenaga
225 Franklin Street
Boston, MA 02110
Born 1970 | Senior Vice President (2017), Chief Legal Officer (2017) and Secretary (2015) | Vice President and Group Counsel, Ameriprise Financial, Inc. since August 2011; officer of Columbia Funds and affiliated funds since 2005. |
Michael E. DeFao
225 Franklin Street
Boston, MA 02110
Born 1968 | Vice President (2011) and Assistant Secretary (2010) | Vice President and Chief Counsel, Ameriprise Financial, Inc. since May 2010. |
Amy Johnson
5228 Ameriprise
Financial Center
Minneapolis, MN 55474
Born 1965 | Vice President (2006) | Managing Director and Global Head of Operations, Columbia Management Investment Advisers, LLC since April 2016 (previously Managing Director and Chief Operating Officer, 2010 - 2016). |
Lyn Kephart-Strong
5228 Ameriprise
Financial Center
Minneapolis, MN 55474
Born 1960 | Vice President (2015) | President, Columbia Management Investment Services Corp. since October 2014; Vice President & Resolution Officer, Ameriprise Trust Company since August 2009. |
| 66 | Columbia Total Return Bond Fund | Annual Report 2018 |
The Fund mails one shareholder report to each shareholder address. If you would like more than one report, please call shareholder services at 800.345.6611 and additional reports will be sent to you.
Proxy voting policies and procedures
The policy of the Board of Trustees is to vote the proxies of the companies in which the Fund holds investments consistent with the procedures as stated in the Statement of Additional Information (SAI). You may obtain a copy of the SAI without charge by calling 800.345.6611; contacting your financial intermediary; visiting columbiathreadneedleus.com/investor/; or searching the website of the Securities and Exchange Commission (SEC) at sec.gov. Information regarding how the Fund voted proxies relating to portfolio securities is filed with the SEC by August 31st for the most recent 12-month period ending June 30th of that year, and is available without charge by visiting columbiathreadneedleus.com/investor/, or searching the website of the SEC at sec.gov.
Quarterly schedule of investments
The Fund files a complete schedule of portfolio holdings with the SEC for the first and third quarters of each fiscal year on Form N-Q. The Fund’s Form N-Q is available on the SEC’s website at sec.gov and may be reviewed and copied at the SEC’s Public Reference Room in Washington, D.C. Information on the operation of the Public Reference Room may be obtained by calling 800.SEC.0330. The Fund’s complete schedule of portfolio holdings, as filed on Form N-Q, can also be obtained without charge, upon request, by calling 800.345.6611.
Additional Fund information
For more information about the Fund, please visit columbiathreadneedleus.com/investor/ or call 800.345.6611. Customer Service Representatives are available to answer your questions Monday through Friday from 8 a.m. to 7 p.m. Eastern time.
Fund investment manager
Columbia Management Investment Advisers, LLC
225 Franklin Street
Boston, MA 02110
Fund distributor
Columbia Management Investment Distributors, Inc.
225 Franklin Street
Boston, MA 02110
Fund transfer agent
Columbia Management Investment Services Corp.
P.O. Box 8081
Boston, MA 02266-8081
Columbia Total Return Bond Fund | Annual Report 2018
| 67 |
[THIS PAGE INTENTIONALLY LEFT BLANK]
[THIS PAGE INTENTIONALLY LEFT BLANK]
Columbia Total Return Bond Fund
P.O. Box 8081
Boston, MA 02266-8081
Please read and consider the investment objectives, risks, charges and expenses for any fund carefully before investing. For a prospectus and summary prospectus, which contains this and other important information about the Fund, go to
columbiathreadneedleus.com/investor/. The Fund is distributed by Columbia Management Investment Distributors, Inc., member FINRA, and managed by Columbia Management Investment Advisers, LLC.
Columbia Threadneedle Investments (Columbia Threadneedle) is the global brand name of the Columbia and Threadneedle group of companies. All rights reserved. Columbia Management Investment Distributors, Inc., 225 Franklin Street, Boston, MA 02110-2804
© 2018 Columbia Management Investment Advisers, LLC.
columbiathreadneedleus .com/investor/

Annual Report
April 30, 2018
Columbia Multi-Asset Income Fund
Not FDIC Insured • No bank guarantee • May lose value
Dear Shareholders,
The year 2017 was an extraordinary year in the financial markets. The S&P 500 Index didn’t experience a single down month and returned over 20%. Continuing this trend, January 2018 marked the fastest start for the index ever. Low volatility, which had been a feature of the U.S. equity market for several years, along with the surge in the S&P 500 Index, drove investor sentiment to very high levels. This arguably set the stage for an overdue correction, which we witnessed in February 2018.
A return to volatility
There have been few periods of market upheaval such as were experienced in the first part of 2018. While investors were taken by surprise by the sudden and pronounced market swings, the return to some level of volatility actually marked a resumption of relatively normal market conditions. Having said that, it’s important to distinguish between a good technical correction where excess enthusiasm in the marketplace is being let out, versus a real change in the underlying fundamentals – things like an underperforming economy or weaker corporate earnings. Our view is that the recent market volatility falls into the former category, and the fundamentals remain strong. We’re continuing to see improvements in global economic activity, and we’re seeing corporate earnings expectations continue to rise – and not just because of tax reform.
Consistency is more important than ever
It’s important to keep in mind that when it comes to long-term investing, it’s the destination, not the journey that matters most. If you have a financial goal that you’ve worked out with your financial advisor, and you have a good asset allocation plan to reach it, it’s a question of sticking with your plan rather than become focused on near-term volatility. Bouts of volatility are normal. After all, it’s hard to cross the ocean without hitting an occasional rough patch. You need to focus on the destination.
One final thought. In weathering volatility, it’s the consistency of the return that is essential. Investors who chase higher returns are usually the first to sell when an investment goes through a bad patch, and they therefore don’t tend to benefit from the recovery. More disciplined investors who perhaps panic less or not at all during periods of volatility, tend to have improved long-term results and are more likely to reach their financial goals. Nothing is more important to us than making sure those who have entrusted us to protect and grow their assets are able to do what matters most to them.
Your success is our priority. Talk to your financial advisor about how working with Columbia Threadneedle Investments may help you position your portfolio for consistent, sustainable outcomes, no matter the market conditions.
Sincerely,
Christopher O. Petersen
President, Columbia Funds
The S&P 500 Index, an unmanaged index, measures the performance of 500 widely held, large-capitalization U.S. stocks and is frequently used as a general measure of market performance. Past performance is no guarantee of future results.
Columbia Funds are distributed by Columbia Management Investment Distributors, Inc., member FINRA, and managed by Columbia Management Investment Advisers, LLC.
© 2018 Columbia Management Investment Advisers, LLC. All rights reserved.
Columbia Multi-Asset Income Fund | Annual Report 2018
Columbia Multi-Asset Income Fund | Annual Report 2018
Investment objective
Columbia Multi-Asset Income Fund (the Fund) seeks to provide shareholders with a high level of current income, with a secondary objective of total return.
Portfolio management
Anwiti Bahuguna, Ph.D.
Lead Portfolio Manager
Managed Fund since 2015
Dan Boncarosky, CFA
Portfolio Manager
Managed Fund since 2015
| Average annual total returns (%) (for the period ended April 30, 2018) |
| | | Inception | 1 Year | Life |
| Class A | Excluding sales charges | 03/27/15 | 2.27 | 3.56 |
| | Including sales charges | | -2.61 | 1.94 |
| Advisor Class | 03/27/15 | 2.53 | 3.83 |
| Class C | Excluding sales charges | 03/27/15 | 1.51 | 2.78 |
| | Including sales charges | | 0.54 | 2.78 |
| Institutional Class | 03/27/15 | 2.53 | 3.86 |
| Institutional 2 Class | 03/27/15 | 2.68 | 3.90 |
| Institutional 3 Class* | 03/01/17 | 2.73 | 3.69 |
| Class T | Excluding sales charges | 03/27/15 | 2.38 | 3.60 |
| | Including sales charges | | -0.17 | 2.74 |
| Blended Benchmark | | 5.02 | 4.89 |
| Bloomberg Barclays U.S. Aggregate Bond Index | | -0.32 | 0.96 |
Returns for Class A shares are shown with and without the maximum initial sales charge of 4.75%. Returns for Class C shares are shown with and without the 1.00% contingent deferred sales charge for the first year only. Returns for Class T shares are shown with and without the maximum initial sales charge of 2.50% per transaction. The Fund’s other classes are not subject to sales charges and have limited eligibility. Effective November 1, 2017, Class R4, Class R5, Class Y and Class Z shares were renamed Advisor Class, Institutional 2 Class, Institutional 3 Class and Institutional Class shares, respectively. Please see the Fund’s prospectus for details. Performance for different share classes will vary based on differences in sales charges and fees associated with each share class. All results shown assume reinvestment of distributions during the period. Returns do not reflect the deduction of taxes that a shareholder may pay on Fund distributions or on the redemption of Fund shares. Performance results reflect the effect of any fee waivers or reimbursements of Fund expenses by Columbia Management Investment Advisers, LLC and/or any of its affiliates. Absent these fee waivers or expense reimbursement arrangements, performance results would have been lower.
The performance information shown represents past performance and is not a guarantee of future results. The investment return and principal value of your investment will fluctuate so that your shares, when redeemed, may be worth more or less than their original cost. Current performance may be lower or higher than the performance information shown. You may obtain performance information current to the most recent month-end by contacting your financial intermediary, visiting columbiathreadneedleus.com/investor/ or calling 800.345.6611.
| * | The returns shown for periods prior to the share class inception date (including returns for the Life of the Fund, if shown, which are since Fund inception) include the returns of the Fund’s oldest share class. Since the Fund launched more than one share class at its inception, Class A shares were used. These returns are adjusted to reflect any higher class-related operating expenses of the newer share classes, as applicable. Please visit columbiathreadneedleus.com/investor/investment-products/mutual-funds/appended-performance for more information. |
The Blended Benchmark is a weighted custom composite consisting of 60% Bloomberg Barclays U.S. Aggregate Bond Index and 40% S&P 500 Index. The S&P 500 Index, an unmanaged index, measures the performance of 500 widely held, large capitalization U.S. stocks and its frequently used as a general measure of market performance.
The Bloomberg Barclays U.S. Aggregate Bond Index, is a broad-based benchmark that measures the investment-grade, U.S. dollar denominated, fixed-rate taxable bond market, including Treasuries, government-related and corporate securities, mortgage-backed securities (agency fixed-rate and hybrid adjustable-rate mortgage passthroughs), asset-backed securities, and commercial mortgage-backed securities.
Indices are not available for investment, are not professionally managed and do not reflect sales charges, fees, brokerage commissions, taxes or other expenses of investing. Securities in the Fund may not match those in an index.
| 2 | Columbia Multi-Asset Income Fund | Annual Report 2018 |
Fund at a Glance (continued)
Performance of a hypothetical $10,000 investment (March 27, 2015 — April 30, 2018)
The chart above shows the change in value of a hypothetical $10,000 investment in Class A shares of Columbia Multi-Asset Income Fund during the stated time period, and does not reflect the deduction of taxes that a shareholder may pay on Fund distributions or on the redemption of Fund shares.
| Top 10 holdings (%) (at April 30, 2018) |
| SPDR Bloomberg Barclays Convertible Securities ETF | 4.8 |
| SPDR Blackstone/GSO Senior Loan ETF | 4.7 |
| iShares US Preferred Stock ETF | 4.0 |
HSBC Bank U.S.A. NA
06/11/2018 14.130% | 3.7 |
| PowerShares S&P 500 High Dividend Low Volatility Portfolio ETF | 3.6 |
Citigroup Global Markets Holdings Inc.
10/05/2018 15.360% | 3.4 |
Deutsche Bank AG
05/04/2018 12.800% | 3.4 |
Morgan Stanley BV
09/07/2018 14.860% | 3.4 |
Credit Suisse AG
08/06/2018 14.860% | 3.4 |
Societe Generale SA
07/12/2018 13.700% | 3.3 |
Percentages indicated are based upon total investments (excluding Money Market Funds).
For further detail about these holdings, please refer to the section entitled “Portfolio of Investments.”
Fund holdings are as of the date given, are subject to change at any time, and are not recommendations to buy or sell any security.
| Portfolio breakdown (%) (at April 30, 2018) |
| Asset-Backed Securities — Non-Agency | 3.4 |
| Commercial Mortgage-Backed Securities - Non-Agency | 1.0 |
| Common Stocks | 9.9 |
| Convertible Preferred Stocks | 0.1 |
| Corporate Bonds & Notes | 21.5 |
| Equity-Linked Notes | 20.0 |
| Exchange-Traded Funds | 18.7 |
| Foreign Government Obligations | 11.9 |
| Limited Partnerships | 0.0 (a) |
| Money Market Funds | 3.6 |
| Residential Mortgage-Backed Securities - Agency | 0.9 |
| Residential Mortgage-Backed Securities - Non-Agency | 6.1 |
| Senior Loans | 0.1 |
| U.S. Treasury Obligations | 2.8 |
| Total | 100.0 |
Percentages indicated are based upon total investments. The Fund’s portfolio composition is subject to change.
Columbia Multi-Asset Income Fund | Annual Report 2018
| 3 |
Manager Discussion of Fund Performance
For the 12-month period that ended April 30, 2018, the Fund’s Class A shares returned 2.27% excluding sales charges. During the same time period, the Fund underperformed its Blended Benchmark, which returned 5.02%, and outperformed the Bloomberg Barclays U.S. Aggregate Bond Index, which returned -0.32%. To compare, the S&P 500 Index returned 13.27% for the same time period. The Fund’s performance is primarily attributable to a combination of asset allocation decisions and underlying positioning across the asset class spectrum.
Fixed income markets significantly lagged equities amid “risk on” sentiment
The 12-month period ended April 30, 2018 saw a market environment with positive absolute returns in many asset classes, though equities generally outperformed fixed income, in some cases rewarding investors with double-digit returns. Within the broad equities market, U.S. equities overall lagged their international equity counterparts. The MSCI EAFE Index (Net), representing developed international equities, posted a return of 14.51%, and emerging markets equities fared even better, with the MSCI Emerging Markets Index (Net) generating a return of 21.71%. Within the U.S., the S&P 500 Index posted positive absolute returns in the first nine consecutive months of the period. However, February and March 2018 were marked by significantly increased volatility and declining returns, before eking out a modestly positive return in April 2018. U.S. dividend-paying equities, as measured by the MSCI USA High Dividend Yield Index, posted a return of 9.27% for the period. Preferred stocks lagged the broad U.S. equity market even more, posting a return of just 1.97%, as represented by the ICE BofAML U.S. Preferred Stock Fixed Rate Index.
Among non-traditional asset classes, convertible securities outperformed, as the ICE BofAML All Convertibles All Qualities Index posted a return of 9.14% for the period. Floating rate loans posted more muted yet still solid absolute returns for the period, with the Credit Suisse Leveraged Loan Index posting 4.69%. Real estate investment trusts (REITs) and master limited partnerships (MLPs) struggled during the period. The FTSE NAREIT Equity REITs Index and the Alerian MLP Index generated returns of -3.26% and -12.48%, respectively.
More traditional fixed income generated mostly flat returns, as measured by the Bloomberg Barclays Aggregate Bond Index. However, within this asset class, investors willing to take on more risk were rewarded, albeit modestly, during the period. The ICE BofAML U.S. Cash Pay High Yield Constrained Index, representing the high-yield corporate bond market, returned 3.19%, and the JPMorgan Emerging Markets Bond Index-Global, representing emerging markets bonds, returned 0.19% for the period. Long maturity investment-grade corporate bonds also posted a return of 2.38%, as measured by the Bloomberg Barclays U.S. Corporate Investment Grade Long Index. Conversely, securitized bonds, including mortgage-backed securities, generated a return of -0.37%, as measured by the Bloomberg Barclays U.S. Securitized Index. U.S. Treasuries similarly posted a decline, with the Bloomberg Barclays U.S. Long Treasury Index returning -0.04% for the annual period.
Underlying positioning dampened relative results
Overall, asset allocation contributed positively to the Fund’s results, but underlying positioning dampened relative performance. Generally, positioning in equity income and alternative income sources detracted from relative results, while positioning in traditional fixed income added value.
More specifically, within the Fund’s equity income allocation, positions in dividend equities, preferred stocks and equity-linked notes detracted from relative results, as these positions were not able to keep pace with the strong absolute returns of the S&P 500 Index during the period. Still, underlying security selection among preferred stocks added value.
The Fund, being diversified across asset classes, had exposure to certain non-traditional asset classes that did not keep pace with the broad U.S. equity market. As the Blended Benchmark is composed of 40% of the S&P 500 Index, such exposures to these lagging alternative income sources detracted from relative results. Among non-traditional income sources, MLPs were the biggest detractors from the Fund’s relative results. While our security selection within the sector beat the returns of the Alerian MLP Index, it was not enough to offset the detracting effect of being allocated to this sector that posted a double-digit negative return during the annual period. Similarly, security selection within the REITs sector proved positive, outpacing the broader FTSE NAREIT Equity REITs Index, but REITs as a sector underperformed both the broad U.S. equity and fixed income asset classes, and thus the Fund’s exposure to REITs detracted. Exposure to convertible securities also detracted from relative results, but more moderately so. On a positive note, the Fund’s allocation to floating rate loans bolstered performance, as the sector posted positive absolute returns during the period.
| 4 | Columbia Multi-Asset Income Fund | Annual Report 2018 |
Manager Discussion of Fund Performance (continued)
Within the Fund’s traditional fixed income allocation, underlying positioning added value as many of the traditional fixed income sectors in which the Fund invests outpaced the Bloomberg Barclays U.S. Aggregate Bond Index for the period. The Fund’s exposure to high-yield corporate bonds was the biggest positive contributor to performance within the asset class. Underlying security selection was particularly strong within the securitized sector.
Various factors drove portfolio changes
Asset class changes within the Fund can be driven by active trading, by tactically adjusting allocations to select asset classes or by market appreciation or depreciation within a given asset class. During the period, the Fund’s positioning shifted as market conditions changed. Through the start of 2018, global economic news pointed toward solid economic growth, rising inflation pressures and, in response, less accommodative monetary policy. As such, the Fund was mostly balanced across asset classes, though we did tilt toward a slightly more aggressive stance. However, as January 2018 progressed, economic indicators began to turn, and, accordingly, we adjusted some of the Fund’s positioning based on the heightened volatility the markets were experiencing.
For the period as a whole, we decreased the Fund’s allocation to traditional fixed income overall. Within traditional fixed income, we decreased the Fund’s allocation "spread" sectors (nongovernment bond sectors), including high-yield corporate bonds, emerging market debt, investment-grade corporate bonds and securitized bonds. We also decreased the Fund’s weighting in U.S. Treasuries, as we found other asset class’ return profiles to be more favorable. We increased the Fund’s allocation to equity income strategies, boosting allocations to dividend-paying equities, preferred securities and equity-linked notes. Among non-traditional income sources, we increased the Fund’s allocation to convertible bonds but made a strategic decision to almost entirely eliminate positions in MLPs, as the sector proved to not be beneficial to the risk-aware income strategy that we employed in the Fund.
Derivative positions in the Fund
During the period, we used equity linked notes to implement our covered call writing strategy. We used credit default swap indices to manage the Fund’s fixed-income exposure. We used U.S. Treasury futures to manage the Fund’s duration positioning. The use of these equity linked notes, credit default swap indices and U.S. Treasury futures detracted from the Fund’s relative performance. We used equity futures for hedging purposes and to manage the Fund’s investment exposures. The use of equity futures added value to the Fund’s relative results during the period.
Market risk may affect a single issuer, sector of the economy, industry or the market as a whole. The Fund’s investment in other funds subjects it to the investment performance (positive or negative), risks and expenses of these underlying funds. Fixed-income securities present issuer default risk. A rise in interest rates may result in a price decline of fixed-income instruments held by the Fund, negatively impacting its performance and NAV. Falling rates may result in the Fund investing in lower yielding debt instruments, lowering the Fund’s income and yield. These risks may be heightened for longer maturity and duration securities. Non-investment-grade (high-yield or junk) securities present greater price volatility and more risk to principal and income than higher rated securities. Prepayment and extension risk exists because the timing of payments on a loan, bond or other investment may accelerate when interest rates fall or decelerate when interest rates rise which may reduce investment opportunities and potential returns. Investing in derivatives is a specialized activity that involves special risks that subject the Fund to significant loss potential, including when used as leverage, and may result in greater fluctuation in fund value. Asset allocation does not assure a profit or protect against loss. International investing involves certain risks and volatility due to potential political, economic or currency instabilities and different financial and accounting standards. Risks are enhanced for emerging market issuers. Market or other (e.g., interest rate) environments may adversely affect the liquidity of fund investments, negatively impacting their price. Generally, the less liquid the market at the time the Fund sells a holding, the greater the risk of loss or decline of value to the Fund. See the Fund’s prospectus for more information on these and other risks.
The views expressed in this report reflect the current views of the respective parties. These views are not guarantees of future performance and involve certain risks, uncertainties and assumptions that are difficult to predict, so actual outcomes and results may differ significantly from the views expressed. These views are subject to change at any time based upon economic, market or other conditions and the respective parties disclaim any responsibility to update such views. These views may not be relied on as investment advice and, because investment decisions for a Columbia fund are based on numerous factors, may not be relied on as an indication of trading intent on behalf of any particular Columbia fund. References to specific securities should not be construed as a recommendation or investment advice.
Columbia Multi-Asset Income Fund | Annual Report 2018
| 5 |
Understanding Your Fund’s Expenses
(Unaudited)
As an investor, you incur two types of costs. There are transaction costs, which generally include sales charges on purchases and may include redemption fees. There are also ongoing costs, which generally include management fees, distribution and/or service fees, and other fund expenses. The following information is intended to help you understand your ongoing costs (in dollars) of investing in the Fund and to help you compare these costs with the ongoing costs of investing in other mutual funds.
Analyzing your Fund’s expenses
To illustrate these ongoing costs, we have provided examples and calculated the expenses paid by investors in each share class of the Fund during the period. The actual and hypothetical information in the table is based on an initial investment of $1,000 at the beginning of the period indicated and held for the entire period. Expense information is calculated two ways and each method provides you with different information. The amount listed in the “Actual” column is calculated using the Fund’s actual operating expenses and total return for the period. You may use the Actual information, together with the amount invested, to estimate the expenses that you paid over the period. Simply divide your account value by $1,000 (for example, an $8,600 account value divided by $1,000 = 8.6), then multiply the results by the expenses paid during the period under the “Actual” column. The amount listed in the “Hypothetical” column assumes a 5% annual rate of return before expenses (which is not the Fund’s actual return) and then applies the Fund’s actual expense ratio for the period to the hypothetical return. You should not use the hypothetical account values and expenses to estimate either your actual account balance at the end of the period or the expenses you paid during the period. See “Compare with other funds” below for details on how to use the hypothetical data.
Compare with other funds
Since all mutual funds are required to include the same hypothetical calculations about expenses in shareholder reports, you can use this information to compare the ongoing cost of investing in the Fund with other funds. To do so, compare the hypothetical example with the 5% hypothetical examples that appear in the shareholder reports of other funds. As you compare hypothetical examples of other funds, it is important to note that hypothetical examples are meant to highlight the ongoing costs of investing in a fund only and do not reflect any transaction costs, such as sales charges, or redemption or exchange fees. Therefore, the hypothetical calculations are useful in comparing ongoing costs only, and will not help you determine the relative total costs of owning different funds. If transaction costs were included in these calculations, your costs would be higher.
| November 1, 2017 — April 30, 2018 |
| | Account value at the
beginning of the
period ($) | Account value at the
end of the
period ($) | Expenses paid during
the period ($) | Fund’s annualized
expense ratio (%) |
| | Actual | Hypothetical | Actual | Hypothetical | Actual | Hypothetical | Actual |
| Class A | 1,000.00 | 1,000.00 | 996.50 | 1,020.23 | 4.55 | 4.61 | 0.92 |
| Advisor Class | 1,000.00 | 1,000.00 | 997.70 | 1,021.47 | 3.32 | 3.36 | 0.67 |
| Class C | 1,000.00 | 1,000.00 | 992.80 | 1,016.51 | 8.25 | 8.35 | 1.67 |
| Institutional Class | 1,000.00 | 1,000.00 | 997.80 | 1,021.47 | 3.32 | 3.36 | 0.67 |
| Institutional 2 Class | 1,000.00 | 1,000.00 | 998.00 | 1,021.62 | 3.17 | 3.21 | 0.64 |
| Institutional 3 Class | 1,000.00 | 1,000.00 | 998.20 | 1,021.92 | 2.87 | 2.91 | 0.58 |
| Class T | 1,000.00 | 1,000.00 | 996.50 | 1,020.23 | 4.55 | 4.61 | 0.92 |
Expenses paid during the period are equal to the annualized expense ratio for each class as indicated above, multiplied by the average account value over the period and then multiplied by the number of days in the Fund’s most recent fiscal half year and divided by 365.
Expenses do not include fees and expenses incurred indirectly by the Fund from its investment in underlying funds, including affiliated and non-affiliated pooled investment vehicles, such as mutual funds and exchange-traded funds.
Had Columbia Management Investment Advisers, LLC and/or certain of its affiliates not waived/reimbursed certain fees and expenses, account value at the end of the period would have been reduced.
| 6 | Columbia Multi-Asset Income Fund | Annual Report 2018 |
Portfolio of Investments
April 30, 2018
(Percentages represent value of investments compared to net assets)
Investments in securities
| Asset-Backed Securities — Non-Agency 3.4% |
| Issuer | Coupon
Rate | | Principal
Amount ($) | Value ($) |
| ARES XLIV CLO Ltd.(a),(b) |
| Series 2017-44A Class D |
3-month USD LIBOR + 6.550%
10/15/2029 | 8.898% | | 500,000 | 508,281 |
| Conn’s Receivables Funding LLC(a) |
| Series 2017-A Class B |
| 02/15/2020 | 5.110% | | 300,000 | 301,899 |
| Series 2017-B Class A |
| 07/15/2020 | 2.730% | | 313,775 | 313,595 |
| Subordinated, Series 2017-B Class B |
| 11/15/2020 | 4.520% | | 300,000 | 301,709 |
| Consumer Loan Underlying Bond Credit Trust(a) |
| Series 2017-NP2 Class A |
| 01/16/2024 | 2.550% | | 198,859 | 198,669 |
| Series 2017-NP2 Class B |
| 01/16/2024 | 3.500% | | 200,000 | 199,362 |
| Hertz Vehicle Financing II LP(a) |
| Subordinated Series 2016-3A Class D |
| 07/25/2020 | 5.410% | | 250,000 | 250,797 |
| OZLM Funding Ltd.(a),(b) |
| Series 2012-1A Class DR2 |
3-month USD LIBOR + 6.670%
07/23/2029 | 9.032% | | 500,000 | 508,927 |
| OZLM XXI(a),(b) |
| Series 2017-21A Class A2 |
3-month USD LIBOR + 1.450%
01/20/2031 | 2.750% | | 500,000 | 496,584 |
| Prosper Marketplace Issuance Trust(a) |
| Series 2018-1A Class B |
| 06/17/2024 | 3.900% | | 200,000 | 199,801 |
| Subordinated, Series 2017-1A Class C |
| 06/15/2023 | 5.800% | | 500,000 | 508,533 |
| Subordinated, Series 2017-2A Class C |
| 09/15/2023 | 5.370% | | 750,000 | 756,908 |
Total Asset-Backed Securities — Non-Agency
(Cost $4,528,775) | 4,545,065 |
|
| Commercial Mortgage-Backed Securities - Non-Agency 1.0% |
| | | | |
| BHMS Mortgage Trust(a),(c) |
| Series 2014-ATLS Class DFX |
| 07/05/2033 | 5.483% | | 500,000 | 500,064 |
| Credit Suisse Mortgage Capital Certificates OA LLC(a) |
| Subordinated, Series 2014-USA Class D |
| 09/15/2037 | 4.373% | | 250,000 | 237,988 |
| Subordinated, Series 2014-USA Class F |
| 09/15/2037 | 4.373% | | 250,000 | 207,043 |
| Commercial Mortgage-Backed Securities - Non-Agency (continued) |
| Issuer | Coupon
Rate | | Principal
Amount ($) | Value ($) |
| Rialto Real Estate Fund LLC(a) |
| Subordinated, Series 2015-LT7 Class B |
| 12/25/2032 | 5.071% | | 191,791 | 191,792 |
| UBS Commercial Mortgage Trust(a),(b) |
| Series 2018-NYCH Class D |
1-month USD LIBOR + 2.100%
02/15/2032 | 3.997% | | 250,000 | 251,434 |
Total Commercial Mortgage-Backed Securities - Non-Agency
(Cost $1,401,568) | 1,388,321 |
| Common Stocks 9.8% |
| Issuer | Shares | Value ($) |
| Consumer Discretionary 0.5% |
| Automobiles 0.1% |
| Ford Motor Co. | 13,492 | 151,650 |
| Hotels, Restaurants & Leisure 0.1% |
| Las Vegas Sands Corp. | 2,605 | 191,025 |
| Household Durables 0.1% |
| Whirlpool Corp. | 639 | 99,013 |
| Multiline Retail 0.2% |
| Target Corp. | 3,376 | 245,097 |
| Total Consumer Discretionary | 686,785 |
| Consumer Staples 0.8% |
| Beverages 0.1% |
| Coca-Cola Co. (The) | 1,142 | 49,346 |
| Molson Coors Brewing Co., Class B | 1,290 | 91,899 |
| Total | | 141,245 |
| Food Products 0.1% |
| Archer-Daniels-Midland Co. | 1,773 | 80,459 |
| Tobacco 0.6% |
| Altria Group, Inc. | 3,711 | 208,224 |
| Imperial Brands PLC | 3,488 | 124,800 |
| Philip Morris International, Inc. | 6,655 | 545,710 |
| Total | | 878,734 |
| Total Consumer Staples | 1,100,438 |
| Energy 1.5% |
| Energy Equipment & Services —% |
| Baker Hughes, Inc. | 1,282 | 46,293 |
The accompanying Notes to Financial Statements are an integral part of this statement.
Columbia Multi-Asset Income Fund | Annual Report 2018
| 7 |
Portfolio of Investments (continued)
April 30, 2018
| Common Stocks (continued) |
| Issuer | Shares | Value ($) |
| Oil, Gas & Consumable Fuels 1.5% |
| BP PLC, ADR | 10,017 | 446,658 |
| Chevron Corp. | 3,912 | 489,430 |
| ConocoPhillips | 6,729 | 440,749 |
| Royal Dutch Shell PLC, Class A | 8,086 | 281,322 |
| Total SA | 4,507 | 283,273 |
| Valero Energy Corp. | 627 | 69,553 |
| Total | | 2,010,985 |
| Total Energy | 2,057,278 |
| Financials 0.7% |
| Banks 0.3% |
| Bank of America Corp. | 4,678 | 139,966 |
| Citigroup, Inc. | 928 | 63,355 |
| JPMorgan Chase & Co. | 1,784 | 194,063 |
| SunTrust Banks, Inc. | 486 | 32,465 |
| Total | | 429,849 |
| Capital Markets 0.2% |
| BlackRock, Inc. | 100 | 52,150 |
| Morgan Stanley | 2,181 | 112,583 |
| Total | | 164,733 |
| Insurance 0.2% |
| Arthur J Gallagher & Co. | 627 | 43,884 |
| Prudential Financial, Inc. | 1,744 | 185,422 |
| Swiss Re AG | 441 | 42,014 |
| Total | | 271,320 |
| Total Financials | 865,902 |
| Health Care 0.4% |
| Biotechnology 0.1% |
| AbbVie, Inc. | 1,072 | 103,501 |
| Pharmaceuticals 0.3% |
| Merck & Co., Inc. | 2,650 | 156,006 |
| Pfizer, Inc. | 8,351 | 305,730 |
| Total | | 461,736 |
| Total Health Care | 565,237 |
| Industrials 0.4% |
| Aerospace & Defense 0.1% |
| Lockheed Martin Corp. | 157 | 50,372 |
| Common Stocks (continued) |
| Issuer | Shares | Value ($) |
| Airlines —% |
| Alaska Air Group, Inc. | 587 | 38,114 |
| Industrial Conglomerates 0.1% |
| Siemens AG, Registered Shares | 1,372 | 174,237 |
| Machinery 0.1% |
| Ingersoll-Rand PLC | 528 | 44,294 |
| Road & Rail 0.1% |
| Union Pacific Corp. | 1,094 | 146,191 |
| Total Industrials | 453,208 |
| Information Technology 0.9% |
| Communications Equipment 0.4% |
| Cisco Systems, Inc. | 8,932 | 395,598 |
| Nokia OYJ | 15,966 | 95,800 |
| Total | | 491,398 |
| IT Services —% |
| International Business Machines Corp. | 317 | 45,952 |
| Semiconductors & Semiconductor Equipment 0.3% |
| Intel Corp. | 6,586 | 339,969 |
| QUALCOMM, Inc. | 1,165 | 59,427 |
| Total | | 399,396 |
| Software 0.2% |
| Microsoft Corp. | 3,284 | 307,120 |
| Total Information Technology | 1,243,866 |
| Materials 0.3% |
| Chemicals 0.2% |
| BASF SE | 471 | 49,005 |
| DowDuPont, Inc. | 2,056 | 130,021 |
| Nutrien Ltd. | 1,598 | 72,757 |
| Total | | 251,783 |
| Containers & Packaging 0.1% |
| Graphic Packaging Holding Co. | 1,656 | 23,681 |
| WestRock Co. | 2,056 | 121,633 |
| Total | | 145,314 |
| Metals & Mining —% |
| ThyssenKrupp AG | 1,611 | 41,903 |
| Total Materials | 439,000 |
The accompanying Notes to Financial Statements are an integral part of this statement.
| 8 | Columbia Multi-Asset Income Fund | Annual Report 2018 |
Portfolio of Investments (continued)
April 30, 2018
| Common Stocks (continued) |
| Issuer | Shares | Value ($) |
| Real Estate 3.1% |
| Equity Real Estate Investment Trusts (REITS) 3.1% |
| Alexandria Real Estate Equities, Inc. | 2,112 | 263,092 |
| Americold Realty Trust | 5,576 | 114,921 |
| Armada Hoffler Properties, Inc. | 1,962 | 26,624 |
| Ashford Hospitality Trust, Inc. | 4,367 | 30,045 |
| Brandywine Realty Trust | 2,833 | 45,640 |
| Chesapeake Lodging Trust | 2,181 | 64,427 |
| Coresite Realty Corp. | 623 | 64,854 |
| Digital Realty Trust, Inc. | 3,541 | 374,248 |
| Duke Realty Corp. | 1,632 | 44,227 |
| EastGroup Properties, Inc. | 1,422 | 127,667 |
| Education Realty Trust, Inc. | 1,827 | 60,127 |
| EPR Properties | 2,495 | 137,275 |
| Four Corners Property Trust, Inc. | 2,040 | 46,226 |
| Front Yard Residential Corp. | 4,047 | 39,742 |
| Gaming and Leisure Properties, Inc. | 4,022 | 137,834 |
| GEO Group, Inc. (The) | 4,269 | 96,053 |
| Getty Realty Corp. | 2,735 | 68,512 |
| Gladstone Commercial Corp. | 1,695 | 29,391 |
| Government Properties Income Trust | 2,789 | 34,835 |
| HCP, Inc. | 4,929 | 115,141 |
| Healthcare Trust of America, Inc., Class A | 3,772 | 94,262 |
| Highwoods Properties, Inc. | 2,786 | 122,640 |
| Host Hotels & Resorts, Inc. | 6,211 | 121,487 |
| Lexington Realty Trust | 12,790 | 102,832 |
| Life Storage, Inc. | 791 | 69,956 |
| Medical Properties Trust, Inc. | 6,986 | 89,281 |
| Mid-America Apartment Communities, Inc. | 876 | 80,119 |
| One Liberty Properties, Inc. | 2,576 | 61,206 |
| Outfront Media, Inc. | 1,586 | 29,738 |
| Pebblebrook Hotel Trust | 2,591 | 90,659 |
| Physicians Realty Trust | 4,761 | 71,129 |
| Ramco-Gershenson Properties Trust | 4,535 | 54,193 |
| Retail Properties of America, Inc., Class A | 4,076 | 47,037 |
| RLJ Lodging Trust | 4,074 | 84,617 |
| Sabra Health Care REIT, Inc. | 6,782 | 124,178 |
| Select Income REIT | 3,354 | 63,592 |
| Senior Housing Properties Trust | 1,890 | 29,427 |
| Common Stocks (continued) |
| Issuer | Shares | Value ($) |
| Spirit Realty Capital, Inc. | 12,507 | 100,681 |
| STAG Industrial, Inc. | 8,848 | 217,395 |
| STORE Capital Corp. | 2,408 | 60,754 |
| Sun Communities, Inc. | 1,879 | 176,344 |
| UDR, Inc. | 2,492 | 90,086 |
| Ventas, Inc. | 998 | 51,317 |
| Washington Prime Group, Inc. | 14,591 | 94,404 |
| WP Carey, Inc. | 1,830 | 116,846 |
| Total | | 4,165,061 |
| Total Real Estate | 4,165,061 |
| Telecommunication Services 0.7% |
| Diversified Telecommunication Services 0.6% |
| AT&T, Inc. | 13,255 | 433,438 |
| BCE, Inc. | 1,992 | 84,560 |
| CenturyLink, Inc. | 2,890 | 53,696 |
| Orange SA | 4,085 | 74,264 |
| Verizon Communications, Inc. | 2,853 | 140,796 |
| Total | | 786,754 |
| Wireless Telecommunication Services 0.1% |
| Vodafone Group PLC | 9,149 | 26,699 |
| Vodafone Group PLC, ADR | 3,370 | 99,112 |
| Total | | 125,811 |
| Total Telecommunication Services | 912,565 |
| Utilities 0.5% |
| Electric Utilities 0.3% |
| American Electric Power Co., Inc. | 1,584 | 110,849 |
| Entergy Corp. | 1,970 | 160,732 |
| Exelon Corp. | 2,421 | 96,065 |
| Xcel Energy, Inc. | 2,158 | 101,081 |
| Total | | 468,727 |
| Multi-Utilities 0.2% |
| Ameren Corp. | 1,624 | 95,199 |
| DTE Energy Co. | 649 | 68,404 |
| Veolia Environnement SA | 3,811 | 90,163 |
| Total | | 253,766 |
| Total Utilities | 722,493 |
Total Common Stocks
(Cost $12,563,150) | 13,211,833 |
The accompanying Notes to Financial Statements are an integral part of this statement.
Columbia Multi-Asset Income Fund | Annual Report 2018
| 9 |
Portfolio of Investments (continued)
April 30, 2018
| Convertible Preferred Stocks 0.1% |
| Issuer | | Shares | Value ($) |
| Health Care —% |
| Health Care Equipment & Supplies —% |
| Becton Dickinson and Co. | 6.125% | 1,298 | 78,334 |
| Total Health Care | 78,334 |
| Utilities 0.1% |
| Electric Utilities 0.1% |
| NextEra Energy, Inc. | 6.123% | 1,449 | 83,752 |
| Total Utilities | 83,752 |
Total Convertible Preferred Stocks
(Cost $160,487) | 162,086 |
| Corporate Bonds & Notes 21.2% |
| Issuer | Coupon
Rate | | Principal
Amount ($) | Value ($) |
| Aerospace & Defense 0.4% |
| Bombardier, Inc.(a) |
| 12/01/2021 | 8.750% | | 56,000 | 62,196 |
| 01/15/2023 | 6.125% | | 39,000 | 39,260 |
| 12/01/2024 | 7.500% | | 51,000 | 53,677 |
| 03/15/2025 | 7.500% | | 27,000 | 28,139 |
| TransDigm, Inc. |
| 07/15/2024 | 6.500% | | 46,000 | 46,830 |
| 05/15/2025 | 6.500% | | 85,000 | 86,347 |
| 06/15/2026 | 6.375% | | 185,000 | 186,193 |
| Total | 502,642 |
| Automotive 0.0% |
| Delphi Technologies PLC(a) |
| 10/01/2025 | 5.000% | | 62,000 | 59,734 |
| Banking 0.4% |
| Agromercantil Senior Trust(a) |
| 04/10/2019 | 6.250% | | 200,000 | 203,163 |
| Ally Financial, Inc. |
| 05/19/2022 | 4.625% | | 50,000 | 50,474 |
| 03/30/2025 | 4.625% | | 113,000 | 112,255 |
| Banco Mercantil del Norte SA(a),(d) |
| Subordinated |
| 10/04/2031 | 5.750% | | 200,000 | 192,704 |
| Total | 558,596 |
| Brokerage/Asset Managers/Exchanges 0.1% |
| NFP Corp.(a) |
| 07/15/2025 | 6.875% | | 97,000 | 96,048 |
| VFH Parent LLC/Orchestra Co-Issuer, Inc.(a) |
| 06/15/2022 | 6.750% | | 19,000 | 19,730 |
| Total | 115,778 |
| Corporate Bonds & Notes (continued) |
| Issuer | Coupon
Rate | | Principal
Amount ($) | Value ($) |
| Building Materials 0.3% |
| American Builders & Contractors Supply Co., Inc.(a) |
| 04/15/2021 | 5.625% | | 28,000 | 28,356 |
| 12/15/2023 | 5.750% | | 132,000 | 136,021 |
| Beacon Roofing Supply, Inc. |
| 10/01/2023 | 6.375% | | 50,000 | 52,571 |
| Beacon Roofing Supply, Inc.(a) |
| 11/01/2025 | 4.875% | | 120,000 | 113,329 |
| Core & Main LP(a) |
| 08/15/2025 | 6.125% | | 31,000 | 30,516 |
| HD Supply, Inc.(a) |
| 04/15/2024 | 5.750% | | 39,000 | 41,005 |
| U.S. Concrete, Inc. |
| 06/01/2024 | 6.375% | | 58,000 | 60,021 |
| Total | 461,819 |
| Cable and Satellite 2.0% |
| Altice U.S. Finance I Corp.(a) |
| 07/15/2023 | 5.375% | | 33,000 | 33,166 |
| 05/15/2026 | 5.500% | | 84,000 | 82,110 |
| CCO Holdings LLC/Capital Corp.(a) |
| 04/01/2024 | 5.875% | | 60,000 | 60,744 |
| 02/15/2026 | 5.750% | | 47,000 | 46,597 |
| 05/01/2026 | 5.500% | | 87,000 | 84,784 |
| 02/01/2028 | 5.000% | | 180,000 | 165,652 |
| Cequel Communications Holdings I LLC/Capital Corp.(a) |
| 12/15/2021 | 5.125% | | 76,000 | 75,708 |
| 12/15/2021 | 5.125% | | 26,000 | 26,028 |
| 04/01/2028 | 7.500% | | 77,000 | 78,054 |
| CSC Holdings LLC(a) |
| 10/15/2025 | 6.625% | | 109,000 | 112,294 |
| 10/15/2025 | 10.875% | | 89,000 | 104,366 |
| 02/01/2028 | 5.375% | | 101,000 | 94,527 |
| DISH DBS Corp. |
| 06/01/2021 | 6.750% | | 66,000 | 65,738 |
| 11/15/2024 | 5.875% | | 21,000 | 17,900 |
| 07/01/2026 | 7.750% | | 267,000 | 243,291 |
| Quebecor Media, Inc. |
| 01/15/2023 | 5.750% | | 40,000 | 40,995 |
| Radiate HoldCo LLC/Finance, Inc.(a) |
| 02/15/2023 | 6.875% | | 23,000 | 22,278 |
| 02/15/2025 | 6.625% | | 64,000 | 59,360 |
| Sirius XM Radio, Inc.(a) |
| 04/15/2025 | 5.375% | | 50,000 | 49,872 |
| 07/15/2026 | 5.375% | | 57,000 | 56,006 |
| 08/01/2027 | 5.000% | | 174,000 | 166,179 |
| Unitymedia GmbH(a) |
| 01/15/2025 | 6.125% | | 174,000 | 183,011 |
The accompanying Notes to Financial Statements are an integral part of this statement.
| 10 | Columbia Multi-Asset Income Fund | Annual Report 2018 |
Portfolio of Investments (continued)
April 30, 2018
| Corporate Bonds & Notes (continued) |
| Issuer | Coupon
Rate | | Principal
Amount ($) | Value ($) |
| Unitymedia Hessen GmbH & Co. KG NRW(a) |
| 01/15/2025 | 5.000% | | 19,000 | 19,428 |
| Videotron Ltd. |
| 07/15/2022 | 5.000% | | 55,000 | 56,186 |
| Virgin Media Finance PLC(a) |
| 10/15/2024 | 6.000% | | 284,000 | 280,030 |
| Vrio Finco 1 LLC/Finco 2, Inc.(a) |
| 04/04/2023 | 6.250% | | 200,000 | 201,672 |
| Ziggo Bond Finance BV(a) |
| 01/15/2027 | 6.000% | | 87,000 | 81,245 |
| Ziggo Secured Finance BV(a) |
| 01/15/2027 | 5.500% | | 199,000 | 187,594 |
| Total | 2,694,815 |
| Chemicals 0.9% |
| Angus Chemical Co.(a) |
| 02/15/2023 | 8.750% | | 74,000 | 77,041 |
| Atotech U.S.A., Inc.(a) |
| 02/01/2025 | 6.250% | | 69,000 | 69,734 |
| Axalta Coating Systems LLC(a) |
| 08/15/2024 | 4.875% | | 64,000 | 64,507 |
| Chemours Co. (The) |
| 05/15/2023 | 6.625% | | 59,000 | 62,013 |
| 05/15/2025 | 7.000% | | 73,000 | 78,538 |
| Elementia SAB de CV(a) |
| 01/15/2025 | 5.500% | | 200,000 | 196,318 |
| INEOS Group Holdings SA(a) |
| 08/01/2024 | 5.625% | | 79,000 | 79,662 |
| Koppers, Inc.(a) |
| 02/15/2025 | 6.000% | | 21,000 | 21,408 |
| Olin Corp. |
| 09/15/2027 | 5.125% | | 37,000 | 36,245 |
| 02/01/2030 | 5.000% | | 53,000 | 50,507 |
| Platform Specialty Products Corp.(a) |
| 02/01/2022 | 6.500% | | 42,000 | 43,034 |
| 12/01/2025 | 5.875% | | 97,000 | 94,627 |
| PQ Corp.(a) |
| 11/15/2022 | 6.750% | | 122,000 | 129,292 |
| 12/15/2025 | 5.750% | | 56,000 | 55,515 |
| SPCM SA(a) |
| 09/15/2025 | 4.875% | | 95,000 | 92,094 |
| Venator Finance SARL/Materials LLC(a) |
| 07/15/2025 | 5.750% | | 13,000 | 13,000 |
| WR Grace & Co.(a) |
| 10/01/2021 | 5.125% | | 60,000 | 61,753 |
| Total | 1,225,288 |
| Corporate Bonds & Notes (continued) |
| Issuer | Coupon
Rate | | Principal
Amount ($) | Value ($) |
| Construction Machinery 0.3% |
| H&E Equipment Services, Inc. |
| 09/01/2025 | 5.625% | | 27,000 | 27,122 |
| Ritchie Bros. Auctioneers, Inc.(a) |
| 01/15/2025 | 5.375% | | 80,000 | 79,594 |
| United Rentals North America, Inc. |
| 10/15/2025 | 4.625% | | 30,000 | 29,137 |
| 09/15/2026 | 5.875% | | 55,000 | 57,267 |
| 05/15/2027 | 5.500% | | 95,000 | 94,303 |
| 01/15/2028 | 4.875% | | 175,000 | 165,674 |
| Total | 453,097 |
| Consumer Cyclical Services 0.3% |
| APX Group, Inc. |
| 12/01/2020 | 8.750% | | 44,000 | 43,349 |
| 12/01/2022 | 7.875% | | 75,000 | 75,750 |
| 09/01/2023 | 7.625% | | 40,000 | 37,336 |
| IHS Markit Ltd.(a) |
| 11/01/2022 | 5.000% | | 82,000 | 84,897 |
| Interval Acquisition Corp. |
| 04/15/2023 | 5.625% | | 93,000 | 96,849 |
| Total | 338,181 |
| Consumer Products 0.5% |
| Mattel, Inc.(a) |
| 12/31/2025 | 6.750% | | 56,000 | 54,601 |
| Prestige Brands, Inc.(a) |
| 03/01/2024 | 6.375% | | 96,000 | 96,473 |
| Scotts Miracle-Gro Co. (The) |
| 10/15/2023 | 6.000% | | 122,000 | 127,532 |
| 12/15/2026 | 5.250% | | 2,000 | 1,943 |
| Spectrum Brands, Inc. |
| 11/15/2022 | 6.625% | | 20,000 | 20,691 |
| 12/15/2024 | 6.125% | | 117,000 | 119,338 |
| 07/15/2025 | 5.750% | | 44,000 | 44,003 |
| Springs Industries, Inc. |
| 06/01/2021 | 6.250% | | 47,000 | 47,656 |
| Valvoline, Inc. |
| 07/15/2024 | 5.500% | | 64,000 | 65,618 |
| 08/15/2025 | 4.375% | | 59,000 | 57,040 |
| Total | 634,895 |
| Diversified Manufacturing 0.3% |
| Apergy Corp.(a),(e) |
| 05/01/2026 | 6.375% | | 58,000 | 58,863 |
| Gates Global LLC/Co.(a) |
| 07/15/2022 | 6.000% | | 65,000 | 65,816 |
The accompanying Notes to Financial Statements are an integral part of this statement.
Columbia Multi-Asset Income Fund | Annual Report 2018
| 11 |
Portfolio of Investments (continued)
April 30, 2018
| Corporate Bonds & Notes (continued) |
| Issuer | Coupon
Rate | | Principal
Amount ($) | Value ($) |
| General Electric Co.(d) |
| Junior Subordinated |
| 12/31/2049 | 5.000% | | 63,000 | 62,340 |
| SPX FLOW, Inc.(a) |
| 08/15/2024 | 5.625% | | 13,000 | 13,164 |
| 08/15/2026 | 5.875% | | 48,000 | 49,078 |
| TriMas Corp.(a) |
| 10/15/2025 | 4.875% | | 9,000 | 8,765 |
| Welbilt, Inc. |
| 02/15/2024 | 9.500% | | 23,000 | 25,574 |
| WESCO Distribution, Inc. |
| 06/15/2024 | 5.375% | | 64,000 | 64,640 |
| Zekelman Industries, Inc.(a) |
| 06/15/2023 | 9.875% | | 31,000 | 34,179 |
| Total | 382,419 |
| Electric 0.7% |
| AES Corp. |
| 03/15/2023 | 4.500% | | 53,000 | 53,267 |
| 05/15/2026 | 6.000% | | 18,000 | 18,807 |
| 09/01/2027 | 5.125% | | 63,000 | 63,877 |
| Calpine Corp. |
| 02/01/2024 | 5.500% | | 66,000 | 60,533 |
| Calpine Corp.(a) |
| 06/01/2026 | 5.250% | | 31,000 | 29,697 |
| NextEra Energy Operating Partners LP(a) |
| 09/15/2027 | 4.500% | | 70,000 | 65,531 |
| NRG Energy, Inc. |
| 05/01/2024 | 6.250% | | 27,000 | 27,839 |
| 05/15/2026 | 7.250% | | 16,000 | 17,055 |
| 01/15/2027 | 6.625% | | 74,000 | 76,131 |
| NRG Energy, Inc.(a) |
| 01/15/2028 | 5.750% | | 30,000 | 29,715 |
| NRG Yield Operating LLC |
| 08/15/2024 | 5.375% | | 114,000 | 114,172 |
| 09/15/2026 | 5.000% | | 58,000 | 56,712 |
| Pattern Energy Group, Inc.(a) |
| 02/01/2024 | 5.875% | | 132,000 | 135,096 |
| TerraForm Power Operating LLC(a) |
| 01/31/2028 | 5.000% | | 113,000 | 105,986 |
| Vistra Energy Corp. |
| 11/01/2024 | 7.625% | | 60,000 | 64,460 |
| Vistra Energy Corp.(a) |
| 01/30/2026 | 8.125% | | 46,000 | 50,487 |
| Total | 969,365 |
| Corporate Bonds & Notes (continued) |
| Issuer | Coupon
Rate | | Principal
Amount ($) | Value ($) |
| Finance Companies 0.6% |
| Aircastle Ltd. |
| 03/15/2021 | 5.125% | | 60,000 | 61,540 |
| 04/01/2023 | 5.000% | | 8,000 | 8,194 |
| Avolon Holdings Funding Ltd.(a) |
| 01/15/2023 | 5.500% | | 81,000 | 80,515 |
| CIT Group, Inc. |
| 03/07/2025 | 5.250% | | 20,000 | 20,425 |
| iStar, Inc. |
| 04/01/2022 | 6.000% | | 54,000 | 54,366 |
| Navient Corp. |
| 03/25/2020 | 8.000% | | 7,000 | 7,455 |
| 10/26/2020 | 5.000% | | 99,000 | 99,493 |
| 07/26/2021 | 6.625% | | 39,000 | 40,498 |
| 06/15/2022 | 6.500% | | 82,000 | 84,271 |
| Provident Funding Associates LP/Finance Corp.(a) |
| 06/15/2025 | 6.375% | | 55,000 | 55,328 |
| Quicken Loans, Inc.(a) |
| 05/01/2025 | 5.750% | | 72,000 | 70,867 |
| 01/15/2028 | 5.250% | | 49,000 | 44,851 |
| Springleaf Finance Corp. |
| 03/15/2023 | 5.625% | | 42,000 | 42,066 |
| 03/15/2025 | 6.875% | | 67,000 | 67,645 |
| Total | 737,514 |
| Food and Beverage 0.9% |
| Aramark Services, Inc.(a) |
| 02/01/2028 | 5.000% | | 45,000 | 43,787 |
| B&G Foods, Inc. |
| 06/01/2021 | 4.625% | | 30,000 | 29,696 |
| 04/01/2025 | 5.250% | | 136,000 | 124,563 |
| Chobani LLC/Finance Corp., Inc.(a) |
| 04/15/2025 | 7.500% | | 118,000 | 118,593 |
| FAGE International SA/U.S.A. Dairy Industry, Inc.(a) |
| 08/15/2026 | 5.625% | | 101,000 | 94,544 |
| Lamb Weston Holdings, Inc.(a) |
| 11/01/2024 | 4.625% | | 25,000 | 24,760 |
| 11/01/2026 | 4.875% | | 94,000 | 93,689 |
| MHP SA(a) |
| 04/03/2026 | 6.950% | | 300,000 | 292,387 |
| Pinnacle Foods Finance LLC/Corp. |
| 01/15/2024 | 5.875% | | 38,000 | 39,146 |
| Post Holdings, Inc.(a) |
| 03/01/2025 | 5.500% | | 24,000 | 23,554 |
| 08/15/2026 | 5.000% | | 117,000 | 109,976 |
| 03/01/2027 | 5.750% | | 212,000 | 207,663 |
| 01/15/2028 | 5.625% | | 39,000 | 37,245 |
| Total | 1,239,603 |
The accompanying Notes to Financial Statements are an integral part of this statement.
| 12 | Columbia Multi-Asset Income Fund | Annual Report 2018 |
Portfolio of Investments (continued)
April 30, 2018
| Corporate Bonds & Notes (continued) |
| Issuer | Coupon
Rate | | Principal
Amount ($) | Value ($) |
| Gaming 1.0% |
| Boyd Gaming Corp. |
| 05/15/2023 | 6.875% | | 31,000 | 32,550 |
| 04/01/2026 | 6.375% | | 20,000 | 20,919 |
| Caesars Resort Collection LLC/CRC Finco, Inc.(a) |
| 10/15/2025 | 5.250% | | 38,000 | 36,286 |
| Eldorado Resorts, Inc. |
| 04/01/2025 | 6.000% | | 71,000 | 70,325 |
| GLP Capital LP/Financing II, Inc. |
| 04/15/2026 | 5.375% | | 132,000 | 133,017 |
| International Game Technology PLC(a) |
| 02/15/2022 | 6.250% | | 148,000 | 155,569 |
| 02/15/2025 | 6.500% | | 63,000 | 67,244 |
| Jack Ohio Finance LLC/1 Corp.(a) |
| 11/15/2021 | 6.750% | | 77,000 | 79,699 |
| MGM Growth Properties Operating Partnership LP/Finance Co-Issuer, Inc. |
| 05/01/2024 | 5.625% | | 21,000 | 21,420 |
| 09/01/2026 | 4.500% | | 27,000 | 25,497 |
| 01/15/2028 | 4.500% | | 78,000 | 71,869 |
| MGM Resorts International |
| 12/15/2021 | 6.625% | | 98,000 | 104,750 |
| 03/15/2023 | 6.000% | | 92,000 | 96,215 |
| Penn National Gaming, Inc.(a) |
| 01/15/2027 | 5.625% | | 53,000 | 50,876 |
| Rivers Pittsburgh Borrower LP/Finance Corp.(a) |
| 08/15/2021 | 6.125% | | 28,000 | 27,535 |
| Scientific Games International, Inc. |
| 12/01/2022 | 10.000% | | 126,000 | 135,766 |
| Scientific Games International, Inc.(a) |
| 10/15/2025 | 5.000% | | 121,000 | 116,927 |
| Wynn Las Vegas LLC/Capital Corp.(a) |
| 03/01/2025 | 5.500% | | 68,000 | 67,593 |
| 05/15/2027 | 5.250% | | 42,000 | 40,487 |
| Total | 1,354,544 |
| Health Care 1.4% |
| Acadia Healthcare Co., Inc. |
| 07/01/2022 | 5.125% | | 32,000 | 32,112 |
| 03/01/2024 | 6.500% | | 32,000 | 33,120 |
| Amsurg Corp. |
| 07/15/2022 | 5.625% | | 7,000 | 7,021 |
| Change Healthcare Holdings LLC/Finance, Inc.(a) |
| 03/01/2025 | 5.750% | | 93,000 | 90,978 |
| Charles River Laboratories International, Inc.(a) |
| 04/01/2026 | 5.500% | | 25,000 | 25,428 |
| CHS/Community Health Systems, Inc. |
| 02/01/2022 | 6.875% | | 38,000 | 20,723 |
| 03/31/2023 | 6.250% | | 118,000 | 107,766 |
| Corporate Bonds & Notes (continued) |
| Issuer | Coupon
Rate | | Principal
Amount ($) | Value ($) |
| DaVita, Inc. |
| 07/15/2024 | 5.125% | | 52,000 | 50,440 |
| 05/01/2025 | 5.000% | | 46,000 | 43,607 |
| Envision Healthcare Corp.(a) |
| 12/01/2024 | 6.250% | | 46,000 | 47,837 |
| HCA Healthcare, Inc. |
| Junior Subordinated |
| 02/15/2021 | 6.250% | | 163,000 | 171,435 |
| HCA, Inc. |
| 02/15/2020 | 6.500% | | 97,000 | 101,584 |
| 02/01/2025 | 5.375% | | 137,000 | 136,326 |
| 02/15/2026 | 5.875% | | 40,000 | 40,528 |
| 02/15/2027 | 4.500% | | 72,000 | 68,929 |
| Hill-Rom Holdings, Inc.(a) |
| 02/15/2025 | 5.000% | | 81,000 | 80,352 |
| Hologic, Inc.(a) |
| 10/15/2025 | 4.375% | | 15,000 | 14,434 |
| 02/01/2028 | 4.625% | | 31,000 | 29,554 |
| IQVIA, Inc.(a) |
| 05/15/2023 | 4.875% | | 42,000 | 42,655 |
| 10/15/2026 | 5.000% | | 24,000 | 23,686 |
| MPH Acquisition Holdings LLC(a) |
| 06/01/2024 | 7.125% | | 140,000 | 142,348 |
| Polaris Intermediate Corp. PIK(a) |
| 12/01/2022 | 8.500% | | 47,000 | 47,685 |
| Sotera Health Holdings LLC(a) |
| 05/15/2023 | 6.500% | | 76,000 | 76,247 |
| Teleflex, Inc. |
| 06/01/2026 | 4.875% | | 12,000 | 11,807 |
| 11/15/2027 | 4.625% | | 48,000 | 46,044 |
| Tenet Healthcare Corp. |
| 04/01/2021 | 4.500% | | 135,000 | 134,111 |
| 06/15/2023 | 6.750% | | 26,000 | 25,607 |
| Tenet Healthcare Corp.(a) |
| 07/15/2024 | 4.625% | | 87,000 | 84,115 |
| 05/01/2025 | 5.125% | | 71,000 | 69,009 |
| 08/01/2025 | 7.000% | | 80,000 | 78,642 |
| Total | 1,884,130 |
| Healthcare Insurance 0.2% |
| Centene Corp. |
| 02/15/2024 | 6.125% | | 126,000 | 132,011 |
| 01/15/2025 | 4.750% | | 52,000 | 50,561 |
| Molina Healthcare, Inc.(a) |
| 06/15/2025 | 4.875% | | 4,000 | 3,800 |
| WellCare Health Plans, Inc. |
| 04/01/2025 | 5.250% | | 138,000 | 138,947 |
| Total | 325,319 |
The accompanying Notes to Financial Statements are an integral part of this statement.
Columbia Multi-Asset Income Fund | Annual Report 2018
| 13 |
Portfolio of Investments (continued)
April 30, 2018
| Corporate Bonds & Notes (continued) |
| Issuer | Coupon
Rate | | Principal
Amount ($) | Value ($) |
| Home Construction 0.4% |
| Lennar Corp. |
| 04/30/2024 | 4.500% | | 137,000 | 133,522 |
| Lennar Corp.(a) |
| 11/15/2024 | 5.875% | | 121,000 | 124,820 |
| Meritage Homes Corp. |
| 04/01/2022 | 7.000% | | 72,000 | 79,101 |
| 06/06/2027 | 5.125% | | 28,000 | 26,352 |
| Meritage Homes Corp.(a) |
| 06/01/2025 | 6.000% | | 59,000 | 60,702 |
| Taylor Morrison Communities, Inc./Holdings II(a) |
| 04/15/2021 | 5.250% | | 59,000 | 59,437 |
| 04/15/2023 | 5.875% | | 24,000 | 24,606 |
| Total | 508,540 |
| Independent Energy 1.5% |
| Callon Petroleum Co. |
| 10/01/2024 | 6.125% | | 55,000 | 56,231 |
| Carrizo Oil & Gas, Inc. |
| 04/15/2023 | 6.250% | | 93,000 | 95,304 |
| Centennial Resource Production LLC(a) |
| 01/15/2026 | 5.375% | | 29,000 | 28,743 |
| Continental Resources, Inc. |
| 04/15/2023 | 4.500% | | 55,000 | 55,664 |
| CrownRock LP/Finance, Inc.(a) |
| 10/15/2025 | 5.625% | | 100,000 | 99,035 |
| Diamondback Energy, Inc. |
| 11/01/2024 | 4.750% | | 18,000 | 17,910 |
| 05/31/2025 | 5.375% | | 105,000 | 106,703 |
| Diamondback Energy, Inc.(a) |
| 05/31/2025 | 5.375% | | 30,000 | 30,391 |
| Endeavor Energy Resources LP/Finance, Inc.(a) |
| 01/30/2026 | 5.500% | | 13,000 | 13,040 |
| 01/30/2028 | 5.750% | | 66,000 | 66,353 |
| Extraction Oil & Gas, Inc.(a) |
| 05/15/2024 | 7.375% | | 46,000 | 48,229 |
| 02/01/2026 | 5.625% | | 39,000 | 37,792 |
| Halcon Resources Corp.(a) |
| 02/15/2025 | 6.750% | | 94,000 | 93,331 |
| Halcon Resources Corp. |
| 02/15/2025 | 6.750% | | 52,000 | 51,921 |
| Indigo Natural Resources LLC(a) |
| 02/15/2026 | 6.875% | | 47,000 | 45,075 |
| Jagged Peak Energy LLC(a),(e) |
| 05/01/2026 | 5.875% | | 63,000 | 63,262 |
| Laredo Petroleum, Inc. |
| 03/15/2023 | 6.250% | | 205,000 | 207,614 |
| Corporate Bonds & Notes (continued) |
| Issuer | Coupon
Rate | | Principal
Amount ($) | Value ($) |
| Parsley Energy LLC/Finance Corp.(a) |
| 06/01/2024 | 6.250% | | 31,000 | 32,337 |
| 01/15/2025 | 5.375% | | 49,000 | 49,097 |
| 08/15/2025 | 5.250% | | 72,000 | 71,875 |
| 10/15/2027 | 5.625% | | 96,000 | 97,261 |
| PDC Energy, Inc. |
| 09/15/2024 | 6.125% | | 108,000 | 110,733 |
| PDC Energy, Inc.(a) |
| 05/15/2026 | 5.750% | | 27,000 | 27,199 |
| Range Resources Corp. |
| 08/15/2022 | 5.000% | | 52,000 | 51,202 |
| RSP Permian, Inc. |
| 01/15/2025 | 5.250% | | 69,000 | 70,982 |
| SM Energy Co. |
| 06/01/2025 | 5.625% | | 19,000 | 18,366 |
| 09/15/2026 | 6.750% | | 163,000 | 166,087 |
| Whiting Petroleum Corp.(a) |
| 01/15/2026 | 6.625% | | 61,000 | 62,749 |
| WPX Energy, Inc. |
| 01/15/2022 | 6.000% | | 117,000 | 122,339 |
| 09/15/2024 | 5.250% | | 80,000 | 80,601 |
| Total | 2,077,426 |
| Leisure 0.2% |
| Boyne U.S.A., Inc.(a) |
| 05/01/2025 | 7.250% | | 39,000 | 40,257 |
| Cedar Fair LP/Canada’s Wonderland Co./Magnum Management Corp./Millenium Operations LLC(a) |
| 04/15/2027 | 5.375% | | 57,000 | 56,711 |
| Live Nation Entertainment, Inc.(a) |
| 11/01/2024 | 4.875% | | 41,000 | 40,130 |
| 03/15/2026 | 5.625% | | 24,000 | 23,991 |
| LTF Merger Sub, Inc.(a) |
| 06/15/2023 | 8.500% | | 37,000 | 38,727 |
| Viking Cruises Ltd.(a) |
| 09/15/2027 | 5.875% | | 29,000 | 27,972 |
| Total | 227,788 |
| Lodging 0.1% |
| Hilton Domestic Operating Co., Inc. |
| 09/01/2024 | 4.250% | | 35,000 | 33,641 |
| Hilton Domestic Operating Co., Inc.(a) |
| 05/01/2026 | 5.125% | | 38,000 | 37,946 |
| Hilton Grand Vacations Borrower LLC/Inc. |
| 12/01/2024 | 6.125% | | 27,000 | 28,540 |
| Total | 100,127 |
The accompanying Notes to Financial Statements are an integral part of this statement.
| 14 | Columbia Multi-Asset Income Fund | Annual Report 2018 |
Portfolio of Investments (continued)
April 30, 2018
| Corporate Bonds & Notes (continued) |
| Issuer | Coupon
Rate | | Principal
Amount ($) | Value ($) |
| Media and Entertainment 0.6% |
| Match Group, Inc. |
| 06/01/2024 | 6.375% | | 85,000 | 90,049 |
| Match Group, Inc.(a) |
| 12/15/2027 | 5.000% | | 33,000 | 32,422 |
| MDC Partners, Inc.(a) |
| 05/01/2024 | 6.500% | | 29,000 | 28,511 |
| Netflix, Inc. |
| 02/15/2025 | 5.875% | | 49,000 | 50,321 |
| 11/15/2026 | 4.375% | | 91,000 | 85,192 |
| Netflix, Inc.(a) |
| 04/15/2028 | 4.875% | | 177,000 | 166,799 |
| 11/15/2028 | 5.875% | | 110,000 | 109,752 |
| Nielsen Luxembourg SARL(a) |
| 02/01/2025 | 5.000% | | 71,000 | 69,744 |
| Outfront Media Capital LLC/Corp. |
| 02/15/2024 | 5.625% | | 72,000 | 72,703 |
| 03/15/2025 | 5.875% | | 34,000 | 34,703 |
| Total | 740,196 |
| Metals and Mining 0.8% |
| Big River Steel LLC/Finance Corp.(a) |
| 09/01/2025 | 7.250% | | 61,000 | 63,673 |
| Constellium NV(a) |
| 05/15/2024 | 5.750% | | 116,000 | 114,228 |
| 03/01/2025 | 6.625% | | 48,000 | 48,799 |
| Freeport-McMoRan, Inc. |
| 03/01/2022 | 3.550% | | 19,000 | 18,399 |
| 11/14/2024 | 4.550% | | 166,000 | 161,004 |
| 03/15/2043 | 5.450% | | 181,000 | 164,009 |
| Grinding Media, Inc./Moly-Cop AltaSteel Ltd.(a) |
| 12/15/2023 | 7.375% | | 51,000 | 53,813 |
| HudBay Minerals, Inc.(a) |
| 01/15/2023 | 7.250% | | 17,000 | 17,734 |
| 01/15/2025 | 7.625% | | 53,000 | 56,487 |
| Novelis Corp.(a) |
| 08/15/2024 | 6.250% | | 30,000 | 30,596 |
| 09/30/2026 | 5.875% | | 124,000 | 123,195 |
| Steel Dynamics, Inc. |
| 09/15/2025 | 4.125% | | 23,000 | 21,951 |
| Teck Resources Ltd.(a) |
| 06/01/2024 | 8.500% | | 48,000 | 53,493 |
| Teck Resources Ltd. |
| 07/15/2041 | 6.250% | | 192,000 | 203,802 |
| Total | 1,131,183 |
| Corporate Bonds & Notes (continued) |
| Issuer | Coupon
Rate | | Principal
Amount ($) | Value ($) |
| Midstream 1.4% |
| Andeavor Logistics LP/Tesoro Finance Corp. |
| 01/15/2025 | 5.250% | | 18,000 | 18,448 |
| Cheniere Corpus Christi Holdings LLC |
| 06/30/2027 | 5.125% | | 64,000 | 62,490 |
| Delek Logistics Partners LP(a) |
| 05/15/2025 | 6.750% | | 55,000 | 54,939 |
| Energy Transfer Equity LP |
| 03/15/2023 | 4.250% | | 63,000 | 60,851 |
| 06/01/2027 | 5.500% | | 261,000 | 260,256 |
| Holly Energy Partners LP/Finance Corp.(a) |
| 08/01/2024 | 6.000% | | 143,000 | 143,958 |
| NGPL PipeCo LLC(a) |
| 08/15/2022 | 4.375% | | 25,000 | 24,889 |
| 08/15/2027 | 4.875% | | 31,000 | 30,121 |
| 12/15/2037 | 7.768% | | 25,000 | 30,151 |
| NuStar Logistics LP |
| 04/28/2027 | 5.625% | | 58,000 | 54,942 |
| Rockpoint Gas Storage Canada Ltd.(a) |
| 03/31/2023 | 7.000% | | 53,000 | 52,904 |
| Star Energy Geothermal Wayang Windu Ltd.(a) |
| 04/24/2033 | 6.750% | | 200,000 | 193,398 |
| Sunoco LP/Finance Corp.(a) |
| 01/15/2023 | 4.875% | | 27,000 | 26,555 |
| 02/15/2026 | 5.500% | | 47,000 | 45,610 |
| 03/15/2028 | 5.875% | | 28,000 | 27,197 |
| Tallgrass Energy Partners LP/Finance Corp.(a) |
| 09/15/2024 | 5.500% | | 22,000 | 22,297 |
| 01/15/2028 | 5.500% | | 73,000 | 72,643 |
| Targa Resources Partners LP/Finance Corp. |
| 11/15/2023 | 4.250% | | 32,000 | 30,277 |
| 02/01/2027 | 5.375% | | 151,000 | 144,583 |
| Targa Resources Partners LP/Finance Corp.(a) |
| 04/15/2026 | 5.875% | | 42,000 | 41,695 |
| 01/15/2028 | 5.000% | | 173,000 | 161,324 |
| TransMontaigne Partners LP/TLP Finance Corp. |
| 02/15/2026 | 6.125% | | 58,000 | 57,999 |
| Williams Companies, Inc. (The) |
| 01/15/2023 | 3.700% | | 50,000 | 48,357 |
| 06/24/2024 | 4.550% | | 161,000 | 160,466 |
| Total | 1,826,350 |
| Oil Field Services 0.3% |
| Diamond Offshore Drilling, Inc. |
| 08/15/2025 | 7.875% | | 35,000 | 35,934 |
| Nabors Industries, Inc.(a) |
| 02/01/2025 | 5.750% | | 147,000 | 139,734 |
The accompanying Notes to Financial Statements are an integral part of this statement.
Columbia Multi-Asset Income Fund | Annual Report 2018
| 15 |
Portfolio of Investments (continued)
April 30, 2018
| Corporate Bonds & Notes (continued) |
| Issuer | Coupon
Rate | | Principal
Amount ($) | Value ($) |
| Rowan Companies, Inc. |
| 01/15/2024 | 4.750% | | 41,000 | 35,157 |
| SESI LLC(a) |
| 09/15/2024 | 7.750% | | 74,000 | 76,805 |
| Transocean, Inc.(a) |
| 01/15/2026 | 7.500% | | 27,000 | 27,396 |
| U.S.A. Compression Partners LP/Finance Corp.(a) |
| 04/01/2026 | 6.875% | | 63,000 | 64,260 |
| Weatherford International LLC(a) |
| 03/01/2025 | 9.875% | | 9,000 | 8,570 |
| Weatherford International Ltd. |
| 06/15/2021 | 7.750% | | 44,000 | 43,562 |
| 06/15/2023 | 8.250% | | 12,000 | 11,311 |
| Total | 442,729 |
| Other Financial Institutions 0.0% |
| Icahn Enterprises LP/Finance Corp. |
| 02/01/2022 | 6.250% | | 33,000 | 33,757 |
| Other Industry 0.1% |
| KAR Auction Services, Inc.(a) |
| 06/01/2025 | 5.125% | | 74,000 | 72,235 |
| Other REIT 0.1% |
| CyrusOne LP/Finance Corp. |
| 03/15/2024 | 5.000% | | 42,000 | 42,177 |
| 03/15/2027 | 5.375% | | 103,000 | 103,139 |
| Total | 145,316 |
| Packaging 0.6% |
| Ardagh Packaging Finance PLC/Holdings U.S.A., Inc.(a) |
| 05/15/2023 | 4.625% | | 39,000 | 39,126 |
| 05/15/2024 | 7.250% | | 137,000 | 144,921 |
| 02/15/2025 | 6.000% | | 92,000 | 93,179 |
| Berry Global, Inc. |
| 05/15/2022 | 5.500% | | 30,000 | 30,810 |
| 10/15/2022 | 6.000% | | 57,000 | 59,309 |
| 07/15/2023 | 5.125% | | 116,000 | 116,999 |
| Crown Americas LLC/Capital Corp. VI(a) |
| 02/01/2026 | 4.750% | | 41,000 | 39,568 |
| Multi-Color Corp.(a) |
| 11/01/2025 | 4.875% | | 71,000 | 66,405 |
| Novolex (a) |
| 01/15/2025 | 6.875% | | 23,000 | 23,156 |
| Owens-Brockway Glass Container, Inc.(a) |
| 01/15/2025 | 5.375% | | 24,000 | 23,940 |
| Reynolds Group Issuer, Inc./LLC |
| 10/15/2020 | 5.750% | | 87,220 | 87,856 |
| 02/15/2021 | 6.875% | | 16,287 | 16,502 |
| Corporate Bonds & Notes (continued) |
| Issuer | Coupon
Rate | | Principal
Amount ($) | Value ($) |
| Reynolds Group Issuer, Inc./LLC(a) |
| 07/15/2024 | 7.000% | | 99,000 | 103,024 |
| Total | 844,795 |
| Pharmaceuticals 0.5% |
| Catalent Pharma Solutions, Inc.(a) |
| 01/15/2026 | 4.875% | | 45,000 | 43,782 |
| Jaguar Holding Co. II/Pharmaceutical Product Development LLC(a) |
| 08/01/2023 | 6.375% | | 120,000 | 122,115 |
| Valeant Pharmaceuticals International, Inc.(a) |
| 03/15/2024 | 7.000% | | 94,000 | 99,260 |
| 04/15/2025 | 6.125% | | 351,000 | 315,987 |
| 11/01/2025 | 5.500% | | 50,000 | 49,750 |
| 04/01/2026 | 9.250% | | 49,000 | 49,937 |
| Total | 680,831 |
| Property & Casualty 0.2% |
| HUB International Ltd.(a) |
| 10/01/2021 | 7.875% | | 205,000 | 213,670 |
| 05/01/2026 | 7.000% | | 70,000 | 70,078 |
| Total | 283,748 |
| Railroads 0.1% |
| BNSF Funding Trust I(d) |
| Junior Subordinated |
| 12/15/2055 | 6.613% | | 155,000 | 176,411 |
| Restaurants 0.3% |
| 1011778 BC ULC/New Red Finance, Inc.(a) |
| 05/15/2024 | 4.250% | | 138,000 | 131,928 |
| BC ULC/New Red Finance, Inc.(a) |
| 01/15/2022 | 4.625% | | 76,000 | 76,276 |
| IRB Holding Corp.(a) |
| 02/15/2026 | 6.750% | | 29,000 | 28,128 |
| KFC Holding Co./Pizza Hut Holdings LLC/Taco Bell of America LLC(a) |
| 06/01/2026 | 5.250% | | 125,000 | 125,625 |
| Total | 361,957 |
| Retailers 0.3% |
| Cencosud SA(a) |
| 02/12/2045 | 6.625% | | 200,000 | 212,853 |
| Hanesbrands, Inc.(a) |
| 05/15/2024 | 4.625% | | 27,000 | 26,188 |
| 05/15/2026 | 4.875% | | 27,000 | 26,047 |
| L Brands, Inc. |
| 11/01/2035 | 6.875% | | 126,000 | 119,529 |
| Penske Automotive Group, Inc. |
| 12/01/2024 | 5.375% | | 36,000 | 35,707 |
| Total | 420,324 |
The accompanying Notes to Financial Statements are an integral part of this statement.
| 16 | Columbia Multi-Asset Income Fund | Annual Report 2018 |
Portfolio of Investments (continued)
April 30, 2018
| Corporate Bonds & Notes (continued) |
| Issuer | Coupon
Rate | | Principal
Amount ($) | Value ($) |
| Technology 1.4% |
| Ascend Learning LLC(a) |
| 08/01/2025 | 6.875% | | 23,000 | 23,394 |
| Camelot Finance SA(a) |
| 10/15/2024 | 7.875% | | 66,000 | 68,758 |
| CDK Global, Inc. |
| 06/01/2027 | 4.875% | | 34,000 | 32,608 |
| Equinix, Inc. |
| 01/01/2022 | 5.375% | | 120,000 | 123,884 |
| 01/15/2026 | 5.875% | | 121,000 | 125,218 |
| 05/15/2027 | 5.375% | | 29,000 | 29,457 |
| First Data Corp.(a) |
| 08/15/2023 | 5.375% | | 60,000 | 61,018 |
| 12/01/2023 | 7.000% | | 129,000 | 135,008 |
| 01/15/2024 | 5.000% | | 48,000 | 48,355 |
| 01/15/2024 | 5.750% | | 183,000 | 185,543 |
| Gartner, Inc.(a) |
| 04/01/2025 | 5.125% | | 132,000 | 132,662 |
| Informatica LLC(a) |
| 07/15/2023 | 7.125% | | 52,000 | 52,089 |
| Iron Mountain, Inc.(a) |
| 09/15/2027 | 4.875% | | 46,000 | 43,060 |
| 03/15/2028 | 5.250% | | 59,000 | 55,512 |
| Microsemi Corp.(a) |
| 04/15/2023 | 9.125% | | 49,000 | 54,030 |
| MSCI, Inc.(a) |
| 11/15/2024 | 5.250% | | 70,000 | 71,747 |
| 08/15/2025 | 5.750% | | 35,000 | 36,546 |
| 08/01/2026 | 4.750% | | 37,000 | 36,724 |
| PTC, Inc. |
| 05/15/2024 | 6.000% | | 72,000 | 75,626 |
| Qualitytech LP/QTS Finance Corp.(a) |
| 11/15/2025 | 4.750% | | 90,000 | 84,771 |
| Sensata Technologies UK Financing Co. PLC(a) |
| 02/15/2026 | 6.250% | | 85,000 | 88,504 |
| Symantec Corp.(a) |
| 04/15/2025 | 5.000% | | 133,000 | 133,158 |
| Tempo Acquisition LLC/Finance Corp.(a) |
| 06/01/2025 | 6.750% | | 80,000 | 79,438 |
| VeriSign, Inc. |
| 05/01/2023 | 4.625% | | 104,000 | 104,225 |
| 07/15/2027 | 4.750% | | 55,000 | 52,815 |
| Total | 1,934,150 |
| Transportation Services 0.1% |
| Avis Budget Car Rental LLC/Finance, Inc.(a) |
| 03/15/2025 | 5.250% | | 101,000 | 96,688 |
| Corporate Bonds & Notes (continued) |
| Issuer | Coupon
Rate | | Principal
Amount ($) | Value ($) |
| Hertz Corp. (The)(a) |
| 06/01/2022 | 7.625% | | 70,000 | 71,329 |
| Total | 168,017 |
| Wireless 1.2% |
| Altice France SA(a) |
| 05/01/2026 | 7.375% | | 310,000 | 300,718 |
| SBA Communications Corp. |
| 09/01/2024 | 4.875% | | 281,000 | 270,547 |
| Sprint Communications, Inc.(a) |
| 03/01/2020 | 7.000% | | 158,000 | 166,928 |
| Sprint Corp. |
| 06/15/2024 | 7.125% | | 274,000 | 283,867 |
| 02/15/2025 | 7.625% | | 79,000 | 83,147 |
| 03/01/2026 | 7.625% | | 59,000 | 62,142 |
| T-Mobile U.S.A., Inc. |
| 03/01/2025 | 6.375% | | 87,000 | 91,174 |
| 01/15/2026 | 6.500% | | 145,000 | 154,242 |
| 02/01/2026 | 4.500% | | 50,000 | 48,104 |
| 02/01/2028 | 4.750% | | 62,000 | 59,711 |
| Wind Tre SpA(a) |
| 01/20/2026 | 5.000% | | 80,000 | 66,912 |
| Total | 1,587,492 |
| Wirelines 0.7% |
| CenturyLink, Inc. |
| 03/15/2022 | 5.800% | | 29,000 | 28,856 |
| 04/01/2025 | 5.625% | | 189,000 | 173,687 |
| Frontier Communications Corp. |
| 01/15/2023 | 7.125% | | 143,000 | 102,225 |
| Frontier Communications Corp.(a) |
| 04/01/2026 | 8.500% | | 42,000 | 40,759 |
| Level 3 Financing, Inc. |
| 08/15/2022 | 5.375% | | 100,000 | 100,391 |
| Liquid Telecommunications Financing PLC(a) |
| 07/13/2022 | 8.500% | | 200,000 | 211,020 |
| Telecom Italia Capital SA |
| 09/30/2034 | 6.000% | | 105,000 | 109,082 |
| Telecom Italia SpA(a) |
| 05/30/2024 | 5.303% | | 51,000 | 51,863 |
| Zayo Group LLC/Capital, Inc.(a) |
| 01/15/2027 | 5.750% | | 149,000 | 147,850 |
| Total | 965,733 |
Total Corporate Bonds & Notes
(Cost $28,925,496) | 28,666,844 |
The accompanying Notes to Financial Statements are an integral part of this statement.
Columbia Multi-Asset Income Fund | Annual Report 2018
| 17 |
Portfolio of Investments (continued)
April 30, 2018
| Equity-Linked Notes 19.7% |
| Issuer | Coupon
Rate | Shares | Value ($) |
| Citigroup Global Markets Holdings Inc.(a),(f) |
| (linked to a basket of common stocks) |
| 10/05/2018 | 15.360% | 44,920 | 4,428,813 |
| Credit Suisse AG(a),(f) |
| (linked to a basket of common stocks) |
| 08/06/2018 | 14.860% | 4,666 | 4,315,026 |
| Credit Suisse AG |
| (linked to common stock of Alaska Air Group, Inc.) |
| 05/11/2018 | 12.900% | 850 | 54,937 |
| (linked to common stock of Baker Hughes, a GE Company) |
| 05/11/2018 | 14.350% | 1,878 | 59,160 |
| Credit Suisse AG(a) |
| (linked to common stock of PG&E Corp.) |
| 07/27/2018 | 10.250% | 1,060 | 48,574 |
| Deutsche Bank AG(a),(f) |
| (linked to a basket of common stocks) |
| 05/04/2018 | 12.800% | 4,508 | 4,392,595 |
| HSBC Bank U.S.A. NA(a),(f) |
| (linked to a basket of common stocks) |
| 06/11/2018 | 14.130% | 5,196 | 4,793,570 |
| Morgan Stanley BV(a),(f) |
| (linked to a basket of common stocks) |
| 09/07/2018 | 14.860% | 4,536 | 4,333,689 |
| Societe Generale SA(a),(f) |
| (linked to a basket of common stocks) |
| 07/12/2018 | 13.700% | 4,618 | 4,273,356 |
Total Equity-Linked Notes
(Cost $28,172,645) | 26,699,720 |
| Exchange-Traded Funds 18.4% |
| | Shares | Value ($) |
| iShares US Preferred Stock ETF | 139,500 | 5,179,635 |
| PowerShares S&P 500 High Dividend Low Volatility Portfolio ETF | 116,091 | 4,596,043 |
| SPDR Blackstone/GSO Senior Loan ETF | 127,414 | 6,044,520 |
| SPDR Bloomberg Barclays Convertible Securities ETF | 120,725 | 6,210,094 |
| SPDR Portfolio Long Term Corporate Bond ETF | 108,002 | 2,860,433 |
Total Exchange-Traded Funds
(Cost $25,111,125) | 24,890,725 |
| Foreign Government Obligations(g),(h) 11.7% |
| Issuer | Coupon
Rate | | Principal
Amount ($) | Value ($) |
| Argentina 0.9% |
| Argentine Republic Government International Bond |
| 04/22/2021 | 6.875% | | 200,000 | 209,839 |
| Foreign Government Obligations(g),(h) (continued) |
| Issuer | Coupon
Rate | | Principal
Amount ($) | Value ($) |
| Autonomous City of Buenos Aires Argentina(a) |
| 06/01/2027 | 7.500% | | 250,000 | 258,824 |
| Provincia de Buenos Aires(a) |
| 03/16/2024 | 9.125% | | 295,000 | 327,594 |
| 06/15/2027 | 7.875% | | 200,000 | 203,600 |
| Provincia de Cordoba(a) |
| 06/10/2021 | 7.125% | | 150,000 | 157,135 |
| Total | 1,156,992 |
| Belarus 0.2% |
| Republic of Belarus International Bond(a) |
| 02/28/2030 | 6.200% | | 300,000 | 289,728 |
| Brazil 0.9% |
| Brazilian Government International Bond |
| 04/07/2026 | 6.000% | | 400,000 | 432,875 |
| 01/07/2041 | 5.625% | | 650,000 | 620,387 |
| Petrobras Global Finance BV(a) |
| 01/27/2025 | 5.299% | | 222,000 | 218,392 |
| Total | 1,271,654 |
| Canada 0.0% |
| NOVA Chemicals Corp.(a) |
| 06/01/2027 | 5.250% | | 10,000 | 9,621 |
| China 0.3% |
| State Grid Overseas Investment 2016 Ltd.(a) |
| 05/04/2027 | 3.500% | | 400,000 | 381,085 |
| Colombia 0.2% |
| Ecopetrol SA |
| 01/16/2025 | 4.125% | | 100,000 | 96,675 |
| 06/26/2026 | 5.375% | | 200,000 | 206,705 |
| Total | 303,380 |
| Costa Rica 0.1% |
| Costa Rica Government International Bond(a) |
| 03/12/2045 | 7.158% | | 200,000 | 203,259 |
| Croatia 0.3% |
| Hrvatska Elektroprivreda(a) |
| 10/23/2022 | 5.875% | | 400,000 | 426,370 |
| Dominican Republic 0.8% |
| Banco de Reservas de la Republica Dominicana(a) |
| Subordinated |
| 02/01/2023 | 7.000% | | 150,000 | 156,060 |
| 02/01/2023 | 7.000% | | 150,000 | 156,060 |
The accompanying Notes to Financial Statements are an integral part of this statement.
| 18 | Columbia Multi-Asset Income Fund | Annual Report 2018 |
Portfolio of Investments (continued)
April 30, 2018
| Foreign Government Obligations(g),(h) (continued) |
| Issuer | Coupon
Rate | | Principal
Amount ($) | Value ($) |
| Dominican Republic International Bond(a) |
| 01/29/2026 | 6.875% | | 400,000 | 432,895 |
| 04/20/2027 | 8.625% | | 300,000 | 351,615 |
| Total | 1,096,630 |
| Ecuador 0.1% |
| Ecuador Government International Bond(a) |
| 10/23/2027 | 8.875% | | 200,000 | 188,456 |
| Egypt 0.5% |
| Egypt Government International Bond(a) |
| 01/31/2022 | 6.125% | | 200,000 | 205,694 |
| 01/31/2027 | 7.500% | | 300,000 | 317,150 |
| 02/21/2048 | 7.903% | | 200,000 | 203,009 |
| Total | 725,853 |
| El Salvador 0.2% |
| El Salvador Government International Bond(a) |
| 01/18/2027 | 6.375% | | 320,000 | 317,288 |
| Gabon 0.1% |
| Gabon Government International Bond(a) |
| 12/12/2024 | 6.375% | | 200,000 | 195,226 |
| Ghana 0.2% |
| Ghana Government International Bond(a) |
| 10/14/2030 | 10.750% | | 200,000 | 258,947 |
| Honduras 0.3% |
| Honduras Government International Bond(a) |
| 03/15/2024 | 7.500% | | 200,000 | 218,285 |
| 01/19/2027 | 6.250% | | 200,000 | 207,962 |
| Total | 426,247 |
| Hungary 0.2% |
| MFB Magyar Fejlesztesi Bank Zrt.(a) |
| 10/21/2020 | 6.250% | | 200,000 | 213,084 |
| Indonesia 1.1% |
| PT Pertamina Persero(a) |
| 05/03/2022 | 4.875% | | 400,000 | 410,246 |
| 05/27/2041 | 6.500% | | 500,000 | 553,382 |
| PT Perusahaan Listrik Negara(a) |
| 11/22/2021 | 5.500% | | 500,000 | 523,364 |
| Total | 1,486,992 |
| Ivory Coast 0.5% |
| Ivory Coast Government International Bond(a) |
| 03/03/2028 | 6.375% | | 200,000 | 201,564 |
| 03/22/2030 | 5.250% | EUR | 200,000 | 244,839 |
| 06/15/2033 | 6.125% | | 200,000 | 189,533 |
| Total | 635,936 |
| Foreign Government Obligations(g),(h) (continued) |
| Issuer | Coupon
Rate | | Principal
Amount ($) | Value ($) |
| Kazakhstan 0.4% |
| Kazakhstan Government International Bond(a) |
| 07/21/2045 | 6.500% | | 200,000 | 239,299 |
| KazMunayGas National Co. JSC(a) |
| 07/02/2018 | 9.125% | | 100,000 | 100,842 |
| 04/24/2030 | 5.375% | | 200,000 | 199,732 |
| Total | 539,873 |
| Kenya 0.2% |
| Kenya Government International Bond(a) |
| 02/28/2028 | 7.250% | | 200,000 | 206,187 |
| Mexico 1.3% |
| Petroleos Mexicanos |
| 06/02/2041 | 6.500% | | 1,800,000 | 1,725,235 |
| Nigeria 0.2% |
| Nigeria Government International Bond(a) |
| 02/16/2032 | 7.875% | | 200,000 | 215,307 |
| Oman 0.2% |
| Oman Government International Bond(a) |
| 01/17/2028 | 5.625% | | 300,000 | 286,808 |
| Pakistan 0.2% |
| Pakistan Government International Bond(a) |
| 04/15/2024 | 8.250% | | 200,000 | 208,258 |
| Russian Federation 0.6% |
| Gazprom Neft OAO Via GPN Capital SA(a) |
| 09/19/2022 | 4.375% | | 200,000 | 196,537 |
| Gazprom OAO Via Gaz Capital SA(a) |
| 02/06/2028 | 4.950% | | 200,000 | 197,407 |
| Russian Foreign Bond - Eurobond(a) |
| 04/04/2022 | 4.500% | | 400,000 | 406,347 |
| Total | 800,291 |
| Senegal 0.2% |
| Senegal Government International Bond(a) |
| 07/30/2024 | 6.250% | | 200,000 | 205,565 |
| Serbia 0.1% |
| Serbia International Bond(a) |
| 12/03/2018 | 5.875% | | 200,000 | 202,813 |
| Switzerland 0.1% |
| Syngenta Finance NV(a) |
| 04/24/2028 | 5.182% | | 200,000 | 196,790 |
The accompanying Notes to Financial Statements are an integral part of this statement.
Columbia Multi-Asset Income Fund | Annual Report 2018
| 19 |
Portfolio of Investments (continued)
April 30, 2018
| Foreign Government Obligations(g),(h) (continued) |
| Issuer | Coupon
Rate | | Principal
Amount ($) | Value ($) |
| Trinidad and Tobago 0.3% |
| Petroleum Co. of Trinidad & Tobago Ltd.(a) |
| 08/14/2019 | 9.750% | | 250,000 | 263,291 |
| 08/14/2019 | 9.750% | | 100,000 | 105,317 |
| Total | 368,608 |
| Turkey 0.7% |
| Export Credit Bank of Turkey(a) |
| 09/23/2021 | 5.000% | | 300,000 | 295,944 |
| Turkey Government International Bond |
| 03/25/2027 | 6.000% | | 200,000 | 200,842 |
| 03/17/2036 | 6.875% | | 400,000 | 411,196 |
| Total | 907,982 |
| Venezuela 0.3% |
| Petroleos de Venezuela SA(a),(i) |
| 05/16/2024 | 0.000% | | 1,329,556 | 336,438 |
| 11/15/2026 | 0.000% | | 120,724 | 30,423 |
| Total | 366,861 |
Total Foreign Government Obligations
(Cost $16,185,107) | 15,817,326 |
| Limited Partnerships 0.0% |
| Issuer | Shares | Value ($) |
| Energy —% |
| Oil, Gas & Consumable Fuels —% |
| Energy Transfer Partners LP | 50 | 901 |
| Enterprise Products Partners LP | 50 | 1,342 |
| MPLX LP | 50 | 1,767 |
| Phillips 66 Partners LP | 50 | 2,479 |
| Total | | 6,489 |
| Total Energy | 6,489 |
Total Limited Partnerships
(Cost $6,067) | 6,489 |
| Residential Mortgage-Backed Securities - Agency 0.9% |
| Issuer | Coupon
Rate | | Principal
Amount ($) | Value ($) |
| Federal Home Loan Mortgage Corp.(b),(j) |
| CMO Series 326 Class S2 |
1-month USD LIBOR + 5.950%
03/15/2044 | 4.053% | | 2,192,393 | 364,231 |
| Federal Home Loan Mortgage Corp.(j) |
| CMO Series 4098 Class AI |
| 05/15/2039 | 3.500% | | 2,099,732 | 222,817 |
| Residential Mortgage-Backed Securities - Agency (continued) |
| Issuer | Coupon
Rate | | Principal
Amount ($) | Value ($) |
| CMO Series 4121 Class IA |
| 01/15/2041 | 3.500% | | 1,419,535 | 183,636 |
| Federal National Mortgage Association(j) |
| CMO Series 2012-121 Class GI |
| 08/25/2039 | 3.500% | | 277,621 | 37,602 |
| Federal National Mortgage Association(b),(j) |
| CMO Series 2013-101 Class CS |
1-month USD LIBOR + 5.900%
10/25/2043 | 4.003% | | 1,375,454 | 239,719 |
| Federal National Mortgage Association(c),(j) |
| CMO Series 2016-62 Class AS |
| 09/25/2046 | 1.464% | | 2,678,555 | 103,007 |
Total Residential Mortgage-Backed Securities - Agency
(Cost $1,455,664) | 1,151,012 |
|
| Residential Mortgage-Backed Securities - Non-Agency 6.0% |
| | | | |
| Angel Oak Mortgage Trust I LLC(a) |
| CMO Series 2016-1 Class A1 |
| 07/25/2046 | 3.500% | | 195,010 | 193,505 |
| Angel Oak Mortgage Trust I LLC(a),(c) |
| CMO Series 2017-2 Class M1 |
| 07/25/2047 | 3.737% | | 500,000 | 478,624 |
| Angel Oak Mortgage Trust LLC(a) |
| CMO Series 2015-1 |
| 11/25/2045 | 4.500% | | 34,263 | 34,306 |
| Bayview Opportunity Master Fund IVb Trust(a) |
| CMO Series 2017-NPL2 Class A1 |
| 10/28/2032 | 2.981% | | 321,053 | 321,008 |
| CAM Mortgage Trust(a) |
| CMO Series 2016-2 Class A1 |
| 06/15/2057 | 3.250% | | 70,048 | 70,066 |
| CIM Trust(a) |
| CMO Series 2017-8 Class A1 |
| 12/25/2065 | 3.000% | | 448,503 | 447,666 |
| Citigroup Mortgage Loan Trust, Inc.(a),(c) |
| CMO Series 2013-11 Class 3A3 |
| 09/25/2034 | 3.507% | | 177,382 | 177,966 |
| CMO Series 2014-C Class A |
| 02/25/2054 | 3.250% | | 752,150 | 736,492 |
| CMO Series 2015-A Class B3 |
| 06/25/2058 | 4.500% | | 233,248 | 222,484 |
| Citigroup Mortgage Loan Trust, Inc.(a),(j) |
| CMO Series 2015-A Class A1IO |
| 06/25/2058 | 1.000% | | 4,384,117 | 102,686 |
| COLT Mortgage Loan Trust(a) |
| CMO Series 2016-1 Class A2 |
| 05/25/2046 | 3.500% | | 136,347 | 136,936 |
The accompanying Notes to Financial Statements are an integral part of this statement.
| 20 | Columbia Multi-Asset Income Fund | Annual Report 2018 |
Portfolio of Investments (continued)
April 30, 2018
| Residential Mortgage-Backed Securities - Non-Agency (continued) |
| Issuer | Coupon
Rate | | Principal
Amount ($) | Value ($) |
| Credit Suisse Mortgage Capital Certificates(a) |
| CMO Series 2010-9R Class 1A5 |
| 08/27/2037 | 4.000% | | 154,906 | 156,145 |
| GCAT (a) |
| CMO Series 2017-1 Class A2 |
| 03/25/2047 | 3.375% | | 59,797 | 59,333 |
| GCAT LLC(a) |
| CMO Series 2017-3 Class A1 |
| 04/25/2047 | 3.352% | | 256,246 | 256,303 |
| Legacy Mortgage Asset Trust(a) |
| CMO Series 2017-GS1 Class A2 |
| 01/25/2057 | 3.500% | | 500,000 | 462,680 |
| NRZ Excess Spread-Collateralized Notes(a) |
| Series 2018-PLS1 Class D |
| 01/25/2023 | 4.374% | | 461,953 | 457,823 |
| Subordinated CMO Series 2018-PLS2 Class D |
| 02/25/2023 | 4.593% | | 236,014 | 234,618 |
| Oak Hill Advisors Residential Loan Trust(a) |
| CMO Series 2017-NPL1 Class A1 |
| 06/25/2057 | 3.000% | | 365,401 | 365,400 |
| Oaktown Re Ltd.(a),(b),(k) |
| CMO Series 2017-1A Class M1 |
1-month USD LIBOR + 2.250%
04/25/2027 | 4.147% | | 256,547 | 256,790 |
| PNMAC GMSR Issuer Trust(a),(b),(k) |
| CMO Series 2017-GT2 Class A |
1-month USD LIBOR + 4.000%
08/25/2023 | 5.897% | | 400,000 | 404,500 |
| PNMAC GMSR Issuer Trust(a),(b) |
| CMO Series 2018-GT1 Class A |
1-month USD LIBOR + 2.850%
02/25/2023 | 4.747% | | 200,000 | 201,248 |
| Preston Ridge Partners Mortgage LLC(a) |
| CMO Series 2017-2A Class A2 |
| 09/25/2022 | 5.000% | | 500,000 | 496,327 |
| Pretium Mortgage Credit Partners I(a) |
| CMO Series 2017-NPL2 Class A1 |
| 03/28/2057 | 3.250% | | 170,746 | 169,527 |
| Pretium Mortgage Credit Partners I LLC(a) |
| CMO Series 2018-NPL1 Class A1 |
| 01/27/2033 | 3.375% | | 235,320 | 234,243 |
| RBSSP Resecuritization Trust(a),(c) |
| CMO Series 2010-1 Class 3A2 |
| 08/26/2035 | 3.545% | | 240,460 | 245,936 |
| Sunset Mortgage Loan Co., LLC(a) |
| CMO Series 2017-NPL1 Class A |
| 06/15/2047 | 3.500% | | 77,287 | 77,332 |
| Verus Securitization Trust(a) |
| CMO Series 2017-SG1A Class A3 |
| 11/25/2047 | 2.825% | | 409,577 | 406,000 |
| Residential Mortgage-Backed Securities - Non-Agency (continued) |
| Issuer | Coupon
Rate | | Principal
Amount ($) | Value ($) |
| CMO Series 2018-1 Class A2 |
| 02/25/2048 | 3.031% | | 471,068 | 471,022 |
| Verus Securitization Trust(a),(c),(k) |
| CMO Series 2018-INV1 Class A1 |
| 03/25/2058 | 3.626% | | 250,000 | 250,000 |
Total Residential Mortgage-Backed Securities - Non-Agency
(Cost $8,162,760) | 8,126,966 |
|
| Senior Loans 0.1% |
| Borrower | Weighted
Average Coupon | | Principal
Amount ($) | Value ($) |
| Consumer Products 0.1% |
| Serta Simmons Bedding LLC(b),(l) |
| 2nd Lien Term Loan |
3-month USD LIBOR + 8.000%
11/08/2024 | 10.331% | | 90,615 | 71,812 |
| Property & Casualty 0.0% |
| Hub International Limited(b),(l),(m) |
| Term Loan |
3-month USD LIBOR + 3.000%
04/25/2025 | | | 22,000 | 22,128 |
| Technology 0.0% |
| Ascend Learning LLC(b),(l) |
| Term Loan |
3-month USD LIBOR + 3.000%
07/12/2024 | 4.901% | | 10,945 | 10,979 |
| Hyland Software, Inc.(b),(l) |
| Tranche 3 1st Lien Term Loan |
3-month USD LIBOR + 3.250%
07/01/2022 | 5.141% | | 15,339 | 15,464 |
| Misys Ltd.(b),(l) |
| 1st Lien Term Loan |
3-month USD LIBOR + 3.500%
06/13/2024 | 5.484% | | 34,500 | 34,465 |
| Total | 60,908 |
Total Senior Loans
(Cost $172,057) | 154,848 |
|
| U.S. Treasury Obligations 2.7% |
| Issuer | Coupon
Rate | | Principal
Amount ($) | Value ($) |
| U.S. Treasury |
| 02/15/2029 | 5.250% | | 109,000 | 132,162 |
| 02/15/2031 | 5.375% | | 24,000 | 30,163 |
| 02/15/2036 | 4.500% | | 57,000 | 69,006 |
| 02/15/2037 | 4.750% | | 33,000 | 41,385 |
| 02/15/2038 | 4.375% | | 30,000 | 36,143 |
| 02/15/2039 | 3.500% | | 236,000 | 253,830 |
The accompanying Notes to Financial Statements are an integral part of this statement.
Columbia Multi-Asset Income Fund | Annual Report 2018
| 21 |
Portfolio of Investments (continued)
April 30, 2018
| U.S. Treasury Obligations (continued) |
| Issuer | Coupon
Rate | | Principal
Amount ($) | Value ($) |
| 11/15/2039 | 4.375% | | 284,000 | 344,465 |
| 02/15/2041 | 4.750% | | 23,000 | 29,413 |
| 08/15/2042 | 2.750% | | 527,000 | 498,032 |
| 05/15/2043 | 2.875% | | 361,000 | 348,080 |
| 05/15/2044 | 3.375% | | 419,000 | 440,581 |
| 08/15/2044 | 3.125% | | 163,000 | 164,104 |
| 11/15/2044 | 3.000% | | 163,000 | 160,372 |
| 02/15/2045 | 2.500% | | 94,000 | 83,850 |
| 02/15/2046 | 2.500% | | 840,000 | 746,669 |
| 08/15/2046 | 2.250% | | 67,000 | 56,336 |
| 11/15/2046 | 2.875% | | 20,000 | 19,158 |
| 02/15/2047 | 3.000% | | 65,000 | 63,823 |
| 05/15/2047 | 3.000% | | 37,000 | 36,318 |
| 08/15/2047 | 2.750% | | 91,000 | 84,921 |
| 11/15/2047 | 2.750% | | 41,000 | 38,254 |
| 02/15/2048 | 3.000% | | 8,000 | 7,851 |
Total U.S. Treasury Obligations
(Cost $4,078,012) | 3,684,916 |
| Money Market Funds 3.5% |
| | Shares | Value ($) |
| Columbia Short-Term Cash Fund, 1.889%(n),(o) | 4,743,524 | 4,743,050 |
Total Money Market Funds
(Cost $4,743,131) | 4,743,050 |
Total Investments in Securities
(Cost: $135,666,044) | 133,249,201 |
| Other Assets & Liabilities, Net | | 2,042,625 |
| Net Assets | 135,291,826 |
At April 30, 2018, securities and/or cash totaling $817,927 were pledged as collateral.
Investments in derivatives
| Forward foreign currency exchange contracts |
Currency to
be sold | Currency to
be purchased | Counterparty | Settlement
date | Unrealized
appreciation ($) | Unrealized
depreciation ($) |
| 200,000 EUR | 248,461 USD | Credit Suisse | 06/07/2018 | 6,270 | — |
| Long futures contracts |
| Description | Number of
contracts | Expiration
date | Trading
currency | Notional
amount | Value/Unrealized
appreciation ($) | Value/Unrealized
depreciation ($) |
| S&P 500 E-mini | 109 | 06/2018 | USD | 14,426,150 | — | (773,353) |
| U.S. Treasury 10-Year Note | 65 | 06/2018 | USD | 7,818,117 | — | (34,090) |
| Total | | | | | — | (807,443) |
| Credit default swap contracts - buy protection |
Reference
entity | Counterparty | Maturity
date | Pay
fixed
rate
(%) | Payment
frequency | Notional
currency | Notional
amount | Value
($) | Periodic
payments
receivable
(payable)
($) | Upfront
payments
($) | Upfront
receipts
($) | Unrealized
appreciation
($) | Unrealized
depreciation
($) |
| Markit CDX Emerging Markets Index, Series 29 | Citi | 06/20/2023 | 1.000 | Quarterly | USD | 9,309,000 | 181,260 | (10,860) | 169,533 | — | 867 | — |
| Cleared credit default swap contracts - buy protection |
Reference
entity | Counterparty | Maturity
date | Pay
fixed
rate
(%) | Payment
frequency | Notional
currency | Notional
amount | Value
($) | Upfront
payments
($) | Upfront
receipts
($) | Unrealized
appreciation
($) | Unrealized
depreciation
($) |
| Markit CDX North America High Yield Index, Series 30 | Morgan Stanley | 06/20/2023 | 5.000 | Quarterly | USD | 4,025,000 | (60,033) | — | — | — | (60,033) |
The accompanying Notes to Financial Statements are an integral part of this statement.
| 22 | Columbia Multi-Asset Income Fund | Annual Report 2018 |
Portfolio of Investments (continued)
April 30, 2018
Notes to Portfolio of Investments
| (a) | Represents privately placed and other securities and instruments exempt from SEC registration (collectively, private placements), such as Section 4(a)(2) and Rule 144A eligible securities, which are often sold only to qualified institutional buyers. The Fund may invest in private placements determined to be liquid as well as those determined to be illiquid. Private placements may be determined to be liquid under guidelines established by the Fund’s Board of Trustees. At April 30, 2018, the value of these securities amounted to $69,047,124, which represents 51.04% of net assets. |
| (b) | Variable rate security. The interest rate shown was the current rate as of April 30, 2018. |
| (c) | Variable or floating rate security, the interest rate of which adjusts periodically based on changes in current interest rates and prepayments on the underlying pool of assets. The interest rate shown was the current rate as of April 30, 2018. |
| (d) | Represents a variable rate security with a step coupon where the rate adjusts according to a schedule for a series of periods, typically lower for an initial period and then increasing to a higher coupon rate thereafter. The interest rate shown was the current rate as of April 30, 2018. |
| (e) | Represents a security purchased on a when-issued basis. |
| (f) | By investing in the equity-linked note, the Fund gains exposure to the underlying investments that make up the custom basket without having to own the underlying investments directly. The components of the basket are available on the Columbia Multi-Asset Income Fund’s page of columbiathreadneedleus.com website. |
| (g) | Principal amounts are denominated in United States Dollars unless otherwise noted. |
| (h) | Principal and interest may not be guaranteed by the government. |
| (i) | Represents securities that have defaulted on payment of interest. The Fund has stopped accruing interest on these securities. At April 30, 2018, the value of these securities amounted to $366,861, which represents 0.27% of net assets. |
| (j) | Represents interest only securities which have the right to receive the monthly interest payments on an underlying pool of mortgage loans. |
| (k) | Valuation based on significant unobservable inputs. |
| (l) | Senior loans have interest rates that float periodically based primarily on the London Interbank Offered Rate (“LIBOR”) and other short-term rates. The interest rate shown reflects the weighted average coupon as of April 30, 2018. The interest rate for senior loans purchased on a when-issued or delayed delivery basis will be determined upon settlement therefore no weighted average coupon rate is disclosed. Remaining maturities of senior loans may be less than the stated maturities shown as a result of contractual or optional prepayments by the borrower. Such prepayments cannot be predicted. |
| (m) | Represents a security purchased on a forward commitment basis. |
| (n) | The rate shown is the seven-day current annualized yield at April 30, 2018. |
| (o) | As defined in the Investment Company Act of 1940, an affiliated company is one in which the Fund owns 5% or more of the company’s outstanding voting securities, or a company which is under common ownership or control with the Fund. Holdings and transactions in these affiliated companies during the year ended April 30, 2018 are as follows: |
| Issuer | Beginning
shares | Shares
purchased | Shares
sold | Ending
shares | Realized gain
(loss) —
affiliated
issuers ($) | Net change in
unrealized
appreciation
(depreciation) —
affiliated
issuers ($) | Dividends —
affiliated
issuers ($) | Value —
affiliated
issuers
at end of
period ($) |
| Columbia Short-Term Cash Fund, 1.889% |
| | 7,735,482 | 89,736,964 | (92,728,922) | 4,743,524 | (1,158) | (239) | 94,582 | 4,743,050 |
Abbreviation Legend
| ADR | American Depositary Receipt |
| CMO | Collateralized Mortgage Obligation |
| PIK | Payment In Kind |
Currency Legend
Fair value measurements
The Fund categorizes its fair value measurements according to a three-level hierarchy that maximizes the use of observable inputs and minimizes the use of unobservable inputs by prioritizing that the most observable input be used when available. Observable inputs are those that market participants would use in pricing an investment based on market data obtained from sources independent of the reporting entity. Unobservable inputs are those that reflect the Fund’s assumptions about the information market participants would use in pricing an investment. An investment’s level within the fair value hierarchy is based on the lowest level of any input that is deemed significant to the asset’s or liability’s fair value measurement. The input levels are not necessarily an indication of the risk or liquidity associated with investments at that level. For example, certain U.S. government securities are generally high quality and liquid, however, they are reflected as Level 2 because the inputs used to determine fair value may not always be quoted prices in an active market.
Fair value inputs are summarized in the three broad levels listed below:
The accompanying Notes to Financial Statements are an integral part of this statement.
Columbia Multi-Asset Income Fund | Annual Report 2018
| 23 |
Portfolio of Investments (continued)
April 30, 2018
Fair value measurements (continued)
| ■ | Level 1 — Valuations based on quoted prices for investments in active markets that the Fund has the ability to access at the measurement date. Valuation adjustments are not applied to Level 1 investments. |
| ■ | Level 2 — Valuations based on other significant observable inputs (including quoted prices for similar securities, interest rates, prepayment speeds, credit risks, etc.). |
| ■ | Level 3 — Valuations based on significant unobservable inputs (including the Fund’s own assumptions and judgment in determining the fair value of investments). |
Inputs that are used in determining fair value of an investment may include price information, credit data, volatility statistics, and other factors. These inputs can be either observable or unobservable. The availability of observable inputs can vary between investments, and is affected by various factors such as the type of investment, and the volume and level of activity for that investment or similar investments in the marketplace. The inputs will be considered by the Investment Manager, along with any other relevant factors in the calculation of an investment’s fair value. The Fund uses prices and inputs that are current as of the measurement date, which may include periods of market dislocations. During these periods, the availability of prices and inputs may be reduced for many investments. This condition could cause an investment to be reclassified between the various levels within the hierarchy.
Foreign equity securities actively traded in markets where there is a significant delay in the local close relative to the New York Stock Exchange are classified as Level 2. The values of these securities may include an adjustment to reflect the impact of significant market movements following the close of local trading, as described in Note 2 to the financial statements – Security valuation.
Certain investments that have been measured at fair value using the net asset value (NAV) per share (or its equivalent) are not categorized in the fair value hierarchy. The fair value amounts presented in the table are intended to reconcile the fair value hierarchy to the amounts presented in the Portfolio of Investments. The Columbia Short-Term Cash Fund seeks to provide shareholders with maximum current income consistent with liquidity and stability of principal. Columbia Short-Term Cash Fund prices its shares with a floating NAV and no longer seeks to maintain a stable NAV.
Investments falling into the Level 3 category are primarily supported by quoted prices from brokers and dealers participating in the market for those investments. However, these may be classified as Level 3 investments due to lack of market transparency and corroboration to support these quoted prices. Additionally, valuation models may be used as the pricing source for any remaining investments classified as Level 3. These models may rely on one or more significant unobservable inputs and/or significant assumptions by the Investment Manager. Inputs used in valuations may include, but are not limited to, financial statement analysis, capital account balances, discount rates and estimated cash flows, and comparable company data.
Under the direction of the Fund’s Board of Trustees (the Board), the Investment Manager’s Valuation Committee (the Committee) is responsible for overseeing the valuation procedures approved by the Board. The Committee consists of voting and non-voting members from various groups within the Investment Manager’s organization, including operations and accounting, trading and investments, compliance, risk management and legal.
The Committee meets at least monthly to review and approve valuation matters, which may include a description of specific valuation determinations, data regarding pricing information received from approved pricing vendors and brokers and the results of Board-approved valuation control policies and procedures (the Policies). The Policies address, among other things, instances when market quotations are or are not readily available, including recommendations of third party pricing vendors and a determination of appropriate pricing methodologies; events that require specific valuation determinations and assessment of fair value techniques; securities with a potential for stale pricing, including those that are illiquid, restricted, or in default; and the effectiveness of third party pricing vendors, including periodic reviews of vendors. The Committee meets more frequently, as needed, to discuss additional valuation matters, which may include the need to review back-testing results, review time-sensitive information or approve related valuation actions. The Committee reports to the Board, with members of the Committee meeting with the Board at each of its regularly scheduled meetings to discuss valuation matters and actions during the period, similar to those described earlier.
For investments categorized as Level 3, the Committee monitors information similar to that described above, which may include: (i) data specific to the issuer or comparable issuers, (ii) general market or specific sector news and (iii) quoted prices and specific or similar security transactions. The Committee considers this data and any changes from prior periods in order to assess the reasonableness of observable and unobservable inputs, any assumptions or internal models used to value those securities and changes in fair value. This data is also used to corroborate, when available, information received from approved pricing vendors and brokers. Various factors impact the frequency of monitoring this information (which may occur as often as daily). However, the Committee may determine that changes to inputs, assumptions and models are not required as a result of the monitoring procedures performed.
The following table is a summary of the inputs used to value the Fund’s investments at April 30, 2018:
| | Level 1
quoted prices
in active
markets for
identical
assets ($) | Level 2
other
significant
observable
inputs ($) | Level 3
significant
unobservable
inputs ($) | Investments
measured at
net asset
value ($) | Total ($) |
| Investments in Securities | | | | | |
| Asset-Backed Securities — Non-Agency | — | 4,545,065 | — | — | 4,545,065 |
| Commercial Mortgage-Backed Securities - Non-Agency | — | 1,388,321 | — | — | 1,388,321 |
| Common Stocks | | | | | |
| Consumer Discretionary | 686,785 | — | — | — | 686,785 |
| Consumer Staples | 975,638 | 124,800 | — | — | 1,100,438 |
| Energy | 1,492,683 | 564,595 | — | — | 2,057,278 |
| Financials | 823,888 | 42,014 | — | — | 865,902 |
| Health Care | 565,237 | — | — | — | 565,237 |
| Industrials | 278,971 | 174,237 | — | — | 453,208 |
| Information Technology | 1,148,066 | 95,800 | — | — | 1,243,866 |
| Materials | 348,092 | 90,908 | — | — | 439,000 |
| Real Estate | 4,165,061 | — | — | — | 4,165,061 |
The accompanying Notes to Financial Statements are an integral part of this statement.
| 24 | Columbia Multi-Asset Income Fund | Annual Report 2018 |
Portfolio of Investments (continued)
April 30, 2018
Fair value measurements (continued)
| | Level 1
quoted prices
in active
markets for
identical
assets ($) | Level 2
other
significant
observable
inputs ($) | Level 3
significant
unobservable
inputs ($) | Investments
measured at
net asset
value ($) | Total ($) |
| Telecommunication Services | 811,602 | 100,963 | — | — | 912,565 |
| Utilities | 632,330 | 90,163 | — | — | 722,493 |
| Total Common Stocks | 11,928,353 | 1,283,480 | — | — | 13,211,833 |
| Convertible Preferred Stocks | | | | | |
| Health Care | 78,334 | — | — | — | 78,334 |
| Utilities | 83,752 | — | — | — | 83,752 |
| Total Convertible Preferred Stocks | 162,086 | — | — | — | 162,086 |
| Corporate Bonds & Notes | — | 28,666,844 | — | — | 28,666,844 |
| Equity-Linked Notes | — | 26,699,720 | — | — | 26,699,720 |
| Exchange-Traded Funds | 24,890,725 | — | — | — | 24,890,725 |
| Foreign Government Obligations | — | 15,817,326 | — | — | 15,817,326 |
| Limited Partnerships | | | | | |
| Energy | 6,489 | — | — | — | 6,489 |
| Residential Mortgage-Backed Securities - Agency | — | 1,151,012 | — | — | 1,151,012 |
| Residential Mortgage-Backed Securities - Non-Agency | — | 7,215,676 | 911,290 | — | 8,126,966 |
| Senior Loans | — | 154,848 | — | — | 154,848 |
| U.S. Treasury Obligations | 3,684,916 | — | — | — | 3,684,916 |
| Money Market Funds | — | — | — | 4,743,050 | 4,743,050 |
| Total Investments in Securities | 40,672,569 | 86,922,292 | 911,290 | 4,743,050 | 133,249,201 |
| Investments in Derivatives | | | | | |
| Asset | | | | | |
| Forward Foreign Currency Exchange Contracts | — | 6,270 | — | — | 6,270 |
| Swap Contracts | — | 867 | — | — | 867 |
| Liability | | | | | |
| Futures Contracts | (807,443) | — | — | — | (807,443) |
| Swap Contracts | — | (60,033) | — | — | (60,033) |
| Total | 39,865,126 | 86,869,396 | 911,290 | 4,743,050 | 132,388,862 |
See the Portfolio of Investments for all investment classifications not indicated in the table.
The Fund’s assets assigned to the Level 2 input category are generally valued using the market approach, in which a security’s value is determined through reference to prices and information from market transactions for similar or identical assets. These assets include certain foreign securities for which a third party statistical pricing service may be employed for purposes of fair market valuation. The model utilized by such third party statistical pricing service takes into account a security’s correlation to available market data including, but not limited to, intraday index, ADR, and exchange-traded fund movements.
Derivative instruments are valued at unrealized appreciation (depreciation).
There were no transfers of financial assets between Levels 1 and 2 during the period.
Financial assets were transferred from Level 3 to Level 2 as observable market inputs were utilized and management determined that there was sufficient, reliable and observable market data to value these assets as of period end.
Transfers between levels are determined based on the fair value at the beginning of the period for security positions held throughout the period.
The following table(s) show(s) transfers between levels of the fair value hierarchy:
| Transfers In | Transfers Out |
| Level 2 ($) | Level 3 ($) | Level 2 ($) | Level 3 ($) |
| 245,294 | — | — | 245,294 |
The Fund does not hold any significant investments (greater than one percent of net assets) categorized as Level 3.
The Fund’s assets assigned to the Level 3 category are valued utilizing the valuation technique deemed the most appropriate in the circumstances. Certain residential mortgage backed securities classified as Level 3 securities are valued using the market approach and utilize single market quotations from broker dealers which may have included, but were not limited to, observable transactions for identical or similar assets in the market and the distressed nature of the security. The appropriateness of fair values for these securities is monitored on an ongoing basis which may include results of back testing, manual price reviews and other control procedures. Significant increases (decreases) to any of these inputs would result in a significantly lower (higher) fair value measurement.
The accompanying Notes to Financial Statements are an integral part of this statement.
Columbia Multi-Asset Income Fund | Annual Report 2018
| 25 |
Statement of Assets and Liabilities
April 30, 2018
| Assets | |
| Investments in securities, at value | |
| Unaffiliated issuers (cost $130,922,913) | $128,506,151 |
| Affiliated issuers (cost $4,743,131) | 4,743,050 |
| Margin deposits on: | |
| Futures contracts | 690,700 |
| Swap contracts | 127,227 |
| Unrealized appreciation on forward foreign currency exchange contracts | 6,270 |
| Unrealized appreciation on swap contracts | 867 |
| Upfront payments on swap contracts | 169,533 |
| Receivable for: | |
| Investments sold | 374,728 |
| Investments sold on a delayed delivery basis | 5,025 |
| Capital shares sold | 59,143 |
| Dividends | 29,079 |
| Interest | 1,061,087 |
| Foreign tax reclaims | 6,821 |
| Variation margin for futures contracts | 8,125 |
| Variation margin for swap contracts | 2,370 |
| Expense reimbursement due from Investment Manager | 3,363 |
| Prepaid expenses | 181 |
| Trustees’ deferred compensation plan | 13,477 |
| Total assets | 135,807,197 |
| Liabilities | |
| Due to custodian | 122,064 |
| Payable for: | |
| Investments purchased | 16,909 |
| Investments purchased on a delayed delivery basis | 148,729 |
| Capital shares purchased | 12,360 |
| Variation margin for futures contracts | 132,980 |
| Management services fees | 7,359 |
| Distribution and/or service fees | 109 |
| Transfer agent fees | 438 |
| Compensation of chief compliance officer | 5 |
| Audit fees | 39,864 |
| Other expenses | 21,077 |
| Trustees’ deferred compensation plan | 13,477 |
| Total liabilities | 515,371 |
| Net assets applicable to outstanding capital stock | $135,291,826 |
| Represented by | |
| Paid in capital | 140,753,523 |
| Undistributed net investment income | 1,666,790 |
| Accumulated net realized loss | (3,851,388) |
| Unrealized appreciation (depreciation) on: | |
| Investments - unaffiliated issuers | (2,416,762) |
| Investments - affiliated issuers | (81) |
| Foreign currency translations | 83 |
| Forward foreign currency exchange contracts | 6,270 |
| Futures contracts | (807,443) |
| Swap contracts | (59,166) |
| Total - representing net assets applicable to outstanding capital stock | $135,291,826 |
The accompanying Notes to Financial Statements are an integral part of this statement.
| 26 | Columbia Multi-Asset Income Fund | Annual Report 2018 |
Statement of Assets and Liabilities (continued)
April 30, 2018
| Class A | |
| Net assets | $1,395,296 |
| Shares outstanding | 146,198 |
| Net asset value per share | $9.54 |
| Maximum sales charge | 4.75% |
| Maximum offering price per share (calculated by dividing the net asset value per share by 1.0 minus the maximum sales charge for Class A shares) | $10.02 |
| Advisor Class | |
| Net assets | $361,722 |
| Shares outstanding | 37,902 |
| Net asset value per share | $9.54 |
| Class C | |
| Net assets | $1,018,730 |
| Shares outstanding | 106,732 |
| Net asset value per share | $9.54 |
| Institutional Class | |
| Net assets | $1,570,864 |
| Shares outstanding | 164,524 |
| Net asset value per share | $9.55 |
| Institutional 2 Class | |
| Net assets | $9,547 |
| Shares outstanding | 1,000 |
| Net asset value per share | $9.55 |
| Institutional 3 Class | |
| Net assets | $130,926,120 |
| Shares outstanding | 13,743,801 |
| Net asset value per share | $9.53 |
| Class T | |
| Net assets | $9,547 |
| Shares outstanding | 1,000 |
| Net asset value per share | $9.55 |
| Maximum sales charge | 2.50% |
| Maximum offering price per share (calculated by dividing the net asset value per share by 1.0 minus the maximum sales charge per transaction for Class T shares) | $9.79 |
The accompanying Notes to Financial Statements are an integral part of this statement.
Columbia Multi-Asset Income Fund | Annual Report 2018
| 27 |
Statement of Operations
Year Ended April 30, 2018
| Net investment income | |
| Income: | |
| Dividends — unaffiliated issuers | $1,535,486 |
| Dividends — affiliated issuers | 94,582 |
| Interest | 6,899,447 |
| Foreign taxes withheld | (6,689) |
| Total income | 8,522,826 |
| Expenses: | |
| Management services fees | 894,672 |
| Distribution and/or service fees | |
| Class A | 3,019 |
| Class C | 9,397 |
| Class T | 25 |
| Transfer agent fees | |
| Class A | 1,543 |
| Advisor Class | 382 |
| Class C | 1,197 |
| Institutional Class | 1,874 |
| Institutional 2 Class | 9 |
| Institutional 3 Class | 11,354 |
| Class T | 13 |
| Compensation of board members | 18,270 |
| Custodian fees | 61,535 |
| Printing and postage fees | 11,060 |
| Registration fees | 103,032 |
| Audit fees | 46,559 |
| Legal fees | 3,421 |
| Compensation of chief compliance officer | 55 |
| Other | 28,757 |
| Total expenses | 1,196,174 |
| Fees waived or expenses reimbursed by Investment Manager and its affiliates | (388,054) |
| Total net expenses | 808,120 |
| Net investment income | 7,714,706 |
| Realized and unrealized gain (loss) — net | |
| Net realized gain (loss) on: | |
| Investments — unaffiliated issuers | (2,060,191) |
| Investments — affiliated issuers | (1,158) |
| Foreign currency translations | (446) |
| Forward foreign currency exchange contracts | (178) |
| Futures contracts | 2,415,402 |
| Swap contracts | (255,600) |
| Net realized gain | 97,829 |
| Net change in unrealized appreciation (depreciation) on: | |
| Investments — unaffiliated issuers | (3,387,722) |
| Investments — affiliated issuers | (239) |
| Foreign currency translations | 46 |
| Forward foreign currency exchange contracts | 6,270 |
| Futures contracts | (969,495) |
| Swap contracts | (14,880) |
| Net change in unrealized appreciation (depreciation) | (4,366,020) |
| Net realized and unrealized loss | (4,268,191) |
| Net increase in net assets resulting from operations | $3,446,515 |
The accompanying Notes to Financial Statements are an integral part of this statement.
| 28 | Columbia Multi-Asset Income Fund | Annual Report 2018 |
Statement of Changes in Net Assets
| | Year Ended
April 30, 2018 | Year Ended
April 30, 2017 (a) |
| Operations | | |
| Net investment income | $7,714,706 | $6,978,668 |
| Net realized gain (loss) | 97,829 | (11,918) |
| Net change in unrealized appreciation (depreciation) | (4,366,020) | 2,956,072 |
| Net increase in net assets resulting from operations | 3,446,515 | 9,922,822 |
| Distributions to shareholders | | |
| Net investment income | | |
| Class A | (57,443) | (22,265) |
| Advisor Class | (14,947) | (1,074) |
| Class C | (37,663) | (11,782) |
| Class I | — | (5,513,329) |
| Institutional Class | (72,821) | (32,785) |
| Institutional 2 Class | (600) | (577) |
| Institutional 3 Class | (6,637,057) | (542,196) |
| Class T | (463) | (469) |
| Total distributions to shareholders | (6,820,994) | (6,124,477) |
| Increase in net assets from capital stock activity | 8,077,665 | 33,791,213 |
| Total increase in net assets | 4,703,186 | 37,589,558 |
| Net assets at beginning of year | 130,588,640 | 92,999,082 |
| Net assets at end of year | $135,291,826 | $130,588,640 |
| Undistributed net investment income | $1,666,790 | $1,236,410 |
| (a) | Institutional 3 Class shares are based on operations from March 1, 2017 (commencement of operations) through the stated period end. |
The accompanying Notes to Financial Statements are an integral part of this statement.
Columbia Multi-Asset Income Fund | Annual Report 2018
| 29 |
Statement of Changes in Net Assets (continued)
| | Year Ended | Year Ended |
| | April 30, 2018 | April 30, 2017 (a) |
| | Shares | Dollars ($) | Shares | Dollars ($) |
| Capital stock activity |
| Class A | | | | |
| Subscriptions | 80,602 | 790,736 | 102,135 | 986,637 |
| Distributions reinvested | 5,813 | 56,747 | 2,263 | 21,796 |
| Redemptions | (21,968) | (216,153) | (37,248) | (359,017) |
| Net increase | 64,447 | 631,330 | 67,150 | 649,416 |
| Advisor Class | | | | |
| Subscriptions | 26,344 | 258,014 | 15,273 | 148,536 |
| Distributions reinvested | 1,481 | 14,459 | 60 | 580 |
| Redemptions | (6,256) | (60,557) | — | — |
| Net increase | 21,569 | 211,916 | 15,333 | 149,116 |
| Class C | | | | |
| Subscriptions | 55,099 | 538,383 | 62,581 | 604,966 |
| Distributions reinvested | 3,741 | 36,547 | 1,159 | 11,200 |
| Redemptions | (20,395) | (199,398) | (6,199) | (58,594) |
| Net increase | 38,445 | 375,532 | 57,541 | 557,572 |
| Class I | | | | |
| Subscriptions | — | — | 2,612,739 | 25,332,376 |
| Distributions reinvested | — | — | 574,056 | 5,512,867 |
| Redemptions | — | — | (12,983,391) | (125,392,271) |
| Net decrease | — | — | (9,796,596) | (94,547,028) |
| Institutional Class | | | | |
| Subscriptions | 24,168 | 235,373 | 110,740 | 1,068,041 |
| Distributions reinvested | 6,893 | 67,322 | 3,301 | 31,870 |
| Redemptions | (7,872) | (77,162) | (5,873) | (55,602) |
| Net increase | 23,189 | 225,533 | 108,168 | 1,044,309 |
| Institutional 2 Class | | | | |
| Subscriptions | — | — | 311 | 3,000 |
| Distributions reinvested | 11 | 109 | 8 | 78 |
| Redemptions | (330) | (3,304) | — | — |
| Net increase (decrease) | (319) | (3,195) | 319 | 3,078 |
| Institutional 3 Class | | | | |
| Subscriptions | — | — | 13,007,521 | 125,392,639 |
| Distributions reinvested | 680,793 | 6,636,549 | 55,487 | 542,111 |
| Net increase | 680,793 | 6,636,549 | 13,063,008 | 125,934,750 |
| Total net increase | 828,124 | 8,077,665 | 3,514,923 | 33,791,213 |
| (a) | Institutional 3 Class shares are based on operations from March 1, 2017 (commencement of operations) through the stated period end. |
The accompanying Notes to Financial Statements are an integral part of this statement.
| 30 | Columbia Multi-Asset Income Fund | Annual Report 2018 |
[THIS PAGE INTENTIONALLY LEFT BLANK]
Columbia Multi-Asset Income Fund | Annual Report 2018
| 31 |
The following table is intended to help you understand the Fund’s financial performance. Certain information reflects financial results for a single share of a class held for the periods shown. Per share net investment income (loss) amounts are calculated based on average shares outstanding during the period. Total return assumes reinvestment of all dividends and distributions, if any. Total return does not reflect payment of sales charges, if any. Total return and portfolio turnover are not annualized for periods of less than one year. The portfolio turnover rate is calculated without regard to purchase and sales transactions of short-term instruments and certain derivatives, if any. If such transactions were included, the Fund’s portfolio turnover rate may be higher.
| | Net asset value,
beginning of
period | Net
investment
income | Net
realized
and
unrealized
gain (loss) | Total from
investment
operations | Distributions
from net
investment
income |
| Class A |
| Year Ended 4/30/2018 | $9.78 | 0.53 | (0.31) | 0.22 | (0.46) |
| Year Ended 4/30/2017 | $9.43 | 0.56 | 0.26 | 0.82 | (0.47) |
| Year Ended 4/30/2016 | $10.05 | 0.57 | (0.65) | (0.08) | (0.54) |
| Year Ended 4/30/2015(c) | $10.00 | 0.03 | 0.04 | 0.07 | (0.02) |
| Advisor Class |
| Year Ended 4/30/2018 | $9.78 | 0.56 | (0.31) | 0.25 | (0.49) |
| Year Ended 4/30/2017 | $9.43 | 0.61 | 0.23 | 0.84 | (0.49) |
| Year Ended 4/30/2016 | $10.05 | 0.56 | (0.62) | (0.06) | (0.56) |
| Year Ended 4/30/2015(e) | $10.00 | 0.03 | 0.04 | 0.07 | (0.02) |
| Class C |
| Year Ended 4/30/2018 | $9.78 | 0.46 | (0.31) | 0.15 | (0.39) |
| Year Ended 4/30/2017 | $9.43 | 0.49 | 0.26 | 0.75 | (0.40) |
| Year Ended 4/30/2016 | $10.05 | 0.48 | (0.63) | (0.15) | (0.47) |
| Year Ended 4/30/2015(f) | $10.00 | 0.02 | 0.04 | 0.06 | (0.01) |
| Institutional Class |
| Year Ended 4/30/2018 | $9.79 | 0.55 | (0.30) | 0.25 | (0.49) |
| Year Ended 4/30/2017 | $9.43 | 0.59 | 0.26 | 0.85 | (0.49) |
| Year Ended 4/30/2016 | $10.06 | 0.56 | (0.63) | (0.07) | (0.56) |
| Year Ended 4/30/2015(g) | $10.00 | 0.03 | 0.05 | 0.08 | (0.02) |
| Institutional 2 Class |
| Year Ended 4/30/2018 | $9.78 | 0.55 | (0.29) | 0.26 | (0.49) |
| Year Ended 4/30/2017 | $9.43 | 0.57 | 0.28 | 0.85 | (0.50) |
| Year Ended 4/30/2016 | $10.05 | 0.57 | (0.63) | (0.06) | (0.56) |
| Year Ended 4/30/2015(h) | $10.00 | 0.03 | 0.04 | 0.07 | (0.02) |
| Institutional 3 Class |
| Year Ended 4/30/2018 | $9.76 | 0.56 | (0.29) | 0.27 | (0.50) |
| Year Ended 4/30/2017(i) | $9.78 | 0.11 | (0.05) (j) | 0.06 | (0.08) |
The accompanying Notes to Financial Statements are an integral part of this statement.
| 32 | Columbia Multi-Asset Income Fund | Annual Report 2018 |
Total
distributions to
shareholders | Net
asset
value,
end of
period | Total
return | Total gross
expense
ratio to
average
net assets(a) | Total net
expense
ratio to
average
net assets(a),(b) | Net investment
income
ratio to
average
net assets | Portfolio
turnover | Net
assets,
end of
period
(000’s) |
| |
| (0.46) | $9.54 | 2.27% | 1.24% | 0.93% | 5.41% | 76% | $1,395 |
| (0.47) | $9.78 | 8.88% | 1.27% | 0.94% | 5.83% | 69% | $800 |
| (0.54) | $9.43 | (0.62%) | 1.34% | 0.91% | 6.15% | 70% | $138 |
| (0.02) | $10.05 | 0.69% | 1.24% (d) | 0.75% (d) | 2.70% (d) | 30% | $10 |
| |
| (0.49) | $9.54 | 2.53% | 0.99% | 0.68% | 5.74% | 76% | $362 |
| (0.49) | $9.78 | 9.17% | 1.05% | 0.69% | 6.57% | 69% | $160 |
| (0.56) | $9.43 | (0.36%) | 1.10% | 0.64% | 5.99% | 70% | $9 |
| (0.02) | $10.05 | 0.71% | 0.99% (d) | 0.50% (d) | 3.00% (d) | 30% | $10 |
| |
| (0.39) | $9.54 | 1.51% | 1.99% | 1.68% | 4.63% | 76% | $1,019 |
| (0.40) | $9.78 | 8.07% | 2.02% | 1.69% | 5.10% | 69% | $668 |
| (0.47) | $9.43 | (1.37%) | 2.12% | 1.65% | 5.24% | 70% | $101 |
| (0.01) | $10.05 | 0.61% | 1.99% (d) | 1.50% (d) | 2.00% (d) | 30% | $10 |
| |
| (0.49) | $9.55 | 2.53% | 0.99% | 0.68% | 5.63% | 76% | $1,571 |
| (0.49) | $9.79 | 9.27% | 1.03% | 0.69% | 6.24% | 69% | $1,383 |
| (0.56) | $9.43 | (0.47%) | 1.11% | 0.65% | 5.99% | 70% | $313 |
| (0.02) | $10.06 | 0.82% | 0.99% (d) | 0.50% (d) | 3.61% (d) | 30% | $315 |
| |
| (0.49) | $9.55 | 2.68% | 0.93% | 0.64% | 5.60% | 76% | $10 |
| (0.50) | $9.78 | 9.22% | 0.93% | 0.64% | 5.99% | 69% | $13 |
| (0.56) | $9.43 | (0.34%) | 1.06% | 0.60% | 6.03% | 70% | $9 |
| (0.02) | $10.05 | 0.73% | 0.97% (d) | 0.47% (d) | 3.02% (d) | 30% | $10 |
| |
| (0.50) | $9.53 | 2.73% | 0.87% | 0.58% | 5.70% | 76% | $130,926 |
| (0.08) | $9.76 | 0.66% | 0.93% (d) | 0.60% (d) | 7.22% (d) | 69% | $127,555 |
Columbia Multi-Asset Income Fund | Annual Report 2018
| 33 |
Financial Highlights (continued)
| | Net asset value,
beginning of
period | Net
investment
income | Net
realized
and
unrealized
gain (loss) | Total from
investment
operations | Distributions
from net
investment
income |
| Class T |
| Year Ended 4/30/2018 | $9.78 | 0.53 | (0.30) | 0.23 | (0.46) |
| Year Ended 4/30/2017 | $9.43 | 0.54 | 0.28 | 0.82 | (0.47) |
| Year Ended 4/30/2016 | $10.05 | 0.54 | (0.62) | (0.08) | (0.54) |
| Year Ended 4/30/2015(k) | $10.00 | 0.03 | 0.04 | 0.07 | (0.02) |
| Notes to Financial Highlights |
| (a) | In addition to the fees and expenses that the Fund bears directly, the Fund indirectly bears a pro rata share of the fees and expenses of any other funds in which it invests. Such indirect expenses are not included in the Fund’s reported expense ratios. |
| (b) | Total net expenses include the impact of certain fee waivers/expense reimbursements made by the Investment Manager and certain of its affiliates, if applicable. |
| (c) | Class A shares commenced operations on March 27, 2015. Per share data and total return reflect activity from that date. |
| (d) | Annualized. |
| (e) | Advisor Class shares commenced operations on March 27, 2015. Per share data and total return reflect activity from that date. |
| (f) | Class C shares commenced operations on March 27, 2015. Per share data and total return reflect activity from that date. |
| (g) | Institutional Class shares commenced operations on March 27, 2015. Per share data and total return reflect activity from that date. |
| (h) | Institutional 2 Class shares commenced operations on March 27, 2015. Per share data and total return reflect activity from that date. |
| (i) | Institutional 3 Class shares commenced operations on March 1, 2017. Per share data and total return reflect activity from that date. |
| (j) | Calculation of the net gain (loss) per share (both realized and unrealized) does not correlate to the aggregate realized and unrealized gain (loss) presented in the Statement of Operations due to the timing of subscriptions and redemptions of Fund shares in relation to fluctuations in the market value of the portfolio. |
| (k) | Class T shares commenced operations on March 27, 2015. Per share data and total return reflect activity from that date. |
The accompanying Notes to Financial Statements are an integral part of this statement.
| 34 | Columbia Multi-Asset Income Fund | Annual Report 2018 |
Total
distributions to
shareholders | Net
asset
value,
end of
period | Total
return | Total gross
expense
ratio to
average
net assets(a) | Total net
expense
ratio to
average
net assets(a),(b) | Net investment
income
ratio to
average
net assets | Portfolio
turnover | Net
assets,
end of
period
(000’s) |
| |
| (0.46) | $9.55 | 2.38% | 1.24% | 0.93% | 5.36% | 76% | $10 |
| (0.47) | $9.78 | 8.89% | 1.27% | 0.94% | 5.63% | 69% | $10 |
| (0.54) | $9.43 | (0.62%) | 1.35% | 0.89% | 5.75% | 70% | $9 |
| (0.02) | $10.05 | 0.69% | 1.24% (d) | 0.75% (d) | 2.75% (d) | 30% | $10 |
Columbia Multi-Asset Income Fund | Annual Report 2018
| 35 |
Notes to Financial Statements
April 30, 2018
Note 1. Organization
Columbia Multi-Asset Income Fund (the Fund), a series of Columbia Funds Series Trust I (the Trust), is a diversified fund. The Trust is registered under the Investment Company Act of 1940, as amended (the 1940 Act), as an open-end management investment company organized as a Massachusetts business trust.
Fund shares
The Trust may issue an unlimited number of shares (without par value). Although all share classes generally have identical voting, dividend and liquidation rights, each share class votes separately when required by the Trust’s organizational documents or by law. Different share classes pay different distribution amounts to the extent the expenses of such share classes differ, and distributions in liquidation will be proportional to the net asset value of each share class. Each share class has its own expense and sales charge structure. The Fund offers each of the share classes identified below.
Class A shares are subject to a maximum front-end sales charge of 4.75% based on the initial investment amount. Class A shares purchased without an initial sales charge in accounts aggregating $1 million to $50 million at the time of purchase are subject to a contingent deferred sales charge (CDSC) if the shares are sold within 18 months after purchase, charged as follows: 1.00% CDSC if redeemed within 12 months after purchase, and 0.50% CDSC if redeemed more than 12, but less than 18, months after purchase.
Advisor Class shares are not subject to sales charges and are generally available only to omnibus retirement plans and certain investors as described in the Fund’s prospectus. Prior to November 1, 2017, Advisor Class shares were known as Class R4 shares.
Class C shares are subject to a 1.00% CDSC on shares redeemed within 12 months after purchase.
Institutional Class shares are not subject to sales charges and are generally available only to eligible investors, which are subject to different investment minimums as described in the Fund’s prospectus. Prior to November 1, 2017, Institutional Class shares were known as Class Z shares.
Institutional 2 Class shares are not subject to sales charges and are generally available only to investors purchasing through authorized investment professionals and omnibus retirement plans as described in the Fund’s prospectus. Prior to November 1, 2017, Institutional 2 Class shares were known as Class R5 shares.
Institutional 3 Class shares are not subject to sales charges and are available to institutional and certain other investors as described in the Fund’s prospectus. Institutional 3 Class shares commenced operations on March 1, 2017. Prior to November 1, 2017, Institutional 3 Class shares were known as Class Y shares.
Class T shares are subject to a maximum front-end sales charge of 2.50% per transaction and must be purchased through financial intermediaries that, by written agreement with Columbia Management Investment Distributors, Inc., are specifically authorized to sell Class T shares.
Note 2. Summary of significant accounting policies
Basis of preparation
The Fund is an investment company that applies the accounting and reporting guidance in the Financial Accounting Standards Board (FASB) Accounting Standards Codification Topic 946, Financial Services - Investment Companies (ASC 946). The financial statements are prepared in accordance with U.S. generally accepted accounting principles (GAAP), which requires management to make certain estimates and assumptions that affect the reported amounts of assets and liabilities, the disclosure of contingent assets and liabilities at the date of the financial statements and the reported amounts of income and expenses during the reporting period. Actual results could differ from those estimates.
The following is a summary of significant accounting policies followed by the Fund in the preparation of its financial statements.
| 36 | Columbia Multi-Asset Income Fund | Annual Report 2018 |
Notes to Financial Statements (continued)
April 30, 2018
Security valuation
All equity securities and exchange-traded funds are valued at the close of business of the New York Stock Exchange. Equity securities and exchange-traded funds are valued at the last quoted sales price on the principal exchange or market on which they trade, except for securities traded on the NASDAQ Stock Market, which are valued at the NASDAQ official close price. Unlisted securities or listed securities for which there were no sales during the day are valued at the mean of the latest quoted bid and ask prices on such exchanges or markets.
Debt securities generally are valued by pricing services approved by the Board of Trustees based upon market transactions for normal, institutional-size trading units of similar securities. The services may use various pricing techniques that take into account, as applicable, factors such as yield, quality, coupon rate, maturity, type of issue, trading characteristics and other data, as well as approved independent broker-dealer quotes. Debt securities for which quotations are not readily available or not believed to be reflective of market value may also be valued based upon a bid quote from an approved independent broker-dealer. Debt securities maturing in 60 days or less are valued primarily at amortized cost value, unless this method results in a valuation that management believes does not approximate market value.
Asset- and mortgage-backed securities are generally valued by pricing services, which utilize pricing models that incorporate the securities’ cash flow and loan performance data. These models also take into account available market data, including trades, market quotations, and benchmark yield curves for identical or similar securities. Factors used to identify similar securities may include, but are not limited to, issuer, collateral type, vintage, prepayment speeds, collateral performance, credit ratings, credit enhancement and expected life. Asset-backed securities for which quotations are readily available may also be valued based upon an over-the-counter or exchange bid quote from an approved independent broker-dealer.
Senior loan securities for which reliable market quotations are readily available are generally valued by pricing services at the average of the bids received.
Foreign equity securities are valued based on the closing price on the foreign exchange in which such securities are primarily traded. If any foreign equity security closing prices are not readily available, the securities are valued at the mean of the latest quoted bid and ask prices on such exchanges or markets. Foreign currency exchange rates are generally determined at 4:00 p.m. Eastern (U.S.) time. Many securities markets and exchanges outside the U.S. close prior to the close of the New York Stock Exchange; therefore, the closing prices for securities in such markets or on such exchanges may not fully reflect events that occur after such close but before the close of the New York Stock Exchange. In those situations, foreign securities will be fair valued pursuant to a policy adopted by the Board of Trustees, including, if available, utilizing a third party pricing service to determine these fair values. The third party pricing service takes into account multiple factors, including, but not limited to, movements in the U.S. securities markets, certain depositary receipts, futures contracts and foreign exchange rates that have occurred subsequent to the close of the foreign exchange or market, to determine a good faith estimate that reasonably reflects the current market conditions as of the close of the New York Stock Exchange. The fair value of a security is likely to be different from the quoted or published price, if available.
Investments in open-end investment companies, including money market funds, are valued at their latest net asset value.
Forward foreign currency exchange contracts are marked-to-market based upon foreign currency exchange rates provided by a pricing service.
Futures and options on futures contracts are valued based upon the settlement price at the close of regular trading on their principal exchanges or, in the absence of transactions, at the mean of the latest quoted bid and ask prices.
Swap transactions are valued through an independent pricing service or broker, or if neither is available, through an internal model based upon observable inputs.
Investments for which market quotations are not readily available, or that have quotations which management believes are not reflective of market value or reliable, are valued at fair value as determined in good faith under procedures approved by and under the general supervision of the Board of Trustees. If a security or class of securities (such as foreign securities) is valued at fair value, such value is likely to be different from the quoted or published price for the security.
Columbia Multi-Asset Income Fund | Annual Report 2018
| 37 |
Notes to Financial Statements (continued)
April 30, 2018
The determination of fair value often requires significant judgment. To determine fair value, management may use assumptions including but not limited to future cash flows and estimated risk premiums. Multiple inputs from various sources may be used to determine fair value.
GAAP requires disclosure regarding the inputs and valuation techniques used to measure fair value and any changes in valuation inputs or techniques. In addition, investments shall be disclosed by major category. This information is disclosed following the Fund’s Portfolio of Investments.
Foreign currency transactions and translations
The values of all assets and liabilities denominated in foreign currencies are generally translated into U.S. dollars at exchange rates determined at the close of regular trading on the New York Stock Exchange. Net realized and unrealized gains (losses) on foreign currency transactions and translations include gains (losses) arising from the fluctuation in exchange rates between trade and settlement dates on securities transactions, gains (losses) arising from the disposition of foreign currency and currency gains (losses) between the accrual and payment dates on dividends, interest income and foreign withholding taxes.
For financial statement purposes, the Fund does not distinguish that portion of gains (losses) on investments which is due to changes in foreign exchange rates from that which is due to changes in market prices of the investments. Such fluctuations are included with the net realized and unrealized gains (losses) on investments in the Statement of Operations.
Derivative instruments
The Fund invests in certain derivative instruments, as detailed below, to meet its investment objectives. Derivatives are instruments whose values depend on, or are derived from, in whole or in part, the value of one or more securities, currencies, commodities, indices, or other assets or instruments. Derivatives may be used to increase investment flexibility (including to maintain cash reserves while maintaining desired exposure to certain assets), for risk management (hedging) purposes, to facilitate trading, to reduce transaction costs and to pursue higher investment returns. The Fund may also use derivative instruments to mitigate certain investment risks, such as foreign currency exchange rate risk, interest rate risk and credit risk. Derivatives may involve various risks, including the potential inability of the counterparty to fulfill its obligations under the terms of the contract, the potential for an illiquid secondary market (making it difficult for the Fund to sell or terminate, including at favorable prices) and the potential for market movements which may expose the Fund to gains or losses in excess of the amount shown in the Statement of Assets and Liabilities. The notional amounts of derivative instruments, if applicable, are not recorded in the financial statements.
A derivative instrument may suffer a marked-to-market loss if the value of the contract decreases due to an unfavorable change in the market rates or values of the underlying instrument. Losses can also occur if the counterparty does not perform its obligations under the contract. The Fund’s risk of loss from counterparty credit risk on over-the-counter derivatives is generally limited to the aggregate unrealized gain netted against any collateral held by the Fund and the amount of any variation margin held by the counterparty, plus any replacement costs or related amounts. With exchange-traded or centrally cleared derivatives, there is reduced counterparty credit risk to the Fund since the clearinghouse or central counterparty (CCP) provides some protection in the case of clearing member default. The clearinghouse or CCP stands between the buyer and the seller of the contract; therefore, additional counterparty credit risk is failure of the clearinghouse or CCP. However, credit risk still exists in exchange-traded or centrally cleared derivatives with respect to initial and variation margin that is held in a broker’s customer account. While brokers are required to segregate customer margin from their own assets, in the event that a broker becomes insolvent or goes into bankruptcy and at that time there is a shortfall in the aggregate amount of margin held by the broker for all its clients, U.S. bankruptcy laws will typically allocate that shortfall on a pro-rata basis across all the broker’s customers (including the Fund), potentially resulting in losses to the Fund.
In order to better define its contractual rights and to secure rights that will help the Fund mitigate its counterparty risk, the Fund may enter into an International Swaps and Derivatives Association, Inc. Master Agreement (ISDA Master Agreement) or similar agreement with its derivatives contract counterparties. An ISDA Master Agreement is an agreement between the Fund and a counterparty that governs over-the-counter derivatives and typically contains, among other things, collateral posting terms and netting provisions in the event of a default and/or termination event. Under an ISDA Master Agreement, the Fund may, under certain circumstances, offset with the counterparty certain derivative instrument’s payables and/or receivables
| 38 | Columbia Multi-Asset Income Fund | Annual Report 2018 |
Notes to Financial Statements (continued)
April 30, 2018
with collateral held and/or posted and create one single net payment. The provisions of the ISDA Master Agreement typically permit a single net payment in the event of default (close-out netting), including the bankruptcy or insolvency of the counterparty. Note, however, that bankruptcy or insolvency laws of a particular jurisdiction may impose restrictions on or prohibitions against the right of offset or netting in bankruptcy, insolvency or other events.
Collateral (margin) requirements differ by type of derivative. Margin requirements are established by the clearinghouse or CCP for exchange-traded and centrally cleared derivatives. Brokers can ask for margin in excess of the minimum in certain circumstances. Collateral terms are contract specific for over-the-counter derivatives. For over-the-counter derivatives traded under an ISDA Master Agreement, the collateral requirements are typically calculated by netting the marked-to-market amount for each transaction under such agreement and comparing that amount to the value of any variation margin currently pledged by the Fund and/or the counterparty. Generally, the amount of collateral due from or to a party has to exceed a minimum transfer amount threshold (e.g., $250,000) before a transfer has to be made. To the extent amounts due to the Fund from its counterparties are not fully collateralized, contractually or otherwise, the Fund bears the risk of loss from counterparty nonperformance. The Fund may also pay interest expense on cash collateral received from the broker. Any interest expense paid by the Fund is shown on the Statement of Operations. The Fund attempts to mitigate counterparty risk by only entering into agreements with counterparties that it believes have the financial resources to honor their obligations and by monitoring the financial stability of those counterparties.
Certain ISDA Master Agreements allow counterparties of over-the-counter derivatives transactions to terminate derivatives contracts prior to maturity in the event the Fund’s net asset value declines by a stated percentage over a specified time period or if the Fund fails to meet certain terms of the ISDA Master Agreement, which would cause the Fund to accelerate payment of any net liability owed to the counterparty. The Fund also has termination rights if the counterparty fails to meet certain terms of the ISDA Master Agreement. In addition to considering counterparty credit risk, the Fund would consider terminating the derivatives contracts based on whether termination would result in a net liability owed from the counterparty.
For financial reporting purposes, the Fund does not offset derivative assets and derivative liabilities that are subject to netting arrangements in the Statement of Assets and Liabilities.
Forward foreign currency exchange contracts
Forward foreign currency exchange contracts are over-the-counter agreements between two parties to buy and sell a currency at a set price on a future date. The Fund utilized forward foreign currency exchange contracts to hedge the currency exposure associated with some or all of the Fund’s securities and to shift foreign currency exposure back to U.S. dollars. These instruments may be used for other purposes in future periods.
The values of forward foreign currency exchange contracts fluctuate daily with changes in foreign currency exchange rates. Changes in the value of these contracts are recorded as unrealized appreciation or depreciation until the contract is exercised or has expired. The Fund will realize a gain or loss when the forward foreign currency exchange contract is closed or expires.
The use of forward foreign currency exchange contracts does not eliminate fluctuations in the prices of the Fund’s portfolio securities. The risks of forward foreign currency exchange contracts include movement in the values of the foreign currencies relative to the U.S. dollar (or other foreign currencies) and the possibility that counterparties will not complete their contractual obligations, which may be in excess of the amount reflected, if any, in the Statement of Assets and Liabilities.
Futures contracts
Futures contracts are exchange-traded and represent commitments for the future purchase or sale of an asset at a specified price on a specified date. The Fund bought and sold futures contracts to produce incremental earnings, to manage the duration and yield curve exposure of the Fund versus the benchmark, to manage exposure to movements in interest rates and to manage exposure to the securities market. These instruments may be used for other purposes in future periods. Upon entering into futures contracts, the Fund bears risks that it may not achieve the anticipated benefits of the futures contracts and may realize a loss. Additional risks include counterparty credit risk, the possibility of an illiquid market, and that a change in the value of the contract or option may not correlate with changes in the value of the underlying asset.
Columbia Multi-Asset Income Fund | Annual Report 2018
| 39 |
Notes to Financial Statements (continued)
April 30, 2018
Upon entering into a futures contract, the Fund deposits cash or securities with the broker, known as a futures commission merchant (FCM), in an amount sufficient to meet the initial margin requirement. The initial margin deposit must be maintained at an established level over the life of the contract. Cash deposited as initial margin is recorded in the Statement of Assets and Liabilities as margin deposits. Securities deposited as initial margin are designated in the Portfolio of Investments. Subsequent payments (variation margin) are made or received by the Fund each day. The variation margin payments are equal to the daily change in the contract value and are recorded as variation margin receivable or payable and are offset in unrealized gains or losses. The Fund recognizes a realized gain or loss when the contract is closed or expires. Futures contracts involve, to varying degrees, risk of loss in excess of the variation margin disclosed in the Statement of Assets and Liabilities.
Swap contracts
Swap contracts are negotiated in the over-the-counter market and may be entered into as a bilateral contract or centrally cleared (centrally cleared swap contract). In a centrally cleared swap contract, immediately following execution of the swap contract with a broker, the swap contract is novated to a central counterparty (the CCP) and the CCP becomes the Fund’s counterparty to the centrally cleared swap contract. The Fund is required to deposit initial margin with the futures commission merchant (FCM), which pledges it through to the CCP in the form of cash or securities in an amount that varies depending on the size and risk profile of the particular swap contract. Securities deposited as initial margin are designated in the Portfolio of Investments and cash deposited is recorded in the Statement of Assets and Liabilities as margin deposits. Unlike a bilateral swap contract, for centrally cleared swap contracts, the Fund has minimal credit exposure to the FCM because the CCP stands between the Fund and the relevant buyer/seller on the other side of the contract. Swap contracts are marked-to-market daily and changes in value are recorded as unrealized appreciation (depreciation). The daily change in valuation of centrally cleared swap contracts, if any, is recorded as a receivable or payable for variation margin in the Statement of Assets and Liabilities.
Entering into these contracts involves, to varying degrees, elements of interest, liquidity and counterparty credit risk in excess of the amounts recognized in the Statement of Assets and Liabilities. Such risks involve the possibility that there may be unfavorable changes in interest rates, market conditions or other conditions, that it may be difficult to initiate a swap transaction or liquidate a position at an advantageous time or price which may result in significant losses, and that the FCM or CCP may not fulfill its obligation under the contract.
Credit default swap contracts
The Fund entered into credit default swap contracts to increase or decrease its credit exposure to a specific debt security or a basket of debt securities as a protection buyer to reduce overall credit exposure. These instruments may be used for other purposes in future periods. Credit default swap contracts are agreements in which one party pays fixed periodic payments to a counterparty in consideration for an agreement from the counterparty to make a specific payment should a specified credit event(s) take place. Although specified credit events are contract specific, credit events are generally defined as bankruptcy, failure to pay, restructuring, obligation acceleration, obligation default, or repudiation/moratorium.
As the purchaser of a credit default swap contract, the Fund purchases protection by paying a periodic interest rate on the notional amount to the counterparty. The interest amount is accrued daily as a component of unrealized appreciation (depreciation) and is recorded as a realized loss upon payment. If a credit event as specified in the contract occurs, the Fund may have the option either to deliver the reference obligation to the seller in exchange for a cash payment of its par amount, or to receive a net cash settlement equal to the par amount less an agreed-upon value of the reference obligation as of the date of the credit event. The difference between the value of the obligation or cash delivered and the notional amount received will be recorded as a realized gain (loss).
Any upfront payments or receipts by the Fund upon entering into a credit default swap contract is recorded as an asset or liability, respectively, and amortized daily as a component of realized gain (loss) in the Statement of Operations. Credit default swap contracts are valued daily, and the change in value is recorded as unrealized appreciation (depreciation) until the termination of the swap, at which time a realized gain (loss) is recorded.
| 40 | Columbia Multi-Asset Income Fund | Annual Report 2018 |
Notes to Financial Statements (continued)
April 30, 2018
Credit default swap contracts can involve greater risks than if a fund had invested in the reference obligation directly since, in addition to general market risks, credit default swaps are subject to counterparty credit risk, leverage risk, hedging risk, correlation risk and liquidity risk.
Effects of derivative transactions in the financial statements
The following tables are intended to provide additional information about the effect of derivatives on the financial statements of the Fund, including: the fair value of derivatives by risk category and the location of those fair values in the Statement of Assets and Liabilities; and the impact of derivative transactions over the period in the Statement of Operations, including realized and unrealized gains (losses). The derivative instrument schedules following the Portfolio of Investments present additional information regarding derivative instruments outstanding at the end of the period, if any.
The following table is a summary of the fair value of derivative instruments (not considered to be hedging instruments for accounting disclosure purposes) at April 30, 2018:
| | Asset derivatives | |
Risk exposure
category | Statement
of assets and liabilities
location | Fair value ($) |
| Credit risk | Net assets — unrealized appreciation on swap contracts | 867* |
| Credit risk | Upfront payments on swap contracts | 169,533 |
| Foreign exchange risk | Unrealized appreciation on forward foreign currency exchange contracts | 6,270 |
| Total | | 176,670 |
| | Liability derivatives | |
Risk exposure
category | Statement
of assets and liabilities
location | Fair value ($) |
| Credit risk | Net assets — unrealized depreciation on swap contracts | 60,033* |
| Equity risk | Net assets — unrealized depreciation on futures contracts | 773,353* |
| Interest rate risk | Net assets — unrealized depreciation on futures contracts | 34,090* |
| Total | | 867,476 |
| * | Includes cumulative appreciation (depreciation) as reported in the tables following the Portfolio of Investments. Only the current day’s variation margin is reported in receivables or payables in the Statement of Assets and Liabilities. |
Columbia Multi-Asset Income Fund | Annual Report 2018
| 41 |
Notes to Financial Statements (continued)
April 30, 2018
The following table indicates the effect of derivative instruments (not considered to be hedging instruments for accounting disclosure purposes) in the Statement of Operations for the year ended April 30, 2018:
| Amount of realized gain (loss) on derivatives recognized in income |
| Risk exposure category | Forward
foreign
currency
exchange
contracts
($) | Futures
contracts
($) | Swap
contracts
($) | Total
($) |
| Credit risk | — | — | (255,600) | (255,600) |
| Equity risk | — | 2,349,050 | — | 2,349,050 |
| Foreign exchange risk | (178) | — | — | (178) |
| Interest rate risk | — | 66,352 | — | 66,352 |
| Total | (178) | 2,415,402 | (255,600) | 2,159,624 |
| |
| Change in unrealized appreciation (depreciation) on derivatives recognized in income |
| Risk exposure category | Forward
foreign
currency
exchange
contracts
($) | Futures
contracts
($) | Swap
contracts
($) | Total
($) |
| Credit risk | — | — | (14,880) | (14,880) |
| Equity risk | — | (830,827) | — | (830,827) |
| Foreign exchange risk | 6,270 | — | — | 6,270 |
| Interest rate risk | — | (138,668) | — | (138,668) |
| Total | 6,270 | (969,495) | (14,880) | (978,105) |
The following table is a summary of the average outstanding volume by derivative instrument for the year ended April 30, 2018:
| Derivative instrument | Average notional
amounts ($)* |
| Futures contracts — long | 21,864,734 |
| Credit default swap contracts — buy protection | 7,856,625 |
| Derivative instrument | Average unrealized
appreciation ($)* | Average unrealized
depreciation ($)* |
| Forward foreign currency exchange contracts | 1,568 | — |
| * | Based on the ending quarterly outstanding amounts for the year ended April 30, 2018. |
Investments in senior loans
The Fund may invest in senior loan assignments. When the Fund purchases an assignment of a senior loan, the Fund typically has direct rights against the borrower; provided, however, that the Fund’s rights may be more limited than the lender from which it acquired the assignment and the Fund may be able to enforce its rights only through an administrative agent. Although certain senior loan assignments are secured by collateral, the Fund could experience delays or limitations in realizing such collateral or have its interest subordinated to other indebtedness of the obligor. In the event that the administrator or collateral agent of a loan becomes insolvent or enters into receivership or bankruptcy, the Fund may incur costs and delays in realizing payment or may suffer a loss of principal and/or interest. The risk of loss is greater for unsecured or subordinated loans. In addition, senior loan assignments are vulnerable to market, economic or other conditions or events that may reduce the demand for senior loan assignments and certain senior loan assignments which were liquid when purchased, may become illiquid.
| 42 | Columbia Multi-Asset Income Fund | Annual Report 2018 |
Notes to Financial Statements (continued)
April 30, 2018
The Fund may enter into senior loan assignments where all or a portion of the loan may be unfunded. The Fund is obligated to fund these commitments at the borrower’s discretion. These commitments, if any, are generally traded and priced in the same manner as other senior loan securities and are disclosed as unfunded senior loan commitments in the Fund’s Portfolio of Investments with a corresponding payable for investments purchased. The Fund designates cash or liquid securities to cover these commitments.
Asset- and mortgage-backed securities
The Fund may invest in asset-backed and mortgage-backed securities. The maturity dates shown represent the original maturity of the underlying obligation. Actual maturity may vary based upon prepayment activity on these obligations. All, or a portion, of the obligation may be prepaid at any time because the underlying asset may be prepaid. As a result, decreasing market interest rates could result in an increased level of prepayment. An increased prepayment rate will have the effect of shortening the maturity of the security. Unless otherwise noted, the coupon rates presented are fixed rates.
Delayed delivery securities
The Fund may trade securities on other than normal settlement terms, including securities purchased or sold on a “when-issued” or "forward commitment" basis. This may increase risk to the Fund since the other party to the transaction may fail to deliver, which could cause the Fund to subsequently invest at less advantageous prices. The Fund designates cash or liquid securities in an amount equal to the delayed delivery commitment.
Equity-linked notes
The Fund may invest in equity-linked notes (ELNs). An ELN is a debt instrument, generally valued based on a quotation received from a counterparty, which is based on the value of a single equity security, basket of equity securities or an index of equity securities (each, an Underlying Equity). An ELN typically provides interest income, thereby offering a yield advantage over investing directly in an Underlying Equity. However, the holder of an ELN may have limited or no benefit from any appreciation in the Underlying Equity, but is exposed to various risks, including, without limitation, volatility, issuer and market risk. The Fund may purchase ELNs that trade on a securities exchange or those that trade on the over-the-counter markets, including securities offered and sold under Rule 144A of the Securities Act of 1933, as amended. The Fund may also purchase an ELN in a privately negotiated transaction with the issuer of the ELN (or its broker-dealer affiliate).
Interest only and principal only securities
The Fund may invest in Interest Only (IO) or Principal Only (PO) securities. IOs are stripped securities entitled to receive all of the security’s interest, but none of its principal. IOs are particularly sensitive to changes in interest rates and therefore subject to greater fluctuations in price than typical interest bearing debt securities. IOs are also subject to credit risk because the Fund may not receive all or part of the interest payments if the issuer, obligor, guarantor or counterparty defaults on its obligation. Payments received for IOs are included in interest income on the Statement of Operations. Because no principal will be received at the maturity of an IO, adjustments are made to the cost of the security on a monthly basis until maturity. These adjustments are included in interest income on the Statement of Operations. POs are stripped securities entitled to receive the principal from the underlying obligation, but not the interest. POs are particularly sensitive to changes in interest rates and therefore are subject to fluctuations in price. POs are also subject to credit risk because the Fund may not receive all or part of its principal if the issuer, obligor, guarantor or counterparty defaults on its obligation. The Fund may also invest in IO or PO stripped mortgage-backed securities. Payments received for POs are treated as reductions to the cost and par value of the securities.
Columbia Multi-Asset Income Fund | Annual Report 2018
| 43 |
Notes to Financial Statements (continued)
April 30, 2018
Offsetting of assets and liabilities
The following table presents the Fund’s gross and net amount of assets and liabilities available for offset under netting arrangements as well as any related collateral received or pledged by the Fund as of April 30, 2018:
| | Citi ($) | Credit
Suisse ($) | Morgan
Stanley ($) | Total ($) |
| Assets | | | | |
| Centrally cleared credit default swap contracts (a) | - | - | 2,370 | 2,370 |
| Forward foreign currency exchange contracts | - | 6,270 | - | 6,270 |
| OTC credit default swap contracts (b) | 170,400 | - | - | 170,400 |
| Total financial and derivative net assets | 170,400 | 6,270 | 2,370 | 179,040 |
| Total collateral received (pledged) (c) | - | - | - | - |
| Net amount (d) | 170,400 | 6,270 | 2,370 | 179,040 |
| (a) | Centrally cleared swaps are included within payable/receivable for variation margin on the Statement of Assets and Liabilities. |
| (b) | Over-the-Counter (OTC) swap contracts are presented at market value plus periodic payments receivable (payable), which is comprised of unrealized appreciation, unrealized depreciation, upfront payments and upfront receipts. |
| (c) | In some instances, the actual collateral received and/or pledged may be more than the amount shown due to overcollateralization. |
| (d) | Represents the net amount due from/(to) counterparties in the event of default. |
Security transactions
Security transactions are accounted for on the trade date. Cost is determined and gains (losses) are based upon the specific identification method for both financial statement and federal income tax purposes.
The trade date for senior loans purchased in the primary market is the date on which the loan is allocated. The trade date for senior loans purchased in the secondary market is the date on which the transaction is entered into.
Income recognition
Interest income is recorded on an accrual basis. Market premiums and discounts, including original issue discounts, are amortized and accreted, respectively, over the expected life of the security on all debt securities, unless otherwise noted. The Fund classifies gains and losses realized on prepayments received on mortgage-backed securities as adjustments to interest income.
The Fund may place a debt security on non-accrual status and reduce related interest income when it becomes probable that the interest will not be collected and the amount of uncollectible interest can be reasonably estimated. A defaulted debt security is removed from non-accrual status when the issuer resumes interest payments or when collectibility of interest is reasonably assured.
Corporate actions and dividend income are generally recorded net of any non-reclaimable tax withholdings, on the ex-dividend date or upon receipt of ex-dividend notification in the case of certain foreign securities.
The Fund may receive distributions from holdings in equity securities, business development companies (BDCs), exchange-traded funds (ETFs), limited partnerships (LPs), other regulated investment companies (RICs), and real estate investment trusts (REITs), which report information on the tax character of their distributions annually. These distributions are allocated to dividend income, capital gain and return of capital based on actual information reported. Return of capital is recorded as a reduction of the cost basis of securities held. If the Fund no longer owns the applicable securities, return of capital is recorded as a realized gain. With respect to REITs, to the extent actual information has not yet been reported, estimates for return of capital are made by the Fund’s management. Management’s estimates are subsequently adjusted when the actual character of the distributions is disclosed by the REITs, which could result in a proportionate change in return of capital to shareholders.
Awards from class action litigation are recorded as a reduction of cost basis if the Fund still owns the applicable securities on the payment date. If the Fund no longer owns the applicable securities, the proceeds are recorded as realized gains.
| 44 | Columbia Multi-Asset Income Fund | Annual Report 2018 |
Notes to Financial Statements (continued)
April 30, 2018
The value of additional securities received as an income payment through a payment in kind, if any, is recorded as interest income and increases the cost basis of such securities.
The Fund may receive other income from senior loans, including amendment fees, consent fees and commitment fees. These fees are recorded as income when received by the Fund. These amounts are included in Interest Income in the Statement of Operations.
Expenses
General expenses of the Trust are allocated to the Fund and other funds of the Trust based upon relative net assets or other expense allocation methodologies determined by the nature of the expense. Expenses directly attributable to the Fund are charged to the Fund. Expenses directly attributable to a specific class of shares are charged to that share class.
Determination of class net asset value
All income, expenses (other than class-specific expenses, which are charged to that share class, as shown in the Statement of Operations) and realized and unrealized gains (losses) are allocated to each class of the Fund on a daily basis, based on the relative net assets of each class, for purposes of determining the net asset value of each class.
Federal income tax status
The Fund intends to qualify each year as a regulated investment company under Subchapter M of the Internal Revenue Code, as amended, and will distribute substantially all of its investment company taxable income and net capital gain, if any, for its tax year, and as such will not be subject to federal income taxes. In addition, the Fund intends to distribute in each calendar year substantially all of its ordinary income, capital gain net income and certain other amounts, if any, such that the Fund should not be subject to federal excise tax. Therefore, no federal income or excise tax provision is recorded.
Foreign taxes
The Fund may be subject to foreign taxes on income, gains on investments or currency repatriation, a portion of which may be recoverable. The Fund will accrue such taxes and recoveries, as applicable, based upon its current interpretation of tax rules and regulations that exist in the markets in which it invests.
Realized gains in certain countries may be subject to foreign taxes at the Fund level, based on statutory rates. The Fund accrues for such foreign taxes on realized and unrealized gains at the appropriate rate for each jurisdiction, as applicable. The amount, if any, is disclosed as a liability on the Statement of Assets and Liabilities.
Distributions to shareholders
Distributions from net investment income, if any, are declared and paid monthly. Net realized capital gains, if any, are distributed at least annually. Income distributions and capital gain distributions are determined in accordance with federal income tax regulations, which may differ from GAAP.
Guarantees and indemnifications
Under the Trust’s organizational documents and, in some cases, by contract, its officers and trustees are indemnified against certain liabilities arising out of the performance of their duties to the Trust or its funds. In addition, certain of the Fund’s contracts with its service providers contain general indemnification clauses. The Fund’s maximum exposure under these arrangements is unknown since the amount of any future claims that may be made against the Fund cannot be determined, and the Fund has no historical basis for predicting the likelihood of any such claims.
Recent accounting pronouncement
Accounting Standards Update 2017-08 Premium Amortization on Purchased Callable Debt Securities
In March 2017, the Financial Accounting Standards Board issued Accounting Standards Update (ASU) No. 2017-08 Premium Amortization on Purchased Callable Debt Securities. ASU No. 2017-08 updates the accounting standards to shorten the amortization period for certain purchased callable debt securities, held at a premium, to be amortized to the earliest call date. The update applies to securities with explicit, noncontingent call features that are callable at fixed prices and on preset
Columbia Multi-Asset Income Fund | Annual Report 2018
| 45 |
Notes to Financial Statements (continued)
April 30, 2018
dates. The standard is effective for annual periods beginning after December 15, 2018 and interim periods within those fiscal years. At this time, management is evaluating the implication of this guidance and the impact it will have on the financial statement amounts and footnote disclosures, if any.
Note 3. Fees and other transactions with affiliates
Management services fees
The Fund has entered into a Management Agreement with Columbia Management Investment Advisers, LLC (the Investment Manager), a wholly-owned subsidiary of Ameriprise Financial, Inc. (Ameriprise Financial). Under the Management Agreement, the Investment Manager provides the Fund with investment research and advice, as well as administrative and accounting services. The management services fee is an annual fee that is equal to a percentage of the Fund’s daily net assets that declines from 0.66% to 0.51% as the Fund’s net assets increase. The effective management services fee rate for the year ended April 30, 2018 was 0.66% of the Fund’s average daily net assets.
Subadvisory agreement
The Fund’s Board of Trustees has approved a subadvisory agreement between the Investment Manager and Threadneedle International Limited (Threadneedle), an affiliate of the Investment Manager and an indirect wholly-owned subsidiary of Ameriprise Financial. As of April 30, 2018, Threadneedle is not providing services to the Fund pursuant to the subadvisory agreement.
Compensation of board members
Members of the Board of Trustees who are not officers or employees of the Investment Manager or Ameriprise Financial are compensated for their services to the Fund as disclosed in the Statement of Operations. These members of the Board of Trustees may participate in a Deferred Compensation Plan (the Plan) which may be terminated at any time. Obligations of the Plan will be paid solely out of the Fund’s assets, and all amounts payable under the Plan constitute a general unsecured obligation of the Fund.
Compensation of Chief Compliance Officer
The Board of Trustees has appointed a Chief Compliance Officer to the Fund in accordance with federal securities regulations. As disclosed in the Statement of Operations, a portion of the Chief Compliance Officer’s total compensation is allocated to the Fund, along with other allocations to affiliated funds governed by the Board of Trustees, based on relative net assets.
Transfer agency fees
Under a Transfer and Dividend Disbursing Agent Agreement, Columbia Management Investment Services Corp. (the Transfer Agent), an affiliate of the Investment Manager and a wholly-owned subsidiary of Ameriprise Financial, is responsible for providing transfer agency services to the Fund. The Transfer Agent has contracted with DST Asset Manager Solutions, Inc. (DST) to serve as sub-transfer agent. The Transfer Agent pays the fees of DST for services as sub-transfer agent and DST is not entitled to reimbursement for such fees from the Fund (with the exception of out-of-pocket fees).
The Fund pays the Transfer Agent a monthly transfer agency fee based on the number or the average value of accounts, depending on the type of account. In addition, the Fund pays the Transfer Agent a fee for shareholder services based on the number of accounts or on a percentage of the average aggregate value of the Fund’s shares maintained in omnibus accounts up to the lesser of the amount charged by the financial intermediary or a cap established by the Board of Trustees from time to time.
The Transfer Agent also receives compensation from the Fund for various shareholder services and reimbursements for certain out-of-pocket fees. Effective August 1, 2017, total transfer agency fees for Institutional 2 Class and Institutional 3 Class shares are subject to an annual limitation of not more than 0.07% and 0.02%, respectively, of the average daily net assets attributable to each share class. Prior to August 1, 2017, these limitations were 0.075% for Institutional 2 Class shares and 0.025% for Institutional 3 Class shares.
| 46 | Columbia Multi-Asset Income Fund | Annual Report 2018 |
Notes to Financial Statements (continued)
April 30, 2018
For the year ended April 30, 2018, the Fund’s effective transfer agency fee rates as a percentage of average daily net assets of each class were as follows:
| | Effective rate (%) |
| Class A | 0.13 |
| Advisor Class | 0.13 |
| Class C | 0.13 |
| Institutional Class | 0.13 |
| Institutional 2 Class | 0.07 |
| Institutional 3 Class | 0.01 |
| Class T | 0.13 |
An annual minimum account balance fee of $20 may apply to certain accounts with a value below the applicable share class’s initial minimum investment requirements to reduce the impact of small accounts on transfer agency fees. These minimum account balance fees are remitted to the Fund and recorded as part of expense reductions in the Statement of Operations. For the year ended April 30, 2018, no minimum account balance fees were charged by the Fund.
Distribution and service fees
The Fund has entered into an agreement with Columbia Management Investment Distributors, Inc. (the Distributor), an affiliate of the Investment Manager and a wholly-owned subsidiary of Ameriprise Financial, for distribution and shareholder services. The Board of Trustees has approved, and the Fund has adopted, distribution and shareholder service plans (the Plans) applicable to certain share classes, which set the distribution and service fees for the Fund. These fees are calculated daily and are intended to compensate the Distributor and/or eligible selling and/or servicing agents for selling shares of the Fund and providing services to investors.
Under the Plans, the Fund pays a monthly service fee to the Distributor at the maximum annual rate of 0.25% of the average daily net assets attributable to Class A, Class C and Class T shares of the Fund. Also under the Plans, the Fund pays a monthly distribution fee to the Distributor at the maximum annual rates of 0.75% and 0.25% of the average daily net assets attributable to Class C and Class T shares of the Fund, respectively.
Although the Fund may pay a distribution fee up to 0.25% of the Fund’s average daily net assets attributable to Class T shares and a service fee of up to 0.25% of the Fund’s average daily net assets attributable to Class T shares, the aggregate fee shall not exceed 0.25% of the Fund’s average daily net assets attributable to Class T shares.
Sales charges (unaudited)
Sales charges, including front-end charges and CDSCs, received by the Distributor for distributing Fund shares for the year ended April 30, 2018, if any, are listed below:
| | Amount ($) |
| Class A | 11,661 |
| Class C | 3 |
Columbia Multi-Asset Income Fund | Annual Report 2018
| 47 |
Notes to Financial Statements (continued)
April 30, 2018
Expenses waived/reimbursed by the Investment Manager and its affiliates
The Investment Manager and certain of its affiliates have contractually agreed to waive fees and/or reimburse expenses (excluding certain fees and expenses described below) for the period(s) disclosed below, unless sooner terminated at the sole discretion of the Board of Trustees, so that the Fund’s net operating expenses, including indirect expenses of the Underlying Funds, after giving effect to fees waived/expenses reimbursed and any balance credits and/or overdraft charges from the Fund’s custodian, do not exceed the following annual rate(s) as a percentage of the class’ average daily net assets:
| | September 1, 2017
through
August 31, 2018 | Prior to
September 1, 2017 |
| Class A | 0.99% | 0.99% |
| Advisor Class | 0.74 | 0.74 |
| Class C | 1.74 | 1.74 |
| Institutional Class | 0.74 | 0.74 |
| Institutional 2 Class | 0.71 | 0.70 |
| Institutional 3 Class | 0.65 | 0.65 |
| Class T | 0.99 | 0.99 |
Under the agreement governing these fee waivers and/or expense reimbursement arrangements, the following fees and expenses are excluded from the waiver/reimbursement commitment, and therefore will be paid by the Fund, if applicable: taxes (including foreign transaction taxes), transaction costs and brokerage commissions, costs related to any securities lending program, dividend expenses associated with securities sold short, inverse floater program fees and expenses, transaction charges and interest on borrowed money, interest, infrequent and/or unusual expenses and any other expenses the exclusion of which is specifically approved by the Board of Trustees. This agreement may be modified or amended only with approval from the Investment Manager, certain of its affiliates and the Fund. Any fees waived and/or expenses reimbursed under the expense reimbursement arrangements described above are not recoverable by the Investment Manager or its affiliates in future periods.
Note 4. Federal tax information
The timing and character of income and capital gain distributions are determined in accordance with income tax regulations, which may differ from GAAP because of temporary or permanent book to tax differences.
At April 30, 2018, these differences were primarily due to differing treatment for deferral/reversal of wash sale losses, re-characterization of distributions for investments, derivative investments, tax straddles, capital loss carryforwards, trustees’ deferred compensation, principal and/or interest from fixed income securities, foreign currency transactions, investments in partnerships and amortization/accretion on certain convertible securities. To the extent these differences were permanent, reclassifications were made among the components of the Fund’s net assets in the Statement of Assets and Liabilities. Temporary differences do not require reclassifications.
In the Statement of Assets and Liabilities the following reclassifications were made:
Undistributed net
investment
income ($) | Accumulated
net realized
(loss) ($) | Paid in
capital ($) |
| (463,332) | (234,233) | 697,565 |
Net investment income (loss) and net realized gains (losses), as disclosed in the Statement of Operations, and net assets were not affected by this reclassification.
| 48 | Columbia Multi-Asset Income Fund | Annual Report 2018 |
Notes to Financial Statements (continued)
April 30, 2018
The tax character of distributions paid during the years indicated was as follows:
| Year Ended April 30, 2018 | Year Ended April 30, 2017 |
Ordinary
income ($) | Long-term
capital gains ($) | Total ($) | Ordinary
income ($) | Long-term
capital gains ($) | Total ($) |
| 6,820,994 | — | 6,820,994 | 6,124,477 | — | 6,124,477 |
Short-term capital gain distributions, if any, are considered ordinary income distributions for tax purposes.
At April 30, 2018, the components of distributable earnings on a tax basis were as follows:
Undistributed
ordinary income ($) | Undistributed
long-term
capital gains ($) | Capital loss
carryforwards ($) | Net unrealized
(depreciation) ($) |
| 2,104,169 | — | (4,602,508) | (2,239,696) |
At April 30, 2018, the cost of all investments for federal income tax purposes along with the aggregate gross unrealized appreciation and depreciation based on that cost was:
Federal
tax cost ($) | Gross unrealized
appreciation ($) | Gross unrealized
(depreciation) ($) | Net unrealized
(depreciation) ($) |
| 134,628,558 | 2,861,772 | (5,101,468) | (2,239,696) |
Tax cost of investments and unrealized appreciation/(depreciation) may also include timing differences that do not constitute adjustments to tax basis.
The following capital loss carryforwards, determined at April 30, 2018, may be available to reduce taxable income arising from future net realized gains on investments, if any, to the extent permitted by the Internal Revenue Code. Capital loss carryforwards with no expiration are required to be utilized prior to any capital losses which carry an expiration date. As a result of this ordering rule, capital loss carryforwards which carry an expiration date may be more likely to expire unused. In addition, for the year ended April 30, 2018, capital loss carryforwards utilized, expired unused and permanently lost, if any, were as follows:
| 2019 ($) | No expiration
short-term ($) | No expiration
long-term ($) | Total ($) | Utilized ($) | Expired ($) | Permanently
lost ($) |
| — | 4,602,508 | — | 4,602,508 | — | — | — |
Management of the Fund has concluded that there are no significant uncertain tax positions in the Fund that would require recognition in the financial statements. However, management’s conclusion may be subject to review and adjustment at a later date based on factors including, but not limited to, new tax laws, regulations, and administrative interpretations (including relevant court decisions). Generally, the Fund’s federal tax returns for the prior three fiscal years remain subject to examination by the Internal Revenue Service.
Note 5. Portfolio information
The cost of purchases and proceeds from sales of securities, excluding short-term investments and derivatives, if any, aggregated to $108,406,280 and $96,285,502, respectively, for the year ended April 30, 2018, of which $323,557 and $735,054, respectively, were U.S. government securities. The amount of purchase and sale activity impacts the portfolio turnover rate reported in the Financial Highlights.
Note 6. Affiliated money market fund
The Fund invests in Columbia Short-Term Cash Fund, an affiliated money market fund established for the exclusive use by the Fund and other affiliated funds (the Affiliated MMF). The income earned by the Fund from such investments is included as Dividends - affiliated issuers in the Statement of Operations. As an investing fund, the Fund indirectly bears its proportionate share of the expenses of the Affiliated MMF. The Affiliated MMF prices its shares with a floating net asset value. In addition,
Columbia Multi-Asset Income Fund | Annual Report 2018
| 49 |
Notes to Financial Statements (continued)
April 30, 2018
the Board of Trustees of the Affiliated MMF may impose a fee on redemptions (sometimes referred to as a liquidity fee) or temporarily suspend redemptions (sometimes referred to as imposing a redemption gate) in the event its liquidity falls below regulatory limits.
Note 7. Line of credit
The Fund has access to a revolving credit facility with a syndicate of banks led by Citibank, N.A., HSBC Bank USA, N.A. and JPMorgan Chase Bank, N.A. whereby the Fund may borrow for the temporary funding of shareholder redemptions or for other temporary or emergency purposes. The credit facility, which is a collective agreement between the Fund and certain other funds managed by the Investment Manager, severally and not jointly, permits collective borrowings up to $1 billion. Interest is charged to each participating fund based on its borrowings at a rate equal to the higher of (i) the overnight federal funds rate plus 1.00% or (ii) the one-month LIBOR rate plus 1.00%. Each borrowing under the credit facility matures no later than 60 days after the date of borrowing. The Fund also pays a commitment fee equal to its pro rata share of the amount of the credit facility at a rate of 0.15% per annum. The commitment fee is included in other expenses in the Statement of Operations.
The Fund had no borrowings during the year ended April 30, 2018.
Note 8. Significant risks
Credit risk
Credit risk is the risk that the value of debt securities in the Fund’s portfolio may decline because the issuer may default and fail to pay interest or repay principal when due. Rating agencies assign credit ratings to debt securities to indicate their credit risk. Lower rated or unrated debt securities held by the Fund may present increased credit risk as compared to higher-rated debt securities.
Foreign securities and emerging market countries risk
Investing in foreign securities may include certain risks and considerations not typically associated with investing in U.S. securities, such as fluctuating currency values and changing local and regional economic, political and social conditions, which may result in greater market volatility. In addition, certain foreign securities may not be as liquid as U.S. securities. Investing in emerging markets may accentuate these risks. These countries are also more likely to experience high levels of inflation, deflation or currency devaluation which could hurt their economies and securities markets. To the extent that the Fund concentrates its investment exposure to any one or a few specific countries, the Fund will be particularly susceptible to the various conditions, events or other factors impacting those countries and may, therefore, have a greater risk than that of a fund which is more geographically diversified.
Interest rate risk
Interest rate risk is the risk of losses attributable to changes in interest rates. In general, if prevailing interest rates rise, the values of debt securities tend to fall, and if interest rates fall, the values of debt securities tend to rise. Actions by governments and central banking authorities can result in increases in interest rates. Increasing interest rates may negatively affect the value of debt securities held by the Fund, resulting in a negative impact on the Fund’s performance and net asset value per share. In general, the longer the maturity or duration of a debt security, the greater its sensitivity to changes in interest rates.
Liquidity risk
Liquidity risk is the risk associated with a lack of marketability of investments which may make it difficult to sell the investment at a desirable time or price. Changing regulatory, market or other conditions or environments (for example, the interest rate or credit environments) may adversely affect the liquidity of the Fund’s investments. The Fund may have to accept a lower selling price for the holding, sell other investments, or forego another, more appealing investment opportunity. Generally, the less liquid the market at the time the Fund sells a portfolio investment, the greater the risk of loss or decline of value to the Fund. A less liquid market can lead to an increase in Fund redemptions, which may negatively impact Fund performance and net asset value per share, including, for example, if the Fund is forced to sell securities in a down market.
| 50 | Columbia Multi-Asset Income Fund | Annual Report 2018 |
Notes to Financial Statements (continued)
April 30, 2018
Shareholder concentration risk
At April 30, 2018, affiliated shareholders of record owned 96.8% of the outstanding shares of the Fund in one or more accounts. Subscription and redemption activity by concentrated accounts may have a significant effect on the operations of the Fund. In the case of a large redemption, the Fund may be forced to sell investments at inopportune times, including its liquid positions, which may result in Fund losses and the Fund holding a higher percentage of less liquid positions. Large redemptions could result in decreased economies of scale and increased operating expenses for non-redeeming Fund shareholders.
Note 9. Subsequent events
Management has evaluated the events and transactions that have occurred through the date the financial statements were issued and noted no items requiring adjustment of the financial statements or additional disclosure.
Note 10. Information regarding pending and settled legal proceedings
Ameriprise Financial and certain of its affiliates have historically been involved in a number of legal, arbitration and regulatory proceedings, including routine litigation, class actions, and governmental actions, concerning matters arising in connection with the conduct of their business activities. Ameriprise Financial believes that the Fund is not currently the subject of, and that neither Ameriprise Financial nor any of its affiliates are the subject of, any pending legal, arbitration or regulatory proceedings that are likely to have a material adverse effect on the Fund or the ability of Ameriprise Financial or its affiliates to perform under their contracts with the Fund. Ameriprise Financial is required to make quarterly (10-Q), annual (10-K) and, as necessary, 8-K filings with the Securities and Exchange Commission (SEC) on legal and regulatory matters that relate to Ameriprise Financial and its affiliates. Copies of these filings may be obtained by accessing the SEC website at www.sec.gov.
There can be no assurance that these matters, or the adverse publicity associated with them, will not result in increased Fund redemptions, reduced sale of Fund shares or other adverse consequences to the Fund. Further, although we believe proceedings are not likely to have a material adverse effect on the Fund or the ability of Ameriprise Financial or its affiliates to perform under their contracts with the Fund, these proceedings are subject to uncertainties and, as such, we are unable to estimate the possible loss or range of loss that may result. An adverse outcome in one or more of these proceedings could result in adverse judgments, settlements, fines, penalties or other relief that could have a material adverse effect on the consolidated financial condition or results of operations of Ameriprise Financial.
Columbia Multi-Asset Income Fund | Annual Report 2018
| 51 |
Report of Independent Registered Public Accounting Firm
To the Board of Trustees of Columbia Funds Series Trust I and Shareholders of Columbia Multi-Asset Income Fund
Opinion on the Financial Statements
We have audited the accompanying statement of assets and liabilities, including the portfolio of investments, of Columbia Multi-Asset Income Fund (one of the funds constituting Columbia Funds Series Trust I, referred to hereafter as the "Fund") as of April 30, 2018, the related statement of operations for the year ended April 30, 2018, the statement of changes in net assets for each of the two years in the period ended April 30, 2018, including the related notes, and the financial highlights for each of the periods indicated therein (collectively referred to as the “financial statements”). In our opinion, the financial statements present fairly, in all material respects, the financial position of the Fund as of April 30, 2018, the results of its operations for the year then ended, the changes in its net assets for each of the two years in the period ended April 30, 2018 and the financial highlights for each of the periods indicated therein in conformity with accounting principles generally accepted in the United States of America.
Basis for Opinion
These financial statements are the responsibility of the Fund’s management. Our responsibility is to express an opinion on the Fund’s financial statements based on our audits. We are a public accounting firm registered with the Public Company Accounting Oversight Board (United States) (“PCAOB”) and are required to be independent with respect to the Fund in accordance with the U.S. federal securities laws and the applicable rules and regulations of the Securities and Exchange Commission and the PCAOB.
We conducted our audits of these financial statements in accordance with the standards of the PCAOB. Those standards require that we plan and perform the audit to obtain reasonable assurance about whether the financial statements are free of material misstatement, whether due to error or fraud.
Our audits included performing procedures to assess the risks of material misstatement of the financial statements, whether due to error or fraud, and performing procedures that respond to those risks. Such procedures included examining, on a test basis, evidence regarding the amounts and disclosures in the financial statements. Our audits also included evaluating the accounting principles used and significant estimates made by management, as well as evaluating the overall presentation of the financial statements. Our procedures included confirmation of securities owned as of April 30, 2018 by correspondence with the custodian, transfer agent, brokers and agent banks; when replies were not received from brokers, we performed other auditing procedures. We believe that our audits provide a reasonable basis for our opinion.
/s/PricewaterhouseCoopers LLP
Minneapolis, Minnesota
June 21, 2018
We have served as auditors of one or more investment companies within the Columbia Funds Complex since 1977.
| 52 | Columbia Multi-Asset Income Fund | Annual Report 2018 |
Federal Income Tax Information
(Unaudited)
The Fund hereby designates the following tax attributes for the fiscal year ended April 30, 2018. Shareholders will be notified in early 2019 of the amounts for use in preparing 2018 income tax returns.
Qualified
dividend
income | Dividends
received
deduction |
| 3.38% | 2.64% |
Qualified dividend income. For taxable, non-corporate shareholders, the percentage of ordinary income distributed during the fiscal year that represents qualified dividend income subject to reduced tax rates.
Dividends received deduction. The percentage of ordinary income distributed during the fiscal year that qualifies for the corporate dividends received deduction.
Columbia Multi-Asset Income Fund | Annual Report 2018
| 53 |
Shareholders elect the Board that oversees the Fund’s operations. The Board appoints officers who are responsible for day-to-day business decisions based on policies set by the Board. The following table provides basic biographical information about the Fund’s Trustees, including their principal occupations during the past five years, although specific titles for individuals may have varied over the period. The year set forth beneath Length of Service in the table below is the year in which the Trustee was first appointed or elected as Trustee to any Fund currently in the Columbia Funds Complex or a predecessor thereof. Under current Board policy, members serve terms of indefinite duration.
Independent trustees
| Name, address, year of birth | Position held with the Trust and length of service | Principal occupation(s) during the past five years and other relevant professional experience | Number of Funds in the Columbia Fund Complex overseen | Other directorships held by Trustee during the past five years |
Janet Langford Carrig
c/o Columbia Management
Investment Advisers, LLC
225 Franklin Street
Mail Drop BX32 05228
Boston, MA 02110
1957 | Trustee
1996 | Senior Vice President, General Counsel and Corporate Secretary, ConocoPhillips (independent energy company) since September 2007 | 71 | None |
Douglas A. Hacker
c/o Columbia Management
Investment Advisers, LLC
225 Franklin Street
Mail Drop BX32 05228
Boston, MA 02110
1955 | Trustee and Chairman of the Board
1996 | Independent business executive since May 2006; Executive Vice President — Strategy of United Airlines from December 2002 to May 2006; President of UAL Loyalty Services (airline marketing company) from September 2001 to December 2002; Executive Vice President and Chief Financial Officer of United Airlines from July 1999 to September 2001 | 71 | Spartan Nash Company, (food distributor); Nash Finch Company (food distributor) from 2005 to 2013; Aircastle Limited (aircraft leasing); SeaCube Container Leasing Ltd. (container leasing) from 2010 to 2013; and Travelport Worldwide Limited (travel information technology) |
Nancy T. Lukitsh
c/o Columbia Management
Investment Advisers, LLC
225 Franklin Street
Mail Drop BX32 05228
Boston, MA 02110
1956 | Trustee
2011 | Senior Vice President, Partner and Director of Marketing, Wellington Management Company, LLP (investment adviser) from 1997 to 2010; Chair, Wellington Management Portfolios (commingled non-U.S. investment pools) from 2007 to 2010; Director, Wellington Trust Company, NA and other Wellington affiliates from 1997 to 2010 | 71 | None |
David M. Moffett
c/o Columbia Management
Investment Advisers, LLC
225 Franklin Street
Mail Drop BX32 05228
Boston, MA 02110
1952 | Trustee
2011 | Retired. Consultant to Bridgewater and Associates | 71 | Director, CSX Corporation; Genworth Financial, Inc. (financial and insurance products and services); PayPal Holdings Inc. (payment and data processing services); Trustee, University of Oklahoma Foundation; former Director, eBay Inc. (online trading community), 2007-2015; and former Director, CIT Bank, CIT Group Inc. (commercial and consumer finance), 2010-2016 |
John J. Neuhauser
c/o Columbia Management
Investment Advisers, LLC
225 Franklin Street
Mail Drop BX32 05228
Boston, MA 02110
1943 | Trustee
1984 | President, Saint Michael’s College since August 2007; Director or Trustee of several non-profit organizations, including University of Vermont Medical Center; Academic Vice President and Dean of Faculties, Boston College from August 1999 to October 2005; University Professor, Boston College from November 2005 to August 2007 | 71 | Liberty All-Star Equity Fund and Liberty All- Star Growth Fund (closed-end funds) |
| 54 | Columbia Multi-Asset Income Fund | Annual Report 2018 |
TRUSTEES AND OFFICERS (continued)
Independent trustees (continued)
| Name, address, year of birth | Position held with the Trust and length of service | Principal occupation(s) during the past five years and other relevant professional experience | Number of Funds in the Columbia Fund Complex overseen | Other directorships held by Trustee during the past five years |
Patrick J. Simpson
c/o Columbia Management
Investment Advisers, LLC
225 Franklin Street
Mail Drop BX32 05228
Boston, MA 02110
1944 | Trustee
2000 | Of Counsel, Perkins Coie LLP (law firm) since 2015; Partner, Perkins Coie LLP from 1988 to 2014 | 71 | None |
Anne-Lee Verville
c/o Columbia Management
Investment Advisers, LLC
225 Franklin Street
Mail Drop BX32 05228
Boston, MA 02110
1945 | Trustee
1998 | Retired. General Manager, Global Education Industry from 1994 to 1997, President – Application Systems Division from 1991 to 1994, Chief Financial Officer – US Marketing & Services from 1988 to 1991, and Chief Information Officer from 1987 to 1988, IBM Corporation (computer and technology) | 71 | Enesco Group, Inc. (producer of giftware and home and garden decor products) from 2001 to 2006 |
Consultants to the Independent Trustees*
| Name, address, year of birth | Position held with the Trust and length of service | Principal occupation(s) during the past five years and other relevant professional experience | Number of Funds in the Columbia Funds complex overseen | Other directorships held by Trustee during the past five years |
J. Kevin Connaughton
c/o Columbia
Management Investment
Advisers, LLC,
225 Franklin Street
Mail Drop BX32 05228,
Boston, MA 02110
1964 | Independent Trustee Consultant
2016 | Independent Trustee Consultant, Columbia Funds since March 2016; Adjunct Professor of Finance, Bentley University since November 2017; Managing Director and General Manager of Mutual Fund Products, Columbia Management Investment Advisers, LLC from May 2010 to February 2015; President, Columbia Funds from 2009 to 2015; and senior officer of Columbia Funds and affiliated funds from 2003 to 2015 | 71 | Director, The Autism Project since March 2015; former Trustee, New Century Portfolios, March 2015-December 2017; formerly on Board of Governors, Gateway Healthcare, January 2016 – December 2017 |
Natalie A. Trunow
c/o Columbia
Management Investment
Advisers, LLC,
225 Franklin Street
Mail Drop BX32 05228,
Boston, MA 02110
1967 | Independent Trustee Consultant
2016 | Independent Trustee Consultant, Columbia Funds since September 2016; Chief Executive Officer, Millennial Portfolio Solutions LLC (asset management and consulting services) since January 2016; Director of Investments, Casey Family Programs from April 2016 to September 2016; Senior Vice President and Chief Investment Officer, Calvert Investments from August 2008 to January 2016; Section Head and Portfolio Manager, General Motors Asset Management from June 1997 to August 2008 | 71 | Director, Health Services for Children with Special Needs, Inc.; Director, Guidewell Financial Solutions |
| * | J. Kevin Connaughton was appointed consultant to the Independent Trustees effective March 1, 2016. Natalie A. Trunow was appointed consultant to the Independent Trustees effective September 1, 2016. Shareholders of the Funds are expected to be asked to elect each of Mr. Connaughton and Ms. Trunow as a Trustee at a future shareholder meeting. |
Columbia Multi-Asset Income Fund | Annual Report 2018
| 55 |
TRUSTEES AND OFFICERS (continued)
Interested trustee affiliated with Investment Manager*
| Name, address, year of birth | Position held with the Trust and length of service | Principal occupation(s) during the past five years and other relevant professional experience | Number of Funds in the Columbia Funds Complex overseen | Other directorships held by Trustee during the past five years |
William F. Truscott
c/o Columbia Management
Investment Advisers, LLC
225 Franklin Street
Boston, MA 02110
1960 | Trustee
2012 | Chairman of the Board and President, Columbia Management Investment Advisers, LLC since May 2010 and February 2012, respectively; Chief Executive Officer, Global Asset Management, Ameriprise Financial, Inc. since September 2012 (previously Chief Executive Officer, U.S. Asset Management & President, Annuities, May 2010-September 2012); Director and Chief Executive Officer, Columbia Management Investment Distributors, Inc. since May 2010 and February 2012, respectively; Chairman of the Board and Chief Executive Officer, RiverSource Distributors, Inc. since 2006; Director, Threadneedle Asset Management Holdings, SARL since 2014; President and Chief Executive Officer, Ameriprise Certificate Company, 2006-August 2012 | 196 | Chairman of the Board, Columbia Management Investment Advisers, LLC since May 2010; Director, Columbia Management Investment Distributors, Inc. since May 2010; former Director, Ameriprise Certificate Company, 2006 - January 2013 |
| * | Interested person (as defined under the 1940 Act) by reason of being an officer, director, security holder and/or employee of the Investment Manager or Ameriprise Financial. |
The Statement of Additional Information has additional information about the Fund’s Board members and is available, without charge, upon request by calling 800.345.6611, visiting columbiathreadneedleus.com/investor/ or contacting your financial intermediary.
| 56 | Columbia Multi-Asset Income Fund | Annual Report 2018 |
TRUSTEES AND OFFICERS (continued)
The Board has appointed officers who are responsible for day-to-day business decisions based on policies it has established. The officers serve at the pleasure of the Board. The following table provides basic information about the Officers of the Fund, including principal occupations during the past five years, although their specific titles may have varied over the period. In addition to Mr. Truscott, who is Senior Vice President, the Fund’s other officers are:
Fund officers
Name,
address and
year of birth | Position and year
first appointed to
position for any Fund
in the Columbia
Funds complex or a
predecessor thereof | Principal occupation(s) during past five years |
Christopher O. Petersen
5228 Ameriprise
Financial Center
Minneapolis, MN 55474
Born 1970 | President and Principal Executive Officer (2015) | Vice President and Lead Chief Counsel, Ameriprise Financial, Inc. since January 2015 (previously, Vice President and Chief Counsel, January 2010 - December 2014; officer of Columbia Funds and affiliated funds since 2007. |
Michael G. Clarke
225 Franklin Street
Boston, MA 02110
Born 1969 | Treasurer (2011), Chief Financial Officer (2009) and Chief Accounting Officer (2015) | Vice President — Mutual Fund Administration, Columbia Management Investment Advisers, LLC, since May 2010; senior officer of Columbia Funds and affiliated funds since 2002. |
Paul B. Goucher
100 Park Avenue
New York, NY 10017
Born 1968 | Senior Vice President (2011) and Assistant Secretary (2008) | Senior Vice President and Assistant General Counsel, Ameriprise Financial, Inc. since January 2017 (previously Vice President and Lead Chief Counsel, November 2008 - January 2017 and January 2013 - January 2017, respectively; and Chief Counsel, January 2010 - January 2013); Vice President, Chief Legal Officer and Assistant Secretary, Columbia Management Investment Advisers, LLC since May 2010. |
Thomas P. McGuire
225 Franklin Street
Boston, MA 02110
Born 1972 | Senior Vice President and Chief Compliance Officer (2012) | Vice President — Asset Management Compliance, Ameriprise Financial, Inc., since May 2010; Chief Compliance Officer, Ameriprise Certificate Company since September 2010. |
Colin Moore
225 Franklin Street
Boston, MA 02110
Born 1958 | Senior Vice President (2010) | Executive Vice President and Global Chief Investment Officer, Ameriprise Financial, Inc., since July 2013; Executive Vice President and Global Chief Investment Officer, Columbia Management Investment Advisers, LLC since July 2013 (previously Director and Global Chief Investment Officer, 2010 - 2013). |
Ryan C. Larrenaga
225 Franklin Street
Boston, MA 02110
Born 1970 | Senior Vice President (2017), Chief Legal Officer (2017) and Secretary (2015) | Vice President and Group Counsel, Ameriprise Financial, Inc. since August 2011; officer of Columbia Funds and affiliated funds since 2005. |
Michael E. DeFao
225 Franklin Street
Boston, MA 02110
Born 1968 | Vice President (2011) and Assistant Secretary (2010) | Vice President and Chief Counsel, Ameriprise Financial, Inc. since May 2010. |
Amy Johnson
5228 Ameriprise
Financial Center
Minneapolis, MN 55474
Born 1965 | Vice President (2006) | Managing Director and Global Head of Operations, Columbia Management Investment Advisers, LLC since April 2016 (previously Managing Director and Chief Operating Officer, 2010 - 2016). |
Lyn Kephart-Strong
5228 Ameriprise
Financial Center
Minneapolis, MN 55474
Born 1960 | Vice President (2015) | President, Columbia Management Investment Services Corp. since October 2014; Vice President & Resolution Officer, Ameriprise Trust Company since August 2009. |
Columbia Multi-Asset Income Fund | Annual Report 2018
| 57 |
The Fund mails one shareholder report to each shareholder address. If you would like more than one report, please call shareholder services at 800.345.6611 and additional reports will be sent to you.
Proxy voting policies and procedures
The policy of the Board of Trustees is to vote the proxies of the companies in which the Fund holds investments consistent with the procedures as stated in the Statement of Additional Information (SAI). You may obtain a copy of the SAI without charge by calling 800.345.6611; contacting your financial intermediary; visiting columbiathreadneedleus.com/investor/; or searching the website of the Securities and Exchange Commission (SEC) at sec.gov. Information regarding how the Fund voted proxies relating to portfolio securities is filed with the SEC by August 31st for the most recent 12-month period ending June 30th of that year, and is available without charge by visiting columbiathreadneedleus.com/investor/, or searching the website of the SEC at sec.gov.
Quarterly schedule of investments
The Fund files a complete schedule of portfolio holdings with the SEC for the first and third quarters of each fiscal year on Form N-Q. The Fund’s Form N-Q is available on the SEC’s website at sec.gov and may be reviewed and copied at the SEC’s Public Reference Room in Washington, D.C. Information on the operation of the Public Reference Room may be obtained by calling 800.SEC.0330. The Fund’s complete schedule of portfolio holdings, as filed on Form N-Q, can also be obtained without charge, upon request, by calling 800.345.6611.
Additional Fund information
For more information about the Fund, please visit columbiathreadneedleus.com/investor/ or call 800.345.6611. Customer Service Representatives are available to answer your questions Monday through Friday from 8 a.m. to 7 p.m. Eastern time.
Fund investment manager
Columbia Management Investment Advisers, LLC
225 Franklin Street
Boston, MA 02110
Fund distributor
Columbia Management Investment Distributors, Inc.
225 Franklin Street
Boston, MA 02110
Fund transfer agent
Columbia Management Investment Services Corp.
P.O. Box 8081
Boston, MA 02266-8081
| 58 | Columbia Multi-Asset Income Fund | Annual Report 2018 |
[THIS PAGE INTENTIONALLY LEFT BLANK]
[THIS PAGE INTENTIONALLY LEFT BLANK]
[THIS PAGE INTENTIONALLY LEFT BLANK]
Columbia Multi-Asset Income Fund
P.O. Box 8081
Boston, MA 02266-8081
Please read and consider the investment objectives, risks, charges and expenses for any fund carefully before investing. For a prospectus and summary prospectus, which contains this and other important information about the Fund, go to
columbiathreadneedleus.com/investor/. The Fund is distributed by Columbia Management Investment Distributors, Inc., member FINRA, and managed by Columbia Management Investment Advisers, LLC.
Columbia Threadneedle Investments (Columbia Threadneedle) is the global brand name of the Columbia and Threadneedle group of companies. All rights reserved. Columbia Management Investment Distributors, Inc., 225 Franklin Street, Boston, MA 02110-2804
© 2018 Columbia Management Investment Advisers, LLC.
columbiathreadneedleus .com/investor/
Item 2. Code of Ethics.
| | (a) | The registrant has adopted a code of ethics that applies to the registrant’s principal executive officer, principal financial officer, principal accounting officer or controller, or persons performing similar functions, regardless of whether these individuals are employed by the registrant or a third party. |
| | (b) | During the period covered by this report, there were not any amendments to a provision of the code of ethics adopted in 2(a) above. |
| | (c) | During the period covered by this report, there were no waivers, including any implicit waivers, from a provision of the code of ethics described in 2(a) above that relates to one or more of the items set forth in paragraph (b) of this item’s instructions. |
Item 3. Audit Committee Financial Expert.
The registrant’s Board of Trustees has determined that Douglas A. Hacker, David M. Moffett and Anne-Lee Verville, each of whom are members of the registrant’s Board of Trustees and Audit Committee, each qualify as an audit committee financial expert. Mr. Hacker, Mr. Moffett and Ms. Verville are each independent trustees, as defined in paragraph (a)(2) of this item’s instructions.
Item 4. Principal Accountant Fees and Services.
Fee information below is disclosed for the seven series of the registrant whose reports to stockholders are included in this annual filing.
(a) Audit Fees. Aggregate Audit Fees billed by the principal accountant for professional services rendered during the fiscal years ended April 30, 2018 and April 30, 2017 are approximately as follows:
| | | | |
| 2018 | | 2017 | |
$267,900 | | $ | 242,800 | |
Audit Fees include amounts related to the audit of the registrant’s annual financial statements or services that are normally provided by the accountant in connection with statutory and regulatory filings or engagements for those fiscal years.
(b) Audit-Related Fees. Aggregate Audit-Related Fees billed to the registrant by the principal accountant for professional services rendered during the fiscal years ended April 30, 2018 and April 30, 2017 are approximately as follows:
Audit-Related Fees include amounts for assurance and related services by the principal accountant that are reasonably related to the performance of the audit of the registrant’s financial statements and are not reported in Audit Fees above. In fiscal year 2017, Audit-Related Fees consist of agreed-upon procedures performed for semi-annual shareholder reports. Fiscal year 2017 and 2018 also includes agreed-upon procedures related to issuance of consents and review of Form N-1A.
During the fiscal years ended April 30, 2018 and April 30, 2017, there were no Audit-Related Fees billed by the registrant’s principal accountant to the registrant’s investment adviser (not including any sub-adviser whose role is primarily portfolio management and is subcontracted with or overseen by another investment adviser) and any entity controlling, controlled by, or under common control with the adviser that provides ongoing services to the registrant for an engagement that related directly to the operations and financial reporting of the registrant.
(c) Tax Fees. Aggregate Tax Fees billed by the principal accountant to the registrant for professional services rendered during the fiscal years ended April 30, 2018 and April 30, 2017 are approximately as follows:
| | | | |
| 2018 | | 2017 | |
$54,700 | | $ | 39,900 | |
Tax Fees include amounts for the review of annual tax returns, the review of required shareholder distribution calculations and typically include amounts for professional services by the principal accountant for tax compliance, tax advice and tax planning. Fiscal year 2018 and 2017 also include Tax Fees for foreign tax filings.
During the fiscal years ended April 30, 2018 and April 30, 2017, there were no Tax Fees billed by the registrant’s principal accountant to the registrant’s investment adviser (not including any sub-adviser whose role is primarily portfolio management and is subcontracted with or overseen by another investment adviser) and any entity controlling, controlled by, or under common control with the adviser that provides ongoing services to the registrant for an engagement that related directly to the operations and financial reporting of the registrant.
(d) All Other Fees. Aggregate All Other Fees billed by the principal accountant to the registrant for professional services rendered during the fiscal years ended April 30, 2018 and April 30, 2017 are approximately as follows:
All Other Fees include amounts for products and services provided by the principal accountant, other than the services reported in paragraphs (a) through (c) above.
Aggregate All Other Fees billed by the registrant’s principal accountant to the registrant’s investment adviser (not including any sub-adviser whose role is primarily portfolio
management and is subcontracted with or overseen by another investment adviser) and any entity controlling, controlled by, or under common control with the adviser that provides ongoing services to the registrant for an engagement that related directly to the operations and financial reporting of the registrant during the fiscal years ended April 30, 2018 and April 30, 2017 are approximately as follows:
| | | | |
| 2018 | | 2017 | |
$242,500 | | $ | 232,500 | |
In fiscal years 2018 and 2017, All Other Fees primarily consists of fees billed for internal control examinations of the registrant’s transfer agent and investment adviser.
(e)(1) Audit Committee Pre-Approval Policies and Procedures
The registrant’s Audit Committee is required to pre-approve the engagement of the registrant’s independent auditors to provide audit and non-audit services to the registrant and non-audit services to its investment adviser (excluding any sub-adviser whose role is primarily portfolio management and is sub-contracted or overseen by another investment adviser (the “Adviser”) or any entity controlling, controlled by or under common control with the Adviser that provides ongoing services to the Fund (a “Control Affiliate”) if the engagement relates directly to the operations and financial reporting of the registrant.
The Audit Committee has adopted a Policy for Engagement of Independent Auditors for Audit and Non-Audit Services (the “Policy”). The Policy sets forth the understanding of the Audit Committee regarding the engagement of the registrant’s independent accountants to provide (i) audit and permissible audit-related, tax and other services to the registrant (“Fund Services”); (ii) non-audit services to the registrant’s Adviser and any Control Affiliates, that relates directly to the operations and financial reporting of a Fund (“Fund-related Adviser Services”); and (iii) certain other audit and non-audit services to the registrant’s Adviser and its Control Affiliates. A service will require specific pre-approval by the Audit Committee if it is to be provided by the Fund’s independent auditor; provided, however, that pre-approval of non-audit services to the Fund, the Adviser or Control Affiliates may be waived if certain de minimis requirements set forth in the SEC’s rules are met.
Under the Policy, the Audit Committee may delegate pre-approval authority to any pre-designated member or members who are independent board members. The member(s) to whom such authority is delegated must report, for informational purposes only, any pre-approval decisions to the Audit Committee at its next regular meeting. The Audit Committee’s responsibilities with respect to the pre-approval of services performed by the independent auditor may not be delegated to management.
On an annual basis, at a regularly scheduled Audit Committee meeting, the Fund’s Treasurer or other Fund officer shall submit to the Audit Committee a schedule of the types of Fund Services and Fund-related Adviser Services that are subject to specific pre-approval. This schedule will provide a description of each type of service that is subject to specific pre-approval, along with total projected fees for each service. The pre-approval
will generally cover a one-year period. The Audit Committee will review and approve the types of services and the projected fees for the next one-year period and may add to, or subtract from, the list of pre-approved services from time to time, based on subsequent determinations. This specific approval acknowledges that the Audit Committee is in agreement with the specific types of services that the independent auditor will be permitted to perform and the projected fees for each service.
The Fund’s Treasurer or other Fund officer shall report to the Audit Committee at each of its regular meetings regarding all Fund Services or Fund-related Adviser Services provided since the last such report was rendered, including a description of the services, by category, with forecasted fees for the annual reporting period, proposed changes requiring specific pre-approval and a description of services provided by the independent auditor, by category, with actual fees during the current reporting period.
*****
(e)(2) 100% of the services performed for items (b) through (d) above during 2018 and 2017 were pre-approved by the registrant’s Audit Committee.
(f) Not applicable.
(g) The aggregate non-audit fees billed by the registrant’s accountant for services rendered to the registrant, and rendered to the registrant’s investment adviser (not including any sub-adviser whose role is primarily portfolio management and is subcontracted with or overseen by another investment adviser), and any entity controlling, controlled by, or under common control with the adviser that provides ongoing services to the registrant during the fiscal years ended April 30, 2018 and April 30, 2017 are approximately as follows:
| | | | |
| 2018 | | 2017 | |
$303,700 | | $ | 281,700 | |
(h) The registrant’s Audit Committee of the Board of Directors has considered whether the provision of non-audit services that were rendered to the registrant’s adviser (not including any sub-adviser whose role is primarily portfolio management and is subcontracted with or overseen by another investment adviser), and any entity controlling, controlled by, or under common control with the investment adviser that provides ongoing services to the registrant that were not pre-approved pursuant to paragraph (c)(7)(ii) of Rule 2-01 of Regulation S-X, is compatible with maintaining the principal accountant’s independence.
Item 5. Audit Committee of Listed Registrants.
Not applicable.
Item 6. Investments
| | (a) | The registrant’s “Schedule I – Investments in securities of unaffiliated issuers” (as set forth in 17 CFR 210.12-12) is included in Item 1 of this Form N-CSR. |
Item 7. Disclosure of Proxy Voting Policies and Procedures for Closed-End Management Investment Companies.
Not applicable.
Item 8. Portfolio Managers of Closed-End Management Investment Companies.
Not applicable.
Item 9. Purchases of Equity Securities by Closed-End Management Investment Company and Affiliated Purchasers.
Not applicable.
Item 10. Submission of Matters to a Vote of Security Holders.
There were no material changes to the procedures by which shareholders may recommend nominees to the registrant’s board of directors.
Item 11. Controls and Procedures.
| | (a) | The registrant’s principal executive officer and principal financial officer, based on their evaluation of the registrant’s disclosure controls and procedures as of a date within 90 days of the filing of this report, have concluded that such controls and procedures are adequately designed to ensure that material information required to be disclosed by the registrant in Form N-CSR is accumulated and communicated to the registrant’s management, including the principal executive officer and principal financial officer, or persons performing similar functions, as appropriate to allow timely decisions regarding required disclosure. |
| | (b) | There was no change in the registrant’s internal control over financial reporting that occurred during the registrant’s second fiscal quarter of the period covered by this report that has materially affected, or is reasonably likely to materially affect, the registrant’s internal control over financial reporting. |
Item 12. Disclosure of Securities Lending Activities for Closed-End Management Investment Companies
Not applicable.
Item 13. Exhibits.
(a)(1) Code of ethics required to be disclosed under Item 2 of Form N-CSR attached hereto as Exhibit 99.CODE ETH.
(a)(2) Certifications pursuant to Rule 30a-2(a) under the Investment Company Act of 1940 (17 CFR 270.30a-2(a)) attached hereto as Exhibit 99.CERT.
(a)(3) Not applicable.
(b) Certification pursuant to Rule 30a-2(b) under the Investment Company Act of 1940 (17 CFR 270.30a-2(b)) attached hereto as Exhibit 99.906CERT.
SIGNATURES
Pursuant to the requirements of the Securities Exchange Act of 1934 and the Investment Company Act of 1940, the registrant has duly caused this report to be signed on its behalf by the undersigned, thereunto duly authorized.
| | |
| (registrant) | | Columbia Funds Series Trust I |
| | |
| By (Signature and Title) | | /s/ Christopher O. Petersen |
| | Christopher O. Petersen, President and Principal Executive Officer |
Pursuant to the requirements of the Securities Exchange Act of 1934 and the Investment Company Act of 1940, this report has been signed below by the following persons on behalf of the registrant and in the capacities and on the dates indicated.
| | |
| By (Signature and Title) | | /s/ Christopher O. Petersen |
| | Christopher O. Petersen, President and Principal Executive Officer |
| | |
| By (Signature and Title) | | /s/ Michael G. Clarke |
| | Michael G. Clarke, Treasurer and Chief Financial Officer |