UNITED STATES
SECURITIES AND EXCHANGE COMMISSION
Washington, D.C. 20549
FORM N-CSR
CERTIFIED SHAREHOLDER REPORT OF REGISTERED
MANAGEMENT INVESTMENT COMPANIES
Investment Company Act file number 811-04367
Columbia Funds Series Trust I
(Exact name of registrant as specified in charter)
225 Franklin Street
Boston, Massachusetts 02110
(Address of principal executive offices) (Zip code)
Christopher O. Petersen, Esq.
c/o Columbia Management Investment Advisers, LLC
225 Franklin Street
Boston, Massachusetts 02110
Ryan C. Larrenaga, Esq.
c/o Columbia Management Investment Advisers, LLC
225 Franklin Street
Boston, MA 02110
(Name and address of agent for service)
Registrant’s telephone number, including area code: (800) 345-6611
Date of fiscal year end: May 31
Date of reporting period: May 31, 2018
Form N-CSR is to be used by management investment companies to file reports with the Commission not later than 10 days after the transmission to stockholders of any report that is required to be transmitted to stockholders under Rule 30e-1 under the Investment Company Act of 1940 (17 CFR 270.30e-1). The Commission may use the information provided on Form N-CSR in its regulatory, disclosure review, inspection, and policymaking roles.
A registrant is required to disclose the information specified by Form N-CSR, and the Commission will make this information public. A registrant is not required to respond to the collection of information contained in Form N-CSR unless the Form displays a currently valid Office of Management and Budget (“OMB”) control number. Please direct comments concerning the accuracy of the information collection burden estimate and any suggestions for reducing the burden to Secretary, Securities and Exchange Commission, 450 Fifth Street, NW, Washington, DC 20549-0609. The OMB has reviewed this collection of information under the clearance requirements of 44 U.S.C. § 3507.
| Item 1. | Reports to Stockholders. |

Annual Report
May 31, 2018
Columbia Dividend Income Fund
Not FDIC Insured • No bank guarantee • May lose value
Dear Shareholders,
The year 2017 was an extraordinary year in the financial markets. The S&P 500 Index didn’t experience a single down month and returned over 20%. Continuing this trend, January 2018 marked the fastest start for the index ever. Low volatility, which had been a feature of the U.S. equity market for several years, along with the surge in the S&P 500 Index, drove investor sentiment to very high levels. This arguably set the stage for an overdue correction, which we witnessed in February 2018.
A return to volatility
There have been few periods of market upheaval such as were experienced in the first part of 2018. While investors were taken by surprise by the sudden and pronounced market swings, the return to some level of volatility actually marked a resumption of relatively normal market conditions. Having said that, it’s important to distinguish between a good technical correction where excess enthusiasm in the marketplace is being let out, versus a real change in the underlying fundamentals – things like an underperforming economy or weaker corporate earnings. Our view is that the recent market volatility falls into the former category, and the fundamentals remain strong. We’re continuing to see improvements in global economic activity, and we’re seeing corporate earnings expectations continue to rise – and not just because of tax reform.
Consistency is more important than ever
It’s important to keep in mind that when it comes to long-term investing, it’s the destination, not the journey that matters most. If you have a financial goal that you’ve worked out with your financial advisor, and you have a good asset allocation plan to reach it, it’s a question of sticking with your plan rather than become focused on near-term volatility. Bouts of volatility are normal. After all, it’s hard to cross the ocean without hitting an occasional rough patch. You need to focus on the destination.
One final thought. In weathering volatility, it’s the consistency of the return that is essential. Investors who chase higher returns are usually the first to sell when an investment goes through a bad patch, and they therefore don’t tend to benefit from the recovery. More disciplined investors who perhaps panic less or not at all during periods of volatility, tend to have improved long-term results and are more likely to reach their financial goals. Nothing is more important to us than making sure those who have entrusted us to protect and grow their assets are able to do what matters most to them.
Your success is our priority. Talk to your financial advisor about how working with Columbia Threadneedle Investments may help you position your portfolio for consistent, sustainable outcomes, no matter the market conditions.
Sincerely,
Christopher O. Petersen
President, Columbia Funds
The S&P 500 Index, an unmanaged index, measures the performance of 500 widely held, large-capitalization U.S. stocks and is frequently used as a general measure of market performance. Past performance is no guarantee of future results.
Columbia Funds are distributed by Columbia Management Investment Distributors, Inc., member FINRA, and managed by Columbia Management Investment Advisers, LLC.
© 2018 Columbia Management Investment Advisers, LLC. All rights reserved.
Columbia Dividend Income Fund | Annual Report 2018
Columbia Dividend Income Fund | Annual Report 2018
Investment objective
Columbia Dividend Income Fund (the Fund) seeks total return, consisting of current income and capital appreciation.
Portfolio management
Scott Davis
Lead Portfolio Manager
Managed Fund since 2001
Michael Barclay, CFA
Portfolio Manager
Managed Fund since 2011
Peter Santoro, CFA
Portfolio Manager
Managed Fund since 2014
Morningstar style boxTM
The Morningstar Style Box is based on a fund’s portfolio holdings. For equity funds, the vertical axis shows the market capitalization of the stocks owned, and the horizontal axis shows investment style (value, blend, or growth). Information shown is based on the most recent data provided by Morningstar.
© 2018 Morningstar, Inc. All rights reserved. The Morningstar information contained herein: (1) is proprietary to Morningstar and/or its content providers; (2) may not be copied or distributed; and (3) is not warranted to be accurate, complete or timely. Neither Morningstar nor its content providers are responsible for any damages or losses arising from any use of this information.
| Average annual total returns (%) (for the period ended May 31, 2018) |
| | | Inception | 1 Year | 5 Years | 10 Years |
| Class A | Excluding sales charges | 11/25/02 | 10.35 | 10.85 | 8.69 |
| | Including sales charges | | 4.00 | 9.54 | 8.05 |
| Advisor Class* | 11/08/12 | 10.60 | 11.12 | 8.96 |
| Class C | Excluding sales charges | 11/25/02 | 9.53 | 10.02 | 7.88 |
| | Including sales charges | | 8.53 | 10.02 | 7.88 |
| Institutional Class | 03/04/98 | 10.67 | 11.12 | 8.96 |
| Institutional 2 Class* | 11/08/12 | 10.76 | 11.27 | 9.04 |
| Institutional 3 Class* | 11/08/12 | 10.84 | 11.33 | 9.07 |
| Class R | 03/28/08 | 10.07 | 10.58 | 8.43 |
| Class T* | Excluding sales charges | 09/27/10 | 10.36 | 10.84 | 8.70 |
| | Including sales charges | | 7.62 | 10.28 | 8.43 |
| Class V | Excluding sales charges | 03/04/98 | 10.35 | 10.84 | 8.65 |
| | Including sales charges | | 4.00 | 9.53 | 8.02 |
| Russell 1000 Index | | 14.60 | 12.91 | 9.18 |
Returns for Class A shares and Class V shares are shown with and without the maximum initial sales charge of 5.75%. Returns for Class C shares are shown with and without the 1.00% contingent deferred sales charge for the first year only. Returns for Class T shares are shown with and without the maximum initial sales charge of 2.50% per transaction. The Fund’s other classes are not subject to sales charges and have limited eligibility. Please see the Fund’s prospectus for details. Effective November 1, 2017, Class R4, Class R5, Class Y and Class Z shares were renamed Advisor Class, Institutional 2 Class, Institutional 3 Class and Institutional Class shares, respectively. Performance for different share classes will vary based on differences in sales charges and fees associated with each class. All results shown assume reinvestment of distributions during the period. Returns do not reflect the deduction of taxes that a shareholder may pay on Fund distributions or on the redemption of Fund shares. Performance results reflect the effect of any fee waivers or reimbursements of Fund expenses by Columbia Management Investment Advisers, LLC and/or any of its affiliates. Absent these fee waivers or expense reimbursement arrangements, performance results would have been lower.
The performance information shown represents past performance and is not a guarantee of future results. The investment return and principal value of your investment will fluctuate so that your shares, when redeemed, may be worth more or less than their original cost. Current performance may be lower or higher than the performance information shown. You may obtain performance information current to the most recent month-end by contacting your financial intermediary, visiting columbiathreadneedleus.com/investor/ or calling 800.345.6611.
| * | The returns shown for periods prior to the share class inception date (including returns for the Life of the Fund, if shown, which are since Fund inception) include the returns of the Fund’s oldest share class. Since the Fund launched more than one share class at its inception, Institutional Class shares were used. These returns are adjusted to reflect any higher class-related operating expenses of the newer share classes, as applicable. Please visit columbiathreadneedleus.com/investor/investment-products/mutual-funds/appended-performance for more information. |
The Russell 1000 Index measures the performance of the large-cap segment of the U.S. equity universe. It is a subset of the Russell 3000 Index and includes approximately 1000 of the largest securities based on a combination of their market cap and current index membership. The Russell 1000 Index represents approximately 92% of the U.S. market.
Indices are not available for investment, are not professionally managed and do not reflect sales charges, fees, brokerage commissions, taxes or other expenses of investing. Securities in the Fund may not match those in an index.
| 2 | Columbia Dividend Income Fund | Annual Report 2018 |
Fund at a Glance (continued)
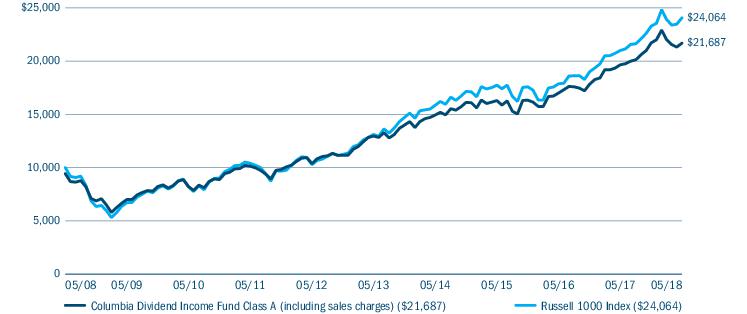
Performance of a hypothetical $10,000 investment (May 31, 2008 — May 31, 2018)
The chart above shows the change in value of a hypothetical $10,000 investment in Class A shares of Columbia Dividend Income Fund during the stated time period, and does not reflect the deduction of taxes that a shareholder may pay on Fund distributions or on the redemption of Fund shares.
| Top 10 holdings (%) (at May 31, 2018) |
| Microsoft Corp. | 4.3 |
| JPMorgan Chase & Co. | 3.9 |
| Johnson & Johnson | 3.7 |
| Apple, Inc. | 3.5 |
| Cisco Systems, Inc. | 2.6 |
| Home Depot, Inc. (The) | 2.4 |
| Lockheed Martin Corp. | 2.3 |
| Union Pacific Corp. | 2.3 |
| Honeywell International, Inc. | 2.2 |
| Pfizer, Inc. | 2.2 |
Percentages indicated are based upon total investments (excluding Money Market Funds).
For further detail about these holdings, please refer to the section entitled “Portfolio of Investments.”
Fund holdings are as of the date given, are subject to change at any time, and are not recommendations to buy or sell any security.
| Portfolio breakdown (%) (at May 31, 2018) |
| Common Stocks | 95.7 |
| Exchange-Traded Funds | 0.7 |
| Money Market Funds | 3.6 |
| Total | 100.0 |
Percentages indicated are based upon total investments. The Fund’s portfolio composition is subject to change.
| Equity sector breakdown (%) (at May 31, 2018) |
| Consumer Discretionary | 8.1 |
| Consumer Staples | 9.0 |
| Energy | 7.0 |
| Financials | 18.6 |
| Health Care | 11.3 |
| Industrials | 15.5 |
| Information Technology | 19.4 |
| Materials | 2.0 |
| Real Estate | 3.0 |
| Telecommunication Services | 1.4 |
| Utilities | 4.7 |
| Total | 100.0 |
Percentages indicated are based upon total equity investments. The Fund’s portfolio composition is subject to change.
Columbia Dividend Income Fund | Annual Report 2018
| 3 |
Manager Discussion of Fund Performance
For the 12-month period that ended May 31, 2018, the Fund’s Class A shares returned 10.35% excluding sales charges. The Fund’s benchmark, the Russell 1000 Index, returned 14.60% over the same period. Although stock selection was strong and the Fund delivered solid absolute gains for the period, it lagged the benchmark because it had no exposure to some top performers that the Fund cannot own because they pay no dividends.
Equity markets moved higher despite correction
In a year marked by political tumult and rising tensions with North Korea and Iran, investors focused on domestic issues, namely prospects for stronger economic growth and lower taxes, and drove equity markets higher over the 12-month period ended May 31, 2018. U.S. economic growth picked up, and the unemployment rate fell to 3.8%. The labor market added an average of nearly 200,000 new jobs per month during the period, even though jobs were lost as a result of hurricane disruptions during the third quarter of 2017. Wage growth picked up as the labor market tightened. Corporate tax cuts boosted profitability for most U.S. companies, while global growth and a weaker U.S. dollar raised exports. However, U.S. equity markets pulled back early in 2018, producing the first real correction in over a year. Enthusiasm turned to anxiety as the market contended with heightened rhetoric regarding trade policy and a major security breach from Facebook, which pressured technology companies. The downturn was short-lived, as stocks staged a modest comeback near the end of the period.
In March 2018, the Federal Reserve raised the target range on its key short-term interest rate, the federal funds rate, to 1.50% - 1.75%, citing solid job and economic growth and progress toward its 2.0% inflation target. The 10-year U.S. Treasury yield closed the period at 2.83%. During the 12-month period, the S&P 500 Index, a broad-based measure of U.S. equity returns, gained 14.38%. The Bloomberg Barclays U.S. Aggregate Bond Index, which tracks returns of U.S. investment-grade government and corporate bonds, lost 0.37% as interest rates rose. (Interest rates and bond prices move in opposite directions.)
Contributors and detractors
On a sector basis, financials, industrials, energy and technology were the strongest performers for the Fund relative to the benchmark. In financials, the Fund benefited from a relative overweight and good stock selection. Positions in capital markets delivered especially strong results, led by T. Rowe Price and CME Group. T. Rowe Price benefited from a strong stock market. The company focuses on active management, using its underlying mutual funds to build target-date funds geared to the employee retirement savings market. As one of only two futures and derivatives platforms worldwide, CME is a niche firm in an industry with high barriers to entry. During the year, CME benefited from volatility created around rising interest rates. The company has a strong presence in the energy market and benefited from rising oil prices as well. Bank stocks were solid contributors to Fund gains, benefiting from a more relaxed regulatory environment. For the Fund, JPMorgan Chase, which continued to execute well across all business lines, was a top performer for the year.
In the industrials sector, the Fund continued to gain against the benchmark because it has no exposure to General Electric (GE), a major benchmark holding. The Fund sold GE in 2016. Overweights in rail company Union Pacific and air and defense contractor Boeing also bolstered Fund results. Union Pacific benefited from improved trends in shipping volume as well as in pricing. At the same time, we believed the company’s capital expenditures were poised to come down. Boeing has benefited from expanding world travel, and improved efficiencies have increased the company’s cash flow. These gains were partially offset by a loss in General Dynamics, which lost favor with investors on a new product delay and continued softness in the business jet market. However, we maintained the position because we believed these were temporary setbacks and the potential for increased defense spending has the potential to lift General Dynamics longer term.
Within energy, the rising price of oil drove gains for certain companies in the portfolio that were particularly levered to oil prices. Energy refiner Valero benefited from good management and capital discipline. The price spread between international and domestic oil created a slight advantage for domestic refiners such as Valero. Canadian integrated energy company Suncor was another strong holding. The company restrained its capital expenditures, and cash flow increased as the price of oil rose. We increased a position in integrated oil company Chevron, which had recently completed some major projects and dramatically decreased capital spending.
| 4 | Columbia Dividend Income Fund | Annual Report 2018 |
Manager Discussion of Fund Performance (continued)
Strong stock selection led to solid gains in the technology sector, even though the Fund could not own some of the period’s stronger performers, such as Facebook, Visa, MasterCard, and PayPal, because they do not pay dividends. An overweight in Microsoft continued to lift Fund results relative to the benchmark. Over the last five years, Microsoft has transformed itself, gaining traction with large enterprises with its Azure cloud computing business and also with subscription-based Office 365. The company had an AAA-rated balance sheet, strong free cash flow and solid margins, all positive metrics for investors. Texas Instruments (TI) and Cisco were two more top technology holdings for the Fund. TI, a semiconductor giant, has multiple entries in an expanding list of end markets, where semiconductors have become pervasive in automobiles, industrial automation and consumer products. Networking company Cisco has maintained a significant share of the routing and switching markets. Recurring service-based revenues have risen and we believed the company was well positioned for growth.
The Fund underperformed the benchmark in the consumer discretionary, consumer staples and health care sectors. Lack of exposure to Netflix and Amazon, which are not eligible for portfolio consideration because they do not pay dividends, accounted for approximately two-thirds of the shortfall relative to the benchmark. An overweight in Comcast also detracted from results as investors took a dim view of the company’s interest in battling the Walt Disney Company for Fox’s entertainment assets. Within consumer staples, it was a challenge to find companies that were not under pressure as brand loyalty evaporated, volume was down and pricing power disappeared for established, old-line names such as General Mills and tobacco companies Phillip Morris and Altria. An underweight in health care was a drag on performance, and Fund gains lagged those of the benchmark. Shares of CVS, Merck and Johnson & Johnson all lost ground in a rising market. We sold CVS because of uncertainty regarding the pending acquisition of Aetna, while the Fund retained Merck and Johnson & Johnson.
Portfolio activity
During the period, we established positions in Ameren, Conoco Phillips, General Motors, Gilead Sciences and IBM, among others. Ameren is a Missouri-based utility, which we believed had the potential to benefit from changes in the state’s regulatory environment. Rising oil prices and improved free cash flow lifted Conoco Phillips, which was well positioned in Texas’s Permian Basin, an attractive drilling area. General Motors had demonstrated improved operating efficiency, and our research led us to view the investment as an option on autonomous driving and electrical vehicles. Gilead Sciences is a biotechnology company that trades like a large pharmaceutical company. Even though revenues from Gilead’s hepatitis C therapy have declined, other products have ascended, including those to treat HIV and cancer. IBM revenues had stabilized and we believed the stock was attractively priced. To fund these and other purchases, we took profits in biopharmaceutical company AbbVie after a solid run. We eliminated positions in American Tower and Avalon Bay, both real estate investment trusts. We sold CVS, General Mills, International Paper and Northern Trust on a variety of concerns, including strategy, acquisitions or general execution.
Market risk may affect a single issuer, sector of the economy, industry or the market as a whole. Value securities may be unprofitable if the market fails to recognize their intrinsic worth or the portfolio manager misgauged that worth. Foreign investments subject the Fund to risks, including political, economic, market, social and others within a particular country, as well as to currency instabilities and less stringent financial and accounting standards generally applicable to U.S. issuers. Dividend payments are not guaranteed and the amount, if any, can vary over time. A rise in interest rates may result in a price decline of fixed-income instruments held by the Fund, negatively impacting its performance and NAV. Falling rates may result in the Fund investing in lower yielding debt instruments, lowering the Fund’s income and yield. These risks may be heightened for longer maturity and duration securities. The Fund may invest significantly in issuers within a particular sector, which may be negatively affected by market, economic or other conditions, making the Fund more vulnerable to unfavorable developments in the sector. See the Fund’s prospectus for more information on these and other risks.
The views expressed in this report reflect the current views of the respective parties. These views are not guarantees of future performance and involve certain risks, uncertainties and assumptions that are difficult to predict, so actual outcomes and results may differ significantly from the views expressed. These views are subject to change at any time based upon economic, market or other conditions and the respective parties disclaim any responsibility to update such views. These views may not be relied on as investment advice and, because investment decisions for a Columbia fund are based on numerous factors, may not be relied on as an indication of trading intent on behalf of any particular Columbia fund. References to specific securities should not be construed as a recommendation or investment advice.
Columbia Dividend Income Fund | Annual Report 2018
| 5 |
Understanding Your Fund’s Expenses
(Unaudited)
As an investor, you incur two types of costs. There are transaction costs, which generally include sales charges on purchases and may include redemption fees. There are also ongoing costs, which generally include management fees, distribution and/or service fees, and other fund expenses. The following information is intended to help you understand your ongoing costs (in dollars) of investing in the Fund and to help you compare these costs with the ongoing costs of investing in other mutual funds.
Analyzing your Fund’s expenses
To illustrate these ongoing costs, we have provided examples and calculated the expenses paid by investors in each share class of the Fund during the period. The actual and hypothetical information in the table is based on an initial investment of $1,000 at the beginning of the period indicated and held for the entire period. Expense information is calculated two ways and each method provides you with different information. The amount listed in the “Actual” column is calculated using the Fund’s actual operating expenses and total return for the period. You may use the Actual information, together with the amount invested, to estimate the expenses that you paid over the period. Simply divide your account value by $1,000 (for example, an $8,600 account value divided by $1,000 = 8.6), then multiply the results by the expenses paid during the period under the “Actual” column. The amount listed in the “Hypothetical” column assumes a 5% annual rate of return before expenses (which is not the Fund’s actual return) and then applies the Fund’s actual expense ratio for the period to the hypothetical return. You should not use the hypothetical account values and expenses to estimate either your actual account balance at the end of the period or the expenses you paid during the period. See “Compare with other funds” below for details on how to use the hypothetical data.
Compare with other funds
Since all mutual funds are required to include the same hypothetical calculations about expenses in shareholder reports, you can use this information to compare the ongoing cost of investing in the Fund with other funds. To do so, compare the hypothetical example with the 5% hypothetical examples that appear in the shareholder reports of other funds. As you compare hypothetical examples of other funds, it is important to note that hypothetical examples are meant to highlight the ongoing costs of investing in a fund only and do not reflect any transaction costs, such as sales charges, or redemption or exchange fees. Therefore, the hypothetical calculations are useful in comparing ongoing costs only, and will not help you determine the relative total costs of owning different funds. If transaction costs were included in these calculations, your costs would be higher.
| December 1, 2017 — May 31, 2018 |
| | Account value at the
beginning of the
period ($) | Account value at the
end of the
period ($) | Expenses paid during
the period ($) | Fund’s annualized
expense ratio (%) |
| | Actual | Hypothetical | Actual | Hypothetical | Actual | Hypothetical | Actual |
| Class A | 1,000.00 | 1,000.00 | 998.80 | 1,020.14 | 4.78 | 4.84 | 0.96 |
| Advisor Class | 1,000.00 | 1,000.00 | 1,000.10 | 1,021.39 | 3.54 | 3.58 | 0.71 |
| Class C | 1,000.00 | 1,000.00 | 995.40 | 1,016.40 | 8.51 | 8.60 | 1.71 |
| Institutional Class | 1,000.00 | 1,000.00 | 1,000.50 | 1,021.39 | 3.54 | 3.58 | 0.71 |
| Institutional 2 Class | 1,000.00 | 1,000.00 | 1,001.00 | 1,021.79 | 3.14 | 3.18 | 0.63 |
| Institutional 3 Class | 1,000.00 | 1,000.00 | 1,001.20 | 1,022.04 | 2.89 | 2.92 | 0.58 |
| Class R | 1,000.00 | 1,000.00 | 998.00 | 1,018.90 | 6.03 | 6.09 | 1.21 |
| Class T | 1,000.00 | 1,000.00 | 999.30 | 1,020.14 | 4.79 | 4.84 | 0.96 |
| Class V | 1,000.00 | 1,000.00 | 998.80 | 1,020.14 | 4.78 | 4.84 | 0.96 |
Expenses paid during the period are equal to the annualized expense ratio for each class as indicated above, multiplied by the average account value over the period and then multiplied by the number of days in the Fund’s most recent fiscal half year and divided by 365.
Expenses do not include fees and expenses incurred indirectly by the Fund from its investment in underlying funds, including affiliated and non-affiliated pooled investment vehicles, such as mutual funds and exchange-traded funds.
| 6 | Columbia Dividend Income Fund | Annual Report 2018 |
Portfolio of Investments
May 31, 2018
(Percentages represent value of investments compared to net assets)
Investments in securities
| Common Stocks 95.3% |
| Issuer | Shares | Value ($) |
| Consumer Discretionary 7.7% |
| Automobiles 0.5% |
| General Motors Co. | 1,413,986 | 60,377,202 |
| Hotels, Restaurants & Leisure 0.9% |
| McDonald’s Corp. | 675,500 | 108,086,755 |
| Media 3.4% |
| Comcast Corp., Class A | 6,657,600 | 207,583,968 |
| Time Warner, Inc. | 1,104,283 | 103,979,287 |
| Walt Disney Co. (The) | 749,040 | 74,507,009 |
| Total | | 386,070,264 |
| Specialty Retail 2.9% |
| Home Depot, Inc. (The) | 1,378,749 | 257,205,626 |
| TJX Companies, Inc. (The) | 747,051 | 67,473,646 |
| Total | | 324,679,272 |
| Total Consumer Discretionary | 879,213,493 |
| Consumer Staples 8.6% |
| Beverages 1.9% |
| Coca-Cola European Partners PLC | 1,228,000 | 46,627,160 |
| PepsiCo, Inc. | 1,688,840 | 169,306,210 |
| Total | | 215,933,370 |
| Food & Staples Retailing 1.2% |
| Walmart, Inc. | 1,659,268 | 136,955,981 |
| Food Products 1.2% |
| Kellogg Co. | 2,174,031 | 139,985,856 |
| Household Products 1.4% |
| Kimberly-Clark Corp. | 610,000 | 61,518,500 |
| Procter & Gamble Co. (The) | 1,260,000 | 92,194,200 |
| Total | | 153,712,700 |
| Tobacco 2.9% |
| Altria Group, Inc. | 2,355,728 | 131,308,279 |
| Philip Morris International, Inc. | 2,483,006 | 197,498,297 |
| Total | | 328,806,576 |
| Total Consumer Staples | 975,394,483 |
| Common Stocks (continued) |
| Issuer | Shares | Value ($) |
| Energy 6.6% |
| Oil, Gas & Consumable Fuels 6.6% |
| Chevron Corp. | 1,664,020 | 206,837,686 |
| ConocoPhillips | 805,010 | 54,249,624 |
| Exxon Mobil Corp. | 2,960,906 | 240,544,003 |
| Suncor Energy, Inc. | 3,228,470 | 128,428,537 |
| Valero Energy Corp. | 1,042,000 | 126,290,400 |
| Total | | 756,350,250 |
| Total Energy | 756,350,250 |
| Financials 17.8% |
| Banks 10.5% |
| Bank of America Corp. | 5,407,958 | 157,047,100 |
| BB&T Corp. | 2,276,501 | 119,516,303 |
| JPMorgan Chase & Co. | 4,020,000 | 430,180,200 |
| PNC Financial Services Group, Inc. (The) | 1,312,825 | 188,272,233 |
| U.S. Bancorp | 2,683,091 | 134,127,719 |
| Wells Fargo & Co. | 3,078,331 | 166,199,091 |
| Total | | 1,195,342,646 |
| Capital Markets 4.3% |
| BlackRock, Inc. | 320,550 | 171,247,426 |
| CME Group, Inc. | 1,190,000 | 193,851,000 |
| T. Rowe Price Group, Inc. | 950,000 | 115,349,000 |
| Total | | 480,447,426 |
| Insurance 3.0% |
| Chubb Ltd. | 1,280,000 | 167,283,200 |
| Marsh & McLennan Companies, Inc. | 2,192,000 | 176,171,040 |
| Total | | 343,454,240 |
| Total Financials | 2,019,244,312 |
| Health Care 10.8% |
| Biotechnology 0.4% |
| Gilead Sciences, Inc. | 649,434 | 43,771,852 |
| Health Care Equipment & Supplies 0.6% |
| Medtronic PLC | 822,800 | 71,024,096 |
| Health Care Providers & Services 0.8% |
| UnitedHealth Group, Inc. | 365,949 | 88,380,343 |
The accompanying Notes to Financial Statements are an integral part of this statement.
Columbia Dividend Income Fund | Annual Report 2018
| 7 |
Portfolio of Investments (continued)
May 31, 2018
| Common Stocks (continued) |
| Issuer | Shares | Value ($) |
| Pharmaceuticals 9.0% |
| Bristol-Myers Squibb Co. | 1,270,417 | 66,849,342 |
| Eli Lilly & Co. | 1,043,532 | 88,741,961 |
| Johnson & Johnson | 3,351,801 | 400,942,436 |
| Merck & Co., Inc. | 3,800,000 | 226,214,000 |
| Pfizer, Inc. | 6,716,157 | 241,311,521 |
| Total | | 1,024,059,260 |
| Total Health Care | 1,227,235,551 |
| Industrials 14.8% |
| Aerospace & Defense 5.3% |
| Boeing Co. (The) | 419,197 | 147,624,416 |
| General Dynamics Corp. | 996,781 | 201,060,695 |
| Lockheed Martin Corp. | 807,062 | 253,853,281 |
| Total | | 602,538,392 |
| Commercial Services & Supplies 1.0% |
| Waste Management, Inc. | 1,363,171 | 112,747,873 |
| Industrial Conglomerates 3.4% |
| 3M Co. | 700,000 | 138,061,000 |
| Honeywell International, Inc. | 1,640,000 | 242,572,400 |
| Total | | 380,633,400 |
| Machinery 2.9% |
| Cummins, Inc. | 478,236 | 68,096,024 |
| Ingersoll-Rand PLC | 1,012,064 | 88,596,083 |
| Parker-Hannifin Corp. | 522,500 | 89,295,250 |
| Stanley Black & Decker, Inc. | 588,000 | 81,873,120 |
| Total | | 327,860,477 |
| Road & Rail 2.2% |
| Union Pacific Corp. | 1,775,693 | 253,497,933 |
| Total Industrials | 1,677,278,075 |
| Information Technology 18.5% |
| Communications Equipment 2.4% |
| Cisco Systems, Inc. | 6,523,943 | 278,637,606 |
| IT Services 2.6% |
| Accenture PLC, Class A | 463,675 | 72,212,744 |
| Automatic Data Processing, Inc. | 1,220,000 | 158,624,400 |
| International Business Machines Corp. | 424,319 | 59,960,518 |
| Total | | 290,797,662 |
| Common Stocks (continued) |
| Issuer | Shares | Value ($) |
| Semiconductors & Semiconductor Equipment 6.0% |
| Broadcom, Inc. | 642,497 | 161,954,219 |
| Intel Corp. | 4,331,286 | 239,086,987 |
| KLA-Tencor Corp. | 635,648 | 71,974,423 |
| Texas Instruments, Inc. | 1,847,953 | 206,804,420 |
| Total | | 679,820,049 |
| Software 4.1% |
| Microsoft Corp. | 4,726,737 | 467,190,685 |
| Technology Hardware, Storage & Peripherals 3.4% |
| Apple, Inc. | 2,066,556 | 386,177,320 |
| Total Information Technology | 2,102,623,322 |
| Materials 1.9% |
| Chemicals 1.4% |
| DowDuPont, Inc. | 1,612,735 | 103,392,441 |
| LyondellBasell Industries NV, Class A | 475,000 | 53,257,000 |
| Total | | 156,649,441 |
| Containers & Packaging 0.5% |
| Sonoco Products Co. | 1,146,000 | 58,594,980 |
| Total Materials | 215,244,421 |
| Real Estate 2.8% |
| Equity Real Estate Investment Trusts (REITS) 2.8% |
| Crown Castle International Corp. | 535,362 | 55,757,952 |
| Digital Realty Trust, Inc. | 692,958 | 74,479,126 |
| Duke Realty Corp. | 1,206,500 | 33,926,780 |
| Equity LifeStyle Properties, Inc. | 339,775 | 30,885,548 |
| Essex Property Trust, Inc. | 143,400 | 34,276,902 |
| Public Storage | 439,700 | 93,146,048 |
| Total | | 322,472,356 |
| Total Real Estate | 322,472,356 |
| Telecommunication Services 1.3% |
| Diversified Telecommunication Services 1.3% |
| AT&T, Inc. | 4,718,940 | 152,516,141 |
| Total Telecommunication Services | 152,516,141 |
The accompanying Notes to Financial Statements are an integral part of this statement.
| 8 | Columbia Dividend Income Fund | Annual Report 2018 |
Portfolio of Investments (continued)
May 31, 2018
| Common Stocks (continued) |
| Issuer | Shares | Value ($) |
| Utilities 4.5% |
| Electric Utilities 2.1% |
| American Electric Power Co., Inc. | 1,266,345 | 86,048,143 |
| Eversource Energy | 1,049,500 | 59,905,460 |
| NextEra Energy, Inc. | 525,000 | 87,050,250 |
| Total | | 233,003,853 |
| Multi-Utilities 2.4% |
| Ameren Corp. | 1,146,965 | 67,888,858 |
| CMS Energy Corp. | 1,605,000 | 74,038,650 |
| Dominion Energy, Inc. | 705,000 | 45,253,950 |
| WEC Energy Group, Inc. | 1,425,132 | 89,997,086 |
| Total | | 277,178,544 |
| Total Utilities | 510,182,397 |
Total Common Stocks
(Cost $6,725,584,011) | 10,837,754,801 |
|
| Exchange-Traded Funds 0.8% |
| | Shares | Value ($) |
| iShares Russell 1000 Value ETF | 715,000 | 86,550,750 |
Total Exchange-Traded Funds
(Cost $86,386,300) | 86,550,750 |
|
| Money Market Funds 3.6% |
| | |
| Columbia Short-Term Cash Fund, 1.907%(a),(b) | 404,537,136 | 404,537,136 |
Total Money Market Funds
(Cost $404,525,863) | 404,537,136 |
Total Investments in Securities
(Cost: $7,216,496,174) | 11,328,842,687 |
| Other Assets & Liabilities, Net | | 39,694,848 |
| Net Assets | 11,368,537,535 |
Notes to Portfolio of Investments
| (a) | The rate shown is the seven-day current annualized yield at May 31, 2018. |
| (b) | As defined in the Investment Company Act of 1940, an affiliated company is one in which the Fund owns 5% or more of the company’s outstanding voting securities, or a company which is under common ownership or control with the Fund. Holdings and transactions in these affiliated companies during the year ended May 31, 2018 are as follows: |
| Issuer | Beginning
shares | Shares
purchased | Shares
sold | Ending
shares | Realized gain
(loss) —
affiliated
issuers ($) | Net change in
unrealized
appreciation
(depreciation) —
affiliated
issuers ($) | Dividends —
affiliated
issuers ($) | Value —
affiliated
issuers
at end of
period ($) |
| Columbia Short-Term Cash Fund, 1.907% |
| | 261,665,545 | 838,982,906 | (696,111,315) | 404,537,136 | 7,686 | 11,979 | 3,548,700 | 404,537,136 |
Fair value measurements
The Fund categorizes its fair value measurements according to a three-level hierarchy that maximizes the use of observable inputs and minimizes the use of unobservable inputs by prioritizing that the most observable input be used when available. Observable inputs are those that market participants would use in pricing an investment based on market data obtained from sources independent of the reporting entity. Unobservable inputs are those that reflect the Fund’s assumptions about the information market participants would use in pricing an investment. An investment’s level within the fair value hierarchy is based on the lowest level of any input that is deemed significant to the asset’s or liability’s fair value measurement. The input levels are not necessarily an indication of the risk or liquidity associated with investments at that level. For example, certain U.S. government securities are generally high quality and liquid, however, they are reflected as Level 2 because the inputs used to determine fair value may not always be quoted prices in an active market.
Fair value inputs are summarized in the three broad levels listed below:
| ■ | Level 1 — Valuations based on quoted prices for investments in active markets that the Fund has the ability to access at the measurement date. Valuation adjustments are not applied to Level 1 investments. |
| ■ | Level 2 — Valuations based on other significant observable inputs (including quoted prices for similar securities, interest rates, prepayment speeds, credit risks, etc.). |
| ■ | Level 3 — Valuations based on significant unobservable inputs (including the Fund’s own assumptions and judgment in determining the fair value of investments). |
Inputs that are used in determining fair value of an investment may include price information, credit data, volatility statistics, and other factors. These inputs can be either observable or unobservable. The availability of observable inputs can vary between investments, and is affected by various factors such as the type of investment, and the volume and level of activity for that investment or similar investments in the marketplace. The inputs will be considered by the Investment Manager, along with any other relevant factors in the calculation of an investment’s fair value. The Fund uses prices and inputs that are current as of the measurement date, which may include periods of market dislocations. During these periods, the availability of prices and inputs may be reduced for many investments. This condition could cause an investment to be reclassified between the various levels within the hierarchy.
The accompanying Notes to Financial Statements are an integral part of this statement.
Columbia Dividend Income Fund | Annual Report 2018
| 9 |
Portfolio of Investments (continued)
May 31, 2018
Fair value measurements (continued)
Certain investments that have been measured at fair value using the net asset value (NAV) per share (or its equivalent) are not categorized in the fair value hierarchy. The fair value amounts presented in the table are intended to reconcile the fair value hierarchy to the amounts presented in the Portfolio of Investments. The Columbia Short-Term Cash Fund seeks to provide shareholders with maximum current income consistent with liquidity and stability of principal. Columbia Short-Term Cash Fund prices its shares with a floating NAV and no longer seeks to maintain a stable NAV.
Investments falling into the Level 3 category are primarily supported by quoted prices from brokers and dealers participating in the market for those investments. However, these may be classified as Level 3 investments due to lack of market transparency and corroboration to support these quoted prices. Additionally, valuation models may be used as the pricing source for any remaining investments classified as Level 3. These models may rely on one or more significant unobservable inputs and/or significant assumptions by the Investment Manager. Inputs used in valuations may include, but are not limited to, financial statement analysis, capital account balances, discount rates and estimated cash flows, and comparable company data.
Under the direction of the Fund’s Board of Trustees (the Board), the Investment Manager’s Valuation Committee (the Committee) is responsible for overseeing the valuation procedures approved by the Board. The Committee consists of voting and non-voting members from various groups within the Investment Manager’s organization, including operations and accounting, trading and investments, compliance, risk management and legal.
The Committee meets at least monthly to review and approve valuation matters, which may include a description of specific valuation determinations, data regarding pricing information received from approved pricing vendors and brokers and the results of Board-approved valuation control policies and procedures (the Policies). The Policies address, among other things, instances when market quotations are or are not readily available, including recommendations of third party pricing vendors and a determination of appropriate pricing methodologies; events that require specific valuation determinations and assessment of fair value techniques; securities with a potential for stale pricing, including those that are illiquid, restricted, or in default; and the effectiveness of third party pricing vendors, including periodic reviews of vendors. The Committee meets more frequently, as needed, to discuss additional valuation matters, which may include the need to review back-testing results, review time-sensitive information or approve related valuation actions. The Committee reports to the Board, with members of the Committee meeting with the Board at each of its regularly scheduled meetings to discuss valuation matters and actions during the period, similar to those described earlier.
For investments categorized as Level 3, the Committee monitors information similar to that described above, which may include: (i) data specific to the issuer or comparable issuers, (ii) general market or specific sector news and (iii) quoted prices and specific or similar security transactions. The Committee considers this data and any changes from prior periods in order to assess the reasonableness of observable and unobservable inputs, any assumptions or internal models used to value those securities and changes in fair value. This data is also used to corroborate, when available, information received from approved pricing vendors and brokers. Various factors impact the frequency of monitoring this information (which may occur as often as daily). However, the Committee may determine that changes to inputs, assumptions and models are not required as a result of the monitoring procedures performed.
The following table is a summary of the inputs used to value the Fund’s investments at May 31, 2018:
| | Level 1
quoted prices
in active
markets for
identical
assets ($) | Level 2
other
significant
observable
inputs ($) | Level 3
significant
unobservable
inputs ($) | Investments
measured at
net asset
value ($) | Total ($) |
| Investments in Securities | | | | | |
| Common Stocks | | | | | |
| Consumer Discretionary | 879,213,493 | — | — | — | 879,213,493 |
| Consumer Staples | 975,394,483 | — | — | — | 975,394,483 |
| Energy | 756,350,250 | — | — | — | 756,350,250 |
| Financials | 2,019,244,312 | — | — | — | 2,019,244,312 |
| Health Care | 1,227,235,551 | — | — | — | 1,227,235,551 |
| Industrials | 1,677,278,075 | — | — | — | 1,677,278,075 |
| Information Technology | 2,102,623,322 | — | — | — | 2,102,623,322 |
| Materials | 215,244,421 | — | — | — | 215,244,421 |
| Real Estate | 322,472,356 | — | — | — | 322,472,356 |
| Telecommunication Services | 152,516,141 | — | — | — | 152,516,141 |
| Utilities | 510,182,397 | — | — | — | 510,182,397 |
| Total Common Stocks | 10,837,754,801 | — | — | — | 10,837,754,801 |
| Exchange-Traded Funds | 86,550,750 | — | — | — | 86,550,750 |
| Money Market Funds | — | — | — | 404,537,136 | 404,537,136 |
| Total Investments in Securities | 10,924,305,551 | — | — | 404,537,136 | 11,328,842,687 |
See the Portfolio of Investments for all investment classifications not indicated in the table.
There were no transfers of financial assets between levels during the period.
The accompanying Notes to Financial Statements are an integral part of this statement.
| 10 | Columbia Dividend Income Fund | Annual Report 2018 |
Statement of Assets and Liabilities
May 31, 2018
| Assets | |
| Investments in securities, at value | |
| Unaffiliated issuers (cost $6,811,970,311) | $10,924,305,551 |
| Affiliated issuers (cost $404,525,863) | 404,537,136 |
| Receivable for: | |
| Capital shares sold | 18,860,426 |
| Dividends | 34,801,792 |
| Prepaid expenses | 6,917 |
| Trustees’ deferred compensation plan | 377,478 |
| Total assets | 11,382,889,300 |
| Liabilities | |
| Payable for: | |
| Capital shares purchased | 12,132,365 |
| Management services fees | 175,201 |
| Distribution and/or service fees | 37,005 |
| Transfer agent fees | 1,364,970 |
| Compensation of board members | 7,663 |
| Compensation of chief compliance officer | 738 |
| Other expenses | 256,345 |
| Trustees’ deferred compensation plan | 377,478 |
| Total liabilities | 14,351,765 |
| Net assets applicable to outstanding capital stock | $11,368,537,535 |
| Represented by | |
| Paid in capital | 6,936,600,998 |
| Undistributed net investment income | 36,186,954 |
| Accumulated net realized gain | 283,403,070 |
| Unrealized appreciation (depreciation) on: | |
| Investments - unaffiliated issuers | 4,112,335,240 |
| Investments - affiliated issuers | 11,273 |
| Total - representing net assets applicable to outstanding capital stock | $11,368,537,535 |
The accompanying Notes to Financial Statements are an integral part of this statement.
Columbia Dividend Income Fund | Annual Report 2018
| 11 |
Statement of Assets and Liabilities (continued)
May 31, 2018
| Class A | |
| Net assets | $1,834,771,514 |
| Shares outstanding | 84,820,133 |
| Net asset value per share | $21.63 |
| Maximum sales charge | 5.75% |
| Maximum offering price per share (calculated by dividing the net asset value per share by 1.0 minus the maximum sales charge for Class A shares) | $22.95 |
| Advisor Class | |
| Net assets | $564,834,032 |
| Shares outstanding | 25,672,585 |
| Net asset value per share | $22.00 |
| Class C | |
| Net assets | $809,268,880 |
| Shares outstanding | 38,634,334 |
| Net asset value per share | $20.95 |
| Institutional Class | |
| Net assets | $4,781,048,756 |
| Shares outstanding | 220,742,438 |
| Net asset value per share | $21.66 |
| Institutional 2 Class | |
| Net assets | $605,284,925 |
| Shares outstanding | 27,529,511 |
| Net asset value per share | $21.99 |
| Institutional 3 Class | |
| Net assets | $2,587,372,065 |
| Shares outstanding | 117,519,823 |
| Net asset value per share | $22.02 |
| Class R | |
| Net assets | $104,035,784 |
| Shares outstanding | 4,808,227 |
| Net asset value per share | $21.64 |
| Class T | |
| Net assets | $46,239 |
| Shares outstanding | 2,139 |
| Net asset value per share | $21.62 |
| Maximum sales charge | 2.50% |
| Maximum offering price per share (calculated by dividing the net asset value per share by 1.0 minus the maximum sales charge per transaction for Class T shares) | $22.17 |
| Class V | |
| Net assets | $81,875,340 |
| Shares outstanding | 3,783,310 |
| Net asset value per share | $21.64 |
| Maximum sales charge | 5.75% |
| Maximum offering price per share (calculated by dividing the net asset value per share by 1.0 minus the maximum sales charge for Class V shares) | $22.96 |
The accompanying Notes to Financial Statements are an integral part of this statement.
| 12 | Columbia Dividend Income Fund | Annual Report 2018 |
Statement of Operations
Year Ended May 31, 2018
| Net investment income | |
| Income: | |
| Dividends — unaffiliated issuers | $285,674,040 |
| Dividends — affiliated issuers | 3,548,700 |
| Interfund lending | 499 |
| Foreign taxes withheld | (367,317) |
| Total income | 288,855,922 |
| Expenses: | |
| Management services fees | 61,556,409 |
| Distribution and/or service fees | |
| Class A | 4,545,343 |
| Class B | 1,236 |
| Class C | 7,892,966 |
| Class R | 514,160 |
| Class T | 134 |
| Class V | 203,911 |
| Transfer agent fees | |
| Class A | 2,608,023 |
| Advisor Class | 682,896 |
| Class B | 195 |
| Class C | 1,132,367 |
| Institutional Class | 7,211,133 |
| Institutional 2 Class | 338,675 |
| Institutional 3 Class | 173,936 |
| Class R | 147,519 |
| Class T | 77 |
| Class V | 116,996 |
| Compensation of board members | 192,140 |
| Custodian fees | 60,887 |
| Printing and postage fees | 423,406 |
| Registration fees | 297,421 |
| Audit fees | 34,883 |
| Legal fees | 249,926 |
| Compensation of chief compliance officer | 4,369 |
| Other | 267,386 |
| Total expenses | 88,656,394 |
| Expense reduction | (3,327) |
| Total net expenses | 88,653,067 |
| Net investment income | 200,202,855 |
| Realized and unrealized gain (loss) — net | |
| Net realized gain (loss) on: | |
| Investments — unaffiliated issuers | 486,505,744 |
| Investments — affiliated issuers | 7,686 |
| Foreign currency translations | 17,141 |
| Net realized gain | 486,530,571 |
| Net change in unrealized appreciation (depreciation) on: | |
| Investments — unaffiliated issuers | 393,027,115 |
| Investments — affiliated issuers | 11,979 |
| Net change in unrealized appreciation (depreciation) | 393,039,094 |
| Net realized and unrealized gain | 879,569,665 |
| Net increase in net assets resulting from operations | $1,079,772,520 |
The accompanying Notes to Financial Statements are an integral part of this statement.
Columbia Dividend Income Fund | Annual Report 2018
| 13 |
Statement of Changes in Net Assets
| | Year Ended
May 31, 2018 | Year Ended
May 31, 2017 |
| Operations | | |
| Net investment income | $200,202,855 | $180,573,854 |
| Net realized gain | 486,530,571 | 166,172,836 |
| Net change in unrealized appreciation (depreciation) | 393,039,094 | 1,075,002,594 |
| Net increase in net assets resulting from operations | 1,079,772,520 | 1,421,749,284 |
| Distributions to shareholders | | |
| Net investment income | | |
| Class A | (29,088,074) | (37,627,869) |
| Advisor Class | (8,458,603) | (5,575,531) |
| Class B | (1,895) | (35,879) |
| Class C | (7,018,756) | (7,060,195) |
| Class I | — | (2,814,423) |
| Institutional Class | (93,175,912) | (101,128,414) |
| Institutional 2 Class | (11,020,397) | (9,356,423) |
| Institutional 3 Class | (40,487,286) | (6,330,936) |
| Class R | (1,393,541) | (1,306,961) |
| Class T | (883) | (1,462) |
| Class V | (1,310,173) | (1,272,666) |
| Net realized gains | | |
| Class A | (49,183,530) | (56,795,302) |
| Advisor Class | (13,038,772) | (6,865,325) |
| Class B | — | (93,412) |
| Class C | (21,936,334) | (17,670,070) |
| Class I | — | (2,693,321) |
| Institutional Class | (125,178,988) | (117,094,884) |
| Institutional 2 Class | (16,023,229) | (10,746,353) |
| Institutional 3 Class | (67,916,233) | (7,726,783) |
| Class R | (2,830,029) | (2,165,669) |
| Class T | (1,553) | (2,264) |
| Class V | (2,220,665) | (1,762,889) |
| Total distributions to shareholders | (490,284,853) | (396,127,031) |
| Increase in net assets from capital stock activity | 419,653,448 | 280,181,713 |
| Total increase in net assets | 1,009,141,115 | 1,305,803,966 |
| Net assets at beginning of year | 10,359,396,420 | 9,053,592,454 |
| Net assets at end of year | $11,368,537,535 | $10,359,396,420 |
| Undistributed net investment income | $36,186,954 | $30,021,301 |
The accompanying Notes to Financial Statements are an integral part of this statement.
| 14 | Columbia Dividend Income Fund | Annual Report 2018 |
Statement of Changes in Net Assets (continued)
| | Year Ended | Year Ended |
| | May 31, 2018 | May 31, 2017 |
| | Shares | Dollars ($) | Shares | Dollars ($) |
| Capital stock activity |
| Class A | | | | |
| Subscriptions | 17,511,638 | 379,470,969 | 29,695,879 | 567,733,173 |
| Distributions reinvested | 3,231,282 | 70,143,797 | 4,571,689 | 87,268,866 |
| Redemptions | (21,454,678) | (461,700,501) | (77,924,997) | (1,532,793,249) |
| Net decrease | (711,758) | (12,085,735) | (43,657,429) | (877,791,210) |
| Advisor Class | | | | |
| Subscriptions | 11,478,715 | 251,688,447 | 9,947,550 | 194,943,152 |
| Distributions reinvested | 918,479 | 20,274,699 | 574,766 | 11,180,689 |
| Redemptions | (5,478,534) | (120,722,603) | (4,106,859) | (80,789,222) |
| Net increase | 6,918,660 | 151,240,543 | 6,415,457 | 125,334,619 |
| Class B | | | | |
| Subscriptions | 100 | 2,020 | 6,694 | 127,739 |
| Distributions reinvested | 89 | 1,780 | 5,693 | 105,580 |
| Redemptions | (56,090) | (1,126,171) | (220,684) | (4,194,521) |
| Net decrease | (55,901) | (1,122,371) | (208,297) | (3,961,202) |
| Class C | | | | |
| Subscriptions | 6,373,408 | 133,839,759 | 7,689,756 | 143,049,052 |
| Distributions reinvested | 1,200,665 | 25,359,885 | 1,099,241 | 20,414,237 |
| Redemptions | (7,454,781) | (155,118,868) | (8,982,100) | (168,696,541) |
| Net increase (decrease) | 119,292 | 4,080,776 | (193,103) | (5,233,252) |
| Class I | | | | |
| Subscriptions | — | — | 1,352,872 | 25,226,903 |
| Distributions reinvested | — | — | 288,336 | 5,507,628 |
| Redemptions | — | — | (11,082,601) | (216,652,243) |
| Net decrease | — | — | (9,441,393) | (185,917,712) |
| Institutional Class | | | | |
| Subscriptions | 52,343,228 | 1,129,615,263 | 112,856,692 | 2,212,408,393 |
| Distributions reinvested | 8,420,382 | 182,791,552 | 6,098,628 | 116,881,045 |
| Redemptions | (139,802,688) | (2,930,608,758) | (77,553,354) | (1,500,061,244) |
| Net increase (decrease) | (79,039,078) | (1,618,201,943) | 41,401,966 | 829,228,194 |
| Institutional 2 Class | | | | |
| Subscriptions | 8,527,399 | 187,833,934 | 7,235,464 | 141,396,798 |
| Distributions reinvested | 1,205,084 | 26,549,062 | 1,003,214 | 19,477,627 |
| Redemptions | (7,443,275) | (164,214,675) | (5,254,991) | (103,257,837) |
| Net increase | 2,289,208 | 50,168,321 | 2,983,687 | 57,616,588 |
| Institutional 3 Class | | | | |
| Subscriptions | 105,278,808 | 2,225,816,279 | 20,553,514 | 407,513,662 |
| Distributions reinvested | 1,512,712 | 33,378,585 | 695,268 | 13,532,540 |
| Redemptions | (18,635,214) | (411,779,299) | (4,068,442) | (79,569,159) |
| Net increase | 88,156,306 | 1,847,415,565 | 17,180,340 | 341,477,043 |
| Class R | | | | |
| Subscriptions | 1,171,822 | 25,323,379 | 1,293,128 | 24,831,054 |
| Distributions reinvested | 172,849 | 3,758,759 | 161,141 | 3,084,149 |
| Redemptions | (1,388,451) | (30,060,753) | (1,217,628) | (23,505,280) |
| Net increase (decrease) | (43,780) | (978,615) | 236,641 | 4,409,923 |
| Class T | | | | |
| Subscriptions | 88 | 1,950 | — | — |
| Distributions reinvested | 103 | 2,240 | 189 | 3,621 |
| Redemptions | (922) | (19,887) | (2,632) | (52,712) |
| Net decrease | (731) | (15,697) | (2,443) | (49,091) |
The accompanying Notes to Financial Statements are an integral part of this statement.
Columbia Dividend Income Fund | Annual Report 2018
| 15 |
Statement of Changes in Net Assets (continued)
| | Year Ended | Year Ended |
| | May 31, 2018 | May 31, 2017 |
| | Shares | Dollars ($) | Shares | Dollars ($) |
| Class V | | | | |
| Subscriptions | 190,907 | 4,209,314 | 43,144 | 830,934 |
| Distributions reinvested | 131,262 | 2,850,934 | 127,283 | 2,434,352 |
| Redemptions | (365,995) | (7,907,644) | (423,748) | (8,197,473) |
| Net decrease | (43,826) | (847,396) | (253,321) | (4,932,187) |
| Total net increase | 17,588,392 | 419,653,448 | 14,462,105 | 280,181,713 |
The accompanying Notes to Financial Statements are an integral part of this statement.
| 16 | Columbia Dividend Income Fund | Annual Report 2018 |
[THIS PAGE INTENTIONALLY LEFT BLANK]
Columbia Dividend Income Fund | Annual Report 2018
| 17 |
The following table is intended to help you understand the Fund’s financial performance. Certain information reflects financial results for a single share of a class held for the periods shown. Per share net investment income (loss) amounts are calculated based on average shares outstanding during the period. Total return assumes reinvestment of all dividends and distributions, if any. Total return does not reflect payment of sales charges, if any. Total return and portfolio turnover are not annualized for periods of less than one year. The portfolio turnover rate is calculated without regard to purchase and sales transactions of short-term instruments and certain derivatives, if any. If such transactions were included, the Fund’s portfolio turnover rate may be higher.
| | Net asset value,
beginning of
period | Net
investment
income | Net
realized
and
unrealized
gain | Total from
investment
operations | Distributions
from net
investment
income | Distributions
from net
realized
gains | Total
distributions to
shareholders |
| Class A |
| Year Ended 5/31/2018 | $20.46 | 0.36 | 1.75 | 2.11 | (0.34) | (0.60) | (0.94) |
| Year Ended 5/31/2017 | $18.43 | 0.34 | 2.46 | 2.80 | (0.32) | (0.45) | (0.77) |
| Year Ended 5/31/2016 | $19.07 | 0.32 | 0.43 | 0.75 | (0.45) | (0.94) | (1.39) |
| Year Ended 5/31/2015 | $19.02 | 0.48 | 1.17 | 1.65 | (0.40) | (1.20) | (1.60) |
| Year Ended 5/31/2014 | $17.05 | 0.35 | 2.20 | 2.55 | (0.34) | (0.24) | (0.58) |
| Advisor Class |
| Year Ended 5/31/2018 | $20.80 | 0.42 | 1.78 | 2.20 | (0.40) | (0.60) | (1.00) |
| Year Ended 5/31/2017 | $18.71 | 0.39 | 2.52 | 2.91 | (0.37) | (0.45) | (0.82) |
| Year Ended 5/31/2016 | $19.34 | 0.37 | 0.44 | 0.81 | (0.50) | (0.94) | (1.44) |
| Year Ended 5/31/2015 | $19.27 | 0.57 | 1.14 | 1.71 | (0.44) | (1.20) | (1.64) |
| Year Ended 5/31/2014 | $17.27 | 0.42 | 2.20 | 2.62 | (0.38) | (0.24) | (0.62) |
| Class C |
| Year Ended 5/31/2018 | $19.84 | 0.19 | 1.70 | 1.89 | (0.18) | (0.60) | (0.78) |
| Year Ended 5/31/2017 | $17.88 | 0.18 | 2.41 | 2.59 | (0.18) | (0.45) | (0.63) |
| Year Ended 5/31/2016 | $18.54 | 0.18 | 0.41 | 0.59 | (0.31) | (0.94) | (1.25) |
| Year Ended 5/31/2015 | $18.53 | 0.34 | 1.12 | 1.46 | (0.25) | (1.20) | (1.45) |
| Year Ended 5/31/2014 | $16.63 | 0.21 | 2.13 | 2.34 | (0.20) | (0.24) | (0.44) |
| Institutional Class |
| Year Ended 5/31/2018 | $20.48 | 0.41 | 1.77 | 2.18 | (0.40) | (0.60) | (1.00) |
| Year Ended 5/31/2017 | $18.45 | 0.38 | 2.47 | 2.85 | (0.37) | (0.45) | (0.82) |
| Year Ended 5/31/2016 | $19.09 | 0.36 | 0.44 | 0.80 | (0.50) | (0.94) | (1.44) |
| Year Ended 5/31/2015 | $19.03 | 0.53 | 1.18 | 1.71 | (0.45) | (1.20) | (1.65) |
| Year Ended 5/31/2014 | $17.07 | 0.39 | 2.19 | 2.58 | (0.38) | (0.24) | (0.62) |
| Institutional 2 Class |
| Year Ended 5/31/2018 | $20.78 | 0.44 | 1.79 | 2.23 | (0.42) | (0.60) | (1.02) |
| Year Ended 5/31/2017 | $18.71 | 0.41 | 2.50 | 2.91 | (0.39) | (0.45) | (0.84) |
| Year Ended 5/31/2016 | $19.33 | 0.39 | 0.45 | 0.84 | (0.52) | (0.94) | (1.46) |
| Year Ended 5/31/2015 | $19.26 | 0.62 | 1.12 | 1.74 | (0.47) | (1.20) | (1.67) |
| Year Ended 5/31/2014 | $17.26 | 0.43 | 2.21 | 2.64 | (0.40) | (0.24) | (0.64) |
The accompanying Notes to Financial Statements are an integral part of this statement.
| 18 | Columbia Dividend Income Fund | Annual Report 2018 |
Financial Highlights (continued)
| | Net
asset
value,
end of
period | Total
return | Total gross
expense
ratio to
average
net assets(a) | Total net
expense
ratio to
average
net assets(a),(b) | Net investment
income
ratio to
average
net assets | Portfolio
turnover | Net
assets,
end of
period
(000’s) |
| Class A |
| Year Ended 5/31/2018 | $21.63 | 10.35% | 0.97% | 0.97% (c) | 1.66% | 15% | $1,834,772 |
| Year Ended 5/31/2017 | $20.46 | 15.52% | 1.00% | 1.00% (c) | 1.74% | 16% | $1,750,090 |
| Year Ended 5/31/2016 | $18.43 | 4.42% | 1.02% | 1.02% (c) | 1.74% | 25% | $2,380,538 |
| Year Ended 5/31/2015 | $19.07 | 9.08% | 1.02% | 1.02% (c) | 2.52% | 27% | $2,514,422 |
| Year Ended 5/31/2014 | $19.02 | 15.25% | 1.02% | 1.02% (c) | 1.96% | 19% | $2,556,782 |
| Advisor Class |
| Year Ended 5/31/2018 | $22.00 | 10.60% | 0.72% | 0.72% (c) | 1.93% | 15% | $564,834 |
| Year Ended 5/31/2017 | $20.80 | 15.89% | 0.75% | 0.75% (c) | 1.99% | 16% | $390,004 |
| Year Ended 5/31/2016 | $18.71 | 4.67% | 0.77% | 0.77% (c) | 2.01% | 25% | $230,893 |
| Year Ended 5/31/2015 | $19.34 | 9.33% | 0.77% | 0.77% (c) | 2.93% | 27% | $179,306 |
| Year Ended 5/31/2014 | $19.27 | 15.51% | 0.77% | 0.77% (c) | 2.29% | 19% | $123,274 |
| Class C |
| Year Ended 5/31/2018 | $20.95 | 9.53% | 1.72% | 1.72% (c) | 0.91% | 15% | $809,269 |
| Year Ended 5/31/2017 | $19.84 | 14.73% | 1.75% | 1.75% (c) | 0.99% | 16% | $764,036 |
| Year Ended 5/31/2016 | $17.88 | 3.62% | 1.78% | 1.78% (c) | 1.00% | 25% | $692,229 |
| Year Ended 5/31/2015 | $18.54 | 8.26% | 1.77% | 1.77% (c) | 1.83% | 27% | $667,300 |
| Year Ended 5/31/2014 | $18.53 | 14.33% | 1.77% | 1.77% (c) | 1.24% | 19% | $601,468 |
| Institutional Class |
| Year Ended 5/31/2018 | $21.66 | 10.67% | 0.72% | 0.72% (c) | 1.89% | 15% | $4,781,049 |
| Year Ended 5/31/2017 | $20.48 | 15.79% | 0.75% | 0.75% (c) | 1.98% | 16% | $6,140,961 |
| Year Ended 5/31/2016 | $18.45 | 4.69% | 0.77% | 0.77% (c) | 2.00% | 25% | $4,766,037 |
| Year Ended 5/31/2015 | $19.09 | 9.40% | 0.77% | 0.77% (c) | 2.76% | 27% | $4,800,733 |
| Year Ended 5/31/2014 | $19.03 | 15.46% | 0.77% | 0.77% (c) | 2.22% | 19% | $5,062,852 |
| Institutional 2 Class |
| Year Ended 5/31/2018 | $21.99 | 10.76% | 0.63% | 0.63% | 2.00% | 15% | $605,285 |
| Year Ended 5/31/2017 | $20.78 | 15.92% | 0.63% | 0.63% | 2.10% | 16% | $524,608 |
| Year Ended 5/31/2016 | $18.71 | 4.88% | 0.64% | 0.64% | 2.14% | 25% | $416,310 |
| Year Ended 5/31/2015 | $19.33 | 9.48% | 0.63% | 0.63% | 3.19% | 27% | $313,051 |
| Year Ended 5/31/2014 | $19.26 | 15.68% | 0.64% | 0.64% | 2.41% | 19% | $156,525 |
The accompanying Notes to Financial Statements are an integral part of this statement.
Columbia Dividend Income Fund | Annual Report 2018
| 19 |
Financial Highlights (continued)
| | Net asset value,
beginning of
period | Net
investment
income | Net
realized
and
unrealized
gain | Total from
investment
operations | Distributions
from net
investment
income | Distributions
from net
realized
gains | Total
distributions to
shareholders |
| Institutional 3 Class |
| Year Ended 5/31/2018 | $20.80 | 0.46 | 1.78 | 2.24 | (0.42) | (0.60) | (1.02) |
| Year Ended 5/31/2017 | $18.72 | 0.43 | 2.50 | 2.93 | (0.40) | (0.45) | (0.85) |
| Year Ended 5/31/2016 | $19.35 | 0.40 | 0.44 | 0.84 | (0.53) | (0.94) | (1.47) |
| Year Ended 5/31/2015 | $19.27 | 0.66 | 1.10 | 1.76 | (0.48) | (1.20) | (1.68) |
| Year Ended 5/31/2014 | $17.27 | 0.47 | 2.18 | 2.65 | (0.41) | (0.24) | (0.65) |
| Class R |
| Year Ended 5/31/2018 | $20.47 | 0.30 | 1.76 | 2.06 | (0.29) | (0.60) | (0.89) |
| Year Ended 5/31/2017 | $18.43 | 0.29 | 2.47 | 2.76 | (0.27) | (0.45) | (0.72) |
| Year Ended 5/31/2016 | $19.07 | 0.27 | 0.43 | 0.70 | (0.40) | (0.94) | (1.34) |
| Year Ended 5/31/2015 | $19.02 | 0.44 | 1.16 | 1.60 | (0.35) | (1.20) | (1.55) |
| Year Ended 5/31/2014 | $17.05 | 0.31 | 2.19 | 2.50 | (0.29) | (0.24) | (0.53) |
| Class T |
| Year Ended 5/31/2018 | $20.45 | 0.36 | 1.75 | 2.11 | (0.34) | (0.60) | (0.94) |
| Year Ended 5/31/2017 | $18.42 | 0.34 | 2.46 | 2.80 | (0.32) | (0.45) | (0.77) |
| Year Ended 5/31/2016 | $19.06 | 0.32 | 0.43 | 0.75 | (0.45) | (0.94) | (1.39) |
| Year Ended 5/31/2015 | $19.01 | 0.47 | 1.18 | 1.65 | (0.40) | (1.20) | (1.60) |
| Year Ended 5/31/2014 | $17.05 | 0.31 | 2.23 | 2.54 | (0.34) | (0.24) | (0.58) |
| Class V |
| Year Ended 5/31/2018 | $20.47 | 0.36 | 1.75 | 2.11 | (0.34) | (0.60) | (0.94) |
| Year Ended 5/31/2017 | $18.43 | 0.33 | 2.48 | 2.81 | (0.32) | (0.45) | (0.77) |
| Year Ended 5/31/2016 | $19.07 | 0.32 | 0.43 | 0.75 | (0.45) | (0.94) | (1.39) |
| Year Ended 5/31/2015 | $19.02 | 0.48 | 1.16 | 1.64 | (0.39) | (1.20) | (1.59) |
| Year Ended 5/31/2014 | $17.05 | 0.34 | 2.20 | 2.54 | (0.33) | (0.24) | (0.57) |
| Notes to Financial Highlights |
| (a) | In addition to the fees and expenses that the Fund bears directly, the Fund indirectly bears a pro rata share of the fees and expenses of any other funds in which it invests. Such indirect expenses are not included in the Fund’s reported expense ratios. |
| (b) | Total net expenses include the impact of certain fee waivers/expense reimbursements made by the Investment Manager and certain of its affiliates, if applicable. |
| (c) | The benefits derived from expense reductions had an impact of less than 0.01%. |
The accompanying Notes to Financial Statements are an integral part of this statement.
| 20 | Columbia Dividend Income Fund | Annual Report 2018 |
Financial Highlights (continued)
| | Net
asset
value,
end of
period | Total
return | Total gross
expense
ratio to
average
net assets(a) | Total net
expense
ratio to
average
net assets(a),(b) | Net investment
income
ratio to
average
net assets | Portfolio
turnover | Net
assets,
end of
period
(000’s) |
| Institutional 3 Class |
| Year Ended 5/31/2018 | $22.02 | 10.84% | 0.59% | 0.59% | 2.08% | 15% | $2,587,372 |
| Year Ended 5/31/2017 | $20.80 | 16.03% | 0.59% | 0.59% | 2.17% | 16% | $610,882 |
| Year Ended 5/31/2016 | $18.72 | 4.87% | 0.59% | 0.59% | 2.19% | 25% | $228,089 |
| Year Ended 5/31/2015 | $19.35 | 9.59% | 0.59% | 0.59% | 3.41% | 27% | $171,392 |
| Year Ended 5/31/2014 | $19.27 | 15.72% | 0.59% | 0.59% | 2.58% | 19% | $78,674 |
| Class R |
| Year Ended 5/31/2018 | $21.64 | 10.07% | 1.22% | 1.22% (c) | 1.41% | 15% | $104,036 |
| Year Ended 5/31/2017 | $20.47 | 15.29% | 1.25% | 1.25% (c) | 1.49% | 16% | $99,305 |
| Year Ended 5/31/2016 | $18.43 | 4.15% | 1.27% | 1.27% (c) | 1.49% | 25% | $85,066 |
| Year Ended 5/31/2015 | $19.07 | 8.80% | 1.27% | 1.27% (c) | 2.28% | 27% | $87,646 |
| Year Ended 5/31/2014 | $19.02 | 14.96% | 1.27% | 1.27% (c) | 1.73% | 19% | $87,406 |
| Class T |
| Year Ended 5/31/2018 | $21.62 | 10.36% | 0.97% | 0.97% (c) | 1.65% | 15% | $46 |
| Year Ended 5/31/2017 | $20.45 | 15.53% | 1.00% | 1.00% (c) | 1.74% | 16% | $59 |
| Year Ended 5/31/2016 | $18.42 | 4.43% | 1.02% | 1.02% (c) | 1.72% | 25% | $98 |
| Year Ended 5/31/2015 | $19.06 | 9.09% | 1.02% | 1.02% (c) | 2.47% | 27% | $164 |
| Year Ended 5/31/2014 | $19.01 | 15.21% | 1.00% | 1.00% (c) | 1.75% | 19% | $193 |
| Class V |
| Year Ended 5/31/2018 | $21.64 | 10.35% | 0.97% | 0.97% (c) | 1.66% | 15% | $81,875 |
| Year Ended 5/31/2017 | $20.47 | 15.58% | 1.00% | 1.00% (c) | 1.74% | 16% | $78,342 |
| Year Ended 5/31/2016 | $18.43 | 4.42% | 1.02% | 1.02% (c) | 1.74% | 25% | $75,218 |
| Year Ended 5/31/2015 | $19.07 | 9.03% | 1.04% | 1.04% (c) | 2.49% | 27% | $81,206 |
| Year Ended 5/31/2014 | $19.02 | 15.19% | 1.07% | 1.07% (c) | 1.92% | 19% | $85,511 |
The accompanying Notes to Financial Statements are an integral part of this statement.
Columbia Dividend Income Fund | Annual Report 2018
| 21 |
Notes to Financial Statements
May 31, 2018
Note 1. Organization
Columbia Dividend Income Fund (the Fund), a series of Columbia Funds Series Trust I (the Trust), is a diversified fund. The Trust is registered under the Investment Company Act of 1940, as amended (the 1940 Act), as an open-end management investment company organized as a Massachusetts business trust.
Fund shares
The Trust may issue an unlimited number of shares (without par value). Although all share classes generally have identical voting, dividend and liquidation rights, each share class votes separately when required by the Trust’s organizational documents or by law. Different share classes pay different distribution amounts to the extent the expenses of such share classes differ, and distributions in liquidation will be proportional to the net asset value of each share class. Each share class has its own expense and sales charge structure. The Fund offers each of the share classes identified below.
Class A shares are subject to a maximum front-end sales charge of 5.75% based on the initial investment amount. Class A shares purchased without an initial sales charge in accounts aggregating $1 million to $50 million at the time of purchase are subject to a contingent deferred sales charge (CDSC) if the shares are sold within 18 months after purchase, charged as follows: 1.00% CDSC if redeemed within 12 months after purchase, and 0.50% CDSC if redeemed more than 12, but less than 18, months after purchase.
Advisor Class shares are not subject to sales charges and are generally available only to omnibus retirement plans and certain investors as described in the Fund’s prospectus. Prior to November 1, 2017, Advisor Class shares were known as Class R4 shares.
Class B shares of the Fund are no longer offered for sale. When available, Class B shares were subject to a maximum CDSC of 5.00% based upon the holding period after purchase. Effective July 17, 2017, Class B shares were automatically converted to Class A shares without a CDSC. On August 4, 2017, the capital owned by Columbia Management Investment Advisers, LLC in Class B shares was redeemed without a CDSC.
Class C shares are subject to a 1.00% CDSC on shares redeemed within 12 months after purchase.
Institutional Class shares are not subject to sales charges and are generally available only to eligible investors, which are subject to different investment minimums as described in the Fund’s prospectus. Prior to November 1, 2017, Institutional Class shares were known as Class Z shares.
Institutional 2 Class shares are not subject to sales charges and are generally available only to investors purchasing through authorized investment professionals and omnibus retirement plans as described in the Fund’s prospectus. Prior to November 1, 2017, Institutional 2 Class shares were known as Class R5 shares.
Institutional 3 Class shares are not subject to sales charges and are available to institutional and certain other investors as described in the Fund’s prospectus. Prior to November 1, 2017, Institutional 3 Class shares were known as Class Y shares.
Class R shares are not subject to sales charges and are generally available only to certain retirement plans and other investors as described in the Fund’s prospectus.
Class T shares are subject to a maximum front-end sales charge of 2.50% per transaction and must be purchased through financial intermediaries that, by written agreement with Columbia Management Investment Distributors, Inc., are specifically authorized to sell Class T shares.
Class V shares are subject to a maximum front-end sales charge of 5.75% based on the investment amount. Class V shares purchased without an initial sales charge in accounts aggregating $1 million to $50 million at the time of purchase are subject to a CDSC if the shares are sold within 18 months after purchase, charged as follows: 1.00% CDSC if redeemed within 12 months after purchase, and 0.50% CDSC if redeemed more than 12, but less than 18, months after purchase. Class V shares are available only to investors who received (and who have continuously held) Class V shares in connection with previous fund reorganizations.
| 22 | Columbia Dividend Income Fund | Annual Report 2018 |
Notes to Financial Statements (continued)
May 31, 2018
Note 2. Summary of significant accounting policies
Basis of preparation
The Fund is an investment company that applies the accounting and reporting guidance in the Financial Accounting Standards Board (FASB) Accounting Standards Codification Topic 946, Financial Services - Investment Companies (ASC 946). The financial statements are prepared in accordance with U.S. generally accepted accounting principles (GAAP), which requires management to make certain estimates and assumptions that affect the reported amounts of assets and liabilities, the disclosure of contingent assets and liabilities at the date of the financial statements and the reported amounts of income and expenses during the reporting period. Actual results could differ from those estimates.
The following is a summary of significant accounting policies followed by the Fund in the preparation of its financial statements.
Security valuation
All equity securities and exchange-traded funds are valued at the close of business of the New York Stock Exchange. Equity securities and exchange-traded funds are valued at the last quoted sales price on the principal exchange or market on which they trade, except for securities traded on the NASDAQ Stock Market, which are valued at the NASDAQ official close price. Unlisted securities or listed securities for which there were no sales during the day are valued at the mean of the latest quoted bid and ask prices on such exchanges or markets.
Foreign equity securities are valued based on the closing price on the foreign exchange in which such securities are primarily traded. If any foreign equity security closing prices are not readily available, the securities are valued at the mean of the latest quoted bid and ask prices on such exchanges or markets. Foreign currency exchange rates are generally determined at 4:00 p.m. Eastern (U.S.) time. Many securities markets and exchanges outside the U.S. close prior to the close of the New York Stock Exchange; therefore, the closing prices for securities in such markets or on such exchanges may not fully reflect events that occur after such close but before the close of the New York Stock Exchange. In those situations, foreign securities will be fair valued pursuant to a policy adopted by the Board of Trustees, including, if available, utilizing a third party pricing service to determine these fair values. The third party pricing service takes into account multiple factors, including, but not limited to, movements in the U.S. securities markets, certain depositary receipts, futures contracts and foreign exchange rates that have occurred subsequent to the close of the foreign exchange or market, to determine a good faith estimate that reasonably reflects the current market conditions as of the close of the New York Stock Exchange. The fair value of a security is likely to be different from the quoted or published price, if available.
Investments in open-end investment companies, including money market funds, are valued at their latest net asset value.
Investments for which market quotations are not readily available, or that have quotations which management believes are not reflective of market value or reliable, are valued at fair value as determined in good faith under procedures approved by and under the general supervision of the Board of Trustees. If a security or class of securities (such as foreign securities) is valued at fair value, such value is likely to be different from the quoted or published price for the security.
The determination of fair value often requires significant judgment. To determine fair value, management may use assumptions including but not limited to future cash flows and estimated risk premiums. Multiple inputs from various sources may be used to determine fair value.
GAAP requires disclosure regarding the inputs and valuation techniques used to measure fair value and any changes in valuation inputs or techniques. In addition, investments shall be disclosed by major category. This information is disclosed following the Fund’s Portfolio of Investments.
Foreign currency transactions and translations
The values of all assets and liabilities denominated in foreign currencies are generally translated into U.S. dollars at exchange rates determined at the close of regular trading on the New York Stock Exchange. Net realized and unrealized gains (losses) on foreign currency transactions and translations include gains (losses) arising from the fluctuation in exchange
Columbia Dividend Income Fund | Annual Report 2018
| 23 |
Notes to Financial Statements (continued)
May 31, 2018
rates between trade and settlement dates on securities transactions, gains (losses) arising from the disposition of foreign currency and currency gains (losses) between the accrual and payment dates on dividends, interest income and foreign withholding taxes.
For financial statement purposes, the Fund does not distinguish that portion of gains (losses) on investments which is due to changes in foreign exchange rates from that which is due to changes in market prices of the investments. Such fluctuations are included with the net realized and unrealized gains (losses) on investments in the Statement of Operations.
Security transactions
Security transactions are accounted for on the trade date. Cost is determined and gains (losses) are based upon the specific identification method for both financial statement and federal income tax purposes.
Income recognition
Corporate actions and dividend income are generally recorded net of any non-reclaimable tax withholdings, on the ex-dividend date or upon receipt of ex-dividend notification in the case of certain foreign securities.
The Fund may receive distributions from holdings in equity securities, business development companies (BDCs), exchange-traded funds (ETFs), limited partnerships (LPs), other regulated investment companies (RICs), and real estate investment trusts (REITs), which report information on the tax character of their distributions annually. These distributions are allocated to dividend income, capital gain and return of capital based on actual information reported. Return of capital is recorded as a reduction of the cost basis of securities held. If the Fund no longer owns the applicable securities, return of capital is recorded as a realized gain. With respect to REITs, to the extent actual information has not yet been reported, estimates for return of capital are made by the Fund’s management. Management’s estimates are subsequently adjusted when the actual character of the distributions is disclosed by the REITs, which could result in a proportionate change in return of capital to shareholders.
Awards from class action litigation are recorded as a reduction of cost basis if the Fund still owns the applicable securities on the payment date. If the Fund no longer owns the applicable securities, the proceeds are recorded as realized gains.
Expenses
General expenses of the Trust are allocated to the Fund and other funds of the Trust based upon relative net assets or other expense allocation methodologies determined by the nature of the expense. Expenses directly attributable to the Fund are charged to the Fund. Expenses directly attributable to a specific class of shares are charged to that share class.
Determination of class net asset value
All income, expenses (other than class-specific expenses, which are charged to that share class, as shown in the Statement of Operations) and realized and unrealized gains (losses) are allocated to each class of the Fund on a daily basis, based on the relative net assets of each class, for purposes of determining the net asset value of each class.
Federal income tax status
The Fund intends to qualify each year as a regulated investment company under Subchapter M of the Internal Revenue Code, as amended, and will distribute substantially all of its investment company taxable income and net capital gain, if any, for its tax year, and as such will not be subject to federal income taxes. In addition, the Fund intends to distribute in each calendar year substantially all of its ordinary income, capital gain net income and certain other amounts, if any, such that the Fund should not be subject to federal excise tax. Therefore, no federal income or excise tax provision is recorded.
Foreign taxes
The Fund may be subject to foreign taxes on income, gains on investments or currency repatriation, a portion of which may be recoverable. The Fund will accrue such taxes and recoveries, as applicable, based upon its current interpretation of tax rules and regulations that exist in the markets in which it invests.
| 24 | Columbia Dividend Income Fund | Annual Report 2018 |
Notes to Financial Statements (continued)
May 31, 2018
Realized gains in certain countries may be subject to foreign taxes at the Fund level, based on statutory rates. The Fund accrues for such foreign taxes on realized and unrealized gains at the appropriate rate for each jurisdiction, as applicable. The amount, if any, is disclosed as a liability on the Statement of Assets and Liabilities.
Distributions to shareholders
Distributions from net investment income, if any, are declared and paid each calendar quarter. Net realized capital gains, if any, are distributed at least annually. Income distributions and capital gain distributions are determined in accordance with federal income tax regulations, which may differ from GAAP.
Guarantees and indemnifications
Under the Trust’s organizational documents and, in some cases, by contract, its officers and trustees are indemnified against certain liabilities arising out of the performance of their duties to the Trust or its funds. In addition, certain of the Fund’s contracts with its service providers contain general indemnification clauses. The Fund’s maximum exposure under these arrangements is unknown since the amount of any future claims that may be made against the Fund cannot be determined, and the Fund has no historical basis for predicting the likelihood of any such claims.
Recent accounting pronouncement
Accounting Standards Update 2017-08 Premium Amortization on Purchased Callable Debt Securities
In March 2017, the Financial Accounting Standards Board issued Accounting Standards Update (ASU) No. 2017-08 Premium Amortization on Purchased Callable Debt Securities. ASU No. 2017-08 updates the accounting standards to shorten the amortization period for certain purchased callable debt securities, held at a premium, to be amortized to the earliest call date. The update applies to securities with explicit, noncontingent call features that are callable at fixed prices and on preset dates. The standard is effective for annual periods beginning after December 15, 2018 and interim periods within those fiscal years. At this time, management is evaluating the implication of this guidance and the impact it will have on the financial statement amounts and footnote disclosures, if any.
Note 3. Fees and other transactions with affiliates
Management services fees
The Fund has entered into a Management Agreement with Columbia Management Investment Advisers, LLC (the Investment Manager), a wholly-owned subsidiary of Ameriprise Financial, Inc. (Ameriprise Financial). Under the Management Agreement, the Investment Manager provides the Fund with investment research and advice, as well as administrative and accounting services. The management services fee is an annual fee that is equal to a percentage of the Fund’s daily net assets that declines from 0.72% to 0.52% as the Fund’s net assets increase. The effective management services fee rate for the year ended May 31, 2018 was 0.56% of the Fund’s average daily net assets.
Compensation of board members
Members of the Board of Trustees who are not officers or employees of the Investment Manager or Ameriprise Financial are compensated for their services to the Fund as disclosed in the Statement of Operations. These members of the Board of Trustees may participate in a Deferred Compensation Plan (the Plan) which may be terminated at any time. Obligations of the Plan will be paid solely out of the Fund’s assets, and all amounts payable under the Plan constitute a general unsecured obligation of the Fund.
Compensation of Chief Compliance Officer
The Board of Trustees has appointed a Chief Compliance Officer to the Fund in accordance with federal securities regulations. As disclosed in the Statement of Operations, a portion of the Chief Compliance Officer’s total compensation is allocated to the Fund, along with other allocations to affiliated funds governed by the Board of Trustees, based on relative net assets.
Columbia Dividend Income Fund | Annual Report 2018
| 25 |
Notes to Financial Statements (continued)
May 31, 2018
Transfer agency fees
Under a Transfer and Dividend Disbursing Agent Agreement, Columbia Management Investment Services Corp. (the Transfer Agent), an affiliate of the Investment Manager and a wholly-owned subsidiary of Ameriprise Financial, is responsible for providing transfer agency services to the Fund. The Transfer Agent has contracted with DST Asset Manager Solutions, Inc. (DST) to serve as sub-transfer agent. The Transfer Agent pays the fees of DST for services as sub-transfer agent and DST is not entitled to reimbursement for such fees from the Fund (with the exception of out-of-pocket fees).
The Fund pays the Transfer Agent a monthly transfer agency fee based on the number or the average value of accounts, depending on the type of account. In addition, the Fund pays the Transfer Agent a fee for shareholder services based on the number of accounts or on a percentage of the average aggregate value of the Fund’s shares maintained in omnibus accounts up to the lesser of the amount charged by the financial intermediary or a cap established by the Board of Trustees from time to time.
The Transfer Agent also receives compensation from the Fund for various shareholder services and reimbursements for certain out-of-pocket fees. Effective August 1, 2017, total transfer agency fees for Institutional 2 Class and Institutional 3 Class shares are subject to an annual limitation of not more than 0.07% and 0.02%, respectively, of the average daily net assets attributable to each share class. Prior to August 1, 2017, these limitations were 0.075% for Institutional 2 Class shares and 0.025% for Institutional 3 Class shares.
For the year ended May 31, 2018, the Fund’s effective transfer agency fee rates as a percentage of average daily net assets of each class were as follows:
| | Effective rate (%) |
| Class A | 0.14 |
| Advisor Class | 0.14 |
| Class B | 0.03 (a) |
| Class C | 0.14 |
| Institutional Class | 0.14 |
| Institutional 2 Class | 0.06 |
| Institutional 3 Class | 0.01 |
| Class R | 0.14 |
| Class T | 0.14 |
| Class V | 0.14 |
An annual minimum account balance fee of $20 may apply to certain accounts with a value below the applicable share class’s initial minimum investment requirements to reduce the impact of small accounts on transfer agency fees. These minimum account balance fees are remitted to the Fund and recorded as part of expense reductions in the Statement of Operations. For the year ended May 31, 2018, these minimum account balance fees reduced total expenses of the Fund by $3,327.
Distribution and service fees
The Fund has entered into an agreement with Columbia Management Investment Distributors, Inc. (the Distributor), an affiliate of the Investment Manager and a wholly-owned subsidiary of Ameriprise Financial, for distribution and shareholder services. The Board of Trustees has approved, and the Fund has adopted, distribution and shareholder service plans (the Plans) applicable to certain share classes, which set the distribution and service fees for the Fund. These fees are calculated daily and are intended to compensate the Distributor and/or eligible selling and/or servicing agents for selling shares of the Fund and providing services to investors.
Under the Plans, the Fund pays a monthly service fee to the Distributor at the maximum annual rate of 0.25% of the average daily net assets attributable to Class A, Class B, Class C and Class T shares of the Fund. Also under the Plans, the Fund pays a monthly distribution fee to the Distributor at the maximum annual rates of 0.10%, 0.75%, 0.75%, 0.50% and 0.25% of
| 26 | Columbia Dividend Income Fund | Annual Report 2018 |
Notes to Financial Statements (continued)
May 31, 2018
the average daily net assets attributable to Class A, Class B, Class C, Class R and Class T shares of the Fund, respectively. As a result of all Class B shares of the Fund being redeemed or converted to Class A shares, August 4, 2017 was the last day the Fund paid a service fee or distribution fee for Class B shares.
Although the Fund may pay distribution and service fees up to a maximum annual rate of 0.35% of the Fund’s average daily net assets attributable to Class A shares (comprised of up to 0.10% for distribution services and up to 0.25% for shareholder liaison services), the Fund currently limits such fees to an aggregate fee of not more than 0.25% of the Fund’s average daily net assets attributable to Class A shares.
Although the Fund may pay a distribution fee up to 0.25% of the Fund’s average daily net assets attributable to Class T shares and a service fee of up to 0.25% of the Fund’s average daily net assets attributable to Class T shares, the aggregate fee shall not exceed 0.25% of the Fund’s average daily net assets attributable to Class T shares.
Shareholder services fees
The Fund has adopted a shareholder services plan that permits it to pay for certain services provided to Class V shareholders by their selling and/or servicing agents. The Fund may pay shareholder servicing fees up to an aggregate annual rate of 0.50% of the Fund’s average daily net assets attributable to Class V shares (comprised of up to 0.25% for shareholder liaison services and up to 0.25% for administrative support services). These fees are currently limited to an aggregate annual rate of not more than 0.25% of the Fund’s average daily net assets attributable to Class V shares.
Sales charges (unaudited)
Sales charges, including front-end charges and CDSCs, received by the Distributor for distributing Fund shares for the year ended May 31, 2018, if any, are listed below:
| | Amount ($) |
| Class A | 2,989,317 |
| Class C | 38,437 |
| Class T | 50 |
| Class V | 3,084 |
Expenses waived/reimbursed by the Investment Manager and its affiliates
The Investment Manager and certain of its affiliates have contractually agreed to waive fees and/or reimburse expenses (excluding certain fees and expenses described below) for the period(s) disclosed below, unless sooner terminated at the sole discretion of the Board of Trustees, so that the Fund’s net operating expenses, after giving effect to fees waived/expenses reimbursed and any balance credits and/or overdraft charges from the Fund’s custodian, do not exceed the following annual rate(s) as a percentage of the class’ average daily net assets:
| | October 1, 2017
through
September 30, 2018 | Prior to
October 1, 2017 |
| Class A | 1.18% | 1.19% |
| Advisor Class | 0.93 | 0.94 |
| Class C | 1.93 | 1.94 |
| Institutional Class | 0.93 | 0.94 |
| Institutional 2 Class | 0.83 | 0.86 |
| Institutional 3 Class | 0.78 | 0.81 |
| Class R | 1.43 | 1.44 |
| Class T | 1.18 | 1.19 |
| Class V | 1.18 | 1.19 |
Under the agreement governing these fee waivers and/or expense reimbursement arrangements, the following fees and expenses are excluded from the waiver/reimbursement commitment, and therefore will be paid by the Fund, if applicable: taxes (including foreign transaction taxes), expenses associated with investments in affiliated and non-affiliated
Columbia Dividend Income Fund | Annual Report 2018
| 27 |
Notes to Financial Statements (continued)
May 31, 2018
pooled investment vehicles (including mutual funds and exchange-traded funds), transaction costs and brokerage commissions, costs related to any securities lending program, dividend expenses associated with securities sold short, inverse floater program fees and expenses, transaction charges and interest on borrowed money, interest, infrequent and/or unusual expenses and any other expenses the exclusion of which is specifically approved by the Board of Trustees. This agreement may be modified or amended only with approval from the Investment Manager, certain of its affiliates and the Fund. Any fees waived and/or expenses reimbursed under the expense reimbursement arrangements described above are not recoverable by the Investment Manager or its affiliates in future periods.
Note 4. Federal tax information
The timing and character of income and capital gain distributions are determined in accordance with income tax regulations, which may differ from GAAP because of temporary or permanent book to tax differences.
At May 31, 2018, these differences were primarily due to differing treatment for deferral/reversal of wash sale losses, re-characterization of distributions for investments, trustees’ deferred compensation and foreign currency transactions. To the extent these differences were permanent, reclassifications were made among the components of the Fund’s net assets in the Statement of Assets and Liabilities. Temporary differences do not require reclassifications.
In the Statement of Assets and Liabilities the following reclassifications were made:
Undistributed net
investment
income ($) | Accumulated
net realized
gain ($) | Paid in
capital ($) |
| (2,081,682) | 2,081,682 | — |
Net investment income (loss) and net realized gains (losses), as disclosed in the Statement of Operations, and net assets were not affected by these reclassifications.
The tax character of distributions paid during the years indicated was as follows:
| Year Ended May 31, 2018 | Year Ended May 31, 2017 |
Ordinary
income ($) | Long-term
capital gains ($) | Total ($) | Ordinary
income ($) | Long-term
capital gains ($) | Total ($) |
| 191,955,520 | 298,329,333 | 490,284,853 | 172,510,759 | 223,616,272 | 396,127,031 |
Short-term capital gain distributions, if any, are considered ordinary income distributions for tax purposes. At May 31, 2018, the components of distributable earnings on a tax basis were as follows:
Undistributed
ordinary income ($) | Undistributed
long-term
capital gains ($) | Capital loss
carryforwards ($) | Net unrealized
appreciation ($) |
| 36,564,432 | 286,128,057 | — | 4,109,621,526 |
At May 31, 2018, the cost of all investments for federal income tax purposes along with the aggregate gross unrealized appreciation and depreciation based on that cost was:
Federal
tax cost ($) | Gross unrealized
appreciation ($) | Gross unrealized
(depreciation) ($) | Net unrealized
appreciation ($) |
| 7,219,221,161 | 4,174,610,057 | (64,988,531) | 4,109,621,526 |
Tax cost of investments and unrealized appreciation/(depreciation) may also include timing differences that do not constitute adjustments to tax basis.
| 28 | Columbia Dividend Income Fund | Annual Report 2018 |
Notes to Financial Statements (continued)
May 31, 2018
Management of the Fund has concluded that there are no significant uncertain tax positions in the Fund that would require recognition in the financial statements. However, management’s conclusion may be subject to review and adjustment at a later date based on factors including, but not limited to, new tax laws, regulations, and administrative interpretations (including relevant court decisions). Generally, the Fund’s federal tax returns for the prior three fiscal years remain subject to examination by the Internal Revenue Service.
Note 5. Portfolio information
The cost of purchases and proceeds from sales of securities, excluding short-term investments and derivatives, if any, aggregated to $1,601,654,217 and $1,643,270,220, respectively, for the year ended May 31, 2018. The amount of purchase and sale activity impacts the portfolio turnover rate reported in the Financial Highlights.
Note 6. Affiliated money market fund
The Fund invests in Columbia Short-Term Cash Fund, an affiliated money market fund established for the exclusive use by the Fund and other affiliated funds (the Affiliated MMF). The income earned by the Fund from such investments is included as Dividends - affiliated issuers in the Statement of Operations. As an investing fund, the Fund indirectly bears its proportionate share of the expenses of the Affiliated MMF. The Affiliated MMF prices its shares with a floating net asset value. In addition, the Board of Trustees of the Affiliated MMF may impose a fee on redemptions (sometimes referred to as a liquidity fee) or temporarily suspend redemptions (sometimes referred to as imposing a redemption gate) in the event its liquidity falls below regulatory limits.
Note 7. Interfund lending
Pursuant to an exemptive order granted by the Securities and Exchange Commission, the Fund participates in a program (the Interfund Program) allowing each participating Columbia Fund (each, a Participating Fund) to lend money directly to and, except for closed-end funds and money market funds, borrow money directly from other Participating Funds for temporary purposes. The amounts eligible for borrowing and lending under the Interfund Program are subject to certain restrictions.
Interfund loans are subject to the risk that the borrowing fund could be unable to repay the loan when due, and a delay in repayment to the lending fund could result in lost opportunities and/or additional lending costs. The exemptive order is subject to conditions intended to mitigate conflicts of interest arising from the Investment Manager’s relationship with each Participating Fund.
The Fund’s activity in the Interfund Program during the year ended May 31, 2018 was as follows:
| Borrower or lender | Average loan
balance ($) | Weighted average
interest rate (%) | Days
outstanding |
| Lender | 1,300,000 | 2.30 | 6 |
Interest income earned by the Fund is recorded as interfund lending on the Statement of Operations. The Fund had no outstanding interfund loans at May 31, 2018.
Note 8. Line of credit
The Fund has access to a revolving credit facility with a syndicate of banks led by Citibank, N.A., HSBC Bank USA, N.A. and JPMorgan Chase Bank, N.A. whereby the Fund may borrow for the temporary funding of shareholder redemptions or for other temporary or emergency purposes. The credit facility, which is a collective agreement between the Fund and certain other funds managed by the Investment Manager, severally and not jointly, permits collective borrowings up to $1 billion. Interest is charged to each participating fund based on its borrowings at a rate equal to the higher of (i) the overnight federal funds rate plus 1.00% or (ii) the one-month LIBOR rate plus 1.00%. Each borrowing under the credit facility matures no later than 60 days after the date of borrowing. The Fund also pays a commitment fee equal to its pro rata share of the amount of the credit facility at a rate of 0.15% per annum. The commitment fee is included in other expenses in the Statement of Operations.
The Fund had no borrowings during the year ended May 31, 2018.
Columbia Dividend Income Fund | Annual Report 2018
| 29 |
Notes to Financial Statements (continued)
May 31, 2018
Note 9. Significant risks
Shareholder concentration risk
At May 31, 2018, unaffiliated shareholders of record owned 37.8% of the outstanding shares of the Fund in one or more accounts. The Fund has no knowledge about whether any portion of those shares was owned beneficially. Affiliated shareholders of record owned 13.3% of the outstanding shares of the Fund in one or more accounts. Subscription and redemption activity by concentrated accounts may have a significant effect on the operations of the Fund. In the case of a large redemption, the Fund may be forced to sell investments at inopportune times, including its liquid positions, which may result in Fund losses and the Fund holding a higher percentage of less liquid positions. Large redemptions could result in decreased economies of scale and increased operating expenses for non-redeeming Fund shareholders.
Note 10. Subsequent events
Management has evaluated the events and transactions that have occurred through the date the financial statements were issued and noted no items requiring adjustment of the financial statements or additional disclosure.
Note 11. Information regarding pending and settled legal proceedings
Ameriprise Financial and certain of its affiliates have historically been involved in a number of legal, arbitration and regulatory proceedings, including routine litigation, class actions, and governmental actions, concerning matters arising in connection with the conduct of their business activities. Ameriprise Financial believes that the Fund is not currently the subject of, and that neither Ameriprise Financial nor any of its affiliates are the subject of, any pending legal, arbitration or regulatory proceedings that are likely to have a material adverse effect on the Fund or the ability of Ameriprise Financial or its affiliates to perform under their contracts with the Fund. Ameriprise Financial is required to make quarterly (10-Q), annual (10-K) and, as necessary, 8-K filings with the Securities and Exchange Commission (SEC) on legal and regulatory matters that relate to Ameriprise Financial and its affiliates. Copies of these filings may be obtained by accessing the SEC website at www.sec.gov.
There can be no assurance that these matters, or the adverse publicity associated with them, will not result in increased Fund redemptions, reduced sale of Fund shares or other adverse consequences to the Fund. Further, although we believe proceedings are not likely to have a material adverse effect on the Fund or the ability of Ameriprise Financial or its affiliates to perform under their contracts with the Fund, these proceedings are subject to uncertainties and, as such, we are unable to estimate the possible loss or range of loss that may result. An adverse outcome in one or more of these proceedings could result in adverse judgments, settlements, fines, penalties or other relief that could have a material adverse effect on the consolidated financial condition or results of operations of Ameriprise Financial.
| 30 | Columbia Dividend Income Fund | Annual Report 2018 |
Report of Independent Registered Public Accounting Firm
To the Board of Trustees of Columbia Funds Series Trust I and Shareholders of Columbia Dividend Income Fund
Opinion on the Financial Statements
We have audited the accompanying statement of assets and liabilities, including the portfolio of investments, of Columbia Dividend Income Fund (one of the funds constituting Columbia Funds Series Trust I, hereafter referred to as the "Fund") as of May 31, 2018, the related statement of operations for the year ended May 31, 2018, the statement of changes in net assets for each of the two years in the period ended May 31, 2018, including the related notes, and the financial highlights for each of the five years in the period ended May 31, 2018 (collectively referred to as the “financial statements”). In our opinion, the financial statements present fairly, in all material respects, the financial position of the Fund as of May 31, 2018, the results of its operations for the year then ended, the changes in its net assets for each of the two years in the period ended May 31, 2018 and the financial highlights for each of the five years in the period ended May 31, 2018 in conformity with accounting principles generally accepted in the United States of America.
Basis for Opinion
These financial statements are the responsibility of the Fund’s management. Our responsibility is to express an opinion on the Fund’s financial statements based on our audits. We are a public accounting firm registered with the Public Company Accounting Oversight Board (United States) (“PCAOB”) and are required to be independent with respect to the Fund in accordance with the U.S. federal securities laws and the applicable rules and regulations of the Securities and Exchange Commission and the PCAOB.
We conducted our audits of these financial statements in accordance with the standards of the PCAOB. Those standards require that we plan and perform the audits to obtain reasonable assurance about whether the financial statements are free of material misstatement, whether due to error or fraud.
Our audits included performing procedures to assess the risks of material misstatement of the financial statements, whether due to error or fraud, and performing procedures that respond to those risks. Such procedures included examining, on a test basis, evidence regarding the amounts and disclosures in the financial statements. Our audits also included evaluating the accounting principles used and significant estimates made by management, as well as evaluating the overall presentation of the financial statements. Our procedures included confirmation of securities owned as of May 31, 2018 by correspondence with the custodian and transfer agent. We believe that our audits provide a reasonable basis for our opinion.
/s/PricewaterhouseCoopers LLP
Minneapolis, Minnesota
July 23, 2018
We have served as the auditor of one or more investment companies within the Columbia Funds Complex since 1977.
Columbia Dividend Income Fund | Annual Report 2018
| 31 |
Federal Income Tax Information
(Unaudited)
The Fund hereby designates the following tax attributes for the fiscal year ended May 31, 2018. Shareholders will be notified in early 2019 of the amounts for use in preparing 2018 income tax returns.
Qualified
dividend
income | Dividends
received
deduction | Capital
gain
dividend |
| 100.00% | 100.00% | $512,802,707 |
Qualified dividend income. For taxable, non-corporate shareholders, the percentage of ordinary income distributed during the fiscal year that represents qualified dividend income subject to reduced tax rates.
Dividends received deduction. The percentage of ordinary income distributed during the fiscal year that qualifies for the corporate dividends received deduction.
Capital gain dividend. The Fund designates as a capital gain dividend the amount reflected above, or if subsequently determined to be different, the net capital gain of such fiscal period.
| 32 | Columbia Dividend Income Fund | Annual Report 2018 |
Shareholders elect the Board that oversees the Fund’s operations. The Board appoints officers who are responsible for day-to-day business decisions based on policies set by the Board. The following table provides basic biographical information about the Fund’s Trustees, including their principal occupations during the past five years, although specific titles for individuals may have varied over the period. The year set forth beneath Length of Service in the table below is the year in which the Trustee was first appointed or elected as Trustee to any Fund currently in the Columbia Funds Complex or a predecessor thereof. Under current Board policy, members serve terms of indefinite duration.
Independent trustees
| Name, address, year of birth | Position held with the Trust and length of service | Principal occupation(s) during the past five years and other relevant professional experience | Number of Funds in the Columbia Fund Complex overseen | Other directorships held by Trustee during the past five years |
Janet Langford Carrig
c/o Columbia Management
Investment Advisers, LLC
225 Franklin Street
Mail Drop BX32 05228
Boston, MA 02110
1957 | Trustee
1996 | Senior Vice President, General Counsel and Corporate Secretary, ConocoPhillips (independent energy company) since September 2007 | 71 | None |
Douglas A. Hacker
c/o Columbia Management
Investment Advisers, LLC
225 Franklin Street
Mail Drop BX32 05228
Boston, MA 02110
1955 | Trustee and Chairman of the Board
1996 | Independent business executive since May 2006; Executive Vice President — Strategy of United Airlines from December 2002 to May 2006; President of UAL Loyalty Services (airline marketing company) from September 2001 to December 2002; Executive Vice President and Chief Financial Officer of United Airlines from July 1999 to September 2001 | 71 | Spartan Nash Company, (food distributor); Nash Finch Company (food distributor) from 2005 to 2013; Aircastle Limited (aircraft leasing); SeaCube Container Leasing Ltd. (container leasing) from 2010 to 2013; and Travelport Worldwide Limited (travel information technology) |
Nancy T. Lukitsh
c/o Columbia Management
Investment Advisers, LLC
225 Franklin Street
Mail Drop BX32 05228
Boston, MA 02110
1956 | Trustee
2011 | Senior Vice President, Partner and Director of Marketing, Wellington Management Company, LLP (investment adviser) from 1997 to 2010; Chair, Wellington Management Portfolios (commingled non-U.S. investment pools) from 2007 to 2010; Director, Wellington Trust Company, NA and other Wellington affiliates from 1997 to 2010 | 71 | None |
David M. Moffett
c/o Columbia Management
Investment Advisers, LLC
225 Franklin Street
Mail Drop BX32 05228
Boston, MA 02110
1952 | Trustee
2011 | Retired. Consultant to Bridgewater and Associates | 71 | Director, CSX Corporation; Genworth Financial, Inc. (financial and insurance products and services); PayPal Holdings Inc. (payment and data processing services); Trustee, University of Oklahoma Foundation; former Director, eBay Inc. (online trading community), 2007-2015; and former Director, CIT Bank, CIT Group Inc. (commercial and consumer finance), 2010-2016 |
John J. Neuhauser
c/o Columbia Management
Investment Advisers, LLC
225 Franklin Street
Mail Drop BX32 05228
Boston, MA 02110
1943 | Trustee
1984 | President, Saint Michael’s College since August 2007; Director or Trustee of several non-profit organizations, including University of Vermont Medical Center; Academic Vice President and Dean of Faculties, Boston College from August 1999 to October 2005; University Professor, Boston College from November 2005 to August 2007 | 71 | Liberty All-Star Equity Fund and Liberty All- Star Growth Fund (closed-end funds) |
Columbia Dividend Income Fund | Annual Report 2018
| 33 |
TRUSTEES AND OFFICERS (continued)
Independent trustees (continued)
| Name, address, year of birth | Position held with the Trust and length of service | Principal occupation(s) during the past five years and other relevant professional experience | Number of Funds in the Columbia Fund Complex overseen | Other directorships held by Trustee during the past five years |
Patrick J. Simpson
c/o Columbia Management
Investment Advisers, LLC
225 Franklin Street
Mail Drop BX32 05228
Boston, MA 02110
1944 | Trustee
2000 | Of Counsel, Perkins Coie LLP (law firm) since 2015; Partner, Perkins Coie LLP from 1988 to 2014 | 71 | None |
Anne-Lee Verville
c/o Columbia Management
Investment Advisers, LLC
225 Franklin Street
Mail Drop BX32 05228
Boston, MA 02110
1945 | Trustee
1998 | Retired. General Manager, Global Education Industry from 1994 to 1997, President – Application Systems Division from 1991 to 1994, Chief Financial Officer – US Marketing & Services from 1988 to 1991, and Chief Information Officer from 1987 to 1988, IBM Corporation (computer and technology) | 71 | Enesco Group, Inc. (producer of giftware and home and garden decor products) from 2001 to 2006 |
Consultants to the Independent Trustees*
| Name, address, year of birth | Position held with the Trust and length of service | Principal occupation(s) during the past five years and other relevant professional experience | Number of Funds in the Columbia Funds complex overseen | Other directorships held by Trustee during the past five years |
J. Kevin Connaughton
c/o Columbia
Management Investment
Advisers, LLC,
225 Franklin Street
Mail Drop BX32 05228,
Boston, MA 02110
1964 | Independent Trustee Consultant
2016 | Independent Trustee Consultant, Columbia Funds since March 2016; Adjunct Professor of Finance, Bentley University since November 2017; Managing Director and General Manager of Mutual Fund Products, Columbia Management Investment Advisers, LLC from May 2010 to February 2015; President, Columbia Funds from 2009 to 2015; and senior officer of Columbia Funds and affiliated funds from 2003 to 2015 | 71 | Director, The Autism Project since March 2015; former Trustee, New Century Portfolios, March 2015-December 2017; formerly on Board of Governors, Gateway Healthcare, January 2016 – December 2017 |
Natalie A. Trunow
c/o Columbia
Management Investment
Advisers, LLC,
225 Franklin Street
Mail Drop BX32 05228,
Boston, MA 02110
1967 | Independent Trustee Consultant
2016 | Independent Trustee Consultant, Columbia Funds since September 2016; Chief Executive Officer, Millennial Portfolio Solutions LLC (asset management and consulting services) since January 2016; Director of Investments, Casey Family Programs from April 2016 to September 2016; Senior Vice President and Chief Investment Officer, Calvert Investments from August 2008 to January 2016; Section Head and Portfolio Manager, General Motors Asset Management from June 1997 to August 2008 | 71 | Director, Health Services for Children with Special Needs, Inc.; Director, Guidewell Financial Solutions |
| * | J. Kevin Connaughton was appointed consultant to the Independent Trustees effective March 1, 2016. Natalie A. Trunow was appointed consultant to the Independent Trustees effective September 1, 2016. Shareholders of the Funds are expected to be asked to elect each of Mr. Connaughton and Ms. Trunow as a Trustee at a future shareholder meeting. |
| 34 | Columbia Dividend Income Fund | Annual Report 2018 |
TRUSTEES AND OFFICERS (continued)
Interested trustee affiliated with Investment Manager*
| Name, address, year of birth | Position held with the Trust and length of service | Principal occupation(s) during the past five years and other relevant professional experience | Number of Funds in the Columbia Funds Complex overseen | Other directorships held by Trustee during the past five years |
William F. Truscott
c/o Columbia Management
Investment Advisers, LLC
225 Franklin Street
Boston, MA 02110
1960 | Trustee
2012 | Chairman of the Board and President, Columbia Management Investment Advisers, LLC since May 2010 and February 2012, respectively; Chief Executive Officer, Global Asset Management, Ameriprise Financial, Inc. since September 2012 (previously Chief Executive Officer, U.S. Asset Management & President, Annuities, May 2010-September 2012); Director and Chief Executive Officer, Columbia Management Investment Distributors, Inc. since May 2010 and February 2012, respectively; Chairman of the Board and Chief Executive Officer, RiverSource Distributors, Inc. since 2006; Director, Threadneedle Asset Management Holdings, SARL since 2014; President and Chief Executive Officer, Ameriprise Certificate Company, 2006-August 2012 | 196 | Chairman of the Board, Columbia Management Investment Advisers, LLC since May 2010; Director, Columbia Management Investment Distributors, Inc. since May 2010; former Director, Ameriprise Certificate Company, 2006 - January 2013 |
| * | Interested person (as defined under the 1940 Act) by reason of being an officer, director, security holder and/or employee of the Investment Manager or Ameriprise Financial. |
The Statement of Additional Information has additional information about the Fund’s Board members and is available, without charge, upon request by calling 800.345.6611, visiting columbiathreadneedleus.com/investor/ or contacting your financial intermediary.
Columbia Dividend Income Fund | Annual Report 2018
| 35 |
TRUSTEES AND OFFICERS (continued)
The Board has appointed officers who are responsible for day-to-day business decisions based on policies it has established. The officers serve at the pleasure of the Board. The following table provides basic information about the Officers of the Fund, including principal occupations during the past five years, although their specific titles may have varied over the period. In addition to Mr. Truscott, who is Senior Vice President, the Fund’s other officers are:
Fund officers
Name,
address and
year of birth | Position and year
first appointed to
position for any Fund
in the Columbia
Funds complex or a
predecessor thereof | Principal occupation(s) during past five years |
Christopher O. Petersen
5228 Ameriprise
Financial Center
Minneapolis, MN 55474
Born 1970 | President and Principal Executive Officer (2015) | Vice President and Lead Chief Counsel, Ameriprise Financial, Inc. since January 2015 (previously, Vice President and Chief Counsel, January 2010 - December 2014; officer of Columbia Funds and affiliated funds since 2007. |
Michael G. Clarke
225 Franklin Street
Boston, MA 02110
Born 1969 | Treasurer (2011), Chief Financial Officer (2009) and Chief Accounting Officer (2015) | Vice President — Mutual Fund Administration, Columbia Management Investment Advisers, LLC, since May 2010; senior officer of Columbia Funds and affiliated funds since 2002. |
Paul B. Goucher
100 Park Avenue
New York, NY 10017
Born 1968 | Senior Vice President (2011) and Assistant Secretary (2008) | Senior Vice President and Assistant General Counsel, Ameriprise Financial, Inc. since January 2017 (previously Vice President and Lead Chief Counsel, November 2008 - January 2017 and January 2013 - January 2017, respectively; and Chief Counsel, January 2010 - January 2013); Vice President, Chief Legal Officer and Assistant Secretary, Columbia Management Investment Advisers, LLC since May 2010. |
Thomas P. McGuire
225 Franklin Street
Boston, MA 02110
Born 1972 | Senior Vice President and Chief Compliance Officer (2012) | Vice President — Asset Management Compliance, Ameriprise Financial, Inc., since May 2010; Chief Compliance Officer, Ameriprise Certificate Company since September 2010. |
Colin Moore
225 Franklin Street
Boston, MA 02110
Born 1958 | Senior Vice President (2010) | Executive Vice President and Global Chief Investment Officer, Ameriprise Financial, Inc., since July 2013; Executive Vice President and Global Chief Investment Officer, Columbia Management Investment Advisers, LLC since July 2013 (previously Director and Global Chief Investment Officer, 2010 - 2013). |
Ryan C. Larrenaga
225 Franklin Street
Boston, MA 02110
Born 1970 | Senior Vice President (2017), Chief Legal Officer (2017) and Secretary (2015) | Vice President and Group Counsel, Ameriprise Financial, Inc. since August 2011; officer of Columbia Funds and affiliated funds since 2005. |
Michael E. DeFao
225 Franklin Street
Boston, MA 02110
Born 1968 | Vice President (2011) and Assistant Secretary (2010) | Vice President and Chief Counsel, Ameriprise Financial, Inc. since May 2010. |
Amy Johnson
5228 Ameriprise
Financial Center
Minneapolis, MN 55474
Born 1965 | Vice President (2006) | Managing Director and Global Head of Operations, Columbia Management Investment Advisers, LLC since April 2016 (previously Managing Director and Chief Operating Officer, 2010 - 2016). |
Lyn Kephart-Strong
5228 Ameriprise
Financial Center
Minneapolis, MN 55474
Born 1960 | Vice President (2015) | President, Columbia Management Investment Services Corp. since October 2014; Vice President & Resolution Officer, Ameriprise Trust Company since August 2009. |
| 36 | Columbia Dividend Income Fund | Annual Report 2018 |
The Fund mails one shareholder report to each shareholder address. If you would like more than one report, please call shareholder services at 800.345.6611 and additional reports will be sent to you.
Proxy voting policies and procedures
The policy of the Board of Trustees is to vote the proxies of the companies in which the Fund holds investments consistent with the procedures as stated in the Statement of Additional Information (SAI). You may obtain a copy of the SAI without charge by calling 800.345.6611; contacting your financial intermediary; visiting columbiathreadneedleus.com/investor/; or searching the website of the Securities and Exchange Commission (SEC) at sec.gov. Information regarding how the Fund voted proxies relating to portfolio securities is filed with the SEC by August 31st for the most recent 12-month period ending June 30th of that year, and is available without charge by visiting columbiathreadneedleus.com/investor/, or searching the website of the SEC at sec.gov.
Quarterly schedule of investments
The Fund files a complete schedule of portfolio holdings with the SEC for the first and third quarters of each fiscal year on Form N-Q. The Fund’s Form N-Q is available on the SEC’s website at sec.gov and may be reviewed and copied at the SEC’s Public Reference Room in Washington, D.C. Information on the operation of the Public Reference Room may be obtained by calling 800.SEC.0330. The Fund’s complete schedule of portfolio holdings, as filed on Form N-Q, can also be obtained without charge, upon request, by calling 800.345.6611.
Additional Fund information
For more information about the Fund, please visit columbiathreadneedleus.com/investor/ or call 800.345.6611. Customer Service Representatives are available to answer your questions Monday through Friday from 8 a.m. to 7 p.m. Eastern time.
Fund investment manager
Columbia Management Investment Advisers, LLC
225 Franklin Street
Boston, MA 02110
Fund distributor
Columbia Management Investment Distributors, Inc.
225 Franklin Street
Boston, MA 02110
Fund transfer agent
Columbia Management Investment Services Corp.
Through October 31, 2018:
P.O. Box 8081
Boston, MA 02266-8081
Effective November 1, 2018:
P.O. Box 219104
Kansas City, MO 64121-9104
Columbia Dividend Income Fund | Annual Report 2018
| 37 |
Columbia Dividend Income Fund
Through October 31, 2018:
P.O. Box 8081
Boston, MA 02266-8081
Effective November 1, 2018:
P.O. Box 219104
Kansas City, MO 64121-9104
Please read and consider the investment objectives, risks, charges and expenses for any fund carefully before investing. For a prospectus and summary prospectus, which contains this and other important information about the Fund, go to
columbiathreadneedleus.com/investor/. The Fund is distributed by Columbia Management Investment Distributors, Inc., member FINRA, and managed by Columbia Management Investment Advisers, LLC.
Columbia Threadneedle Investments (Columbia Threadneedle) is the global brand name of the Columbia and Threadneedle group of companies. All rights reserved. Columbia Management Investment Distributors, Inc., 225 Franklin Street, Boston, MA 02110-2804
© 2018 Columbia Management Investment Advisers, LLC.
columbiathreadneedleus .com/investor/

Annual Report
May 31, 2018
Columbia High Yield Municipal Fund
Not FDIC Insured • No bank guarantee • May lose value
Dear Shareholders,
The year 2017 was an extraordinary year in the financial markets. The S&P 500 Index didn’t experience a single down month and returned over 20%. Continuing this trend, January 2018 marked the fastest start for the index ever. Low volatility, which had been a feature of the U.S. equity market for several years, along with the surge in the S&P 500 Index, drove investor sentiment to very high levels. This arguably set the stage for an overdue correction, which we witnessed in February 2018.
A return to volatility
There have been few periods of market upheaval such as were experienced in the first part of 2018. While investors were taken by surprise by the sudden and pronounced market swings, the return to some level of volatility actually marked a resumption of relatively normal market conditions. Having said that, it’s important to distinguish between a good technical correction where excess enthusiasm in the marketplace is being let out, versus a real change in the underlying fundamentals – things like an underperforming economy or weaker corporate earnings. Our view is that the recent market volatility falls into the former category, and the fundamentals remain strong. We’re continuing to see improvements in global economic activity, and we’re seeing corporate earnings expectations continue to rise – and not just because of tax reform.
Consistency is more important than ever
It’s important to keep in mind that when it comes to long-term investing, it’s the destination, not the journey that matters most. If you have a financial goal that you’ve worked out with your financial advisor, and you have a good asset allocation plan to reach it, it’s a question of sticking with your plan rather than become focused on near-term volatility. Bouts of volatility are normal. After all, it’s hard to cross the ocean without hitting an occasional rough patch. You need to focus on the destination.
One final thought. In weathering volatility, it’s the consistency of the return that is essential. Investors who chase higher returns are usually the first to sell when an investment goes through a bad patch, and they therefore don’t tend to benefit from the recovery. More disciplined investors who perhaps panic less or not at all during periods of volatility, tend to have improved long-term results and are more likely to reach their financial goals. Nothing is more important to us than making sure those who have entrusted us to protect and grow their assets are able to do what matters most to them.
Your success is our priority. Talk to your financial advisor about how working with Columbia Threadneedle Investments may help you position your portfolio for consistent, sustainable outcomes, no matter the market conditions.
Sincerely,
Christopher O. Petersen
President, Columbia Funds
The S&P 500 Index, an unmanaged index, measures the performance of 500 widely held, large-capitalization U.S. stocks and is frequently used as a general measure of market performance. Past performance is no guarantee of future results.
Columbia Funds are distributed by Columbia Management Investment Distributors, Inc., member FINRA, and managed by Columbia Management Investment Advisers, LLC.
© 2018 Columbia Management Investment Advisers, LLC. All rights reserved.
Columbia High Yield Municipal Fund | Annual Report 2018
Columbia High Yield Municipal Fund | Annual Report 2018
Investment objective
Columbia High Yield Municipal Fund (the Fund) seeks total return, consisting of current income exempt from federal income tax and capital appreciation.
Portfolio management
Chad Farrington, CFA
Co-Portfolio Manager
Managed Fund since 2009
Catherine Stienstra
Co-Portfolio Manager
Managed Fund since 2016
| Average annual total returns (%) (for the period ended May 31, 2018) |
| | | Inception | 1 Year | 5 Years | 10 Years |
| Class A | Excluding sales charges | 07/31/00 | 3.68 | 4.20 | 4.93 |
| | Including sales charges | | 0.56 | 3.57 | 4.62 |
| Advisor Class* | 03/19/13 | 3.89 | 4.41 | 5.15 |
| Class C | Excluding sales charges | 07/15/02 | 3.01 | 3.54 | 4.29 |
| | Including sales charges | | 2.01 | 3.54 | 4.29 |
| Institutional Class | 03/05/84 | 3.88 | 4.41 | 5.14 |
| Institutional 2 Class* | 11/08/12 | 3.92 | 4.49 | 5.19 |
| Institutional 3 Class* | 03/01/17 | 3.99 | 4.43 | 5.15 |
| Blended Benchmark | | 4.24 | 3.80 | 5.24 |
| Bloomberg Barclays High Yield Municipal Bond Index | | 6.38 | 4.36 | 5.79 |
Returns for Class A shares are shown with and without the maximum initial sales charge of 3.00%. Returns for Class C shares are shown with and without the 1.00% contingent deferred sales charge for the first year only. The Fund’s other classes are not subject to sales charges and have limited eligibility. Effective November 1, 2017, Class R4, Class R5, Class Y and Class Z shares were renamed Advisor Class, Institutional 2 Class, Institutional 3 Class and Institutional Class shares, respectively. Please see the Fund’s prospectus for details. Performance for different share classes will vary based on differences in sales charges and fees associated with each class. All results shown assume reinvestment of distributions during the period. Returns do not reflect the deduction of taxes that a shareholder may pay on Fund distributions or on the redemption of Fund shares. Performance results reflect the effect of any fee waivers or reimbursements of Fund expenses by Columbia Management Investment Advisers, LLC and/or any of its affiliates. Absent these fee waivers or expense reimbursement arrangements, performance results would have been lower.
The performance information shown represents past performance and is not a guarantee of future results. The investment return and principal value of your investment will fluctuate so that your shares, when redeemed, may be worth more or less than their original cost. Current performance may be lower or higher than the performance information shown. You may obtain performance information current to the most recent month-end by contacting your financial intermediary, visiting columbiathreadneedleus.com/investor/ or calling 800.345.6611.
| * | The returns shown for periods prior to the share class inception date (including returns for the Life of the Fund, if shown, which are since Fund inception) include the returns of the Fund’s oldest share class. These returns are adjusted to reflect any higher class-related operating expenses of the newer share classes, as applicable. Please visit columbiathreadneedleus.com/investor/investment-products/mutual-funds/appended-performance for more information. |
The Blended Benchmark, established by the Investment Manager, consists of a 60% weighting of the Bloomberg Barclays High Yield Municipal Bond Index and a 40% weighting of the Bloomberg Barclays Municipal Bond Index.
The Bloomberg Barclays Municipal Bond Index is considered representative of the broad market for investment-grade, tax-exempt bonds with a maturity of at least one year.
The Bloomberg Barclays High Yield Municipal Bond Index is comprised of bonds with maturities greater than one-year, having a par value of at least $3 million issued as part of a transaction size greater than $20 million, and rated no higher than “BB+” or equivalent by any of the three principal rating agencies.
Indices are not available for investment, are not professionally managed and do not reflect sales charges, fees, brokerage commissions, taxes or other expenses of investing. Securities in the Fund may not match those in an index.
| 2 | Columbia High Yield Municipal Fund | Annual Report 2018 |
Fund at a Glance (continued)
Performance of a hypothetical $10,000 investment (May 31, 2008 — May 31, 2018)
The chart above shows the change in value of a hypothetical $10,000 investment in Class A shares of Columbia High Yield Municipal Fund during the stated time period, and does not reflect the deduction of taxes that a shareholder may pay on Fund distributions or on the redemption of Fund shares.
| Quality breakdown (%) (at May 31, 2018) |
| AAA rating | 1.5 |
| AA rating | 8.9 |
| A rating | 18.3 |
| BBB rating | 23.2 |
| BB rating | 9.6 |
| B rating | 3.9 |
| CCC rating | 1.3 |
| C rating | 0.7 |
| D rating | 0.5 |
| Not rated | 32.1 |
| Total | 100.0 |
Percentages indicated are based upon total fixed income investments.
Bond ratings apply to the underlying holdings of the Fund and not the Fund itself and are divided into categories ranging from highest to lowest credit quality, determined by using the middle rating of Moody’s, S&P and Fitch, after dropping the highest and lowest available ratings. When ratings are available from only two rating agencies, the lower rating is used. When a rating is available from only one rating agency, that rating is used. When a bond is not rated by any rating agency, it is designated as “Not rated.” Credit quality ratings assigned by a rating agency are subjective opinions, not statements of fact, and are subject to change, including daily. The ratings assigned by credit rating agencies are but one of the considerations that the Investment Manager and/or Fund’s subadviser incorporates into its credit analysis process, along with such other issuer-specific factors as cash flows, capital structure and leverage ratios, ability to de-leverage (repay) through free cash flow, quality of management, market positioning and access to capital, as well as such security-specific factors as the terms of the security (e.g., interest rate and time to maturity) and the amount and type of any collateral.
Top Ten States/Territories (%)
(at May 31, 2018) |
| Illinois | 12.5 |
| Florida | 8.9 |
| Texas | 7.9 |
| California | 7.5 |
| Pennsylvania | 6.9 |
| New York | 5.3 |
| Washington | 3.3 |
| Michigan | 3.2 |
| Colorado | 3.2 |
| Georgia | 3.1 |
Percentages indicated are based upon total investments.
For further detail about these holdings, please refer to the section entitled “Portfolio of Investments.”
Fund holdings are as of the date given, are subject to change at any time, and are not recommendations to buy or sell any security.
Columbia High Yield Municipal Fund | Annual Report 2018
| 3 |
Manager Discussion of Fund Performance
For the 12-month period that ended May 31, 2018, Class A shares of the Fund returned 3.68% excluding sales charges. Institutional Class shares of the Fund returned 3.88%. During the same time period, the Fund’s Blended Benchmark returned 4.24%, and the Bloomberg Barclays High Yield Municipal Bond Index returned 6.38%. The Fund’s underperformance stemmed largely from its underweight to tobacco securitization issues and other lower quality bonds.
Despite rising rates, municipal bonds posted positive returns
The municipal bond market experienced a fair amount of volatility during the reporting period. Yields reached historic lows in the summer of 2017 before gradually increasing in the autumn as rising new issuance created a less favorable balance of supply and demand. (Prices and yields move in opposite directions.) Despite record issuance, tax-exempt yields declined in December 2017 in advance of the federal tax reform legislation changes. However, yields rose in the first part of 2018 in reaction to interest rate hikes by the U.S. Federal Reserve (Fed) and pronounced weakness in U.S. Treasuries. Although market volatility remained high and investors were somewhat hesitant due to expectations for higher interest rates, demand for municipal bonds stayed robust due in part to the stability in credit conditions. Yield spreads tightened in most sectors, with yields on lower quality bonds moving closer to those on higher quality issues due to the combination of insufficient supply and strong demand for bonds with relatively higher yields. Tobacco was once again among the best performing sectors, as its above-average yields fueled hearty investor demand.
Contributors and detractors
The Fund underperformed its benchmark due to an underweight in tobacco securitization debt and other lower quality bonds. Tobacco is one of the largest sector weightings in the Bloomberg Barclays High Yield Municipal Bond Index, but we retained an underweight in the space due to its elevated volatility. During times in which higher yielding assets are in demand, this aspect of our positioning can be a source of underperformance. We maintained some exposure to the sector to capture its attractive yields, but we did not increase the position due to elevated prices and our expectation that future defaults are likely.
The Fund’s exposure to distressed Puerto Rico debt also detracted from relative performance. The territory’s bonds came under heavy pressure in September 2017 following Hurricane Maria, as investors struggled to assess the financial impact of the disaster. While prices rebounded in 2018 as revised economic projections reflected a better-than-expected recovery, Puerto Rico debt nonetheless hurt performance for the full period due to its earlier losses. We took advantage of the rebound in prices to reduce the Fund’s position in the territory.
Two distressed credits suffered price declines and therefore detracted from the Fund’s 12-month results. Texas Pellets experienced problems with one of its facilities, leading to a lower potential recovery from its assets in bankruptcy. Annuvia, a Florida-based fertilizer producer, lost ground on expectations that weaker financial results would result in a debt restructuring.
On the positive side, the Fund was aided by having an underweight in short-maturity bonds, given that this market segment lagged longer term debt by a considerable margin. Positions in local general obligation bonds, particularly those issued by Chicago and the Chicago Public Schools, also performed well, as better fundamental news improved the market’s view of the issuers’ credit quality and led to tighter yield spreads. We slightly reduced the Fund’s position in Chicago bonds in order to capitalize on their healthy price performance. An overweight to certain high-yield sectors, including Continuing Care Retirement Communities (CCRCs), added value amid the outperformance for higher yielding issues.
A conservative approach to credit quality
The market’s overall credit quality remained stable at the end of the reporting period. Illinois appeared to be making some progress, as a political stalemate in the state ended with passage of an on-time budget for the first time in three years. This favorable development was reflected in market prices. The Fund had increased its allocation to the state in advance of the budget passage due to relatively compelling yields spreads and indications that a budget would be passed and allow the state to avoid downgrades to its credit rating.
| 4 | Columbia High Yield Municipal Fund | Annual Report 2018 |
Manager Discussion of Fund Performance (continued)
We maintained a strict buying discipline, especially among lower quality securities. As some of the Fund’s holdings were called away by issuers, we found some attractive replacements that allowed us to maintain a stable weighting in lower quality bonds. The Fund’s allocation to lower quality bonds remained below half of the portfolio throughout the period. We also took advantage of strong demand to pare back on our weightings in certain riskier issues where we believed current yields did not provide appropriate compensation for the risk.
We maintained a slightly longer duration (i.e., an interest-rate sensitivity above that of the benchmark) based on our view that we are nearing the end of the economic cycle and that deflationary factors may limit the magnitude of yield increases. We also maintained exposure to the long end of the yield curve. The Fed’s interest-rate policy tends to have a larger impact on the front end of the curve, which can lead to better returns for longer maturities.
Fixed-income securities present issuer default risk. The Fund invests substantially in municipal securities and will be affected by tax, legislative, regulatory, demographic or political changes, as well as changes impacting a state’s financial, economic or other conditions. A relatively small number of tax-exempt issuers may necessitate the Fund investing more heavily in a single issuer and, therefore, be more exposed to the risk of loss than a fund that invests more broadly. Prepayment and extension risk exists because the timing of payments on a loan, bond or other investment may accelerate when interest rates fall or decelerate when interest rates rise which may reduce investment opportunities and potential returns. A rise in interest rates may result in a price decline of fixed-income instruments held by the Fund, negatively impacting its performance and NAV. Falling rates may result in the Fund investing in lower yielding debt instruments, lowering the Fund’s income and yield. These risks may be heightened for longer maturity and duration securities. Non-investment-grade (high-yield or junk) securities present greater price volatility and more risk to principal and income than higher rated securities. Market risk may affect a single issuer, sector of the economy, industry or the market as a whole. Federal and state tax rules apply to capital gain distributions and any gains or losses on sales. Income may be subject to state, local or alternative minimum taxes. Market or other (e.g., interest rate) environments may adversely affect the liquidity of Fund investments, negatively impacting their price. Generally, the less liquid the market at the time the Fund sells a holding, the greater the risk of loss or decline of value to the Fund. See the Fund’s prospectus for more information on these and other risks.
The views expressed in this report reflect the current views of the respective parties. These views are not guarantees of future performance and involve certain risks, uncertainties and assumptions that are difficult to predict, so actual outcomes and results may differ significantly from the views expressed. These views are subject to change at any time based upon economic, market or other conditions and the respective parties disclaim any responsibility to update such views. These views may not be relied on as investment advice and, because investment decisions for a Columbia fund are based on numerous factors, may not be relied on as an indication of trading intent on behalf of any particular Columbia fund. References to specific securities should not be construed as a recommendation or investment advice.
Columbia High Yield Municipal Fund | Annual Report 2018
| 5 |
Understanding Your Fund’s Expenses
(Unaudited)
As an investor, you incur two types of costs. There are transaction costs, which generally include sales charges on purchases and may include redemption fees. There are also ongoing costs, which generally include management fees, distribution and/or service fees, and other fund expenses. The following information is intended to help you understand your ongoing costs (in dollars) of investing in the Fund and to help you compare these costs with the ongoing costs of investing in other mutual funds.
Analyzing your Fund’s expenses
To illustrate these ongoing costs, we have provided examples and calculated the expenses paid by investors in each share class of the Fund during the period. The actual and hypothetical information in the table is based on an initial investment of $1,000 at the beginning of the period indicated and held for the entire period. Expense information is calculated two ways and each method provides you with different information. The amount listed in the “Actual” column is calculated using the Fund’s actual operating expenses and total return for the period. You may use the Actual information, together with the amount invested, to estimate the expenses that you paid over the period. Simply divide your account value by $1,000 (for example, an $8,600 account value divided by $1,000 = 8.6), then multiply the results by the expenses paid during the period under the “Actual” column. The amount listed in the “Hypothetical” column assumes a 5% annual rate of return before expenses (which is not the Fund’s actual return) and then applies the Fund’s actual expense ratio for the period to the hypothetical return. You should not use the hypothetical account values and expenses to estimate either your actual account balance at the end of the period or the expenses you paid during the period. See “Compare with other funds” below for details on how to use the hypothetical data.
Compare with other funds
Since all mutual funds are required to include the same hypothetical calculations about expenses in shareholder reports, you can use this information to compare the ongoing cost of investing in the Fund with other funds. To do so, compare the hypothetical example with the 5% hypothetical examples that appear in the shareholder reports of other funds. As you compare hypothetical examples of other funds, it is important to note that hypothetical examples are meant to highlight the ongoing costs of investing in a fund only and do not reflect any transaction costs, such as sales charges, or redemption or exchange fees. Therefore, the hypothetical calculations are useful in comparing ongoing costs only, and will not help you determine the relative total costs of owning different funds. If transaction costs were included in these calculations, your costs would be higher.
| December 1, 2017 — May 31, 2018 |
| | Account value at the
beginning of the
period ($) | Account value at the
end of the
period ($) | Expenses paid during
the period ($) | Fund’s annualized
expense ratio (%) |
| | Actual | Hypothetical | Actual | Hypothetical | Actual | Hypothetical | Actual |
| Class A | 1,000.00 | 1,000.00 | 1,022.30 | 1,020.69 | 4.29 | 4.28 | 0.85 |
| Advisor Class | 1,000.00 | 1,000.00 | 1,023.40 | 1,021.69 | 3.28 | 3.28 | 0.65 |
| Class C | 1,000.00 | 1,000.00 | 1,019.00 | 1,017.45 | 7.55 | 7.54 | 1.50 |
| Institutional Class | 1,000.00 | 1,000.00 | 1,023.40 | 1,021.69 | 3.28 | 3.28 | 0.65 |
| Institutional 2 Class | 1,000.00 | 1,000.00 | 1,023.40 | 1,021.94 | 3.03 | 3.02 | 0.60 |
| Institutional 3 Class | 1,000.00 | 1,000.00 | 1,022.80 | 1,022.19 | 2.77 | 2.77 | 0.55 |
Expenses paid during the period are equal to the annualized expense ratio for each class as indicated above, multiplied by the average account value over the period and then multiplied by the number of days in the Fund’s most recent fiscal half year and divided by 365.
Expenses do not include fees and expenses incurred indirectly by the Fund from its investment in underlying funds, including affiliated and non-affiliated pooled investment vehicles, such as mutual funds and exchange-traded funds.
Had Columbia Management Investment Advisers, LLC and/or certain of its affiliates not waived/reimbursed certain fees and expenses, account value at the end of the period would have been reduced.
| 6 | Columbia High Yield Municipal Fund | Annual Report 2018 |
Portfolio of Investments
May 31, 2018
(Percentages represent value of investments compared to net assets)
Investments in securities
| Floating Rate Notes 1.3% |
| Issue Description | Effective
Yield | | Principal
Amount ($) | Value ($) |
| Indiana 0.3% |
| Indiana Finance Authority(a),(b) |
| Unrefunded Revenue Bonds |
| Lease Appropriation |
| Series 2009A-2 (JPMorgan Chase Bank) |
| 02/01/2037 | 0.890% | | 2,600,000 | 2,600,000 |
| New York 1.0% |
| City of New York(a),(b) |
| Unlimited General Obligation Notes |
| Subordinated Series 2013-D3 (JPMorgan Chase Bank) |
| 08/01/2038 | 0.920% | | 2,650,000 | 2,650,000 |
| New York City Transitional Finance Authority Future Tax Secured(a),(b) |
| Revenue Bonds |
| Subordinated Series 2015 (Royal Bank of Canada) |
| 08/01/2041 | 0.900% | | 2,580,000 | 2,580,000 |
| New York City Water & Sewer System(a),(b) |
| Revenue Bonds |
| 2nd General Resolution |
| Series 2016BB (State Street Bank and Trust Co.) |
| 06/15/2049 | 1.000% | | 2,325,000 | 2,325,000 |
| Total | 7,555,000 |
Total Floating Rate Notes
(Cost $10,155,000) | 10,155,000 |
|
| Municipal Bonds 97.8% |
| Issue Description | Coupon
Rate | | Principal
Amount ($) | Value ($) |
| Arizona 2.4% |
| Industrial Development Authority of the County of Pima (The)(c) |
| Revenue Bonds |
| American Leadership Academy Project |
| Series 2017 |
| 06/15/2047 | 5.000% | | 4,150,000 | 4,168,177 |
| La Paz County Industrial Development Authority |
| Revenue Bonds |
| Charter School Solutions - Harmony Public |
| Series 2016 |
| 02/15/2036 | 5.000% | | 1,200,000 | 1,254,480 |
| 02/15/2046 | 5.000% | | 1,500,000 | 1,557,135 |
| Maricopa County Industrial Development Authority(c) |
| Revenue Bonds |
| Christian Care Surprise, Inc. Project |
| Series 2016 |
| 01/01/2048 | 6.000% | | 3,595,000 | 3,681,855 |
| Municipal Bonds (continued) |
| Issue Description | Coupon
Rate | | Principal
Amount ($) | Value ($) |
| Maricopa County Pollution Control Corp. |
| Revenue Bonds |
| El Paso Electric Co. Project |
| Series 2009B |
| 04/01/2040 | 7.250% | | 3,600,000 | 3,754,332 |
| Surprise Municipal Property Corp. |
| Revenue Bonds |
| Series 2007 |
| 04/01/2032 | 4.900% | | 2,000,000 | 2,012,920 |
| Tempe Industrial Development Authority(c) |
| Revenue Bonds |
| Mirabella at ASU Project |
| Series 2017A |
| 10/01/2047 | 6.125% | | 1,400,000 | 1,462,006 |
| Total | 17,890,905 |
| California 7.5% |
| California Health Facilities Financing Authority |
| Refunding Revenue Bonds |
| Northern California Presbyterian Homes |
| Series 2015 |
| 07/01/2039 | 5.000% | | 900,000 | 1,007,262 |
| California Municipal Finance Authority(c),(d),(e) |
| Revenue Bonds |
| UTS Renewable Energy-Waste Water Facilities |
| Series 2011 AMT |
| 12/01/2032 | 0.000% | | 1,835,000 | 275,250 |
| California State Public Works Board |
| Refunding Revenue Bonds |
| Various Capital Projects |
| Series 2012G |
| 11/01/2037 | 5.000% | | 1,250,000 | 1,382,950 |
| California Statewide Communities Development Authority |
| Refunding Revenue Bonds |
| 899 Charleston Project |
| Series 2014A |
| 11/01/2044 | 5.250% | | 1,500,000 | 1,595,430 |
| Revenue Bonds |
| American Baptist Homes West |
| Series 2010 |
| 10/01/2039 | 6.250% | | 2,750,000 | 2,891,597 |
| Loma Linda University Medical Center |
| Series 2014 |
| 12/01/2054 | 5.500% | | 5,000,000 | 5,448,900 |
| Chino Public Financing Authority |
| Refunding Special Tax Bonds |
| Series 2012 |
| 09/01/2034 | 5.000% | | 1,775,000 | 1,904,344 |
The accompanying Notes to Financial Statements are an integral part of this statement.
Columbia High Yield Municipal Fund | Annual Report 2018
| 7 |
Portfolio of Investments (continued)
May 31, 2018
| Municipal Bonds (continued) |
| Issue Description | Coupon
Rate | | Principal
Amount ($) | Value ($) |
| City of Carson |
| Special Assessment Bonds |
| Assessment District No. 92-1 |
| Series 1992 |
| 09/02/2022 | 7.375% | | 50,000 | 50,585 |
| City of Long Beach Marina System |
| Revenue Bonds |
| Series 2015 |
| 05/15/2045 | 5.000% | | 500,000 | 548,150 |
| City of Santa Maria Water & Wastewater(f) |
| Refunding Revenue Bonds |
| Series 2012A |
| 02/01/2025 | 0.000% | | 3,100,000 | 2,452,565 |
| City of Upland |
| Prerefunded 01/01/21 Certificate of Participation |
| San Antonio Community Hospital |
| Series 2011 |
| 01/01/2041 | 6.500% | | 5,000,000 | 5,587,300 |
| Compton Unified School District(f) |
| Unlimited General Obligation Bonds |
| Election of 2002 - Capital Appreciation |
| Series 2006C |
| 06/01/2025 | 0.000% | | 2,310,000 | 1,909,746 |
| County of Sacramento Airport System |
| Revenue Bonds |
| Subordinated Series 2009D |
| 07/01/2035 | 6.000% | | 2,500,000 | 2,508,925 |
| Department of Veterans Affairs Veteran’s Farm & Home Purchase Program |
| Revenue Bonds |
| Series 2012A |
| 12/01/2025 | 3.500% | | 3,760,000 | 3,854,602 |
| Empire Union School District(f) |
| Special Tax Bonds |
| Communities Facilities District No. 1987-1 |
| Series 2002A (AMBAC) |
| 10/01/2021 | 0.000% | | 1,665,000 | 1,541,574 |
| Foothill-Eastern Transportation Corridor Agency |
| Refunding Revenue Bonds |
| Junior Lien |
| Series 2014C |
| 01/15/2043 | 6.500% | | 5,000,000 | 5,858,300 |
| Hesperia Public Financing Authority |
| Tax Allocation Bonds |
| Redevelopment & Housing Projects |
| Series 2007A (SGI) |
| 09/01/2027 | 5.500% | | 5,430,000 | 5,444,715 |
| M-S-R Energy Authority |
| Revenue Bonds |
| Series 2009B |
| 11/01/2039 | 6.500% | | 5,000,000 | 7,085,400 |
| Municipal Bonds (continued) |
| Issue Description | Coupon
Rate | | Principal
Amount ($) | Value ($) |
| Palomar Health |
| Refunding Revenue Bonds |
| Series 2016 |
| 11/01/2036 | 5.000% | | 1,845,000 | 2,007,176 |
| State of California |
| Unlimited General Obligation Bonds |
| Various Purpose |
| Series 2012 |
| 04/01/2042 | 5.000% | | 3,000,000 | 3,285,630 |
| Total | 56,640,401 |
| Colorado 3.1% |
| Colliers Hill Metropolitan District No. 2 |
| Limited General Obligation Bonds |
| Senior Bonds |
| Series 2017A |
| 12/01/2047 | 6.500% | | 4,380,000 | 4,447,277 |
| Colorado Health Facilities Authority |
| Refunding Revenue Bonds |
| NCMC, Inc. Project |
| Series 2016 |
| 05/15/2032 | 4.000% | | 3,535,000 | 3,729,460 |
| Revenue Bonds |
| Senior Living - Ralston Creek at Arvada |
| Series 2017 |
| 11/01/2052 | 6.000% | | 5,000,000 | 5,148,100 |
| Colorado International Center Metropolitan District No. 14 |
| Limited General Obligation Refunding Bonds |
| Series 2018 |
| 12/01/2046 | 5.875% | | 1,000,000 | 1,046,560 |
| Leyden Rock Metropolitan District No. 10 |
| Limited General Obligation Bonds |
| Series 2016A |
| 12/01/2045 | 5.000% | | 1,000,000 | 1,020,540 |
| Palisade Metropolitan District No. 2 |
| Limited General Obligation Bonds |
| Series 2016 |
| 12/01/2046 | 5.000% | | 1,500,000 | 1,516,560 |
| Regional Transportation District |
| Certificate of Participation |
| Series 2014A |
| 06/01/2039 | 5.000% | | 5,000,000 | 5,477,400 |
| Sierra Ridge Metropolitan District No. 2 |
| Senior Limited General Obligation Bonds |
| Series 2016A |
| 12/01/2046 | 5.500% | | 1,500,000 | 1,539,465 |
| Total | 23,925,362 |
The accompanying Notes to Financial Statements are an integral part of this statement.
| 8 | Columbia High Yield Municipal Fund | Annual Report 2018 |
Portfolio of Investments (continued)
May 31, 2018
| Municipal Bonds (continued) |
| Issue Description | Coupon
Rate | | Principal
Amount ($) | Value ($) |
| Connecticut 0.8% |
| Connecticut State Health & Educational Facility Authority(c) |
| Revenue Bonds |
| Church Home of Hartford, Inc. Project |
| Series 2016 |
| 09/01/2053 | 5.000% | | 1,750,000 | 1,815,678 |
| Harbor Point Infrastructure Improvement District |
| Prerefunded 04/01/20 Tax Allocation Bonds |
| Harbor Point Project |
| Series 2010A |
| 04/01/2039 | 7.875% | | 4,000,000 | 4,414,320 |
| Total | 6,229,998 |
| Delaware 0.2% |
| Centerline Equity Issuer Trust(c),(d) |
| Secured AMT |
| 05/14/2004 |
| 05/15/2019 | 6.300% | | 1,000,000 | 1,040,870 |
| City of Wilmington(d) |
| Revenue Bonds |
| Housing-Electra Arms Senior Associates Project |
| Series 1998 AMT |
| 06/01/2028 | 6.250% | | 555,000 | 555,305 |
| Total | 1,596,175 |
| District of Columbia 0.7% |
| District of Columbia |
| Revenue Bonds |
| Ingleside Rock Creek Project |
| Series 2017 |
| 07/01/2052 | 5.000% | | 1,000,000 | 1,036,130 |
| Metropolitan Washington Airports Authority(d) |
| Revenue Bonds |
| Airport System |
| Series 2012A AMT |
| 10/01/2024 | 5.000% | | 4,000,000 | 4,421,240 |
| Total | 5,457,370 |
| Florida 8.8% |
| Capital Trust Agency, Inc.(c) |
| Revenue Bonds |
| 1st Mortgage Tallahassee Tapestry Senior Housing Project |
| Series 2015 |
| 12/01/2050 | 7.125% | | 2,000,000 | 2,113,200 |
| City of Lakeland |
| Refunding Revenue Bonds |
| 1st Mortgage-Carpenters Home Estates |
| Series 2008 |
| 01/01/2028 | 6.250% | | 675,000 | 686,070 |
| 01/01/2043 | 6.375% | | 2,250,000 | 2,283,323 |
| Municipal Bonds (continued) |
| Issue Description | Coupon
Rate | | Principal
Amount ($) | Value ($) |
| Revenue Bonds |
| Lakeland Regional Health |
| Series 2015 |
| 11/15/2040 | 5.000% | | 5,000,000 | 5,514,350 |
| City of Orlando |
| Refunding Revenue Bonds |
| Senior Lien Tourist Development Tax |
| Series 2017 (AGM) |
| 11/01/2037 | 5.000% | | 1,725,000 | 1,958,979 |
| City of Tallahassee |
| Revenue Bonds |
| Tallahassee Memorial Healthcare, Inc. Project |
| Series 2016 |
| 12/01/2055 | 5.000% | | 3,000,000 | 3,220,650 |
| County of Miami-Dade(f) |
| Revenue Bonds |
| Capital Appreciation |
| Subordinated Series 2009B |
| 10/01/2041 | 0.000% | | 10,000,000 | 3,758,200 |
| County of Miami-Dade |
| Subordinated Refunding Revenue Bonds |
| Series 2012B |
| 10/01/2037 | 5.000% | | 1,530,000 | 1,666,155 |
| County of Miami-Dade Aviation |
| Refunding Revenue Bonds |
| Series 2016 |
| 10/01/2030 | 5.000% | | 1,310,000 | 1,519,482 |
| Florida Development Finance Corp.(c) |
| Revenue Bonds |
| Miami Arts Charter School Project |
| Series 2014A |
| 06/15/2044 | 6.000% | | 6,100,000 | 5,683,309 |
| Renaissance Charter School |
| Series 2015 |
| 06/15/2046 | 6.125% | | 4,900,000 | 5,108,348 |
| Florida Development Finance Corp. |
| Revenue Bonds |
| Renaissance Charter School |
| Series 2010A |
| 09/15/2040 | 6.000% | | 3,750,000 | 3,897,525 |
| Series 2012A |
| 06/15/2043 | 6.125% | | 4,500,000 | 4,697,640 |
| Renaissance Charter School Projects |
| Series 2013A |
| 06/15/2044 | 8.500% | | 5,000,000 | 5,748,250 |
| Mid-Bay Bridge Authority |
| Prerefunded 10/01/21 Revenue Bonds |
| Series 2011A |
| 10/01/2040 | 7.250% | | 4,000,000 | 4,646,880 |
The accompanying Notes to Financial Statements are an integral part of this statement.
Columbia High Yield Municipal Fund | Annual Report 2018
| 9 |
Portfolio of Investments (continued)
May 31, 2018
| Municipal Bonds (continued) |
| Issue Description | Coupon
Rate | | Principal
Amount ($) | Value ($) |
| Orange County Health Facilities Authority |
| Refunding Revenue Bonds |
| Mayflower Retirement Center |
| Series 2012 |
| 06/01/2042 | 5.125% | | 750,000 | 788,685 |
| Orlando Health, Inc. |
| Series 2016A |
| 10/01/2034 | 5.000% | | 2,000,000 | 2,253,400 |
| Orange County Industrial Development Authority(c),(d),(e) |
| Revenue Bonds |
| VITAG Florida LLC Project |
| Series 2014 AMT |
| 07/01/2036 | 0.000% | | 5,000,000 | 2,918,350 |
| Palm Beach County Health Facilities Authority |
| Revenue Bonds |
| Sinai Residences Boca Raton |
| Series 2014 |
| 06/01/2049 | 7.500% | | 1,250,000 | 1,445,350 |
| South Lake County Hospital District |
| Revenue Bonds |
| South Lake Hospital, Inc. |
| Series 2010A |
| 04/01/2039 | 6.250% | | 2,000,000 | 2,061,440 |
| St. Johns County Industrial Development Authority |
| Refunding Revenue Bonds |
| Bayview Project |
| Series 2007A |
| 10/01/2041 | 5.250% | | 3,725,000 | 3,161,519 |
| Westridge Community Development District(e) |
| Special Assessment Bonds |
| Series 2005 |
| 05/01/2037 | 0.000% | | 2,650,000 | 1,696,000 |
| Total | 66,827,105 |
| Georgia 3.1% |
| DeKalb County Hospital Authority |
| Revenue Bonds |
| DeKalb Medical Center, Inc. Project |
| Series 2010 |
| 09/01/2040 | 6.125% | | 4,500,000 | 4,807,485 |
| Georgia Housing & Finance Authority |
| Revenue Bonds |
| Single Family Mortgage |
| Series 2017A |
| 12/01/2042 | 4.050% | | 3,000,000 | 3,093,030 |
| Georgia State Road & Tollway Authority(c),(f) |
| Revenue Bonds |
| I-75 S Expressway |
| Series 2014S |
| 06/01/2049 | 0.000% | | 9,100,000 | 6,159,062 |
| Municipal Bonds (continued) |
| Issue Description | Coupon
Rate | | Principal
Amount ($) | Value ($) |
| Glynn-Brunswick Memorial Hospital Authority |
| Revenue Bonds |
| SE Georgia Health System Anticipation Certificates |
| Series 2017 |
| 08/01/2047 | 5.000% | | 355,000 | 391,135 |
| Rockdale County Development Authority(d) |
| Revenue Bonds |
| Visy Paper Project |
| Series 2007A AMT |
| 01/01/2034 | 6.125% | | 5,000,000 | 5,000,000 |
| Savannah Economic Development Authority |
| Refunding Revenue Bonds |
| Marshes Skidaway Island Project |
| Series 2013 |
| 01/01/2049 | 7.250% | | 3,500,000 | 3,967,915 |
| Total | 23,418,627 |
| Hawaii 1.4% |
| State of Hawaii |
| Refunding Unlimited General Obligation Bonds |
| Series 2016FE |
| 10/01/2027 | 5.000% | | 4,890,000 | 5,815,628 |
| State of Hawaii Department of Budget & Finance |
| Prerefunded 11/15/19 Revenue Bonds |
| 15 Craigside Project |
| Series 2009A |
| 11/15/2044 | 9.000% | | 2,375,000 | 2,614,543 |
| Revenue Bonds |
| Hawaii Pacific University |
| Series 2013A |
| 07/01/2043 | 6.875% | | 1,800,000 | 1,898,388 |
| Total | 10,328,559 |
| Idaho 0.6% |
| Idaho Health Facilities Authority |
| Revenue Bonds |
| Terraces of Boise Project |
| Series 2014A |
| 10/01/2049 | 8.125% | | 4,000,000 | 4,558,640 |
| Illinois 12.4% |
| Chicago Board of Education(c) |
| Unlimited General Obligation Bonds |
| Dedicated |
| Series 2017A |
| 12/01/2046 | 7.000% | | 3,000,000 | 3,569,070 |
| Chicago Board of Education |
| Unlimited General Obligation Bonds |
| Dedicated |
| Series 2017H |
| 12/01/2036 | 5.000% | | 1,665,000 | 1,710,588 |
The accompanying Notes to Financial Statements are an integral part of this statement.
| 10 | Columbia High Yield Municipal Fund | Annual Report 2018 |
Portfolio of Investments (continued)
May 31, 2018
| Municipal Bonds (continued) |
| Issue Description | Coupon
Rate | | Principal
Amount ($) | Value ($) |
| Project |
| Series 2015C |
| 12/01/2039 | 5.250% | | 2,000,000 | 2,019,700 |
| Series 2011A |
| 12/01/2041 | 5.000% | | 1,110,000 | 1,112,109 |
| Series 2012A |
| 12/01/2042 | 5.000% | | 1,000,000 | 1,000,790 |
| Series 2016B |
| 12/01/2046 | 6.500% | | 1,500,000 | 1,705,245 |
| Chicago Board of Education(g) |
| Unlimited General Obligation Refunding Bonds |
| Series 2018A (AGM) |
| ASSURED GUARANTY MUNICIPAL CORP |
| 12/01/2035 | 5.000% | | 500,000 | 557,015 |
| Chicago O’Hare International Airport(d) |
| Revenue Bonds |
| TriPs Obligated Group |
| Series 2018 AMT |
| 07/01/2048 | 5.000% | | 800,000 | 883,944 |
| Chicago Park District |
| Limited General Obligation Bonds |
| Series 2015A |
| 01/01/2040 | 5.000% | | 3,000,000 | 3,213,480 |
| City of Chicago |
| Prerefunded 01/01/25 Revenue Bonds |
| Series 2002 |
| 01/01/2030 | 5.000% | | 1,000,000 | 1,159,890 |
| Refunding Unlimited General Obligation Bonds |
| Series 2005D |
| 01/01/2033 | 5.500% | | 1,000,000 | 1,072,790 |
| Unlimited General Obligation Bonds |
| Project |
| Series 2011A |
| 01/01/2040 | 5.000% | | 5,000,000 | 5,055,150 |
| Series 2009C |
| 01/01/2040 | 5.000% | | 2,500,000 | 2,509,050 |
| Series 2015A |
| 01/01/2039 | 5.500% | | 500,000 | 526,135 |
| Series 2017A |
| 01/01/2038 | 6.000% | | 5,235,000 | 5,895,395 |
| Unlimited General Obligation Refunding Bonds |
| Project |
| Series 2014A |
| 01/01/2033 | 5.250% | | 1,000,000 | 1,050,150 |
| 01/01/2036 | 5.000% | | 4,500,000 | 4,641,030 |
| Series 2007F |
| 01/01/2042 | 5.500% | | 1,000,000 | 1,059,830 |
| Municipal Bonds (continued) |
| Issue Description | Coupon
Rate | | Principal
Amount ($) | Value ($) |
| City of Chicago Wastewater Transmission |
| Refunding Revenue Bonds |
| 2nd Lien |
| Series 2015C |
| 01/01/2035 | 5.000% | | 1,000,000 | 1,080,080 |
| County of Cook |
| Unlimited General Obligation Refunding Bonds |
| Series 2018 |
| 11/15/2035 | 5.000% | | 450,000 | 504,932 |
| Du Page County Special Service Area No. 31 |
| Special Tax Bonds |
| Monarch Landing Project |
| Series 2006 |
| 03/01/2036 | 5.625% | | 697,000 | 697,815 |
| Illinois Finance Authority |
| Prerefunded 04/01/21 Revenue Bonds |
| CHF-Normal LLC-Illinois State University |
| Series 2011 |
| 04/01/2043 | 7.000% | | 3,450,000 | 3,910,161 |
| Prerefunded 08/15/19 Revenue Bonds |
| Provena Health |
| Series 2009A |
| 08/15/2034 | 7.750% | | 40,000 | 42,775 |
| Refunding Revenue Bonds |
| DePaul University |
| Series 2016A |
| 10/01/2034 | 4.000% | | 1,500,000 | 1,553,700 |
| Unrefunded Revenue Bonds |
| Riverside Health System |
| Series 2009 |
| 11/15/2035 | 6.250% | | 1,190,000 | 1,258,615 |
| Illinois Finance Authority(e) |
| Revenue Bonds |
| Leafs Hockey Club Project |
| Series 2007A |
| 03/01/2037 | 0.000% | | 1,000,000 | 240,000 |
| Illinois State Toll Highway Authority |
| Senior Revenue Bonds |
| Series 2016B |
| 01/01/2037 | 5.000% | | 3,500,000 | 3,977,120 |
| Metropolitan Pier & Exposition Authority |
| Refunding Revenue Bonds |
| McCormick Place Project |
| Series 2010B-2 |
| 06/15/2050 | 5.000% | | 5,000,000 | 5,090,650 |
| Revenue Bonds |
| McCormick Place Expansion Project |
| Series 2017 |
| 06/15/2057 | 5.000% | | 3,750,000 | 3,941,438 |
The accompanying Notes to Financial Statements are an integral part of this statement.
Columbia High Yield Municipal Fund | Annual Report 2018
| 11 |
Portfolio of Investments (continued)
May 31, 2018
| Municipal Bonds (continued) |
| Issue Description | Coupon
Rate | | Principal
Amount ($) | Value ($) |
| Metropolitan Water Reclamation District of Greater Chicago |
| Green Unlimited General Obligation Bond |
| Series 2016E |
| 12/01/2036 | 5.000% | | 2,225,000 | 2,501,367 |
| Unlimited General Obligation Bonds |
| Green Bond |
| Series 2016E |
| 12/01/2035 | 5.000% | | 1,620,000 | 1,826,339 |
| Northern Illinois Municipal Power Agency |
| Refunding Revenue Bonds |
| Series 2016A |
| 12/01/2041 | 4.000% | | 5,000,000 | 5,075,600 |
| Railsplitter Tobacco Settlement Authority |
| Prerefunded 06/01/21 Revenue Bonds |
| Series 2010 |
| 06/01/2028 | 6.000% | | 5,000,000 | 5,576,450 |
| Revenue Bonds |
| Series 2017 |
| 06/01/2027 | 5.000% | | 1,315,000 | 1,506,688 |
| State of Illinois |
| Unlimited General Obligation Bonds |
| Series 2016 |
| 01/01/2041 | 5.000% | | 3,830,000 | 3,971,557 |
| Series 2018A |
| 05/01/2032 | 5.000% | | 2,500,000 | 2,646,100 |
| 05/01/2041 | 5.000% | | 3,910,000 | 4,090,212 |
| Village of Hillside |
| Tax Allocation Bonds |
| Senior Lien-Mannheim Redevelopment Project |
| Series 2008 |
| 01/01/2028 | 7.000% | | 5,240,000 | 5,348,992 |
| Village of Lincolnshire |
| Special Tax Bonds |
| Sedgebrook Project |
| Series 2004 |
| 03/01/2034 | 6.250% | | 604,000 | 605,148 |
| Total | 94,187,100 |
| Indiana 0.4% |
| Indiana Finance Authority |
| Revenue Bonds |
| BHI Senior Living |
| Series 2016A |
| 11/15/2046 | 5.250% | | 2,500,000 | 2,725,825 |
| Iowa 0.4% |
| Iowa Finance Authority(h) |
| Refunding Revenue Bonds |
| Deerfield Retirement Community |
| Series 2014 |
| 11/15/2046 | 5.400% | | 2,138,019 | 2,263,008 |
| Municipal Bonds (continued) |
| Issue Description | Coupon
Rate | | Principal
Amount ($) | Value ($) |
| Iowa Finance Authority(e) |
| Refunding Revenue Bonds |
| Deerfield Retirement Community |
| Series 2014 |
| 05/15/2056 | 0.000% | | 401,062 | 4,231 |
| Iowa Student Loan Liquidity Corp.(d) |
| Revenue Bonds |
| Senior Series 2011A-2 AMT |
| 12/01/2030 | 5.850% | | 900,000 | 934,929 |
| Total | 3,202,168 |
| Kansas 1.3% |
| City of Overland Park |
| Revenue Bonds |
| Prairiefire-Lionsgate Project |
| Series 2012 |
| 12/15/2032 | 6.000% | | 6,000,000 | 5,173,440 |
| Wyandotte County-Kansas City Unified Government |
| Revenue Bonds |
| Legends Village West Project |
| Series 2006 |
| 10/01/2028 | 4.875% | | 4,570,000 | 4,564,196 |
| Total | 9,737,636 |
| Kentucky 0.1% |
| Kentucky Economic Development Finance Authority |
| Refunding Revenue Bonds |
| Owensboro Health |
| Series 2017A |
| 06/01/2045 | 5.000% | | 1,000,000 | 1,070,220 |
| Louisiana 2.6% |
| Louisiana Local Government Environmental Facilities & Community Development Authority |
| Revenue Bonds |
| Westlake Chemical Corp. |
| Series 2010A-2 |
| 11/01/2035 | 6.500% | | 5,000,000 | 5,501,500 |
| Louisiana Public Facilities Authority |
| Prerefunded 05/15/26 Revenue Bonds |
| Ochsner Clinic Foundation Project |
| Series 2016 |
| 05/15/2034 | 5.000% | | 25,000 | 29,578 |
| Refunding Revenue Bonds |
| Nineteenth Judicial District |
| Series 2015C (AGM) |
| 06/01/2042 | 5.000% | | 1,000,000 | 1,097,510 |
| Ochsner Clinic Foundation Project |
| Series 2016 |
| 05/15/2034 | 5.000% | | 2,075,000 | 2,318,252 |
The accompanying Notes to Financial Statements are an integral part of this statement.
| 12 | Columbia High Yield Municipal Fund | Annual Report 2018 |
Portfolio of Investments (continued)
May 31, 2018
| Municipal Bonds (continued) |
| Issue Description | Coupon
Rate | | Principal
Amount ($) | Value ($) |
| Louisiana Public Facilities Authority(d) |
| Revenue Bonds |
| Impala Warehousing LLC Project |
| Series 2013 AMT |
| 07/01/2036 | 6.500% | | 4,810,000 | 5,345,546 |
| New Orleans Aviation Board |
| Revenue Bonds |
| Consolidated Rental Car |
| Series 2009A |
| 01/01/2040 | 6.500% | | 5,000,000 | 5,120,600 |
| Total | 19,412,986 |
| Maryland 1.3% |
| Howard County Housing Commission |
| Revenue Bonds |
| Woodfield Oxford Square Apartments |
| Series 2017 |
| 12/01/2037 | 5.000% | | 6,000,000 | 6,794,040 |
| Maryland Health & Higher Educational Facilities Authority |
| Refunding Revenue Bonds |
| University of Maryland Medical System |
| Series 2015 |
| 07/01/2034 | 5.000% | | 2,750,000 | 3,090,752 |
| Total | 9,884,792 |
| Massachusetts 2.7% |
| Massachusetts Development Finance Agency |
| Prerefunded 07/01/20 Revenue Bonds |
| Foxborough Regional Charter School |
| Series 2010A |
| 07/01/2042 | 7.000% | | 4,200,000 | 4,636,422 |
| Refunding Revenue Bonds |
| 1st Mortgage-VOA Concord |
| Series 2007 |
| 11/01/2041 | 5.200% | | 1,000,000 | 1,000,070 |
| South Shore Hospital |
| Series 2016I |
| 07/01/2036 | 4.000% | | 750,000 | 756,690 |
| Massachusetts Development Finance Agency(c) |
| Refunding Revenue Bonds |
| NewBridge on the Charles, Inc. |
| Series 2017 |
| 10/01/2057 | 5.000% | | 2,000,000 | 2,111,220 |
| Massachusetts Development Finance Agency(f) |
| Revenue Bonds |
| Linden Ponds, Inc. Facility |
| Subordinated Series 2011B |
| 11/15/2056 | 0.000% | | 1,391,019 | 288,901 |
| Municipal Bonds (continued) |
| Issue Description | Coupon
Rate | | Principal
Amount ($) | Value ($) |
| Massachusetts Educational Financing Authority(d) |
| Refunding Revenue Bonds |
| Issue K |
| Subordinated Series 2017B AMT |
| 07/01/2046 | 4.250% | | 1,500,000 | 1,529,775 |
| Series 2016J AMT |
| 07/01/2033 | 3.500% | | 2,655,000 | 2,654,920 |
| Revenue Bonds |
| Series 2008H (AGM) AMT |
| 01/01/2030 | 6.350% | | 1,085,000 | 1,093,810 |
| Series 2012J AMT |
| 07/01/2021 | 5.000% | | 3,000,000 | 3,214,170 |
| Massachusetts Educational Financing Authority(d),(g) |
| Refunding Revenue Bonds |
| Series 2018B AMT |
| 07/01/2034 | 3.625% | | 3,135,000 | 3,146,788 |
| Total | 20,432,766 |
| Michigan 3.2% |
| City of Detroit Sewage Disposal System |
| Refunding Revenue Bonds |
| Senior Lien |
| Series 2012A |
| 07/01/2039 | 5.250% | | 1,375,000 | 1,477,506 |
| City of Detroit Water Supply System |
| Revenue Bonds |
| Senior Lien |
| Series 2011A |
| 07/01/2041 | 5.250% | | 1,445,000 | 1,554,329 |
| Series 2011C |
| 07/01/2041 | 5.000% | | 1,025,000 | 1,079,520 |
| Kalamazoo Hospital Finance Authority |
| Refunding Revenue Bonds |
| Bronson Healthcare Group |
| Series 2016 |
| 05/15/2036 | 4.000% | | 7,000,000 | 7,162,750 |
| Michigan Finance Authority |
| Refunding Revenue Bonds |
| Henry Ford Health System |
| Series 2016 |
| 11/15/2046 | 4.000% | | 4,580,000 | 4,638,945 |
| Series 2014H1 |
| 10/01/2022 | 5.000% | | 1,075,000 | 1,164,128 |
| Michigan Tobacco Settlement Finance Authority |
| Revenue Bonds |
| Senior Series 2007A |
| 06/01/2034 | 6.000% | | 1,000,000 | 1,005,150 |
| 06/01/2048 | 6.000% | | 6,000,000 | 6,030,960 |
| Total | 24,113,288 |
The accompanying Notes to Financial Statements are an integral part of this statement.
Columbia High Yield Municipal Fund | Annual Report 2018
| 13 |
Portfolio of Investments (continued)
May 31, 2018
| Municipal Bonds (continued) |
| Issue Description | Coupon
Rate | | Principal
Amount ($) | Value ($) |
| Minnesota 1.7% |
| City of Blaine |
| Refunding Revenue Bonds |
| Crest View Senior Community Project |
| Series 2015 |
| 07/01/2045 | 6.125% | | 3,500,000 | 3,470,110 |
| 07/01/2050 | 6.125% | | 1,500,000 | 1,476,120 |
| City of Brooklyn Center |
| Revenue Bonds |
| Sanctuary Brooklyn Center Project |
| Series 2016 |
| 11/01/2035 | 5.500% | | 2,000,000 | 2,010,040 |
| City of Eveleth |
| Refunding Revenue Bonds |
| Arrowhead Senior Living Community |
| Series 2007 |
| 10/01/2027 | 5.200% | | 1,810,000 | 1,756,533 |
| Dakota County Community Development Agency |
| Revenue Bonds |
| Sanctuary at West St. Paul Project |
| Series 2015 |
| 08/01/2035 | 6.000% | | 2,235,000 | 2,242,755 |
| Minneapolis/St. Paul Housing Finance Board(d) |
| Revenue Bonds |
| Mortgage-Backed Securities Program-Cityliving |
| Series 2006A-2 (GNMA / FNMA) AMT |
| 12/01/2038 | 5.000% | | 1,513 | 1,515 |
| St. Cloud Housing & Redevelopment Authority |
| Revenue Bonds |
| Sanctuary St. Cloud Project |
| Series 2016A |
| 08/01/2036 | 5.250% | | 2,250,000 | 2,023,335 |
| Total | 12,980,408 |
| Mississippi 0.3% |
| County of Lowndes |
| Refunding Revenue Bonds |
| Weyerhaeuser Co. Project |
| Series 1992A |
| 04/01/2022 | 6.800% | | 1,995,000 | 2,271,567 |
| Series 1992B |
| 04/01/2022 | 6.700% | | 230,000 | 261,057 |
| Total | 2,532,624 |
| Missouri 2.7% |
| City of Manchester |
| Refunding Tax Allocation Bonds |
| Highway 141/Manchester Road Project |
| Series 2010 |
| 11/01/2039 | 6.875% | | 5,000,000 | 5,043,000 |
| Municipal Bonds (continued) |
| Issue Description | Coupon
Rate | | Principal
Amount ($) | Value ($) |
| Grundy County Industrial Development Authority |
| Revenue Bonds |
| Wright Memorial Hospital |
| Series 2009 |
| 09/01/2034 | 6.750% | | 2,250,000 | 2,308,612 |
| Kirkwood Industrial Development Authority |
| Prerefunded 05/15/20 Revenue Bonds |
| Aberdeen Heights |
| Series 2010A |
| 05/15/2045 | 8.250% | | 4,500,000 | 5,030,730 |
| Refunding Revenue Bonds |
| Aberdeen Heights Project |
| Series 2017 |
| 05/15/2050 | 5.250% | | 4,500,000 | 4,783,680 |
| St. Louis County Industrial Development Authority |
| Refunding Revenue Bonds |
| St. Andrews Residence for Seniors |
| Series 2015 |
| 12/01/2045 | 5.125% | | 3,000,000 | 3,161,010 |
| Total | 20,327,032 |
| Montana 0.3% |
| City of Kalispell |
| Refunding Revenue Bonds |
| Immanuel Lutheran Corp. Project |
| Series 2017 |
| 05/15/2047 | 5.250% | | 2,200,000 | 2,307,162 |
| Nebraska 1.3% |
| Central Plains Energy Project |
| Revenue Bonds |
| Project #3 |
| Series 2012 |
| 09/01/2042 | 5.000% | | 5,000,000 | 5,468,250 |
| Public Power Generation Agency |
| Refunding Revenue Bonds |
| Whelan Energy Center Unit |
| Series 2015 |
| 01/01/2028 | 5.000% | | 4,000,000 | 4,537,880 |
| Total | 10,006,130 |
| Nevada 1.6% |
| City of Carson City |
| Revenue Bonds |
| Carson Tahoe Regional Medical Center |
| Series 2017 |
| 09/01/2047 | 5.000% | | 455,000 | 498,675 |
| City of Sparks(c) |
| Tax Anticipation Revenue Bonds |
| Senior Sales |
| Series 2008A |
| 06/15/2028 | 6.750% | | 5,000,000 | 5,004,300 |
The accompanying Notes to Financial Statements are an integral part of this statement.
| 14 | Columbia High Yield Municipal Fund | Annual Report 2018 |
Portfolio of Investments (continued)
May 31, 2018
| Municipal Bonds (continued) |
| Issue Description | Coupon
Rate | | Principal
Amount ($) | Value ($) |
| State of Nevada Department of Business & Industry(c),(d) |
| Revenue Bonds |
| Fulcrum Sierra Biofuels |
| Series 2017 AMT |
| 12/15/2037 | 6.250% | | 2,000,000 | 2,175,020 |
| State of Nevada Department of Business & Industry(c) |
| Revenue Bonds |
| Somerset Academy |
| Series 2015A |
| 12/15/2045 | 5.125% | | 2,515,000 | 2,614,418 |
| Series 2018A |
| 12/15/2048 | 5.000% | | 1,500,000 | 1,544,535 |
| Total | 11,836,948 |
| New Hampshire 0.3% |
| New Hampshire Business Finance Authority(d) |
| Revenue Bonds |
| Pennichuck Water Works, Inc. Project |
| Series 1988 Escrowed to Maturity AMT |
| 07/01/2018 | 7.500% | | 30,000 | 30,132 |
| New Hampshire Health and Education Facilities Authority Act |
| Revenue Bonds |
| Hillside Village |
| Series 2017A |
| 07/01/2052 | 6.125% | | 2,500,000 | 2,659,900 |
| Total | 2,690,032 |
| New Jersey 2.8% |
| City of Atlantic City |
| Unlimited General Obligation Refunding Bonds |
| Tax Appeal |
| Series 2013 |
| 12/01/2021 | 5.000% | | 2,500,000 | 2,438,350 |
| 12/01/2024 | 5.000% | | 2,095,000 | 2,029,573 |
| 12/01/2025 | 5.000% | | 450,000 | 436,604 |
| 12/01/2028 | 5.000% | | 270,000 | 258,306 |
| Middlesex County Improvement Authority(e) |
| Revenue Bonds |
| Heldrich Center Hotel |
| Series 2005C |
| 01/01/2037 | 0.000% | | 1,250,000 | 13 |
| Subordinated Revenue Bonds |
| Heldrich Center Hotel |
| Series 2005B |
| 01/01/2025 | 0.000% | | 2,750,000 | 28,875 |
| 01/01/2037 | 0.000% | | 6,450,000 | 67,725 |
| New Jersey Building Authority |
| Prerefunded 06/15/26 Revenue Bonds |
| Series 2016A |
| 06/15/2030 | 4.000% | | 400,000 | 444,948 |
| Municipal Bonds (continued) |
| Issue Description | Coupon
Rate | | Principal
Amount ($) | Value ($) |
| New Jersey Economic Development Authority |
| Revenue Bonds |
| Provident Group-Kean Properties |
| Series 2017 |
| 07/01/2047 | 5.000% | | 500,000 | 535,605 |
| Provident Group-Rowan Properties LLC |
| Series 2015 |
| 01/01/2048 | 5.000% | | 960,000 | 1,017,274 |
| School Facilities Construction |
| Series 2014UU |
| 06/15/2040 | 5.000% | | 1,500,000 | 1,580,475 |
| Series 2015WW |
| 06/15/2040 | 5.250% | | 375,000 | 404,666 |
| New Jersey Economic Development Authority(d) |
| Revenue Bonds |
| UMM Energy Partners LLC |
| Series 2012A AMT |
| 06/15/2043 | 5.125% | | 2,000,000 | 2,078,440 |
| New Jersey Higher Education Student Assistance Authority(d) |
| Subordinated Revenue Bonds |
| Series 2013-1B AMT |
| 12/01/2043 | 4.750% | | 5,000,000 | 5,244,950 |
| New Jersey Transportation Trust Fund Authority |
| Revenue Bonds |
| Transportation Program |
| Series 2015AA |
| 06/15/2045 | 5.000% | | 1,750,000 | 1,845,340 |
| South Jersey Port Corp.(d) |
| Revenue Bonds |
| Marine Terminal |
| Subordinated Series 2017B AMT |
| 01/01/2048 | 5.000% | | 600,000 | 651,798 |
| Tobacco Settlement Financing Corp. |
| Refunding Revenue Bonds |
| Series 2018A |
| 06/01/2046 | 5.000% | | 835,000 | 915,477 |
| Subordinated Series 2018B |
| 06/01/2046 | 5.000% | | 1,025,000 | 1,099,999 |
| Total | 21,078,418 |
| New York 4.2% |
| Build NYC Resource Corp. |
| Revenue Bonds |
| International Leadership Charter School |
| Series 2013 |
| 07/01/2043 | 6.000% | | 4,330,000 | 4,112,417 |
| Build NYC Resource Corp.(c) |
| Revenue Bonds |
| International Leadership Charter School |
| Series 2016 |
| 07/01/2046 | 6.250% | | 765,000 | 737,552 |
The accompanying Notes to Financial Statements are an integral part of this statement.
Columbia High Yield Municipal Fund | Annual Report 2018
| 15 |
Portfolio of Investments (continued)
May 31, 2018
| Municipal Bonds (continued) |
| Issue Description | Coupon
Rate | | Principal
Amount ($) | Value ($) |
| Taxable International Leadership |
| Series 2016 |
| 07/01/2021 | 5.000% | | 195,000 | 191,960 |
| City of New York |
| Unlimited General Obligation Refunding Bonds |
| Series 2015C |
| 08/01/2027 | 5.000% | | 4,000,000 | 4,612,400 |
| Glen Cove Local Economic Assistance Corp.(h) |
| Revenue Bonds |
| Garvies Point |
| Series 2016 CABS |
| 01/01/2055 | 0.000% | | 2,500,000 | 2,095,325 |
| Jefferson County Industrial Development Agency(c),(d) |
| Revenue Bonds |
| Green Bonds |
| Series 2014 AMT |
| 01/01/2024 | 5.250% | | 1,620,000 | 1,541,705 |
| Nassau County Tobacco Settlement Corp.(f) |
| Asset-Backed Revenue Bonds |
| Capital Appreciation |
| Third Series 2006D |
| 06/01/2060 | 0.000% | | 25,000,000 | 716,750 |
| New York City Water & Sewer System |
| Refunding Revenue Bonds |
| 2nd General Resolution |
| Series 2015FF |
| 06/15/2027 | 5.000% | | 2,645,000 | 3,089,307 |
| New York Transportation Development Corp.(d) |
| Refunding Revenue Bonds |
| American Airlines, Inc. |
| Series 2016 AMT |
| 08/01/2026 | 5.000% | | 4,000,000 | 4,229,280 |
| Revenue Bonds |
| Delta Air Lines, Inc. - LaGuardia Airport |
| Series 2018 AMT |
| 01/01/2036 | 4.000% | | 1,000,000 | 1,010,290 |
| LaGuardia Airport Terminal B Redevelopment Project |
| Series 2016 AMT |
| 07/01/2046 | 4.000% | | 5,000,000 | 5,021,300 |
| Port Authority of New York & New Jersey(d) |
| Revenue Bonds |
| 5th Installment-Special Project |
| Series 1996-4 AMT |
| 10/01/2019 | 6.750% | | 120,000 | 125,134 |
| Town of Oyster Bay |
| Limited General Obligation Bonds |
| BAN Series 2016C |
| 06/01/2018 | 4.000% | | 4,685,000 | 4,685,239 |
| Total | 32,168,659 |
| Municipal Bonds (continued) |
| Issue Description | Coupon
Rate | | Principal
Amount ($) | Value ($) |
| North Carolina 0.9% |
| Durham Housing Authority(d) |
| Revenue Bonds |
| Magnolia Pointe Apartments |
| Series 2005 AMT |
| 02/01/2038 | 5.650% | | 3,004,372 | 3,109,344 |
| North Carolina Medical Care Commission |
| Refunding Revenue Bonds |
| United Methodist Retirement Community |
| Series 2017 |
| 10/01/2047 | 5.000% | | 2,250,000 | 2,451,353 |
| United Methodist Retirement Homes |
| Series 2016 |
| 10/01/2035 | 5.000% | | 1,000,000 | 1,102,160 |
| Total | 6,662,857 |
| North Dakota 0.4% |
| City of Fargo |
| Revenue Bonds |
| Sanford Obligation Group |
| Series 2011 |
| 11/01/2031 | 6.250% | | 2,500,000 | 2,846,550 |
| Ohio 2.1% |
| Buckeye Tobacco Settlement Financing Authority |
| Asset-Backed Senior Turbo Revenue Bonds |
| Series 2007A-2 |
| 06/01/2047 | 5.875% | | 6,000,000 | 5,999,820 |
| County of Scioto |
| Refunding Revenue Bonds |
| Southern Ohio Medical Center |
| Series 2016 |
| 02/15/2034 | 5.000% | | 1,445,000 | 1,603,459 |
| Lake County Port & Economic Development Authority(c) |
| Revenue Bonds |
| 1st Mortgage - Tapestry Wickliffe LLC |
| Series 2017 |
| 12/01/2052 | 6.750% | | 3,000,000 | 3,233,010 |
| Ohio Air Quality Development Authority(c),(d) |
| Revenue Bonds |
| Pratt Paper LLC Project |
| Series 2017 AMT |
| 01/15/2048 | 4.500% | | 500,000 | 518,960 |
| State of Ohio(d) |
| Revenue Bonds |
| Portsmouth Bypass Project |
| Series 2015 AMT |
| 12/31/2039 | 5.000% | | 4,100,000 | 4,530,910 |
| Total | 15,886,159 |
The accompanying Notes to Financial Statements are an integral part of this statement.
| 16 | Columbia High Yield Municipal Fund | Annual Report 2018 |
Portfolio of Investments (continued)
May 31, 2018
| Municipal Bonds (continued) |
| Issue Description | Coupon
Rate | | Principal
Amount ($) | Value ($) |
| Oregon 1.3% |
| Clackamas County Hospital Facility Authority |
| Revenue Bonds |
| Mary’s Woods at Marylhurst, Inc. |
| Series 2018 |
| 05/15/2052 | 5.000% | | 1,000,000 | 1,069,910 |
| Hospital Facilities Authority of Multnomah County |
| Refunding Revenue Bonds |
| Mirabella at South Waterfront |
| Series 2014A |
| 10/01/2049 | 5.500% | | 3,115,000 | 3,343,049 |
| Oregon State Business Development Commission(c),(d) |
| Refunding Revenue Bonds |
| Red Rock Biofuels LLC |
| Series 2018 AMT |
| 04/01/2031 | 6.500% | | 2,000,000 | 2,062,920 |
| 04/01/2031 | 11.500% | | 1,000,000 | 1,094,530 |
| Warm Springs Reservation Confederated Tribe(i) |
| Revenue Bonds |
| Pelton Round Butte Tribal |
| Series 2009B |
| 11/01/2033 | 6.375% | | 2,410,000 | 2,515,823 |
| Total | 10,086,232 |
| Pennsylvania 6.9% |
| Allegheny County Higher Education Building Authority |
| Refunding Revenue Bonds |
| Duquesne University |
| Series 2016 |
| 03/01/2029 | 5.000% | | 1,030,000 | 1,179,752 |
| Commonwealth Financing Authority |
| Revenue Bonds |
| Tobacco Master Settlement Payment |
| Series 2018 (AGM) |
| 06/01/2039 | 4.000% | | 1,365,000 | 1,393,215 |
| Commonwealth of Pennsylvania |
| Refunding Certificate of Participation |
| Series 2018A |
| 07/01/2046 | 4.000% | | 2,500,000 | 2,525,875 |
| Dauphin County Industrial Development Authority(d) |
| Revenue Bonds |
| Dauphin Consolidated Water Supply |
| Series 1992A AMT |
| 06/01/2024 | 6.900% | | 3,200,000 | 3,909,216 |
| Pennsylvania Economic Development Financing Authority(c) |
| Refunding Revenue Bonds |
| Tapestry Moon Senior Housing Project |
| Series 2018 |
| 12/01/2053 | 6.750% | | 3,000,000 | 3,107,130 |
| Municipal Bonds (continued) |
| Issue Description | Coupon
Rate | | Principal
Amount ($) | Value ($) |
| Pennsylvania Economic Development Financing Authority(d) |
| Revenue Bonds |
| PA Bridges Finco LP |
| Series 2015 AMT |
| 12/31/2038 | 5.000% | | 1,650,000 | 1,810,529 |
| 06/30/2042 | 5.000% | | 3,700,000 | 4,043,730 |
| Pennsylvania Economic Development Financing Authority |
| Revenue Bonds |
| Philadelphia Biosolids Facility |
| Series 2009 |
| 01/01/2032 | 6.250% | | 3,375,000 | 3,546,686 |
| Pennsylvania Higher Educational Facilities Authority |
| Revenue Bonds |
| Shippensburg University |
| Series 2011 |
| 10/01/2043 | 6.250% | | 2,000,000 | 2,191,760 |
| Pennsylvania Housing Finance Agency(d) |
| Revenue Bonds |
| Series 2013-115A AMT |
| 10/01/2033 | 4.200% | | 4,460,000 | 4,604,013 |
| Pennsylvania Turnpike Commission |
| Revenue Bonds |
| Series 2014C |
| 12/01/2044 | 5.000% | | 3,000,000 | 3,312,420 |
| Subordinated Refunding Revenue Bonds |
| Series 2015A-1 |
| 12/01/2028 | 5.000% | | 3,300,000 | 3,737,514 |
| Philadelphia Authority for Industrial Development |
| Refunding Revenue Bonds |
| Wesley Enhanced Living |
| Series 2017 |
| 07/01/2049 | 5.000% | | 2,250,000 | 2,386,327 |
| Revenue Bonds |
| 1st Philadelphia Preparatory Charter School |
| Series 2014 |
| 06/15/2033 | 7.000% | | 1,870,000 | 2,111,323 |
| Philadelphia Gas Works Co. |
| Refunding Revenue Bonds |
| 1998 General Ordinance |
| 14th Series 2016 |
| 10/01/2037 | 4.000% | | 500,000 | 510,645 |
| Scranton School District |
| Limited General Obligation Refunding Bonds |
| Series 2017D (NPFGC) |
| 06/01/2037 | 4.250% | | 1,750,000 | 1,807,733 |
| Series 2017E (BAM) |
| 12/01/2037 | 4.000% | | 1,000,000 | 1,015,810 |
The accompanying Notes to Financial Statements are an integral part of this statement.
Columbia High Yield Municipal Fund | Annual Report 2018
| 17 |
Portfolio of Investments (continued)
May 31, 2018
| Municipal Bonds (continued) |
| Issue Description | Coupon
Rate | | Principal
Amount ($) | Value ($) |
| State Public School Building Authority |
| Refunding Revenue Bonds |
| Philadelphia School District |
| Series 2015 |
| 06/01/2025 | 5.000% | | 8,000,000 | 8,964,880 |
| Total | 52,158,558 |
| Puerto Rico 1.2% |
| Commonwealth of Puerto Rico(e),(i) |
| Unlimited General Obligation Bonds |
| Series 2014A |
| 07/01/2035 | 0.000% | | 1,000,000 | 418,750 |
| Unlimited General Obligation Refunding Bonds |
| Public Improvement |
| Series 2012A |
| 07/01/2041 | 0.000% | | 2,000,000 | 815,000 |
| Puerto Rico Electric Power Authority(e),(i) |
| Refunding Revenue Bonds |
| Series 2010ZZ |
| 07/01/2025 | 0.000% | | 2,000,000 | 790,000 |
| Revenue Bonds |
| Series 2013A |
| 07/01/2043 | 0.000% | | 1,000,000 | 390,000 |
| Puerto Rico Highways & Transportation Authority(e),(i) |
| Refunding Revenue Bonds |
| Series 2007N |
| 07/01/2021 | 0.000% | | 760,000 | 152,000 |
| Puerto Rico Industrial Tourist Educational, Medical & Environmental Control Facilities Financing Authority(d),(i) |
| Revenue Bonds |
| Cogen Facilities AES Puerto Rico Project |
| Series 2000 AMT |
| 06/01/2026 | 6.625% | | 5,820,000 | 5,208,900 |
| Puerto Rico Sales Tax Financing Corp.(e),(i) |
| Revenue Bonds |
| Senior Lien |
| Series 2011C |
| 08/01/2040 | 0.000% | | 1,885,000 | 1,333,638 |
| Total | 9,108,288 |
| Rhode Island 0.6% |
| Rhode Island Student Loan Authority(d) |
| Refunding Revenue Bonds |
| Series 2018A AMT |
| 12/01/2034 | 3.500% | | 2,250,000 | 2,276,640 |
| Revenue Bonds |
| Series 2016A AMT |
| 12/01/2027 | 3.125% | | 2,675,000 | 2,626,395 |
| Total | 4,903,035 |
| Municipal Bonds (continued) |
| Issue Description | Coupon
Rate | | Principal
Amount ($) | Value ($) |
| South Carolina 0.9% |
| South Carolina Jobs-Economic Development Authority |
| Revenue Bonds |
| Lutheran Homes of South Carolina, Inc. Obligation Group |
| Series 2013 |
| 05/01/2043 | 5.000% | | 750,000 | 770,978 |
| 05/01/2048 | 5.125% | | 1,500,000 | 1,546,815 |
| York Preparatory Academy Project |
| Series 2014A |
| 11/01/2045 | 7.250% | | 4,000,000 | 4,275,600 |
| Total | 6,593,393 |
| Texas 7.8% |
| Capital Area Cultural Education Facilities Finance Corp. |
| Revenue Bonds |
| Roman Catholic Diocese |
| Series 2005B |
| 04/01/2045 | 6.125% | | 5,000,000 | 5,319,350 |
| Central Texas Regional Mobility Authority |
| Prerefunded 01/01/21 Subordinated Revenue Bonds |
| Lien |
| Series 2011 |
| 01/01/2041 | 6.750% | | 5,000,000 | 5,571,700 |
| Central Texas Turnpike System |
| Refunding Revenue Bonds |
| Series 2015B |
| 08/15/2037 | 5.000% | | 3,000,000 | 3,310,110 |
| City of Houston Airport System(d) |
| Refunding Revenue Bonds |
| Special Facilities - United Airlines |
| Series 2011A AMT |
| 07/15/2038 | 6.625% | | 4,000,000 | 4,405,280 |
| Clifton Higher Education Finance Corp. |
| Revenue Bonds |
| International Leadership of Texas |
| Series 2015 |
| 08/15/2045 | 5.750% | | 5,500,000 | 5,685,900 |
| Deaf Smith County Hospital District |
| Limited General Obligation Refunding Bonds |
| Series 2017 |
| 03/01/2040 | 4.000% | | 1,825,000 | 1,822,281 |
| Prerefunded 03/01/20 Limited General Obligation Bonds |
| Series 2010A |
| 03/01/2040 | 6.500% | | 4,000,000 | 4,302,160 |
| Mission Economic Development Corp.(d) |
| Revenue Bonds |
| Dallas Clean Energy McCommas |
| Series 2011 AMT |
| 12/01/2024 | 6.875% | | 4,710,000 | 4,714,239 |
The accompanying Notes to Financial Statements are an integral part of this statement.
| 18 | Columbia High Yield Municipal Fund | Annual Report 2018 |
Portfolio of Investments (continued)
May 31, 2018
| Municipal Bonds (continued) |
| Issue Description | Coupon
Rate | | Principal
Amount ($) | Value ($) |
| New Hope Cultural Education Facilities Finance Corp. |
| Revenue Bonds |
| Cardinal Bay, Inc. - Village on the Park |
| Series 2016 |
| 07/01/2046 | 5.000% | | 2,300,000 | 2,455,687 |
| Collegiate Housing Island Campus |
| Series 2017 |
| 04/01/2037 | 5.000% | | 1,000,000 | 1,095,480 |
| NCCD-College Station Properties LLC |
| Series 2015 |
| 07/01/2035 | 5.000% | | 1,000,000 | 837,700 |
| Series 2015A |
| 07/01/2047 | 5.000% | | 1,000,000 | 829,890 |
| New Hope Cultural Education Facilities Finance Corp.(c) |
| Revenue Bonds |
| Jubilee Academic Center Project |
| Series 2017 |
| 08/15/2047 | 5.125% | | 2,085,000 | 2,088,190 |
| Pharr Higher Education Finance Authority |
| Prerefunded 08/15/19 Revenue Bonds |
| IDEA Public Schools |
| Series 2009 |
| 08/15/2039 | 6.500% | | 530,000 | 558,641 |
| Pottsboro Higher Education Finance Corp. |
| Revenue Bonds |
| Series 2016A |
| 08/15/2046 | 5.000% | | 1,000,000 | 1,003,260 |
| Red River Health Facilities Development Corp. |
| Revenue Bonds |
| MRC Crossings Project |
| Series 2014A |
| 11/15/2049 | 8.000% | | 2,000,000 | 2,325,940 |
| Sanger Industrial Development Corp.(c),(d),(e) |
| Revenue Bonds |
| Texas Pellets Project |
| Series 2012B AMT |
| 07/01/2038 | 0.000% | | 4,950,000 | 1,188,000 |
| Tarrant County Cultural Education Facilities Finance Corp. |
| Revenue Bonds |
| Buckner Senior Living Ventana Project |
| Series 2017 |
| 11/15/2052 | 6.750% | | 3,500,000 | 3,899,980 |
| CC Young Memorial Home |
| Series 2009A |
| 02/15/2038 | 8.000% | | 4,000,000 | 4,246,800 |
| Texas Private Activity Bond Surface Transportation Corp.(d) |
| Revenue Bonds |
| Senior Lien - Blueridge Transportation |
| Series 2016 AMT |
| 12/31/2055 | 5.000% | | 3,515,000 | 3,792,685 |
| Total | 59,453,273 |
| Municipal Bonds (continued) |
| Issue Description | Coupon
Rate | | Principal
Amount ($) | Value ($) |
| Utah 0.3% |
| Salt Lake City Corp. Airport(d) |
| Revenue Bonds |
| Series 2017A AMT |
| 07/01/2037 | 5.000% | | 2,000,000 | 2,266,400 |
| Virgin Islands, U.S. 0.4% |
| Virgin Islands Public Finance Authority(i) |
| Revenue Bonds |
| Matching Fund Loan Notes |
| Series 2012A |
| 10/01/2022 | 4.000% | | 900,000 | 868,500 |
| Virgin Islands Water & Power Authority - Electric System(i) |
| Refunding Revenue Bonds |
| Series 2012A |
| 07/01/2021 | 4.000% | | 2,170,000 | 1,871,625 |
| Total | 2,740,125 |
| Virginia 2.3% |
| Alexandria Industrial Development Authority |
| Refunding Revenue Bonds |
| Goodwin House, Inc. |
| Series 2015 |
| 10/01/2050 | 5.000% | | 2,275,000 | 2,495,243 |
| City of Chesapeake Expressway Toll Road(f) |
| Refunding Revenue Bonds |
| Transportation System |
| Series 2012 |
| 07/15/2040 | 0.000% | | 7,530,000 | 6,445,604 |
| Mosaic District Community Development Authority |
| Special Assessment Bonds |
| Series 2011A |
| 03/01/2036 | 6.875% | | 2,500,000 | 2,722,675 |
| Tobacco Settlement Financing Corp. |
| Revenue Bonds |
| Senior Series 2007-B1 |
| 06/01/2047 | 5.000% | | 5,000,000 | 4,999,900 |
| Virginia Small Business Financing Authority(d) |
| Revenue Bonds |
| Transform 66 P3 Project |
| Series 2017 AMT |
| 12/31/2056 | 5.000% | | 700,000 | 765,618 |
| Total | 17,429,040 |
| Washington 3.3% |
| Greater Wenatchee Regional Events Center Public Facilities District |
| Revenue Bonds |
| Series 2012A |
| 09/01/2042 | 5.500% | | 2,150,000 | 2,202,826 |
The accompanying Notes to Financial Statements are an integral part of this statement.
Columbia High Yield Municipal Fund | Annual Report 2018
| 19 |
Portfolio of Investments (continued)
May 31, 2018
| Municipal Bonds (continued) |
| Issue Description | Coupon
Rate | | Principal
Amount ($) | Value ($) |
| King County Housing Authority |
| Refunding Revenue Bonds |
| Series 2018 |
| 05/01/2038 | 3.750% | | 3,295,000 | 3,285,741 |
| King County Public Hospital District No. 4 |
| Revenue Bonds |
| Series 2015A |
| 12/01/2035 | 6.000% | | 1,250,000 | 1,259,725 |
| 12/01/2045 | 6.250% | | 2,500,000 | 2,535,750 |
| Port of Seattle Industrial Development Corp.(d) |
| Refunding Revenue Bonds |
| Special Facilities Delta Air Lines, Inc. |
| Series 2012 AMT |
| 04/01/2030 | 5.000% | | 2,500,000 | 2,730,000 |
| Tacoma Consolidated Local Improvement Districts |
| Special Assessment Bonds |
| No. 65 |
| Series 2013 |
| 04/01/2043 | 5.750% | | 1,710,000 | 1,715,917 |
| Washington State Housing Finance Commission(c) |
| Refunding Revenue Bonds |
| Bayview Manor Homes |
| Series 2016A |
| 07/01/2051 | 5.000% | | 2,150,000 | 2,210,307 |
| Nonprofit Housing-Mirabella |
| Series 2012 |
| 10/01/2047 | 6.750% | | 5,000,000 | 5,449,550 |
| Washington State Housing Finance Commission |
| Revenue Bonds |
| Heron’s Key |
| Series 2015A |
| 07/01/2050 | 7.000% | | 3,600,000 | 3,838,968 |
| Total | 25,228,784 |
| Wisconsin 1.2% |
| Public Finance Authority(d) |
| Refunding Revenue Bonds |
| Celanese Project |
| Series 2016C AMT |
| 11/01/2030 | 4.300% | | 2,000,000 | 2,080,180 |
| Waste Management, Inc. Project |
| Series 2016 AMT |
| 05/01/2027 | 2.875% | | 630,000 | 616,625 |
| Municipal Bonds (continued) |
| Issue Description | Coupon
Rate | | Principal
Amount ($) | Value ($) |
| Public Finance Authority(c) |
| Refunding Revenue Bonds |
| Mary’s Woods At Marylhurst |
| Series 2017 |
| 05/15/2052 | 5.250% | | 2,300,000 | 2,506,310 |
| Public Finance Authority |
| Revenue Bonds |
| FFAH North Carolina and Missouri Portfolio |
| Series 2015A |
| 12/01/2050 | 5.150% | | 3,220,000 | 3,404,281 |
| Wisconsin Health & Educational Facilities Authority |
| Revenue Bonds |
| St. John’s Communities, Inc. Project |
| Series 2018A |
| 09/15/2050 | 5.000% | | 750,000 | 777,742 |
| Total | 9,385,138 |
Total Municipal Bonds
(Cost $723,661,556) | 742,315,168 |
| Municipal Preferred Stocks 0.2% |
| Issue Description | Coupon
Rate | Principal
Amount ($) | Value ($) |
| Maryland 0.2% |
| Munimae TE Bond Subsidiary LLC(c),(d) |
| AMT |
| 06/30/2049 | 5.800% | 1,000,000 | 1,047,320 |
Total Municipal Preferred Stocks
(Cost $1,000,000) | 1,047,320 |
| Money Market Funds 0.0% |
| | Shares | Value ($) |
| Dreyfus Tax-Exempt Cash Management Fund, Institutional Shares, 1.050%(j) | 267,550 | 267,550 |
Total Money Market Funds
(Cost $267,535) | 267,550 |
Total Investments in Securities
(Cost $735,084,091) | 753,785,038 |
| Other Assets & Liabilities, Net | | 5,565,549 |
| Net Assets | $759,350,587 |
The accompanying Notes to Financial Statements are an integral part of this statement.
| 20 | Columbia High Yield Municipal Fund | Annual Report 2018 |
Portfolio of Investments (continued)
May 31, 2018
Notes to Portfolio of Investments
| (a) | The Fund is entitled to receive principal and interest from the guarantor after a day or a week’s notice or upon maturity. The maturity date disclosed represents the final maturity. |
| (b) | Represents a variable rate security where the coupon rate adjusts on specified dates (generally daily or weekly) using the prevailing money market rate. The interest rate shown was the current rate as of May 31, 2018. |
| (c) | Represents privately placed and other securities and instruments exempt from SEC registration (collectively, private placements), such as Section 4(a)(2) and Rule 144A eligible securities, which are often sold only to qualified institutional buyers. The Fund may invest in private placements determined to be liquid as well as those determined to be illiquid. Private placements may be determined to be liquid under guidelines established by the Fund’s Board of Trustees. At May 31, 2018, the value of these securities amounted to $78,422,112, which represents 10.33% of net assets. |
| (d) | Income from this security may be subject to alternative minimum tax. |
| (e) | Represents securities that have defaulted on payment of interest. The Fund has stopped accruing interest on these securities. At May 31, 2018, the value of these securities amounted to $10,317,832, which represents 1.36% of net assets. |
| (f) | Zero coupon bond. |
| (g) | Represents a security purchased on a when-issued basis. |
| (h) | Represents a variable rate security with a step coupon where the rate adjusts according to a schedule for a series of periods, typically lower for an initial period and then increasing to a higher coupon rate thereafter. The interest rate shown was the current rate as of May 31, 2018. |
| (i) | Municipal obligations include debt obligations issued by or on behalf of territories, possessions, or sovereign nations within the territorial boundaries of the United States. At May 31, 2018, the value of these securities amounted to $14,364,236, which represents 1.89% of net assets. |
| (j) | The rate shown is the seven-day current annualized yield at May 31, 2018. |
Abbreviation Legend
| AGM | Assured Guaranty Municipal Corporation |
| AMBAC | Ambac Assurance Corporation |
| AMT | Alternative Minimum Tax |
| BAM | Build America Mutual Assurance Co. |
| BAN | Bond Anticipation Note |
| FNMA | Federal National Mortgage Association |
| GNMA | Government National Mortgage Association |
| NPFGC | National Public Finance Guarantee Corporation |
| SGI | Syncora Guarantee, Inc. |
Fair value measurements
The Fund categorizes its fair value measurements according to a three-level hierarchy that maximizes the use of observable inputs and minimizes the use of unobservable inputs by prioritizing that the most observable input be used when available. Observable inputs are those that market participants would use in pricing an investment based on market data obtained from sources independent of the reporting entity. Unobservable inputs are those that reflect the Fund’s assumptions about the information market participants would use in pricing an investment. An investment’s level within the fair value hierarchy is based on the lowest level of any input that is deemed significant to the asset’s or liability’s fair value measurement. The input levels are not necessarily an indication of the risk or liquidity associated with investments at that level. For example, certain U.S. government securities are generally high quality and liquid, however, they are reflected as Level 2 because the inputs used to determine fair value may not always be quoted prices in an active market.
Fair value inputs are summarized in the three broad levels listed below:
| ■ | Level 1 — Valuations based on quoted prices for investments in active markets that the Fund has the ability to access at the measurement date. Valuation adjustments are not applied to Level 1 investments. |
| ■ | Level 2 — Valuations based on other significant observable inputs (including quoted prices for similar securities, interest rates, prepayment speeds, credit risks, etc.). |
| ■ | Level 3 — Valuations based on significant unobservable inputs (including the Fund’s own assumptions and judgment in determining the fair value of investments). |
Inputs that are used in determining fair value of an investment may include price information, credit data, volatility statistics, and other factors. These inputs can be either observable or unobservable. The availability of observable inputs can vary between investments, and is affected by various factors such as the type of investment, and the volume and level of activity for that investment or similar investments in the marketplace. The inputs will be considered by the Investment Manager, along with any other relevant factors in the calculation of an investment’s fair value. The Fund uses prices and inputs that are current as of the measurement date, which may include periods of market dislocations. During these periods, the availability of prices and inputs may be reduced for many investments. This condition could cause an investment to be reclassified between the various levels within the hierarchy.
Investments falling into the Level 3 category are primarily supported by quoted prices from brokers and dealers participating in the market for those investments. However, these may be classified as Level 3 investments due to lack of market transparency and corroboration to support these quoted prices. Additionally, valuation models may be used as the pricing source for any remaining investments classified as Level 3. These models may rely on one or more significant unobservable inputs and/or significant assumptions by the Investment Manager. Inputs used in valuations may include, but are not limited to, financial statement analysis, capital account balances, discount rates and estimated cash flows, and comparable company data.
Under the direction of the Fund’s Board of Trustees (the Board), the Investment Manager’s Valuation Committee (the Committee) is responsible for overseeing the valuation procedures approved by the Board. The Committee consists of voting and non-voting members from various groups within the Investment Manager’s organization, including operations and accounting, trading and investments, compliance, risk management and legal.
The accompanying Notes to Financial Statements are an integral part of this statement.
Columbia High Yield Municipal Fund | Annual Report 2018
| 21 |
Portfolio of Investments (continued)
May 31, 2018
Fair value measurements (continued)
The Committee meets at least monthly to review and approve valuation matters, which may include a description of specific valuation determinations, data regarding pricing information received from approved pricing vendors and brokers and the results of Board-approved valuation control policies and procedures (the Policies). The Policies address, among other things, instances when market quotations are or are not readily available, including recommendations of third party pricing vendors and a determination of appropriate pricing methodologies; events that require specific valuation determinations and assessment of fair value techniques; securities with a potential for stale pricing, including those that are illiquid, restricted, or in default; and the effectiveness of third party pricing vendors, including periodic reviews of vendors. The Committee meets more frequently, as needed, to discuss additional valuation matters, which may include the need to review back-testing results, review time-sensitive information or approve related valuation actions. The Committee reports to the Board, with members of the Committee meeting with the Board at each of its regularly scheduled meetings to discuss valuation matters and actions during the period, similar to those described earlier.
For investments categorized as Level 3, the Committee monitors information similar to that described above, which may include: (i) data specific to the issuer or comparable issuers, (ii) general market or specific sector news and (iii) quoted prices and specific or similar security transactions. The Committee considers this data and any changes from prior periods in order to assess the reasonableness of observable and unobservable inputs, any assumptions or internal models used to value those securities and changes in fair value. This data is also used to corroborate, when available, information received from approved pricing vendors and brokers. Various factors impact the frequency of monitoring this information (which may occur as often as daily). However, the Committee may determine that changes to inputs, assumptions and models are not required as a result of the monitoring procedures performed.
The following table is a summary of the inputs used to value the Fund’s investments at May 31, 2018:
| | Level 1
quoted prices in active
markets for identical
assets ($) | Level 2
other significant
observable inputs ($) | Level 3
significant
unobservable inputs ($) | Total ($) |
| Investments in Securities | | | | |
| Floating Rate Notes | — | 10,155,000 | — | 10,155,000 |
| Municipal Bonds | — | 742,315,168 | — | 742,315,168 |
| Municipal Preferred Stocks | — | 1,047,320 | — | 1,047,320 |
| Money Market Funds | 267,550 | — | — | 267,550 |
| Total Investments in Securities | 267,550 | 753,517,488 | — | 753,785,038 |
See the Portfolio of Investments for all investment classifications not indicated in the table.
The Fund’s assets assigned to the Level 2 input category are generally valued using the market approach, in which a security’s value is determined through reference to prices and information from market transactions for similar or identical assets.
There were no transfers of financial assets between levels during the period.
The accompanying Notes to Financial Statements are an integral part of this statement.
| 22 | Columbia High Yield Municipal Fund | Annual Report 2018 |
Statement of Assets and Liabilities
May 31, 2018
| Assets | |
| Investments in securities, at value | |
| Unaffiliated issuers (cost $735,084,091) | $753,785,038 |
| Cash | 4,643 |
| Receivable for: | |
| Investments sold | 552,225 |
| Capital shares sold | 2,290,964 |
| Interest | 12,202,558 |
| Expense reimbursement due from Investment Manager | 640 |
| Prepaid expenses | 525 |
| Trustees’ deferred compensation plan | 110,547 |
| Total assets | 768,947,140 |
| Liabilities | |
| Payable for: | |
| Investments purchased on a delayed delivery basis | 3,646,959 |
| Capital shares purchased | 2,545,545 |
| Distributions to shareholders | 3,165,669 |
| Management services fees | 11,205 |
| Distribution and/or service fees | 1,877 |
| Transfer agent fees | 64,683 |
| Compensation of board members | 1,536 |
| Compensation of chief compliance officer | 49 |
| Other expenses | 48,483 |
| Trustees’ deferred compensation plan | 110,547 |
| Total liabilities | 9,596,553 |
| Net assets applicable to outstanding capital stock | $759,350,587 |
| Represented by | |
| Paid in capital | 751,192,963 |
| Undistributed net investment income | 4,911,592 |
| Accumulated net realized loss | (15,454,915) |
| Unrealized appreciation (depreciation) on: | |
| Investments - unaffiliated issuers | 18,700,947 |
| Total - representing net assets applicable to outstanding capital stock | $759,350,587 |
The accompanying Notes to Financial Statements are an integral part of this statement.
Columbia High Yield Municipal Fund | Annual Report 2018
| 23 |
Statement of Assets and Liabilities (continued)
May 31, 2018
| Class A | |
| Net assets | $132,807,071 |
| Shares outstanding | 12,579,594 |
| Net asset value per share | $10.56 |
| Maximum sales charge | 3.00% |
| Maximum offering price per share (calculated by dividing the net asset value per share by 1.0 minus the maximum sales charge for Class A shares) | $10.89 |
| Advisor Class | |
| Net assets | $4,751,874 |
| Shares outstanding | 449,596 |
| Net asset value per share | $10.57 |
| Class C | |
| Net assets | $49,519,325 |
| Shares outstanding | 4,690,860 |
| Net asset value per share | $10.56 |
| Institutional Class | |
| Net assets | $562,971,733 |
| Shares outstanding | 53,317,526 |
| Net asset value per share | $10.56 |
| Institutional 2 Class | |
| Net assets | $7,767,388 |
| Shares outstanding | 736,038 |
| Net asset value per share | $10.55 |
| Institutional 3 Class | |
| Net assets | $1,533,196 |
| Shares outstanding | 144,863 |
| Net asset value per share | $10.58 |
The accompanying Notes to Financial Statements are an integral part of this statement.
| 24 | Columbia High Yield Municipal Fund | Annual Report 2018 |
Statement of Operations
Year Ended May 31, 2018
| Net investment income | |
| Income: | |
| Dividends — unaffiliated issuers | $7,250 |
| Interest | 37,844,359 |
| Total income | 37,851,609 |
| Expenses: | |
| Management services fees | 4,167,839 |
| Distribution and/or service fees | |
| Class A | 266,234 |
| Class B | 59 |
| Class C | 481,770 |
| Transfer agent fees | |
| Class A | 146,137 |
| Advisor Class | 3,920 |
| Class B | 8 |
| Class C | 55,710 |
| Institutional Class | 638,008 |
| Institutional 2 Class | 3,445 |
| Institutional 3 Class | 124 |
| Compensation of board members | 28,626 |
| Custodian fees | 7,058 |
| Printing and postage fees | 34,247 |
| Registration fees | 103,058 |
| Audit fees | 34,333 |
| Legal fees | 17,598 |
| Compensation of chief compliance officer | 305 |
| Other | 40,257 |
| Total expenses | 6,028,736 |
| Fees waived or expenses reimbursed by Investment Manager and its affiliates | (278,084) |
| Fees waived by distributor | |
| Class C | (50,713) |
| Expense reduction | (500) |
| Total net expenses | 5,699,439 |
| Net investment income | 32,152,170 |
| Realized and unrealized gain (loss) — net | |
| Net realized gain (loss) on: | |
| Investments — unaffiliated issuers | (6,838,081) |
| Net realized loss | (6,838,081) |
| Net change in unrealized appreciation (depreciation) on: | |
| Investments — unaffiliated issuers | 3,446,480 |
| Net change in unrealized appreciation (depreciation) | 3,446,480 |
| Net realized and unrealized loss | (3,391,601) |
| Net increase in net assets resulting from operations | $28,760,569 |
The accompanying Notes to Financial Statements are an integral part of this statement.
Columbia High Yield Municipal Fund | Annual Report 2018
| 25 |
Statement of Changes in Net Assets
| | Year Ended
May 31, 2018 | Year Ended
May 31, 2017 (a) |
| Operations | | |
| Net investment income | $32,152,170 | $37,662,277 |
| Net realized gain (loss) | (6,838,081) | 12,190,282 |
| Net change in unrealized appreciation (depreciation) | 3,446,480 | (36,848,714) |
| Net increase in net assets resulting from operations | 28,760,569 | 13,003,845 |
| Distributions to shareholders | | |
| Net investment income | | |
| Class A | (5,814,348) | (7,144,448) |
| Advisor Class | (163,776) | (132,031) |
| Class B | (188) | (9,935) |
| Class C | (1,880,925) | (2,101,735) |
| Institutional Class | (26,465,653) | (27,718,517) |
| Institutional 2 Class | (265,246) | (278,018) |
| Institutional 3 Class | (38,928) | (113) |
| Total distributions to shareholders | (34,629,064) | (37,384,797) |
| Decrease in net assets from capital stock activity | (30,779,418) | (115,592,097) |
| Total decrease in net assets | (36,647,913) | (139,973,049) |
| Net assets at beginning of year | 795,998,500 | 935,971,549 |
| Net assets at end of year | $759,350,587 | $795,998,500 |
| Undistributed net investment income | $4,911,592 | $6,816,423 |
| (a) | Institutional 3 Class shares are based on operations from March 1, 2017 (commencement of operations) through the stated period end. |
The accompanying Notes to Financial Statements are an integral part of this statement.
| 26 | Columbia High Yield Municipal Fund | Annual Report 2018 |
Statement of Changes in Net Assets (continued)
| | Year Ended | Year Ended |
| | May 31, 2018 | May 31, 2017 (a) |
| | Shares | Dollars ($) | Shares | Dollars ($) |
| Capital stock activity |
| Class A | | | | |
| Subscriptions | 3,437,330 | 36,404,520 | 7,141,734 | 77,197,323 |
| Distributions reinvested | 498,090 | 5,267,391 | 609,542 | 6,525,871 |
| Redemptions | (3,663,136) | (38,743,361) | (12,895,312) | (137,266,743) |
| Net increase (decrease) | 272,284 | 2,928,550 | (5,144,036) | (53,543,549) |
| Advisor Class | | | | |
| Subscriptions | 318,386 | 3,365,423 | 295,285 | 3,139,850 |
| Distributions reinvested | 15,357 | 162,550 | 12,261 | 131,508 |
| Redemptions | (236,518) | (2,507,657) | (377,210) | (4,084,029) |
| Net increase (decrease) | 97,225 | 1,020,316 | (69,664) | (812,671) |
| Class B | | | | |
| Subscriptions | — | — | 766 | 7,992 |
| Distributions reinvested | 8 | 83 | 387 | 4,129 |
| Redemptions | (4,109) | (43,876) | (32,050) | (335,495) |
| Net decrease | (4,101) | (43,793) | (30,897) | (323,374) |
| Class C | | | | |
| Subscriptions | 800,087 | 8,473,818 | 1,438,687 | 15,542,781 |
| Distributions reinvested | 165,309 | 1,748,215 | 176,746 | 1,889,047 |
| Redemptions | (1,142,156) | (12,102,307) | (2,265,388) | (23,902,758) |
| Net decrease | (176,760) | (1,880,274) | (649,955) | (6,470,930) |
| Institutional Class | | | | |
| Subscriptions | 8,935,977 | 94,656,299 | 12,434,645 | 131,835,129 |
| Distributions reinvested | 931,235 | 9,848,777 | 782,350 | 8,357,752 |
| Redemptions | (13,323,863) | (141,178,075) | (18,139,822) | (192,310,119) |
| Net decrease | (3,456,651) | (36,672,999) | (4,922,827) | (52,117,238) |
| Institutional 2 Class | | | | |
| Subscriptions | 409,740 | 4,328,687 | 272,005 | 2,873,560 |
| Distributions reinvested | 25,060 | 264,748 | 25,872 | 277,546 |
| Redemptions | (213,167) | (2,255,220) | (510,619) | (5,485,441) |
| Net increase (decrease) | 221,633 | 2,338,215 | (212,742) | (2,334,335) |
| Institutional 3 Class | | | | |
| Subscriptions | 158,527 | 1,685,515 | 954 | 10,000 |
| Distributions reinvested | 3,637 | 38,455 | — | — |
| Redemptions | (18,255) | (193,403) | — | — |
| Net increase | 143,909 | 1,530,567 | 954 | 10,000 |
| Total net decrease | (2,902,461) | (30,779,418) | (11,029,167) | (115,592,097) |
| (a) | Institutional 3 Class shares are based on operations from March 1, 2017 (commencement of operations) through the stated period end. |
The accompanying Notes to Financial Statements are an integral part of this statement.
Columbia High Yield Municipal Fund | Annual Report 2018
| 27 |
The following table is intended to help you understand the Fund’s financial performance. Certain information reflects financial results for a single share of a class held for the periods shown. Per share net investment income (loss) amounts are calculated based on average shares outstanding during the period. Total return assumes reinvestment of all dividends and distributions, if any. Total return does not reflect payment of sales charges, if any. Total return and portfolio turnover are not annualized for periods of less than one year. The portfolio turnover rate is calculated without regard to purchase and sales transactions of short-term instruments and certain derivatives, if any. If such transactions were included, the Fund’s portfolio turnover rate may be higher.
| | Net asset value,
beginning of
period | Net
investment
income | Net
realized
and
unrealized
gain (loss) | Total from
investment
operations | Distributions
from net
investment
income | Total
distributions to
shareholders |
| Class A |
| Year Ended 5/31/2018 | $10.64 | 0.43 | (0.05) | 0.38 | (0.46) | (0.46) |
| Year Ended 5/31/2017 | $10.90 | 0.45 | (0.26) | 0.19 | (0.45) | (0.45) |
| Year Ended 5/31/2016 | $10.71 | 0.47 | 0.19 | 0.66 | (0.47) | (0.47) |
| Year Ended 5/31/2015 | $10.56 | 0.47 | 0.15 | 0.62 | (0.47) | (0.47) |
| Year Ended 5/31/2014 | $10.72 | 0.49 | (0.16) | 0.33 | (0.49) | (0.49) |
| Advisor Class |
| Year Ended 5/31/2018 | $10.65 | 0.45 | (0.05) | 0.40 | (0.48) | (0.48) |
| Year Ended 5/31/2017 | $10.92 | 0.47 | (0.27) | 0.20 | (0.47) | (0.47) |
| Year Ended 5/31/2016 | $10.72 | 0.49 | 0.20 | 0.69 | (0.49) | (0.49) |
| Year Ended 5/31/2015 | $10.57 | 0.49 | 0.15 | 0.64 | (0.49) | (0.49) |
| Year Ended 5/31/2014 | $10.73 | 0.52 | (0.18) | 0.34 | (0.50) | (0.50) |
| Class C |
| Year Ended 5/31/2018 | $10.64 | 0.36 | (0.05) | 0.31 | (0.39) | (0.39) |
| Year Ended 5/31/2017 | $10.90 | 0.38 | (0.26) | 0.12 | (0.38) | (0.38) |
| Year Ended 5/31/2016 | $10.71 | 0.40 | 0.19 | 0.59 | (0.40) | (0.40) |
| Year Ended 5/31/2015 | $10.56 | 0.40 | 0.15 | 0.55 | (0.40) | (0.40) |
| Year Ended 5/31/2014 | $10.72 | 0.43 | (0.16) | 0.27 | (0.43) | (0.43) |
| Institutional Class |
| Year Ended 5/31/2018 | $10.64 | 0.45 | (0.05) | 0.40 | (0.48) | (0.48) |
| Year Ended 5/31/2017 | $10.90 | 0.47 | (0.26) | 0.21 | (0.47) | (0.47) |
| Year Ended 5/31/2016 | $10.71 | 0.49 | 0.19 | 0.68 | (0.49) | (0.49) |
| Year Ended 5/31/2015 | $10.56 | 0.49 | 0.15 | 0.64 | (0.49) | (0.49) |
| Year Ended 5/31/2014 | $10.72 | 0.51 | (0.16) | 0.35 | (0.51) | (0.51) |
| Institutional 2 Class |
| Year Ended 5/31/2018 | $10.63 | 0.45 | (0.04) | 0.41 | (0.49) | (0.49) |
| Year Ended 5/31/2017 | $10.90 | 0.48 | (0.27) | 0.21 | (0.48) | (0.48) |
| Year Ended 5/31/2016 | $10.70 | 0.50 | 0.20 | 0.70 | (0.50) | (0.50) |
| Year Ended 5/31/2015 | $10.55 | 0.50 | 0.15 | 0.65 | (0.50) | (0.50) |
| Year Ended 5/31/2014 | $10.71 | 0.52 | (0.17) | 0.35 | (0.51) | (0.51) |
The accompanying Notes to Financial Statements are an integral part of this statement.
| 28 | Columbia High Yield Municipal Fund | Annual Report 2018 |
Financial Highlights (continued)
| | Net
asset
value,
end of
period | Total
return | Total gross
expense
ratio to
average
net assets(a) | Total net
expense
ratio to
average
net assets(a),(b) | Net investment
income
ratio to
average
net assets | Portfolio
turnover | Net
assets,
end of
period
(000’s) |
| Class A |
| Year Ended 5/31/2018 | $10.56 | 3.68% | 0.88% | 0.85% (c) | 4.04% | 16% | $132,807 |
| Year Ended 5/31/2017 | $10.64 | 1.81% | 0.90% (d) | 0.84% (c),(d) | 4.21% | 21% | $130,917 |
| Year Ended 5/31/2016 | $10.90 | 6.27% | 0.95% | 0.86% (c) | 4.33% | 10% | $190,262 |
| Year Ended 5/31/2015 | $10.71 | 5.97% | 0.95% | 0.86% (c) | 4.44% | 7% | $150,483 |
| Year Ended 5/31/2014 | $10.56 | 3.35% | 0.95% | 0.86% (c) | 4.87% | 12% | $123,890 |
| Advisor Class |
| Year Ended 5/31/2018 | $10.57 | 3.89% | 0.68% | 0.65% (c) | 4.24% | 16% | $4,752 |
| Year Ended 5/31/2017 | $10.65 | 1.92% | 0.71% (d) | 0.64% (c),(d) | 4.41% | 21% | $3,753 |
| Year Ended 5/31/2016 | $10.92 | 6.58% | 0.75% | 0.66% (c) | 4.52% | 10% | $4,607 |
| Year Ended 5/31/2015 | $10.72 | 6.18% | 0.76% | 0.66% (c) | 4.65% | 7% | $4,218 |
| Year Ended 5/31/2014 | $10.57 | 3.53% | 0.76% | 0.65% (c) | 5.09% | 12% | $2,476 |
| Class C |
| Year Ended 5/31/2018 | $10.56 | 3.01% | 1.63% | 1.50% (c) | 3.39% | 16% | $49,519 |
| Year Ended 5/31/2017 | $10.64 | 1.15% | 1.65% (d) | 1.48% (c),(d) | 3.58% | 21% | $51,775 |
| Year Ended 5/31/2016 | $10.90 | 5.58% | 1.70% | 1.51% (c) | 3.67% | 10% | $60,144 |
| Year Ended 5/31/2015 | $10.71 | 5.31% | 1.70% | 1.49% (c) | 3.79% | 7% | $32,575 |
| Year Ended 5/31/2014 | $10.56 | 2.73% | 1.70% | 1.46% (c) | 4.26% | 12% | $19,946 |
| Institutional Class |
| Year Ended 5/31/2018 | $10.56 | 3.88% | 0.68% | 0.65% (c) | 4.24% | 16% | $562,972 |
| Year Ended 5/31/2017 | $10.64 | 2.01% | 0.70% (d) | 0.64% (c),(d) | 4.43% | 21% | $604,031 |
| Year Ended 5/31/2016 | $10.90 | 6.48% | 0.75% | 0.66% (c) | 4.55% | 10% | $672,655 |
| Year Ended 5/31/2015 | $10.71 | 6.19% | 0.75% | 0.66% (c) | 4.64% | 7% | $665,442 |
| Year Ended 5/31/2014 | $10.56 | 3.56% | 0.75% | 0.67% (c) | 5.07% | 12% | $605,931 |
| Institutional 2 Class |
| Year Ended 5/31/2018 | $10.55 | 3.92% | 0.63% | 0.59% | 4.30% | 16% | $7,767 |
| Year Ended 5/31/2017 | $10.63 | 2.00% | 0.61% (d) | 0.56% (d) | 4.48% | 21% | $5,469 |
| Year Ended 5/31/2016 | $10.90 | 6.67% | 0.62% | 0.57% | 4.62% | 10% | $7,922 |
| Year Ended 5/31/2015 | $10.70 | 6.27% | 0.61% | 0.58% | 4.67% | 7% | $3,893 |
| Year Ended 5/31/2014 | $10.55 | 3.64% | 0.63% | 0.57% | 5.21% | 12% | $7,807 |
The accompanying Notes to Financial Statements are an integral part of this statement.
Columbia High Yield Municipal Fund | Annual Report 2018
| 29 |
Financial Highlights (continued)
| | Net asset value,
beginning of
period | Net
investment
income | Net
realized
and
unrealized
gain (loss) | Total from
investment
operations | Distributions
from net
investment
income | Total
distributions to
shareholders |
| Institutional 3 Class |
| Year Ended 5/31/2018 | $10.66 | 0.46 | (0.04) | 0.42 | (0.50) | (0.50) |
| Year Ended 5/31/2017(e) | $10.48 | 0.12 | 0.18 (f) | 0.30 | (0.12) | (0.12) |
| Notes to Financial Highlights |
| (a) | In addition to the fees and expenses that the Fund bears directly, the Fund indirectly bears a pro rata share of the fees and expenses of any other funds in which it invests. Such indirect expenses are not included in the Fund’s reported expense ratios. |
| (b) | Total net expenses include the impact of certain fee waivers/expense reimbursements made by the Investment Manager and certain of its affiliates, if applicable. |
| (c) | The benefits derived from expense reductions had an impact of less than 0.01%. |
| (d) | Expenses have been reduced due to a reimbursement of expenses overbilled by a third party. If the reimbursement had been excluded, the expense ratios would have been higher by the percentages shown for each class in the table below. All fee waivers and expense reimbursements by the Investment Manager and its affiliates were applied before giving effect to this third party reimbursement. |
| Year Ended | Class A | Advisor
Class | Class C | Institutional
Class | Institutional 2
Class |
| 05/31/2017 | 0.02 % | 0.02 % | 0.03 % | 0.02 % | 0.02 % |
| (e) | Institutional 3 Class shares commenced operations on March 1, 2017. Per share data and total return reflect activity from that date. |
| (f) | Calculation of the net gain (loss) per share (both realized and unrealized) does not correlate to the aggregate realized and unrealized gain (loss) presented in the Statement of Operations due to the timing of subscriptions and redemptions of Fund shares in relation to fluctuations in the market value of the portfolio. |
| (g) | Annualized. |
The accompanying Notes to Financial Statements are an integral part of this statement.
| 30 | Columbia High Yield Municipal Fund | Annual Report 2018 |
Financial Highlights (continued)
| | Net
asset
value,
end of
period | Total
return | Total gross
expense
ratio to
average
net assets(a) | Total net
expense
ratio to
average
net assets(a),(b) | Net investment
income
ratio to
average
net assets | Portfolio
turnover | Net
assets,
end of
period
(000’s) |
| Institutional 3 Class |
| Year Ended 5/31/2018 | $10.58 | 3.99% | 0.59% | 0.55% | 4.41% | 16% | $1,533 |
| Year Ended 5/31/2017(e) | $10.66 | 2.86% | 0.61% (g) | 0.53% (g) | 4.62% (g) | 21% | $10 |
The accompanying Notes to Financial Statements are an integral part of this statement.
Columbia High Yield Municipal Fund | Annual Report 2018
| 31 |
Notes to Financial Statements
May 31, 2018
Note 1. Organization
Columbia High Yield Municipal Fund (the Fund), a series of Columbia Funds Series Trust I (the Trust), is a diversified fund. The Trust is registered under the Investment Company Act of 1940, as amended (the 1940 Act), as an open-end management investment company organized as a Massachusetts business trust.
Fund shares
The Trust may issue an unlimited number of shares (without par value). Although all share classes generally have identical voting, dividend and liquidation rights, each share class votes separately when required by the Trust’s organizational documents or by law. Different share classes pay different distribution amounts to the extent the expenses of such share classes differ, and distributions in liquidation will be proportional to the net asset value of each share class. Each share class has its own expense and sales charge structure. The Fund offers each of the share classes identified below.
Class A shares are subject to a maximum front-end sales charge of 3.00% based on the initial investment amount. Class A shares purchased without an initial sales charge are subject to a contingent deferred sales charge (CDSC) of 0.75% on certain investments of $500,000 or more if redeemed within 12 months after purchase.
Advisor Class shares are not subject to sales charges and are generally available only to omnibus retirement plans and certain investors as described in the Fund’s prospectus. Prior to November 1, 2017, Advisor Class shares were known as Class R4 shares.
Class B shares of the Fund are no longer offered for sale. When available, Class B shares were subject to a maximum CDSC of 5.00% based upon the holding period after purchase. Effective July 17, 2017, Class B shares were automatically converted to Class A shares without a CDSC. On August 4, 2017, the capital owned by Columbia Management Investment Advisers, LLC in Class B shares was redeemed without a CDSC.
Class C shares are subject to a 1.00% CDSC on shares redeemed within 12 months after purchase.
Institutional Class shares are not subject to sales charges and are generally available only to eligible investors, which are subject to different investment minimums as described in the Fund’s prospectus. Prior to November 1, 2017, Institutional Class shares were known as Class Z shares.
Institutional 2 Class shares are not subject to sales charges and are generally available only to investors purchasing through authorized investment professionals and omnibus retirement plans as described in the Fund’s prospectus. Prior to November 1, 2017, Institutional 2 Class shares were known as Class R5 shares.
Institutional 3 Class shares are not subject to sales charges and are available to institutional and certain other investors as described in the Fund’s prospectus. Prior to November 1, 2017, Institutional 3 Class shares were known as Class Y shares.
Note 2. Summary of significant accounting policies
Basis of preparation
The Fund is an investment company that applies the accounting and reporting guidance in the Financial Accounting Standards Board (FASB) Accounting Standards Codification Topic 946, Financial Services - Investment Companies (ASC 946). The financial statements are prepared in accordance with U.S. generally accepted accounting principles (GAAP), which requires management to make certain estimates and assumptions that affect the reported amounts of assets and liabilities, the disclosure of contingent assets and liabilities at the date of the financial statements and the reported amounts of income and expenses during the reporting period. Actual results could differ from those estimates.
The following is a summary of significant accounting policies followed by the Fund in the preparation of its financial statements.
| 32 | Columbia High Yield Municipal Fund | Annual Report 2018 |
Notes to Financial Statements (continued)
May 31, 2018
Security valuation
All equity securities are valued at the close of business of the New York Stock Exchange. Equity securities are valued at the last quoted sales price on the principal exchange or market on which they trade, except for securities traded on the NASDAQ Stock Market, which are valued at the NASDAQ official close price. Unlisted securities or listed securities for which there were no sales during the day are valued at the mean of the latest quoted bid and ask prices on such exchanges or markets.
Debt securities generally are valued by pricing services approved by the Board of Trustees based upon market transactions for normal, institutional-size trading units of similar securities. The services may use various pricing techniques that take into account, as applicable, factors such as yield, quality, coupon rate, maturity, type of issue, trading characteristics and other data, as well as approved independent broker-dealer quotes. Debt securities for which quotations are not readily available or not believed to be reflective of market value may also be valued based upon a bid quote from an approved independent broker-dealer. Debt securities maturing in 60 days or less are valued primarily at amortized cost value, unless this method results in a valuation that management believes does not approximate market value.
Investments for which market quotations are not readily available, or that have quotations which management believes are not reflective of market value or reliable, are valued at fair value as determined in good faith under procedures approved by and under the general supervision of the Board of Trustees. If a security or class of securities (such as foreign securities) is valued at fair value, such value is likely to be different from the quoted or published price for the security.
The determination of fair value often requires significant judgment. To determine fair value, management may use assumptions including but not limited to future cash flows and estimated risk premiums. Multiple inputs from various sources may be used to determine fair value.
GAAP requires disclosure regarding the inputs and valuation techniques used to measure fair value and any changes in valuation inputs or techniques. In addition, investments shall be disclosed by major category. This information is disclosed following the Fund’s Portfolio of Investments.
Delayed delivery securities
The Fund may trade securities on other than normal settlement terms, including securities purchased or sold on a “when-issued” or "forward commitment" basis. This may increase risk to the Fund since the other party to the transaction may fail to deliver, which could cause the Fund to subsequently invest at less advantageous prices. The Fund designates cash or liquid securities in an amount equal to the delayed delivery commitment.
Security transactions
Security transactions are accounted for on the trade date. Cost is determined and gains (losses) are based upon the specific identification method for both financial statement and federal income tax purposes.
Income recognition
Interest income is recorded on an accrual basis. Market premiums and discounts, including original issue discounts, are amortized and accreted, respectively, over the expected life of the security on all debt securities, unless otherwise noted.
The Fund may place a debt security on non-accrual status and reduce related interest income when it becomes probable that the interest will not be collected and the amount of uncollectible interest can be reasonably estimated. A defaulted debt security is removed from non-accrual status when the issuer resumes interest payments or when collectibility of interest is reasonably assured.
Dividend income is recorded on the ex-dividend date.
Expenses
General expenses of the Trust are allocated to the Fund and other funds of the Trust based upon relative net assets or other expense allocation methodologies determined by the nature of the expense. Expenses directly attributable to the Fund are charged to the Fund. Expenses directly attributable to a specific class of shares are charged to that share class.
Columbia High Yield Municipal Fund | Annual Report 2018
| 33 |
Notes to Financial Statements (continued)
May 31, 2018
Determination of class net asset value
All income, expenses (other than class-specific expenses, which are charged to that share class, as shown in the Statement of Operations) and realized and unrealized gains (losses) are allocated to each class of the Fund on a daily basis, based on the relative net assets of each class, for purposes of determining the net asset value of each class.
Federal income tax status
The Fund intends to qualify each year as a regulated investment company under Subchapter M of the Internal Revenue Code, as amended, and will distribute substantially all of its net tax-exempt and investment company taxable income and net capital gain, if any, for its tax year, and as such will not be subject to federal income taxes. In addition, the Fund intends to distribute in each calendar year substantially all of its ordinary income, capital gain net income and certain other amounts, if any, such that the Fund should not be subject to federal excise tax. Therefore, no federal income or excise tax provision is recorded.
Distributions to shareholders
Distributions from net investment income, if any, are declared daily and paid monthly. Net realized capital gains, if any, are distributed at least annually. Income distributions and capital gain distributions are determined in accordance with federal income tax regulations, which may differ from GAAP.
Guarantees and indemnifications
Under the Trust’s organizational documents and, in some cases, by contract, its officers and trustees are indemnified against certain liabilities arising out of the performance of their duties to the Trust or its funds. In addition, certain of the Fund’s contracts with its service providers contain general indemnification clauses. The Fund’s maximum exposure under these arrangements is unknown since the amount of any future claims that may be made against the Fund cannot be determined, and the Fund has no historical basis for predicting the likelihood of any such claims.
Recent accounting pronouncement
Accounting Standards Update 2017-08 Premium Amortization on Purchased Callable Debt Securities
In March 2017, the Financial Accounting Standards Board issued Accounting Standards Update (ASU) No. 2017-08 Premium Amortization on Purchased Callable Debt Securities. ASU No. 2017-08 updates the accounting standards to shorten the amortization period for certain purchased callable debt securities, held at a premium, to be amortized to the earliest call date. The update applies to securities with explicit, noncontingent call features that are callable at fixed prices and on preset dates. The standard is effective for annual periods beginning after December 15, 2018 and interim periods within those fiscal years. At this time, management is evaluating the implication of this guidance and the impact it will have on the financial statement amounts and footnote disclosures, if any.
Note 3. Fees and other transactions with affiliates
Management services fees
The Fund has entered into a Management Agreement with Columbia Management Investment Advisers, LLC (the Investment Manager), a wholly-owned subsidiary of Ameriprise Financial, Inc. (Ameriprise Financial). Under the Management Agreement, the Investment Manager provides the Fund with investment research and advice, as well as administrative and accounting services. The management services fee is an annual fee that is equal to a percentage of the Fund’s daily net assets that declines from 0.54% to 0.34% as the Fund’s net assets increase. The effective management services fee rate for the year ended May 31, 2018 was 0.54% of the Fund’s average daily net assets.
Compensation of board members
Members of the Board of Trustees who are not officers or employees of the Investment Manager or Ameriprise Financial are compensated for their services to the Fund as disclosed in the Statement of Operations. These members of the Board of Trustees may participate in a Deferred Compensation Plan (the Plan) which may be terminated at any time. Obligations of the Plan will be paid solely out of the Fund’s assets, and all amounts payable under the Plan constitute a general unsecured obligation of the Fund.
| 34 | Columbia High Yield Municipal Fund | Annual Report 2018 |
Notes to Financial Statements (continued)
May 31, 2018
Compensation of Chief Compliance Officer
The Board of Trustees has appointed a Chief Compliance Officer to the Fund in accordance with federal securities regulations. As disclosed in the Statement of Operations, a portion of the Chief Compliance Officer’s total compensation is allocated to the Fund, along with other allocations to affiliated funds governed by the Board of Trustees, based on relative net assets.
Transfer agency fees
Under a Transfer and Dividend Disbursing Agent Agreement, Columbia Management Investment Services Corp. (the Transfer Agent), an affiliate of the Investment Manager and a wholly-owned subsidiary of Ameriprise Financial, is responsible for providing transfer agency services to the Fund. The Transfer Agent has contracted with DST Asset Manager Solutions, Inc. (DST) to serve as sub-transfer agent. The Transfer Agent pays the fees of DST for services as sub-transfer agent and DST is not entitled to reimbursement for such fees from the Fund (with the exception of out-of-pocket fees).
The Fund pays the Transfer Agent a monthly transfer agency fee based on the number or the average value of accounts, depending on the type of account. In addition, the Fund pays the Transfer Agent a fee for shareholder services based on the number of accounts or on a percentage of the average aggregate value of the Fund’s shares maintained in omnibus accounts up to the lesser of the amount charged by the financial intermediary or a cap established by the Board of Trustees from time to time.
The Transfer Agent also receives compensation from the Fund for various shareholder services and reimbursements for certain out-of-pocket fees. Effective August 1, 2017, total transfer agency fees for Institutional 2 Class and Institutional 3 Class shares are subject to an annual limitation of not more than 0.07% and 0.02%, respectively, of the average daily net assets attributable to each share class. Prior to August 1, 2017, these limitations were 0.075% for Institutional 2 Class shares and 0.025% for Institutional 3 Class shares.
For the year ended May 31, 2018, the Fund’s effective transfer agency fee rates as a percentage of average daily net assets of each class were as follows:
| | Effective rate (%) |
| Class A | 0.11 |
| Advisor Class | 0.11 |
| Class B | 0.02 (a) |
| Class C | 0.11 |
| Institutional Class | 0.11 |
| Institutional 2 Class | 0.06 |
| Institutional 3 Class | 0.02 |
An annual minimum account balance fee of $20 may apply to certain accounts with a value below the applicable share class’s initial minimum investment requirements to reduce the impact of small accounts on transfer agency fees. These minimum account balance fees are remitted to the Fund and recorded as part of expense reductions in the Statement of Operations. For the year ended May 31, 2018, these minimum account balance fees reduced total expenses of the Fund by $500.
Distribution and service fees
The Fund has entered into an agreement with Columbia Management Investment Distributors, Inc. (the Distributor), an affiliate of the Investment Manager and a wholly-owned subsidiary of Ameriprise Financial, for distribution and shareholder services. The Board of Trustees has approved, and the Fund has adopted, distribution and shareholder service plans (the Plans) applicable to certain share classes, which set the distribution and service fees for the Fund. These fees are calculated daily and are intended to compensate the Distributor and/or eligible selling and/or servicing agents for selling shares of the Fund and providing services to investors.
Columbia High Yield Municipal Fund | Annual Report 2018
| 35 |
Notes to Financial Statements (continued)
May 31, 2018
Under the Plans, the Fund pays a monthly service fee to the Distributor at the maximum annual rate of 0.20% of the average daily net assets attributable to Class A, Class B and Class C shares of the Fund. Also under the Plans, the Fund pays a monthly distribution fee to the Distributor at the maximum annual rates of 0.75% of the average daily net assets attributable to Class B and Class C shares of the Fund. As a result of all Class B shares of the Fund being redeemed or converted to Class A shares, August 4, 2017 was the last day the Fund paid a service fee or distribution fee for Class B shares.
The Distributor has voluntarily agreed to waive a portion of the distribution fee for Class C shares so that the distribution fee does not exceed 0.65% annually of the average daily net assets attributable to Class C shares. This arrangement may be modified or terminated by the Distributor at any time.
Sales charges (unaudited)
Sales charges, including front-end charges and CDSCs, received by the Distributor for distributing Fund shares for the year ended May 31, 2018, if any, are listed below:
| | Amount ($) |
| Class A | 142,353 |
| Class C | 3,141 |
Expenses waived/reimbursed by the Investment Manager and its affiliates
The Investment Manager and certain of its affiliates have contractually agreed to waive fees and/or reimburse expenses (excluding certain fees and expenses described below) for the period(s) disclosed below, unless sooner terminated at the sole discretion of the Board of Trustees, so that the Fund’s net operating expenses, after giving effect to fees waived/expenses reimbursed and any balance credits and/or overdraft charges from the Fund’s custodian, do not exceed the following annual rate(s) as a percentage of the class’ average daily net assets:
| | October 1, 2017
through
September 30, 2018 | Prior to
October 1, 2017 |
| Class A | 0.86% | 0.86% |
| Advisor Class | 0.66 | 0.66 |
| Class C | 1.61 | 1.61 |
| Institutional Class | 0.66 | 0.66 |
| Institutional 2 Class | 0.60 | 0.58 |
| Institutional 3 Class | 0.56 | 0.53 |
Under the agreement governing these fee waivers and/or expense reimbursement arrangements, the following fees and expenses are excluded from the waiver/reimbursement commitment, and therefore will be paid by the Fund, if applicable: taxes (including foreign transaction taxes), expenses associated with investments in affiliated and non-affiliated pooled investment vehicles (including mutual funds and exchange-traded funds), transaction costs and brokerage commissions, costs related to any securities lending program, dividend expenses associated with securities sold short, inverse floater program fees and expenses, transaction charges and interest on borrowed money, interest, infrequent and/or unusual expenses and any other expenses the exclusion of which is specifically approved by the Board of Trustees. This agreement may be modified or amended only with approval from the Investment Manager, certain of its affiliates and the Fund. Any fees waived and/or expenses reimbursed under the expense reimbursement arrangements described above are not recoverable by the Investment Manager or its affiliates in future periods. Class C distribution fees waived by the Distributor, as discussed above, are in addition to the waiver/reimbursement commitment under the agreement.
Note 4. Federal tax information
The timing and character of income and capital gain distributions are determined in accordance with income tax regulations, which may differ from GAAP because of temporary or permanent book to tax differences.
| 36 | Columbia High Yield Municipal Fund | Annual Report 2018 |
Notes to Financial Statements (continued)
May 31, 2018
At May 31, 2018, these differences were primarily due to differing treatment for deferral/reversal of wash sale losses, tax straddles, capital loss carryforwards, trustees’ deferred compensation, distributions, principal and/or interest from fixed income securities and investments in partnerships. To the extent these differences were permanent, reclassifications were made among the components of the Fund’s net assets in the Statement of Assets and Liabilities. Temporary differences do not require reclassifications.
In the Statement of Assets and Liabilities the following reclassifications were made:
Undistributed net
investment
income ($) | Accumulated
net realized
(loss) ($) | Paid in
capital ($) |
| 572,063 | 35,151,875 | (35,723,938) |
Net investment income (loss) and net realized gains (losses), as disclosed in the Statement of Operations, and net assets were not affected by this reclassification.
The tax character of distributions paid during the years indicated was as follows:
| Year Ended May 31, 2018 | Year Ended May 31, 2017 |
Ordinary
income ($) | Tax-exempt
income ($) | Long-term
capital gains ($) | Total ($) | Ordinary
income ($) | Tax-exempt
income ($) | Long-term
capital gains ($) | Total ($) |
| 246,457 | 34,382,607 | — | 34,629,064 | 656,347 | 36,728,450 | — | 37,384,797 |
Short-term capital gain distributions, if any, are considered ordinary income distributions for tax purposes. At May 31, 2018, the components of distributable earnings on a tax basis were as follows:
Undistributed
ordinary income ($) | Undistributed tax-
exempt income ($) | Undistributed
long-term
capital gains ($) | Capital loss
carryforwards ($) | Net unrealized
appreciation ($) |
| — | 15,538,563 | — | (15,429,539) | 11,324,815 |
At May 31, 2018, the cost of all investments for federal income tax purposes along with the aggregate gross unrealized appreciation and depreciation based on that cost was:
Federal
tax cost ($) | Gross unrealized
appreciation ($) | Gross unrealized
(depreciation) ($) | Net unrealized
appreciation ($) |
| 742,460,222 | 34,788,938 | (23,464,123) | 11,324,815 |
Tax cost of investments and unrealized appreciation/(depreciation) may also include timing differences that do not constitute adjustments to tax basis.
The following capital loss carryforwards, determined at May 31, 2018, may be available to reduce taxable income arising from future net realized gains on investments, if any, to the extent permitted by the Internal Revenue Code. Capital loss carryforwards with no expiration are required to be utilized prior to any capital losses which carry an expiration date. As a result of this ordering rule, capital loss carryforwards which carry an expiration date may be more likely to expire unused. In addition, for the year ended May 31, 2018, capital loss carryforwards utilized, expired unused and permanently lost, if any, were as follows:
| 2019 ($) | No expiration
short-term ($) | No expiration
long-term ($) | Total ($) | Utilized ($) | Expired ($) | Permanently
lost ($) |
| 4,244,605 | 1,661,297 | 9,523,637 | 15,429,539 | — | 35,721,468 | — |
Management of the Fund has concluded that there are no significant uncertain tax positions in the Fund that would require recognition in the financial statements. However, management’s conclusion may be subject to review and adjustment at a later date based on factors including, but not limited to, new tax laws, regulations, and administrative interpretations (including relevant court decisions). Generally, the Fund’s federal tax returns for the prior three fiscal years remain subject to examination by the Internal Revenue Service.
Columbia High Yield Municipal Fund | Annual Report 2018
| 37 |
Notes to Financial Statements (continued)
May 31, 2018
Note 5. Portfolio information
The cost of purchases and proceeds from sales of securities, excluding short-term investments and derivatives, if any, aggregated to $124,149,984 and $157,042,142, respectively, for the year ended May 31, 2018. The amount of purchase and sale activity impacts the portfolio turnover rate reported in the Financial Highlights.
Note 6. Interfund lending
Pursuant to an exemptive order granted by the Securities and Exchange Commission, the Fund participates in a program (the Interfund Program) allowing each participating Columbia Fund (each, a Participating Fund) to lend money directly to and, except for closed-end funds and money market funds, borrow money directly from other Participating Funds for temporary purposes. The amounts eligible for borrowing and lending under the Interfund Program are subject to certain restrictions.
Interfund loans are subject to the risk that the borrowing fund could be unable to repay the loan when due, and a delay in repayment to the lending fund could result in lost opportunities and/or additional lending costs. The exemptive order is subject to conditions intended to mitigate conflicts of interest arising from the Investment Manager’s relationship with each Participating Fund.
The Fund did not borrow or lend money under the Interfund Program during the year ended May 31, 2018.
Note 7. Line of credit
The Fund has access to a revolving credit facility with a syndicate of banks led by Citibank, N.A., HSBC Bank USA, N.A. and JPMorgan Chase Bank, N.A. whereby the Fund may borrow for the temporary funding of shareholder redemptions or for other temporary or emergency purposes. The credit facility, which is a collective agreement between the Fund and certain other funds managed by the Investment Manager, severally and not jointly, permits collective borrowings up to $1 billion. Interest is charged to each participating fund based on its borrowings at a rate equal to the higher of (i) the overnight federal funds rate plus 1.00% or (ii) the one-month LIBOR rate plus 1.00%. Each borrowing under the credit facility matures no later than 60 days after the date of borrowing. The Fund also pays a commitment fee equal to its pro rata share of the amount of the credit facility at a rate of 0.15% per annum. The commitment fee is included in other expenses in the Statement of Operations.
The Fund had no borrowings during the year ended May 31, 2018.
Note 8. Significant risks
Credit risk
Credit risk is the risk that the value of debt securities in the Fund’s portfolio may decline because the issuer may default and fail to pay interest or repay principal when due. Rating agencies assign credit ratings to debt securities to indicate their credit risk. Lower rated or unrated debt securities held by the Fund may present increased credit risk as compared to higher-rated debt securities.
High-yield investments risk
Securities and other debt instruments held by the Fund that are rated below investment grade (commonly called "high-yield" or "junk" bonds) and unrated debt instruments of comparable quality expose the Fund to a greater risk of loss of principal and income than a fund that invests solely or primarily in investment grade securities. In addition, these investments have greater price fluctuations, are less liquid and are more likely to experience a default than higher-rated debt instruments. High-yield debt instruments are considered to be predominantly speculative with respect to the issuer’s capacity to pay interest and repay principal.
Interest rate risk
Interest rate risk is the risk of losses attributable to changes in interest rates. In general, if prevailing interest rates rise, the values of debt securities tend to fall, and if interest rates fall, the values of debt securities tend to rise. Actions by governments and central banking authorities can result in increases in interest rates. Increasing interest rates may negatively
| 38 | Columbia High Yield Municipal Fund | Annual Report 2018 |
Notes to Financial Statements (continued)
May 31, 2018
affect the value of debt securities held by the Fund, resulting in a negative impact on the Fund’s performance and net asset value per share. In general, the longer the maturity or duration of a debt security, the greater its sensitivity to changes in interest rates.
Liquidity risk
Liquidity risk is the risk associated with a lack of marketability of investments which may make it difficult to sell the investment at a desirable time or price. Changing regulatory, market or other conditions or environments (for example, the interest rate or credit environments) may adversely affect the liquidity of the Fund’s investments. The Fund may have to accept a lower selling price for the holding, sell other investments, or forego another, more appealing investment opportunity. Generally, the less liquid the market at the time the Fund sells a portfolio investment, the greater the risk of loss or decline of value to the Fund. A less liquid market can lead to an increase in Fund redemptions, which may negatively impact Fund performance and net asset value per share, including, for example, if the Fund is forced to sell securities in a down market.
Municipal securities risk
Securities issued by a particular state and its instrumentalities are subject to the risk of unfavorable developments in such state. A municipal security can be significantly affected by adverse tax, legislative, regulatory, demographic or political changes as well as changes in a particular state’s (state and its instrumentalities’) financial, economic or other condition and prospects.
Shareholder concentration risk
At May 31, 2018, one unaffiliated shareholder of record owned 43.5% of the outstanding shares of the Fund in one or more accounts. The Fund has no knowledge about whether any portion of those shares was owned beneficially. Affiliated shareholders of record owned 13.2% of the outstanding shares of the Fund in one or more accounts. Subscription and redemption activity by concentrated accounts may have a significant effect on the operations of the Fund. In the case of a large redemption, the Fund may be forced to sell investments at inopportune times, including its liquid positions, which may result in Fund losses and the Fund holding a higher percentage of less liquid positions. Large redemptions could result in decreased economies of scale and increased operating expenses for non-redeeming Fund shareholders.
Note 9. Subsequent events
Management has evaluated the events and transactions that have occurred through the date the financial statements were issued and noted no items requiring adjustment of the financial statements or additional disclosure.
Note 10. Information regarding pending and settled legal proceedings
Ameriprise Financial and certain of its affiliates have historically been involved in a number of legal, arbitration and regulatory proceedings, including routine litigation, class actions, and governmental actions, concerning matters arising in connection with the conduct of their business activities. Ameriprise Financial believes that the Fund is not currently the subject of, and that neither Ameriprise Financial nor any of its affiliates are the subject of, any pending legal, arbitration or regulatory proceedings that are likely to have a material adverse effect on the Fund or the ability of Ameriprise Financial or its affiliates to perform under their contracts with the Fund. Ameriprise Financial is required to make quarterly (10-Q), annual (10-K) and, as necessary, 8-K filings with the Securities and Exchange Commission (SEC) on legal and regulatory matters that relate to Ameriprise Financial and its affiliates. Copies of these filings may be obtained by accessing the SEC website at www.sec.gov.
There can be no assurance that these matters, or the adverse publicity associated with them, will not result in increased Fund redemptions, reduced sale of Fund shares or other adverse consequences to the Fund. Further, although we believe proceedings are not likely to have a material adverse effect on the Fund or the ability of Ameriprise Financial or its affiliates to perform under their contracts with the Fund, these proceedings are subject to uncertainties and, as such, we are unable to estimate the possible loss or range of loss that may result. An adverse outcome in one or more of these proceedings could result in adverse judgments, settlements, fines, penalties or other relief that could have a material adverse effect on the consolidated financial condition or results of operations of Ameriprise Financial.
Columbia High Yield Municipal Fund | Annual Report 2018
| 39 |
Report of Independent Registered Public Accounting Firm
To the Board of Trustees of Columbia Funds Series Trust I and Shareholders of Columbia High Yield Municipal Fund
Opinion on the Financial Statements
We have audited the accompanying statement of assets and liabilities, including the portfolio of investments, of Columbia High Yield Municipal Fund (one of the funds constituting Columbia Funds Series Trust I, referred to hereafter as the "Fund") as of May 31, 2018, the related statement of operations for the year ended May 31, 2018, the statement of changes in net assets for each of the two years in the period ended May 31, 2018, including the related notes, and the financial highlights for each of the periods indicated therein (collectively referred to as the “financial statements”). In our opinion, the financial statements present fairly, in all material respects, the financial position of the Fund as of May 31, 2018, the results of its operations for the year then ended, the changes in its net assets for each of the two years in the period ended May 31, 2018 and the financial highlights for each of the periods indicated therein in conformity with accounting principles generally accepted in the United States of America.
Basis for Opinion
These financial statements are the responsibility of the Fund’s management. Our responsibility is to express an opinion on the Fund’s financial statements based on our audits. We are a public accounting firm registered with the Public Company Accounting Oversight Board (United States) (“PCAOB”) and are required to be independent with respect to the Fund in accordance with the U.S. federal securities laws and the applicable rules and regulations of the Securities and Exchange Commission and the PCAOB.
We conducted our audits of these financial statements in accordance with the standards of the PCAOB. Those standards require that we plan and perform the audits to obtain reasonable assurance about whether the financial statements are free of material misstatement, whether due to error or fraud.
Our audits included performing procedures to assess the risks of material misstatement of the financial statements, whether due to error or fraud, and performing procedures that respond to those risks. Such procedures included examining, on a test basis, evidence regarding the amounts and disclosures in the financial statements. Our audits also included evaluating the accounting principles used and significant estimates made by management, as well as evaluating the overall presentation of the financial statements. Our procedures included confirmation of securities owned as of May 31, 2018 by correspondence with the custodian and brokers; when replies were not received from brokers, we performed other auditing procedures. We believe that our audits provide a reasonable basis for our opinion.
/s/PricewaterhouseCoopers LLP
Minneapolis, Minnesota
July 23, 2018
We have served as the auditor of one or more investment companies within the Columbia Funds Complex since 1977.
| 40 | Columbia High Yield Municipal Fund | Annual Report 2018 |
Federal Income Tax Information
(Unaudited)
The Fund hereby designates the following tax attributes for the fiscal year ended May 31, 2018. Shareholders will be notified in early 2019 of the amounts for use in preparing 2018 income tax returns.
Exempt-
interest
dividends | |
| 99.29% | |
Exempt-interest dividends. The percentage of net investment income distributed during the fiscal year that qualifies as exempt-interest dividends for federal income tax purposes. A portion of the income may be subject to federal alternative minimum tax.
Columbia High Yield Municipal Fund | Annual Report 2018
| 41 |
Shareholders elect the Board that oversees the Fund’s operations. The Board appoints officers who are responsible for day-to-day business decisions based on policies set by the Board. The following table provides basic biographical information about the Fund’s Trustees, including their principal occupations during the past five years, although specific titles for individuals may have varied over the period. The year set forth beneath Length of Service in the table below is the year in which the Trustee was first appointed or elected as Trustee to any Fund currently in the Columbia Funds Complex or a predecessor thereof. Under current Board policy, members serve terms of indefinite duration.
Independent trustees
| Name, address, year of birth | Position held with the Trust and length of service | Principal occupation(s) during the past five years and other relevant professional experience | Number of Funds in the Columbia Fund Complex overseen | Other directorships held by Trustee during the past five years |
Janet Langford Carrig
c/o Columbia Management
Investment Advisers, LLC
225 Franklin Street
Mail Drop BX32 05228
Boston, MA 02110
1957 | Trustee
1996 | Senior Vice President, General Counsel and Corporate Secretary, ConocoPhillips (independent energy company) since September 2007 | 71 | None |
Douglas A. Hacker
c/o Columbia Management
Investment Advisers, LLC
225 Franklin Street
Mail Drop BX32 05228
Boston, MA 02110
1955 | Trustee and Chairman of the Board
1996 | Independent business executive since May 2006; Executive Vice President — Strategy of United Airlines from December 2002 to May 2006; President of UAL Loyalty Services (airline marketing company) from September 2001 to December 2002; Executive Vice President and Chief Financial Officer of United Airlines from July 1999 to September 2001 | 71 | Spartan Nash Company, (food distributor); Nash Finch Company (food distributor) from 2005 to 2013; Aircastle Limited (aircraft leasing); SeaCube Container Leasing Ltd. (container leasing) from 2010 to 2013; and Travelport Worldwide Limited (travel information technology) |
Nancy T. Lukitsh
c/o Columbia Management
Investment Advisers, LLC
225 Franklin Street
Mail Drop BX32 05228
Boston, MA 02110
1956 | Trustee
2011 | Senior Vice President, Partner and Director of Marketing, Wellington Management Company, LLP (investment adviser) from 1997 to 2010; Chair, Wellington Management Portfolios (commingled non-U.S. investment pools) from 2007 to 2010; Director, Wellington Trust Company, NA and other Wellington affiliates from 1997 to 2010 | 71 | None |
David M. Moffett
c/o Columbia Management
Investment Advisers, LLC
225 Franklin Street
Mail Drop BX32 05228
Boston, MA 02110
1952 | Trustee
2011 | Retired. Consultant to Bridgewater and Associates | 71 | Director, CSX Corporation; Genworth Financial, Inc. (financial and insurance products and services); PayPal Holdings Inc. (payment and data processing services); Trustee, University of Oklahoma Foundation; former Director, eBay Inc. (online trading community), 2007-2015; and former Director, CIT Bank, CIT Group Inc. (commercial and consumer finance), 2010-2016 |
John J. Neuhauser
c/o Columbia Management
Investment Advisers, LLC
225 Franklin Street
Mail Drop BX32 05228
Boston, MA 02110
1943 | Trustee
1984 | President, Saint Michael’s College since August 2007; Director or Trustee of several non-profit organizations, including University of Vermont Medical Center; Academic Vice President and Dean of Faculties, Boston College from August 1999 to October 2005; University Professor, Boston College from November 2005 to August 2007 | 71 | Liberty All-Star Equity Fund and Liberty All- Star Growth Fund (closed-end funds) |
| 42 | Columbia High Yield Municipal Fund | Annual Report 2018 |
TRUSTEES AND OFFICERS (continued)
Independent trustees (continued)
| Name, address, year of birth | Position held with the Trust and length of service | Principal occupation(s) during the past five years and other relevant professional experience | Number of Funds in the Columbia Fund Complex overseen | Other directorships held by Trustee during the past five years |
Patrick J. Simpson
c/o Columbia Management
Investment Advisers, LLC
225 Franklin Street
Mail Drop BX32 05228
Boston, MA 02110
1944 | Trustee
2000 | Of Counsel, Perkins Coie LLP (law firm) since 2015; Partner, Perkins Coie LLP from 1988 to 2014 | 71 | None |
Anne-Lee Verville
c/o Columbia Management
Investment Advisers, LLC
225 Franklin Street
Mail Drop BX32 05228
Boston, MA 02110
1945 | Trustee
1998 | Retired. General Manager, Global Education Industry from 1994 to 1997, President – Application Systems Division from 1991 to 1994, Chief Financial Officer – US Marketing & Services from 1988 to 1991, and Chief Information Officer from 1987 to 1988, IBM Corporation (computer and technology) | 71 | Enesco Group, Inc. (producer of giftware and home and garden decor products) from 2001 to 2006 |
Consultants to the Independent Trustees*
| Name, address, year of birth | Position held with the Trust and length of service | Principal occupation(s) during the past five years and other relevant professional experience | Number of Funds in the Columbia Funds complex overseen | Other directorships held by Trustee during the past five years |
J. Kevin Connaughton
c/o Columbia
Management Investment
Advisers, LLC,
225 Franklin Street
Mail Drop BX32 05228,
Boston, MA 02110
1964 | Independent Trustee Consultant
2016 | Independent Trustee Consultant, Columbia Funds since March 2016; Adjunct Professor of Finance, Bentley University since November 2017; Managing Director and General Manager of Mutual Fund Products, Columbia Management Investment Advisers, LLC from May 2010 to February 2015; President, Columbia Funds from 2009 to 2015; and senior officer of Columbia Funds and affiliated funds from 2003 to 2015 | 71 | Director, The Autism Project since March 2015; former Trustee, New Century Portfolios, March 2015-December 2017; formerly on Board of Governors, Gateway Healthcare, January 2016 – December 2017 |
Natalie A. Trunow
c/o Columbia
Management Investment
Advisers, LLC,
225 Franklin Street
Mail Drop BX32 05228,
Boston, MA 02110
1967 | Independent Trustee Consultant
2016 | Independent Trustee Consultant, Columbia Funds since September 2016; Chief Executive Officer, Millennial Portfolio Solutions LLC (asset management and consulting services) since January 2016; Director of Investments, Casey Family Programs from April 2016 to September 2016; Senior Vice President and Chief Investment Officer, Calvert Investments from August 2008 to January 2016; Section Head and Portfolio Manager, General Motors Asset Management from June 1997 to August 2008 | 71 | Director, Health Services for Children with Special Needs, Inc.; Director, Guidewell Financial Solutions |
| * | J. Kevin Connaughton was appointed consultant to the Independent Trustees effective March 1, 2016. Natalie A. Trunow was appointed consultant to the Independent Trustees effective September 1, 2016. Shareholders of the Funds are expected to be asked to elect each of Mr. Connaughton and Ms. Trunow as a Trustee at a future shareholder meeting. |
Columbia High Yield Municipal Fund | Annual Report 2018
| 43 |
TRUSTEES AND OFFICERS (continued)
Interested trustee affiliated with Investment Manager*
| Name, address, year of birth | Position held with the Trust and length of service | Principal occupation(s) during the past five years and other relevant professional experience | Number of Funds in the Columbia Funds Complex overseen | Other directorships held by Trustee during the past five years |
William F. Truscott
c/o Columbia Management
Investment Advisers, LLC
225 Franklin Street
Boston, MA 02110
1960 | Trustee
2012 | Chairman of the Board and President, Columbia Management Investment Advisers, LLC since May 2010 and February 2012, respectively; Chief Executive Officer, Global Asset Management, Ameriprise Financial, Inc. since September 2012 (previously Chief Executive Officer, U.S. Asset Management & President, Annuities, May 2010-September 2012); Director and Chief Executive Officer, Columbia Management Investment Distributors, Inc. since May 2010 and February 2012, respectively; Chairman of the Board and Chief Executive Officer, RiverSource Distributors, Inc. since 2006; Director, Threadneedle Asset Management Holdings, SARL since 2014; President and Chief Executive Officer, Ameriprise Certificate Company, 2006-August 2012 | 196 | Chairman of the Board, Columbia Management Investment Advisers, LLC since May 2010; Director, Columbia Management Investment Distributors, Inc. since May 2010; former Director, Ameriprise Certificate Company, 2006 - January 2013 |
| * | Interested person (as defined under the 1940 Act) by reason of being an officer, director, security holder and/or employee of the Investment Manager or Ameriprise Financial. |
The Statement of Additional Information has additional information about the Fund’s Board members and is available, without charge, upon request by calling 800.345.6611, visiting columbiathreadneedleus.com/investor/ or contacting your financial intermediary.
| 44 | Columbia High Yield Municipal Fund | Annual Report 2018 |
TRUSTEES AND OFFICERS (continued)
The Board has appointed officers who are responsible for day-to-day business decisions based on policies it has established. The officers serve at the pleasure of the Board. The following table provides basic information about the Officers of the Fund, including principal occupations during the past five years, although their specific titles may have varied over the period. In addition to Mr. Truscott, who is Senior Vice President, the Fund’s other officers are:
Fund officers
Name,
address and
year of birth | Position and year
first appointed to
position for any Fund
in the Columbia
Funds complex or a
predecessor thereof | Principal occupation(s) during past five years |
Christopher O. Petersen
5228 Ameriprise
Financial Center
Minneapolis, MN 55474
Born 1970 | President and Principal Executive Officer (2015) | Vice President and Lead Chief Counsel, Ameriprise Financial, Inc. since January 2015 (previously, Vice President and Chief Counsel, January 2010 - December 2014; officer of Columbia Funds and affiliated funds since 2007. |
Michael G. Clarke
225 Franklin Street
Boston, MA 02110
Born 1969 | Treasurer (2011), Chief Financial Officer (2009) and Chief Accounting Officer (2015) | Vice President — Mutual Fund Administration, Columbia Management Investment Advisers, LLC, since May 2010; senior officer of Columbia Funds and affiliated funds since 2002. |
Paul B. Goucher
100 Park Avenue
New York, NY 10017
Born 1968 | Senior Vice President (2011) and Assistant Secretary (2008) | Senior Vice President and Assistant General Counsel, Ameriprise Financial, Inc. since January 2017 (previously Vice President and Lead Chief Counsel, November 2008 - January 2017 and January 2013 - January 2017, respectively; and Chief Counsel, January 2010 - January 2013); Vice President, Chief Legal Officer and Assistant Secretary, Columbia Management Investment Advisers, LLC since May 2010. |
Thomas P. McGuire
225 Franklin Street
Boston, MA 02110
Born 1972 | Senior Vice President and Chief Compliance Officer (2012) | Vice President — Asset Management Compliance, Ameriprise Financial, Inc., since May 2010; Chief Compliance Officer, Ameriprise Certificate Company since September 2010. |
Colin Moore
225 Franklin Street
Boston, MA 02110
Born 1958 | Senior Vice President (2010) | Executive Vice President and Global Chief Investment Officer, Ameriprise Financial, Inc., since July 2013; Executive Vice President and Global Chief Investment Officer, Columbia Management Investment Advisers, LLC since July 2013 (previously Director and Global Chief Investment Officer, 2010 - 2013). |
Ryan C. Larrenaga
225 Franklin Street
Boston, MA 02110
Born 1970 | Senior Vice President (2017), Chief Legal Officer (2017) and Secretary (2015) | Vice President and Group Counsel, Ameriprise Financial, Inc. since August 2011; officer of Columbia Funds and affiliated funds since 2005. |
Michael E. DeFao
225 Franklin Street
Boston, MA 02110
Born 1968 | Vice President (2011) and Assistant Secretary (2010) | Vice President and Chief Counsel, Ameriprise Financial, Inc. since May 2010. |
Amy Johnson
5228 Ameriprise
Financial Center
Minneapolis, MN 55474
Born 1965 | Vice President (2006) | Managing Director and Global Head of Operations, Columbia Management Investment Advisers, LLC since April 2016 (previously Managing Director and Chief Operating Officer, 2010 - 2016). |
Lyn Kephart-Strong
5228 Ameriprise
Financial Center
Minneapolis, MN 55474
Born 1960 | Vice President (2015) | President, Columbia Management Investment Services Corp. since October 2014; Vice President & Resolution Officer, Ameriprise Trust Company since August 2009. |
Columbia High Yield Municipal Fund | Annual Report 2018
| 45 |
The Fund mails one shareholder report to each shareholder address. If you would like more than one report, please call shareholder services at 800.345.6611 and additional reports will be sent to you.
Proxy voting policies and procedures
The policy of the Board of Trustees is to vote the proxies of the companies in which the Fund holds investments consistent with the procedures as stated in the Statement of Additional Information (SAI). You may obtain a copy of the SAI without charge by calling 800.345.6611; contacting your financial intermediary; visiting columbiathreadneedleus.com/investor/; or searching the website of the Securities and Exchange Commission (SEC) at sec.gov. Information regarding how the Fund voted proxies relating to portfolio securities is filed with the SEC by August 31st for the most recent 12-month period ending June 30th of that year, and is available without charge by visiting columbiathreadneedleus.com/investor/, or searching the website of the SEC at sec.gov.
Quarterly schedule of investments
The Fund files a complete schedule of portfolio holdings with the SEC for the first and third quarters of each fiscal year on Form N-Q. The Fund’s Form N-Q is available on the SEC’s website at sec.gov and may be reviewed and copied at the SEC’s Public Reference Room in Washington, D.C. Information on the operation of the Public Reference Room may be obtained by calling 800.SEC.0330. The Fund’s complete schedule of portfolio holdings, as filed on Form N-Q, can also be obtained without charge, upon request, by calling 800.345.6611.
Additional Fund information
For more information about the Fund, please visit columbiathreadneedleus.com/investor/ or call 800.345.6611. Customer Service Representatives are available to answer your questions Monday through Friday from 8 a.m. to 7 p.m. Eastern time.
Fund investment manager
Columbia Management Investment Advisers, LLC
225 Franklin Street
Boston, MA 02110
Fund distributor
Columbia Management Investment Distributors, Inc.
225 Franklin Street
Boston, MA 02110
Fund transfer agent
Columbia Management Investment Services Corp.
Through October 31, 2018:
P.O. Box 8081
Boston, MA 02266-8081
Effective November 1, 2018:
P.O. Box 219104
Kansas City, MO 64121-9104
| 46 | Columbia High Yield Municipal Fund | Annual Report 2018 |
[THIS PAGE INTENTIONALLY LEFT BLANK]
[THIS PAGE INTENTIONALLY LEFT BLANK]
[THIS PAGE INTENTIONALLY LEFT BLANK]
Columbia High Yield Municipal Fund
Through October 31, 2018:
P.O. Box 8081
Boston, MA 02266-8081
Effective November 1, 2018:
P.O. Box 219104
Kansas City, MO 64121-9104
Please read and consider the investment objectives, risks, charges and expenses for any fund carefully before investing. For a prospectus and summary prospectus, which contains this and other important information about the Fund, go to
columbiathreadneedleus.com/investor/. The Fund is distributed by Columbia Management Investment Distributors, Inc., member FINRA, and managed by Columbia Management Investment Advisers, LLC.
Columbia Threadneedle Investments (Columbia Threadneedle) is the global brand name of the Columbia and Threadneedle group of companies. All rights reserved. Columbia Management Investment Distributors, Inc., 225 Franklin Street, Boston, MA 02110-2804
© 2018 Columbia Management Investment Advisers, LLC.
columbiathreadneedleus .com/investor/

Annual Report
May 31, 2018
Columbia Adaptive Risk Allocation Fund
Not FDIC Insured • No bank guarantee • May lose value
Dear Shareholders,
The year 2017 was an extraordinary year in the financial markets. The S&P 500 Index didn’t experience a single down month and returned over 20%. Continuing this trend, January 2018 marked the fastest start for the index ever. Low volatility, which had been a feature of the U.S. equity market for several years, along with the surge in the S&P 500 Index, drove investor sentiment to very high levels. This arguably set the stage for an overdue correction, which we witnessed in February 2018.
A return to volatility
There have been few periods of market upheaval such as were experienced in the first part of 2018. While investors were taken by surprise by the sudden and pronounced market swings, the return to some level of volatility actually marked a resumption of relatively normal market conditions. Having said that, it’s important to distinguish between a good technical correction where excess enthusiasm in the marketplace is being let out, versus a real change in the underlying fundamentals – things like an underperforming economy or weaker corporate earnings. Our view is that the recent market volatility falls into the former category, and the fundamentals remain strong. We’re continuing to see improvements in global economic activity, and we’re seeing corporate earnings expectations continue to rise – and not just because of tax reform.
Consistency is more important than ever
It’s important to keep in mind that when it comes to long-term investing, it’s the destination, not the journey that matters most. If you have a financial goal that you’ve worked out with your financial advisor, and you have a good asset allocation plan to reach it, it’s a question of sticking with your plan rather than become focused on near-term volatility. Bouts of volatility are normal. After all, it’s hard to cross the ocean without hitting an occasional rough patch. You need to focus on the destination.
One final thought. In weathering volatility, it’s the consistency of the return that is essential. Investors who chase higher returns are usually the first to sell when an investment goes through a bad patch, and they therefore don’t tend to benefit from the recovery. More disciplined investors who perhaps panic less or not at all during periods of volatility, tend to have improved long-term results and are more likely to reach their financial goals. Nothing is more important to us than making sure those who have entrusted us to protect and grow their assets are able to do what matters most to them.
Your success is our priority. Talk to your financial advisor about how working with Columbia Threadneedle Investments may help you position your portfolio for consistent, sustainable outcomes, no matter the market conditions.
Sincerely,
Christopher O. Petersen
President, Columbia Funds
The S&P 500 Index, an unmanaged index, measures the performance of 500 widely held, large-capitalization U.S. stocks and is frequently used as a general measure of market performance. Past performance is no guarantee of future results.
Columbia Funds are distributed by Columbia Management Investment Distributors, Inc., member FINRA, and managed by Columbia Management Investment Advisers, LLC.
© 2018 Columbia Management Investment Advisers, LLC. All rights reserved.
Columbia Adaptive Risk Allocation Fund | Annual Report 2018
Columbia Adaptive Risk Allocation Fund | Annual Report 2018
Investment objective
Columbia Adaptive Risk Allocation Fund (the Fund) pursues consistent total returns by seeking to allocate risks across multiple asset classes.
Portfolio management
Joshua Kutin, CFA
Lead Portfolio Manager
Managed Fund since 2015
Alexander Wilkinson, CFA, CAIA
Portfolio Manager
Managed Fund since May 2018
| Average annual total returns (%) (for the period ended May 31, 2018) |
| | | Inception | 1 Year | 5 Years | Life |
| Class A | Excluding sales charges | 06/19/12 | 7.07 | 4.93 | 4.85 |
| | Including sales charges | | 0.92 | 3.71 | 3.81 |
| Advisor Class* | 10/01/14 | 7.26 | 5.14 | 5.02 |
| Class C | Excluding sales charges | 06/19/12 | 6.19 | 4.14 | 4.05 |
| | Including sales charges | | 5.21 | 4.14 | 4.05 |
| Institutional Class | 06/19/12 | 7.26 | 5.20 | 5.11 |
| Institutional 2 Class | 06/19/12 | 7.24 | 5.27 | 5.16 |
| Institutional 3 Class* | 10/01/14 | 7.29 | 5.21 | 5.07 |
| Class R | 06/19/12 | 6.75 | 4.68 | 4.59 |
| Class T | Excluding sales charges | 06/19/12 | 6.97 | 4.95 | 4.86 |
| | Including sales charges | | 4.28 | 4.42 | 4.41 |
| Modified Blended Benchmark | | 7.76 | 5.93 | 6.92 |
| New Blended Benchmark | | 7.36 | 7.28 | 8.59 |
| FTSE Three Month U.S. Treasury Bill Index | | 1.24 | 0.37 | 0.32 |
| Former Blended Benchmark | | 8.16 | 6.06 | 7.08 |
Returns for Class A shares are shown with and without the maximum initial sales charge of 5.75%. Returns for Class C shares are shown with and without the 1.00% contingent deferred sales charge for the first year only. Returns for Class T shares are shown with and without the maximum initial sales charge of 2.50% per transaction. The Fund’s other classes are not subject to sales charges and have limited eligibility. Effective November 1, 2017, Class R4, Class R5, Class Y and Class Z shares were renamed Advisor Class, Institutional 2 Class, Institutional 3 Class and Institutional Class shares, respectively. Please see the Fund’s prospectus for details. Performance for different share classes will vary based on differences in sales charges and fees associated with each class. All results shown assume reinvestment of distributions during the period. Returns do not reflect the deduction of taxes that a shareholder may pay on Fund distributions or on the redemption of Fund shares. Performance results reflect the effect of any fee waivers or reimbursements of Fund expenses by Columbia Management Investment Advisers, LLC and/or any of its affiliates. Absent these fee waivers or expense reimbursement arrangements, performance results would have been lower.
The performance information shown represents past performance and is not a guarantee of future results. The investment return and principal value of your investment will fluctuate so that your shares, when redeemed, may be worth more or less than their original cost. Current performance may be lower or higher than the performance information shown. You may obtain performance information current to the most recent month-end by contacting your financial intermediary, visiting columbiathreadneedleus.com/investor/ or calling 800.345.6611.
| * | The returns shown for periods prior to the share class inception date (including returns for the Life of the Fund, if shown, which are since Fund inception) include the returns of the Fund’s oldest share class. Since the Fund launched more than one share class at its inception, Class A shares were used. These returns are adjusted to reflect any higher class-related operating expenses of the newer share classes, as applicable. Please visit columbiathreadneedleus.com/investor/investment-products/mutual-funds/appended-performance for more information. |
Effective January 1, 2018, the Fund compares its performance to that of a blended benchmark consisting of 60% MSCI ACWI (Net) Hedged to DM Currencies and 40% Bloomberg Barclays Global Aggregate Bond Hedged Index (the New Blended Benchmark). In addition, on the same date, the blended benchmark consisting of 60% MSCI ACWI All Cap Index (Net) and 40% Bloomberg Barclays Global Aggregate Bond Index (the Former Blended Benchmark) was modified to a blended benchmark consisting of 60% MSCI ACWI (Net) and 40% Bloomberg Barclays Global Aggregate Bond Index (the Modified Blended Benchmark). The Fund continues to compare its performance to that of the FTSE Three-Month U.S. Treasury Bill Index. The Fund’s investment manager recommended these changes because the new benchmarks provide a more complete comparison with how the Fund is managed.
The MSCI ACWI (Net) is a free float-adjusted market capitalization index that is designed to measure equity market performance in the global developed and emerging markets. The MSCI ACWI All Cap Index (Net) captures large, mid, small and micro cap representation across 23 developed markets countries and large, mid and small cap representation across 23 emerging markets countries. The Bloomberg Barclays Global Aggregate Bond Index is a broad-based benchmark that measures the global investment-grade fixed-rate debt markets. The MSCI ACWI (Net) Hedged DM Currencies Index represents a close estimation of the performance that can be achieved by hedging the currency exposures of all developed market exposures of its parent index, the MSCI ACWI, to the USD, the “home” currency for
| 2 | Columbia Adaptive Risk Allocation Fund | Annual Report 2018 |
Fund at a Glance (continued)
the hedged index. The index is 100% hedged to the USD of developed market currencies by selling each foreign currency forward at the one-month Forward weight. The parent index is composed of large and mid cap stocks across 23 Developed Markets (DM) countries and 24 Emerging Markets (EM) countries. The Bloomberg Barclays Global Aggregate Bond Index Hedged is an unmanaged index that is comprised of several other Barclays indexes that measure fixed income performance of regions around the world while hedging the currency back to the US dollar.
The FTSE Three-Month U.S. Treasury Bill Index is an unmanaged index that represents the performance of three-month Treasury bills and reflects reinvestment of all distributions and changes in market prices.
Indices are not available for investment, are not professionally managed and do not reflect sales charges, fees, brokerage commissions, taxes (except the MSCI ACWI All Cap Index (Net), MSCI ACWI Index (Net) and MSCI ACWI Index (Net) Hedged to DM Currencies, which reflect reinvested dividends net of withholding taxes) or other expenses of investing. Securities in the Fund may not match those in an index.
Performance of a hypothetical $10,000 investment (June 19, 2012 — May 31, 2018)
The chart above shows the change in value of a hypothetical $10,000 investment in Class A shares of Columbia Adaptive Risk Allocation Fund during the stated time period, and does not reflect the deduction of taxes that a shareholder may pay on Fund distributions or on the redemption of Fund shares.
| Portfolio breakdown (%) (at May 31, 2018) |
| Alternative Strategies Funds | 13.5 |
| Common Stocks | 10.6 |
| Exchange-Traded Funds | 1.5 |
| Foreign Government Obligations | 8.4 |
| Inflation-Indexed Bonds | 12.1 |
| Money Market Funds(a) | 43.0 |
| Residential Mortgage-Backed Securities - Agency | 4.6 |
| U.S. Treasury Obligations | 6.3 |
| Total | 100.0 |
| (a) | Includes investments in Money Market Funds (amounting to $1,364.9 million) which have been segregated to cover obligations relating to the Fund’s investment in derivatives which provide exposure to multiple markets. For a description of the Fund’s investments in derivatives, see Investments in derivatives following the Portfolio of Investments and Note 2 to the Notes to Financial Statements. |
Percentages indicated are based upon total investments. The Fund’s portfolio composition is subject to change.
| Market exposure by asset class categories (%)(a) (at May 31, 2018) |
| Equity Assets | 61.7% |
| Inflation-Hedging Assets | 26.5% |
| Spread Assets | 33.7% |
| Interest Rate Assets | 37.2% |
(a) Percentages are based upon net assets. The percentages do not equal 100% due to the effects of leverage within the Fund’s portfolio. Leverage exists when the Fund purchases or sells an instrument or enters into a transaction without investing cash in an amount equal to the full economic exposure of the instrument or transaction. The Fund’s portfolio composition and its market exposure are subject to change. Inflation-Hedging Assets may include, but are not limited to, direct or indirect investments in commodity-related investments, including certain types of commodities-linked derivatives and notes, and U.S. and non-U.S. inflation-linked bonds. Interest Rate Assets generally include fixed-income securities issued by U.S. and non-U.S. governments. Spread Assets generally include any other fixed-income securities.
Columbia Adaptive Risk Allocation Fund | Annual Report 2018
| 3 |
Manager Discussion of Fund Performance
For the 12-month period that ended May 31, 2018, the Fund’s Class A shares returned 7.07% excluding sales charges. While posting solid absolute gains, the Fund underperformed its New Blended Benchmark, which returned 7.36% for the same time period. During the same 12 months, the Modified Blended Benchmark returned 7.76% and the Former Blended Benchmark returned 8.16% over the same period. To compare, the FTSE Three-Month U.S. Treasury Bill Index returned 1.24% during the 12-month period. The Fund takes a risk-based approach to allocating assets across four primary segments of global capital markets.
During the period, MSCI ACWI Index (Net) Hedged to DM Currencies returned 11.54%, and the Bloomberg Barclays Global Aggregate Bond Hedged Index returned 1.18%. The MSCI ACWI Index returned 11.84%, the MSCI ACWI All Cap Index returned 12.53%, and the Bloomberg Barclays Global Aggregate Bond Index returned 1.72% for the same period.
Market state policy implementation and tactical positioning drove results
The Fund uses a global risk allocation strategy and takes a flexible approach to allocating portfolio risk across multiple asset classes including: equity securities, inflation hedging assets, and fixed-income securities (generally consisting of fixed-income securities issued by governments, which are referred to as interest rate assets, and other fixed-income securities, which are referred to as spread assets). The Fund employs a market state classification process, based on multiple market-based indicators, to identify four distinct market environments and creates a policy or benchmark portfolio with a strategic risk allocation for each environment that is intended to generate attractive risk-adjusted returns in that environment. Allocations of risk to asset classes may differ significantly across market environments. While a global risk-balanced portfolio is what we expect the Fund to be in most often, other market states represent conditions when risk balancing may be less than ideal, and the portfolio can deviate from balance to improve risk-adjusted return potential for that environment. This could be to protect capital in a weakening market or to more fully participate when market conditions are considered favorable. Once a policy portfolio is established, the Fund then employs a tactical overlay process driven by the Columbia Global Asset Allocation Team’s Investment Strategy Outlook. During the 12-month period ended May 31, 2018, changes to the Fund’s risk allocation using this market state classification process added value relative to maintaining a static neutral state, however, the Fund underperformed the New Blended Benchmark due to diversifying the portfolio with out-of-benchmark positions that lagged the New Blended Benchmark during these months.
The Fund’s absolute returns were strong during the period, and our tactical positioning overall was a modest contributor to the Fund’s relative performance during the period. Of the broad global asset classes to which the Fund allocates, its exposure to global equities contributed most positively, as global equity markets have responded favorably to a persistent pro-growth sentiment since the U.S. presidential election. Additionally, the Fund’s allocations to commodities and to spread assets — primarily investment-grade corporate bonds, high-yield bonds, mortgage-backed securities and emerging market debt, significantly boosted relative results. Exposure to inflation hedging assets as a whole also added value, albeit modestly so. The Fund’s allocation to global government fixed-income securities detracted from the Fund’s performance, as interest rates rose during the period.
Global positioning reflected changing market conditions
The Fund uses an adaptive approach to re-allocate portfolio risk exposures as market conditions change in an effort to improve risk-adjusted returns. We believe no single portfolio is appropriate for all market environments and have identified four distinct market states — highly bullish, bullish, neutral and capital preservation, but we expect the Fund to be in the neutral market state the majority of the time. The Fund made several deviations from the neutral market state during the period, moving into the capital preservation market state to start the period and subsequently toggling between the neutral and more aggressive bullish and highly bullish market states when market-based indicators became more positive. From a risk allocation perspective, the Fund in the neutral state was approximately 50% of the portfolio’s risk allocation in equities, with the remaining 50% of the portfolio’s risk allocation divided among the other three asset classes. In the months when the Fund was in a bullish or highly bullish market state, the Fund increased risk exposure to equities and decreased exposure to interest rates. With these changes, the Fund’s portfolio turnover rate for the 12-month period was 210%.
At the end of the period, we favored a modestly overweight stance toward equities, given the tactical view that the upside opportunities for stocks, particularly U.S. stocks, seemed to more than offset the downside risks. The positive equity environment we observed was supported by both qualitative and quantitative indicators that favored greater exposure to risk assets. The well-known aphorism “sell in May and go away” aside, we believed at the end of the period that volatility could
| 4 | Columbia Adaptive Risk Allocation Fund | Annual Report 2018 |
Manager Discussion of Fund Performance (continued)
continue to contract from early 2018 highs and that there may still be room to be rewarded for holding riskier assets during the second half of 2018. In our view, economic data have been rather resilient, with strong employment statistics on multiple fronts, healthy first quarter corporate earnings and improved expectations for forward earnings. Valuations at the end of May 2018 were not cheap by long-term metrics, but we felt they had become relatively inexpensive with more earnings growth than price appreciation in the last months of the annual period. All of these factors supported our moderate equity overweight thesis. Dovetailing with the constructive fundamental environment, the Fund shifted to a bullish market state at the end of May 2018 for the first time since November 2017. Also, consistent with such a view, the Fund moved at the end of the period to a risk allocation that de-emphasizes government bonds.
Derivatives usage
During the period, the Fund used futures (including bond, currency, equity, index and interest rate futures), currency forwards, options and swaps (including credit default, credit default swap index, interest rate and total return swaps). The Fund used derivatives for both hedging and non-hedging purposes, including, for example, seeking to enhance returns or as a substitute for a position in an underlying asset. The Fund also used derivatives to manage its overall risk exposure and to obtain leverage (market exposure in excess of the Fund’s assets) within certain asset classes and during certain market environments in seeking to maintain attractive expected risk-adjusted returns while adhering to the Fund’s risk allocation framework. On a stand-alone basis, these derivatives had an overall positive impact on Fund performance during the period.
Market risk may affect a single issuer, sector of the economy, industry or the market as a whole. The Fund’s investment in other funds subjects it to the investment performance (positive or negative), risks and expenses of these underlying funds. Asset allocation does not assure a profit or protect against loss. Investing in derivatives is a specialized activity that involves special risks that subject the Fund to significant loss potential, including when used as leverage, and may result in greater fluctuation in Fund value. Commodity investments may be affected by the overall market and industry- and commodity-specific factors, and may be more volatile and less liquid than other investments. Short positions (where the underlying asset is not owned) can create unlimited risk. International investing involves certain risks and volatility due to potential political, economic or currency instabilities and different financial and accounting standards. Risks are enhanced for emerging market issuers. Investment in or exposure to foreign currencies subjects the Fund to currency fluctuation and risk of loss. Investments in small- and mid-cap companies involve risks and volatility greater than investments in larger, more established companies. Fixed-income securities present issuer default risk. A rise in interest rates may result in a price decline of fixed-income instruments held by the Fund, negatively impacting its performance and NAV. Falling rates may result in the Fund investing in lower yielding debt instruments, lowering the Fund’s income and yield. These risks may be heightened for longer maturity and duration securities. Interest payments on inflation-protected securities may be more volatile than interest paid on ordinary bonds. In periods of deflation, these securities provide no income. As a non-diversified fund, fewer investments could have a greater effect on performance. Investments selected using quantitative methods may perform differently from the market as a whole and may not enable the Fund to achieve its objective. Market or other (e.g., interest rate) environments may adversely affect the liquidity of fund investments, negatively impacting their price. Generally, the less liquid the market at the time the Fund sells a holding, the greater the risk of loss or decline of value to the Fund. See the Fund’s prospectus for more information on these and other risks.
The views expressed in this report reflect the current views of the respective parties. These views are not guarantees of future performance and involve certain risks, uncertainties and assumptions that are difficult to predict, so actual outcomes and results may differ significantly from the views expressed. These views are subject to change at any time based upon economic, market or other conditions and the respective parties disclaim any responsibility to update such views. These views may not be relied on as investment advice and, because investment decisions for a Columbia fund are based on numerous factors, may not be relied on as an indication of trading intent on behalf of any particular Columbia fund. References to specific securities should not be construed as a recommendation or investment advice.
Columbia Adaptive Risk Allocation Fund | Annual Report 2018
| 5 |
Understanding Your Fund’s Expenses
(Unaudited)
As an investor, you incur two types of costs. There are transaction costs, which generally include sales charges on purchases and may include redemption fees. There are also ongoing costs, which generally include management fees, distribution and/or service fees, and other fund expenses. The following information is intended to help you understand your ongoing costs (in dollars) of investing in the Fund and to help you compare these costs with the ongoing costs of investing in other mutual funds.
Analyzing your Fund’s expenses
To illustrate these ongoing costs, we have provided examples and calculated the expenses paid by investors in each share class of the Fund during the period. The actual and hypothetical information in the table is based on an initial investment of $1,000 at the beginning of the period indicated and held for the entire period. Expense information is calculated two ways and each method provides you with different information. The amount listed in the “Actual” column is calculated using the Fund’s actual operating expenses and total return for the period. You may use the Actual information, together with the amount invested, to estimate the expenses that you paid over the period. Simply divide your account value by $1,000 (for example, an $8,600 account value divided by $1,000 = 8.6), then multiply the results by the expenses paid during the period under the “Actual” column. The amount listed in the “Hypothetical” column assumes a 5% annual rate of return before expenses (which is not the Fund’s actual return) and then applies the Fund’s actual expense ratio for the period to the hypothetical return. You should not use the hypothetical account values and expenses to estimate either your actual account balance at the end of the period or the expenses you paid during the period. See “Compare with other funds” below for details on how to use the hypothetical data.
Compare with other funds
Since all mutual funds are required to include the same hypothetical calculations about expenses in shareholder reports, you can use this information to compare the ongoing cost of investing in the Fund with other funds. To do so, compare the hypothetical example with the 5% hypothetical examples that appear in the shareholder reports of other funds. As you compare hypothetical examples of other funds, it is important to note that hypothetical examples are meant to highlight the ongoing costs of investing in a fund only and do not reflect any transaction costs, such as sales charges, or redemption or exchange fees. Therefore, the hypothetical calculations are useful in comparing ongoing costs only, and will not help you determine the relative total costs of owning different funds. If transaction costs were included in these calculations, your costs would be higher.
| December 1, 2017 — May 31, 2018 |
| | Account value at the
beginning of the
period ($) | Account value at the
end of the
period ($) | Expenses paid during
the period ($) | Fund’s annualized
expense ratio (%) |
| | Actual | Hypothetical | Actual | Hypothetical | Actual | Hypothetical | Actual |
| Class A | 1,000.00 | 1,000.00 | 1,017.20 | 1,020.04 | 4.93 | 4.94 | 0.98 |
| Advisor Class | 1,000.00 | 1,000.00 | 1,018.50 | 1,021.29 | 3.67 | 3.68 | 0.73 |
| Class C | 1,000.00 | 1,000.00 | 1,013.00 | 1,016.31 | 8.68 | 8.70 | 1.73 |
| Institutional Class | 1,000.00 | 1,000.00 | 1,018.50 | 1,021.29 | 3.67 | 3.68 | 0.73 |
| Institutional 2 Class | 1,000.00 | 1,000.00 | 1,017.40 | 1,021.24 | 3.72 | 3.73 | 0.74 |
| Institutional 3 Class | 1,000.00 | 1,000.00 | 1,018.10 | 1,021.49 | 3.47 | 3.48 | 0.69 |
| Class R | 1,000.00 | 1,000.00 | 1,015.50 | 1,018.85 | 6.13 | 6.14 | 1.22 |
| Class T | 1,000.00 | 1,000.00 | 1,016.30 | 1,020.09 | 4.88 | 4.89 | 0.97 |
Expenses paid during the period are equal to the annualized expense ratio for each class as indicated above, multiplied by the average account value over the period and then multiplied by the number of days in the Fund’s most recent fiscal half year and divided by 365.
Expenses do not include fees and expenses incurred indirectly by the Fund from its investment in underlying funds, including affiliated and non-affiliated pooled investment vehicles, such as mutual funds and exchange-traded funds.
| 6 | Columbia Adaptive Risk Allocation Fund | Annual Report 2018 |
Portfolio of Investments
May 31, 2018
(Percentages represent value of investments compared to net assets)
Investments in securities
| Alternative Strategies Funds 14.0% |
| | Shares | Value ($) |
| Columbia Commodity Strategy Fund, Institutional 3 Class(a) | 72,539,944 | 428,711,071 |
Total Alternative Strategies Funds
(Cost $403,777,390) | 428,711,071 |
|
| Common Stocks 11.0% |
| Issuer | Shares | Value ($) |
| Real Estate 11.0% |
| Equity Real Estate Investment Trusts (REITS) 11.0% |
| Alexandria Real Estate Equities, Inc. | 124,816 | 15,592,015 |
| American Homes 4 Rent, Class A | 719,983 | 14,342,061 |
| American Tower Corp. | 25,412 | 3,516,258 |
| AvalonBay Communities, Inc. | 73,504 | 12,167,852 |
| Coresite Realty Corp. | 69,164 | 7,342,450 |
| Corporate Office Properties Trust | 275,540 | 7,687,566 |
| Crown Castle International Corp. | 51,364 | 5,349,561 |
| CubeSmart | 282,995 | 8,631,347 |
| DDR Corp. | 173,266 | 2,631,911 |
| Digital Realty Trust, Inc. | 184,696 | 19,851,126 |
| Duke Realty Corp. | 285,889 | 8,039,199 |
| Equinix, Inc. | 27,738 | 11,007,825 |
| Equity LifeStyle Properties, Inc. | 207,422 | 18,854,660 |
| Equity Residential | 101,533 | 6,497,097 |
| Essex Property Trust, Inc. | 72,109 | 17,236,214 |
| Extra Space Storage, Inc. | 89,147 | 8,580,399 |
| First Industrial Realty Trust, Inc. | 331,503 | 10,916,394 |
| Four Corners Property Trust, Inc. | 290,217 | 6,643,067 |
| Getty Realty Corp. | 73,250 | 1,912,557 |
| GGP, Inc. | 253,446 | 5,139,885 |
| Healthcare Trust of America, Inc., Class A | 260,469 | 6,683,634 |
| Highwoods Properties, Inc. | 251,712 | 12,039,385 |
| Host Hotels & Resorts, Inc. | 477,725 | 10,333,192 |
| Invitation Homes, Inc. | 689,367 | 15,172,968 |
| Macerich Co. (The) | 57,701 | 3,209,907 |
| Mack-Cali Realty Corp. | 403,299 | 7,973,221 |
| Outfront Media, Inc. | 113,539 | 2,252,614 |
| Pebblebrook Hotel Trust | 109,991 | 4,489,833 |
| ProLogis, Inc. | 248,211 | 15,972,378 |
| Common Stocks (continued) |
| Issuer | Shares | Value ($) |
| Simon Property Group, Inc. | 164,152 | 26,300,433 |
| SL Green Realty Corp. | 173,201 | 16,890,561 |
| Sun Communities, Inc. | 74,654 | 7,217,549 |
| Sunstone Hotel Investors, Inc. | 330,986 | 5,755,847 |
| Ventas, Inc. | 177,938 | 9,726,091 |
| Total | | 335,957,057 |
| Total Real Estate | 335,957,057 |
Total Common Stocks
(Cost $339,913,587) | 335,957,057 |
|
| Exchange-Traded Funds 1.5% |
| | Shares | Value ($) |
| iShares MSCI Canada ETF | 1,614,568 | 46,402,684 |
Total Exchange-Traded Funds
(Cost $46,655,445) | 46,402,684 |
| Foreign Government Obligations(b),(c) 8.7% |
| Issuer | Coupon
Rate | | Principal
Amount ($) | Value ($) |
| Austria 0.9% |
| Republic of Austria Government Bond(d) |
| 11/22/2022 | 3.400% | EUR | 19,300,000 | 26,196,056 |
| Belgium 0.8% |
| Kingdom of Belgium Government Bond(d) |
| 06/22/2024 | 2.600% | EUR | 8,737,000 | 11,737,392 |
| 06/22/2027 | 0.800% | EUR | 11,400,000 | 13,549,500 |
| Total | 25,286,892 |
| France 0.8% |
| French Republic Government Bond OAT(d) |
| 05/25/2045 | 3.250% | EUR | 8,232,464 | 13,387,206 |
| 05/25/2048 | 2.000% | EUR | 7,670,000 | 9,838,648 |
| Total | 23,225,854 |
| Italy 0.6% |
| Italy Buoni Poliennali Del Tesoro(d) |
| 09/01/2046 | 3.250% | EUR | 8,274,000 | 9,839,811 |
| 03/01/2047 | 2.700% | EUR | 8,208,000 | 8,700,819 |
| Total | 18,540,630 |
| Japan 1.8% |
| Japan Government 20-Year Bond |
| 06/20/2032 | 1.500% | JPY | 23,300,000 | 252,068 |
| 09/20/2037 | 0.600% | JPY | 1,451,000,000 | 13,614,151 |
The accompanying Notes to Financial Statements are an integral part of this statement.
Columbia Adaptive Risk Allocation Fund | Annual Report 2018
| 7 |
Portfolio of Investments (continued)
May 31, 2018
| Foreign Government Obligations(b),(c) (continued) |
| Issuer | Coupon
Rate | | Principal
Amount ($) | Value ($) |
| Japan Government 30-Year Bond |
| 03/20/2037 | 2.400% | JPY | 288,250,000 | 3,573,214 |
| 03/20/2047 | 0.800% | JPY | 1,409,900,000 | 13,291,591 |
| 06/20/2047 | 0.800% | JPY | 337,300,000 | 3,176,660 |
| 09/20/2047 | 0.800% | JPY | 1,565,000,000 | 14,714,596 |
| 03/20/2048 | 0.800% | JPY | 625,650,000 | 5,871,333 |
| Total | 54,493,613 |
| Mexico 0.3% |
| Mexican Bonos |
| 06/10/2021 | 6.500% | MXN | 201,310,000 | 9,759,018 |
| Netherlands 1.8% |
| Netherlands Government Bond(d) |
| 07/15/2027 | 0.750% | EUR | 46,085,000 | 55,467,668 |
| Poland 0.0% |
| Republic of Poland Government Bond |
| 07/25/2026 | 2.500% | PLN | 4,247,000 | 1,097,997 |
| Portugal 0.0% |
| Portugal Obrigacoes do Tesouro OT(d) |
| 10/15/2025 | 2.875% | EUR | 425,000 | 547,795 |
| Spain 1.6% |
| Spain Government Bond(d) |
| 01/31/2022 | 5.850% | EUR | 8,716,000 | 12,247,539 |
| 10/31/2024 | 2.750% | EUR | 28,254,000 | 36,881,826 |
| Total | 49,129,365 |
| United Kingdom 0.1% |
| United Kingdom Gilt(d) |
| 01/22/2045 | 3.500% | GBP | 832,133 | 1,527,228 |
Total Foreign Government Obligations
(Cost $267,658,683) | 265,272,116 |
|
| Inflation-Indexed Bonds(b) 12.5% |
| | | | |
| Australia 0.3% |
| Australia Government Bond(d) |
| 08/21/2035 | 2.000% | AUD | 9,017,358 | 7,940,145 |
| France 1.5% |
| France Government Bond OAT(d) |
| 07/25/2032 | 3.150% | EUR | 4,383,971 | 8,000,475 |
| French Republic Government Bond OAT(d) |
| 07/25/2024 | 0.250% | EUR | 18,206,023 | 23,462,346 |
| 07/25/2040 | 1.800% | EUR | 8,092,500 | 14,198,420 |
| Total | 45,661,241 |
| Inflation-Indexed Bonds(b) (continued) |
| Issuer | Coupon
Rate | | Principal
Amount ($) | Value ($) |
| Germany 1.0% |
| Bundesrepublik Deutschland Bundesobligation Inflation-Linked Bond(d) |
| 04/15/2030 | 0.500% | EUR | 5,924,912 | 8,163,571 |
| Deutsche Bundesrepublik Inflation-Linked Bond(d) |
| 04/15/2023 | 0.100% | EUR | 11,177,090 | 14,171,885 |
| 04/15/2046 | 0.100% | EUR | 5,073,371 | 7,269,334 |
| Total | 29,604,790 |
| Italy 0.8% |
| Italy Buoni Poliennali Del Tesoro(d) |
| 09/15/2026 | 3.100% | EUR | 12,284,310 | 16,213,015 |
| 09/15/2041 | 2.550% | EUR | 6,329,494 | 8,193,471 |
| Total | 24,406,486 |
| Japan 0.5% |
| Japanese Government CPI-Linked Bond |
| 03/10/2027 | 0.100% | JPY | 1,691,356,758 | 16,483,129 |
| New Zealand 0.7% |
| New Zealand Government Bond(d) |
| 09/20/2025 | 2.000% | NZD | 28,701,005 | 21,028,452 |
| Spain 0.1% |
| Spain Government Inflation-Linked Bond(d) |
| 11/30/2030 | 1.000% | EUR | 3,733,533 | 4,725,251 |
| Sweden 0.4% |
| Sweden Inflation-Linked Bond |
| 06/01/2025 | 1.000% | SEK | 81,442,916 | 11,181,957 |
| United Kingdom 3.9% |
| United Kingdom Gilt Inflation-Linked Bond(d) |
| 03/22/2024 | 0.125% | GBP | 8,102,443 | 12,167,133 |
| 03/22/2029 | 0.125% | GBP | 6,239,408 | 10,089,185 |
| 03/22/2034 | 0.750% | GBP | 13,983,663 | 26,741,369 |
| 11/22/2037 | 1.125% | GBP | 3,302,496 | 7,203,035 |
| 03/22/2044 | 0.125% | GBP | 8,109,260 | 16,800,557 |
| 03/22/2052 | 0.250% | GBP | 13,873,913 | 33,671,387 |
| 11/22/2056 | 0.125% | GBP | 766,960 | 1,935,375 |
| 11/22/2065 | 0.125% | GBP | 3,890,757 | 11,568,684 |
| Total | 120,176,725 |
| United States 3.3% |
| U.S. Treasury Inflation-Indexed Bond |
| 01/15/2021 | 1.125% | | 6,070,197 | 6,171,807 |
| 01/15/2022 | 0.125% | | 22,300,985 | 21,967,935 |
| 01/15/2024 | 0.625% | | 23,921,108 | 23,939,730 |
| 01/15/2025 | 0.250% | | 20,356,992 | 19,827,655 |
| 02/15/2042 | 0.750% | | 10,663,079 | 10,362,947 |
| 02/15/2043 | 0.625% | | 10,013,184 | 9,419,049 |
| 02/15/2045 | 0.750% | | 8,049,937 | 7,755,931 |
The accompanying Notes to Financial Statements are an integral part of this statement.
| 8 | Columbia Adaptive Risk Allocation Fund | Annual Report 2018 |
Portfolio of Investments (continued)
May 31, 2018
| Inflation-Indexed Bonds(b) (continued) |
| Issuer | Coupon
Rate | | Principal
Amount ($) | Value ($) |
| 02/15/2048 | 1.000% | | 3,228,248 | 3,314,044 |
| Total | 102,759,098 |
Total Inflation-Indexed Bonds
(Cost $381,010,783) | 383,967,274 |
|
| Residential Mortgage-Backed Securities - Agency 4.7% |
| | | | |
| Federal National Mortgage Association(e) |
| 06/18/2033 | 2.500% | | 16,744,328 | 16,323,404 |
| 07/12/2048 | 3.000% | | 24,000,000 | 23,271,094 |
| 07/12/2048 | 3.500% | | 30,750,000 | 30,644,295 |
| 07/12/2048 | 4.000% | | 21,100,000 | 21,541,782 |
| 07/12/2048 | 4.500% | | 5,300,000 | 5,525,871 |
| 07/12/2048 | 5.000% | | 4,675,000 | 4,950,752 |
| Government National Mortgage Association(e) |
| 06/20/2048 | 3.500% | | 42,628,000 | 42,883,291 |
Total Residential Mortgage-Backed Securities - Agency
(Cost $144,725,045) | 145,140,489 |
|
| U.S. Treasury Obligations 6.6% |
| Issuer | Coupon
Rate | | Principal
Amount ($) | Value ($) |
| U.S. Treasury |
| 11/30/2024 | 2.125% | | 63,580,000 | 61,204,436 |
| 08/15/2027 | 2.250% | | 70,580,000 | 67,249,825 |
| 11/15/2027 | 2.250% | | 76,677,000 | 72,974,938 |
Total U.S. Treasury Obligations
(Cost $207,166,688) | 201,429,199 |
| Money Market Funds 44.6% |
| | Shares | Value ($) |
| Columbia Short-Term Cash Fund, 1.907%(a),(f) | 1,364,858,194 | 1,364,858,194 |
Total Money Market Funds
(Cost $1,364,795,408) | 1,364,858,194 |
Total Investments in Securities
(Cost: $3,155,703,029) | 3,171,738,084 |
| Other Assets & Liabilities, Net | | (109,720,881) |
| Net Assets | 3,062,017,203 |
At May 31, 2018, securities and/or cash totaling $91,347,153 were pledged as collateral.
Investments in derivatives
| Forward foreign currency exchange contracts |
Currency to
be sold | Currency to
be purchased | Counterparty | Settlement
date | Unrealized
appreciation ($) | Unrealized
depreciation ($) |
| 3,945,556,000 JPY | 36,375,501 USD | HSBC | 07/09/2018 | 14,030 | — |
| 19,484,756,000 JPY | 178,395,728 USD | HSBC | 07/09/2018 | — | (1,171,965) |
| 198,958,000 MXN | 10,054,816 USD | HSBC | 07/09/2018 | 142,045 | — |
| 16,937,000 NOK | 2,113,034 USD | HSBC | 07/09/2018 | 40,179 | — |
| 10,916,000 NOK | 1,335,699 USD | HSBC | 07/09/2018 | — | (269) |
| 29,933,000 NZD | 20,689,091 USD | HSBC | 07/09/2018 | — | (258,426) |
| 3,374,000 PLN | 943,647 USD | HSBC | 07/09/2018 | 29,799 | — |
| 267,262,000 SEK | 30,979,664 USD | HSBC | 07/09/2018 | 586,975 | — |
| 5,474,000 SGD | 4,103,700 USD | HSBC | 07/09/2018 | 12,331 | — |
| 3,330,000 SGD | 2,488,789 USD | HSBC | 07/09/2018 | — | (115) |
| 22,983,766 USD | 2,491,808,000 JPY | HSBC | 07/09/2018 | — | (19,752) |
| 29,379,297 USD | 42,506,000 NZD | HSBC | 07/09/2018 | 366,975 | — |
| 6,737,271 USD | 58,640,000 SEK | HSBC | 07/09/2018 | — | (68,806) |
| 12,614,000 AUD | 9,543,122 USD | Morgan Stanley | 07/09/2018 | 1,596 | — |
| 45,374,000 AUD | 34,154,159 USD | Morgan Stanley | 07/09/2018 | — | (167,799) |
| 60,579,000 CAD | 47,184,215 USD | Morgan Stanley | 07/09/2018 | 416,378 | — |
| 10,630,000 CHF | 10,824,519 USD | Morgan Stanley | 07/09/2018 | 3,976 | — |
| 85,750,000 CHF | 86,120,983 USD | Morgan Stanley | 07/09/2018 | — | (1,166,086) |
| 34,355,000 DKK | 5,528,045 USD | Morgan Stanley | 07/09/2018 | 116,270 | — |
| 18,873,000 DKK | 2,971,601 USD | Morgan Stanley | 07/09/2018 | — | (1,371) |
| 398,584,300 EUR | 477,680,334 USD | Morgan Stanley | 07/09/2018 | 10,389,476 | — |
| 42,884,000 EUR | 50,264,118 USD | Morgan Stanley | 07/09/2018 | — | (12,075) |
| 137,759,000 GBP | 187,326,178 USD | Morgan Stanley | 07/09/2018 | 3,856,368 | — |
| 21,647,000 GBP | 28,818,623 USD | Morgan Stanley | 07/09/2018 | — | (11,225) |
| 29,844,857 USD | 39,639,000 AUD | Morgan Stanley | 07/09/2018 | 139,012 | — |
| 40,113,776 USD | 34,224,000 EUR | Morgan Stanley | 07/09/2018 | 9,637 | — |
The accompanying Notes to Financial Statements are an integral part of this statement.
Columbia Adaptive Risk Allocation Fund | Annual Report 2018
| 9 |
Portfolio of Investments (continued)
May 31, 2018
| Forward foreign currency exchange contracts (continued) |
Currency to
be sold | Currency to
be purchased | Counterparty | Settlement
date | Unrealized
appreciation ($) | Unrealized
depreciation ($) |
| 59,859,487 USD | 49,941,000 EUR | Morgan Stanley | 07/09/2018 | — | (1,309,834) |
| 59,951,718 USD | 44,088,000 GBP | Morgan Stanley | 07/09/2018 | — | (1,234,559) |
| Total | | | | 16,125,047 | (5,422,282) |
| Long futures contracts |
| Description | Number of
contracts | Expiration
date | Trading
currency | Notional
amount | Value/Unrealized
appreciation ($) | Value/Unrealized
depreciation ($) |
| Australian 10-Year Bond | 461 | 06/2018 | AUD | 59,471,476 | 698,902 | — |
| Euro-BTP | 137 | 09/2018 | EUR | 17,595,229 | 262,273 | — |
| Euro-Bund | 348 | 09/2018 | EUR | 56,790,541 | — | (122,170) |
| Euro-Buxl 30-Year | 19 | 09/2018 | EUR | 3,449,201 | — | (42,617) |
| Euro-OAT | 170 | 09/2018 | EUR | 26,677,131 | 53,455 | — |
| FTSE 100 Index | 452 | 06/2018 | GBP | 34,668,400 | 3,509,079 | — |
| Hang Seng Index | 236 | 06/2018 | HKD | 359,864,600 | 90,521 | — |
| Japanese 10-Year Government Bond | 67 | 09/2018 | JPY | 10,137,894,946 | — | (68,364) |
| Long Gilt | 283 | 09/2018 | GBP | 35,267,500 | 1,133,525 | — |
| MSCI EAFE Index | 4,981 | 06/2018 | USD | 494,862,350 | — | (7,928,586) |
| MSCI Emerging Markets Index | 2,302 | 06/2018 | USD | 129,107,670 | — | (11,046,104) |
| S&P 500 E-mini | 118 | 06/2018 | USD | 15,962,450 | 102,482 | — |
| S&P 500 E-mini | 5,862 | 06/2018 | USD | 792,982,050 | — | (15,259,938) |
| SPI 200 Index | 527 | 06/2018 | AUD | 79,260,800 | 497,894 | — |
| U.S. Long Bond | 97 | 09/2018 | USD | 14,243,974 | 290,606 | — |
| U.S. Treasury 10-Year Note | 1,542 | 09/2018 | USD | 185,760,052 | 1,807,332 | — |
| U.S. Treasury 2-Year Note | 31 | 09/2018 | USD | 6,615,393 | 13,507 | — |
| U.S. Treasury 5-Year Note | 98 | 09/2018 | USD | 11,147,174 | 80,204 | — |
| U.S. Treasury Ultra 10-Year Note | 1,254 | 09/2018 | USD | 162,186,291 | 2,456,507 | — |
| Total | | | | | 10,996,287 | (34,467,779) |
| Short futures contracts |
| Description | Number of
contracts | Expiration
date | Trading
currency | Notional
amount | Value/Unrealized
appreciation ($) | Value/Unrealized
depreciation ($) |
| Canadian Government 10-Year Bond | (97) | 09/2018 | CAD | (13,161,999) | — | (242,069) |
| EURO STOXX 50 | (1,921) | 06/2018 | EUR | (65,448,470) | — | (1,871,480) |
| Total | | | | | — | (2,113,549) |
| Credit default swap contracts - sell protection |
Reference
entity | Counterparty | Maturity
date | Receive
fixed
rate
(%) | Payment
frequency | Implied
credit
spread
(%)* | Notional
currency | Notional
amount | Value
($) | Periodic
payments
receivable
(payable)
($) | Upfront
payments
($) | Upfront
receipts
($) | Unrealized
appreciation
($) | Unrealized
depreciation
($) |
| Markit CDX Emerging Markets Index, Series 29 | Citi | 06/20/2023 | 1.000 | Quarterly | 1.736 | USD | 36,525,000 | (1,210,946) | 0 | — | (1,205,325) | — | (5,621) |
| Markit CDX Emerging Markets Index, Series 29 | Citi | 06/20/2023 | 1.000 | Quarterly | 1.736 | USD | 40,000,000 | (1,326,156) | 0 | — | (1,320,000) | — | (6,156) |
| Markit CDX Emerging Markets Index, Series 29 | Citi | 06/20/2023 | 1.000 | Quarterly | 1.736 | USD | 40,000,000 | (1,326,156) | 0 | — | (1,284,000) | — | (42,156) |
The accompanying Notes to Financial Statements are an integral part of this statement.
| 10 | Columbia Adaptive Risk Allocation Fund | Annual Report 2018 |
Portfolio of Investments (continued)
May 31, 2018
| Credit default swap contracts - sell protection (continued) |
Reference
entity | Counterparty | Maturity
date | Receive
fixed
rate
(%) | Payment
frequency | Implied
credit
spread
(%)* | Notional
currency | Notional
amount | Value
($) | Periodic
payments
receivable
(payable)
($) | Upfront
payments
($) | Upfront
receipts
($) | Unrealized
appreciation
($) | Unrealized
depreciation
($) |
| Markit CDX Emerging Markets Index, Series 29 | Citi | 06/20/2023 | 1.000 | Quarterly | 1.736 | USD | 63,000,000 | (2,088,695) | 127,750 | — | (1,180,898) | — | (780,047) |
| Markit CDX Emerging Markets Index, Series 29 | Citi | 06/20/2023 | 1.000 | Quarterly | 1.736 | USD | 120,117,000 | (3,982,346) | 243,571 | — | (2,171,627) | — | (1,567,147) |
| Total | | | | | | | | | 371,321 | — | (7,161,850) | — | (2,401,127) |
| * | Implied credit spreads, represented in absolute terms, utilized in determining the market value of credit default swap agreements on corporate or sovereign issues as of period end serve as an indicator of the current status of the payment/performance risk and represent the likelihood or risk of default for the credit derivative. The implied credit spread of a particular referenced entity reflects the cost of buying/selling protection and may include upfront payments required to be made to enter into the agreement. Wider credit spreads represent a deterioration of the referenced entity’s credit soundness and a greater likelihood or risk of default or other credit event occurring as defined under the terms of the agreement. |
| Cleared credit default swap contracts - sell protection |
Reference
entity | Counterparty | Maturity
date | Receive
fixed
rate
(%) | Payment
frequency | Implied
credit
spread
(%)* | Notional
currency | Notional
amount | Value
($) | Upfront
payments
($) | Upfront
receipts
($) | Unrealized
appreciation
($) | Unrealized
depreciation
($) |
| Markit CDX North America High Yield Index, Series 30 | Morgan Stanley | 06/20/2023 | 5.000 | Quarterly | 3.521 | USD | 513,935,000 | 4,209,506 | — | — | 4,209,506 | — |
| Markit CDX North America Investment Grade Index, Series 30 | Morgan Stanley | 06/20/2023 | 1.000 | Quarterly | 0.667 | USD | 167,640,000 | 29,208 | — | — | 29,208 | — |
| Markit CDX North America Investment Grade Index, Series 30 | Morgan Stanley | 06/20/2023 | 1.000 | Quarterly | 0.667 | USD | 119,145,000 | (14,804) | — | — | — | (14,804) |
| Total | | | | | | | | 4,223,910 | — | — | 4,238,714 | (14,804) |
| * | Implied credit spreads, represented in absolute terms, utilized in determining the market value of credit default swap agreements on corporate or sovereign issues as of period end serve as an indicator of the current status of the payment/performance risk and represent the likelihood or risk of default for the credit derivative. The implied credit spread of a particular referenced entity reflects the cost of buying/selling protection and may include upfront payments required to be made to enter into the agreement. Wider credit spreads represent a deterioration of the referenced entity’s credit soundness and a greater likelihood or risk of default or other credit event occurring as defined under the terms of the agreement. |
The accompanying Notes to Financial Statements are an integral part of this statement.
Columbia Adaptive Risk Allocation Fund | Annual Report 2018
| 11 |
Portfolio of Investments (continued)
May 31, 2018
Notes to Portfolio of Investments
| (a) | As defined in the Investment Company Act of 1940, an affiliated company is one in which the Fund owns 5% or more of the company’s outstanding voting securities, or a company which is under common ownership or control with the Fund. Holdings and transactions in these affiliated companies during the year ended May 31, 2018 are as follows: |
| Issuer | Beginning
shares | Shares
purchased | Shares
sold | Ending
shares | Capital gain
distributions —
affiliated
issuers ($) | Realized gain
(loss) —
affiliated
issuers ($) | Net change in
unrealized
appreciation
(depreciation) —
affiliated
issuers ($) | Dividends —
affiliated
issuers ($) | Value —
affiliated
issuers
at end of
period ($) |
| Columbia Commodity Strategy Fund, Institutional 3 Class |
| | 11,294,769 | 73,044,557 | (11,799,382) | 72,539,944 | — | 194,653 | 27,269,785 | 534,671 | 428,711,071 |
| Columbia Real Estate Equity Fund, Institutional 3 Class Shares |
| | 5,587,408 | 23,895 | (5,611,303) | — | 102,356 | 2,116,684 | (2,045,900) | 279,483 | — |
| Columbia Short-Term Cash Fund, 1.907% |
| | 1,241,745,376 | 3,646,457,313 | (3,523,344,495) | 1,364,858,194 | — | (50,229) | 52,778 | 17,971,679 | 1,364,858,194 |
| Total | | | | | 102,356 | 2,261,108 | 25,276,663 | 18,785,833 | 1,793,569,265 |
| (b) | Principal amounts are denominated in United States Dollars unless otherwise noted. |
| (c) | Principal and interest may not be guaranteed by the government. |
| (d) | Represents privately placed and other securities and instruments exempt from SEC registration (collectively, private placements), such as Section 4(a)(2) and Rule 144A eligible securities, which are often sold only to qualified institutional buyers. The Fund may invest in private placements determined to be liquid as well as those determined to be illiquid. Private placements may be determined to be liquid under guidelines established by the Fund’s Board of Trustees. At May 31, 2018, the value of these securities amounted to $453,464,578, which represents 14.81% of net assets. |
| (e) | Represents a security purchased on a when-issued basis. |
| (f) | The rate shown is the seven-day current annualized yield at May 31, 2018. |
Currency Legend
| AUD | Australian Dollar |
| CAD | Canada Dollar |
| CHF | Swiss Franc |
| DKK | Danish Krone |
| EUR | Euro |
| GBP | British Pound |
| HKD | Hong Kong Dollar |
| JPY | Japanese Yen |
| MXN | Mexican Peso |
| NOK | Norwegian Krone |
| NZD | New Zealand Dollar |
| PLN | Polish Zloty |
| SEK | Swedish Krona |
| SGD | Singapore Dollar |
| USD | US Dollar |
Fair value measurements
The Fund categorizes its fair value measurements according to a three-level hierarchy that maximizes the use of observable inputs and minimizes the use of unobservable inputs by prioritizing that the most observable input be used when available. Observable inputs are those that market participants would use in pricing an investment based on market data obtained from sources independent of the reporting entity. Unobservable inputs are those that reflect the Fund’s assumptions about the information market participants would use in pricing an investment. An investment’s level within the fair value hierarchy is based on the lowest level of any input that is deemed significant to the asset’s or liability’s fair value measurement. The input levels are not necessarily an indication of the risk or liquidity associated with investments at that level. For example, certain U.S. government securities are generally high quality and liquid, however, they are reflected as Level 2 because the inputs used to determine fair value may not always be quoted prices in an active market.
Fair value inputs are summarized in the three broad levels listed below:
The accompanying Notes to Financial Statements are an integral part of this statement.
| 12 | Columbia Adaptive Risk Allocation Fund | Annual Report 2018 |
Portfolio of Investments (continued)
May 31, 2018
Fair value measurements (continued)
| ■ | Level 1 — Valuations based on quoted prices for investments in active markets that the Fund has the ability to access at the measurement date. Valuation adjustments are not applied to Level 1 investments. |
| ■ | Level 2 — Valuations based on other significant observable inputs (including quoted prices for similar securities, interest rates, prepayment speeds, credit risks, etc.). |
| ■ | Level 3 — Valuations based on significant unobservable inputs (including the Fund’s own assumptions and judgment in determining the fair value of investments). |
Inputs that are used in determining fair value of an investment may include price information, credit data, volatility statistics, and other factors. These inputs can be either observable or unobservable. The availability of observable inputs can vary between investments, and is affected by various factors such as the type of investment, and the volume and level of activity for that investment or similar investments in the marketplace. The inputs will be considered by the Investment Manager, along with any other relevant factors in the calculation of an investment’s fair value. The Fund uses prices and inputs that are current as of the measurement date, which may include periods of market dislocations. During these periods, the availability of prices and inputs may be reduced for many investments. This condition could cause an investment to be reclassified between the various levels within the hierarchy.
Certain investments that have been measured at fair value using the net asset value (NAV) per share (or its equivalent) are not categorized in the fair value hierarchy. The fair value amounts presented in the table are intended to reconcile the fair value hierarchy to the amounts presented in the Portfolio of Investments. The Columbia Short-Term Cash Fund seeks to provide shareholders with maximum current income consistent with liquidity and stability of principal. Columbia Short-Term Cash Fund prices its shares with a floating NAV and no longer seeks to maintain a stable NAV.
Investments falling into the Level 3 category are primarily supported by quoted prices from brokers and dealers participating in the market for those investments. However, these may be classified as Level 3 investments due to lack of market transparency and corroboration to support these quoted prices. Additionally, valuation models may be used as the pricing source for any remaining investments classified as Level 3. These models may rely on one or more significant unobservable inputs and/or significant assumptions by the Investment Manager. Inputs used in valuations may include, but are not limited to, financial statement analysis, capital account balances, discount rates and estimated cash flows, and comparable company data.
Under the direction of the Fund’s Board of Trustees (the Board), the Investment Manager’s Valuation Committee (the Committee) is responsible for overseeing the valuation procedures approved by the Board. The Committee consists of voting and non-voting members from various groups within the Investment Manager’s organization, including operations and accounting, trading and investments, compliance, risk management and legal.
The Committee meets at least monthly to review and approve valuation matters, which may include a description of specific valuation determinations, data regarding pricing information received from approved pricing vendors and brokers and the results of Board-approved valuation control policies and procedures (the Policies). The Policies address, among other things, instances when market quotations are or are not readily available, including recommendations of third party pricing vendors and a determination of appropriate pricing methodologies; events that require specific valuation determinations and assessment of fair value techniques; securities with a potential for stale pricing, including those that are illiquid, restricted, or in default; and the effectiveness of third party pricing vendors, including periodic reviews of vendors. The Committee meets more frequently, as needed, to discuss additional valuation matters, which may include the need to review back-testing results, review time-sensitive information or approve related valuation actions. The Committee reports to the Board, with members of the Committee meeting with the Board at each of its regularly scheduled meetings to discuss valuation matters and actions during the period, similar to those described earlier.
For investments categorized as Level 3, the Committee monitors information similar to that described above, which may include: (i) data specific to the issuer or comparable issuers, (ii) general market or specific sector news and (iii) quoted prices and specific or similar security transactions. The Committee considers this data and any changes from prior periods in order to assess the reasonableness of observable and unobservable inputs, any assumptions or internal models used to value those securities and changes in fair value. This data is also used to corroborate, when available, information received from approved pricing vendors and brokers. Various factors impact the frequency of monitoring this information (which may occur as often as daily). However, the Committee may determine that changes to inputs, assumptions and models are not required as a result of the monitoring procedures performed.
The following table is a summary of the inputs used to value the Fund’s investments at May 31, 2018:
| | Level 1
quoted prices
in active
markets for
identical
assets ($) | Level 2
other
significant
observable
inputs ($) | Level 3
significant
unobservable
inputs ($) | Investments
measured at
net asset
value ($) | Total ($) |
| Investments in Securities | | | | | |
| Alternative Strategies Funds | 428,711,071 | — | — | — | 428,711,071 |
| Common Stocks | | | | | |
| Real Estate | 335,957,057 | — | — | — | 335,957,057 |
| Exchange-Traded Funds | 46,402,684 | — | — | — | 46,402,684 |
| Foreign Government Obligations | — | 265,272,116 | — | — | 265,272,116 |
| Inflation-Indexed Bonds | — | 383,967,274 | — | — | 383,967,274 |
| Residential Mortgage-Backed Securities - Agency | — | 145,140,489 | — | — | 145,140,489 |
| U.S. Treasury Obligations | 201,429,199 | — | — | — | 201,429,199 |
| Money Market Funds | — | — | — | 1,364,858,194 | 1,364,858,194 |
| Total Investments in Securities | 1,012,500,011 | 794,379,879 | — | 1,364,858,194 | 3,171,738,084 |
| Investments in Derivatives | | | | | |
| Asset | | | | | |
| Forward Foreign Currency Exchange Contracts | — | 16,125,047 | — | — | 16,125,047 |
| Futures Contracts | 10,996,287 | — | — | — | 10,996,287 |
| Swap Contracts | — | 4,238,714 | — | — | 4,238,714 |
The accompanying Notes to Financial Statements are an integral part of this statement.
Columbia Adaptive Risk Allocation Fund | Annual Report 2018
| 13 |
Portfolio of Investments (continued)
May 31, 2018
Fair value measurements (continued)
| | Level 1
quoted prices
in active
markets for
identical
assets ($) | Level 2
other
significant
observable
inputs ($) | Level 3
significant
unobservable
inputs ($) | Investments
measured at
net asset
value ($) | Total ($) |
| Liability | | | | | |
| Forward Foreign Currency Exchange Contracts | — | (5,422,282) | — | — | (5,422,282) |
| Futures Contracts | (36,581,328) | — | — | — | (36,581,328) |
| Swap Contracts | — | (2,415,931) | — | — | (2,415,931) |
| Total | 986,914,970 | 806,905,427 | — | 1,364,858,194 | 3,158,678,591 |
See the Portfolio of Investments for all investment classifications not indicated in the table.
The Fund’s assets assigned to the Level 2 input category are generally valued using the market approach, in which a security’s value is determined through reference to prices and information from market transactions for similar or identical assets.
Derivative instruments are valued at unrealized appreciation (depreciation).
There were no transfers of financial assets between levels during the period.
The accompanying Notes to Financial Statements are an integral part of this statement.
| 14 | Columbia Adaptive Risk Allocation Fund | Annual Report 2018 |
Statement of Assets and Liabilities
May 31, 2018
| Assets | |
| Investments in securities, at value | |
| Unaffiliated issuers (cost $1,387,130,231) | $1,378,168,819 |
| Affiliated issuers (cost $1,768,572,798) | 1,793,569,265 |
| Foreign currency (cost $443,097) | 443,418 |
| Cash collateral held at broker for: | |
| Swap contracts | 4,948,000 |
| Margin deposits on: | |
| Futures contracts | 65,331,345 |
| Swap contracts | 21,067,808 |
| Unrealized appreciation on forward foreign currency exchange contracts | 16,125,047 |
| Receivable for: | |
| Investments sold | 249,192,561 |
| Capital shares sold | 8,553,804 |
| Dividends | 2,258,803 |
| Interest | 5,806,631 |
| Foreign tax reclaims | 215,740 |
| Variation margin for futures contracts | 2,875,047 |
| Variation margin for swap contracts | 10,477,517 |
| Prepaid expenses | 1,387 |
| Trustees’ deferred compensation plan | 35,639 |
| Total assets | 3,559,070,831 |
| Liabilities | |
| Unrealized depreciation on forward foreign currency exchange contracts | 5,422,282 |
| Unrealized depreciation on swap contracts | 2,401,127 |
| Upfront receipts on swap contracts | 7,161,850 |
| Payable for: | |
| Investments purchased | 327,122,815 |
| Investments purchased on a delayed delivery basis | 144,918,661 |
| Capital shares purchased | 4,093,019 |
| Variation margin for futures contracts | 5,594,381 |
| Management services fees | 54,277 |
| Distribution and/or service fees | 3,926 |
| Transfer agent fees | 106,712 |
| Compensation of board members | 2,810 |
| Compensation of chief compliance officer | 183 |
| Other expenses | 135,946 |
| Trustees’ deferred compensation plan | 35,639 |
| Total liabilities | 497,053,628 |
| Net assets applicable to outstanding capital stock | $3,062,017,203 |
| Represented by | |
| Paid in capital | 2,966,927,875 |
| Undistributed net investment income | 9,629,336 |
| Accumulated net realized gain | 83,158,699 |
| Unrealized appreciation (depreciation) on: | |
| Investments - unaffiliated issuers | (8,961,412) |
| Investments - affiliated issuers | 24,996,467 |
| Foreign currency translations | (674,269) |
| Forward foreign currency exchange contracts | 10,702,765 |
| Futures contracts | (25,585,041) |
| Swap contracts | 1,822,783 |
| Total - representing net assets applicable to outstanding capital stock | $3,062,017,203 |
The accompanying Notes to Financial Statements are an integral part of this statement.
Columbia Adaptive Risk Allocation Fund | Annual Report 2018
| 15 |
Statement of Assets and Liabilities (continued)
May 31, 2018
| Class A | |
| Net assets | $132,920,024 |
| Shares outstanding | 12,300,698 |
| Net asset value per share | $10.81 |
| Maximum sales charge | 5.75% |
| Maximum offering price per share (calculated by dividing the net asset value per share by 1.0 minus the maximum sales charge for Class A shares) | $11.47 |
| Advisor Class | |
| Net assets | $19,763,988 |
| Shares outstanding | 1,810,662 |
| Net asset value per share | $10.92 |
| Class C | |
| Net assets | $109,335,338 |
| Shares outstanding | 10,497,030 |
| Net asset value per share | $10.42 |
| Institutional Class | |
| Net assets | $2,782,662,107 |
| Shares outstanding | 255,092,955 |
| Net asset value per share | $10.91 |
| Institutional 2 Class | |
| Net assets | $16,032,848 |
| Shares outstanding | 1,466,831 |
| Net asset value per share | $10.93 |
| Institutional 3 Class | |
| Net assets | $2,697 |
| Shares outstanding | 246 |
| Net asset value per share(a) | $10.95 |
| Class R | |
| Net assets | $325,192 |
| Shares outstanding | 30,428 |
| Net asset value per share | $10.69 |
| Class T | |
| Net assets | $975,009 |
| Shares outstanding | 90,101 |
| Net asset value per share | $10.82 |
| Maximum sales charge | 2.50% |
| Maximum offering price per share (calculated by dividing the net asset value per share by 1.0 minus the maximum sales charge per transaction for Class T shares) | $11.10 |
| (a) | Net asset value per share rounds to this amount due to fractional shares outstanding. |
The accompanying Notes to Financial Statements are an integral part of this statement.
| 16 | Columbia Adaptive Risk Allocation Fund | Annual Report 2018 |
Statement of Operations
Year Ended May 31, 2018
| Net investment income | |
| Income: | |
| Dividends — unaffiliated issuers | $4,783,587 |
| Dividends — affiliated issuers | 18,785,833 |
| Interest | 10,892,617 |
| Total income | 34,462,037 |
| Expenses: | |
| Management services fees | 17,016,235 |
| Distribution and/or service fees | |
| Class A | 312,198 |
| Class C | 1,051,672 |
| Class R | 13,682 |
| Class T | 3,733 |
| Transfer agent fees | |
| Class A | 62,549 |
| Advisor Class | 8,083 |
| Class C | 52,760 |
| Institutional Class | 1,167,850 |
| Institutional 2 Class | 9,126 |
| Institutional 3 Class | 1 |
| Class R | 1,425 |
| Class T | 756 |
| Plan administration fees | |
| Class K | 6 |
| Compensation of board members | 55,021 |
| Custodian fees | 120,074 |
| Printing and postage fees | 105,287 |
| Registration fees | 412,113 |
| Audit fees | 51,203 |
| Legal fees | 58,635 |
| Compensation of chief compliance officer | 1,036 |
| Other | 59,458 |
| Total expenses | 20,562,903 |
| Expense reduction | (40) |
| Total net expenses | 20,562,863 |
| Net investment income | 13,899,174 |
| Realized and unrealized gain (loss) — net | |
| Net realized gain (loss) on: | |
| Investments — unaffiliated issuers | 9,503,309 |
| Investments — affiliated issuers | 2,261,108 |
| Capital gain distributions from underlying affiliated funds | 102,356 |
| Foreign currency translations | 628,228 |
| Forward foreign currency exchange contracts | (17,329,564) |
| Futures contracts | 159,702,327 |
| Swap contracts | 21,280,767 |
| Net realized gain | 176,148,531 |
| Net change in unrealized appreciation (depreciation) on: | |
| Investments — unaffiliated issuers | (18,851,836) |
| Investments — affiliated issuers | 25,276,663 |
| Foreign currency translations | (1,035,522) |
| Forward foreign currency exchange contracts | 24,564,239 |
| Futures contracts | (40,864,579) |
| Swap contracts | (2,061,417) |
| Net change in unrealized appreciation (depreciation) | (12,972,452) |
| Net realized and unrealized gain | 163,176,079 |
| Net increase in net assets resulting from operations | $177,075,253 |
The accompanying Notes to Financial Statements are an integral part of this statement.
Columbia Adaptive Risk Allocation Fund | Annual Report 2018
| 17 |
Statement of Changes in Net Assets
| | Year Ended
May 31, 2018 | Year Ended
May 31, 2017 |
| Operations | | |
| Net investment income | $13,899,174 | $232,258 |
| Net realized gain | 176,148,531 | 127,848,065 |
| Net change in unrealized appreciation (depreciation) | (12,972,452) | 3,493,497 |
| Net increase in net assets resulting from operations | 177,075,253 | 131,573,820 |
| Distributions to shareholders | | |
| Net investment income | | |
| Class A | — | (1,910,227) |
| Advisor Class | (8,151) | (141,268) |
| Class C | — | (243,404) |
| Institutional Class | (1,109,555) | (868,460) |
| Institutional 2 Class | (6,066) | (24,304) |
| Institutional 3 Class | (3) | (36) |
| Class K | — | (31) |
| Class R | — | (29,257) |
| Class T | — | (11,021,316) |
| Net realized gains | | |
| Class A | (8,895,348) | (1,740,349) |
| Advisor Class | (1,203,519) | (103,975) |
| Class C | (7,552,721) | (773,591) |
| Institutional Class | (163,838,026) | (639,198) |
| Institutional 2 Class | (1,130,495) | (17,090) |
| Institutional 3 Class | (191) | (24) |
| Class K | (210) | (26) |
| Class R | (39,437) | (35,333) |
| Class T | (92,603) | (10,080,281) |
| Total distributions to shareholders | (183,876,325) | (27,628,170) |
| Increase in net assets from capital stock activity | 1,034,957,346 | 1,305,414,282 |
| Total increase in net assets | 1,028,156,274 | 1,409,359,932 |
| Net assets at beginning of year | 2,033,860,929 | 624,500,997 |
| Net assets at end of year | $3,062,017,203 | $2,033,860,929 |
| Undistributed net investment income | $9,629,336 | $812,549 |
The accompanying Notes to Financial Statements are an integral part of this statement.
| 18 | Columbia Adaptive Risk Allocation Fund | Annual Report 2018 |
Statement of Changes in Net Assets (continued)
| | Year Ended | Year Ended |
| | May 31, 2018 | May 31, 2017 |
| | Shares | Dollars ($) | Shares | Dollars ($) |
| Capital stock activity |
| Class A | | | | |
| Subscriptions | 4,912,496 | 53,563,688 | 11,356,840 | 118,267,708 |
| Distributions reinvested | 773,391 | 8,244,346 | 351,985 | 3,569,124 |
| Redemptions | (2,687,685) | (29,194,559) | (16,421,262) | (171,054,994) |
| Net increase (decrease) | 2,998,202 | 32,613,475 | (4,712,437) | (49,218,162) |
| Advisor Class | | | | |
| Subscriptions | 964,721 | 10,638,403 | 892,526 | 9,419,772 |
| Distributions reinvested | 112,696 | 1,211,477 | 24,038 | 245,186 |
| Redemptions | (327,614) | (3,599,053) | (937,711) | (9,739,345) |
| Net increase (decrease) | 749,803 | 8,250,827 | (21,147) | (74,387) |
| Class C | | | | |
| Subscriptions | 3,198,244 | 33,801,436 | 4,272,792 | 43,520,811 |
| Distributions reinvested | 721,596 | 7,439,655 | 101,737 | 1,007,198 |
| Redemptions | (2,449,521) | (25,859,757) | (1,645,970) | (16,768,855) |
| Net increase | 1,470,319 | 15,381,334 | 2,728,559 | 27,759,154 |
| Institutional Class | | | | |
| Subscriptions | 110,535,679 | 1,216,036,759 | 173,506,980 | 1,846,743,172 |
| Distributions reinvested | 15,023,303 | 161,500,512 | 119,523 | 1,219,132 |
| Redemptions | (36,469,971) | (400,677,174) | (10,189,919) | (108,433,001) |
| Net increase | 89,089,011 | 976,860,097 | 163,436,584 | 1,739,529,303 |
| Institutional 2 Class | | | | |
| Subscriptions | 1,178,095 | 12,995,199 | 605,341 | 6,457,550 |
| Distributions reinvested | 105,511 | 1,136,351 | 4,044 | 41,332 |
| Redemptions | (473,540) | (5,164,584) | (113,835) | (1,185,895) |
| Net increase | 810,066 | 8,966,966 | 495,550 | 5,312,987 |
| Class K | | | | |
| Redemptions | (270) | (2,915) | — | — |
| Net decrease | (270) | (2,915) | — | — |
| Class R | | | | |
| Subscriptions | 21,129 | 226,116 | 586,829 | 5,986,038 |
| Distributions reinvested | 3,718 | 39,227 | 6,409 | 64,542 |
| Redemptions | (543,330) | (6,029,844) | (130,982) | (1,348,548) |
| Net increase (decrease) | (518,483) | (5,764,501) | 462,256 | 4,702,032 |
| Class T | | | | |
| Subscriptions | 32,740 | 355,304 | 101,125,247 | 1,048,428,796 |
| Distributions reinvested | 8,659 | 92,394 | 2,076,923 | 21,101,542 |
| Redemptions | (164,447) | (1,795,635) | (141,258,260) | (1,492,126,983) |
| Net decrease | (123,048) | (1,347,937) | (38,056,090) | (422,596,645) |
| Total net increase | 94,475,600 | 1,034,957,346 | 124,333,275 | 1,305,414,282 |
The accompanying Notes to Financial Statements are an integral part of this statement.
Columbia Adaptive Risk Allocation Fund | Annual Report 2018
| 19 |
The following table is intended to help you understand the Fund’s financial performance. Certain information reflects financial results for a single share of a class held for the periods shown. Per share net investment income (loss) amounts are calculated based on average shares outstanding during the period. Total return assumes reinvestment of all dividends and distributions, if any. Total return does not reflect payment of sales charges, if any. Total return and portfolio turnover are not annualized for periods of less than one year. The portfolio turnover rate is calculated without regard to purchase and sales transactions of short-term instruments and certain derivatives, if any. If such transactions were included, the Fund’s portfolio turnover rate may be higher.
| | Net asset value,
beginning of
period | Net
investment
income
(loss) | Net
realized
and
unrealized
gain (loss) | Increase
from payment
by affiliate | Total from
investment
operations | Distributions
from net
investment
income | Distributions
from net
realized
gains | Total
distributions to
shareholders |
| Class A |
| Year Ended 5/31/2018 | $10.83 | 0.04 | 0.72 | — | 0.76 | — | (0.78) | (0.78) |
| Year Ended 5/31/2017 | $10.01 | (0.01) | 1.03 | 0.00 (d) | 1.02 | (0.10) | (0.10) | (0.20) |
| Year Ended 5/31/2016 | $10.17 | (0.03) | (0.03) (f) | — | (0.06) | — | (0.10) | (0.10) |
| Year Ended 5/31/2015 | $10.24 | (0.04) | 0.14 | 0.01 | 0.11 | (0.00) (d) | (0.18) | (0.18) |
| Year Ended 5/31/2014 | $10.06 | 0.01 | 0.65 | — | 0.66 | — | (0.48) | (0.48) |
| Advisor Class |
| Year Ended 5/31/2018 | $10.92 | 0.07 | 0.71 | — | 0.78 | (0.00) (d) | (0.78) | (0.78) |
| Year Ended 5/31/2017 | $10.08 | 0.02 | 1.05 | 0.00 (d) | 1.07 | (0.13) | (0.10) | (0.23) |
| Year Ended 5/31/2016 | $10.21 | (0.01) | (0.02) (f) | — | (0.03) | — | (0.10) | (0.10) |
| Year Ended 5/31/2015(h) | $10.13 | (0.02) | 0.31 | — | 0.29 | (0.03) | (0.18) | (0.21) |
| Class C |
| Year Ended 5/31/2018 | $10.55 | (0.04) | 0.69 | — | 0.65 | — | (0.78) | (0.78) |
| Year Ended 5/31/2017 | $9.75 | (0.08) | 1.01 | 0.00 (d) | 0.93 | (0.03) | (0.10) | (0.13) |
| Year Ended 5/31/2016 | $9.98 | (0.10) | (0.03) (f) | — | (0.13) | — | (0.10) | (0.10) |
| Year Ended 5/31/2015 | $10.11 | (0.11) | 0.15 | 0.01 | 0.05 | — | (0.18) | (0.18) |
| Year Ended 5/31/2014 | $10.03 | (0.06) | 0.62 | — | 0.56 | — | (0.48) | (0.48) |
| Institutional Class |
| Year Ended 5/31/2018 | $10.91 | 0.06 | 0.72 | — | 0.78 | (0.00) (d) | (0.78) | (0.78) |
| Year Ended 5/31/2017 | $10.08 | 0.05 | 1.01 | 0.00 (d) | 1.06 | (0.13) | (0.10) | (0.23) |
| Year Ended 5/31/2016 | $10.21 | (0.01) | (0.02) (f) | — | (0.03) | — | (0.10) | (0.10) |
| Year Ended 5/31/2015 | $10.28 | (0.02) | 0.15 | 0.01 | 0.14 | (0.03) | (0.18) | (0.21) |
| Year Ended 5/31/2014 | $10.07 | 0.04 | 0.65 | — | 0.69 | — | (0.48) | (0.48) |
| Institutional 2 Class |
| Year Ended 5/31/2018 | $10.93 | 0.06 | 0.72 | — | 0.78 | (0.00) (d) | (0.78) | (0.78) |
| Year Ended 5/31/2017 | $10.10 | 0.03 | 1.03 | 0.00 (d) | 1.06 | (0.13) | (0.10) | (0.23) |
| Year Ended 5/31/2016 | $10.22 | 0.00 (d) | (0.02) (f) | — | (0.02) | — | (0.10) | (0.10) |
| Year Ended 5/31/2015 | $10.29 | (0.01) | 0.15 | 0.01 | 0.15 | (0.04) | (0.18) | (0.22) |
| Year Ended 5/31/2014 | $10.07 | 0.07 | 0.63 | — | 0.70 | — | (0.48) | (0.48) |
The accompanying Notes to Financial Statements are an integral part of this statement.
| 20 | Columbia Adaptive Risk Allocation Fund | Annual Report 2018 |
Financial Highlights (continued)
| | Net
asset
value,
end of
period | Total
return | Total gross
expense
ratio to
average
net assets(a) | Total net
expense
ratio to
average
net assets(a),(b) | Net investment
income (loss)
ratio to
average
net assets | Portfolio
turnover | Net
assets,
end of
period
(000’s) |
| Class A |
| Year Ended 5/31/2018 | $10.81 | 7.07% | 0.99% | 0.99% (c) | 0.33% | 210% | $132,920 |
| Year Ended 5/31/2017 | $10.83 | 10.35% (e) | 0.99% | 0.99% (c) | (0.07%) | 396% | $100,790 |
| Year Ended 5/31/2016 | $10.01 | (0.55%) | 1.15% | 1.07% (c) | (0.32%) | 254% | $140,291 |
| Year Ended 5/31/2015 | $10.17 | 1.13% (g) | 1.23% | 1.06% | (0.35%) | 256% | $169,978 |
| Year Ended 5/31/2014 | $10.24 | 7.07% | 2.01% | 0.75% | 0.14% | 303% | $7,281 |
| Advisor Class |
| Year Ended 5/31/2018 | $10.92 | 7.26% | 0.74% | 0.74% (c) | 0.59% | 210% | $19,764 |
| Year Ended 5/31/2017 | $10.92 | 10.75% (e) | 0.74% | 0.74% (c) | 0.20% | 396% | $11,580 |
| Year Ended 5/31/2016 | $10.08 | (0.25%) | 0.90% | 0.82% (c) | (0.08%) | 254% | $10,908 |
| Year Ended 5/31/2015(h) | $10.21 | 2.87% | 0.99% (i) | 0.82% (i) | (0.30%) (i) | 256% | $11,110 |
| Class C |
| Year Ended 5/31/2018 | $10.42 | 6.19% | 1.74% | 1.74% (c) | (0.43%) | 210% | $109,335 |
| Year Ended 5/31/2017 | $10.55 | 9.59% (e) | 1.74% | 1.74% (c) | (0.77%) | 396% | $95,199 |
| Year Ended 5/31/2016 | $9.75 | (1.26%) | 1.90% | 1.82% (c) | (1.09%) | 254% | $61,386 |
| Year Ended 5/31/2015 | $9.98 | 0.48% (g) | 1.98% | 1.81% | (1.11%) | 256% | $52,406 |
| Year Ended 5/31/2014 | $10.11 | 6.07% | 2.76% | 1.50% | (0.65%) | 303% | $416 |
| Institutional Class |
| Year Ended 5/31/2018 | $10.91 | 7.26% | 0.74% | 0.74% (c) | 0.59% | 210% | $2,782,662 |
| Year Ended 5/31/2017 | $10.91 | 10.64% (e) | 0.73% | 0.73% (c) | 0.46% | 396% | $1,810,897 |
| Year Ended 5/31/2016 | $10.08 | (0.25%) | 0.90% | 0.82% (c) | (0.06%) | 254% | $25,871 |
| Year Ended 5/31/2015 | $10.21 | 1.37% (g) | 0.99% | 0.78% | (0.17%) | 256% | $21,494 |
| Year Ended 5/31/2014 | $10.28 | 7.37% | 1.76% | 0.50% | 0.41% | 303% | $6,470 |
| Institutional 2 Class |
| Year Ended 5/31/2018 | $10.93 | 7.24% | 0.75% | 0.75% | 0.57% | 210% | $16,033 |
| Year Ended 5/31/2017 | $10.93 | 10.69% (e) | 0.73% | 0.73% | 0.24% | 396% | $7,177 |
| Year Ended 5/31/2016 | $10.10 | (0.15%) | 0.79% | 0.73% | 0.03% | 254% | $1,628 |
| Year Ended 5/31/2015 | $10.22 | 1.48% (g) | 0.86% | 0.69% | (0.14%) | 256% | $1,647 |
| Year Ended 5/31/2014 | $10.29 | 7.47% | 1.54% | 0.38% | 0.68% | 303% | $26 |
The accompanying Notes to Financial Statements are an integral part of this statement.
Columbia Adaptive Risk Allocation Fund | Annual Report 2018
| 21 |
Financial Highlights (continued)
| | Net asset value,
beginning of
period | Net
investment
income
(loss) | Net
realized
and
unrealized
gain (loss) | Increase
from payment
by affiliate | Total from
investment
operations | Distributions
from net
investment
income | Distributions
from net
realized
gains | Total
distributions to
shareholders |
| Institutional 3 Class |
| Year Ended 5/31/2018 | $10.95 | 0.07 | 0.72 | — | 0.79 | (0.01) | (0.78) | (0.79) |
| Year Ended 5/31/2017 | $10.11 | 0.03 | 1.05 | 0.00 (d) | 1.08 | (0.14) | (0.10) | (0.24) |
| Year Ended 5/31/2016 | $10.23 | 0.00 (d) | (0.02) (f) | — | (0.02) | — | (0.10) | (0.10) |
| Year Ended 5/31/2015(j) | $10.15 | (0.02) | 0.32 | — | 0.30 | (0.04) | (0.18) | (0.22) |
| Class R |
| Year Ended 5/31/2018 | $10.75 | (0.01) | 0.73 | — | 0.72 | — | (0.78) | (0.78) |
| Year Ended 5/31/2017 | $9.93 | (0.03) | 1.03 | 0.00 (d) | 1.00 | (0.08) | (0.10) | (0.18) |
| Year Ended 5/31/2016 | $10.11 | (0.06) | (0.02) (f) | — | (0.08) | — | (0.10) | (0.10) |
| Year Ended 5/31/2015 | $10.20 | (0.08) | 0.16 | 0.01 | 0.09 | — | (0.18) | (0.18) |
| Year Ended 5/31/2014 | $10.05 | (0.01) | 0.64 | — | 0.63 | — | (0.48) | (0.48) |
| Class T |
| Year Ended 5/31/2018 | $10.85 | 0.03 | 0.72 | — | 0.75 | — | (0.78) | (0.78) |
| Year Ended 5/31/2017 | $10.02 | (0.02) | 1.05 | 0.00 (d) | 1.03 | (0.10) | (0.10) | (0.20) |
| Year Ended 5/31/2016 | $10.18 | (0.03) | (0.03) (f) | — | (0.06) | — | (0.10) | (0.10) |
| Year Ended 5/31/2015 | $10.25 | (0.04) | 0.14 | 0.01 | 0.11 | (0.00) (d) | (0.18) | (0.18) |
| Year Ended 5/31/2014 | $10.06 | 0.05 | 0.62 | — | 0.67 | — | (0.48) | (0.48) |
| Notes to Financial Highlights |
| (a) | In addition to the fees and expenses that the Fund bears directly, the Fund indirectly bears a pro rata share of the fees and expenses of any other funds in which it invests. Such indirect expenses are not included in the Fund’s reported expense ratios. |
| (b) | Total net expenses include the impact of certain fee waivers/expense reimbursements made by the Investment Manager and certain of its affiliates, if applicable. |
| (c) | The benefits derived from expense reductions had an impact of less than 0.01%. |
| (d) | Rounds to zero. |
| (e) | The Fund received a payment from an affiliate. Had the Fund not received this payment, the total return would have been lower by 0.02%. |
| (f) | Calculation of the net gain (loss) per share (both realized and unrealized) does not correlate to the aggregate realized and unrealized gain (loss) presented in the Statement of Operations due to the timing of subscriptions and redemptions of Fund shares in relation to fluctuations in the market value of the portfolio. |
| (g) | The Fund received a payment from an affiliate. Had the Fund not received this payment, the total return would have been lower by 0.07%. |
| (h) | Advisor Class shares commenced operations on October 1, 2014. Per share data and total return reflect activity from that date. |
| (i) | Annualized. |
| (j) | Institutional 3 Class shares commenced operations on October 1, 2014. Per share data and total return reflect activity from that date. |
The accompanying Notes to Financial Statements are an integral part of this statement.
| 22 | Columbia Adaptive Risk Allocation Fund | Annual Report 2018 |
Financial Highlights (continued)
| | Net
asset
value,
end of
period | Total
return | Total gross
expense
ratio to
average
net assets(a) | Total net
expense
ratio to
average
net assets(a),(b) | Net investment
income (loss)
ratio to
average
net assets | Portfolio
turnover | Net
assets,
end of
period
(000’s) |
| Institutional 3 Class |
| Year Ended 5/31/2018 | $10.95 | 7.29% | 0.69% | 0.69% | 0.65% | 210% | $3 |
| Year Ended 5/31/2017 | $10.95 | 10.85% (e) | 0.67% | 0.67% | 0.29% | 396% | $3 |
| Year Ended 5/31/2016 | $10.11 | (0.15%) | 0.76% | 0.69% | 0.02% | 254% | $2 |
| Year Ended 5/31/2015(j) | $10.23 | 2.98% | 0.85% (i) | 0.65% (i) | (0.28%) (i) | 256% | $3 |
| Class R |
| Year Ended 5/31/2018 | $10.69 | 6.75% | 1.25% | 1.25% (c) | (0.08%) | 210% | $325 |
| Year Ended 5/31/2017 | $10.75 | 10.15% (e) | 1.22% | 1.22% (c) | (0.25%) | 396% | $5,900 |
| Year Ended 5/31/2016 | $9.93 | (0.75%) | 1.38% | 1.34% (c) | (0.57%) | 254% | $861 |
| Year Ended 5/31/2015 | $10.11 | 0.87% (g) | 1.48% | 1.32% | (0.83%) | 256% | $146 |
| Year Ended 5/31/2014 | $10.20 | 6.77% | 2.26% | 1.00% | (0.14%) | 303% | $3 |
| Class T |
| Year Ended 5/31/2018 | $10.82 | 6.97% | 0.99% | 0.99% (c) | 0.28% | 210% | $975 |
| Year Ended 5/31/2017 | $10.85 | 10.43% (e) | 0.99% | 0.99% (c) | (0.17%) | 396% | $2,313 |
| Year Ended 5/31/2016 | $10.02 | (0.55%) | 1.14% | 1.08% | (0.31%) | 254% | $383,552 |
| Year Ended 5/31/2015 | $10.18 | 1.13% (g) | 1.25% | 0.96% | (0.37%) | 256% | $174,418 |
| Year Ended 5/31/2014 | $10.25 | 7.18% | 2.01% | 0.75% | 0.62% | 303% | $183,246 |
The accompanying Notes to Financial Statements are an integral part of this statement.
Columbia Adaptive Risk Allocation Fund | Annual Report 2018
| 23 |
Notes to Financial Statements
May 31, 2018
Note 1. Organization
Columbia Adaptive Risk Allocation Fund (the Fund), a series of Columbia Funds Series Trust I (the Trust), is a non-diversified fund. The Trust is registered under the Investment Company Act of 1940, as amended (the 1940 Act), as an open-end management investment company organized as a Massachusetts business trust.
The Fund invests significantly in Institutional 3 Class shares of affiliated funds managed by Columbia Management Investment Advisers, LLC (the Investment Manager), a wholly-owned subsidiary of Ameriprise Financial, Inc. (Ameriprise Financial), or its affiliates as well as third-party advised (unaffiliated) funds, including exchange-traded funds (collectively, Underlying Funds).
For information on the Underlying Funds, please refer to the Fund’s current prospectus and the prospectuses of the Underlying Funds, which are available, free of charge, from the Securities and Exchange Commission website at www.sec.gov.
Fund shares
The Trust may issue an unlimited number of shares (without par value). Although all share classes generally have identical voting, dividend and liquidation rights, each share class votes separately when required by the Trust’s organizational documents or by law. Different share classes pay different distribution amounts to the extent the expenses of such share classes differ, and distributions in liquidation will be proportional to the net asset value of each share class. Each share class has its own expense and sales charge structure. The Fund offers each of the share classes identified below.
Class A shares are subject to a maximum front-end sales charge of 5.75% based on the initial investment amount. Class A shares purchased without an initial sales charge in accounts aggregating $1 million to $50 million at the time of purchase are subject to a contingent deferred sales charge (CDSC) if the shares are sold within 18 months after purchase, charged as follows: 1.00% CDSC if redeemed within 12 months after purchase, and 0.50% CDSC if redeemed more than 12, but less than 18, months after purchase.
Advisor Class shares are not subject to sales charges and are generally available only to omnibus retirement plans and certain investors as described in the Fund’s prospectus. Prior to November 1, 2017, Advisor Class shares were known as Class R4 shares.
Class C shares are subject to a 1.00% CDSC on shares redeemed within 12 months after purchase.
Institutional Class shares are not subject to sales charges and are generally available only to eligible investors, which are subject to different investment minimums as described in the Fund’s prospectus. Prior to November 1, 2017, Institutional Class shares were known as Class Z shares.
Institutional 2 Class shares are not subject to sales charges and are generally available only to investors purchasing through authorized investment professionals and omnibus retirement plans as described in the Fund’s prospectus. Prior to November 1, 2017, Institutional 2 Class shares were known as Class R5 shares.
Institutional 3 Class shares are not subject to sales charges and are available to institutional and certain other investors as described in the Fund’s prospectus. Prior to November 1, 2017, Institutional 3 Class shares were known as Class Y shares.
The Fund no longer accepts investments by existing investors in Class K shares. When available, Class K shares were not subject to sales charges and were made available only to existing investors in Class K shares. On March 9, 2018, Class K shares were redeemed or exchanged for Advisor Class shares of the Fund in a tax free transaction that had no impact on fees and expenses paid by the shareholders.
Class R shares are not subject to sales charges and are generally available only to certain retirement plans and other investors as described in the Fund’s prospectus.
Class T shares are subject to a maximum front-end sales charge of 2.50% per transaction and must be purchased through financial intermediaries that, by written agreement with Columbia Management Investment Distributors, Inc., are specifically authorized to sell Class T shares.
| 24 | Columbia Adaptive Risk Allocation Fund | Annual Report 2018 |
Notes to Financial Statements (continued)
May 31, 2018
Note 2. Summary of significant accounting policies
Basis of preparation
The Fund is an investment company that applies the accounting and reporting guidance in the Financial Accounting Standards Board (FASB) Accounting Standards Codification Topic 946, Financial Services - Investment Companies (ASC 946). The financial statements are prepared in accordance with U.S. generally accepted accounting principles (GAAP), which requires management to make certain estimates and assumptions that affect the reported amounts of assets and liabilities, the disclosure of contingent assets and liabilities at the date of the financial statements and the reported amounts of income and expenses during the reporting period. Actual results could differ from those estimates.
The following is a summary of significant accounting policies followed by the Fund in the preparation of its financial statements.
Security valuation
All equity securities and exchange-traded funds are valued at the close of business of the New York Stock Exchange. Equity securities and exchange-traded funds are valued at the last quoted sales price on the principal exchange or market on which they trade, except for securities traded on the NASDAQ Stock Market, which are valued at the NASDAQ official close price. Unlisted securities or listed securities for which there were no sales during the day are valued at the mean of the latest quoted bid and ask prices on such exchanges or markets.
Debt securities generally are valued by pricing services approved by the Board of Trustees based upon market transactions for normal, institutional-size trading units of similar securities. The services may use various pricing techniques that take into account, as applicable, factors such as yield, quality, coupon rate, maturity, type of issue, trading characteristics and other data, as well as approved independent broker-dealer quotes. Debt securities for which quotations are not readily available or not believed to be reflective of market value may also be valued based upon a bid quote from an approved independent broker-dealer. Debt securities maturing in 60 days or less are valued primarily at amortized cost value, unless this method results in a valuation that management believes does not approximate market value.
Asset- and mortgage-backed securities are generally valued by pricing services, which utilize pricing models that incorporate the securities’ cash flow and loan performance data. These models also take into account available market data, including trades, market quotations, and benchmark yield curves for identical or similar securities. Factors used to identify similar securities may include, but are not limited to, issuer, collateral type, vintage, prepayment speeds, collateral performance, credit ratings, credit enhancement and expected life. Asset-backed securities for which quotations are readily available may also be valued based upon an over-the-counter or exchange bid quote from an approved independent broker-dealer.
Investments in the Underlying Funds, with the exception of exchange-traded funds, are valued at the net asset value of the applicable class of the Underlying Fund determined as of the close of the New York Stock Exchange on the valuation date.
Forward foreign currency exchange contracts are marked-to-market based upon foreign currency exchange rates provided by a pricing service.
Futures and options on futures contracts are valued based upon the settlement price at the close of regular trading on their principal exchanges or, in the absence of transactions, at the mean of the latest quoted bid and ask prices.
Swap transactions are valued through an independent pricing service or broker, or if neither is available, through an internal model based upon observable inputs.
Investments for which market quotations are not readily available, or that have quotations which management believes are not reflective of market value or reliable, are valued at fair value as determined in good faith under procedures approved by and under the general supervision of the Board of Trustees. If a security or class of securities (such as foreign securities) is valued at fair value, such value is likely to be different from the quoted or published price for the security.
Columbia Adaptive Risk Allocation Fund | Annual Report 2018
| 25 |
Notes to Financial Statements (continued)
May 31, 2018
The determination of fair value often requires significant judgment. To determine fair value, management may use assumptions including but not limited to future cash flows and estimated risk premiums. Multiple inputs from various sources may be used to determine fair value.
GAAP requires disclosure regarding the inputs and valuation techniques used to measure fair value and any changes in valuation inputs or techniques. In addition, investments shall be disclosed by major category. This information is disclosed following the Fund’s Portfolio of Investments.
Foreign currency transactions and translations
The values of all assets and liabilities denominated in foreign currencies are generally translated into U.S. dollars at exchange rates determined at the close of regular trading on the New York Stock Exchange. Net realized and unrealized gains (losses) on foreign currency transactions and translations include gains (losses) arising from the fluctuation in exchange rates between trade and settlement dates on securities transactions, gains (losses) arising from the disposition of foreign currency and currency gains (losses) between the accrual and payment dates on dividends, interest income and foreign withholding taxes.
For financial statement purposes, the Fund does not distinguish that portion of gains (losses) on investments which is due to changes in foreign exchange rates from that which is due to changes in market prices of the investments. Such fluctuations are included with the net realized and unrealized gains (losses) on investments in the Statement of Operations.
Derivative instruments
The Fund invests in certain derivative instruments, as detailed below, to meet its investment objectives. Derivatives are instruments whose values depend on, or are derived from, in whole or in part, the value of one or more securities, currencies, commodities, indices, or other assets or instruments. Derivatives may be used to increase investment flexibility (including to maintain cash reserves while maintaining desired exposure to certain assets), for risk management (hedging) purposes, to facilitate trading, to reduce transaction costs and to pursue higher investment returns. The Fund may also use derivative instruments to mitigate certain investment risks, such as foreign currency exchange rate risk, interest rate risk and credit risk. Derivatives may involve various risks, including the potential inability of the counterparty to fulfill its obligations under the terms of the contract, the potential for an illiquid secondary market (making it difficult for the Fund to sell or terminate, including at favorable prices) and the potential for market movements which may expose the Fund to gains or losses in excess of the amount shown in the Statement of Assets and Liabilities. The notional amounts of derivative instruments, if applicable, are not recorded in the financial statements.
A derivative instrument may suffer a marked-to-market loss if the value of the contract decreases due to an unfavorable change in the market rates or values of the underlying instrument. Losses can also occur if the counterparty does not perform its obligations under the contract. The Fund’s risk of loss from counterparty credit risk on over-the-counter derivatives is generally limited to the aggregate unrealized gain netted against any collateral held by the Fund and the amount of any variation margin held by the counterparty, plus any replacement costs or related amounts. With exchange-traded or centrally cleared derivatives, there is reduced counterparty credit risk to the Fund since the clearinghouse or central counterparty (CCP) provides some protection in the case of clearing member default. The clearinghouse or CCP stands between the buyer and the seller of the contract; therefore, additional counterparty credit risk is failure of the clearinghouse or CCP. However, credit risk still exists in exchange-traded or centrally cleared derivatives with respect to initial and variation margin that is held in a broker’s customer account. While brokers are required to segregate customer margin from their own assets, in the event that a broker becomes insolvent or goes into bankruptcy and at that time there is a shortfall in the aggregate amount of margin held by the broker for all its clients, U.S. bankruptcy laws will typically allocate that shortfall on a pro-rata basis across all the broker’s customers (including the Fund), potentially resulting in losses to the Fund.
In order to better define its contractual rights and to secure rights that will help the Fund mitigate its counterparty risk, the Fund may enter into an International Swaps and Derivatives Association, Inc. Master Agreement (ISDA Master Agreement) or similar agreement with its derivatives contract counterparties. An ISDA Master Agreement is an agreement between the Fund and a counterparty that governs over-the-counter derivatives and typically contains, among other things, collateral posting terms and netting provisions in the event of a default and/or termination event. Under an ISDA Master Agreement, the Fund may, under certain circumstances, offset with the counterparty certain derivative instrument’s payables and/or receivables
| 26 | Columbia Adaptive Risk Allocation Fund | Annual Report 2018 |
Notes to Financial Statements (continued)
May 31, 2018
with collateral held and/or posted and create one single net payment. The provisions of the ISDA Master Agreement typically permit a single net payment in the event of default (close-out netting), including the bankruptcy or insolvency of the counterparty. Note, however, that bankruptcy or insolvency laws of a particular jurisdiction may impose restrictions on or prohibitions against the right of offset or netting in bankruptcy, insolvency or other events.
Collateral (margin) requirements differ by type of derivative. Margin requirements are established by the clearinghouse or CCP for exchange-traded and centrally cleared derivatives. Brokers can ask for margin in excess of the minimum in certain circumstances. Collateral terms are contract specific for over-the-counter derivatives. For over-the-counter derivatives traded under an ISDA Master Agreement, the collateral requirements are typically calculated by netting the marked-to-market amount for each transaction under such agreement and comparing that amount to the value of any variation margin currently pledged by the Fund and/or the counterparty. Generally, the amount of collateral due from or to a party has to exceed a minimum transfer amount threshold (e.g., $250,000) before a transfer has to be made. To the extent amounts due to the Fund from its counterparties are not fully collateralized, contractually or otherwise, the Fund bears the risk of loss from counterparty nonperformance. The Fund may also pay interest expense on cash collateral received from the broker. Any interest expense paid by the Fund is shown on the Statement of Operations. The Fund attempts to mitigate counterparty risk by only entering into agreements with counterparties that it believes have the financial resources to honor their obligations and by monitoring the financial stability of those counterparties.
Certain ISDA Master Agreements allow counterparties of over-the-counter derivatives transactions to terminate derivatives contracts prior to maturity in the event the Fund’s net asset value declines by a stated percentage over a specified time period or if the Fund fails to meet certain terms of the ISDA Master Agreement, which would cause the Fund to accelerate payment of any net liability owed to the counterparty. The Fund also has termination rights if the counterparty fails to meet certain terms of the ISDA Master Agreement. In addition to considering counterparty credit risk, the Fund would consider terminating the derivatives contracts based on whether termination would result in a net liability owed from the counterparty.
For financial reporting purposes, the Fund does not offset derivative assets and derivative liabilities that are subject to netting arrangements in the Statement of Assets and Liabilities.
Forward foreign currency exchange contracts
Forward foreign currency exchange contracts are over-the-counter agreements between two parties to buy and sell a currency at a set price on a future date. The Fund utilized forward foreign currency exchange contracts to hedge the currency exposure associated with some or all of the Fund’s securities, to shift foreign currency exposure back to U.S. dollars, to shift U.S. dollar exposure to achieve a representative weighted mix of major currencies in its benchmark, to recover an underweight country exposure in its portfolio or to generate total return through long and short positions versus the U.S. dollar. These instruments may be used for other purposes in future periods.
The values of forward foreign currency exchange contracts fluctuate daily with changes in foreign currency exchange rates. Changes in the value of these contracts are recorded as unrealized appreciation or depreciation until the contract is exercised or has expired. The Fund will realize a gain or loss when the forward foreign currency exchange contract is closed or expires.
The use of forward foreign currency exchange contracts does not eliminate fluctuations in the prices of the Fund’s portfolio securities. The risks of forward foreign currency exchange contracts include movement in the values of the foreign currencies relative to the U.S. dollar (or other foreign currencies) and the possibility that counterparties will not complete their contractual obligations, which may be in excess of the amount reflected, if any, in the Statement of Assets and Liabilities.
Futures contracts
Futures contracts are exchange-traded and represent commitments for the future purchase or sale of an asset at a specified price on a specified date. The Fund bought and sold futures contracts to manage the duration and yield curve exposure of the Fund versus the benchmark, to manage exposure to movements in interest rates, to manage exposure to the securities market and to maintain appropriate equity market exposure while keeping sufficient cash to accommodate daily redemptions. These instruments may be used for other purposes in future periods. Upon entering into futures contracts, the Fund bears
Columbia Adaptive Risk Allocation Fund | Annual Report 2018
| 27 |
Notes to Financial Statements (continued)
May 31, 2018
risks that it may not achieve the anticipated benefits of the futures contracts and may realize a loss. Additional risks include counterparty credit risk, the possibility of an illiquid market, and that a change in the value of the contract or option may not correlate with changes in the value of the underlying asset.
Upon entering into a futures contract, the Fund deposits cash or securities with the broker, known as a futures commission merchant (FCM), in an amount sufficient to meet the initial margin requirement. The initial margin deposit must be maintained at an established level over the life of the contract. Cash deposited as initial margin is recorded in the Statement of Assets and Liabilities as margin deposits. Securities deposited as initial margin are designated in the Portfolio of Investments. Subsequent payments (variation margin) are made or received by the Fund each day. The variation margin payments are equal to the daily change in the contract value and are recorded as variation margin receivable or payable and are offset in unrealized gains or losses. The Fund recognizes a realized gain or loss when the contract is closed or expires. Futures contracts involve, to varying degrees, risk of loss in excess of the variation margin disclosed in the Statement of Assets and Liabilities.
Swap contracts
Swap contracts are negotiated in the over-the-counter market and may be entered into as a bilateral contract or centrally cleared (centrally cleared swap contract). In a centrally cleared swap contract, immediately following execution of the swap contract with a broker, the swap contract is novated to a central counterparty (the CCP) and the CCP becomes the Fund’s counterparty to the centrally cleared swap contract. The Fund is required to deposit initial margin with the futures commission merchant (FCM), which pledges it through to the CCP in the form of cash or securities in an amount that varies depending on the size and risk profile of the particular swap contract. Securities deposited as initial margin are designated in the Portfolio of Investments and cash deposited is recorded in the Statement of Assets and Liabilities as margin deposits. Unlike a bilateral swap contract, for centrally cleared swap contracts, the Fund has minimal credit exposure to the FCM because the CCP stands between the Fund and the relevant buyer/seller on the other side of the contract. Swap contracts are marked-to-market daily and changes in value are recorded as unrealized appreciation (depreciation). The daily change in valuation of centrally cleared swap contracts, if any, is recorded as a receivable or payable for variation margin in the Statement of Assets and Liabilities.
Entering into these contracts involves, to varying degrees, elements of interest, liquidity and counterparty credit risk in excess of the amounts recognized in the Statement of Assets and Liabilities. Such risks involve the possibility that there may be unfavorable changes in interest rates, market conditions or other conditions, that it may be difficult to initiate a swap transaction or liquidate a position at an advantageous time or price which may result in significant losses, and that the FCM or CCP may not fulfill its obligation under the contract.
Credit default swap contracts
The Fund entered into credit default swap contracts to increase or decrease its credit exposure to an index and to manage credit risk exposure. These instruments may be used for other purposes in future periods. Credit default swap contracts are agreements in which one party pays fixed periodic payments to a counterparty in consideration for an agreement from the counterparty to make a specific payment should a specified credit event(s) take place. Although specified credit events are contract specific, credit events are generally defined as bankruptcy, failure to pay, restructuring, obligation acceleration, obligation default, or repudiation/moratorium.
As the purchaser of a credit default swap contract, the Fund purchases protection by paying a periodic interest rate on the notional amount to the counterparty. The interest amount is accrued daily as a component of unrealized appreciation (depreciation) and is recorded as a realized loss upon payment. If a credit event as specified in the contract occurs, the Fund may have the option either to deliver the reference obligation to the seller in exchange for a cash payment of its par amount, or to receive a net cash settlement equal to the par amount less an agreed-upon value of the reference obligation as of the date of the credit event. The difference between the value of the obligation or cash delivered and the notional amount received will be recorded as a realized gain (loss).
As the seller of a credit default swap contract, the Fund sells protection to a buyer and will generally receive a periodic interest rate on a notional amount. The interest amount is accrued daily as a component of unrealized appreciation (depreciation) and is recorded as a realized gain upon receipt of the payment. If a credit event as specified in the contract
| 28 | Columbia Adaptive Risk Allocation Fund | Annual Report 2018 |
Notes to Financial Statements (continued)
May 31, 2018
with the counterparty occurs, the Fund may either be required to accept the reference obligation from the buyer in exchange for a cash payment of its notional amount, or to pay the buyer a net cash settlement equal to the notional amount less an agreed-upon value of the reference obligation (recovery value) as of the date of the credit event. The difference between the value of the obligation or cash received and the notional amount paid will be recorded as a realized gain (loss). The maximum potential amount of undiscounted future payments the Fund could be required to make as the seller of protection under a credit default swap contract is equal to the notional amount of the reference obligation. These potential amounts may be partially offset by any recovery values of the respective reference obligations or upfront receipts upon entering into the agreement. The notional amounts and market values of all credit default swap contracts in which the Fund is the seller of protection, if any, are disclosed in the Credit Default Swap Contracts Outstanding schedule following the Portfolio of Investments.
As a protection seller, the Fund bears the risk of loss from the credit events specified in the contract with the counterparty. For credit default swap contracts on credit indices, quoted market prices and resulting market values serve as an indicator of the current status of the payment/performance risk. Increasing market values, in absolute terms when compared to the notional amount of the swap, represent a deterioration of the reference entity’s credit soundness and a greater likelihood or risk of default or other credit event occurring as defined under the terms of the contract.
Any upfront payments or receipts by the Fund upon entering into a credit default swap contract is recorded as an asset or liability, respectively, and amortized daily as a component of realized gain (loss) in the Statement of Operations. Credit default swap contracts are valued daily, and the change in value is recorded as unrealized appreciation (depreciation) until the termination of the swap, at which time a realized gain (loss) is recorded.
Credit default swap contracts can involve greater risks than if a fund had invested in the reference obligation directly since, in addition to general market risks, credit default swaps are subject to counterparty credit risk, leverage risk, hedging risk, correlation risk and liquidity risk.
Effects of derivative transactions in the financial statements
The following tables are intended to provide additional information about the effect of derivatives on the financial statements of the Fund, including: the fair value of derivatives by risk category and the location of those fair values in the Statement of Assets and Liabilities; and the impact of derivative transactions over the period in the Statement of Operations, including realized and unrealized gains (losses). The derivative instrument schedules following the Portfolio of Investments present additional information regarding derivative instruments outstanding at the end of the period, if any.
The following table is a summary of the fair value of derivative instruments (not considered to be hedging instruments for accounting disclosure purposes) at May 31, 2018:
| | Asset derivatives | |
Risk exposure
category | Statement
of assets and liabilities
location | Fair value ($) |
| Credit risk | Net assets — unrealized appreciation on swap contracts | 4,238,714 |
| Equity risk | Net assets — unrealized appreciation on futures contracts | 4,199,976 |
| Foreign exchange risk | Unrealized appreciation on forward foreign currency exchange contracts | 16,125,047 |
| Interest rate risk | Net assets — unrealized appreciation on futures contracts | 6,796,311 |
| Total | | 31,360,048 |
Columbia Adaptive Risk Allocation Fund | Annual Report 2018
| 29 |
Notes to Financial Statements (continued)
May 31, 2018
| | Liability derivatives | |
Risk exposure
category | Statement
of assets and liabilities
location | Fair value ($) |
| Credit risk | Net assets — unrealized depreciation on swap contracts | 2,415,931 |
| Credit risk | Upfront receipts on swap contracts | 7,161,850 |
| Equity risk | Net assets — unrealized depreciation on futures contracts | 36,106,108 |
| Foreign exchange risk | Unrealized depreciation on forward foreign currency exchange contracts | 5,422,282 |
| Interest rate risk | Net assets — unrealized depreciation on futures contracts | 475,220 |
| Total | | 51,581,391 |
The following table indicates the effect of derivative instruments (not considered to be hedging instruments for accounting disclosure purposes) in the Statement of Operations for the year ended May 31, 2018:
| Amount of realized gain (loss) on derivatives recognized in income |
| Risk exposure category | | | Forward
foreign
currency
exchange
contracts
($) | Futures
contracts
($) | Swap
contracts
($) | Total
($) |
| Credit risk | | | — | — | 21,280,767 | 21,280,767 |
| Equity risk | | | — | 169,320,641 | — | 169,320,641 |
| Foreign exchange risk | | | (17,329,564) | — | — | (17,329,564) |
| Interest rate risk | | | — | (9,618,314) | — | (9,618,314) |
| Total | | | (17,329,564) | 159,702,327 | 21,280,767 | 163,653,530 |
| |
| Change in unrealized appreciation (depreciation) on derivatives recognized in income |
| Risk exposure category | | | Forward
foreign
currency
exchange
contracts
($) | Futures
contracts
($) | Swap
contracts
($) | Total
($) |
| Credit risk | | | — | — | (2,061,417) | (2,061,417) |
| Equity risk | | | — | (41,233,013) | — | (41,233,013) |
| Foreign exchange risk | | | 24,564,239 | — | — | 24,564,239 |
| Interest rate risk | | | — | 368,434 | — | 368,434 |
| Total | | | 24,564,239 | (40,864,579) | (2,061,417) | (18,361,757) |
The following table is a summary of the average outstanding volume by derivative instrument for the year ended May 31, 2018:
| Derivative instrument | Average notional
amounts ($)* |
| Futures contracts — long | 1,910,066,367 |
| Futures contracts — short | 137,692,709 |
| Credit default swap contracts — sell protection | 803,968,828 |
| Derivative instrument | Average unrealized
appreciation ($)* | Average unrealized
depreciation ($)* |
| Forward foreign currency exchange contracts | 8,485,735 | (6,256,375) |
| * | Based on the ending quarterly outstanding amounts for the year ended May 31, 2018. |
| 30 | Columbia Adaptive Risk Allocation Fund | Annual Report 2018 |
Notes to Financial Statements (continued)
May 31, 2018
Asset- and mortgage-backed securities
The Fund may invest in asset-backed and mortgage-backed securities. The maturity dates shown represent the original maturity of the underlying obligation. Actual maturity may vary based upon prepayment activity on these obligations. All, or a portion, of the obligation may be prepaid at any time because the underlying asset may be prepaid. As a result, decreasing market interest rates could result in an increased level of prepayment. An increased prepayment rate will have the effect of shortening the maturity of the security. Unless otherwise noted, the coupon rates presented are fixed rates.
Delayed delivery securities
The Fund may trade securities on other than normal settlement terms, including securities purchased or sold on a “when-issued” or "forward commitment" basis. This may increase risk to the Fund since the other party to the transaction may fail to deliver, which could cause the Fund to subsequently invest at less advantageous prices. The Fund designates cash or liquid securities in an amount equal to the delayed delivery commitment.
To be announced securities
The Fund may trade securities on a To Be Announced (TBA) basis. As with other delayed-delivery transactions, a seller agrees to issue a TBA security at a future date. However, the seller does not specify the particular securities to be delivered. Instead, the Fund agrees to accept any security that meets specified terms.
In some cases, Master Securities Forward Transaction Agreements (MSFTAs) may be used to govern transactions of certain forward-settling agency mortgage-backed securities, such as delayed-delivery and TBAs, between the Fund and counterparty. The MSFTA maintains provisions for, among other things, initiation and confirmation, payment and transfer, events of default, termination, and maintenance of collateral relating to such transactions.
Mortgage dollar roll transactions
The Fund may enter into mortgage “dollar rolls” in which the Fund sells securities for delivery in the current month and simultaneously contracts with the same counterparty to repurchase similar but not identical securities (same type, coupon and maturity) on a specified future date. During the roll period, the Fund loses the right to receive principal and interest paid on the securities sold. However, the Fund will benefit because it receives negotiated amounts in the form of reductions of the purchase price for the future purchase plus the interest earned on the cash proceeds of the securities sold until the settlement date of the forward purchase. The Fund records the incremental difference between the forward purchase and sale of each forward roll as a realized gain or loss. Unless any realized gains exceed the income, capital appreciation, and gain or loss due to mortgage prepayments that would have been realized on the securities sold as part of the mortgage dollar roll, the use of this technique will diminish the investment performance of the Fund compared to what the performance would have been without the use of mortgage dollar rolls. All cash proceeds will be invested in instruments that are permissible investments for the Fund. The Fund identifies cash or liquid securities in an amount equal to the forward purchase price.
For financial reporting and tax purposes, the Fund treats “to be announced” mortgage dollar rolls as two separate transactions, one involving the purchase of a security and a separate transaction involving a sale. These transactions may increase the Fund’s portfolio turnover rate. The Fund does not currently enter into mortgage dollar rolls that are accounted for as financing transactions.
Mortgage dollar rolls involve the risk that the market value of the securities the Fund is obligated to repurchase may decline below the repurchase price, or that the counterparty may default on its obligations.
Treasury inflation protected securities
The Fund may invest in treasury inflation protected securities (TIPS). The principal amount of TIPS is adjusted periodically and is increased for inflation or decreased for deflation based on a monthly published index. These adjustments are recorded as interest income in the Statement of Operations. Coupon payments are based on the adjusted principal at the time the interest is paid.
Columbia Adaptive Risk Allocation Fund | Annual Report 2018
| 31 |
Notes to Financial Statements (continued)
May 31, 2018
Offsetting of assets and liabilities
The following table presents the Fund’s gross and net amount of assets and liabilities available for offset under netting arrangements as well as any related collateral received or pledged by the Fund as of May 31, 2018:
| | Citi ($) | HSBC ($) | Morgan
Stanley ($)(a) | Morgan
Stanley ($)(a) | Total ($) |
| Assets | | | | | |
| Centrally cleared credit default swap contracts (b) | - | - | - | 10,477,517 | 10,477,517 |
| Forward foreign currency exchange contracts | - | 1,192,334 | 14,932,713 | | 16,125,047 |
| Total assets | - | 1,192,334 | 14,932,713 | 10,477,517 | 26,602,564 |
| Liabilities | | | | | |
| Forward foreign currency exchange contracts | - | 1,519,333 | 3,902,949 | | 5,422,282 |
| OTC credit default swap contracts (c) | 9,562,977 | - | - | - | 9,562,977 |
| Total liabilities | 9,562,977 | 1,519,333 | 3,902,949 | - | 14,985,259 |
| Total financial and derivative net assets | (9,562,977) | (326,999) | 11,029,764 | 10,477,517 | 11,617,305 |
| Total collateral received (pledged) (d) | (4,948,000) | - | - | - | (4,948,000) |
| Net amount (e) | (4,614,977) | (326,999) | 11,029,764 | 10,477,517 | 16,565,305 |
| (a) | Exposure can only be netted across transactions governed under the same master agreement with the same legal entity. |
| (b) | Centrally cleared swaps are included within payable/receivable for variation margin on the Statement of Assets and Liabilities. |
| (c) | Over-the-Counter (OTC) swap contracts are presented at market value plus periodic payments receivable (payable), which is comprised of unrealized appreciation, unrealized depreciation, upfront payments and upfront receipts. |
| (d) | In some instances, the actual collateral received and/or pledged may be more than the amount shown due to overcollateralization. |
| (e) | Represents the net amount due from/(to) counterparties in the event of default. |
Security transactions
Security transactions are accounted for on the trade date. Cost is determined and gains (losses) are based upon the specific identification method for both financial statement and federal income tax purposes.
Income recognition
Interest income is recorded on an accrual basis. Market premiums and discounts, including original issue discounts, are amortized and accreted, respectively, over the expected life of the security on all debt securities, unless otherwise noted. The Fund classifies gains and losses realized on prepayments received on mortgage-backed securities as adjustments to interest income.
The Fund may place a debt security on non-accrual status and reduce related interest income when it becomes probable that the interest will not be collected and the amount of uncollectible interest can be reasonably estimated. A defaulted debt security is removed from non-accrual status when the issuer resumes interest payments or when collectibility of interest is reasonably assured.
The Fund may receive distributions from holdings in equity securities, business development companies (BDCs), exchange-traded funds (ETFs), limited partnerships (LPs), other regulated investment companies (RICs), and real estate investment trusts (REITs), which report information on the tax character of their distributions annually. These distributions are allocated to dividend income, capital gain and return of capital based on actual information reported. Return of capital is recorded as a reduction of the cost basis of securities held. If the Fund no longer owns the applicable securities, return of capital is recorded as a realized gain. With respect to REITs, to the extent actual information has not yet been reported, estimates for return of capital are made by the Fund’s management. Management’s estimates are subsequently adjusted when the actual character of the distributions is disclosed by the REITs, which could result in a proportionate change in return of capital to shareholders.
Income and capital gain distributions from the Underlying Funds, if any, are recorded on the ex-dividend date.
| 32 | Columbia Adaptive Risk Allocation Fund | Annual Report 2018 |
Notes to Financial Statements (continued)
May 31, 2018
Expenses
General expenses of the Trust are allocated to the Fund and other funds of the Trust based upon relative net assets or other expense allocation methodologies determined by the nature of the expense. Expenses directly attributable to the Fund are charged to the Fund. Expenses directly attributable to a specific class of shares are charged to that share class.
Determination of class net asset value
All income, expenses (other than class-specific expenses, which are charged to that share class, as shown in the Statement of Operations) and realized and unrealized gains (losses) are allocated to each class of the Fund on a daily basis, based on the relative net assets of each class, for purposes of determining the net asset value of each class.
Federal income tax status
The Fund intends to qualify each year as a regulated investment company under Subchapter M of the Internal Revenue Code, as amended, and will distribute substantially all of its investment company taxable income and net capital gain, if any, for its tax year, and as such will not be subject to federal income taxes. In addition, the Fund intends to distribute in each calendar year substantially all of its ordinary income, capital gain net income and certain other amounts, if any, such that the Fund should not be subject to federal excise tax. Therefore, no federal income or excise tax provision is recorded.
Distributions to shareholders
Distributions from net investment income, if any, are declared and paid annually. Net realized capital gains, if any, are distributed at least annually. Income distributions and capital gain distributions are determined in accordance with federal income tax regulations, which may differ from GAAP.
Guarantees and indemnifications
Under the Trust’s organizational documents and, in some cases, by contract, its officers and trustees are indemnified against certain liabilities arising out of the performance of their duties to the Trust or its funds. In addition, certain of the Fund’s contracts with its service providers contain general indemnification clauses. The Fund’s maximum exposure under these arrangements is unknown since the amount of any future claims that may be made against the Fund cannot be determined, and the Fund has no historical basis for predicting the likelihood of any such claims.
Recent accounting pronouncement
Accounting Standards Update 2017-08 Premium Amortization on Purchased Callable Debt Securities
In March 2017, the Financial Accounting Standards Board issued Accounting Standards Update (ASU) No. 2017-08 Premium Amortization on Purchased Callable Debt Securities. ASU No. 2017-08 updates the accounting standards to shorten the amortization period for certain purchased callable debt securities, held at a premium, to be amortized to the earliest call date. The update applies to securities with explicit, noncontingent call features that are callable at fixed prices and on preset dates. The standard is effective for annual periods beginning after December 15, 2018 and interim periods within those fiscal years. At this time, management is evaluating the implication of this guidance and the impact it will have on the financial statement amounts and footnote disclosures, if any.
Note 3. Fees and other transactions with affiliates
Management services fees
The Fund has entered into a Management Agreement with Columbia Management Investment Advisers, LLC (the Investment Manager). Under the Management Agreement, the Investment Manager provides the Fund with investment research and advice, as well as administrative and accounting services. The management services fee is an annual fee that is a blend of (i) a fee that declines from 0.06% to 0.03%, depending on asset levels, on assets invested in affiliated mutual funds, exchange-traded funds and closed-end funds that pay an investment advisory fee to the Investment Manager, (ii) a fee that declines from 0.16% to 0.13%, depending on asset levels, on assets invested in exchange-traded funds and mutual funds that are not managed by the Investment Manager or its affiliates and (iii) a fee that declines from 0.76% to 0.63%, depending on asset levels, on assets invested in securities, instruments and other assets not described above, including affiliated
Columbia Adaptive Risk Allocation Fund | Annual Report 2018
| 33 |
Notes to Financial Statements (continued)
May 31, 2018
mutual funds, exchange-traded funds and closed-end funds advised by the Investment Manager that do not pay an investment advisory fee, third party closed-end funds, derivatives and individual securities. The effective management services fee rate for the year ended May 31, 2018 was 0.65% of the Fund’s average daily net assets.
In addition to the fees and expenses which the Fund bears directly, the Fund indirectly bears a pro rata share of the fees and expenses of the Underlying Funds (also referred to as "acquired funds") in which the Fund invests. Because the Underlying Funds have varied expense and fee levels and the Fund may own different proportions of Underlying Funds at different times, the amount of fees and expenses incurred indirectly by the Fund will vary.
Compensation of board members
Members of the Board of Trustees who are not officers or employees of the Investment Manager or Ameriprise Financial are compensated for their services to the Fund as disclosed in the Statement of Operations. These members of the Board of Trustees may participate in a Deferred Compensation Plan (the Plan) which may be terminated at any time. Obligations of the Plan will be paid solely out of the Fund’s assets, and all amounts payable under the Plan constitute a general unsecured obligation of the Fund.
Compensation of Chief Compliance Officer
The Board of Trustees has appointed a Chief Compliance Officer to the Fund in accordance with federal securities regulations. As disclosed in the Statement of Operations, a portion of the Chief Compliance Officer’s total compensation is allocated to the Fund, along with other allocations to affiliated funds governed by the Board of Trustees, based on relative net assets.
Transfer agency fees
Under a Transfer and Dividend Disbursing Agent Agreement, Columbia Management Investment Services Corp. (the Transfer Agent), an affiliate of the Investment Manager and a wholly-owned subsidiary of Ameriprise Financial, is responsible for providing transfer agency services to the Fund. The Transfer Agent has contracted with DST Asset Manager Solutions, Inc. (DST) to serve as sub-transfer agent. The Transfer Agent pays the fees of DST for services as sub-transfer agent and DST is not entitled to reimbursement for such fees from the Fund (with the exception of out-of-pocket fees).
The Fund pays the Transfer Agent a monthly transfer agency fee based on the number or the average value of accounts, depending on the type of account. In addition, the Fund pays the Transfer Agent a fee for shareholder services based on the number of accounts or on a percentage of the average aggregate value of the Fund’s shares maintained in omnibus accounts up to the lesser of the amount charged by the financial intermediary or a cap established by the Board of Trustees from time to time.
The Transfer Agent also receives compensation from the Fund for various shareholder services and reimbursements for certain out-of-pocket fees. Effective August 1, 2017, total transfer agency fees for Institutional 2 Class and Institutional 3 Class shares are subject to an annual limitation of not more than 0.07% and 0.02%, respectively, of the average daily net assets attributable to each share class. Prior to August 1, 2017, these limitations were 0.075% for Institutional 2 Class shares and 0.025% for Institutional 3 Class shares.
For the year ended May 31, 2018, the Fund’s effective transfer agency fee rates as a percentage of average daily net assets of each class were as follows:
| | Effective rate (%) |
| Class A | 0.05 |
| Advisor Class | 0.05 |
| Class C | 0.05 |
| Institutional Class | 0.05 |
| Institutional 2 Class | 0.06 |
| Institutional 3 Class | 0.02 |
| Class R | 0.05 |
| Class T | 0.05 |
| 34 | Columbia Adaptive Risk Allocation Fund | Annual Report 2018 |
Notes to Financial Statements (continued)
May 31, 2018
An annual minimum account balance fee of $20 may apply to certain accounts with a value below the applicable share class’s initial minimum investment requirements to reduce the impact of small accounts on transfer agency fees. These minimum account balance fees are remitted to the Fund and recorded as part of expense reductions in the Statement of Operations. For the year ended May 31, 2018, these minimum account balance fees reduced total expenses of the Fund by $40.
Plan administration fees
Under a Plan Administration Services Agreement with the Transfer Agent, the Fund pays an annual fee at a rate of 0.25% of the Fund’s average daily net assets attributable to Class K shares for the provision of various administrative, recordkeeping, communication and educational services. As a result of all Class K shares of the Fund being redeemed or exchanged for Advisor Class shares, March 9, 2018 was the last day the Fund paid a plan administration fee for Class K shares.
Distribution and service fees
The Fund has entered into an agreement with Columbia Management Investment Distributors, Inc. (the Distributor), an affiliate of the Investment Manager and a wholly-owned subsidiary of Ameriprise Financial, for distribution and shareholder services. The Board of Trustees has approved, and the Fund has adopted, distribution and shareholder service plans (the Plans) applicable to certain share classes, which set the distribution and service fees for the Fund. These fees are calculated daily and are intended to compensate the Distributor and/or eligible selling and/or servicing agents for selling shares of the Fund and providing services to investors.
Under the Plans, the Fund pays a monthly service fee to the Distributor at the maximum annual rate of 0.25% of the average daily net assets attributable to Class A, Class C and Class T shares of the Fund. Also under the Plans, the Fund pays a monthly distribution fee to the Distributor at the maximum annual rates of 0.10%, 0.75%, 0.50% and 0.25% of the average daily net assets attributable to Class A, Class C, Class R and Class T shares of the Fund, respectively.
Although the Fund may pay distribution and service fees up to a maximum annual rate of 0.35% of the Fund’s average daily net assets attributable to Class A shares (comprised of up to 0.10% for distribution services and up to 0.25% for shareholder liaison services), the Fund currently limits such fees to an aggregate fee of not more than 0.25% of the Fund’s average daily net assets attributable to Class A shares.
Although the Fund may pay a distribution fee up to 0.25% of the Fund’s average daily net assets attributable to Class T shares and a service fee of up to 0.25% of the Fund’s average daily net assets attributable to Class T shares, the aggregate fee shall not exceed 0.25% of the Fund’s average daily net assets attributable to Class T shares.
Sales charges (unaudited)
Sales charges, including front-end charges and CDSCs, received by the Distributor for distributing Fund shares for the year ended May 31, 2018, if any, are listed below:
| | Amount ($) |
| Class A | 725,125 |
| Class C | 22,964 |
Columbia Adaptive Risk Allocation Fund | Annual Report 2018
| 35 |
Notes to Financial Statements (continued)
May 31, 2018
Expenses waived/reimbursed by the Investment Manager and its affiliates
The Investment Manager and certain of its affiliates have contractually agreed to waive fees and/or reimburse expenses (excluding certain fees and expenses described below) for the period(s) disclosed below, unless sooner terminated at the sole discretion of the Board of Trustees, so that the Fund’s net operating expenses, including indirect expenses of the Underlying Funds, after giving effect to fees waived/expenses reimbursed and any balance credits and/or overdraft charges from the Fund’s custodian, do not exceed the following annual rate(s) as a percentage of the class’ average daily net assets:
| | August 1, 2017
through
September 30, 2018 | Prior to
August 1, 2017 |
| Class A | 1.25% | 1.25% |
| Advisor Class | 1.00 | 1.00 |
| Class C | 2.00 | 2.00 |
| Institutional Class | 1.00 | 1.00 |
| Institutional 2 Class | 1.00 | 0.97 |
| Institutional 3 Class | 0.95 | 0.92 |
| Class R | 1.50 | 1.50 |
| Class T | 1.25 | 1.25 |
Under the agreement governing these fee waivers and/or expense reimbursement arrangements, the following fees and expenses are excluded from the waiver/reimbursement commitment, and therefore will be paid by the Fund, if applicable: taxes (including foreign transaction taxes), transaction costs and brokerage commissions, costs related to any securities lending program, dividend expenses associated with securities sold short, inverse floater program fees and expenses, transaction charges and interest on borrowed money, interest, infrequent and/or unusual expenses and any other expenses the exclusion of which is specifically approved by the Board of Trustees. This agreement may be modified or amended only with approval from the Investment Manager, certain of its affiliates and the Fund. Any fees waived and/or expenses reimbursed under the expense reimbursement arrangements described above are not recoverable by the Investment Manager or its affiliates in future periods.
Note 4. Federal tax information
The timing and character of income and capital gain distributions are determined in accordance with income tax regulations, which may differ from GAAP because of temporary or permanent book to tax differences.
At May 31, 2018, these differences were primarily due to differing treatment for deferral/reversal of wash sale losses, re-characterization of distributions for investments, derivative investments, tax straddles, trustees’ deferred compensation, foreign currency transactions and TIPS Holding. To the extent these differences were permanent, reclassifications were made among the components of the Fund’s net assets in the Statement of Assets and Liabilities. Temporary differences do not require reclassifications.
In the Statement of Assets and Liabilities the following reclassifications were made:
Undistributed net
investment
income ($) | Accumulated
net realized
gain ($) | Paid in
capital ($) |
| (3,958,611) | 3,958,611 | — |
The tax character of distributions paid during the years indicated was as follows:
| Year Ended May 31, 2018 | Year Ended May 31, 2017 |
Ordinary
income ($) | Long-term
capital gains ($) | Total ($) | Ordinary
income ($) | Long-term
capital gains ($) | Total ($) |
| 84,659,245 | 99,217,080 | 183,876,325 | 27,628,170 | — | 27,628,170 |
| 36 | Columbia Adaptive Risk Allocation Fund | Annual Report 2018 |
Notes to Financial Statements (continued)
May 31, 2018
At May 31, 2018, the components of distributable earnings on a tax basis were as follows:
Undistributed
ordinary income ($) | Undistributed
long-term
capital gains ($) | Capital loss
carryforwards ($) | Net unrealized
appreciation ($) |
| 59,348,443 | 26,205,942 | — | 10,244,851 |
At May 31, 2018, the cost of all investments for federal income tax purposes along with the aggregate gross unrealized appreciation and depreciation based on that cost was:
Federal
tax cost ($) | Gross unrealized
appreciation ($) | Gross unrealized
(depreciation) ($) | Net unrealized
appreciation ($) |
| 3,148,433,740 | 60,978,059 | (50,733,208) | 10,244,851 |
Tax cost of investments and unrealized appreciation/(depreciation) may also include timing differences that do not constitute adjustments to tax basis.
Management of the Fund has concluded that there are no significant uncertain tax positions in the Fund that would require recognition in the financial statements. However, management’s conclusion may be subject to review and adjustment at a later date based on factors including, but not limited to, new tax laws, regulations, and administrative interpretations (including relevant court decisions). Generally, the Fund’s federal tax returns for the prior three fiscal years remain subject to examination by the Internal Revenue Service.
Note 5. Portfolio information
The cost of purchases and proceeds from sales of securities, excluding short-term investments and derivatives, if any, aggregated to $3,967,462,916 and $2,708,097,760, respectively, for the year ended May 31, 2018, of which $2,300,213,069 and $1,931,507,138, respectively, were U.S. government securities. The amount of purchase and sale activity impacts the portfolio turnover rate reported in the Financial Highlights.
Note 6. Affiliated money market fund
The Fund invests in Columbia Short-Term Cash Fund, an affiliated money market fund established for the exclusive use by the Fund and other affiliated funds (the Affiliated MMF). The income earned by the Fund from such investments is included as Dividends - affiliated issuers in the Statement of Operations. As an investing fund, the Fund indirectly bears its proportionate share of the expenses of the Affiliated MMF. The Affiliated MMF prices its shares with a floating net asset value. In addition, the Board of Trustees of the Affiliated MMF may impose a fee on redemptions (sometimes referred to as a liquidity fee) or temporarily suspend redemptions (sometimes referred to as imposing a redemption gate) in the event its liquidity falls below regulatory limits.
Note 7. Interfund lending
Pursuant to an exemptive order granted by the Securities and Exchange Commission, the Fund participates in a program (the Interfund Program) allowing each participating Columbia Fund (each, a Participating Fund) to lend money directly to and, except for closed-end funds and money market funds, borrow money directly from other Participating Funds for temporary purposes. The amounts eligible for borrowing and lending under the Interfund Program are subject to certain restrictions.
Interfund loans are subject to the risk that the borrowing fund could be unable to repay the loan when due, and a delay in repayment to the lending fund could result in lost opportunities and/or additional lending costs. The exemptive order is subject to conditions intended to mitigate conflicts of interest arising from the Investment Manager’s relationship with each Participating Fund.
The Fund did not borrow or lend money under the Interfund Program during the year ended May 31, 2018.
Columbia Adaptive Risk Allocation Fund | Annual Report 2018
| 37 |
Notes to Financial Statements (continued)
May 31, 2018
Note 8. Line of credit
The Fund has access to a revolving credit facility with a syndicate of banks led by Citibank, N.A., HSBC Bank USA, N.A. and JPMorgan Chase Bank, N.A. whereby the Fund may borrow for the temporary funding of shareholder redemptions or for other temporary or emergency purposes. The credit facility, which is a collective agreement between the Fund and certain other funds managed by the Investment Manager, severally and not jointly, permits collective borrowings up to $1 billion. Interest is charged to each participating fund based on its borrowings at a rate equal to the higher of (i) the overnight federal funds rate plus 1.00% or (ii) the one-month LIBOR rate plus 1.00%. Each borrowing under the credit facility matures no later than 60 days after the date of borrowing. The Fund also pays a commitment fee equal to its pro rata share of the amount of the credit facility at a rate of 0.15% per annum. The commitment fee is included in other expenses in the Statement of Operations.
The Fund had no borrowings during the year ended May 31, 2018.
Note 9. Significant risks
Commodity-related investment risk
The value of commodities investments will generally be affected by overall market movements and factors specific to a particular industry or commodity, which may include demand for the commodity, weather, embargoes, tariffs, and economic health, political, international, regulatory and other developments. Exposure to commodities and commodities markets may subject the value of the Fund’s investments to greater volatility than other types of investments. Commodities investments may also subject the Fund to counterparty risk and liquidity risk. The Fund may make commodity-related investments through one or more wholly-owned subsidiaries organized outside the U.S. that are generally not subject to U.S. laws (including securities laws) and their protections.
Credit risk
Credit risk is the risk that the value of debt securities in the Fund’s portfolio may decline because the issuer may default and fail to pay interest or repay principal when due. Rating agencies assign credit ratings to debt securities to indicate their credit risk. Lower rated or unrated debt securities held by the Fund may present increased credit risk as compared to higher-rated debt securities.
Derivatives risk
Losses involving derivative instruments may be substantial, because a relatively small price movement in the underlying security(ies), commodity, currency or index or other instrument or asset may result in a substantial loss for the Fund. In addition to the potential for increased losses, the use of derivative instruments may lead to increased volatility within the Fund. Derivatives will typically increase the Fund’s exposure to principal risks to which it is otherwise exposed, and may expose the Fund to additional risks, including correlation risk, counterparty risk, hedging risk, leverage risk and liquidity risk.
Interest rate risk
Interest rate risk is the risk of losses attributable to changes in interest rates. In general, if prevailing interest rates rise, the values of debt securities tend to fall, and if interest rates fall, the values of debt securities tend to rise. Actions by governments and central banking authorities can result in increases in interest rates. Increasing interest rates may negatively affect the value of debt securities held by the Fund, resulting in a negative impact on the Fund’s performance and net asset value per share. In general, the longer the maturity or duration of a debt security, the greater its sensitivity to changes in interest rates.
Leverage risk
Leverage occurs when the Fund increases its assets available for investment using borrowings, short sales, derivatives, or similar instruments or techniques. The use of leverage may make any change in the Fund’s net asset value even greater and thus result in increased volatility of returns. Because short sales involve borrowing securities and then selling them, the Fund’s short sales effectively leverage the Fund’s assets. The Fund’s assets that are used as collateral to secure the Fund’s obligations to return the securities sold short may decrease in value while the short positions are outstanding, which may
| 38 | Columbia Adaptive Risk Allocation Fund | Annual Report 2018 |
Notes to Financial Statements (continued)
May 31, 2018
force the Fund to use its other assets to increase the collateral. Leverage can create an interest expense that may lower the Fund’s overall returns. Leverage presents the opportunity for increased net income and capital gains, but also exaggerates the Fund’s risk of loss. There can be no guarantee that a leveraging strategy will be successful.
Liquidity risk
Liquidity risk is the risk associated with a lack of marketability of investments which may make it difficult to sell the investment at a desirable time or price. Changing regulatory, market or other conditions or environments (for example, the interest rate or credit environments) may adversely affect the liquidity of the Fund’s investments. The Fund may have to accept a lower selling price for the holding, sell other investments, or forego another, more appealing investment opportunity. Generally, the less liquid the market at the time the Fund sells a portfolio investment, the greater the risk of loss or decline of value to the Fund. A less liquid market can lead to an increase in Fund redemptions, which may negatively impact Fund performance and net asset value per share, including, for example, if the Fund is forced to sell securities in a down market.
Non-diversification risk
A non-diversified fund is permitted to invest a greater percentage of its total assets in fewer issuers than a diversified fund. The Fund may, therefore, have a greater risk of loss from a few issuers than a similar fund that invests more broadly.
Shareholder concentration risk
At May 31, 2018, affiliated shareholders of record owned 91.4% of the outstanding shares of the Fund in one or more accounts. Subscription and redemption activity by concentrated accounts may have a significant effect on the operations of the Fund. In the case of a large redemption, the Fund may be forced to sell investments at inopportune times, including its liquid positions, which may result in Fund losses and the Fund holding a higher percentage of less liquid positions. Large redemptions could result in decreased economies of scale and increased operating expenses for non-redeeming Fund shareholders.
Note 10. Subsequent events
Management has evaluated the events and transactions that have occurred through the date the financial statements were issued and noted no items requiring adjustment of the financial statements or additional disclosure.
Note 11. Information regarding pending and settled legal proceedings
Ameriprise Financial and certain of its affiliates have historically been involved in a number of legal, arbitration and regulatory proceedings, including routine litigation, class actions, and governmental actions, concerning matters arising in connection with the conduct of their business activities. Ameriprise Financial believes that the Funds are not currently the subject of, and that neither Ameriprise Financial nor any of its affiliates are the subject of, any pending legal, arbitration or regulatory proceedings that are likely to have a material adverse effect on the Fund or the ability of Ameriprise Financial or its affiliates to perform under their contracts with the Fund. Ameriprise Financial is required to make quarterly (10-Q), annual (10-K) and, as necessary, 8-K filings with the Securities and Exchange Commission (SEC) on legal and regulatory matters that relate to Ameriprise Financial and its affiliates. Copies of these filings may be obtained by accessing the SEC website at www.sec.gov.
There can be no assurance that these matters, or the adverse publicity associated with them, will not result in increased Fund redemptions, reduced sale of Fund shares or other adverse consequences to the Fund. Further, although we believe proceedings are not likely to have a material adverse effect on the Fund or the ability of Ameriprise Financial or its affiliates to perform under their contracts with the Fund, these proceedings are subject to uncertainties and, as such, we are unable to estimate the possible loss or range of loss that may result. An adverse outcome in one or more of these proceedings could result in adverse judgments, settlements, fines, penalties or other relief that could have a material adverse effect on the consolidated financial condition or results of operations of Ameriprise Financial.
Columbia Adaptive Risk Allocation Fund | Annual Report 2018
| 39 |
Report of Independent Registered Public Accounting Firm
To the Board of Trustees of Columbia Funds Series Trust I and Shareholders of Columbia Adaptive Risk Allocation Fund
Opinion on the Financial Statements
We have audited the accompanying statement of assets and liabilities, including the portfolio of investments, of Columbia Adaptive Risk Allocation Fund (one of the funds constituting Columbia Funds Series Trust I, hereafter referred to as the "Fund") as of May 31, 2018, the related statement of operations for the year ended May 31, 2018, the statement of changes in net assets for each of the two years in the period ended May 31, 2018, including the related notes, and the financial highlights for each of the periods indicated therein (collectively referred to as the “financial statements”). In our opinion, the financial statements present fairly, in all material respects, the financial position of the Fund as of May 31, 2018, the results of its operations for the year then ended, the changes in its net assets for each of the two years in the period ended May 31, 2018 and the financial highlights for each of the periods indicated therein in conformity with accounting principles generally accepted in the United States of America.
Basis for Opinion
These financial statements are the responsibility of the Fund’s management. Our responsibility is to express an opinion on the Fund’s financial statements based on our audits. We are a public accounting firm registered with the Public Company Accounting Oversight Board (United States) (“PCAOB”) and are required to be independent with respect to the Fund in accordance with the U.S. federal securities laws and the applicable rules and regulations of the Securities and Exchange Commission and the PCAOB.
We conducted our audits of these financial statements in accordance with the standards of the PCAOB. Those standards require that we plan and perform the audits to obtain reasonable assurance about whether the financial statements are free of material misstatement, whether due to error or fraud.
Our audits included performing procedures to assess the risks of material misstatement of the financial statements, whether due to error or fraud, and performing procedures that respond to those risks. Such procedures included examining, on a test basis, evidence regarding the amounts and disclosures in the financial statements. Our audits also included evaluating the accounting principles used and significant estimates made by management, as well as evaluating the overall presentation of the financial statements. Our procedures included confirmation of securities owned as of May 31, 2018 by correspondence with the custodian, brokers and transfer agent; when replies were not received from brokers, we performed other auditing procedures. We believe that our audits provide a reasonable basis for our opinion.
/s/PricewaterhouseCoopers LLP
Minneapolis, Minnesota
July 23, 2018
We have served as the auditor of one or more investment companies within the Columbia Funds Complex since 1977.
| 40 | Columbia Adaptive Risk Allocation Fund | Annual Report 2018 |
Federal Income Tax Information
(Unaudited)
The Fund hereby designates the following tax attributes for the fiscal year ended May 31, 2018. Shareholders will be notified in early 2019 of the amounts for use in preparing 2018 income tax returns.
Capital
gain
dividend | |
| $68,825,152 | |
Capital gain dividend. The Fund designates as a capital gain dividend the amount reflected above, or if subsequently determined to be different, the net capital gain of such fiscal period.
Columbia Adaptive Risk Allocation Fund | Annual Report 2018
| 41 |
Shareholders elect the Board that oversees the Fund’s operations. The Board appoints officers who are responsible for day-to-day business decisions based on policies set by the Board. The following table provides basic biographical information about the Fund’s Trustees, including their principal occupations during the past five years, although specific titles for individuals may have varied over the period. The year set forth beneath Length of Service in the table below is the year in which the Trustee was first appointed or elected as Trustee to any Fund currently in the Columbia Funds Complex or a predecessor thereof. Under current Board policy, members serve terms of indefinite duration.
Independent trustees
| Name, address, year of birth | Position held with the Trust and length of service | Principal occupation(s) during the past five years and other relevant professional experience | Number of Funds in the Columbia Fund Complex overseen | Other directorships held by Trustee during the past five years |
Janet Langford Carrig
c/o Columbia Management
Investment Advisers, LLC
225 Franklin Street
Mail Drop BX32 05228
Boston, MA 02110
1957 | Trustee
1996 | Senior Vice President, General Counsel and Corporate Secretary, ConocoPhillips (independent energy company) since September 2007 | 71 | None |
Douglas A. Hacker
c/o Columbia Management
Investment Advisers, LLC
225 Franklin Street
Mail Drop BX32 05228
Boston, MA 02110
1955 | Trustee and Chairman of the Board
1996 | Independent business executive since May 2006; Executive Vice President — Strategy of United Airlines from December 2002 to May 2006; President of UAL Loyalty Services (airline marketing company) from September 2001 to December 2002; Executive Vice President and Chief Financial Officer of United Airlines from July 1999 to September 2001 | 71 | Spartan Nash Company, (food distributor); Nash Finch Company (food distributor) from 2005 to 2013; Aircastle Limited (aircraft leasing); SeaCube Container Leasing Ltd. (container leasing) from 2010 to 2013; and Travelport Worldwide Limited (travel information technology) |
Nancy T. Lukitsh
c/o Columbia Management
Investment Advisers, LLC
225 Franklin Street
Mail Drop BX32 05228
Boston, MA 02110
1956 | Trustee
2011 | Senior Vice President, Partner and Director of Marketing, Wellington Management Company, LLP (investment adviser) from 1997 to 2010; Chair, Wellington Management Portfolios (commingled non-U.S. investment pools) from 2007 to 2010; Director, Wellington Trust Company, NA and other Wellington affiliates from 1997 to 2010 | 71 | None |
David M. Moffett
c/o Columbia Management
Investment Advisers, LLC
225 Franklin Street
Mail Drop BX32 05228
Boston, MA 02110
1952 | Trustee
2011 | Retired. Consultant to Bridgewater and Associates | 71 | Director, CSX Corporation; Genworth Financial, Inc. (financial and insurance products and services); PayPal Holdings Inc. (payment and data processing services); Trustee, University of Oklahoma Foundation; former Director, eBay Inc. (online trading community), 2007-2015; and former Director, CIT Bank, CIT Group Inc. (commercial and consumer finance), 2010-2016 |
John J. Neuhauser
c/o Columbia Management
Investment Advisers, LLC
225 Franklin Street
Mail Drop BX32 05228
Boston, MA 02110
1943 | Trustee
1984 | President, Saint Michael’s College since August 2007; Director or Trustee of several non-profit organizations, including University of Vermont Medical Center; Academic Vice President and Dean of Faculties, Boston College from August 1999 to October 2005; University Professor, Boston College from November 2005 to August 2007 | 71 | Liberty All-Star Equity Fund and Liberty All- Star Growth Fund (closed-end funds) |
| 42 | Columbia Adaptive Risk Allocation Fund | Annual Report 2018 |
TRUSTEES AND OFFICERS (continued)
Independent trustees (continued)
| Name, address, year of birth | Position held with the Trust and length of service | Principal occupation(s) during the past five years and other relevant professional experience | Number of Funds in the Columbia Fund Complex overseen | Other directorships held by Trustee during the past five years |
Patrick J. Simpson
c/o Columbia Management
Investment Advisers, LLC
225 Franklin Street
Mail Drop BX32 05228
Boston, MA 02110
1944 | Trustee
2000 | Of Counsel, Perkins Coie LLP (law firm) since 2015; Partner, Perkins Coie LLP from 1988 to 2014 | 71 | None |
Anne-Lee Verville
c/o Columbia Management
Investment Advisers, LLC
225 Franklin Street
Mail Drop BX32 05228
Boston, MA 02110
1945 | Trustee
1998 | Retired. General Manager, Global Education Industry from 1994 to 1997, President – Application Systems Division from 1991 to 1994, Chief Financial Officer – US Marketing & Services from 1988 to 1991, and Chief Information Officer from 1987 to 1988, IBM Corporation (computer and technology) | 71 | Enesco Group, Inc. (producer of giftware and home and garden decor products) from 2001 to 2006 |
Consultants to the Independent Trustees*
| Name, address, year of birth | Position held with the Trust and length of service | Principal occupation(s) during the past five years and other relevant professional experience | Number of Funds in the Columbia Funds complex overseen | Other directorships held by Trustee during the past five years |
J. Kevin Connaughton
c/o Columbia
Management Investment
Advisers, LLC,
225 Franklin Street
Mail Drop BX32 05228,
Boston, MA 02110
1964 | Independent Trustee Consultant
2016 | Independent Trustee Consultant, Columbia Funds since March 2016; Adjunct Professor of Finance, Bentley University since November 2017; Managing Director and General Manager of Mutual Fund Products, Columbia Management Investment Advisers, LLC from May 2010 to February 2015; President, Columbia Funds from 2009 to 2015; and senior officer of Columbia Funds and affiliated funds from 2003 to 2015 | 71 | Director, The Autism Project since March 2015; former Trustee, New Century Portfolios, March 2015-December 2017; formerly on Board of Governors, Gateway Healthcare, January 2016 – December 2017 |
Natalie A. Trunow
c/o Columbia
Management Investment
Advisers, LLC,
225 Franklin Street
Mail Drop BX32 05228,
Boston, MA 02110
1967 | Independent Trustee Consultant
2016 | Independent Trustee Consultant, Columbia Funds since September 2016; Chief Executive Officer, Millennial Portfolio Solutions LLC (asset management and consulting services) since January 2016; Director of Investments, Casey Family Programs from April 2016 to September 2016; Senior Vice President and Chief Investment Officer, Calvert Investments from August 2008 to January 2016; Section Head and Portfolio Manager, General Motors Asset Management from June 1997 to August 2008 | 71 | Director, Health Services for Children with Special Needs, Inc.; Director, Guidewell Financial Solutions |
| * | J. Kevin Connaughton was appointed consultant to the Independent Trustees effective March 1, 2016. Natalie A. Trunow was appointed consultant to the Independent Trustees effective September 1, 2016. Shareholders of the Funds are expected to be asked to elect each of Mr. Connaughton and Ms. Trunow as a Trustee at a future shareholder meeting. |
Columbia Adaptive Risk Allocation Fund | Annual Report 2018
| 43 |
TRUSTEES AND OFFICERS (continued)
Interested trustee affiliated with Investment Manager*
| Name, address, year of birth | Position held with the Trust and length of service | Principal occupation(s) during the past five years and other relevant professional experience | Number of Funds in the Columbia Funds Complex overseen | Other directorships held by Trustee during the past five years |
William F. Truscott
c/o Columbia Management
Investment Advisers, LLC
225 Franklin Street
Boston, MA 02110
1960 | Trustee
2012 | Chairman of the Board and President, Columbia Management Investment Advisers, LLC since May 2010 and February 2012, respectively; Chief Executive Officer, Global Asset Management, Ameriprise Financial, Inc. since September 2012 (previously Chief Executive Officer, U.S. Asset Management & President, Annuities, May 2010-September 2012); Director and Chief Executive Officer, Columbia Management Investment Distributors, Inc. since May 2010 and February 2012, respectively; Chairman of the Board and Chief Executive Officer, RiverSource Distributors, Inc. since 2006; Director, Threadneedle Asset Management Holdings, SARL since 2014; President and Chief Executive Officer, Ameriprise Certificate Company, 2006-August 2012 | 196 | Chairman of the Board, Columbia Management Investment Advisers, LLC since May 2010; Director, Columbia Management Investment Distributors, Inc. since May 2010; former Director, Ameriprise Certificate Company, 2006 - January 2013 |
| * | Interested person (as defined under the 1940 Act) by reason of being an officer, director, security holder and/or employee of the Investment Manager or Ameriprise Financial. |
The Statement of Additional Information has additional information about the Fund’s Board members and is available, without charge, upon request by calling 800.345.6611, visiting columbiathreadneedleus.com/investor/ or contacting your financial intermediary.
| 44 | Columbia Adaptive Risk Allocation Fund | Annual Report 2018 |
TRUSTEES AND OFFICERS (continued)
The Board has appointed officers who are responsible for day-to-day business decisions based on policies it has established. The officers serve at the pleasure of the Board. The following table provides basic information about the Officers of the Fund, including principal occupations during the past five years, although their specific titles may have varied over the period. In addition to Mr. Truscott, who is Senior Vice President, the Fund’s other officers are:
Fund officers
Name,
address and
year of birth | Position and year
first appointed to
position for any Fund
in the Columbia
Funds complex or a
predecessor thereof | Principal occupation(s) during past five years |
Christopher O. Petersen
5228 Ameriprise
Financial Center
Minneapolis, MN 55474
Born 1970 | President and Principal Executive Officer (2015) | Vice President and Lead Chief Counsel, Ameriprise Financial, Inc. since January 2015 (previously, Vice President and Chief Counsel, January 2010 - December 2014; officer of Columbia Funds and affiliated funds since 2007. |
Michael G. Clarke
225 Franklin Street
Boston, MA 02110
Born 1969 | Treasurer (2011), Chief Financial Officer (2009) and Chief Accounting Officer (2015) | Vice President — Mutual Fund Administration, Columbia Management Investment Advisers, LLC, since May 2010; senior officer of Columbia Funds and affiliated funds since 2002. |
Paul B. Goucher
100 Park Avenue
New York, NY 10017
Born 1968 | Senior Vice President (2011) and Assistant Secretary (2008) | Senior Vice President and Assistant General Counsel, Ameriprise Financial, Inc. since January 2017 (previously Vice President and Lead Chief Counsel, November 2008 - January 2017 and January 2013 - January 2017, respectively; and Chief Counsel, January 2010 - January 2013); Vice President, Chief Legal Officer and Assistant Secretary, Columbia Management Investment Advisers, LLC since May 2010. |
Thomas P. McGuire
225 Franklin Street
Boston, MA 02110
Born 1972 | Senior Vice President and Chief Compliance Officer (2012) | Vice President — Asset Management Compliance, Ameriprise Financial, Inc., since May 2010; Chief Compliance Officer, Ameriprise Certificate Company since September 2010. |
Colin Moore
225 Franklin Street
Boston, MA 02110
Born 1958 | Senior Vice President (2010) | Executive Vice President and Global Chief Investment Officer, Ameriprise Financial, Inc., since July 2013; Executive Vice President and Global Chief Investment Officer, Columbia Management Investment Advisers, LLC since July 2013 (previously Director and Global Chief Investment Officer, 2010 - 2013). |
Ryan C. Larrenaga
225 Franklin Street
Boston, MA 02110
Born 1970 | Senior Vice President (2017), Chief Legal Officer (2017) and Secretary (2015) | Vice President and Group Counsel, Ameriprise Financial, Inc. since August 2011; officer of Columbia Funds and affiliated funds since 2005. |
Michael E. DeFao
225 Franklin Street
Boston, MA 02110
Born 1968 | Vice President (2011) and Assistant Secretary (2010) | Vice President and Chief Counsel, Ameriprise Financial, Inc. since May 2010. |
Amy Johnson
5228 Ameriprise
Financial Center
Minneapolis, MN 55474
Born 1965 | Vice President (2006) | Managing Director and Global Head of Operations, Columbia Management Investment Advisers, LLC since April 2016 (previously Managing Director and Chief Operating Officer, 2010 - 2016). |
Lyn Kephart-Strong
5228 Ameriprise
Financial Center
Minneapolis, MN 55474
Born 1960 | Vice President (2015) | President, Columbia Management Investment Services Corp. since October 2014; Vice President & Resolution Officer, Ameriprise Trust Company since August 2009. |
Columbia Adaptive Risk Allocation Fund | Annual Report 2018
| 45 |
Proxy voting policies and procedures
The policy of the Board of Trustees is to vote the proxies of the companies in which the Fund holds investments consistent with the procedures as stated in the Statement of Additional Information (SAI). You may obtain a copy of the SAI without charge by calling 800.345.6611; contacting your financial intermediary; visiting columbiathreadneedleus.com/investor/; or searching the website of the Securities and Exchange Commission (SEC) at sec.gov. Information regarding how the Fund voted proxies relating to portfolio securities is filed with the SEC by August 31st for the most recent 12-month period ending June 30th of that year, and is available without charge by visiting columbiathreadneedleus.com/investor/, or searching the website of the SEC at sec.gov.
Quarterly schedule of investments
The Fund files a complete schedule of portfolio holdings with the SEC for the first and third quarters of each fiscal year on Form N-Q. The Fund’s Form N-Q is available on the SEC’s website at sec.gov and may be reviewed and copied at the SEC’s Public Reference Room in Washington, D.C. Information on the operation of the Public Reference Room may be obtained by calling 800.SEC.0330. The Fund’s complete schedule of portfolio holdings, as filed on Form N-Q, can also be obtained without charge, upon request, by calling 800.345.6611.
Additional Fund information
For more information about the Fund, please visit columbiathreadneedleus.com/investor/ or call 800.345.6611. Customer Service Representatives are available to answer your questions Monday through Friday from 8 a.m. to 7 p.m. Eastern time.
You may obtain the current net asset value (NAV) of Fund shares at no cost by calling 800.345.6611 or by sending an e-mail to serviceinquiries@columbiathreadneedle.com.
Fund investment manager
Columbia Management Investment Advisers, LLC
225 Franklin Street
Boston, MA 02110
Fund distributor
Columbia Management Investment Distributors, Inc.
225 Franklin Street
Boston, MA 02110
Fund transfer agent
Columbia Management Investment Services Corp.
Through October 31, 2018:
P.O. Box 8081
Boston, MA 02266-8081
Effective November 1, 2018:
P.O. Box 219104
Kansas City, MO 64121-9104
| 46 | Columbia Adaptive Risk Allocation Fund | Annual Report 2018 |
[THIS PAGE INTENTIONALLY LEFT BLANK]
[THIS PAGE INTENTIONALLY LEFT BLANK]
[THIS PAGE INTENTIONALLY LEFT BLANK]
Columbia Adaptive Risk Allocation Fund
Through October 31, 2018:
P.O. Box 8081
Boston, MA 02266-8081
Effective November 1, 2018:
P.O. Box 219104
Kansas City, MO 64121-9104
Please read and consider the investment objectives, risks, charges and expenses for any fund carefully before investing. For a prospectus and summary prospectus, which contains this and other important information about the Fund, go to
columbiathreadneedleus.com/investor/. The Fund is distributed by Columbia Management Investment Distributors, Inc., member FINRA, and managed by Columbia Management Investment Advisers, LLC.
Columbia Threadneedle Investments (Columbia Threadneedle) is the global brand name of the Columbia and Threadneedle group of companies. All rights reserved. Columbia Management Investment Distributors, Inc., 225 Franklin Street, Boston, MA 02110-2804
© 2018 Columbia Management Investment Advisers, LLC.
columbiathreadneedleus .com/investor/

Annual Report
May 31, 2018
Columbia Alternative Beta Fund
Not FDIC Insured • No bank guarantee • May lose value
Dear Shareholders,
The year 2017 was an extraordinary year in the financial markets. The S&P 500 Index didn’t experience a single down month and returned over 20%. Continuing this trend, January 2018 marked the fastest start for the index ever. Low volatility, which had been a feature of the U.S. equity market for several years, along with the surge in the S&P 500 Index, drove investor sentiment to very high levels. This arguably set the stage for an overdue correction, which we witnessed in February 2018.
A return to volatility
There have been few periods of market upheaval such as were experienced in the first part of 2018. While investors were taken by surprise by the sudden and pronounced market swings, the return to some level of volatility actually marked a resumption of relatively normal market conditions. Having said that, it’s important to distinguish between a good technical correction where excess enthusiasm in the marketplace is being let out, versus a real change in the underlying fundamentals – things like an underperforming economy or weaker corporate earnings. Our view is that the recent market volatility falls into the former category, and the fundamentals remain strong. We’re continuing to see improvements in global economic activity, and we’re seeing corporate earnings expectations continue to rise – and not just because of tax reform.
Consistency is more important than ever
It’s important to keep in mind that when it comes to long-term investing, it’s the destination, not the journey that matters most. If you have a financial goal that you’ve worked out with your financial advisor, and you have a good asset allocation plan to reach it, it’s a question of sticking with your plan rather than become focused on near-term volatility. Bouts of volatility are normal. After all, it’s hard to cross the ocean without hitting an occasional rough patch. You need to focus on the destination.
One final thought. In weathering volatility, it’s the consistency of the return that is essential. Investors who chase higher returns are usually the first to sell when an investment goes through a bad patch, and they therefore don’t tend to benefit from the recovery. More disciplined investors who perhaps panic less or not at all during periods of volatility, tend to have improved long-term results and are more likely to reach their financial goals. Nothing is more important to us than making sure those who have entrusted us to protect and grow their assets are able to do what matters most to them.
Your success is our priority. Talk to your financial advisor about how working with Columbia Threadneedle Investments may help you position your portfolio for consistent, sustainable outcomes, no matter the market conditions.
Sincerely,
Christopher O. Petersen
President, Columbia Funds
The S&P 500 Index, an unmanaged index, measures the performance of 500 widely held, large-capitalization U.S. stocks and is frequently used as a general measure of market performance. Past performance is no guarantee of future results.
Columbia Funds are distributed by Columbia Management Investment Distributors, Inc., member FINRA, and managed by Columbia Management Investment Advisers, LLC.
© 2018 Columbia Management Investment Advisers, LLC. All rights reserved.
Columbia Alternative Beta Fund | Annual Report 2018
Columbia Alternative Beta Fund | Annual Report 2018
Investment objective
Columbia Alternative Beta Fund (the Fund) seeks to provide shareholders with absolute (positive) returns over a complete market cycle.
Portfolio management
Marc Khalamayzer, CFA
Lead Portfolio Manager
Managed Fund since 2015
Joshua Kutin, CFA
Portfolio Manager
Managed Fund since 2015
Effective May 24, 2018, Jeffrey Knight and William Landes no longer manage the Fund.
| Average annual total returns (%) (for the period ended May 31, 2018) |
| | | Inception | 1 Year | Life |
| Class A | Excluding sales charges | 01/28/15 | -5.49 | -3.29 |
| | Including sales charges | | -10.91 | -5.00 |
| Advisor Class | 01/28/15 | -5.27 | -3.06 |
| Class C | Excluding sales charges | 01/28/15 | -6.15 | -4.00 |
| | Including sales charges | | -7.07 | -4.00 |
| Institutional Class | 01/28/15 | -5.35 | -3.12 |
| Institutional 2 Class | 01/28/15 | -5.08 | -2.97 |
| Institutional 3 Class | 01/28/15 | -5.16 | -2.92 |
| Class R | 01/28/15 | -5.80 | -3.56 |
| Class T | Excluding sales charges | 01/28/15 | -5.60 | -3.36 |
| | Including sales charges | | -7.96 | -4.10 |
| FTSE One-Month U.S. Treasury Bill Index | | 1.20 | 0.50 |
| HFRX Global Hedge Fund Index | | 2.88 | 1.25 |
Returns for Class A shares are shown with and without the maximum initial sales charge of 5.75%. Returns for Class C shares are shown with and without the 1.00% contingent deferred sales charge for the first year only. Returns for Class T shares are shown with and without the maximum initial sales charge of 2.50% per transaction. The Fund’s other classes are not subject to sales charges and have limited eligibility. Effective November 1, 2017, Class R4, Class R5, Class Y and Class Z shares were renamed Advisor Class, Institutional 2 Class, Institutional 3 Class and Institutional Class shares, respectively. Please see the Fund’s prospectus for details. Performance for different share classes will vary based on differences in sales charges and fees associated with each class. All results shown assume reinvestment of distributions during the period. Returns do not reflect the deduction of taxes that a shareholder may pay on Fund distributions or on the redemption of Fund shares. Performance results reflect the effect of any fee waivers or reimbursements of Fund expenses by Columbia Management Investment Advisers, LLC and/or any of its affiliates. Absent these fee waivers or expense reimbursement arrangements, performance results would have been lower.
The performance information shown represents past performance and is not a guarantee of future results. The investment return and principal value of your investment will fluctuate so that your shares, when redeemed, may be worth more or less than their original cost. Current performance may be lower or higher than the performance information shown. You may obtain performance information current to the most recent month-end by contacting your financial intermediary, visiting columbiathreadneedleus.com/investor/ or calling 800.345.6611.
The Fund’s performance prior to October 1, 2016 reflects returns achieved pursuant to different principal investment strategies. If the Fund’s current strategies had been in place for the prior periods, results shown may have been different.
The FTSE One-Month U.S. Treasury Bill Index is an unmanaged index that represents the performance of one-month Treasury bills and reflects reinvestment of all distributions and changes in market prices.
HFRX Global Hedge Fund Index is designed to be representative of the overall composition of the hedge fund universe.
Indices are not available for investment, are not professionally managed and do not reflect sales charges, fees, brokerage commissions, taxes or other expenses of investing. Securities in the Fund may not match those in an index.
| 2 | Columbia Alternative Beta Fund | Annual Report 2018 |
Fund at a Glance (continued)
Performance of a hypothetical $10,000 investment (January 28, 2015 — May 31, 2018)
The chart above shows the change in value of a hypothetical $10,000 investment in Class A shares of Columbia Alternative Beta Fund during the stated time period, and does not reflect the deduction of taxes that a shareholder may pay on Fund distributions or on the redemption of Fund shares.
| Portfolio breakdown (%) (at May 31, 2018) |
| Money Market Funds | 100.0 |
| Total | 100.0 |
Percentages indicated are based upon total investments. The Fund’s portfolio composition is subject to change.
| Market exposure through derivatives investments (% of notional exposure) (at May 31, 2018)(a) |
| | Long | Short | Net |
| Fixed Income Derivative Contracts | 21.1 | — | 21.1 |
| Commodities Derivative Contracts | 27.6 | — | 27.6 |
| Equity Derivative Contracts | 30.3 | — | 30.3 |
| Foreign Currency Derivative Contracts | 21.9 | (0.9) | 21.0 |
| Total Notional Market Value of Derivative Contracts | 100.9 | (0.9) | 100.0 |
(a) The Fund has market exposure (long and/or short) to fixed income, commodity and equity asset classes and foreign currency through its investments in derivatives. The notional exposure of a financial instrument is the nominal or face amount that is used to calculate payments made on that instrument and/or changes in value for the instrument. The notional exposure is a hypothetical underlying quantity upon which payment obligations are computed. Notional exposures provide a gauge for how the Fund may behave given changes in individual markets. For a description of the Fund’s investments in derivatives, see Investments in derivatives following the Consolidated Portfolio of Investments, and Note 2 to the Notes to Consolidated Financial Statements.
Columbia Alternative Beta Fund | Annual Report 2018
| 3 |
Manager Discussion of Fund Performance
For the 12-month period that ended May 31, 2018, the Fund’s Class A shares returned -5.49% excluding sales charges. To compare, the FTSE One-Month U.S. Treasury Bill Index returned 1.20% and the HFRX Global Hedge Fund Index returned 2.88% over the same period. As an absolute return fund, it does not seek to measure itself against a particular benchmark and thus comparisons to the FTSE One-Month U.S. Treasury Bill Index and the HFRX Global Hedge Fund Index are for information purposes only. This multi-strategy, multi-asset class risk premia fund accesses various alternative beta investment strategies that offer return opportunities typically not available from traditional investments.
U.S. capital markets experienced divergent backdrops during reporting period
U.S. capital markets experienced divergent backdrops during the 12-month period ended May 31, 2018. From the start of the period in early June 2017 through most of January 2018, U.S. equities recorded gains, supported by discussion and then enactment of tax reform, reasonably strong economic activity, rising commodity prices and favorable corporate earnings reports. Market volatility was unusually low. In early February 2018, however, equities sold off globally on market speculation of a faster pace of interest rate hikes by the Federal Reserve (the Fed), exacerbated by solid U.S. labor and inflation data. Such speculation, in turn, stoked a sharp rise in bond yields and an increase in equity market volatility toward more historically normal levels. Heightened volatility persisted through most of the remainder of the period, driven not only by new Fed Chair Powell’s hawkish tilt but also by escalating trade tensions and tariffs, surfacing uncertainty about sanctions on Russia and anticipation about a potential summit between the leaders of the U.S. and North Korea. Most U.S. equity market indices generated negative returns during the last four months of the period. All told, the Fed raised short-term U.S. interest rates three times during the period — in June and December 2017 and in March 2018. These rate hikes, along with a number of macroeconomic drivers, pushed up U.S. Treasury yields across the spectrum of maturities, with the 10-year U.S. Treasury yield breaching 3% toward the end of April 2018 before rallying modestly to end the period at 2.83%.
Fixed-income positions hampered Fund results most
The Fund was 100% allocated to alternative beta strategies. Alternative beta strategies represent those strategies associated with the systematic risks embedded in capital markets and are driven primarily by: 1) academically-supported forms of risk premia (e.g. value, momentum, quality, etc.) and 2) investor-based behavioral biases, industry needs, structures and constraints (e.g., short-term volatility, commodity curve, etc.). In implementing these alternative beta strategies, the Fund maintains a multi-asset class, multi-style portfolio invested across specific risk premia styles in equity, fixed-income, credit, currency, commodity and volatility-based strategies. This broadly invested, absolute return Fund is managed to a 7.5% volatility target relying on risk parity and risk targeting concepts.
During the period, the primary detractor from the Fund’s performance was its fixed-income suite of positions. Equity, currency and volatility positions also detracted. Conversely, the Fund’s returns were buoyed by holdings in the commodity and credit asset classes. As alternative beta positions typically perform with little correlation to one another, this disparate performance among asset classes and styles is to be expected and indeed is the primary rationale for holding such a broadly invested portfolio.
All of the Fund’s individual alternative risk premia positions are long/short alternative baskets designed to be market neutral to broad market betas. In aggregate, the Fund is designed to exhibit very little to zero correlation to traditional market exposures.
Re-balances are based on highly systematic methodology
The Fund adheres to a highly systematic allocation methodology based on modified risk parity concepts. Our team constructs a strategic allocation at the asset class level and then rebalances each of the underlying positions intra-asset class to achieve as close to parity as possible. The Fund’s allocation is revisited formally once per week. The decision to reduce the Fund’s exposure to the volatility-based strategy was made in early 2018, which helped mitigate some of the challenges in this area. No other material changes were made to the Fund’s positioning during the period. The number of individual positions held increased, but this was expected and a natural part of the Fund’s evolution since taking on this mandate in October 2016. Confident in the highly systematic methodology as being what we believe to be the best long-term approach to building an alternative risk premia portfolio, we do not seek to use discretion to over-ride this system.
| 4 | Columbia Alternative Beta Fund | Annual Report 2018 |
Manager Discussion of Fund Performance (continued)
Derivative positions
The Fund utilizes derivatives for both hedging and non-hedging purposes, including, for example, seeking to enhance returns or as a substitute for a position in an underlying asset, instrument, or other reference, to increase market exposure and investment flexibility, or to obtain or reduce particular exposures. During the period, the Fund used tri-party swap agreements with a small group of approved counterparty bank providers to more efficiently and cost effectively manage its exposures. These flexible structures, which allow for direct and highly versatile portfolio management applications, detracted from the Fund’s results during the period.
Market risk may affect a single issuer, sector of the economy, industry or the market as a whole. Alternative investments cover a broad range of strategies and structures designed to be low or non-correlated to traditional equity and fixed-income markets and involve substantial risks and are more volatile than traditional investments, making them more suitable for investors with an above average-tolerance for risk. The Fund’s use of leverage allows for investment exposure in excess of net assets, thereby magnifying volatility of returns and risk of loss. Commodity investments may be affected by the overall market and industry- and commodity-specific factors, and may be more volatile and less liquid than other investments. Investing in derivatives is a specialized activity that involves special risks that subject the Fund to significant loss potential, including when used as leverage, and may result in greater fluctuation in fund value. Foreign investments subject the fund to risks, including political, economic, market, social and others within a particular country, as well as to currency instabilities and less stringent financial and accounting standards than those generally applicable to U.S. issuers. The sales price the Fund (or its underlying investments) could receive for any particular investment may differ from the Fund’s (or underlying investments’) valuation of the investment. As a non-diversified fund, fewer investments could have a greater effect on performance. See the Fund’s prospectus for more information on these and other risks.
The views expressed in this report reflect the current views of the respective parties. These views are not guarantees of future performance and involve certain risks, uncertainties and assumptions that are difficult to predict, so actual outcomes and results may differ significantly from the views expressed. These views are subject to change at any time based upon economic, market or other conditions and the respective parties disclaim any responsibility to update such views. These views may not be relied on as investment advice and, because investment decisions for a Columbia fund are based on numerous factors, may not be relied on as an indication of trading intent on behalf of any particular Columbia fund. References to specific securities should not be construed as a recommendation or investment advice.
Columbia Alternative Beta Fund | Annual Report 2018
| 5 |
Understanding Your Fund’s Expenses
(Unaudited)
As an investor, you incur two types of costs. There are transaction costs, which generally include sales charges on purchases and may include redemption fees. There are also ongoing costs, which generally include management fees, distribution and/or service fees, and other fund expenses. The following information is intended to help you understand your ongoing costs (in dollars) of investing in the Fund and to help you compare these costs with the ongoing costs of investing in other mutual funds.
Analyzing your Fund’s expenses
To illustrate these ongoing costs, we have provided examples and calculated the expenses paid by investors in each share class of the Fund during the period. The actual and hypothetical information in the table is based on an initial investment of $1,000 at the beginning of the period indicated and held for the entire period. Expense information is calculated two ways and each method provides you with different information. The amount listed in the “Actual” column is calculated using the Fund’s actual operating expenses and total return for the period. You may use the Actual information, together with the amount invested, to estimate the expenses that you paid over the period. Simply divide your account value by $1,000 (for example, an $8,600 account value divided by $1,000 = 8.6), then multiply the results by the expenses paid during the period under the “Actual” column. The amount listed in the “Hypothetical” column assumes a 5% annual rate of return before expenses (which is not the Fund’s actual return) and then applies the Fund’s actual expense ratio for the period to the hypothetical return. You should not use the hypothetical account values and expenses to estimate either your actual account balance at the end of the period or the expenses you paid during the period. See “Compare with other funds” below for details on how to use the hypothetical data.
Compare with other funds
Since all mutual funds are required to include the same hypothetical calculations about expenses in shareholder reports, you can use this information to compare the ongoing cost of investing in the Fund with other funds. To do so, compare the hypothetical example with the 5% hypothetical examples that appear in the shareholder reports of other funds. As you compare hypothetical examples of other funds, it is important to note that hypothetical examples are meant to highlight the ongoing costs of investing in a fund only and do not reflect any transaction costs, such as sales charges, or redemption or exchange fees. Therefore, the hypothetical calculations are useful in comparing ongoing costs only, and will not help you determine the relative total costs of owning different funds. If transaction costs were included in these calculations, your costs would be higher.
| December 1, 2017 — May 31, 2018 |
| | Account value at the
beginning of the
period ($) | Account value at the
end of the
period ($) | Expenses paid during
the period ($) | Fund’s annualized
expense ratio (%) |
| | Actual | Hypothetical | Actual | Hypothetical | Actual | Hypothetical | Actual |
| Class A | 1,000.00 | 1,000.00 | 915.80 | 1,018.60 | 6.07 | 6.39 | 1.27 |
| Advisor Class | 1,000.00 | 1,000.00 | 917.10 | 1,019.85 | 4.88 | 5.14 | 1.02 |
| Class C | 1,000.00 | 1,000.00 | 911.90 | 1,014.86 | 9.63 | 10.15 | 2.02 |
| Institutional Class | 1,000.00 | 1,000.00 | 916.20 | 1,019.85 | 4.87 | 5.14 | 1.02 |
| Institutional 2 Class | 1,000.00 | 1,000.00 | 917.00 | 1,020.39 | 4.35 | 4.58 | 0.91 |
| Institutional 3 Class | 1,000.00 | 1,000.00 | 917.20 | 1,020.74 | 4.02 | 4.23 | 0.84 |
| Class R | 1,000.00 | 1,000.00 | 914.50 | 1,017.35 | 7.26 | 7.64 | 1.52 |
| Class T | 1,000.00 | 1,000.00 | 914.70 | 1,018.60 | 6.06 | 6.39 | 1.27 |
Expenses paid during the period are equal to the annualized expense ratio for each class as indicated above, multiplied by the average account value over the period and then multiplied by the number of days in the Fund’s most recent fiscal half year and divided by 365.
Expenses do not include fees and expenses incurred indirectly by the Fund from its investment in underlying funds, including affiliated and non-affiliated pooled investment vehicles, such as mutual funds and exchange-traded funds.
Had Columbia Management Investment Advisers, LLC and/or certain of its affiliates not waived/reimbursed certain fees and expenses, account value at the end of the period would have been reduced.
| 6 | Columbia Alternative Beta Fund | Annual Report 2018 |
Consolidated Portfolio of Investments
May 31, 2018
(Percentages represent value of investments compared to net assets)
Investments in securities
| Money Market Funds 100.8% |
| | Shares | Value ($) |
| Columbia Short-Term Cash Fund, 1.907%(a),(b) | 743,722,362 | 743,722,362 |
Total Money Market Funds
(Cost $743,704,686) | 743,722,362 |
Total Investments in Securities
(Cost: $743,704,686) | 743,722,362 |
| Other Assets & Liabilities, Net | | (5,621,592) |
| Net Assets | 738,100,770 |
At May 31, 2018, securities and/or cash totaling $28,800,000 were pledged as collateral.
Investments in derivatives
| Forward foreign currency exchange contracts |
Currency to
be sold | Currency to
be purchased | Counterparty | Settlement
date | Unrealized
appreciation ($) | Unrealized
depreciation ($) |
| 489,217,000 JPY | 4,479,103 USD | HSBC | 07/09/2018 | — | (29,425) |
| 789,100 USD | 85,400,000 JPY | HSBC | 07/09/2018 | — | (2,071) |
| 47,620,000 CAD | 37,249,439 USD | Morgan Stanley | 07/09/2018 | 486,132 | — |
| 8,427,000 EUR | 10,100,637 USD | Morgan Stanley | 07/09/2018 | 221,020 | — |
| 3,487,175 USD | 4,513,000 CAD | Morgan Stanley | 07/09/2018 | — | (3,076) |
| 2,405,109 USD | 2,056,000 EUR | Morgan Stanley | 07/09/2018 | 5,297 | — |
| 6,350,357 USD | 4,670,000 GBP | Morgan Stanley | 07/09/2018 | — | (130,770) |
| Total | | | | 712,449 | (165,342) |
| Total return swap contracts |
| Fund receives | Fund pays | Payment
frequency | Counterparty | Maturity
date | Notional
currency | Notional
amount | Value
($) | Periodic
payments
receivable
(payable)
($) | Upfront
payments | Upfront
receipts | Unrealized
appreciation
($) | Unrealized
depreciation
($) |
| Total return on Barclays Backwardation Alpha Bloomberg CI Index ER† | Fixed rate of 0.350% | Monthly | Barclays | 11/30/2018 | USD | 97,204,086 | 1,113,107 †† | (29,296) | — | — | 1,083,811 | — |
| Total return on Barclays Commodity Hedging Insights 2 Index† | Fixed rate of 0.150% | Monthly | Barclays | 11/30/2018 | USD | 57,308,240 | 944,076 †† | (7,164) | — | — | 936,912 | — |
| Total return on Barclays Commodity Hedging Insights 2 Index† | Fixed rate of 0.150% | Monthly | Barclays | 11/30/2018 | USD | 34,091,145 | 363,207 †† | (2,887) | — | — | 360,320 | — |
The accompanying Notes to Consolidated Financial Statements are an integral part of this statement.
Columbia Alternative Beta Fund | Annual Report 2018
| 7 |
Consolidated Portfolio of Investments (continued)
May 31, 2018
| Total return swap contracts (continued) |
| Fund receives | Fund pays | Payment
frequency | Counterparty | Maturity
date | Notional
currency | Notional
amount | Value
($) | Periodic
payments
receivable
(payable)
($) | Upfront
payments | Upfront
receipts | Unrealized
appreciation
($) | Unrealized
depreciation
($) |
| Total return on Barclays Backwardation Alpha Bloomberg CI Index ER† | Fixed rate of 0.350% | Monthly | Barclays | 11/30/2018 | USD | 23,281,757 | 266,605 †† | (7,017) | — | — | 259,588 | — |
| Total return on Barclays Commodity Hedging Insights 2 Index† | Fixed rate of 0.150% | Monthly | Barclays | 11/30/2018 | USD | 14,275,075 | 235,162 †† | (1,784) | — | — | 233,378 | — |
| Total return on Barclays Backwardation Alpha Bloomberg CI Index ER† | Fixed rate of 0.350% | Monthly | Barclays | 11/30/2018 | USD | 6,742,651 | 166,281 †† | (1,840) | — | — | 164,441 | — |
| Total return on Barclays Backwardation Alpha Bloomberg CI Index ER† | Fixed rate of 0.350% | Monthly | Barclays | 11/30/2018 | USD | 12,503,048 | 143,176 †† | (3,647) | — | — | 139,529 | — |
| Total return on Barclays TrendStar+ Alt Roll 2 Index† | Fixed rate of 0.600% | Monthly | Barclays | 11/30/2018 | USD | 139,084,888 | 171,804 †† | (69,542) | — | — | 102,262 | — |
| Total return on Barclays Commodity Hedging Insights 2 Index† | Fixed rate of 0.150% | Monthly | Barclays | 11/30/2018 | USD | 3,804,127 | 62,668 †† | (476) | — | — | 62,192 | — |
| Total return on Barclays Backwardation Alpha Bloomberg CI Index ER† | Fixed rate of 0.350% | Monthly | Barclays | 11/30/2018 | USD | 5,039,726 | 57,711 †† | (1,470) | — | — | 56,241 | — |
| Total return on Barclays Commodity Hedging Insights 2 Index† | Fixed rate of 0.150% | Monthly | Barclays | 11/30/2018 | USD | 1,876,784 | 30,918 †† | (235) | — | — | 30,683 | — |
| Total return on Barclays Backwardation Alpha Bloomberg CI Index ER† | Fixed rate of 0.350% | Monthly | Barclays | 11/30/2018 | USD | 2,630,940 | 30,127 †† | (767) | — | — | 29,360 | — |
| Total return on Barclays Backwardation Alpha Bloomberg CI Index ER† | Fixed rate of 0.350% | Monthly | Barclays | 11/30/2018 | USD | 2,624,593 | 30,055 †† | (766) | — | — | 29,289 | — |
The accompanying Notes to Consolidated Financial Statements are an integral part of this statement.
| 8 | Columbia Alternative Beta Fund | Annual Report 2018 |
Consolidated Portfolio of Investments (continued)
May 31, 2018
| Total return swap contracts (continued) |
| Fund receives | Fund pays | Payment
frequency | Counterparty | Maturity
date | Notional
currency | Notional
amount | Value
($) | Periodic
payments
receivable
(payable)
($) | Upfront
payments | Upfront
receipts | Unrealized
appreciation
($) | Unrealized
depreciation
($) |
| Total return on Barclays Commodity Hedging Insights 2 Index† | Fixed rate of 0.150% | Monthly | Barclays | 11/30/2018 | USD | 1,751,335 | 28,851 †† | (430) | — | — | 28,421 | — |
| Total return on Barclays Commodity Hedging Insights 2 Index† | Fixed rate of 0.150% | Monthly | Barclays | 11/30/2018 | USD | 1,323,670 | 21,805 †† | (165) | — | — | 21,640 | — |
| Total return on Barclays TrendStar+ Alt Roll 2 Index† | Fixed rate of 0.600% | Monthly | Barclays | 11/30/2018 | USD | 1,795,377 | 17,242 †† | (463) | 663 | — | 16,116 | — |
| Total return on Barclays TrendStar+ Alt Roll 2 Index† | Fixed rate of 0.600% | Monthly | Barclays | 11/30/2018 | USD | 30,473,427 | 37,642 †† | (15,237) | 7,204 | — | 15,201 | — |
| Total return on Barclays TrendStar+ Alt Roll 2 Index† | Fixed rate of 0.600% | Monthly | Barclays | 11/30/2018 | USD | 23,384,746 | 28,886 †† | (11,692) | 4,309 | — | 12,885 | — |
| Total return on Barclays Backwardation Alpha Bloomberg CI Index ER† | Fixed rate of 0.350% | Monthly | Barclays | 11/30/2018 | USD | 1,000,752 | 11,460 †† | (292) | — | — | 11,168 | — |
| Total return on Barclays TrendStar+ Alt Roll 2 Index† | Fixed rate of 0.600% | Monthly | Barclays | 11/30/2018 | USD | 5,019,710 | 6,201 †† | (2,510) | 962 | — | 2,729 | — |
| Total return on Barclays TrendStar+ Alt Roll 2 Index† | Fixed rate of 0.600% | Monthly | Barclays | 11/30/2018 | USD | 3,674,944 | 4,540 †† | (1,899) | 735 | — | 1,906 | — |
| Total return on Barclays TrendStar+ Alt Roll 2 Index† | Fixed rate of 0.600% | Monthly | Barclays | 11/30/2018 | USD | 262,253 | 324 †† | (131) | 75 | — | 118 | — |
| Total return on Barclays Commodity Strategy 1692 Index Excess Return† | Fixed rate of 0.500% | Monthly | Barclays | 11/30/2018 | USD | 646,677 | (167) †† | (278) | — | — | — | (445) |
| Total return on Barclays TrendStar+ Alt Roll 2 Index† | Fixed rate of 0.600% | Monthly | Barclays | 11/30/2018 | USD | 1,478,248 | 1,826 †† | (1,843) | 481 | — | — | (498) |
The accompanying Notes to Consolidated Financial Statements are an integral part of this statement.
Columbia Alternative Beta Fund | Annual Report 2018
| 9 |
Consolidated Portfolio of Investments (continued)
May 31, 2018
| Total return swap contracts (continued) |
| Fund receives | Fund pays | Payment
frequency | Counterparty | Maturity
date | Notional
currency | Notional
amount | Value
($) | Periodic
payments
receivable
(payable)
($) | Upfront
payments | Upfront
receipts | Unrealized
appreciation
($) | Unrealized
depreciation
($) |
| Total return on Barclays Commodity Strategy 1692 Index Excess Return† | Fixed rate of 0.500% | Monthly | Barclays | 11/30/2018 | USD | 8,818,458 | (2,272) †† | (3,797) | — | — | — | (6,069) |
| Total return on Barclays Dualis Volatility Weighted Index† | Fixed rate of 0.540% | Monthly | Barclays | 11/30/2018 | USD | 1,593,315 | (4,822) †† | (1,527) | — | — | — | (6,349) |
| Total return on Barclays Commodity Strategy 1692 Index Excess Return† | Fixed rate of 0.500% | Monthly | Barclays | 11/30/2018 | USD | 10,285,410 | (2,650) †† | (4,730) | — | — | — | (7,380) |
| Total return on Barclays Commodity Strategy 1692 Index Excess Return† | Fixed rate of 0.500% | Monthly | Barclays | 11/30/2018 | USD | 16,612,081 | (4,281) †† | (7,152) | — | — | — | (11,433) |
| Total return on Barclays Commodity Strategy 1692 Index Excess Return† | Fixed rate of 0.500% | Monthly | Barclays | 11/30/2018 | USD | 52,899,583 | (13,632) †† | (22,776) | — | — | — | (36,408) |
| Total return on Barclays Dualis Volatility Weighted Index† | Fixed rate of 0.540% | Monthly | Barclays | 11/30/2018 | USD | 79,939,656 | (241,922) †† | (35,973) | — | — | — | (277,895) |
| Total return on Barclays Dualis Volatility Weighted Index† | Fixed rate of 0.540% | Monthly | Barclays | 11/30/2018 | USD | 85,736,441 | (259,466) †† | (38,581) | — | — | — | (298,047) |
| Total return on Citi Curve Composite (DJ-UBSCI wtd) Balanced Alpha† | Fixed rate of 0.300% | Monthly | Citi | 11/30/2018 | USD | 230,824,322 | 1,528,500 †† | (59,630) | — | — | 1,468,870 | — |
| Total return on Citi Curve Composite (DJ-UBSCI wtd) Balanced Alpha† | Fixed rate of 0.300% | Monthly | Citi | 11/30/2018 | USD | 66,114,376 | 437,804 †† | (19,753) | — | — | 418,051 | — |
| Total return on Citi Curve Composite (DJ-UBSCI wtd) Balanced Alpha† | Fixed rate of 0.300% | Monthly | Citi | 11/30/2018 | USD | 10,301,875 | 68,218 †† | (2,661) | — | — | 65,557 | — |
The accompanying Notes to Consolidated Financial Statements are an integral part of this statement.
| 10 | Columbia Alternative Beta Fund | Annual Report 2018 |
Consolidated Portfolio of Investments (continued)
May 31, 2018
| Total return swap contracts (continued) |
| Fund receives | Fund pays | Payment
frequency | Counterparty | Maturity
date | Notional
currency | Notional
amount | Value
($) | Periodic
payments
receivable
(payable)
($) | Upfront
payments | Upfront
receipts | Unrealized
appreciation
($) | Unrealized
depreciation
($) |
| Total return on Citi Curve Composite (DJ-UBSCI wtd) Balanced Alpha† | Fixed rate of 0.300% | Monthly | Citi | 11/30/2018 | USD | 8,482,964 | 56,173 †† | (2,191) | — | — | 53,982 | — |
| Total return on Citi Curve Composite (DJ-UBSCI wtd) Balanced Alpha† | Fixed rate of 0.300% | Monthly | Citi | 11/30/2018 | USD | 6,042,433 | 40,013 †† | (1,561) | — | — | 38,452 | — |
| Total return on Citi Curve Composite (DJ-UBSCI wtd) Balanced Alpha† | Fixed rate of 0.300% | Monthly | Citi | 11/30/2018 | USD | 5,296,554 | 35,073 †† | (1,368) | — | — | 33,705 | — |
| Total return on Citi Curve Composite (DJ-UBSCI wtd) Balanced Alpha† | Fixed rate of 0.300% | Monthly | Citi | 11/30/2018 | USD | 5,031,532 | 33,319 †† | (1,300) | — | — | 32,019 | — |
| Total return on Citi Curve Composite (DJ-UBSCI wtd) Balanced Alpha† | Fixed rate of 0.300% | Monthly | Citi | 11/30/2018 | USD | 3,798,646 | 25,154 †† | (981) | — | — | 24,173 | — |
| Total return on Citi Commodities Congestion Pre-Post Roll Alpha (B) Index† | Fixed rate of 0.270% | Monthly | Citi | 11/30/2018 | USD | 254,105,293 | 80,121 †† | (59,080) | — | — | 21,041 | — |
| Total return on Citi Commodities Congestion Pre-Post Roll Alpha (B) Index† | Fixed rate of 0.270% | Monthly | Citi | 11/30/2018 | USD | 76,763,291 | 24,204 †† | (17,847) | — | — | 6,357 | — |
| Total return on Citi Curve Composite (DJ-UBSCI wtd) Balanced Alpha† | Fixed rate of 0.300% | Monthly | Citi | 11/30/2018 | USD | 793,771 | 5,256 †† | (205) | — | — | 5,051 | — |
| Total return on Citi Commodities Congestion Pre-Post Roll Alpha (B) Index† | Fixed rate of 0.270% | Monthly | Citi | 11/30/2018 | USD | 4,686,993 | 1,478 †† | (1,090) | — | — | 388 | — |
| Total return on Citi Commodities Congestion Pre-Post Roll Alpha (B) Index† | Fixed rate of 0.270% | Monthly | Citi | 11/30/2018 | USD | 1,594,826 | 503 †† | (371) | — | — | 132 | — |
| Total return on Citi Commodities Congestion Pre-Post Roll Alpha (B) Index† | Fixed rate of 0.270% | Monthly | Citi | 11/30/2018 | USD | 1,119,735 | 353 †† | (2,631) | — | — | — | (2,278) |
The accompanying Notes to Consolidated Financial Statements are an integral part of this statement.
Columbia Alternative Beta Fund | Annual Report 2018
| 11 |
Consolidated Portfolio of Investments (continued)
May 31, 2018
| Total return swap contracts (continued) |
| Fund receives | Fund pays | Payment
frequency | Counterparty | Maturity
date | Notional
currency | Notional
amount | Value
($) | Periodic
payments
receivable
(payable)
($) | Upfront
payments | Upfront
receipts | Unrealized
appreciation
($) | Unrealized
depreciation
($) |
| Total return on Deutsche Bank Haven Plus - USD Excess Return† | Fixed rate of 0.000% | Monthly | Deutsche Bank | 11/30/2018 | USD | 1,577,213 | 15,402 †† | — | — | — | 15,402 | — |
| Total return on Deutsche Bank Haven Plus - USD Excess Return† | Fixed rate of 0.000% | Monthly | Deutsche Bank | 11/30/2018 | USD | 297,554 | (6,856) †† | — | — | — | — | (6,856) |
| Total return on Deutsche Bank Currency Valuation - USD Excess Return† | Fixed rate of 0.000% | Monthly | Deutsche Bank | 11/30/2018 | USD | 1,080,335 | (18,919) †† | — | — | — | — | (18,919) |
| Total return on Deutsche Bank Currency Valuation - USD Excess Return† | Fixed rate of 0.000% | Monthly | Deutsche Bank | 11/30/2018 | USD | 1,512,240 | (26,483) †† | — | — | — | — | (26,483) |
| Total return on Deutsche Bank Currency Valuation - USD Excess Return† | Fixed rate of 0.000% | Monthly | Deutsche Bank | 11/30/2018 | USD | 3,391,169 | (29,228) †† | — | — | — | — | (29,228) |
| Total return on Deutsche Bank Currency Valuation - USD Excess Return† | Fixed rate of 0.000% | Monthly | Deutsche Bank | 11/30/2018 | USD | 2,029,742 | (35,546) †† | — | — | — | — | (35,546) |
| Total return on Deutsche Bank Currency Valuation - USD Excess Return† | Fixed rate of 0.000% | Monthly | Deutsche Bank | 11/30/2018 | USD | 2,032,503 | (35,594) †† | — | — | — | — | (35,594) |
| Total return on Deutsche Bank Currency Valuation - USD Excess Return† | Fixed rate of 0.000% | Monthly | Deutsche Bank | 11/30/2018 | USD | 2,103,145 | (36,831) †† | — | — | — | — | (36,831) |
| Total return on Deutsche Bank Currency Valuation - USD Excess Return† | Fixed rate of 0.000% | Monthly | Deutsche Bank | 11/30/2018 | USD | 2,120,863 | (37,142) †† | — | — | — | — | (37,142) |
| Total return on Deutsche Bank Haven Plus - USD Excess Return† | Fixed rate of 0.000% | Monthly | Deutsche Bank | 11/30/2018 | USD | 2,012,788 | (46,374) †† | — | — | — | — | (46,374) |
The accompanying Notes to Consolidated Financial Statements are an integral part of this statement.
| 12 | Columbia Alternative Beta Fund | Annual Report 2018 |
Consolidated Portfolio of Investments (continued)
May 31, 2018
| Total return swap contracts (continued) |
| Fund receives | Fund pays | Payment
frequency | Counterparty | Maturity
date | Notional
currency | Notional
amount | Value
($) | Periodic
payments
receivable
(payable)
($) | Upfront
payments | Upfront
receipts | Unrealized
appreciation
($) | Unrealized
depreciation
($) |
| Total return on Deutsche Bank Haven Plus - USD Excess Return† | Fixed rate of 0.000% | Monthly | Deutsche Bank | 11/30/2018 | USD | 2,101,991 | (48,429) †† | — | — | — | — | (48,429) |
| Total return on Deutsche Bank Currency Valuation - USD Excess Return† | Fixed rate of 0.000% | Monthly | Deutsche Bank | 11/30/2018 | USD | 5,007,970 | (87,702) †† | — | — | — | — | (87,702) |
| Total return on Deutsche Bank Currency Valuation - USD Excess Return† | Fixed rate of 0.000% | Monthly | Deutsche Bank | 11/30/2018 | USD | 5,276,731 | (92,409) †† | — | — | — | — | (92,409) |
| Total return on Deutsche Bank Currency Valuation - USD Excess Return† | Fixed rate of 0.000% | Monthly | Deutsche Bank | 11/30/2018 | USD | 5,701,962 | (99,856) †† | — | — | — | — | (99,856) |
| Total return on Deutsche Bank Currency Valuation - USD Excess Return† | Fixed rate of 0.000% | Monthly | Deutsche Bank | 11/30/2018 | USD | 8,021,405 | (140,475) †† | — | — | — | — | (140,475) |
| Total return on Deutsche Bank Currency Valuation - USD Excess Return† | Fixed rate of 0.000% | Monthly | Deutsche Bank | 11/30/2018 | USD | 9,098,519 | (159,338) †† | — | — | — | — | (159,338) |
| Total return on Deutsche Bank Haven Plus - USD Excess Return† | Fixed rate of 0.000% | Monthly | Deutsche Bank | 11/30/2018 | USD | 7,375,127 | (169,921) †† | — | — | — | — | (169,921) |
| Total return on Deutsche Bank Haven Plus - USD Excess Return† | Fixed rate of 0.000% | Monthly | Deutsche Bank | 11/30/2018 | USD | 19,311,682 | (444,936) †† | — | — | — | — | (444,936) |
| Total return on Deutsche Bank Haven Plus - USD Excess Return† | Fixed rate of 0.000% | Monthly | Deutsche Bank | 11/30/2018 | USD | 19,622,298 | (452,093) †† | — | — | — | — | (452,093) |
| Total return on Deutsche Bank Haven Plus - USD Excess Return† | Fixed rate of 0.000% | Monthly | Deutsche Bank | 11/30/2018 | USD | 29,535,870 | (680,499) †† | — | — | — | — | (680,499) |
The accompanying Notes to Consolidated Financial Statements are an integral part of this statement.
Columbia Alternative Beta Fund | Annual Report 2018
| 13 |
Consolidated Portfolio of Investments (continued)
May 31, 2018
| Total return swap contracts (continued) |
| Fund receives | Fund pays | Payment
frequency | Counterparty | Maturity
date | Notional
currency | Notional
amount | Value
($) | Periodic
payments
receivable
(payable)
($) | Upfront
payments | Upfront
receipts | Unrealized
appreciation
($) | Unrealized
depreciation
($) |
| Total return on Deutsche Bank Currency Valuation - USD Excess Return† | Fixed rate of 0.000% | Monthly | Deutsche Bank | 11/30/2018 | USD | 59,716,434 | (1,045,788) †† | — | — | — | — | (1,045,788) |
| Total return on Deutsche Bank Haven Plus - USD Excess Return† | Fixed rate of 0.000% | Monthly | Deutsche Bank | 11/30/2018 | USD | 46,558,874 | (1,072,704) †† | — | — | — | — | (1,072,704) |
| Total return on Deutsche Bank Currency Valuation - USD Excess Return† | Fixed rate of 0.000% | Monthly | Deutsche Bank | 11/30/2018 | USD | 229,061,492 | (4,011,454) †† | — | — | — | — | (4,011,454) |
| Total return on Goldman Sachs RP Equity World Long Short Series 37 Excess Return† | Fixed rate of 0.000% | Monthly | Goldman Sachs International | 11/30/2018 | USD | 363,646,592 | 408,025 †† | — | — | — | 408,025 | — |
| Total return on Goldman Sachs Equity Volatility Carry Series 28 Excess Return Strategy† | Fixed rate of 0.100% | Monthly | Goldman Sachs International | 11/30/2018 | USD | 44,119,242 | 169,244 †† | (11,030) | — | — | 158,214 | — |
| Total return on Goldman Sachs RP Equity World Long Short Series 37 Excess Return† | Fixed rate of 0.000% | Monthly | Goldman Sachs International | 11/30/2018 | USD | 132,228,422 | 148,365 †† | — | — | — | 148,365 | — |
| Total return on Goldman Sachs Curve Index RP09† | Fixed rate of 0.110% | Monthly | Goldman Sachs International | 11/30/2018 | USD | 239,838,057 | 166,642 †† | (21,985) | — | — | 144,657 | — |
| Total return on Goldman Sachs Curve Index C0210† | Fixed rate of -0.020% | Monthly | Goldman Sachs International | 11/30/2018 | USD | 228,779,619 | 91,108 †† | 3,813 | — | — | 94,921 | — |
| Total return on Goldman Sachs Curve Index RP09† | Fixed rate of 0.110% | Monthly | Goldman Sachs International | 11/30/2018 | USD | 65,736,290 | 45,674 †† | (6,943) | — | — | 38,731 | — |
The accompanying Notes to Consolidated Financial Statements are an integral part of this statement.
| 14 | Columbia Alternative Beta Fund | Annual Report 2018 |
Consolidated Portfolio of Investments (continued)
May 31, 2018
| Total return swap contracts (continued) |
| Fund receives | Fund pays | Payment
frequency | Counterparty | Maturity
date | Notional
currency | Notional
amount | Value
($) | Periodic
payments
receivable
(payable)
($) | Upfront
payments | Upfront
receipts | Unrealized
appreciation
($) | Unrealized
depreciation
($) |
| Total return on Goldman Sachs Equity Volatility Carry Series 28 Excess Return Strategy† | Fixed rate of 0.100% | Monthly | Goldman Sachs International | 11/30/2018 | USD | 4,901,318 | 18,801 †† | (408) | — | — | 18,393 | — |
| Total return on Goldman Sachs Curve Index C0210† | Fixed rate of -0.020% | Monthly | Goldman Sachs International | 11/30/2018 | USD | 40,667,782 | 16,195 †† | 678 | — | — | 16,873 | — |
| Total return on Goldman Sachs RP Equity World Long Short Series 37 Excess Return† | Fixed rate of 0.000% | Monthly | Goldman Sachs International | 11/30/2018 | USD | 9,462,865 | 10,618 †† | — | — | — | 10,618 | — |
| Total return on Goldman Sachs RP Equity World Long Short Series 37 Excess Return† | Fixed rate of 0.000% | Monthly | Goldman Sachs International | 11/30/2018 | USD | 9,429,815 | 10,581 †† | — | — | — | 10,581 | — |
| Total return on Goldman Sachs Equity Volatility Carry Series 28 Excess Return Strategy† | Fixed rate of 0.100% | Monthly | Goldman Sachs International | 11/30/2018 | USD | 2,327,481 | 8,928 †† | (194) | — | — | 8,734 | — |
| Total return on Goldman Sachs RP Equity World Long Short Series 37 Excess Return† | Fixed rate of 0.000% | Monthly | Goldman Sachs International | 11/30/2018 | USD | 6,860,007 | 7,697 †† | — | — | — | 7,697 | — |
| Total return on Goldman Sachs Equity Volatility Carry Series 28 Excess Return Strategy† | Fixed rate of 0.100% | Monthly | Goldman Sachs International | 11/30/2018 | USD | 1,728,915 | 6,632 †† | (144) | — | — | 6,488 | — |
| Total return on Goldman Sachs RP Equity World Long Short Series 37 Excess Return† | Fixed rate of 0.100% | Monthly | Goldman Sachs International | 11/30/2018 | USD | 5,856,429 | 6,571 †† | (488) | — | — | 6,083 | — |
The accompanying Notes to Consolidated Financial Statements are an integral part of this statement.
Columbia Alternative Beta Fund | Annual Report 2018
| 15 |
Consolidated Portfolio of Investments (continued)
May 31, 2018
| Total return swap contracts (continued) |
| Fund receives | Fund pays | Payment
frequency | Counterparty | Maturity
date | Notional
currency | Notional
amount | Value
($) | Periodic
payments
receivable
(payable)
($) | Upfront
payments | Upfront
receipts | Unrealized
appreciation
($) | Unrealized
depreciation
($) |
| Total return on Goldman Sachs Equity Volatility Carry Series 28 Excess Return Strategy† | Fixed rate of 0.100% | Monthly | Goldman Sachs International | 11/30/2018 | USD | 1,508,002 | 5,785 †† | (126) | — | — | 5,659 | — |
| Total return on Goldman Sachs Equity Volatility Carry Series 28 Excess Return Strategy† | Fixed rate of 0.100% | Monthly | Goldman Sachs International | 11/30/2018 | USD | 1,501,414 | 5,759 †† | (125) | — | — | 5,634 | — |
| Total return on Goldman Sachs Equity Volatility Carry Series 28 Excess Return Strategy† | Fixed rate of 0.100% | Monthly | Goldman Sachs International | 11/30/2018 | USD | 1,436,901 | 5,512 †† | (120) | — | — | 5,392 | — |
| Total return on Goldman Sachs Curve Index RP09† | Fixed rate of 0.110% | Monthly | Goldman Sachs International | 11/30/2018 | USD | 8,829,651 | 6,135 †† | (809) | — | — | 5,326 | — |
| Total return on Goldman Sachs RP Equity World Long Short Series 37 Excess Return† | Fixed rate of 0.000% | Monthly | Goldman Sachs International | 11/30/2018 | USD | 3,722,057 | 4,176 †† | — | — | — | 4,176 | — |
| Total return on Goldman Sachs Curve Index RP09† | Fixed rate of 0.110% | Monthly | Goldman Sachs International | 11/30/2018 | USD | 6,315,281 | 4,388 †† | (579) | — | — | 3,809 | — |
| Total return on Goldman Sachs Equity Volatility Carry Series 28 Excess Return Strategy† | Fixed rate of 0.100% | Monthly | Goldman Sachs International | 11/30/2018 | USD | 998,823 | 3,831 †† | (83) | — | — | 3,748 | — |
| Total return on Goldman Sachs Curve Index C0210† | Fixed rate of -0.020% | Monthly | Goldman Sachs International | 11/30/2018 | USD | 8,720,517 | 3,473 †† | 145 | — | — | 3,618 | — |
| Total return on Goldman Sachs Equity Volatility Carry Series 28 Excess Return Strategy† | Fixed rate of 0.100% | Monthly | Goldman Sachs International | 11/30/2018 | USD | 953,050 | 3,656 †† | (79) | — | — | 3,577 | — |
The accompanying Notes to Consolidated Financial Statements are an integral part of this statement.
| 16 | Columbia Alternative Beta Fund | Annual Report 2018 |
Consolidated Portfolio of Investments (continued)
May 31, 2018
| Total return swap contracts (continued) |
| Fund receives | Fund pays | Payment
frequency | Counterparty | Maturity
date | Notional
currency | Notional
amount | Value
($) | Periodic
payments
receivable
(payable)
($) | Upfront
payments | Upfront
receipts | Unrealized
appreciation
($) | Unrealized
depreciation
($) |
| Total return on Goldman Sachs RP Equity World Long Short Series 37 Excess Return† | Fixed rate of 0.000% | Monthly | Goldman Sachs International | 11/30/2018 | USD | 3,180,558 | 3,569 †† | — | — | — | 3,569 | — |
| Total return on Goldman Sachs Curve Index C0210† | Fixed rate of -0.020% | Monthly | Goldman Sachs International | 11/30/2018 | USD | 8,556,412 | 3,407 †† | 143 | — | — | 3,550 | — |
| Total return on Goldman Sachs Curve Index C0210† | Fixed rate of -0.020% | Monthly | Goldman Sachs International | 11/30/2018 | USD | 8,069,569 | 3,214 †† | 134 | — | — | 3,348 | — |
| Total return on Goldman Sachs Curve Index RP09† | Fixed rate of 0.110% | Monthly | Goldman Sachs International | 11/30/2018 | USD | 4,777,720 | 3,320 †† | (438) | — | — | 2,882 | — |
| Total return on Goldman Sachs Curve Index RP09† | Fixed rate of 0.110% | Monthly | Goldman Sachs International | 11/30/2018 | USD | 4,417,137 | 3,069 †† | (405) | — | — | 2,664 | — |
| Total return on Goldman Sachs RP Equity World Long Short Series 37 Excess Return† | Fixed rate of 0.000% | Monthly | Goldman Sachs International | 11/30/2018 | USD | 2,227,825 | 2,500 †† | — | — | — | 2,500 | — |
| Total return on Goldman Sachs RP Equity World Long Short Series 37 Excess Return† | Fixed rate of 0.000% | Monthly | Goldman Sachs International | 11/30/2018 | USD | 2,406,189 | 2,700 †† | (201) | — | — | 2,499 | — |
| Total return on Goldman Sachs Curve Index RP09† | Fixed rate of 0.110% | Monthly | Goldman Sachs International | 11/30/2018 | USD | 3,783,343 | 2,630 †† | (347) | — | — | 2,283 | — |
| Total return on Goldman Sachs RP Equity World Long Short Series 37 Excess Return† | Fixed rate of 0.000% | Monthly | Goldman Sachs International | 11/30/2018 | USD | 2,023,834 | 2,271 †† | — | — | — | 2,271 | — |
| Total return on Goldman Sachs Curve Index RP09† | Fixed rate of 0.110% | Monthly | Goldman Sachs International | 11/30/2018 | USD | 3,528,856 | 2,452 †† | (324) | — | — | 2,128 | — |
The accompanying Notes to Consolidated Financial Statements are an integral part of this statement.
Columbia Alternative Beta Fund | Annual Report 2018
| 17 |
Consolidated Portfolio of Investments (continued)
May 31, 2018
| Total return swap contracts (continued) |
| Fund receives | Fund pays | Payment
frequency | Counterparty | Maturity
date | Notional
currency | Notional
amount | Value
($) | Periodic
payments
receivable
(payable)
($) | Upfront
payments | Upfront
receipts | Unrealized
appreciation
($) | Unrealized
depreciation
($) |
| Total return on Goldman Sachs Curve Index C0210† | Fixed rate of -0.020% | Monthly | Goldman Sachs International | 11/30/2018 | USD | 3,084,270 | 1,229 †† | 51 | — | — | 1,280 | — |
| Total return on Goldman Sachs Curve Index C0210† | Fixed rate of -0.020% | Monthly | Goldman Sachs International | 11/30/2018 | USD | 2,207,852 | 879 †† | 92 | — | — | 971 | — |
| Total return on Goldman Sachs Curve Index RP09† | Fixed rate of 0.110% | Monthly | Goldman Sachs International | 11/30/2018 | USD | 1,363,280 | 947 †† | (125) | — | — | 822 | — |
| Total return on Goldman Sachs Curve Index C0210† | Fixed rate of -0.020% | Monthly | Goldman Sachs International | 11/30/2018 | USD | 1,771,297 | 705 †† | 30 | — | — | 735 | — |
| Total return on Goldman Sachs RP Equity World Long Short Series 37 Excess Return† | Fixed rate of 0.000% | Monthly | Goldman Sachs International | 11/30/2018 | USD | 599,971 | 673 †† | (50) | — | — | 623 | — |
| Total return on Goldman Sachs Curve Index C0210† | Fixed rate of -0.020% | Monthly | Goldman Sachs International | 11/30/2018 | USD | 1,483,953 | 591 †† | 25 | — | — | 616 | — |
| Total return on Goldman Sachs Commodity Volatility Carry Series 18 Excess Return Strategy† | Fixed rate of 0.100% | Monthly | Goldman Sachs International | 11/30/2018 | USD | 2,069,283 | (4,116) †† | (172) | — | — | — | (4,288) |
| Total return on Goldman Sachs FX Time Series Momentum Index C0038† | Fixed rate of 0.220% | Monthly | Goldman Sachs International | 11/30/2018 | USD | 2,106,198 | (9,235) †† | (386) | — | — | — | (9,621) |
| Total return on Goldman Sachs U.S. Series 71 Excess Return Strategy† | Fixed rate of 0.100% | Monthly | Goldman Sachs International | 11/30/2018 | USD | 1,345,323 | (9,834) †† | (112) | — | — | — | (9,946) |
| Total return on Goldman Sachs FX Time Series Momentum Index C0038† | Fixed rate of 0.220% | Monthly | Goldman Sachs International | 11/30/2018 | USD | 2,230,392 | (9,779) †† | (721) | — | — | — | (10,500) |
| Total return on Goldman Sachs U.S. Series 71 Excess Return Strategy† | Fixed rate of 0.100% | Monthly | Goldman Sachs International | 11/30/2018 | USD | 1,442,529 | (10,545) †† | (120) | — | — | — | (10,665) |
The accompanying Notes to Consolidated Financial Statements are an integral part of this statement.
| 18 | Columbia Alternative Beta Fund | Annual Report 2018 |
Consolidated Portfolio of Investments (continued)
May 31, 2018
| Total return swap contracts (continued) |
| Fund receives | Fund pays | Payment
frequency | Counterparty | Maturity
date | Notional
currency | Notional
amount | Value
($) | Periodic
payments
receivable
(payable)
($) | Upfront
payments | Upfront
receipts | Unrealized
appreciation
($) | Unrealized
depreciation
($) |
| Total return on Goldman Sachs FX Time Series Momentum Index C0038† | Fixed rate of 0.220% | Monthly | Goldman Sachs International | 11/30/2018 | USD | 2,355,464 | (10,328) †† | (432) | — | — | — | (10,760) |
| Total return on Goldman Sachs FX Time Series Momentum Index C0038† | Fixed rate of 0.220% | Monthly | Goldman Sachs International | 11/30/2018 | USD | 2,464,726 | (10,807) †† | (452) | — | — | — | (11,259) |
| Total return on Goldman Sachs U.S. Series 71 Excess Return Strategy† | Fixed rate of 0.100% | Monthly | Goldman Sachs International | 11/30/2018 | USD | 1,784,158 | (13,042) †† | (149) | — | — | — | (13,191) |
| Total return on Goldman Sachs FX Time Series Momentum Index C0038† | Fixed rate of 0.220% | Monthly | Goldman Sachs International | 11/30/2018 | USD | 2,951,664 | (12,942) †† | (541) | — | — | — | (13,483) |
| Total return on Goldman Sachs FX Time Series Momentum Index C0038† | Fixed rate of 0.220% | Monthly | Goldman Sachs International | 11/30/2018 | USD | 3,436,845 | (15,069) †† | (630) | — | — | — | (15,699) |
| Total return on Goldman Sachs U.S. Series 71 Excess Return Strategy† | Fixed rate of 0.100% | Monthly | Goldman Sachs International | 11/30/2018 | USD | 2,468,566 | (18,044) †† | (206) | — | — | — | (18,250) |
| Total return on Goldman Sachs FX Time Series Momentum Index C0038† | Fixed rate of 0.220% | Monthly | Goldman Sachs International | 11/30/2018 | USD | 4,375,412 | (19,184) †† | (802) | — | — | — | (19,986) |
| Total return on Goldman Sachs Macro Index CA03† | Fixed rate of 0.100% | Monthly | Goldman Sachs International | 11/30/2018 | USD | 1,233,166 | (20,651) †† | (30) | — | — | — | (20,681) |
| Total return on Goldman Sachs U.S. Series 71 Excess Return Strategy† | Fixed rate of 0.100% | Monthly | Goldman Sachs International | 11/30/2018 | USD | 2,829,511 | (20,683) †† | (236) | — | — | — | (20,919) |
| Total return on Goldman Sachs FX EM & G10 3 Month Valuation Index C0114† | Fixed rate of 0.180% | Monthly | Goldman Sachs International | 11/30/2018 | USD | 1,027,960 | (21,495) †† | (154) | — | — | — | (21,649) |
The accompanying Notes to Consolidated Financial Statements are an integral part of this statement.
Columbia Alternative Beta Fund | Annual Report 2018
| 19 |
Consolidated Portfolio of Investments (continued)
May 31, 2018
| Total return swap contracts (continued) |
| Fund receives | Fund pays | Payment
frequency | Counterparty | Maturity
date | Notional
currency | Notional
amount | Value
($) | Periodic
payments
receivable
(payable)
($) | Upfront
payments | Upfront
receipts | Unrealized
appreciation
($) | Unrealized
depreciation
($) |
| Total return on Goldman Sachs U.S. Series 71 Excess Return Strategy† | Fixed rate of 0.100% | Monthly | Goldman Sachs International | 11/30/2018 | USD | 3,497,631 | (25,567) †† | (291) | — | — | — | (25,858) |
| Total return on Goldman Sachs Commodity Volatility Carry Series 18 Excess Return Strategy† | Fixed rate of 0.100% | Monthly | Goldman Sachs International | 11/30/2018 | USD | 12,680,704 | (25,223) †† | (1,057) | — | — | — | (26,280) |
| Total return on Goldman Sachs FX EM & G10 3 Month Carry Index C0115† | Fixed rate of 0.260% | Monthly | Goldman Sachs International | 11/30/2018 | USD | 1,026,884 | (27,282) †† | (223) | — | — | — | (27,505) |
| Total return on Goldman Sachs Macro Index MF03† | Fixed rate of 0.100% | Monthly | Goldman Sachs International | 11/30/2018 | USD | 8,412,653 | (33,013) †† | — | — | — | — | (33,013) |
| Total return on Goldman Sachs FX EM & G10 3 Month Carry Index C0115† | Fixed rate of 0.260% | Monthly | Goldman Sachs International | 11/30/2018 | USD | 1,326,955 | (35,255) †† | (288) | — | — | — | (35,543) |
| Total return on Goldman Sachs FX EM & G10 3 Month Carry Index C0115† | Fixed rate of 0.260% | Monthly | Goldman Sachs International | 11/30/2018 | USD | 1,331,951 | (35,388) †† | (289) | — | — | — | (35,677) |
| Total return on Goldman Sachs FX Time Series Momentum Index C0038† | Fixed rate of 0.220% | Monthly | Goldman Sachs International | 11/30/2018 | USD | 8,085,763 | (35,453) †† | (1,482) | — | — | — | (36,935) |
| Total return on Goldman Sachs FX EM & G10 3 Month Valuation Index C0114† | Fixed rate of 0.180% | Monthly | Goldman Sachs International | 11/30/2018 | USD | 1,810,100 | (37,848) †† | (272) | — | — | — | (38,120) |
| Total return on Goldman Sachs FX EM & G10 3 Month Carry Index C0115† | Fixed rate of 0.260% | Monthly | Goldman Sachs International | 11/30/2018 | USD | 1,475,668 | (39,206) †† | (320) | — | — | — | (39,526) |
The accompanying Notes to Consolidated Financial Statements are an integral part of this statement.
| 20 | Columbia Alternative Beta Fund | Annual Report 2018 |
Consolidated Portfolio of Investments (continued)
May 31, 2018
| Total return swap contracts (continued) |
| Fund receives | Fund pays | Payment
frequency | Counterparty | Maturity
date | Notional
currency | Notional
amount | Value
($) | Periodic
payments
receivable
(payable)
($) | Upfront
payments | Upfront
receipts | Unrealized
appreciation
($) | Unrealized
depreciation
($) |
| Total return on Goldman Sachs FX EM & G10 3 Month Valuation Index C0114† | Fixed rate of 0.180% | Monthly | Goldman Sachs International | 11/30/2018 | USD | 2,174,754 | (45,474) †† | (326) | — | — | — | (45,800) |
| Total return on Goldman Sachs FX EM & G10 3 Month Valuation Index C0114† | Fixed rate of 0.180% | Monthly | Goldman Sachs International | 11/30/2018 | USD | 2,252,356 | (47,096) †† | (338) | — | — | — | (47,434) |
| Total return on Goldman Sachs FX Volatility Carry Basket Index† | Fixed rate of 0.100% | Monthly | Goldman Sachs International | 11/30/2018 | USD | 11,001,655 | (61,395) †† | (1,785) | — | — | — | (63,180) |
| Total return on Goldman Sachs FX EM & G10 3 Month Valuation Index C0114† | Fixed rate of 0.180% | Monthly | Goldman Sachs International | 11/30/2018 | USD | 3,159,131 | (66,057) †† | (474) | — | — | — | (66,531) |
| Total return on Goldman Sachs Macro Index CA03† | Fixed rate of 0.100% | Monthly | Goldman Sachs International | 11/30/2018 | USD | 2,474,390 | (80,032) †† | — | — | — | — | (80,032) |
| Total return on Goldman Sachs Macro Index MF03† | Fixed rate of 0.100% | Monthly | Goldman Sachs International | 11/30/2018 | USD | 3,037,039 | (82,817) †† | (253) | — | — | — | (83,070) |
| Total return on Goldman Sachs Macro Index MF03† | Fixed rate of 0.100% | Monthly | Goldman Sachs International | 11/30/2018 | USD | 3,383,355 | (92,260) †† | (282) | — | — | — | (92,542) |
| Total return on Goldman Sachs FX EM & G10 3 Month Carry Index C0115† | Fixed rate of 0.260% | Monthly | Goldman Sachs International | 11/30/2018 | USD | 3,516,798 | (93,436) †† | (762) | — | — | — | (94,198) |
| Total return on Goldman Sachs FX EM & G10 3 Month Carry Index C0115† | Fixed rate of 0.260% | Monthly | Goldman Sachs International | 11/30/2018 | USD | 3,526,790 | (93,702) †† | (3,816) | — | — | — | (97,518) |
| Total return on Goldman Sachs Series 19 10-year Volatility Carry Index† | Fixed rate of 0.100% | Monthly | Goldman Sachs International | 11/30/2018 | USD | 5,828,540 | (104,345) †† | (486) | — | — | — | (104,831) |
The accompanying Notes to Consolidated Financial Statements are an integral part of this statement.
Columbia Alternative Beta Fund | Annual Report 2018
| 21 |
Consolidated Portfolio of Investments (continued)
May 31, 2018
| Total return swap contracts (continued) |
| Fund receives | Fund pays | Payment
frequency | Counterparty | Maturity
date | Notional
currency | Notional
amount | Value
($) | Periodic
payments
receivable
(payable)
($) | Upfront
payments | Upfront
receipts | Unrealized
appreciation
($) | Unrealized
depreciation
($) |
| Total return on Goldman Sachs Series 19 10-year Volatility Carry Index† | Fixed rate of 0.100% | Monthly | Goldman Sachs International | 11/30/2018 | USD | 6,329,080 | (113,307) †† | (527) | — | — | — | (113,834) |
| Total return on Goldman Sachs FX EM & G10 3 Month Carry Index C0115† | Fixed rate of 0.260% | Monthly | Goldman Sachs International | 11/30/2018 | USD | 4,418,481 | (117,393) †† | (957) | — | — | — | (118,350) |
| Total return on Goldman Sachs FX EM & G10 3 Month Valuation Index C0114† | Fixed rate of 0.180% | Monthly | Goldman Sachs International | 11/30/2018 | USD | 6,073,382 | (126,994) †† | (911) | — | — | — | (127,905) |
| Total return on Goldman Sachs Macro Index MF03† | Fixed rate of 0.100% | Monthly | Goldman Sachs International | 11/30/2018 | USD | 4,698,763 | (128,129) †† | (392) | — | — | — | (128,521) |
| Total return on Goldman Sachs FX Time Series Momentum Index C0038† | Fixed rate of 0.100% | Monthly | Goldman Sachs International | 11/30/2018 | USD | 36,630,987 | (136,303) †† | (3,466) | — | — | — | (139,769) |
| Total return on Goldman Sachs FX Volatility Carry Basket Index† | Fixed rate of 0.100% | Monthly | Goldman Sachs International | 11/30/2018 | USD | 26,456,025 | (147,640) †† | (6,173) | — | — | — | (153,813) |
| Total return on Goldman Sachs FX EM & G10 3 Month Valuation Index C0114† | Fixed rate of 0.180% | Monthly | Goldman Sachs International | 11/30/2018 | USD | 8,229,950 | (172,087) †† | (1,235) | — | — | — | (173,322) |
| Total return on Goldman Sachs Macro Index CA03† | Fixed rate of 0.100% | Monthly | Goldman Sachs International | 11/30/2018 | USD | 6,321,284 | (204,457) †† | (527) | — | — | — | (204,984) |
| Total return on Goldman Sachs Macro Index MF03† | Fixed rate of 0.100% | Monthly | Goldman Sachs International | 11/30/2018 | USD | 8,731,566 | (238,100) †† | (728) | — | — | — | (238,828) |
| Total return on Goldman Sachs Series 19 10-year Volatility Carry Index† | Fixed rate of 0.100% | Monthly | Goldman Sachs International | 11/30/2018 | USD | 14,226,356 | (254,688) †† | 1,186 | — | — | — | (253,502) |
The accompanying Notes to Consolidated Financial Statements are an integral part of this statement.
| 22 | Columbia Alternative Beta Fund | Annual Report 2018 |
Consolidated Portfolio of Investments (continued)
May 31, 2018
| Total return swap contracts (continued) |
| Fund receives | Fund pays | Payment
frequency | Counterparty | Maturity
date | Notional
currency | Notional
amount | Value
($) | Periodic
payments
receivable
(payable)
($) | Upfront
payments | Upfront
receipts | Unrealized
appreciation
($) | Unrealized
depreciation
($) |
| Total return on Goldman Sachs FX EM & G10 3 Month Valuation Index C0114† | Fixed rate of 0.180% | Monthly | Goldman Sachs International | 11/30/2018 | USD | 12,467,835 | (260,701) †† | (1,870) | — | — | — | (262,571) |
| Total return on Goldman Sachs Macro Index MF03† | Fixed rate of 0.100% | Monthly | Goldman Sachs International | 11/30/2018 | USD | 11,028,556 | (300,736) †† | (919) | — | — | — | (301,655) |
| Total return on Goldman Sachs FX EM & G10 3 Month Valuation Index C0114† | Fixed rate of 0.180% | Monthly | Goldman Sachs International | 11/30/2018 | USD | 16,904,822 | (353,477) †† | (2,536) | — | — | — | (356,013) |
| Total return on Goldman Sachs U.S. Series 71 Excess Return Strategy† | Fixed rate of 0.100% | Monthly | Goldman Sachs International | 11/30/2018 | USD | 47,746,067 | (349,006) †† | (11,937) | — | — | — | (360,943) |
| Total return on Goldman Sachs Macro Index CA03† | Fixed rate of 0.100% | Monthly | Goldman Sachs International | 11/30/2018 | USD | 13,471,247 | (435,718) †† | (1,123) | — | — | — | (436,841) |
| Total return on Goldman Sachs FX Time Series Momentum Index C0038† | Fixed rate of 0.220% | Monthly | Goldman Sachs International | 11/30/2018 | USD | 110,346,515 | (483,818) †† | (20,230) | — | — | — | (504,048) |
| Total return on Goldman Sachs Macro Index CA03† | Fixed rate of 0.100% | Monthly | Goldman Sachs International | 11/30/2018 | USD | 16,010,973 | (517,864) †† | (1,334) | — | — | — | (519,198) |
| Total return on Goldman Sachs FX EM & G10 3 Month Valuation Index C0114† | Fixed rate of 0.180% | Monthly | Goldman Sachs International | 11/30/2018 | USD | 25,330,581 | (529,659) †† | (8,529) | — | — | — | (538,188) |
| Total return on Goldman Sachs U.S. Series 71 Excess Return Strategy† | Fixed rate of 0.100% | Monthly | Goldman Sachs International | 11/30/2018 | USD | 73,652,693 | (538,375) †† | (6,138) | — | — | — | (544,513) |
| Total return on Goldman Sachs FX EM & G10 3 Month Carry Index C0115† | Fixed rate of 0.260% | Monthly | Goldman Sachs International | 11/30/2018 | USD | 21,612,465 | (574,213) †† | (4,683) | — | — | — | (578,896) |
The accompanying Notes to Consolidated Financial Statements are an integral part of this statement.
Columbia Alternative Beta Fund | Annual Report 2018
| 23 |
Consolidated Portfolio of Investments (continued)
May 31, 2018
| Total return swap contracts (continued) |
| Fund receives | Fund pays | Payment
frequency | Counterparty | Maturity
date | Notional
currency | Notional
amount | Value
($) | Periodic
payments
receivable
(payable)
($) | Upfront
payments | Upfront
receipts | Unrealized
appreciation
($) | Unrealized
depreciation
($) |
| Total return on Goldman Sachs Macro Index CA03† | Fixed rate of 0.100% | Monthly | Goldman Sachs International | 11/30/2018 | USD | 18,821,966 | (608,783) †† | (2,379) | — | — | — | (611,162) |
| Total return on Goldman Sachs FX EM & G10 3 Month Carry Index C0115† | Fixed rate of 0.260% | Monthly | Goldman Sachs International | 11/30/2018 | USD | 28,690,734 | (762,274) †† | (6,216) | — | — | — | (768,490) |
| Total return on Goldman Sachs Macro Index CA03† | Fixed rate of 0.100% | Monthly | Goldman Sachs International | 11/30/2018 | USD | 64,726,372 | (2,093,529) †† | (5,394) | — | — | — | (2,098,923) |
| Total return on Goldman Sachs FX EM & G10 3 Month Carry Index C0115† | Fixed rate of 0.260% | Monthly | Goldman Sachs International | 11/30/2018 | USD | 88,698,485 | (2,356,597) †† | (19,218) | — | — | — | (2,375,815) |
| Total return on Goldman Sachs Macro Index MF03† | Fixed rate of 0.100% | Monthly | Goldman Sachs International | 11/30/2018 | USD | 93,410,910 | (2,547,210) †† | (7,784) | — | — | — | (2,554,994) |
| Total return on Goldman Sachs FX EM & G10 3 Month Valuation Index C0114† | Fixed rate of 0.180% | Monthly | Goldman Sachs International | 11/30/2018 | USD | 170,329,680 | (3,561,571) †† | (25,549) | — | — | — | (3,587,120) |
| Total return on Goldman Sachs Macro Index MF03† | Fixed rate of 0.100% | Monthly | Goldman Sachs International | 11/30/2018 | USD | 390,903,345 | (10,659,493) †† | (32,575) | — | — | — | (10,692,068) |
| Total return on JPMorgan Equity Risk Premium - Global Balanced Multi-Factor (Long/Short) US Index† | Fixed rate of -0.150% | Monthly | JPMorgan | 11/30/2018 | USD | 1,570,334 | (986) †† | 461 | — | — | — | (525) |
| Total return on JPMorgan Equity Risk Premium - Global Balanced Multi-Factor (Long/Short) US Index† | Fixed rate of -0.150% | Monthly | JPMorgan | 11/30/2018 | USD | 4,414,384 | (2,771) †† | 570 | — | — | — | (2,201) |
The accompanying Notes to Consolidated Financial Statements are an integral part of this statement.
| 24 | Columbia Alternative Beta Fund | Annual Report 2018 |
Consolidated Portfolio of Investments (continued)
May 31, 2018
| Total return swap contracts (continued) |
| Fund receives | Fund pays | Payment
frequency | Counterparty | Maturity
date | Notional
currency | Notional
amount | Value
($) | Periodic
payments
receivable
(payable)
($) | Upfront
payments | Upfront
receipts | Unrealized
appreciation
($) | Unrealized
depreciation
($) |
| Total return on JPMorgan Equity Risk Premium - Global Balanced Multi-Factor (Long/Short) US Index† | Fixed rate of -0.150% | Monthly | JPMorgan | 11/30/2018 | USD | 11,703,195 | (7,349) †† | 1,512 | — | — | — | (5,837) |
| Total return on JPMorgan Equity Risk Premium - Global Balanced Multi-Factor (Long/Short) US Index† | Fixed rate of -0.150% | Monthly | JPMorgan | 11/30/2018 | USD | 14,689,132 | (9,223) †† | 1,897 | — | — | — | (7,326) |
| Total return on JPMorgan Equity Risk Premium - Global Pure Value L/S USD Index 1† | Fixed rate of 0.000% | Monthly | JPMorgan | 11/30/2018 | USD | 357,770 | (8,140) †† | — | — | — | — | (8,140) |
| Total return on JPMorgan Equity Risk Premium - Global Balanced Multi-Factor (Long/Short) US Index† | Fixed rate of -0.100% | Monthly | JPMorgan | 11/30/2018 | USD | 120,247,738 | (75,500) †† | 1,035 | — | — | — | (74,465) |
| Total return on JPMorgan Equity Risk Premium - Global Balanced Multi-Factor (Long/Short) US Index† | Fixed rate of 0.150% | Monthly | JPMorgan | 11/30/2018 | USD | 188,947,845 | (118,637) †† | (24,406) | — | — | — | (143,043) |
| Total return on JPMorgan Equity Risk Premium - Global Pure Value L/S USD Index 1† | Fixed rate of 0.000% | Monthly | JPMorgan | 11/30/2018 | USD | 20,137,198 | (458,143) †† | — | — | — | — | (458,143) |
| Total return on JPMorgan Equity Risk Premium - Global Pure Value L/S USD Index 1† | Fixed rate of 0.000% | Monthly | JPMorgan | 11/30/2018 | USD | 119,372,172 | (2,715,849) †† | — | — | — | — | (2,715,849) |
The accompanying Notes to Consolidated Financial Statements are an integral part of this statement.
Columbia Alternative Beta Fund | Annual Report 2018
| 25 |
Consolidated Portfolio of Investments (continued)
May 31, 2018
| Total return swap contracts (continued) |
| Fund receives | Fund pays | Payment
frequency | Counterparty | Maturity
date | Notional
currency | Notional
amount | Value
($) | Periodic
payments
receivable
(payable)
($) | Upfront
payments | Upfront
receipts | Unrealized
appreciation
($) | Unrealized
depreciation
($) |
| Total return on Morgan Stanley Cube Equity Factors Risk Parity Global Index† | Fixed rate of -0.150% | Monthly | Morgan Stanley | 11/30/2018 | USD | 354,027,993 | 1,139,028 †† | 45,729 | — | — | 1,184,757 | — |
| Total return on Morgan Stanley Cube Equity Factors Risk Parity Global Index† | Fixed rate of -0.150% | Monthly | Morgan Stanley | 11/30/2018 | USD | 138,020,629 | 444,059 †† | 17,828 | — | — | 461,887 | — |
| Total return on Morgan Stanley Cube Equity Factors Risk Parity Global Index† | Fixed rate of -0.150% | Monthly | Morgan Stanley | 11/30/2018 | USD | 10,845,805 | 34,895 †† | 1,401 | — | — | 36,296 | — |
| Total return on Morgan Stanley Cube Equity Factors Risk Parity Global Index† | Fixed rate of -0.150% | Monthly | Morgan Stanley | 11/30/2018 | USD | 9,994,114 | 32,154 †† | 1,291 | — | — | 33,445 | — |
| Total return on Morgan Stanley Cube Equity Factors Risk Parity Global Index† | Fixed rate of -0.150% | Monthly | Morgan Stanley | 11/30/2018 | USD | 8,322,503 | 26,776 †† | 1,075 | — | — | 27,851 | — |
| Total return on Morgan Stanley Cube Equity Factors Risk Parity Global Index† | Fixed rate of -0.150% | Monthly | Morgan Stanley | 11/30/2018 | USD | 7,621,402 | 24,521 †† | 984 | — | — | 25,505 | — |
| Total return on Morgan Stanley Cube Equity Factors Risk Parity Global Index† | Fixed rate of -0.150% | Monthly | Morgan Stanley | 11/30/2018 | USD | 5,540,422 | 17,825 †† | 693 | — | — | 18,518 | — |
| Total return on Morgan Stanley Cube Equity Factors Risk Parity Global Index† | Fixed rate of -0.150% | Monthly | Morgan Stanley | 11/30/2018 | USD | 3,201,962 | 10,301 †† | 414 | — | — | 10,715 | — |
The accompanying Notes to Consolidated Financial Statements are an integral part of this statement.
| 26 | Columbia Alternative Beta Fund | Annual Report 2018 |
Consolidated Portfolio of Investments (continued)
May 31, 2018
| Total return swap contracts (continued) |
| Fund receives | Fund pays | Payment
frequency | Counterparty | Maturity
date | Notional
currency | Notional
amount | Value
($) | Periodic
payments
receivable
(payable)
($) | Upfront
payments | Upfront
receipts | Unrealized
appreciation
($) | Unrealized
depreciation
($) |
| Total return on Morgan Stanley Cube Equity Factors Risk Parity Global Index† | Fixed rate of -0.150% | Monthly | Morgan Stanley | 11/30/2018 | USD | 2,325,704 | 7,483 †† | 300 | — | — | 7,783 | — |
| Total return on Morgan Stanley Cube Equity Factors Risk Parity Global Index† | Fixed rate of -0.150% | Monthly | Morgan Stanley | 11/30/2018 | USD | 388,346 | 1,250 †† | 50 | — | — | 1,300 | — |
| Total return on Morgan Stanley Cube Equity Factors Risk Parity Global Index† | Fixed rate of -0.150% | Monthly | Morgan Stanley | 11/30/2018 | USD | 131,929 | 424 †† | 635 | — | — | 1,059 | — |
| Total return on Morgan Stanley Cube Equity Factors Risk Parity Global Index† | Fixed rate of -0.150% | Monthly | Morgan Stanley | 11/30/2018 | USD | 290,905 | 936 †† | 38 | — | — | 974 | — |
| Total return on Morgan Stanley Cube Global Value Index† | Fixed rate of -0.200% | Monthly | Morgan Stanley | 11/30/2018 | USD | 787,064 | (12,556) †† | 136 | — | — | — | (12,420) |
| Total return on Morgan Stanley Cube Global Value Index† | Fixed rate of -0.200% | Monthly | Morgan Stanley | 11/30/2018 | USD | 3,427,462 | (54,675) †† | 590 | — | — | — | (54,085) |
| Total return on Morgan Stanley Cube Global Value Index† | Fixed rate of -0.200% | Monthly | Morgan Stanley | 11/30/2018 | USD | 4,065,490 | (64,853) †† | 700 | — | — | — | (64,153) |
| Total return on Morgan Stanley Cube Global Value Index† | Fixed rate of -0.200% | Monthly | Morgan Stanley | 11/30/2018 | USD | 5,949,064 | (94,901) †† | 1,025 | — | — | — | (93,876) |
| Total return on Morgan Stanley Cube Global Value Index† | Fixed rate of -0.200% | Monthly | Morgan Stanley | 11/30/2018 | USD | 9,300,157 | (148,358) †† | 1,602 | — | — | — | (146,756) |
The accompanying Notes to Consolidated Financial Statements are an integral part of this statement.
Columbia Alternative Beta Fund | Annual Report 2018
| 27 |
Consolidated Portfolio of Investments (continued)
May 31, 2018
| Total return swap contracts (continued) |
| Fund receives | Fund pays | Payment
frequency | Counterparty | Maturity
date | Notional
currency | Notional
amount | Value
($) | Periodic
payments
receivable
(payable)
($) | Upfront
payments | Upfront
receipts | Unrealized
appreciation
($) | Unrealized
depreciation
($) |
| Total return on Morgan Stanley Cube Global Value Index† | Fixed rate of -0.200% | Monthly | Morgan Stanley | 11/30/2018 | USD | 10,466,897 | (166,970) †† | 1,803 | — | — | — | (165,167) |
| Total return on Morgan Stanley Cube Global Value Index† | Fixed rate of -0.200% | Monthly | Morgan Stanley | 11/30/2018 | USD | 45,016,024 | (718,102) †† | 7,753 | — | — | — | (710,349) |
| Total | | | | | | | (34,746,678) | (611,843) | 14,429 | — | 8,743,520 | (44,116,470) |
| † | By investing in the total return swap contract, the Fund gains exposure to the underlying investments that make up the custom basket/index without having to own the underlying investments directly. The components of the custom basket/index are available on Columbia Alternative Beta Fund’s page of columbiathreadneedleus.com website. |
| †† | Valuation based on significant unobservable inputs. |
Notes to Consolidated Portfolio of Investments
| (a) | The rate shown is the seven-day current annualized yield at May 31, 2018. |
| (b) | As defined in the Investment Company Act of 1940, an affiliated company is one in which the Fund owns 5% or more of the company’s outstanding voting securities, or a company which is under common ownership or control with the Fund. Holdings and transactions in these affiliated companies during the year ended May 31, 2018 are as follows: |
| Issuer | Beginning
shares | Shares
purchased | Shares
sold | Ending
shares | Realized gain
(loss) —
affiliated
issuers ($) | Net change in
unrealized
appreciation
(depreciation) —
affiliated
issuers ($) | Dividends —
affiliated
issuers ($) | Value —
affiliated
issuers
at end of
period ($) |
| Columbia Short-Term Cash Fund, 1.907% |
| | 538,647,376 | 504,320,250 | (299,245,264) | 743,722,362 | (12,167) | 17,394 | 9,135,345 | 743,722,362 |
Currency Legend
| CAD | Canada Dollar |
| EUR | Euro |
| GBP | British Pound |
| JPY | Japanese Yen |
| USD | US Dollar |
Fair value measurements
The Fund categorizes its fair value measurements according to a three-level hierarchy that maximizes the use of observable inputs and minimizes the use of unobservable inputs by prioritizing that the most observable input be used when available. Observable inputs are those that market participants would use in pricing an investment based on market data obtained from sources independent of the reporting entity. Unobservable inputs are those that reflect the Fund’s assumptions about the information market participants would use in pricing an investment. An investment’s level within the fair value hierarchy is based on the lowest level of any input that is deemed significant to the asset’s or liability’s fair value measurement. The input levels are not necessarily an indication of the risk or liquidity associated with investments at that level. For example, certain U.S. government securities are generally high quality and liquid, however, they are reflected as Level 2 because the inputs used to determine fair value may not always be quoted prices in an active market.
Fair value inputs are summarized in the three broad levels listed below:
| ■ | Level 1 — Valuations based on quoted prices for investments in active markets that the Fund has the ability to access at the measurement date. Valuation adjustments are not applied to Level 1 investments. |
| ■ | Level 2 — Valuations based on other significant observable inputs (including quoted prices for similar securities, interest rates, prepayment speeds, credit risks, etc.). |
| ■ | Level 3 — Valuations based on significant unobservable inputs (including the Fund’s own assumptions and judgment in determining the fair value of investments). |
The accompanying Notes to Consolidated Financial Statements are an integral part of this statement.
| 28 | Columbia Alternative Beta Fund | Annual Report 2018 |
Consolidated Portfolio of Investments (continued)
May 31, 2018
Fair value measurements (continued)
Inputs that are used in determining fair value of an investment may include price information, credit data, volatility statistics, and other factors. These inputs can be either observable or unobservable. The availability of observable inputs can vary between investments, and is affected by various factors such as the type of investment, and the volume and level of activity for that investment or similar investments in the marketplace. The inputs will be considered by the Investment Manager, along with any other relevant factors in the calculation of an investment’s fair value. The Fund uses prices and inputs that are current as of the measurement date, which may include periods of market dislocations. During these periods, the availability of prices and inputs may be reduced for many investments. This condition could cause an investment to be reclassified between the various levels within the hierarchy.
Certain investments that have been measured at fair value using the net asset value (NAV) per share (or its equivalent) are not categorized in the fair value hierarchy. The fair value amounts presented in the table are intended to reconcile the fair value hierarchy to the amounts presented in the Consolidated Portfolio of Investments. The Columbia Short-Term Cash Fund seeks to provide shareholders with maximum current income consistent with liquidity and stability of principal. Columbia Short-Term Cash Fund prices its shares with a floating NAV and no longer seeks to maintain a stable NAV.
Investments falling into the Level 3 category are primarily supported by quoted prices from brokers and dealers participating in the market for those investments. However, these may be classified as Level 3 investments due to lack of market transparency and corroboration to support these quoted prices. Additionally, valuation models may be used as the pricing source for any remaining investments classified as Level 3. These models may rely on one or more significant unobservable inputs and/or significant assumptions by the Investment Manager. Inputs used in valuations may include, but are not limited to, financial statement analysis, capital account balances, discount rates and estimated cash flows, and comparable company data.
Under the direction of the Fund’s Board of Trustees (the Board), the Investment Manager’s Valuation Committee (the Committee) is responsible for overseeing the valuation procedures approved by the Board. The Committee consists of voting and non-voting members from various groups within the Investment Manager’s organization, including operations and accounting, trading and investments, compliance, risk management and legal.
The Committee meets at least monthly to review and approve valuation matters, which may include a description of specific valuation determinations, data regarding pricing information received from approved pricing vendors and brokers and the results of Board-approved valuation control policies and procedures (the Policies). The Policies address, among other things, instances when market quotations are or are not readily available, including recommendations of third party pricing vendors and a determination of appropriate pricing methodologies; events that require specific valuation determinations and assessment of fair value techniques; securities with a potential for stale pricing, including those that are illiquid, restricted, or in default; and the effectiveness of third party pricing vendors, including periodic reviews of vendors. The Committee meets more frequently, as needed, to discuss additional valuation matters, which may include the need to review back-testing results, review time-sensitive information or approve related valuation actions. The Committee reports to the Board, with members of the Committee meeting with the Board at each of its regularly scheduled meetings to discuss valuation matters and actions during the period, similar to those described earlier.
For investments categorized as Level 3, the Committee monitors information similar to that described above, which may include: (i) data specific to the issuer or comparable issuers, (ii) general market or specific sector news and (iii) quoted prices and specific or similar security transactions. The Committee considers this data and any changes from prior periods in order to assess the reasonableness of observable and unobservable inputs, any assumptions or internal models used to value those securities and changes in fair value. This data is also used to corroborate, when available, information received from approved pricing vendors and brokers. Various factors impact the frequency of monitoring this information (which may occur as often as daily). However, the Committee may determine that changes to inputs, assumptions and models are not required as a result of the monitoring procedures performed.
The following table is a summary of the inputs used to value the Fund’s investments at May 31, 2018:
| | Level 1
quoted prices
in active
markets for
identical
assets ($) | Level 2
other
significant
observable
inputs ($) | Level 3
significant
unobservable
inputs ($) | Investments
measured at
net asset
value ($) | Total ($) |
| Investments in Securities | | | | | |
| Money Market Funds | — | — | — | 743,722,362 | 743,722,362 |
| Total Investments in Securities | — | — | — | 743,722,362 | 743,722,362 |
| Investments in Derivatives | | | | | |
| Asset | | | | | |
| Forward Foreign Currency Exchange Contracts | — | 712,449 | — | — | 712,449 |
| Swap Contracts | — | — | 8,743,520 | — | 8,743,520 |
| Liability | | | | | |
| Forward Foreign Currency Exchange Contracts | — | (165,342) | — | — | (165,342) |
| Swap Contracts | — | — | (44,116,470) | — | (44,116,470) |
| Total | — | 547,107 | (35,372,950) | 743,722,362 | 708,896,519 |
See the Consolidated Portfolio of Investments for all investment classifications not indicated in the table.
Derivative instruments are valued at unrealized appreciation (depreciation).
There were no transfers of financial assets between levels during the period.
The accompanying Notes to Consolidated Financial Statements are an integral part of this statement.
Columbia Alternative Beta Fund | Annual Report 2018
| 29 |
Consolidated Portfolio of Investments (continued)
May 31, 2018
Fair value measurements (continued)
The following table is a reconciliation of Level 3 assets for which significant observable and unobservable inputs were used to determine fair value:
| Investments in securities | Balance
as of
05/31/2017
($) | Increase
(decrease)
in accrued
discounts/
premiums
($) | Realized
gain (loss)(a)
($) | Change
in unrealized
appreciation
(depreciation)(b)
($) | Purchases
($) | Sales
($) | Transfers
into
Level 3
($) | Transfers
out of
Level 3
($) | Balance
as of
05/31/2018
($) |
| Total Return Swap Contracts | 1,389,791 | — | — | (36,762,741) | — | — | — | — | (35,372,950) |
Derivative instruments are valued at unrealized appreciation (depreciation).
(a) The realized gain (loss) earned during the period was $(7,876,068).
(b) Change in unrealized appreciation (depreciation) relating to securities held at May 31, 2018 was $(35,372,950).
The Fund’s assets assigned to the Level 3 category are valued utilizing the valuation technique deemed the most appropriate in the circumstances. Certain swap contracts classified as Level 3 securities are valued using the market approach and utilize single market quotations from broker dealers. The appropriateness of fair values for these securities is monitored on an ongoing basis which may include results of back testing and other control procedures. Significant increases (decreases) to any of these inputs would result in a significantly lower (higher) valuation measurement.
The accompanying Notes to Consolidated Financial Statements are an integral part of this statement.
| 30 | Columbia Alternative Beta Fund | Annual Report 2018 |
Consolidated Statement of Assets and Liabilities
May 31, 2018
| Assets | |
| Investments in securities, at value | |
| Affiliated issuers (cost $743,704,686) | $743,722,362 |
| Cash collateral held at broker for: | |
| Swap contracts | 28,800,000 |
| Unrealized appreciation on forward foreign currency exchange contracts | 712,449 |
| Unrealized appreciation on swap contracts | 8,743,520 |
| Upfront payments on swap contracts | 14,429 |
| Receivable for: | |
| Investments sold | 126,489 |
| Capital shares sold | 2,057,616 |
| Dividends | 1,192,356 |
| Prepaid expenses | 371 |
| Trustees’ deferred compensation plan | 21,184 |
| Total assets | 785,390,776 |
| Liabilities | |
| Due to custodian | 483 |
| Unrealized depreciation on forward foreign currency exchange contracts | 165,342 |
| Unrealized depreciation on swap contracts | 44,116,470 |
| Payable for: | |
| Investments purchased | 1,883,777 |
| Capital shares purchased | 873,935 |
| Management services fees | 15,195 |
| Distribution and/or service fees | 55 |
| Transfer agent fees | 104,917 |
| Compensation of board members | 1,535 |
| Compensation of chief compliance officer | 46 |
| Other expenses | 107,067 |
| Trustees’ deferred compensation plan | 21,184 |
| Total liabilities | 47,290,006 |
| Net assets applicable to outstanding capital stock | $738,100,770 |
| Represented by | |
| Paid in capital | 807,386,034 |
| Undistributed net investment income | 1,448,746 |
| Accumulated net realized loss | (35,925,843) |
| Unrealized appreciation (depreciation) on: | |
| Investments - affiliated issuers | 17,676 |
| Forward foreign currency exchange contracts | 547,107 |
| Swap contracts | (35,372,950) |
| Total - representing net assets applicable to outstanding capital stock | $738,100,770 |
The accompanying Notes to Consolidated Financial Statements are an integral part of this statement.
Columbia Alternative Beta Fund | Annual Report 2018
| 31 |
Consolidated Statement of Assets and Liabilities (continued)
May 31, 2018
| Class A | |
| Net assets | $4,342,776 |
| Shares outstanding | 501,674 |
| Net asset value per share | $8.66 |
| Maximum sales charge | 5.75% |
| Maximum offering price per share (calculated by dividing the net asset value per share by 1.0 minus the maximum sales charge for Class A shares) | $9.19 |
| Advisor Class | |
| Net assets | $4,432,785 |
| Shares outstanding | 509,745 |
| Net asset value per share | $8.70 |
| Class C | |
| Net assets | $838,321 |
| Shares outstanding | 98,188 |
| Net asset value per share | $8.54 |
| Institutional Class | |
| Net assets | $706,826,082 |
| Shares outstanding | 81,402,042 |
| Net asset value per share | $8.68 |
| Institutional 2 Class | |
| Net assets | $825,150 |
| Shares outstanding | 94,744 |
| Net asset value per share | $8.71 |
| Institutional 3 Class | |
| Net assets | $20,458,768 |
| Shares outstanding | 2,345,287 |
| Net asset value per share | $8.72 |
| Class R | |
| Net assets | $8,610 |
| Shares outstanding | 1,000 |
| Net asset value per share | $8.61 |
| Class T | |
| Net assets | $368,278 |
| Shares outstanding | 42,603 |
| Net asset value per share | $8.64 |
| Maximum sales charge | 2.50% |
| Maximum offering price per share (calculated by dividing the net asset value per share by 1.0 minus the maximum sales charge per transaction for Class T shares) | $8.86 |
The accompanying Notes to Consolidated Financial Statements are an integral part of this statement.
| 32 | Columbia Alternative Beta Fund | Annual Report 2018 |
Consolidated Statement of Operations
Year Ended May 31, 2018
| Net investment income | |
| Income: | |
| Dividends — affiliated issuers | $9,135,345 |
| Total income | 9,135,345 |
| Expenses: | |
| Management services fees | 6,402,070 |
| Distribution and/or service fees | |
| Class A | 12,324 |
| Class C | 9,557 |
| Class R | 47 |
| Class T | 1,423 |
| Transfer agent fees | |
| Class A | 9,847 |
| Advisor Class | 1,961 |
| Class C | 1,912 |
| Institutional Class | 1,262,321 |
| Institutional 2 Class | 546 |
| Institutional 3 Class | 2,451 |
| Class R | 19 |
| Class T | 1,156 |
| Compensation of board members | 25,865 |
| Custodian fees | 31,175 |
| Printing and postage fees | 142,462 |
| Registration fees | 192,017 |
| Audit fees | 58,050 |
| Legal fees | 15,294 |
| Interest on collateral | 51,935 |
| Compensation of chief compliance officer | 270 |
| Other | 27,208 |
| Total expenses | 8,249,910 |
| Fees waived or expenses reimbursed by Investment Manager and its affiliates | (1,402,288) |
| Total net expenses | 6,847,622 |
| Net investment income | 2,287,723 |
| Realized and unrealized gain (loss) — net | |
| Net realized gain (loss) on: | |
| Investments — affiliated issuers | (12,167) |
| Forward foreign currency exchange contracts | (2,498,252) |
| Futures contracts | (369,168) |
| Swap contracts | (7,876,068) |
| Net realized loss | (10,755,655) |
| Net change in unrealized appreciation (depreciation) on: | |
| Investments — affiliated issuers | 17,394 |
| Forward foreign currency exchange contracts | 1,462,563 |
| Futures contracts | 285,198 |
| Swap contracts | (36,762,741) |
| Net change in unrealized appreciation (depreciation) | (34,997,586) |
| Net realized and unrealized loss | (45,753,241) |
| Net decrease in net assets resulting from operations | $(43,465,518) |
The accompanying Notes to Consolidated Financial Statements are an integral part of this statement.
Columbia Alternative Beta Fund | Annual Report 2018
| 33 |
Consolidated Statement of Changes in Net Assets
| | Year Ended
May 31, 2018 | Year Ended
May 31, 2017 |
| Operations | | |
| Net investment income (loss) | $2,287,723 | $(2,380,066) |
| Net realized gain (loss) | (10,755,655) | 5,227,168 |
| Net change in unrealized appreciation (depreciation) | (34,997,586) | 698,926 |
| Net increase (decrease) in net assets resulting from operations | (43,465,518) | 3,546,028 |
| Distributions to shareholders | | |
| Net investment income | | |
| Class A | (109,968) | (69,437) |
| Advisor Class | (18,086) | (5,310) |
| Class C | (14,403) | (2,054) |
| Class I | — | (130,658) |
| Institutional Class | (14,910,288) | (15,068) |
| Institutional 2 Class | (20,567) | (572) |
| Institutional 3 Class | (516,752) | (58) |
| Class R | (197) | (32) |
| Class T | (10,906) | (1,461,744) |
| Total distributions to shareholders | (15,601,167) | (1,684,933) |
| Increase in net assets from capital stock activity | 246,864,641 | 334,043,572 |
| Total increase in net assets | 187,797,956 | 335,904,667 |
| Net assets at beginning of year | 550,302,814 | 214,398,147 |
| Net assets at end of year | $738,100,770 | $550,302,814 |
| Undistributed net investment income | $1,448,746 | $14,227,555 |
The accompanying Notes to Consolidated Financial Statements are an integral part of this statement.
| 34 | Columbia Alternative Beta Fund | Annual Report 2018 |
Consolidated Statement of Changes in Net Assets (continued)
| | Year Ended | Year Ended |
| | May 31, 2018 | May 31, 2017 |
| | Shares | Dollars ($) | Shares | Dollars ($) |
| Capital stock activity |
| Class A | | | | |
| Subscriptions | 143,994 | 1,349,191 | 306,867 | 2,842,707 |
| Distributions reinvested | 11,506 | 109,763 | 7,702 | 69,395 |
| Redemptions | (250,205) | (2,326,486) | (1,688,704) | (15,571,317) |
| Net decrease | (94,705) | (867,532) | (1,374,135) | (12,659,215) |
| Advisor Class | | | | |
| Subscriptions | 478,376 | 4,310,172 | 30,379 | 282,580 |
| Distributions reinvested | 1,865 | 17,871 | 582 | 5,258 |
| Redemptions | (29,249) | (274,500) | (79,166) | (730,905) |
| Net increase (decrease) | 450,992 | 4,053,543 | (48,205) | (443,067) |
| Class C | | | | |
| Subscriptions | 50,386 | 468,649 | 24,091 | 222,445 |
| Distributions reinvested | 1,507 | 14,227 | 228 | 2,042 |
| Redemptions | (72,307) | (669,088) | (147,767) | (1,356,311) |
| Net decrease | (20,414) | (186,212) | (123,448) | (1,131,824) |
| Class I | | | | |
| Distributions reinvested | — | — | 14,447 | 130,600 |
| Redemptions | — | — | (2,291,506) | (21,539,897) |
| Net decrease | — | — | (2,277,059) | (21,409,297) |
| Institutional Class | | | | |
| Subscriptions | 34,258,744 | 320,948,772 | 57,606,542 | 536,261,796 |
| Distributions reinvested | 1,559,642 | 14,910,176 | 1,655 | 14,923 |
| Redemptions | (9,935,993) | (92,865,010) | (2,454,556) | (22,830,962) |
| Net increase | 25,882,393 | 242,993,938 | 55,153,641 | 513,445,757 |
| Institutional 2 Class | | | | |
| Subscriptions | 167,958 | 1,575,132 | 15,298 | 139,471 |
| Distributions reinvested | 2,121 | 20,343 | 57 | 516 |
| Redemptions | (77,830) | (726,054) | (13,860) | (127,124) |
| Net increase | 92,249 | 869,421 | 1,495 | 12,863 |
| Institutional 3 Class | | | | |
| Subscriptions | — | — | 2,290,482 | 21,530,498 |
| Distributions reinvested | 53,805 | 516,526 | — | — |
| Net increase | 53,805 | 516,526 | 2,290,482 | 21,530,498 |
| Class T | | | | |
| Subscriptions | 9,434 | 88,122 | 30,502,808 | 280,253,189 |
| Distributions reinvested | 1,123 | 10,700 | 162,231 | 1,461,702 |
| Redemptions | (65,647) | (613,865) | (48,351,190) | (447,017,034) |
| Net decrease | (55,090) | (515,043) | (17,686,151) | (165,302,143) |
| Total net increase | 26,309,230 | 246,864,641 | 35,936,620 | 334,043,572 |
The accompanying Notes to Consolidated Financial Statements are an integral part of this statement.
Columbia Alternative Beta Fund | Annual Report 2018
| 35 |
Consolidated Financial Highlights
The following table is intended to help you understand the Fund’s financial performance. Certain information reflects financial results for a single share of a class held for the periods shown. Per share net investment income (loss) amounts are calculated based on average shares outstanding during the period. Total return assumes reinvestment of all dividends and distributions, if any. Total return does not reflect payment of sales charges, if any. Total return and portfolio turnover are not annualized for periods of less than one year. The portfolio turnover rate is calculated without regard to purchase and sales transactions of short-term instruments and certain derivatives, if any. If such transactions were included, the Fund’s portfolio turnover rate may be higher.
| | Net asset value,
beginning of
period | Net
investment
income
(loss) | Net
realized
and
unrealized
gain (loss) | Total from
investment
operations | Distributions
from net
investment
income | Total
distributions to
shareholders |
| Class A |
| Year Ended 5/31/2018 | $9.36 | 0.01 | (0.50) | (0.49) | (0.21) | (0.21) |
| Year Ended 5/31/2017 | $9.43 | (0.09) | 0.06 | (0.03) | (0.04) | (0.04) |
| Year Ended 5/31/2016 | $9.85 | 0.05 | (0.41) | (0.36) | (0.06) | (0.06) |
| Year Ended 5/31/2015(d) | $10.00 | (0.05) | (0.10) | (0.15) | — | — |
| Advisor Class |
| Year Ended 5/31/2018 | $9.39 | 0.04 | (0.51) | (0.47) | (0.22) | (0.22) |
| Year Ended 5/31/2017 | $9.45 | (0.06) | 0.05 | (0.01) | (0.05) | (0.05) |
| Year Ended 5/31/2016 | $9.86 | 0.19 | (0.53) | (0.34) | (0.07) | (0.07) |
| Year Ended 5/31/2015(d) | $10.00 | (0.04) | (0.10) | (0.14) | — | — |
| Class C |
| Year Ended 5/31/2018 | $9.27 | (0.06) | (0.49) | (0.55) | (0.18) | (0.18) |
| Year Ended 5/31/2017 | $9.38 | (0.16) | 0.06 | (0.10) | (0.01) | (0.01) |
| Year Ended 5/31/2016 | $9.83 | (0.03) | (0.40) | (0.43) | (0.02) | (0.02) |
| Year Ended 5/31/2015(d) | $10.00 | (0.07) | (0.10) | (0.17) | — | — |
| Institutional Class |
| Year Ended 5/31/2018 | $9.38 | 0.03 | (0.51) | (0.48) | (0.22) | (0.22) |
| Year Ended 5/31/2017 | $9.43 | (0.03) | 0.03 | 0.00 | (0.05) | (0.05) |
| Year Ended 5/31/2016 | $9.86 | (0.06) | (0.30) | (0.36) | (0.07) | (0.07) |
| Year Ended 5/31/2015(d) | $10.00 | (0.04) | (0.10) | (0.14) | — | — |
| Institutional 2 Class |
| Year Ended 5/31/2018 | $9.39 | 0.05 | (0.51) | (0.46) | (0.22) | (0.22) |
| Year Ended 5/31/2017 | $9.45 | (0.03) | 0.03 | 0.00 | (0.06) | (0.06) |
| Year Ended 5/31/2016 | $9.86 | 0.07 | (0.40) | (0.33) | (0.08) | (0.08) |
| Year Ended 5/31/2015(d) | $10.00 | (0.03) | (0.11) | (0.14) | — | — |
| Institutional 3 Class |
| Year Ended 5/31/2018 | $9.41 | 0.05 | (0.51) | (0.46) | (0.23) | (0.23) |
| Year Ended 5/31/2017 | $9.45 | (0.01) | 0.03 | 0.02 | (0.06) | (0.06) |
| Year Ended 5/31/2016 | $9.86 | 0.07 | (0.40) | (0.33) | (0.08) | (0.08) |
| Year Ended 5/31/2015(d) | $10.00 | (0.03) | (0.11) | (0.14) | — | — |
| Class R |
| Year Ended 5/31/2018 | $9.33 | (0.02) | (0.50) | (0.52) | (0.20) | (0.20) |
| Year Ended 5/31/2017 | $9.41 | (0.10) | 0.05 | (0.05) | (0.03) | (0.03) |
| Year Ended 5/31/2016 | $9.84 | 0.01 | (0.40) | (0.39) | (0.04) | (0.04) |
| Year Ended 5/31/2015(d) | $10.00 | (0.05) | (0.11) | (0.16) | — | — |
The accompanying Notes to Consolidated Financial Statements are an integral part of this statement.
| 36 | Columbia Alternative Beta Fund | Annual Report 2018 |
Consolidated Financial Highlights (continued)
| | Net
asset
value,
end of
period | Total
return | Total gross
expense
ratio to
average
net assets(a) | Total net
expense
ratio to
average
net assets(a),(b) | Net investment
income (loss)
ratio to
average
net assets | Portfolio
turnover | Net
assets,
end of
period
(000’s) |
| Class A |
| Year Ended 5/31/2018 | $8.66 | (5.49%) | 1.49% (c) | 1.28% (c) | 0.06% | 0% | $4,343 |
| Year Ended 5/31/2017 | $9.36 | (0.28%) | 1.61% | 1.41% | (0.95%) | 71% | $5,582 |
| Year Ended 5/31/2016 | $9.43 | (3.67%) | 2.09% | 1.39% | 0.49% | 32% | $18,579 |
| Year Ended 5/31/2015(d) | $9.85 | (1.50%) | 2.08% (e) | 1.50% (e) | (1.42%) (e) | 28% | $4,470 |
| Advisor Class |
| Year Ended 5/31/2018 | $8.70 | (5.27%) | 1.24% (c) | 1.03% (c) | 0.41% | 0% | $4,433 |
| Year Ended 5/31/2017 | $9.39 | (0.06%) | 1.36% | 1.15% | (0.66%) | 71% | $552 |
| Year Ended 5/31/2016 | $9.45 | (3.42%) | 1.83% | 1.12% | 2.03% | 32% | $1,010 |
| Year Ended 5/31/2015(d) | $9.86 | (1.40%) | 1.80% (e) | 1.23% (e) | (1.09%) (e) | 28% | $10 |
| Class C |
| Year Ended 5/31/2018 | $8.54 | (6.15%) | 2.24% (c) | 2.03% (c) | (0.68%) | 0% | $838 |
| Year Ended 5/31/2017 | $9.27 | (1.03%) | 2.36% | 2.16% | (1.68%) | 71% | $1,100 |
| Year Ended 5/31/2016 | $9.38 | (4.42%) | 2.84% | 2.14% | (0.34%) | 32% | $2,272 |
| Year Ended 5/31/2015(d) | $9.83 | (1.70%) | 2.83% (e) | 2.25% (e) | (2.18%) (e) | 28% | $932 |
| Institutional Class |
| Year Ended 5/31/2018 | $8.68 | (5.35%) | 1.24% (c) | 1.03% (c) | 0.34% | 0% | $706,826 |
| Year Ended 5/31/2017 | $9.38 | 0.05% | 1.36% | 1.08% | (0.28%) | 71% | $520,564 |
| Year Ended 5/31/2016 | $9.43 | (3.63%) | 1.84% | 1.12% | (0.56%) | 32% | $3,450 |
| Year Ended 5/31/2015(d) | $9.86 | (1.40%) | 1.83% (e) | 1.23% (e) | (1.09%) (e) | 28% | $34,686 |
| Institutional 2 Class |
| Year Ended 5/31/2018 | $8.71 | (5.08%) | 1.11% (c) | 0.90% (c) | 0.48% | 0% | $825 |
| Year Ended 5/31/2017 | $9.39 | (0.02%) | 1.21% | 0.93% | (0.33%) | 71% | $23 |
| Year Ended 5/31/2016 | $9.45 | (3.37%) | 1.62% | 1.04% | 0.69% | 32% | $9 |
| Year Ended 5/31/2015(d) | $9.86 | (1.40%) | 1.63% (e) | 1.17% (e) | (1.03%) (e) | 28% | $10 |
| Institutional 3 Class |
| Year Ended 5/31/2018 | $8.72 | (5.16%) | 1.05% (c) | 0.84% (c) | 0.50% | 0% | $20,459 |
| Year Ended 5/31/2017 | $9.41 | 0.21% | 1.18% | 0.88% | (0.07%) | 71% | $21,559 |
| Year Ended 5/31/2016 | $9.45 | (3.34%) | 1.57% | 0.99% | 0.72% | 32% | $9 |
| Year Ended 5/31/2015(d) | $9.86 | (1.40%) | 1.58% (e) | 1.12% (e) | (0.98%) (e) | 28% | $10 |
| Class R |
| Year Ended 5/31/2018 | $8.61 | (5.80%) | 1.74% (c) | 1.53% (c) | (0.19%) | 0% | $9 |
| Year Ended 5/31/2017 | $9.33 | (0.50%) | 1.89% | 1.63% | (1.10%) | 71% | $9 |
| Year Ended 5/31/2016 | $9.41 | (3.92%) | 2.33% | 1.64% | 0.09% | 32% | $9 |
| Year Ended 5/31/2015(d) | $9.84 | (1.60%) | 2.33% (e) | 1.73% (e) | (1.59%) (e) | 28% | $10 |
The accompanying Notes to Consolidated Financial Statements are an integral part of this statement.
Columbia Alternative Beta Fund | Annual Report 2018
| 37 |
Consolidated Financial Highlights (continued)
| | Net asset value,
beginning of
period | Net
investment
income
(loss) | Net
realized
and
unrealized
gain (loss) | Total from
investment
operations | Distributions
from net
investment
income | Total
distributions to
shareholders |
| Class T |
| Year Ended 5/31/2018 | $9.35 | 0.00 (f) | (0.50) | (0.50) | (0.21) | (0.21) |
| Year Ended 5/31/2017 | $9.42 | (0.09) | 0.06 | (0.03) | (0.04) | (0.04) |
| Year Ended 5/31/2016 | $9.84 | 0.02 | (0.38) | (0.36) | (0.06) | (0.06) |
| Year Ended 5/31/2015(d) | $10.00 | (0.05) | (0.11) | (0.16) | — | — |
| Notes to Consolidated Financial Highlights |
| (a) | In addition to the fees and expenses that the Fund bears directly, the Fund indirectly bears a pro rata share of the fees and expenses of any other funds in which it invests. Such indirect expenses are not included in the Fund’s reported expense ratios. |
| (b) | Total net expenses include the impact of certain fee waivers/expense reimbursements made by the Investment Manager and certain of its affiliates, if applicable. |
| (c) | Ratios include interest on collateral expense. For the periods indicated below, if interest on collateral expense had been excluded, expenses would have been lower by: |
| Class | 5/31/2018 |
| Class A | 0.01% |
| Advisor Class | 0.01% |
| Class C | 0.01% |
| Institutional Class | 0.01% |
| Institutional 2 Class | 0.01% |
| Institutional 3 Class | 0.01% |
| Class R | 0.01% |
| Class T | less than 0.01% |
| (d) | The Fund commenced operations on January 28, 2015. Per share data and total return reflect activity from that date. |
| (e) | Annualized. |
| (f) | Rounds to zero. |
The accompanying Notes to Consolidated Financial Statements are an integral part of this statement.
| 38 | Columbia Alternative Beta Fund | Annual Report 2018 |
Consolidated Financial Highlights (continued)
| | Net
asset
value,
end of
period | Total
return | Total gross
expense
ratio to
average
net assets(a) | Total net
expense
ratio to
average
net assets(a),(b) | Net investment
income (loss)
ratio to
average
net assets | Portfolio
turnover | Net
assets,
end of
period
(000’s) |
| Class T |
| Year Ended 5/31/2018 | $8.64 | (5.60%) | 1.49% (c) | 1.28% (c) | 0.02% | 0% | $368 |
| Year Ended 5/31/2017 | $9.35 | (0.28%) | 1.61% | 1.39% | (0.93%) | 71% | $913 |
| Year Ended 5/31/2016 | $9.42 | (3.68%) | 2.09% | 1.38% | 0.24% | 32% | $167,528 |
| Year Ended 5/31/2015(d) | $9.84 | (1.60%) | 2.07% (e) | 1.48% (e) | (1.35%) (e) | 28% | $114,125 |
The accompanying Notes to Consolidated Financial Statements are an integral part of this statement.
Columbia Alternative Beta Fund | Annual Report 2018
| 39 |
Notes to Consolidated Financial Statements
May 31, 2018
Note 1. Organization
Columbia Alternative Beta Fund (the Fund), a series of Columbia Funds Series Trust I (the Trust), is a non-diversified fund. The Trust is registered under the Investment Company Act of 1940, as amended (the 1940 Act), as an open-end management investment company organized as a Massachusetts business trust.
Basis for consolidation
CAAF Offshore Fund, Ltd. (the Subsidiary) is a Cayman Islands exempted company and wholly-owned subsidiary of the Fund. The Subsidiary acts as an investment vehicle in order to effect certain investment strategies consistent with the Fund’s investment objective and policies as stated in its current prospectus and statement of additional information. In accordance with the Memorandum and Articles of Association of the Subsidiary (the Articles), the Fund owns the sole issued share of the Subsidiary and retains all rights associated with such share, including the right to receive notice of, attend and vote at general meetings of the Subsidiary, rights in a winding-up or repayment of capital and the right to participate in the profits or assets of the Subsidiary. The consolidated financial statements (financial statements) include the accounts of the consolidated Fund and the respective Subsidiary. Subsequent references to the Fund within the Notes to Consolidated Financial Statements collectively refer to the Fund and the Subsidiary. All intercompany transactions and balances have been eliminated in the consolidation process.
At May 31, 2018, the Subsidiary financial statement information is as follows:
| | CAAF Offshore Fund, Ltd. |
| % of consolidated fund net assets | 26.28% |
| Net assets | $193,980,330 |
| Net investment income (loss) | 218,846 |
| Net realized gain (loss) | (7,086,482) |
| Net change in unrealized appreciation (depreciation) | 7,063,485 |
The financial statements present the portfolio holdings, financial position and results of operations of the Fund and the Subsidiary on a consolidated basis.
Fund shares
The Trust may issue an unlimited number of shares (without par value). Although all share classes generally have identical voting, dividend and liquidation rights, each share class votes separately when required by the Trust’s organizational documents or by law. Different share classes pay different distribution amounts to the extent the expenses of such share classes differ, and distributions in liquidation will be proportional to the net asset value of each share class. Each share class has its own expense and sales charge structure. The Fund offers each of the share classes identified below.
Class A shares are subject to a maximum front-end sales charge of 5.75% based on the initial investment amount. Class A shares purchased without an initial sales charge in accounts aggregating $1 million to $50 million at the time of purchase are subject to a contingent deferred sales charge (CDSC) if the shares are sold within 18 months after purchase, charged as follows: 1.00% CDSC if redeemed within 12 months after purchase, and 0.50% CDSC if redeemed more than 12, but less than 18, months after purchase.
Advisor Class shares are not subject to sales charges and are generally available only to omnibus retirement plans and certain investors as described in the Fund’s prospectus. Prior to November 1, 2017, Advisor Class shares were known as Class R4 shares.
Class C shares are subject to a 1.00% CDSC on shares redeemed within 12 months after purchase.
Institutional Class shares are not subject to sales charges and are generally available only to eligible investors, which are subject to different investment minimums as described in the Fund’s prospectus. Prior to November 1, 2017, Institutional Class shares were known as Class Z shares.
| 40 | Columbia Alternative Beta Fund | Annual Report 2018 |
Notes to Consolidated Financial Statements (continued)
May 31, 2018
Institutional 2 Class shares are not subject to sales charges and are generally available only to investors purchasing through authorized investment professionals and omnibus retirement plans as described in the Fund’s prospectus. Prior to November 1, 2017, Institutional 2 Class shares were known as Class R5 shares.
Institutional 3 Class shares are not subject to sales charges and are available to institutional and certain other investors as described in the Fund’s prospectus. Prior to November 1, 2017, Institutional 3 Class shares were known as Class Y shares.
Class R shares are not subject to sales charges and are generally available only to certain retirement plans and other investors as described in the Fund’s prospectus.
Class T shares are subject to a maximum front-end sales charge of 2.50% per transaction and must be purchased through financial intermediaries that, by written agreement with Columbia Management Investment Distributors, Inc., are specifically authorized to sell Class T shares.
Note 2. Summary of significant accounting policies
Basis of preparation
The Fund is an investment company that applies the accounting and reporting guidance in the Financial Accounting Standards Board (FASB) Accounting Standards Codification Topic 946, Financial Services - Investment Companies (ASC 946). The financial statements are prepared in accordance with U.S. generally accepted accounting principles (GAAP), which requires management to make certain estimates and assumptions that affect the reported amounts of assets and liabilities, the disclosure of contingent assets and liabilities at the date of the financial statements and the reported amounts of income and expenses during the reporting period. Actual results could differ from those estimates.
The following is a summary of significant accounting policies followed by the Fund in the preparation of its financial statements.
Security valuation
Investments in open-end investment companies, including money market funds, are valued at their latest net asset value.
Forward foreign currency exchange contracts are marked-to-market based upon foreign currency exchange rates provided by a pricing service.
Swap transactions are valued through an independent pricing service or broker, or if neither is available, through an internal model based upon observable inputs.
Investments for which market quotations are not readily available, or that have quotations which management believes are not reflective of market value or reliable, are valued at fair value as determined in good faith under procedures approved by and under the general supervision of the Board of Trustees. If a security or class of securities (such as foreign securities) is valued at fair value, such value is likely to be different from the quoted or published price for the security.
The determination of fair value often requires significant judgment. To determine fair value, management may use assumptions including but not limited to future cash flows and estimated risk premiums. Multiple inputs from various sources may be used to determine fair value.
GAAP requires disclosure regarding the inputs and valuation techniques used to measure fair value and any changes in valuation inputs or techniques. In addition, investments shall be disclosed by major category. This information is disclosed following the Fund’s Consolidated Portfolio of Investments.
Derivative instruments
The Fund invests in certain derivative instruments, as detailed below, to meet its investment objectives. Derivatives are instruments whose values depend on, or are derived from, in whole or in part, the value of one or more securities, currencies, commodities, indices, or other assets or instruments. Derivatives may be used to increase investment flexibility (including to maintain cash reserves while maintaining desired exposure to certain assets), for risk management (hedging)
Columbia Alternative Beta Fund | Annual Report 2018
| 41 |
Notes to Consolidated Financial Statements (continued)
May 31, 2018
purposes, to facilitate trading, to reduce transaction costs and to pursue higher investment returns. The Fund may also use derivative instruments to mitigate certain investment risks, such as foreign currency exchange rate risk, interest rate risk and credit risk. Derivatives may involve various risks, including the potential inability of the counterparty to fulfill its obligations under the terms of the contract, the potential for an illiquid secondary market (making it difficult for the Fund to sell or terminate, including at favorable prices) and the potential for market movements which may expose the Fund to gains or losses in excess of the amount shown in the Consolidated Statement of Assets and Liabilities. The notional amounts of derivative instruments, if applicable, are not recorded in the financial statements.
A derivative instrument may suffer a marked-to-market loss if the value of the contract decreases due to an unfavorable change in the market rates or values of the underlying instrument. Losses can also occur if the counterparty does not perform its obligations under the contract. The Fund’s risk of loss from counterparty credit risk on over-the-counter derivatives is generally limited to the aggregate unrealized gain netted against any collateral held by the Fund and the amount of any variation margin held by the counterparty, plus any replacement costs or related amounts. With exchange-traded or centrally cleared derivatives, there is reduced counterparty credit risk to the Fund since the clearinghouse or central counterparty (CCP) provides some protection in the case of clearing member default. The clearinghouse or CCP stands between the buyer and the seller of the contract; therefore, additional counterparty credit risk is failure of the clearinghouse or CCP. However, credit risk still exists in exchange-traded or centrally cleared derivatives with respect to initial and variation margin that is held in a broker’s customer account. While brokers are required to segregate customer margin from their own assets, in the event that a broker becomes insolvent or goes into bankruptcy and at that time there is a shortfall in the aggregate amount of margin held by the broker for all its clients, U.S. bankruptcy laws will typically allocate that shortfall on a pro-rata basis across all the broker’s customers (including the Fund), potentially resulting in losses to the Fund.
In order to better define its contractual rights and to secure rights that will help the Fund mitigate its counterparty risk, the Fund may enter into an International Swaps and Derivatives Association, Inc. Master Agreement (ISDA Master Agreement) or similar agreement with its derivatives contract counterparties. An ISDA Master Agreement is an agreement between the Fund and a counterparty that governs over-the-counter derivatives and typically contains, among other things, collateral posting terms and netting provisions in the event of a default and/or termination event. Under an ISDA Master Agreement, the Fund may, under certain circumstances, offset with the counterparty certain derivative instrument’s payables and/or receivables with collateral held and/or posted and create one single net payment. The provisions of the ISDA Master Agreement typically permit a single net payment in the event of default (close-out netting), including the bankruptcy or insolvency of the counterparty. Note, however, that bankruptcy or insolvency laws of a particular jurisdiction may impose restrictions on or prohibitions against the right of offset or netting in bankruptcy, insolvency or other events.
Collateral (margin) requirements differ by type of derivative. Margin requirements are established by the clearinghouse or CCP for exchange-traded and centrally cleared derivatives. Brokers can ask for margin in excess of the minimum in certain circumstances. Collateral terms are contract specific for over-the-counter derivatives. For over-the-counter derivatives traded under an ISDA Master Agreement, the collateral requirements are typically calculated by netting the marked-to-market amount for each transaction under such agreement and comparing that amount to the value of any variation margin currently pledged by the Fund and/or the counterparty. Generally, the amount of collateral due from or to a party has to exceed a minimum transfer amount threshold (e.g., $250,000) before a transfer has to be made. To the extent amounts due to the Fund from its counterparties are not fully collateralized, contractually or otherwise, the Fund bears the risk of loss from counterparty nonperformance. The Fund may also pay interest expense on cash collateral received from the broker. Any interest expense paid by the Fund is shown on the Consolidated Statement of Operations. The Fund attempts to mitigate counterparty risk by only entering into agreements with counterparties that it believes have the financial resources to honor their obligations and by monitoring the financial stability of those counterparties.
Certain ISDA Master Agreements allow counterparties of over-the-counter derivatives transactions to terminate derivatives contracts prior to maturity in the event the Fund’s net asset value declines by a stated percentage over a specified time period or if the Fund fails to meet certain terms of the ISDA Master Agreement, which would cause the Fund to accelerate payment of any net liability owed to the counterparty. The Fund also has termination rights if the counterparty fails to meet certain terms of the ISDA Master Agreement. In addition to considering counterparty credit risk, the Fund would consider terminating the derivatives contracts based on whether termination would result in a net liability owed from the counterparty.
| 42 | Columbia Alternative Beta Fund | Annual Report 2018 |
Notes to Consolidated Financial Statements (continued)
May 31, 2018
For financial reporting purposes, the Fund does not offset derivative assets and derivative liabilities that are subject to netting arrangements in the Consolidated Statement of Assets and Liabilities.
Forward foreign currency exchange contracts
Forward foreign currency exchange contracts are over-the-counter agreements between two parties to buy and sell a currency at a set price on a future date. The Fund utilized forward foreign currency exchange contracts to hedge the currency exposure associated with some or all of the Fund’s securities. These instruments may be used for other purposes in future periods.
The values of forward foreign currency exchange contracts fluctuate daily with changes in foreign currency exchange rates. Changes in the value of these contracts are recorded as unrealized appreciation or depreciation until the contract is exercised or has expired. The Fund will realize a gain or loss when the forward foreign currency exchange contract is closed or expires.
The use of forward foreign currency exchange contracts does not eliminate fluctuations in the prices of the Fund’s portfolio securities. The risks of forward foreign currency exchange contracts include movement in the values of the foreign currencies relative to the U.S. dollar (or other foreign currencies) and the possibility that counterparties will not complete their contractual obligations, which may be in excess of the amount reflected, if any, in the Consolidated Statement of Assets and Liabilities.
Futures contracts
Futures contracts are exchange-traded and represent commitments for the future purchase or sale of an asset at a specified price on a specified date. The Fund bought and sold futures contracts to manage exposure to the securities market. These instruments may be used for other purposes in future periods. Upon entering into futures contracts, the Fund bears risks that it may not achieve the anticipated benefits of the futures contracts and may realize a loss. Additional risks include counterparty credit risk, the possibility of an illiquid market, and that a change in the value of the contract or option may not correlate with changes in the value of the underlying asset.
Upon entering into a futures contract, the Fund deposits cash or securities with the broker, known as a futures commission merchant (FCM), in an amount sufficient to meet the initial margin requirement. The initial margin deposit must be maintained at an established level over the life of the contract. Cash deposited as initial margin is recorded in the Consolidated Statement of Assets and Liabilities as margin deposits. Securities deposited as initial margin are designated in the Consolidated Portfolio of Investments. Subsequent payments (variation margin) are made or received by the Fund each day. The variation margin payments are equal to the daily change in the contract value and are recorded as variation margin receivable or payable and are offset in unrealized gains or losses. The Fund recognizes a realized gain or loss when the contract is closed or expires. Futures contracts involve, to varying degrees, risk of loss in excess of the variation margin disclosed in the Consolidated Statement of Assets and Liabilities.
Swap contracts
Swap contracts are negotiated in the over-the-counter market and may be entered into as a bilateral contract or centrally cleared (centrally cleared swap contract). In a centrally cleared swap contract, immediately following execution of the swap contract with a broker, the swap contract is novated to a central counterparty (the CCP) and the CCP becomes the Fund’s counterparty to the centrally cleared swap contract. The Fund is required to deposit initial margin with the futures commission merchant (FCM), which pledges it through to the CCP in the form of cash or securities in an amount that varies depending on the size and risk profile of the particular swap contract. Securities deposited as initial margin are designated in the Consolidated Portfolio of Investments and cash deposited is recorded in the Consolidated Statement of Assets and Liabilities as margin deposits. Unlike a bilateral swap contract, for centrally cleared swap contracts, the Fund has minimal credit exposure to the FCM because the CCP stands between the Fund and the relevant buyer/seller on the other side of the contract. Swap contracts are marked-to-market daily and changes in value are recorded as unrealized appreciation (depreciation). The daily change in valuation of centrally cleared swap contracts, if any, is recorded as a receivable or payable for variation margin in the Consolidated Statement of Assets and Liabilities.
Columbia Alternative Beta Fund | Annual Report 2018
| 43 |
Notes to Consolidated Financial Statements (continued)
May 31, 2018
Entering into these contracts involves, to varying degrees, elements of interest, liquidity and counterparty credit risk in excess of the amounts recognized in the Consolidated Statement of Assets and Liabilities. Such risks involve the possibility that there may be unfavorable changes in interest rates, market conditions or other conditions, that it may be difficult to initiate a swap transaction or liquidate a position at an advantageous time or price which may result in significant losses, and that the FCM or CCP may not fulfill its obligation under the contract.
Total return swap contracts
The Fund entered into total return swap contracts to manage long or short exposure to the total return on a reference security index in return for periodic payments based on a fixed or variable interest rate. These instruments may be used for other purposes in future periods. Total return swap contracts may be used to obtain exposure to an underlying reference security, instrument, or other asset or index or market without owning, taking physical custody of, or short selling any such security, instrument or asset in a market.
Total return swap contracts are valued daily, and the change in value is recorded as unrealized appreciation (depreciation) until the termination of the swap, at which time the Fund will realize a gain (loss). Periodic payments received (or made) by the Fund over the term of the contract are recorded as realized gains (losses). Total return swap contracts are subject to the risk associated with the investment in the underlying reference security, instrument or asset. The risk in the case of short total return swap contracts is unlimited based on the potential for unlimited increases in the market value of the underlying reference security, instrument or asset. This risk may be offset if the Fund holds any of the underlying reference security, instrument or asset. The risk in the case of long total return swap contracts is limited to the current notional amount of the total return swap contract.
Effects of derivative transactions in the financial statements
The following tables are intended to provide additional information about the effect of derivatives on the financial statements of the Fund, including: the fair value of derivatives by risk category and the location of those fair values in the Consolidated Statement of Assets and Liabilities; and the impact of derivative transactions over the period in the Consolidated Statement of Operations, including realized and unrealized gains (losses). The derivative instrument schedules following the Consolidated Portfolio of Investments present additional information regarding derivative instruments outstanding at the end of the period, if any.
The following table is a summary of the fair value of derivative instruments (not considered to be hedging instruments for accounting disclosure purposes) at May 31, 2018:
| | Asset derivatives | |
Risk exposure
category | Consolidated statement
of assets and liabilities
location | Fair value ($) |
| Equity risk | Net assets — unrealized appreciation on swap contracts | 2,632,936* |
| Foreign exchange risk | Unrealized appreciation on forward foreign currency exchange contracts | 712,449 |
| Foreign exchange risk | Net assets — unrealized appreciation on swap contracts | 15,402* |
| Interest rate risk | Net assets — unrealized appreciation on swap contracts | 277,129* |
| Interest rate risk | Upfront payments on swap contracts | 14,429 |
| Commodity-related investment risk | Net assets — unrealized appreciation on swap contracts | 5,818,053* |
| Total | | 9,470,398 |
| 44 | Columbia Alternative Beta Fund | Annual Report 2018 |
Notes to Consolidated Financial Statements (continued)
May 31, 2018
| | Liability derivatives | |
Risk exposure
category | Consolidated statement
of assets and liabilities
location | Fair value ($) |
| Equity risk | Net assets — unrealized depreciation on swap contracts | 4,662,335* |
| Foreign exchange risk | Unrealized depreciation on forward foreign currency exchange contracts | 165,342 |
| Foreign exchange risk | Net assets — unrealized depreciation on swap contracts | 20,208,086* |
| Interest rate risk | Net assets — unrealized depreciation on swap contracts | 18,569,177* |
| Commodity-related investment risk | Net assets — unrealized depreciation on swap contracts | 676,872* |
| Total | | 44,281,812 |
| * | Includes cumulative appreciation (depreciation) as reported in the tables following the Consolidated Portfolio of Investments. Only the current day’s variation margin is reported in receivables or payables in the Consolidated Statement of Assets and Liabilities. |
The following table indicates the effect of derivative instruments (not considered to be hedging instruments for accounting disclosure purposes) in the Consolidated Statement of Operations for the year ended May 31, 2018:
| Amount of realized gain (loss) on derivatives recognized in income |
| Risk exposure category | Forward
foreign
currency
exchange
contracts
($) | Futures
contracts
($) | Swap
contracts
($) | Total
($) |
| Commodity-related investment risk | — | — | (7,855,006) | (7,855,006) |
| Credit risk | — | — | 109,250 | 109,250 |
| Equity risk | — | (369,168) | (4,301,364) | (4,670,532) |
| Foreign exchange risk | (2,498,252) | — | (1,800,320) | (4,298,572) |
| Interest rate risk | — | — | 5,971,372 | 5,971,372 |
| Total | (2,498,252) | (369,168) | (7,876,068) | (10,743,488) |
| |
| Change in unrealized appreciation (depreciation) on derivatives recognized in income |
| Risk exposure category | Forward
foreign
currency
exchange
contracts
($) | Futures
contracts
($) | Swap
contracts
($) | Total
($) |
| Commodity-related investment risk | — | — | 7,433,864 | 7,433,864 |
| Credit risk | — | — | (55,989) | (55,989) |
| Equity risk | — | 285,198 | (6,055,385) | (5,770,187) |
| Foreign exchange risk | 1,462,563 | — | (19,435,682) | (17,973,119) |
| Interest rate risk | — | — | (18,649,549) | (18,649,549) |
| Total | 1,462,563 | 285,198 | (36,762,741) | (35,014,980) |
The following table is a summary of the average outstanding volume by derivative instrument for the year ended May 31, 2018:
| Derivative instrument | Average notional
amounts ($)* |
| Futures contracts — short | 848,093 |
| Derivative instrument | Average unrealized
appreciation ($)** | Average unrealized
depreciation ($)** |
| Forward foreign currency exchange contracts | 520,362 | (266,495) |
| Total return swap contracts | 12,769,355 | (18,154,959) |
| * | Based on the ending daily outstanding amounts for the year ended May 31, 2018. |
| ** | Based on the ending quarterly outstanding amounts for the year ended May 31, 2018. |
Columbia Alternative Beta Fund | Annual Report 2018
| 45 |
Notes to Consolidated Financial Statements (continued)
May 31, 2018
Offsetting of assets and liabilities
The following table presents the Fund’s gross and net amount of assets and liabilities available for offset under netting arrangements as well as any related collateral received or pledged by the Fund as of May 31, 2018:
| | Barclays ($)(a) | Barclays ($)(a) | Citi ($) | Deutsche
Bank ($) | Goldman
Sachs
International ($)(a) | Goldman
Sachs
International ($)(a) | HSBC ($) | JPMorgan ($) | Morgan
Stanley ($) | Total ($) |
| Assets | | | | | | | | | | |
| Forward foreign currency exchange contracts | - | - | - | - | - | - | - | - | 712,449 | 712,449 |
| OTC total return swap contracts (b) | 165,165 | 3,446,973 | 2,167,778 | 15,402 | 948,758 | 203,302 | - | - | 1,810,090 | 8,757,468 |
| Repurchase agreements | | | | | | | | | | |
| Total assets | 165,165 | 3,446,973 | 2,167,778 | 15,402 | 948,758 | 203,302 | - | - | 2,522,539 | 9,469,917 |
| Liabilities | | | | | | | | | | |
| Forward foreign currency exchange contracts | - | - | - | - | - | - | 31,496 | - | 133,846 | 165,342 |
| OTC total return swap contracts (b) | 17 | 644,026 | 2,278 | 8,778,577 | 29,998,188 | 30,568 | - | 3,415,529 | 1,246,806 | 44,115,989 |
| Total liabilities | 17 | 644,026 | 2,278 | 8,778,577 | 29,998,188 | 30,568 | 31,496 | 3,415,529 | 1,380,652 | 44,281,331 |
| Total financial and derivative net assets | 165,148 | 2,802,947 | 2,165,500 | (8,763,175) | (29,049,430) | 172,734 | (31,496) | (3,415,529) | 1,141,887 | (34,811,414) |
| Total collateral received (pledged) (c) | - | 2,802,947 | 1,599,000 | (6,400,000) | (19,800,000) | - | - | (1,710,000) | 1,141,887 | (22,366,166) |
| Net amount (d) | 165,148 | - | 566,500 | (2,363,175) | (9,249,430) | 172,734 | (31,496) | (1,705,529) | - | (12,445,248) |
| (a) | Exposure can only be netted across transactions governed under the same master agreement with the same legal entity. |
| (b) | Over-the-Counter (OTC) swap contracts are presented at market value plus periodic payments receivable (payable), which is comprised of unrealized appreciation, unrealized depreciation, upfront payments and upfront receipts. |
| (c) | In some instances, the actual collateral received and/or pledged may be more than the amount shown due to overcollateralization. |
| (d) | Represents the net amount due from/(to) counterparties in the event of default. |
| 46 | Columbia Alternative Beta Fund | Annual Report 2018 |
Notes to Consolidated Financial Statements (continued)
May 31, 2018
Security transactions
Security transactions are accounted for on the trade date. Cost is determined and gains (losses) are based upon the specific identification method for both financial statement and federal income tax purposes.
Income recognition
Dividend income is recorded on the ex-dividend date.
Expenses
General expenses of the Trust are allocated to the Fund and other funds of the Trust based upon relative net assets or other expense allocation methodologies determined by the nature of the expense. Expenses directly attributable to the Fund are charged to the Fund. Expenses directly attributable to a specific class of shares are charged to that share class.
Determination of class net asset value
All income, expenses (other than class-specific expenses, which are charged to that share class, as shown in the Consolidated Statement of Operations) and realized and unrealized gains (losses) are allocated to each class of the Fund on a daily basis, based on the relative net assets of each class, for purposes of determining the net asset value of each class.
Federal income tax status
The Fund intends to qualify each year as a regulated investment company under Subchapter M of the Internal Revenue Code, as amended, and will distribute substantially all of its investment company taxable income and net capital gain, if any, for its tax year, and as such will not be subject to federal income taxes. In addition, the Fund intends to distribute in each calendar year substantially all of its ordinary income, capital gain net income and certain other amounts, if any, such that the Fund should not be subject to federal excise tax. Therefore, no federal income or excise tax provision is recorded.
Distributions to shareholders
Distributions from net investment income, if any, are declared and paid annually. Net realized capital gains, if any, are distributed at least annually. Income distributions and capital gain distributions are determined in accordance with federal income tax regulations, which may differ from GAAP.
Guarantees and indemnifications
Under the Trust’s organizational documents and, in some cases, by contract, its officers and trustees are indemnified against certain liabilities arising out of the performance of their duties to the Trust or its funds. In addition, certain of the Fund’s contracts with its service providers contain general indemnification clauses. The Fund’s maximum exposure under these arrangements is unknown since the amount of any future claims that may be made against the Fund cannot be determined, and the Fund has no historical basis for predicting the likelihood of any such claims.
Recent accounting pronouncement
Accounting Standards Update 2017-08 Premium Amortization on Purchased Callable Debt Securities
In March 2017, the Financial Accounting Standards Board issued Accounting Standards Update (ASU) No. 2017-08 Premium Amortization on Purchased Callable Debt Securities. ASU No. 2017-08 updates the accounting standards to shorten the amortization period for certain purchased callable debt securities, held at a premium, to be amortized to the earliest call date. The update applies to securities with explicit, noncontingent call features that are callable at fixed prices and on preset dates. The standard is effective for annual periods beginning after December 15, 2018 and interim periods within those fiscal years. At this time, management is evaluating the implication of this guidance and the impact it will have on the financial statement amounts and footnote disclosures, if any.
Columbia Alternative Beta Fund | Annual Report 2018
| 47 |
Notes to Consolidated Financial Statements (continued)
May 31, 2018
Note 3. Fees and other transactions with affiliates
Management services fees
The Fund has entered into a Management Agreement with Columbia Management Investment Advisers, LLC (the Investment Manager), a wholly-owned subsidiary of Ameriprise Financial, Inc. (Ameriprise Financial). Under the Management Agreement, the Investment Manager provides the Fund with investment research and advice, as well as administrative and accounting services. The management services fee is an annual fee that is equal to a percentage of the Fund’s daily net assets that declines from 0.96% to 0.93% as the Fund’s net assets increase. The effective management fee rate, net of fee waivers, for the year ended May 31, 2018 was 0.75% of the Fund’s average daily net assets.
Effective October 1, 2016, the Investment Manager has contractually agreed to waive 0.21% of the management fee through September 30, 2019.
Subadvisory agreement
The Fund’s Board of Trustees has approved a subadvisory agreement between the Investment Manager and Threadneedle International Limited (Threadneedle), an affiliate of the Investment Manager and an indirect wholly-owned subsidiary of Ameriprise Financial. As of May 31, 2018, Threadneedle is not providing services to the Fund pursuant to the subadvisory agreement.
Compensation of board members
Members of the Board of Trustees who are not officers or employees of the Investment Manager or Ameriprise Financial are compensated for their services to the Fund as disclosed in the Consolidated Statement of Operations. These members of the Board of Trustees may participate in a Deferred Compensation Plan (the Plan) which may be terminated at any time. Obligations of the Plan will be paid solely out of the Fund’s assets, and all amounts payable under the Plan constitute a general unsecured obligation of the Fund.
Compensation of Chief Compliance Officer
The Board of Trustees has appointed a Chief Compliance Officer to the Fund in accordance with federal securities regulations. As disclosed in the Consolidated Statement of Operations, a portion of the Chief Compliance Officer’s total compensation is allocated to the Fund, along with other allocations to affiliated funds governed by the Board of Trustees, based on relative net assets.
Transfer agency fees
Under a Transfer and Dividend Disbursing Agent Agreement, Columbia Management Investment Services Corp. (the Transfer Agent), an affiliate of the Investment Manager and a wholly-owned subsidiary of Ameriprise Financial, is responsible for providing transfer agency services to the Fund. The Transfer Agent has contracted with DST Asset Manager Solutions, Inc. (DST) to serve as sub-transfer agent. The Transfer Agent pays the fees of DST for services as sub-transfer agent and DST is not entitled to reimbursement for such fees from the Fund (with the exception of out-of-pocket fees).
The Fund pays the Transfer Agent a monthly transfer agency fee based on the number or the average value of accounts, depending on the type of account. In addition, the Fund pays the Transfer Agent a fee for shareholder services based on the number of accounts or on a percentage of the average aggregate value of the Fund’s shares maintained in omnibus accounts up to the lesser of the amount charged by the financial intermediary or a cap established by the Board of Trustees from time to time.
The Transfer Agent also receives compensation from the Fund for various shareholder services and reimbursements for certain out-of-pocket fees. Effective August 1, 2017, total transfer agency fees for Institutional 2 Class and Institutional 3 Class shares are subject to an annual limitation of not more than 0.07% and 0.02%, respectively, of the average daily net assets attributable to each share class. Prior to August 1, 2017, these limitations were 0.075% for Institutional 2 Class shares and 0.025% for Institutional 3 Class shares.
| 48 | Columbia Alternative Beta Fund | Annual Report 2018 |
Notes to Consolidated Financial Statements (continued)
May 31, 2018
For the year ended May 31, 2018, the Fund’s effective transfer agency fee rates as a percentage of average daily net assets of each class were as follows:
| | Effective rate (%) |
| Class A | 0.20 |
| Advisor Class | 0.20 |
| Class C | 0.20 |
| Institutional Class | 0.20 |
| Institutional 2 Class | 0.07 |
| Institutional 3 Class | 0.01 |
| Class R | 0.19 |
| Class T | 0.20 |
An annual minimum account balance fee of $20 may apply to certain accounts with a value below the applicable share class’s initial minimum investment requirements to reduce the impact of small accounts on transfer agency fees. These minimum account balance fees are remitted to the Fund and recorded as part of expense reductions in the Consolidated Statement of Operations. For the year ended May 31, 2018, no minimum account balance fees were charged by the Fund.
Distribution and service fees
The Fund has entered into an agreement with Columbia Management Investment Distributors, Inc. (the Distributor), an affiliate of the Investment Manager and a wholly-owned subsidiary of Ameriprise Financial, for distribution and shareholder services. The Board of Trustees has approved, and the Fund has adopted, distribution and shareholder service plans (the Plans) applicable to certain share classes, which set the distribution and service fees for the Fund. These fees are calculated daily and are intended to compensate the Distributor and/or eligible selling and/or servicing agents for selling shares of the Fund and providing services to investors.
Under the Plans, the Fund pays a monthly service fee to the Distributor at the maximum annual rate of 0.25% of the average daily net assets attributable to Class A, Class C and Class T shares of the Fund. Also under the Plans, the Fund pays a monthly distribution fee to the Distributor at the maximum annual rates of 0.75%, 0.50% and 0.25% of the average daily net assets attributable to Class C, Class R and Class T shares of the Fund, respectively.
Although the Fund may pay a distribution fee up to 0.25% of the Fund’s average daily net assets attributable to Class T shares and a service fee of up to 0.25% of the Fund’s average daily net assets attributable to Class T shares, the aggregate fee shall not exceed 0.25% of the Fund’s average daily net assets attributable to Class T shares.
Sales charges (unaudited)
Sales charges, including front-end charges and CDSCs, received by the Distributor for distributing Fund shares for the year ended May 31, 2018, if any, are listed below:
| | Amount ($) |
| Class A | 10,247 |
| Class C | 359 |
Columbia Alternative Beta Fund | Annual Report 2018
| 49 |
Notes to Consolidated Financial Statements (continued)
May 31, 2018
Expenses waived/reimbursed by the Investment Manager and its affiliates
The Investment Manager and certain of its affiliates have contractually agreed to waive fees and/or reimburse expenses (excluding certain fees and expenses described below) for the period(s) disclosed below, unless sooner terminated at the sole discretion of the Board of Trustees, so that the Fund’s net operating expenses, after giving effect to fees waived/expenses reimbursed and any balance credits and/or overdraft charges from the Fund’s custodian, do not exceed the following annual rate(s) as a percentage of the class’ average daily net assets:
| | October 1, 2017
through
September 30, 2018 | Prior to
October 1, 2017 |
| Class A | 1.38% | 1.38% |
| Advisor Class | 1.13 | 1.13 |
| Class C | 2.13 | 2.13 |
| Institutional Class | 1.13 | 1.13 |
| Institutional 2 Class | 1.00 | 1.01 |
| Institutional 3 Class | 0.94 | 0.96 |
| Class R | 1.63 | 1.63 |
| Class T | 1.38 | 1.38 |
Under the agreement governing these fee waivers and/or expense reimbursement arrangements, the following fees and expenses are excluded from the waiver/reimbursement commitment, and therefore will be paid by the Fund, if applicable: taxes (including foreign transaction taxes), expenses associated with investments in affiliated and non-affiliated pooled investment vehicles (including mutual funds and exchange-traded funds), transaction costs and brokerage commissions, costs related to any securities lending program, dividend expenses associated with securities sold short, inverse floater program fees and expenses, transaction charges and interest on borrowed money, interest, infrequent and/or unusual expenses and any other expenses the exclusion of which is specifically approved by the Board of Trustees. This agreement may be modified or amended only with approval from the Investment Manager, certain of its affiliates and the Fund. Any fees waived and/or expenses reimbursed under the expense reimbursement arrangements described above are not recoverable by the Investment Manager or its affiliates in future periods. Reflected in the cap commitments is the Investment Manager’s contractual agreement to waive 0.21% of its management fee, with this waiver agreement in effect through September 30, 2019, unless sooner terminated at the sole discretion of the Board of Trustees.
Note 4. Federal tax information
The timing and character of income and capital gain distributions are determined in accordance with income tax regulations, which may differ from GAAP because of temporary or permanent book to tax differences.
At May 31, 2018, these differences were primarily due to differing treatment for derivative investments, swap investments, late-year ordinary losses, capital loss carryforwards, trustees’ deferred compensation, foreign currency transactions, non-deductible expenses and investments in commodity subsidiaries. To the extent these differences were permanent, reclassifications were made among the components of the Fund’s net assets in the Consolidated Statement of Assets and Liabilities. Temporary differences do not require reclassifications.
In the Consolidated Statement of Assets and Liabilities the following reclassifications were made:
Undistributed net
investment
income ($) | Accumulated
net realized
(loss) ($) | Paid in
capital ($) |
| 534,635 | (7,402,271) | 6,867,636 |
Net investment income (loss) and net realized gains (losses), as disclosed in the Consolidated Statement of Operations, and net assets were not affected by this reclassification.
| 50 | Columbia Alternative Beta Fund | Annual Report 2018 |
Notes to Consolidated Financial Statements (continued)
May 31, 2018
The tax character of distributions paid during the years indicated was as follows:
| Year Ended May 31, 2018 | Year Ended May 31, 2017 |
Ordinary
income ($) | Long-term
capital gains ($) | Total ($) | Ordinary
income ($) | Long-term
capital gains ($) | Total ($) |
| 15,601,167 | — | 15,601,167 | 1,684,933 | — | 1,684,933 |
Short-term capital gain distributions, if any, are considered ordinary income distributions for tax purposes. At May 31, 2018, the components of distributable earnings on a tax basis were as follows:
Undistributed
ordinary income ($) | Undistributed
long-term
capital gains ($) | Capital loss
carryforwards ($) | Net unrealized
(depreciation) ($) |
| — | — | (20,972,018) | (10,452,805) |
At May 31, 2018, the cost of all investments for federal income tax purposes along with the aggregate gross unrealized appreciation and depreciation based on that cost was:
Federal
tax cost ($) | Gross unrealized
appreciation ($) | Gross unrealized
(depreciation) ($) | Net unrealized
(depreciation) ($) |
| 719,750,012 | 41,078,914 | (51,531,719) | (10,452,805) |
Tax cost of investments and unrealized appreciation/(depreciation) may also include timing differences that do not constitute adjustments to tax basis.
The following capital loss carryforwards, determined at May 31, 2018, may be available to reduce taxable income arising from future net realized gains on investments, if any, to the extent permitted by the Internal Revenue Code. Capital loss carryforwards with no expiration are required to be utilized prior to any capital losses which carry an expiration date. As a result of this ordering rule, capital loss carryforwards which carry an expiration date may be more likely to expire unused. In addition, for the year ended May 31, 2018, capital loss carryforwards utilized, expired unused and permanently lost, if any, were as follows:
| 2019 ($) | No expiration
short-term ($) | No expiration
long-term ($) | Total ($) | Utilized ($) | Expired ($) | Permanently
lost ($) |
| — | 19,517,130 | 1,454,888 | 20,972,018 | — | — | — |
Under current tax rules, regulated investment companies can elect to treat certain late-year ordinary losses incurred and post-October capital losses (capital losses realized after October 31) as arising on the first day of the following taxable year. As of May 31, 2018, the Fund will elect to treat the following late-year ordinary losses and post-October capital losses as arising on June 1, 2018.
Late year
ordinary losses ($) | Post-October
capital losses ($) |
| 32,868,190 | — |
Management of the Fund has concluded that there are no significant uncertain tax positions in the Fund that would require recognition in the financial statements. However, management’s conclusion may be subject to review and adjustment at a later date based on factors including, but not limited to, new tax laws, regulations, and administrative interpretations (including relevant court decisions). Generally, the Fund’s federal tax returns for the prior three fiscal years remain subject to examination by the Internal Revenue Service.
Note 5. Portfolio information
For the year ended May 31, 2018, there were no purchases or proceeds from the sale of securities other than short-term investment transactions and derivative activity, if any. Only the amount of long-term security purchases and sales activity, excluding derivatives, impacts the portfolio turnover reported in the Consolidated Financial Highlights.
Columbia Alternative Beta Fund | Annual Report 2018
| 51 |
Notes to Consolidated Financial Statements (continued)
May 31, 2018
Note 6. Affiliated money market fund
The Fund invests significantly in Columbia Short-Term Cash Fund, an affiliated money market fund established for the exclusive use by the Fund and other affiliated funds (the Affiliated MMF). The income earned by the Fund from such investments is included as Dividends - affiliated issuers in the Consolidated Statement of Operations. As an investing fund, the Fund indirectly bears its proportionate share of the expenses of the Affiliated MMF. The Affiliated MMF prices its shares with a floating net asset value. In addition, the Board of Trustees of the Affiliated MMF may impose a fee on redemptions (sometimes referred to as a liquidity fee) or temporarily suspend redemptions (sometimes referred to as imposing a redemption gate) in the event its liquidity falls below regulatory limits.
Note 7. Interfund lending
Pursuant to an exemptive order granted by the Securities and Exchange Commission, the Fund participates in a program (the Interfund Program) allowing each participating Columbia Fund (each, a Participating Fund) to lend money directly to and, except for closed-end funds and money market funds, borrow money directly from other Participating Funds for temporary purposes. The amounts eligible for borrowing and lending under the Interfund Program are subject to certain restrictions.
Interfund loans are subject to the risk that the borrowing fund could be unable to repay the loan when due, and a delay in repayment to the lending fund could result in lost opportunities and/or additional lending costs. The exemptive order is subject to conditions intended to mitigate conflicts of interest arising from the Investment Manager’s relationship with each Participating Fund.
The Fund did not borrow or lend money under the Interfund Program during the year ended May 31, 2018.
Note 8. Line of credit
The Fund has access to a revolving credit facility with a syndicate of banks led by Citibank, N.A., HSBC Bank USA, N.A. and JPMorgan Chase Bank, N.A. whereby the Fund may borrow for the temporary funding of shareholder redemptions or for other temporary or emergency purposes. The credit facility, which is a collective agreement between the Fund and certain other funds managed by the Investment Manager, severally and not jointly, permits collective borrowings up to $1 billion. Interest is charged to each participating fund based on its borrowings at a rate equal to the higher of (i) the overnight federal funds rate plus 1.00% or (ii) the one-month LIBOR rate plus 1.00%. Each borrowing under the credit facility matures no later than 60 days after the date of borrowing. The Fund also pays a commitment fee equal to its pro rata share of the amount of the credit facility at a rate of 0.15% per annum. The commitment fee is included in other expenses in the Consolidated Statement of Operations.
The Fund had no borrowings during the year ended May 31, 2018.
Note 9. Significant risks
Alternative strategies investment risk
An investment in alternative investment strategies (Alternative Strategies) involves risks, which may be significant. Alternative Strategies may include strategies, instruments or other assets, such as derivatives, that seek investment returns uncorrelated with the broad equity and fixed income/debt markets, as well as those providing exposure to other markets (such as commodity markets), including but not limited to absolute (positive) return strategies. Alternative Strategies may fail to achieve their desired performance, market or other exposure, or their returns (or lack thereof) may be more correlated with the broad equity and/or fixed income/debt markets than was anticipated, and the fund may lose money.
Derivatives risk
Losses involving derivative instruments may be substantial, because a relatively small price movement in the underlying security(ies), commodity, currency or index or other instrument or asset may result in a substantial loss for the Fund. In addition to the potential for increased losses, the use of derivative instruments may lead to increased volatility within the Fund. Derivatives will typically increase the Fund’s exposure to principal risks to which it is otherwise exposed, and may expose the Fund to additional risks, including correlation risk, counterparty risk, hedging risk, leverage risk and liquidity risk.
| 52 | Columbia Alternative Beta Fund | Annual Report 2018 |
Notes to Consolidated Financial Statements (continued)
May 31, 2018
Leverage risk
Leverage occurs when the Fund increases its assets available for investment using borrowings, short sales, derivatives, or similar instruments or techniques. The use of leverage may make any change in the Fund’s net asset value even greater and thus result in increased volatility of returns. Because short sales involve borrowing securities and then selling them, the Fund’s short sales effectively leverage the Fund’s assets. The Fund’s assets that are used as collateral to secure the Fund’s obligations to return the securities sold short may decrease in value while the short positions are outstanding, which may force the Fund to use its other assets to increase the collateral. Leverage can create an interest expense that may lower the Fund’s overall returns. Leverage presents the opportunity for increased net income and capital gains, but also exaggerates the Fund’s risk of loss. There can be no guarantee that a leveraging strategy will be successful.
Non-diversification risk
A non-diversified fund is permitted to invest a greater percentage of its total assets in fewer issuers than a diversified fund. The Fund may, therefore, have a greater risk of loss from a few issuers than a similar fund that invests more broadly.
Shareholder concentration risk
At May 31, 2018, affiliated shareholders of record owned 99.1% of the outstanding shares of the Fund in one or more accounts. Subscription and redemption activity by concentrated accounts may have a significant effect on the operations of the Fund. In the case of a large redemption, the Fund may be forced to sell investments at inopportune times, including its liquid positions, which may result in Fund losses and the Fund holding a higher percentage of less liquid positions. Large redemptions could result in decreased economies of scale and increased operating expenses for non-redeeming Fund shareholders.
Note 10. Subsequent events
Management has evaluated the events and transactions that have occurred through the date the financial statements were issued and noted no items requiring adjustment of the financial statements or additional disclosure.
Note 11. Information regarding pending and settled legal proceedings
Ameriprise Financial and certain of its affiliates have historically been involved in a number of legal, arbitration and regulatory proceedings, including routine litigation, class actions, and governmental actions, concerning matters arising in connection with the conduct of their business activities. Ameriprise Financial believes that the Fund is not currently the subject of, and that neither Ameriprise Financial nor any of its affiliates are the subject of, any pending legal, arbitration or regulatory proceedings that are likely to have a material adverse effect on the Fund or the ability of Ameriprise Financial or its affiliates to perform under their contracts with the Fund. Ameriprise Financial is required to make quarterly (10-Q), annual (10-K) and, as necessary, 8-K filings with the Securities and Exchange Commission (SEC) on legal and regulatory matters that relate to Ameriprise Financial and its affiliates. Copies of these filings may be obtained by accessing the SEC website at www.sec.gov.
There can be no assurance that these matters, or the adverse publicity associated with them, will not result in increased Fund redemptions, reduced sale of Fund shares or other adverse consequences to the Fund. Further, although we believe proceedings are not likely to have a material adverse effect on the Fund or the ability of Ameriprise Financial or its affiliates to perform under their contracts with the Fund, these proceedings are subject to uncertainties and, as such, we are unable to estimate the possible loss or range of loss that may result. An adverse outcome in one or more of these proceedings could result in adverse judgments, settlements, fines, penalties or other relief that could have a material adverse effect on the consolidated financial condition or results of operations of Ameriprise Financial.
Columbia Alternative Beta Fund | Annual Report 2018
| 53 |
Report of Independent Registered Public Accounting Firm
To the Board of Trustees of Columbia Funds Series Trust I and Shareholders of Columbia Alternative Beta Fund
Opinion on the Financial Statements
We have audited the accompanying consolidated statement of assets and liabilities, including the consolidated portfolio of investments, of Columbia Alternative Beta Fund (one of the funds constituting Columbia Funds Series Trust I, hereafter referred to as the "Fund") and its subsidiary as of May 31, 2018, the related consolidated statement of operations for the year ended May 31, 2018, the consolidated statement of changes in net assets for each of the two years in the period ended May 31, 2018, including the related notes, and the consolidated financial highlights for each of the four years in the period ended May 31, 2018 (collectively referred to as the “consolidated financial statements”). In our opinion, the consolidated financial statements present fairly, in all material respects, the financial position of Columbia Alternative Beta Fund and its subsidiary as of May 31, 2018, the results of their operations for the year then ended, the changes in their net assets for each of the two years in the period ended May 31, 2018 and the financial highlights for each of the four years in the period ended May 31, 2018 in conformity with accounting principles generally accepted in the United States of America.
Basis for Opinion
These consolidated financial statements are the responsibility of the Fund’s management. Our responsibility is to express an opinion on the Fund’s consolidated financial statements based on our audits. We are a public accounting firm registered with the Public Company Accounting Oversight Board (United States) (“PCAOB”) and are required to be independent with respect to the Fund in accordance with the U.S. federal securities laws and the applicable rules and regulations of the Securities and Exchange Commission and the PCAOB.
We conducted our audits of these consolidated financial statements in accordance with the standards of the PCAOB. Those standards require that we plan and perform the audits to obtain reasonable assurance about whether the consolidated financial statements are free of material misstatement, whether due to error or fraud.
Our audits included performing procedures to assess the risks of material misstatement of the consolidated financial statements, whether due to error or fraud, and performing procedures that respond to those risks. Such procedures included examining, on a test basis, evidence regarding the amounts and disclosures in the consolidated financial statements. Our audits also included evaluating the accounting principles used and significant estimates made by management, as well as evaluating the overall presentation of the consolidated financial statements. Our procedures included confirmation of securities owned as of May 31, 2018 by correspondence with the custodian, brokers and transfer agent; when replies were not received from brokers, we performed other auditing procedures. We believe that our audits provide a reasonable basis for our opinion.
/s/PricewaterhouseCoopers LLP
Minneapolis, Minnesota
July 23, 2018
We have served as the auditor of one or more investment companies within the Columbia Funds Complex since 1977.
| 54 | Columbia Alternative Beta Fund | Annual Report 2018 |
Shareholders elect the Board that oversees the Fund’s operations. The Board appoints officers who are responsible for day-to-day business decisions based on policies set by the Board. The following table provides basic biographical information about the Fund’s Trustees, including their principal occupations during the past five years, although specific titles for individuals may have varied over the period. The year set forth beneath Length of Service in the table below is the year in which the Trustee was first appointed or elected as Trustee to any Fund currently in the Columbia Funds Complex or a predecessor thereof. Under current Board policy, members serve terms of indefinite duration.
Independent trustees
| Name, address, year of birth | Position held with the Trust and length of service | Principal occupation(s) during the past five years and other relevant professional experience | Number of Funds in the Columbia Fund Complex overseen | Other directorships held by Trustee during the past five years |
Janet Langford Carrig
c/o Columbia Management
Investment Advisers, LLC
225 Franklin Street
Mail Drop BX32 05228
Boston, MA 02110
1957 | Trustee
1996 | Senior Vice President, General Counsel and Corporate Secretary, ConocoPhillips (independent energy company) since September 2007 | 71 | None |
Douglas A. Hacker
c/o Columbia Management
Investment Advisers, LLC
225 Franklin Street
Mail Drop BX32 05228
Boston, MA 02110
1955 | Trustee and Chairman of the Board
1996 | Independent business executive since May 2006; Executive Vice President — Strategy of United Airlines from December 2002 to May 2006; President of UAL Loyalty Services (airline marketing company) from September 2001 to December 2002; Executive Vice President and Chief Financial Officer of United Airlines from July 1999 to September 2001 | 71 | Spartan Nash Company, (food distributor); Nash Finch Company (food distributor) from 2005 to 2013; Aircastle Limited (aircraft leasing); SeaCube Container Leasing Ltd. (container leasing) from 2010 to 2013; and Travelport Worldwide Limited (travel information technology) |
Nancy T. Lukitsh
c/o Columbia Management
Investment Advisers, LLC
225 Franklin Street
Mail Drop BX32 05228
Boston, MA 02110
1956 | Trustee
2011 | Senior Vice President, Partner and Director of Marketing, Wellington Management Company, LLP (investment adviser) from 1997 to 2010; Chair, Wellington Management Portfolios (commingled non-U.S. investment pools) from 2007 to 2010; Director, Wellington Trust Company, NA and other Wellington affiliates from 1997 to 2010 | 71 | None |
David M. Moffett
c/o Columbia Management
Investment Advisers, LLC
225 Franklin Street
Mail Drop BX32 05228
Boston, MA 02110
1952 | Trustee
2011 | Retired. Consultant to Bridgewater and Associates | 71 | Director, CSX Corporation; Genworth Financial, Inc. (financial and insurance products and services); PayPal Holdings Inc. (payment and data processing services); Trustee, University of Oklahoma Foundation; former Director, eBay Inc. (online trading community), 2007-2015; and former Director, CIT Bank, CIT Group Inc. (commercial and consumer finance), 2010-2016 |
John J. Neuhauser
c/o Columbia Management
Investment Advisers, LLC
225 Franklin Street
Mail Drop BX32 05228
Boston, MA 02110
1943 | Trustee
1984 | President, Saint Michael’s College since August 2007; Director or Trustee of several non-profit organizations, including University of Vermont Medical Center; Academic Vice President and Dean of Faculties, Boston College from August 1999 to October 2005; University Professor, Boston College from November 2005 to August 2007 | 71 | Liberty All-Star Equity Fund and Liberty All- Star Growth Fund (closed-end funds) |
Columbia Alternative Beta Fund | Annual Report 2018
| 55 |
TRUSTEES AND OFFICERS (continued)
Independent trustees (continued)
| Name, address, year of birth | Position held with the Trust and length of service | Principal occupation(s) during the past five years and other relevant professional experience | Number of Funds in the Columbia Fund Complex overseen | Other directorships held by Trustee during the past five years |
Patrick J. Simpson
c/o Columbia Management
Investment Advisers, LLC
225 Franklin Street
Mail Drop BX32 05228
Boston, MA 02110
1944 | Trustee
2000 | Of Counsel, Perkins Coie LLP (law firm) since 2015; Partner, Perkins Coie LLP from 1988 to 2014 | 71 | None |
Anne-Lee Verville
c/o Columbia Management
Investment Advisers, LLC
225 Franklin Street
Mail Drop BX32 05228
Boston, MA 02110
1945 | Trustee
1998 | Retired. General Manager, Global Education Industry from 1994 to 1997, President – Application Systems Division from 1991 to 1994, Chief Financial Officer – US Marketing & Services from 1988 to 1991, and Chief Information Officer from 1987 to 1988, IBM Corporation (computer and technology) | 71 | Enesco Group, Inc. (producer of giftware and home and garden decor products) from 2001 to 2006 |
Consultants to the Independent Trustees*
| Name, address, year of birth | Position held with the Trust and length of service | Principal occupation(s) during the past five years and other relevant professional experience | Number of Funds in the Columbia Funds complex overseen | Other directorships held by Trustee during the past five years |
J. Kevin Connaughton
c/o Columbia
Management Investment
Advisers, LLC,
225 Franklin Street
Mail Drop BX32 05228,
Boston, MA 02110
1964 | Independent Trustee Consultant
2016 | Independent Trustee Consultant, Columbia Funds since March 2016; Adjunct Professor of Finance, Bentley University since November 2017; Managing Director and General Manager of Mutual Fund Products, Columbia Management Investment Advisers, LLC from May 2010 to February 2015; President, Columbia Funds from 2009 to 2015; and senior officer of Columbia Funds and affiliated funds from 2003 to 2015 | 71 | Director, The Autism Project since March 2015; former Trustee, New Century Portfolios, March 2015-December 2017; formerly on Board of Governors, Gateway Healthcare, January 2016 – December 2017 |
Natalie A. Trunow
c/o Columbia
Management Investment
Advisers, LLC,
225 Franklin Street
Mail Drop BX32 05228,
Boston, MA 02110
1967 | Independent Trustee Consultant
2016 | Independent Trustee Consultant, Columbia Funds since September 2016; Chief Executive Officer, Millennial Portfolio Solutions LLC (asset management and consulting services) since January 2016; Director of Investments, Casey Family Programs from April 2016 to September 2016; Senior Vice President and Chief Investment Officer, Calvert Investments from August 2008 to January 2016; Section Head and Portfolio Manager, General Motors Asset Management from June 1997 to August 2008 | 71 | Director, Health Services for Children with Special Needs, Inc.; Director, Guidewell Financial Solutions |
| * | J. Kevin Connaughton was appointed consultant to the Independent Trustees effective March 1, 2016. Natalie A. Trunow was appointed consultant to the Independent Trustees effective September 1, 2016. Shareholders of the Funds are expected to be asked to elect each of Mr. Connaughton and Ms. Trunow as a Trustee at a future shareholder meeting. |
| 56 | Columbia Alternative Beta Fund | Annual Report 2018 |
TRUSTEES AND OFFICERS (continued)
Interested trustee affiliated with Investment Manager*
| Name, address, year of birth | Position held with the Trust and length of service | Principal occupation(s) during the past five years and other relevant professional experience | Number of Funds in the Columbia Funds Complex overseen | Other directorships held by Trustee during the past five years |
William F. Truscott
c/o Columbia Management
Investment Advisers, LLC
225 Franklin Street
Boston, MA 02110
1960 | Trustee
2012 | Chairman of the Board and President, Columbia Management Investment Advisers, LLC since May 2010 and February 2012, respectively; Chief Executive Officer, Global Asset Management, Ameriprise Financial, Inc. since September 2012 (previously Chief Executive Officer, U.S. Asset Management & President, Annuities, May 2010-September 2012); Director and Chief Executive Officer, Columbia Management Investment Distributors, Inc. since May 2010 and February 2012, respectively; Chairman of the Board and Chief Executive Officer, RiverSource Distributors, Inc. since 2006; Director, Threadneedle Asset Management Holdings, SARL since 2014; President and Chief Executive Officer, Ameriprise Certificate Company, 2006-August 2012 | 196 | Chairman of the Board, Columbia Management Investment Advisers, LLC since May 2010; Director, Columbia Management Investment Distributors, Inc. since May 2010; former Director, Ameriprise Certificate Company, 2006 - January 2013 |
| * | Interested person (as defined under the 1940 Act) by reason of being an officer, director, security holder and/or employee of the Investment Manager or Ameriprise Financial. |
The Statement of Additional Information has additional information about the Fund’s Board members and is available, without charge, upon request by calling 800.345.6611, visiting columbiathreadneedleus.com/investor/ or contacting your financial intermediary.
Columbia Alternative Beta Fund | Annual Report 2018
| 57 |
TRUSTEES AND OFFICERS (continued)
The Board has appointed officers who are responsible for day-to-day business decisions based on policies it has established. The officers serve at the pleasure of the Board. The following table provides basic information about the Officers of the Fund, including principal occupations during the past five years, although their specific titles may have varied over the period. In addition to Mr. Truscott, who is Senior Vice President, the Fund’s other officers are:
Fund officers
Name,
address and
year of birth | Position and year
first appointed to
position for any Fund
in the Columbia
Funds complex or a
predecessor thereof | Principal occupation(s) during past five years |
Christopher O. Petersen
5228 Ameriprise
Financial Center
Minneapolis, MN 55474
Born 1970 | President and Principal Executive Officer (2015) | Vice President and Lead Chief Counsel, Ameriprise Financial, Inc. since January 2015 (previously, Vice President and Chief Counsel, January 2010 - December 2014; officer of Columbia Funds and affiliated funds since 2007. |
Michael G. Clarke
225 Franklin Street
Boston, MA 02110
Born 1969 | Treasurer (2011), Chief Financial Officer (2009) and Chief Accounting Officer (2015) | Vice President — Mutual Fund Administration, Columbia Management Investment Advisers, LLC, since May 2010; senior officer of Columbia Funds and affiliated funds since 2002. |
Paul B. Goucher
100 Park Avenue
New York, NY 10017
Born 1968 | Senior Vice President (2011) and Assistant Secretary (2008) | Senior Vice President and Assistant General Counsel, Ameriprise Financial, Inc. since January 2017 (previously Vice President and Lead Chief Counsel, November 2008 - January 2017 and January 2013 - January 2017, respectively; and Chief Counsel, January 2010 - January 2013); Vice President, Chief Legal Officer and Assistant Secretary, Columbia Management Investment Advisers, LLC since May 2010. |
Thomas P. McGuire
225 Franklin Street
Boston, MA 02110
Born 1972 | Senior Vice President and Chief Compliance Officer (2012) | Vice President — Asset Management Compliance, Ameriprise Financial, Inc., since May 2010; Chief Compliance Officer, Ameriprise Certificate Company since September 2010. |
Colin Moore
225 Franklin Street
Boston, MA 02110
Born 1958 | Senior Vice President (2010) | Executive Vice President and Global Chief Investment Officer, Ameriprise Financial, Inc., since July 2013; Executive Vice President and Global Chief Investment Officer, Columbia Management Investment Advisers, LLC since July 2013 (previously Director and Global Chief Investment Officer, 2010 - 2013). |
Ryan C. Larrenaga
225 Franklin Street
Boston, MA 02110
Born 1970 | Senior Vice President (2017), Chief Legal Officer (2017) and Secretary (2015) | Vice President and Group Counsel, Ameriprise Financial, Inc. since August 2011; officer of Columbia Funds and affiliated funds since 2005. |
Michael E. DeFao
225 Franklin Street
Boston, MA 02110
Born 1968 | Vice President (2011) and Assistant Secretary (2010) | Vice President and Chief Counsel, Ameriprise Financial, Inc. since May 2010. |
Amy Johnson
5228 Ameriprise
Financial Center
Minneapolis, MN 55474
Born 1965 | Vice President (2006) | Managing Director and Global Head of Operations, Columbia Management Investment Advisers, LLC since April 2016 (previously Managing Director and Chief Operating Officer, 2010 - 2016). |
Lyn Kephart-Strong
5228 Ameriprise
Financial Center
Minneapolis, MN 55474
Born 1960 | Vice President (2015) | President, Columbia Management Investment Services Corp. since October 2014; Vice President & Resolution Officer, Ameriprise Trust Company since August 2009. |
| 58 | Columbia Alternative Beta Fund | Annual Report 2018 |
Proxy voting policies and procedures
The policy of the Board of Trustees is to vote the proxies of the companies in which the Fund holds investments consistent with the procedures as stated in the Statement of Additional Information (SAI). You may obtain a copy of the SAI without charge by calling 800.345.6611; contacting your financial intermediary; visiting columbiathreadneedleus.com/investor/; or searching the website of the Securities and Exchange Commission (SEC) at sec.gov. Information regarding how the Fund voted proxies relating to portfolio securities is filed with the SEC by August 31st for the most recent 12-month period ending June 30th of that year, and is available without charge by visiting columbiathreadneedleus.com/investor/, or searching the website of the SEC at sec.gov.
Quarterly schedule of investments
The Fund files a complete schedule of portfolio holdings with the SEC for the first and third quarters of each fiscal year on Form N-Q. The Fund’s Form N-Q is available on the SEC’s website at sec.gov and may be reviewed and copied at the SEC’s Public Reference Room in Washington, D.C. Information on the operation of the Public Reference Room may be obtained by calling 800.SEC.0330. The Fund’s complete schedule of portfolio holdings, as filed on Form N-Q, can also be obtained without charge, upon request, by calling 800.345.6611.
Additional Fund information
For more information about the Fund, please visit columbiathreadneedleus.com/investor/ or call 800.345.6611. Customer Service Representatives are available to answer your questions Monday through Friday from 8 a.m. to 7 p.m. Eastern time.
You may obtain the current net asset value (NAV) of Fund shares at no cost by calling 800.345.6611 or by sending an e-mail to serviceinquiries@columbiathreadneedle.com.
Fund investment manager
Columbia Management Investment Advisers, LLC
225 Franklin Street
Boston, MA 02110
Fund distributor
Columbia Management Investment Distributors, Inc.
225 Franklin Street
Boston, MA 02110
Fund transfer agent
Columbia Management Investment Services Corp.
Through October 31, 2018:
P.O. Box 8081
Boston, MA 02266-8081
Effective November 1, 2018:
P.O. Box 219104
Kansas City, MO 64121-9104
Columbia Alternative Beta Fund | Annual Report 2018
| 59 |
[THIS PAGE INTENTIONALLY LEFT BLANK]
[THIS PAGE INTENTIONALLY LEFT BLANK]
Columbia Alternative Beta Fund
Through October 31, 2018:
P.O. Box 8081
Boston, MA 02266-8081
Effective November 1, 2018:
P.O. Box 219104
Kansas City, MO 64121-9104
Please read and consider the investment objectives, risks, charges and expenses for any fund carefully before investing. For a prospectus and summary prospectus, which contains this and other important information about the Fund, go to
columbiathreadneedleus.com/investor/. The Fund is distributed by Columbia Management Investment Distributors, Inc., member FINRA, and managed by Columbia Management Investment Advisers, LLC.
Columbia Threadneedle Investments (Columbia Threadneedle) is the global brand name of the Columbia and Threadneedle group of companies. All rights reserved. Columbia Management Investment Distributors, Inc., 225 Franklin Street, Boston, MA 02110-2804
© 2018 Columbia Management Investment Advisers, LLC.
columbiathreadneedleus .com/investor/

Annual Report
May 31, 2018
Columbia Diversified Absolute Return Fund
Not FDIC Insured • No bank guarantee • May lose value
Dear Shareholders,
The year 2017 was an extraordinary year in the financial markets. The S&P 500 Index didn’t experience a single down month and returned over 20%. Continuing this trend, January 2018 marked the fastest start for the index ever. Low volatility, which had been a feature of the U.S. equity market for several years, along with the surge in the S&P 500 Index, drove investor sentiment to very high levels. This arguably set the stage for an overdue correction, which we witnessed in February 2018.
A return to volatility
There have been few periods of market upheaval such as were experienced in the first part of 2018. While investors were taken by surprise by the sudden and pronounced market swings, the return to some level of volatility actually marked a resumption of relatively normal market conditions. Having said that, it’s important to distinguish between a good technical correction where excess enthusiasm in the marketplace is being let out, versus a real change in the underlying fundamentals – things like an underperforming economy or weaker corporate earnings. Our view is that the recent market volatility falls into the former category, and the fundamentals remain strong. We’re continuing to see improvements in global economic activity, and we’re seeing corporate earnings expectations continue to rise – and not just because of tax reform.
Consistency is more important than ever
It’s important to keep in mind that when it comes to long-term investing, it’s the destination, not the journey that matters most. If you have a financial goal that you’ve worked out with your financial advisor, and you have a good asset allocation plan to reach it, it’s a question of sticking with your plan rather than become focused on near-term volatility. Bouts of volatility are normal. After all, it’s hard to cross the ocean without hitting an occasional rough patch. You need to focus on the destination.
One final thought. In weathering volatility, it’s the consistency of the return that is essential. Investors who chase higher returns are usually the first to sell when an investment goes through a bad patch, and they therefore don’t tend to benefit from the recovery. More disciplined investors who perhaps panic less or not at all during periods of volatility, tend to have improved long-term results and are more likely to reach their financial goals. Nothing is more important to us than making sure those who have entrusted us to protect and grow their assets are able to do what matters most to them.
Your success is our priority. Talk to your financial advisor about how working with Columbia Threadneedle Investments may help you position your portfolio for consistent, sustainable outcomes, no matter the market conditions.
Sincerely,
Christopher O. Petersen
President, Columbia Funds
The S&P 500 Index, an unmanaged index, measures the performance of 500 widely held, large-capitalization U.S. stocks and is frequently used as a general measure of market performance. Past performance is no guarantee of future results.
Columbia Funds are distributed by Columbia Management Investment Distributors, Inc., member FINRA, and managed by Columbia Management Investment Advisers, LLC.
© 2018 Columbia Management Investment Advisers, LLC. All rights reserved.
Columbia Diversified Absolute Return Fund | Annual Report 2018
Columbia Diversified Absolute Return Fund | Annual Report 2018
Investment objective
Columbia Diversified Absolute Return Fund (the Fund) seeks to provide shareholders with absolute (positive) returns.
Portfolio management
Joshua Kutin, CFA
Lead Portfolio Manager
Managed Fund since 2015
Brian Virginia
Portfolio Manager
Managed Fund since 2015
Alexander Wilkinson, CFA, CAIA
Portfolio Manager
Managed Fund since January 2017
| Average annual total returns (%) (for the period ended May 31, 2018) |
| | | Inception | 1 Year | Life |
| Class A | Excluding sales charges | 02/19/15 | -2.30 | -1.82 |
| | Including sales charges | | -7.90 | -3.57 |
| Advisor Class | 02/19/15 | -1.98 | -1.57 |
| Class C | Excluding sales charges | 02/19/15 | -3.08 | -2.56 |
| | Including sales charges | | -4.05 | -2.56 |
| Institutional Class | 02/19/15 | -2.07 | -1.41 |
| Institutional 2 Class | 02/19/15 | -1.97 | -1.44 |
| Institutional 3 Class* | 03/01/17 | -1.98 | -1.56 |
| Class T | Excluding sales charges | 02/19/15 | -2.26 | -1.24 |
| | Including sales charges | | -4.71 | -2.01 |
| FTSE One-Month U.S. Treasury Bill Index | | 1.20 | 0.50 |
Returns for Class A shares are shown with and without the maximum initial sales charge of 5.75%. Returns for Class C shares are shown with and without the 1.00% contingent deferred sales charge for the first year only. Returns for Class T shares are shown with and without the maximum initial sales charge of 2.50% per transaction. The Fund’s other classes are not subject to sales charges and have limited eligibility. Effective November 1, 2017, Class R4, Class R5, Class Y and Class Z shares were renamed Advisor Class, Institutional 2 Class, Institutional 3 Class and Institutional Class shares, respectively. Please see the Fund’s prospectus for details. Performance for different share classes will vary based on differences in sales charges and fees associated with each class. All results shown assume reinvestment of distributions during the period. Returns do not reflect the deduction of taxes that a shareholder may pay on Fund distributions or on the redemption of Fund shares. Performance results reflect the effect of any fee waivers or reimbursements of Fund expenses by Columbia Management Investment Advisers, LLC and/or any of its affiliates. Absent these fee waivers or expense reimbursement arrangements, performance results would have been lower.
The performance information shown represents past performance and is not a guarantee of future results. The investment return and principal value of your investment will fluctuate so that your shares, when redeemed, may be worth more or less than their original cost. Current performance may be lower or higher than the performance information shown. You may obtain performance information current to the most recent month-end by contacting your financial intermediary, visiting columbiathreadneedleus.com/investor/ or calling 800.345.6611.
| * | The returns shown for periods prior to the share class inception date (including returns for the Life of the Fund, if shown, which are since Fund inception) include the returns of the Fund’s oldest share class. Since the Fund launched more than one share class at its inception, Class A shares were used. These returns are adjusted to reflect any higher class-related operating expenses of the newer share classes, as applicable. Please visit columbiathreadneedleus.com/investor/investment-products/mutual-funds/appended-performance for more information. |
The FTSE One-Month U.S. Treasury Bill Index is an unmanaged index that represents the performance of one-month Treasury bills and reflects reinvestment of all distributions and changes in market prices.
Indices are not available for investment, are not professionally managed and do not reflect sales charges, fees, brokerage commissions, taxes or other expenses of investing. Securities in the Fund may not match those in an index.
| 2 | Columbia Diversified Absolute Return Fund | Annual Report 2018 |
Fund at a Glance (continued)
Performance of a hypothetical $10,000 investment (February 19, 2015 — May 31, 2018)
The chart above shows the change in value of a hypothetical $10,000 investment in Class A shares of Columbia Diversified Absolute Return Fund during the stated time period, and does not reflect the deduction of taxes that a shareholder may pay on Fund distributions or on the redemption of Fund shares.
| Portfolio breakdown — long positions (%) (at May 31, 2018) |
| Common Stocks | 61.8 |
| Convertible Bonds | 0.3 |
| Exchange-Traded Funds | 21.8 |
| Short-Term Investments Segregated in Connection with Open Derivatives Contracts(a) | 78.5 |
| Total | 162.4 |
| (a) | Includes investments in Money Market Funds (amounting to $45.4 million) which have been segregated to cover obligations relating to the Fund’s investment in derivatives which provide exposure to multiple markets. For a description of the Fund’s investments in derivatives, see Investments in derivatives following the Consolidated Portfolio of Investments and Note 2 to the Notes to Consolidated Financial Statements. |
Percentages indicated are based upon total investments, net of investments sold short. The Fund’s portfolio composition is subject to change.
| Portfolio breakdown — short positions (%) (at May 31, 2018) |
| Common Stocks | (62.4) |
Percentages indicated are based upon total investments, net of investments sold short. The Fund’s portfolio composition is subject to change.
| Market exposure through derivatives investments (% of notional exposure) (at May 31, 2018)(a) |
| | Long | Short | Net |
| Fixed Income Derivative Contracts | 37.1 | (31.1) | 6.0 |
| Commodities Derivative Contracts | 22.8 | — | 22.8 |
| Equity Derivative Contracts | 52.1 | (2.9) | 49.2 |
| Foreign Currency Derivative Contracts | 42.3 | (20.3) | 22.0 |
| Total Notional Market Value of Derivative Contracts | 154.3 | (54.3) | 100.0 |
(a) The Fund has market exposure (long and/or short) to fixed income , commodity and equity assets classes and foreign currency through its investments in derivatives. The notional exposure of a financial instrument is the nominal or face amount that is used to calculate payments made on that instrument and/or changes in value for the instrument. The notional exposure is a hypothetical underlying quantity upon which payment obligations are computed. Notional exposures provide a gauge for how the Fund may behave given changes in individual markets. For a description of the Fund’s investments in derivatives, see Investments in derivatives following the Consolidated Portfolio of Investments, and Note 2 to the Notes to Consolidated Financial Statements.
Columbia Diversified Absolute Return Fund | Annual Report 2018
| 3 |
Manager Discussion of Fund Performance
At May 31, 2018, approximately 98.6% of the Fund’s shares were owned in the aggregate by affiliated funds-of-funds managed by Columbia Management Investment Advisers, LLC (the Investment Manager). As a result of asset allocation decisions by the Investment Manager, it is possible that the Fund may experience relatively large purchases or redemptions from affiliated funds-of-funds. The Investment Manager seeks to minimize the impact of these transactions by structuring them over a reasonable period of time. The Fund may experience increased expenses as it buys and sells securities as a result of purchases or redemptions by affiliated funds-of-funds.
For the 12-month period that ended May 31, 2018, the Fund’s Class A shares returned -2.30% excluding sales charges. To compare, the FTSE One-Month U.S. Treasury Bill Index returned 1.20% over the same period. As an absolute return fund, it employs a benchmark agnostic strategy and thus comparisons to the FTSE One-Month U.S. Treasury Bill Index are for information purposes only. This Fund is a diversified portfolio that invests across global asset classes using both traditional and alternative investment strategies.
U.S. capital markets experienced divergent backdrops during reporting period
U.S. capital markets experienced divergent backdrops during the 12-month period ended May 31, 2018. From the start of the period in early June 2017 through most of January 2018, U.S. equities recorded gains, supported by discussion and then enactment of tax reform, reasonably strong economic activity, rising commodity prices and favorable corporate earnings reports. Market volatility was unusually low. In early February 2018, however, equities sold off globally on market speculation of a faster pace of interest rate hikes by the Federal Reserve (Fed), exacerbated by solid U.S. labor and inflation data. Such speculation, in turn, stoked a sharp rise in bond yields and an increase in equity market volatility toward more historically normal levels. Heightened volatility persisted through most of the remainder of the period, driven not only by new Fed Chair Powell’s hawkish tilt but also by escalating trade tensions and tariffs, surfacing uncertainty about sanctions on Russia and anticipation about a potential summit between the leaders of the U.S. and North Korea. Most U.S. equity market indices generated negative returns during the last four months of the period. All told, the Fed raised short-term U.S. interest rates three times during the period — in June and December 2017 and in March 2018. These rate hikes, along with a number of macroeconomic drivers, pushed up U.S. Treasury yields across the spectrum of maturities, with the 10-year U.S. Treasury yield breaching 3% toward the end of April 2018 before rallying modestly to end the period at 2.83%.
Alternative beta strategies posted most negative absolute returns
The Fund invests in three core strategies — alpha, which is a measure of return resulting from active management; tactical beta, which seeks opportunities to earn returns from price movements of broad markets; and alternative beta, which seeks to generate returns with relatively low correlation to overall market movements by employing a systematic, rules-based approach. During the period, the alternative beta strategy component posted the largest negative absolute return, followed by the alpha strategy component, which also posted a negative absolute return. The tactical beta strategy contributed positively to Fund results during the period.
Within the alpha strategies sleeve, which is comprised of several internally-managed hedge fund portfolios, the managed futures strategy and the equity market neutral-fundamental strategy posted the biggest negative absolute returns. The global tactical asset allocation strategy, the G10 currency strategy and the equity market neutral-quantitative strategies contributed positively to Fund returns. Within the tactical beta sleeve, the tactical beta core strategy contributed positively to the Fund’s absolute returns, while the equity hedges strategy posted a negative absolute return.
Flexible portfolio structure enabled changes
The Fund features a flexible portfolio structure that employs both fundamental and quantitative methods to identify market opportunities and can dynamically reallocate as market conditions change. Indeed, during the period, there were several material changes in the Fund’s allocation. For example, in July 2017, we allocated Fund assets to an equity market neutral-fundamental strategy and to an equity market neutral-quantitative strategy within the alpha strategies sleeve. In November 2017, we increased the Fund’s allocation to the alternative beta sleeve. In late 2017, we liquidated allocations to the fixed-income absolute return strategy within the alpha strategies sleeve.
| 4 | Columbia Diversified Absolute Return Fund | Annual Report 2018 |
Manager Discussion of Fund Performance (continued)
At the end of the period, the Columbia Global Asset Allocation Team favored a modestly positive stance toward equities, given the tactical view that the upside opportunities for stocks — particularly U.S. stocks — seemed to more than offset the downside risks. The positive equity environment we observed was supported by both qualitative and quantitative indicators that favored greater exposure to risk assets. We believed at the end of the period that volatility could continue to contract from early 2018 highs and that there may still be room to be rewarded for holding riskier assets during the second half of 2018. In our view, economic data has been rather resilient, with strong employment statistics on multiple fronts, healthy first quarter corporate earnings and improved expectations for forward earnings. Valuations at the end of May 2018 were not cheap by long-terms metrics, but we feel they had become relatively inexpensive with more earnings growth than price appreciation in the last months of the annual period.
Derivative positions
The Fund utilizes derivatives for both hedging and non-hedging purposes, including, for example, seeking to enhance returns or as a substitute for a position in an underlying asset or index. During the period, the Fund used futures, options and swaps to more efficiently and cost effectively manage its exposures. These flexible structures, which allow for direct and highly versatile portfolio management applications, detracted from the Fund’s results during the period. Also, the underlying managers of hedge fund strategies employed derivatives and similar instruments as part of their underlying strategies to hedge market exposure and/or to gain implicit leverage, subject to the constraints of the Investment Company Act of 1940.
Absolute return funds are not designed to outperform stocks and bonds in strong markets. Market risk may affect a single issuer, sector of the economy, industry or the market as a whole. Alternative investments involve substantial risks and are more volatile than traditional investments, making them more suitable for investors with an above average tolerance for risk. Foreign investments subject the Fund to risks, including political, economic, market, social and others within a particular country, as well as to currency instabilities and less stringent financial and accounting standards generally applicable to U.S. issuers. The Fund’s investment in otherfunds subjects it to the investment performance (positive or negative), risks and expenses of these underlying funds. ETFs trade like stocks, are subject to investment risk and will fluctuate in market value. Investment products, including shares of mutual funds, are not federally or FDIC-insured, are not deposits or obligations of, or guaranteed by any financial institution. The Fund employs multiple strategies independently of one another, which may result in contradicting trades (i.e., with no net benefit to the Fund) while increasing transaction costs. Commodity investments may be affected by the overall market and industry- and commodity-specific factors, and may be more volatile and less liquid than other investments. Investing in derivatives is a specialized activity that involves special risks that subject the Fund to significant loss potential, including when used as leverage, and may result in greater fluctuation in fund value. The Fund’s use of leverage subjects additional fund assets to the risk of loss. The sales price the Fund (or its underlying investments) could receive for any particular investment may differ from the Fund’s (or underlying investments’) valuation of the investment. Short positions (where the underlying asset is not owned) can create unlimited risk. See the Fund’s prospectus for more information on these and other risks.
The views expressed in this report reflect the current views of the respective parties. These views are not guarantees of future performance and involve certain risks, uncertainties and assumptions that are difficult to predict, so actual outcomes and results may differ significantly from the views expressed. These views are subject to change at any time based upon economic, market or other conditions and the respective parties disclaim any responsibility to update such views. These views may not be relied on as investment advice and, because investment decisions for a Columbia fund are based on numerous factors, may not be relied on as an indication of trading intent on behalf of any particular Columbia fund. References to specific securities should not be construed as a recommendation or investment advice.
Columbia Diversified Absolute Return Fund | Annual Report 2018
| 5 |
Understanding Your Fund’s Expenses
(Unaudited)
As an investor, you incur two types of costs. There are transaction costs, which generally include sales charges on purchases and may include redemption fees. There are also ongoing costs, which generally include management fees, distribution and/or service fees, and other fund expenses. The following information is intended to help you understand your ongoing costs (in dollars) of investing in the Fund and to help you compare these costs with the ongoing costs of investing in other mutual funds.
Analyzing your Fund’s expenses
To illustrate these ongoing costs, we have provided examples and calculated the expenses paid by investors in each share class of the Fund during the period. The actual and hypothetical information in the table is based on an initial investment of $1,000 at the beginning of the period indicated and held for the entire period. Expense information is calculated two ways and each method provides you with different information. The amount listed in the “Actual” column is calculated using the Fund’s actual operating expenses and total return for the period. You may use the Actual information, together with the amount invested, to estimate the expenses that you paid over the period. Simply divide your account value by $1,000 (for example, an $8,600 account value divided by $1,000 = 8.6), then multiply the results by the expenses paid during the period under the “Actual” column. The amount listed in the “Hypothetical” column assumes a 5% annual rate of return before expenses (which is not the Fund’s actual return) and then applies the Fund’s actual expense ratio for the period to the hypothetical return. You should not use the hypothetical account values and expenses to estimate either your actual account balance at the end of the period or the expenses you paid during the period. See “Compare with other funds” below for details on how to use the hypothetical data.
Compare with other funds
Since all mutual funds are required to include the same hypothetical calculations about expenses in shareholder reports, you can use this information to compare the ongoing cost of investing in the Fund with other funds. To do so, compare the hypothetical example with the 5% hypothetical examples that appear in the shareholder reports of other funds. As you compare hypothetical examples of other funds, it is important to note that hypothetical examples are meant to highlight the ongoing costs of investing in a fund only and do not reflect any transaction costs, such as sales charges, or redemption or exchange fees. Therefore, the hypothetical calculations are useful in comparing ongoing costs only, and will not help you determine the relative total costs of owning different funds. If transaction costs were included in these calculations, your costs would be higher.
| December 1, 2017 — May 31, 2018 |
| | Account value at the
beginning of the
period ($) | Account value at the
end of the
period ($) | Expenses paid during
the period ($) | Fund’s annualized
expense ratio (%) |
| | Actual | Hypothetical | Actual | Hypothetical | Actual | Hypothetical | Actual |
| Class A | 1,000.00 | 1,000.00 | 982.10 | 1,010.02 | 14.78 | 14.98 | 2.99 |
| Advisor Class | 1,000.00 | 1,000.00 | 983.30 | 1,011.27 | 13.55 | 13.74 | 2.74 |
| Class C | 1,000.00 | 1,000.00 | 978.50 | 1,006.33 | 18.40 | 18.66 | 3.73 |
| Institutional Class | 1,000.00 | 1,000.00 | 983.40 | 1,011.32 | 13.50 | 13.69 | 2.73 |
| Institutional 2 Class | 1,000.00 | 1,000.00 | 983.30 | 1,011.57 | 13.25 | 13.44 | 2.68 |
| Institutional 3 Class | 1,000.00 | 1,000.00 | 983.30 | 1,011.82 | 13.00 | 13.19 | 2.63 |
| Class T | 1,000.00 | 1,000.00 | 982.40 | 1,010.07 | 14.73 | 14.93 | 2.98 |
Expenses paid during the period are equal to the annualized expense ratio for each class as indicated above, multiplied by the average account value over the period and then multiplied by the number of days in the Fund’s most recent fiscal half year and divided by 365.
Expenses do not include fees and expenses incurred indirectly by the Fund from its investment in underlying funds, including affiliated and non-affiliated pooled investment vehicles, such as mutual funds and exchange-traded funds.
Had Columbia Management Investment Advisers, LLC and/or certain of its affiliates not waived/reimbursed certain fees and expenses, account value at the end of the period would have been reduced.
| 6 | Columbia Diversified Absolute Return Fund | Annual Report 2018 |
Consolidated Portfolio of Investments
May 31, 2018
(Percentages represent value of investments compared to net assets)
Investments in securities
| Common Stocks 47.1% |
| Issuer | Shares | Value ($) |
| Consumer Discretionary 7.2% |
| Auto Components 0.2% |
| Gentex Corp.(a) | 5,213 | 125,268 |
| Automobiles 0.1% |
| General Motors Co.(a) | 1,867 | 79,721 |
| Diversified Consumer Services 0.2% |
| H&R Block, Inc.(a) | 6,403 | 175,762 |
| Hotels, Restaurants & Leisure 1.7% |
| Extended Stay America, Inc.(a) | 6,444 | 135,646 |
| International Game Technology PLC(a) | 3,988 | 100,258 |
| Melco Resorts & Entertainment Ltd., ADR(a) | 5,826 | 190,277 |
| Norwegian Cruise Line Holdings Ltd.(a),(b) | 5,273 | 275,989 |
| Royal Caribbean Cruises Ltd.(a) | 2,023 | 212,374 |
| Six Flags Entertainment Corp.(a) | 4,740 | 305,825 |
| Yum China Holdings, Inc.(a) | 2,202 | 86,539 |
| Total | | 1,306,908 |
| Household Durables 0.5% |
| Mohawk Industries, Inc.(a),(b) | 1,693 | 345,440 |
| Tupperware Brands Corp.(a) | 293 | 12,353 |
| Total | | 357,793 |
| Internet & Direct Marketing Retail 0.5% |
| Amazon.com, Inc.(a),(b) | 92 | 149,925 |
| Expedia Group, Inc.(a) | 1,325 | 160,365 |
| Qurate Retail Group, Inc. QVC Group(b) | 4,277 | 86,951 |
| Total | | 397,241 |
| Media 0.9% |
| 21st Century Fox, Inc., Class A(a) | 6,933 | 267,267 |
| Charter Communications, Inc., Class A(a),(b) | 89 | 23,233 |
| Comcast Corp., Class A(a) | 3,169 | 98,809 |
| DISH Network Corp., Class A(a),(b) | 4,474 | 132,207 |
| Liberty Global PLC, Class A(a),(b) | 4,031 | 114,924 |
| Total | | 636,440 |
| Multiline Retail 0.3% |
| Dollar General Corp.(a) | 1,005 | 87,918 |
| Target Corp.(a) | 1,715 | 125,006 |
| Total | | 212,924 |
| Common Stocks (continued) |
| Issuer | Shares | Value ($) |
| Specialty Retail 1.3% |
| Best Buy Co., Inc.(a) | 2,400 | 163,800 |
| Burlington Stores, Inc.(a),(b) | 469 | 68,591 |
| Home Depot, Inc. (The)(a) | 1,911 | 356,497 |
| Lowe’s Companies, Inc.(a) | 1,242 | 118,002 |
| O’Reilly Automotive, Inc.(a),(b) | 270 | 72,741 |
| Signet Jewelers Ltd.(a) | 2,327 | 100,061 |
| Ulta Beauty, Inc.(a),(b) | 461 | 113,826 |
| Total | | 993,518 |
| Textiles, Apparel & Luxury Goods 1.5% |
| Canada Goose Holdings, Inc.(a),(b) | 2,959 | 124,426 |
| PVH Corp.(a) | 3,118 | 498,880 |
| Ralph Lauren Corp.(a) | 1,620 | 218,020 |
| Tapestry, Inc. | 2,743 | 119,924 |
| VF Corp.(a) | 2,207 | 179,120 |
| Total | | 1,140,370 |
| Total Consumer Discretionary | 5,425,945 |
| Consumer Staples 2.7% |
| Beverages 0.4% |
| PepsiCo, Inc.(a) | 3,290 | 329,822 |
| Food & Staples Retailing 0.2% |
| Walgreens Boots Alliance, Inc.(a) | 2,522 | 157,348 |
| Food Products 1.1% |
| ConAgra Foods, Inc.(a) | 692 | 25,646 |
| Kellogg Co.(a) | 6,291 | 405,077 |
| Mondelez International, Inc., Class A | 5,367 | 210,762 |
| Pilgrim’s Pride Corp.(a),(b) | 6,045 | 117,817 |
| Tyson Foods, Inc., Class A | 1,479 | 99,788 |
| Total | | 859,090 |
| Household Products 0.2% |
| Energizer Holdings, Inc.(a) | 2,375 | 144,258 |
| Tobacco 0.8% |
| Altria Group, Inc.(a) | 4,005 | 223,239 |
| Philip Morris International, Inc.(a) | 4,541 | 361,191 |
| Total | | 584,430 |
| Total Consumer Staples | 2,074,948 |
The accompanying Notes to Consolidated Financial Statements are an integral part of this statement.
Columbia Diversified Absolute Return Fund | Annual Report 2018
| 7 |
Consolidated Portfolio of Investments (continued)
May 31, 2018
| Common Stocks (continued) |
| Issuer | Shares | Value ($) |
| Energy 3.6% |
| Energy Equipment & Services 0.4% |
| Helmerich & Payne, Inc.(a) | 969 | 64,322 |
| Patterson-UTI Energy, Inc.(a) | 5,307 | 109,749 |
| TechnipFMC PLC(a) | 3,031 | 94,416 |
| Tenaris SA, ADR | 1,638 | 58,804 |
| Total | | 327,291 |
| Oil, Gas & Consumable Fuels 3.2% |
| BP PLC, ADR(a) | 2,500 | 114,550 |
| Chevron Corp.(a) | 1,009 | 125,419 |
| Cimarex Energy Co.(a) | 1,055 | 98,031 |
| ConocoPhillips (a) | 8,307 | 559,809 |
| Continental Resources, Inc.(a),(b) | 6,223 | 419,057 |
| Diamondback Energy, Inc.(a) | 781 | 94,313 |
| Marathon Oil Corp. | 7,613 | 163,147 |
| Murphy Oil Corp.(a) | 5,906 | 181,609 |
| PBF Energy, Inc., Class A(a) | 1,641 | 77,422 |
| Suncor Energy, Inc.(a) | 6,176 | 245,681 |
| Valero Energy Corp.(a) | 1,499 | 181,679 |
| World Fuel Services Corp.(a) | 1,350 | 28,188 |
| WPX Energy, Inc.(b) | 8,320 | 151,507 |
| Total | | 2,440,412 |
| Total Energy | 2,767,703 |
| Financials 6.9% |
| Banks 3.2% |
| Bank of America Corp.(a) | 6,355 | 184,549 |
| Bank of the Ozarks(a) | 6,472 | 307,679 |
| BB&T Corp.(a) | 8,555 | 449,137 |
| CIT Group, Inc.(a) | 2,384 | 119,033 |
| Citizens Financial Group, Inc.(a) | 4,091 | 167,117 |
| Comerica, Inc.(a) | 1,333 | 125,689 |
| JPMorgan Chase & Co.(a) | 1,371 | 146,711 |
| M&T Bank Corp. | 1,994 | 343,128 |
| Regions Financial Corp. | 9,595 | 175,013 |
| SunTrust Banks, Inc.(a) | 3,431 | 231,627 |
| Wells Fargo & Co.(a) | 2,475 | 133,625 |
| Zions Bancorporation(a) | 1,490 | 81,667 |
| Total | | 2,464,975 |
| Common Stocks (continued) |
| Issuer | Shares | Value ($) |
| Capital Markets 1.0% |
| Bank of New York Mellon Corp. (The)(a) | 4,391 | 240,407 |
| Federated Investors, Inc., Class B(a) | 222 | 5,388 |
| Invesco Ltd.(a) | 5,058 | 138,185 |
| Lazard Ltd., Class A(a) | 3,303 | 169,906 |
| S&P Global, Inc.(a) | 945 | 186,638 |
| Total | | 740,524 |
| Consumer Finance 0.2% |
| Navient Corp.(a) | 10,245 | 141,483 |
| Diversified Financial Services 0.1% |
| Voya Financial, Inc.(a) | 2,045 | 106,217 |
| Insurance 2.4% |
| Aflac, Inc. | 3,656 | 164,739 |
| Allstate Corp. (The)(a) | 1,268 | 118,533 |
| American International Group, Inc.(a) | 5,951 | 314,153 |
| Chubb Ltd.(a) | 1,179 | 154,084 |
| CNA Financial Corp.(a) | 1,440 | 67,651 |
| Lincoln National Corp. | 4,104 | 272,054 |
| Old Republic International Corp.(a) | 4,310 | 90,424 |
| Principal Financial Group, Inc. | 6,646 | 370,847 |
| Prudential Financial, Inc.(a) | 1,589 | 153,879 |
| Unum Group(a) | 2,550 | 98,965 |
| Total | | 1,805,329 |
| Total Financials | 5,258,528 |
| Health Care 5.2% |
| Biotechnology 1.0% |
| Alder Biopharmaceuticals, Inc.(a),(b) | 4,072 | 71,056 |
| Alexion Pharmaceuticals, Inc.(a),(b) | 519 | 60,272 |
| Atara Biotherapeutics, Inc.(a),(b) | 1,460 | 72,708 |
| Biogen, Inc.(a),(b) | 180 | 52,913 |
| BioMarin Pharmaceutical, Inc.(a),(b) | 930 | 84,016 |
| bluebird bio, Inc.(a),(b) | 299 | 53,536 |
| Gilead Sciences, Inc.(a) | 655 | 44,147 |
| Immunomedics, Inc.(a),(b) | 3,296 | 72,710 |
| Puma Biotechnology, Inc.(a),(b) | 859 | 45,484 |
| Sage Therapeutics, Inc.(a),(b) | 438 | 66,878 |
The accompanying Notes to Consolidated Financial Statements are an integral part of this statement.
| 8 | Columbia Diversified Absolute Return Fund | Annual Report 2018 |
Consolidated Portfolio of Investments (continued)
May 31, 2018
| Common Stocks (continued) |
| Issuer | Shares | Value ($) |
| TESARO, Inc.(a),(b) | 1,079 | 49,386 |
| Vertex Pharmaceuticals, Inc.(a),(b) | 338 | 52,052 |
| Total | | 725,158 |
| Health Care Equipment & Supplies 1.1% |
| Baxter International, Inc.(a) | 2,500 | 177,100 |
| Hill-Rom Holdings, Inc.(a) | 244 | 22,448 |
| Medtronic PLC(a) | 3,278 | 282,957 |
| STERIS PLC(a) | 1,800 | 186,912 |
| Varian Medical Systems, Inc.(a),(b) | 1,472 | 173,505 |
| Total | | 842,922 |
| Health Care Providers & Services 1.2% |
| Brookdale Senior Living, Inc.(a),(b) | 8,598 | 67,666 |
| Envision Healthcare Corp.(a),(b) | 3,312 | 142,018 |
| Express Scripts Holding Co.(a),(b) | 2,420 | 183,460 |
| UnitedHealth Group, Inc.(a) | 429 | 103,608 |
| WellCare Health Plans, Inc.(a),(b) | 2,007 | 444,892 |
| Total | | 941,644 |
| Life Sciences Tools & Services 0.5% |
| Charles River Laboratories International, Inc.(a),(b) | 3,251 | 349,547 |
| Pharmaceuticals 1.4% |
| Allergan PLC(a) | 678 | 102,242 |
| Eli Lilly & Co.(a) | 231 | 19,644 |
| GW Pharmaceuticals PLC, ADR(a),(b) | 555 | 89,349 |
| Johnson & Johnson(a) | 1,634 | 195,459 |
| Mallinckrodt PLC(a),(b) | 4,330 | 72,961 |
| Perrigo Co. PLC(a) | 1,806 | 132,127 |
| Pfizer, Inc.(a) | 12,490 | 448,766 |
| Total | | 1,060,548 |
| Total Health Care | 3,919,819 |
| Industrials 7.2% |
| Aerospace & Defense 1.4% |
| Boeing Co. (The)(a) | 531 | 186,997 |
| General Dynamics Corp.(a) | 2,115 | 426,617 |
| L3 Technologies, Inc.(a) | 2,146 | 425,616 |
| Total | | 1,039,230 |
| Common Stocks (continued) |
| Issuer | Shares | Value ($) |
| Airlines 1.2% |
| Alaska Air Group, Inc.(a) | 7,445 | 452,730 |
| Copa Holdings SA, Class A(a) | 974 | 107,919 |
| Delta Air Lines, Inc.(a) | 6,750 | 364,838 |
| Total | | 925,487 |
| Building Products 0.2% |
| Masco Corp. | 4,795 | 178,710 |
| Commercial Services & Supplies —% |
| Pitney Bowes, Inc.(a) | 4,051 | 36,054 |
| Electrical Equipment 0.4% |
| Acuity Brands, Inc.(a) | 1,394 | 164,840 |
| AMETEK, Inc.(a) | 2,221 | 162,200 |
| Total | | 327,040 |
| Industrial Conglomerates 0.6% |
| Carlisle Companies, Inc.(a) | 4,131 | 443,628 |
| Machinery 2.5% |
| Allison Transmission Holdings, Inc.(a) | 4,159 | 171,808 |
| Crane Co.(a) | 1,921 | 159,654 |
| Cummins, Inc.(a) | 286 | 40,724 |
| Deere & Co. | 410 | 61,299 |
| Gardner Denver Holdings, Inc.(a),(b) | 11,139 | 366,139 |
| Graco, Inc.(a) | 3,451 | 156,675 |
| Ingersoll-Rand PLC(a) | 4,969 | 434,986 |
| ITT, Inc.(a) | 1,954 | 100,866 |
| REV Group, Inc.(a) | 22,865 | 387,791 |
| Total | | 1,879,942 |
| Marine 0.5% |
| Kirby Corp.(b) | 4,292 | 389,284 |
| Road & Rail 0.1% |
| Norfolk Southern Corp. | 440 | 66,726 |
| Trading Companies & Distributors 0.3% |
| WW Grainger, Inc.(a) | 618 | 190,956 |
| Total Industrials | 5,477,057 |
The accompanying Notes to Consolidated Financial Statements are an integral part of this statement.
Columbia Diversified Absolute Return Fund | Annual Report 2018
| 9 |
Consolidated Portfolio of Investments (continued)
May 31, 2018
| Common Stocks (continued) |
| Issuer | Shares | Value ($) |
| Information Technology 7.2% |
| Communications Equipment 0.3% |
| Arista Networks, Inc.(a),(b) | 118 | 29,684 |
| F5 Networks, Inc.(a),(b) | 1,086 | 187,998 |
| Total | | 217,682 |
| Electronic Equipment, Instruments & Components 0.5% |
| TE Connectivity Ltd.(a) | 726 | 67,576 |
| Trimble Navigation Ltd.(a),(b) | 2,420 | 80,005 |
| Zebra Technologies Corp., Class A(a),(b) | 1,416 | 217,370 |
| Total | | 364,951 |
| Internet Software & Services 0.8% |
| Alibaba Group Holding Ltd., ADR(a),(b) | 335 | 66,333 |
| Alphabet, Inc., Class A(a),(b) | 302 | 332,200 |
| VeriSign, Inc.(a),(b) | 1,410 | 183,921 |
| Total | | 582,454 |
| IT Services 2.6% |
| Automatic Data Processing, Inc.(a) | 558 | 72,551 |
| Booz Allen Hamilton Holdings Corp.(a) | 11,490 | 518,084 |
| First Data Corp., Class A(a),(b) | 14,544 | 276,336 |
| FleetCor Technologies, Inc.(a),(b) | 1,334 | 265,933 |
| MasterCard, Inc., Class A(a) | 966 | 183,656 |
| Pagseguro Digital Ltd., Class A(b) | 7,470 | 248,527 |
| PayPal Holdings, Inc.(a),(b) | 1,230 | 100,946 |
| Visa, Inc., Class A(a) | 2,175 | 284,316 |
| Total | | 1,950,349 |
| Semiconductors & Semiconductor Equipment 1.1% |
| Broadcom, Inc.(a) | 498 | 125,531 |
| MACOM Technology Solutions Holdings, Inc.(b) | 4,585 | 103,392 |
| Marvell Technology Group Ltd.(a) | 7,937 | 170,963 |
| Microchip Technology, Inc. | 723 | 70,406 |
| Micron Technology, Inc.(a),(b) | 1,914 | 110,227 |
| NVIDIA Corp.(a) | 265 | 66,830 |
| ON Semiconductor Corp.(a),(b) | 5,829 | 146,483 |
| Teradyne, Inc. | 1,773 | 67,214 |
| Total | | 861,046 |
| Common Stocks (continued) |
| Issuer | Shares | Value ($) |
| Software 1.1% |
| Activision Blizzard, Inc.(a) | 1,473 | 104,451 |
| Adobe Systems, Inc.(a),(b) | 608 | 151,562 |
| CA, Inc.(a) | 503 | 17,977 |
| Cadence Design Systems, Inc.(a),(b) | 543 | 23,050 |
| Electronic Arts, Inc.(a),(b) | 1,381 | 180,787 |
| Fortinet, Inc.(a),(b) | 3,215 | 196,694 |
| Microsoft Corp.(a) | 1,888 | 186,610 |
| Total | | 861,131 |
| Technology Hardware, Storage & Peripherals 0.8% |
| Apple, Inc.(a) | 769 | 143,703 |
| Electronics for Imaging, Inc.(a),(b) | 7,590 | 253,734 |
| HP, Inc.(a) | 3,652 | 80,454 |
| NetApp, Inc.(a) | 2,417 | 165,129 |
| Western Digital Corp.(a) | 95 | 7,933 |
| Total | | 650,953 |
| Total Information Technology | 5,488,566 |
| Materials 2.3% |
| Chemicals 1.0% |
| Cabot Corp.(a) | 1,587 | 95,617 |
| Celanese Corp., Class A(a) | 1,657 | 187,108 |
| DowDuPont, Inc.(a) | 1,981 | 127,002 |
| LyondellBasell Industries NV, Class A(a) | 1,609 | 180,401 |
| Westlake Chemical Corp.(a) | 1,326 | 153,458 |
| Total | | 743,586 |
| Containers & Packaging 0.4% |
| Avery Dennison Corp.(a) | 599 | 62,913 |
| Owens-Illinois, Inc.(a),(b) | 9,300 | 172,980 |
| Packaging Corp. of America(a) | 785 | 92,238 |
| Total | | 328,131 |
| Metals & Mining 0.7% |
| Alcoa Corp.(a),(b) | 456 | 21,920 |
| Freeport-McMoRan, Inc.(a) | 4,403 | 74,410 |
| Steel Dynamics, Inc. | 4,425 | 218,728 |
| United States Steel Corp.(a) | 4,931 | 181,806 |
| Total | | 496,864 |
The accompanying Notes to Consolidated Financial Statements are an integral part of this statement.
| 10 | Columbia Diversified Absolute Return Fund | Annual Report 2018 |
Consolidated Portfolio of Investments (continued)
May 31, 2018
| Common Stocks (continued) |
| Issuer | Shares | Value ($) |
| Paper & Forest Products 0.2% |
| Domtar Corp.(a) | 3,111 | 149,546 |
| Total Materials | 1,718,127 |
| Real Estate 2.4% |
| Equity Real Estate Investment Trusts (REITS) 2.2% |
| American Tower Corp. | 348 | 48,153 |
| CoreCivic, Inc.(a) | 5,772 | 124,213 |
| Coresite Realty Corp.(a) | 1,386 | 147,138 |
| Duke Realty Corp.(a) | 4,771 | 134,160 |
| Equinix, Inc.(a) | 571 | 226,601 |
| Equity LifeStyle Properties, Inc.(a) | 6,412 | 582,851 |
| Gaming and Leisure Properties, Inc.(a) | 2,535 | 88,978 |
| Invitation Homes, Inc. | 4,569 | 100,564 |
| Mack-Cali Realty Corp. | 4,854 | 95,964 |
| SBA Communications Corp.(a),(b) | 669 | 105,749 |
| Total | | 1,654,371 |
| Real Estate Management & Development 0.2% |
| Jones Lang LaSalle, Inc.(a) | 49 | 8,024 |
| Realogy Holdings Corp.(a) | 5,065 | 120,497 |
| Total | | 128,521 |
| Total Real Estate | 1,782,892 |
| Telecommunication Services 0.6% |
| Diversified Telecommunication Services 0.6% |
| BCE, Inc.(a) | 10,668 | 444,535 |
| Total Telecommunication Services | 444,535 |
| Utilities 1.8% |
| Electric Utilities 0.9% |
| American Electric Power Co., Inc.(a) | 5,307 | 360,611 |
| Edison International(a) | 3,010 | 187,101 |
| Xcel Energy, Inc.(a) | 2,421 | 110,204 |
| Total | | 657,916 |
| Common Stocks (continued) |
| Issuer | Shares | Value ($) |
| Multi-Utilities 0.9% |
| Ameren Corp.(a) | 4,714 | 279,021 |
| DTE Energy Co.(a) | 1,083 | 110,932 |
| NiSource, Inc.(a) | 13,157 | 332,872 |
| Total | | 722,825 |
| Total Utilities | 1,380,741 |
Total Common Stocks
(Cost $34,324,894) | 35,738,861 |
| Convertible Bonds 0.2% |
| Issuer | Coupon
Rate | | Principal
Amount ($) | Value ($) |
| Cable and Satellite 0.2% |
| DISH Network Corp. |
| 08/15/2026 | 3.375% | | 187,000 | 165,836 |
Total Convertible Bonds
(Cost $203,764) | 165,836 |
| Exchange-Traded Funds 16.7% |
| | Shares | Value ($) |
| iPath Bloomberg Commodity Index Total Return ETN(b) | 161,710 | 4,112,285 |
| iShares TIPS Bond ETF | 43,210 | 4,860,261 |
| Vanguard Mortgage-Backed Securities ETF | 31,549 | 1,624,458 |
| Vanguard REIT ETF | 25,683 | 2,026,132 |
Total Exchange-Traded Funds
(Cost $12,471,639) | 12,623,136 |
|
| Money Market Funds 59.9% |
| | |
| Columbia Short-Term Cash Fund, 1.907%(c),(d) | 45,439,416 | 45,439,416 |
Total Money Market Funds
(Cost $45,438,415) | 45,439,416 |
Total Investments in Securities
(Cost $92,438,712) | 93,967,249 |
|
| Investments in securities sold short |
| |
| Common Stocks (47.6)% |
| Issuer | Shares | Value ($) |
| Consumer Discretionary (7.5)% |
| Auto Components (0.2)% |
| Autoliv, Inc. | (532) | (78,720) |
| Delphi Technologies PLC | (1,365) | (68,386) |
| Total | | (147,106) |
The accompanying Notes to Consolidated Financial Statements are an integral part of this statement.
Columbia Diversified Absolute Return Fund | Annual Report 2018
| 11 |
Consolidated Portfolio of Investments (continued)
May 31, 2018
| Common Stocks (continued) |
| Issuer | Shares | Value ($) |
| Automobiles (0.9)% |
| Ferrari NV | (2,074) | (272,420) |
| Ford Motor Co. | (25,076) | (289,628) |
| Tesla, Inc.(b) | (541) | (154,039) |
| Total | | (716,087) |
| Distributors (0.2)% |
| Genuine Parts Co. | (1,813) | (164,602) |
| Diversified Consumer Services (0.0)% |
| Bright Horizons Family Solutions, Inc.(b) | (282) | (28,538) |
| Hotels, Restaurants & Leisure (0.8)% |
| Chipotle Mexican Grill, Inc.(b) | (311) | (133,786) |
| Darden Restaurants, Inc. | (802) | (70,103) |
| Domino’s Pizza, Inc. | (148) | (37,219) |
| Dunkin’ Brands Group, Inc. | (1,080) | (69,152) |
| Hyatt Hotels Corp., Class A | (958) | (78,297) |
| MGM Resorts International | (240) | (7,548) |
| Norwegian Cruise Line Holdings Ltd.(b) | (2,093) | (109,548) |
| Starbucks Corp. | (2,050) | (116,174) |
| Total | | (621,827) |
| Internet & Direct Marketing Retail (0.2)% |
| Amazon.com, Inc.(b) | (12) | (19,556) |
| Netflix, Inc.(b) | (407) | (143,101) |
| Total | | (162,657) |
| Leisure Products (0.3)% |
| Mattel, Inc. | (8,330) | (129,282) |
| Polaris Industries, Inc. | (799) | (89,408) |
| Total | | (218,690) |
| Media (0.7)% |
| Madison Square Garden Co. (The), Class A(b) | (79) | (20,701) |
| Omnicom Group, Inc. | (1,819) | (131,114) |
| Pearson PLC | (8,884) | (106,430) |
| Walt Disney Co. (The) | (2,756) | (274,139) |
| Total | | (532,384) |
| Multiline Retail (0.4)% |
| Target Corp. | (3,585) | (261,311) |
| Common Stocks (continued) |
| Issuer | Shares | Value ($) |
| Specialty Retail (2.1)% |
| Abercrombie & Fitch Co., Class A | (3,600) | (85,860) |
| AutoZone, Inc.(b) | (161) | (104,540) |
| Bed Bath & Beyond, Inc. | (2,974) | (54,008) |
| Best Buy Co., Inc. | (3,454) | (235,735) |
| CarMax, Inc.(b) | (1,933) | (133,222) |
| Dick’s Sporting Goods, Inc. | (2,706) | (99,040) |
| DSW, Inc., Class A | (3,293) | (78,637) |
| Murphy U.S.A., Inc.(b) | (1,550) | (103,478) |
| Penske Automotive Group, Inc. | (2,771) | (133,424) |
| Tiffany & Co. | (1,926) | (251,882) |
| TJX Companies, Inc. (The) | (3,428) | (309,617) |
| Total | | (1,589,443) |
| Textiles, Apparel & Luxury Goods (1.7)% |
| Deckers Outdoor Corp.(b) | (785) | (88,831) |
| G-III Apparel Group Ltd.(b) | (4,514) | (189,137) |
| Michael Kors Holdings Ltd.(b) | (1,152) | (66,113) |
| Nike, Inc., Class B | (1,650) | (118,470) |
| Skechers U.S.A., Inc., Class A(b) | (1,569) | (45,595) |
| Steven Madden Ltd. | (1,657) | (87,572) |
| Under Armour, Inc., Class C(b) | (19,993) | (378,268) |
| VF Corp. | (3,600) | (292,176) |
| Total | | (1,266,162) |
| Total Consumer Discretionary | (5,708,807) |
| Consumer Staples (2.7)% |
| Beverages (1.2)% |
| Brown-Forman Corp., Class B | (3,936) | (222,620) |
| Coca-Cola Co. (The) | (6,438) | (276,834) |
| Constellation Brands, Inc., Class A | (1,662) | (370,759) |
| Monster Beverage Corp.(b) | (1,050) | (53,718) |
| Total | | (923,931) |
| Food & Staples Retailing (0.1)% |
| Casey’s General Stores, Inc. | (1,061) | (102,705) |
The accompanying Notes to Consolidated Financial Statements are an integral part of this statement.
| 12 | Columbia Diversified Absolute Return Fund | Annual Report 2018 |
Consolidated Portfolio of Investments (continued)
May 31, 2018
| Common Stocks (continued) |
| Issuer | Shares | Value ($) |
| Food Products (0.5)% |
| Dean Foods Co. | (6,188) | (59,219) |
| Hain Celestial Group, Inc. (The)(b) | (4,161) | (106,189) |
| Kraft Heinz Co. (The) | (1,950) | (112,086) |
| McCormick & Co., Inc. | (744) | (75,144) |
| Total | | (352,638) |
| Household Products (0.8)% |
| Church & Dwight Co., Inc. | (1,340) | (62,913) |
| Clorox Co. (The) | (1,971) | (238,156) |
| Procter & Gamble Co. (The) | (3,615) | (264,510) |
| Total | | (565,579) |
| Personal Products (0.1)% |
| Coty, Inc., Class A | (7,797) | (103,310) |
| Total Consumer Staples | (2,048,163) |
| Energy (3.8)% |
| Energy Equipment & Services (1.2)% |
| Dril-Quip, Inc.(b) | (1,493) | (71,739) |
| Frank’s International NV | (30,461) | (224,802) |
| National Oilwell Varco, Inc. | (7,399) | (306,466) |
| Oceaneering International, Inc. | (6,855) | (163,355) |
| Patterson-UTI Energy, Inc. | (598) | (12,366) |
| Weatherford International PLC(b) | (44,494) | (150,835) |
| Total | | (929,563) |
| Oil, Gas & Consumable Fuels (2.6)% |
| Apache Corp. | (7,165) | (286,600) |
| Cabot Oil & Gas Corp. | (11,988) | (273,926) |
| Cheniere Energy, Inc.(b) | (2,167) | (144,365) |
| Diamondback Energy, Inc. | (951) | (114,843) |
| Extraction Oil & Gas, Inc.(b) | (558) | (9,464) |
| Exxon Mobil Corp. | (3,704) | (300,913) |
| Gulfport Energy Corp.(b) | (6,734) | (74,815) |
| Hess Corp. | (1,216) | (73,471) |
| Laredo Petroleum, Inc.(b) | (14,453) | (134,124) |
| Murphy Oil Corp. | (2,671) | (82,133) |
| ONEOK, Inc. | (2,043) | (139,251) |
| Parsley Energy, Inc.(b) | (4,352) | (128,297) |
| Common Stocks (continued) |
| Issuer | Shares | Value ($) |
| SM Energy Co. | (1,146) | (30,025) |
| WPX Energy, Inc.(b) | (7,421) | (135,136) |
| Total | | (1,927,363) |
| Total Energy | (2,856,926) |
| Financials (7.1)% |
| Banks (2.7)% |
| Bank of Hawaii Corp. | (442) | (37,539) |
| Bank of the Ozarks | (1,186) | (56,382) |
| Cullen/Frost Bankers, Inc. | (2,387) | (272,667) |
| East West Bancorp, Inc. | (3,137) | (217,959) |
| Fifth Third Bancorp | (8,593) | (262,774) |
| First Hawaiian, Inc. | (2,180) | (63,830) |
| First Republic Bank | (1,345) | (133,962) |
| People’s United Financial, Inc. | (5,606) | (103,207) |
| Pinnacle Financial Partners, Inc. | (1,965) | (131,753) |
| PNC Financial Services Group, Inc. (The) | (1,934) | (277,355) |
| Prosperity Bancshares, Inc. | (1,666) | (120,668) |
| Regions Financial Corp. | (15,217) | (277,558) |
| Signature Bank(b) | (828) | (105,562) |
| Total | | (2,061,216) |
| Capital Markets (2.2)% |
| Affiliated Managers Group, Inc. | (529) | (84,249) |
| Cboe Global Markets, Inc. | (736) | (71,804) |
| Charles Schwab Corp. (The) | (4,819) | (268,033) |
| Factset Research Systems, Inc. | (393) | (78,997) |
| Franklin Resources, Inc. | (7,304) | (245,195) |
| Goldman Sachs Group, Inc. (The) | (1,078) | (243,499) |
| Moody’s Corp. | (1,171) | (199,737) |
| Raymond James Financial, Inc. | (846) | (81,690) |
| T Rowe Price Group, Inc. | (2,544) | (308,892) |
| Thomson Reuters Corp. | (3,017) | (117,120) |
| Total | | (1,699,216) |
| Diversified Financial Services (0.1)% |
| Berkshire Hathaway, Inc., Class B(b) | (339) | (64,929) |
| Insurance (1.9)% |
| Alleghany Corp. | (205) | (116,965) |
| American International Group, Inc. | (511) | (26,976) |
| Aon PLC | (1,904) | (266,312) |
The accompanying Notes to Consolidated Financial Statements are an integral part of this statement.
Columbia Diversified Absolute Return Fund | Annual Report 2018
| 13 |
Consolidated Portfolio of Investments (continued)
May 31, 2018
| Common Stocks (continued) |
| Issuer | Shares | Value ($) |
| Brown & Brown, Inc. | (4,822) | (133,955) |
| Chubb Ltd. | (816) | (106,643) |
| Markel Corp.(b) | (78) | (85,572) |
| RenaissanceRe Holdings Ltd. | (978) | (120,069) |
| Travelers Companies, Inc. (The) | (1,267) | (162,835) |
| White Mountains Insurance Group Ltd. | (102) | (92,012) |
| Willis Towers Watson PLC | (1,585) | (239,573) |
| WR Berkley Corp. | (1,121) | (85,723) |
| Total | | (1,436,635) |
| Thrifts & Mortgage Finance (0.2)% |
| TFS Financial Corp. | (8,746) | (139,936) |
| Total Financials | (5,401,932) |
| Health Care (5.2)% |
| Biotechnology (1.1)% |
| Alnylam Pharmaceuticals, Inc.(b) | (290) | (28,846) |
| AMAG Pharmaceuticals, Inc.(b) | (3,193) | (78,069) |
| Amgen, Inc. | (582) | (104,539) |
| Epizyme, Inc.(b) | (2,875) | (50,169) |
| Fibrogen, Inc.(b) | (668) | (36,005) |
| Halozyme Therapeutics, Inc.(b) | (2,058) | (37,867) |
| Intrexon Corp.(b) | (4,525) | (75,025) |
| Ironwood Pharmaceuticals, Inc.(b) | (2,395) | (44,499) |
| Ligand Pharmaceuticals, Inc.(b) | (392) | (75,354) |
| Madrigal Pharmaceuticals, Inc.(b) | (427) | (113,415) |
| Myriad Genetics, Inc.(b) | (1,077) | (39,321) |
| OPKO Health, Inc.(b) | (15,006) | (58,223) |
| PDL BioPharma, Inc.(b) | (15,434) | (41,209) |
| Radius Health, Inc.(b) | (1,006) | (28,671) |
| United Therapeutics Corp.(b) | (474) | (50,519) |
| Total | | (861,731) |
| Health Care Equipment & Supplies (1.5)% |
| ABIOMED, Inc.(b) | (349) | (133,018) |
| Align Technology, Inc.(b) | (453) | (150,373) |
| Becton Dickinson and Co. | (835) | (185,028) |
| Boston Scientific Corp.(b) | (1,844) | (56,039) |
| Dexcom, Inc.(b) | (1,564) | (137,616) |
| Hologic, Inc.(b) | (3,050) | (115,565) |
| Common Stocks (continued) |
| Issuer | Shares | Value ($) |
| Stryker Corp. | (1,672) | (290,961) |
| Teleflex, Inc. | (153) | (40,876) |
| Total | | (1,109,476) |
| Health Care Providers & Services (0.7)% |
| Acadia Healthcare Co., Inc.(b) | (731) | (29,379) |
| Aetna, Inc. | (734) | (129,279) |
| DaVita, Inc.(b) | (995) | (66,506) |
| Henry Schein, Inc.(b) | (1,583) | (109,544) |
| Laboratory Corp. of America Holdings(b) | (49) | (8,849) |
| Quest Diagnostics, Inc. | (667) | (71,055) |
| Universal Health Services, Inc., Class B | (1,119) | (128,663) |
| Total | | (543,275) |
| Health Care Technology (0.3)% |
| athenahealth, Inc.(b) | (237) | (35,662) |
| Cerner Corp.(b) | (2,593) | (154,750) |
| Total | | (190,412) |
| Life Sciences Tools & Services (0.3)% |
| Bio-Rad Laboratories, Inc., Class A(b) | (373) | (107,099) |
| IQVIA Holdings, Inc.(b) | (751) | (74,296) |
| Waters Corp.(b) | (325) | (62,602) |
| Total | | (243,997) |
| Pharmaceuticals (1.3)% |
| Akorn, Inc.(b) | (590) | (8,242) |
| Astrazeneca PLC, ADR | (2,135) | (79,059) |
| Novo Nordisk A/S, ADR | (5,715) | (271,691) |
| Perrigo Co. PLC | (829) | (60,650) |
| Roche Holding AG, ADR | (2,691) | (72,146) |
| Sanofi, ADR | (5,653) | (216,340) |
| Zoetis, Inc. | (3,608) | (301,990) |
| Total | | (1,010,118) |
| Total Health Care | (3,959,009) |
| Industrials (7.4)% |
| Aerospace & Defense (0.6)% |
| Curtiss-Wright Corp. | (537) | (68,333) |
| Esterline Technologies Corp.(b) | (1,406) | (102,568) |
| Harris Corp. | (716) | (107,736) |
| Huntington Ingalls Industries, Inc. | (531) | (117,388) |
The accompanying Notes to Consolidated Financial Statements are an integral part of this statement.
| 14 | Columbia Diversified Absolute Return Fund | Annual Report 2018 |
Consolidated Portfolio of Investments (continued)
May 31, 2018
| Common Stocks (continued) |
| Issuer | Shares | Value ($) |
| Northrop Grumman Corp. | (28) | (9,163) |
| Triumph Group, Inc. | (2,399) | (50,859) |
| Total | | (456,047) |
| Air Freight & Logistics (0.8)% |
| C.H. Robinson Worldwide, Inc. | (1,072) | (93,264) |
| Expeditors International of Washington, Inc. | (1,019) | (75,895) |
| Fedex Corp. | (480) | (119,578) |
| United Parcel Service, Inc., Class B | (2,559) | (297,151) |
| Total | | (585,888) |
| Airlines (0.6)% |
| American Airlines Group, Inc. | (329) | (14,325) |
| Spirit Airlines, Inc.(b) | (3,240) | (118,875) |
| United Continental Holdings, Inc.(b) | (4,197) | (292,069) |
| Total | | (425,269) |
| Building Products (0.4)% |
| Allegion PLC | (904) | (69,093) |
| AO Smith Corp. | (1,446) | (91,199) |
| Armstrong World Industries, Inc.(b) | (1,041) | (63,084) |
| Johnson Controls International PLC | (3,269) | (109,708) |
| Total | | (333,084) |
| Commercial Services & Supplies (0.7)% |
| Clean Harbors, Inc.(b) | (95) | (5,035) |
| Republic Services, Inc. | (3,118) | (210,247) |
| Stericycle, Inc.(b) | (939) | (59,627) |
| Waste Management, Inc. | (3,050) | (252,265) |
| Total | | (527,174) |
| Construction & Engineering (0.3)% |
| Fluor Corp. | (4,005) | (195,204) |
| Valmont Industries, Inc. | (508) | (74,244) |
| Total | | (269,448) |
| Electrical Equipment (0.4)% |
| Emerson Electric Co. | (4,045) | (286,548) |
| Industrial Conglomerates (0.7)% |
| 3M Co. | (1,238) | (244,171) |
| Roper Technologies, Inc. | (1,056) | (291,234) |
| Total | | (535,405) |
| Common Stocks (continued) |
| Issuer | Shares | Value ($) |
| Machinery (1.6)% |
| Allison Transmission Holdings, Inc. | (1,488) | (61,469) |
| Deere & Co. | (870) | (130,074) |
| Illinois Tool Works | (1,789) | (257,079) |
| Kennametal, Inc. | (6,956) | (258,972) |
| Oshkosh Corp. | (1,523) | (110,798) |
| Trinity Industries, Inc. | (3,651) | (125,923) |
| Wabtec Corp. | (1,385) | (135,051) |
| Welbilt, Inc.(b) | (5,484) | (106,774) |
| Total | | (1,186,140) |
| Professional Services (0.8)% |
| Dun & Bradstreet Corp. (The) | (645) | (79,213) |
| IHS Markit Ltd.(b) | (5,004) | (246,597) |
| Nielsen Holdings PLC | (4,672) | (140,954) |
| Verisk Analytics, Inc.(b) | (1,634) | (173,596) |
| Total | | (640,360) |
| Road & Rail (0.2)% |
| AMERCO | (55) | (17,762) |
| Heartland Express, Inc. | (3,369) | (62,933) |
| Landstar System, Inc. | (628) | (71,215) |
| Total | | (151,910) |
| Trading Companies & Distributors (0.3)% |
| Air Lease Corp. | (2,678) | (118,930) |
| WESCO International, Inc.(b) | (1,756) | (104,219) |
| Total | | (223,149) |
| Total Industrials | (5,620,422) |
| Information Technology (7.0)% |
| Communications Equipment (0.4)% |
| CommScope Holding Co., Inc.(b) | (3,143) | (92,153) |
| Juniper Networks, Inc. | (8,311) | (221,405) |
| Total | | (313,558) |
| Electronic Equipment, Instruments & Components (0.5)% |
| Arrow Electronics, Inc.(b) | (1,408) | (104,361) |
| Avnet, Inc. | (2,897) | (110,434) |
| Corning Inc | (309) | (8,395) |
| Dolby Laboratories, Inc., Class A | (1,101) | (69,143) |
| Vishay Intertechnology, Inc. | (3,885) | (82,362) |
| Total | | (374,695) |
The accompanying Notes to Consolidated Financial Statements are an integral part of this statement.
Columbia Diversified Absolute Return Fund | Annual Report 2018
| 15 |
Consolidated Portfolio of Investments (continued)
May 31, 2018
| Common Stocks (continued) |
| Issuer | Shares | Value ($) |
| Internet Software & Services (0.1)% |
| Akamai Technologies, Inc.(b) | (1,013) | (76,360) |
| IT Services (1.6)% |
| Convergys Corp. | (5,678) | (134,228) |
| Gartner, Inc.(b) | (891) | (118,271) |
| Infosys Ltd., ADR | (3,533) | (64,265) |
| Jack Henry & Associates, Inc. | (623) | (77,912) |
| Paychex, Inc. | (4,308) | (282,519) |
| Square, Inc., Class A(b) | (2,471) | (143,936) |
| Syntel, Inc.(b) | (2,337) | (73,616) |
| Western Union Co. | (10,237) | (203,614) |
| Wex, Inc.(b) | (759) | (133,440) |
| Total | | (1,231,801) |
| Semiconductors & Semiconductor Equipment (1.6)% |
| Advanced Micro Devices, Inc.(b) | (2,856) | (39,213) |
| Amkor Technology, Inc.(b) | (29,477) | (268,241) |
| Analog Devices, Inc. | (1,387) | (134,789) |
| Cavium, Inc.(b) | (1,100) | (91,971) |
| Qorvo, Inc.(b) | (2,929) | (235,052) |
| QUALCOMM, Inc. | (4,824) | (280,371) |
| Universal Display Corp. | (1,112) | (110,088) |
| Versum Materials, Inc. | (1,391) | (55,598) |
| Total | | (1,215,323) |
| Software (1.4)% |
| Autodesk, Inc.(b) | (987) | (127,422) |
| CA, Inc. | (8,030) | (286,992) |
| Check Point Software Technologies Ltd.(b) | (1,121) | (109,141) |
| Citrix Systems, Inc.(b) | (2,707) | (285,913) |
| FireEye, Inc.(b) | (2,820) | (47,066) |
| Nuance Communications, Inc.(b) | (3,736) | (50,473) |
| PTC, Inc.(b) | (1,580) | (136,259) |
| Total | | (1,043,266) |
| Common Stocks (continued) |
| Issuer | Shares | Value ($) |
| Technology Hardware, Storage & Peripherals (1.4)% |
| Hewlett Packard Enterprise Co. | (22,506) | (342,991) |
| HP, Inc. | (13,139) | (289,452) |
| NetApp, Inc. | (3,110) | (212,475) |
| Seagate Technology | (1,492) | (84,074) |
| Xerox Corp. | (3,875) | (105,323) |
| Total | | (1,034,315) |
| Total Information Technology | (5,289,318) |
| Materials (2.3)% |
| Chemicals (1.4)% |
| Air Products & Chemicals, Inc. | (438) | (70,698) |
| Albemarle Corp. | (1,189) | (111,136) |
| Ecolab, Inc. | (2,253) | (321,300) |
| International Flavors & Fragrances, Inc. | (552) | (67,416) |
| Mosaic Co. (The) | (2,839) | (78,044) |
| Platform Specialty Products Corp.(b) | (9,472) | (114,232) |
| Praxair, Inc. | (529) | (82,662) |
| Scotts Miracle-Gro Co. (The), Class A | (826) | (70,317) |
| WR Grace & Co. | (1,656) | (118,553) |
| Total | | (1,034,358) |
| Construction Materials (0.2)% |
| Martin Marietta Materials, Inc. | (125) | (27,859) |
| Vulcan Materials Co. | (961) | (122,758) |
| Total | | (150,617) |
| Containers & Packaging (0.4)% |
| AptarGroup, Inc. | (875) | (80,780) |
| Ball Corp. | (2,849) | (105,270) |
| Sealed Air Corp. | (2,670) | (116,305) |
| Total | | (302,355) |
| Metals & Mining (0.3)% |
| Newmont Mining Corp. | (1,703) | (66,298) |
| Royal Gold, Inc. | (2,256) | (202,273) |
| Total | | (268,571) |
| Total Materials | (1,755,901) |
The accompanying Notes to Consolidated Financial Statements are an integral part of this statement.
| 16 | Columbia Diversified Absolute Return Fund | Annual Report 2018 |
Consolidated Portfolio of Investments (continued)
May 31, 2018
| Common Stocks (continued) |
| Issuer | Shares | Value ($) |
| Real Estate (2.3)% |
| Equity Real Estate Investment Trusts (REITS) (2.3)% |
| Alexandria Real Estate Equities, Inc. | (108) | (13,491) |
| American Campus Communities, Inc. | (1,840) | (73,784) |
| Crown Castle International Corp. | (165) | (17,185) |
| Federal Realty Investment Trust | (906) | (107,714) |
| Healthcare Trust of America, Inc., Class A | (4,417) | (113,340) |
| Kimco Realty Corp. | (17,260) | (266,840) |
| Macerich Co. (The) | (2,030) | (112,929) |
| Omega Healthcare Investors, Inc. | (2,149) | (65,867) |
| Public Storage | (1,374) | (291,068) |
| Realty Income Corp. | (1,960) | (104,468) |
| Uniti Group, Inc. | (689) | (14,448) |
| Washington Prime Group, Inc. | (36,857) | (267,950) |
| Welltower, Inc. | (5,070) | (292,286) |
| Total | | (1,741,370) |
| Total Real Estate | (1,741,370) |
| Telecommunication Services (0.6)% |
| Diversified Telecommunication Services (0.4)% |
| AT&T, Inc. | (8,616) | (278,469) |
| Wireless Telecommunication Services (0.2)% |
| Rogers Communications, Inc. | (3,867) | (181,440) |
| Total Telecommunication Services | (459,909) |
| Common Stocks (continued) |
| Issuer | Shares | Value ($) |
| Utilities (1.7)% |
| Electric Utilities (0.7)% |
| PPL Corp. | (8,746) | (238,941) |
| Southern Co. (The) | (6,185) | (277,706) |
| Total | | (516,647) |
| Multi-Utilities (0.7)% |
| Consolidated Edison, Inc. | (3,587) | (275,230) |
| Dominion Energy, Inc. | (3,967) | (254,642) |
| Total | | (529,872) |
| Water Utilities (0.3)% |
| Aqua America, Inc. | (6,212) | (215,557) |
| Total Utilities | (1,262,076) |
Total Common Stocks
(Proceeds $34,933,068) | (36,103,833) |
Total Investments in Securities Sold Short
(Proceeds $34,933,068) | (36,103,833) |
| Total Investments in Securities, Net of Securities Sold Short | 57,863,416 |
| Other Assets & Liabilities, Net | | 17,939,180 |
| Net Assets | 75,802,596 |
At May 31, 2018, securities and/or cash totaling $49,656,170 were pledged as collateral.
Investments in derivatives
| Forward foreign currency exchange contracts |
Currency to
be sold | Currency to
be purchased | Counterparty | Settlement
date | Unrealized
appreciation ($) | Unrealized
depreciation ($) |
| 9,538,000 NOK | 1,181,967 USD | Citi | 06/13/2018 | 15,903 | — |
| 1,277,100 USD | 10,545,000 NOK | Citi | 06/13/2018 | 12,074 | — |
| 3,686,098 USD | 29,404,000 NOK | Citi | 06/13/2018 | — | (91,324) |
| 6,157,755 USD | 8,871,000 NZD | HSBC | 06/13/2018 | 50,197 | — |
| 500,000 CHF | 508,310 USD | HSBC | 06/18/2018 | 340 | — |
| 500,000 EUR | 605,550 USD | HSBC | 06/18/2018 | 20,357 | — |
| 400,000 GBP | 551,580 USD | HSBC | 06/18/2018 | 19,440 | — |
| 85,800,000 JPY | 786,578 USD | HSBC | 06/18/2018 | — | (2,938) |
| 3,300,000 NOK | 411,801 USD | HSBC | 06/18/2018 | 8,277 | — |
| 500,000 NZD | 350,088 USD | HSBC | 06/18/2018 | 186 | — |
| 3,400,000 SEK | 385,375 USD | HSBC | 06/18/2018 | — | (599) |
| 1,900,000 SGD | 1,435,425 USD | HSBC | 06/18/2018 | 15,925 | — |
| 468,530 USD | 600,000 CAD | HSBC | 06/18/2018 | — | (5,589) |
The accompanying Notes to Consolidated Financial Statements are an integral part of this statement.
Columbia Diversified Absolute Return Fund | Annual Report 2018
| 17 |
Consolidated Portfolio of Investments (continued)
May 31, 2018
| Forward foreign currency exchange contracts (continued) |
Currency to
be sold | Currency to
be purchased | Counterparty | Settlement
date | Unrealized
appreciation ($) | Unrealized
depreciation ($) |
| 616,707 USD | 500,000 EUR | HSBC | 06/18/2018 | — | (31,515) |
| 562,500 USD | 400,000 GBP | HSBC | 06/18/2018 | — | (30,360) |
| 799,449 USD | 85,800,000 JPY | HSBC | 06/18/2018 | — | (9,933) |
| 422,577 USD | 3,300,000 NOK | HSBC | 06/18/2018 | — | (19,053) |
| 1,446,941 USD | 1,900,000 SGD | HSBC | 06/18/2018 | — | (27,441) |
| 14,334,000 JPY | 131,237 USD | HSBC | 07/09/2018 | — | (862) |
| 30,141 USD | 3,262,000 JPY | HSBC | 07/09/2018 | — | (79) |
| 894,000 GBP | 1,187,189 USD | Morgan Stanley | 06/13/2018 | — | (1,824) |
| 53,496,000 SEK | 6,237,938 USD | Morgan Stanley | 06/13/2018 | 167,481 | — |
| 3,718,200 USD | 2,743,000 GBP | Morgan Stanley | 06/13/2018 | — | (70,030) |
| 2,320,277 USD | 20,665,000 SEK | Morgan Stanley | 06/13/2018 | 24,683 | — |
| 1,379,000 CAD | 1,078,685 USD | Morgan Stanley | 07/09/2018 | 14,077 | — |
| 245,000 EUR | 293,658 USD | Morgan Stanley | 07/09/2018 | 6,426 | — |
| 149,903 USD | 194,000 CAD | Morgan Stanley | 07/09/2018 | — | (132) |
| 80,716 USD | 69,000 EUR | Morgan Stanley | 07/09/2018 | 178 | — |
| 184,936 USD | 136,000 GBP | Morgan Stanley | 07/09/2018 | — | (3,808) |
| 6,106,000 CHF | 6,140,615 USD | UBS | 06/13/2018 | — | (59,816) |
| 2,086,000 EUR | 2,503,108 USD | UBS | 06/13/2018 | 62,679 | — |
| 267,472,000 JPY | 2,455,170 USD | UBS | 06/13/2018 | — | (5,163) |
| 2,417,528 USD | 2,086,000 EUR | UBS | 06/13/2018 | 22,901 | — |
| Total | | | | 441,124 | (360,466) |
| Long futures contracts |
| Description | Number of
contracts | Expiration
date | Trading
currency | Notional
amount | Value/Unrealized
appreciation ($) | Value/Unrealized
depreciation ($) |
| 10-Year Mini JGB | 27 | 09/2018 | JPY | 408,542,035 | — | (3,742) |
| Australian 10-Year Bond | 9 | 06/2018 | AUD | 1,161,048 | 1,205 | — |
| CAC40 Index | 4 | 06/2018 | EUR | 215,120 | — | (5,163) |
| DAX Index | 1 | 06/2018 | EUR | 315,300 | 195 | — |
| Euro CHF 3-Month ICE | 6 | 09/2018 | CHF | 1,511,250 | — | (117) |
| EURO STOXX 50 | 30 | 06/2018 | EUR | 1,022,100 | 26,369 | — |
| EURO STOXX 50 | 7 | 06/2018 | EUR | 238,490 | — | (5,232) |
| Euro-Buxl 30-Year | 6 | 09/2018 | EUR | 1,089,221 | — | (13,458) |
| FTSE 100 Index | 54 | 06/2018 | GBP | 4,141,800 | 481,416 | — |
| FTSE 100 Index | 15 | 06/2018 | GBP | 1,150,500 | 115,978 | — |
| Hang Seng Index | 5 | 06/2018 | HKD | 7,624,250 | 1,918 | — |
| MSCI Emerging Markets Index | 29 | 06/2018 | USD | 1,626,465 | — | (151,237) |
| MSCI Singapore IX ETS | 10 | 06/2018 | SGD | 391,500 | — | (6,718) |
| OMXS30 Index | 17 | 06/2018 | SEK | 2,623,950 | — | (11,273) |
| S&P 500 E-mini | 3 | 06/2018 | USD | 405,825 | 4,380 | — |
| S&P 500 E-mini | 50 | 06/2018 | USD | 6,763,750 | — | (196,339) |
| S&P/TSE 60 Index | 3 | 06/2018 | CAD | 569,580 | 11,237 | — |
| SPI 200 Index | 26 | 06/2018 | AUD | 3,910,400 | 44,280 | — |
| TOPIX Index | 8 | 06/2018 | JPY | 139,560,000 | 36,655 | — |
| TOPIX Index | 2 | 06/2018 | JPY | 34,890,000 | — | (4,977) |
| U.S. Ultra Bond | 20 | 09/2018 | USD | 3,185,295 | 99,942 | — |
| Total | | | | | 823,575 | (398,256) |
| Short futures contracts |
| Description | Number of
contracts | Expiration
date | Trading
currency | Notional
amount | Value/Unrealized
appreciation ($) | Value/Unrealized
depreciation ($) |
| 10-Year Mini JGB | (7) | 06/2018 | JPY | (105,937,380) | — | (1,600) |
| 3-Month Euroyen | (14) | 09/2018 | JPY | (349,720,000) | — | (368) |
| 90-Day Euro$ | (7) | 09/2018 | USD | (1,707,388) | 506 | — |
| Australian 10-Year Bond | (5) | 06/2018 | AUD | (645,027) | — | (3,879) |
| Banker’s Acceptance | (17) | 09/2018 | CAD | (4,167,125) | — | (366) |
The accompanying Notes to Consolidated Financial Statements are an integral part of this statement.
| 18 | Columbia Diversified Absolute Return Fund | Annual Report 2018 |
Consolidated Portfolio of Investments (continued)
May 31, 2018
| Short futures contracts (continued) |
| Description | Number of
contracts | Expiration
date | Trading
currency | Notional
amount | Value/Unrealized
appreciation ($) | Value/Unrealized
depreciation ($) |
| Canadian Government 10-Year Bond | (11) | 09/2018 | CAD | (1,492,598) | — | (16,363) |
| EURO STOXX 50 | (52) | 06/2018 | EUR | (1,771,640) | — | (49,310) |
| Euro-Bund | (9) | 09/2018 | EUR | (1,468,721) | — | (2,130) |
| Long Gilt | (8) | 09/2018 | GBP | (996,961) | — | (8,919) |
| MSCI Emerging Markets Index | (12) | 06/2018 | USD | (673,020) | 12,327 | — |
| S&P 500 E-mini | (26) | 06/2018 | USD | (3,517,150) | 36,586 | — |
| S&P/TSE 60 Index | (7) | 06/2018 | CAD | (1,329,020) | — | (33,531) |
| U.S. Long Bond | (7) | 09/2018 | USD | (1,027,916) | — | (18,391) |
| Total | | | | | 49,419 | (134,857) |
| Cleared interest rate swap contracts |
| Fund receives | Fund pays | Payment
frequency | Counterparty | Maturity
date | Notional
currency | Notional
amount | Value
($) | Upfront
payments
($) | Upfront
receipts
($) | Unrealized
appreciation
($) | Unrealized
depreciation
($) |
| 3-Month USD LIBOR | Fixed rate of 2.044% | Receives Quarterly, Pays Semi annually | Morgan Stanley | 09/08/2027 | USD | 6,143,000 | 429,461 | — | — | 429,461 | — |
| Fixed rate of 0.770% | 6-Month EURIBOR | Receives Annually, Pays Semi annually | Morgan Stanley | 09/08/2027 | EUR | 4,881,000 | 3,709 | — | — | 3,709 | — |
| Fixed rate of 0.210% | 6-Month JPY BBA LIBOR | Receives Semi annually, Pays Semi annually | Morgan Stanley | 09/08/2027 | JPY | 82,205,000 | (3,908) | — | — | — | (3,908) |
| Fixed rate of 0.769% | 6-Month EURIBOR | Receives Annually, Pays Semi annually | Morgan Stanley | 12/05/2027 | EUR | 1,191,000 | (4,191) | — | — | — | (4,191) |
| Fixed rate of 0.285% | 6-Month JPY BBA LIBOR | Receives Semi annually, Pays Semi annually | Morgan Stanley | 12/06/2027 | JPY | 66,227,000 | 987 | — | — | 987 | — |
| 6-Month GBP LIBOR | Fixed rate of 1.322% | Receives Semi annually, Pays Semi annually | Morgan Stanley | 01/02/2028 | GBP | 2,734,000 | 27,770 | — | — | 27,770 | — |
| Fixed rate of 2.821% | 6-Month AUD BBA LIBOR | Receives Semi annually, Pays Semi annually | Morgan Stanley | 01/03/2028 | AUD | 3,156,000 | 7,630 | — | — | 7,630 | — |
| Fixed rate of 0.891% | 6-Month EURIBOR | Receives Annually, Pays Semi annually | Morgan Stanley | 01/04/2028 | EUR | 2,843,000 | 24,264 | — | — | 24,264 | — |
| Fixed rate of 1.090% | 6-Month EURIBOR | Receives Annually, Pays Semi annually | Morgan Stanley | 03/07/2028 | EUR | 1,275,000 | 34,940 | — | — | 34,940 | — |
| Fixed rate of 0.958% | 6-Month EURIBOR | Receives Annually, Pays Semi annually | Morgan Stanley | 04/05/2028 | EUR | 2,743,618 | 27,877 | — | — | 27,877 | — |
| Fixed rate of 0.293% | 6-Month JPY BBA LIBOR | Receives Semi annually, Pays Semi annually | Morgan Stanley | 04/05/2028 | JPY | 1,014,099,749 | 1,050 | — | — | 1,050 | — |
| Fixed rate of 2.830% | 3-Month USD LIBOR | Receives Semi annually, Pays Quarterly | Morgan Stanley | 04/05/2028 | USD | 2,279,643 | (12,302) | — | — | — | (12,302) |
| 6-Month GBP LIBOR | Fixed rate of 1.550% | Receives Semi annually, Pays Semi annually | Morgan Stanley | 05/01/2028 | GBP | 2,009,000 | (25,571) | — | — | — | (25,571) |
| 3-Month USD LIBOR | Fixed rate of 3.037% | Receives Quarterly, Pays Semi annually | Morgan Stanley | 05/03/2028 | USD | 4,149,556 | (50,958) | — | — | — | (50,958) |
| 6-Month EURIBOR | Fixed rate of 1.006% | Receives Semi annually, Pays Annually | Morgan Stanley | 05/04/2028 | EUR | 1,759,406 | (24,211) | — | — | — | (24,211) |
| 6-Month JPY BBA LIBOR | Fixed rate of 0.308% | Receives Semi annually, Pays Semi annually | Morgan Stanley | 05/08/2028 | JPY | 678,871,664 | (5,549) | — | — | — | (5,549) |
| Total | | | | | | | 430,998 | — | — | 557,688 | (126,690) |
The accompanying Notes to Consolidated Financial Statements are an integral part of this statement.
Columbia Diversified Absolute Return Fund | Annual Report 2018
| 19 |
Consolidated Portfolio of Investments (continued)
May 31, 2018
| Credit default swap contracts - sell protection |
Reference
entity | Counterparty | Maturity
date | Receive
fixed
rate
(%) | Payment
frequency | Implied
credit
spread
(%)* | Notional
currency | Notional
amount | Value
($) | Periodic
payments
receivable
(payable)
($) | Upfront
payments
($) | Upfront
receipts
($) | Unrealized
appreciation
($) | Unrealized
depreciation
($) |
| Markit CDX Emerging Markets Index, Series 29 | Citi | 06/20/2023 | 1.000 | Quarterly | 1.736 | USD | 600,000 | (19,893) | 1,217 | — | (11,247) | — | (7,429) |
| Markit CDX Emerging Markets Index, Series 29 | Citi | 06/20/2023 | 1.000 | Quarterly | 1.736 | USD | 1,396,000 | (46,283) | 2,831 | — | (25,238) | — | (18,214) |
| Total | | | | | | | | | 4,048 | — | (36,485) | — | (25,643) |
| * | Implied credit spreads, represented in absolute terms, utilized in determining the market value of credit default swap agreements on corporate or sovereign issues as of period end serve as an indicator of the current status of the payment/performance risk and represent the likelihood or risk of default for the credit derivative. The implied credit spread of a particular referenced entity reflects the cost of buying/selling protection and may include upfront payments required to be made to enter into the agreement. Wider credit spreads represent a deterioration of the referenced entity’s credit soundness and a greater likelihood or risk of default or other credit event occurring as defined under the terms of the agreement. |
| Cleared credit default swap contracts - sell protection |
Reference
entity | Counterparty | Maturity
date | Receive
fixed
rate
(%) | Payment
frequency | Implied
credit
spread
(%)* | Notional
currency | Notional
amount | Value
($) | Upfront
payments
($) | Upfront
receipts
($) | Unrealized
appreciation
($) | Unrealized
depreciation
($) |
| Markit CDX North America High Yield Index, Series 30 | Morgan Stanley | 06/20/2023 | 5.000 | Quarterly | 3.521 | USD | 3,936,000 | 45,273 | — | — | 45,273 | — |
| Markit CDX North America Investment Grade Index, Series 30 | Morgan Stanley | 06/20/2023 | 1.000 | Quarterly | 0.667 | USD | 1,285,000 | 403 | — | — | 403 | — |
| Markit CDX North America Investment Grade Index, Series 30 | Morgan Stanley | 06/20/2023 | 1.000 | Quarterly | 0.667 | USD | 640,000 | (422) | — | — | — | (422) |
| Total | | | | | | | | 45,254 | — | — | 45,676 | (422) |
| * | Implied credit spreads, represented in absolute terms, utilized in determining the market value of credit default swap agreements on corporate or sovereign issues as of period end serve as an indicator of the current status of the payment/performance risk and represent the likelihood or risk of default for the credit derivative. The implied credit spread of a particular referenced entity reflects the cost of buying/selling protection and may include upfront payments required to be made to enter into the agreement. Wider credit spreads represent a deterioration of the referenced entity’s credit soundness and a greater likelihood or risk of default or other credit event occurring as defined under the terms of the agreement. |
| Total return swap contracts |
| Fund receives | Fund pays | Payment
frequency | Counterparty | Maturity
date | Notional
currency | Notional
amount | Value
($) | Periodic
payments
receivable
(payable)
($) | Upfront
payments | Upfront
receipts | Unrealized
appreciation
($) | Unrealized
depreciation
($) |
| Total return on Barclays Backwardation Alpha Bloomberg CI Index ER† | Fixed rate of 0.350% | Monthly | Barclays | 11/30/2018 | USD | 3,407,422 | 39,018 †† | (1,027) | — | — | 37,991 | — |
| Total return on Barclays Commodity Hedging Insights 2 Index† | Fixed rate of 0.150% | Monthly | Barclays | 11/30/2018 | USD | 2,008,124 | 33,081 †† | (251) | — | — | 32,830 | — |
| Total return on Barclays Commodity Hedging Insights 2 Index† | Fixed rate of 0.150% | Monthly | Barclays | 11/30/2018 | USD | 907,665 | 9,670 †† | (77) | — | — | 9,593 | — |
The accompanying Notes to Consolidated Financial Statements are an integral part of this statement.
| 20 | Columbia Diversified Absolute Return Fund | Annual Report 2018 |
Consolidated Portfolio of Investments (continued)
May 31, 2018
| Total return swap contracts (continued) |
| Fund receives | Fund pays | Payment
frequency | Counterparty | Maturity
date | Notional
currency | Notional
amount | Value
($) | Periodic
payments
receivable
(payable)
($) | Upfront
payments | Upfront
receipts | Unrealized
appreciation
($) | Unrealized
depreciation
($) |
| Total return on Barclays Backwardation Alpha Bloomberg CI Index ER† | Fixed rate of 0.350% | Monthly | Barclays | 11/30/2018 | USD | 681,273 | 7,802 †† | (199) | — | — | 7,603 | — |
| Total return on Barclays Commodity Hedging Insights 2 Index† | Fixed rate of 0.150% | Monthly | Barclays | 11/30/2018 | USD | 197,486 | 3,254 †† | (25) | — | — | 3,229 | — |
| Total return on Barclays TrendStar+ Alt Roll 2 Index† | Fixed rate of 0.600% | Monthly | Barclays | 11/30/2018 | USD | 5,286,674 | 6,529 †† | (2,643) | 973 | — | 2,913 | — |
| Total return on Barclays Backwardation Alpha Bloomberg CI Index ER† | Fixed rate of 0.350% | Monthly | Barclays | 11/30/2018 | USD | 99,203 | 2,446 †† | (27) | — | — | 2,419 | — |
| Total return on Barclays Commodity Hedging Insights 2 Index† | Fixed rate of 0.150% | Monthly | Barclays | 11/30/2018 | USD | 38,585 | 635 †† | (17) | — | — | 618 | — |
| Total return on Barclays Backwardation Alpha Bloomberg CI Index ER† | Fixed rate of 0.350% | Monthly | Barclays | 11/30/2018 | USD | 35,968 | 412 †† | (11) | — | — | 401 | — |
| Total return on Barclays Commodity Hedging Insights 2 Index† | Fixed rate of 0.150% | Monthly | Barclays | 11/30/2018 | USD | 4,752 | 79 †† | (1) | — | — | 78 | — |
| Total return on Barclays TrendStar+ Alt Roll 2 Index† | Fixed rate of 0.600% | Monthly | Barclays | 11/30/2018 | USD | 127,986 | 157 †† | (66) | 24 | — | 67 | — |
| Total return on Barclays TrendStar+ Alt Roll 2 Index† | Fixed rate of 0.600% | Monthly | Barclays | 11/30/2018 | USD | 95,793 | 119 †† | (48) | 23 | — | 48 | — |
| Total return on Barclays TrendStar+ Alt Roll 2 Index† | Fixed rate of 0.600% | Monthly | Barclays | 11/30/2018 | USD | 151,280 | 188 †† | (151) | 44 | — | — | (7) |
The accompanying Notes to Consolidated Financial Statements are an integral part of this statement.
Columbia Diversified Absolute Return Fund | Annual Report 2018
| 21 |
Consolidated Portfolio of Investments (continued)
May 31, 2018
| Total return swap contracts (continued) |
| Fund receives | Fund pays | Payment
frequency | Counterparty | Maturity
date | Notional
currency | Notional
amount | Value
($) | Periodic
payments
receivable
(payable)
($) | Upfront
payments | Upfront
receipts | Unrealized
appreciation
($) | Unrealized
depreciation
($) |
| Total return on Barclays Commodity Strategy 1692 Index Excess Return† | Fixed rate of 0.500% | Monthly | Barclays | 11/30/2018 | USD | 24,365 | (7) †† | (10) | — | — | — | (17) |
| Total return on Barclays Dualis Volatility Weighted Index† | Fixed rate of 0.540% | Monthly | Barclays | 11/30/2018 | USD | 14,710 | (44) †† | (52) | — | — | — | (96) |
| Total return on Barclays Commodity Strategy 1692 Index Excess Return† | Fixed rate of 0.500% | Monthly | Barclays | 11/30/2018 | USD | 603,024 | (155) †† | (260) | — | — | — | (415) |
| Total return on Barclays Commodity Strategy 1692 Index Excess Return† | Fixed rate of 0.500% | Monthly | Barclays | 11/30/2018 | USD | 2,365,903 | (609) †† | (1,019) | — | — | — | (1,628) |
| Total return on Barclays Dualis Volatility Weighted Index† | Fixed rate of 0.540% | Monthly | Barclays | 11/30/2018 | USD | 1,724,400 | (5,219) †† | (776) | — | — | — | (5,995) |
| Total return on Barclays Dualis Volatility Weighted Index† | Fixed rate of 0.540% | Monthly | Barclays | 11/30/2018 | USD | 2,879,959 | (8,716) †† | (1,296) | — | — | — | (10,012) |
| Total return on Citi Curve Composite (DJ-UBSCI wtd) Balanced Alpha† | Fixed rate of 0.300% | Monthly | Citi | 11/30/2018 | USD | 7,469,798 | 49,465 †† | (1,930) | — | — | 47,535 | — |
| Total return on Citi Curve Composite (DJ-UBSCI wtd) Balanced Alpha† | Fixed rate of 0.300% | Monthly | Citi | 11/30/2018 | USD | 533,210 | 2,298 †† | (124) | — | — | 2,174 | — |
| Total return on Citi Curve Composite (DJ-UBSCI wtd) Balanced Alpha† | Fixed rate of 0.300% | Monthly | Citi | 11/30/2018 | USD | 114,875 | 761 †† | (30) | — | — | 731 | — |
| Total return on Citi Commodities Congestion Pre-Post Roll Alpha (B) Index† | Fixed rate of 0.270% | Monthly | Citi | 11/30/2018 | USD | 7,429,054 | 2,342 †† | (1,727) | — | — | 615 | — |
The accompanying Notes to Consolidated Financial Statements are an integral part of this statement.
| 22 | Columbia Diversified Absolute Return Fund | Annual Report 2018 |
Consolidated Portfolio of Investments (continued)
May 31, 2018
| Total return swap contracts (continued) |
| Fund receives | Fund pays | Payment
frequency | Counterparty | Maturity
date | Notional
currency | Notional
amount | Value
($) | Periodic
payments
receivable
(payable)
($) | Upfront
payments | Upfront
receipts | Unrealized
appreciation
($) | Unrealized
depreciation
($) |
| Total return on Citi Commodities Congestion Pre-Post Roll Alpha (B) Index† | Fixed rate of 0.270% | Monthly | Citi | 11/30/2018 | USD | 564,106 | 681 †† | (116) | — | — | 565 | — |
| Total return on Citi Commodities Congestion Pre-Post Roll Alpha (B) Index† | Fixed rate of 0.270% | Monthly | Citi | 11/30/2018 | USD | 159,881 | 50 †† | (37) | — | — | 13 | — |
| Total return on Deutsche Bank Currency Valuation - USD Excess Return† | Fixed rate of 0.000% | Monthly | Deutsche Bank | 11/30/2018 | USD | 20,249 | (355) †† | — | — | — | — | (355) |
| Total return on Deutsche Bank Haven Plus - USD Excess Return† | Fixed rate of 0.000% | Monthly | Deutsche Bank | 11/30/2018 | USD | 31,221 | (719) †† | — | — | — | — | (719) |
| Total return on Deutsche Bank Currency Valuation - USD Excess Return† | Fixed rate of 0.000% | Monthly | Deutsche Bank | 11/30/2018 | USD | 52,464 | (919) †† | — | — | — | — | (919) |
| Total return on Deutsche Bank Currency Valuation - USD Excess Return† | Fixed rate of 0.000% | Monthly | Deutsche Bank | 11/30/2018 | USD | 283,948 | (4,973) †† | — | — | — | — | (4,973) |
| Total return on Deutsche Bank Haven Plus - USD Excess Return† | Fixed rate of 0.000% | Monthly | Deutsche Bank | 11/30/2018 | USD | 573,125 | (13,204) †† | — | — | — | — | (13,204) |
| Total return on Deutsche Bank Currency Valuation - USD Excess Return† | Fixed rate of 0.000% | Monthly | Deutsche Bank | 11/30/2018 | USD | 788,564 | (13,809) †† | — | — | — | — | (13,809) |
| Total return on Deutsche Bank Haven Plus - USD Excess Return† | Fixed rate of 0.000% | Monthly | Deutsche Bank | 11/30/2018 | USD | 973,899 | (22,437) †† | — | — | — | — | (22,437) |
| Total return on Deutsche Bank Haven Plus - USD Excess Return† | Fixed rate of 0.000% | Monthly | Deutsche Bank | 11/30/2018 | USD | 1,951,940 | (44,972) †† | — | — | — | — | (44,972) |
The accompanying Notes to Consolidated Financial Statements are an integral part of this statement.
Columbia Diversified Absolute Return Fund | Annual Report 2018
| 23 |
Consolidated Portfolio of Investments (continued)
May 31, 2018
| Total return swap contracts (continued) |
| Fund receives | Fund pays | Payment
frequency | Counterparty | Maturity
date | Notional
currency | Notional
amount | Value
($) | Periodic
payments
receivable
(payable)
($) | Upfront
payments | Upfront
receipts | Unrealized
appreciation
($) | Unrealized
depreciation
($) |
| Total return on Deutsche Bank Currency Valuation - USD Excess Return† | Fixed rate of 0.000% | Monthly | Deutsche Bank | 11/30/2018 | USD | 8,129,323 | (142,365) †† | — | — | — | — | (142,365) |
| Total return on Goldman Sachs RP Equity World Long Short Series 37 Excess Return† | Fixed rate of 0.000% | Monthly | Goldman Sachs International | 11/30/2018 | USD | 12,851,175 | 14,420 †† | — | — | — | 14,420 | — |
| Total return on Goldman Sachs Equity Volatility Carry Series 28 Excess Return Strategy† | Fixed rate of 0.100% | Monthly | Goldman Sachs International | 11/30/2018 | USD | 1,571,266 | 6,028 †† | (393) | — | — | 5,635 | — |
| Total return on Goldman Sachs Curve Index RP09† | Fixed rate of 0.110% | Monthly | Goldman Sachs International | 11/30/2018 | USD | 8,302,646 | 5,769 †† | (761) | — | — | 5,008 | — |
| Total return on Goldman Sachs Curve Index C0210† | Fixed rate of -0.020% | Monthly | Goldman Sachs International | 11/30/2018 | USD | 7,763,256 | 3,092 †† | 133 | — | — | 3,225 | — |
| Total return on Goldman Sachs RP Equity World Long Short Series 37 Excess Return† | Fixed rate of 0.100% | Monthly | Goldman Sachs International | 11/30/2018 | USD | 1,458,845 | 1,636 †† | (121) | — | — | 1,515 | — |
| Total return on Goldman Sachs Curve Index RP09† | Fixed rate of 0.110% | Monthly | Goldman Sachs International | 11/30/2018 | USD | 1,471,686 | 1,023 †† | (135) | — | — | 888 | — |
| Total return on Goldman Sachs Curve Index RP09† | Fixed rate of 0.110% | Monthly | Goldman Sachs International | 11/30/2018 | USD | 975,191 | 677 †† | (89) | — | — | 588 | — |
| Total return on Goldman Sachs RP Equity World Long Short Series 37 Excess Return† | Fixed rate of 0.000% | Monthly | Goldman Sachs International | 11/30/2018 | USD | 400,659 | 450 †† | — | — | — | 450 | — |
| Total return on Goldman Sachs Equity Volatility Carry Series 28 Excess Return Strategy† | Fixed rate of 0.100% | Monthly | Goldman Sachs International | 11/30/2018 | USD | 71,328 | 274 †† | (6) | — | — | 268 | — |
The accompanying Notes to Consolidated Financial Statements are an integral part of this statement.
| 24 | Columbia Diversified Absolute Return Fund | Annual Report 2018 |
Consolidated Portfolio of Investments (continued)
May 31, 2018
| Total return swap contracts (continued) |
| Fund receives | Fund pays | Payment
frequency | Counterparty | Maturity
date | Notional
currency | Notional
amount | Value
($) | Periodic
payments
receivable
(payable)
($) | Upfront
payments | Upfront
receipts | Unrealized
appreciation
($) | Unrealized
depreciation
($) |
| Total return on Goldman Sachs RP Equity World Long Short Series 37 Excess Return† | Fixed rate of 0.000% | Monthly | Goldman Sachs International | 11/30/2018 | USD | 133,926 | 150 †† | — | — | — | 150 | — |
| Total return on Goldman Sachs RP Equity World Long Short Series 37 Excess Return† | Fixed rate of 0.000% | Monthly | Goldman Sachs International | 11/30/2018 | USD | 101,487 | 114 †† | — | — | — | 114 | — |
| Total return on Goldman Sachs Curve Index C0210† | Fixed rate of -0.020% | Monthly | Goldman Sachs International | 11/30/2018 | USD | 196,825 | 79 †† | 3 | — | — | 82 | — |
| Total return on Goldman Sachs Equity Volatility Carry Series 28 Excess Return Strategy† | Fixed rate of 0.100% | Monthly | Goldman Sachs International | 11/30/2018 | USD | 20,331 | 78 †† | (2) | — | — | 76 | — |
| Total return on Goldman Sachs Curve Index C0210† | Fixed rate of -0.020% | Monthly | Goldman Sachs International | 11/30/2018 | USD | 147,300 | 58 †† | 3 | — | — | 61 | — |
| Total return on Goldman Sachs Curve Index C0210† | Fixed rate of -0.020% | Monthly | Goldman Sachs International | 11/30/2018 | USD | 132,787 | 53 †† | 2 | — | — | 55 | — |
| Total return on Goldman Sachs Curve Index C0210† | Fixed rate of -0.020% | Monthly | Goldman Sachs International | 11/30/2018 | USD | 119,928 | 48 †† | 2 | — | — | 50 | — |
| Total return on Goldman Sachs Equity Volatility Carry Series 28 Excess Return Strategy† | Fixed rate of 0.100% | Monthly | Goldman Sachs International | 11/30/2018 | USD | 7,383 | 28 †† | (2) | — | — | 26 | — |
| Total return on Goldman Sachs Curve Index RP09† | Fixed rate of 0.110% | Monthly | Goldman Sachs International | 11/30/2018 | USD | 59,173 | 41 †† | (51) | — | — | — | (10) |
| Total return on Goldman Sachs Commodity Volatility Carry Series 18 Excess Return Strategy† | Fixed rate of 0.100% | Monthly | Goldman Sachs International | 11/30/2018 | USD | 34,692 | (69) †† | (3) | — | — | — | (72) |
The accompanying Notes to Consolidated Financial Statements are an integral part of this statement.
Columbia Diversified Absolute Return Fund | Annual Report 2018
| 25 |
Consolidated Portfolio of Investments (continued)
May 31, 2018
| Total return swap contracts (continued) |
| Fund receives | Fund pays | Payment
frequency | Counterparty | Maturity
date | Notional
currency | Notional
amount | Value
($) | Periodic
payments
receivable
(payable)
($) | Upfront
payments | Upfront
receipts | Unrealized
appreciation
($) | Unrealized
depreciation
($) |
| Total return on Goldman Sachs FX Time Series Momentum Index C0038† | Fixed rate of 0.220% | Monthly | Goldman Sachs International | 11/30/2018 | USD | 51,996 | (229) †† | (9) | — | — | — | (238) |
| Total return on Goldman Sachs Series 19 10-year Volatility Carry Index† | Fixed rate of 0.100% | Monthly | Goldman Sachs International | 11/30/2018 | USD | 23,354 | (418) †† | (2) | — | — | — | (420) |
| Total return on Goldman Sachs FX Time Series Momentum Index C0038† | Fixed rate of 0.220% | Monthly | Goldman Sachs International | 11/30/2018 | USD | 98,196 | (431) †† | (18) | — | — | — | (449) |
| Total return on Goldman Sachs FX Time Series Momentum Index C0038† | Fixed rate of 0.220% | Monthly | Goldman Sachs International | 11/30/2018 | USD | 103,290 | (453) †† | (19) | — | — | — | (472) |
| Total return on Goldman Sachs FX Volatility Carry Basket Index† | Fixed rate of 0.100% | Monthly | Goldman Sachs International | 11/30/2018 | USD | 82,761 | (462) †† | (59) | — | — | — | (521) |
| Total return on Goldman Sachs U.S. Series 71 Excess Return Strategy† | Fixed rate of 0.100% | Monthly | Goldman Sachs International | 11/30/2018 | USD | 99,920 | (731) †† | (8) | — | — | — | (739) |
| Total return on Goldman Sachs Commodity Volatility Carry Series 18 Excess Return Strategy† | Fixed rate of 0.100% | Monthly | Goldman Sachs International | 11/30/2018 | USD | 383,952 | (764) †† | (112) | — | — | — | (876) |
| Total return on Goldman Sachs U.S. Series 71 Excess Return Strategy† | Fixed rate of 0.100% | Monthly | Goldman Sachs International | 11/30/2018 | USD | 123,726 | (904) †† | (19) | — | — | — | (923) |
| Total return on Goldman Sachs FX EM & G10 3 Month Carry Index C0115† | Fixed rate of 0.260% | Monthly | Goldman Sachs International | 11/30/2018 | USD | 49,081 | (1,304) †† | (110) | — | — | — | (1,414) |
| Total return on Goldman Sachs Macro Index CA03† | Fixed rate of 0.100% | Monthly | Goldman Sachs International | 11/30/2018 | USD | 59,946 | (1,939) †† | (5) | — | — | — | (1,944) |
The accompanying Notes to Consolidated Financial Statements are an integral part of this statement.
| 26 | Columbia Diversified Absolute Return Fund | Annual Report 2018 |
Consolidated Portfolio of Investments (continued)
May 31, 2018
| Total return swap contracts (continued) |
| Fund receives | Fund pays | Payment
frequency | Counterparty | Maturity
date | Notional
currency | Notional
amount | Value
($) | Periodic
payments
receivable
(payable)
($) | Upfront
payments | Upfront
receipts | Unrealized
appreciation
($) | Unrealized
depreciation
($) |
| Total return on Goldman Sachs FX Volatility Carry Basket Index† | Fixed rate of 0.100% | Monthly | Goldman Sachs International | 11/30/2018 | USD | 432,477 | (2,414) †† | (36) | — | — | — | (2,450) |
| Total return on Goldman Sachs FX Time Series Momentum Index C0038† | Fixed rate of 0.100% | Monthly | Goldman Sachs International | 11/30/2018 | USD | 665,319 | (2,476) †† | (72) | — | — | — | (2,548) |
| Total return on Goldman Sachs Macro Index MF03† | Fixed rate of 0.100% | Monthly | Goldman Sachs International | 11/30/2018 | USD | 104,784 | (2,857) †† | (9) | — | — | — | (2,866) |
| Total return on Goldman Sachs FX Volatility Carry Basket Index† | Fixed rate of 0.100% | Monthly | Goldman Sachs International | 11/30/2018 | USD | 525,381 | (2,931) †† | (123) | — | — | — | (3,054) |
| Total return on Goldman Sachs Series 19 10-year Volatility Carry Index† | Fixed rate of 0.100% | Monthly | Goldman Sachs International | 11/30/2018 | USD | 202,691 | (3,629) †† | (17) | — | — | — | (3,646) |
| Total return on Goldman Sachs FX EM & G10 3 Month Valuation Index C0114† | Fixed rate of 0.180% | Monthly | Goldman Sachs International | 11/30/2018 | USD | 205,843 | (4,304) †† | (31) | — | — | — | (4,335) |
| Total return on Goldman Sachs Macro Index CA03† | Fixed rate of 0.100% | Monthly | Goldman Sachs International | 11/30/2018 | USD | 145,768 | (4,715) †† | (12) | — | — | — | (4,727) |
| Total return on Goldman Sachs FX EM & G10 3 Month Valuation Index C0114† | Fixed rate of 0.180% | Monthly | Goldman Sachs International | 11/30/2018 | USD | 253,188 | (5,294) †† | (38) | — | — | — | (5,332) |
| Total return on Goldman Sachs Macro Index MF03† | Fixed rate of 0.100% | Monthly | Goldman Sachs International | 11/30/2018 | USD | 265,664 | (7,244) †† | (22) | — | — | — | (7,266) |
| Total return on Goldman Sachs Macro Index MF03† | Fixed rate of 0.100% | Monthly | Goldman Sachs International | 11/30/2018 | USD | 303,556 | (8,278) †† | (25) | — | — | — | (8,303) |
| Total return on Goldman Sachs Series 19 10-year Volatility Carry Index† | Fixed rate of 0.100% | Monthly | Goldman Sachs International | 11/30/2018 | USD | 509,603 | (9,123) †† | — | — | — | — | (9,123) |
The accompanying Notes to Consolidated Financial Statements are an integral part of this statement.
Columbia Diversified Absolute Return Fund | Annual Report 2018
| 27 |
Consolidated Portfolio of Investments (continued)
May 31, 2018
| Total return swap contracts (continued) |
| Fund receives | Fund pays | Payment
frequency | Counterparty | Maturity
date | Notional
currency | Notional
amount | Value
($) | Periodic
payments
receivable
(payable)
($) | Upfront
payments | Upfront
receipts | Unrealized
appreciation
($) | Unrealized
depreciation
($) |
| Total return on Goldman Sachs FX EM & G10 3 Month Carry Index C0115† | Fixed rate of 0.260% | Monthly | Goldman Sachs International | 11/30/2018 | USD | 347,683 | (9,238) †† | (75) | — | — | — | (9,313) |
| Total return on Goldman Sachs FX EM & G10 3 Month Valuation Index C0114† | Fixed rate of 0.180% | Monthly | Goldman Sachs International | 11/30/2018 | USD | 478,784 | (10,011) †† | (72) | — | — | — | (10,083) |
| Total return on Goldman Sachs FX EM & G10 3 Month Valuation Index C0114† | Fixed rate of 0.180% | Monthly | Goldman Sachs International | 11/30/2018 | USD | 592,602 | (12,391) †† | (89) | — | — | — | (12,480) |
| Total return on Goldman Sachs Macro Index CA03† | Fixed rate of 0.100% | Monthly | Goldman Sachs International | 11/30/2018 | USD | 505,013 | (16,334) †† | (70) | — | — | — | (16,404) |
| Total return on Goldman Sachs Macro Index CA03† | Fixed rate of 0.100% | Monthly | Goldman Sachs International | 11/30/2018 | USD | 513,207 | (16,599) †† | (43) | — | — | — | (16,642) |
| Total return on Goldman Sachs FX Time Series Momentum Index C0038† | Fixed rate of 0.220% | Monthly | Goldman Sachs International | 11/30/2018 | USD | 3,916,404 | (17,172) †† | (718) | — | — | — | (17,890) |
| Total return on Goldman Sachs Macro Index MF03† | Fixed rate of 0.100% | Monthly | Goldman Sachs International | 11/30/2018 | USD | 892,039 | (24,325) †† | (74) | — | — | — | (24,399) |
| Total return on Goldman Sachs U.S. Series 71 Excess Return Strategy† | Fixed rate of 0.100% | Monthly | Goldman Sachs International | 11/30/2018 | USD | 3,452,734 | (25,238) †† | (288) | — | — | — | (25,526) |
| Total return on Goldman Sachs Macro Index CA03† | Fixed rate of 0.100% | Monthly | Goldman Sachs International | 11/30/2018 | USD | 2,167,328 | (70,100) †† | (181) | — | — | — | (70,281) |
| Total return on Goldman Sachs FX EM & G10 3 Month Carry Index C0115† | Fixed rate of 0.260% | Monthly | Goldman Sachs International | 11/30/2018 | USD | 3,900,630 | (103,635) †† | (845) | — | — | — | (104,480) |
| Total return on Goldman Sachs FX EM & G10 3 Month Valuation Index C0114† | Fixed rate of 0.180% | Monthly | Goldman Sachs International | 11/30/2018 | USD | 5,336,079 | (111,577) †† | (953) | — | — | — | (112,530) |
The accompanying Notes to Consolidated Financial Statements are an integral part of this statement.
| 28 | Columbia Diversified Absolute Return Fund | Annual Report 2018 |
Consolidated Portfolio of Investments (continued)
May 31, 2018
| Total return swap contracts (continued) |
| Fund receives | Fund pays | Payment
frequency | Counterparty | Maturity
date | Notional
currency | Notional
amount | Value
($) | Periodic
payments
receivable
(payable)
($) | Upfront
payments | Upfront
receipts | Unrealized
appreciation
($) | Unrealized
depreciation
($) |
| Total return on Goldman Sachs Macro Index MF03† | Fixed rate of 0.100% | Monthly | Goldman Sachs International | 11/30/2018 | USD | 12,872,964 | (351,031) †† | (1,073) | — | — | — | (352,104) |
| Total return on JPMorgan Equity Risk Premium - Global Balanced Multi-Factor (Long/Short) US Index† | Fixed rate of -0.150% | Monthly | JPMorgan | 11/30/2018 | USD | 168,796 | (106) †† | 48 | — | — | — | (58) |
| Total return on JPMorgan Equity Risk Premium - Global Balanced Multi-Factor (Long/Short) US Index† | Fixed rate of -0.150% | Monthly | JPMorgan | 11/30/2018 | USD | 157,686 | (99) †† | 20 | — | — | — | (79) |
| Total return on JPMorgan Equity Risk Premium - Global Balanced Multi-Factor (Long/Short) US Index† | Fixed rate of -0.150% | Monthly | JPMorgan | 11/30/2018 | USD | 313,435 | (197) †† | 41 | — | — | — | (156) |
| Total return on JPMorgan Equity Risk Premium - Global Balanced Multi-Factor (Long/Short) US Index† | Fixed rate of -0.100% | Monthly | JPMorgan | 11/30/2018 | USD | 4,681,441 | (2,940) †† | 605 | — | — | — | (2,335) |
| Total return on JPMorgan Equity Risk Premium - Global Balanced Multi-Factor (Long/Short) US Index† | Fixed rate of -0.100% | Monthly | JPMorgan | 11/30/2018 | USD | 4,108,493 | (2,580) †† | 35 | — | — | — | (2,545) |
| Total return on JPMorgan Equity Risk Premium - Global Pure Value L/S USD Index 1† | Fixed rate of 0.000% | Monthly | JPMorgan | 11/30/2018 | USD | 155,660 | (3,541) †† | — | — | — | — | (3,541) |
| Total return on JPMorgan Equity Risk Premium - Global Pure Value L/S USD Index 1† | Fixed rate of -0.100% | Monthly | JPMorgan | 11/30/2018 | USD | 3,755,683 | (85,446) †† | 323 | — | — | — | (85,123) |
The accompanying Notes to Consolidated Financial Statements are an integral part of this statement.
Columbia Diversified Absolute Return Fund | Annual Report 2018
| 29 |
Consolidated Portfolio of Investments (continued)
May 31, 2018
| Total return swap contracts (continued) |
| Fund receives | Fund pays | Payment
frequency | Counterparty | Maturity
date | Notional
currency | Notional
amount | Value
($) | Periodic
payments
receivable
(payable)
($) | Upfront
payments | Upfront
receipts | Unrealized
appreciation
($) | Unrealized
depreciation
($) |
| Total return on Morgan Stanley Cube Equity Factors Risk Parity Global Index† | Fixed rate of -0.150% | Monthly | Morgan Stanley | 11/30/2018 | USD | 12,568,203 | 40,437 †† | 1,623 | — | — | 42,060 | — |
| Total return on Morgan Stanley Cube Equity Factors Risk Parity Global Index† | Fixed rate of -0.150% | Monthly | Morgan Stanley | 11/30/2018 | USD | 1,533,540 | 4,934 †† | 198 | — | — | 5,132 | — |
| Total return on Morgan Stanley Cube Equity Factors Risk Parity Global Index† | Fixed rate of -0.150% | Monthly | Morgan Stanley | 11/30/2018 | USD | 502,204 | 1,616 †† | 116 | — | — | 1,732 | — |
| Total return on Morgan Stanley Cube Equity Factors Risk Parity Global Index† | Fixed rate of -0.150% | Monthly | Morgan Stanley | 11/30/2018 | USD | 117,992 | 380 †† | 15 | — | — | 395 | — |
| Total return on Morgan Stanley Cube Equity Factors Risk Parity Global Index† | Fixed rate of -0.150% | Monthly | Morgan Stanley | 11/30/2018 | USD | 84,567 | 272 †† | 11 | — | — | 283 | — |
| Total return on Morgan Stanley Cube Equity Factors Risk Parity Global Index† | Fixed rate of -0.150% | Monthly | Morgan Stanley | 11/30/2018 | USD | 82,913 | 267 †† | 11 | — | — | 278 | — |
| Total return on Morgan Stanley Cube Global Value Index† | Fixed rate of -0.200% | Monthly | Morgan Stanley | 11/30/2018 | USD | 70,952 | (1,132) †† | 12 | — | — | — | (1,120) |
| Total return on Morgan Stanley Cube Global Value Index† | Fixed rate of -0.200% | Monthly | Morgan Stanley | 11/30/2018 | USD | 89,187 | (1,422) †† | 15 | — | — | — | (1,407) |
| Total return on Morgan Stanley Cube Global Value Index† | Fixed rate of -0.200% | Monthly | Morgan Stanley | 11/30/2018 | USD | 120,240 | (1,918) †† | 21 | — | — | — | (1,897) |
| Total return on Morgan Stanley Cube Global Value Index† | Fixed rate of -0.200% | Monthly | Morgan Stanley | 11/30/2018 | USD | 1,933,132 | (30,838) †† | 333 | — | — | — | (30,505) |
| Total | | | | | | | (976,431) | (15,140) | 1,064 | — | 231,914 | (1,224,549) |
| † | By investing in the total return swap contract, the Fund gains exposure to the underlying investments that make up the custom basket/index without having to own the underlying investments directly. The components of the custom basket/index are available on Columbia Diversified Absolute Return Fund’s page of columbiathreadneedleus.com website. |
| †† | Valuation based on significant unobservable inputs. |
The accompanying Notes to Consolidated Financial Statements are an integral part of this statement.
| 30 | Columbia Diversified Absolute Return Fund | Annual Report 2018 |
Consolidated Portfolio of Investments (continued)
May 31, 2018
Notes to Consolidated Portfolio of Investments
| (a) | This security or a portion of this security has been pledged as collateral in connection with investments sold short. |
| (b) | Non-income producing investment. |
| (c) | The rate shown is the seven-day current annualized yield at May 31, 2018. |
| (d) | As defined in the Investment Company Act of 1940, an affiliated company is one in which the Fund owns 5% or more of the company’s outstanding voting securities, or a company which is under common ownership or control with the Fund. Holdings and transactions in these affiliated companies during the year ended May 31, 2018 are as follows: |
| Issuer | Beginning
shares | Shares
purchased | Shares
sold | Ending
shares | Realized gain
(loss) —
affiliated
issuers ($) | Net change in
unrealized
appreciation
(depreciation) —
affiliated
issuers ($) | Dividends —
affiliated
issuers ($) | Value —
affiliated
issuers
at end of
period ($) |
| Columbia Short-Term Cash Fund, 1.907% |
| | 38,686,183 | 81,342,486 | (74,589,253) | 45,439,416 | (1,116) | 975 | 614,627 | 45,439,416 |
Abbreviation Legend
| ADR | American Depositary Receipt |
Currency Legend
| AUD | Australian Dollar |
| CAD | Canada Dollar |
| CHF | Swiss Franc |
| EUR | Euro |
| GBP | British Pound |
| HKD | Hong Kong Dollar |
| JPY | Japanese Yen |
| NOK | Norwegian Krone |
| NZD | New Zealand Dollar |
| SEK | Swedish Krona |
| SGD | Singapore Dollar |
| USD | US Dollar |
Fair value measurements
The Fund categorizes its fair value measurements according to a three-level hierarchy that maximizes the use of observable inputs and minimizes the use of unobservable inputs by prioritizing that the most observable input be used when available. Observable inputs are those that market participants would use in pricing an investment based on market data obtained from sources independent of the reporting entity. Unobservable inputs are those that reflect the Fund’s assumptions about the information market participants would use in pricing an investment. An investment’s level within the fair value hierarchy is based on the lowest level of any input that is deemed significant to the asset’s or liability’s fair value measurement. The input levels are not necessarily an indication of the risk or liquidity associated with investments at that level. For example, certain U.S. government securities are generally high quality and liquid, however, they are reflected as Level 2 because the inputs used to determine fair value may not always be quoted prices in an active market.
Fair value inputs are summarized in the three broad levels listed below:
| ■ | Level 1 — Valuations based on quoted prices for investments in active markets that the Fund has the ability to access at the measurement date. Valuation adjustments are not applied to Level 1 investments. |
| ■ | Level 2 — Valuations based on other significant observable inputs (including quoted prices for similar securities, interest rates, prepayment speeds, credit risks, etc.). |
| ■ | Level 3 — Valuations based on significant unobservable inputs (including the Fund’s own assumptions and judgment in determining the fair value of investments). |
Inputs that are used in determining fair value of an investment may include price information, credit data, volatility statistics, and other factors. These inputs can be either observable or unobservable. The availability of observable inputs can vary between investments, and is affected by various factors such as the type of investment, and the volume and level of activity for that investment or similar investments in the marketplace. The inputs will be considered by the Investment Manager, along with any other relevant factors in the calculation of an investment’s fair value. The Fund uses prices and inputs that are current as of the measurement date, which may include periods of market dislocations. During these periods, the availability of prices and inputs may be reduced for many investments. This condition could cause an investment to be reclassified between the various levels within the hierarchy.
Certain investments that have been measured at fair value using the net asset value (NAV) per share (or its equivalent) are not categorized in the fair value hierarchy. The fair value amounts presented in the table are intended to reconcile the fair value hierarchy to the amounts presented in the Consolidated Portfolio of Investments. The Columbia Short-Term Cash Fund seeks to provide shareholders with maximum current income consistent with liquidity and stability of principal. Columbia Short-Term Cash Fund prices its shares with a floating NAV and no longer seeks to maintain a stable NAV.
The accompanying Notes to Consolidated Financial Statements are an integral part of this statement.
Columbia Diversified Absolute Return Fund | Annual Report 2018
| 31 |
Consolidated Portfolio of Investments (continued)
May 31, 2018
Fair value measurements (continued)
Investments falling into the Level 3 category are primarily supported by quoted prices from brokers and dealers participating in the market for those investments. However, these may be classified as Level 3 investments due to lack of market transparency and corroboration to support these quoted prices. Additionally, valuation models may be used as the pricing source for any remaining investments classified as Level 3. These models may rely on one or more significant unobservable inputs and/or significant assumptions by the Investment Manager. Inputs used in valuations may include, but are not limited to, financial statement analysis, capital account balances, discount rates and estimated cash flows, and comparable company data.
Under the direction of the Fund’s Board of Trustees (the Board), the Investment Manager’s Valuation Committee (the Committee) is responsible for overseeing the valuation procedures approved by the Board. The Committee consists of voting and non-voting members from various groups within the Investment Manager’s organization, including operations and accounting, trading and investments, compliance, risk management and legal.
The Committee meets at least monthly to review and approve valuation matters, which may include a description of specific valuation determinations, data regarding pricing information received from approved pricing vendors and brokers and the results of Board-approved valuation control policies and procedures (the Policies). The Policies address, among other things, instances when market quotations are or are not readily available, including recommendations of third party pricing vendors and a determination of appropriate pricing methodologies; events that require specific valuation determinations and assessment of fair value techniques; securities with a potential for stale pricing, including those that are illiquid, restricted, or in default; and the effectiveness of third party pricing vendors, including periodic reviews of vendors. The Committee meets more frequently, as needed, to discuss additional valuation matters, which may include the need to review back-testing results, review time-sensitive information or approve related valuation actions. The Committee reports to the Board, with members of the Committee meeting with the Board at each of its regularly scheduled meetings to discuss valuation matters and actions during the period, similar to those described earlier.
For investments categorized as Level 3, the Committee monitors information similar to that described above, which may include: (i) data specific to the issuer or comparable issuers, (ii) general market or specific sector news and (iii) quoted prices and specific or similar security transactions. The Committee considers this data and any changes from prior periods in order to assess the reasonableness of observable and unobservable inputs, any assumptions or internal models used to value those securities and changes in fair value. This data is also used to corroborate, when available, information received from approved pricing vendors and brokers. Various factors impact the frequency of monitoring this information (which may occur as often as daily). However, the Committee may determine that changes to inputs, assumptions and models are not required as a result of the monitoring procedures performed.
The following table is a summary of the inputs used to value the Fund’s investments at May 31, 2018:
| | Level 1
quoted prices
in active
markets for
identical
assets ($) | Level 2
other
significant
observable
inputs ($) | Level 3
significant
unobservable
inputs ($) | Investments
measured at
net asset
value ($) | Total ($) |
| Investments in Securities | | | | | |
| Common Stocks | | | | | |
| Consumer Discretionary | 5,425,945 | — | — | — | 5,425,945 |
| Consumer Staples | 2,074,948 | — | — | — | 2,074,948 |
| Energy | 2,767,703 | — | — | — | 2,767,703 |
| Financials | 5,258,528 | — | — | — | 5,258,528 |
| Health Care | 3,919,819 | — | — | — | 3,919,819 |
| Industrials | 5,477,057 | — | — | — | 5,477,057 |
| Information Technology | 5,488,566 | — | — | — | 5,488,566 |
| Materials | 1,718,127 | — | — | — | 1,718,127 |
| Real Estate | 1,782,892 | — | — | — | 1,782,892 |
| Telecommunication Services | 444,535 | — | — | — | 444,535 |
| Utilities | 1,380,741 | — | — | — | 1,380,741 |
| Total Common Stocks | 35,738,861 | — | — | — | 35,738,861 |
| Convertible Bonds | — | 165,836 | — | — | 165,836 |
| Exchange-Traded Funds | 12,623,136 | — | — | — | 12,623,136 |
| Money Market Funds | — | — | — | 45,439,416 | 45,439,416 |
| Total Investments in Securities | 48,361,997 | 165,836 | — | 45,439,416 | 93,967,249 |
| Investments in Securities Sold Short | | | | | |
| Common Stocks | | | | | |
| Consumer Discretionary | (5,708,807) | — | — | — | (5,708,807) |
| Consumer Staples | (2,048,163) | — | — | — | (2,048,163) |
| Energy | (2,856,926) | — | — | — | (2,856,926) |
| Financials | (5,401,932) | — | — | — | (5,401,932) |
| Health Care | (3,959,009) | — | — | — | (3,959,009) |
| Industrials | (5,620,422) | — | — | — | (5,620,422) |
| Information Technology | (5,289,318) | — | — | — | (5,289,318) |
| Materials | (1,755,901) | — | — | — | (1,755,901) |
| Real Estate | (1,741,370) | — | — | — | (1,741,370) |
The accompanying Notes to Consolidated Financial Statements are an integral part of this statement.
| 32 | Columbia Diversified Absolute Return Fund | Annual Report 2018 |
Consolidated Portfolio of Investments (continued)
May 31, 2018
Fair value measurements (continued)
| | Level 1
quoted prices
in active
markets for
identical
assets ($) | Level 2
other
significant
observable
inputs ($) | Level 3
significant
unobservable
inputs ($) | Investments
measured at
net asset
value ($) | Total ($) |
| Telecommunication Services | (459,909) | — | — | — | (459,909) |
| Utilities | (1,262,076) | — | — | — | (1,262,076) |
| Total Common Stocks | (36,103,833) | — | — | — | (36,103,833) |
| Total Investments in Securities Sold Short | (36,103,833) | — | — | — | (36,103,833) |
| Total Investments in Securities, Net of Securities Sold Short | 12,258,164 | 165,836 | — | 45,439,416 | 57,863,416 |
| Investments in Derivatives | | | | | |
| Asset | | | | | |
| Forward Foreign Currency Exchange Contracts | — | 441,124 | — | — | 441,124 |
| Futures Contracts | 872,994 | — | — | — | 872,994 |
| Swap Contracts | — | 603,364 | 231,914 | — | 835,278 |
| Liability | | | | | |
| Forward Foreign Currency Exchange Contracts | — | (360,466) | — | — | (360,466) |
| Futures Contracts | (533,113) | — | — | — | (533,113) |
| Swap Contracts | — | (152,755) | (1,224,549) | — | (1,377,304) |
| Total | 12,598,045 | 697,103 | (992,635) | 45,439,416 | 57,741,929 |
See the Consolidated Portfolio of Investments for all investment classifications not indicated in the table.
The Fund’s assets assigned to the Level 2 input category are generally valued using the market approach, in which a security’s value is determined through reference to prices and information from market transactions for similar or identical assets.
Derivative instruments are valued at unrealized appreciation (depreciation).
There were no transfers of financial assets between levels during the period.
The following table is a reconciliation of Level 3 assets for which significant observable and unobservable inputs were used to determine fair value:
| Investments in securities | Balance
as of
05/31/2017
($) | Increase
(decrease)
in accrued
discounts/
premiums
($) | Realized
gain (loss)(a)
($) | Change
in unrealized
appreciation
(depreciation)(b)
($) | Purchases
($) | Sales
($) | Transfers
into
Level 3
($) | Transfers
out of
Level 3
($) | Balance
as of
05/31/2018
($) |
| Total Return Swap Contracts | — | — | — | (992,635) | — | — | — | — | (992,635) |
Derivative instruments are valued at unrealized appreciation (depreciation).
(a) The realized gain (loss) earned during the period was $(134,848).
(b) Change in unrealized appreciation (depreciation) relating to securities held at May 31, 2018 was $(992,635).
The Fund’s assets assigned to the Level 3 category are valued utilizing the valuation technique deemed the most appropriate in the circumstances. Certain swaps classified as Level 3 securities are valued using the market approach and utilize single market quotations from broker dealers. The appropriateness of fair values for these securities is monitored on an ongoing basis which may include results of back testing and other control procedures. Significant increases (decreases) to any of these inputs would result in a significantly lower (higher) fair value measurement.
The accompanying Notes to Consolidated Financial Statements are an integral part of this statement.
Columbia Diversified Absolute Return Fund | Annual Report 2018
| 33 |
Consolidated Statement of Assets and Liabilities
May 31, 2018
| Assets | |
| Investments in securities, at value | |
| Unaffiliated issuers (cost $47,000,297) | $48,527,833 |
| Affiliated issuers (cost $45,438,415) | 45,439,416 |
| Cash | 2,429 |
| Foreign currency (cost $13) | 13 |
| Cash collateral held at broker for: | |
| Swap contracts | 670,000 |
| Securities sold short | 16,077,627 |
| Margin deposits on: | |
| Futures contracts | 1,734,437 |
| Swap contracts | 515,433 |
| Unrealized appreciation on forward foreign currency exchange contracts | 441,124 |
| Unrealized appreciation on swap contracts | 231,914 |
| Upfront payments on swap contracts | 1,064 |
| Receivable for: | |
| Investments sold | 629,279 |
| Capital shares sold | 1,409 |
| Dividends | 139,338 |
| Interest | 1,841 |
| Foreign tax reclaims | 166 |
| Variation margin for futures contracts | 119,209 |
| Variation margin for swap contracts | 42,296 |
| Expense reimbursement due from Investment Manager | 941 |
| Prepaid expenses | 53 |
| Trustees’ deferred compensation plan | 14,804 |
| Total assets | 114,590,626 |
| Liabilities | |
| Securities sold short, at value (proceeds $34,933,068) | 36,103,833 |
| Unrealized depreciation on forward foreign currency exchange contracts | 360,466 |
| Unrealized depreciation on swap contracts | 1,250,192 |
| Upfront receipts on swap contracts | 36,485 |
| Payable for: | |
| Investments purchased | 688,614 |
| Capital shares purchased | 33,975 |
| Dividends and interest on securities sold short | 90,299 |
| Variation margin for futures contracts | 81,749 |
| Variation margin for swap contracts | 30,434 |
| Management services fees | 2,458 |
| Distribution and/or service fees | 3 |
| Transfer agent fees | 237 |
| Compensation of board members | 1,143 |
| Compensation of chief compliance officer | 5 |
| Other expenses | 93,333 |
| Trustees’ deferred compensation plan | 14,804 |
| Total liabilities | 38,788,030 |
| Net assets applicable to outstanding capital stock | $75,802,596 |
The accompanying Notes to Consolidated Financial Statements are an integral part of this statement.
| 34 | Columbia Diversified Absolute Return Fund | Annual Report 2018 |
Consolidated Statement of Assets and Liabilities (continued)
May 31, 2018
| Represented by | |
| Paid in capital | $80,217,822 |
| Excess of distributions over net investment income | (174,376) |
| Accumulated net realized loss | (4,441,978) |
| Unrealized appreciation (depreciation) on: | |
| Investments - unaffiliated issuers | 1,527,536 |
| Investments - affiliated issuers | 1,001 |
| Foreign currency translations | (35,157) |
| Forward foreign currency exchange contracts | 80,658 |
| Futures contracts | 339,881 |
| Securities sold short | (1,170,765) |
| Swap contracts | (542,026) |
| Total - representing net assets applicable to outstanding capital stock | $75,802,596 |
| Class A | |
| Net assets | $365,945 |
| Shares outstanding | 39,236 |
| Net asset value per share | $9.33 |
| Maximum sales charge | 5.75% |
| Maximum offering price per share (calculated by dividing the net asset value per share by 1.0 minus the maximum sales charge for Class A shares) | $9.90 |
| Advisor Class | |
| Net assets | $9,396 |
| Shares outstanding | 1,000 |
| Net asset value per share | $9.40 |
| Class C | |
| Net assets | $17,891 |
| Shares outstanding | 1,962 |
| Net asset value per share | $9.12 |
| Institutional Class | |
| Net assets | $586,363 |
| Shares outstanding | 62,071 |
| Net asset value per share | $9.45 |
| Institutional 2 Class | |
| Net assets | $9,438 |
| Shares outstanding | 1,000 |
| Net asset value per share | $9.44 |
| Institutional 3 Class | |
| Net assets | $74,747,419 |
| Shares outstanding | 7,934,620 |
| Net asset value per share | $9.42 |
| Class T | |
| Net assets | $66,144 |
| Shares outstanding | 6,957 |
| Net asset value per share | $9.51 |
| Maximum sales charge | 2.50% |
| Maximum offering price per share (calculated by dividing the net asset value per share by 1.0 minus the maximum sales charge per transaction for Class T shares) | $9.75 |
The accompanying Notes to Consolidated Financial Statements are an integral part of this statement.
Columbia Diversified Absolute Return Fund | Annual Report 2018
| 35 |
Consolidated Statement of Operations
Year Ended May 31, 2018
| Net investment income | |
| Income: | |
| Dividends — unaffiliated issuers | $860,463 |
| Dividends — affiliated issuers | 614,627 |
| Interest | 168,355 |
| Foreign taxes withheld | (10,518) |
| Total income | 1,632,927 |
| Expenses: | |
| Management services fees | 925,178 |
| Distribution and/or service fees | |
| Class A | 570 |
| Class C | 161 |
| Class T | 207 |
| Transfer agent fees | |
| Class A | 271 |
| Advisor Class | 12 |
| Class C | 19 |
| Institutional Class | 711 |
| Institutional 2 Class | 7 |
| Institutional 3 Class | 6,678 |
| Class T | 108 |
| Compensation of board members | 17,499 |
| Custodian fees | 98,156 |
| Printing and postage fees | 11,395 |
| Registration fees | 104,256 |
| Audit fees | 65,625 |
| Legal fees | 1,783 |
| Dividends and interest on securities sold short | 984,223 |
| Compensation of chief compliance officer | 31 |
| Other | 30,930 |
| Total expenses | 2,247,820 |
| Fees waived or expenses reimbursed by Investment Manager and its affiliates | (309,970) |
| Total net expenses | 1,937,850 |
| Net investment loss | (304,923) |
| Realized and unrealized gain (loss) — net | |
| Net realized gain (loss) on: | |
| Investments — unaffiliated issuers | 4,593,587 |
| Investments — affiliated issuers | (1,116) |
| Foreign currency translations | 61,371 |
| Forward foreign currency exchange contracts | (69,834) |
| Futures contracts | 450,993 |
| Securities sold short | (4,084,377) |
| Swap contracts | (134,848) |
| Net realized gain | 815,776 |
| Net change in unrealized appreciation (depreciation) on: | |
| Investments — unaffiliated issuers | (1,522,094) |
| Investments — affiliated issuers | 975 |
| Foreign currency translations | (53,917) |
| Forward foreign currency exchange contracts | 42,342 |
| Futures contracts | 130,524 |
| Securities sold short | (105,721) |
| Swap contracts | (534,859) |
| Foreign capital gains tax | 2,486 |
| Net change in unrealized appreciation (depreciation) | (2,040,264) |
| Net realized and unrealized loss | (1,224,488) |
| Net decrease in net assets resulting from operations | $(1,529,411) |
The accompanying Notes to Consolidated Financial Statements are an integral part of this statement.
| 36 | Columbia Diversified Absolute Return Fund | Annual Report 2018 |
Consolidated Statement of Changes in Net Assets
| | Year Ended
May 31, 2018 | Year Ended
May 31, 2017 |
| Operations | | |
| Net investment loss | $(304,923) | $(404,135) |
| Net realized gain (loss) | 815,776 | (2,503,106) |
| Net change in unrealized appreciation (depreciation) | (2,040,264) | 2,307,889 |
| Net decrease in net assets resulting from operations | (1,529,411) | (599,352) |
| Decrease in net assets from capital stock activity | (1,822,709) | (74,626,837) |
| Total decrease in net assets | (3,352,120) | (75,226,189) |
| Net assets at beginning of year | 79,154,716 | 154,380,905 |
| Net assets at end of year | $75,802,596 | $79,154,716 |
| Excess of distributions over net investment income | $(174,376) | $(974,061) |
The accompanying Notes to Consolidated Financial Statements are an integral part of this statement.
Columbia Diversified Absolute Return Fund | Annual Report 2018
| 37 |
Consolidated Statement of Changes in Net Assets (continued)
| | Year Ended | Year Ended |
| | May 31, 2018 | May 31, 2017 (a) |
| | Shares | Dollars ($) | Shares | Dollars ($) |
| Capital stock activity |
| Class A | | | | |
| Subscriptions | 35,881 | 340,362 | 11,047 | 105,354 |
| Redemptions | (4,720) | (44,389) | (24,670) | (231,892) |
| Net increase (decrease) | 31,161 | 295,973 | (13,623) | (126,538) |
| Class C | | | | |
| Subscriptions | 536 | 5,000 | 1,472 | 13,776 |
| Redemptions | — | — | (1,046) | (9,611) |
| Net increase | 536 | 5,000 | 426 | 4,165 |
| Class I | | | | |
| Subscriptions | — | — | 207,955 | 1,987,019 |
| Redemptions | — | — | (11,773,004) | (112,389,158) |
| Net decrease | — | — | (11,565,049) | (110,402,139) |
| Institutional Class | | | | |
| Subscriptions | 20,654 | 198,959 | 24,757 | 234,528 |
| Redemptions | (5,219) | (50,161) | (54,722) | (515,680) |
| Net increase (decrease) | 15,435 | 148,798 | (29,965) | (281,152) |
| Institutional 3 Class | | | | |
| Subscriptions | 277,342 | 2,661,540 | 8,327,304 | 79,277,140 |
| Redemptions | (511,969) | (4,891,806) | (158,057) | (1,514,846) |
| Net increase (decrease) | (234,627) | (2,230,266) | 8,169,247 | 77,762,294 |
| Class T | | | | |
| Subscriptions | — | — | 97,080 | 930,095 |
| Redemptions | (4,359) | (42,214) | (4,431,332) | (42,513,562) |
| Net decrease | (4,359) | (42,214) | (4,334,252) | (41,583,467) |
| Total net decrease | (191,854) | (1,822,709) | (7,773,216) | (74,626,837) |
| (a) | Institutional 3 Class shares are based on operations from March 1, 2017 (commencement of operations) through the stated period end. |
The accompanying Notes to Consolidated Financial Statements are an integral part of this statement.
| 38 | Columbia Diversified Absolute Return Fund | Annual Report 2018 |
[THIS PAGE INTENTIONALLY LEFT BLANK]
Columbia Diversified Absolute Return Fund | Annual Report 2018
| 39 |
Consolidated Financial Highlights
The following table is intended to help you understand the Fund’s financial performance. Certain information reflects financial results for a single share of a class held for the periods shown. Per share net investment income (loss) amounts are calculated based on average shares outstanding during the period. Total return assumes reinvestment of all dividends and distributions, if any. Total return does not reflect payment of sales charges, if any. Total return and portfolio turnover are not annualized for periods of less than one year. The portfolio turnover rate is calculated without regard to purchase and sales transactions of short-term instruments and certain derivatives, if any. If such transactions were included, the Fund’s portfolio turnover rate may be higher.
| | Net asset value,
beginning of
period | Net
investment
income
(loss) | Net
realized
and
unrealized
gain (loss) | Total from
investment
operations | Distributions
from net
investment
income | Distributions
from net
realized
gains | Total
distributions to
shareholders |
| Class A |
| Year Ended 5/31/2018 | $9.55 | (0.08) | (0.14) | (0.22) | — | — | — |
| Year Ended 5/31/2017 | $9.61 | (0.08) | 0.02 (d) | (0.06) | — | — | — |
| Year Ended 5/31/2016 | $10.10 | (0.13) | (0.27) | (0.40) | (0.03) | (0.06) | (0.09) |
| Year Ended 5/31/2015(e) | $10.00 | (0.03) | 0.13 | 0.10 | — | — | — |
| Advisor Class |
| Year Ended 5/31/2018 | $9.59 | (0.05) | (0.14) | (0.19) | — | — | — |
| Year Ended 5/31/2017 | $9.64 | (0.06) | 0.01 (d) | (0.05) | — | — | — |
| Year Ended 5/31/2016 | $10.11 | (0.09) | (0.28) | (0.37) | (0.04) | (0.06) | (0.10) |
| Year Ended 5/31/2015(e) | $10.00 | (0.02) | 0.13 | 0.11 | — | — | — |
| Class C |
| Year Ended 5/31/2018 | $9.41 | (0.14) | (0.15) | (0.29) | — | — | — |
| Year Ended 5/31/2017 | $9.54 | (0.15) | 0.02 (d) | (0.13) | — | — | — |
| Year Ended 5/31/2016 | $10.08 | (0.19) | (0.28) | (0.47) | (0.01) | (0.06) | (0.07) |
| Year Ended 5/31/2015(e) | $10.00 | (0.05) | 0.13 | 0.08 | — | — | — |
| Institutional Class |
| Year Ended 5/31/2018 | $9.65 | (0.05) | (0.15) | (0.20) | — | — | — |
| Year Ended 5/31/2017 | $9.64 | (0.02) | 0.03 (d) | 0.01 | — | — | — |
| Year Ended 5/31/2016 | $10.11 | (0.10) | (0.27) | (0.37) | (0.04) | (0.06) | (0.10) |
| Year Ended 5/31/2015(e) | $10.00 | (0.02) | 0.13 | 0.11 | — | — | — |
| Institutional 2 Class |
| Year Ended 5/31/2018 | $9.63 | (0.04) | (0.15) | (0.19) | — | — | — |
| Year Ended 5/31/2017 | $9.65 | (0.04) | 0.02 (d) | (0.02) | — | — | — |
| Year Ended 5/31/2016 | $10.11 | (0.09) | (0.27) | (0.36) | (0.04) | (0.06) | (0.10) |
| Year Ended 5/31/2015(e) | $10.00 | (0.02) | 0.13 | 0.11 | — | — | — |
| Institutional 3 Class |
| Year Ended 5/31/2018 | $9.61 | (0.04) | (0.15) | (0.19) | — | — | — |
| Year Ended 5/31/2017(g) | $9.58 | (0.01) | 0.04 (d) | 0.03 | — | — | — |
The accompanying Notes to Consolidated Financial Statements are an integral part of this statement.
| 40 | Columbia Diversified Absolute Return Fund | Annual Report 2018 |
Consolidated Financial Highlights (continued)
| | Net
asset
value,
end of
period | Total
return | Total gross
expense
ratio to
average
net assets(a) | Total net
expense
ratio to
average
net assets(a),(b) | Net investment
income (loss)
ratio to
average
net assets | Portfolio
turnover | Net
assets,
end of
period
(000’s) |
| Class A |
| Year Ended 5/31/2018 | $9.33 | (2.30%) | 3.23% (c) | 2.82% (c) | (0.72%) | 186% | $366 |
| Year Ended 5/31/2017 | $9.55 | (0.62%) | 3.15% (c) | 2.31% (c) | (0.84%) | 135% | $77 |
| Year Ended 5/31/2016 | $9.61 | (3.96%) | 3.03% (c) | 2.22% (c) | (1.31%) | 196% | $209 |
| Year Ended 5/31/2015(e) | $10.10 | 1.00% | 2.11% (c),(f) | 1.99% (c),(f) | (1.04%) (f) | 60% | $11 |
| Advisor Class |
| Year Ended 5/31/2018 | $9.40 | (1.98%) | 2.97% (c) | 2.59% (c) | (0.50%) | 186% | $9 |
| Year Ended 5/31/2017 | $9.59 | (0.52%) | 2.88% (c) | 2.03% (c) | (0.59%) | 135% | $10 |
| Year Ended 5/31/2016 | $9.64 | (3.69%) | 2.77% (c) | 1.97% (c) | (0.99%) | 196% | $10 |
| Year Ended 5/31/2015(e) | $10.11 | 1.10% | 1.89% (c),(f) | 1.74% (c),(f) | (0.79%) (f) | 60% | $10 |
| Class C |
| Year Ended 5/31/2018 | $9.12 | (3.08%) | 4.01% (c) | 3.62% (c) | (1.54%) | 186% | $18 |
| Year Ended 5/31/2017 | $9.41 | (1.36%) | 3.89% (c) | 3.05% (c) | (1.62%) | 135% | $13 |
| Year Ended 5/31/2016 | $9.54 | (4.68%) | 3.78% (c) | 2.97% (c) | (2.00%) | 196% | $10 |
| Year Ended 5/31/2015(e) | $10.08 | 0.80% | 2.89% (c),(f) | 2.75% (c),(f) | (1.80%) (f) | 60% | $10 |
| Institutional Class |
| Year Ended 5/31/2018 | $9.45 | (2.07%) | 3.00% (c) | 2.61% (c) | (0.52%) | 186% | $586 |
| Year Ended 5/31/2017 | $9.65 | 0.10% | 2.90% (c) | 2.05% (c) | (0.54%) | 135% | $450 |
| Year Ended 5/31/2016 | $9.64 | (3.69%) | 2.77% (c) | 1.97% (c) | (0.99%) | 196% | $738 |
| Year Ended 5/31/2015(e) | $10.11 | 1.10% | 1.91% (c),(f) | 1.75% (c),(f) | (0.74%) (f) | 60% | $772 |
| Institutional 2 Class |
| Year Ended 5/31/2018 | $9.44 | (1.97%) | 2.91% (c) | 2.52% (c) | (0.44%) | 186% | $9 |
| Year Ended 5/31/2017 | $9.63 | (0.21%) | 2.20% (c) | 1.89% (c) | (0.46%) | 135% | $10 |
| Year Ended 5/31/2016 | $9.65 | (3.59%) | 2.02% (c) | 1.85% (c) | (0.88%) | 196% | $10 |
| Year Ended 5/31/2015(e) | $10.11 | 1.10% | 1.89% (c),(f) | 1.74% (c),(f) | (0.80%) (f) | 60% | $10 |
| Institutional 3 Class |
| Year Ended 5/31/2018 | $9.42 | (1.98%) | 2.86% (c) | 2.47% (c) | (0.39%) | 186% | $74,747 |
| Year Ended 5/31/2017(g) | $9.61 | 0.31% | 2.29% (c),(f) | 1.74% (c),(f) | (0.30%) (f) | 135% | $78,485 |
The accompanying Notes to Consolidated Financial Statements are an integral part of this statement.
Columbia Diversified Absolute Return Fund | Annual Report 2018
| 41 |
Consolidated Financial Highlights (continued)
| | Net asset value,
beginning of
period | Net
investment
income
(loss) | Net
realized
and
unrealized
gain (loss) | Total from
investment
operations | Distributions
from net
investment
income | Distributions
from net
realized
gains | Total
distributions to
shareholders |
| Class T |
| Year Ended 5/31/2018 | $9.73 | (0.07) | (0.15) | (0.22) | — | — | — |
| Year Ended 5/31/2017 | $9.62 | (0.05) | 0.16 (d) | 0.11 | — | — | — |
| Year Ended 5/31/2016 | $10.10 | (0.13) | (0.26) | (0.39) | (0.03) | (0.06) | (0.09) |
| Year Ended 5/31/2015(e) | $10.00 | (0.03) | 0.13 | 0.10 | — | — | — |
| Notes to Consolidated Financial Highlights |
| (a) | In addition to the fees and expenses that the Fund bears directly, the Fund indirectly bears a pro rata share of the fees and expenses of any other funds in which it invests. Such indirect expenses are not included in the Fund’s reported expense ratios. |
| (b) | Total net expenses include the impact of certain fee waivers/expense reimbursements made by the Investment Manager and certain of its affiliates, if applicable. |
| (c) | Ratios include dividends and interest on securities sold short. If dividends and interest on securities sold short had been excluded, expenses would have been lower by: |
| Class | 5/31/2018 | 5/31/2017 | 5/31/2016 | 5/31/2015 |
| Class A | 1.35% | 0.67% | 0.53% | 0.41% |
| Advisor Class | 1.26% | 0.64% | 0.50% | 0.42% |
| Class C | 1.29% | 0.66% | 0.50% | 0.42% |
| Institutional Class | 1.27% | 0.66% | 0.50% | 0.44% |
| Institutional 2 Class | 1.26% | 0.64% | 0.50% | 0.42% |
| Institutional 3 Class | 1.25% | 0.57% | —% | —% |
| Class T | 1.21% | 0.66% | 0.60% | 0.42% |
| (d) | Calculation of the net gain (loss) per share (both realized and unrealized) does not correlate to the aggregate realized and unrealized gain (loss) presented in the Consolidated Statement of Operations due to the timing of subscriptions and redemptions of Fund shares in relation to fluctuations in the market value of the portfolio. |
| (e) | The Fund commenced operations on February 19, 2015. Per share data and total return reflect activity from that date. |
| (f) | Annualized. |
| (g) | Institutional 3 Class shares commenced operations on March 1, 2017. Per share data and total return reflect activity from that date. |
The accompanying Notes to Consolidated Financial Statements are an integral part of this statement.
| 42 | Columbia Diversified Absolute Return Fund | Annual Report 2018 |
Consolidated Financial Highlights (continued)
| | Net
asset
value,
end of
period | Total
return | Total gross
expense
ratio to
average
net assets(a) | Total net
expense
ratio to
average
net assets(a),(b) | Net investment
income (loss)
ratio to
average
net assets | Portfolio
turnover | Net
assets,
end of
period
(000’s) |
| Class T |
| Year Ended 5/31/2018 | $9.51 | (2.26%) | 3.23% (c) | 2.82% (c) | (0.74%) | 186% | $66 |
| Year Ended 5/31/2017 | $9.73 | 1.14% | 3.15% (c) | 2.31% (c) | (0.51%) | 135% | $110 |
| Year Ended 5/31/2016 | $9.62 | (3.87%) | 3.03% (c) | 2.22% (c) | (1.24%) | 196% | $41,796 |
| Year Ended 5/31/2015(e) | $10.10 | 1.00% | 2.14% (c),(f) | 2.00% (c),(f) | (1.05%) (f) | 60% | $10 |
The accompanying Notes to Consolidated Financial Statements are an integral part of this statement.
Columbia Diversified Absolute Return Fund | Annual Report 2018
| 43 |
Notes to Consolidated Financial Statements
May 31, 2018
Note 1. Organization
Columbia Diversified Absolute Return Fund (the Fund), a series of Columbia Funds Series Trust I (the Trust), is a diversified fund. The Trust is registered under the Investment Company Act of 1940, as amended (the 1940 Act), as an open-end management investment company organized as a Massachusetts business trust.
Basis for consolidation
CDARF1 Offshore Fund, Ltd., CDARF2 Offshore Fund, Ltd. and CDARF3 Offshore Fund, Ltd. (each, a Subsidiary) are each a Cayman Islands exempted company and wholly-owned subsidiary of the Fund. Each Subsidiary acts as an investment vehicle in order to effect certain investment strategies consistent with the Fund’s investment objective and policies as stated in its current prospectus and statement of additional information. In accordance with the Memorandum and Articles of Association of the Subsidiary (the Articles), the Fund owns the sole issued share of each Subsidiary and retains all rights associated with such share, including the right to receive notice of, attend and vote at general meetings of the Subsidiaries, rights in a winding-up or repayment of capital and the right to participate in the profits or assets of the Subsidiaries. The consolidated financial statements (financial statements) include the accounts of the consolidated Fund and each respective Subsidiary. Subsequent references to the Fund within the Notes to Consolidated Financial Statements collectively refer to the Fund and each Subsidiary. All intercompany transactions and balances have been eliminated in the consolidation process.
At May 31, 2018, each Subsidiary’s financial statement information is as follows:
| | CDARF1 Offshore Fund, Ltd. | CDARF2 Offshore Fund, Ltd. | CDARF3 Offshore Fund, Ltd. |
| % of consolidated fund net assets | 0.06% | 6.01% | 3.77% |
| Net assets | $43,827 | $4,562,845 | $2,858,814 |
| Net investment income (loss) | (2,691) | (33,946) | 967 |
| Net realized gain (loss) | — | 20,925 | (498,157) |
| Net change in unrealized appreciation (depreciation) | — | 353,332 | 133,799 |
The financial statements present the portfolio holdings, financial position and results of operations of the Fund and the Subsidiaries on a consolidated basis.
Fund shares
The Trust may issue an unlimited number of shares (without par value). Although all share classes generally have identical voting, dividend and liquidation rights, each share class votes separately when required by the Trust’s organizational documents or by law. Different share classes pay different distribution amounts to the extent the expenses of such share classes differ, and distributions in liquidation will be proportional to the net asset value of each share class. Each share class has its own expense and sales charge structure. The Fund offers each of the share classes identified below.
Class A shares are subject to a maximum front-end sales charge of 5.75% based on the initial investment amount. Class A shares purchased without an initial sales charge in accounts aggregating $1 million to $50 million at the time of purchase are subject to a contingent deferred sales charge (CDSC) if the shares are sold within 18 months after purchase, charged as follows: 1.00% CDSC if redeemed within 12 months after purchase, and 0.50% CDSC if redeemed more than 12, but less than 18, months after purchase.
Advisor Class shares are not subject to sales charges and are generally available only to omnibus retirement plans and certain investors as described in the Fund’s prospectus. Prior to November 1, 2017, Advisor Class shares were known as Class R4 shares.
Class C shares are subject to a 1.00% CDSC on shares redeemed within 12 months after purchase.
Institutional Class shares are not subject to sales charges and are generally available only to eligible investors, which are subject to different investment minimums as described in the Fund’s prospectus. Prior to November 1, 2017, Institutional Class shares were known as Class Z shares.
| 44 | Columbia Diversified Absolute Return Fund | Annual Report 2018 |
Notes to Consolidated Financial Statements (continued)
May 31, 2018
Institutional 2 Class shares are not subject to sales charges and are generally available only to investors purchasing through authorized investment professionals and omnibus retirement plans as described in the Fund’s prospectus. Prior to November 1, 2017, Institutional 2 Class shares were known as Class R5 shares.
Institutional 3 Class shares are not subject to sales charges and are available to institutional and certain other investors as described in the Fund’s prospectus. Prior to November 1, 2017, Institutional 3 Class shares were known as Class Y shares.
Class T shares are subject to a maximum front-end sales charge of 2.50% per transaction and must be purchased through financial intermediaries that, by written agreement with Columbia Management Investment Distributors, Inc., are specifically authorized to sell Class T shares.
Note 2. Summary of significant accounting policies
Basis of preparation
The Fund is an investment company that applies the accounting and reporting guidance in the Financial Accounting Standards Board (FASB) Accounting Standards Codification Topic 946, Financial Services - Investment Companies (ASC 946). The financial statements are prepared in accordance with U.S. generally accepted accounting principles (GAAP), which requires management to make certain estimates and assumptions that affect the reported amounts of assets and liabilities, the disclosure of contingent assets and liabilities at the date of the financial statements and the reported amounts of income and expenses during the reporting period. Actual results could differ from those estimates.
The following is a summary of significant accounting policies followed by the Fund in the preparation of its financial statements.
Security valuation
All equity securities and exchange-traded funds are valued at the close of business of the New York Stock Exchange. Equity securities and exchange-traded funds are valued at the last quoted sales price on the principal exchange or market on which they trade, except for securities traded on the NASDAQ Stock Market, which are valued at the NASDAQ official close price. Unlisted securities or listed securities for which there were no sales during the day are valued at the mean of the latest quoted bid and ask prices on such exchanges or markets.
Debt securities generally are valued by pricing services approved by the Board of Trustees based upon market transactions for normal, institutional-size trading units of similar securities. The services may use various pricing techniques that take into account, as applicable, factors such as yield, quality, coupon rate, maturity, type of issue, trading characteristics and other data, as well as approved independent broker-dealer quotes. Debt securities for which quotations are not readily available or not believed to be reflective of market value may also be valued based upon a bid quote from an approved independent broker-dealer. Debt securities maturing in 60 days or less are valued primarily at amortized cost value, unless this method results in a valuation that management believes does not approximate market value.
Foreign equity securities are valued based on the closing price on the foreign exchange in which such securities are primarily traded. If any foreign equity security closing prices are not readily available, the securities are valued at the mean of the latest quoted bid and ask prices on such exchanges or markets. Foreign currency exchange rates are generally determined at 4:00 p.m. Eastern (U.S.) time. Many securities markets and exchanges outside the U.S. close prior to the close of the New York Stock Exchange; therefore, the closing prices for securities in such markets or on such exchanges may not fully reflect events that occur after such close but before the close of the New York Stock Exchange. In those situations, foreign securities will be fair valued pursuant to a policy adopted by the Board of Trustees, including, if available, utilizing a third party pricing service to determine these fair values. The third party pricing service takes into account multiple factors, including, but not limited to, movements in the U.S. securities markets, certain depositary receipts, futures contracts and foreign exchange rates that have occurred subsequent to the close of the foreign exchange or market, to determine a good faith estimate that reasonably reflects the current market conditions as of the close of the New York Stock Exchange. The fair value of a security is likely to be different from the quoted or published price, if available.
Investments in open-end investment companies, including money market funds, are valued at their latest net asset value.
Columbia Diversified Absolute Return Fund | Annual Report 2018
| 45 |
Notes to Consolidated Financial Statements (continued)
May 31, 2018
Forward foreign currency exchange contracts are marked-to-market based upon foreign currency exchange rates provided by a pricing service.
Futures and options on futures contracts are valued based upon the settlement price at the close of regular trading on their principal exchanges or, in the absence of transactions, at the mean of the latest quoted bid and ask prices.
Swap transactions are valued through an independent pricing service or broker, or if neither is available, through an internal model based upon observable inputs.
Investments for which market quotations are not readily available, or that have quotations which management believes are not reflective of market value or reliable, are valued at fair value as determined in good faith under procedures approved by and under the general supervision of the Board of Trustees. If a security or class of securities (such as foreign securities) is valued at fair value, such value is likely to be different from the quoted or published price for the security.
The determination of fair value often requires significant judgment. To determine fair value, management may use assumptions including but not limited to future cash flows and estimated risk premiums. Multiple inputs from various sources may be used to determine fair value.
GAAP requires disclosure regarding the inputs and valuation techniques used to measure fair value and any changes in valuation inputs or techniques. In addition, investments shall be disclosed by major category. This information is disclosed following the Fund’s Consolidated Portfolio of Investments.
Foreign currency transactions and translations
The values of all assets and liabilities denominated in foreign currencies are generally translated into U.S. dollars at exchange rates determined at the close of regular trading on the New York Stock Exchange. Net realized and unrealized gains (losses) on foreign currency transactions and translations include gains (losses) arising from the fluctuation in exchange rates between trade and settlement dates on securities transactions, gains (losses) arising from the disposition of foreign currency and currency gains (losses) between the accrual and payment dates on dividends, interest income and foreign withholding taxes.
For financial statement purposes, the Fund does not distinguish that portion of gains (losses) on investments which is due to changes in foreign exchange rates from that which is due to changes in market prices of the investments. Such fluctuations are included with the net realized and unrealized gains (losses) on investments in the Consolidated Statement of Operations.
Derivative instruments
The Fund invests in certain derivative instruments, as detailed below, to meet its investment objectives. Derivatives are instruments whose values depend on, or are derived from, in whole or in part, the value of one or more securities, currencies, commodities, indices, or other assets or instruments. Derivatives may be used to increase investment flexibility (including to maintain cash reserves while maintaining desired exposure to certain assets), for risk management (hedging) purposes, to facilitate trading, to reduce transaction costs and to pursue higher investment returns. The Fund may also use derivative instruments to mitigate certain investment risks, such as foreign currency exchange rate risk, interest rate risk and credit risk. Derivatives may involve various risks, including the potential inability of the counterparty to fulfill its obligations under the terms of the contract, the potential for an illiquid secondary market (making it difficult for the Fund to sell or terminate, including at favorable prices) and the potential for market movements which may expose the Fund to gains or losses in excess of the amount shown in the Consolidated Statement of Assets and Liabilities. The notional amounts of derivative instruments, if applicable, are not recorded in the financial statements.
A derivative instrument may suffer a marked-to-market loss if the value of the contract decreases due to an unfavorable change in the market rates or values of the underlying instrument. Losses can also occur if the counterparty does not perform its obligations under the contract. The Fund’s risk of loss from counterparty credit risk on over-the-counter derivatives is generally limited to the aggregate unrealized gain netted against any collateral held by the Fund and the amount of any variation margin held by the counterparty, plus any replacement costs or related amounts. With exchange-traded or centrally cleared derivatives, there is reduced counterparty credit risk to the Fund since the clearinghouse or central counterparty (CCP) provides some protection in the case of clearing member default. The clearinghouse or CCP stands between the buyer
| 46 | Columbia Diversified Absolute Return Fund | Annual Report 2018 |
Notes to Consolidated Financial Statements (continued)
May 31, 2018
and the seller of the contract; therefore, additional counterparty credit risk is failure of the clearinghouse or CCP. However, credit risk still exists in exchange-traded or centrally cleared derivatives with respect to initial and variation margin that is held in a broker’s customer account. While brokers are required to segregate customer margin from their own assets, in the event that a broker becomes insolvent or goes into bankruptcy and at that time there is a shortfall in the aggregate amount of margin held by the broker for all its clients, U.S. bankruptcy laws will typically allocate that shortfall on a pro-rata basis across all the broker’s customers (including the Fund), potentially resulting in losses to the Fund.
In order to better define its contractual rights and to secure rights that will help the Fund mitigate its counterparty risk, the Fund may enter into an International Swaps and Derivatives Association, Inc. Master Agreement (ISDA Master Agreement) or similar agreement with its derivatives contract counterparties. An ISDA Master Agreement is an agreement between the Fund and a counterparty that governs over-the-counter derivatives and typically contains, among other things, collateral posting terms and netting provisions in the event of a default and/or termination event. Under an ISDA Master Agreement, the Fund may, under certain circumstances, offset with the counterparty certain derivative instrument’s payables and/or receivables with collateral held and/or posted and create one single net payment. The provisions of the ISDA Master Agreement typically permit a single net payment in the event of default (close-out netting), including the bankruptcy or insolvency of the counterparty. Note, however, that bankruptcy or insolvency laws of a particular jurisdiction may impose restrictions on or prohibitions against the right of offset or netting in bankruptcy, insolvency or other events.
Collateral (margin) requirements differ by type of derivative. Margin requirements are established by the clearinghouse or CCP for exchange-traded and centrally cleared derivatives. Brokers can ask for margin in excess of the minimum in certain circumstances. Collateral terms are contract specific for over-the-counter derivatives. For over-the-counter derivatives traded under an ISDA Master Agreement, the collateral requirements are typically calculated by netting the marked-to-market amount for each transaction under such agreement and comparing that amount to the value of any variation margin currently pledged by the Fund and/or the counterparty. Generally, the amount of collateral due from or to a party has to exceed a minimum transfer amount threshold (e.g., $250,000) before a transfer has to be made. To the extent amounts due to the Fund from its counterparties are not fully collateralized, contractually or otherwise, the Fund bears the risk of loss from counterparty nonperformance. The Fund may also pay interest expense on cash collateral received from the broker. Any interest expense paid by the Fund is shown on the Consolidated Statement of Operations. The Fund attempts to mitigate counterparty risk by only entering into agreements with counterparties that it believes have the financial resources to honor their obligations and by monitoring the financial stability of those counterparties.
Certain ISDA Master Agreements allow counterparties of over-the-counter derivatives transactions to terminate derivatives contracts prior to maturity in the event the Fund’s net asset value declines by a stated percentage over a specified time period or if the Fund fails to meet certain terms of the ISDA Master Agreement, which would cause the Fund to accelerate payment of any net liability owed to the counterparty. The Fund also has termination rights if the counterparty fails to meet certain terms of the ISDA Master Agreement. In addition to considering counterparty credit risk, the Fund would consider terminating the derivatives contracts based on whether termination would result in a net liability owed from the counterparty.
For financial reporting purposes, the Fund does not offset derivative assets and derivative liabilities that are subject to netting arrangements in the Consolidated Statement of Assets and Liabilities.
Forward foreign currency exchange contracts
Forward foreign currency exchange contracts are over-the-counter agreements between two parties to buy and sell a currency at a set price on a future date. The Fund utilized forward foreign currency exchange contracts to hedge the currency exposure associated with some or all of the Fund’s securities, to shift foreign currency exposure back to U.S. dollars, to shift investment exposure from one currency to another, to shift U.S. dollar exposure to achieve a representative weighted mix of major currencies in its benchmark, to recover an underweight country exposure in its portfolio and to generate total return through long and short positions versus the U.S. dollar. These instruments may be used for other purposes in future periods.
The values of forward foreign currency exchange contracts fluctuate daily with changes in foreign currency exchange rates. Changes in the value of these contracts are recorded as unrealized appreciation or depreciation until the contract is exercised or has expired. The Fund will realize a gain or loss when the forward foreign currency exchange contract is closed or expires.
Columbia Diversified Absolute Return Fund | Annual Report 2018
| 47 |
Notes to Consolidated Financial Statements (continued)
May 31, 2018
The use of forward foreign currency exchange contracts does not eliminate fluctuations in the prices of the Fund’s portfolio securities. The risks of forward foreign currency exchange contracts include movement in the values of the foreign currencies relative to the U.S. dollar (or other foreign currencies) and the possibility that counterparties will not complete their contractual obligations, which may be in excess of the amount reflected, if any, in the Consolidated Statement of Assets and Liabilities.
Futures contracts
Futures contracts are exchange-traded and represent commitments for the future purchase or sale of an asset at a specified price on a specified date. The Fund bought and sold futures contracts to produce incremental earnings, to manage the duration and yield curve exposure of the Fund versus the benchmark, to manage exposure to movements in interest rates and to manage exposure to the securities market. These instruments may be used for other purposes in future periods. Upon entering into futures contracts, the Fund bears risks that it may not achieve the anticipated benefits of the futures contracts and may realize a loss. Additional risks include counterparty credit risk, the possibility of an illiquid market, and that a change in the value of the contract or option may not correlate with changes in the value of the underlying asset.
Upon entering into a futures contract, the Fund deposits cash or securities with the broker, known as a futures commission merchant (FCM), in an amount sufficient to meet the initial margin requirement. The initial margin deposit must be maintained at an established level over the life of the contract. Cash deposited as initial margin is recorded in the Consolidated Statement of Assets and Liabilities as margin deposits. Securities deposited as initial margin are designated in the Consolidated Portfolio of Investments. Subsequent payments (variation margin) are made or received by the Fund each day. The variation margin payments are equal to the daily change in the contract value and are recorded as variation margin receivable or payable and are offset in unrealized gains or losses. The Fund recognizes a realized gain or loss when the contract is closed or expires. Futures contracts involve, to varying degrees, risk of loss in excess of the variation margin disclosed in the Consolidated Statement of Assets and Liabilities.
Swap contracts
Swap contracts are negotiated in the over-the-counter market and may be entered into as a bilateral contract or centrally cleared (centrally cleared swap contract). In a centrally cleared swap contract, immediately following execution of the swap contract with a broker, the swap contract is novated to a central counterparty (the CCP) and the CCP becomes the Fund’s counterparty to the centrally cleared swap contract. The Fund is required to deposit initial margin with the futures commission merchant (FCM), which pledges it through to the CCP in the form of cash or securities in an amount that varies depending on the size and risk profile of the particular swap contract. Securities deposited as initial margin are designated in the Consolidated Portfolio of Investments and cash deposited is recorded in the Consolidated Statement of Assets and Liabilities as margin deposits. Unlike a bilateral swap contract, for centrally cleared swap contracts, the Fund has minimal credit exposure to the FCM because the CCP stands between the Fund and the relevant buyer/seller on the other side of the contract. Swap contracts are marked-to-market daily and changes in value are recorded as unrealized appreciation (depreciation). The daily change in valuation of centrally cleared swap contracts, if any, is recorded as a receivable or payable for variation margin in the Consolidated Statement of Assets and Liabilities.
Entering into these contracts involves, to varying degrees, elements of interest, liquidity and counterparty credit risk in excess of the amounts recognized in the Consolidated Statement of Assets and Liabilities. Such risks involve the possibility that there may be unfavorable changes in interest rates, market conditions or other conditions, that it may be difficult to initiate a swap transaction or liquidate a position at an advantageous time or price which may result in significant losses, and that the FCM or CCP may not fulfill its obligation under the contract.
Credit default swap contracts
The Fund entered into credit default swap contracts to increase or decrease its credit exposure to an index, increase or decrease its credit exposure to a single issuer of debt securities, increase or decrease its credit exposure to a specific debt security or a basket of debt securities, as a protection buyer to reduce overall credit exposure and to manage credit risk exposure. These instruments may be used for other purposes in future periods. Credit default swap contracts are agreements in which one party pays fixed periodic payments to a counterparty in consideration for an agreement from the
| 48 | Columbia Diversified Absolute Return Fund | Annual Report 2018 |
Notes to Consolidated Financial Statements (continued)
May 31, 2018
counterparty to make a specific payment should a specified credit event(s) take place. Although specified credit events are contract specific, credit events are generally defined as bankruptcy, failure to pay, restructuring, obligation acceleration, obligation default, or repudiation/moratorium.
As the purchaser of a credit default swap contract, the Fund purchases protection by paying a periodic interest rate on the notional amount to the counterparty. The interest amount is accrued daily as a component of unrealized appreciation (depreciation) and is recorded as a realized loss upon payment. If a credit event as specified in the contract occurs, the Fund may have the option either to deliver the reference obligation to the seller in exchange for a cash payment of its par amount, or to receive a net cash settlement equal to the par amount less an agreed-upon value of the reference obligation as of the date of the credit event. The difference between the value of the obligation or cash delivered and the notional amount received will be recorded as a realized gain (loss).
As the seller of a credit default swap contract, the Fund sells protection to a buyer and will generally receive a periodic interest rate on a notional amount. The interest amount is accrued daily as a component of unrealized appreciation (depreciation) and is recorded as a realized gain upon receipt of the payment. If a credit event as specified in the contract with the counterparty occurs, the Fund may either be required to accept the reference obligation from the buyer in exchange for a cash payment of its notional amount, or to pay the buyer a net cash settlement equal to the notional amount less an agreed-upon value of the reference obligation (recovery value) as of the date of the credit event. The difference between the value of the obligation or cash received and the notional amount paid will be recorded as a realized gain (loss). The maximum potential amount of undiscounted future payments the Fund could be required to make as the seller of protection under a credit default swap contract is equal to the notional amount of the reference obligation. These potential amounts may be partially offset by any recovery values of the respective reference obligations or upfront receipts upon entering into the agreement. The notional amounts and market values of all credit default swap contracts in which the Fund is the seller of protection, if any, are disclosed in the Credit Default Swap Contracts Outstanding schedule following the Portfolio of Investments.
As a protection seller, the Fund bears the risk of loss from the credit events specified in the contract with the counterparty. For credit default swap contracts on credit indices, quoted market prices and resulting market values serve as an indicator of the current status of the payment/performance risk. Increasing market values, in absolute terms when compared to the notional amount of the swap, represent a deterioration of the reference entity’s credit soundness and a greater likelihood or risk of default or other credit event occurring as defined under the terms of the contract.
Any upfront payments or receipts by the Fund upon entering into a credit default swap contract is recorded as an asset or liability, respectively, and amortized daily as a component of realized gain (loss) in the Consolidated Statement of Operations. Credit default swap contracts are valued daily, and the change in value is recorded as unrealized appreciation (depreciation) until the termination of the swap, at which time a realized gain (loss) is recorded.
Credit default swap contracts can involve greater risks than if a fund had invested in the reference obligation directly since, in addition to general market risks, credit default swaps are subject to counterparty credit risk, leverage risk, hedging risk, correlation risk and liquidity risk.
Interest rate swap contracts
The Fund entered into interest rate swap transactions which may include inflation rate swap contracts to produce incremental earnings, to manage interest rate and market risk exposure to produce incremental earnings, to gain exposure to or protect itself from market rate changes, to synthetically add or subtract principal exposure to a market and to manage long or short exposure to an inflation index. These instruments may be used for other purposes in future periods. An interest rate swap is an agreement between two parties where there are two flows and payments are made between the two counterparties and the payments are dependent upon changes in an interest rate, inflation rate or inflation index calculated on a nominal amount. Interest rate swaps are agreements between two parties that involve the exchange of one type of interest rate for another type of interest rate cash flow on specified dates in the future, based on a predetermined, specified notional amount. Certain interest rate swaps are considered forward-starting, whereby the accrual for the exchange of cash flows does not begin until a specified date in the future. The net cash flow for a standard interest rate swap transaction is generally the difference between a floating market interest rate versus a fixed interest rate.
Columbia Diversified Absolute Return Fund | Annual Report 2018
| 49 |
Notes to Consolidated Financial Statements (continued)
May 31, 2018
Interest rate swaps are valued daily and unrealized appreciation (depreciation) is recorded. Certain interest rate swaps may accrue periodic interest on a daily basis as a component of unrealized appreciation (depreciation); the Fund will realize a gain or loss upon the payment or receipt of accrued interest. The Fund will realize a gain or a loss when the interest rate swap is terminated.
Total return basket swap contracts
The Fund entered into total return basket swap transactions. These instruments allow the Fund to manage exposure to a custom basket of securities and foreign markets (both long and short exposures) without owning or taking physical custody of such securities. Under the terms of the contract, payments made by the Fund or the counterparty are based on the total return of the reference assets within the basket in return for a specified interest rate. The contract allows the Investment Manager of the Fund to alter the composition of the custom basket by trading in and out of the notional reference security positions at its discretion.
The total return basket swap is valued daily, and the change in value is recorded as unrealized appreciation (depreciation). The swap resets monthly at which time the Fund settles in cash with the counterparty. Payments received (or made) by the Fund are recorded as realized gains (losses). Total return basket swaps are subject to the risk associated with the investment in the reference securities within the basket. The risk in the case of short swaps transactions is unlimited based on the potential for unlimited increases in the market value of the reference securities in the basket. The risk may be offset if the Fund holds any of the reference securities. The risk in the case of long swap transactions is limited to the current notional amount of the swap.
Effects of derivative transactions in the financial statements
The following tables are intended to provide additional information about the effect of derivatives on the financial statements of the Fund, including: the fair value of derivatives by risk category and the location of those fair values in the Consolidated Statement of Assets and Liabilities; and the impact of derivative transactions over the period in the Consolidated Statement of Operations, including realized and unrealized gains (losses). The derivative instrument schedules following the Consolidated Portfolio of Investments present additional information regarding derivative instruments outstanding at the end of the period, if any.
The following table is a summary of the fair value of derivative instruments (not considered to be hedging instruments for accounting disclosure purposes) at May 31, 2018:
| | Asset derivatives | |
Risk exposure
category | Consolidated statement
of assets and liabilities
location | Fair value ($) |
| Credit risk | Net assets — unrealized appreciation on swap contracts | 45,676* |
| Equity risk | Net assets — unrealized appreciation on futures contracts | 771,341* |
| Equity risk | Net assets — unrealized appreciation on swap contracts | 72,534* |
| Foreign exchange risk | Unrealized appreciation on forward foreign currency exchange contracts | 441,124 |
| Interest rate risk | Net assets — unrealized appreciation on futures contracts | 101,653* |
| Interest rate risk | Net assets — unrealized appreciation on swap contracts | 564,189* |
| Interest rate risk | Upfront payments on swap contracts | 1,064 |
| Commodity-related investment risk | Net assets — unrealized appreciation on swap contracts | 152,879* |
| Total | | 2,150,460 |
| 50 | Columbia Diversified Absolute Return Fund | Annual Report 2018 |
Notes to Consolidated Financial Statements (continued)
May 31, 2018
| | Liability derivatives | |
Risk exposure
category | Consolidated statement
of assets and liabilities
location | Fair value ($) |
| Credit risk | Net assets — unrealized depreciation on swap contracts | 26,065* |
| Credit risk | Upfront receipts on swap contracts | 36,485 |
| Equity risk | Net assets — unrealized depreciation on futures contracts | 463,780* |
| Equity risk | Net assets — unrealized depreciation on swap contracts | 128,766* |
| Foreign exchange risk | Unrealized depreciation on forward foreign currency exchange contracts | 360,466 |
| Foreign exchange risk | Net assets — unrealized depreciation on swap contracts | 558,530* |
| Interest rate risk | Net assets — unrealized depreciation on futures contracts | 69,333* |
| Interest rate risk | Net assets — unrealized depreciation on swap contracts | 644,822* |
| Commodity-related investment risk | Net assets — unrealized depreciation on swap contracts | 19,121* |
| Total | | 2,307,368 |
| * | Includes cumulative appreciation (depreciation) as reported in the tables following the Consolidated Portfolio of Investments. Only the current day’s variation margin is reported in receivables or payables in the Consolidated Statement of Assets and Liabilities. |
The following table indicates the effect of derivative instruments (not considered to be hedging instruments for accounting disclosure purposes) in the Consolidated Statement of Operations for the year ended May 31, 2018:
| Amount of realized gain (loss) on derivatives recognized in income |
| Risk exposure category | Forward
foreign
currency
exchange
contracts
($) | Futures
contracts
($) | Swap
contracts
($) | Total
($) |
| Commodity-related investment risk | — | — | (498,094) | (498,094) |
| Credit risk | — | — | (272,435) | (272,435) |
| Equity risk | — | 714,251 | (438,131) | 276,120 |
| Foreign exchange risk | (69,834) | — | 189,988 | 120,154 |
| Interest rate risk | — | (263,258) | 883,824 | 620,566 |
| Total | (69,834) | 450,993 | (134,848) | 246,311 |
| |
| Change in unrealized appreciation (depreciation) on derivatives recognized in income |
| Risk exposure category | Forward
foreign
currency
exchange
contracts
($) | Futures
contracts
($) | Swap
contracts
($) | Total
($) |
| Commodity-related investment risk | — | — | 133,758 | 133,758 |
| Credit risk | — | — | 26,778 | 26,778 |
| Equity risk | — | 283,712 | (56,232) | 227,480 |
| Foreign exchange risk | 42,342 | — | (558,530) | (516,188) |
| Interest rate risk | — | (153,188) | (80,633) | (233,821) |
| Total | 42,342 | 130,524 | (534,859) | (361,993) |
Columbia Diversified Absolute Return Fund | Annual Report 2018
| 51 |
Notes to Consolidated Financial Statements (continued)
May 31, 2018
The following table is a summary of the average outstanding volume by derivative instrument for the year ended May 31, 2018:
| Derivative instrument | Average notional
amounts ($)* |
| Futures contracts — long | 29,409,719 |
| Futures contracts — short | 17,661,431 |
| Credit default swap contracts — buy protection | 3,428,886 |
| Credit default swap contracts — sell protection | 8,942,563 |
| Derivative instrument | Average unrealized
appreciation ($)* | Average unrealized
depreciation ($)* |
| Forward foreign currency exchange contracts | 319,584 | (323,775) |
| Interest rate swap contracts | 390,268 | (113,947) |
| Total return swap contracts | 355,670 | (482,759) |
| * | Based on the ending quarterly outstanding amounts for the year ended May 31, 2018. |
Short Sales
The Fund may sell a security it does not own in anticipation of a decline in the fair value of the security. When the Fund sells a security short, it must borrow the security sold short and deliver it to the broker-dealer through which it made the short sale. The Fund is required to maintain a margin account with the broker and to pledge assets to the broker as collateral for the borrowed security. Securities pledged as collateral are designated in the Consolidated Portfolio of Investments. In addition, collateral is recorded as cash collateral held at broker in the Consolidated Statement of Assets and Liabilities. The Fund can purchase the same security at the current market price and deliver it to the broker to close out the short sale. The Fund is obligated to pay the broker a fee for borrowing the security. The fee is included in "Dividends and interest on securities sold short" in the Consolidated Statement of Operations and a short position is reported as a liability at fair value in the Consolidated Statement of Assets and Liabilities. The Fund must also pay the broker for any dividends accrued (recognized on ex-date) on the borrowed security. This amount is recorded as an expense in the Consolidated Statement of Operations. The Fund will record a gain if the security declines in value, and will realize a loss if the security appreciates. Such gain, limited to the price at which the Fund sold the security short, or such loss, potentially unlimited in size because the short position loses value as the market price of the security sold short increases, will be recognized upon the termination of a short sale.
| 52 | Columbia Diversified Absolute Return Fund | Annual Report 2018 |
Offsetting of assets and liabilities
The following table presents the Fund’s gross and net amount of assets and liabilities available for offset under netting arrangements as well as any related collateral received or pledged by the Fund as of May 31, 2018:
| | Barclays
($)(e) | Barclays
($)(e) | Citi
($)(e) | Citi
($)(e) | Deutsche
Bank
($) | Goldman
Sachs
International
($)(e) | Goldman
Sachs
International
($)(e) | HSBC
($) | JPMorgan
($)(e) | JPMorgan
($)(e) | Morgan
Stanley
($) | Morgan
Stanley
International
($) | Westpac
($) | Total
($) |
| Assets | | | | | | | | | | | | | | |
| Centrally cleared interest rate swap contracts (a) | - | - | - | - | - | - | - | - | - | - | - | 42,296 | - | 42,296 |
| Forward foreign currency exchange contracts | - | - | 27,977 | - | - | - | - | 114,722 | - | - | 212,845 | - | 85,580 | 441,124 |
| OTC total return swap contracts (b) | 4,486 | 94,361 | - | 51,633 | - | 26,125 | 6,484 | - | - | - | 49,880 | - | - | 232,969 |
| Total assets | 4,486 | 94,361 | 27,977 | 51,633 | - | 26,125 | 6,484 | 114,722 | - | - | 262,725 | 42,296 | 85,580 | 716,389 |
| Liabilities | | | | | | | | | | | | | | |
| Centrally cleared credit default swap contracts (a) | - | - | - | - | - | - | - | - | - | - | - | 3,514 | - | 3,514 |
| Centrally cleared interest rate swap contracts (a) | - | - | - | - | - | - | - | - | - | - | - | 26,920 | - | 26,920 |
| Forward foreign currency exchange contracts | - | - | 91,324 | - | - | - | - | 128,369 | - | - | 75,794 | - | 64,979 | 360,466 |
| OTC credit default swap contracts (b) | - | - | 62,128 | - | - | - | - | - | - | - | - | - | - | 62,128 |
| OTC total return swap contracts (b) | - | 18,163 | - | - | 243,753 | 832,903 | 958 | - | 93,838 | - | 34,925 | - | - | 1,224,540 |
| Securities borrowed | - | - | - | - | - | - | - | - | - | 36,103,833 | - | - | - | 36,103,833 |
| Total liabilities | - | 18,163 | 153,452 | - | 243,753 | 832,903 | 958 | 128,369 | 93,838 | 36,103,833 | 110,719 | 30,434 | 64,979 | 37,781,401 |
| Total financial and derivative net assets | 4,486 | 76,198 | (125,475) | 51,633 | (243,753) | (806,778) | 5,526 | (13,647) | (93,838) | (36,103,833) | 152,006 | 11,862 | 20,601 | (37,065,012) |
| Total collateral received (pledged) (c) | - | - | - | - | (243,753) | (370,000) | - | - | - | (36,103,833) | - | | - | (36,717,586) |
| Net amount (d) | 4,486 | 76,198 | (125,475) | 51,633 | - | (436,778) | 5,526 | (13,647) | (93,838) | - | 152,006 | 11,862 | 20,601 | (347,426) |
| (a) | Centrally cleared swaps are included within payable/receivable for variation margin on the Statement of Assets and Liabilities. |
| (b) | Over-the-Counter (OTC) Swap Contracts are presented at market value plus periodic payments receivable (payable), which is comprised of unrealized appreciation, unrealized depreciation, upfront payments and upfront receipts. |
| (c) | In some instances, the actual collateral received and/or pledged may be more than the amount shown due to overcollateralization. |
| (d) | Represents the net amount due from/(to) counterparties in the event of default. |
| (e) | Exposure can only be netted across transactions governed under the same master agreement with the same legal entity. |
Notes to Consolidated Financial Statements (continued)
May 31, 2018
Columbia Diversified Absolute Return Fund | Annual Report 2018
| 53 |
Notes to Consolidated Financial Statements (continued)
May 31, 2018
Security transactions
Security transactions are accounted for on the trade date. Cost is determined and gains (losses) are based upon the specific identification method for both financial statement and federal income tax purposes.
Income recognition
Interest income is recorded on an accrual basis. Market premiums and discounts, including original issue discounts, are amortized and accreted, respectively, over the expected life of the security on all debt securities, unless otherwise noted.
The Fund may place a debt security on non-accrual status and reduce related interest income when it becomes probable that the interest will not be collected and the amount of uncollectible interest can be reasonably estimated. A defaulted debt security is removed from non-accrual status when the issuer resumes interest payments or when collectibility of interest is reasonably assured.
Corporate actions and dividend income are generally recorded net of any non-reclaimable tax withholdings, on the ex-dividend date or upon receipt of ex-dividend notification in the case of certain foreign securities.
The Fund may receive distributions from holdings in equity securities, business development companies (BDCs), exchange-traded funds (ETFs), limited partnerships (LPs), other regulated investment companies (RICs), and real estate investment trusts (REITs), which report information on the tax character of their distributions annually. These distributions are allocated to dividend income, capital gain and return of capital based on actual information reported. Return of capital is recorded as a reduction of the cost basis of securities held. If the Fund no longer owns the applicable securities, return of capital is recorded as a realized gain. With respect to REITs, to the extent actual information has not yet been reported, estimates for return of capital are made by the Fund’s management. Management’s estimates are subsequently adjusted when the actual character of the distributions is disclosed by the REITs, which could result in a proportionate change in return of capital to shareholders.
Awards from class action litigation are recorded as a reduction of cost basis if the Fund still owns the applicable securities on the payment date. If the Fund no longer owns the applicable securities, the proceeds are recorded as realized gains.
Expenses
General expenses of the Trust are allocated to the Fund and other funds of the Trust based upon relative net assets or other expense allocation methodologies determined by the nature of the expense. Expenses directly attributable to the Fund are charged to the Fund. Expenses directly attributable to a specific class of shares are charged to that share class.
Determination of class net asset value
All income, expenses (other than class-specific expenses, which are charged to that share class, as shown in the Consolidated Statement of Operations) and realized and unrealized gains (losses) are allocated to each class of the Fund on a daily basis, based on the relative net assets of each class, for purposes of determining the net asset value of each class.
Federal income tax status
The Fund intends to qualify each year as a regulated investment company under Subchapter M of the Internal Revenue Code, as amended, and will distribute substantially all of its investment company taxable income and net capital gain, if any, for its tax year, and as such will not be subject to federal income taxes. In addition, the Fund intends to distribute in each calendar year substantially all of its ordinary income, capital gain net income and certain other amounts, if any, such that the Fund should not be subject to federal excise tax. Therefore, no federal income or excise tax provision is recorded.
Foreign taxes
The Fund may be subject to foreign taxes on income, gains on investments or currency repatriation, a portion of which may be recoverable. The Fund will accrue such taxes and recoveries, as applicable, based upon its current interpretation of tax rules and regulations that exist in the markets in which it invests.
| 54 | Columbia Diversified Absolute Return Fund | Annual Report 2018 |
Notes to Consolidated Financial Statements (continued)
May 31, 2018
Realized gains in certain countries may be subject to foreign taxes at the Fund level, based on statutory rates. The Fund accrues for such foreign taxes on realized and unrealized gains at the appropriate rate for each jurisdiction, as applicable. The amount, if any, is disclosed as a liability on the Consolidated Statement of Assets and Liabilities.
Distributions to shareholders
Distributions from net investment income, if any, are declared and paid annually. Net realized capital gains, if any, are distributed at least annually. Income distributions and capital gain distributions are determined in accordance with federal income tax regulations, which may differ from GAAP.
Guarantees and indemnifications
Under the Trust’s organizational documents and, in some cases, by contract, its officers and trustees are indemnified against certain liabilities arising out of the performance of their duties to the Trust or its funds. In addition, certain of the Fund’s contracts with its service providers contain general indemnification clauses. The Fund’s maximum exposure under these arrangements is unknown since the amount of any future claims that may be made against the Fund cannot be determined, and the Fund has no historical basis for predicting the likelihood of any such claims.
Recent accounting pronouncement
Accounting Standards Update 2017-08 Premium Amortization on Purchased Callable Debt Securities
In March 2017, the Financial Accounting Standards Board issued Accounting Standards Update (ASU) No. 2017-08 Premium Amortization on Purchased Callable Debt Securities. ASU No. 2017-08 updates the accounting standards to shorten the amortization period for certain purchased callable debt securities, held at a premium, to be amortized to the earliest call date. The update applies to securities with explicit, noncontingent call features that are callable at fixed prices and on preset dates. The standard is effective for annual periods beginning after December 15, 2018 and interim periods within those fiscal years. At this time, management is evaluating the implication of this guidance and the impact it will have on the financial statement amounts and footnote disclosures, if any.
Note 3. Fees and other transactions with affiliates
Management services fees
The Fund has entered into a Management Agreement with Columbia Management Investment Advisers, LLC (the Investment Manager), a wholly-owned subsidiary of Ameriprise Financial, Inc. (Ameriprise Financial). Under the Management Agreement, the Investment Manager provides the Fund with investment research and advice, as well as administrative and accounting services. The management services fee is an annual fee that is equal to a percentage of the Fund’s daily net assets that declines from 1.18% to 1.03% as the Fund’s net assets increase. The effective management services fee rate for the year ended May 31, 2018 was 1.18% of the Fund’s average daily net assets.
Subadvisory agreement
The Fund’s Board of Trustees has approved a subadvisory agreement between the Investment Manager and Threadneedle International Limited (Threadneedle), an affiliate of the Investment Manager and an indirect wholly-owned subsidiary of Ameriprise Financial. As of May 31, 2018, Threadneedle is not providing services to the Fund pursuant to the subadvisory agreement.
Compensation of board members
Members of the Board of Trustees who are not officers or employees of the Investment Manager or Ameriprise Financial are compensated for their services to the Fund as disclosed in the Consolidated Statement of Operations. These members of the Board of Trustees may participate in a Deferred Compensation Plan (the Plan) which may be terminated at any time. Obligations of the Plan will be paid solely out of the Fund’s assets, and all amounts payable under the Plan constitute a general unsecured obligation of the Fund.
Columbia Diversified Absolute Return Fund | Annual Report 2018
| 55 |
Notes to Consolidated Financial Statements (continued)
May 31, 2018
Compensation of Chief Compliance Officer
The Board of Trustees has appointed a Chief Compliance Officer to the Fund in accordance with federal securities regulations. As disclosed in the Consolidated Statement of Operations, a portion of the Chief Compliance Officer’s total compensation is allocated to the Fund, along with other allocations to affiliated funds governed by the Board of Trustees, based on relative net assets.
Transfer agency fees
Under a Transfer and Dividend Disbursing Agent Agreement, Columbia Management Investment Services Corp. (the Transfer Agent), an affiliate of the Investment Manager and a wholly-owned subsidiary of Ameriprise Financial, is responsible for providing transfer agency services to the Fund. The Transfer Agent has contracted with DST Asset Manager Solutions, Inc. (DST) to serve as sub-transfer agent. The Transfer Agent pays the fees of DST for services as sub-transfer agent and DST is not entitled to reimbursement for such fees from the Fund (with the exception of out-of-pocket fees).
The Fund pays the Transfer Agent a monthly transfer agency fee based on the number or the average value of accounts, depending on the type of account. In addition, the Fund pays the Transfer Agent a fee for shareholder services based on the number of accounts or on a percentage of the average aggregate value of the Fund’s shares maintained in omnibus accounts up to the lesser of the amount charged by the financial intermediary or a cap established by the Board of Trustees from time to time.
The Transfer Agent also receives compensation from the Fund for various shareholder services and reimbursements for certain out-of-pocket fees. Effective August 1, 2017, total transfer agency fees for Institutional 2 Class and Institutional 3 Class shares are subject to an annual limitation of not more than 0.07% and 0.02%, respectively, of the average daily net assets attributable to each share class. Prior to August 1, 2017, these limitations were 0.075% for Institutional 2 Class shares and 0.025% for Institutional 3 Class shares.
For the year ended May 31, 2018, the Fund’s effective transfer agency fee rates as a percentage of average daily net assets of each class were as follows:
| | Effective rate (%) |
| Class A | 0.12 |
| Advisor Class | 0.12 |
| Class C | 0.12 |
| Institutional Class | 0.12 |
| Institutional 2 Class | 0.07 |
| Institutional 3 Class | 0.01 |
| Class T | 0.12 |
An annual minimum account balance fee of $20 may apply to certain accounts with a value below the applicable share class’s initial minimum investment requirements to reduce the impact of small accounts on transfer agency fees. These minimum account balance fees are remitted to the Fund and recorded as part of expense reductions in the Consolidated Statement of Operations. For the year ended May 31, 2018, no minimum account balance fees were charged by the Fund.
Distribution and service fees
The Fund has entered into an agreement with Columbia Management Investment Distributors, Inc. (the Distributor), an affiliate of the Investment Manager and a wholly-owned subsidiary of Ameriprise Financial, for distribution and shareholder services. The Board of Trustees has approved, and the Fund has adopted, distribution and shareholder service plans (the Plans) applicable to certain share classes, which set the distribution and service fees for the Fund. These fees are calculated daily and are intended to compensate the Distributor and/or eligible selling and/or servicing agents for selling shares of the Fund and providing services to investors.
| 56 | Columbia Diversified Absolute Return Fund | Annual Report 2018 |
Notes to Consolidated Financial Statements (continued)
May 31, 2018
Under the Plans, the Fund pays a monthly service fee to the Distributor at the maximum annual rate of 0.25% of the average daily net assets attributable to Class A, Class C and Class T shares of the Fund. Also under the Plans, the Fund pays a monthly distribution fee to the Distributor at the maximum annual rates of 0.75% and 0.25% of the average daily net assets attributable to Class C and Class T shares of the Fund, respectively.
Although the Fund may pay a distribution fee up to 0.25% of the Fund’s average daily net assets attributable to Class T shares and a service fee of up to 0.25% of the Fund’s average daily net assets attributable to Class T shares, the aggregate fee shall not exceed 0.25% of the Fund’s average daily net assets attributable to Class T shares.
Sales charges (unaudited)
Sales charges, including front-end charges and CDSCs, received by the Distributor for distributing Fund shares for the year ended May 31, 2018, if any, are listed below:
Expenses waived/reimbursed by the Investment Manager and its affiliates
The Investment Manager and certain of its affiliates have contractually agreed to waive fees and/or reimburse expenses (excluding certain fees and expenses described below) for the period(s) disclosed below, unless sooner terminated at the sole discretion of the Board of Trustees, so that the Fund’s net operating expenses, including indirect expenses of the Underlying Funds, after giving effect to fees waived/expenses reimbursed and any balance credits and/or overdraft charges from the Fund’s custodian, do not exceed the following annual rate(s) as a percentage of the class’ average daily net assets:
| | October 1, 2017
through
September 30, 2018 | Prior to
October 1, 2017 |
| Class A | 1.65% | 1.65% |
| Advisor Class | 1.40 | 1.40 |
| Class C | 2.40 | 2.40 |
| Institutional Class | 1.40 | 1.40 |
| Institutional 2 Class | 1.30 | 1.25 |
| Institutional 3 Class | 1.25 | 1.20 |
| Class T | 1.65 | 1.65 |
Under the agreement governing these fee waivers and/or expense reimbursement arrangements, the following fees and expenses are excluded from the waiver/reimbursement commitment, and therefore will be paid by the Fund, if applicable: taxes (including foreign transaction taxes), transaction costs and brokerage commissions, costs related to any securities lending program, dividend expenses associated with securities sold short, inverse floater program fees and expenses, transaction charges and interest on borrowed money, interest, infrequent and/or unusual expenses and any other expenses the exclusion of which is specifically approved by the Board of Trustees. This agreement may be modified or amended only with approval from the Investment Manager, certain of its affiliates and the Fund. In addition to the contractual agreement, the Investment Manager and certain of its affiliates have voluntarily agreed to waive fees and/or reimburse Fund expenses (excluding certain fees and expenses described above) so that Fund level expenses (expenses directly attributable to the Fund and not to a specific share class) are waived proportionately across all share classes, but the Fund’s net operating expenses shall not exceed the contractual annual rates listed in the table above. This arrangement may be revised or discontinued at any time. Any fees waived and/or expenses reimbursed under the expense reimbursement arrangements described above are not recoverable by the Investment Manager or its affiliates in future periods.
Note 4. Federal tax information
The timing and character of income and capital gain distributions are determined in accordance with income tax regulations, which may differ from GAAP because of temporary or permanent book to tax differences.
Columbia Diversified Absolute Return Fund | Annual Report 2018
| 57 |
Notes to Consolidated Financial Statements (continued)
May 31, 2018
At May 31, 2018, these differences were primarily due to differing treatment for deferral/reversal of wash sale losses, re-characterization of distributions for investments, derivative investments, tax straddles, swap investments, late-year ordinary losses, capital loss carryforwards, trustees’ deferred compensation, foreign currency transactions, non-deductible expenses, net operating loss reclassification, investments in partnerships and constructive sales of appreciated financial positions. To the extent these differences were permanent, reclassifications were made among the components of the Fund’s net assets in the Consolidated Statement of Assets and Liabilities. Temporary differences do not require reclassifications.
In the Consolidated Statement of Assets and Liabilities the following reclassifications were made:
Excess of distributions
over net investment
income ($) | Accumulated
net realized
(loss) ($) | Paid in
capital ($) |
| 1,104,608 | (839,641) | (264,967) |
Net investment income (loss) and net realized gains (losses), as disclosed in the Consolidated Statement of Operations, and net assets were not affected by this reclassification.
For the years ended May 31, 2018 and May 31, 2017, there were no distributions.
At May 31, 2018, the components of distributable earnings on a tax basis were as follows:
Undistributed
ordinary income ($) | Undistributed
long-term
capital gains ($) | Capital loss
carryforwards ($) | Net unrealized
(depreciation) ($) |
| — | — | (1,592,588) | (2,338,244) |
At May 31, 2018, the cost of all investments for federal income tax purposes along with the aggregate gross unrealized appreciation and depreciation based on that cost was:
Federal
tax cost ($) | Gross unrealized
appreciation ($) | Gross unrealized
(depreciation) ($) | Net unrealized
(depreciation) ($) |
| 95,019,913 | 2,754,959 | (5,093,203) | (2,338,244) |
Tax cost of investments and unrealized appreciation/(depreciation) may also include timing differences that do not constitute adjustments to tax basis.
The following capital loss carryforwards, determined at May 31, 2018, may be available to reduce taxable income arising from future net realized gains on investments, if any, to the extent permitted by the Internal Revenue Code. Capital loss carryforwards with no expiration are required to be utilized prior to any capital losses which carry an expiration date. As a result of this ordering rule, capital loss carryforwards which carry an expiration date may be more likely to expire unused. In addition, for the year ended May 31, 2018, capital loss carryforwards utilized, expired unused and permanently lost, if any, were as follows:
| 2019 ($) | No expiration
short-term ($) | No expiration
long-term ($) | Total ($) | Utilized ($) | Expired ($) | Permanently
lost ($) |
| — | 1,592,588 | — | 1,592,588 | 1,075,053 | — | — |
Under current tax rules, regulated investment companies can elect to treat certain late-year ordinary losses incurred and post-October capital losses (capital losses realized after October 31) as arising on the first day of the following taxable year. As of May 31, 2018, the Fund will elect to treat the following late-year ordinary losses and post-October capital losses as arising on June 1, 2018.
Late year
ordinary losses ($) | Post-October
capital losses ($) |
| 419,578 | — |
| 58 | Columbia Diversified Absolute Return Fund | Annual Report 2018 |
Notes to Consolidated Financial Statements (continued)
May 31, 2018
Management of the Fund has concluded that there are no significant uncertain tax positions in the Fund that would require recognition in the financial statements. However, management’s conclusion may be subject to review and adjustment at a later date based on factors including, but not limited to, new tax laws, regulations, and administrative interpretations (including relevant court decisions). Generally, the Fund’s federal tax returns for the prior three fiscal years remain subject to examination by the Internal Revenue Service.
Note 5. Portfolio information
The cost of purchases and proceeds from sales of securities, excluding short-term investments and derivatives, if any, aggregated to $157,121,897 and $168,765,739, respectively, for the year ended May 31, 2018. The amount of purchase and sale activity impacts the portfolio turnover rate reported in the Consolidated Financial Highlights.
Note 6. Affiliated money market fund
The Fund invests significantly in Columbia Short-Term Cash Fund, an affiliated money market fund established for the exclusive use by the Fund and other affiliated funds (the Affiliated MMF). The income earned by the Fund from such investments is included as Dividends - affiliated issuers in the Consolidated Statement of Operations. As an investing fund, the Fund indirectly bears its proportionate share of the expenses of the Affiliated MMF. The Affiliated MMF prices its shares with a floating net asset value. In addition, the Board of Trustees of the Affiliated MMF may impose a fee on redemptions (sometimes referred to as a liquidity fee) or temporarily suspend redemptions (sometimes referred to as imposing a redemption gate) in the event its liquidity falls below regulatory limits.
Note 7. Interfund lending
Pursuant to an exemptive order granted by the Securities and Exchange Commission, the Fund participates in a program (the Interfund Program) allowing each participating Columbia Fund (each, a Participating Fund) to lend money directly to and, except for closed-end funds and money market funds, borrow money directly from other Participating Funds for temporary purposes. The amounts eligible for borrowing and lending under the Interfund Program are subject to certain restrictions.
Interfund loans are subject to the risk that the borrowing fund could be unable to repay the loan when due, and a delay in repayment to the lending fund could result in lost opportunities and/or additional lending costs. The exemptive order is subject to conditions intended to mitigate conflicts of interest arising from the Investment Manager’s relationship with each Participating Fund.
The Fund did not borrow or lend money under the Interfund Program during the year ended May 31, 2018.
Note 8. Line of credit
The Fund has access to a revolving credit facility with a syndicate of banks led by Citibank, N.A., HSBC Bank USA, N.A. and JPMorgan Chase Bank, N.A. whereby the Fund may borrow for the temporary funding of shareholder redemptions or for other temporary or emergency purposes. The credit facility, which is a collective agreement between the Fund and certain other funds managed by the Investment Manager, severally and not jointly, permits collective borrowings up to $1 billion. Interest is charged to each participating fund based on its borrowings at a rate equal to the higher of (i) the overnight federal funds rate plus 1.00% or (ii) the one-month LIBOR rate plus 1.00%. Each borrowing under the credit facility matures no later than 60 days after the date of borrowing. The Fund also pays a commitment fee equal to its pro rata share of the amount of the credit facility at a rate of 0.15% per annum. The commitment fee is included in other expenses in the Consolidated Statement of Operations.
The Fund had no borrowings during the year ended May 31, 2018.
Columbia Diversified Absolute Return Fund | Annual Report 2018
| 59 |
Notes to Consolidated Financial Statements (continued)
May 31, 2018
Note 9. Significant risks
Derivatives risk
Losses involving derivative instruments may be substantial, because a relatively small price movement in the underlying security(ies), commodity, currency or index or other instrument or asset may result in a substantial loss for the Fund. In addition to the potential for increased losses, the use of derivative instruments may lead to increased volatility within the Fund. Derivatives will typically increase the Fund’s exposure to principal risks to which it is otherwise exposed, and may expose the Fund to additional risks, including correlation risk, counterparty risk, hedging risk, leverage risk and liquidity risk.
Shareholder concentration risk
At May 31, 2018, affiliated shareholders of record owned 99.5% of the outstanding shares of the Fund in one or more accounts. Subscription and redemption activity by concentrated accounts may have a significant effect on the operations of the Fund. In the case of a large redemption, the Fund may be forced to sell investments at inopportune times, including its liquid positions, which may result in Fund losses and the Fund holding a higher percentage of less liquid positions. Large redemptions could result in decreased economies of scale and increased operating expenses for non-redeeming Fund shareholders.
Short Selling Risk
Leverage occurs when the Fund increases its assets available for investment using borrowings, short sales, derivatives, or similar instruments or techniques. Because short sales involve borrowing securities and then selling them, the Fund’s short sales effectively leverage the Fund’s assets. The Fund’s assets that are used as collateral to secure the Fund’s obligations to return the securities sold short may decrease in value while the short positions are outstanding, which may force the Fund to use its other assets to increase the collateral. Leverage can create an interest expense that may lower the Fund’s overall returns. Leverage presents the opportunity for increased net income and capital gains, but may also exaggerate the Fund’s volatility and risk of loss. There can be no guarantee that a leveraging strategy will be successful.
Note 10. Subsequent events
Management has evaluated the events and transactions that have occurred through the date the financial statements were issued. Other than as noted below, there were no items requiring adjustment of the financial statements or additional disclosure.
The Board of Trustees of the Fund has approved a Plan of Liquidation and Termination (the Plan) pursuant to which the Fund will be liquidated and terminated. It is currently anticipated that the Fund will be liquidated in the third quarter of 2018 at which time the Fund’s shareholders will receive a liquidating distribution in an amount equal to the net asset value of their Fund shares.
Note 11. Information regarding pending and settled legal proceedings
Ameriprise Financial and certain of its affiliates have historically been involved in a number of legal, arbitration and regulatory proceedings, including routine litigation, class actions, and governmental actions, concerning matters arising in connection with the conduct of their business activities. Ameriprise Financial believes that the Fund is not currently the subject of, and that neither Ameriprise Financial nor any of its affiliates are the subject of, any pending legal, arbitration or regulatory proceedings that are likely to have a material adverse effect on the Fund or the ability of Ameriprise Financial or its affiliates to perform under their contracts with the Fund. Ameriprise Financial is required to make quarterly (10-Q), annual (10-K) and, as necessary, 8-K filings with the Securities and Exchange Commission (SEC) on legal and regulatory matters that relate to Ameriprise Financial and its affiliates. Copies of these filings may be obtained by accessing the SEC website at www.sec.gov.
There can be no assurance that these matters, or the adverse publicity associated with them, will not result in increased Fund redemptions, reduced sale of Fund shares or other adverse consequences to the Fund. Further, although we believe proceedings are not likely to have a material adverse effect on the Fund or the ability of Ameriprise Financial or its affiliates to perform under their contracts with the Fund, these proceedings are subject to uncertainties and, as such, we are unable to
| 60 | Columbia Diversified Absolute Return Fund | Annual Report 2018 |
Notes to Consolidated Financial Statements (continued)
May 31, 2018
estimate the possible loss or range of loss that may result. An adverse outcome in one or more of these proceedings could result in adverse judgments, settlements, fines, penalties or other relief that could have a material adverse effect on the consolidated financial condition or results of operations of Ameriprise Financial.
Columbia Diversified Absolute Return Fund | Annual Report 2018
| 61 |
Report of Independent Registered Public Accounting Firm
To the Board of Trustees of Columbia Funds Series Trust I and Shareholders of Columbia Diversified Absolute Return Fund
Opinion on the Financial Statements
We have audited the accompanying consolidated statement of assets and liabilities, including the consolidated portfolio of investments, of Columbia Diversified Absolute Return Fund (one of the funds constituting Columbia Funds Series Trust I, hereafter referred to as the "Fund") and its subsidiaries as of May 31, 2018, the related consolidated statement of operations for the year ended May 31, 2018, the consolidated statement of changes in net assets for each of the two years in the period ended May 31, 2018, including the related notes, and the consolidated financial highlights for each of the periods indicated therein (collectively referred to as the “consolidated financial statements”). In our opinion, the consolidated financial statements present fairly, in all material respects, the financial position of Columbia Diversified Absolute Return Fund and its subsidiaries as of May 31, 2018, the results of their operations for the year then ended, the changes in their net assets for each of the two years in the period ended May 31, 2018 and the financial highlights for each of the periods indicated therein in conformity with accounting principles generally accepted in the United States of America.
Basis for Opinion
These consolidated financial statements are the responsibility of the Fund’s management. Our responsibility is to express an opinion on the Fund’s consolidated financial statements based on our audits. We are a public accounting firm registered with the Public Company Accounting Oversight Board (United States) (“PCAOB”) and are required to be independent with respect to the Fund in accordance with the U.S. federal securities laws and the applicable rules and regulations of the Securities and Exchange Commission and the PCAOB.
We conducted our audits of these consolidated financial statements in accordance with the standards of the PCAOB. Those standards require that we plan and perform the audits to obtain reasonable assurance about whether the consolidated financial statements are free of material misstatement, whether due to error or fraud.
Our audits included performing procedures to assess the risks of material misstatement of the consolidated financial statements, whether due to error or fraud, and performing procedures that respond to those risks. Such procedures included examining, on a test basis, evidence regarding the amounts and disclosures in the consolidated financial statements. Our audits also included evaluating the accounting principles used and significant estimates made by management, as well as evaluating the overall presentation of the consolidated financial statements. Our procedures included confirmation of securities owned as of May 31, 2018 by correspondence with the custodian, brokers and transfer agent; when replies were not received from brokers, we performed other auditing procedures. We believe that our audits provide a reasonable basis for our opinion.
/s/PricewaterhouseCoopers LLP
Minneapolis, Minnesota
July 23, 2018
We have served as the auditor of one or more investment companies within the Columbia Funds Complex since 1977.
| 62 | Columbia Diversified Absolute Return Fund | Annual Report 2018 |
Shareholders elect the Board that oversees the Fund’s operations. The Board appoints officers who are responsible for day-to-day business decisions based on policies set by the Board. The following table provides basic biographical information about the Fund’s Trustees, including their principal occupations during the past five years, although specific titles for individuals may have varied over the period. The year set forth beneath Length of Service in the table below is the year in which the Trustee was first appointed or elected as Trustee to any Fund currently in the Columbia Funds Complex or a predecessor thereof. Under current Board policy, members serve terms of indefinite duration.
Independent trustees
| Name, address, year of birth | Position held with the Trust and length of service | Principal occupation(s) during the past five years and other relevant professional experience | Number of Funds in the Columbia Fund Complex overseen | Other directorships held by Trustee during the past five years |
Janet Langford Carrig
c/o Columbia Management
Investment Advisers, LLC
225 Franklin Street
Mail Drop BX32 05228
Boston, MA 02110
1957 | Trustee
1996 | Senior Vice President, General Counsel and Corporate Secretary, ConocoPhillips (independent energy company) since September 2007 | 71 | None |
Douglas A. Hacker
c/o Columbia Management
Investment Advisers, LLC
225 Franklin Street
Mail Drop BX32 05228
Boston, MA 02110
1955 | Trustee and Chairman of the Board
1996 | Independent business executive since May 2006; Executive Vice President — Strategy of United Airlines from December 2002 to May 2006; President of UAL Loyalty Services (airline marketing company) from September 2001 to December 2002; Executive Vice President and Chief Financial Officer of United Airlines from July 1999 to September 2001 | 71 | Spartan Nash Company, (food distributor); Nash Finch Company (food distributor) from 2005 to 2013; Aircastle Limited (aircraft leasing); SeaCube Container Leasing Ltd. (container leasing) from 2010 to 2013; and Travelport Worldwide Limited (travel information technology) |
Nancy T. Lukitsh
c/o Columbia Management
Investment Advisers, LLC
225 Franklin Street
Mail Drop BX32 05228
Boston, MA 02110
1956 | Trustee
2011 | Senior Vice President, Partner and Director of Marketing, Wellington Management Company, LLP (investment adviser) from 1997 to 2010; Chair, Wellington Management Portfolios (commingled non-U.S. investment pools) from 2007 to 2010; Director, Wellington Trust Company, NA and other Wellington affiliates from 1997 to 2010 | 71 | None |
David M. Moffett
c/o Columbia Management
Investment Advisers, LLC
225 Franklin Street
Mail Drop BX32 05228
Boston, MA 02110
1952 | Trustee
2011 | Retired. Consultant to Bridgewater and Associates | 71 | Director, CSX Corporation; Genworth Financial, Inc. (financial and insurance products and services); PayPal Holdings Inc. (payment and data processing services); Trustee, University of Oklahoma Foundation; former Director, eBay Inc. (online trading community), 2007-2015; and former Director, CIT Bank, CIT Group Inc. (commercial and consumer finance), 2010-2016 |
John J. Neuhauser
c/o Columbia Management
Investment Advisers, LLC
225 Franklin Street
Mail Drop BX32 05228
Boston, MA 02110
1943 | Trustee
1984 | President, Saint Michael’s College since August 2007; Director or Trustee of several non-profit organizations, including University of Vermont Medical Center; Academic Vice President and Dean of Faculties, Boston College from August 1999 to October 2005; University Professor, Boston College from November 2005 to August 2007 | 71 | Liberty All-Star Equity Fund and Liberty All- Star Growth Fund (closed-end funds) |
Columbia Diversified Absolute Return Fund | Annual Report 2018
| 63 |
TRUSTEES AND OFFICERS (continued)
Independent trustees (continued)
| Name, address, year of birth | Position held with the Trust and length of service | Principal occupation(s) during the past five years and other relevant professional experience | Number of Funds in the Columbia Fund Complex overseen | Other directorships held by Trustee during the past five years |
Patrick J. Simpson
c/o Columbia Management
Investment Advisers, LLC
225 Franklin Street
Mail Drop BX32 05228
Boston, MA 02110
1944 | Trustee
2000 | Of Counsel, Perkins Coie LLP (law firm) since 2015; Partner, Perkins Coie LLP from 1988 to 2014 | 71 | None |
Anne-Lee Verville
c/o Columbia Management
Investment Advisers, LLC
225 Franklin Street
Mail Drop BX32 05228
Boston, MA 02110
1945 | Trustee
1998 | Retired. General Manager, Global Education Industry from 1994 to 1997, President – Application Systems Division from 1991 to 1994, Chief Financial Officer – US Marketing & Services from 1988 to 1991, and Chief Information Officer from 1987 to 1988, IBM Corporation (computer and technology) | 71 | Enesco Group, Inc. (producer of giftware and home and garden decor products) from 2001 to 2006 |
Consultants to the Independent Trustees*
| Name, address, year of birth | Position held with the Trust and length of service | Principal occupation(s) during the past five years and other relevant professional experience | Number of Funds in the Columbia Funds complex overseen | Other directorships held by Trustee during the past five years |
J. Kevin Connaughton
c/o Columbia
Management Investment
Advisers, LLC,
225 Franklin Street
Mail Drop BX32 05228,
Boston, MA 02110
1964 | Independent Trustee Consultant
2016 | Independent Trustee Consultant, Columbia Funds since March 2016; Adjunct Professor of Finance, Bentley University since November 2017; Managing Director and General Manager of Mutual Fund Products, Columbia Management Investment Advisers, LLC from May 2010 to February 2015; President, Columbia Funds from 2009 to 2015; and senior officer of Columbia Funds and affiliated funds from 2003 to 2015 | 71 | Director, The Autism Project since March 2015; former Trustee, New Century Portfolios, March 2015-December 2017; formerly on Board of Governors, Gateway Healthcare, January 2016 – December 2017 |
Natalie A. Trunow
c/o Columbia
Management Investment
Advisers, LLC,
225 Franklin Street
Mail Drop BX32 05228,
Boston, MA 02110
1967 | Independent Trustee Consultant
2016 | Independent Trustee Consultant, Columbia Funds since September 2016; Chief Executive Officer, Millennial Portfolio Solutions LLC (asset management and consulting services) since January 2016; Director of Investments, Casey Family Programs from April 2016 to September 2016; Senior Vice President and Chief Investment Officer, Calvert Investments from August 2008 to January 2016; Section Head and Portfolio Manager, General Motors Asset Management from June 1997 to August 2008 | 71 | Director, Health Services for Children with Special Needs, Inc.; Director, Guidewell Financial Solutions |
| * | J. Kevin Connaughton was appointed consultant to the Independent Trustees effective March 1, 2016. Natalie A. Trunow was appointed consultant to the Independent Trustees effective September 1, 2016. Shareholders of the Funds are expected to be asked to elect each of Mr. Connaughton and Ms. Trunow as a Trustee at a future shareholder meeting. |
| 64 | Columbia Diversified Absolute Return Fund | Annual Report 2018 |
TRUSTEES AND OFFICERS (continued)
Interested trustee affiliated with Investment Manager*
| Name, address, year of birth | Position held with the Trust and length of service | Principal occupation(s) during the past five years and other relevant professional experience | Number of Funds in the Columbia Funds Complex overseen | Other directorships held by Trustee during the past five years |
William F. Truscott
c/o Columbia Management
Investment Advisers, LLC
225 Franklin Street
Boston, MA 02110
1960 | Trustee
2012 | Chairman of the Board and President, Columbia Management Investment Advisers, LLC since May 2010 and February 2012, respectively; Chief Executive Officer, Global Asset Management, Ameriprise Financial, Inc. since September 2012 (previously Chief Executive Officer, U.S. Asset Management & President, Annuities, May 2010-September 2012); Director and Chief Executive Officer, Columbia Management Investment Distributors, Inc. since May 2010 and February 2012, respectively; Chairman of the Board and Chief Executive Officer, RiverSource Distributors, Inc. since 2006; Director, Threadneedle Asset Management Holdings, SARL since 2014; President and Chief Executive Officer, Ameriprise Certificate Company, 2006-August 2012 | 196 | Chairman of the Board, Columbia Management Investment Advisers, LLC since May 2010; Director, Columbia Management Investment Distributors, Inc. since May 2010; former Director, Ameriprise Certificate Company, 2006 - January 2013 |
| * | Interested person (as defined under the 1940 Act) by reason of being an officer, director, security holder and/or employee of the Investment Manager or Ameriprise Financial. |
The Statement of Additional Information has additional information about the Fund’s Board members and is available, without charge, upon request by calling 800.345.6611, visiting columbiathreadneedleus.com/investor/ or contacting your financial intermediary.
Columbia Diversified Absolute Return Fund | Annual Report 2018
| 65 |
TRUSTEES AND OFFICERS (continued)
The Board has appointed officers who are responsible for day-to-day business decisions based on policies it has established. The officers serve at the pleasure of the Board. The following table provides basic information about the Officers of the Fund, including principal occupations during the past five years, although their specific titles may have varied over the period. In addition to Mr. Truscott, who is Senior Vice President, the Fund’s other officers are:
Fund officers
Name,
address and
year of birth | Position and year
first appointed to
position for any Fund
in the Columbia
Funds complex or a
predecessor thereof | Principal occupation(s) during past five years |
Christopher O. Petersen
5228 Ameriprise
Financial Center
Minneapolis, MN 55474
Born 1970 | President and Principal Executive Officer (2015) | Vice President and Lead Chief Counsel, Ameriprise Financial, Inc. since January 2015 (previously, Vice President and Chief Counsel, January 2010 - December 2014; officer of Columbia Funds and affiliated funds since 2007. |
Michael G. Clarke
225 Franklin Street
Boston, MA 02110
Born 1969 | Treasurer (2011), Chief Financial Officer (2009) and Chief Accounting Officer (2015) | Vice President — Mutual Fund Administration, Columbia Management Investment Advisers, LLC, since May 2010; senior officer of Columbia Funds and affiliated funds since 2002. |
Paul B. Goucher
100 Park Avenue
New York, NY 10017
Born 1968 | Senior Vice President (2011) and Assistant Secretary (2008) | Senior Vice President and Assistant General Counsel, Ameriprise Financial, Inc. since January 2017 (previously Vice President and Lead Chief Counsel, November 2008 - January 2017 and January 2013 - January 2017, respectively; and Chief Counsel, January 2010 - January 2013); Vice President, Chief Legal Officer and Assistant Secretary, Columbia Management Investment Advisers, LLC since May 2010. |
Thomas P. McGuire
225 Franklin Street
Boston, MA 02110
Born 1972 | Senior Vice President and Chief Compliance Officer (2012) | Vice President — Asset Management Compliance, Ameriprise Financial, Inc., since May 2010; Chief Compliance Officer, Ameriprise Certificate Company since September 2010. |
Colin Moore
225 Franklin Street
Boston, MA 02110
Born 1958 | Senior Vice President (2010) | Executive Vice President and Global Chief Investment Officer, Ameriprise Financial, Inc., since July 2013; Executive Vice President and Global Chief Investment Officer, Columbia Management Investment Advisers, LLC since July 2013 (previously Director and Global Chief Investment Officer, 2010 - 2013). |
Ryan C. Larrenaga
225 Franklin Street
Boston, MA 02110
Born 1970 | Senior Vice President (2017), Chief Legal Officer (2017) and Secretary (2015) | Vice President and Group Counsel, Ameriprise Financial, Inc. since August 2011; officer of Columbia Funds and affiliated funds since 2005. |
Michael E. DeFao
225 Franklin Street
Boston, MA 02110
Born 1968 | Vice President (2011) and Assistant Secretary (2010) | Vice President and Chief Counsel, Ameriprise Financial, Inc. since May 2010. |
Amy Johnson
5228 Ameriprise
Financial Center
Minneapolis, MN 55474
Born 1965 | Vice President (2006) | Managing Director and Global Head of Operations, Columbia Management Investment Advisers, LLC since April 2016 (previously Managing Director and Chief Operating Officer, 2010 - 2016). |
Lyn Kephart-Strong
5228 Ameriprise
Financial Center
Minneapolis, MN 55474
Born 1960 | Vice President (2015) | President, Columbia Management Investment Services Corp. since October 2014; Vice President & Resolution Officer, Ameriprise Trust Company since August 2009. |
| 66 | Columbia Diversified Absolute Return Fund | Annual Report 2018 |
Proxy voting policies and procedures
The policy of the Board of Trustees is to vote the proxies of the companies in which the Fund holds investments consistent with the procedures as stated in the Statement of Additional Information (SAI). You may obtain a copy of the SAI without charge by calling 800.345.6611; contacting your financial intermediary; visiting columbiathreadneedleus.com/investor/; or searching the website of the Securities and Exchange Commission (SEC) at sec.gov. Information regarding how the Fund voted proxies relating to portfolio securities is filed with the SEC by August 31st for the most recent 12-month period ending June 30th of that year, and is available without charge by visiting columbiathreadneedleus.com/investor/, or searching the website of the SEC at sec.gov.
Quarterly schedule of investments
The Fund files a complete schedule of portfolio holdings with the SEC for the first and third quarters of each fiscal year on Form N-Q. The Fund’s Form N-Q is available on the SEC’s website at sec.gov and may be reviewed and copied at the SEC’s Public Reference Room in Washington, D.C. Information on the operation of the Public Reference Room may be obtained by calling 800.SEC.0330. The Fund’s complete schedule of portfolio holdings, as filed on Form N-Q, can also be obtained without charge, upon request, by calling 800.345.6611.
Additional Fund information
For more information about the Fund, please visit columbiathreadneedleus.com/investor/ or call 800.345.6611. Customer Service Representatives are available to answer your questions Monday through Friday from 8 a.m. to 7 p.m. Eastern time.
You may obtain the current net asset value (NAV) of Fund shares at no cost by calling 800.345.6611 or by sending an e-mail to serviceinquiries@columbiathreadneedle.com.
Fund investment manager
Columbia Management Investment Advisers, LLC
225 Franklin Street
Boston, MA 02110
Fund distributor
Columbia Management Investment Distributors, Inc.
225 Franklin Street
Boston, MA 02110
Fund transfer agent
Columbia Management Investment Services Corp.
Through October 31, 2018:
P.O. Box 8081
Boston, MA 02266-8081
Effective November 1, 2018:
P.O. Box 219104
Kansas City, MO 64121-9104
Columbia Diversified Absolute Return Fund | Annual Report 2018
| 67 |
[THIS PAGE INTENTIONALLY LEFT BLANK]
[THIS PAGE INTENTIONALLY LEFT BLANK]
Columbia Diversified Absolute Return Fund
Through October 31, 2018:
P.O. Box 8081
Boston, MA 02266-8081
Effective November 1, 2018:
P.O. Box 219104
Kansas City, MO 64121-9104
Please read and consider the investment objectives, risks, charges and expenses for any fund carefully before investing. For a prospectus and summary prospectus, which contains this and other important information about the Fund, go to
columbiathreadneedleus.com/investor/. The Fund is distributed by Columbia Management Investment Distributors, Inc., member FINRA, and managed by Columbia Management Investment Advisers, LLC.
Columbia Threadneedle Investments (Columbia Threadneedle) is the global brand name of the Columbia and Threadneedle group of companies. All rights reserved. Columbia Management Investment Distributors, Inc., 225 Franklin Street, Boston, MA 02110-2804
© 2018 Columbia Management Investment Advisers, LLC.
columbiathreadneedleus .com/investor/
| | (a) | The registrant has adopted a code of ethics that applies to the registrant’s principal executive officer, principal financial officer, principal accounting officer or controller, or persons performing similar functions, regardless of whether these individuals are employed by the registrant or a third party. |
| | (b) | During the period covered by this report, there were not any amendments to a provision of the code of ethics adopted in 2(a) above. |
| | (c) | During the period covered by this report, there were no waivers, including any implicit waivers, from a provision of the code of ethics described in 2(a) above that relates to one or more of the items set forth in paragraph (b) of this item’s instructions. |
| Item 3. | Audit Committee Financial Expert. |
The registrant’s Board of Trustees has determined that Douglas A. Hacker, David M. Moffett and Anne-Lee Verville, each of whom are members of the registrant’s Board of Trustees and Audit Committee, each qualify as an audit committee financial expert. Mr. Hacker, Mr. Moffett and Ms. Verville are each independent trustees, as defined in paragraph (a)(2) of this item’s instructions.
| Item 4. | Principal Accountant Fees and Services. |
Fee information below is disclosed for the five series of the registrant whose reports to stockholders are included in this annual filing.
(a) Audit Fees. Aggregate Audit Fees billed by the principal accountant for professional services rendered during the fiscal years ended May 31, 2018 and May 31, 2017 are approximately as follows:
| | |
| 2018 | | 2017 |
| $196,200 | | $186,700 |
Audit Fees include amounts related to the audit of the registrant’s annual financial statements or services that are normally provided by the accountant in connection with statutory and regulatory filings or engagements for those fiscal years.
(b) Audit-Related Fees. Aggregate Audit-Related Fees billed to the registrant by the principal accountant for professional services rendered during the fiscal years ended May 31, 2018 and May 31, 2017 are approximately as follows:
Audit-Related Fees include amounts for assurance and related services by the principal accountant that are reasonably related to the performance of the audit of the registrant’s financial statements and are not reported in Audit Fees above. In fiscal year 2017, Audit-Related Fees consist of agreed-upon procedures performed for semi-annual shareholder reports.
During the fiscal years ended May 31, 2018 and May 31, 2017, there were no Audit-Related Fees billed by the registrant’s principal accountant to the registrant’s investment adviser (not including any sub-adviser whose role is primarily portfolio management and is subcontracted with or overseen by another investment adviser) and any entity controlling, controlled by, or under common control with the adviser that provides ongoing services to the registrant for an engagement that related directly to the operations and financial reporting of the registrant.
(c) Tax Fees. Aggregate Tax Fees billed by the principal accountant to the registrant for professional services rendered during the fiscal years ended May 31, 2018 and May 31, 2017 are approximately as follows:
Tax Fees include amounts for the review of annual tax returns, the review of required shareholder distribution calculations and typically include amounts for professional services by the principal accountant for tax compliance, tax advice and tax planning.
During the fiscal years ended May 31, 2018 and May 31, 2017, there were no Tax Fees billed by the registrant’s principal accountant to the registrant’s investment adviser (not including any sub-adviser whose role is primarily portfolio management and is subcontracted with or overseen by another investment adviser) and any entity controlling, controlled by, or under common control with the adviser that provides ongoing services to the registrant for an engagement that related directly to the operations and financial reporting of the registrant.
(d) All Other Fees. Aggregate All Other Fees billed by the principal accountant to the registrant for professional services rendered during the fiscal years ended May 31, 2018 and May 31, 2017 are approximately as follows:
All Other Fees include amounts for products and services provided by the principal accountant, other than the services reported in paragraphs (a) through (c) above.
Aggregate All Other Fees billed by the registrant’s principal accountant to the registrant’s investment adviser (not including any sub-adviser whose role is primarily portfolio management and is subcontracted with or overseen by another investment adviser) and any entity controlling, controlled by, or under common control with the adviser that provides ongoing services to the registrant for an engagement that related directly to the operations and financial reporting of the registrant during the fiscal years ended May 31, 2018 and May 31, 2017 are approximately as follows:
| | |
| 2018 | | 2017 |
| $242,500 | | $242,500 |
In fiscal years 2018 and 2017, All Other Fees primarily consists of fees billed for internal control examinations of the registrant’s transfer agent and investment adviser.
(e)(1) Audit Committee Pre-Approval Policies and Procedures
The registrant’s Audit Committee is required to pre-approve the engagement of the registrant’s independent auditors to provide audit and non-audit services to the registrant and non-audit services to its investment adviser (excluding any sub-adviser whose role is primarily portfolio management and is sub-contracted or overseen by another investment adviser (the “Adviser”) or any entity controlling, controlled by or under common control with the Adviser that provides ongoing services to the Fund (a “Control Affiliate”) if the engagement relates directly to the operations and financial reporting of the registrant.
The Audit Committee has adopted a Policy for Engagement of Independent Auditors for Audit and Non-Audit Services (the “Policy”). The Policy sets forth the understanding of the Audit Committee regarding the engagement of the registrant’s independent accountants to provide (i) audit and permissible audit-related, tax and other services to the registrant (“Fund Services”); (ii) non-audit services to the registrant’s Adviser and any Control Affiliates, that relates directly to the operations and financial reporting of a Fund (“Fund-related Adviser Services”); and (iii) certain other audit and non-audit services to the registrant’s Adviser and its Control Affiliates. A service will require specific pre-approval by the Audit Committee if it is to be provided by the Fund’s independent auditor; provided, however, that pre-approval of non-audit services to the Fund, the Adviser or Control Affiliates may be waived if certain de minimis requirements set forth in the SEC’s rules are met.
Under the Policy, the Audit Committee may delegate pre-approval authority to any pre-designated member or members who are independent board members. The member(s) to whom such authority is delegated must report, for informational purposes only, any pre-approval decisions to the Audit Committee at its next regular meeting. The Audit Committee’s responsibilities with respect to the pre-approval of services performed by the independent auditor may not be delegated to management.
On an annual basis, at a regularly scheduled Audit Committee meeting, the Fund’s Treasurer or other Fund officer shall submit to the Audit Committee a schedule of the types of Fund Services and Fund-related Adviser Services that are subject to specific pre-approval. This schedule will provide a description of each type of service that is subject to specific pre-approval, along with total projected fees for each service. The pre-approval will generally cover a one-year period. The Audit Committee will review and approve the types of services and the projected fees for the next one-year period and may
add to, or subtract from, the list of pre-approved services from time to time, based on subsequent determinations. This specific approval acknowledges that the Audit Committee is in agreement with the specific types of services that the independent auditor will be permitted to perform and the projected fees for each service.
The Fund’s Treasurer or other Fund officer shall report to the Audit Committee at each of its regular meetings regarding all Fund Services or Fund-related Adviser Services provided since the last such report was rendered, including a description of the services, by category, with forecasted fees for the annual reporting period, proposed changes requiring specific pre-approval and a description of services provided by the independent auditor, by category, with actual fees during the current reporting period.
*****
(e)(2) 100% of the services performed for items (b) through (d) above during 2018 and 2017 were pre-approved by the registrant’s Audit Committee.
(f) Not applicable.
(g) The aggregate non-audit fees billed by the registrant’s accountant for services rendered to the registrant, and rendered to the registrant’s investment adviser (not including any sub-adviser whose role is primarily portfolio management and is subcontracted with or overseen by another investment adviser), and any entity controlling, controlled by, or under common control with the adviser that provides ongoing services to the registrant during the fiscal years ended May 31, 2018 and May 31, 2017 are approximately as follows:
| | |
| 2018 | | 2017 |
| $287,400 | | $271,800 |
(h) The registrant’s Audit Committee of the Board of Directors has considered whether the provision of non-audit services that were rendered to the registrant’s adviser (not including any sub-adviser whose role is primarily portfolio management and is subcontracted with or overseen by another investment adviser), and any entity controlling, controlled by, or under common control with the investment adviser that provides ongoing services to the registrant that were not pre-approved pursuant to paragraph (c)(7)(ii) of Rule 2-01 of Regulation S-X, is compatible with maintaining the principal accountant’s independence.
| Item 5. | Audit Committee of Listed Registrants. |
Not applicable.
| | (a) | The registrant’s “Schedule I – Investments in securities of unaffiliated issuers” (as set forth in 17 CFR 210.12-12) is included in Item 1 of this Form N-CSR. |
| Item 7. | Disclosure of Proxy Voting Policies and Procedures for Closed-End Management Investment Companies. |
Not applicable.
| Item 8. | Portfolio Managers of Closed-End Management Investment Companies. |
Not applicable.
| Item 9. | Purchases of Equity Securities by Closed-End Management Investment Company and Affiliated Purchasers. |
Not applicable.
| Item 10. | Submission of Matters to a Vote of Security Holders. |
There were no material changes to the procedures by which shareholders may recommend nominees to the registrant’s board of directors.
| Item 11. | Controls and Procedures. |
| | (a) | The registrant’s principal executive officer and principal financial officer, based on their evaluation of the registrant’s disclosure controls and procedures as of a date within 90 days of the filing of this report, have concluded that such controls and procedures are adequately designed to ensure that material information required to be disclosed by the registrant in Form N-CSR is accumulated and communicated to the registrant’s management, including the principal executive officer and principal financial officer, or persons performing similar functions, as appropriate to allow timely decisions regarding required disclosure. |
| | (b) | There was no change in the registrant’s internal control over financial reporting that occurred during the registrant’s second fiscal quarter of the period covered by this report that has materially affected, or is reasonably likely to materially affect, the registrant’s internal control over financial reporting. |
| Item 12. | Disclosure of Securities Lending Activities for Closed-End Management Investment Companies |
Not applicable.
(a)(1) Code of ethics required to be disclosed under Item 2 of Form N-CSR attached hereto as Exhibit 99.CODE ETH.
(a)(2) Certifications pursuant to Rule 30a-2(a) under the Investment Company Act of 1940 (17 CFR 270.30a-2(a)) attached hereto as Exhibit 99.CERT.
(a)(3) Not applicable.
(b) Certification pursuant to Rule 30a-2(b) under the Investment Company Act of 1940 (17 CFR 270.30a-2(b)) attached hereto as Exhibit 99.906CERT.
SIGNATURES
Pursuant to the requirements of the Securities Exchange Act of 1934 and the Investment Company Act of 1940, the registrant has duly caused this report to be signed on its behalf by the undersigned, thereunto duly authorized.
(registrant) Columbia Funds Series Trust I
By (Signature and Title) /s/ Christopher O. Petersen
Christopher O. Petersen, President and Principal Executive Officer
Date July 23, 2018
Pursuant to the requirements of the Securities Exchange Act of 1934 and the Investment Company Act of 1940, this report has been signed below by the following persons on behalf of the registrant and in the capacities and on the dates indicated.
By (Signature and Title) /s/ Christopher O. Petersen
Christopher O. Petersen, President and Principal Executive Officer
Date July 23, 2018
By (Signature and Title) /s/ Michael G. Clarke
Michael G. Clarke, Treasurer and Chief Financial Officer
Date July 23, 2018