UNITED STATES
SECURITIES AND EXCHANGE COMMISSION
Washington, D.C. 20549
FORM N-CSR
CERTIFIED SHAREHOLDER REPORT OF REGISTERED
MANAGEMENT INVESTMENT COMPANIES
Investment Company Act file number 811-04367
Columbia Funds Series Trust I
(Exact name of registrant as specified in charter)
225 Franklin Street
Boston, Massachusetts 02110
(Address of principal executive offices) (Zip code)
Christopher O. Petersen, Esq.
c/o Columbia Management Investment Advisers, LLC
225 Franklin Street
Boston, Massachusetts 02110
Ryan C. Larrenaga, Esq.
c/o Columbia Management Investment Advisers, LLC
225 Franklin Street
Boston, MA 02110
(Name and address of agent for service)
Registrant’s telephone number, including area code: (800) 345-6611
Date of fiscal year end: August 31
Date of reporting period: August 31, 2018
Form N-CSR is to be used by management investment companies to file reports with the Commission not later than 10 days after the transmission to stockholders of any report that is required to be transmitted to stockholders under Rule 30e-1 under the Investment Company Act of 1940 (17 CFR 270.30e-1). The Commission may use the information provided on Form N-CSR in its regulatory, disclosure review, inspection, and policymaking roles.
A registrant is required to disclose the information specified by Form N-CSR, and the Commission will make this information public. A registrant is not required to respond to the collection of information contained in Form N-CSR unless the Form displays a currently valid Office of Management and Budget (“OMB”) control number. Please direct comments concerning the accuracy of the information collection burden estimate and any suggestions for reducing the burden to Secretary, Securities and Exchange Commission, 450 Fifth Street, NW, Washington, DC 20549-0609. The OMB has reviewed this collection of information under the clearance requirements of 44 U.S.C. § 3507.
Item 1. Reports to Stockholders.

Annual Report
August 31, 2018
Columbia Contrarian Core Fund
Not FDIC Insured • No bank guarantee • May lose value
Dear Shareholders,
Volatility exists in financial markets and this is not a comfortable fact of life. How investors deal with this reality, including how they react to short term spikes in volatility as well as to longer periods of increased or decreased volatility, may have a significant impact on their overall investing success.
Too often, investors change their investment strategy based on something that’s happening at a moment in time rather than thinking about how that change in strategy might affect their ability to achieve their longer-term financial goals. Emotion replaces logic and reasoning. Investors may sell in reaction to a market drop (fear or panic), locking in low returns which means they won’t be invested when the market returns, or they invest more at a market peak (greed or conviction), essentially when it is expensive to do so. In both cases, selling and buying at the exact wrong time.
We believe the best outcomes come from a consistent approach to investing. Here are five areas where advisors can help us overcome the tendency to react emotionally as we struggle to make the right choices with our investments:
Long-term focus
The further away long-term goals, aspirations and objectives are, the easier it is to stray away from the goals and priorities that we set out. Advisors help us stay focused on what we want to accomplish.
Discipline through up-and-down markets
Advisors help set rules to prevent us from making rash decisions that we may regret later. Knowing ahead of time what you should do in case of certain situations will help you get through volatile markets and not make emotional decisions.
Tax-awareness
Taxes are one of the biggest drags on investment returns and are critical attributes of investing. Yet few of us take the necessary steps to ease the corrosive effect of taxes. Advisors have tools and knowledge that may help us to manage portfolios more tax-efficiently and keep more of what we earn.
Emotional objectivity
Our emotions are very hard to manage and making investment decisions in an emotional state can lead to exceedingly bad outcomes. An objective advisor can help prevent some of the reactionary mistakes emotions often lead us to.
Education and guidance
The role of the advisor is to teach and guide us toward achieving our financial goals. In terms of working through emotions, guidance is by far the most important component.
By understanding our own behaviors and biases, we can prepare for future challenges. Your success is our priority. Talk to your advisor about how working with Columbia Threadneedle Investments may help you stay the course and position your portfolio for consistent, sustainable outcomes, regardless of market conditions.
Sincerely,
Christopher O. Petersen
President, Columbia Funds
Columbia Funds are distributed by Columbia Management Investment Distributors, Inc., member FINRA, and managed by Columbia Management Investment Advisers, LLC.
© 2018 Columbia Management Investment Advisers, LLC. All rights reserved.
Columbia Contrarian Core Fund | Annual Report 2018
Columbia Contrarian Core Fund | Annual Report 2018
Investment objective
Columbia Contrarian Core Fund (the Fund) seeks total return, consisting of long-term capital appreciation and current income.
Portfolio management
Guy Pope, CFA
Portfolio Manager
Managed Fund since 2005
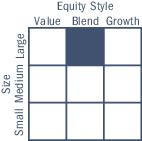
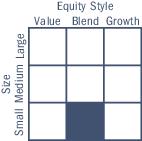
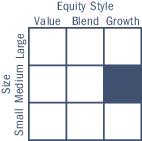
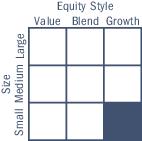
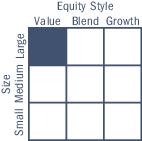
Morningstar style boxTM
The Morningstar Style Box is based on a fund’s portfolio holdings. For equity funds, the vertical axis shows the market capitalization of the stocks owned, and the horizontal axis shows investment style (value, blend, or growth). Information shown is based on the most recent data provided by Morningstar.
© 2018 Morningstar, Inc. All rights reserved. The Morningstar information contained herein: (1) is proprietary to Morningstar and/or its content providers; (2) may not be copied or distributed; and (3) is not warranted to be accurate, complete or timely. Neither Morningstar nor its content providers are responsible for any damages or losses arising from any use of this information.
| Average annual total returns (%) (for the period ended August 31, 2018) |
| | | Inception | 1 Year | 5 Years | 10 Years |
| Class A | Excluding sales charges | 11/01/98 | 13.09 | 12.90 | 10.95 |
| | Including sales charges | | 6.59 | 11.57 | 10.29 |
| Advisor Class* | 11/08/12 | 13.39 | 13.18 | 11.23 |
| Class C | Excluding sales charges | 12/09/02 | 12.23 | 12.05 | 10.12 |
| | Including sales charges | | 11.23 | 12.05 | 10.12 |
| Institutional Class | 12/14/92 | 13.37 | 13.18 | 11.22 |
| Institutional 2 Class* | 11/08/12 | 13.50 | 13.31 | 11.30 |
| Institutional 3 Class* | 11/08/12 | 13.50 | 13.37 | 11.34 |
| Class R* | 09/27/10 | 12.78 | 12.62 | 10.68 |
| Class T* | Excluding sales charges | 09/27/10 | 13.09 | 12.89 | 10.95 |
| | Including sales charges | | 10.27 | 12.32 | 10.66 |
| Class V | Excluding sales charges | 02/12/93 | 13.09 | 12.88 | 10.91 |
| | Including sales charges | | 6.57 | 11.55 | 10.25 |
| Russell 1000 Index | | 19.82 | 14.36 | 10.93 |
Returns for Class A and Class V shares are shown with and without the maximum initial sales charge of 5.75%. Returns for Class C shares are shown with and without the 1.00% contingent deferred sales charge for the first year only. Returns for Class T shares are shown with and without the maximum initial sales charge of 2.50% per transaction. The Fund’s other share classes are not subject to sales charges and have limited eligibility. Effective November 1, 2017, Class R4, Class R5, Class Y and Class Z shares were renamed Advisor Class, Institutional 2 Class, Institutional 3 Class and Institutional Class shares, respectively. Please see the Fund’s prospectus for details. Performance for different share classes will vary based on differences in sales charges and fees associated with each share class. All results shown assume reinvestment of distributions during the period. Returns do not reflect the deduction of taxes that a shareholder may pay on Fund distributions or on the redemption of Fund shares. Performance results reflect the effect of any fee waivers or reimbursements of Fund expenses by Columbia Management Investment Advisers, LLC and/or any of its affiliates. Absent these fee waivers or expense reimbursement arrangements, performance results would have been lower.
The performance information shown represents past performance and is not a guarantee of future results. The investment return and principal value of your investment will fluctuate so that your shares, when redeemed, may be worth more or less than their original cost. Current performance may be lower or higher than the performance information shown. You may obtain performance information current to the most recent month-end by contacting your financial intermediary, visiting columbiathreadneedleus.com/investor/ or calling 800.345.6611.
| * | The returns shown for periods prior to the share class inception date (including returns for the Life of the Fund, if shown, which are since Fund inception) include the returns of the Fund’s oldest share class. These returns are adjusted to reflect any higher class-related operating expenses of the newer share classes, as applicable. Please visit columbiathreadneedleus.com/investor/investment-products/mutual-funds/appended-performance for more information. |
The Russell 1000 Index tracks the performance of 1,000 of the largest U.S. companies, based on market capitalization.
Indices are not available for investment, are not professionally managed and do not reflect sales charges, fees, brokerage commissions, taxes or other expenses of investing. Securities in the Fund may not match those in an index.
| 2 | Columbia Contrarian Core Fund | Annual Report 2018 |
Fund at a Glance (continued)
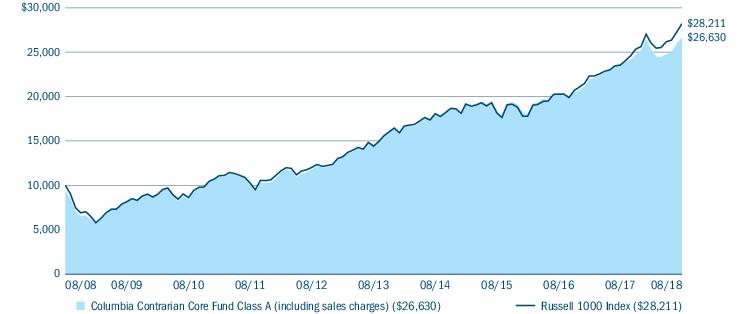
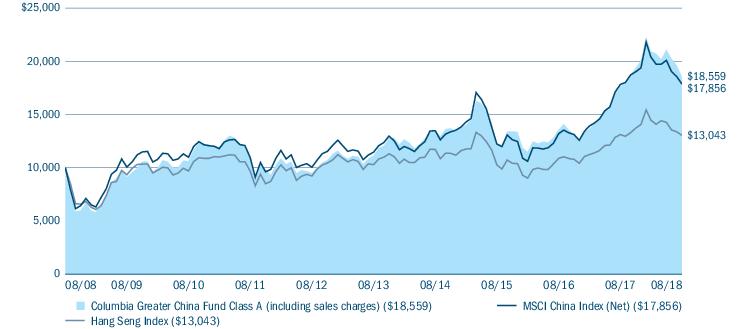
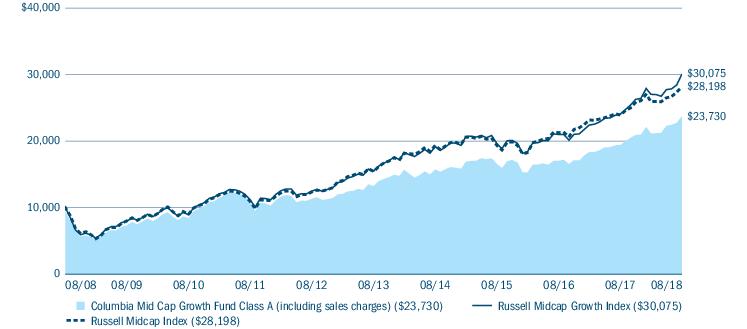
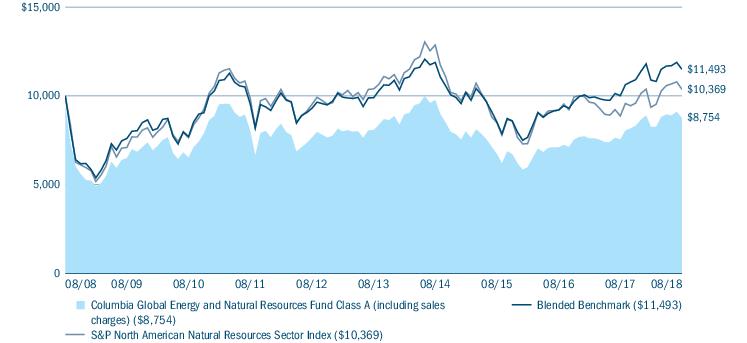
Performance of a hypothetical $10,000 investment (August 31, 2008 — August 31, 2018)
The chart above shows the change in value of a hypothetical $10,000 investment in Class A shares of Columbia Contrarian Core Fund during the stated time period, and does not reflect the deduction of taxes that a shareholder may pay on Fund distributions or on the redemption of Fund shares.
| Top 10 holdings (%) (at August 31, 2018) |
| Apple, Inc. | 5.5 |
| Microsoft Corp. | 4.6 |
| Amazon.com, Inc. | 3.6 |
| JPMorgan Chase & Co. | 3.3 |
| Facebook, Inc., Class A | 3.2 |
| Medtronic PLC | 2.9 |
| Alphabet, Inc., Class C | 2.8 |
| Berkshire Hathaway, Inc., Class B | 2.7 |
| Johnson & Johnson | 2.6 |
| MasterCard, Inc., Class A | 2.6 |
Percentages indicated are based upon total investments (excluding Money Market Funds and derivatives, if any).
For further detail about these holdings, please refer to the section entitled “Portfolio of Investments.”
Fund holdings are as of the date given, are subject to change at any time, and are not recommendations to buy or sell any security.
| Portfolio breakdown (%) (at August 31, 2018) |
| Common Stocks | 99.6 |
| Money Market Funds | 0.4 |
| Total | 100.0 |
Percentages indicated are based upon total investments and exclude investments in derivatives, if any. The Fund’s portfolio composition is subject to change.
| Equity sector breakdown (%) (at August 31, 2018) |
| Consumer Discretionary | 11.2 |
| Consumer Staples | 6.3 |
| Energy | 5.8 |
| Financials | 15.7 |
| Health Care | 16.9 |
| Industrials | 7.8 |
| Information Technology | 27.9 |
| Materials | 3.2 |
| Real Estate | 2.4 |
| Telecommunication Services | 2.1 |
| Utilities | 0.7 |
| Total | 100.0 |
Percentages indicated are based upon total equity investments. The Fund’s portfolio composition is subject to change.
Columbia Contrarian Core Fund | Annual Report 2018
| 3 |
Manager Discussion of Fund Performance
For the 12-month period that ended August 31, 2018, the Fund’s Class A shares returned 13.09% excluding sales charges. The Fund’s benchmark, the Russell 1000 Index, returned 19.82% for the same period. Stock selection in an environment unfavorable to the Fund’s contrarian style generally accounted for the shortfall relative to the benchmark.
Equity markets moved higher
U.S. equities delivered solid gains for the 12-month period that ended August 31, 2018, hitting record highs along the way. Buoyant corporate earnings, especially in the information technology sector, along with a strengthening domestic economy and a solid global economy, boosted investor sentiment. Consumer confidence was high, jobs data remained strong and personal income increased as the period wore on. Tax cuts approved by Congress late in 2017 had a favorable impact on corporate earnings and helped fuel investor optimism. Concerns that interest rates and inflation might rise faster than expected briefly put a damper on equity markets early in 2018, the first such correction in two years. Equities quickly recovered their lost ground — and then some. For the 12 months ended August 31, 2018, the S&P 500 Index, which measures the performance of 500 widely held, large-capitalization U.S. stocks and is frequently used as a general measure of market performance, gained 19.66%. Growth stocks outperformed value stocks, and small-cap stocks outperformed large- and mid-cap stocks.
The Federal Reserve (the Fed) raised the federal funds target rate three times during the period, to 1.75% - 2.00%, citing strong job growth and inflation in line with its 2.0% target. The yield on the 10-year U.S. Treasury ended the period at 2.86%.
Contributors and detractors
In a generally favorable period for equities, the Fund generated solid gains. Sector allocation decisions were positive for performance, while stock selection generally accounted for the Fund’s shortfall relative to its benchmark. Market dynamics shifted, and stylistically, it became more challenging to find gems that were consistent with our contrarian philosophy.
An underweight in utilities and good stock selection in the materials sector aided Fund performance. In utilities, we did well because the Fund was underweight and the sector underperformed. In the materials sector, a position in Sherwin Williams aided results, as domestic fundamentals for the paint giant were strong. Elsewhere in the portfolio, disappointments were mostly stock specific. Citigroup, in the financials sector, detracted from performance as investors worried about a global slowdown in economic growth. Citigroup is more international than its peers. Gains from JPMorgan were not enough to offset the loss from Citigroup. In the energy sector, Haliburton was a poor performer, suffering from a slowdown in the pressure pumping business, which faced a deteriorating demand outlook. A significant gain from a position in EOG was not enough to offset this disappointment. An outsized position in Phillip Morris in the consumer staples sector was a drag on performance as the company suffered from a slowdown in its smokeless business. Demand slowed in Japan and a strong dollar hurt expected revenues as well. Despite strong gains from technology positions in Mastercard, Palo Alto, Cisco, Apple and Microsoft, the Fund underperformed the broad sector with significant disappointments from Facebook and Broadcom. A combination of concerns over privacy, which led to increased spending, and slower revenue growth led investors to mark down future earnings expectations for Facebook. Slower growth for semiconductors combined with unmet investor expectations led Broadcom lower. The company’s unsuccessful bid for Qualcomm was not well received, nor was the subsequent acquisition of CA Technologies.
Even though retailers helped boost gains in the consumer discretionary sector, exposure to Comcast was a drag on performance. Investors rejected the company’s efforts to acquire Sky Media and Fox Network. Fears about cable cord cutting also weighed on Comcast’s share price. Good performance from several key health care stocks, namely Abbott Laboratories and Anthem, was more than offset by negative performance from biotechnology holdings Allergan and Celgene. Patent protection figured into the downfall of both stocks. We sold the Fund’s position in Celgene during the period.
At period’s end
Although the Fund underperformed its benchmark, we remain believers in our contrarian philosophy. We plan to stay with our core principles in constructing the portfolio and managing it from day to day, as we believe this discipline has served our shareholders well over the long term.
| 4 | Columbia Contrarian Core Fund | Annual Report 2018 |
Manager Discussion of Fund Performance (continued)
Market risk may affect a single issuer, sector of the economy, industry or the market as a whole. Foreign investments subject the Fund to risks, including political, economic, market, social and others within a particular country, as well as to currency instabilities and less stringent financial and accounting standards generally applicable to U.S. issuers. Growth securities, at times, may not perform as well as value securities or the stock market in general and may be out of favor with investors. Value securities may be unprofitable if the market fails to recognize their intrinsic worth or the portfolio manager misgauged that worth. The Fund may invest significantly in issuers within a particular sector, which may be negatively affected by market, economic or other conditions, making the Fund more vulnerable to unfavorable developments in the sector. See the Fund’s prospectus for information on these and other risks.
The views expressed in this report reflect the current views of the respective parties. These views are not guarantees of future performance and involve certain risks, uncertainties and assumptions that are difficult to predict, so actual outcomes and results may differ significantly from the views expressed. These views are subject to change at any time based upon economic, market or other conditions and the respective parties disclaim any responsibility to update such views. These views may not be relied on as investment advice and, because investment decisions for a Columbia fund are based on numerous factors, may not be relied on as an indication of trading intent on behalf of any particular Columbia fund. References to specific securities should not be construed as a recommendation or investment advice.
Columbia Contrarian Core Fund | Annual Report 2018
| 5 |
Understanding Your Fund’s Expenses
(Unaudited)
As an investor, you incur two types of costs. There are shareholder transaction costs, which generally include sales charges on purchases and may include redemption fees. There are also ongoing costs, which generally include management fees, distribution and/or service fees, and other fund expenses. The following information is intended to help you understand your ongoing costs (in dollars) of investing in the Fund and to help you compare these costs with the ongoing costs of investing in other mutual funds.
Analyzing your Fund’s expenses
To illustrate these ongoing costs, we have provided examples and calculated the expenses paid by investors in each share class of the Fund during the period. The actual and hypothetical information in the table is based on an initial investment of $1,000 at the beginning of the period indicated and held for the entire period. Expense information is calculated two ways and each method provides you with different information. The amount listed in the “Actual” column is calculated using the Fund’s actual operating expenses and total return for the period. You may use the Actual information, together with the amount invested, to estimate the expenses that you paid over the period. Simply divide your account value by $1,000 (for example, an $8,600 account value divided by $1,000 = 8.6), then multiply the results by the expenses paid during the period under the “Actual” column. The amount listed in the “Hypothetical” column assumes a 5% annual rate of return before expenses (which is not the Fund’s actual return) and then applies the Fund’s actual expense ratio for the period to the hypothetical return. You should not use the hypothetical account values and expenses to estimate either your actual account balance at the end of the period or the expenses you paid during the period. See “Compare with other funds” below for details on how to use the hypothetical data.
Compare with other funds
Since all mutual funds are required to include the same hypothetical calculations about expenses in shareholder reports, you can use this information to compare the ongoing cost of investing in the Fund with other funds. To do so, compare the hypothetical example with the 5% hypothetical examples that appear in the shareholder reports of other funds. As you compare hypothetical examples of other funds, it is important to note that hypothetical examples are meant to highlight the ongoing costs of investing in a fund only and do not reflect any transaction costs, such as sales charges, or redemption or exchange fees. Therefore, the hypothetical calculations are useful in comparing ongoing costs only, and will not help you determine the relative total costs of owning different funds. If transaction costs were included in these calculations, your costs would be higher.
| March 1, 2018 — August 31, 2018 |
| | Account value at the
beginning of the
period ($) | Account value at the
end of the
period ($) | Expenses paid during
the period ($) | Fund’s annualized
expense ratio (%) |
| | Actual | Hypothetical | Actual | Hypothetical | Actual | Hypothetical | Actual |
| Class A | 1,000.00 | 1,000.00 | 1,051.80 | 1,020.06 | 5.28 | 5.19 | 1.02 |
| Advisor Class | 1,000.00 | 1,000.00 | 1,053.60 | 1,021.32 | 3.99 | 3.92 | 0.77 |
| Class C | 1,000.00 | 1,000.00 | 1,048.20 | 1,016.28 | 9.14 | 9.00 | 1.77 |
| Institutional Class | 1,000.00 | 1,000.00 | 1,053.40 | 1,021.32 | 3.99 | 3.92 | 0.77 |
| Institutional 2 Class | 1,000.00 | 1,000.00 | 1,054.10 | 1,021.78 | 3.52 | 3.47 | 0.68 |
| Institutional 3 Class | 1,000.00 | 1,000.00 | 1,054.00 | 1,022.03 | 3.26 | 3.21 | 0.63 |
| Class R | 1,000.00 | 1,000.00 | 1,050.60 | 1,018.80 | 6.56 | 6.46 | 1.27 |
| Class T | 1,000.00 | 1,000.00 | 1,052.20 | 1,020.06 | 5.28 | 5.19 | 1.02 |
| Class V | 1,000.00 | 1,000.00 | 1,052.00 | 1,020.06 | 5.28 | 5.19 | 1.02 |
Expenses paid during the period are equal to the annualized expense ratio for each class as indicated above, multiplied by the average account value over the period and then multiplied by the number of days in the Fund’s most recent fiscal half year and divided by 365.
Expenses do not include fees and expenses incurred indirectly by the Fund from its investment in underlying funds, including affiliated and non-affiliated pooled investment vehicles, such as mutual funds and exchange-traded funds.
| 6 | Columbia Contrarian Core Fund | Annual Report 2018 |
Portfolio of Investments
August 31, 2018
(Percentages represent value of investments compared to net assets)
Investments in securities
| Common Stocks 99.0% |
| Issuer | Shares | Value ($) |
| Consumer Discretionary 11.2% |
| Hotels, Restaurants & Leisure 1.7% |
| McDonald’s Corp. | 715,303 | 116,043,606 |
| Royal Caribbean Cruises Ltd. | 689,725 | 84,546,490 |
| Total | | 200,590,096 |
| Internet & Direct Marketing Retail 4.1% |
| Amazon.com, Inc.(a) | 205,975 | 414,567,942 |
| Expedia Group, Inc. | 414,350 | 54,072,675 |
| Total | | 468,640,617 |
| Media 1.7% |
| Comcast Corp., Class A | 5,333,531 | 197,287,311 |
| Multiline Retail 0.5% |
| Dollar General Corp. | 475,538 | 51,229,709 |
| Specialty Retail 1.1% |
| AutoZone, Inc.(a) | 72,421 | 55,538,217 |
| Lowe’s Companies, Inc. | 583,939 | 63,503,366 |
| Ulta Beauty, Inc.(a) | 48,558 | 12,625,080 |
| Total | | 131,666,663 |
| Textiles, Apparel & Luxury Goods 2.1% |
| PVH Corp. | 968,908 | 138,708,869 |
| Tapestry, Inc. | 1,955,295 | 99,113,904 |
| Total | | 237,822,773 |
| Total Consumer Discretionary | 1,287,237,169 |
| Consumer Staples 6.2% |
| Beverages 0.3% |
| PepsiCo, Inc. | 257,822 | 28,878,642 |
| Food & Staples Retailing 0.7% |
| SYSCO Corp. | 1,157,416 | 86,597,865 |
| Food Products 3.1% |
| ConAgra Foods, Inc. | 2,149,080 | 78,978,690 |
| General Mills, Inc. | 1,866,620 | 85,883,186 |
| Mondelez International, Inc., Class A | 4,629,410 | 197,768,396 |
| Total | | 362,630,272 |
| Common Stocks (continued) |
| Issuer | Shares | Value ($) |
| Tobacco 2.1% |
| Philip Morris International, Inc. | 3,110,370 | 242,266,719 |
| Total Consumer Staples | 720,373,498 |
| Energy 5.7% |
| Energy Equipment & Services 1.0% |
| Halliburton Co. | 2,905,339 | 115,893,973 |
| Oil, Gas & Consumable Fuels 4.7% |
| Canadian Natural Resources Ltd. | 4,911,719 | 167,833,438 |
| Chevron Corp. | 1,980,323 | 234,589,063 |
| EOG Resources, Inc. | 1,205,828 | 142,565,044 |
| Total | | 544,987,545 |
| Total Energy | 660,881,518 |
| Financials 15.5% |
| Banks 8.3% |
| Citigroup, Inc. | 3,096,216 | 220,574,428 |
| JPMorgan Chase & Co. | 3,312,558 | 379,552,896 |
| U.S. Bancorp | 2,442,945 | 132,187,754 |
| Wells Fargo & Co. | 3,888,020 | 227,371,409 |
| Total | | 959,686,487 |
| Capital Markets 2.6% |
| Bank of New York Mellon Corp. (The) | 1,565,796 | 81,656,262 |
| BlackRock, Inc. | 189,297 | 90,684,621 |
| Morgan Stanley | 1,393,980 | 68,068,043 |
| S&P Global, Inc. | 276,145 | 57,175,822 |
| Total | | 297,584,748 |
| Diversified Financial Services 2.6% |
| Berkshire Hathaway, Inc., Class B(a) | 1,477,888 | 308,464,783 |
| Insurance 2.0% |
| American International Group, Inc. | 2,079,720 | 110,578,712 |
| Aon PLC | 815,326 | 118,678,853 |
| Total | | 229,257,565 |
| Total Financials | 1,794,993,583 |
The accompanying Notes to Financial Statements are an integral part of this statement.
Columbia Contrarian Core Fund | Annual Report 2018
| 7 |
Portfolio of Investments (continued)
August 31, 2018
| Common Stocks (continued) |
| Issuer | Shares | Value ($) |
| Health Care 16.7% |
| Biotechnology 3.4% |
| Alexion Pharmaceuticals, Inc.(a) | 727,220 | 88,895,373 |
| Biogen, Inc.(a) | 626,710 | 221,535,718 |
| Vertex Pharmaceuticals, Inc.(a) | 437,931 | 80,754,476 |
| Total | | 391,185,567 |
| Health Care Equipment & Supplies 3.7% |
| Abbott Laboratories | 1,397,249 | 93,392,123 |
| Medtronic PLC | 3,451,307 | 332,740,508 |
| Total | | 426,132,631 |
| Health Care Providers & Services 2.7% |
| Anthem, Inc. | 709,830 | 187,913,296 |
| CIGNA Corp. | 519,150 | 97,776,711 |
| CVS Health Corp. | 465,675 | 35,037,387 |
| Total | | 320,727,394 |
| Life Sciences Tools & Services 0.4% |
| Agilent Technologies, Inc. | 683,475 | 46,161,902 |
| Pharmaceuticals 6.5% |
| Allergan PLC | 835,385 | 160,151,659 |
| Johnson & Johnson | 2,223,726 | 299,513,655 |
| Pfizer, Inc. | 6,966,814 | 289,262,117 |
| Total | | 748,927,431 |
| Total Health Care | 1,933,134,925 |
| Industrials 7.7% |
| Aerospace & Defense 1.5% |
| General Dynamics Corp. | 441,285 | 85,344,519 |
| Lockheed Martin Corp. | 285,680 | 91,534,729 |
| Total | | 176,879,248 |
| Air Freight & Logistics 1.9% |
| FedEx Corp. | 881,897 | 215,138,773 |
| Airlines 0.6% |
| Southwest Airlines Co. | 1,058,056 | 64,858,833 |
| Electrical Equipment 0.6% |
| Emerson Electric Co. | 943,925 | 72,427,365 |
| Industrial Conglomerates 2.4% |
| Honeywell International, Inc. | 1,722,054 | 273,909,909 |
| Machinery 0.7% |
| Common Stocks (continued) |
| Issuer | Shares | Value ($) |
| Caterpillar, Inc. | 612,960 | 85,109,496 |
| Total Industrials | 888,323,624 |
| Information Technology 27.6% |
| Communications Equipment 1.6% |
| Cisco Systems, Inc. | 2,857,110 | 136,484,145 |
| Palo Alto Networks, Inc.(a) | 226,815 | 52,428,287 |
| Total | | 188,912,432 |
| Internet Software & Services 8.4% |
| Alphabet, Inc., Class A(a) | 151,808 | 186,997,094 |
| Alphabet, Inc., Class C(a) | 265,162 | 323,017,697 |
| eBay, Inc.(a) | 2,971,165 | 102,832,021 |
| Facebook, Inc., Class A(a) | 2,072,505 | 364,201,303 |
| Total | | 977,048,115 |
| IT Services 4.4% |
| Fidelity National Information Services, Inc. | 1,393,665 | 150,752,743 |
| First Data Corp., Class A(a) | 1,562,820 | 40,195,730 |
| MasterCard, Inc., Class A | 1,361,649 | 293,517,059 |
| Total System Services, Inc. | 197,185 | 19,154,551 |
| Total | | 503,620,083 |
| Semiconductors & Semiconductor Equipment 2.5% |
| Applied Materials, Inc. | 2,457,327 | 105,714,207 |
| Broadcom, Inc. | 629,490 | 137,877,195 |
| Microchip Technology, Inc. | 534,665 | 45,997,230 |
| Total | | 289,588,632 |
| Software 5.3% |
| Activision Blizzard, Inc. | 1,199,035 | 86,450,424 |
| Microsoft Corp. | 4,661,097 | 523,581,026 |
| Total | | 610,031,450 |
| Technology Hardware, Storage & Peripherals 5.4% |
| Apple, Inc. | 2,741,366 | 624,017,143 |
| Total Information Technology | 3,193,217,855 |
| Materials 3.1% |
| Chemicals 2.7% |
| DowDuPont, Inc. | 2,740,175 | 192,168,473 |
| Sherwin-Williams Co. (The) | 263,064 | 119,846,697 |
| Total | | 312,015,170 |
The accompanying Notes to Financial Statements are an integral part of this statement.
| 8 | Columbia Contrarian Core Fund | Annual Report 2018 |
Portfolio of Investments (continued)
August 31, 2018
| Common Stocks (continued) |
| Issuer | Shares | Value ($) |
| Containers & Packaging 0.3% |
| Sealed Air Corp. | 868,840 | 34,849,172 |
| Metals & Mining 0.1% |
| Nucor Corp. | 224,759 | 14,047,438 |
| Total Materials | 360,911,780 |
| Real Estate 2.4% |
| Equity Real Estate Investment Trusts (REITS) 2.4% |
| American Tower Corp. | 1,393,432 | 207,788,580 |
| Equinix, Inc. | 162,385 | 70,820,970 |
| Total | | 278,609,550 |
| Total Real Estate | 278,609,550 |
| Telecommunication Services 2.1% |
| Diversified Telecommunication Services 1.9% |
| AT&T, Inc. | 715,375 | 22,849,078 |
| Verizon Communications, Inc. | 3,618,933 | 196,761,387 |
| Total | | 219,610,465 |
| Wireless Telecommunication Services 0.2% |
| T-Mobile U.S.A., Inc.(a) | 380,885 | 25,153,645 |
| Total Telecommunication Services | 244,764,110 |
| Common Stocks (continued) |
| Issuer | Shares | Value ($) |
| Utilities 0.8% |
| Electric Utilities 0.8% |
| American Electric Power Co., Inc. | 1,196,900 | 85,853,637 |
| Total Utilities | 85,853,637 |
Total Common Stocks
(Cost $7,915,216,162) | 11,448,301,249 |
|
| Money Market Funds 0.4% |
| | Shares | Value ($) |
| Columbia Short-Term Cash Fund, 2.058%(b),(c) | 40,983,443 | 40,979,344 |
Total Money Market Funds
(Cost $40,979,344) | 40,979,344 |
Total Investments in Securities
(Cost: $7,956,195,506) | 11,489,280,593 |
| Other Assets & Liabilities, Net | | 71,126,837 |
| Net Assets | 11,560,407,430 |
Notes to Portfolio of Investments
| (a) | Non-income producing investment. |
| (b) | The rate shown is the seven-day current annualized yield at August 31, 2018. |
| (c) | As defined in the Investment Company Act of 1940, an affiliated company is one in which the Fund owns 5% or more of the company’s outstanding voting securities, or a company which is under common ownership or control with the Fund. Holdings and transactions in these affiliated companies during the year ended August 31, 2018 are as follows: |
| Issuer | Beginning
shares | Shares
purchased | Shares
sold | Ending
shares | Realized gain
(loss) —
affiliated
issuers ($) | Net change in
unrealized
appreciation
(depreciation) —
affiliated
issuers ($) | Dividends —
affiliated
issuers ($) | Value —
affiliated
issuers
at end of
period ($) |
| Columbia Short-Term Cash Fund, 2.058% |
| | 424,293,769 | 2,529,035,547 | (2,912,345,873) | 40,983,443 | 10,928 | (19,400) | 3,917,758 | 40,979,344 |
Fair value measurements
The Fund categorizes its fair value measurements according to a three-level hierarchy that maximizes the use of observable inputs and minimizes the use of unobservable inputs by prioritizing that the most observable input be used when available. Observable inputs are those that market participants would use in pricing an investment based on market data obtained from sources independent of the reporting entity. Unobservable inputs are those that reflect the Fund’s assumptions about the information market participants would use in pricing an investment. An investment’s level within the fair value hierarchy is based on the lowest level of any input that is deemed significant to the asset’s or liability’s fair value measurement. The input levels are not necessarily an indication of the risk or liquidity associated with investments at that level. For example, certain U.S. government securities are generally high quality and liquid, however, they are reflected as Level 2 because the inputs used to determine fair value may not always be quoted prices in an active market.
Fair value inputs are summarized in the three broad levels listed below:
| ■ | Level 1 — Valuations based on quoted prices for investments in active markets that the Fund has the ability to access at the measurement date. Valuation adjustments are not applied to Level 1 investments. |
The accompanying Notes to Financial Statements are an integral part of this statement.
Columbia Contrarian Core Fund | Annual Report 2018
| 9 |
Portfolio of Investments (continued)
August 31, 2018
Fair value measurements (continued)
| ■ | Level 2 — Valuations based on other significant observable inputs (including quoted prices for similar securities, interest rates, prepayment speeds, credit risks, etc.). |
| ■ | Level 3 — Valuations based on significant unobservable inputs (including the Fund’s own assumptions and judgment in determining the fair value of investments). |
Inputs that are used in determining fair value of an investment may include price information, credit data, volatility statistics, and other factors. These inputs can be either observable or unobservable. The availability of observable inputs can vary between investments, and is affected by various factors such as the type of investment, and the volume and level of activity for that investment or similar investments in the marketplace. The inputs will be considered by the Investment Manager, along with any other relevant factors in the calculation of an investment’s fair value. The Fund uses prices and inputs that are current as of the measurement date, which may include periods of market dislocations. During these periods, the availability of prices and inputs may be reduced for many investments. This condition could cause an investment to be reclassified between the various levels within the hierarchy.
Certain investments that have been measured at fair value using the net asset value (NAV) per share (or its equivalent) are not categorized in the fair value hierarchy. The fair value amounts presented in the table are intended to reconcile the fair value hierarchy to the amounts presented in the Portfolio of Investments. The Columbia Short-Term Cash Fund seeks to provide shareholders with maximum current income consistent with liquidity and stability of principal. Columbia Short-Term Cash Fund prices its shares with a floating NAV and no longer seeks to maintain a stable NAV.
Investments falling into the Level 3 category are primarily supported by quoted prices from brokers and dealers participating in the market for those investments. However, these may be classified as Level 3 investments due to lack of market transparency and corroboration to support these quoted prices. Additionally, valuation models may be used as the pricing source for any remaining investments classified as Level 3. These models may rely on one or more significant unobservable inputs and/or significant assumptions by the Investment Manager. Inputs used in valuations may include, but are not limited to, financial statement analysis, capital account balances, discount rates and estimated cash flows, and comparable company data.
Under the direction of the Fund’s Board of Trustees (the Board), the Investment Manager’s Valuation Committee (the Committee) is responsible for overseeing the valuation procedures approved by the Board. The Committee consists of voting and non-voting members from various groups within the Investment Manager’s organization, including operations and accounting, trading and investments, compliance, risk management and legal.
The Committee meets at least monthly to review and approve valuation matters, which may include a description of specific valuation determinations, data regarding pricing information received from approved pricing vendors and brokers and the results of Board-approved valuation control policies and procedures (the Policies). The Policies address, among other things, instances when market quotations are or are not readily available, including recommendations of third party pricing vendors and a determination of appropriate pricing methodologies; events that require specific valuation determinations and assessment of fair value techniques; securities with a potential for stale pricing, including those that are illiquid, restricted, or in default; and the effectiveness of third party pricing vendors, including periodic reviews of vendors. The Committee meets more frequently, as needed, to discuss additional valuation matters, which may include the need to review back-testing results, review time-sensitive information or approve related valuation actions. The Committee reports to the Board, with members of the Committee meeting with the Board at each of its regularly scheduled meetings to discuss valuation matters and actions during the period, similar to those described earlier.
For investments categorized as Level 3, the Committee monitors information similar to that described above, which may include: (i) data specific to the issuer or comparable issuers, (ii) general market or specific sector news and (iii) quoted prices and specific or similar security transactions. The Committee considers this data and any changes from prior periods in order to assess the reasonableness of observable and unobservable inputs, any assumptions or internal models used to value those securities and changes in fair value. This data is also used to corroborate, when available, information received from approved pricing vendors and brokers. Various factors impact the frequency of monitoring this information (which may occur as often as daily). However, the Committee may determine that changes to inputs, assumptions and models are not required as a result of the monitoring procedures performed.
The following table is a summary of the inputs used to value the Fund’s investments at August 31, 2018:
| | Level 1
quoted prices
in active
markets for
identical
assets ($) | Level 2
other
significant
observable
inputs ($) | Level 3
significant
unobservable
inputs ($) | Investments
measured at
net asset
value ($) | Total ($) |
| Investments in Securities | | | | | |
| Common Stocks | | | | | |
| Consumer Discretionary | 1,287,237,169 | — | — | — | 1,287,237,169 |
| Consumer Staples | 720,373,498 | — | — | — | 720,373,498 |
| Energy | 660,881,518 | — | — | — | 660,881,518 |
| Financials | 1,794,993,583 | — | — | — | 1,794,993,583 |
| Health Care | 1,933,134,925 | — | — | — | 1,933,134,925 |
| Industrials | 888,323,624 | — | — | — | 888,323,624 |
| Information Technology | 3,193,217,855 | — | — | — | 3,193,217,855 |
| Materials | 360,911,780 | — | — | — | 360,911,780 |
| Real Estate | 278,609,550 | — | — | — | 278,609,550 |
| Telecommunication Services | 244,764,110 | — | — | — | 244,764,110 |
| Utilities | 85,853,637 | — | — | — | 85,853,637 |
| Total Common Stocks | 11,448,301,249 | — | — | — | 11,448,301,249 |
| Money Market Funds | — | — | — | 40,979,344 | 40,979,344 |
| Total Investments in Securities | 11,448,301,249 | — | — | 40,979,344 | 11,489,280,593 |
See the Portfolio of Investments for all investment classifications not indicated in the table.
There were no transfers of financial assets between levels during the period.
The accompanying Notes to Financial Statements are an integral part of this statement.
| 10 | Columbia Contrarian Core Fund | Annual Report 2018 |
Statement of Assets and Liabilities
August 31, 2018
| Assets | |
| Investments in securities, at value | |
| Unaffiliated issuers (cost $7,915,216,162) | $11,448,301,249 |
| Affiliated issuers (cost $40,979,344) | 40,979,344 |
| Receivable for: | |
| Investments sold | 81,465,607 |
| Capital shares sold | 5,282,223 |
| Dividends | 17,096,800 |
| Foreign tax reclaims | 121,672 |
| Prepaid expenses | 73,030 |
| Trustees’ deferred compensation plan | 491,958 |
| Total assets | 11,593,811,883 |
| Liabilities | |
| Due to custodian | 60 |
| Payable for: | |
| Investments purchased | 17,441,172 |
| Capital shares purchased | 13,396,808 |
| Management services fees | 193,053 |
| Distribution and/or service fees | 35,711 |
| Transfer agent fees | 1,542,738 |
| Compensation of chief compliance officer | 739 |
| Other expenses | 302,214 |
| Trustees’ deferred compensation plan | 491,958 |
| Total liabilities | 33,404,453 |
| Net assets applicable to outstanding capital stock | $11,560,407,430 |
| Represented by | |
| Paid in capital | 7,387,321,008 |
| Undistributed net investment income | 66,473,849 |
| Accumulated net realized gain | 573,527,486 |
| Unrealized appreciation (depreciation) on: | |
| Investments - unaffiliated issuers | 3,533,085,087 |
| Total - representing net assets applicable to outstanding capital stock | $11,560,407,430 |
The accompanying Notes to Financial Statements are an integral part of this statement.
Columbia Contrarian Core Fund | Annual Report 2018
| 11 |
Statement of Assets and Liabilities (continued)
August 31, 2018
| Class A | |
| Net assets | $1,912,202,854 |
| Shares outstanding | 70,315,998 |
| Net asset value per share | $27.19 |
| Maximum sales charge | 5.75% |
| Maximum offering price per share (calculated by dividing the net asset value per share by 1.0 minus the maximum sales charge for Class A shares) | $28.85 |
| Advisor Class | |
| Net assets | $743,515,496 |
| Shares outstanding | 26,662,428 |
| Net asset value per share | $27.89 |
| Class C | |
| Net assets | $708,041,457 |
| Shares outstanding | 28,815,770 |
| Net asset value per share | $24.57 |
| Institutional Class | |
| Net assets | $4,889,699,313 |
| Shares outstanding | 178,306,089 |
| Net asset value per share | $27.42 |
| Institutional 2 Class | |
| Net assets | $894,848,563 |
| Shares outstanding | 32,101,024 |
| Net asset value per share | $27.88 |
| Institutional 3 Class | |
| Net assets | $2,101,809,354 |
| Shares outstanding | 75,351,885 |
| Net asset value per share | $27.89 |
| Class R | |
| Net assets | $145,911,520 |
| Shares outstanding | 5,367,678 |
| Net asset value per share | $27.18 |
| Class T | |
| Net assets | $1,044,101 |
| Shares outstanding | 38,398 |
| Net asset value per share | $27.19 |
| Maximum sales charge | 2.50% |
| Maximum offering price per share (calculated by dividing the net asset value per share by 1.0 minus the maximum sales charge per transaction for Class T shares) | $27.89 |
| Class V | |
| Net assets | $163,334,772 |
| Shares outstanding | 6,064,756 |
| Net asset value per share | $26.93 |
| Maximum sales charge | 5.75% |
| Maximum offering price per share (calculated by dividing the net asset value per share by 1.0 minus the maximum sales charge for Class V shares) | $28.57 |
The accompanying Notes to Financial Statements are an integral part of this statement.
| 12 | Columbia Contrarian Core Fund | Annual Report 2018 |
Statement of Operations
Year Ended August 31, 2018
| Net investment income | |
| Income: | |
| Dividends — unaffiliated issuers | $194,140,860 |
| Dividends — affiliated issuers | 3,917,758 |
| Foreign taxes withheld | (670,221) |
| Total income | 197,388,397 |
| Expenses: | |
| Management services fees | 69,747,238 |
| Distribution and/or service fees | |
| Class A | 4,820,995 |
| Class C | 7,502,601 |
| Class R | 701,365 |
| Class T | 2,888 |
| Class V | 397,804 |
| Transfer agent fees | |
| Class A | 2,840,993 |
| Advisor Class | 1,015,812 |
| Class C | 1,105,073 |
| Institutional Class | 7,294,117 |
| Institutional 2 Class | 499,909 |
| Institutional 3 Class | 153,327 |
| Class K | 1,929 |
| Class R | 206,661 |
| Class T | 1,700 |
| Class V | 234,413 |
| Plan administration fees | |
| Class K | 8,271 |
| Compensation of board members | 187,987 |
| Custodian fees | 71,834 |
| Printing and postage fees | 590,837 |
| Registration fees | 274,554 |
| Audit fees | 34,301 |
| Legal fees | 268,515 |
| Compensation of chief compliance officer | 4,489 |
| Other | 263,831 |
| Total expenses | 98,231,444 |
| Expense reduction | (11,763) |
| Total net expenses | 98,219,681 |
| Net investment income | 99,168,716 |
| Realized and unrealized gain (loss) — net | |
| Net realized gain (loss) on: | |
| Investments — unaffiliated issuers | 736,125,600 |
| Investments — affiliated issuers | 10,928 |
| Foreign currency translations | 3,384 |
| Net realized gain | 736,139,912 |
| Net change in unrealized appreciation (depreciation) on: | |
| Investments — unaffiliated issuers | 591,473,814 |
| Investments — affiliated issuers | (19,400) |
| Net change in unrealized appreciation (depreciation) | 591,454,414 |
| Net realized and unrealized gain | 1,327,594,326 |
| Net increase in net assets resulting from operations | $1,426,763,042 |
The accompanying Notes to Financial Statements are an integral part of this statement.
Columbia Contrarian Core Fund | Annual Report 2018
| 13 |
Statement of Changes in Net Assets
| | Year Ended
August 31, 2018 | Year Ended
August 31, 2017 |
| Operations | | |
| Net investment income | $99,168,716 | $96,662,160 |
| Net realized gain | 736,139,912 | 476,645,774 |
| Net change in unrealized appreciation (depreciation) | 591,454,414 | 930,041,147 |
| Net increase in net assets resulting from operations | 1,426,763,042 | 1,503,349,081 |
| Distributions to shareholders | | |
| Net investment income | | |
| Class A | (13,688,620) | (19,193,883) |
| Advisor Class | (6,065,193) | (3,562,542) |
| Class C | — | (1) |
| Class I | — | (3,453,777) |
| Institutional Class | (45,538,309) | (38,846,630) |
| Institutional 2 Class | (8,571,940) | (5,967,141) |
| Institutional 3 Class | (20,115,690) | (3,854,161) |
| Class K | (48,187) | (40,230) |
| Class R | (641,230) | (451,640) |
| Class T | (8,444) | (843,456) |
| Class V | (1,127,941) | (968,097) |
| Net realized gains | | |
| Class A | (93,913,407) | (21,919,791) |
| Advisor Class | (31,380,381) | (3,005,305) |
| Class B | — | (42,890) |
| Class C | (40,119,346) | (5,729,742) |
| Class I | — | (2,474,135) |
| Institutional Class | (235,608,254) | (32,770,414) |
| Institutional 2 Class | (40,157,532) | (4,473,015) |
| Institutional 3 Class | (90,640,911) | (2,760,953) |
| Class K | (292,694) | (39,271) |
| Class R | (6,615,240) | (797,594) |
| Class T | (57,932) | (958,481) |
| Class V | (7,738,463) | (1,115,823) |
| Total distributions to shareholders | (642,329,714) | (153,268,972) |
| Decrease in net assets from capital stock activity | (116,288,386) | (392,465,869) |
| Total increase in net assets | 668,144,942 | 957,614,240 |
| Net assets at beginning of year | 10,892,262,488 | 9,934,648,248 |
| Net assets at end of year | $11,560,407,430 | $10,892,262,488 |
| Undistributed net investment income | $66,473,849 | $64,041,928 |
The accompanying Notes to Financial Statements are an integral part of this statement.
| 14 | Columbia Contrarian Core Fund | Annual Report 2018 |
Statement of Changes in Net Assets (continued)
| | Year Ended | Year Ended |
| | August 31, 2018 | August 31, 2017 |
| | Shares | Dollars ($) | Shares | Dollars ($) |
| Capital stock activity |
| Class A | | | | |
| Subscriptions | 12,208,122 | 316,921,667 | 24,532,402 | 567,339,209 |
| Distributions reinvested | 3,884,229 | 99,008,995 | 1,703,138 | 38,796,444 |
| Redemptions | (22,154,412) | (575,389,741) | (78,222,523) | (1,845,678,165) |
| Net decrease | (6,062,061) | (159,459,079) | (51,986,983) | (1,239,542,512) |
| Advisor Class | | | | |
| Subscriptions | 11,310,517 | 300,451,143 | 10,776,230 | 260,548,555 |
| Distributions reinvested | 1,389,820 | 36,260,392 | 279,486 | 6,506,429 |
| Redemptions | (8,970,419) | (238,568,015) | (4,694,624) | (112,458,762) |
| Net increase | 3,729,918 | 98,143,520 | 6,361,092 | 154,596,222 |
| Class B | | | | |
| Subscriptions | — | — | 10,229 | 211,772 |
| Distributions reinvested | — | — | 2,033 | 42,206 |
| Redemptions | — | — | (309,670) | (6,756,778) |
| Net decrease | — | — | (297,408) | (6,502,800) |
| Class C | | | | |
| Subscriptions | 4,636,954 | 109,134,302 | 8,279,732 | 176,276,614 |
| Distributions reinvested | 1,592,042 | 36,871,699 | 237,660 | 4,945,710 |
| Redemptions | (9,819,541) | (231,021,490) | (9,109,741) | (195,062,192) |
| Net decrease | (3,590,545) | (85,015,489) | (592,349) | (13,839,868) |
| Class I | | | | |
| Subscriptions | — | — | 619,606 | 13,527,383 |
| Distributions reinvested | — | — | 258,970 | 5,927,821 |
| Redemptions | — | — | (16,890,162) | (398,885,486) |
| Net decrease | — | — | (16,011,586) | (379,430,282) |
| Institutional Class | | | | |
| Subscriptions | 32,541,591 | 849,445,217 | 85,852,060 | 2,044,682,517 |
| Distributions reinvested | 10,065,737 | 258,286,816 | 2,284,114 | 52,351,890 |
| Redemptions | (57,893,556) | (1,516,465,968) | (83,135,098) | (2,002,573,073) |
| Net increase (decrease) | (15,286,228) | (408,733,935) | 5,001,076 | 94,461,334 |
| Institutional 2 Class | | | | |
| Subscriptions | 12,831,692 | 340,843,986 | 11,090,361 | 270,140,698 |
| Distributions reinvested | 1,868,398 | 48,709,121 | 448,671 | 10,436,073 |
| Redemptions | (12,546,333) | (332,078,939) | (9,119,270) | (216,839,757) |
| Net increase | 2,153,757 | 57,474,168 | 2,419,762 | 63,737,014 |
| Institutional 3 Class | | | | |
| Subscriptions | 29,449,843 | 779,912,063 | 49,850,577 | 1,240,699,466 |
| Distributions reinvested | 2,580,501 | 67,273,670 | 271,473 | 6,314,467 |
| Redemptions | (17,189,124) | (461,087,450) | (4,056,941) | (98,611,716) |
| Net increase | 14,841,220 | 386,098,283 | 46,065,109 | 1,148,402,217 |
| Class K | | | | |
| Subscriptions | 10,761 | 288,499 | 18,689 | 455,856 |
| Distributions reinvested | 13,282 | 340,682 | 3,468 | 79,454 |
| Redemptions | (269,627) | (7,180,214) | (13,564) | (307,763) |
| Net increase (decrease) | (245,584) | (6,551,033) | 8,593 | 227,547 |
| Class R | | | | |
| Subscriptions | 1,298,152 | 33,613,269 | 2,442,785 | 57,295,465 |
| Distributions reinvested | 229,073 | 5,848,237 | 40,077 | 914,165 |
| Redemptions | (1,370,468) | (35,554,329) | (1,605,994) | (37,805,368) |
| Net increase | 156,757 | 3,907,177 | 876,868 | 20,404,262 |
The accompanying Notes to Financial Statements are an integral part of this statement.
Columbia Contrarian Core Fund | Annual Report 2018
| 15 |
Statement of Changes in Net Assets (continued)
| | Year Ended | Year Ended |
| | August 31, 2018 | August 31, 2017 |
| | Shares | Dollars ($) | Shares | Dollars ($) |
| Class T | | | | |
| Subscriptions | 726 | 19,043 | 1,447,862 | 32,641,606 |
| Distributions reinvested | 2,595 | 66,153 | 79,099 | 1,801,867 |
| Redemptions | (18,306) | (475,567) | (11,365,827) | (257,363,851) |
| Net decrease | (14,985) | (390,371) | (9,838,866) | (222,920,378) |
| Class V | | | | |
| Subscriptions | 246,930 | 6,375,877 | 49,241 | 1,134,243 |
| Distributions reinvested | 250,684 | 6,329,782 | 64,778 | 1,462,036 |
| Redemptions | (564,074) | (14,467,286) | (633,299) | (14,654,904) |
| Net decrease | (66,460) | (1,761,627) | (519,280) | (12,058,625) |
| Total net decrease | (4,384,211) | (116,288,386) | (18,513,972) | (392,465,869) |
The accompanying Notes to Financial Statements are an integral part of this statement.
| 16 | Columbia Contrarian Core Fund | Annual Report 2018 |
[THIS PAGE INTENTIONALLY LEFT BLANK]
Columbia Contrarian Core Fund | Annual Report 2018
| 17 |
The following table is intended to help you understand the Fund’s financial performance. Certain information reflects financial results for a single share of a class held for the periods shown. Per share net investment income (loss) amounts are calculated based on average shares outstanding during the period. Total return assumes reinvestment of all dividends and distributions, if any. Total return does not reflect payment of sales charges, if any. Total return and portfolio turnover are not annualized for periods of less than one year. The portfolio turnover rate is calculated without regard to purchase and sales transactions of short-term instruments and certain derivatives, if any. If such transactions were included, the Fund’s portfolio turnover rate may be higher.
| | Net asset value,
beginning of
period | Net
investment
income
(loss) | Net
realized
and
unrealized
gain (loss) | Total from
investment
operations | Distributions
from net
investment
income | Distributions
from net
realized
gains | Total
distributions to
shareholders |
| Class A |
| Year Ended 8/31/2018 | $25.41 | 0.18 | 3.05 | 3.23 | (0.18) | (1.27) | (1.45) |
| Year Ended 8/31/2017 | $22.29 | 0.19 | 3.25 | 3.44 | (0.15) | (0.17) | (0.32) |
| Year Ended 8/31/2016 | $21.27 | 0.15 | 2.05 | 2.20 | (0.55) | (0.63) | (1.18) |
| Year Ended 8/31/2015 | $22.37 | 0.65 (d) | (0.23) | 0.42 | (0.10) | (1.42) | (1.52) |
| Year Ended 8/31/2014 | $19.15 | 0.14 | 4.32 | 4.46 | (0.11) | (1.13) | (1.24) |
| Advisor Class |
| Year Ended 8/31/2018 | $26.02 | 0.25 | 3.13 | 3.38 | (0.24) | (1.27) | (1.51) |
| Year Ended 8/31/2017 | $22.81 | 0.26 | 3.33 | 3.59 | (0.21) | (0.17) | (0.38) |
| Year Ended 8/31/2016 | $21.74 | 0.21 | 2.09 | 2.30 | (0.60) | (0.63) | (1.23) |
| Year Ended 8/31/2015 | $22.83 | 0.80 (d) | (0.32) | 0.48 | (0.15) | (1.42) | (1.57) |
| Year Ended 8/31/2014 | $19.52 | 0.20 | 4.40 | 4.60 | (0.16) | (1.13) | (1.29) |
| Class C |
| Year Ended 8/31/2018 | $23.09 | (0.01) | 2.76 | 2.75 | — | (1.27) | (1.27) |
| Year Ended 8/31/2017 | $20.28 | 0.01 | 2.97 | 2.98 | (0.00) (e) | (0.17) | (0.17) |
| Year Ended 8/31/2016 | $19.43 | (0.00) (e) | 1.86 | 1.86 | (0.38) | (0.63) | (1.01) |
| Year Ended 8/31/2015 | $20.62 | 0.50 (d) | (0.27) | 0.23 | — | (1.42) | (1.42) |
| Year Ended 8/31/2014 | $17.77 | (0.01) | 3.99 | 3.98 | — | (1.13) | (1.13) |
| Institutional Class |
| Year Ended 8/31/2018 | $25.61 | 0.25 | 3.07 | 3.32 | (0.24) | (1.27) | (1.51) |
| Year Ended 8/31/2017 | $22.45 | 0.25 | 3.29 | 3.54 | (0.21) | (0.17) | (0.38) |
| Year Ended 8/31/2016 | $21.42 | 0.21 | 2.05 | 2.26 | (0.60) | (0.63) | (1.23) |
| Year Ended 8/31/2015 | $22.52 | 0.66 (d) | (0.18) | 0.48 | (0.16) | (1.42) | (1.58) |
| Year Ended 8/31/2014 | $19.27 | 0.19 | 4.35 | 4.54 | (0.16) | (1.13) | (1.29) |
| Institutional 2 Class |
| Year Ended 8/31/2018 | $26.01 | 0.28 | 3.13 | 3.41 | (0.27) | (1.27) | (1.54) |
| Year Ended 8/31/2017 | $22.80 | 0.28 | 3.33 | 3.61 | (0.23) | (0.17) | (0.40) |
| Year Ended 8/31/2016 | $21.73 | 0.24 | 2.09 | 2.33 | (0.63) | (0.63) | (1.26) |
| Year Ended 8/31/2015 | $22.83 | 0.78 (d) | (0.28) | 0.50 | (0.18) | (1.42) | (1.60) |
| Year Ended 8/31/2014 | $19.52 | 0.23 | 4.39 | 4.62 | (0.18) | (1.13) | (1.31) |
The accompanying Notes to Financial Statements are an integral part of this statement.
| 18 | Columbia Contrarian Core Fund | Annual Report 2018 |
Financial Highlights (continued)
| | Net
asset
value,
end of
period | Total
return | Total gross
expense
ratio to
average
net assets(a) | Total net
expense
ratio to
average
net assets(a),(b) | Net investment
income (loss)
ratio to
average
net assets | Portfolio
turnover | Net
assets,
end of
period
(000’s) |
| Class A |
| Year Ended 8/31/2018 | $27.19 | 13.09% | 1.02% | 1.02% (c) | 0.70% | 63% | $1,912,203 |
| Year Ended 8/31/2017 | $25.41 | 15.61% | 1.04% | 1.04% (c) | 0.82% | 52% | $1,941,062 |
| Year Ended 8/31/2016 | $22.29 | 10.79% | 1.07% | 1.07% (c) | 0.72% | 47% | $2,860,806 |
| Year Ended 8/31/2015 | $21.27 | 1.99% | 1.09% | 1.09% (c) | 2.93% | 60% | $2,297,176 |
| Year Ended 8/31/2014 | $22.37 | 24.15% | 1.11% | 1.11% (c) | 0.69% | 65% | $1,659,841 |
| Advisor Class |
| Year Ended 8/31/2018 | $27.89 | 13.39% | 0.77% | 0.77% (c) | 0.95% | 63% | $743,515 |
| Year Ended 8/31/2017 | $26.02 | 15.91% | 0.80% | 0.80% (c) | 1.07% | 52% | $596,704 |
| Year Ended 8/31/2016 | $22.81 | 11.07% | 0.82% | 0.82% (c) | 0.99% | 47% | $377,946 |
| Year Ended 8/31/2015 | $21.74 | 2.25% | 0.85% | 0.85% (c) | 3.53% | 60% | $227,941 |
| Year Ended 8/31/2014 | $22.83 | 24.44% | 0.86% | 0.86% (c) | 0.94% | 65% | $105,458 |
| Class C |
| Year Ended 8/31/2018 | $24.57 | 12.23% | 1.77% | 1.77% (c) | (0.05%) | 63% | $708,041 |
| Year Ended 8/31/2017 | $23.09 | 14.80% | 1.79% | 1.79% (c) | 0.07% | 52% | $748,148 |
| Year Ended 8/31/2016 | $20.28 | 9.98% | 1.83% | 1.83% (c) | (0.02%) | 47% | $669,226 |
| Year Ended 8/31/2015 | $19.43 | 1.17% | 1.85% | 1.85% (c) | 2.46% | 60% | $409,798 |
| Year Ended 8/31/2014 | $20.62 | 23.22% | 1.86% | 1.86% (c) | (0.06%) | 65% | $222,834 |
| Institutional Class |
| Year Ended 8/31/2018 | $27.42 | 13.37% | 0.77% | 0.77% (c) | 0.95% | 63% | $4,889,699 |
| Year Ended 8/31/2017 | $25.61 | 15.95% | 0.80% | 0.80% (c) | 1.07% | 52% | $4,958,099 |
| Year Ended 8/31/2016 | $22.45 | 11.05% | 0.82% | 0.82% (c) | 0.99% | 47% | $4,234,639 |
| Year Ended 8/31/2015 | $21.42 | 2.24% | 0.84% | 0.84% (c) | 2.97% | 60% | $2,119,278 |
| Year Ended 8/31/2014 | $22.52 | 24.45% | 0.86% | 0.86% (c) | 0.93% | 65% | $1,831,114 |
| Institutional 2 Class |
| Year Ended 8/31/2018 | $27.88 | 13.50% | 0.68% | 0.68% | 1.04% | 63% | $894,849 |
| Year Ended 8/31/2017 | $26.01 | 16.05% | 0.69% | 0.69% | 1.17% | 52% | $779,002 |
| Year Ended 8/31/2016 | $22.80 | 11.22% | 0.70% | 0.70% | 1.12% | 47% | $627,659 |
| Year Ended 8/31/2015 | $21.73 | 2.34% | 0.71% | 0.71% | 3.45% | 60% | $336,043 |
| Year Ended 8/31/2014 | $22.83 | 24.60% | 0.73% | 0.73% | 1.08% | 65% | $209,498 |
The accompanying Notes to Financial Statements are an integral part of this statement.
Columbia Contrarian Core Fund | Annual Report 2018
| 19 |
Financial Highlights (continued)
| | Net asset value,
beginning of
period | Net
investment
income
(loss) | Net
realized
and
unrealized
gain (loss) | Total from
investment
operations | Distributions
from net
investment
income | Distributions
from net
realized
gains | Total
distributions to
shareholders |
| Institutional 3 Class |
| Year Ended 8/31/2018 | $26.03 | 0.29 | 3.12 | 3.41 | (0.28) | (1.27) | (1.55) |
| Year Ended 8/31/2017 | $22.81 | 0.30 | 3.33 | 3.63 | (0.24) | (0.17) | (0.41) |
| Year Ended 8/31/2016 | $21.75 | 0.27 | 2.06 | 2.33 | (0.64) | (0.63) | (1.27) |
| Year Ended 8/31/2015 | $22.84 | 1.19 (d) | (0.67) | 0.52 | (0.19) | (1.42) | (1.61) |
| Year Ended 8/31/2014 | $19.52 | 0.24 | 4.40 | 4.64 | (0.19) | (1.13) | (1.32) |
| Class R |
| Year Ended 8/31/2018 | $25.41 | 0.12 | 3.04 | 3.16 | (0.12) | (1.27) | (1.39) |
| Year Ended 8/31/2017 | $22.29 | 0.14 | 3.25 | 3.39 | (0.10) | (0.17) | (0.27) |
| Year Ended 8/31/2016 | $21.26 | 0.10 | 2.05 | 2.15 | (0.49) | (0.63) | (1.12) |
| Year Ended 8/31/2015 | $22.37 | 0.65 (d) | (0.29) | 0.36 | (0.05) | (1.42) | (1.47) |
| Year Ended 8/31/2014 | $19.15 | 0.09 | 4.32 | 4.41 | (0.06) | (1.13) | (1.19) |
| Class T |
| Year Ended 8/31/2018 | $25.41 | 0.18 | 3.05 | 3.23 | (0.18) | (1.27) | (1.45) |
| Year Ended 8/31/2017 | $22.29 | 0.17 | 3.27 | 3.44 | (0.15) | (0.17) | (0.32) |
| Year Ended 8/31/2016 | $21.27 | 0.15 | 2.05 | 2.20 | (0.55) | (0.63) | (1.18) |
| Year Ended 8/31/2015 | $22.38 | 0.50 (d) | (0.09) | 0.41 | (0.10) | (1.42) | (1.52) |
| Year Ended 8/31/2014 | $19.16 | 0.14 | 4.32 | 4.46 | (0.11) | (1.13) | (1.24) |
| Class V |
| Year Ended 8/31/2018 | $25.18 | 0.18 | 3.02 | 3.20 | (0.18) | (1.27) | (1.45) |
| Year Ended 8/31/2017 | $22.09 | 0.19 | 3.22 | 3.41 | (0.15) | (0.17) | (0.32) |
| Year Ended 8/31/2016 | $21.08 | 0.15 | 2.04 | 2.19 | (0.55) | (0.63) | (1.18) |
| Year Ended 8/31/2015 | $22.19 | 0.55 (d) | (0.15) | 0.40 | (0.09) | (1.42) | (1.51) |
| Year Ended 8/31/2014 | $19.01 | 0.13 | 4.28 | 4.41 | (0.10) | (1.13) | (1.23) |
| Notes to Financial Highlights |
| (a) | In addition to the fees and expenses that the Fund bears directly, the Fund indirectly bears a pro rata share of the fees and expenses of any other funds in which it invests. Such indirect expenses are not included in the Fund’s reported expense ratios. |
| (b) | Total net expenses include the impact of certain fee waivers/expense reimbursements made by the Investment Manager and certain of its affiliates, if applicable. |
| (c) | The benefits derived from expense reductions had an impact of less than 0.01%. |
| (d) | Net investment income per share includes special dividends. The per share effect of these dividends amounted to: |
| Year Ended | Class A | Advisor
Class | Class C | Institutional
Class | Institutional 2
Class | Institutional 3
Class | Class R | Class T | Class V |
| 08/31/2015 | $ 0.54 | $ 0.63 | $ 0.55 | $ 0.50 | $ 0.58 | $ 0.96 | $ 0.60 | $ 0.40 | $ 0.45 |
The accompanying Notes to Financial Statements are an integral part of this statement.
| 20 | Columbia Contrarian Core Fund | Annual Report 2018 |
Financial Highlights (continued)
| | Net
asset
value,
end of
period | Total
return | Total gross
expense
ratio to
average
net assets(a) | Total net
expense
ratio to
average
net assets(a),(b) | Net investment
income (loss)
ratio to
average
net assets | Portfolio
turnover | Net
assets,
end of
period
(000’s) |
| Institutional 3 Class |
| Year Ended 8/31/2018 | $27.89 | 13.50% | 0.63% | 0.63% | 1.10% | 63% | $2,101,809 |
| Year Ended 8/31/2017 | $26.03 | 16.14% | 0.65% | 0.65% | 1.23% | 52% | $1,574,824 |
| Year Ended 8/31/2016 | $22.81 | 11.22% | 0.65% | 0.65% | 1.23% | 47% | $329,514 |
| Year Ended 8/31/2015 | $21.75 | 2.44% | 0.66% | 0.66% | 5.26% | 60% | $53,246 |
| Year Ended 8/31/2014 | $22.84 | 24.71% | 0.68% | 0.68% | 1.12% | 65% | $2,514 |
| Class R |
| Year Ended 8/31/2018 | $27.18 | 12.78% | 1.27% | 1.27% (c) | 0.45% | 63% | $145,912 |
| Year Ended 8/31/2017 | $25.41 | 15.34% | 1.29% | 1.29% (c) | 0.57% | 52% | $132,392 |
| Year Ended 8/31/2016 | $22.29 | 10.55% | 1.32% | 1.32% (c) | 0.49% | 47% | $96,586 |
| Year Ended 8/31/2015 | $21.26 | 1.69% | 1.34% | 1.34% (c) | 2.93% | 60% | $50,048 |
| Year Ended 8/31/2014 | $22.37 | 23.86% | 1.36% | 1.36% (c) | 0.44% | 65% | $30,291 |
| Class T |
| Year Ended 8/31/2018 | $27.19 | 13.09% | 1.02% | 1.02% (c) | 0.69% | 63% | $1,044 |
| Year Ended 8/31/2017 | $25.41 | 15.62% | 1.04% | 1.04% (c) | 0.74% | 52% | $1,357 |
| Year Ended 8/31/2016 | $22.29 | 10.79% | 1.07% | 1.07% (c) | 0.71% | 47% | $220,502 |
| Year Ended 8/31/2015 | $21.27 | 1.95% | 1.09% | 1.09% (c) | 2.26% | 60% | $118,262 |
| Year Ended 8/31/2014 | $22.38 | 24.15% | 1.10% | 1.10% (c) | 0.67% | 65% | $124,021 |
| Class V |
| Year Ended 8/31/2018 | $26.93 | 13.09% | 1.02% | 1.02% (c) | 0.70% | 63% | $163,335 |
| Year Ended 8/31/2017 | $25.18 | 15.61% | 1.04% | 1.04% (c) | 0.82% | 52% | $154,392 |
| Year Ended 8/31/2016 | $22.09 | 10.83% | 1.08% | 1.08% (c) | 0.71% | 47% | $146,879 |
| Year Ended 8/31/2015 | $21.08 | 1.92% | 1.11% | 1.11% (c) | 2.49% | 60% | $143,304 |
| Year Ended 8/31/2014 | $22.19 | 24.06% | 1.16% | 1.16% (c) | 0.63% | 65% | $151,430 |
The accompanying Notes to Financial Statements are an integral part of this statement.
Columbia Contrarian Core Fund | Annual Report 2018
| 21 |
Notes to Financial Statements
August 31, 2018
Note 1. Organization
Columbia Contrarian Core Fund (the Fund), a series of Columbia Funds Series Trust I (the Trust), is a diversified fund. The Trust is registered under the Investment Company Act of 1940, as amended (the 1940 Act), as an open-end management investment company organized as a Massachusetts business trust.
Fund shares
The Trust may issue an unlimited number of shares (without par value). Although all share classes generally have identical voting, dividend and liquidation rights, each share class votes separately when required by the Trust’s organizational documents or by law. Different share classes pay different distribution amounts to the extent the expenses of such share classes differ, and distributions in liquidation will be proportional to the net asset value of each share class. Each share class has its own expense and sales charge structure. The Fund offers each of the share classes identified below.
Class A shares are subject to a maximum front-end sales charge of 5.75% based on the initial investment amount. Class A shares purchased without an initial sales charge in accounts aggregating $1 million to $50 million at the time of purchase are subject to a contingent deferred sales charge (CDSC) if the shares are sold within 18 months after purchase, charged as follows: 1.00% CDSC if redeemed within 12 months after purchase, and 0.50% CDSC if redeemed more than 12, but less than 18, months after purchase.
Advisor Class shares are not subject to sales charges and are generally available only to omnibus retirement plans and certain investors as described in the Fund’s prospectus. Prior to November 1, 2017, Advisor Class shares were known as Class R4 shares.
Class C shares are subject to a 1.00% CDSC on shares redeemed within 12 months after purchase. Effective July 1, 2018, Class C shares will automatically convert to Class A shares of the same Fund in the month of or the month following the 10-year anniversary of the Class C shares purchase date.
Institutional Class shares are not subject to sales charges and are generally available only to eligible investors, which are subject to different investment minimums as described in the Fund’s prospectus. Prior to November 1, 2017, Institutional Class shares were known as Class Z shares.
Institutional 2 Class shares are not subject to sales charges and are generally available only to investors purchasing through authorized investment professionals and omnibus retirement plans as described in the Fund’s prospectus. Prior to November 1, 2017, Institutional 2 Class shares were known as Class R5 shares.
Institutional 3 Class shares are not subject to sales charges and are available to institutional and certain other investors as described in the Fund’s prospectus. Prior to November 1, 2017, Institutional 3 Class shares were known as Class Y shares.
The Fund no longer accepts investments by existing investors in Class K shares. When available, Class K shares were not subject to sales charges and were made available only to existing investors in Class K shares. On March 9, 2018, Class K shares were redeemed or exchanged for Advisor Class shares of the Fund in a tax free transaction that had no impact on fees and expenses paid by the shareholders.
Class R shares are not subject to sales charges and are generally available only to certain retirement plans and other investors as described in the Fund’s prospectus.
Class T shares are subject to a maximum front-end sales charge of 2.50% per transaction and must be purchased through financial intermediaries that, by written agreement with Columbia Management Investment Distributors, Inc., are specifically authorized to sell Class T shares.
Class V shares are subject to a maximum front-end sales charge of 5.75% based on the investment amount. Class V shares purchased without an initial sales charge in accounts aggregating $1 million to $50 million at the time of purchase are subject to a CDSC if the shares are sold within 18 months after purchase, charged as follows: 1.00% CDSC if redeemed within 12 months after purchase, and 0.50% CDSC if redeemed more than 12, but less than 18, months after purchase. Class V shares are available only to investors who received (and who have continuously held) Class V shares in connection with previous fund reorganizations.
| 22 | Columbia Contrarian Core Fund | Annual Report 2018 |
Notes to Financial Statements (continued)
August 31, 2018
Note 2. Summary of significant accounting policies
Basis of preparation
The Fund is an investment company that applies the accounting and reporting guidance in the Financial Accounting Standards Board (FASB) Accounting Standards Codification Topic 946, Financial Services - Investment Companies (ASC 946). The financial statements are prepared in accordance with U.S. generally accepted accounting principles (GAAP), which requires management to make certain estimates and assumptions that affect the reported amounts of assets and liabilities, the disclosure of contingent assets and liabilities at the date of the financial statements and the reported amounts of income and expenses during the reporting period. Actual results could differ from those estimates.
The following is a summary of significant accounting policies followed by the Fund in the preparation of its financial statements.
Security valuation
All equity securities are valued at the close of business of the New York Stock Exchange. Equity securities are valued at the last quoted sales price on the principal exchange or market on which they trade, except for securities traded on the NASDAQ Stock Market, which are valued at the NASDAQ official close price. Unlisted securities or listed securities for which there were no sales during the day are valued at the mean of the latest quoted bid and ask prices on such exchanges or markets.
Foreign equity securities are valued based on the closing price on the foreign exchange in which such securities are primarily traded. If any foreign equity security closing prices are not readily available, the securities are valued at the mean of the latest quoted bid and ask prices on such exchanges or markets. Foreign currency exchange rates are generally determined at 4:00 p.m. Eastern (U.S.) time. Many securities markets and exchanges outside the U.S. close prior to the close of the New York Stock Exchange; therefore, the closing prices for securities in such markets or on such exchanges may not fully reflect events that occur after such close but before the close of the New York Stock Exchange. In those situations, foreign securities will be fair valued pursuant to a policy adopted by the Board of Trustees, including, if available, utilizing a third party pricing service to determine these fair values. The third party pricing service takes into account multiple factors, including, but not limited to, movements in the U.S. securities markets, certain depositary receipts, futures contracts and foreign exchange rates that have occurred subsequent to the close of the foreign exchange or market, to determine a good faith estimate that reasonably reflects the current market conditions as of the close of the New York Stock Exchange. The fair value of a security is likely to be different from the quoted or published price, if available.
Investments in open-end investment companies, including money market funds, are valued at their latest net asset value.
Investments for which market quotations are not readily available, or that have quotations which management believes are not reflective of market value or reliable, are valued at fair value as determined in good faith under procedures approved by and under the general supervision of the Board of Trustees. If a security or class of securities (such as foreign securities) is valued at fair value, such value is likely to be different from the quoted or published price for the security.
The determination of fair value often requires significant judgment. To determine fair value, management may use assumptions including but not limited to future cash flows and estimated risk premiums. Multiple inputs from various sources may be used to determine fair value.
GAAP requires disclosure regarding the inputs and valuation techniques used to measure fair value and any changes in valuation inputs or techniques. In addition, investments shall be disclosed by major category. This information is disclosed following the Fund’s Portfolio of Investments.
Foreign currency transactions and translations
The values of all assets and liabilities denominated in foreign currencies are generally translated into U.S. dollars at exchange rates determined at the close of regular trading on the New York Stock Exchange. Net realized and unrealized gains (losses) on foreign currency transactions and translations include gains (losses) arising from the fluctuation in exchange
Columbia Contrarian Core Fund | Annual Report 2018
| 23 |
Notes to Financial Statements (continued)
August 31, 2018
rates between trade and settlement dates on securities transactions, gains (losses) arising from the disposition of foreign currency and currency gains (losses) between the accrual and payment dates on dividends, interest income and foreign withholding taxes.
For financial statement purposes, the Fund does not distinguish that portion of gains (losses) on investments which is due to changes in foreign exchange rates from that which is due to changes in market prices of the investments. Such fluctuations are included with the net realized and unrealized gains (losses) on investments in the Statement of Operations.
Security transactions
Security transactions are accounted for on the trade date. Cost is determined and gains (losses) are based upon the specific identification method for both financial statement and federal income tax purposes.
Income recognition
Corporate actions and dividend income are generally recorded net of any non-reclaimable tax withholdings, on the ex-dividend date or upon receipt of ex-dividend notification in the case of certain foreign securities.
The Fund may receive distributions from holdings in equity securities, business development companies (BDCs), exchange-traded funds (ETFs), limited partnerships (LPs), other regulated investment companies (RICs), and real estate investment trusts (REITs), which report information on the tax character of their distributions annually. These distributions are allocated to dividend income, capital gain and return of capital based on actual information reported. Return of capital is recorded as a reduction of the cost basis of securities held. If the Fund no longer owns the applicable securities, return of capital is recorded as a realized gain. With respect to REITs, to the extent actual information has not yet been reported, estimates for return of capital are made by the Fund’s management. Management’s estimates are subsequently adjusted when the actual character of the distributions is disclosed by the REITs, which could result in a proportionate change in return of capital to shareholders.
Awards from class action litigation are recorded as a reduction of cost basis if the Fund still owns the applicable securities on the payment date. If the Fund no longer owns the applicable securities, the proceeds are recorded as realized gains.
Expenses
General expenses of the Trust are allocated to the Fund and other funds of the Trust based upon relative net assets or other expense allocation methodologies determined by the nature of the expense. Expenses directly attributable to the Fund are charged to the Fund. Expenses directly attributable to a specific class of shares are charged to that share class.
Determination of class net asset value
All income, expenses (other than class-specific expenses, which are charged to that share class, as shown in the Statement of Operations) and realized and unrealized gains (losses) are allocated to each class of the Fund on a daily basis, based on the relative net assets of each class, for purposes of determining the net asset value of each class.
Federal income tax status
The Fund intends to qualify each year as a regulated investment company under Subchapter M of the Internal Revenue Code, as amended, and will distribute substantially all of its investment company taxable income and net capital gain, if any, for its tax year, and as such will not be subject to federal income taxes. In addition, the Fund intends to distribute in each calendar year substantially all of its ordinary income, capital gain net income and certain other amounts, if any, such that the Fund should not be subject to federal excise tax. Therefore, no federal income or excise tax provision is recorded.
Foreign taxes
The Fund may be subject to foreign taxes on income, gains on investments or currency repatriation, a portion of which may be recoverable. The Fund will accrue such taxes and recoveries, as applicable, based upon its current interpretation of tax rules and regulations that exist in the markets in which it invests.
| 24 | Columbia Contrarian Core Fund | Annual Report 2018 |
Notes to Financial Statements (continued)
August 31, 2018
Realized gains in certain countries may be subject to foreign taxes at the Fund level, based on statutory rates. The Fund accrues for such foreign taxes on realized and unrealized gains at the appropriate rate for each jurisdiction, as applicable. The amount, if any, is disclosed as a liability on the Statement of Assets and Liabilities.
Distributions to shareholders
Distributions from net investment income, if any, are declared and paid annually. Net realized capital gains, if any, are distributed at least annually. Income distributions and capital gain distributions are determined in accordance with federal income tax regulations, which may differ from GAAP.
Guarantees and indemnifications
Under the Trust’s organizational documents and, in some cases, by contract, its officers and trustees are indemnified against certain liabilities arising out of the performance of their duties to the Trust or its funds. In addition, certain of the Fund’s contracts with its service providers contain general indemnification clauses. The Fund’s maximum exposure under these arrangements is unknown since the amount of any future claims that may be made against the Fund cannot be determined, and the Fund has no historical basis for predicting the likelihood of any such claims.
Recent accounting pronouncement
Accounting Standards Update 2017-08 Premium Amortization on Purchased Callable Debt Securities
In March 2017, the Financial Accounting Standards Board issued Accounting Standards Update (ASU) No. 2017-08 Premium Amortization on Purchased Callable Debt Securities. ASU No. 2017-08 updates the accounting standards to shorten the amortization period for certain purchased callable debt securities, held at a premium, to be amortized to the earliest call date. The update applies to securities with explicit, noncontingent call features that are callable at fixed prices and on preset dates. The standard is effective for annual periods beginning after December 15, 2018 and interim periods within those fiscal years. At this time, management is evaluating the implication of this guidance and the impact it will have on the financial statement amounts and footnote disclosures, if any.
Note 3. Fees and other transactions with affiliates
Management services fees
The Fund has entered into a Management Agreement with Columbia Management Investment Advisers, LLC (the Investment Manager), a wholly-owned subsidiary of Ameriprise Financial, Inc. (Ameriprise Financial). Under the Management Agreement, the Investment Manager provides the Fund with investment research and advice, as well as administrative and accounting services. The management services fee is an annual fee that is equal to a percentage of the Fund’s daily net assets that declines from 0.77% to 0.57% as the Fund’s net assets increase. The effective management services fee rate for the year ended August 31, 2018 was 0.61% of the Fund’s average daily net assets.
Compensation of board members
Members of the Board of Trustees who are not officers or employees of the Investment Manager or Ameriprise Financial are compensated for their services to the Fund as disclosed in the Statement of Operations. These members of the Board of Trustees may participate in a Deferred Compensation Plan (the Plan) which may be terminated at any time. Obligations of the Plan will be paid solely out of the Fund’s assets, and all amounts payable under the Plan constitute a general unsecured obligation of the Fund.
Compensation of Chief Compliance Officer
The Board of Trustees has appointed a Chief Compliance Officer to the Fund in accordance with federal securities regulations. As disclosed in the Statement of Operations, a portion of the Chief Compliance Officer’s total compensation is allocated to the Fund, along with other allocations to affiliated funds governed by the Board of Trustees, based on relative net assets.
Columbia Contrarian Core Fund | Annual Report 2018
| 25 |
Notes to Financial Statements (continued)
August 31, 2018
Transfer agency fees
Under a Transfer and Dividend Disbursing Agent Agreement, Columbia Management Investment Services Corp. (the Transfer Agent), an affiliate of the Investment Manager and a wholly-owned subsidiary of Ameriprise Financial, is responsible for providing transfer agency services to the Fund. The Transfer Agent has contracted with DST Asset Manager Solutions, Inc. (DST) to serve as sub-transfer agent. The Transfer Agent pays the fees of DST for services as sub-transfer agent and DST is not entitled to reimbursement for such fees from the Fund (with the exception of out-of-pocket fees).
The Fund pays the Transfer Agent a monthly transfer agency fee based on the number or the average value of accounts, depending on the type of account. In addition, the Fund pays the Transfer Agent a fee for shareholder services based on the number of accounts or on a percentage of the average aggregate value of the Fund’s shares maintained in omnibus accounts up to the lesser of the amount charged by the financial intermediary or a cap established by the Board of Trustees from time to time.
The Transfer Agent also receives compensation from the Fund for various shareholder services and reimbursements for certain out-of-pocket fees. Total transfer agency fees for Class K, Institutional 2 Class and Institutional 3 Class shares are subject to an annual limitation of not more than 0.07%, 0.07% and 0.02%, respectively, of the average daily net assets attributable to each share class.
For the year ended August 31, 2018, the Fund’s effective transfer agency fee rates as a percentage of average daily net assets of each class were as follows:
| | Effective rate (%) |
| Class A | 0.15 |
| Advisor Class | 0.15 |
| Class C | 0.15 |
| Institutional Class | 0.15 |
| Institutional 2 Class | 0.06 |
| Institutional 3 Class | 0.01 |
| Class K | 0.03 (a) |
| Class R | 0.15 |
| Class T | 0.15 |
| Class V | 0.15 |
An annual minimum account balance fee of $20 may apply to certain accounts with a value below the applicable share class’s initial minimum investment requirements to reduce the impact of small accounts on transfer agency fees. These minimum account balance fees are remitted to the Fund and recorded as part of expense reductions in the Statement of Operations. For the year ended August 31, 2018, these minimum account balance fees reduced total expenses of the Fund by $11,763.
Plan administration fees
Under a Plan Administration Services Agreement with the Transfer Agent, the Fund paid an annual fee at a rate of 0.25% of the Fund’s average daily net assets attributable to Class K shares for the provision of various administrative, recordkeeping, communication and educational services. As a result of all Class K shares of the Fund being redeemed or exchanged for Advisor Class shares, March 9, 2018 was the last day the Fund paid a plan administration fee for Class K shares.
Distribution and service fees
The Fund has entered into an agreement with Columbia Management Investment Distributors, Inc. (the Distributor), an affiliate of the Investment Manager and a wholly-owned subsidiary of Ameriprise Financial, for distribution and shareholder services. The Board of Trustees has approved, and the Fund has adopted, distribution and shareholder service plans (the Plans) applicable to certain share classes, which set the distribution and service fees for the Fund. These fees are calculated daily and are intended to compensate the Distributor and/or eligible selling and/or servicing agents for selling shares of the Fund and providing services to investors.
| 26 | Columbia Contrarian Core Fund | Annual Report 2018 |
Notes to Financial Statements (continued)
August 31, 2018
Under the Plans, the Fund pays a monthly service fee to the Distributor at the maximum annual rate of 0.25% of the average daily net assets attributable to Class A, Class C and Class T shares of the Fund. Also under the Plans, the Fund pays a monthly distribution fee to the Distributor at the maximum annual rates of 0.10%, 0.75%, 0.50% and 0.25% of the average daily net assets attributable to Class A, Class C, Class R and Class T shares of the Fund, respectively.
Although the Fund may pay distribution and service fees up to a maximum annual rate of 0.35% of the Fund’s average daily net assets attributable to Class A shares (comprised of up to 0.10% for distribution services and up to 0.25% for shareholder liaison services), the Fund currently limits such fees to an aggregate fee of not more than 0.25% of the Fund’s average daily net assets attributable to Class A shares.
Although the Fund may pay a distribution fee up to 0.25% of the Fund’s average daily net assets attributable to Class T shares and a service fee of up to 0.25% of the Fund’s average daily net assets attributable to Class T shares, the aggregate fee shall not exceed 0.25% of the Fund’s average daily net assets attributable to Class T shares.
Shareholder services fees
The Fund has adopted a shareholder services plan that permits it to pay for certain services provided to Class V shareholders by their selling and/or servicing agents. The Fund may pay shareholder servicing fees up to an aggregate annual rate of 0.50% of the Fund’s average daily net assets attributable to Class V shares (comprised of up to 0.25% for shareholder liaison services and up to 0.25% for administrative support services). These fees are currently limited to an aggregate annual rate of not more than 0.25% of the Fund’s average daily net assets attributable to Class V shares.
Sales charges (unaudited)
Sales charges, including front-end charges and CDSCs, received by the Distributor for distributing Fund shares for the year ended August 31, 2018, if any, are listed below:
| | Amount ($) |
| Class A | 2,807,522 |
| Class C | 55,802 |
| Class T | 486 |
| Class V | 6,522 |
Expenses waived/reimbursed by the Investment Manager and its affiliates
The Investment Manager and certain of its affiliates have contractually agreed to waive fees and/or reimburse expenses (excluding certain fees and expenses described below) for the period(s) disclosed below, unless sooner terminated at the sole discretion of the Board of Trustees, so that the Fund’s net operating expenses, after giving effect to fees waived/expenses reimbursed and any balance credits and/or overdraft charges from the Fund’s custodian, do not exceed the following annual rate(s) as a percentage of the class’ average daily net assets:
| | January 1, 2018
through
December 31, 2018 | Prior to
January 1, 2018 |
| Class A | 1.15% | 1.17% |
| Advisor Class | 0.90 | 0.92 |
| Class C | 1.90 | 1.92 |
| Institutional Class | 0.90 | 0.92 |
| Institutional 2 Class | 0.81 | 0.865 |
| Institutional 3 Class | 0.76 | 0.815 |
| Class R | 1.40 | 1.42 |
| Class T | 1.15 | 1.17 |
| Class V | 1.15 | 1.17 |
Columbia Contrarian Core Fund | Annual Report 2018
| 27 |
Notes to Financial Statements (continued)
August 31, 2018
Under the agreement governing these fee waivers and/or expense reimbursement arrangements, the following fees and expenses are excluded from the waiver/reimbursement commitment, and therefore will be paid by the Fund, if applicable: taxes (including foreign transaction taxes), expenses associated with investments in affiliated and non-affiliated pooled investment vehicles (including mutual funds and exchange-traded funds), transaction costs and brokerage commissions, costs related to any securities lending program, dividend expenses associated with securities sold short, inverse floater program fees and expenses, transaction charges and interest on borrowed money, interest, infrequent and/or unusual expenses and any other expenses the exclusion of which is specifically approved by the Board of Trustees. This agreement may be modified or amended only with approval from the Investment Manager, certain of its affiliates and the Fund. Any fees waived and/or expenses reimbursed under the expense reimbursement arrangements described above are not recoverable by the Investment Manager or its affiliates in future periods.
Note 4. Federal tax information
The timing and character of income and capital gain distributions are determined in accordance with income tax regulations, which may differ from GAAP because of temporary or permanent book to tax differences.
At August 31, 2018, these differences were primarily due to differing treatment for deferral/reversal of wash sale losses, trustees’ deferred compensation and foreign currency transactions. To the extent these differences were permanent, reclassifications were made among the components of the Fund’s net assets in the Statement of Assets and Liabilities. Temporary differences do not require reclassifications.
In the Statement of Assets and Liabilities the following reclassifications were made:
Undistributed net
investment
income ($) | Accumulated
net realized
gain ($) | Paid in
capital ($) |
| (931,241) | 931,241 | — |
Net investment income (loss) and net realized gains (losses), as disclosed in the Statement of Operations, and net assets were not affected by this reclassification.
The tax character of distributions paid during the years indicated was as follows:
| Year Ended August 31, 2018 | Year Ended August 31, 2017 |
Ordinary
income ($) | Long-term
capital gains ($) | Total ($) | Ordinary
income ($) | Long-term
capital gains ($) | Total ($) |
| 128,021,089 | 514,308,625 | 642,329,714 | 85,458,988 | 67,809,984 | 153,268,972 |
Short-term capital gain distributions, if any, are considered ordinary income distributions for tax purposes.
At August 31, 2018, the components of distributable earnings on a tax basis were as follows:
Undistributed
ordinary income ($) | Undistributed
long-term
capital gains ($) | Capital loss
carryforwards ($) | Net unrealized
appreciation ($) |
| 69,401,742 | 635,067,922 | — | 3,469,108,716 |
At August 31, 2018, the cost of all investments for federal income tax purposes along with the aggregate gross unrealized appreciation and depreciation based on that cost was:
Federal
tax cost ($) | Gross unrealized
appreciation ($) | Gross unrealized
(depreciation) ($) | Net unrealized
appreciation ($) |
| 8,020,171,877 | 3,563,691,817 | (94,583,101) | 3,469,108,716 |
Tax cost of investments and unrealized appreciation/(depreciation) may also include timing differences that do not constitute adjustments to tax basis.
| 28 | Columbia Contrarian Core Fund | Annual Report 2018 |
Notes to Financial Statements (continued)
August 31, 2018
Management of the Fund has concluded that there are no significant uncertain tax positions in the Fund that would require recognition in the financial statements. However, management’s conclusion may be subject to review and adjustment at a later date based on factors including, but not limited to, new tax laws, regulations, and administrative interpretations (including relevant court decisions). Generally, the Fund’s federal tax returns for the prior three fiscal years remain subject to examination by the Internal Revenue Service.
Note 5. Portfolio information
The cost of purchases and proceeds from sales of securities, excluding short-term investments and derivatives, if any, aggregated to $7,016,413,084 and $7,374,111,419, respectively, for the year ended August 31, 2018. The amount of purchase and sale activity impacts the portfolio turnover rate reported in the Financial Highlights.
Note 6. Affiliated money market fund
The Fund invests in Columbia Short-Term Cash Fund, an affiliated money market fund established for the exclusive use by the Fund and other affiliated funds (the Affiliated MMF). The income earned by the Fund from such investments is included as Dividends - affiliated issuers in the Statement of Operations. As an investing fund, the Fund indirectly bears its proportionate share of the expenses of the Affiliated MMF. The Affiliated MMF prices its shares with a floating net asset value. In addition, the Board of Trustees of the Affiliated MMF may impose a fee on redemptions (sometimes referred to as a liquidity fee) or temporarily suspend redemptions (sometimes referred to as imposing a redemption gate) in the event its liquidity falls below regulatory limits.
Note 7. Interfund lending
Pursuant to an exemptive order granted by the Securities and Exchange Commission, the Fund participates in a program (the Interfund Program) allowing each participating Columbia Fund (each, a Participating Fund) to lend money directly to and, except for closed-end funds and money market funds, borrow money directly from other Participating Funds for temporary purposes. The amounts eligible for borrowing and lending under the Interfund Program are subject to certain restrictions.
Interfund loans are subject to the risk that the borrowing fund could be unable to repay the loan when due, and a delay in repayment to the lending fund could result in lost opportunities and/or additional lending costs. The exemptive order is subject to conditions intended to mitigate conflicts of interest arising from the Investment Manager’s relationship with each Participating Fund.
The Fund did not borrow or lend money under the Interfund Program during the year ended August 31, 2018.
Note 8. Line of credit
The Fund has access to a revolving credit facility with a syndicate of banks led by Citibank, N.A., HSBC Bank USA, N.A. and JPMorgan Chase Bank, N.A. whereby the Fund may borrow for the temporary funding of shareholder redemptions or for other temporary or emergency purposes. The credit facility, which is a collective agreement between the Fund and certain other funds managed by the Investment Manager, severally and not jointly, permits collective borrowings up to $1 billion. Interest is charged to each participating fund based on its borrowings at a rate equal to the higher of (i) the overnight federal funds rate plus 1.00% or (ii) the one-month LIBOR rate plus 1.00%. Each borrowing under the credit facility matures no later than 60 days after the date of borrowing. The Fund also pays a commitment fee equal to its pro rata share of the amount of the credit facility at a rate of 0.15% per annum. The commitment fee is included in other expenses in the Statement of Operations. This agreement expires annually in December unless extended or renewed.
The Fund had no borrowings during the year ended August 31, 2018.
Columbia Contrarian Core Fund | Annual Report 2018
| 29 |
Notes to Financial Statements (continued)
August 31, 2018
Note 9. Significant risks
Shareholder concentration risk
At August 31, 2018, two unaffiliated shareholders of record owned 25.9% of the outstanding shares of the Fund in one or more accounts. The Fund has no knowledge about whether any portion of those shares was owned beneficially. Affiliated shareholders of record owned 22.9% of the outstanding shares of the Fund in one or more accounts. Subscription and redemption activity by concentrated accounts may have a significant effect on the operations of the Fund. In the case of a large redemption, the Fund may be forced to sell investments at inopportune times, including its liquid positions, which may result in Fund losses and the Fund holding a higher percentage of less liquid positions. Large redemptions could result in decreased economies of scale and increased operating expenses for non-redeeming Fund shareholders.
Technology and technology-related investment risk
The Fund may be more susceptible to the particular risks that may affect companies in the information technology sector, as well as other technology-related sectors (collectively, the technology sectors) than if it were invested in a wider variety of companies in unrelated sectors. Companies in the technology sectors are subject to certain risks, including the risk that new services, equipment or technologies will not be accepted by consumers and businesses or will become rapidly obsolete. Performance of such companies may be affected by factors including obtaining and protecting patents (or the failure to do so) and significant competitive pressures, including aggressive pricing of their products or services, new market entrants, competition for market share and short product cycles due to an accelerated rate of technological developments. Such competitive pressures may lead to limited earnings and/or falling profit margins. As a result, the value of their securities may fall or fail to rise. In addition, many technology sector companies have limited operating histories and prices of these companies’ securities historically have been more volatile than other securities, especially over the short term.
Note 10. Subsequent events
Management has evaluated the events and transactions that have occurred through the date the financial statements were issued and noted no items requiring adjustment of the financial statements or additional disclosure.
Note 11. Information regarding pending and settled legal proceedings
Ameriprise Financial and certain of its affiliates have historically been involved in a number of legal, arbitration and regulatory proceedings, including routine litigation, class actions, and governmental actions, concerning matters arising in connection with the conduct of their business activities. Ameriprise Financial believes that the Fund is not currently the subject of, and that neither Ameriprise Financial nor any of its affiliates are the subject of, any pending legal, arbitration or regulatory proceedings that are likely to have a material adverse effect on the Fund or the ability of Ameriprise Financial or its affiliates to perform under their contracts with the Fund. Ameriprise Financial is required to make quarterly (10-Q), annual (10-K) and, as necessary, 8-K filings with the Securities and Exchange Commission (SEC) on legal and regulatory matters that relate to Ameriprise Financial and its affiliates. Copies of these filings may be obtained by accessing the SEC website at www.sec.gov.
There can be no assurance that these matters, or the adverse publicity associated with them, will not result in increased Fund redemptions, reduced sale of Fund shares or other adverse consequences to the Fund. Further, although we believe proceedings are not likely to have a material adverse effect on the Fund or the ability of Ameriprise Financial or its affiliates to perform under their contracts with the Fund, these proceedings are subject to uncertainties and, as such, we are unable to estimate the possible loss or range of loss that may result. An adverse outcome in one or more of these proceedings could result in adverse judgments, settlements, fines, penalties or other relief that could have a material adverse effect on the consolidated financial condition or results of operations of Ameriprise Financial.
| 30 | Columbia Contrarian Core Fund | Annual Report 2018 |
Report of Independent Registered Public Accounting Firm
To the Board of Trustees of Columbia Funds Series Trust I and Shareholders of Columbia Contrarian Core Fund
Opinion on the Financial Statements
We have audited the accompanying statement of assets and liabilities, including the portfolio of investments, of Columbia Contrarian Core Fund (one of the funds constituting Columbia Funds Series Trust I, hereafter referred to as the “Fund”) as of August 31, 2018, the related statement of operations for the year ended August 31, 2018, the statement of changes in net assets for each of the two years in the period ended August 31, 2018, including the related notes, and the financial highlights for each of the five years in the period ended August 31, 2018, (collectively referred to as the “financial statements”). In our opinion, the financial statements present fairly, in all material respects, the financial position of the Fund as of August 31, 2018, the results of its operations for the year then ended, the changes in its net assets for each of the two years in the period ended August 31, 2018 and the financial highlights for each of the five years in the period ended August 31, 2018 in conformity with accounting principles generally accepted in the United States of America.
Basis for Opinion
These financial statements are the responsibility of the Fund’s management. Our responsibility is to express an opinion on the Fund’s financial statements based on our audits. We are a public accounting firm registered with the Public Company Accounting Oversight Board (United States) (“PCAOB”) and are required to be independent with respect to the Fund in accordance with the U.S. federal securities laws and the applicable rules and regulations of the Securities and Exchange Commission and the PCAOB.
We conducted our audits of these financial statements in accordance with the standards of the PCAOB. Those standards require that we plan and perform the audit to obtain reasonable assurance about whether the financial statements are free of material misstatement, whether due to error or fraud.
Our audits included performing procedures to assess the risks of material misstatement of the financial statements, whether due to error or fraud, and performing procedures that respond to those risks. Such procedures included examining, on a test basis, evidence regarding the amounts and disclosures in the financial statements. Our audits also included evaluating the accounting principles used and significant estimates made by management, as well as evaluating the overall presentation of the financial statements. Our procedures included confirmation of securities owned as of August 31, 2018, by correspondence with the custodian, transfer agent and brokers; when replies were not received from brokers, we performed other audit procedures. We believe that our audits provide a reasonable basis for our opinion.
/s/PricewaterhouseCoopers LLP
Minneapolis, Minnesota
October 22, 2018
We have served as the auditor of one or more investment companies within the Columbia Funds Complex since 1977.
Columbia Contrarian Core Fund | Annual Report 2018
| 31 |
Federal Income Tax Information
(Unaudited)
The Fund hereby designates the following tax attributes for the fiscal year ended August 31, 2018. Shareholders will be notified in early 2019 of the amounts for use in preparing 2018 income tax returns.
Qualified
dividend
income | Dividends
received
deduction | Capital
gain
dividend |
| 100.00% | 100.00% | $793,645,944 |
Qualified dividend income. For taxable, non-corporate shareholders, the percentage of ordinary income distributed during the fiscal year that represents qualified dividend income subject to reduced tax rates.
Dividends received deduction. The percentage of ordinary income distributed during the fiscal year that qualifies for the corporate dividends received deduction.
Capital gain dividend. The Fund designates as a capital gain dividend the amount reflected above, or if subsequently determined to be different, the net capital gain of such fiscal period.
| 32 | Columbia Contrarian Core Fund | Annual Report 2018 |
Shareholders elect the Board that oversees the Fund’s operations. The Board appoints officers who are responsible for day-to-day business decisions based on policies set by the Board. The following table provides basic biographical information about the Fund’s Trustees, including their principal occupations during the past five years, although specific titles for individuals may have varied over the period. The year set forth beneath Length of Service in the table below is the year in which the Trustee was first appointed or elected as Trustee to any Fund currently in the Columbia Funds Complex or a predecessor thereof. Under current Board policy, members serve terms of indefinite duration.
Independent trustees
| Name, address, year of birth | Position held with the Trust and length of service | Principal occupation(s) during the past five years and other relevant professional experience | Number of Funds in the Columbia Fund Complex overseen | Other directorships held by Trustee during the past five years |
Janet Langford Carrig
c/o Columbia Management
Investment Advisers, LLC
225 Franklin Street
Mail Drop BX32 05228
Boston, MA 02110
1957 | Trustee
1996 | Senior Vice President, General Counsel and Corporate Secretary, ConocoPhillips (independent energy company) since September 2007 | 69 | None |
Douglas A. Hacker
c/o Columbia Management
Investment Advisers, LLC
225 Franklin Street
Mail Drop BX32 05228
Boston, MA 02110
1955 | Trustee and Chairman of the Board
1996 | Independent business executive since May 2006; Executive Vice President — Strategy of United Airlines from December 2002 to May 2006; President of UAL Loyalty Services (airline marketing company) from September 2001 to December 2002; Executive Vice President and Chief Financial Officer of United Airlines from July 1999 to September 2001 | 69 | Spartan Nash Company, (food distributor); Nash Finch Company (food distributor) from 2005 to 2013; Aircastle Limited (aircraft leasing); SeaCube Container Leasing Ltd. (container leasing) from 2010 to 2013; and Travelport Worldwide Limited (travel information technology) |
Nancy T. Lukitsh
c/o Columbia Management
Investment Advisers, LLC
225 Franklin Street
Mail Drop BX32 05228
Boston, MA 02110
1956 | Trustee
2011 | Senior Vice President, Partner and Director of Marketing, Wellington Management Company, LLP (investment adviser) from 1997 to 2010; Chair, Wellington Management Portfolios (commingled non-U.S. investment pools) from 2007 to 2010; Director, Wellington Trust Company, NA and other Wellington affiliates from 1997 to 2010 | 69 | None |
David M. Moffett
c/o Columbia Management
Investment Advisers, LLC
225 Franklin Street
Mail Drop BX32 05228
Boston, MA 02110
1952 | Trustee
2011 | Retired. Consultant to Bridgewater and Associates | 69 | Director, CSX Corporation (transportation suppliers); Genworth Financial, Inc. (financial and insurance products and services); PayPal Holdings Inc. (payment and data processing services); Trustee, University of Oklahoma Foundation; former Director, eBay Inc. (online trading community), 2007-2015; and former Director, CIT Bank, CIT Group Inc. (commercial and consumer finance), 2010-2016 |
Columbia Contrarian Core Fund | Annual Report 2018
| 33 |
TRUSTEES AND OFFICERS (continued)
Independent trustees (continued)
| Name, address, year of birth | Position held with the Trust and length of service | Principal occupation(s) during the past five years and other relevant professional experience | Number of Funds in the Columbia Fund Complex overseen | Other directorships held by Trustee during the past five years |
John J. Neuhauser
c/o Columbia Management
Investment Advisers, LLC
225 Franklin Street
Mail Drop BX32 05228
Boston, MA 02110
1943 | Trustee
1984 | President, Saint Michael’s College since August 2007; Director or Trustee of several non-profit organizations, including University of Vermont Medical Center; Academic Vice President and Dean of Faculties, Boston College from August 1999 to October 2005; University Professor, Boston College from November 2005 to August 2007 | 69 | Liberty All-Star Equity Fund and Liberty All- Star Growth Fund (closed-end funds) |
Patrick J. Simpson
c/o Columbia Management
Investment Advisers, LLC
225 Franklin Street
Mail Drop BX32 05228
Boston, MA 02110
1944 | Trustee
2000 | Of Counsel, Perkins Coie LLP (law firm) since 2015; Partner, Perkins Coie LLP from 1988 to 2014 | 69 | None |
Anne-Lee Verville
c/o Columbia Management
Investment Advisers, LLC
225 Franklin Street
Mail Drop BX32 05228
Boston, MA 02110
1945 | Trustee
1998 | Retired. General Manager, Global Education Industry from 1994 to 1997, President – Application Systems Division from 1991 to 1994, Chief Financial Officer – US Marketing & Services from 1988 to 1991, and Chief Information Officer from 1987 to 1988, IBM Corporation (computer and technology) | 69 | Enesco Group, Inc. (producer of giftware and home and garden decor products) from 2001 to 2006 |
Consultants to the Independent Trustees*
| Name, address, year of birth | Position held with the Trust and length of service | Principal occupation(s) during the past five years and other relevant professional experience | Number of Funds in the Columbia Funds complex overseen | Other directorships held by Trustee during the past five years |
J. Kevin Connaughton
c/o Columbia
Management Investment
Advisers, LLC,
225 Franklin Street
Mail Drop BX32 05228,
Boston, MA 02110
1964 | Independent Trustee Consultant
2016 | Independent Trustee Consultant, Columbia Funds since March 2016; Adjunct Professor of Finance, Bentley University since November 2017; Managing Director and General Manager of Mutual Fund Products, Columbia Management Investment Advisers, LLC from May 2010 to February 2015; President, Columbia Funds from 2009 to 2015; and senior officer of Columbia Funds and affiliated funds from 2003 to 2015 | 69 | Director, The Autism Project since March 2015; former Trustee, New Century Portfolios, March 2015-December 2017; formerly on Board of Governors, Gateway Healthcare, January 2016 – December 2017 |
Natalie A. Trunow
c/o Columbia
Management Investment
Advisers, LLC,
225 Franklin Street
Mail Drop BX32 05228,
Boston, MA 02110
1967 | Independent Trustee Consultant
2016 | Independent Trustee Consultant, Columbia Funds since September 2016; Chief Executive Officer, Millennial Portfolio Solutions LLC (asset management and consulting services) since January 2016; Director of Investments, Casey Family Programs from April 2016 to September 2016; Senior Vice President and Chief Investment Officer, Calvert Investments from August 2008 to January 2016; Section Head and Portfolio Manager, General Motors Asset Management from June 1997 to August 2008 | 69 | Director, Health Services for Children with Special Needs, Inc.; Director, Guidewell Financial Solutions |
| * | J. Kevin Connaughton was appointed consultant to the Independent Trustees effective March 1, 2016. Natalie A. Trunow was appointed consultant to the Independent Trustees effective September 1, 2016. Shareholders of the Funds are expected to be asked to elect each of Mr. Connaughton and Ms. Trunow as a Trustee at a future shareholder meeting. |
| 34 | Columbia Contrarian Core Fund | Annual Report 2018 |
TRUSTEES AND OFFICERS (continued)
Interested trustee affiliated with Investment Manager*
| Name, address, year of birth | Position held with the Trust and length of service | Principal occupation(s) during the past five years and other relevant professional experience | Number of Funds in the Columbia Funds Complex overseen | Other directorships held by Trustee during the past five years |
William F. Truscott
c/o Columbia Management
Investment Advisers, LLC
225 Franklin Street
Boston, MA 02110
1960 | Trustee
2012 | Chairman of the Board and President, Columbia Management Investment Advisers, LLC since May 2010 and February 2012, respectively; Chief Executive Officer, Global Asset Management, Ameriprise Financial, Inc. since September 2012 (previously Chief Executive Officer, U.S. Asset Management & President, Annuities, May 2010-September 2012); Director and Chief Executive Officer, Columbia Management Investment Distributors, Inc. since May 2010 and February 2012, respectively; Chairman of the Board and Chief Executive Officer, RiverSource Distributors, Inc. since 2006; Director, Threadneedle Asset Management Holdings, SARL since 2014; President and Chief Executive Officer, Ameriprise Certificate Company, 2006-August 2012 | 193 | Chairman of the Board, Columbia Management Investment Advisers, LLC since May 2010; Director, Columbia Management Investment Distributors, Inc. since May 2010; former Director, Ameriprise Certificate Company, 2006 - January 2013 |
| * | Interested person (as defined under the 1940 Act) by reason of being an officer, director, security holder and/or employee of the Investment Manager or Ameriprise Financial. |
The Statement of Additional Information has additional information about the Fund’s Board members and is available, without charge, upon request by calling 800.345.6611, visiting columbiathreadneedleus.com/investor/ or contacting your financial intermediary.
Columbia Contrarian Core Fund | Annual Report 2018
| 35 |
TRUSTEES AND OFFICERS (continued)
The Board has appointed officers who are responsible for day-to-day business decisions based on policies it has established. The officers serve at the pleasure of the Board. The following table provides basic information about the Officers of the Fund, including principal occupations during the past five years, although their specific titles may have varied over the period. In addition to Mr. Truscott, who is Senior Vice President, the Fund’s other officers are:
Fund officers
Name,
address and
year of birth | Position and year
first appointed to
position for any Fund
in the Columbia
Funds complex or a
predecessor thereof | Principal occupation(s) during past five years |
Christopher O. Petersen
5228 Ameriprise
Financial Center
Minneapolis, MN 55474
Born 1970 | President and Principal Executive Officer (2015) | Vice President and Lead Chief Counsel, Ameriprise Financial, Inc. since January 2015 (previously, Vice President and Chief Counsel, January 2010 - December 2014; officer of Columbia Funds and affiliated funds since 2007. |
Michael G. Clarke
225 Franklin Street
Boston, MA 02110
Born 1969 | Treasurer (2011), Chief Financial Officer (2009) and Chief Accounting Officer (2015) | Vice President — Mutual Fund Administration, Columbia Management Investment Advisers, LLC, since May 2010; senior officer of Columbia Funds and affiliated funds since 2002. |
Paul B. Goucher
100 Park Avenue
New York, NY 10017
Born 1968 | Senior Vice President (2011) and Assistant Secretary (2008) | Senior Vice President and Assistant General Counsel, Ameriprise Financial, Inc. since January 2017 (previously, Vice President and Lead Chief Counsel, November 2008 - January 2017 and January 2013 - January 2017, respectively); Vice President, Chief Legal Officer and Assistant Secretary, Columbia Management Investment Advisers, LLC since May 2010. |
Thomas P. McGuire
225 Franklin Street
Boston, MA 02110
Born 1972 | Senior Vice President and Chief Compliance Officer (2012) | Vice President — Asset Management Compliance, Ameriprise Financial, Inc., since May 2010; Chief Compliance Officer, Ameriprise Certificate Company since September 2010. |
Colin Moore
225 Franklin Street
Boston, MA 02110
Born 1958 | Senior Vice President (2010) | Executive Vice President and Global Chief Investment Officer, Ameriprise Financial, Inc., since July 2013; Executive Vice President and Global Chief Investment Officer, Columbia Management Investment Advisers, LLC since July 2013. |
Ryan C. Larrenaga
225 Franklin Street
Boston, MA 02110
Born 1970 | Senior Vice President (2017), Chief Legal Officer (2017) and Secretary (2015) | Vice President and Chief Counsel, Ameriprise Financial, Inc. since August 2018 (previously, Vice President and Group Counsel, August 2011 - August 2018); officer of Columbia Funds and affiliated funds since 2005. |
Michael E. DeFao
225 Franklin Street
Boston, MA 02110
Born 1968 | Vice President (2011) and Assistant Secretary (2010) | Vice President and Chief Counsel, Ameriprise Financial, Inc. since May 2010. |
Amy Johnson
5228 Ameriprise
Financial Center
Minneapolis, MN 55474
Born 1965 | Vice President (2006) | Managing Director and Global Head of Operations, Columbia Management Investment Advisers, LLC since April 2016 (previously Managing Director and Chief Operating Officer, 2010 - 2016). |
Lyn Kephart-Strong
5228 Ameriprise
Financial Center
Minneapolis, MN 55474
Born 1960 | Vice President (2015) | President, Columbia Management Investment Services Corp. since October 2014; Vice President & Resolution Officer, Ameriprise Trust Company since August 2009. |
| 36 | Columbia Contrarian Core Fund | Annual Report 2018 |
Board Consideration and Approval of Management
Agreement
On June 12, 2018, the Board of Trustees (the Board) and the Trustees who are not interested persons (as defined in the Investment Company Act of 1940) (the Independent Trustees) of Columbia Funds Series Trust I (the Trust) unanimously approved the continuation of the Management Agreement (the Management Agreement) with Columbia Management Investment Advisers, LLC (the Investment Manager) with respect to Columbia Contrarian Core Fund (the Fund), a series of the Trust. As detailed below, the Board’s Advisory Fees and Expenses Committee (the Committee) and the Board met on multiple occasions to review and discuss, among themselves, with the management team of the Investment Manager and with an independent fee consultant, materials provided by the Investment Manager, the independent fee consultant and others before determining to approve the continuation of the Management Agreement.
In connection with their deliberations regarding the continuation of the Management Agreement, the Committee and the Board evaluated materials requested from the Investment Manager regarding the Fund and the Management Agreement, and discussed these materials with representatives of the Investment Manager at Committee meetings held on March 6, 2018, April 26, 2018 and June 11, 2018 and at Board meetings held on March 7, 2018 and June 12, 2018. In addition, the Board and its various committees consider matters bearing on the Management Agreement at other meetings throughout the year and in prior years and meet regularly with senior management of the Trust and the Investment Manager. Through the Board’s Investment Oversight Committees, Trustees also meet with selected portfolio managers of the funds the Trustees oversee and with other investment personnel at various times throughout the year. The Committee and the Board also consulted with the independent fee consultant, Fund counsel and the Independent Trustees’ independent legal counsel, who advised on various matters with respect to the Committee’s and the Board’s considerations and otherwise assisted the Committee and the Board in their deliberations. On June 11, 2018, the Committee recommended that the Board approve the continuation of the Management Agreement. On June 12, 2018, the Board, including the Independent Trustees, voting separately, unanimously approved the continuation of the Management Agreement for the Fund.
The Committee and the Board considered all information that they, their legal counsel or the Investment Manager believed reasonably necessary to evaluate and to determine whether to recommend for approval or approve the continuation of the Management Agreement. The information and factors considered by the Committee and the Board in recommending for approval or approving the continuation of the Management Agreement for the Fund included the following:
| • | Information on the investment performance of the Fund relative to the performance of a group of mutual funds determined to be comparable to the Fund by an independent third-party data provider, as well as performance relative to benchmarks; |
| • | Information on the Fund’s management fees and total expenses, including information comparing the Fund’s expenses to those of a group of comparable mutual funds, as determined by the independent third-party data provider; |
| • | The Investment Manager’s agreement to contractually limit or cap total operating expenses for the Fund through December 31, 2019 so that total operating expenses (excluding certain fees and expenses, such as transaction costs and certain other investment related expenses, interest, taxes, acquired fund fees and expenses, and infrequent and/or unusual expenses) would not exceed a specified annual rate, as a percentage of the Fund’s net assets; |
| • | The terms and conditions of the Management Agreement; |
| • | The current and proposed terms and conditions of other agreements and arrangements with affiliates of the Investment Manager relating to the operations of the Fund, including agreements with respect to the provision of distribution, transfer agency and shareholder services to the Fund; |
| • | Descriptions of various functions performed by the Investment Manager under the Management Agreement, including portfolio management and portfolio trading practices; |
| • | Information regarding the management fees of similarly-managed portfolios of other clients of the Investment Manager, including institutional accounts and collective trusts; |
| • | Information regarding the reputation, regulatory history and resources of the Investment Manager, including information regarding senior management, portfolio managers and other personnel; |
Columbia Contrarian Core Fund | Annual Report 2018
| 37 |
Board Consideration and Approval of Management
Agreement (continued)
| • | Information regarding the capabilities of the Investment Manager with respect to compliance monitoring services, including an assessment of the Investment Manager’s compliance system by the Fund’s Chief Compliance Officer; and |
| • | The profitability to the Investment Manager and its affiliates from their relationships with the Fund. |
Nature, extent and quality of services provided under the Management Agreement
The Committee and the Board considered the nature, extent and quality of services provided to the Fund by the Investment Manager and its affiliates under the Management Agreement and under separate agreements for the provision of transfer agency and shareholder services, and the resources dedicated to the Fund and the other Columbia Funds by the Investment Manager and its affiliates. The Committee and the Board considered, among other things, the Investment Manager’s ability to attract, motivate and retain highly qualified research, advisory and supervisory investment professionals (including compensation programs for personnel involved in fund management, reputation and other attributes), the portfolio management services provided by those investment professionals, and the quality of the Investment Manager’s investment research capabilities and trade execution services. The Committee and the Board also considered the potential benefits to shareholders of investing in a mutual fund that is part of a fund complex offering exposure to a variety of asset classes and investment disciplines and providing a variety of fund and shareholder services.
The Committee and the Board also considered the professional experience and qualifications of the senior personnel of the Investment Manager, which included consideration of the Investment Manager’s experience with similarly-structured funds. The Committee and the Board noted the compliance programs of and the compliance-related resources provided to the Fund by the Investment Manager and its affiliates and the resources dedicated by the Investment Manager and its affiliates to risk management, and considered the Investment Manager’s ability to provide administrative services to the Fund and coordinate the activities of the Fund’s other service providers. After reviewing these and related factors, the Committee and the Board concluded, within the context of their overall conclusions, that the nature, extent and quality of the services provided to the Fund under the Management Agreement supported the continuation of the Management Agreement.
Investment performance
The Committee and the Board reviewed information about the performance of the Fund over various time periods, including performance information relative to benchmarks, information that compared the performance of the Fund to the performance of a group of comparable mutual funds as determined by the independent third-party data provider, and information and analysis provided by the independent fee consultant. The Committee and the Board also reviewed a description of the third party’s methodology for identifying the Fund’s peer groups for purposes of performance and expense comparisons.
The Committee and the Board noted that, through December 31, 2017, the Fund’s performance was in the thirty-eighth, twenty-eighth and fourteenth percentile (where the best performance would be in the first percentile) of its category selected by the independent third-party data provider for the purposes of performance comparisons for the one-, three- and five-year periods, respectively.
The Committee and the Board also considered the Investment Manager’s performance and reputation generally, the Investment Manager’s historical responsiveness to Board concerns about performance, and the Investment Manager’s willingness to take steps intended to improve performance. After reviewing these and related factors, the Committee and the Board concluded, within the context of their overall conclusions, that the performance of the Fund and the Investment Manager was sufficient, in light of other considerations, to support the continuation of the Management Agreement.
Investment Management fee rates and other expenses
The Committee and the Board considered the management fees charged to the Fund under the Management Agreement as well as the total expenses incurred by the Fund. In assessing the reasonableness of the fees under the Management Agreement, the Committee and the Board considered, among other information, the Fund’s total expense ratio as a percentage of average daily net assets. The Committee and the Board considered data provided by the independent third-party data provider and the independent fee consultant. The Committee and the Board noted that, as of December 31, 2017, the Fund’s actual management fee and net total expense ratio were both ranked in the third quintile (where the lowest
| 38 | Columbia Contrarian Core Fund | Annual Report 2018 |
Board Consideration and Approval of Management
Agreement (continued)
fees and expenses would be in the first quintile) against the Fund’s expense universe as determined by the independent third-party data provider for purposes of expense comparison. The Committee and the Board also took into account the fee waiver and expense limitation arrangements agreed to by the Investment Manager, as noted above.
The Committee and the Board also received and considered information about the management fees charged by the Investment Manager to institutional accounts. In considering the fees charged to those accounts, the Committee and the Board took into account, among other things, the Investment Manager’s representations about the differences between managing mutual funds as compared to other types of accounts, including differences in the services provided, differences in the risk profile of such business for the Investment Manager and the additional resources required to manage mutual funds effectively. The Committee and the Board also received and considered information about the fees charged by the Investment Manager for sub-advisory services it provides to comparable unaffiliated funds. In evaluating the Fund’s management fees, the Committee and the Board also took into account the demands, complexity and quality of the investment management of the Fund.
After reviewing these and related factors, the Committee and the Board concluded, within the context of their overall conclusions, that the management fee rates and expenses of the Fund, in light of other considerations, supported the continuation of the Management Agreement.
Costs of services provided and profitability
The Committee and the Board also took note of the costs the Investment Manager and its affiliates incur in connection with the services provided and the profitability to the Investment Manager and its affiliates from their relationships with the Fund.
The Committee and the Board also considered the compensation directly or indirectly received by the Investment Manager’s affiliates in connection with their relationships with the Fund. The Committee and the Board reviewed information provided by management as to the profitability to the Investment Manager and its affiliates of their relationships with the Fund, information about the allocation of expenses used to calculate profitability, and comparisons of profitability levels realized in 2017 to profitability levels realized in 2016. When reviewing profitability, the Committee and the Board also considered court cases in which adviser profitability was an issue in whole or in part, the performance of similarly managed funds, the performance of the Fund, and the expense ratio of the Fund. In addition, the Committee and the Board considered information provided by the Investment Manager regarding the Investment Manager’s financial condition and comparing its profitability to that of other asset management firms that are, or are subsidiaries of, publicly traded companies. In this regard, the Committee and the Board also considered data provided by the independent fee consultant.
After reviewing these and related factors, the Committee and the Board concluded, within the context of their overall conclusions, that the costs of services provided and the profitability to the Investment Manager and its affiliates from their relationships with the Fund supported the continuation of the Management Agreement.
Economies of scale
The Committee and the Board considered the potential existence of economies of scale in the provision by the Investment Manager of services to the Fund, to groups of related funds, and to the Investment Manager’s investment advisory clients as a whole, and whether those economies of scale were shared with the Fund through breakpoints in investment management fees or other means, such as expense limitation arrangements and additional investments by the Investment Manager in investment, trading, compliance and other resources. The Committee and the Board noted that the management fee schedules for the Fund contained breakpoints that would reduce the fee rate on assets above specified threshold levels.
In considering these matters, the Committee and the Board also considered the costs of the services provided and the profitability to the Investment Manager and its affiliates from their relationships with the Fund, as noted above. After reviewing these and related factors, the Committee and the Board concluded, within the context of their overall conclusions, that the extent to which any economies of scale were expected to be shared with the Fund supported the continuation of the Management Agreement.
Columbia Contrarian Core Fund | Annual Report 2018
| 39 |
Board Consideration and Approval of Management
Agreement (continued)
Other benefits to the Investment Manager
The Committee and the Board received and considered information regarding “fall-out” or ancillary benefits received by the Investment Manager and its affiliates as a result of their relationships with the Fund, such as the engagement of the Investment Manager’s affiliates to provide distribution, transfer agency and shareholder services to the Fund. In this regard, among other matters, the Committee and the Board considered that the Fund’s distributor retains a portion of the distribution fees from the Fund and receives a portion of the sales charges on sales or redemptions of certain classes of shares of the Fund. The Committee and the Board also considered the benefits of research made available to the Investment Manager by reason of brokerage commissions generated by the Fund’s securities transactions, and reviewed information about the Investment Manager’s practices with respect to considering brokerage and research services when allocating portfolio transactions. In this connection, the Board also noted that the amount of research made available to the Investment Manager by reason of brokerage commissions had been declining over time, and may decline further. The Committee and the Board recognized that the Investment Manager’s profitability would be somewhat lower without these benefits.
Conclusion
The Committee and the Board reviewed all of the above considerations in reaching their decisions to recommend or approve the continuation of the Management Agreement. In their deliberations, the Trustees did not identify any particular information that was all-important or controlling, and individual Trustees may have attributed different weights to the various factors. Based on their evaluation of all factors that they deemed to be material, including those factors described above, and assisted by the advice of independent legal counsel, the Board, including the Independent Trustees, voting separately, unanimously approved the continuation of the Management Agreement.
| 40 | Columbia Contrarian Core Fund | Annual Report 2018 |
The Fund mails one shareholder report to each shareholder address. If you would like more than one report, please call shareholder services at 800.345.6611 and additional reports will be sent to you.
Proxy voting policies and procedures
The policy of the Board of Trustees is to vote the proxies of the companies in which the Fund holds investments consistent with the procedures as stated in the Statement of Additional Information (SAI). You may obtain a copy of the SAI without charge by calling 800.345.6611; contacting your financial intermediary; visiting columbiathreadneedleus.com/investor/; or searching the website of the Securities and Exchange Commission (SEC) at sec.gov. Information regarding how the Fund voted proxies relating to portfolio securities is filed with the SEC by August 31st for the most recent 12-month period ending June 30th of that year, and is available without charge by visiting columbiathreadneedleus.com/investor/, or searching the website of the SEC at sec.gov.
Quarterly schedule of investments
The Fund files a complete schedule of portfolio holdings with the SEC for the first and third quarters of each fiscal year on Form N-Q or Form N-PORT. The Fund’s Form N-Q or Form N-PORT is available on the SEC’s website at sec.gov and may be reviewed and copied at the SEC’s Public Reference Room in Washington, D.C. Information on the operation of the Public Reference Room may be obtained by calling 800.SEC.0330. The Fund’s complete schedule of portfolio holdings, as filed on Form N-Q or Form N-PORT, can also be obtained without charge, upon request, by calling 800.345.6611.
Additional Fund information
For more information about the Fund, please visit columbiathreadneedleus.com/investor/ or call 800.345.6611. Customer Service Representatives are available to answer your questions Monday through Friday from 8 a.m. to 7 p.m. Eastern time.
Fund investment manager
Columbia Management Investment Advisers, LLC
225 Franklin Street
Boston, MA 02110
Fund distributor
Columbia Management Investment Distributors, Inc.
225 Franklin Street
Boston, MA 02110
Fund transfer agent
Columbia Management Investment Services Corp.
Through October 31, 2018:
P.O. Box 8081
Boston, MA 02266-8081
Effective November 1, 2018:
P.O. Box 219104
Kansas City, MO 64121-9104
Columbia Contrarian Core Fund | Annual Report 2018
| 41 |
Columbia Contrarian Core Fund
Through October 31, 2018:
P.O. Box 8081
Boston, MA 02266-8081
Effective November 1, 2018:
P.O. Box 219104
Kansas City, MO 64121-9104
Please read and consider the investment objectives, risks, charges and expenses for any fund carefully before investing. For a prospectus and summary prospectus, which contains this and other important information about the Fund, go to
columbiathreadneedleus.com/investor/. The Fund is distributed by Columbia Management Investment Distributors, Inc., member FINRA, and managed by Columbia Management Investment Advisers, LLC.
Columbia Threadneedle Investments (Columbia Threadneedle) is the global brand name of the Columbia and Threadneedle group of companies. All rights reserved.
© 2018 Columbia Management Investment Advisers, LLC.
columbiathreadneedleus .com/investor/

Annual Report
August 31, 2018
Columbia Emerging Markets Fund
Not FDIC Insured • No bank guarantee • May lose value
Dear Shareholders,
Volatility exists in financial markets and this is not a comfortable fact of life. How investors deal with this reality, including how they react to short term spikes in volatility as well as to longer periods of increased or decreased volatility, may have a significant impact on their overall investing success.
Too often, investors change their investment strategy based on something that’s happening at a moment in time rather than thinking about how that change in strategy might affect their ability to achieve their longer-term financial goals. Emotion replaces logic and reasoning. Investors may sell in reaction to a market drop (fear or panic), locking in low returns which means they won’t be invested when the market returns, or they invest more at a market peak (greed or conviction), essentially when it is expensive to do so. In both cases, selling and buying at the exact wrong time.
We believe the best outcomes come from a consistent approach to investing. Here are five areas where advisors can help us overcome the tendency to react emotionally as we struggle to make the right choices with our investments:
Long-term focus
The further away long-term goals, aspirations and objectives are, the easier it is to stray away from the goals and priorities that we set out. Advisors help us stay focused on what we want to accomplish.
Discipline through up-and-down markets
Advisors help set rules to prevent us from making rash decisions that we may regret later. Knowing ahead of time what you should do in case of certain situations will help you get through volatile markets and not make emotional decisions.
Tax-awareness
Taxes are one of the biggest drags on investment returns and are critical attributes of investing. Yet few of us take the necessary steps to ease the corrosive effect of taxes. Advisors have tools and knowledge that may help us to manage portfolios more tax-efficiently and keep more of what we earn.
Emotional objectivity
Our emotions are very hard to manage and making investment decisions in an emotional state can lead to exceedingly bad outcomes. An objective advisor can help prevent some of the reactionary mistakes emotions often lead us to.
Education and guidance
The role of the advisor is to teach and guide us toward achieving our financial goals. In terms of working through emotions, guidance is by far the most important component.
By understanding our own behaviors and biases, we can prepare for future challenges. Your success is our priority. Talk to your advisor about how working with Columbia Threadneedle Investments may help you stay the course and position your portfolio for consistent, sustainable outcomes, regardless of market conditions.
Sincerely,
Christopher O. Petersen
President, Columbia Funds
Columbia Funds are distributed by Columbia Management Investment Distributors, Inc., member FINRA, and managed by Columbia Management Investment Advisers, LLC.
© 2018 Columbia Management Investment Advisers, LLC. All rights reserved.
Columbia Emerging Markets Fund | Annual Report 2018
Columbia Emerging Markets Fund | Annual Report 2018
Investment objective
Columbia Emerging Markets Fund (the Fund) seeks long-term capital appreciation.
Portfolio management
Dara White, CFA
Lead Portfolio Manager
Managed Fund since 2008
Robert Cameron
Portfolio Manager
Managed Fund since 2008
Jasmine (Weili) Huang, CFA, CPA (U.S. and China), CFM
Portfolio Manager
Managed Fund since 2008
Young Kim
Portfolio Manager
Managed Fund since 2015
Perry Vickery, CFA
Portfolio Manager
Managed Fund since 2017
Morningstar style boxTM
The Morningstar Style Box is based on a fund’s portfolio holdings. For equity funds, the vertical axis shows the market capitalization of the stocks owned, and the horizontal axis shows investment style (value, blend, or growth). Information shown is based on the most recent data provided by Morningstar.
© 2018 Morningstar, Inc. All rights reserved. The Morningstar information contained herein: (1) is proprietary to Morningstar and/or its content providers; (2) may not be copied or distributed; and (3) is not warranted to be accurate, complete or timely. Neither Morningstar nor its content providers are responsible for any damages or losses arising from any use of this information.
| Average annual total returns (%) (for the period ended August 31, 2018) |
| | | Inception | 1 Year | 5 Years | 10 Years |
| Class A | Excluding sales charges | 09/28/07 | -3.58 | 5.95 | 3.70 |
| | Including sales charges | | -9.13 | 4.69 | 3.08 |
| Advisor Class* | 03/19/13 | -3.26 | 6.23 | 3.97 |
| Class C | Excluding sales charges | 09/28/07 | -4.26 | 5.17 | 2.91 |
| | Including sales charges | | -5.22 | 5.17 | 2.91 |
| Institutional Class | 01/02/98 | -3.35 | 6.22 | 3.96 |
| Institutional 2 Class* | 11/08/12 | -3.22 | 6.38 | 4.05 |
| Institutional 3 Class* | 11/08/12 | -3.18 | 6.44 | 4.08 |
| Class R* | 09/27/10 | -3.85 | 5.69 | 3.45 |
| Class T* | Excluding sales charges | 09/27/10 | -3.52 | 5.94 | 3.70 |
| | Including sales charges | | -5.90 | 5.41 | 3.43 |
| MSCI Emerging Markets Index (Net) | | -0.68 | 5.04 | 3.45 |
| MSCI EAFE Index (Net) | | 4.39 | 5.73 | 3.66 |
Returns for Class A shares are shown with and without the maximum initial sales charge of 5.75%. Returns for Class C shares are shown with and without the 1.00% contingent deferred sales charge for the first year only. Returns for Class T shares are shown with and without the maximum initial sales charge of 2.50% per transaction. The Fund’s other share classes are not subject to sales charges and have limited eligibility. Effective November 1, 2017, Class R4, Class R5, Class Y and Class Z shares were renamed Advisor Class, Institutional 2 Class, Institutional 3 Class and Institutional Class shares, respectively. Please see the Fund’s prospectus for details. Performance for different share classes will vary based on differences in sales charges and fees associated with each share class. All results shown assume reinvestment of distributions during the period. Returns do not reflect the deduction of taxes that a shareholder may pay on Fund distributions or on the redemption of Fund shares. Performance results reflect the effect of any fee waivers or reimbursements of Fund expenses by Columbia Management Investment Advisers, LLC and/or any of its affiliates. Absent these fee waivers or expense reimbursement arrangements, performance results would have been lower.
The performance information shown represents past performance and is not a guarantee of future results. The investment return and principal value of your investment will fluctuate so that your shares, when redeemed, may be worth more or less than their original cost. Current performance may be lower or higher than the performance information shown. You may obtain performance information current to the most recent month-end by contacting your financial intermediary, visiting columbiathreadneedleus.com/investor/ or calling 800.345.6611.
| * | The returns shown for periods prior to the share class inception date (including returns for the Life of the Fund, if shown, which are since Fund inception) include the returns of the Fund’s oldest share class. These returns are adjusted to reflect any higher class-related operating expenses of the newer share classes, as applicable. Please visit columbiathreadneedleus.com/investor/investment-products/mutual-funds/appended-performance for more information. |
The MSCI Emerging Markets Index (Net) is a free float-adjusted market capitalization index that is designed to measure equity market performance of emerging markets.
The MSCI EAFE Index (Net) is a free float-adjusted market capitalization index that is designed to measure the equity market performance of developed markets, excluding the U.S. and Canada. The index is compiled from a composite of securities markets of Europe, Australasia and the Far East and is widely recognized by investors in foreign markets as the measurement index for portfolios of non-North American securities.
Indices are not available for investment, are not professionally managed and do not reflect sales charges, fees, brokerage commissions, taxes (except the MSCI Emerging Markets Index (Net) and the MSCI EAFE Index (Net) which reflect reinvested dividends net of withholding taxes) or other expenses of investing. Securities in the Fund may not match those in an index.
| 2 | Columbia Emerging Markets Fund | Annual Report 2018 |
Fund at a Glance (continued)
Performance of a hypothetical $10,000 investment (August 31, 2008 — August 31, 2018)
The chart above shows the change in value of a hypothetical $10,000 investment in Class A shares of Columbia Emerging Markets Fund during the stated time period, and does not reflect the deduction of taxes that a shareholder may pay on Fund distributions or on the redemption of Fund shares.
| Top 10 holdings (%) (at August 31, 2018) |
| Alibaba Group Holding Ltd., ADR (China) | 6.6 |
| Tencent Holdings Ltd. (China) | 5.8 |
| Samsung Electronics Co., Ltd. (South Korea) | 5.4 |
| Taiwan Semiconductor Manufacturing Co., Ltd. (Taiwan) | 3.8 |
| Naspers Ltd., Class N (South Africa) | 3.6 |
| SK Hynix, Inc. (South Korea) | 2.8 |
| Industrial & Commercial Bank of China Ltd., Class H (China) | 2.2 |
| Ping An Insurance Group Co. of China Ltd., Class H (China) | 2.1 |
| PT Bank Central Asia Tbk (Indonesia) | 1.7 |
| Grupo Financiero Banorte SAB de CV, Class O (Mexico) | 1.6 |
Percentages indicated are based upon total investments (excluding Money Market Funds and derivatives, if any).
For further detail about these holdings, please refer to the section entitled “Portfolio of Investments.”
Fund holdings are as of the date given, are subject to change at any time, and are not recommendations to buy or sell any security.
| Equity sector breakdown (%) (at August 31, 2018) |
| Consumer Discretionary | 14.4 |
| Consumer Staples | 4.7 |
| Energy | 3.7 |
| Financials | 26.5 |
| Health Care | 4.1 |
| Industrials | 2.1 |
| Information Technology | 37.5 |
| Materials | 4.9 |
| Real Estate | 0.4 |
| Telecommunication Services | 0.8 |
| Utilities | 0.9 |
| Total | 100.0 |
Percentages indicated are based upon total equity investments. The Fund’s portfolio composition is subject to change.
Columbia Emerging Markets Fund | Annual Report 2018
| 3 |
Fund at a Glance (continued)
| Country breakdown (%) (at August 31, 2018) |
| Argentina | 0.2 |
| Brazil | 7.2 |
| Canada | 1.2 |
| China | 30.3 |
| Hong Kong | 4.0 |
| India | 9.9 |
| Indonesia | 4.7 |
| Mexico | 2.2 |
| Panama | 0.3 |
| Peru | 1.1 |
| Philippines | 0.4 |
| Poland | 1.4 |
| Russian Federation | 4.4 |
| South Africa | 5.8 |
| South Korea | 13.6 |
| Spain | 0.2 |
| Taiwan | 6.5 |
| Thailand | 2.2 |
| United States(a) | 4.4 |
| Total | 100.0 |
| (a) | Includes investments in Money Market Funds. |
Country breakdown is based primarily on issuer’s place of organization/incorporation. Percentages indicated are based upon total investments and exclude investments in derivatives, if any. The Fund’s portfolio composition is subject to change.
| 4 | Columbia Emerging Markets Fund | Annual Report 2018 |
Manager Discussion of Fund Performance
The Fund’s Class A shares returned -3.58%, excluding sales charges, during the 12-month period that ended August 31, 2018. The Fund’s benchmark, the MSCI Emerging Markets Index (Net), returned -0.68% during the period, while the MSCI EAFE Index (Net), a measure of more developed foreign markets, returned 4.39%. Individual stock selection, particularly in the industrials, health care, and materials sectors, was the primary factor in the Fund’s underperformance.
Market overview
After delivering a strong gain from the beginning of the period through late January, emerging market equities entered a protracted downturn and ultimately finished in negative territory for the full 12 months ended August 31, 2018.
The initial rally, while short lived in duration, nonetheless proved substantial in magnitude. After trading sideways from September 2017 through November 2017, emerging market stocks surged over the next two months. During this time, investor optimism regarding synchronized global growth contributed to sizable gains for higher risk assets. In the short span from December 6, 2017 to the peak on January 26, 2018, the benchmark registered a gain of more than 15%.
The advance stalled in early February 2018, as the prospect of tighter monetary policy by the world’s major central banks led to a spike in bond yields and a sharp downturn across the world equity markets. Following a strong initial recovery from the sell-off, the benchmark traded steadily lower through the remainder of the period and never regained its January 2018 high. Stocks were pressured by negative headlines related to economic turmoil in Venezuela, Argentina, and Turkey, as well as political uncertainty in Mexico, Brazil, and South Africa. Investors also reacted negatively to signs of waning global growth, highlighted by mounting evidence that China’s economy had begun to slow. Not least, emerging-market stocks came under pressure from the shifting outlook for U.S. trade policy. These factors fueled weakness in the both equities and currencies during the spring and summer, ultimately causing the benchmark to finish the period with a negative total return.
Contributors and detractors
Individual stock selection was the primary factor in the Fund’s underperformance. The largest shortfall occurred in the industrials sector, where the Brazilian airline operator Azul SA experienced cost pressures due to rising fuel prices and weakness in Brazil’s currency. We retained the investment based on our view that the company’s dominant market position should enable it to maintain its pricing power. We also lagged in health care, where Fleury SA., a provider of medical services in Brazil, lost ground after its earnings came in below expectations. The materials sector was another challenging area for the Fund, primarily as a result of the downturn in shares of the Argentinian cement company Loma Negra SA. The depreciation of the peso adversely affected the company’s dollar pricing, and slowing growth was seen as pressuring the near-term demand for cement. We chose to sell the stock from the portfolio.
On the positive side, our investments in the financials sector outpaced the broader category. India-based bank stocks such as Bajaj Finance, Ltd., HDFC Bank, Ltd., and Yes Bank, Ltd. were particularly robust performers, as the country’s growth picked up following the initial reaction to the government’s 2016 decision to declare the use of large bank notes to be invalid. We continue to see a long-term opportunity in Indian financials due to the steady progress of privatization. The Fund’s performance in the financial sector was also boosted by the strong showing of our holdings in Chinese insurance stocks, including AIA Group, Ltd. and Ping An Insurance Company of China, Ltd. We believe the industry stands to benefit as rising middle-class wealth in the country fosters increased demand for insurance over time. China was also home to two of the Fund’s top performers outside of financials: Kingdee International Software Group Co., Ltd. and Wuxi Biologics Cayman, Inc.
The information technology sector was an additional area of relative strength for the Fund, thanks to the significant gains for the semiconductor-related stocks Taiwan Semiconductor Manufacturing Co., Samsung Electronics Co., Ltd., and SK Hynix, Inc.
The Fund’s sector and country allocations offset some of the deficit from stock selection. With regard to the former, our decision to maintain overweight positions in information technology and health care added value and outweighed the negative effect of being underweight in the consumer discretionary sector. In terms of country positioning, the Fund benefited from an overweight in China — particularly Hong Kong-listed companies — and an underweight in Turkey. When assessing performance, it’s important to keep in mind that the Fund’s country and sector weightings are the result of our individual stock selection process and not top-down analysis.
Columbia Emerging Markets Fund | Annual Report 2018
| 5 |
Manager Discussion of Fund Performance (continued)
Portfolio positioning
We continued to use a bottom-up approach designed to identify fast-growing, fundamentally sound companies that are capitalizing on what we believe to be favorable long-term trends. This strategy led us to hold an overweight position in information technology, where we believe the demand for new and better technology is sustainable. We favor established winners such as Chinese e-commerce giants Tencent Holdings Ltd. and Alibaba Group Holdings Ltd. We also maintained an overweight in health care, where we identified a wide range of companies poised to capitalize on the growing demand for higher quality drugs and health services. Additionally, the sector’s generally lower sensitivity to broader economic trends means that it can act as a defensive component within the context of the overall portfolio.
The financial sector was an additional overweight of note. We sought to invest in companies with the potential to generate above-average growth, including Itau Unibanco Holding SA (Brazil) and Credicorp Ltd. (Peru). China is also home to a number of interesting financial stocks, including banks that have benefited from improving credit quality and rising loan growth — such as China Merchants Bank Co., Ltd. — as well as insurance providers such as AIA and Ping An.
The Fund was underweight in energy and materials, but we continued to find opportunities in specific companies that were exhibiting cost controls and reducing capital expenditures. Consumer staples was another area in which we had a below-benchmark weighting, but we identified compelling stories among a number of individual stocks. One such company was Wuliangye Yibin Co., Ltd., a Chinese spirits producer that we believe is poised to benefit from the long-term development of the country’s middle class. Other notable underweights included industrials, utilities, and real estate.
At period’s end
The market environment proved challenging throughout most of 2018, and risks remained in place as the period drew to a close. Still, we retained a positive view on emerging markets given that the majority of the recent volatility was the result of broader macroeconomic factors. At the close of the reporting period, we believed the underlying fundamentals of the emerging markets remained quite favorable, with robust earnings growth, rising consumer spending, improving corporate governance, and economic growth that remained higher than that of the developed world. Despite these supportive factors, valuations came down significantly amid the market downturn of the past seven-plus months. We viewed this disconnect as a positive development, as it provided us with the opportunity to purchase shares of growing companies at more reasonable prices.
Market risk may affect a single issuer, sector of the economy, industry or the market as a whole. International investing involves certain risks and volatility due to potential political, economic or currency instabilities and different financial and accounting standards. Risks are enhanced for emerging market issuers. Investments in small- and mid-cap companies involve risks and volatility greater than investments in larger, more established companies. Value securities may be unprofitable if the market fails to recognize their intrinsic worth or the portfolio manager misgauged that worth. Growth securities, at times, may not perform as well as value securities or the stock market in general and may be out of favor with investors. Certain issuer events, including initial public offerings, business consolidation or restructuring, may present heightened risks to securities from the high degree of uncertainty associated with such events. See the Fund’s prospectus for more information on these and other risks.
The views expressed in this report reflect the current views of the respective parties. These views are not guarantees of future performance and involve certain risks, uncertainties and assumptions that are difficult to predict, so actual outcomes and results may differ significantly from the views expressed. These views are subject to change at any time based upon economic, market or other conditions and the respective parties disclaim any responsibility to update such views. These views may not be relied on as investment advice and, because investment decisions for a Columbia fund are based on numerous factors, may not be relied on as an indication of trading intent on behalf of any particular Columbia fund. References to specific securities should not be construed as a recommendation or investment advice.
| 6 | Columbia Emerging Markets Fund | Annual Report 2018 |
Understanding Your Fund’s Expenses
(Unaudited)
As an investor, you incur two types of costs. There are shareholder transaction costs, which generally include sales charges on purchases and may include redemption fees. There are also ongoing costs, which generally include management fees, distribution and/or service fees, and other fund expenses. The following information is intended to help you understand your ongoing costs (in dollars) of investing in the Fund and to help you compare these costs with the ongoing costs of investing in other mutual funds.
Analyzing your Fund’s expenses
To illustrate these ongoing costs, we have provided examples and calculated the expenses paid by investors in each share class of the Fund during the period. The actual and hypothetical information in the table is based on an initial investment of $1,000 at the beginning of the period indicated and held for the entire period. Expense information is calculated two ways and each method provides you with different information. The amount listed in the “Actual” column is calculated using the Fund’s actual operating expenses and total return for the period. You may use the Actual information, together with the amount invested, to estimate the expenses that you paid over the period. Simply divide your account value by $1,000 (for example, an $8,600 account value divided by $1,000 = 8.6), then multiply the results by the expenses paid during the period under the “Actual” column. The amount listed in the “Hypothetical” column assumes a 5% annual rate of return before expenses (which is not the Fund’s actual return) and then applies the Fund’s actual expense ratio for the period to the hypothetical return. You should not use the hypothetical account values and expenses to estimate either your actual account balance at the end of the period or the expenses you paid during the period. See “Compare with other funds” below for details on how to use the hypothetical data.
Compare with other funds
Since all mutual funds are required to include the same hypothetical calculations about expenses in shareholder reports, you can use this information to compare the ongoing cost of investing in the Fund with other funds. To do so, compare the hypothetical example with the 5% hypothetical examples that appear in the shareholder reports of other funds. As you compare hypothetical examples of other funds, it is important to note that hypothetical examples are meant to highlight the ongoing costs of investing in a fund only and do not reflect any transaction costs, such as sales charges, or redemption or exchange fees. Therefore, the hypothetical calculations are useful in comparing ongoing costs only, and will not help you determine the relative total costs of owning different funds. If transaction costs were included in these calculations, your costs would be higher.
| March 1, 2018 — August 31, 2018 |
| | Account value at the
beginning of the
period ($) | Account value at the
end of the
period ($) | Expenses paid during
the period ($) | Fund’s annualized
expense ratio (%) |
| | Actual | Hypothetical | Actual | Hypothetical | Actual | Hypothetical | Actual |
| Class A | 1,000.00 | 1,000.00 | 871.60 | 1,017.39 | 7.31 | 7.88 | 1.55 |
| Advisor Class | 1,000.00 | 1,000.00 | 873.10 | 1,018.70 | 6.09 | 6.56 | 1.29 |
| Class C | 1,000.00 | 1,000.00 | 868.70 | 1,013.61 | 10.83 | 11.67 | 2.30 |
| Institutional Class | 1,000.00 | 1,000.00 | 872.90 | 1,018.65 | 6.14 | 6.61 | 1.30 |
| Institutional 2 Class | 1,000.00 | 1,000.00 | 873.60 | 1,019.31 | 5.53 | 5.96 | 1.17 |
| Institutional 3 Class | 1,000.00 | 1,000.00 | 873.50 | 1,019.61 | 5.24 | 5.65 | 1.11 |
| Class R | 1,000.00 | 1,000.00 | 870.70 | 1,016.13 | 8.49 | 9.15 | 1.80 |
| Class T | 1,000.00 | 1,000.00 | 872.20 | 1,017.39 | 7.31 | 7.88 | 1.55 |
Expenses paid during the period are equal to the annualized expense ratio for each class as indicated above, multiplied by the average account value over the period and then multiplied by the number of days in the Fund’s most recent fiscal half year and divided by 365.
Expenses do not include fees and expenses incurred indirectly by the Fund from its investment in underlying funds, including affiliated and non-affiliated pooled investment vehicles, such as mutual funds and exchange-traded funds.
Had Columbia Management Investment Advisers, LLC and/or certain of its affiliates not waived/reimbursed certain fees and expenses, account value at the end of the period would have been reduced.
Columbia Emerging Markets Fund | Annual Report 2018
| 7 |
Portfolio of Investments
August 31, 2018
(Percentages represent value of investments compared to net assets)
Investments in securities
| Common Stocks 95.1% |
| Issuer | Shares | Value ($) |
| Argentina 0.2% |
| Banco Macro SA, ADR | 53,223 | 2,322,652 |
| Brazil 6.5% |
| B3 SA - Brasil Bolsa Balcao | 1,028,600 | 5,538,091 |
| Fleury SA | 1,721,000 | 10,854,752 |
| Hypera SA | 612,900 | 4,118,503 |
| Itaú Unibanco Holding SA, ADR | 1,977,040 | 20,600,757 |
| Localiza Rent a Car SA | 1,128,100 | 6,001,799 |
| Pagseguro Digital Ltd., Class A(a) | 518,769 | 14,987,236 |
| Petroleo Brasileiro SA, ADR | 796,515 | 8,658,118 |
| Vale SA ADR | 1,368,073 | 18,058,563 |
| Total | 88,817,819 |
| Canada 1.2% |
| First Quantum Minerals Ltd. | 582,981 | 7,312,949 |
| Parex Resources(a) | 652,110 | 9,369,397 |
| Total | 16,682,346 |
| China 30.3% |
| 58.Com, Inc., ADR(a) | 87,494 | 6,656,544 |
| AAC Technologies Holdings, Inc. | 458,000 | 5,090,287 |
| Alibaba Group Holding Ltd., ADR(a) | 500,689 | 87,625,582 |
| Baidu, Inc., ADR(a) | 75,057 | 16,998,909 |
| BeiGene Ltd., ADR(a) | 50,876 | 9,032,016 |
| Brilliance China Automotive Holdings Ltd. | 4,780,000 | 7,585,110 |
| China Animal Healthcare Ltd.(a),(b),(c) | 6,354,000 | 1 |
| China Merchants Bank Co., Ltd., Class H | 3,619,000 | 13,900,998 |
| China Resources Cement Holdings Ltd. | 7,530,000 | 8,805,845 |
| CSPC Pharmaceutical Group Ltd. | 3,526,000 | 8,905,637 |
| Industrial & Commercial Bank of China Ltd., Class H | 39,391,000 | 29,094,109 |
| Jiangsu Yanghe Brewery Joint-Stock Co., Ltd., Class A | 525,373 | 8,877,909 |
| Kingdee International Software Group Co., Ltd. | 7,714,000 | 8,802,316 |
| Kweichow Moutai Co., Ltd., Class A | 100,748 | 9,728,174 |
| Midea Group Co., Ltd., Class A | 1,248,553 | 7,610,245 |
| NetEase, Inc., ADR | 50,101 | 9,905,469 |
| New Oriental Education & Technology Group, Inc., ADR | 249,482 | 19,609,285 |
| Nexteer Automotive Group Ltd. | 4,629,000 | 7,807,899 |
| Common Stocks (continued) |
| Issuer | Shares | Value ($) |
| Ping An Insurance Group Co. of China Ltd., Class H | 2,868,000 | 27,664,298 |
| Sunny Optical Technology Group Co., Ltd. | 932,300 | 11,883,145 |
| Tencent Holdings Ltd. | 1,773,200 | 76,224,853 |
| Tingyi Cayman Islands Holding Corp. | 4,672,000 | 8,345,461 |
| Wuliangye Yibin Co., Ltd., Class A | 1,561,698 | 14,186,235 |
| Wuxi Biologics Cayman, Inc.(a) | 907,000 | 8,965,239 |
| Total | 413,305,566 |
| Hong Kong 4.0% |
| AIA Group Ltd. | 1,644,600 | 14,199,902 |
| Galaxy Entertainment Group Ltd. | 2,267,000 | 16,791,805 |
| Melco Resorts & Entertainment Ltd., ADR | 432,429 | 10,326,405 |
| Techtronic Industries Co., Ltd. | 2,100,500 | 12,859,861 |
| Total | 54,177,973 |
| India 9.9% |
| Adani Ports & Special Economic Zone, Ltd. | 985,241 | 5,333,880 |
| AU Small Finance Bank Ltd. | 306,175 | 3,176,842 |
| Bajaj Finance Ltd. | 119,258 | 4,810,255 |
| Balkrishna Industries Ltd. | 363,256 | 6,972,899 |
| Biocon Ltd. | 390,625 | 3,439,377 |
| Eicher Motors Ltd. | 51,992 | 20,593,751 |
| HDFC Asset Management Co., Ltd.(a) | 284,897 | 7,286,687 |
| HDFC Bank Ltd., ADR | 166,766 | 16,888,393 |
| HDFC Standard Life Insurance Co., Ltd. | 1,580,639 | 10,309,901 |
| Indraprastha Gas Ltd. | 2,870,419 | 11,772,587 |
| IndusInd Bank Ltd. | 367,849 | 9,898,252 |
| InterGlobe Aviation Ltd. | 259,996 | 3,410,873 |
| Natco Pharma Ltd. | 378,245 | 4,167,185 |
| Petronet LNG Ltd. | 2,285,927 | 8,010,390 |
| RBL Bank Ltd. | 590,500 | 5,230,725 |
| Tejas Networks Ltd.(a) | 1,903,604 | 7,803,044 |
| Yes Bank Ltd. | 1,266,953 | 6,151,735 |
| Total | 135,256,776 |
| Indonesia 4.7% |
| PT Ace Hardware Indonesia Tbk | 71,267,400 | 6,580,018 |
| PT Astra International Tbk | 18,604,300 | 9,162,913 |
| PT Bank Central Asia Tbk | 13,040,900 | 21,964,583 |
| PT Bank Rakyat Indonesia Persero Tbk | 97,006,900 | 20,959,943 |
The accompanying Notes to Financial Statements are an integral part of this statement.
| 8 | Columbia Emerging Markets Fund | Annual Report 2018 |
Portfolio of Investments (continued)
August 31, 2018
| Common Stocks (continued) |
| Issuer | Shares | Value ($) |
| PT Pakuwon Jati Tbk | 160,903,400 | 5,626,162 |
| Total | 64,293,619 |
| Mexico 2.2% |
| Grupo Financiero Banorte SAB de CV, Class O | 3,090,600 | 21,079,865 |
| Mexichem SAB de CV | 2,531,900 | 8,543,808 |
| Total | 29,623,673 |
| Panama 0.3% |
| Copa Holdings SA, Class A | 44,642 | 3,568,681 |
| Peru 1.1% |
| Credicorp Ltd. | 72,229 | 15,747,366 |
| Philippines 0.4% |
| Security Bank Corp. | 1,543,340 | 5,619,138 |
| Poland 1.4% |
| Dino Polska SA(a) | 377,225 | 9,291,457 |
| KRUK SA | 181,958 | 10,161,412 |
| Total | 19,452,869 |
| Russian Federation 4.4% |
| Detsky Mir PJSC | 3,393,890 | 4,525,606 |
| Lukoil PJSC, ADR | 172,552 | 11,945,775 |
| Mail.ru Group Ltd., GDR(a),(d) | 405,164 | 8,711,026 |
| Sberbank of Russia PJSC, ADR | 1,184,650 | 12,859,376 |
| TCS Group Holding PLC, GDR(d) | 447,095 | 8,226,548 |
| Yandex NV, Class A(a) | 422,312 | 13,568,884 |
| Total | 59,837,215 |
| South Africa 5.8% |
| AVI Ltd. | 1,092,276 | 8,622,997 |
| Capitec Bank Holdings Ltd. | 106,898 | 7,294,452 |
| Clicks Group Ltd. | 219,159 | 3,027,511 |
| Mr. Price Group Ltd. | 262,320 | 4,022,538 |
| Naspers Ltd., Class N | 216,155 | 48,037,599 |
| Sasol Ltd. | 223,092 | 8,744,538 |
| Total | 79,749,635 |
| South Korea 12.8% |
| Cafe24 Corp.(a) | 34,506 | 5,013,170 |
| KB Financial Group, Inc. | 318,223 | 14,713,220 |
| NAVER Corp. | 18,829 | 12,713,623 |
| POSCO | 44,797 | 13,070,855 |
| Common Stocks (continued) |
| Issuer | Shares | Value ($) |
| Samsung Electronics Co., Ltd. | 1,636,550 | 71,141,901 |
| SK Hynix, Inc. | 489,485 | 36,505,666 |
| SK Innovation Co., Ltd. | 64,317 | 11,150,154 |
| SK Telecom Co., Ltd. | 43,668 | 10,281,783 |
| Total | 174,590,372 |
| Spain 0.2% |
| Atento SA | 322,656 | 2,323,123 |
| Taiwan 6.5% |
| Cathay Financial Holding Co., Ltd. | 8,110,000 | 13,900,629 |
| eMemory Technology, Inc. | 426,000 | 4,385,754 |
| MediaTek, Inc. | 906,000 | 7,422,274 |
| Silergy Corp. | 326,000 | 6,429,832 |
| Taiwan Semiconductor Manufacturing Co., Ltd. | 6,055,048 | 50,733,377 |
| United Microelectronics Corp. | 9,929,000 | 5,628,187 |
| Total | 88,500,053 |
| Thailand 2.1% |
| Mega Lifesciences PCL, Foreign Registered Shares | 4,650,400 | 5,011,425 |
| Muangthai Leasing PCL, Foreign Registered Shares | 11,780,800 | 15,023,025 |
| PTG Energy PCL, Foreign Registered Shares | 11,090,819 | 3,967,252 |
| Tisco Financial Group PCL, Foreign Registered Shares | 2,188,600 | 5,484,954 |
| Total | 29,486,656 |
| United States 1.1% |
| Luxoft Holding, Inc.(a) | 122,699 | 5,717,773 |
| Universal Display Corp. | 75,425 | 9,232,020 |
| Total | 14,949,793 |
Total Common Stocks
(Cost $934,451,935) | 1,298,305,325 |
| Preferred Stocks 1.6% |
| Issuer | | Shares | Value ($) |
| Brazil 0.7% |
| Azul SA(a) | | 1,123,200 | 6,292,854 |
| Lojas Americanas SA | | 915,900 | 3,514,649 |
| Total | 9,807,503 |
| South Korea 0.9% |
| Samsung Electronics Co., Ltd. | | 330,700 | 11,783,274 |
Total Preferred Stocks
(Cost $19,533,472) | 21,590,777 |
The accompanying Notes to Financial Statements are an integral part of this statement.
Columbia Emerging Markets Fund | Annual Report 2018
| 9 |
Portfolio of Investments (continued)
August 31, 2018
| Money Market Funds 3.3% |
| | Shares | Value ($) |
| Columbia Short-Term Cash Fund, 2.058%(e),(f) | 44,632,401 | 44,627,938 |
Total Money Market Funds
(Cost $44,627,938) | 44,627,938 |
Total Investments in Securities
(Cost $998,613,345) | 1,364,524,040 |
| Other Assets & Liabilities, Net | | 556,291 |
| Net Assets | $1,365,080,331 |
Notes to Portfolio of Investments
| (a) | Non-income producing investment. |
| (b) | Represents fair value as determined in good faith under procedures approved by the Board of Trustees. At August 31, 2018, the total value of these securities amounted to $1, which represents less than 0.01% of total net assets. |
| (c) | Valuation based on significant unobservable inputs. |
| (d) | Represents privately placed and other securities and instruments exempt from SEC registration (collectively, private placements), such as Section 4(a)(2) and Rule 144A eligible securities, which are often sold only to qualified institutional buyers. The Fund may invest in private placements determined to be liquid as well as those determined to be illiquid. Private placements may be determined to be liquid under guidelines established by the Fund’s Board of Trustees. At August 31, 2018, the total value of these securities amounted to $16,937,574, which represents 1.24% of total net assets. |
| (e) | The rate shown is the seven-day current annualized yield at August 31, 2018. |
| (f) | As defined in the Investment Company Act of 1940, an affiliated company is one in which the Fund owns 5% or more of the company’s outstanding voting securities, or a company which is under common ownership or control with the Fund. Holdings and transactions in these affiliated companies during the year ended August 31, 2018 are as follows: |
| Issuer | Beginning
shares | Shares
purchased | Shares
sold | Ending
shares | Realized gain
(loss) —
affiliated
issuers ($) | Net change in
unrealized
appreciation
(depreciation) —
affiliated
issuers ($) | Dividends —
affiliated
issuers ($) | Value —
affiliated
issuers
at end of
period ($) |
| Columbia Short-Term Cash Fund, 2.058% |
| | 25,505,768 | 429,121,290 | (409,994,657) | 44,632,401 | 4,579 | (132) | 579,748 | 44,627,938 |
Abbreviation Legend
| ADR | American Depositary Receipt |
| GDR | Global Depositary Receipt |
Fair value measurements
The Fund categorizes its fair value measurements according to a three-level hierarchy that maximizes the use of observable inputs and minimizes the use of unobservable inputs by prioritizing that the most observable input be used when available. Observable inputs are those that market participants would use in pricing an investment based on market data obtained from sources independent of the reporting entity. Unobservable inputs are those that reflect the Fund’s assumptions about the information market participants would use in pricing an investment. An investment’s level within the fair value hierarchy is based on the lowest level of any input that is deemed significant to the asset’s or liability’s fair value measurement. The input levels are not necessarily an indication of the risk or liquidity associated with investments at that level. For example, certain U.S. government securities are generally high quality and liquid, however, they are reflected as Level 2 because the inputs used to determine fair value may not always be quoted prices in an active market.
Fair value inputs are summarized in the three broad levels listed below:
| ■ | Level 1 — Valuations based on quoted prices for investments in active markets that the Fund has the ability to access at the measurement date. Valuation adjustments are not applied to Level 1 investments. |
| ■ | Level 2 — Valuations based on other significant observable inputs (including quoted prices for similar securities, interest rates, prepayment speeds, credit risks, etc.). |
| ■ | Level 3 — Valuations based on significant unobservable inputs (including the Fund’s own assumptions and judgment in determining the fair value of investments). |
Inputs that are used in determining fair value of an investment may include price information, credit data, volatility statistics, and other factors. These inputs can be either observable or unobservable. The availability of observable inputs can vary between investments, and is affected by various factors such as the type of investment, and the volume and level of activity for that investment or similar investments in the marketplace. The inputs will be considered by the Investment Manager, along with any other relevant factors in the calculation of an investment’s fair value. The Fund uses prices and inputs that are current as of the measurement date, which may include periods of market dislocations. During these periods, the availability of prices and inputs may be reduced for many investments. This condition could cause an investment to be reclassified between the various levels within the hierarchy.
The accompanying Notes to Financial Statements are an integral part of this statement.
| 10 | Columbia Emerging Markets Fund | Annual Report 2018 |
Portfolio of Investments (continued)
August 31, 2018
Fair value measurements (continued)
Foreign equity securities actively traded in markets where there is a significant delay in the local close relative to the New York Stock Exchange are classified as Level 2. The values of these securities may include an adjustment to reflect the impact of significant market movements following the close of local trading, as described in Note 2 to the financial statements – Security valuation.
Certain investments that have been measured at fair value using the net asset value (NAV) per share (or its equivalent) are not categorized in the fair value hierarchy. The fair value amounts presented in the table are intended to reconcile the fair value hierarchy to the amounts presented in the Portfolio of Investments. The Columbia Short-Term Cash Fund seeks to provide shareholders with maximum current income consistent with liquidity and stability of principal. Columbia Short-Term Cash Fund prices its shares with a floating NAV and no longer seeks to maintain a stable NAV.
Investments falling into the Level 3 category are primarily supported by quoted prices from brokers and dealers participating in the market for those investments. However, these may be classified as Level 3 investments due to lack of market transparency and corroboration to support these quoted prices. Additionally, valuation models may be used as the pricing source for any remaining investments classified as Level 3. These models may rely on one or more significant unobservable inputs and/or significant assumptions by the Investment Manager. Inputs used in valuations may include, but are not limited to, financial statement analysis, capital account balances, discount rates and estimated cash flows, and comparable company data.
Under the direction of the Fund’s Board of Trustees (the Board), the Investment Manager’s Valuation Committee (the Committee) is responsible for overseeing the valuation procedures approved by the Board. The Committee consists of voting and non-voting members from various groups within the Investment Manager’s organization, including operations and accounting, trading and investments, compliance, risk management and legal.
The Committee meets at least monthly to review and approve valuation matters, which may include a description of specific valuation determinations, data regarding pricing information received from approved pricing vendors and brokers and the results of Board-approved valuation control policies and procedures (the Policies). The Policies address, among other things, instances when market quotations are or are not readily available, including recommendations of third party pricing vendors and a determination of appropriate pricing methodologies; events that require specific valuation determinations and assessment of fair value techniques; securities with a potential for stale pricing, including those that are illiquid, restricted, or in default; and the effectiveness of third party pricing vendors, including periodic reviews of vendors. The Committee meets more frequently, as needed, to discuss additional valuation matters, which may include the need to review back-testing results, review time-sensitive information or approve related valuation actions. The Committee reports to the Board, with members of the Committee meeting with the Board at each of its regularly scheduled meetings to discuss valuation matters and actions during the period, similar to those described earlier.
For investments categorized as Level 3, the Committee monitors information similar to that described above, which may include: (i) data specific to the issuer or comparable issuers, (ii) general market or specific sector news and (iii) quoted prices and specific or similar security transactions. The Committee considers this data and any changes from prior periods in order to assess the reasonableness of observable and unobservable inputs, any assumptions or internal models used to value those securities and changes in fair value. This data is also used to corroborate, when available, information received from approved pricing vendors and brokers. Various factors impact the frequency of monitoring this information (which may occur as often as daily). However, the Committee may determine that changes to inputs, assumptions and models are not required as a result of the monitoring procedures performed.
The following table is a summary of the inputs used to value the Fund’s investments at August 31, 2018:
| | Level 1
quoted prices
in active
markets for
identical
assets ($) | Level 2
other
significant
observable
inputs ($) | Level 3
significant
unobservable
inputs ($) | Investments
measured at
net asset
value ($) | Total ($) |
| Investments in Securities | | | | | |
| Common Stocks | | | | | |
| Argentina | 2,322,652 | — | — | — | 2,322,652 |
| Brazil | 88,817,819 | — | — | — | 88,817,819 |
| Canada | 16,682,346 | — | — | — | 16,682,346 |
| China | 149,827,805 | 263,477,760 | 1 | — | 413,305,566 |
| Hong Kong | 10,326,405 | 43,851,568 | — | — | 54,177,973 |
| India | 16,888,393 | 118,368,383 | — | — | 135,256,776 |
| Indonesia | — | 64,293,619 | — | — | 64,293,619 |
| Mexico | 29,623,673 | — | — | — | 29,623,673 |
| Panama | 3,568,681 | — | — | — | 3,568,681 |
| Peru | 15,747,366 | — | — | — | 15,747,366 |
| Philippines | — | 5,619,138 | — | — | 5,619,138 |
| Poland | — | 19,452,869 | — | — | 19,452,869 |
| Russian Federation | 25,514,659 | 34,322,556 | — | — | 59,837,215 |
| South Africa | — | 79,749,635 | — | — | 79,749,635 |
| South Korea | — | 174,590,372 | — | — | 174,590,372 |
| Spain | 2,323,123 | — | — | — | 2,323,123 |
| Taiwan | — | 88,500,053 | — | — | 88,500,053 |
The accompanying Notes to Financial Statements are an integral part of this statement.
Columbia Emerging Markets Fund | Annual Report 2018
| 11 |
Portfolio of Investments (continued)
August 31, 2018
Fair value measurements (continued)
| | Level 1
quoted prices
in active
markets for
identical
assets ($) | Level 2
other
significant
observable
inputs ($) | Level 3
significant
unobservable
inputs ($) | Investments
measured at
net asset
value ($) | Total ($) |
| Thailand | — | 29,486,656 | — | — | 29,486,656 |
| United States | 14,949,793 | — | — | — | 14,949,793 |
| Total Common Stocks | 376,592,715 | 921,712,609 | 1 | — | 1,298,305,325 |
| Preferred Stocks | | | | | |
| Brazil | 9,807,503 | — | — | — | 9,807,503 |
| South Korea | — | 11,783,274 | — | — | 11,783,274 |
| Total Preferred Stocks | 9,807,503 | 11,783,274 | — | — | 21,590,777 |
| Money Market Funds | — | — | — | 44,627,938 | 44,627,938 |
| Total Investments in Securities | 386,400,218 | 933,495,883 | 1 | 44,627,938 | 1,364,524,040 |
See the Portfolio of Investments for all investment classifications not indicated in the table.
The Fund’s assets assigned to the Level 2 input category are generally valued using the market approach, in which a security’s value is determined through reference to prices and information from market transactions for similar or identical assets. These assets include certain foreign securities for which a third party statistical pricing service may be employed for purposes of fair market valuation. The model utilized by such third party statistical pricing service takes into account a security’s correlation to available market data including, but not limited to, intraday index, ADR, and exchange-traded fund movements.
There were no transfers of financial assets between levels during the period.
The Fund does not hold any significant investments (greater than one percent of net assets) categorized as Level 3.
The Fund’s assets assigned to the Level 3 category are valued utilizing the valuation technique deemed the most appropriate in the circumstances. Certain common stocks classified as Level 3 securities are valued using the market approach. To determine fair value for these securities, management considered various factors which may have included, but were not limited to, the halt price of the security, discount rates observed in the market for similar assets as well as the movement in certain foreign or domestic market indices. Significant increases (decreases) to any of these inputs would result in a significantly higher (lower) fair value measurement. Generally, a change in observable yields on comparable securities would result in a directionally similar change to discount rates.
The accompanying Notes to Financial Statements are an integral part of this statement.
| 12 | Columbia Emerging Markets Fund | Annual Report 2018 |
Statement of Assets and Liabilities
August 31, 2018
| Assets | |
| Investments in securities, at value | |
| Unaffiliated issuers (cost $953,985,407) | $1,319,896,102 |
| Affiliated issuers (cost $44,627,938) | 44,627,938 |
| Cash | 125 |
| Foreign currency (cost $1,828,871) | 1,828,871 |
| Receivable for: | |
| Investments sold | 358,465 |
| Capital shares sold | 1,367,072 |
| Dividends | 1,339,173 |
| Foreign tax reclaims | 224 |
| Prepaid expenses | 9,294 |
| Trustees’ deferred compensation plan | 77,401 |
| Total assets | 1,369,504,665 |
| Liabilities | |
| Payable for: | |
| Investments purchased | 1,828,871 |
| Capital shares purchased | 1,281,588 |
| Foreign capital gains taxes deferred | 846,963 |
| Management services fees | 38,159 |
| Distribution and/or service fees | 2,627 |
| Transfer agent fees | 147,901 |
| Compensation of board members | 1,042 |
| Compensation of chief compliance officer | 95 |
| Other expenses | 199,687 |
| Trustees’ deferred compensation plan | 77,401 |
| Total liabilities | 4,424,334 |
| Net assets applicable to outstanding capital stock | $1,365,080,331 |
| Represented by | |
| Paid in capital | 1,023,983,407 |
| Undistributed net investment income | 2,344,628 |
| Accumulated net realized loss | (26,298,778) |
| Unrealized appreciation (depreciation) on: | |
| Investments - unaffiliated issuers | 365,910,695 |
| Foreign currency translations | (12,658) |
| Foreign capital gains tax | (846,963) |
| Total - representing net assets applicable to outstanding capital stock | $1,365,080,331 |
The accompanying Notes to Financial Statements are an integral part of this statement.
Columbia Emerging Markets Fund | Annual Report 2018
| 13 |
Statement of Assets and Liabilities (continued)
August 31, 2018
| Class A | |
| Net assets | $276,209,139 |
| Shares outstanding | 22,729,700 |
| Net asset value per share | $12.15 |
| Maximum sales charge | 5.75% |
| Maximum offering price per share (calculated by dividing the net asset value per share by 1.0 minus the maximum sales charge for Class A shares) | $12.89 |
| Advisor Class | |
| Net assets | $24,379,105 |
| Shares outstanding | 1,969,463 |
| Net asset value per share | $12.38 |
| Class C | |
| Net assets | $22,176,590 |
| Shares outstanding | 1,936,877 |
| Net asset value per share | $11.45 |
| Institutional Class | |
| Net assets | $203,192,904 |
| Shares outstanding | 16,536,680 |
| Net asset value per share | $12.29 |
| Institutional 2 Class | |
| Net assets | $155,442,178 |
| Shares outstanding | 12,561,709 |
| Net asset value per share | $12.37 |
| Institutional 3 Class | |
| Net assets | $673,687,825 |
| Shares outstanding | 54,196,277 |
| Net asset value per share | $12.43 |
| Class R | |
| Net assets | $9,846,793 |
| Shares outstanding | 821,195 |
| Net asset value per share | $11.99 |
| Class T | |
| Net assets | $145,797 |
| Shares outstanding | 12,005 |
| Net asset value per share(a) | $12.15 |
| Maximum sales charge | 2.50% |
| Maximum offering price per share (calculated by dividing the net asset value per share by 1.0 minus the maximum sales charge per transaction for Class T shares) | $12.46 |
| (a) | Net asset value per share rounds to this amount due to fractional shares outstanding. |
The accompanying Notes to Financial Statements are an integral part of this statement.
| 14 | Columbia Emerging Markets Fund | Annual Report 2018 |
Statement of Operations
Year Ended August 31, 2018
| Net investment income | |
| Income: | |
| Dividends — unaffiliated issuers | $26,529,485 |
| Dividends — affiliated issuers | 579,748 |
| Interfund lending | 68 |
| Foreign taxes withheld | (2,878,370) |
| Total income | 24,230,931 |
| Expenses: | |
| Management services fees | 14,851,585 |
| Distribution and/or service fees | |
| Class A | 744,390 |
| Class C | 283,808 |
| Class R | 58,797 |
| Class T | 479 |
| Transfer agent fees | |
| Class A | 580,394 |
| Advisor Class | 87,241 |
| Class C | 55,306 |
| Institutional Class | 408,138 |
| Institutional 2 Class | 75,747 |
| Institutional 3 Class | 57,647 |
| Class K | 29 |
| Class R | 22,834 |
| Class T | 371 |
| Plan administration fees | |
| Class K | 126 |
| Compensation of board members | 37,689 |
| Custodian fees | 538,118 |
| Printing and postage fees | 122,692 |
| Registration fees | 158,880 |
| Audit fees | 58,054 |
| Legal fees | 34,698 |
| Compensation of chief compliance officer | 579 |
| Other | 288,883 |
| Total expenses | 18,466,485 |
| Fees waived by transfer agent | |
| Institutional 2 Class | (3,969) |
| Institutional 3 Class | (21,360) |
| Class K | (3) |
| Expense reduction | (1,480) |
| Total net expenses | 18,439,673 |
| Net investment income | 5,791,258 |
| Realized and unrealized gain (loss) — net | |
| Net realized gain (loss) on: | |
| Investments — unaffiliated issuers | 48,936,532 |
| Investments — affiliated issuers | 4,579 |
| Foreign currency translations | (326,120) |
| Net realized gain | 48,614,991 |
| Net change in unrealized appreciation (depreciation) on: | |
| Investments — unaffiliated issuers | (105,229,051) |
| Investments — affiliated issuers | (132) |
| Foreign currency translations | (15,004) |
| Foreign capital gains tax | 1,812,021 |
| Net change in unrealized appreciation (depreciation) | (103,432,166) |
| Net realized and unrealized loss | (54,817,175) |
| Net decrease in net assets resulting from operations | $(49,025,917) |
The accompanying Notes to Financial Statements are an integral part of this statement.
Columbia Emerging Markets Fund | Annual Report 2018
| 15 |
Statement of Changes in Net Assets
| | Year Ended
August 31, 2018 | Year Ended
August 31, 2017 |
| Operations | | |
| Net investment income | $5,791,258 | $4,490,018 |
| Net realized gain | 48,614,991 | 70,673,189 |
| Net change in unrealized appreciation (depreciation) | (103,432,166) | 223,143,872 |
| Net increase (decrease) in net assets resulting from operations | (49,025,917) | 298,307,079 |
| Distributions to shareholders | | |
| Net investment income | | |
| Class A | (428,669) | — |
| Advisor Class | (246,201) | — |
| Institutional Class | (663,215) | — |
| Institutional 2 Class | (591,542) | — |
| Institutional 3 Class | (3,566,018) | — |
| Class K | (265) | — |
| Class T | (273) | — |
| Total distributions to shareholders | (5,496,183) | — |
| Increase (decrease) in net assets from capital stock activity | 61,209,749 | (260,416,367) |
| Total increase in net assets | 6,687,649 | 37,890,712 |
| Net assets at beginning of year | 1,358,392,682 | 1,320,501,970 |
| Net assets at end of year | $1,365,080,331 | $1,358,392,682 |
| Undistributed net investment income | $2,344,628 | $2,699,247 |
The accompanying Notes to Financial Statements are an integral part of this statement.
| 16 | Columbia Emerging Markets Fund | Annual Report 2018 |
Statement of Changes in Net Assets (continued)
| | Year Ended | Year Ended |
| | August 31, 2018 | August 31, 2017 |
| | Shares | Dollars ($) | Shares | Dollars ($) |
| Capital stock activity |
| Class A | | | | |
| Subscriptions | 6,518,228 | 87,750,740 | 6,289,768 | 66,175,683 |
| Distributions reinvested | 30,980 | 414,207 | — | — |
| Redemptions | (5,276,371) | (70,201,930) | (9,269,294) | (96,912,694) |
| Net increase (decrease) | 1,272,837 | 17,963,017 | (2,979,526) | (30,737,011) |
| Advisor Class | | | | |
| Subscriptions | 5,182,839 | 69,700,665 | 1,521,419 | 18,672,721 |
| Distributions reinvested | 16,026 | 217,629 | — | — |
| Redemptions | (4,887,806) | (68,542,788) | (80,480) | (899,818) |
| Net increase | 311,059 | 1,375,506 | 1,440,939 | 17,772,903 |
| Class B | | | | |
| Subscriptions | — | — | 7,435 | 71,954 |
| Redemptions | — | — | (155,284) | (1,635,407) |
| Net decrease | — | — | (147,849) | (1,563,453) |
| Class C | | | | |
| Subscriptions | 798,806 | 10,227,940 | 669,621 | 7,026,834 |
| Redemptions | (919,710) | (11,349,229) | (647,396) | (6,447,932) |
| Net increase (decrease) | (120,904) | (1,121,289) | 22,225 | 578,902 |
| Class I | | | | |
| Subscriptions | — | — | 3,869,395 | 36,628,202 |
| Redemptions | — | — | (24,274,504) | (259,099,630) |
| Net decrease | — | — | (20,405,109) | (222,471,428) |
| Institutional Class | | | | |
| Subscriptions | 7,368,950 | 100,703,261 | 14,602,588 | 151,153,173 |
| Distributions reinvested | 34,024 | 458,987 | — | — |
| Redemptions | (4,938,883) | (66,091,619) | (64,764,300) | (740,553,476) |
| Net increase (decrease) | 2,464,091 | 35,070,629 | (50,161,712) | (589,400,303) |
| Institutional 2 Class | | | | |
| Subscriptions | 6,934,574 | 92,870,933 | 2,419,008 | 25,924,957 |
| Distributions reinvested | 42,452 | 576,068 | — | — |
| Redemptions | (4,022,170) | (55,890,014) | (3,978,331) | (43,538,318) |
| Net increase (decrease) | 2,954,856 | 37,556,987 | (1,559,323) | (17,613,361) |
| Institutional 3 Class | | | | |
| Subscriptions | 7,735,597 | 107,784,636 | 58,448,526 | 687,607,797 |
| Distributions reinvested | 104,027 | 1,417,884 | — | — |
| Redemptions | (9,957,728) | (136,688,116) | (4,308,072) | (49,918,845) |
| Net increase (decrease) | (2,118,104) | (27,485,596) | 54,140,454 | 637,688,952 |
| Class K | | | | |
| Distributions reinvested | 20 | 256 | — | — |
| Redemptions | (7,495) | (107,872) | (384) | (3,772) |
| Net decrease | (7,475) | (107,616) | (384) | (3,772) |
| Class R | | | | |
| Subscriptions | 344,871 | 4,595,479 | 455,142 | 4,770,503 |
| Redemptions | (500,192) | (6,547,665) | (457,479) | (4,715,585) |
| Net increase (decrease) | (155,321) | (1,952,186) | (2,337) | 54,918 |
| Class T | | | | |
| Subscriptions | — | — | 4,686,354 | 46,837,502 |
| Distributions reinvested | 21 | 269 | — | — |
| Redemptions | (6,816) | (89,972) | (10,152,614) | (101,560,216) |
| Net decrease | (6,795) | (89,703) | (5,466,260) | (54,722,714) |
| Total net increase (decrease) | 4,594,244 | 61,209,749 | (25,118,882) | (260,416,367) |
The accompanying Notes to Financial Statements are an integral part of this statement.
Columbia Emerging Markets Fund | Annual Report 2018
| 17 |
The following table is intended to help you understand the Fund’s financial performance. Certain information reflects financial results for a single share of a class held for the periods shown. Per share net investment income (loss) amounts are calculated based on average shares outstanding during the period. Total return assumes reinvestment of all dividends and distributions, if any. Total return does not reflect payment of sales charges, if any. Total return and portfolio turnover are not annualized for periods of less than one year. The portfolio turnover rate is calculated without regard to purchase and sales transactions of short-term instruments and certain derivatives, if any. If such transactions were included, the Fund’s portfolio turnover rate may be higher.
| | Net asset value,
beginning of
period | Net
investment
income
(loss) | Net
realized
and
unrealized
gain (loss) | Total from
investment
operations | Distributions
from net
investment
income | Total
distributions to
shareholders |
| Class A |
| Year Ended 8/31/2018 | $12.62 | 0.02 | (0.47) | (0.45) | (0.02) | (0.02) |
| Year Ended 8/31/2017 | $9.99 | 0.01 | 2.62 | 2.63 | — | — |
| Year Ended 8/31/2016 | $8.79 | (0.01) | 1.21 | 1.20 | — | — |
| Year Ended 8/31/2015 | $10.94 | (0.01) | (2.14) | (2.15) | (0.00) (e) | (0.00) (e) |
| Year Ended 8/31/2014 | $9.13 | (0.01) | 1.84 | 1.83 | (0.02) | (0.02) |
| Advisor Class |
| Year Ended 8/31/2018 | $12.84 | 0.02 | (0.43) | (0.41) | (0.05) | (0.05) |
| Year Ended 8/31/2017 | $10.14 | 0.07 | 2.63 | 2.70 | — | — |
| Year Ended 8/31/2016 | $8.90 | 0.01 | 1.23 | 1.24 | — | — |
| Year Ended 8/31/2015 | $11.08 | 0.09 | (2.24) | (2.15) | (0.03) | (0.03) |
| Year Ended 8/31/2014 | $9.24 | 0.04 | 1.84 | 1.88 | (0.04) | (0.04) |
| Class C |
| Year Ended 8/31/2018 | $11.96 | (0.08) | (0.43) | (0.51) | — | — |
| Year Ended 8/31/2017 | $9.54 | (0.06) | 2.48 | 2.42 | — | — |
| Year Ended 8/31/2016 | $8.45 | (0.08) | 1.17 | 1.09 | — | — |
| Year Ended 8/31/2015 | $10.60 | (0.08) | (2.07) | (2.15) | — | — |
| Year Ended 8/31/2014 | $8.90 | (0.08) | 1.78 | 1.70 | — | — |
| Institutional Class |
| Year Ended 8/31/2018 | $12.76 | 0.05 | (0.47) | (0.42) | (0.05) | (0.05) |
| Year Ended 8/31/2017 | $10.07 | 0.04 | 2.65 | 2.69 | — | — |
| Year Ended 8/31/2016 | $8.84 | 0.01 | 1.22 | 1.23 | — | — |
| Year Ended 8/31/2015 | $11.00 | 0.02 | (2.15) | (2.13) | (0.03) | (0.03) |
| Year Ended 8/31/2014 | $9.18 | 0.03 | 1.83 | 1.86 | (0.04) | (0.04) |
| Institutional 2 Class |
| Year Ended 8/31/2018 | $12.84 | 0.08 | (0.49) | (0.41) | (0.06) | (0.06) |
| Year Ended 8/31/2017 | $10.12 | 0.06 | 2.66 | 2.72 | — | — |
| Year Ended 8/31/2016 | $8.87 | 0.05 | 1.20 | 1.25 | — | — |
| Year Ended 8/31/2015 | $11.05 | 0.11 | (2.24) | (2.13) | (0.05) | (0.05) |
| Year Ended 8/31/2014 | $9.22 | 0.05 | 1.84 | 1.89 | (0.06) | (0.06) |
The accompanying Notes to Financial Statements are an integral part of this statement.
| 18 | Columbia Emerging Markets Fund | Annual Report 2018 |
Financial Highlights (continued)
| | Net
asset
value,
end of
period | Total
return | Total gross
expense
ratio to
average
net assets(a) | Total net
expense
ratio to
average
net assets(a),(b) | Net investment
income (loss)
ratio to
average
net assets | Portfolio
turnover | Net
assets,
end of
period
(000’s) |
| Class A |
| Year Ended 8/31/2018 | $12.15 | (3.58%) | 1.54% | 1.54% (c) | 0.12% | 39% | $276,209 |
| Year Ended 8/31/2017 | $12.62 | 26.33% | 1.65% (d) | 1.62% (c),(d) | 0.14% | 51% | $270,816 |
| Year Ended 8/31/2016 | $9.99 | 13.65% | 1.67% (d) | 1.67% (c),(d) | (0.16%) | 81% | $244,190 |
| Year Ended 8/31/2015 | $8.79 | (19.65%) | 1.62% (d) | 1.62% (c),(d) | (0.07%) | 76% | $238,932 |
| Year Ended 8/31/2014 | $10.94 | 20.01% | 1.67% (d) | 1.67% (c),(d) | (0.07%) | 80% | $314,231 |
| Advisor Class |
| Year Ended 8/31/2018 | $12.38 | (3.26%) | 1.29% | 1.29% (c) | 0.14% | 39% | $24,379 |
| Year Ended 8/31/2017 | $12.84 | 26.63% | 1.41% (d) | 1.37% (c),(d) | 0.68% | 51% | $21,298 |
| Year Ended 8/31/2016 | $10.14 | 13.93% | 1.42% (d) | 1.42% (c),(d) | 0.13% | 81% | $2,205 |
| Year Ended 8/31/2015 | $8.90 | (19.45%) | 1.39% (d) | 1.39% (c),(d) | 0.91% | 76% | $1,827 |
| Year Ended 8/31/2014 | $11.08 | 20.36% | 1.41% (d) | 1.41% (c),(d) | 0.35% | 80% | $301 |
| Class C |
| Year Ended 8/31/2018 | $11.45 | (4.26%) | 2.29% | 2.29% (c) | (0.62%) | 39% | $22,177 |
| Year Ended 8/31/2017 | $11.96 | 25.37% | 2.40% (d) | 2.37% (c),(d) | (0.57%) | 51% | $24,616 |
| Year Ended 8/31/2016 | $9.54 | 12.90% | 2.42% (d) | 2.42% (c),(d) | (0.92%) | 81% | $19,419 |
| Year Ended 8/31/2015 | $8.45 | (20.28%) | 2.37% (d) | 2.37% (c),(d) | (0.83%) | 76% | $20,462 |
| Year Ended 8/31/2014 | $10.60 | 19.10% | 2.42% (d) | 2.42% (c),(d) | (0.81%) | 80% | $27,126 |
| Institutional Class |
| Year Ended 8/31/2018 | $12.29 | (3.35%) | 1.29% | 1.29% (c) | 0.40% | 39% | $203,193 |
| Year Ended 8/31/2017 | $12.76 | 26.71% | 1.40% (d) | 1.37% (c),(d) | 0.39% | 51% | $179,501 |
| Year Ended 8/31/2016 | $10.07 | 13.91% | 1.42% (d) | 1.42% (c),(d) | 0.07% | 81% | $647,011 |
| Year Ended 8/31/2015 | $8.84 | (19.41%) | 1.37% (d) | 1.37% (c),(d) | 0.18% | 76% | $760,839 |
| Year Ended 8/31/2014 | $11.00 | 20.28% | 1.41% (d) | 1.41% (c),(d) | 0.25% | 80% | $1,060,340 |
| Institutional 2 Class |
| Year Ended 8/31/2018 | $12.37 | (3.22%) | 1.16% | 1.16% | 0.58% | 39% | $155,442 |
| Year Ended 8/31/2017 | $12.84 | 26.88% | 1.22% (d) | 1.22% (d) | 0.57% | 51% | $123,364 |
| Year Ended 8/31/2016 | $10.12 | 14.09% | 1.26% (d) | 1.26% (d) | 0.54% | 81% | $113,041 |
| Year Ended 8/31/2015 | $8.87 | (19.35%) | 1.21% (d) | 1.21% (d) | 1.08% | 76% | $17,559 |
| Year Ended 8/31/2014 | $11.05 | 20.58% | 1.22% (d) | 1.22% (d) | 0.46% | 80% | $3,087 |
The accompanying Notes to Financial Statements are an integral part of this statement.
Columbia Emerging Markets Fund | Annual Report 2018
| 19 |
Financial Highlights (continued)
| | Net asset value,
beginning of
period | Net
investment
income
(loss) | Net
realized
and
unrealized
gain (loss) | Total from
investment
operations | Distributions
from net
investment
income | Total
distributions to
shareholders |
| Institutional 3 Class |
| Year Ended 8/31/2018 | $12.90 | 0.07 | (0.47) | (0.40) | (0.07) | (0.07) |
| Year Ended 8/31/2017 | $10.17 | 0.10 | 2.63 | 2.73 | — | — |
| Year Ended 8/31/2016 | $8.90 | 0.05 | 1.22 | 1.27 | — | — |
| Year Ended 8/31/2015 | $11.09 | 0.05 | (2.19) | (2.14) | (0.05) | (0.05) |
| Year Ended 8/31/2014 | $9.24 | 0.06 | 1.85 | 1.91 | (0.06) | (0.06) |
| Class R |
| Year Ended 8/31/2018 | $12.47 | (0.02) | (0.46) | (0.48) | — | — |
| Year Ended 8/31/2017 | $9.89 | (0.01) | 2.59 | 2.58 | — | — |
| Year Ended 8/31/2016 | $8.72 | (0.03) | 1.20 | 1.17 | — | — |
| Year Ended 8/31/2015 | $10.89 | (0.03) | (2.14) | (2.17) | — | — |
| Year Ended 8/31/2014 | $9.09 | (0.03) | 1.83 | 1.80 | — | — |
| Class T |
| Year Ended 8/31/2018 | $12.61 | 0.00 (e) | (0.44) | (0.44) | (0.02) | (0.02) |
| Year Ended 8/31/2017 | $9.99 | (0.05) | 2.67 | 2.62 | — | — |
| Year Ended 8/31/2016 | $8.78 | (0.02) | 1.23 | 1.21 | — | — |
| Year Ended 8/31/2015 | $10.94 | (0.02) | (2.14) | (2.16) | (0.00) (e) | (0.00) (e) |
| Year Ended 8/31/2014 | $9.13 | (0.07) | 1.89 | 1.82 | (0.01) | (0.01) |
| Notes to Financial Highlights |
| (a) | In addition to the fees and expenses that the Fund bears directly, the Fund indirectly bears a pro rata share of the fees and expenses of any other funds in which it invests. Such indirect expenses are not included in the Fund’s reported expense ratios. |
| (b) | Total net expenses include the impact of certain fee waivers/expense reimbursements made by the Investment Manager and certain of its affiliates, if applicable. |
| (c) | The benefits derived from expense reductions had an impact of less than 0.01%. |
| (d) | Ratios include line of credit interest expense which is less than 0.01%. |
| (e) | Rounds to zero. |
The accompanying Notes to Financial Statements are an integral part of this statement.
| 20 | Columbia Emerging Markets Fund | Annual Report 2018 |
Financial Highlights (continued)
| | Net
asset
value,
end of
period | Total
return | Total gross
expense
ratio to
average
net assets(a) | Total net
expense
ratio to
average
net assets(a),(b) | Net investment
income (loss)
ratio to
average
net assets | Portfolio
turnover | Net
assets,
end of
period
(000’s) |
| Institutional 3 Class |
| Year Ended 8/31/2018 | $12.43 | (3.18%) | 1.10% | 1.10% | 0.54% | 39% | $673,688 |
| Year Ended 8/31/2017 | $12.90 | 26.84% | 1.19% (d) | 1.19% (d) | 0.86% | 51% | $726,291 |
| Year Ended 8/31/2016 | $10.17 | 14.27% | 1.20% (d) | 1.20% (d) | 0.58% | 81% | $22,104 |
| Year Ended 8/31/2015 | $8.90 | (19.34%) | 1.15% (d) | 1.15% (d) | 0.46% | 76% | $5,351 |
| Year Ended 8/31/2014 | $11.09 | 20.73% | 1.19% (d) | 1.19% (d) | 0.56% | 80% | $4,148 |
| Class R |
| Year Ended 8/31/2018 | $11.99 | (3.85%) | 1.79% | 1.79% (c) | (0.17%) | 39% | $9,847 |
| Year Ended 8/31/2017 | $12.47 | 26.09% | 1.90% (d) | 1.87% (c),(d) | (0.08%) | 51% | $12,175 |
| Year Ended 8/31/2016 | $9.89 | 13.42% | 1.92% (d) | 1.92% (c),(d) | (0.37%) | 81% | $9,683 |
| Year Ended 8/31/2015 | $8.72 | (19.93%) | 1.87% (d) | 1.87% (c),(d) | (0.30%) | 76% | $6,997 |
| Year Ended 8/31/2014 | $10.89 | 19.80% | 1.91% (d) | 1.91% (c),(d) | (0.26%) | 80% | $8,237 |
| Class T |
| Year Ended 8/31/2018 | $12.15 | (3.52%) | 1.54% | 1.54% (c) | 0.02% | 39% | $146 |
| Year Ended 8/31/2017 | $12.61 | 26.23% | 1.65% (d) | 1.63% (c),(d) | (0.50%) | 51% | $237 |
| Year Ended 8/31/2016 | $9.99 | 13.78% | 1.67% (d) | 1.67% (c),(d) | (0.24%) | 81% | $54,785 |
| Year Ended 8/31/2015 | $8.78 | (19.74%) | 1.62% (d) | 1.62% (c),(d) | (0.15%) | 76% | $57 |
| Year Ended 8/31/2014 | $10.94 | 19.98% | 1.67% (d) | 1.67% (c),(d) | (0.68%) | 80% | $133 |
The accompanying Notes to Financial Statements are an integral part of this statement.
Columbia Emerging Markets Fund | Annual Report 2018
| 21 |
Notes to Financial Statements
August 31, 2018
Note 1. Organization
Columbia Emerging Markets Fund (the Fund), a series of Columbia Funds Series Trust I (the Trust), is a diversified fund. The Trust is registered under the Investment Company Act of 1940, as amended (the 1940 Act), as an open-end management investment company organized as a Massachusetts business trust.
Fund shares
The Trust may issue an unlimited number of shares (without par value). Although all share classes generally have identical voting, dividend and liquidation rights, each share class votes separately when required by the Trust’s organizational documents or by law. Different share classes pay different distribution amounts to the extent the expenses of such share classes differ, and distributions in liquidation will be proportional to the net asset value of each share class. Each share class has its own expense and sales charge structure. The Fund offers each of the share classes identified below.
Class A shares are subject to a maximum front-end sales charge of 5.75% based on the initial investment amount. Class A shares purchased without an initial sales charge in accounts aggregating $1 million to $50 million at the time of purchase are subject to a contingent deferred sales charge (CDSC) if the shares are sold within 18 months after purchase, charged as follows: 1.00% CDSC if redeemed within 12 months after purchase, and 0.50% CDSC if redeemed more than 12, but less than 18, months after purchase.
Advisor Class shares are not subject to sales charges and are generally available only to omnibus retirement plans and certain investors as described in the Fund’s prospectus. Prior to November 1, 2017, Advisor Class shares were known as Class R4 shares.
Class C shares are subject to a 1.00% CDSC on shares redeemed within 12 months after purchase. Effective July 1, 2018, Class C shares will automatically convert to Class A shares of the same Fund in the month of or the month following the 10-year anniversary of the Class C shares purchase date.
Institutional Class shares are not subject to sales charges and are generally available only to eligible investors, which are subject to different investment minimums as described in the Fund’s prospectus. Prior to November 1, 2017, Institutional Class shares were known as Class Z shares.
Institutional 2 Class shares are not subject to sales charges and are generally available only to investors purchasing through authorized investment professionals and omnibus retirement plans as described in the Fund’s prospectus. Prior to November 1, 2017, Institutional 2 Class shares were known as Class R5 shares.
Institutional 3 Class shares are not subject to sales charges and are available to institutional and certain other investors as described in the Fund’s prospectus. Prior to November 1, 2017, Institutional 3 Class shares were known as Class Y shares.
The Fund no longer accepts investments by existing investors in Class K shares. When available, Class K shares were not subject to sales charges and were made available only to existing investors in Class K shares. On March 9, 2018, Class K shares were redeemed or exchanged for Advisor Class shares of the Fund in a tax free transaction that had no impact on fees and expenses paid by the shareholders.
Class R shares are not subject to sales charges and are generally available only to certain retirement plans and other investors as described in the Fund’s prospectus.
Class T shares are subject to a maximum front-end sales charge of 2.50% per transaction and must be purchased through financial intermediaries that, by written agreement with Columbia Management Investment Distributors, Inc., are specifically authorized to sell Class T shares.
| 22 | Columbia Emerging Markets Fund | Annual Report 2018 |
Notes to Financial Statements (continued)
August 31, 2018
Note 2. Summary of significant accounting policies
Basis of preparation
The Fund is an investment company that applies the accounting and reporting guidance in the Financial Accounting Standards Board (FASB) Accounting Standards Codification Topic 946, Financial Services - Investment Companies (ASC 946). The financial statements are prepared in accordance with U.S. generally accepted accounting principles (GAAP), which requires management to make certain estimates and assumptions that affect the reported amounts of assets and liabilities, the disclosure of contingent assets and liabilities at the date of the financial statements and the reported amounts of income and expenses during the reporting period. Actual results could differ from those estimates.
The following is a summary of significant accounting policies followed by the Fund in the preparation of its financial statements.
Security valuation
All equity securities are valued at the close of business of the New York Stock Exchange. Equity securities are valued at the last quoted sales price on the principal exchange or market on which they trade, except for securities traded on the NASDAQ Stock Market, which are valued at the NASDAQ official close price. Unlisted securities or listed securities for which there were no sales during the day are valued at the mean of the latest quoted bid and ask prices on such exchanges or markets.
Foreign equity securities are valued based on the closing price on the foreign exchange in which such securities are primarily traded. If any foreign equity security closing prices are not readily available, the securities are valued at the mean of the latest quoted bid and ask prices on such exchanges or markets. Foreign currency exchange rates are generally determined at 4:00 p.m. Eastern (U.S.) time. Many securities markets and exchanges outside the U.S. close prior to the close of the New York Stock Exchange; therefore, the closing prices for securities in such markets or on such exchanges may not fully reflect events that occur after such close but before the close of the New York Stock Exchange. In those situations, foreign securities will be fair valued pursuant to a policy adopted by the Board of Trustees, including, if available, utilizing a third party pricing service to determine these fair values. The third party pricing service takes into account multiple factors, including, but not limited to, movements in the U.S. securities markets, certain depositary receipts, futures contracts and foreign exchange rates that have occurred subsequent to the close of the foreign exchange or market, to determine a good faith estimate that reasonably reflects the current market conditions as of the close of the New York Stock Exchange. The fair value of a security is likely to be different from the quoted or published price, if available.
Investments in open-end investment companies, including money market funds, are valued at their latest net asset value.
Investments for which market quotations are not readily available, or that have quotations which management believes are not reflective of market value or reliable, are valued at fair value as determined in good faith under procedures approved by and under the general supervision of the Board of Trustees. If a security or class of securities (such as foreign securities) is valued at fair value, such value is likely to be different from the quoted or published price for the security.
The determination of fair value often requires significant judgment. To determine fair value, management may use assumptions including but not limited to future cash flows and estimated risk premiums. Multiple inputs from various sources may be used to determine fair value.
GAAP requires disclosure regarding the inputs and valuation techniques used to measure fair value and any changes in valuation inputs or techniques. In addition, investments shall be disclosed by major category. This information is disclosed following the Fund’s Portfolio of Investments.
Foreign currency transactions and translations
The values of all assets and liabilities denominated in foreign currencies are generally translated into U.S. dollars at exchange rates determined at the close of regular trading on the New York Stock Exchange. Net realized and unrealized gains (losses) on foreign currency transactions and translations include gains (losses) arising from the fluctuation in exchange
Columbia Emerging Markets Fund | Annual Report 2018
| 23 |
Notes to Financial Statements (continued)
August 31, 2018
rates between trade and settlement dates on securities transactions, gains (losses) arising from the disposition of foreign currency and currency gains (losses) between the accrual and payment dates on dividends, interest income and foreign withholding taxes.
For financial statement purposes, the Fund does not distinguish that portion of gains (losses) on investments which is due to changes in foreign exchange rates from that which is due to changes in market prices of the investments. Such fluctuations are included with the net realized and unrealized gains (losses) on investments in the Statement of Operations.
Security transactions
Security transactions are accounted for on the trade date. Cost is determined and gains (losses) are based upon the specific identification method for both financial statement and federal income tax purposes.
Income recognition
Corporate actions and dividend income are generally recorded net of any non-reclaimable tax withholdings, on the ex-dividend date or upon receipt of ex-dividend notification in the case of certain foreign securities.
The Fund may receive distributions from holdings in equity securities, business development companies (BDCs), exchange-traded funds (ETFs), limited partnerships (LPs), other regulated investment companies (RICs), and real estate investment trusts (REITs), which report information on the tax character of their distributions annually. These distributions are allocated to dividend income, capital gain and return of capital based on actual information reported. Return of capital is recorded as a reduction of the cost basis of securities held. If the Fund no longer owns the applicable securities, return of capital is recorded as a realized gain. With respect to REITs, to the extent actual information has not yet been reported, estimates for return of capital are made by the Fund’s management. Management’s estimates are subsequently adjusted when the actual character of the distributions is disclosed by the REITs, which could result in a proportionate change in return of capital to shareholders.
Awards from class action litigation are recorded as a reduction of cost basis if the Fund still owns the applicable securities on the payment date. If the Fund no longer owns the applicable securities, the proceeds are recorded as realized gains.
Expenses
General expenses of the Trust are allocated to the Fund and other funds of the Trust based upon relative net assets or other expense allocation methodologies determined by the nature of the expense. Expenses directly attributable to the Fund are charged to the Fund. Expenses directly attributable to a specific class of shares are charged to that share class.
Determination of class net asset value
All income, expenses (other than class-specific expenses, which are charged to that share class, as shown in the Statement of Operations) and realized and unrealized gains (losses) are allocated to each class of the Fund on a daily basis, based on the relative net assets of each class, for purposes of determining the net asset value of each class.
Federal income tax status
The Fund intends to qualify each year as a regulated investment company under Subchapter M of the Internal Revenue Code, as amended, and will distribute substantially all of its investment company taxable income and net capital gain, if any, for its tax year, and as such will not be subject to federal income taxes. In addition, the Fund intends to distribute in each calendar year substantially all of its ordinary income, capital gain net income and certain other amounts, if any, such that the Fund should not be subject to federal excise tax. Therefore, no federal income or excise tax provision is recorded.
Foreign taxes
The Fund may be subject to foreign taxes on income, gains on investments or currency repatriation, a portion of which may be recoverable. The Fund will accrue such taxes and recoveries, as applicable, based upon its current interpretation of tax rules and regulations that exist in the markets in which it invests.
| 24 | Columbia Emerging Markets Fund | Annual Report 2018 |
Notes to Financial Statements (continued)
August 31, 2018
Realized gains in certain countries may be subject to foreign taxes at the Fund level, based on statutory rates. The Fund accrues for such foreign taxes on realized and unrealized gains at the appropriate rate for each jurisdiction, as applicable. The amount, if any, is disclosed as a liability on the Statement of Assets and Liabilities.
Distributions to shareholders
Distributions from net investment income, if any, are declared and paid annually. Net realized capital gains, if any, are distributed at least annually. Income distributions and capital gain distributions are determined in accordance with federal income tax regulations, which may differ from GAAP.
Guarantees and indemnifications
Under the Trust’s organizational documents and, in some cases, by contract, its officers and trustees are indemnified against certain liabilities arising out of the performance of their duties to the Trust or its funds. In addition, certain of the Fund’s contracts with its service providers contain general indemnification clauses. The Fund’s maximum exposure under these arrangements is unknown since the amount of any future claims that may be made against the Fund cannot be determined, and the Fund has no historical basis for predicting the likelihood of any such claims.
Recent accounting pronouncement
Accounting Standards Update 2017-08 Premium Amortization on Purchased Callable Debt Securities
In March 2017, the Financial Accounting Standards Board issued Accounting Standards Update (ASU) No. 2017-08 Premium Amortization on Purchased Callable Debt Securities. ASU No. 2017-08 updates the accounting standards to shorten the amortization period for certain purchased callable debt securities, held at a premium, to be amortized to the earliest call date. The update applies to securities with explicit, noncontingent call features that are callable at fixed prices and on preset dates. The standard is effective for annual periods beginning after December 15, 2018 and interim periods within those fiscal years. At this time, management is evaluating the implication of this guidance and the impact it will have on the financial statement amounts and footnote disclosures, if any.
Note 3. Fees and other transactions with affiliates
Management services fees
The Fund has entered into a Management Agreement with Columbia Management Investment Advisers, LLC (the Investment Manager), a wholly-owned subsidiary of Ameriprise Financial, Inc. (Ameriprise Financial). Under the Management Agreement, the Investment Manager provides the Fund with investment research and advice, as well as administrative and accounting services. The management services fee is an annual fee that is equal to a percentage of the Fund’s daily net assets that declines from 1.10% to 0.70% as the Fund’s net assets increase. The effective management services fee rate for the year ended August 31, 2018 was 1.01% of the Fund’s average daily net assets.
Compensation of board members
Members of the Board of Trustees who are not officers or employees of the Investment Manager or Ameriprise Financial are compensated for their services to the Fund as disclosed in the Statement of Operations. These members of the Board of Trustees may participate in a Deferred Compensation Plan (the Plan) which may be terminated at any time. Obligations of the Plan will be paid solely out of the Fund’s assets, and all amounts payable under the Plan constitute a general unsecured obligation of the Fund.
Compensation of Chief Compliance Officer
The Board of Trustees has appointed a Chief Compliance Officer to the Fund in accordance with federal securities regulations. As disclosed in the Statement of Operations, a portion of the Chief Compliance Officer’s total compensation is allocated to the Fund, along with other allocations to affiliated funds governed by the Board of Trustees, based on relative net assets.
Columbia Emerging Markets Fund | Annual Report 2018
| 25 |
Notes to Financial Statements (continued)
August 31, 2018
Transfer agency fees
Under a Transfer and Dividend Disbursing Agent Agreement, Columbia Management Investment Services Corp. (the Transfer Agent), an affiliate of the Investment Manager and a wholly-owned subsidiary of Ameriprise Financial, is responsible for providing transfer agency services to the Fund. The Transfer Agent has contracted with DST Asset Manager Solutions, Inc. (DST) to serve as sub-transfer agent. The Transfer Agent pays the fees of DST for services as sub-transfer agent and DST is not entitled to reimbursement for such fees from the Fund (with the exception of out-of-pocket fees).
The Fund pays the Transfer Agent a monthly transfer agency fee based on the number or the average value of accounts, depending on the type of account. In addition, the Fund pays the Transfer Agent a fee for shareholder services based on the number of accounts or on a percentage of the average aggregate value of the Fund’s shares maintained in omnibus accounts up to the lesser of the amount charged by the financial intermediary or a cap established by the Board of Trustees from time to time.
The Transfer Agent also receives compensation from the Fund for various shareholder services and reimbursements for certain out-of-pocket fees. Total transfer agency fees for Class K, Institutional 2 Class and Institutional 3 Class shares are subject to an annual limitation of not more than 0.07%, 0.07% and 0.02%, respectively, of the average daily net assets attributable to each share class. Prior to January 1, 2018, Institutional 3 Class shares were subject to a contractual transfer agency fee annual limitation of not more than 0.00% and Class K and Institutional 2 shares were subject to a contractual transfer agency fee annual limitation of not more than 0.05% of the average daily net assets attributable to each share class.
For the year ended August 31, 2018, the Fund’s effective transfer agency fee rates as a percentage of average daily net assets of each class were as follows:
| | Effective rate (%) |
| Class A | 0.19 |
| Advisor Class | 0.20 |
| Class C | 0.19 |
| Institutional Class | 0.20 |
| Institutional 2 Class | 0.06 |
| Institutional 3 Class | 0.00 |
| Class K | 0.03 (a) |
| Class R | 0.19 |
| Class T | 0.19 |
The Fund and certain other associated investment companies have severally, but not jointly, guaranteed the performance and observance of all the terms and conditions of a lease entered into by Seligman Data Corp. (SDC), the former transfer agent, including the payment of rent by SDC (the Guaranty). SDC was the legacy Seligman funds’ former transfer agent.
The lease and the Guaranty expire in January 2019. At August 31, 2018, the Fund’s total potential future obligation over the life of the Guaranty is $8,219. The liability remaining at August 31, 2018 for non-recurring charges associated with the lease amounted to $823 and is recorded as a part of the payable for other expenses in the Statement of Assets and Liabilities.
An annual minimum account balance fee of $20 may apply to certain accounts with a value below the applicable share class’s initial minimum investment requirements to reduce the impact of small accounts on transfer agency fees. These minimum account balance fees are remitted to the Fund and recorded as part of expense reductions in the Statement of Operations. For the year ended August 31, 2018, these minimum account balance fees reduced total expenses of the Fund by $1,480.
Plan administration fees
Under a Plan Administration Services Agreement with the Transfer Agent, the Fund paid an annual fee at a rate of 0.25% of the Fund’s average daily net assets attributable to Class K shares for the provision of various administrative, recordkeeping, communication and educational services. As a result of all Class K shares of the Fund being redeemed or exchanged for Advisor Class shares, March 9, 2018 was the last day the Fund paid a plan administration fee for Class K shares.
| 26 | Columbia Emerging Markets Fund | Annual Report 2018 |
Notes to Financial Statements (continued)
August 31, 2018
Distribution and service fees
The Fund has entered into an agreement with Columbia Management Investment Distributors, Inc. (the Distributor), an affiliate of the Investment Manager and a wholly-owned subsidiary of Ameriprise Financial, for distribution and shareholder services. The Board of Trustees has approved, and the Fund has adopted, distribution and shareholder service plans (the Plans) applicable to certain share classes, which set the distribution and service fees for the Fund. These fees are calculated daily and are intended to compensate the Distributor and/or eligible selling and/or servicing agents for selling shares of the Fund and providing services to investors.
Under the Plans, the Fund pays a monthly service fee to the Distributor at the maximum annual rate of 0.25% of the average daily net assets attributable to Class A, Class C and Class T shares of the Fund. Also under the Plans, the Fund pays a monthly distribution fee to the Distributor at the maximum annual rates of 0.75%, 0.50% and 0.25% of the average daily net assets attributable to Class C, Class R and Class T shares of the Fund, respectively.
Although the Fund may pay a distribution fee up to 0.25% of the Fund’s average daily net assets attributable to Class T shares and a service fee of up to 0.25% of the Fund’s average daily net assets attributable to Class T shares, the aggregate fee shall not exceed 0.25% of the Fund’s average daily net assets attributable to Class T shares.
Sales charges (unaudited)
Sales charges, including front-end charges and CDSCs, received by the Distributor for distributing Fund shares for the year ended August 31, 2018, if any, are listed below:
| | Amount ($) |
| Class A | 516,045 |
| Class C | 2,233 |
Expenses waived/reimbursed by the Investment Manager and its affiliates
The Investment Manager and certain of its affiliates have contractually agreed to waive fees and/or reimburse expenses (excluding certain fees and expenses described below) for the period(s) disclosed below, unless sooner terminated at the sole discretion of the Board of Trustees, so that the Fund’s net operating expenses, after giving effect to fees waived/expenses reimbursed and any balance credits and/or overdraft charges from the Fund’s custodian, do not exceed the following annual rate(s) as a percentage of the class’ average daily net assets:
| | January 1, 2018
through
December 31, 2018 | Prior to
January 1, 2018 |
| Class A | 1.65% | 1.61% |
| Advisor Class | 1.40 | 1.36 |
| Class C | 2.40 | 2.36 |
| Institutional Class | 1.40 | 1.36 |
| Institutional 2 Class | 1.27 | 1.265 |
| Institutional 3 Class | 1.22 | 1.215 |
| Class R | 1.90 | 1.86 |
| Class T | 1.65 | 1.61 |
Under the agreement governing these fee waivers and/or expense reimbursement arrangements, the following fees and expenses are excluded from the waiver/reimbursement commitment, and therefore will be paid by the Fund, if applicable: taxes (including foreign transaction taxes), expenses associated with investments in affiliated and non-affiliated pooled investment vehicles (including mutual funds and exchange-traded funds), transaction costs and brokerage commissions, costs related to any securities lending program, dividend expenses associated with securities sold short, inverse floater program fees and expenses, transaction charges and interest on borrowed money, interest, infrequent and/or unusual expenses and any other expenses the exclusion of which is specifically approved by the Board of Trustees. This agreement may be modified or amended only with approval from the Investment Manager, certain of its affiliates and the Fund. Reflected in the contractual cap commitment, prior to January 1, 2018, is the Transfer Agent’s contractual agreement
Columbia Emerging Markets Fund | Annual Report 2018
| 27 |
Notes to Financial Statements (continued)
August 31, 2018
to limit total transfer agency fees to an annual rate of not more than 0.00% for Institutional 3 Class and 0.05% for Institutional 2 Class of the average daily net assets attributable to each share class, unless sooner terminated at the sole discretion of the Board of Trustees. Any fees waived and/or expenses reimbursed under the expense reimbursement arrangements described above are not recoverable by the Investment Manager or its affiliates in future periods.
Note 4. Federal tax information
The timing and character of income and capital gain distributions are determined in accordance with income tax regulations, which may differ from GAAP because of temporary or permanent book to tax differences.
At August 31, 2018, these differences were primarily due to differing treatment for deferral/reversal of wash sale losses, capital loss carryforwards, trustees’ deferred compensation, foreign currency transactions and foreign capital gains tax. To the extent these differences were permanent, reclassifications were made among the components of the Fund’s net assets in the Statement of Assets and Liabilities. Temporary differences do not require reclassifications.
In the Statement of Assets and Liabilities the following reclassifications were made:
Undistributed net
investment
income ($) | Accumulated
net realized
(loss) ($) | Paid in
capital ($) |
| (649,694) | 649,693 | 1 |
Net investment income (loss) and net realized gains (losses), as disclosed in the Statement of Operations, and net assets were not affected by this reclassification.
The tax character of distributions paid during the years indicated was as follows:
| Year Ended August 31, 2018 | Year Ended August 31, 2017 |
Ordinary
income ($) | Long-term
capital gains ($) | Total ($) | Ordinary
income ($) | Long-term
capital gains ($) | Total ($) |
| 5,496,183 | — | 5,496,183 | — | — | — |
Short-term capital gain distributions, if any, are considered ordinary income distributions for tax purposes.
At August 31, 2018, the components of distributable earnings on a tax basis were as follows:
Undistributed
ordinary income ($) | Undistributed
long-term
capital gains ($) | Capital loss
carryforwards ($) | Net unrealized
appreciation ($) |
| 2,423,070 | — | (25,646,932) | 365,258,849 |
At August 31, 2018, the cost of all investments for federal income tax purposes along with the aggregate gross unrealized appreciation and depreciation based on that cost was:
Federal
tax cost ($) | Gross unrealized
appreciation ($) | Gross unrealized
(depreciation) ($) | Net unrealized
appreciation ($) |
| 999,265,191 | 403,552,221 | (38,293,372) | 365,258,849 |
Tax cost of investments and unrealized appreciation/(depreciation) may also include timing differences that do not constitute adjustments to tax basis.
The following capital loss carryforwards, determined at August 31, 2018, may be available to reduce taxable income arising from future net realized gains on investments, if any, to the extent permitted by the Internal Revenue Code. Capital loss carryforwards with no expiration are required to be utilized prior to any capital losses which carry an expiration date. As a
| 28 | Columbia Emerging Markets Fund | Annual Report 2018 |
Notes to Financial Statements (continued)
August 31, 2018
result of this ordering rule, capital loss carryforwards which carry an expiration date may be more likely to expire unused. In addition, for the year ended August 31, 2018, capital loss carryforwards utilized, expired unused and permanently lost, if any, were as follows:
| 2019 ($) | No expiration
short-term ($) | No expiration
long-term ($) | Total ($) | Utilized ($) | Expired ($) | Permanently
lost ($) |
| — | 25,646,932 | — | 25,646,932 | 49,134,341 | — | — |
Management of the Fund has concluded that there are no significant uncertain tax positions in the Fund that would require recognition in the financial statements. However, management’s conclusion may be subject to review and adjustment at a later date based on factors including, but not limited to, new tax laws, regulations, and administrative interpretations (including relevant court decisions). Generally, the Fund’s federal tax returns for the prior three fiscal years remain subject to examination by the Internal Revenue Service.
Note 5. Portfolio information
The cost of purchases and proceeds from sales of securities, excluding short-term investments and derivatives, if any, aggregated to $592,702,369 and $550,906,001, respectively, for the year ended August 31, 2018. The amount of purchase and sale activity impacts the portfolio turnover rate reported in the Financial Highlights.
Note 6. Affiliated money market fund
The Fund invests in Columbia Short-Term Cash Fund, an affiliated money market fund established for the exclusive use by the Fund and other affiliated funds (the Affiliated MMF). The income earned by the Fund from such investments is included as Dividends - affiliated issuers in the Statement of Operations. As an investing fund, the Fund indirectly bears its proportionate share of the expenses of the Affiliated MMF. The Affiliated MMF prices its shares with a floating net asset value. In addition, the Board of Trustees of the Affiliated MMF may impose a fee on redemptions (sometimes referred to as a liquidity fee) or temporarily suspend redemptions (sometimes referred to as imposing a redemption gate) in the event its liquidity falls below regulatory limits.
Note 7. Interfund lending
Pursuant to an exemptive order granted by the Securities and Exchange Commission, the Fund participates in a program (the Interfund Program) allowing each participating Columbia Fund (each, a Participating Fund) to lend money directly to and, except for closed-end funds and money market funds, borrow money directly from other Participating Funds for temporary purposes. The amounts eligible for borrowing and lending under the Interfund Program are subject to certain restrictions.
Interfund loans are subject to the risk that the borrowing fund could be unable to repay the loan when due, and a delay in repayment to the lending fund could result in lost opportunities and/or additional lending costs. The exemptive order is subject to conditions intended to mitigate conflicts of interest arising from the Investment Manager’s relationship with each Participating Fund.
The Fund’s activity in the Interfund Program during the year ended August 31, 2018 was as follows:
| Borrower or lender | Average loan
balance ($) | Weighted average
interest rate (%) | Days
outstanding |
| Lender | 500,000 | 2.46 | 2 |
The Fund had no outstanding interfund loans at August 31, 2018.
Note 8. Line of credit
The Fund has access to a revolving credit facility with a syndicate of banks led by Citibank, N.A., HSBC Bank USA, N.A. and JPMorgan Chase Bank, N.A. whereby the Fund may borrow for the temporary funding of shareholder redemptions or for other temporary or emergency purposes. The credit facility, which is a collective agreement between the Fund and certain other funds managed by the Investment Manager, severally and not jointly, permits collective borrowings up to $1 billion. Interest is charged to each participating fund based on its borrowings at a rate equal to the higher of (i) the overnight federal funds rate
Columbia Emerging Markets Fund | Annual Report 2018
| 29 |
Notes to Financial Statements (continued)
August 31, 2018
plus 1.00% or (ii) the one-month LIBOR rate plus 1.00%. Each borrowing under the credit facility matures no later than 60 days after the date of borrowing. The Fund also pays a commitment fee equal to its pro rata share of the amount of the credit facility at a rate of 0.15% per annum. The commitment fee is included in other expenses in the Statement of Operations. This agreement expires annually in December unless extended or renewed.
The Fund had no borrowings during the year ended August 31, 2018.
Note 9. Significant risks
Financial sector risk
The Fund may be more susceptible to the particular risks that may affect companies in the financial services sector than if it were invested in a wider variety of companies in unrelated sectors. Companies in the financial services sector are subject to certain risks, including the risk of regulatory change, decreased liquidity in credit markets and unstable interest rates. Such companies may have concentrated portfolios, such as a high level of loans to real estate developers, which makes them vulnerable to economic conditions that affect that industry. Performance of such companies may be affected by competitive pressures and exposure to investments or agreements that, under certain circumstances, may lead to losses (e.g., subprime loans). Companies in the financial services sector are subject to extensive governmental regulation that may limit the amount and types of loans and other financial commitments they can make, and interest rates and fees that they may charge. In addition, profitability of such companies is largely dependent upon the availability and the cost of capital.
Foreign securities and emerging market countries risk
Investing in foreign securities may include certain risks and considerations not typically associated with investing in U.S. securities, such as fluctuating currency values and changing local and regional economic, political and social conditions, which may result in greater market volatility. In addition, certain foreign securities may not be as liquid as U.S. securities. Investing in emerging markets may accentuate these risks. These countries are also more likely to experience high levels of inflation, deflation or currency devaluation which could hurt their economies and securities markets. To the extent that the Fund concentrates its investment exposure to any one or a few specific countries, the Fund will be particularly susceptible to the various conditions, events or other factors impacting those countries and may, therefore, have a greater risk than that of a fund which is more geographically diversified.
Shareholder concentration risk
At August 31, 2018, two unaffiliated shareholders of record owned 41.0% of the outstanding shares of the Fund in one or more accounts. The Fund has no knowledge about whether any portion of those shares was owned beneficially. Affiliated shareholders of record owned 34.0% of the outstanding shares of the Fund in one or more accounts. Subscription and redemption activity by concentrated accounts may have a significant effect on the operations of the Fund. In the case of a large redemption, the Fund may be forced to sell investments at inopportune times, including its liquid positions, which may result in Fund losses and the Fund holding a higher percentage of less liquid positions. Large redemptions could result in decreased economies of scale and increased operating expenses for non-redeeming Fund shareholders.
Technology and technology-related investment risk
The Fund may be more susceptible to the particular risks that may affect companies in the information technology sector, as well as other technology-related sectors (collectively, the technology sectors) than if it were invested in a wider variety of companies in unrelated sectors. Companies in the technology sectors are subject to certain risks, including the risk that new services, equipment or technologies will not be accepted by consumers and businesses or will become rapidly obsolete. Performance of such companies may be affected by factors including obtaining and protecting patents (or the failure to do so) and significant competitive pressures, including aggressive pricing of their products or services, new market entrants, competition for market share and short product cycles due to an accelerated rate of technological developments. Such competitive pressures may lead to limited earnings and/or falling profit margins. As a result, the value of their securities may fall or fail to rise. In addition, many technology sector companies have limited operating histories and prices of these companies’ securities historically have been more volatile than other securities, especially over the short term.
| 30 | Columbia Emerging Markets Fund | Annual Report 2018 |
Notes to Financial Statements (continued)
August 31, 2018
Note 10. Subsequent events
Management has evaluated the events and transactions that have occurred through the date the financial statements were issued and noted no items requiring adjustment of the financial statements or additional disclosure.
Note 11. Information regarding pending and settled legal proceedings
Ameriprise Financial and certain of its affiliates have historically been involved in a number of legal, arbitration and regulatory proceedings, including routine litigation, class actions, and governmental actions, concerning matters arising in connection with the conduct of their business activities. Ameriprise Financial believes that the Fund is not currently the subject of, and that neither Ameriprise Financial nor any of its affiliates are the subject of, any pending legal, arbitration or regulatory proceedings that are likely to have a material adverse effect on the Fund or the ability of Ameriprise Financial or its affiliates to perform under their contracts with the Fund. Ameriprise Financial is required to make quarterly (10-Q), annual (10-K) and, as necessary, 8-K filings with the Securities and Exchange Commission (SEC) on legal and regulatory matters that relate to Ameriprise Financial and its affiliates. Copies of these filings may be obtained by accessing the SEC website at www.sec.gov.
There can be no assurance that these matters, or the adverse publicity associated with them, will not result in increased Fund redemptions, reduced sale of Fund shares or other adverse consequences to the Fund. Further, although we believe proceedings are not likely to have a material adverse effect on the Fund or the ability of Ameriprise Financial or its affiliates to perform under their contracts with the Fund, these proceedings are subject to uncertainties and, as such, we are unable to estimate the possible loss or range of loss that may result. An adverse outcome in one or more of these proceedings could result in adverse judgments, settlements, fines, penalties or other relief that could have a material adverse effect on the consolidated financial condition or results of operations of Ameriprise Financial.
Columbia Emerging Markets Fund | Annual Report 2018
| 31 |
Report of Independent Registered Public Accounting Firm
To the Board of Trustees of Columbia Funds Series Trust I and Shareholders of Columbia Emerging Markets Fund
Opinion on the Financial Statements
We have audited the accompanying statement of assets and liabilities, including the portfolio of investments, of Columbia Emerging Markets Fund (one of the funds constituting Columbia Funds Series Trust I, hereafter referred to as the “Fund”) as of August 31, 2018, the related statement of operations for the year ended August 31, 2018, the statement of changes in net assets for each of the two years in the period ended August 31, 2018, including the related notes, and the financial highlights for each of the five years in the period ended August 31, 2018, (collectively referred to as the “financial statements”). In our opinion, the financial statements present fairly, in all material respects, the financial position of the Fund as of August 31, 2018, the results of its operations for the year then ended, the changes in its net assets for each of the two years in the period ended August 31, 2018 and the financial highlights for each of the five years in the period ended August 31, 2018 in conformity with accounting principles generally accepted in the United States of America.
Basis for Opinion
These financial statements are the responsibility of the Fund’s management. Our responsibility is to express an opinion on the Fund’s financial statements based on our audits. We are a public accounting firm registered with the Public Company Accounting Oversight Board (United States) (“PCAOB”) and are required to be independent with respect to the Fund in accordance with the U.S. federal securities laws and the applicable rules and regulations of the Securities and Exchange Commission and the PCAOB.
We conducted our audits of these financial statements in accordance with the standards of the PCAOB. Those standards require that we plan and perform the audit to obtain reasonable assurance about whether the financial statements are free of material misstatement, whether due to error or fraud.
Our audits included performing procedures to assess the risks of material misstatement of the financial statements, whether due to error or fraud, and performing procedures that respond to those risks. Such procedures included examining, on a test basis, evidence regarding the amounts and disclosures in the financial statements. Our audits also included evaluating the accounting principles used and significant estimates made by management, as well as evaluating the overall presentation of the financial statements. Our procedures included confirmation of securities owned as of August 31, 2018, by correspondence with the custodian, transfer agent and brokers; when replies were not received from brokers, we performed other audit procedures. We believe that our audits provide a reasonable basis for our opinion.
/s/PricewaterhouseCoopers LLP
Minneapolis, Minnesota
October 22, 2018
We have served as the auditor of one or more investment companies within the Columbia Funds Complex since 1977.
| 32 | Columbia Emerging Markets Fund | Annual Report 2018 |
Federal Income Tax Information
(Unaudited)
The Fund hereby designates the following tax attributes for the fiscal year ended August 31, 2018. Shareholders will be notified in early 2019 of the amounts for use in preparing 2018 income tax returns.
Qualified
dividend
income | Dividends
received
deduction | Foreign
taxes paid
to foreign
countries | Foreign
taxes paid
per share
to foreign
countries | Foreign
source
income | Foreign
source
income per
share |
| 100.00% | 0.20% | $3,201,944 | $0.03 | $26,516,716 | $0.24 |
Qualified dividend income. For taxable, non-corporate shareholders, the percentage of ordinary income distributed during the fiscal year that represents qualified dividend income subject to reduced tax rates.
Dividends received deduction. The percentage of ordinary income distributed during the fiscal year that qualifies for the corporate dividends received deduction.
Foreign taxes. The Fund makes the election to pass through to shareholders the foreign taxes paid. Eligible shareholders may claim a foreign tax credit. These taxes, and the corresponding foreign source income, are provided.
Columbia Emerging Markets Fund | Annual Report 2018
| 33 |
Shareholders elect the Board that oversees the Fund’s operations. The Board appoints officers who are responsible for day-to-day business decisions based on policies set by the Board. The following table provides basic biographical information about the Fund’s Trustees, including their principal occupations during the past five years, although specific titles for individuals may have varied over the period. The year set forth beneath Length of Service in the table below is the year in which the Trustee was first appointed or elected as Trustee to any Fund currently in the Columbia Funds Complex or a predecessor thereof. Under current Board policy, members serve terms of indefinite duration.
Independent trustees
| Name, address, year of birth | Position held with the Trust and length of service | Principal occupation(s) during the past five years and other relevant professional experience | Number of Funds in the Columbia Fund Complex overseen | Other directorships held by Trustee during the past five years |
Janet Langford Carrig
c/o Columbia Management
Investment Advisers, LLC
225 Franklin Street
Mail Drop BX32 05228
Boston, MA 02110
1957 | Trustee
1996 | Senior Vice President, General Counsel and Corporate Secretary, ConocoPhillips (independent energy company) since September 2007 | 69 | None |
Douglas A. Hacker
c/o Columbia Management
Investment Advisers, LLC
225 Franklin Street
Mail Drop BX32 05228
Boston, MA 02110
1955 | Trustee and Chairman of the Board
1996 | Independent business executive since May 2006; Executive Vice President — Strategy of United Airlines from December 2002 to May 2006; President of UAL Loyalty Services (airline marketing company) from September 2001 to December 2002; Executive Vice President and Chief Financial Officer of United Airlines from July 1999 to September 2001 | 69 | Spartan Nash Company, (food distributor); Nash Finch Company (food distributor) from 2005 to 2013; Aircastle Limited (aircraft leasing); SeaCube Container Leasing Ltd. (container leasing) from 2010 to 2013; and Travelport Worldwide Limited (travel information technology) |
Nancy T. Lukitsh
c/o Columbia Management
Investment Advisers, LLC
225 Franklin Street
Mail Drop BX32 05228
Boston, MA 02110
1956 | Trustee
2011 | Senior Vice President, Partner and Director of Marketing, Wellington Management Company, LLP (investment adviser) from 1997 to 2010; Chair, Wellington Management Portfolios (commingled non-U.S. investment pools) from 2007 to 2010; Director, Wellington Trust Company, NA and other Wellington affiliates from 1997 to 2010 | 69 | None |
David M. Moffett
c/o Columbia Management
Investment Advisers, LLC
225 Franklin Street
Mail Drop BX32 05228
Boston, MA 02110
1952 | Trustee
2011 | Retired. Consultant to Bridgewater and Associates | 69 | Director, CSX Corporation (transportation suppliers); Genworth Financial, Inc. (financial and insurance products and services); PayPal Holdings Inc. (payment and data processing services); Trustee, University of Oklahoma Foundation; former Director, eBay Inc. (online trading community), 2007-2015; and former Director, CIT Bank, CIT Group Inc. (commercial and consumer finance), 2010-2016 |
| 34 | Columbia Emerging Markets Fund | Annual Report 2018 |
TRUSTEES AND OFFICERS (continued)
Independent trustees (continued)
| Name, address, year of birth | Position held with the Trust and length of service | Principal occupation(s) during the past five years and other relevant professional experience | Number of Funds in the Columbia Fund Complex overseen | Other directorships held by Trustee during the past five years |
John J. Neuhauser
c/o Columbia Management
Investment Advisers, LLC
225 Franklin Street
Mail Drop BX32 05228
Boston, MA 02110
1943 | Trustee
1984 | President, Saint Michael’s College since August 2007; Director or Trustee of several non-profit organizations, including University of Vermont Medical Center; Academic Vice President and Dean of Faculties, Boston College from August 1999 to October 2005; University Professor, Boston College from November 2005 to August 2007 | 69 | Liberty All-Star Equity Fund and Liberty All- Star Growth Fund (closed-end funds) |
Patrick J. Simpson
c/o Columbia Management
Investment Advisers, LLC
225 Franklin Street
Mail Drop BX32 05228
Boston, MA 02110
1944 | Trustee
2000 | Of Counsel, Perkins Coie LLP (law firm) since 2015; Partner, Perkins Coie LLP from 1988 to 2014 | 69 | None |
Anne-Lee Verville
c/o Columbia Management
Investment Advisers, LLC
225 Franklin Street
Mail Drop BX32 05228
Boston, MA 02110
1945 | Trustee
1998 | Retired. General Manager, Global Education Industry from 1994 to 1997, President – Application Systems Division from 1991 to 1994, Chief Financial Officer – US Marketing & Services from 1988 to 1991, and Chief Information Officer from 1987 to 1988, IBM Corporation (computer and technology) | 69 | Enesco Group, Inc. (producer of giftware and home and garden decor products) from 2001 to 2006 |
Consultants to the Independent Trustees*
| Name, address, year of birth | Position held with the Trust and length of service | Principal occupation(s) during the past five years and other relevant professional experience | Number of Funds in the Columbia Funds complex overseen | Other directorships held by Trustee during the past five years |
J. Kevin Connaughton
c/o Columbia
Management Investment
Advisers, LLC,
225 Franklin Street
Mail Drop BX32 05228,
Boston, MA 02110
1964 | Independent Trustee Consultant
2016 | Independent Trustee Consultant, Columbia Funds since March 2016; Adjunct Professor of Finance, Bentley University since November 2017; Managing Director and General Manager of Mutual Fund Products, Columbia Management Investment Advisers, LLC from May 2010 to February 2015; President, Columbia Funds from 2009 to 2015; and senior officer of Columbia Funds and affiliated funds from 2003 to 2015 | 69 | Director, The Autism Project since March 2015; former Trustee, New Century Portfolios, March 2015-December 2017; formerly on Board of Governors, Gateway Healthcare, January 2016 – December 2017 |
Natalie A. Trunow
c/o Columbia
Management Investment
Advisers, LLC,
225 Franklin Street
Mail Drop BX32 05228,
Boston, MA 02110
1967 | Independent Trustee Consultant
2016 | Independent Trustee Consultant, Columbia Funds since September 2016; Chief Executive Officer, Millennial Portfolio Solutions LLC (asset management and consulting services) since January 2016; Director of Investments, Casey Family Programs from April 2016 to September 2016; Senior Vice President and Chief Investment Officer, Calvert Investments from August 2008 to January 2016; Section Head and Portfolio Manager, General Motors Asset Management from June 1997 to August 2008 | 69 | Director, Health Services for Children with Special Needs, Inc.; Director, Guidewell Financial Solutions |
| * | J. Kevin Connaughton was appointed consultant to the Independent Trustees effective March 1, 2016. Natalie A. Trunow was appointed consultant to the Independent Trustees effective September 1, 2016. Shareholders of the Funds are expected to be asked to elect each of Mr. Connaughton and Ms. Trunow as a Trustee at a future shareholder meeting. |
Columbia Emerging Markets Fund | Annual Report 2018
| 35 |
TRUSTEES AND OFFICERS (continued)
Interested trustee affiliated with Investment Manager*
| Name, address, year of birth | Position held with the Trust and length of service | Principal occupation(s) during the past five years and other relevant professional experience | Number of Funds in the Columbia Funds Complex overseen | Other directorships held by Trustee during the past five years |
William F. Truscott
c/o Columbia Management
Investment Advisers, LLC
225 Franklin Street
Boston, MA 02110
1960 | Trustee
2012 | Chairman of the Board and President, Columbia Management Investment Advisers, LLC since May 2010 and February 2012, respectively; Chief Executive Officer, Global Asset Management, Ameriprise Financial, Inc. since September 2012 (previously Chief Executive Officer, U.S. Asset Management & President, Annuities, May 2010-September 2012); Director and Chief Executive Officer, Columbia Management Investment Distributors, Inc. since May 2010 and February 2012, respectively; Chairman of the Board and Chief Executive Officer, RiverSource Distributors, Inc. since 2006; Director, Threadneedle Asset Management Holdings, SARL since 2014; President and Chief Executive Officer, Ameriprise Certificate Company, 2006-August 2012 | 193 | Chairman of the Board, Columbia Management Investment Advisers, LLC since May 2010; Director, Columbia Management Investment Distributors, Inc. since May 2010; former Director, Ameriprise Certificate Company, 2006 - January 2013 |
| * | Interested person (as defined under the 1940 Act) by reason of being an officer, director, security holder and/or employee of the Investment Manager or Ameriprise Financial. |
The Statement of Additional Information has additional information about the Fund’s Board members and is available, without charge, upon request by calling 800.345.6611, visiting columbiathreadneedleus.com/investor/ or contacting your financial intermediary.
| 36 | Columbia Emerging Markets Fund | Annual Report 2018 |
TRUSTEES AND OFFICERS (continued)
The Board has appointed officers who are responsible for day-to-day business decisions based on policies it has established. The officers serve at the pleasure of the Board. The following table provides basic information about the Officers of the Fund, including principal occupations during the past five years, although their specific titles may have varied over the period. In addition to Mr. Truscott, who is Senior Vice President, the Fund’s other officers are:
Fund officers
Name,
address and
year of birth | Position and year
first appointed to
position for any Fund
in the Columbia
Funds complex or a
predecessor thereof | Principal occupation(s) during past five years |
Christopher O. Petersen
5228 Ameriprise
Financial Center
Minneapolis, MN 55474
Born 1970 | President and Principal Executive Officer (2015) | Vice President and Lead Chief Counsel, Ameriprise Financial, Inc. since January 2015 (previously, Vice President and Chief Counsel, January 2010 - December 2014; officer of Columbia Funds and affiliated funds since 2007. |
Michael G. Clarke
225 Franklin Street
Boston, MA 02110
Born 1969 | Treasurer (2011), Chief Financial Officer (2009) and Chief Accounting Officer (2015) | Vice President — Mutual Fund Administration, Columbia Management Investment Advisers, LLC, since May 2010; senior officer of Columbia Funds and affiliated funds since 2002. |
Paul B. Goucher
100 Park Avenue
New York, NY 10017
Born 1968 | Senior Vice President (2011) and Assistant Secretary (2008) | Senior Vice President and Assistant General Counsel, Ameriprise Financial, Inc. since January 2017 (previously, Vice President and Lead Chief Counsel, November 2008 - January 2017 and January 2013 - January 2017, respectively); Vice President, Chief Legal Officer and Assistant Secretary, Columbia Management Investment Advisers, LLC since May 2010. |
Thomas P. McGuire
225 Franklin Street
Boston, MA 02110
Born 1972 | Senior Vice President and Chief Compliance Officer (2012) | Vice President — Asset Management Compliance, Ameriprise Financial, Inc., since May 2010; Chief Compliance Officer, Ameriprise Certificate Company since September 2010. |
Colin Moore
225 Franklin Street
Boston, MA 02110
Born 1958 | Senior Vice President (2010) | Executive Vice President and Global Chief Investment Officer, Ameriprise Financial, Inc., since July 2013; Executive Vice President and Global Chief Investment Officer, Columbia Management Investment Advisers, LLC since July 2013. |
Ryan C. Larrenaga
225 Franklin Street
Boston, MA 02110
Born 1970 | Senior Vice President (2017), Chief Legal Officer (2017) and Secretary (2015) | Vice President and Chief Counsel, Ameriprise Financial, Inc. since August 2018 (previously, Vice President and Group Counsel, August 2011 - August 2018); officer of Columbia Funds and affiliated funds since 2005. |
Michael E. DeFao
225 Franklin Street
Boston, MA 02110
Born 1968 | Vice President (2011) and Assistant Secretary (2010) | Vice President and Chief Counsel, Ameriprise Financial, Inc. since May 2010. |
Amy Johnson
5228 Ameriprise
Financial Center
Minneapolis, MN 55474
Born 1965 | Vice President (2006) | Managing Director and Global Head of Operations, Columbia Management Investment Advisers, LLC since April 2016 (previously Managing Director and Chief Operating Officer, 2010 - 2016). |
Lyn Kephart-Strong
5228 Ameriprise
Financial Center
Minneapolis, MN 55474
Born 1960 | Vice President (2015) | President, Columbia Management Investment Services Corp. since October 2014; Vice President & Resolution Officer, Ameriprise Trust Company since August 2009. |
Columbia Emerging Markets Fund | Annual Report 2018
| 37 |
Board Consideration and Approval of Management
Agreement
On June 12, 2018, the Board of Trustees (the Board) and the Trustees who are not interested persons (as defined in the Investment Company Act of 1940) (the Independent Trustees) of Columbia Funds Series Trust I (the Trust) unanimously approved the continuation of the Management Agreement (the Management Agreement) with Columbia Management Investment Advisers, LLC (the Investment Manager) with respect to Columbia Emerging Markets Fund (the Fund), a series of the Trust. As detailed below, the Board’s Advisory Fees and Expenses Committee (the Committee) and the Board met on multiple occasions to review and discuss, among themselves, with the management team of the Investment Manager and with an independent fee consultant, materials provided by the Investment Manager, the independent fee consultant and others before determining to approve the continuation of the Management Agreement.
In connection with their deliberations regarding the continuation of the Management Agreement, the Committee and the Board evaluated materials requested from the Investment Manager regarding the Fund and the Management Agreement, and discussed these materials with representatives of the Investment Manager at Committee meetings held on March 6, 2018, April 26, 2018 and June 11, 2018 and at Board meetings held on March 7, 2018 and June 12, 2018. In addition, the Board and its various committees consider matters bearing on the Management Agreement at other meetings throughout the year and in prior years and meet regularly with senior management of the Trust and the Investment Manager. Through the Board’s Investment Oversight Committees, Trustees also meet with selected portfolio managers of the funds the Trustees oversee and with other investment personnel at various times throughout the year. The Committee and the Board also consulted with the independent fee consultant, Fund counsel and the Independent Trustees’ independent legal counsel, who advised on various matters with respect to the Committee’s and the Board’s considerations and otherwise assisted the Committee and the Board in their deliberations. On June 11, 2018, the Committee recommended that the Board approve the continuation of the Management Agreement. On June 12, 2018, the Board, including the Independent Trustees, voting separately, unanimously approved the continuation of the Management Agreement for the Fund.
The Committee and the Board considered all information that they, their legal counsel or the Investment Manager believed reasonably necessary to evaluate and to determine whether to recommend for approval or approve the continuation of the Management Agreement. The information and factors considered by the Committee and the Board in recommending for approval or approving the continuation of the Management Agreement for the Fund included the following:
| • | Information on the investment performance of the Fund relative to the performance of a group of mutual funds determined to be comparable to the Fund by an independent third-party data provider, as well as performance relative to benchmarks; |
| • | Information on the Fund’s management fees and total expenses, including information comparing the Fund’s expenses to those of a group of comparable mutual funds, as determined by the independent third-party data provider; |
| • | The Investment Manager’s agreement to contractually limit or cap total operating expenses for the Fund through December 31, 2019 so that total operating expenses (excluding certain fees and expenses, such as transaction costs and certain other investment related expenses, interest, taxes, acquired fund fees and expenses, and infrequent and/or unusual expenses) would not exceed a specified annual rate, as a percentage of the Fund’s net assets; |
| • | The terms and conditions of the Management Agreement; |
| • | The current and proposed terms and conditions of other agreements and arrangements with affiliates of the Investment Manager relating to the operations of the Fund, including agreements with respect to the provision of distribution, transfer agency and shareholder services to the Fund; |
| • | Descriptions of various functions performed by the Investment Manager under the Management Agreement, including portfolio management and portfolio trading practices; |
| • | Information regarding the management fees of similarly-managed portfolios of other clients of the Investment Manager, including institutional accounts and collective trusts; |
| • | Information regarding the reputation, regulatory history and resources of the Investment Manager, including information regarding senior management, portfolio managers and other personnel; |
| 38 | Columbia Emerging Markets Fund | Annual Report 2018 |
Board Consideration and Approval of Management
Agreement (continued)
| • | Information regarding the capabilities of the Investment Manager with respect to compliance monitoring services, including an assessment of the Investment Manager’s compliance system by the Fund’s Chief Compliance Officer; and |
| • | The profitability to the Investment Manager and its affiliates from their relationships with the Fund. |
Nature, extent and quality of services provided under the Management Agreement
The Committee and the Board considered the nature, extent and quality of services provided to the Fund by the Investment Manager and its affiliates under the Management Agreement and under separate agreements for the provision of transfer agency and shareholder services, and the resources dedicated to the Fund and the other Columbia Funds by the Investment Manager and its affiliates. The Committee and the Board considered, among other things, the Investment Manager’s ability to attract, motivate and retain highly qualified research, advisory and supervisory investment professionals (including compensation programs for personnel involved in fund management, reputation and other attributes), the portfolio management services provided by those investment professionals, and the quality of the Investment Manager’s investment research capabilities and trade execution services. The Committee and the Board also considered the potential benefits to shareholders of investing in a mutual fund that is part of a fund complex offering exposure to a variety of asset classes and investment disciplines and providing a variety of fund and shareholder services.
The Committee and the Board also considered the professional experience and qualifications of the senior personnel of the Investment Manager, which included consideration of the Investment Manager’s experience with similarly-structured funds. The Committee and the Board noted the compliance programs of and the compliance-related resources provided to the Fund by the Investment Manager and its affiliates and the resources dedicated by the Investment Manager and its affiliates to risk management, and considered the Investment Manager’s ability to provide administrative services to the Fund and coordinate the activities of the Fund’s other service providers. After reviewing these and related factors, the Committee and the Board concluded, within the context of their overall conclusions, that the nature, extent and quality of the services provided to the Fund under the Management Agreement supported the continuation of the Management Agreement.
Investment performance
The Committee and the Board reviewed information about the performance of the Fund over various time periods, including performance information relative to benchmarks, information that compared the performance of the Fund to the performance of a group of comparable mutual funds as determined by the independent third-party data provider, and information and analysis provided by the independent fee consultant. The Committee and the Board also reviewed a description of the third party’s methodology for identifying the Fund’s peer groups for purposes of performance and expense comparisons.
The Committee and the Board noted that, through December 31, 2017, the Fund’s performance was in the seventh, twelfth and thirtieth percentile (where the best performance would be in the first percentile) of its category selected by the independent third-party data provider for the purposes of performance comparisons for the one-, three- and five-year periods, respectively.
The Committee and the Board also considered the Investment Manager’s performance and reputation generally, the Investment Manager’s historical responsiveness to Board concerns about performance, and the Investment Manager’s willingness to take steps intended to improve performance. After reviewing these and related factors, the Committee and the Board concluded, within the context of their overall conclusions, that the performance of the Fund and the Investment Manager was sufficient, in light of other considerations, to support the continuation of the Management Agreement.
Investment management fee rates and other expenses
The Committee and the Board considered the management fees charged to the Fund under the Management Agreement as well as the total expenses incurred by the Fund. In assessing the reasonableness of the fees under the Management Agreement, the Committee and the Board considered, among other information, the Fund’s total expense ratio as a percentage of average daily net assets. The Committee and the Board considered data provided by the independent third-party data provider and the independent fee consultant. The Committee and the Board noted that, as of December 31, 2017, the Fund’s actual management fee and net total expense ratio were ranked in the fourth and third quintiles,
Columbia Emerging Markets Fund | Annual Report 2018
| 39 |
Board Consideration and Approval of Management
Agreement (continued)
respectively, (where the lowest fees and expenses would be in the first quintile) against the Fund’s expense universe as determined by the independent third-party data provider for purposes of expense comparison. The Committee and the Board also took into account the fee waiver and expense limitation arrangements agreed to by the Investment Manager, as noted above.
The Committee and the Board also received and considered information about the management fees charged by the Investment Manager to institutional accounts. In considering the fees charged to those accounts, the Committee and the Board took into account, among other things, the Investment Manager’s representations about the differences between managing mutual funds as compared to other types of accounts, including differences in the services provided, differences in the risk profile of such business for the Investment Manager and the additional resources required to manage mutual funds effectively. The Committee and the Board also received and considered information about the fees charged by the Investment Manager for sub-advisory services it provides to comparable unaffiliated funds. In evaluating the Fund’s management fees, the Committee and the Board also took into account the demands, complexity and quality of the investment management of the Fund.
After reviewing these and related factors, the Committee and the Board concluded, within the context of their overall conclusions, that the management fee rates and expenses of the Fund, in light of other considerations, supported the continuation of the Management Agreement.
Costs of services provided and profitability
The Committee and the Board also took note of the costs the Investment Manager and its affiliates incur in connection with the services provided and the profitability to the Investment Manager and its affiliates from their relationships with the Fund.
The Committee and the Board also considered the compensation directly or indirectly received by the Investment Manager’s affiliates in connection with their relationships with the Fund. The Committee and the Board reviewed information provided by management as to the profitability to the Investment Manager and its affiliates of their relationships with the Fund, information about the allocation of expenses used to calculate profitability, and comparisons of profitability levels realized in 2017 to profitability levels realized in 2016. When reviewing profitability, the Committee and the Board also considered court cases in which adviser profitability was an issue in whole or in part, the performance of similarly managed funds, the performance of the Fund, and the expense ratio of the Fund. In addition, the Committee and the Board considered information provided by the Investment Manager regarding the Investment Manager’s financial condition and comparing its profitability to that of other asset management firms that are, or are subsidiaries of, publicly traded companies. In this regard, the Committee and the Board also considered data provided by the independent fee consultant.
After reviewing these and related factors, the Committee and the Board concluded, within the context of their overall conclusions, that the costs of services provided and the profitability to the Investment Manager and its affiliates from their relationships with the Fund supported the continuation of the Management Agreement.
Economies of scale
The Committee and the Board considered the potential existence of economies of scale in the provision by the Investment Manager of services to the Fund, to groups of related funds, and to the Investment Manager’s investment advisory clients as a whole, and whether those economies of scale were shared with the Fund through breakpoints in investment management fees or other means, such as expense limitation arrangements and additional investments by the Investment Manager in investment, trading, compliance and other resources. The Committee and the Board noted that the management fee schedules for the Fund contained breakpoints that would reduce the fee rate on assets above specified threshold levels.
In considering these matters, the Committee and the Board also considered the costs of the services provided and the profitability to the Investment Manager and its affiliates from their relationships with the Fund, as noted above. After reviewing these and related factors, the Committee and the Board concluded, within the context of their overall conclusions, that the extent to which any economies of scale were expected to be shared with the Fund supported the continuation of the Management Agreement.
| 40 | Columbia Emerging Markets Fund | Annual Report 2018 |
Board Consideration and Approval of Management
Agreement (continued)
Other benefits to the Investment Manager
The Committee and the Board received and considered information regarding “fall-out” or ancillary benefits received by the Investment Manager and its affiliates as a result of their relationships with the Fund, such as the engagement of the Investment Manager’s affiliates to provide distribution, transfer agency and shareholder services to the Fund. In this regard, among other matters, the Committee and the Board considered that the Fund’s distributor retains a portion of the distribution fees from the Fund and receives a portion of the sales charges on sales or redemptions of certain classes of shares of the Fund. The Committee and the Board also considered the benefits of research made available to the Investment Manager by reason of brokerage commissions generated by the Fund’s securities transactions, and reviewed information about the Investment Manager’s practices with respect to considering brokerage and research services when allocating portfolio transactions. In this connection, the Board also noted that the amount of research made available to the Investment Manager by reason of brokerage commissions had been declining over time, and may decline further. The Committee and the Board recognized that the Investment Manager’s profitability would be somewhat lower without these benefits.
Conclusion
The Committee and the Board reviewed all of the above considerations in reaching their decisions to recommend or approve the continuation of the Management Agreement. In their deliberations, the Trustees did not identify any particular information that was all-important or controlling, and individual Trustees may have attributed different weights to the various factors. Based on their evaluation of all factors that they deemed to be material, including those factors described above, and assisted by the advice of independent legal counsel, the Board, including the Independent Trustees, voting separately, unanimously approved the continuation of the Management Agreement.
Columbia Emerging Markets Fund | Annual Report 2018
| 41 |
The Fund mails one shareholder report to each shareholder address. If you would like more than one report, please call shareholder services at 800.345.6611 and additional reports will be sent to you.
Proxy voting policies and procedures
The policy of the Board of Trustees is to vote the proxies of the companies in which the Fund holds investments consistent with the procedures as stated in the Statement of Additional Information (SAI). You may obtain a copy of the SAI without charge by calling 800.345.6611; contacting your financial intermediary; visiting columbiathreadneedleus.com/investor/; or searching the website of the Securities and Exchange Commission (SEC) at sec.gov. Information regarding how the Fund voted proxies relating to portfolio securities is filed with the SEC by August 31st for the most recent 12-month period ending June 30th of that year, and is available without charge by visiting columbiathreadneedleus.com/investor/, or searching the website of the SEC at sec.gov.
Quarterly schedule of investments
The Fund files a complete schedule of portfolio holdings with the SEC for the first and third quarters of each fiscal year on Form N-Q or Form N-PORT. The Fund’s Form N-Q or Form N-PORT is available on the SEC’s website at sec.gov and may be reviewed and copied at the SEC’s Public Reference Room in Washington, D.C. Information on the operation of the Public Reference Room may be obtained by calling 800.SEC.0330. The Fund’s complete schedule of portfolio holdings, as filed on Form N-Q or Form N-PORT, can also be obtained without charge, upon request, by calling 800.345.6611.
Additional Fund information
For more information about the Fund, please visit columbiathreadneedleus.com/investor/ or call 800.345.6611. Customer Service Representatives are available to answer your questions Monday through Friday from 8 a.m. to 7 p.m. Eastern time.
Fund investment manager
Columbia Management Investment Advisers, LLC
225 Franklin Street
Boston, MA 02110
Fund distributor
Columbia Management Investment Distributors, Inc.
225 Franklin Street
Boston, MA 02110
Fund transfer agent
Columbia Management Investment Services Corp.
Through October 31, 2018:
P.O. Box 8081
Boston, MA 02266-8081
Effective November 1, 2018:
P.O. Box 219104
Kansas City, MO 64121-9104
| 42 | Columbia Emerging Markets Fund | Annual Report 2018 |
[THIS PAGE INTENTIONALLY LEFT BLANK]
[THIS PAGE INTENTIONALLY LEFT BLANK]
[THIS PAGE INTENTIONALLY LEFT BLANK]
Columbia Emerging Markets Fund
Through October 31, 2018:
P.O. Box 8081
Boston, MA 02266-8081
Effective November 1, 2018:
P.O. Box 219104
Kansas City, MO 64121-9104
Please read and consider the investment objectives, risks, charges and expenses for any fund carefully before investing. For a prospectus and summary prospectus, which contains this and other important information about the Fund, go to
columbiathreadneedleus.com/investor/. The Fund is distributed by Columbia Management Investment Distributors, Inc., member FINRA, and managed by Columbia Management Investment Advisers, LLC.
Columbia Threadneedle Investments (Columbia Threadneedle) is the global brand name of the Columbia and Threadneedle group of companies. All rights reserved.
© 2018 Columbia Management Investment Advisers, LLC.
columbiathreadneedleus .com/investor/

Annual Report
August 31, 2018
Columbia Greater China Fund
Not FDIC Insured • No bank guarantee • May lose value
Dear Shareholders,
Volatility exists in financial markets and this is not a comfortable fact of life. How investors deal with this reality, including how they react to short term spikes in volatility as well as to longer periods of increased or decreased volatility, may have a significant impact on their overall investing success.
Too often, investors change their investment strategy based on something that’s happening at a moment in time rather than thinking about how that change in strategy might affect their ability to achieve their longer-term financial goals. Emotion replaces logic and reasoning. Investors may sell in reaction to a market drop (fear or panic), locking in low returns which means they won’t be invested when the market returns, or they invest more at a market peak (greed or conviction), essentially when it is expensive to do so. In both cases, selling and buying at the exact wrong time.
We believe the best outcomes come from a consistent approach to investing. Here are five areas where advisors can help us overcome the tendency to react emotionally as we struggle to make the right choices with our investments:
Long-term focus
The further away long-term goals, aspirations and objectives are, the easier it is to stray away from the goals and priorities that we set out. Advisors help us stay focused on what we want to accomplish.
Discipline through up-and-down markets
Advisors help set rules to prevent us from making rash decisions that we may regret later. Knowing ahead of time what you should do in case of certain situations will help you get through volatile markets and not make emotional decisions.
Tax-awareness
Taxes are one of the biggest drags on investment returns and are critical attributes of investing. Yet few of us take the necessary steps to ease the corrosive effect of taxes. Advisors have tools and knowledge that may help us to manage portfolios more tax-efficiently and keep more of what we earn.
Emotional objectivity
Our emotions are very hard to manage and making investment decisions in an emotional state can lead to exceedingly bad outcomes. An objective advisor can help prevent some of the reactionary mistakes emotions often lead us to.
Education and guidance
The role of the advisor is to teach and guide us toward achieving our financial goals. In terms of working through emotions, guidance is by far the most important component.
By understanding our own behaviors and biases, we can prepare for future challenges. Your success is our priority. Talk to your advisor about how working with Columbia Threadneedle Investments may help you stay the course and position your portfolio for consistent, sustainable outcomes, regardless of market conditions.
Sincerely,
Christopher O. Petersen
President, Columbia Funds
Columbia Funds are distributed by Columbia Management Investment Distributors, Inc., member FINRA, and managed by Columbia Management Investment Advisers, LLC.
© 2018 Columbia Management Investment Advisers, LLC. All rights reserved.
Columbia Greater China Fund | Annual Report 2018
Columbia Greater China Fund | Annual Report 2018
Investment objective
Columbia Greater China Fund (the Fund) seeks long-term capital appreciation.
Portfolio management
Jasmine (Weili) Huang, CFA, CPA (U.S. and China), CFM
Portfolio Manager
Managed Fund since 2005
Morningstar style boxTM
The Morningstar Style Box is based on a fund’s portfolio holdings. For equity funds, the vertical axis shows the market capitalization of the stocks owned, and the horizontal axis shows investment style (value, blend, or growth). Information shown is based on the most recent data provided by Morningstar.
© 2018 Morningstar, Inc. All rights reserved. The Morningstar information contained herein: (1) is proprietary to Morningstar and/or its content providers; (2) may not be copied or distributed; and (3) is not warranted to be accurate, complete or timely. Neither Morningstar nor its content providers are responsible for any damages or losses arising from any use of this information.
| Average annual total returns (%) (for the period ended August 31, 2018) |
| | | Inception | 1 Year | 5 Years | 10 Years |
| Class A | Excluding sales charges | 05/16/97 | 5.41 | 10.74 | 7.01 |
| | Including sales charges | | -0.66 | 9.43 | 6.38 |
| Advisor Class* | 03/19/13 | 5.69 | 11.01 | 7.15 |
| Class C | Excluding sales charges | 05/16/97 | 4.63 | 9.91 | 6.21 |
| | Including sales charges | | 3.63 | 9.91 | 6.21 |
| Institutional Class | 05/16/97 | 5.68 | 11.01 | 7.28 |
| Institutional 2 Class* | 11/08/12 | 5.73 | 11.15 | 7.24 |
| Institutional 3 Class* | 03/01/17 | 5.82 | 10.86 | 7.07 |
| Class T* | Excluding sales charges | 06/18/12 | 5.43 | 10.74 | 7.02 |
| | Including sales charges | | 2.80 | 10.18 | 6.75 |
| MSCI China Index (Net) | | 0.22 | 9.27 | 5.97 |
| Hang Seng Index | | -0.57 | 4.86 | 2.69 |
Returns for Class A shares are shown with and without the maximum initial sales charge of 5.75%. Returns for Class C shares are shown with and without the 1.00% contingent deferred sales charge for the first year only. Returns for Class T shares are shown with and without the maximum initial sales charge of 2.50% per transaction. The Fund’s other share classes are not subject to sales charges and have limited eligibility. Effective November 1, 2017, Class R4, Class R5, Class Y and Class Z shares were renamed Advisor Class, Institutional 2 Class, Institutional 3 Class and Institutional Class shares, respectively. Please see the Fund’s prospectus for details. Performance for different share classes will vary based on differences in sales charges and fees associated with each share class. All results shown assume reinvestment of distributions during the period. Returns do not reflect the deduction of taxes that a shareholder may pay on Fund distributions or on the redemption of Fund shares. Performance results reflect the effect of any fee waivers or reimbursements of Fund expenses by Columbia Management Investment Advisers, LLC and/or any of its affiliates. Absent these fee waivers or expense reimbursement arrangements, performance results would have been lower.
The performance information shown represents past performance and is not a guarantee of future results. The investment return and principal value of your investment will fluctuate so that your shares, when redeemed, may be worth more or less than their original cost. Current performance may be lower or higher than the performance information shown. You may obtain performance information current to the most recent month-end by contacting your financial intermediary, visiting columbiathreadneedleus.com/investor/ or calling 800.345.6611.
| * | The returns shown for periods prior to the share class inception date (including returns for the Life of the Fund, if shown, which are since Fund inception) include the returns of the Fund’s oldest share class. Since the Fund launched more than one share class at its inception, Class A shares were used. These returns are adjusted to reflect any higher class-related operating expenses of the newer share classes, as applicable. Please visit columbiathreadneedleus.com/investor/investment-products/mutual-funds/appended-performance for more information. |
The MSCI China Index (Net) is designed to broadly and fairly represent the full diversity of business activities in China. This index aims to capture 85% of the free float adjusted market capitalization in each industry group.
The Hang Seng Index tracks the performance of approximately 70% of the total market capitalization of the stock exchange of Hong Kong.
Indices are not available for investment, are not professionally managed and do not reflect sales charges, fees, brokerage commissions, taxes (except the MSCI China Index (Net) which reflects reinvested dividends net of withholding taxes) or other expenses of investing. Securities in the Fund may not match those in an index.
| 2 | Columbia Greater China Fund | Annual Report 2018 |
Fund at a Glance (continued)
Performance of a hypothetical $10,000 investment (August 31, 2008 — August 31, 2018)
The chart above shows the change in value of a hypothetical $10,000 investment in Class A shares of Columbia Greater China Fund during the stated time period, and does not reflect the deduction of taxes that a shareholder may pay on Fund distributions or on the redemption of Fund shares.
| Top 10 holdings (%) (at August 31, 2018) |
| Tencent Holdings Ltd. | 20.0 |
| Alibaba Group Holding Ltd., ADR | 12.8 |
| Ping An Insurance Group Co. of China Ltd., Class H | 5.6 |
| China Construction Bank Corp., Class H | 4.6 |
| Shenzhou International Group Holdings Ltd. | 3.6 |
| CNOOC Ltd. | 3.5 |
| Industrial & Commercial Bank of China Ltd., Class H | 3.3 |
| CSPC Pharmaceutical Group Ltd. | 3.2 |
| New Oriental Education & Technology Group, Inc., ADR | 3.1 |
| Baidu, Inc., ADR | 2.6 |
Percentages indicated are based upon total investments (excluding Money Market Funds and derivatives, if any).
For further detail about these holdings, please refer to the section entitled “Portfolio of Investments.”
Fund holdings are as of the date given, are subject to change at any time, and are not recommendations to buy or sell any security.
| Equity sector breakdown (%) (at August 31, 2018) |
| Consumer Discretionary | 14.6 |
| Consumer Staples | 8.4 |
| Energy | 3.5 |
| Financials | 18.2 |
| Health Care | 10.7 |
| Industrials | 1.8 |
| Information Technology | 40.8 |
| Materials | 1.0 |
| Real Estate | 1.0 |
| Total | 100.0 |
Percentages indicated are based upon total equity investments. The Fund’s portfolio composition is subject to change.
Columbia Greater China Fund | Annual Report 2018
| 3 |
Fund at a Glance (continued)
| Country breakdown (%) (at August 31, 2018) |
| China | 91.6 |
| Hong Kong | 3.6 |
| United States(a) | 4.8 |
| Total | 100.0 |
| (a) | Includes investments in Money Market Funds. |
Country breakdown is based primarily on issuer’s place of organization/incorporation. Percentages indicated are based upon total investments and exclude investments in derivatives, if any. The Fund’s portfolio composition is subject to change.
| 4 | Columbia Greater China Fund | Annual Report 2018 |
Manager Discussion of Fund Performance
For the 12-month period that ended August 31, 2018, the Fund’s Class A shares returned 5.41% excluding sales charges. During the same 12-month period, the Fund’s performance exceeded that of its benchmark, the MSCI China Index (Net), which returned 0.22%, as well as that of the Hang Seng Index, which returned -0.57%. Overweight exposure to the health care and consumer staples sectors added to the Fund’s performance relative to the benchmark, as did an underweight to telecommunication services. Selection within financials, consumer discretionary, materials and information technology also added to relative performance. An underweight to energy and overweight to consumer discretionary constrained returns, as did selection within consumer staples and health care.
A tale of two markets
While the Chinese stock market finished more or less unchanged for the full 12 months ended August 31, 2018, the period saw a tale of two markets. Chinese stocks rose sharply early in the period, as investors shrugged off a slight slowing in Chinese economic activity, which was viewed as driven by policy efforts to reduce overcapacity, contain leverage and implement stricter environmental protection standards. Markets took a constructive view on these efforts, which should add to the resilience of the Chinese economy in the long term. Chinese corporate profits showed a broad-based recovery, driven by factors including strengthening in demand and pricing, an enhanced working capital cycle, and a slight decline in liability-to-asset ratios. The improved profitability helped ease systemic concerns, supporting a firming of bank stock prices and the equity market in general. Sentiment was also supported by the stability of the Chinese yuan. China’s real gross domestic product (GDP) growth reached 6.9% in 2017, the first improvement relative to the prior year since 2010.
Positive sentiment carried over through January of 2018, before global equities began to experience increased volatility driven by a slowdown in global growth momentum, higher oil prices and a U.S. Federal Reserve rate increase. Entering the second quarter of 2018, escalating rhetoric and action around a potential U.S.-China trade war added to investor anxieties and pressured Chinese equities in particular. Subsequently, second quarter 2018 data revealed an increasing impact on Chinese industrial activity and infrastructure investment from the financial deleveraging measures implemented by the government beginning in 2017. The Chinese government responded swiftly by dialing back the pace of deleveraging and with measures designed to cushion the impact of the global slowdown and trade conflict, including lower the reserve requirement ratio for banks, increasing fiscal spending and cutting taxes. However, Chinese equities continued to trend lower as the 12 months ended August 31, 2018 drew to a close.
Fund performance aided by sector allocation and security selection
For the 12 months ended August 31, 2018, performance in the Chinese market was led by the relatively defensive health care and consumer staples sectors, along with energy stocks which benefited from the strength in crude oil prices. By contrast, the consumer discretionary, industrials and telecommunication services sectors were in negative territory.
The Fund’s sector allocations in aggregate added to returns versus the MSCI benchmark. In particular, overweight exposure to the health care and consumer staples sectors added to the Fund’s performance relative to the benchmark, as did an underweight to telecommunication services. An underweight to energy and overweight to consumer discretionary constrained returns. The Fund’s security selection also aided relative performance. Selection was positive within financials, consumer discretionary, materials and information technology, more than offsetting negative selection within consumer staples and health care.
With respect to individual stocks, positive contributors to relative performance included Shenzhou International, the world’s largest vertically integrated knitwear supplier for global clothing and sports brands including Nike and Adidas. The stock posted strong performance as Shenzhou continued to demonstrate the ability to secure new brands and grow orders on the strength of both research and development and manufacturing efficiency. A position in CSPC Pharmaceutical, a leading pharmaceutical company in China and a long-term Fund holding, also contributed meaningfully. CSPC posted stronger-than-expected financial results, while the company’s drug portfolio showed accelerated growth and demand for some existing drugs was boosted by admission to the national drug reimbursement list. We trimmed the position on strength. Wuxi Biologic, a contract research and manufacturing organization (CRMO), provides global biotech companies with biological pharmaceutical-related research and manufacturing services. The company is the leader in China and within the top five globally in the biologics CRMO business, and benefits from the trend of global biotech companies outsourcing the research and manufacturing parts of their businesses. The company has exhibited strong earnings growth and saw its stock valuation
Columbia Greater China Fund | Annual Report 2018
| 5 |
Manager Discussion of Fund Performance (continued)
rewarded in the period. Ping An Insurance Group is a financial conglomerate with leading positions in both China’s life and property and casualty insurance industries. The stock performed well as Ping An’s innovation and technology leadership continued to drive strong insurance business growth.
On the downside, the Fund’s lack of exposure to China Petroleum and Chemical (Sinopec) acted as a constraint on performance relative to the MSCI benchmark, as the upward move in global oil prices drove energy-related stocks to outperform. An overweight position in Netease, an internet technology company and the second largest online gaming company in China, also detracted. The stock declined due to tapering sales growth of existing games, as well as the impact of regulatory approval delays on new product launches. We continued to hold the stock based on its reasonable valuation and the company’s strong game pipeline and long-term proven track record of launching successful games. Zai Lab, a China-based biopharmaceutical company, has a broad portfolio of drugs in the fields of antibody-based oncology, autoimmune disease and infectious disease. In September of 2017, the company engaged in an initial public offering (IPO) with an eye toward deploying funds toward accelerating the approval process for use in China of a range of licensed cancer treatments. The stock’s poor performance was driven by post-IPO profit taking, as well as a clinical trial setback with respect to a dermatitis treatment.
At period’s end
Trade tensions have been the center of investor attention and a persistent source of market volatility. A trade war is clearly a threat to risk sentiment and ultimately there would be no real winner. The tariffs of 25% on $50 billion of imports from China imposed by the United States in July could lower China’s GDP growth by a modest 0.1%. However, more recent protectionist rhetoric added further uncertainty as the Trump administration threatened tariffs on an additional $200 billion of Chinese imports or even all Chinese imports. The end game is hard to predict, and retaliation from all sides will ultimately mean domestic consumers and industries end up paying the cost of tariffs. The effect may likely damage U.S. output and employment, as well as market confidence. We believe many countervailing U.S. political and economic forces would become vocal if this extreme scenario plays out.
In view of the growth slowdown and an uncertain trade outlook, the Chinese government has started to fine-tune policy, changing from a tightening bias to at least a neutral stance to cushion downside risks. As deleveraging measures have been a key cause of the recent growth deceleration, we believe that Beijing is likely to — and also has room to — adjust domestic policies to mitigate risks from internal or external headwinds.
At the close of the reporting period, the Fund remained overweight in health care and consumer discretionary stocks, and had recently increased exposure to the relatively defensive consumer staples sector where we believe many companies have innovated to meet consumer preferences and restructured to focus on profitability. Exposure to banks was been trimmed on signs of a deterioration in loan quality against a backdrop of slower growth.
In managing the Fund, we try not to overreact to macroeconomic and geopolitical headlines. Our investment focus remains on long-term secular Chinese domestic growth themes rather than global trade and cyclical trends. China’s GDP growth pace is slowing, but the quality of growth is improving due to deleveraging measures and the many investment opportunities related to Chinese consumers. We believe the outlook for China’s “new economy” remains robust, and that market volatility can create opportunities to invest in high quality companies at reasonable prices.
Market risk may affect a single issuer, sector of the economy, industry or the market as a whole. International investing involves certain risks and volatility due to potential political, economic or currency instabilities and different financial and accounting standards. Risks are enhanced for emerging market issuers. Concentration in the Greater China region, where issuers tend to be less developed than U.S. issuers, presents increased risk of loss than a fund that does not concentrate its investments. Investments in small- and mid-cap companies involve risks and volatility greater than investments in larger, more established companies. As a non-diversified fund, fewer investments could have a greater affect on performance.See the Fund’s prospectus for more information on these and other risks.
The views expressed in this report reflect the current views of the respective parties. These views are not guarantees of future performance and involve certain risks, uncertainties and assumptions that are difficult to predict, so actual outcomes and results may differ significantly from the views expressed. These views are subject to change at any time based upon economic, market or other conditions and the respective parties disclaim any responsibility to
| 6 | Columbia Greater China Fund | Annual Report 2018 |
Manager Discussion of Fund Performance (continued)
update such views. These views may not be relied on as investment advice and, because investment decisions for a Columbia fund are based on numerous factors, may not be relied on as an indication of trading intent on behalf of any particular Columbia fund. References to specific securities should not be construed as a recommendation or investment advice.
Columbia Greater China Fund | Annual Report 2018
| 7 |
Understanding Your Fund’s Expenses
(Unaudited)
As an investor, you incur two types of costs. There are shareholder transaction costs, which generally include sales charges on purchases and may include redemption fees. There are also ongoing costs, which generally include management fees, distribution and/or service fees, and other fund expenses. The following information is intended to help you understand your ongoing costs (in dollars) of investing in the Fund and to help you compare these costs with the ongoing costs of investing in other mutual funds.
Analyzing your Fund’s expenses
To illustrate these ongoing costs, we have provided examples and calculated the expenses paid by investors in each share class of the Fund during the period. The actual and hypothetical information in the table is based on an initial investment of $1,000 at the beginning of the period indicated and held for the entire period. Expense information is calculated two ways and each method provides you with different information. The amount listed in the “Actual” column is calculated using the Fund’s actual operating expenses and total return for the period. You may use the Actual information, together with the amount invested, to estimate the expenses that you paid over the period. Simply divide your account value by $1,000 (for example, an $8,600 account value divided by $1,000 = 8.6), then multiply the results by the expenses paid during the period under the “Actual” column. The amount listed in the “Hypothetical” column assumes a 5% annual rate of return before expenses (which is not the Fund’s actual return) and then applies the Fund’s actual expense ratio for the period to the hypothetical return. You should not use the hypothetical account values and expenses to estimate either your actual account balance at the end of the period or the expenses you paid during the period. See “Compare with other funds” below for details on how to use the hypothetical data.
Compare with other funds
Since all mutual funds are required to include the same hypothetical calculations about expenses in shareholder reports, you can use this information to compare the ongoing cost of investing in the Fund with other funds. To do so, compare the hypothetical example with the 5% hypothetical examples that appear in the shareholder reports of other funds. As you compare hypothetical examples of other funds, it is important to note that hypothetical examples are meant to highlight the ongoing costs of investing in a fund only and do not reflect any transaction costs, such as sales charges, or redemption or exchange fees. Therefore, the hypothetical calculations are useful in comparing ongoing costs only, and will not help you determine the relative total costs of owning different funds. If transaction costs were included in these calculations, your costs would be higher.
| March 1, 2018 — August 31, 2018 |
| | Account value at the
beginning of the
period ($) | Account value at the
end of the
period ($) | Expenses paid during
the period ($) | Fund’s annualized
expense ratio (%) |
| | Actual | Hypothetical | Actual | Hypothetical | Actual | Hypothetical | Actual |
| Class A | 1,000.00 | 1,000.00 | 887.00 | 1,017.69 | 7.09 | 7.58 | 1.49 |
| Advisor Class | 1,000.00 | 1,000.00 | 888.20 | 1,018.95 | 5.90 | 6.31 | 1.24 |
| Class C | 1,000.00 | 1,000.00 | 883.60 | 1,013.96 | 10.59 | 11.32 | 2.23 |
| Institutional Class | 1,000.00 | 1,000.00 | 888.00 | 1,018.95 | 5.90 | 6.31 | 1.24 |
| Institutional 2 Class | 1,000.00 | 1,000.00 | 888.40 | 1,019.41 | 5.47 | 5.85 | 1.15 |
| Institutional 3 Class | 1,000.00 | 1,000.00 | 888.80 | 1,019.66 | 5.24 | 5.60 | 1.10 |
| Class T | 1,000.00 | 1,000.00 | 887.00 | 1,017.85 | 6.94 | 7.43 | 1.46 |
Expenses paid during the period are equal to the annualized expense ratio for each class as indicated above, multiplied by the average account value over the period and then multiplied by the number of days in the Fund’s most recent fiscal half year and divided by 365.
Expenses do not include fees and expenses incurred indirectly by the Fund from its investment in underlying funds, including affiliated and non-affiliated pooled investment vehicles, such as mutual funds and exchange-traded funds.
| 8 | Columbia Greater China Fund | Annual Report 2018 |
Portfolio of Investments
August 31, 2018
(Percentages represent value of investments compared to net assets)
Investments in securities
| Common Stocks 95.1% |
| Issuer | Shares | Value ($) |
| Consumer Discretionary 13.9% |
| Auto Components 1.1% |
| Nexteer Automotive Group Ltd. | 819,000 | 1,381,436 |
| Automobiles 0.8% |
| Brilliance China Automotive Holdings Ltd. | 696,000 | 1,104,443 |
| Diversified Consumer Services 3.6% |
| New Oriental Education & Technology Group, Inc., ADR | 49,197 | 3,866,884 |
| RISE Education Cayman Ltd., ADR(a) | 78,404 | 827,162 |
| Total | | 4,694,046 |
| Hotels, Restaurants & Leisure 1.9% |
| Galaxy Entertainment Group Ltd. | 328,000 | 2,429,516 |
| Household Durables 2.6% |
| Midea Group Co., Ltd., Class A | 302,975 | 1,846,709 |
| Qingdao Haier Co., Ltd., Class A | 356,620 | 779,246 |
| Techtronic Industries Co., Ltd. | 131,000 | 802,019 |
| Total | | 3,427,974 |
| Internet & Direct Marketing Retail 0.5% |
| Ctrip.com International Ltd., ADR(a) | 18,137 | 710,063 |
| Textiles, Apparel & Luxury Goods 3.4% |
| Shenzhou International Group Holdings Ltd. | 336,000 | 4,413,245 |
| Total Consumer Discretionary | 18,160,723 |
| Consumer Staples 8.0% |
| Beverages 4.8% |
| China Resources Beer Holdings Co., Ltd. | 276,000 | 1,175,777 |
| Jiangsu Yanghe Brewery Joint-Stock Co., Ltd., Class A | 127,000 | 2,146,083 |
| Kweichow Moutai Co., Ltd., Class A | 22,600 | 2,182,244 |
| Wuliangye Yibin Co., Ltd., Class A | 71,707 | 651,376 |
| Total | | 6,155,480 |
| Food & Staples Retailing 0.3% |
| Sun Art Retail Group Ltd. | 353,500 | 407,884 |
| Common Stocks (continued) |
| Issuer | Shares | Value ($) |
| Food Products 2.9% |
| China Mengniu Dairy Co., Ltd. | 637,000 | 1,840,440 |
| Foshan Haitian Flavouring & Food Co., Ltd., Class A | 102,136 | 1,025,739 |
| Tingyi Cayman Islands Holding Corp. | 520,000 | 928,861 |
| Total | | 3,795,040 |
| Total Consumer Staples | 10,358,404 |
| Energy 3.3% |
| Oil, Gas & Consumable Fuels 3.3% |
| CNOOC Ltd. | 2,448,500 | 4,344,549 |
| Total Energy | 4,344,549 |
| Financials 17.3% |
| Banks 10.9% |
| Bank of China Ltd., Class H | 6,683,000 | 3,003,056 |
| China Construction Bank Corp., Class H | 6,455,340 | 5,685,452 |
| China Merchants Bank Co., Ltd., Class H | 377,500 | 1,450,021 |
| Industrial & Commercial Bank of China Ltd., Class H | 5,505,000 | 4,065,982 |
| Total | | 14,204,511 |
| Insurance 6.4% |
| AIA Group Ltd. | 161,200 | 1,391,842 |
| Ping An Insurance Group Co. of China Ltd., Class H | 722,500 | 6,969,127 |
| Total | | 8,360,969 |
| Total Financials | 22,565,480 |
| Health Care 10.1% |
| Biotechnology 3.3% |
| Ascletis Pharma, Inc.(a) | 1,000,000 | 1,177,257 |
| BeiGene Ltd.(a) | 82,500 | 1,117,344 |
| BeiGene Ltd., ADR(a) | 3,381 | 600,229 |
| Zai Lab Ltd., ADR(a) | 65,281 | 1,483,837 |
| Total | | 4,378,667 |
| Life Sciences Tools & Services 1.0% |
| Wuxi Biologics Cayman, Inc.(a) | 131,000 | 1,294,869 |
The accompanying Notes to Financial Statements are an integral part of this statement.
Columbia Greater China Fund | Annual Report 2018
| 9 |
Portfolio of Investments (continued)
August 31, 2018
| Common Stocks (continued) |
| Issuer | Shares | Value ($) |
| Pharmaceuticals 5.8% |
| China Animal Healthcare Ltd.(a),(b),(c),(d) | 1,050,000 | 0 |
| CSPC Pharmaceutical Group Ltd. | 1,592,000 | 4,020,923 |
| Jiangsu Hengrui Medicine Co., Ltd., Class A | 43,443 | 421,231 |
| Sino Biopharmaceutical Ltd. | 2,443,500 | 3,096,913 |
| Total | | 7,539,067 |
| Total Health Care | 13,212,603 |
| Industrials 1.8% |
| Electrical Equipment 1.8% |
| Zhuzhou CRRC Times Electric Co., Ltd., Class H | 425,400 | 2,297,282 |
| Total Industrials | 2,297,282 |
| Information Technology 38.8% |
| Electronic Equipment, Instruments & Components 1.4% |
| AAC Technologies Holdings, Inc. | 63,000 | 700,192 |
| Sunny Optical Technology Group Co., Ltd. | 87,500 | 1,115,280 |
| Total | | 1,815,472 |
| Internet Software & Services 35.9% |
| Alibaba Group Holding Ltd., ADR(a) | 90,530 | 15,843,655 |
| Baidu, Inc., ADR(a) | 13,992 | 3,168,908 |
| NetEase, Inc., ADR | 14,867 | 2,939,355 |
| Tencent Holdings Ltd. | 577,100 | 24,807,897 |
| Total | | 46,759,815 |
| Software 0.8% |
| Kingdee International Software Group Co., Ltd. | 932,000 | 1,063,489 |
| Common Stocks (continued) |
| Issuer | Shares | Value ($) |
| Technology Hardware, Storage & Peripherals 0.7% |
| Focus Media Information Technology Co., Ltd., Class A | 742,956 | 935,907 |
| Total Information Technology | 50,574,683 |
| Materials 0.9% |
| Construction Materials 0.9% |
| China Resources Cement Holdings Ltd. | 1,036,000 | 1,211,535 |
| Total Materials | 1,211,535 |
| Real Estate 1.0% |
| Real Estate Management & Development 1.0% |
| China Resources Land Ltd. | 360,000 | 1,255,772 |
| Total Real Estate | 1,255,772 |
Total Common Stocks
(Cost $67,158,268) | 123,981,031 |
|
| Money Market Funds 4.8% |
| | Shares | Value ($) |
| Columbia Short-Term Cash Fund, 2.058%(e),(f) | 6,297,619 | 6,296,990 |
Total Money Market Funds
(Cost $6,296,990) | 6,296,990 |
Total Investments in Securities
(Cost: $73,455,258) | 130,278,021 |
| Other Assets & Liabilities, Net | | 168,172 |
| Net Assets | 130,446,193 |
Notes to Portfolio of Investments
| (a) | Non-income producing investment. |
| (b) | Represents fair value as determined in good faith under procedures approved by the Board of Trustees. At August 31, 2018, the total value of these securities amounted to $0, which represents less than 0.01% of total net assets. |
| (c) | Negligible market value. |
| (d) | Valuation based on significant unobservable inputs. |
| (e) | The rate shown is the seven-day current annualized yield at August 31, 2018. |
| (f) | As defined in the Investment Company Act of 1940, an affiliated company is one in which the Fund owns 5% or more of the company’s outstanding voting securities, or a company which is under common ownership or control with the Fund. Holdings and transactions in these affiliated companies during the year ended August 31, 2018 are as follows: |
| Issuer | Beginning
shares | Shares
purchased | Shares
sold | Ending
shares | Realized gain
(loss) —
affiliated
issuers ($) | Net change in
unrealized
appreciation
(depreciation) —
affiliated
issuers ($) | Dividends —
affiliated
issuers ($) | Value —
affiliated
issuers
at end of
period ($) |
| Columbia Short-Term Cash Fund, 2.058% |
| | 1,531,860 | 45,588,522 | (40,822,763) | 6,297,619 | (340) | (15) | 49,295 | 6,296,990 |
The accompanying Notes to Financial Statements are an integral part of this statement.
| 10 | Columbia Greater China Fund | Annual Report 2018 |
Portfolio of Investments (continued)
August 31, 2018
Abbreviation Legend
| ADR | American Depositary Receipt |
Fair value measurements
The Fund categorizes its fair value measurements according to a three-level hierarchy that maximizes the use of observable inputs and minimizes the use of unobservable inputs by prioritizing that the most observable input be used when available. Observable inputs are those that market participants would use in pricing an investment based on market data obtained from sources independent of the reporting entity. Unobservable inputs are those that reflect the Fund’s assumptions about the information market participants would use in pricing an investment. An investment’s level within the fair value hierarchy is based on the lowest level of any input that is deemed significant to the asset’s or liability’s fair value measurement. The input levels are not necessarily an indication of the risk or liquidity associated with investments at that level. For example, certain U.S. government securities are generally high quality and liquid, however, they are reflected as Level 2 because the inputs used to determine fair value may not always be quoted prices in an active market.
Fair value inputs are summarized in the three broad levels listed below:
| ■ | Level 1 — Valuations based on quoted prices for investments in active markets that the Fund has the ability to access at the measurement date. Valuation adjustments are not applied to Level 1 investments. |
| ■ | Level 2 — Valuations based on other significant observable inputs (including quoted prices for similar securities, interest rates, prepayment speeds, credit risks, etc.). |
| ■ | Level 3 — Valuations based on significant unobservable inputs (including the Fund’s own assumptions and judgment in determining the fair value of investments). |
Inputs that are used in determining fair value of an investment may include price information, credit data, volatility statistics, and other factors. These inputs can be either observable or unobservable. The availability of observable inputs can vary between investments, and is affected by various factors such as the type of investment, and the volume and level of activity for that investment or similar investments in the marketplace. The inputs will be considered by the Investment Manager, along with any other relevant factors in the calculation of an investment’s fair value. The Fund uses prices and inputs that are current as of the measurement date, which may include periods of market dislocations. During these periods, the availability of prices and inputs may be reduced for many investments. This condition could cause an investment to be reclassified between the various levels within the hierarchy.
Foreign equity securities actively traded in markets where there is a significant delay in the local close relative to the New York Stock Exchange are classified as Level 2. The values of these securities may include an adjustment to reflect the impact of significant market movements following the close of local trading, as described in Note 2 to the financial statements – Security valuation.
Certain investments that have been measured at fair value using the net asset value (NAV) per share (or its equivalent) are not categorized in the fair value hierarchy. The fair value amounts presented in the table are intended to reconcile the fair value hierarchy to the amounts presented in the Portfolio of Investments. The Columbia Short-Term Cash Fund seeks to provide shareholders with maximum current income consistent with liquidity and stability of principal. Columbia Short-Term Cash Fund prices its shares with a floating NAV and no longer seeks to maintain a stable NAV.
Investments falling into the Level 3 category are primarily supported by quoted prices from brokers and dealers participating in the market for those investments. However, these may be classified as Level 3 investments due to lack of market transparency and corroboration to support these quoted prices. Additionally, valuation models may be used as the pricing source for any remaining investments classified as Level 3. These models may rely on one or more significant unobservable inputs and/or significant assumptions by the Investment Manager. Inputs used in valuations may include, but are not limited to, financial statement analysis, capital account balances, discount rates and estimated cash flows, and comparable company data.
Under the direction of the Fund’s Board of Trustees (the Board), the Investment Manager’s Valuation Committee (the Committee) is responsible for overseeing the valuation procedures approved by the Board. The Committee consists of voting and non-voting members from various groups within the Investment Manager’s organization, including operations and accounting, trading and investments, compliance, risk management and legal.
The Committee meets at least monthly to review and approve valuation matters, which may include a description of specific valuation determinations, data regarding pricing information received from approved pricing vendors and brokers and the results of Board-approved valuation control policies and procedures (the Policies). The Policies address, among other things, instances when market quotations are or are not readily available, including recommendations of third party pricing vendors and a determination of appropriate pricing methodologies; events that require specific valuation determinations and assessment of fair value techniques; securities with a potential for stale pricing, including those that are illiquid, restricted, or in default; and the effectiveness of third party pricing vendors, including periodic reviews of vendors. The Committee meets more frequently, as needed, to discuss additional valuation matters, which may include the need to review back-testing results, review time-sensitive information or approve related valuation actions. The Committee reports to the Board, with members of the Committee meeting with the Board at each of its regularly scheduled meetings to discuss valuation matters and actions during the period, similar to those described earlier.
For investments categorized as Level 3, the Committee monitors information similar to that described above, which may include: (i) data specific to the issuer or comparable issuers, (ii) general market or specific sector news and (iii) quoted prices and specific or similar security transactions. The Committee considers this data and any changes from prior periods in order to assess the reasonableness of observable and unobservable inputs, any assumptions or internal models used to value those securities and changes in fair value. This data is also used to corroborate, when available, information received from approved pricing vendors and brokers. Various factors impact the frequency of monitoring this information (which may occur as often as daily). However, the Committee may determine that changes to inputs, assumptions and models are not required as a result of the monitoring procedures performed.
The accompanying Notes to Financial Statements are an integral part of this statement.
Columbia Greater China Fund | Annual Report 2018
| 11 |
Portfolio of Investments (continued)
August 31, 2018
Fair value measurements (continued)
The following table is a summary of the inputs used to value the Fund’s investments at August 31, 2018:
| | Level 1
quoted prices
in active
markets for
identical
assets ($) | Level 2
other
significant
observable
inputs ($) | Level 3
significant
unobservable
inputs ($) | Investments
measured at
net asset
value ($) | Total ($) |
| Investments in Securities | | | | | |
| Common Stocks | | | | | |
| Consumer Discretionary | 5,404,109 | 12,756,614 | — | — | 18,160,723 |
| Consumer Staples | — | 10,358,404 | — | — | 10,358,404 |
| Energy | — | 4,344,549 | — | — | 4,344,549 |
| Financials | — | 22,565,480 | — | — | 22,565,480 |
| Health Care | 2,084,066 | 11,128,537 | 0* | — | 13,212,603 |
| Industrials | — | 2,297,282 | — | — | 2,297,282 |
| Information Technology | 21,951,918 | 28,622,765 | — | — | 50,574,683 |
| Materials | — | 1,211,535 | — | — | 1,211,535 |
| Real Estate | — | 1,255,772 | — | — | 1,255,772 |
| Total Common Stocks | 29,440,093 | 94,540,938 | 0* | — | 123,981,031 |
| Money Market Funds | — | — | — | 6,296,990 | 6,296,990 |
| Total Investments in Securities | 29,440,093 | 94,540,938 | 0* | 6,296,990 | 130,278,021 |
See the Portfolio of Investments for all investment classifications not indicated in the table.
The Fund’s assets assigned to the Level 2 input category are generally valued using the market approach, in which a security’s value is determined through reference to prices and information from market transactions for similar or identical assets. These assets include certain foreign securities for which a third party statistical pricing service may be employed for purposes of fair market valuation. The model utilized by such third party statistical pricing service takes into account a security’s correlation to available market data including, but not limited to, intraday index, ADR, and exchange-traded fund movements.
There were no transfers of financial assets between levels during the period.
The Fund does not hold any significant investments (greater than one percent of net assets) categorized as Level 3.
The Fund’s assets assigned to the Level 3 category are valued utilizing the valuation technique deemed the most appropriate in the circumstances. Certain common stocks classified as Level 3 securities are valued using the market approach. To determine fair value for these securities, management considered various factors which may have included, but were not limited to, the halt price of the security, discount rates observed in the market for similar assets as well as the movement in certain foreign or domestic market indices. Significant increases (decreases) to any of these inputs would result in a significantly lower (higher) fair value measurement. Generally, a change in observable yields on comparable securities would result in a directionally similar change to discount rates.
The accompanying Notes to Financial Statements are an integral part of this statement.
| 12 | Columbia Greater China Fund | Annual Report 2018 |
Statement of Assets and Liabilities
August 31, 2018
| Assets | |
| Investments in securities, at value | |
| Unaffiliated issuers (cost $67,158,268) | $123,981,031 |
| Affiliated issuers (cost $6,296,990) | 6,296,990 |
| Cash | 37 |
| Receivable for: | |
| Capital shares sold | 494,184 |
| Dividends | 46,158 |
| Prepaid expenses | 933 |
| Trustees’ deferred compensation plan | 57,890 |
| Total assets | 130,877,223 |
| Liabilities | |
| Payable for: | |
| Capital shares purchased | 306,736 |
| Management services fees | 3,378 |
| Distribution and/or service fees | 654 |
| Transfer agent fees | 16,816 |
| Compensation of chief compliance officer | 9 |
| Audit fees | 35,475 |
| Other expenses | 10,072 |
| Trustees’ deferred compensation plan | 57,890 |
| Total liabilities | 431,030 |
| Net assets applicable to outstanding capital stock | $130,446,193 |
| Represented by | |
| Paid in capital | 69,057,870 |
| Excess of distributions over net investment income | (786,878) |
| Accumulated net realized gain | 5,352,436 |
| Unrealized appreciation (depreciation) on: | |
| Investments - unaffiliated issuers | 56,822,763 |
| Foreign currency translations | 2 |
| Total - representing net assets applicable to outstanding capital stock | $130,446,193 |
The accompanying Notes to Financial Statements are an integral part of this statement.
Columbia Greater China Fund | Annual Report 2018
| 13 |
Statement of Assets and Liabilities (continued)
August 31, 2018
| Class A | |
| Net assets | $73,210,410 |
| Shares outstanding | 1,549,571 |
| Net asset value per share | $47.25 |
| Maximum sales charge | 5.75% |
| Maximum offering price per share (calculated by dividing the net asset value per share by 1.0 minus the maximum sales charge for Class A shares) | $50.13 |
| Advisor Class | |
| Net assets | $2,008,299 |
| Shares outstanding | 38,440 |
| Net asset value per share | $52.25 |
| Class C | |
| Net assets | $5,584,765 |
| Shares outstanding | 128,183 |
| Net asset value per share | $43.57 |
| Institutional Class | |
| Net assets | $42,541,795 |
| Shares outstanding | 829,283 |
| Net asset value per share | $51.30 |
| Institutional 2 Class | |
| Net assets | $2,330,205 |
| Shares outstanding | 44,483 |
| Net asset value per share | $52.38 |
| Institutional 3 Class | |
| Net assets | $4,768,009 |
| Shares outstanding | 93,351 |
| Net asset value per share | $51.08 |
| Class T | |
| Net assets | $2,710 |
| Shares outstanding | 57 |
| Net asset value per share(a) | $47.24 |
| Maximum sales charge | 2.50% |
| Maximum offering price per share (calculated by dividing the net asset value per share by 1.0 minus the maximum sales charge per transaction for Class T shares) | $48.45 |
| (a) | Net asset value per share rounds to this amount due to fractional shares outstanding. |
The accompanying Notes to Financial Statements are an integral part of this statement.
| 14 | Columbia Greater China Fund | Annual Report 2018 |
Statement of Operations
Year Ended August 31, 2018
| Net investment income | |
| Income: | |
| Dividends — unaffiliated issuers | $1,924,312 |
| Dividends — affiliated issuers | 49,295 |
| Foreign taxes withheld | (147,832) |
| Total income | 1,825,775 |
| Expenses: | |
| Management services fees | 1,316,857 |
| Distribution and/or service fees | |
| Class A | 197,349 |
| Class C | 99,478 |
| Class T | 7 |
| Transfer agent fees | |
| Class A | 109,565 |
| Advisor Class | 3,119 |
| Class C | 13,778 |
| Institutional Class | 54,475 |
| Institutional 2 Class | 1,282 |
| Institutional 3 Class | 553 |
| Class T | 5 |
| Compensation of board members | 16,521 |
| Custodian fees | 19,683 |
| Printing and postage fees | 24,399 |
| Registration fees | 103,091 |
| Audit fees | 35,475 |
| Legal fees | 3,321 |
| Line of credit interest | 1,470 |
| Compensation of chief compliance officer | 55 |
| Other | 33,027 |
| Total expenses | 2,033,510 |
| Expense reduction | (360) |
| Total net expenses | 2,033,150 |
| Net investment loss | (207,375) |
| Realized and unrealized gain (loss) — net | |
| Net realized gain (loss) on: | |
| Investments — unaffiliated issuers | 9,636,378 |
| Investments — affiliated issuers | (340) |
| Foreign currency translations | (5,209) |
| Net realized gain | 9,630,829 |
| Net change in unrealized appreciation (depreciation) on: | |
| Investments — unaffiliated issuers | (3,756,916) |
| Investments — affiliated issuers | (15) |
| Foreign currency translations | 5 |
| Net change in unrealized appreciation (depreciation) | (3,756,926) |
| Net realized and unrealized gain | 5,873,903 |
| Net increase in net assets resulting from operations | $5,666,528 |
The accompanying Notes to Financial Statements are an integral part of this statement.
Columbia Greater China Fund | Annual Report 2018
| 15 |
Statement of Changes in Net Assets
| | Year Ended
August 31, 2018 | Year Ended
August 31, 2017 (a) |
| Operations | | |
| Net investment income (loss) | $(207,375) | $215,800 |
| Net realized gain | 9,630,829 | 5,423,260 |
| Net change in unrealized appreciation (depreciation) | (3,756,926) | 23,069,442 |
| Net increase in net assets resulting from operations | 5,666,528 | 28,708,502 |
| Distributions to shareholders | | |
| Net investment income | | |
| Class A | (417,242) | — |
| Advisor Class | (9,370) | — |
| Institutional Class | (254,856) | — |
| Institutional 2 Class | (16,423) | — |
| Institutional 3 Class | (48,186) | — |
| Class T | (16) | — |
| Net realized gains | | |
| Class A | (999,421) | — |
| Advisor Class | (16,158) | — |
| Class C | (142,541) | — |
| Institutional Class | (436,288) | — |
| Institutional 2 Class | (25,504) | — |
| Institutional 3 Class | (75,324) | — |
| Class T | (38) | — |
| Total distributions to shareholders | (2,441,367) | — |
| Increase (decrease) in net assets from capital stock activity | 2,163,844 | (18,016,589) |
| Total increase in net assets | 5,389,005 | 10,691,913 |
| Net assets at beginning of year | 125,057,188 | 114,365,275 |
| Net assets at end of year | $130,446,193 | $125,057,188 |
| Undistributed (excess of distributions over) net investment income | $(786,878) | $171,799 |
| (a) | Institutional 3 Class shares are based on operations from March 1, 2017 (commencement of operations) through the stated period end. |
The accompanying Notes to Financial Statements are an integral part of this statement.
| 16 | Columbia Greater China Fund | Annual Report 2018 |
Statement of Changes in Net Assets (continued)
| | Year Ended | Year Ended |
| | August 31, 2018 | August 31, 2017 (a) |
| | Shares | Dollars ($) | Shares | Dollars ($) |
| Capital stock activity |
| Class A | | | | |
| Subscriptions | 488,536 | 25,350,672 | 203,068 | 7,926,928 |
| Distributions reinvested | 25,274 | 1,257,391 | — | — |
| Redemptions | (460,353) | (23,554,912) | (365,483) | (13,326,272) |
| Net increase (decrease) | 53,457 | 3,053,151 | (162,415) | (5,399,344) |
| Advisor Class | | | | |
| Subscriptions | 49,981 | 2,825,421 | 18,167 | 756,460 |
| Distributions reinvested | 464 | 25,473 | — | — |
| Redemptions | (75,925) | (4,056,287) | (45,415) | (2,025,325) |
| Net decrease | (25,480) | (1,205,393) | (27,248) | (1,268,865) |
| Class B | | | | |
| Redemptions | — | — | (10,038) | (338,805) |
| Net decrease | — | — | (10,038) | (338,805) |
| Class C | | | | |
| Subscriptions | 67,512 | 3,183,493 | 6,032 | 216,566 |
| Distributions reinvested | 2,943 | 135,746 | — | — |
| Redemptions | (158,393) | (7,532,398) | (123,717) | (4,311,208) |
| Net decrease | (87,938) | (4,213,159) | (117,685) | (4,094,642) |
| Class I | | | | |
| Redemptions | — | — | (54) | (2,196) |
| Net decrease | — | — | (54) | (2,196) |
| Institutional Class | | | | |
| Subscriptions | 438,459 | 24,336,834 | 274,905 | 11,344,693 |
| Distributions reinvested | 11,538 | 622,116 | — | — |
| Redemptions | (395,992) | (21,306,306) | (558,474) | (22,965,000) |
| Net increase (decrease) | 54,005 | 3,652,644 | (283,569) | (11,620,307) |
| Institutional 2 Class | | | | |
| Subscriptions | 62,028 | 3,525,467 | 11,303 | 467,972 |
| Distributions reinvested | 761 | 41,868 | — | — |
| Redemptions | (36,118) | (2,069,011) | (16,140) | (676,446) |
| Net increase (decrease) | 26,671 | 1,498,324 | (4,837) | (208,474) |
| Institutional 3 Class | | | | |
| Subscriptions | 46,467 | 2,552,658 | 105,498 | 4,999,018 |
| Distributions reinvested | 263 | 14,088 | — | — |
| Redemptions | (57,187) | (3,188,469) | (1,690) | (82,974) |
| Net increase (decrease) | (10,457) | (621,723) | 103,808 | 4,916,044 |
| Total net increase (decrease) | 10,258 | 2,163,844 | (502,038) | (18,016,589) |
| (a) | Institutional 3 Class shares are based on operations from March 1, 2017 (commencement of operations) through the stated period end. |
The accompanying Notes to Financial Statements are an integral part of this statement.
Columbia Greater China Fund | Annual Report 2018
| 17 |
The following table is intended to help you understand the Fund’s financial performance. Certain information reflects financial results for a single share of a class held for the periods shown. Per share net investment income (loss) amounts are calculated based on average shares outstanding during the period. Total return assumes reinvestment of all dividends and distributions, if any. Total return does not reflect payment of sales charges, if any. Total return and portfolio turnover are not annualized for periods of less than one year. The portfolio turnover rate is calculated without regard to purchase and sales transactions of short-term instruments and certain derivatives, if any. If such transactions were included, the Fund’s portfolio turnover rate may be higher.
| | Net asset value,
beginning of
period | Net
investment
income
(loss) | Net
realized
and
unrealized
gain (loss) | Increase
from payment
by affiliate | Total from
investment
operations | Distributions
from net
investment
income | Distributions
from net
realized
gains | Total
distributions to
shareholders |
| Class A |
| Year Ended 8/31/2018 | $45.67 | (0.10) | 2.62 | — | 2.52 | (0.28) | (0.66) | (0.94) |
| Year Ended 8/31/2017 | $35.20 | 0.06 | 10.41 | — | 10.47 | — | — | — |
| Year Ended 8/31/2016 | $33.33 | (0.04) | 3.66 | — | 3.62 | (0.05) | (1.70) | (1.75) |
| Year Ended 8/31/2015 | $45.93 | 0.02 | (3.87) | 0.15 | (3.70) | (0.30) | (8.60) | (8.90) |
| Year Ended 8/31/2014 | $48.80 | 0.33 | 8.97 | — | 9.30 | (0.81) | (11.36) | (12.17) |
| Advisor Class |
| Year Ended 8/31/2018 | $50.38 | 0.12 | 2.80 | — | 2.92 | (0.39) | (0.66) | (1.05) |
| Year Ended 8/31/2017 | $38.74 | 0.18 | 11.46 | — | 11.64 | — | — | — |
| Year Ended 8/31/2016 | $36.53 | 0.11 | 3.96 | — | 4.07 | (0.16) | (1.70) | (1.86) |
| Year Ended 8/31/2015 | $49.47 | 1.09 | (5.18) | 0.16 | (3.93) | (0.41) | (8.60) | (9.01) |
| Year Ended 8/31/2014 | $51.71 | (0.01) | 10.04 | — | 10.03 | (0.91) | (11.36) | (12.27) |
| Class C |
| Year Ended 8/31/2018 | $42.24 | (0.43) | 2.42 | — | 1.99 | — | (0.66) | (0.66) |
| Year Ended 8/31/2017 | $32.81 | (0.24) | 9.67 | — | 9.43 | — | — | — |
| Year Ended 8/31/2016 | $31.35 | (0.22) | 3.38 | — | 3.16 | — | (1.70) | (1.70) |
| Year Ended 8/31/2015 | $43.71 | (0.28) | (3.62) | 0.14 | (3.76) | — | (8.60) | (8.60) |
| Year Ended 8/31/2014 | $46.94 | (0.02) | 8.60 | — | 8.58 | (0.45) | (11.36) | (11.81) |
| Institutional Class |
| Year Ended 8/31/2018 | $49.49 | 0.03 | 2.83 | — | 2.86 | (0.39) | (0.66) | (1.05) |
| Year Ended 8/31/2017 | $38.05 | 0.17 | 11.27 | — | 11.44 | — | — | — |
| Year Ended 8/31/2016 | $35.91 | 0.12 | 3.87 | — | 3.99 | (0.15) | (1.70) | (1.85) |
| Year Ended 8/31/2015 | $48.78 | 0.38 | (4.39) | 0.16 | (3.85) | (0.42) | (8.60) | (9.02) |
| Year Ended 8/31/2014 | $51.16 | 0.46 | 9.45 | — | 9.91 | (0.93) | (11.36) | (12.29) |
| Institutional 2 Class |
| Year Ended 8/31/2018 | $50.52 | 0.11 | 2.84 | — | 2.95 | (0.43) | (0.66) | (1.09) |
| Year Ended 8/31/2017 | $38.80 | 0.22 | 11.50 | — | 11.72 | — | — | — |
| Year Ended 8/31/2016 | $36.58 | 0.24 | 3.90 | — | 4.14 | (0.22) | (1.70) | (1.92) |
| Year Ended 8/31/2015 | $49.52 | 0.52 | (4.54) | 0.16 | (3.86) | (0.48) | (8.60) | (9.08) |
| Year Ended 8/31/2014 | $51.76 | 0.73 | 9.38 | — | 10.11 | (0.99) | (11.36) | (12.35) |
| Institutional 3 Class |
| Year Ended 8/31/2018 | $49.25 | 0.09 | 2.83 | — | 2.92 | (0.43) | (0.66) | (1.09) |
| Year Ended 8/31/2017(g) | $38.50 | 0.22 | 10.53 | — | 10.75 | — | — | — |
The accompanying Notes to Financial Statements are an integral part of this statement.
| 18 | Columbia Greater China Fund | Annual Report 2018 |
Financial Highlights (continued)
| | Net
asset
value,
end of
period | Total
return | Total gross
expense
ratio to
average
net assets(a) | Total net
expense
ratio to
average
net assets(a),(b) | Net investment
income (loss)
ratio to
average
net assets | Portfolio
turnover | Net
assets,
end of
period
(000’s) |
| Class A |
| Year Ended 8/31/2018 | $47.25 | 5.41% | 1.51% (c) | 1.51% (c),(d) | (0.20%) | 26% | $73,210 |
| Year Ended 8/31/2017 | $45.67 | 29.74% | 1.55% (e) | 1.55% (d),(e) | 0.17% | 35% | $68,323 |
| Year Ended 8/31/2016 | $35.20 | 10.97% | 1.60% (c) | 1.60% (c),(d) | (0.11%) | 39% | $58,385 |
| Year Ended 8/31/2015 | $33.33 | (9.49%) (f) | 1.56% (c) | 1.56% (c),(d) | 0.04% | 74% | $63,284 |
| Year Ended 8/31/2014 | $45.93 | 21.22% | 1.57% (c) | 1.57% (c),(d) | 0.73% | 61% | $97,302 |
| Advisor Class |
| Year Ended 8/31/2018 | $52.25 | 5.69% | 1.26% (c) | 1.26% (c),(d) | 0.22% | 26% | $2,008 |
| Year Ended 8/31/2017 | $50.38 | 30.05% | 1.30% (e) | 1.30% (d),(e) | 0.43% | 35% | $3,220 |
| Year Ended 8/31/2016 | $38.74 | 11.27% | 1.36% (c) | 1.36% (c),(d) | 0.30% | 39% | $3,532 |
| Year Ended 8/31/2015 | $36.53 | (9.26%) (f) | 1.29% (c) | 1.29% (c),(d) | 2.47% | 74% | $2,473 |
| Year Ended 8/31/2014 | $49.47 | 21.50% | 1.33% (c) | 1.33% (c),(d) | (0.03%) | 61% | $8 |
| Class C |
| Year Ended 8/31/2018 | $43.57 | 4.63% | 2.26% (c) | 2.26% (c),(d) | (0.90%) | 26% | $5,585 |
| Year Ended 8/31/2017 | $42.24 | 28.74% | 2.29% (e) | 2.29% (d),(e) | (0.70%) | 35% | $9,130 |
| Year Ended 8/31/2016 | $32.81 | 10.15% | 2.36% (c) | 2.36% (c),(d) | (0.71%) | 39% | $10,952 |
| Year Ended 8/31/2015 | $31.35 | (10.16%) (f) | 2.32% (c) | 2.32% (c),(d) | (0.71%) | 74% | $12,103 |
| Year Ended 8/31/2014 | $43.71 | 20.32% | 2.32% (c) | 2.32% (c),(d) | (0.05%) | 61% | $15,851 |
| Institutional Class |
| Year Ended 8/31/2018 | $51.30 | 5.68% | 1.26% (c) | 1.26% (c),(d) | 0.05% | 26% | $42,542 |
| Year Ended 8/31/2017 | $49.49 | 30.07% | 1.29% (e) | 1.29% (d),(e) | 0.43% | 35% | $38,369 |
| Year Ended 8/31/2016 | $38.05 | 11.24% | 1.35% (c) | 1.35% (c),(d) | 0.34% | 39% | $40,293 |
| Year Ended 8/31/2015 | $35.91 | (9.24%) (f) | 1.31% (c) | 1.31% (c),(d) | 0.86% | 74% | $49,047 |
| Year Ended 8/31/2014 | $48.78 | 21.49% | 1.32% (c) | 1.32% (c),(d) | 0.96% | 61% | $29,730 |
| Institutional 2 Class |
| Year Ended 8/31/2018 | $52.38 | 5.73% | 1.18% (c) | 1.18% (c) | 0.19% | 26% | $2,330 |
| Year Ended 8/31/2017 | $50.52 | 30.21% | 1.18% (e) | 1.18% (e) | 0.54% | 35% | $900 |
| Year Ended 8/31/2016 | $38.80 | 11.44% | 1.21% (c) | 1.21% (c) | 0.66% | 39% | $879 |
| Year Ended 8/31/2015 | $36.58 | (9.11%) (f) | 1.16% (c) | 1.16% (c) | 1.17% | 74% | $438 |
| Year Ended 8/31/2014 | $49.52 | 21.67% | 1.19% (c) | 1.19% (c) | 1.58% | 61% | $117 |
| Institutional 3 Class |
| Year Ended 8/31/2018 | $51.08 | 5.82% | 1.13% (c) | 1.13% (c) | 0.17% | 26% | $4,768 |
| Year Ended 8/31/2017(g) | $49.25 | 27.92% | 1.22% (h) | 1.22% (h) | 1.45% (h) | 35% | $5,112 |
The accompanying Notes to Financial Statements are an integral part of this statement.
Columbia Greater China Fund | Annual Report 2018
| 19 |
Financial Highlights (continued)
| | Net asset value,
beginning of
period | Net
investment
income
(loss) | Net
realized
and
unrealized
gain (loss) | Increase
from payment
by affiliate | Total from
investment
operations | Distributions
from net
investment
income | Distributions
from net
realized
gains | Total
distributions to
shareholders |
| Class T |
| Year Ended 8/31/2018 | $45.65 | (0.09) | 2.62 | — | 2.53 | (0.28) | (0.66) | (0.94) |
| Year Ended 8/31/2017 | $35.20 | 0.07 | 10.38 | — | 10.45 | — | — | — |
| Year Ended 8/31/2016 | $33.33 | 0.01 | 3.61 | — | 3.62 | (0.05) | (1.70) | (1.75) |
| Year Ended 8/31/2015 | $45.95 | 0.01 | (3.86) | 0.15 | (3.70) | (0.32) | (8.60) | (8.92) |
| Year Ended 8/31/2014 | $48.82 | 0.36 | 8.96 | — | 9.32 | (0.83) | (11.36) | (12.19) |
| Notes to Financial Highlights |
| (a) | In addition to the fees and expenses that the Fund bears directly, the Fund indirectly bears a pro rata share of the fees and expenses of any other funds in which it invests. Such indirect expenses are not included in the Fund’s reported expense ratios. |
| (b) | Total net expenses include the impact of certain fee waivers/expense reimbursements made by the Investment Manager and certain of its affiliates, if applicable. |
| (c) | Ratios include line of credit interest expense which is less than 0.01%. |
| (d) | The benefits derived from expense reductions had an impact of less than 0.01%. |
| (e) | Expenses have been reduced due to a reimbursement of expenses overbilled by a third party. If the reimbursement had been excluded, the expense ratios would have been higher by the percentages shown for each class in the table below. All fee waivers and expense reimbursements by the Investment Manager and its affiliates were applied before giving effect to this third party reimbursement. |
| Year Ended | Class A | Advisor
Class | Class C | Institutional
Class | Institutional 2
Class | Class T |
| 08/31/2017 | 0.06 % | 0.05 % | 0.06 % | 0.06 % | 0.06 % | 0.05 % |
| (f) | The Fund received a payment from an affiliate. Had the Fund not received this payment, the total return would have been lower by 0.33%. |
| (g) | Institutional 3 Class shares commenced operations on March 1, 2017. Per share data and total return reflect activity from that date. |
| (h) | Annualized. |
The accompanying Notes to Financial Statements are an integral part of this statement.
| 20 | Columbia Greater China Fund | Annual Report 2018 |
Financial Highlights (continued)
| | Net
asset
value,
end of
period | Total
return | Total gross
expense
ratio to
average
net assets(a) | Total net
expense
ratio to
average
net assets(a),(b) | Net investment
income (loss)
ratio to
average
net assets | Portfolio
turnover | Net
assets,
end of
period
(000’s) |
| Class T |
| Year Ended 8/31/2018 | $47.24 | 5.43% | 1.48% (c) | 1.48% (c),(d) | (0.17%) | 26% | $3 |
| Year Ended 8/31/2017 | $45.65 | 29.69% | 1.56% (e) | 1.56% (d),(e) | 0.18% | 35% | $3 |
| Year Ended 8/31/2016 | $35.20 | 10.97% | 1.60% (c) | 1.60% (c),(d) | 0.06% | 39% | $2 |
| Year Ended 8/31/2015 | $33.33 | (9.48%) (f) | 1.56% (c) | 1.56% (c),(d) | 0.01% | 74% | $2 |
| Year Ended 8/31/2014 | $45.95 | 21.27% | 1.52% (c) | 1.52% (c),(d) | 0.78% | 61% | $3 |
The accompanying Notes to Financial Statements are an integral part of this statement.
Columbia Greater China Fund | Annual Report 2018
| 21 |
Notes to Financial Statements
August 31, 2018
Note 1. Organization
Columbia Greater China Fund (the Fund), a series of Columbia Funds Series Trust I (the Trust), is a non-diversified fund. The Trust is registered under the Investment Company Act of 1940, as amended (the 1940 Act), as an open-end management investment company organized as a Massachusetts business trust.
Fund shares
The Trust may issue an unlimited number of shares (without par value). Although all share classes generally have identical voting, dividend and liquidation rights, each share class votes separately when required by the Trust’s organizational documents or by law. Different share classes pay different distribution amounts to the extent the expenses of such share classes differ, and distributions in liquidation will be proportional to the net asset value of each share class. Each share class has its own expense and sales charge structure. The Fund offers each of the share classes identified below.
Class A shares are subject to a maximum front-end sales charge of 5.75% based on the initial investment amount. Class A shares purchased without an initial sales charge in accounts aggregating $1 million to $50 million at the time of purchase are subject to a contingent deferred sales charge (CDSC) if the shares are sold within 18 months after purchase, charged as follows: 1.00% CDSC if redeemed within 12 months after purchase, and 0.50% CDSC if redeemed more than 12, but less than 18, months after purchase.
Advisor Class shares are not subject to sales charges and are generally available only to omnibus retirement plans and certain investors as described in the Fund’s prospectus. Prior to November 1, 2017, Advisor Class shares were known as Class R4 shares.
Class C shares are subject to a 1.00% CDSC on shares redeemed within 12 months after purchase. Effective July 1, 2018, Class C shares will automatically convert to Class A shares of the same Fund in the month of or the month following the 10-year anniversary of the Class C shares purchase date.
Institutional Class shares are not subject to sales charges and are generally available only to eligible investors, which are subject to different investment minimums as described in the Fund’s prospectus. Prior to November 1, 2017, Institutional Class shares were known as Class Z shares.
Institutional 2 Class shares are not subject to sales charges and are generally available only to investors purchasing through authorized investment professionals and omnibus retirement plans as described in the Fund’s prospectus. Prior to November 1, 2017, Institutional 2 Class shares were known as Class R5 shares.
Institutional 3 Class shares are not subject to sales charges and are available to institutional and certain other investors as described in the Fund’s prospectus. Prior to November 1, 2017, Institutional 3 Class shares were known as Class Y shares.
Class T shares are subject to a maximum front-end sales charge of 2.50% per transaction and must be purchased through financial intermediaries that, by written agreement with Columbia Management Investment Distributors, Inc., are specifically authorized to sell Class T shares.
Note 2. Summary of significant accounting policies
Basis of preparation
The Fund is an investment company that applies the accounting and reporting guidance in the Financial Accounting Standards Board (FASB) Accounting Standards Codification Topic 946, Financial Services - Investment Companies (ASC 946). The financial statements are prepared in accordance with U.S. generally accepted accounting principles (GAAP), which requires management to make certain estimates and assumptions that affect the reported amounts of assets and liabilities, the disclosure of contingent assets and liabilities at the date of the financial statements and the reported amounts of income and expenses during the reporting period. Actual results could differ from those estimates.
The following is a summary of significant accounting policies followed by the Fund in the preparation of its financial statements.
| 22 | Columbia Greater China Fund | Annual Report 2018 |
Notes to Financial Statements (continued)
August 31, 2018
Security valuation
All equity securities are valued at the close of business of the New York Stock Exchange. Equity securities are valued at the last quoted sales price on the principal exchange or market on which they trade, except for securities traded on the NASDAQ Stock Market, which are valued at the NASDAQ official close price. Unlisted securities or listed securities for which there were no sales during the day are valued at the mean of the latest quoted bid and ask prices on such exchanges or markets.
Foreign equity securities are valued based on the closing price on the foreign exchange in which such securities are primarily traded. If any foreign equity security closing prices are not readily available, the securities are valued at the mean of the latest quoted bid and ask prices on such exchanges or markets. Foreign currency exchange rates are generally determined at 4:00 p.m. Eastern (U.S.) time. Many securities markets and exchanges outside the U.S. close prior to the close of the New York Stock Exchange; therefore, the closing prices for securities in such markets or on such exchanges may not fully reflect events that occur after such close but before the close of the New York Stock Exchange. In those situations, foreign securities will be fair valued pursuant to a policy adopted by the Board of Trustees, including, if available, utilizing a third party pricing service to determine these fair values. The third party pricing service takes into account multiple factors, including, but not limited to, movements in the U.S. securities markets, certain depositary receipts, futures contracts and foreign exchange rates that have occurred subsequent to the close of the foreign exchange or market, to determine a good faith estimate that reasonably reflects the current market conditions as of the close of the New York Stock Exchange. The fair value of a security is likely to be different from the quoted or published price, if available.
Investments in open-end investment companies, including money market funds, are valued at their latest net asset value.
Investments for which market quotations are not readily available, or that have quotations which management believes are not reflective of market value or reliable, are valued at fair value as determined in good faith under procedures approved by and under the general supervision of the Board of Trustees. If a security or class of securities (such as foreign securities) is valued at fair value, such value is likely to be different from the quoted or published price for the security.
The determination of fair value often requires significant judgment. To determine fair value, management may use assumptions including but not limited to future cash flows and estimated risk premiums. Multiple inputs from various sources may be used to determine fair value.
GAAP requires disclosure regarding the inputs and valuation techniques used to measure fair value and any changes in valuation inputs or techniques. In addition, investments shall be disclosed by major category. This information is disclosed following the Fund’s Portfolio of Investments.
Foreign currency transactions and translations
The values of all assets and liabilities denominated in foreign currencies are generally translated into U.S. dollars at exchange rates determined at the close of regular trading on the New York Stock Exchange. Net realized and unrealized gains (losses) on foreign currency transactions and translations include gains (losses) arising from the fluctuation in exchange rates between trade and settlement dates on securities transactions, gains (losses) arising from the disposition of foreign currency and currency gains (losses) between the accrual and payment dates on dividends, interest income and foreign withholding taxes.
For financial statement purposes, the Fund does not distinguish that portion of gains (losses) on investments which is due to changes in foreign exchange rates from that which is due to changes in market prices of the investments. Such fluctuations are included with the net realized and unrealized gains (losses) on investments in the Statement of Operations.
Security transactions
Security transactions are accounted for on the trade date. Cost is determined and gains (losses) are based upon the specific identification method for both financial statement and federal income tax purposes.
Income recognition
Corporate actions and dividend income are generally recorded net of any non-reclaimable tax withholdings, on the ex-dividend date or upon receipt of ex-dividend notification in the case of certain foreign securities.
Columbia Greater China Fund | Annual Report 2018
| 23 |
Notes to Financial Statements (continued)
August 31, 2018
Awards from class action litigation are recorded as a reduction of cost basis if the Fund still owns the applicable securities on the payment date. If the Fund no longer owns the applicable securities, the proceeds are recorded as realized gains.
Expenses
General expenses of the Trust are allocated to the Fund and other funds of the Trust based upon relative net assets or other expense allocation methodologies determined by the nature of the expense. Expenses directly attributable to the Fund are charged to the Fund. Expenses directly attributable to a specific class of shares are charged to that share class.
Determination of class net asset value
All income, expenses (other than class-specific expenses, which are charged to that share class, as shown in the Statement of Operations) and realized and unrealized gains (losses) are allocated to each class of the Fund on a daily basis, based on the relative net assets of each class, for purposes of determining the net asset value of each class.
Federal income tax status
The Fund intends to qualify each year as a regulated investment company under Subchapter M of the Internal Revenue Code, as amended, and will distribute substantially all of its investment company taxable income and net capital gain, if any, for its tax year, and as such will not be subject to federal income taxes. In addition, the Fund intends to distribute in each calendar year substantially all of its ordinary income, capital gain net income and certain other amounts, if any, such that the Fund should not be subject to federal excise tax. Therefore, no federal income or excise tax provision is recorded.
Foreign taxes
The Fund may be subject to foreign taxes on income, gains on investments or currency repatriation, a portion of which may be recoverable. The Fund will accrue such taxes and recoveries, as applicable, based upon its current interpretation of tax rules and regulations that exist in the markets in which it invests.
Realized gains in certain countries may be subject to foreign taxes at the Fund level, based on statutory rates. The Fund accrues for such foreign taxes on realized and unrealized gains at the appropriate rate for each jurisdiction, as applicable. The amount, if any, is disclosed as a liability on the Statement of Assets and Liabilities.
Distributions to shareholders
Distributions from net investment income, if any, are declared and paid annually. Net realized capital gains, if any, are distributed at least annually. Income distributions and capital gain distributions are determined in accordance with federal income tax regulations, which may differ from GAAP.
Guarantees and indemnifications
Under the Trust’s organizational documents and, in some cases, by contract, its officers and trustees are indemnified against certain liabilities arising out of the performance of their duties to the Trust or its funds. In addition, certain of the Fund’s contracts with its service providers contain general indemnification clauses. The Fund’s maximum exposure under these arrangements is unknown since the amount of any future claims that may be made against the Fund cannot be determined, and the Fund has no historical basis for predicting the likelihood of any such claims.
Recent accounting pronouncement
Accounting Standards Update 2017-08 Premium Amortization on Purchased Callable Debt Securities
In March 2017, the Financial Accounting Standards Board issued Accounting Standards Update (ASU) No. 2017-08 Premium Amortization on Purchased Callable Debt Securities. ASU No. 2017-08 updates the accounting standards to shorten the amortization period for certain purchased callable debt securities, held at a premium, to be amortized to the earliest call date. The update applies to securities with explicit, noncontingent call features that are callable at fixed prices and on preset dates. The standard is effective for annual periods beginning after December 15, 2018 and interim periods within those fiscal years. At this time, management is evaluating the implication of this guidance and the impact it will have on the financial statement amounts and footnote disclosures, if any.
| 24 | Columbia Greater China Fund | Annual Report 2018 |
Notes to Financial Statements (continued)
August 31, 2018
Note 3. Fees and other transactions with affiliates
Management services fees
The Fund has entered into a Management Agreement with Columbia Management Investment Advisers, LLC (the Investment Manager), a wholly-owned subsidiary of Ameriprise Financial, Inc. (Ameriprise Financial). Under the Management Agreement, the Investment Manager provides the Fund with investment research and advice, as well as administrative and accounting services. The management services fee is an annual fee that is equal to a percentage of the Fund’s daily net assets that declines from 0.95% to 0.72% as the Fund’s net assets increase. The effective management services fee rate for the year ended August 31, 2018 was 0.95% of the Fund’s average daily net assets.
Compensation of board members
Members of the Board of Trustees who are not officers or employees of the Investment Manager or Ameriprise Financial are compensated for their services to the Fund as disclosed in the Statement of Operations. These members of the Board of Trustees may participate in a Deferred Compensation Plan (the Plan) which may be terminated at any time. Obligations of the Plan will be paid solely out of the Fund’s assets, and all amounts payable under the Plan constitute a general unsecured obligation of the Fund.
Compensation of Chief Compliance Officer
The Board of Trustees has appointed a Chief Compliance Officer to the Fund in accordance with federal securities regulations. As disclosed in the Statement of Operations, a portion of the Chief Compliance Officer’s total compensation is allocated to the Fund, along with other allocations to affiliated funds governed by the Board of Trustees, based on relative net assets.
Transfer agency fees
Under a Transfer and Dividend Disbursing Agent Agreement, Columbia Management Investment Services Corp. (the Transfer Agent), an affiliate of the Investment Manager and a wholly-owned subsidiary of Ameriprise Financial, is responsible for providing transfer agency services to the Fund. The Transfer Agent has contracted with DST Asset Manager Solutions, Inc. (DST) to serve as sub-transfer agent. The Transfer Agent pays the fees of DST for services as sub-transfer agent and DST is not entitled to reimbursement for such fees from the Fund (with the exception of out-of-pocket fees).
The Fund pays the Transfer Agent a monthly transfer agency fee based on the number or the average value of accounts, depending on the type of account. In addition, the Fund pays the Transfer Agent a fee for shareholder services based on the number of accounts or on a percentage of the average aggregate value of the Fund’s shares maintained in omnibus accounts up to the lesser of the amount charged by the financial intermediary or a cap established by the Board of Trustees from time to time.
The Transfer Agent also receives compensation from the Fund for various shareholder services and reimbursements for certain out-of-pocket fees. Total transfer agency fees for Institutional 2 Class and Institutional 3 Class shares are subject to an annual limitation of not more than 0.07% and 0.02%, respectively, of the average daily net assets attributable to each share class.
For the year ended August 31, 2018, the Fund’s effective transfer agency fee rates as a percentage of average daily net assets of each class were as follows:
| | Effective rate (%) |
| Class A | 0.14 |
| Advisor Class | 0.14 |
| Class C | 0.14 |
| Institutional Class | 0.14 |
| Institutional 2 Class | 0.06 |
| Institutional 3 Class | 0.01 |
| Class T | 0.14 |
Columbia Greater China Fund | Annual Report 2018
| 25 |
Notes to Financial Statements (continued)
August 31, 2018
An annual minimum account balance fee of $20 may apply to certain accounts with a value below the applicable share class’s initial minimum investment requirements to reduce the impact of small accounts on transfer agency fees. These minimum account balance fees are remitted to the Fund and recorded as part of expense reductions in the Statement of Operations. For the year ended August 31, 2018, these minimum account balance fees reduced total expenses of the Fund by $360.
Distribution and service fees
The Fund has entered into an agreement with Columbia Management Investment Distributors, Inc. (the Distributor), an affiliate of the Investment Manager and a wholly-owned subsidiary of Ameriprise Financial, for distribution and shareholder services. The Board of Trustees has approved, and the Fund has adopted, distribution and shareholder service plans (the Plans) applicable to certain share classes, which set the distribution and service fees for the Fund. These fees are calculated daily and are intended to compensate the Distributor and/or eligible selling and/or servicing agents for selling shares of the Fund and providing services to investors.
Under the Plans, the Fund pays a monthly service fee to the Distributor at the maximum annual rate of 0.25% of the average daily net assets attributable to Class A, Class C and Class T shares of the Fund. Also under the Plans, the Fund pays a monthly distribution fee to the Distributor at the maximum annual rates of 0.75% and 0.25% of the average daily net assets attributable to Class C and Class T shares of the Fund, respectively.
Although the Fund may pay a distribution fee up to 0.25% of the Fund’s average daily net assets attributable to Class T shares and a service fee of up to 0.25% of the Fund’s average daily net assets attributable to Class T shares, the aggregate fee shall not exceed 0.25% of the Fund’s average daily net assets attributable to Class T shares.
Sales charges (unaudited)
Sales charges, including front-end charges and CDSCs, received by the Distributor for distributing Fund shares for the year ended August 31, 2018, if any, are listed below:
| | Amount ($) |
| Class A | 160,529 |
| Class C | 2,419 |
Expenses waived/reimbursed by the Investment Manager and its affiliates
The Investment Manager and certain of its affiliates have contractually agreed to waive fees and/or reimburse expenses (excluding certain fees and expenses described below) for the period(s) disclosed below, unless sooner terminated at the sole discretion of the Board of Trustees, so that the Fund’s net operating expenses, after giving effect to fees waived/expenses reimbursed and any balance credits and/or overdraft charges from the Fund’s custodian, do not exceed the following annual rate(s) as a percentage of the class’ average daily net assets:
| | January 1, 2018
through
December 31, 2018 | Prior to
January 1, 2018 |
| Class A | 1.86% | 1.86% |
| Advisor Class | 1.61 | 1.61 |
| Class C | 2.61 | 2.61 |
| Institutional Class | 1.61 | 1.61 |
| Institutional 2 Class | 1.54 | 1.525 |
| Institutional 3 Class | 1.48 | 1.475 |
| Class T | 1.86 | 1.86 |
Under the agreement governing these fee waivers and/or expense reimbursement arrangements, the following fees and expenses are excluded from the waiver/reimbursement commitment, and therefore will be paid by the Fund, if applicable: taxes (including foreign transaction taxes), expenses associated with investments in affiliated and non-affiliated pooled investment vehicles (including mutual funds and exchange-traded funds), transaction costs and brokerage
| 26 | Columbia Greater China Fund | Annual Report 2018 |
Notes to Financial Statements (continued)
August 31, 2018
commissions, costs related to any securities lending program, dividend expenses associated with securities sold short, inverse floater program fees and expenses, transaction charges and interest on borrowed money, interest, infrequent and/or unusual expenses and any other expenses the exclusion of which is specifically approved by the Board of Trustees. This agreement may be modified or amended only with approval from the Investment Manager, certain of its affiliates and the Fund. Any fees waived and/or expenses reimbursed under the expense reimbursement arrangements described above are not recoverable by the Investment Manager or its affiliates in future periods.
Note 4. Federal tax information
The timing and character of income and capital gain distributions are determined in accordance with income tax regulations, which may differ from GAAP because of temporary or permanent book to tax differences.
At August 31, 2018, these differences were primarily due to differing treatment for deferral/reversal of wash sale losses, late-year ordinary losses, trustees’ deferred compensation, foreign currency transactions and earnings and profits distributed to shareholders on the redemption of shares. To the extent these differences were permanent, reclassifications were made among the components of the Fund’s net assets in the Statement of Assets and Liabilities. Temporary differences do not require reclassifications.
In the Statement of Assets and Liabilities the following reclassifications were made:
Excess of distributions
over net investment
income ($) | Accumulated
net realized
gain ($) | Paid in
capital ($) |
| (5,209) | (571,020) | 576,229 |
Net investment income (loss) and net realized gains (losses), as disclosed in the Statement of Operations, and net assets were not affected by this reclassification.
The tax character of distributions paid during the years indicated was as follows:
| Year Ended August 31, 2018 | Year Ended August 31, 2017 |
Ordinary
income ($) | Long-term
capital gains ($) | Total ($) | Ordinary
income ($) | Long-term
capital gains ($) | Total ($) |
| 746,093 | 1,695,274 | 2,441,367 | — | — | — |
Short-term capital gain distributions, if any, are considered ordinary income distributions for tax purposes.
At August 31, 2018, the components of distributable earnings on a tax basis were as follows:
Undistributed
ordinary income ($) | Undistributed
long-term
capital gains ($) | Capital loss
carryforwards ($) | Net unrealized
appreciation ($) |
| — | 5,562,283 | — | 56,612,916 |
At August 31, 2018, the cost of all investments for federal income tax purposes along with the aggregate gross unrealized appreciation and depreciation based on that cost was:
Federal
tax cost ($) | Gross unrealized
appreciation ($) | Gross unrealized
(depreciation) ($) | Net unrealized
appreciation ($) |
| 73,665,105 | 61,008,697 | (4,395,781) | 56,612,916 |
Tax cost of investments and unrealized appreciation/(depreciation) may also include timing differences that do not constitute adjustments to tax basis.
The following capital loss carryforwards, determined at August 31, 2018, may be available to reduce taxable income arising from future net realized gains on investments, if any, to the extent permitted by the Internal Revenue Code. Capital loss carryforwards with no expiration are required to be utilized prior to any capital losses which carry an expiration date. As a
Columbia Greater China Fund | Annual Report 2018
| 27 |
Notes to Financial Statements (continued)
August 31, 2018
result of this ordering rule, capital loss carryforwards which carry an expiration date may be more likely to expire unused. In addition, for the year ended August 31, 2018, capital loss carryforwards utilized, expired unused and permanently lost, if any, were as follows:
| 2019 ($) | No expiration
short-term ($) | No expiration
long-term ($) | Total ($) | Utilized ($) | Expired ($) | Permanently
lost ($) |
| — | — | — | — | 1,802,252 | — | — |
Under current tax rules, regulated investment companies can elect to treat certain late-year ordinary losses incurred and post-October capital losses (capital losses realized after October 31) as arising on the first day of the following taxable year. As of August 31, 2018, the Fund will elect to treat the following late-year ordinary losses and post-October capital losses as arising on September 1, 2018.
Late year
ordinary losses ($) | Post-October
capital losses ($) |
| 728,988 | — |
Management of the Fund has concluded that there are no significant uncertain tax positions in the Fund that would require recognition in the financial statements. However, management’s conclusion may be subject to review and adjustment at a later date based on factors including, but not limited to, new tax laws, regulations, and administrative interpretations (including relevant court decisions). Generally, the Fund’s federal tax returns for the prior three fiscal years remain subject to examination by the Internal Revenue Service.
Note 5. Portfolio information
The cost of purchases and proceeds from sales of securities, excluding short-term investments and derivatives, if any, aggregated to $35,501,323 and $40,878,625, respectively, for the year ended August 31, 2018. The amount of purchase and sale activity impacts the portfolio turnover rate reported in the Financial Highlights.
Note 6. Affiliated money market fund
The Fund invests in Columbia Short-Term Cash Fund, an affiliated money market fund established for the exclusive use by the Fund and other affiliated funds (the Affiliated MMF). The income earned by the Fund from such investments is included as Dividends - affiliated issuers in the Statement of Operations. As an investing fund, the Fund indirectly bears its proportionate share of the expenses of the Affiliated MMF. The Affiliated MMF prices its shares with a floating net asset value. In addition, the Board of Trustees of the Affiliated MMF may impose a fee on redemptions (sometimes referred to as a liquidity fee) or temporarily suspend redemptions (sometimes referred to as imposing a redemption gate) in the event its liquidity falls below regulatory limits.
Note 7. Interfund lending
Pursuant to an exemptive order granted by the Securities and Exchange Commission, the Fund participates in a program (the Interfund Program) allowing each participating Columbia Fund (each, a Participating Fund) to lend money directly to and, except for closed-end funds and money market funds, borrow money directly from other Participating Funds for temporary purposes. The amounts eligible for borrowing and lending under the Interfund Program are subject to certain restrictions.
Interfund loans are subject to the risk that the borrowing fund could be unable to repay the loan when due, and a delay in repayment to the lending fund could result in lost opportunities and/or additional lending costs. The exemptive order is subject to conditions intended to mitigate conflicts of interest arising from the Investment Manager’s relationship with each Participating Fund.
The Fund did not borrow or lend money under the Interfund Program during the year ended August 31, 2018.
| 28 | Columbia Greater China Fund | Annual Report 2018 |
Notes to Financial Statements (continued)
August 31, 2018
Note 8. Line of credit
The Fund has access to a revolving credit facility with a syndicate of banks led by Citibank, N.A., HSBC Bank USA, N.A. and JPMorgan Chase Bank, N.A. whereby the Fund may borrow for the temporary funding of shareholder redemptions or for other temporary or emergency purposes. The credit facility, which is a collective agreement between the Fund and certain other funds managed by the Investment Manager, severally and not jointly, permits collective borrowings up to $1 billion. Interest is charged to each participating fund based on its borrowings at a rate equal to the higher of (i) the overnight federal funds rate plus 1.00% or (ii) the one-month LIBOR rate plus 1.00%. Each borrowing under the credit facility matures no later than 60 days after the date of borrowing. The Fund also pays a commitment fee equal to its pro rata share of the amount of the credit facility at a rate of 0.15% per annum. The commitment fee is included in other expenses in the Statement of Operations. This agreement expires annually in December unless extended or renewed.
For the year ended August 31, 2018, the Fund’s borrowing activity was as follows:
Average loan
balance ($) | Weighted average
interest rate (%) | Days
outstanding |
| 5,900,000 | 2.24 | 4 |
Interest expense incurred by the Fund is recorded as a line of credit interest expense in the Statement of Operations. The Fund had no outstanding borrowings at August 31, 2018.
Note 9. Significant risks
Foreign securities and emerging market countries risk
Investing in foreign securities may include certain risks and considerations not typically associated with investing in U.S. securities, such as fluctuating currency values and changing local and regional economic, political and social conditions, which may result in greater market volatility. In addition, certain foreign securities may not be as liquid as U.S. securities. Investing in emerging markets may accentuate these risks. These countries are also more likely to experience high levels of inflation, deflation or currency devaluation which could hurt their economies and securities markets. To the extent that the Fund concentrates its investment exposure to any one or a few specific countries, the Fund will be particularly susceptible to the various conditions, events or other factors impacting those countries and may, therefore, have a greater risk than that of a fund which is more geographically diversified.
Geographic concentration risk
The Fund may be particularly susceptible to economic, political, regulatory or other events or conditions affecting issuers and countries within the specific geographic regions in which the Fund invests. Currency devaluations could occur in countries that have not yet experienced currency devaluation to date, or could continue to occur in countries that have already experienced such devaluations. The Fund’s NAV may be more volatile than the NAV of a more geographically diversified fund.
Non-diversification risk
A non-diversified fund is permitted to invest a greater percentage of its total assets in fewer issuers than a diversified fund. The Fund may, therefore, have a greater risk of loss from a few issuers than a similar fund that invests more broadly.
Shareholder concentration risk
At August 31, 2018, two unaffiliated shareholders of record owned 21.7% of the outstanding shares of the Fund in one or more accounts. The Fund has no knowledge about whether any portion of those shares was owned beneficially. Affiliated shareholders of record owned 4.7% of the outstanding shares of the Fund in one or more accounts. Subscription and redemption activity by concentrated accounts may have a significant effect on the operations of the Fund. In the case of a large redemption, the Fund may be forced to sell investments at inopportune times, including its liquid positions, which may result in Fund losses and the Fund holding a higher percentage of less liquid positions. Large redemptions could result in decreased economies of scale and increased operating expenses for non-redeeming Fund shareholders.
Columbia Greater China Fund | Annual Report 2018
| 29 |
Notes to Financial Statements (continued)
August 31, 2018
Technology and technology-related investment risk
The Fund may be more susceptible to the particular risks that may affect companies in the information technology sector, as well as other technology-related sectors (collectively, the technology sectors) than if it were invested in a wider variety of companies in unrelated sectors. Companies in the technology sectors are subject to certain risks, including the risk that new services, equipment or technologies will not be accepted by consumers and businesses or will become rapidly obsolete. Performance of such companies may be affected by factors including obtaining and protecting patents (or the failure to do so) and significant competitive pressures, including aggressive pricing of their products or services, new market entrants, competition for market share and short product cycles due to an accelerated rate of technological developments. Such competitive pressures may lead to limited earnings and/or falling profit margins. As a result, the value of their securities may fall or fail to rise. In addition, many technology sector companies have limited operating histories and prices of these companies’ securities historically have been more volatile than other securities, especially over the short term.
Note 10. Subsequent events
Management has evaluated the events and transactions that have occurred through the date the financial statements were issued and noted no items requiring adjustment of the financial statements or additional disclosure.
Note 11. Information regarding pending and settled legal proceedings
Ameriprise Financial and certain of its affiliates have historically been involved in a number of legal, arbitration and regulatory proceedings, including routine litigation, class actions, and governmental actions, concerning matters arising in connection with the conduct of their business activities. Ameriprise Financial believes that the Fund is not currently the subject of, and that neither Ameriprise Financial nor any of its affiliates are the subject of, any pending legal, arbitration or regulatory proceedings that are likely to have a material adverse effect on the Fund or the ability of Ameriprise Financial or its affiliates to perform under their contracts with the Fund. Ameriprise Financial is required to make quarterly (10-Q), annual (10-K) and, as necessary, 8-K filings with the Securities and Exchange Commission (SEC) on legal and regulatory matters that relate to Ameriprise Financial and its affiliates. Copies of these filings may be obtained by accessing the SEC website at www.sec.gov.
There can be no assurance that these matters, or the adverse publicity associated with them, will not result in increased Fund redemptions, reduced sale of Fund shares or other adverse consequences to the Fund. Further, although we believe proceedings are not likely to have a material adverse effect on the Fund or the ability of Ameriprise Financial or its affiliates to perform under their contracts with the Fund, these proceedings are subject to uncertainties and, as such, we are unable to estimate the possible loss or range of loss that may result. An adverse outcome in one or more of these proceedings could result in adverse judgments, settlements, fines, penalties or other relief that could have a material adverse effect on the consolidated financial condition or results of operations of Ameriprise Financial.
| 30 | Columbia Greater China Fund | Annual Report 2018 |
Report of Independent Registered Public Accounting Firm
To the Board of Trustees of Columbia Funds Series Trust I and Shareholders of Columbia Greater China Fund
Opinion on the Financial Statements
We have audited the accompanying statement of assets and liabilities, including the portfolio of investments, of Columbia Greater China Fund (one of the funds constituting Columbia Funds Series Trust I, hereafter referred to as the “Fund”) as of August 31, 2018, the related statement of operations for the year ended August 31, 2018, the statement of changes in net assets for each of the two years in the period ended August 31, 2018, including the related notes, and the financial highlights for each of the five years in the period ended August 31, 2018, (collectively referred to as the “financial statements”). In our opinion, the financial statements present fairly, in all material respects, the financial position of the Fund as of August 31, 2018, the results of its operations for the year then ended, the changes in its net assets for each of the two years in the period ended August 31, 2018 and the financial highlights for each of the five years in the period ended August 31, 2018 in conformity with accounting principles generally accepted in the United States of America.
Basis for Opinion
These financial statements are the responsibility of the Fund’s management. Our responsibility is to express an opinion on the Fund’s financial statements based on our audits. We are a public accounting firm registered with the Public Company Accounting Oversight Board (United States) (“PCAOB”) and are required to be independent with respect to the Fund in accordance with the U.S. federal securities laws and the applicable rules and regulations of the Securities and Exchange Commission and the PCAOB.
We conducted our audits of these financial statements in accordance with the standards of the PCAOB. Those standards require that we plan and perform the audit to obtain reasonable assurance about whether the financial statements are free of material misstatement, whether due to error or fraud.
Our audits included performing procedures to assess the risks of material misstatement of the financial statements, whether due to error or fraud, and performing procedures that respond to those risks. Such procedures included examining, on a test basis, evidence regarding the amounts and disclosures in the financial statements. Our audits also included evaluating the accounting principles used and significant estimates made by management, as well as evaluating the overall presentation of the financial statements. Our procedures included confirmation of securities owned as of August 31, 2018, by correspondence with the custodian and transfer agent. We believe that our audits provide a reasonable basis for our opinion.
/s/PricewaterhouseCoopers LLP
Minneapolis, Minnesota
October 22, 2018
We have served as the auditor of one or more investment companies within the Columbia Funds Complex since 1977.
Columbia Greater China Fund | Annual Report 2018
| 31 |
Federal Income Tax Information
(Unaudited)
The Fund hereby designates the following tax attributes for the fiscal year ended August 31, 2018. Shareholders will be notified in early 2019 of the amounts for use in preparing 2018 income tax returns.
Qualified
dividend
income | Dividends
received
deduction | Capital
gain
dividend | Foreign
taxes paid
to foreign
countries | Foreign
taxes paid
per share
to foreign
countries | Foreign
source
income | Foreign
source
income per
share |
| 100.00% | 1.06% | $8,225,475 | $147,832 | $0.06 | $1,916,352 | $0.71 |
Qualified dividend income. For taxable, non-corporate shareholders, the percentage of ordinary income distributed during the fiscal year that represents qualified dividend income subject to reduced tax rates.
Dividends received deduction. The percentage of ordinary income distributed during the fiscal year that qualifies for the corporate dividends received deduction.
Capital gain dividend. The Fund designates as a capital gain dividend the amount reflected above, or if subsequently determined to be different, the net capital gain of such fiscal period.
Foreign taxes. The Fund makes the election to pass through to shareholders the foreign taxes paid. Eligible shareholders may claim a foreign tax credit. These taxes, and the corresponding foreign source income, are provided.
| 32 | Columbia Greater China Fund | Annual Report 2018 |
Shareholders elect the Board that oversees the Fund’s operations. The Board appoints officers who are responsible for day-to-day business decisions based on policies set by the Board. The following table provides basic biographical information about the Fund’s Trustees, including their principal occupations during the past five years, although specific titles for individuals may have varied over the period. The year set forth beneath Length of Service in the table below is the year in which the Trustee was first appointed or elected as Trustee to any Fund currently in the Columbia Funds Complex or a predecessor thereof. Under current Board policy, members serve terms of indefinite duration.
Independent trustees
| Name, address, year of birth | Position held with the Trust and length of service | Principal occupation(s) during the past five years and other relevant professional experience | Number of Funds in the Columbia Fund Complex overseen | Other directorships held by Trustee during the past five years |
Janet Langford Carrig
c/o Columbia Management
Investment Advisers, LLC
225 Franklin Street
Mail Drop BX32 05228
Boston, MA 02110
1957 | Trustee
1996 | Senior Vice President, General Counsel and Corporate Secretary, ConocoPhillips (independent energy company) since September 2007 | 69 | None |
Douglas A. Hacker
c/o Columbia Management
Investment Advisers, LLC
225 Franklin Street
Mail Drop BX32 05228
Boston, MA 02110
1955 | Trustee and Chairman of the Board
1996 | Independent business executive since May 2006; Executive Vice President — Strategy of United Airlines from December 2002 to May 2006; President of UAL Loyalty Services (airline marketing company) from September 2001 to December 2002; Executive Vice President and Chief Financial Officer of United Airlines from July 1999 to September 2001 | 69 | Spartan Nash Company, (food distributor); Nash Finch Company (food distributor) from 2005 to 2013; Aircastle Limited (aircraft leasing); SeaCube Container Leasing Ltd. (container leasing) from 2010 to 2013; and Travelport Worldwide Limited (travel information technology) |
Nancy T. Lukitsh
c/o Columbia Management
Investment Advisers, LLC
225 Franklin Street
Mail Drop BX32 05228
Boston, MA 02110
1956 | Trustee
2011 | Senior Vice President, Partner and Director of Marketing, Wellington Management Company, LLP (investment adviser) from 1997 to 2010; Chair, Wellington Management Portfolios (commingled non-U.S. investment pools) from 2007 to 2010; Director, Wellington Trust Company, NA and other Wellington affiliates from 1997 to 2010 | 69 | None |
David M. Moffett
c/o Columbia Management
Investment Advisers, LLC
225 Franklin Street
Mail Drop BX32 05228
Boston, MA 02110
1952 | Trustee
2011 | Retired. Consultant to Bridgewater and Associates | 69 | Director, CSX Corporation (transportation suppliers); Genworth Financial, Inc. (financial and insurance products and services); PayPal Holdings Inc. (payment and data processing services); Trustee, University of Oklahoma Foundation; former Director, eBay Inc. (online trading community), 2007-2015; and former Director, CIT Bank, CIT Group Inc. (commercial and consumer finance), 2010-2016 |
Columbia Greater China Fund | Annual Report 2018
| 33 |
TRUSTEES AND OFFICERS (continued)
Independent trustees (continued)
| Name, address, year of birth | Position held with the Trust and length of service | Principal occupation(s) during the past five years and other relevant professional experience | Number of Funds in the Columbia Fund Complex overseen | Other directorships held by Trustee during the past five years |
John J. Neuhauser
c/o Columbia Management
Investment Advisers, LLC
225 Franklin Street
Mail Drop BX32 05228
Boston, MA 02110
1943 | Trustee
1984 | President, Saint Michael’s College since August 2007; Director or Trustee of several non-profit organizations, including University of Vermont Medical Center; Academic Vice President and Dean of Faculties, Boston College from August 1999 to October 2005; University Professor, Boston College from November 2005 to August 2007 | 69 | Liberty All-Star Equity Fund and Liberty All- Star Growth Fund (closed-end funds) |
Patrick J. Simpson
c/o Columbia Management
Investment Advisers, LLC
225 Franklin Street
Mail Drop BX32 05228
Boston, MA 02110
1944 | Trustee
2000 | Of Counsel, Perkins Coie LLP (law firm) since 2015; Partner, Perkins Coie LLP from 1988 to 2014 | 69 | None |
Anne-Lee Verville
c/o Columbia Management
Investment Advisers, LLC
225 Franklin Street
Mail Drop BX32 05228
Boston, MA 02110
1945 | Trustee
1998 | Retired. General Manager, Global Education Industry from 1994 to 1997, President – Application Systems Division from 1991 to 1994, Chief Financial Officer – US Marketing & Services from 1988 to 1991, and Chief Information Officer from 1987 to 1988, IBM Corporation (computer and technology) | 69 | Enesco Group, Inc. (producer of giftware and home and garden decor products) from 2001 to 2006 |
Consultants to the Independent Trustees*
| Name, address, year of birth | Position held with the Trust and length of service | Principal occupation(s) during the past five years and other relevant professional experience | Number of Funds in the Columbia Funds complex overseen | Other directorships held by Trustee during the past five years |
J. Kevin Connaughton
c/o Columbia
Management Investment
Advisers, LLC,
225 Franklin Street
Mail Drop BX32 05228,
Boston, MA 02110
1964 | Independent Trustee Consultant
2016 | Independent Trustee Consultant, Columbia Funds since March 2016; Adjunct Professor of Finance, Bentley University since November 2017; Managing Director and General Manager of Mutual Fund Products, Columbia Management Investment Advisers, LLC from May 2010 to February 2015; President, Columbia Funds from 2009 to 2015; and senior officer of Columbia Funds and affiliated funds from 2003 to 2015 | 69 | Director, The Autism Project since March 2015; former Trustee, New Century Portfolios, March 2015-December 2017; formerly on Board of Governors, Gateway Healthcare, January 2016 – December 2017 |
Natalie A. Trunow
c/o Columbia
Management Investment
Advisers, LLC,
225 Franklin Street
Mail Drop BX32 05228,
Boston, MA 02110
1967 | Independent Trustee Consultant
2016 | Independent Trustee Consultant, Columbia Funds since September 2016; Chief Executive Officer, Millennial Portfolio Solutions LLC (asset management and consulting services) since January 2016; Director of Investments, Casey Family Programs from April 2016 to September 2016; Senior Vice President and Chief Investment Officer, Calvert Investments from August 2008 to January 2016; Section Head and Portfolio Manager, General Motors Asset Management from June 1997 to August 2008 | 69 | Director, Health Services for Children with Special Needs, Inc.; Director, Guidewell Financial Solutions |
| * | J. Kevin Connaughton was appointed consultant to the Independent Trustees effective March 1, 2016. Natalie A. Trunow was appointed consultant to the Independent Trustees effective September 1, 2016. Shareholders of the Funds are expected to be asked to elect each of Mr. Connaughton and Ms. Trunow as a Trustee at a future shareholder meeting. |
| 34 | Columbia Greater China Fund | Annual Report 2018 |
TRUSTEES AND OFFICERS (continued)
Interested trustee affiliated with Investment Manager*
| Name, address, year of birth | Position held with the Trust and length of service | Principal occupation(s) during the past five years and other relevant professional experience | Number of Funds in the Columbia Funds Complex overseen | Other directorships held by Trustee during the past five years |
William F. Truscott
c/o Columbia Management
Investment Advisers, LLC
225 Franklin Street
Boston, MA 02110
1960 | Trustee
2012 | Chairman of the Board and President, Columbia Management Investment Advisers, LLC since May 2010 and February 2012, respectively; Chief Executive Officer, Global Asset Management, Ameriprise Financial, Inc. since September 2012 (previously Chief Executive Officer, U.S. Asset Management & President, Annuities, May 2010-September 2012); Director and Chief Executive Officer, Columbia Management Investment Distributors, Inc. since May 2010 and February 2012, respectively; Chairman of the Board and Chief Executive Officer, RiverSource Distributors, Inc. since 2006; Director, Threadneedle Asset Management Holdings, SARL since 2014; President and Chief Executive Officer, Ameriprise Certificate Company, 2006-August 2012 | 193 | Chairman of the Board, Columbia Management Investment Advisers, LLC since May 2010; Director, Columbia Management Investment Distributors, Inc. since May 2010; former Director, Ameriprise Certificate Company, 2006 - January 2013 |
| * | Interested person (as defined under the 1940 Act) by reason of being an officer, director, security holder and/or employee of the Investment Manager or Ameriprise Financial. |
The Statement of Additional Information has additional information about the Fund’s Board members and is available, without charge, upon request by calling 800.345.6611, visiting columbiathreadneedleus.com/investor/ or contacting your financial intermediary.
Columbia Greater China Fund | Annual Report 2018
| 35 |
TRUSTEES AND OFFICERS (continued)
The Board has appointed officers who are responsible for day-to-day business decisions based on policies it has established. The officers serve at the pleasure of the Board. The following table provides basic information about the Officers of the Fund, including principal occupations during the past five years, although their specific titles may have varied over the period. In addition to Mr. Truscott, who is Senior Vice President, the Fund’s other officers are:
Fund officers
Name,
address and
year of birth | Position and year
first appointed to
position for any Fund
in the Columbia
Funds complex or a
predecessor thereof | Principal occupation(s) during past five years |
Christopher O. Petersen
5228 Ameriprise
Financial Center
Minneapolis, MN 55474
Born 1970 | President and Principal Executive Officer (2015) | Vice President and Lead Chief Counsel, Ameriprise Financial, Inc. since January 2015 (previously, Vice President and Chief Counsel, January 2010 - December 2014; officer of Columbia Funds and affiliated funds since 2007. |
Michael G. Clarke
225 Franklin Street
Boston, MA 02110
Born 1969 | Treasurer (2011), Chief Financial Officer (2009) and Chief Accounting Officer (2015) | Vice President — Mutual Fund Administration, Columbia Management Investment Advisers, LLC, since May 2010; senior officer of Columbia Funds and affiliated funds since 2002. |
Paul B. Goucher
100 Park Avenue
New York, NY 10017
Born 1968 | Senior Vice President (2011) and Assistant Secretary (2008) | Senior Vice President and Assistant General Counsel, Ameriprise Financial, Inc. since January 2017 (previously, Vice President and Lead Chief Counsel, November 2008 - January 2017 and January 2013 - January 2017, respectively); Vice President, Chief Legal Officer and Assistant Secretary, Columbia Management Investment Advisers, LLC since May 2010. |
Thomas P. McGuire
225 Franklin Street
Boston, MA 02110
Born 1972 | Senior Vice President and Chief Compliance Officer (2012) | Vice President — Asset Management Compliance, Ameriprise Financial, Inc., since May 2010; Chief Compliance Officer, Ameriprise Certificate Company since September 2010. |
Colin Moore
225 Franklin Street
Boston, MA 02110
Born 1958 | Senior Vice President (2010) | Executive Vice President and Global Chief Investment Officer, Ameriprise Financial, Inc., since July 2013; Executive Vice President and Global Chief Investment Officer, Columbia Management Investment Advisers, LLC since July 2013. |
Ryan C. Larrenaga
225 Franklin Street
Boston, MA 02110
Born 1970 | Senior Vice President (2017), Chief Legal Officer (2017) and Secretary (2015) | Vice President and Chief Counsel, Ameriprise Financial, Inc. since August 2018 (previously, Vice President and Group Counsel, August 2011 - August 2018); officer of Columbia Funds and affiliated funds since 2005. |
Michael E. DeFao
225 Franklin Street
Boston, MA 02110
Born 1968 | Vice President (2011) and Assistant Secretary (2010) | Vice President and Chief Counsel, Ameriprise Financial, Inc. since May 2010. |
Amy Johnson
5228 Ameriprise
Financial Center
Minneapolis, MN 55474
Born 1965 | Vice President (2006) | Managing Director and Global Head of Operations, Columbia Management Investment Advisers, LLC since April 2016 (previously Managing Director and Chief Operating Officer, 2010 - 2016). |
Lyn Kephart-Strong
5228 Ameriprise
Financial Center
Minneapolis, MN 55474
Born 1960 | Vice President (2015) | President, Columbia Management Investment Services Corp. since October 2014; Vice President & Resolution Officer, Ameriprise Trust Company since August 2009. |
| 36 | Columbia Greater China Fund | Annual Report 2018 |
Board Consideration and Approval of Management
Agreement
On June 12, 2018, the Board of Trustees (the Board) and the Trustees who are not interested persons (as defined in the Investment Company Act of 1940) (the Independent Trustees) of Columbia Funds Series Trust I (the Trust) unanimously approved the continuation of the Management Agreement (the Management Agreement) with Columbia Management Investment Advisers, LLC (the Investment Manager) with respect to Columbia Greater China Fund (the Fund), a series of the Trust. As detailed below, the Board’s Advisory Fees and Expenses Committee (the Committee) and the Board met on multiple occasions to review and discuss, among themselves, with the management team of the Investment Manager and with an independent fee consultant, materials provided by the Investment Manager, the independent fee consultant and others before determining to approve the continuation of the Management Agreement.
In connection with their deliberations regarding the continuation of the Management Agreement, the Committee and the Board evaluated materials requested from the Investment Manager regarding the Fund and the Management Agreement, and discussed these materials with representatives of the Investment Manager at Committee meetings held on March 6, 2018, April 26, 2018 and June 11, 2018 and at Board meetings held on March 7, 2018 and June 12, 2018. In addition, the Board and its various committees consider matters bearing on the Management Agreement at other meetings throughout the year and in prior years and meet regularly with senior management of the Trust and the Investment Manager. Through the Board’s Investment Oversight Committees, Trustees also meet with selected portfolio managers of the funds the Trustees oversee and with other investment personnel at various times throughout the year. The Committee and the Board also consulted with the independent fee consultant, Fund counsel and the Independent Trustees’ independent legal counsel, who advised on various matters with respect to the Committee’s and the Board’s considerations and otherwise assisted the Committee and the Board in their deliberations. On June 11, 2018, the Committee recommended that the Board approve the continuation of the Management Agreement. On June 12, 2018, the Board, including the Independent Trustees, voting separately, unanimously approved the continuation of the Management Agreement for the Fund.
The Committee and the Board considered all information that they, their legal counsel or the Investment Manager believed reasonably necessary to evaluate and to determine whether to recommend for approval or approve the continuation of the Management Agreement. The information and factors considered by the Committee and the Board in recommending for approval or approving the continuation of the Management Agreement for the Fund included the following:
| • | Information on the investment performance of the Fund relative to the performance of a group of mutual funds determined to be comparable to the Fund by an independent third-party data provider, as well as performance relative to benchmarks; |
| • | Information on the Fund’s management fees and total expenses, including information comparing the Fund’s expenses to those of a group of comparable mutual funds, as determined by the independent third-party data provider; |
| • | The Investment Manager’s agreement to contractually limit or cap total operating expenses for the Fund through December 31, 2019 so that total operating expenses (excluding certain fees and expenses, such as transaction costs and certain other investment related expenses, interest, taxes, acquired fund fees and expenses, and infrequent and/or unusual expenses) would not exceed a specified annual rate, as a percentage of the Fund’s net assets; |
| • | The terms and conditions of the Management Agreement; |
| • | The current and proposed terms and conditions of other agreements and arrangements with affiliates of the Investment Manager relating to the operations of the Fund, including agreements with respect to the provision of distribution, transfer agency and shareholder services to the Fund; |
| • | Descriptions of various functions performed by the Investment Manager under the Management Agreement, including portfolio management and portfolio trading practices; |
| • | Information regarding the management fees of similarly-managed portfolios of other clients of the Investment Manager, including institutional accounts and collective trusts; |
| • | Information regarding the reputation, regulatory history and resources of the Investment Manager, including information regarding senior management, portfolio managers and other personnel; |
Columbia Greater China Fund | Annual Report 2018
| 37 |
Board Consideration and Approval of Management
Agreement (continued)
| • | Information regarding the capabilities of the Investment Manager with respect to compliance monitoring services, including an assessment of the Investment Manager’s compliance system by the Fund’s Chief Compliance Officer; and |
| • | The profitability to the Investment Manager and its affiliates from their relationships with the Fund. |
Nature, extent and quality of services provided under the Management Agreement
The Committee and the Board considered the nature, extent and quality of services provided to the Fund by the Investment Manager and its affiliates under the Management Agreement and under separate agreements for the provision of transfer agency and shareholder services, and the resources dedicated to the Fund and the other Columbia Funds by the Investment Manager and its affiliates. The Committee and the Board considered, among other things, the Investment Manager’s ability to attract, motivate and retain highly qualified research, advisory and supervisory investment professionals (including compensation programs for personnel involved in fund management, reputation and other attributes), the portfolio management services provided by those investment professionals, and the quality of the Investment Manager’s investment research capabilities and trade execution services. The Committee and the Board also considered the potential benefits to shareholders of investing in a mutual fund that is part of a fund complex offering exposure to a variety of asset classes and investment disciplines and providing a variety of fund and shareholder services.
The Committee and the Board also considered the professional experience and qualifications of the senior personnel of the Investment Manager, which included consideration of the Investment Manager’s experience with similarly-structured funds. The Committee and the Board noted the compliance programs of and the compliance-related resources provided to the Fund by the Investment Manager and its affiliates and the resources dedicated by the Investment Manager and its affiliates to risk management, and considered the Investment Manager’s ability to provide administrative services to the Fund and coordinate the activities of the Fund’s other service providers. After reviewing these and related factors, the Committee and the Board concluded, within the context of their overall conclusions, that the nature, extent and quality of the services provided to the Fund under the Management Agreement supported the continuation of the Management Agreement.
Investment performance
The Committee and the Board reviewed information about the performance of the Fund over various time periods, including performance information relative to benchmarks, information that compared the performance of the Fund to the performance of a group of comparable mutual funds as determined by the independent third-party data provider, and information and analysis provided by the independent fee consultant. The Committee and the Board also reviewed a description of the third party’s methodology for identifying the Fund’s peer groups for purposes of performance and expense comparisons.
The Committee and the Board noted that, through December 31, 2017, the Fund’s performance was in the sixteenth, twenty-fourth and seventeenth percentile (where the best performance would be in the first percentile) of its category selected by the independent third-party data provider for the purposes of performance comparisons for the one-, three- and five-year periods, respectively.
The Committee and the Board also considered the Investment Manager’s performance and reputation generally, the Investment Manager’s historical responsiveness to Board concerns about performance, and the Investment Manager’s willingness to take steps intended to improve performance. After reviewing these and related factors, the Committee and the Board concluded, within the context of their overall conclusions, that the performance of the Fund and the Investment Manager was sufficient, in light of other considerations, to support the continuation of the Management Agreement.
Investment management fee rates and other expenses
The Committee and the Board considered the management fees charged to the Fund under the Management Agreement as well as the total expenses incurred by the Fund. In assessing the reasonableness of the fees under the Management Agreement, the Committee and the Board considered, among other information, the Fund’s total expense ratio as a percentage of average daily net assets. The Committee and the Board considered data provided by the independent third-party data provider and the independent fee consultant. The Committee and the Board noted that, as of December 31, 2017, the Fund’s actual management fee and net total expense ratio were ranked in the third and first quintiles, respectively,
| 38 | Columbia Greater China Fund | Annual Report 2018 |
Board Consideration and Approval of Management
Agreement (continued)
(where the lowest fees and expenses would be in the first quintile) against the Fund’s expense universe as determined by the independent third-party data provider for purposes of expense comparison. The Committee and the Board also took into account the fee waiver and expense limitation arrangements agreed to by the Investment Manager, as noted above.
The Committee and the Board also received and considered information about the management fees charged by the Investment Manager to institutional accounts. In considering the fees charged to those accounts, the Committee and the Board took into account, among other things, the Investment Manager’s representations about the differences between managing mutual funds as compared to other types of accounts, including differences in the services provided, differences in the risk profile of such business for the Investment Manager and the additional resources required to manage mutual funds effectively. The Committee and the Board also received and considered information about the fees charged by the Investment Manager for sub-advisory services it provides to comparable unaffiliated funds. In evaluating the Fund’s management fees, the Committee and the Board also took into account the demands, complexity and quality of the investment management of the Fund.
After reviewing these and related factors, the Committee and the Board concluded, within the context of their overall conclusions, that the management fee rates and expenses of the Fund, in light of other considerations, supported the continuation of the Management Agreement.
Costs of services provided and profitability
The Committee and the Board also took note of the costs the Investment Manager and its affiliates incur in connection with the services provided and the profitability to the Investment Manager and its affiliates from their relationships with the Fund.
The Committee and the Board also considered the compensation directly or indirectly received by the Investment Manager’s affiliates in connection with their relationships with the Fund. The Committee and the Board reviewed information provided by management as to the profitability to the Investment Manager and its affiliates of their relationships with the Fund, information about the allocation of expenses used to calculate profitability, and comparisons of profitability levels realized in 2017 to profitability levels realized in 2016. When reviewing profitability, the Committee and the Board also considered court cases in which adviser profitability was an issue in whole or in part, the performance of similarly managed funds, the performance of the Fund, and the expense ratio of the Fund. In addition, the Committee and the Board considered information provided by the Investment Manager regarding the Investment Manager’s financial condition and comparing its profitability to that of other asset management firms that are, or are subsidiaries of, publicly traded companies. In this regard, the Committee and the Board also considered data provided by the independent fee consultant.
After reviewing these and related factors, the Committee and the Board concluded, within the context of their overall conclusions, that the costs of services provided and the profitability to the Investment Manager and its affiliates from their relationships with the Fund supported the continuation of the Management Agreement.
Economies of scale
The Committee and the Board considered the potential existence of economies of scale in the provision by the Investment Manager of services to the Fund, to groups of related funds, and to the Investment Manager’s investment advisory clients as a whole, and whether those economies of scale were shared with the Fund through breakpoints in investment management fees or other means, such as expense limitation arrangements and additional investments by the Investment Manager in investment, trading, compliance and other resources. The Committee and the Board noted that the management fee schedules for the Fund contained breakpoints that would reduce the fee rate on assets above specified threshold levels.
In considering these matters, the Committee and the Board also considered the costs of the services provided and the profitability to the Investment Manager and its affiliates from their relationships with the Fund, as noted above. After reviewing these and related factors, the Committee and the Board concluded, within the context of their overall conclusions, that the extent to which any economies of scale were expected to be shared with the Fund supported the continuation of the Management Agreement.
Columbia Greater China Fund | Annual Report 2018
| 39 |
Board Consideration and Approval of Management
Agreement (continued)
Other benefits to the Investment Manager
The Committee and the Board received and considered information regarding “fall-out” or ancillary benefits received by the Investment Manager and its affiliates as a result of their relationships with the Fund, such as the engagement of the Investment Manager’s affiliates to provide distribution, transfer agency and shareholder services to the Fund. In this regard, among other matters, the Committee and the Board considered that the Fund’s distributor retains a portion of the distribution fees from the Fund and receives a portion of the sales charges on sales or redemptions of certain classes of shares of the Fund. The Committee and the Board also considered the benefits of research made available to the Investment Manager by reason of brokerage commissions generated by the Fund’s securities transactions, and reviewed information about the Investment Manager’s practices with respect to considering brokerage and research services when allocating portfolio transactions. In this connection, the Board also noted that the amount of research made available to the Investment Manager by reason of brokerage commissions had been declining over time, and may decline further. The Committee and the Board recognized that the Investment Manager’s profitability would be somewhat lower without these benefits.
Conclusion
The Committee and the Board reviewed all of the above considerations in reaching their decisions to recommend or approve the continuation of the Management Agreement. In their deliberations, the Trustees did not identify any particular information that was all-important or controlling, and individual Trustees may have attributed different weights to the various factors. Based on their evaluation of all factors that they deemed to be material, including those factors described above, and assisted by the advice of independent legal counsel, the Board, including the Independent Trustees, voting separately, unanimously approved the continuation of the Management Agreement.
| 40 | Columbia Greater China Fund | Annual Report 2018 |
The Fund mails one shareholder report to each shareholder address. If you would like more than one report, please call shareholder services at 800.345.6611 and additional reports will be sent to you.
Proxy voting policies and procedures
The policy of the Board of Trustees is to vote the proxies of the companies in which the Fund holds investments consistent with the procedures as stated in the Statement of Additional Information (SAI). You may obtain a copy of the SAI without charge by calling 800.345.6611; contacting your financial intermediary; visiting columbiathreadneedleus.com/investor/; or searching the website of the Securities and Exchange Commission (SEC) at sec.gov. Information regarding how the Fund voted proxies relating to portfolio securities is filed with the SEC by August 31st for the most recent 12-month period ending June 30th of that year, and is available without charge by visiting columbiathreadneedleus.com/investor/, or searching the website of the SEC at sec.gov.
Quarterly schedule of investments
The Fund files a complete schedule of portfolio holdings with the SEC for the first and third quarters of each fiscal year on Form N-Q or Form N-PORT. The Fund’s Form N-Q or Form N-PORT is available on the SEC’s website at sec.gov and may be reviewed and copied at the SEC’s Public Reference Room in Washington, D.C. Information on the operation of the Public Reference Room may be obtained by calling 800.SEC.0330. The Fund’s complete schedule of portfolio holdings, as filed on Form N-Q or Form N-PORT, can also be obtained without charge, upon request, by calling 800.345.6611.
Additional Fund information
For more information about the Fund, please visit columbiathreadneedleus.com/investor/ or call 800.345.6611. Customer Service Representatives are available to answer your questions Monday through Friday from 8 a.m. to 7 p.m. Eastern time.
Fund investment manager
Columbia Management Investment Advisers, LLC
225 Franklin Street
Boston, MA 02110
Fund distributor
Columbia Management Investment Distributors, Inc.
225 Franklin Street
Boston, MA 02110
Fund transfer agent
Columbia Management Investment Services Corp.
Through October 31, 2018:
P.O. Box 8081
Boston, MA 02266-8081
Effective November 1, 2018:
P.O. Box 219104
Kansas City, MO 64121-9104
Columbia Greater China Fund | Annual Report 2018
| 41 |
Columbia Greater China Fund
Through October 31, 2018:
P.O. Box 8081
Boston, MA 02266-8081
Effective November 1, 2018:
P.O. Box 219104
Kansas City, MO 64121-9104
Please read and consider the investment objectives, risks, charges and expenses for any fund carefully before investing. For a prospectus and summary prospectus, which contains this and other important information about the Fund, go to
columbiathreadneedleus.com/investor/. The Fund is distributed by Columbia Management Investment Distributors, Inc., member FINRA, and managed by Columbia Management Investment Advisers, LLC.
Columbia Threadneedle Investments (Columbia Threadneedle) is the global brand name of the Columbia and Threadneedle group of companies. All rights reserved.
© 2018 Columbia Management Investment Advisers, LLC.
columbiathreadneedleus .com/investor/

Annual Report
August 31, 2018
Columbia Mid Cap Growth Fund
Not FDIC Insured • No bank guarantee • May lose value
Dear Shareholders,
Volatility exists in financial markets and this is not a comfortable fact of life. How investors deal with this reality, including how they react to short term spikes in volatility as well as to longer periods of increased or decreased volatility, may have a significant impact on their overall investing success.
Too often, investors change their investment strategy based on something that’s happening at a moment in time rather than thinking about how that change in strategy might affect their ability to achieve their longer-term financial goals. Emotion replaces logic and reasoning. Investors may sell in reaction to a market drop (fear or panic), locking in low returns which means they won’t be invested when the market returns, or they invest more at a market peak (greed or conviction), essentially when it is expensive to do so. In both cases, selling and buying at the exact wrong time.
We believe the best outcomes come from a consistent approach to investing. Here are five areas where advisors can help us overcome the tendency to react emotionally as we struggle to make the right choices with our investments:
Long-term focus
The further away long-term goals, aspirations and objectives are, the easier it is to stray away from the goals and priorities that we set out. Advisors help us stay focused on what we want to accomplish.
Discipline through up-and-down markets
Advisors help set rules to prevent us from making rash decisions that we may regret later. Knowing ahead of time what you should do in case of certain situations will help you get through volatile markets and not make emotional decisions.
Tax-awareness
Taxes are one of the biggest drags on investment returns and are critical attributes of investing. Yet few of us take the necessary steps to ease the corrosive effect of taxes. Advisors have tools and knowledge that may help us to manage portfolios more tax-efficiently and keep more of what we earn.
Emotional objectivity
Our emotions are very hard to manage and making investment decisions in an emotional state can lead to exceedingly bad outcomes. An objective advisor can help prevent some of the reactionary mistakes emotions often lead us to.
Education and guidance
The role of the advisor is to teach and guide us toward achieving our financial goals. In terms of working through emotions, guidance is by far the most important component.
By understanding our own behaviors and biases, we can prepare for future challenges. Your success is our priority. Talk to your advisor about how working with Columbia Threadneedle Investments may help you stay the course and position your portfolio for consistent, sustainable outcomes, regardless of market conditions.
Sincerely,
Christopher O. Petersen
President, Columbia Funds
Columbia Funds are distributed by Columbia Management Investment Distributors, Inc., member FINRA, and managed by Columbia Management Investment Advisers, LLC.
© 2018 Columbia Management Investment Advisers, LLC. All rights reserved.
Columbia Mid Cap Growth Fund | Annual Report 2018
Columbia Mid Cap Growth Fund | Annual Report 2018
Investment objective
Columbia Mid Cap Growth Fund (the Fund) seeks significant capital appreciation by investing, under normal market conditions, at least 80% of its net assets (plus any borrowings for investment purposes) in stocks of companies with a market capitalization, at the time of initial purchase, equal to or less than the largest stock in the Russell Midcap Index.
Portfolio management
Matthew Litfin, CFA
Lead Portfolio Manager
Managed Fund since February 2018
Erika Maschmeyer, CFA
Portfolio Manager
Managed Fund since February 2018
John Emerson, CFA
Portfolio Manager
Managed Fund since February 2018
Morningstar style boxTM
The Morningstar Style Box is based on a fund’s portfolio holdings. For equity funds, the vertical axis shows the market capitalization of the stocks owned, and the horizontal axis shows investment style (value, blend, or growth). Information shown is based on the most recent data provided by Morningstar.
© 2018 Morningstar, Inc. All rights reserved. The Morningstar information contained herein: (1) is proprietary to Morningstar and/or its content providers; (2) may not be copied or distributed; and (3) is not warranted to be accurate, complete or timely. Neither Morningstar nor its content providers are responsible for any damages or losses arising from any use of this information.
| Average annual total returns (%) (for the period ended August 31, 2018) |
| | | Inception | 1 Year | 5 Years | 10 Years |
| Class A | Excluding sales charges | 11/01/02 | 22.23 | 12.37 | 9.67 |
| | Including sales charges | | 15.21 | 11.05 | 9.03 |
| Advisor Class* | 11/08/12 | 22.50 | 12.65 | 9.94 |
| Class C | Excluding sales charges | 10/13/03 | 21.27 | 11.52 | 8.85 |
| | Including sales charges | | 20.27 | 11.52 | 8.85 |
| Institutional Class | 11/20/85 | 22.49 | 12.66 | 9.95 |
| Institutional 2 Class* | 03/07/11 | 22.60 | 12.78 | 10.05 |
| Institutional 3 Class* | 07/15/09 | 22.66 | 12.84 | 10.09 |
| Class R | 01/23/06 | 21.89 | 12.09 | 9.39 |
| Class T* | Excluding sales charges | 09/27/10 | 22.19 | 12.36 | 9.68 |
| | Including sales charges | | 19.13 | 11.79 | 9.40 |
| Class V | Excluding sales charges | 11/01/02 | 22.19 | 12.36 | 9.63 |
| | Including sales charges | | 15.15 | 11.03 | 8.99 |
| Russell Midcap Growth Index | | 25.06 | 14.19 | 11.64 |
| Russell Midcap Index | | 17.89 | 12.80 | 10.92 |
Returns for Class A and Class V shares are shown with and without the maximum initial sales charge of 5.75%. Returns for Class C shares are shown with and without the 1.00% contingent deferred sales charge for the first year only. Returns for Class T shares are shown with and without the maximum initial sales charge of 2.50% per transaction. The Fund’s other share classes are not subject to sales charges and have limited eligibility. Effective November 1, 2017, Class R4, Class R5, Class Y and Class Z shares were renamed Advisor Class, Institutional 2 Class, Institutional 3 Class and Institutional Class shares, respectively. Please see the Fund’s prospectus for details. Performance for different share classes will vary based on differences in sales charges and fees associated with each share class. All results shown assume reinvestment of distributions during the period. Returns do not reflect the deduction of taxes that a shareholder may pay on Fund distributions or on the redemption of Fund shares. Performance results reflect the effect of any fee waivers or reimbursements of Fund expenses by Columbia Management Investment Advisers, LLC and/or any of its affiliates. Absent these fee waivers or expense reimbursement arrangements, performance results would have been lower.
The performance information shown represents past performance and is not a guarantee of future results. The investment return and principal value of your investment will fluctuate so that your shares, when redeemed, may be worth more or less than their original cost. Current performance may be lower or higher than the performance information shown. You may obtain performance information current to the most recent month-end by contacting your financial intermediary, visiting columbiathreadneedleus.com/investor/ or calling 800.345.6611.
| * | The returns shown for periods prior to the share class inception date (including returns for the Life of the Fund, if shown, which are since Fund inception) include the returns of the Fund’s oldest share class. These returns are adjusted to reflect any higher class-related operating expenses of the newer share classes, as applicable. Please visit columbiathreadneedleus.com/investor/investment-products/mutual-funds/appended-performance for more information. |
The Russell Midcap Growth Index, an unmanaged index, measures the performance of those Russell Midcap Index companies with higher price-to-book ratios and forecasted growth values.
The Russell Midcap Index, an unmanaged index, measures the performance of the 800 smallest companies in the Russell 1000 Index, which represents approximately 25% of the total market capitalization or the Russell 1000 Index.
Indices are not available for investment, are not professionally managed and do not reflect sales charges, fees, brokerage commissions, taxes or other expenses of investing. Securities in the Fund may not match those in an index.
| 2 | Columbia Mid Cap Growth Fund | Annual Report 2018 |
Fund at a Glance (continued)
Performance of a hypothetical $10,000 investment (August 31, 2008 — August 31, 2018)
The chart above shows the change in value of a hypothetical $10,000 investment in Class A shares of Columbia Mid Cap Growth Fund during the stated time period, and does not reflect the deduction of taxes that a shareholder may pay on Fund distributions or on the redemption of Fund shares.
| Top 10 holdings (%) (at August 31, 2018) |
| Tyler Technologies, Inc. | 2.4 |
| Tractor Supply Co. | 2.4 |
| Fastenal Co. | 2.3 |
| Align Technology, Inc. | 2.3 |
| MSCI, Inc. | 2.3 |
| Aspen Technology, Inc. | 2.2 |
| Worldpay, Inc., Class A | 2.1 |
| VeriSign, Inc. | 2.1 |
| IDEXX Laboratories, Inc. | 2.1 |
| Choice Hotels International, Inc. | 2.1 |
Percentages indicated are based upon total investments (excluding Money Market Funds and derivatives, if any).
For further detail about these holdings, please refer to the section entitled “Portfolio of Investments.”
Fund holdings are as of the date given, are subject to change at any time, and are not recommendations to buy or sell any security.
| Portfolio breakdown (%) (at August 31, 2018) |
| Common Stocks | 99.0 |
| Money Market Funds | 1.0 |
| Total | 100.0 |
Percentages indicated are based upon total investments and exclude investments in derivatives, if any. The Fund’s portfolio composition is subject to change.
| Equity sector breakdown (%) (at August 31, 2018) |
| Consumer Discretionary | 20.4 |
| Energy | 3.2 |
| Financials | 8.2 |
| Health Care | 17.1 |
| Industrials | 15.3 |
| Information Technology | 29.2 |
| Materials | 2.8 |
| Real Estate | 3.8 |
| Total | 100.0 |
Percentages indicated are based upon total equity investments. The Fund’s portfolio composition is subject to change.
Columbia Mid Cap Growth Fund | Annual Report 2018
| 3 |
Manager Discussion of Fund Performance
For the 12-month period ended August 31, 2018, the Fund’s Class A shares returned 22.23% excluding sales charges. During the same period, the Fund underperformed its benchmark, the Russell Midcap Growth Index, which returned 25.06%, and outperformed the broader-based Russell Midcap Index, which returned 17.89%. Stock selection in information technology and industrials detracted from relative results. Stock selection in materials and consumer staples were top contributors to relative returns.
Effective February 12, 2018, responsibility for the day-to-day portfolio management of the Fund was assumed by Matthew Litfin, Erika Maschmayer and John Emerson of Columbia Wanger Asset Management, LLC, an investment advisory affiliate of Columbia Management Investment Advisers, LLC. From the time the new portfolio management team started managing the portfolio, through August 31, 2018, Class A shares of the Fund returned 15.55% and the benchmark returned 15.74%.
Solid U.S. growth supported corporate results
During the 12 months ended August 31, 2018, U.S. economic performance was generally strong, highlighted by healthy manufacturing data, improving business sentiment and positive employment trends. Outside the United States, growth initially picked up steam, particularly within Europe and the emerging markets. The broadening of global growth boosted corporate results, leading to gains in revenues and bottom-line earnings domestically and overseas. Weakness in the U.S. dollar provided an additional boost by making U.S. multinational companies’ goods and services less expensive overseas. Late in 2017, the markets gained additional momentum from the passage of a federal tax reform package that reduced the corporate tax rate from 35% to 21%. While not all corporations saw the same benefits, market watchers viewed the cut as supportive of corporate earnings, which bolstered investor risk appetites. In February and March 2018, markets stumbled on concerns over inflation and U.S. trade policy. Nonetheless, business and consumer confidence remained high, and the U.S. economy regained positive momentum following a disappointing first quarter GDP report. The picture was more mixed overseas, as the second quarter of 2018 saw global manufacturing slow to its lowest level in 11 months, negatively impacted by the U.S. administration’s threats of a trade war.
U.S. Federal Reserve (Fed) policy was supportive of equity markets over the period. The Fed clearly communicated its intention to raise rates and reverse the quantitative easing policy that had helped the economy and markets recover from the 2007/2008 financial crisis. Rather than regard the Fed’s policy trajectory as a headwind, investors viewed it as confirmation of U.S. economic strength, and the markets remained confident that the Fed would maintain a gradual approach to tightening monetary conditions. The Fed raised short-term rates three times during the 12-month period, with two additional rate hikes projected for the remainder of 2018.
Contributors and detractors
The Fund’s stock selection within information technology represented the largest relative detractor from performance during the 12-month period. Stock selection in industrials and an overweight in consumer discretionary also detracted. Within the information technology sector, the Fund’s position in Coherent, a leading supplier of fiber lasers used in manufacturing OLED (organic light-emitting diode) displays, subtracted from returns. Coherent’s shares declined as disappointing iPhone X holiday sales for 2017 sparked concern that OLED technology would fail to garner mainstream adoption. While we anticipate that OLED technology will increasingly gain traction over the next few years, we see better opportunities in the near-term. A position in Healthcare Services Group, which supplies outsourced services in housekeeping, laundry and dining to nursing homes and rehabilitation facilities, weighed on returns. The company reported disappointing quarterly results driven by weaker than expected margins. Healthcare Services Group’s customers appear to be facing challenging longer term headwinds.
Leading positive contributors to the Fund’s performance relative to the benchmark included stock selection in both materials and consumer staples, along with overweights in the consumer staples and health care sectors. Top individual contributors to relative results included the Fund’s position in the U.S.-based medical research and drug development company Sarepta Therapeutics. Shares of Sarepta rose after the company reported encouraging early results for its gene therapy treatment for Duchenne muscular dystrophy. In addition, shares of Abiomed, a leading cardiac medical device firm, registered solid gains as the company’s flagship Impella heart pump continued to exceed analysts’ expectations for sales and adoption.
| 4 | Columbia Mid Cap Growth Fund | Annual Report 2018 |
Manager Discussion of Fund Performance (continued)
Fund strategy
U.S. trade policy disputes have been a persistent source of market volatility. In our view, higher volatility levels and the increased number of economic and market divergences that have been occurring have the potential to create attractive opportunities. We believe that our investment philosophy, which favors higher quality and structural growth as measured across return on invested capital, revenue and earnings growth, and superior debt ratios, can be particularly advantageous in this environment.
While cognizant of macroeconomic trends, our investment process takes a bottom-up approach, relying on intensive fundamental research and disciplined valuation techniques. We are focused on companies with sustainable competitive advantages, entrepreneurial management and the potential to gain market share. Our team creates and closely monitors a specific and unique investment thesis for every company in which we invest. We will continue to employ our time-tested process to look for opportunities for investors to benefit from growth in undervalued businesses.
Market risk may affect a single issuer, sector of the economy, industry or the market as a whole. Growth securities, at times, may not perform as well as value securities or the stock market in general and may be out of favor with investors. Foreign investments subject the Fund to risks, including political, economic, market, social and others within a particular country, as well as to currency instabilities and less stringent financial and accounting standards generally applicable to U.S. issuers. Investments in mid-cap companies involve risks and volatility greater than investments in larger, more established companies. The Fund may invest significantly in issuers within a particular sector, which may be negatively affected by market, economic or other conditions, making the Fund more vulnerable to unfavorable developments in the sector. See the Fund’s prospectus for more information on these and other risks.
The views expressed in this report reflect the current views of the respective parties. These views are not guarantees of future performance and involve certain risks, uncertainties and assumptions that are difficult to predict, so actual outcomes and results may differ significantly from the views expressed. These views are subject to change at any time based upon economic, market or other conditions and the respective parties disclaim any responsibility to update such views. These views may not be relied on as investment advice and, because investment decisions for a Columbia fund are based on numerous factors, may not be relied on as an indication of trading intent on behalf of any particular Columbia fund. References to specific securities should not be construed as a recommendation or investment advice.
Columbia Mid Cap Growth Fund | Annual Report 2018
| 5 |
Understanding Your Fund’s Expenses
(Unaudited)
As an investor, you incur two types of costs. There are shareholder transaction costs, which generally include sales charges on purchases and may include redemption fees. There are also ongoing costs, which generally include management fees, distribution and/or service fees, and other fund expenses. The following information is intended to help you understand your ongoing costs (in dollars) of investing in the Fund and to help you compare these costs with the ongoing costs of investing in other mutual funds.
Analyzing your Fund’s expenses
To illustrate these ongoing costs, we have provided examples and calculated the expenses paid by investors in each share class of the Fund during the period. The actual and hypothetical information in the table is based on an initial investment of $1,000 at the beginning of the period indicated and held for the entire period. Expense information is calculated two ways and each method provides you with different information. The amount listed in the “Actual” column is calculated using the Fund’s actual operating expenses and total return for the period. You may use the Actual information, together with the amount invested, to estimate the expenses that you paid over the period. Simply divide your account value by $1,000 (for example, an $8,600 account value divided by $1,000 = 8.6), then multiply the results by the expenses paid during the period under the “Actual” column. The amount listed in the “Hypothetical” column assumes a 5% annual rate of return before expenses (which is not the Fund’s actual return) and then applies the Fund’s actual expense ratio for the period to the hypothetical return. You should not use the hypothetical account values and expenses to estimate either your actual account balance at the end of the period or the expenses you paid during the period. See “Compare with other funds” below for details on how to use the hypothetical data.
Compare with other funds
Since all mutual funds are required to include the same hypothetical calculations about expenses in shareholder reports, you can use this information to compare the ongoing cost of investing in the Fund with other funds. To do so, compare the hypothetical example with the 5% hypothetical examples that appear in the shareholder reports of other funds. As you compare hypothetical examples of other funds, it is important to note that hypothetical examples are meant to highlight the ongoing costs of investing in a fund only and do not reflect any transaction costs, such as sales charges, or redemption or exchange fees. Therefore, the hypothetical calculations are useful in comparing ongoing costs only, and will not help you determine the relative total costs of owning different funds. If transaction costs were included in these calculations, your costs would be higher.
| March 1, 2018 — August 31, 2018 |
| | Account value at the
beginning of the
period ($) | Account value at the
end of the
period ($) | Expenses paid during
the period ($) | Fund’s annualized
expense ratio (%) |
| | Actual | Hypothetical | Actual | Hypothetical | Actual | Hypothetical | Actual |
| Class A | 1,000.00 | 1,000.00 | 1,121.40 | 1,019.36 | 6.20 | 5.90 | 1.16 |
| Advisor Class | 1,000.00 | 1,000.00 | 1,122.50 | 1,020.62 | 4.87 | 4.63 | 0.91 |
| Class C | 1,000.00 | 1,000.00 | 1,116.90 | 1,015.63 | 10.14 | 9.65 | 1.90 |
| Institutional Class | 1,000.00 | 1,000.00 | 1,122.90 | 1,020.62 | 4.87 | 4.63 | 0.91 |
| Institutional 2 Class | 1,000.00 | 1,000.00 | 1,123.30 | 1,021.02 | 4.44 | 4.23 | 0.83 |
| Institutional 3 Class | 1,000.00 | 1,000.00 | 1,123.70 | 1,021.27 | 4.18 | 3.97 | 0.78 |
| Class R | 1,000.00 | 1,000.00 | 1,119.90 | 1,018.10 | 7.53 | 7.17 | 1.41 |
| Class T | 1,000.00 | 1,000.00 | 1,121.40 | 1,019.41 | 6.15 | 5.85 | 1.15 |
| Class V | 1,000.00 | 1,000.00 | 1,121.00 | 1,019.36 | 6.20 | 5.90 | 1.16 |
Expenses paid during the period are equal to the annualized expense ratio for each class as indicated above, multiplied by the average account value over the period and then multiplied by the number of days in the Fund’s most recent fiscal half year and divided by 365.
Expenses do not include fees and expenses incurred indirectly by the Fund from its investment in underlying funds, including affiliated and non-affiliated pooled investment vehicles, such as mutual funds and exchange-traded funds.
| 6 | Columbia Mid Cap Growth Fund | Annual Report 2018 |
Portfolio of Investments
August 31, 2018
(Percentages represent value of investments compared to net assets)
Investments in securities
| Common Stocks 98.8% |
| Issuer | Shares | Value ($) |
| Consumer Discretionary 20.2% |
| Auto Components 1.6% |
| Visteon Corp.(a) | 277,104 | 30,589,511 |
| Distributors 1.6% |
| Pool Corp. | 191,330 | 31,427,866 |
| Hotels, Restaurants & Leisure 7.3% |
| Choice Hotels International, Inc. | 506,123 | 39,502,900 |
| Churchill Downs, Inc. | 126,013 | 35,611,274 |
| Dunkin’ Brands Group, Inc. | 411,067 | 29,962,673 |
| Six Flags Entertainment Corp. | 540,867 | 36,535,566 |
| Total | | 141,612,413 |
| Household Durables 1.0% |
| NVR, Inc.(a) | 7,110 | 18,972,679 |
| Media 2.9% |
| Live Nation Entertainment, Inc.(a) | 385,500 | 19,151,640 |
| Madison Square Garden Co. (The), Class A(a) | 125,408 | 37,865,692 |
| Total | | 57,017,332 |
| Specialty Retail 5.8% |
| O’Reilly Automotive, Inc.(a) | 102,329 | 34,323,193 |
| Tractor Supply Co. | 515,517 | 45,509,841 |
| Ulta Beauty, Inc.(a) | 123,287 | 32,054,620 |
| Total | | 111,887,654 |
| Total Consumer Discretionary | 391,507,455 |
| Energy 3.1% |
| Energy Equipment & Services 2.0% |
| Core Laboratories NV | 170,935 | 19,580,604 |
| Helmerich & Payne, Inc. | 305,234 | 20,014,194 |
| Total | | 39,594,798 |
| Oil, Gas & Consumable Fuels 1.1% |
| Concho Resources, Inc.(a) | 152,200 | 20,874,230 |
| Total Energy | 60,469,028 |
| Financials 8.1% |
| Banks 2.9% |
| First Republic Bank | 309,105 | 31,401,977 |
| SVB Financial Group(a) | 75,790 | 24,461,222 |
| Total | | 55,863,199 |
| Common Stocks (continued) |
| Issuer | Shares | Value ($) |
| Capital Markets 5.2% |
| Affiliated Managers Group, Inc. | 122,400 | 17,881,416 |
| MSCI, Inc. | 241,893 | 43,603,632 |
| Raymond James Financial, Inc. | 423,714 | 39,422,351 |
| Total | | 100,907,399 |
| Total Financials | 156,770,598 |
| Health Care 16.9% |
| Biotechnology 2.3% |
| Amicus Therapeutics, Inc.(a) | 1,306,895 | 17,616,945 |
| Sarepta Therapeutics(a) | 200,733 | 27,709,183 |
| Total | | 45,326,128 |
| Health Care Equipment & Supplies 6.6% |
| ABIOMED, Inc.(a) | 47,307 | 19,234,080 |
| Align Technology, Inc.(a) | 114,692 | 44,327,311 |
| IDEXX Laboratories, Inc.(a) | 155,766 | 39,570,795 |
| STERIS PLC | 217,000 | 24,829,140 |
| Total | | 127,961,326 |
| Health Care Providers & Services 1.5% |
| Laboratory Corp. of America Holdings(a) | 165,000 | 28,523,550 |
| Life Sciences Tools & Services 5.9% |
| Agilent Technologies, Inc. | 333,659 | 22,535,329 |
| Illumina, Inc.(a) | 82,246 | 29,183,348 |
| Mettler-Toledo International, Inc.(a) | 52,397 | 30,623,950 |
| Waters Corp.(a) | 164,800 | 31,226,304 |
| Total | | 113,568,931 |
| Pharmaceuticals 0.6% |
| Zoetis, Inc. | 140,220 | 12,703,932 |
| Total Health Care | 328,083,867 |
| Industrials 15.1% |
| Aerospace & Defense 0.9% |
| BWX Technologies, Inc. | 293,730 | 18,011,524 |
| Building Products 0.9% |
| Lennox International, Inc. | 77,426 | 17,251,287 |
The accompanying Notes to Financial Statements are an integral part of this statement.
Columbia Mid Cap Growth Fund | Annual Report 2018
| 7 |
Portfolio of Investments (continued)
August 31, 2018
| Common Stocks (continued) |
| Issuer | Shares | Value ($) |
| Commercial Services & Supplies 4.6% |
| Cintas Corp. | 134,223 | 28,639,162 |
| Copart, Inc.(a) | 349,000 | 22,444,190 |
| Rollins, Inc. | 633,252 | 38,045,780 |
| Total | | 89,129,132 |
| Machinery 1.4% |
| Donaldson Co., Inc. | 528,444 | 26,739,266 |
| Professional Services 1.6% |
| TransUnion | 410,000 | 30,873,000 |
| Road & Rail 3.4% |
| JB Hunt Transport Services, Inc. | 242,497 | 29,281,513 |
| Landstar System, Inc. | 321,674 | 37,249,849 |
| Total | | 66,531,362 |
| Trading Companies & Distributors 2.3% |
| Fastenal Co. | 761,826 | 44,460,165 |
| Total Industrials | 292,995,736 |
| Information Technology 28.9% |
| Communications Equipment 0.5% |
| Arista Networks, Inc.(a) | 31,140 | 9,310,237 |
| Electronic Equipment, Instruments & Components 1.9% |
| CDW Corp. | 422,187 | 36,966,694 |
| Internet Software & Services 3.3% |
| GoDaddy, Inc., Class A(a) | 297,089 | 24,200,870 |
| VeriSign, Inc.(a) | 252,144 | 39,992,560 |
| Total | | 64,193,430 |
| IT Services 3.8% |
| WEX, Inc.(a) | 174,160 | 33,128,715 |
| Worldpay, Inc., Class A(a) | 419,423 | 40,847,606 |
| Total | | 73,976,321 |
| Semiconductors & Semiconductor Equipment 5.8% |
| Lam Research Corp. | 190,867 | 33,037,169 |
| Monolithic Power Systems, Inc. | 206,748 | 30,985,323 |
| Skyworks Solutions, Inc. | 229,800 | 20,980,740 |
| Teradyne, Inc. | 645,500 | 26,588,145 |
| Total | | 111,591,377 |
| Common Stocks (continued) |
| Issuer | Shares | Value ($) |
| Software 13.6% |
| ANSYS, Inc.(a) | 109,500 | 20,364,810 |
| Aspen Technology, Inc.(a) | 361,271 | 41,676,223 |
| Guidewire Software, Inc.(a) | 269,439 | 27,097,480 |
| Red Hat, Inc.(a) | 181,574 | 26,823,927 |
| ServiceNow, Inc.(a) | 185,197 | 36,365,283 |
| Synopsys, Inc.(a) | 367,817 | 37,568,828 |
| Take-Two Interactive Software, Inc.(a) | 205,057 | 27,387,413 |
| Tyler Technologies, Inc.(a) | 184,756 | 45,625,494 |
| Total | | 262,909,458 |
| Total Information Technology | 558,947,517 |
| Materials 2.8% |
| Chemicals 2.8% |
| Celanese Corp., Class A | 238,415 | 27,854,025 |
| International Flavors & Fragrances, Inc. | 201,742 | 26,284,965 |
| Total | | 54,138,990 |
| Total Materials | 54,138,990 |
| Real Estate 3.7% |
| Equity Real Estate Investment Trusts (REITS) 2.6% |
| Equity LifeStyle Properties, Inc. | 220,191 | 21,332,104 |
| SBA Communications Corp.(a) | 186,766 | 28,991,686 |
| Total | | 50,323,790 |
| Real Estate Management & Development 1.1% |
| Jones Lang LaSalle, Inc. | 144,831 | 22,089,624 |
| Total Real Estate | 72,413,414 |
Total Common Stocks
(Cost $1,565,171,609) | 1,915,326,605 |
|
| Money Market Funds 1.0% |
| | Shares | Value ($) |
| Columbia Short-Term Cash Fund, 2.058%(b),(c) | 19,029,731 | 19,027,828 |
Total Money Market Funds
(Cost $19,027,828) | 19,027,828 |
Total Investments in Securities
(Cost: $1,584,199,437) | 1,934,354,433 |
| Other Assets & Liabilities, Net | | 3,487,781 |
| Net Assets | 1,937,842,214 |
The accompanying Notes to Financial Statements are an integral part of this statement.
| 8 | Columbia Mid Cap Growth Fund | Annual Report 2018 |
Portfolio of Investments (continued)
August 31, 2018
Notes to Portfolio of Investments
| (a) | Non-income producing investment. |
| (b) | The rate shown is the seven-day current annualized yield at August 31, 2018. |
| (c) | As defined in the Investment Company Act of 1940, an affiliated company is one in which the Fund owns 5% or more of the company’s outstanding voting securities, or a company which is under common ownership or control with the Fund. Holdings and transactions in these affiliated companies during the year ended August 31, 2018 are as follows: |
| Issuer | Beginning
shares | Shares
purchased | Shares
sold | Ending
shares | Realized gain
(loss) —
affiliated
issuers ($) | Net change in
unrealized
appreciation
(depreciation) —
affiliated
issuers ($) | Dividends —
affiliated
issuers ($) | Value —
affiliated
issuers
at end of
period ($) |
| Columbia Short-Term Cash Fund, 2.058% |
| | 61,629,467 | 727,000,769 | (769,600,505) | 19,029,731 | (4,880) | (3,710) | 615,271 | 19,027,828 |
Fair value measurements
The Fund categorizes its fair value measurements according to a three-level hierarchy that maximizes the use of observable inputs and minimizes the use of unobservable inputs by prioritizing that the most observable input be used when available. Observable inputs are those that market participants would use in pricing an investment based on market data obtained from sources independent of the reporting entity. Unobservable inputs are those that reflect the Fund’s assumptions about the information market participants would use in pricing an investment. An investment’s level within the fair value hierarchy is based on the lowest level of any input that is deemed significant to the asset’s or liability’s fair value measurement. The input levels are not necessarily an indication of the risk or liquidity associated with investments at that level. For example, certain U.S. government securities are generally high quality and liquid, however, they are reflected as Level 2 because the inputs used to determine fair value may not always be quoted prices in an active market.
Fair value inputs are summarized in the three broad levels listed below:
| ■ | Level 1 — Valuations based on quoted prices for investments in active markets that the Fund has the ability to access at the measurement date. Valuation adjustments are not applied to Level 1 investments. |
| ■ | Level 2 — Valuations based on other significant observable inputs (including quoted prices for similar securities, interest rates, prepayment speeds, credit risks, etc.). |
| ■ | Level 3 — Valuations based on significant unobservable inputs (including the Fund’s own assumptions and judgment in determining the fair value of investments). |
Inputs that are used in determining fair value of an investment may include price information, credit data, volatility statistics, and other factors. These inputs can be either observable or unobservable. The availability of observable inputs can vary between investments, and is affected by various factors such as the type of investment, and the volume and level of activity for that investment or similar investments in the marketplace. The inputs will be considered by the Investment Manager, along with any other relevant factors in the calculation of an investment’s fair value. The Fund uses prices and inputs that are current as of the measurement date, which may include periods of market dislocations. During these periods, the availability of prices and inputs may be reduced for many investments. This condition could cause an investment to be reclassified between the various levels within the hierarchy.
Certain investments that have been measured at fair value using the net asset value (NAV) per share (or its equivalent) are not categorized in the fair value hierarchy. The fair value amounts presented in the table are intended to reconcile the fair value hierarchy to the amounts presented in the Portfolio of Investments. The Columbia Short-Term Cash Fund seeks to provide shareholders with maximum current income consistent with liquidity and stability of principal. Columbia Short-Term Cash Fund prices its shares with a floating NAV and no longer seeks to maintain a stable NAV.
Investments falling into the Level 3 category are primarily supported by quoted prices from brokers and dealers participating in the market for those investments. However, these may be classified as Level 3 investments due to lack of market transparency and corroboration to support these quoted prices. Additionally, valuation models may be used as the pricing source for any remaining investments classified as Level 3. These models may rely on one or more significant unobservable inputs and/or significant assumptions by the Investment Manager. Inputs used in valuations may include, but are not limited to, financial statement analysis, capital account balances, discount rates and estimated cash flows, and comparable company data.
Under the direction of the Fund’s Board of Trustees (the Board), the Investment Manager’s Valuation Committee (the Committee) is responsible for overseeing the valuation procedures approved by the Board. The Committee consists of voting and non-voting members from various groups within the Investment Manager’s organization, including operations and accounting, trading and investments, compliance, risk management and legal.
The Committee meets at least monthly to review and approve valuation matters, which may include a description of specific valuation determinations, data regarding pricing information received from approved pricing vendors and brokers and the results of Board-approved valuation control policies and procedures (the Policies). The Policies address, among other things, instances when market quotations are or are not readily available, including recommendations of third party pricing vendors and a determination of appropriate pricing methodologies; events that require specific valuation determinations and assessment of fair value techniques; securities with a potential for stale pricing, including those that are illiquid, restricted, or in default; and the effectiveness of third party pricing vendors, including periodic reviews of vendors. The Committee meets more frequently, as needed, to discuss additional valuation matters, which may include the need to review back-testing results, review time-sensitive information or approve related valuation actions. The Committee reports to the Board, with members of the Committee meeting with the Board at each of its regularly scheduled meetings to discuss valuation matters and actions during the period, similar to those described earlier.
For investments categorized as Level 3, the Committee monitors information similar to that described above, which may include: (i) data specific to the issuer or comparable issuers, (ii) general market or specific sector news and (iii) quoted prices and specific or similar security transactions. The Committee considers this data and any changes from prior periods in order to assess the reasonableness of observable and unobservable inputs, any assumptions or internal models used to value those securities and changes in fair value. This data is also used to corroborate, when available, information received from approved pricing vendors and brokers. Various factors impact the frequency of monitoring this information (which may occur as often as daily). However, the Committee may determine that changes to inputs, assumptions and models are not required as a result of the monitoring procedures performed.
The accompanying Notes to Financial Statements are an integral part of this statement.
Columbia Mid Cap Growth Fund | Annual Report 2018
| 9 |
Portfolio of Investments (continued)
August 31, 2018
Fair value measurements (continued)
The following table is a summary of the inputs used to value the Fund’s investments at August 31, 2018:
| | Level 1
quoted prices
in active
markets for
identical
assets ($) | Level 2
other
significant
observable
inputs ($) | Level 3
significant
unobservable
inputs ($) | Investments
measured at
net asset
value ($) | Total ($) |
| Investments in Securities | | | | | |
| Common Stocks | | | | | |
| Consumer Discretionary | 391,507,455 | — | — | — | 391,507,455 |
| Energy | 60,469,028 | — | — | — | 60,469,028 |
| Financials | 156,770,598 | — | — | — | 156,770,598 |
| Health Care | 328,083,867 | — | — | — | 328,083,867 |
| Industrials | 292,995,736 | — | — | — | 292,995,736 |
| Information Technology | 558,947,517 | — | — | — | 558,947,517 |
| Materials | 54,138,990 | — | — | — | 54,138,990 |
| Real Estate | 72,413,414 | — | — | — | 72,413,414 |
| Total Common Stocks | 1,915,326,605 | — | — | — | 1,915,326,605 |
| Money Market Funds | — | — | — | 19,027,828 | 19,027,828 |
| Total Investments in Securities | 1,915,326,605 | — | — | 19,027,828 | 1,934,354,433 |
See the Portfolio of Investments for all investment classifications not indicated in the table.
There were no transfers of financial assets between levels during the period.
The accompanying Notes to Financial Statements are an integral part of this statement.
| 10 | Columbia Mid Cap Growth Fund | Annual Report 2018 |
Statement of Assets and Liabilities
August 31, 2018
| Assets | |
| Investments in securities, at value | |
| Unaffiliated issuers (cost $1,565,171,609) | $1,915,326,605 |
| Affiliated issuers (cost $19,027,828) | 19,027,828 |
| Receivable for: | |
| Investments sold | 4,271,863 |
| Capital shares sold | 145,378 |
| Dividends | 1,104,708 |
| Prepaid expenses | 12,357 |
| Trustees’ deferred compensation plan | 160,941 |
| Other assets | 2,199 |
| Total assets | 1,940,051,879 |
| Liabilities | |
| Due to custodian | 7,284 |
| Payable for: | |
| Capital shares purchased | 1,599,896 |
| Management services fees | 39,558 |
| Distribution and/or service fees | 7,135 |
| Transfer agent fees | 238,772 |
| Compensation of board members | 54,463 |
| Compensation of chief compliance officer | 122 |
| Other expenses | 101,494 |
| Trustees’ deferred compensation plan | 160,941 |
| Total liabilities | 2,209,665 |
| Net assets applicable to outstanding capital stock | $1,937,842,214 |
| Represented by | |
| Paid in capital | 1,249,962,066 |
| Excess of distributions over net investment income | (216,816) |
| Accumulated net realized gain | 337,941,968 |
| Unrealized appreciation (depreciation) on: | |
| Investments - unaffiliated issuers | 350,154,996 |
| Total - representing net assets applicable to outstanding capital stock | $1,937,842,214 |
The accompanying Notes to Financial Statements are an integral part of this statement.
Columbia Mid Cap Growth Fund | Annual Report 2018
| 11 |
Statement of Assets and Liabilities (continued)
August 31, 2018
| Class A | |
| Net assets | $922,861,887 |
| Shares outstanding | 32,012,824 |
| Net asset value per share | $28.83 |
| Maximum sales charge | 5.75% |
| Maximum offering price per share (calculated by dividing the net asset value per share by 1.0 minus the maximum sales charge for Class A shares) | $30.59 |
| Advisor Class | |
| Net assets | $15,488,216 |
| Shares outstanding | 488,369 |
| Net asset value per share | $31.71 |
| Class C | |
| Net assets | $17,458,149 |
| Shares outstanding | 727,617 |
| Net asset value per share | $23.99 |
| Institutional Class | |
| Net assets | $758,444,192 |
| Shares outstanding | 24,624,180 |
| Net asset value per share | $30.80 |
| Institutional 2 Class | |
| Net assets | $48,791,926 |
| Shares outstanding | 1,571,103 |
| Net asset value per share | $31.06 |
| Institutional 3 Class | |
| Net assets | $135,727,504 |
| Shares outstanding | 4,368,798 |
| Net asset value per share | $31.07 |
| Class R | |
| Net assets | $13,414,289 |
| Shares outstanding | 485,329 |
| Net asset value per share | $27.64 |
| Class T | |
| Net assets | $89,809 |
| Shares outstanding | 3,115 |
| Net asset value per share | $28.83 |
| Maximum sales charge | 2.50% |
| Maximum offering price per share (calculated by dividing the net asset value per share by 1.0 minus the maximum sales charge per transaction for Class T shares) | $29.57 |
| Class V | |
| Net assets | $25,566,242 |
| Shares outstanding | 890,373 |
| Net asset value per share | $28.71 |
| Maximum sales charge | 5.75% |
| Maximum offering price per share (calculated by dividing the net asset value per share by 1.0 minus the maximum sales charge for Class V shares) | $30.46 |
The accompanying Notes to Financial Statements are an integral part of this statement.
| 12 | Columbia Mid Cap Growth Fund | Annual Report 2018 |
Statement of Operations
Year Ended August 31, 2018
| Net investment income | |
| Income: | |
| Dividends — unaffiliated issuers | $14,060,240 |
| Dividends — affiliated issuers | 615,271 |
| Foreign taxes withheld | (28,204) |
| Total income | 14,647,307 |
| Expenses: | |
| Management services fees | 14,133,865 |
| Distribution and/or service fees | |
| Class A | 2,164,300 |
| Class C | 387,177 |
| Class R | 68,519 |
| Class T | 285 |
| Class V | 59,840 |
| Transfer agent fees | |
| Class A | 1,176,401 |
| Advisor Class | 54,911 |
| Class C | 52,799 |
| Institutional Class | 970,818 |
| Institutional 2 Class | 27,779 |
| Institutional 3 Class | 10,718 |
| Class K | 125 |
| Class R | 18,647 |
| Class T | 155 |
| Class V | 32,517 |
| Plan administration fees | |
| Class K | 549 |
| Compensation of board members | 48,422 |
| Custodian fees | 18,651 |
| Printing and postage fees | 144,639 |
| Registration fees | 146,655 |
| Audit fees | 34,301 |
| Legal fees | 43,969 |
| Compensation of chief compliance officer | 733 |
| Other | 57,101 |
| Total expenses | 19,653,876 |
| Expense reduction | (4,500) |
| Total net expenses | 19,649,376 |
| Net investment loss | (5,002,069) |
| Realized and unrealized gain (loss) — net | |
| Net realized gain (loss) on: | |
| Investments — unaffiliated issuers | 388,820,422 |
| Investments — affiliated issuers | (4,880) |
| Options contracts written | (1,521,291) |
| Net realized gain | 387,294,251 |
| Net change in unrealized appreciation (depreciation) on: | |
| Investments — unaffiliated issuers | (2,093,202) |
| Investments — affiliated issuers | (3,710) |
| Net change in unrealized appreciation (depreciation) | (2,096,912) |
| Net realized and unrealized gain | 385,197,339 |
| Net increase in net assets resulting from operations | $380,195,270 |
The accompanying Notes to Financial Statements are an integral part of this statement.
Columbia Mid Cap Growth Fund | Annual Report 2018
| 13 |
Statement of Changes in Net Assets
| | Year Ended
August 31, 2018 | Year Ended
August 31, 2017 |
| Operations | | |
| Net investment loss | $(5,002,069) | $(4,741,686) |
| Net realized gain | 387,294,251 | 248,832,195 |
| Net change in unrealized appreciation (depreciation) | (2,096,912) | (5,869,446) |
| Net increase in net assets resulting from operations | 380,195,270 | 238,221,063 |
| Distributions to shareholders | | |
| Net realized gains | | |
| Class A | (105,220,136) | (51,052,445) |
| Advisor Class | (4,507,137) | (1,505,690) |
| Class B | — | (234,465) |
| Class C | (5,722,872) | (3,005,402) |
| Class I | — | (140) |
| Institutional Class | (82,635,824) | (45,262,358) |
| Institutional 2 Class | (6,394,483) | (2,113,734) |
| Institutional 3 Class | (18,192,893) | (532,420) |
| Class K | (48,940) | (23,438) |
| Class R | (1,655,980) | (992,962) |
| Class T | (16,630) | (8,430) |
| Class V | (2,907,267) | (1,277,842) |
| Total distributions to shareholders | (227,302,162) | (106,009,326) |
| Decrease in net assets from capital stock activity | (40,756,164) | (158,772,541) |
| Total increase (decrease) in net assets | 112,136,944 | (26,560,804) |
| Net assets at beginning of year | 1,825,705,270 | 1,852,266,074 |
| Net assets at end of year | $1,937,842,214 | $1,825,705,270 |
| Excess of distributions over net investment income | $(216,816) | $(189,914) |
The accompanying Notes to Financial Statements are an integral part of this statement.
| 14 | Columbia Mid Cap Growth Fund | Annual Report 2018 |
Statement of Changes in Net Assets (continued)
| | Year Ended | Year Ended |
| | August 31, 2018 | August 31, 2017 |
| | Shares | Dollars ($) | Shares | Dollars ($) |
| Capital stock activity |
| Class A | | | | |
| Subscriptions | 1,910,223 | 52,520,354 | 1,238,395 | 31,436,677 |
| Distributions reinvested | 4,044,479 | 100,950,198 | 2,037,154 | 49,136,143 |
| Redemptions | (4,953,334) | (133,269,622) | (7,341,268) | (185,811,380) |
| Net increase (decrease) | 1,001,368 | 20,200,930 | (4,065,719) | (105,238,560) |
| Advisor Class | | | | |
| Subscriptions | 454,467 | 13,424,077 | 528,018 | 14,715,600 |
| Distributions reinvested | 139,602 | 3,826,498 | 57,486 | 1,505,564 |
| Redemptions | (1,317,881) | (40,333,359) | (366,983) | (10,088,658) |
| Net increase (decrease) | (723,812) | (23,082,784) | 218,521 | 6,132,506 |
| Class B | | | | |
| Subscriptions | — | — | 1,163 | 24,774 |
| Distributions reinvested | — | — | 11,199 | 229,921 |
| Redemptions | — | — | (207,015) | (4,555,905) |
| Net decrease | — | — | (194,653) | (4,301,210) |
| Class C | | | | |
| Subscriptions | 140,699 | 3,189,968 | 120,211 | 2,583,102 |
| Distributions reinvested | 265,314 | 5,542,415 | 132,604 | 2,739,607 |
| Redemptions | (1,469,074) | (34,096,662) | (598,109) | (13,048,978) |
| Net decrease | (1,063,061) | (25,364,279) | (345,294) | (7,726,269) |
| Class I | | | | |
| Redemptions | — | — | (90) | (2,430) |
| Net decrease | — | — | (90) | (2,430) |
| Institutional Class | | | | |
| Subscriptions | 1,047,744 | 30,091,638 | 1,879,325 | 50,526,264 |
| Distributions reinvested | 2,875,772 | 76,553,065 | 1,335,272 | 34,076,146 |
| Redemptions | (3,139,551) | (90,275,444) | (10,095,051) | (274,565,834) |
| Net increase (decrease) | 783,965 | 16,369,259 | (6,880,454) | (189,963,424) |
| Institutional 2 Class | | | | |
| Subscriptions | 319,028 | 9,203,476 | 567,777 | 15,465,198 |
| Distributions reinvested | 238,412 | 6,394,196 | 82,274 | 2,113,610 |
| Redemptions | (765,851) | (22,045,765) | (258,617) | (6,954,015) |
| Net increase (decrease) | (208,411) | (6,448,093) | 391,434 | 10,624,793 |
| Institutional 3 Class | | | | |
| Subscriptions | 378,819 | 10,762,862 | 4,960,722 | 137,909,531 |
| Distributions reinvested | 76,819 | 2,060,281 | 20,720 | 532,288 |
| Redemptions | (1,153,614) | (33,061,314) | (135,059) | (3,688,740) |
| Net increase (decrease) | (697,976) | (20,238,171) | 4,846,383 | 134,753,079 |
| Class K | | | | |
| Subscriptions | 362 | 10,225 | 1,669 | 44,525 |
| Distributions reinvested | 1,832 | 48,646 | 916 | 23,311 |
| Redemptions | (15,939) | (457,104) | (6,980) | (187,437) |
| Net decrease | (13,745) | (398,233) | (4,395) | (119,601) |
| Class R | | | | |
| Subscriptions | 134,778 | 3,410,677 | 133,432 | 3,252,287 |
| Distributions reinvested | 35,729 | 856,409 | 26,856 | 625,485 |
| Redemptions | (276,570) | (7,270,777) | (260,876) | (6,288,941) |
| Net decrease | (106,063) | (3,003,691) | (100,588) | (2,411,169) |
| Class T | | | | |
| Distributions reinvested | 655 | 16,346 | 344 | 8,307 |
| Redemptions | (2,442) | (62,892) | (1,264) | (31,549) |
| Net decrease | (1,787) | (46,546) | (920) | (23,242) |
The accompanying Notes to Financial Statements are an integral part of this statement.
Columbia Mid Cap Growth Fund | Annual Report 2018
| 15 |
Statement of Changes in Net Assets (continued)
| | Year Ended | Year Ended |
| | August 31, 2018 | August 31, 2017 |
| | Shares | Dollars ($) | Shares | Dollars ($) |
| Class V | | | | |
| Subscriptions | 30,854 | 827,255 | 9,109 | 222,930 |
| Distributions reinvested | 100,223 | 2,491,545 | 45,154 | 1,085,510 |
| Redemptions | (76,862) | (2,063,356) | (71,597) | (1,805,454) |
| Net increase (decrease) | 54,215 | 1,255,444 | (17,334) | (497,014) |
| Total net decrease | (975,307) | (40,756,164) | (6,153,109) | (158,772,541) |
The accompanying Notes to Financial Statements are an integral part of this statement.
| 16 | Columbia Mid Cap Growth Fund | Annual Report 2018 |
[THIS PAGE INTENTIONALLY LEFT BLANK]
Columbia Mid Cap Growth Fund | Annual Report 2018
| 17 |
The following table is intended to help you understand the Fund’s financial performance. Certain information reflects financial results for a single share of a class held for the periods shown. Per share net investment income (loss) amounts are calculated based on average shares outstanding during the period. Total return assumes reinvestment of all dividends and distributions, if any. Total return does not reflect payment of sales charges, if any. Total return and portfolio turnover are not annualized for periods of less than one year. The portfolio turnover rate is calculated without regard to purchase and sales transactions of short-term instruments and certain derivatives, if any. If such transactions were included, the Fund’s portfolio turnover rate may be higher.
| | Net asset value,
beginning of
period | Net
investment
income
(loss) | Net
realized
and
unrealized
gain (loss) | Total from
investment
operations | Distributions
from net
investment
income | Distributions
from net
realized
gains | Total
distributions to
shareholders |
| Class A |
| Year Ended 8/31/2018 | $26.90 | (0.10) | 5.54 | 5.44 | — | (3.51) | (3.51) |
| Year Ended 8/31/2017 | $25.09 | (0.09) | 3.42 | 3.33 | — | (1.52) | (1.52) |
| Year Ended 8/31/2016 | $28.69 | (0.06) | 0.84 | 0.78 | (0.26) | (4.12) | (4.38) |
| Year Ended 8/31/2015 | $32.14 | 0.25 (d) | 1.29 | 1.54 | — | (4.99) | (4.99) |
| Year Ended 8/31/2014 | $29.89 | (0.13) | 5.45 | 5.32 | — | (3.07) | (3.07) |
| Advisor Class |
| Year Ended 8/31/2018 | $29.26 | (0.05) | 6.07 | 6.02 | — | (3.57) | (3.57) |
| Year Ended 8/31/2017 | $27.12 | (0.03) | 3.71 | 3.68 | — | (1.54) | (1.54) |
| Year Ended 8/31/2016 | $30.67 | 0.00 (e) | 0.91 | 0.91 | (0.34) | (4.12) | (4.46) |
| Year Ended 8/31/2015 | $33.99 | 1.93 (d) | (0.21) (f) | 1.72 | — | (5.04) | (5.04) |
| Year Ended 8/31/2014 | $31.42 | (0.03) | 5.72 | 5.69 | — | (3.12) | (3.12) |
| Class C |
| Year Ended 8/31/2018 | $22.91 | (0.26) | 4.64 | 4.38 | — | (3.30) | (3.30) |
| Year Ended 8/31/2017 | $21.70 | (0.24) | 2.93 | 2.69 | — | (1.48) | (1.48) |
| Year Ended 8/31/2016 | $25.34 | (0.21) | 0.72 | 0.51 | (0.03) | (4.12) | (4.15) |
| Year Ended 8/31/2015 | $28.99 | 0.03 (d) | 1.15 | 1.18 | — | (4.83) | (4.83) |
| Year Ended 8/31/2014 | $27.30 | (0.33) | 4.95 | 4.62 | — | (2.93) | (2.93) |
| Institutional Class |
| Year Ended 8/31/2018 | $28.52 | (0.04) | 5.89 | 5.85 | — | (3.57) | (3.57) |
| Year Ended 8/31/2017 | $26.46 | (0.03) | 3.63 | 3.60 | — | (1.54) | (1.54) |
| Year Ended 8/31/2016 | $30.03 | 0.01 | 0.87 | 0.88 | (0.33) | (4.12) | (4.45) |
| Year Ended 8/31/2015 | $33.39 | 0.32 (d) | 1.36 | 1.68 | — | (5.04) | (5.04) |
| Year Ended 8/31/2014 | $30.91 | (0.06) | 5.66 | 5.60 | — | (3.12) | (3.12) |
| Institutional 2 Class |
| Year Ended 8/31/2018 | $28.73 | (0.02) | 5.95 | 5.93 | — | (3.60) | (3.60) |
| Year Ended 8/31/2017 | $26.63 | (0.00) (e) | 3.65 | 3.65 | — | (1.55) | (1.55) |
| Year Ended 8/31/2016 | $30.20 | 0.04 | 0.88 | 0.92 | (0.37) | (4.12) | (4.49) |
| Year Ended 8/31/2015 | $33.54 | 0.40 (d) | 1.33 | 1.73 | — | (5.07) | (5.07) |
| Year Ended 8/31/2014 | $31.03 | 0.03 | 5.63 | 5.66 | — | (3.15) | (3.15) |
The accompanying Notes to Financial Statements are an integral part of this statement.
| 18 | Columbia Mid Cap Growth Fund | Annual Report 2018 |
Financial Highlights (continued)
| | Net
asset
value,
end of
period | Total
return | Total gross
expense
ratio to
average
net assets(a) | Total net
expense
ratio to
average
net assets(a),(b) | Net investment
income (loss)
ratio to
average
net assets | Portfolio
turnover | Net
assets,
end of
period
(000’s) |
| Class A |
| Year Ended 8/31/2018 | $28.83 | 22.23% | 1.16% | 1.16% (c) | (0.38%) | 140% | $922,862 |
| Year Ended 8/31/2017 | $26.90 | 13.97% | 1.19% | 1.19% (c) | (0.37%) | 119% | $834,347 |
| Year Ended 8/31/2016 | $25.09 | 2.83% | 1.19% | 1.19% (c) | (0.23%) | 130% | $880,155 |
| Year Ended 8/31/2015 | $28.69 | 5.33% | 1.19% | 1.19% (c) | 0.83% | 101% | $948,826 |
| Year Ended 8/31/2014 | $32.14 | 18.77% | 1.19% | 1.19% (c) | (0.42%) | 100% | $995,730 |
| Advisor Class |
| Year Ended 8/31/2018 | $31.71 | 22.50% | 0.91% | 0.91% (c) | (0.16%) | 140% | $15,488 |
| Year Ended 8/31/2017 | $29.26 | 14.24% | 0.94% | 0.94% (c) | (0.11%) | 119% | $35,473 |
| Year Ended 8/31/2016 | $27.12 | 3.10% | 0.94% | 0.94% (c) | 0.02% | 130% | $26,945 |
| Year Ended 8/31/2015 | $30.67 | 5.61% | 0.93% | 0.93% (c) | 6.10% | 101% | $26,912 |
| Year Ended 8/31/2014 | $33.99 | 19.05% | 0.94% | 0.94% (c) | (0.08%) | 100% | $373 |
| Class C |
| Year Ended 8/31/2018 | $23.99 | 21.27% | 1.91% | 1.91% (c) | (1.15%) | 140% | $17,458 |
| Year Ended 8/31/2017 | $22.91 | 13.12% | 1.94% | 1.94% (c) | (1.12%) | 119% | $41,030 |
| Year Ended 8/31/2016 | $21.70 | 2.05% | 1.94% | 1.94% (c) | (0.98%) | 130% | $46,355 |
| Year Ended 8/31/2015 | $25.34 | 4.56% | 1.94% | 1.94% (c) | 0.11% | 101% | $51,859 |
| Year Ended 8/31/2014 | $28.99 | 17.84% | 1.94% | 1.94% (c) | (1.17%) | 100% | $52,845 |
| Institutional Class |
| Year Ended 8/31/2018 | $30.80 | 22.49% | 0.91% | 0.91% (c) | (0.13%) | 140% | $758,444 |
| Year Ended 8/31/2017 | $28.52 | 14.29% | 0.94% | 0.94% (c) | (0.12%) | 119% | $679,866 |
| Year Ended 8/31/2016 | $26.46 | 3.09% | 0.94% | 0.94% (c) | 0.02% | 130% | $813,009 |
| Year Ended 8/31/2015 | $30.03 | 5.58% | 0.94% | 0.94% (c) | 1.01% | 101% | $938,781 |
| Year Ended 8/31/2014 | $33.39 | 19.07% | 0.94% | 0.94% (c) | (0.17%) | 100% | $1,149,098 |
| Institutional 2 Class |
| Year Ended 8/31/2018 | $31.06 | 22.60% | 0.83% | 0.83% | (0.06%) | 140% | $48,792 |
| Year Ended 8/31/2017 | $28.73 | 14.40% | 0.84% | 0.84% | (0.01%) | 119% | $51,118 |
| Year Ended 8/31/2016 | $26.63 | 3.21% | 0.83% | 0.83% | 0.14% | 130% | $36,964 |
| Year Ended 8/31/2015 | $30.20 | 5.72% | 0.82% | 0.82% | 1.28% | 101% | $37,589 |
| Year Ended 8/31/2014 | $33.54 | 19.21% | 0.81% | 0.81% | 0.09% | 100% | $31,305 |
The accompanying Notes to Financial Statements are an integral part of this statement.
Columbia Mid Cap Growth Fund | Annual Report 2018
| 19 |
Financial Highlights (continued)
| | Net asset value,
beginning of
period | Net
investment
income
(loss) | Net
realized
and
unrealized
gain (loss) | Total from
investment
operations | Distributions
from net
investment
income | Distributions
from net
realized
gains | Total
distributions to
shareholders |
| Institutional 3 Class |
| Year Ended 8/31/2018 | $28.74 | (0.00) (e) | 5.94 | 5.94 | — | (3.61) | (3.61) |
| Year Ended 8/31/2017 | $26.63 | 0.03 | 3.63 | 3.66 | — | (1.55) | (1.55) |
| Year Ended 8/31/2016 | $30.21 | 0.03 | 0.91 | 0.94 | (0.40) | (4.12) | (4.52) |
| Year Ended 8/31/2015 | $33.53 | 0.05 (d) | 1.71 | 1.76 | — | (5.08) | (5.08) |
| Year Ended 8/31/2014 | $31.01 | 0.01 | 5.66 | 5.67 | — | (3.15) | (3.15) |
| Class R |
| Year Ended 8/31/2018 | $25.93 | (0.16) | 5.31 | 5.15 | — | (3.44) | (3.44) |
| Year Ended 8/31/2017 | $24.27 | (0.15) | 3.31 | 3.16 | — | (1.50) | (1.50) |
| Year Ended 8/31/2016 | $27.88 | (0.12) | 0.81 | 0.69 | (0.18) | (4.12) | (4.30) |
| Year Ended 8/31/2015 | $31.39 | 0.15 (d) | 1.28 | 1.43 | — | (4.94) | (4.94) |
| Year Ended 8/31/2014 | $29.28 | (0.20) | 5.33 | 5.13 | — | (3.02) | (3.02) |
| Class T |
| Year Ended 8/31/2018 | $26.91 | (0.10) | 5.53 | 5.43 | — | (3.51) | (3.51) |
| Year Ended 8/31/2017 | $25.09 | (0.09) | 3.43 | 3.34 | — | (1.52) | (1.52) |
| Year Ended 8/31/2016 | $28.69 | (0.06) | 0.84 | 0.78 | (0.26) | (4.12) | (4.38) |
| Year Ended 8/31/2015 | $32.15 | 0.21 (d) | 1.33 | 1.54 | — | (5.00) | (5.00) |
| Year Ended 8/31/2014 | $29.91 | (0.23) | 5.54 | 5.31 | — | (3.07) | (3.07) |
| Class V |
| Year Ended 8/31/2018 | $26.81 | (0.10) | 5.51 | 5.41 | — | (3.51) | (3.51) |
| Year Ended 8/31/2017 | $25.01 | (0.09) | 3.41 | 3.32 | — | (1.52) | (1.52) |
| Year Ended 8/31/2016 | $28.61 | (0.06) | 0.83 | 0.77 | (0.25) | (4.12) | (4.37) |
| Year Ended 8/31/2015 | $32.05 | 0.24 (d) | 1.30 | 1.54 | — | (4.98) | (4.98) |
| Year Ended 8/31/2014 | $29.82 | (0.14) | 5.43 | 5.29 | — | (3.06) | (3.06) |
| Notes to Financial Highlights |
| (a) | In addition to the fees and expenses that the Fund bears directly, the Fund indirectly bears a pro rata share of the fees and expenses of any other funds in which it invests. Such indirect expenses are not included in the Fund’s reported expense ratios. |
| (b) | Total net expenses include the impact of certain fee waivers/expense reimbursements made by the Investment Manager and certain of its affiliates, if applicable. |
| (c) | The benefits derived from expense reductions had an impact of less than 0.01%. |
| (d) | Net investment income per share includes special dividends. The per share effect of these dividends amounted to: |
| Year Ended | Class A | Advisor
Class | Class C | Institutional
Class | Institutional 2
Class | Institutional 3
Class | Class K | Class R | Class T | Class V |
| 08/31/2015 | $ 0.35 | $ 2.00 | $ 0.32 | $ 0.34 | $ 0.39 | $ 0.04 | $ 0.40 | $ 0.32 | $ 0.31 | $ 0.34 |
| (e) | Rounds to zero. |
| (f) | Calculation of the net gain (loss) per share (both realized and unrealized) does not correlate to the aggregate realized and unrealized gain (loss) presented in the Statement of Operations due to the timing of subscriptions and redemptions of Fund shares in relation to fluctuations in the market value of the portfolio. |
The accompanying Notes to Financial Statements are an integral part of this statement.
| 20 | Columbia Mid Cap Growth Fund | Annual Report 2018 |
Financial Highlights (continued)
| | Net
asset
value,
end of
period | Total
return | Total gross
expense
ratio to
average
net assets(a) | Total net
expense
ratio to
average
net assets(a),(b) | Net investment
income (loss)
ratio to
average
net assets | Portfolio
turnover | Net
assets,
end of
period
(000’s) |
| Institutional 3 Class |
| Year Ended 8/31/2018 | $31.07 | 22.66% | 0.78% | 0.78% | (0.01%) | 140% | $135,728 |
| Year Ended 8/31/2017 | $28.74 | 14.45% | 0.79% | 0.79% | 0.11% | 119% | $145,597 |
| Year Ended 8/31/2016 | $26.63 | 3.27% | 0.79% | 0.79% | 0.13% | 130% | $5,869 |
| Year Ended 8/31/2015 | $30.21 | 5.83% | 0.73% | 0.73% | 0.15% | 101% | $3 |
| Year Ended 8/31/2014 | $33.53 | 19.24% | 0.75% | 0.75% | 0.02% | 100% | $250 |
| Class R |
| Year Ended 8/31/2018 | $27.64 | 21.89% | 1.41% | 1.41% (c) | (0.63%) | 140% | $13,414 |
| Year Ended 8/31/2017 | $25.93 | 13.71% | 1.44% | 1.44% (c) | (0.62%) | 119% | $15,333 |
| Year Ended 8/31/2016 | $24.27 | 2.58% | 1.44% | 1.44% (c) | (0.48%) | 130% | $16,796 |
| Year Ended 8/31/2015 | $27.88 | 5.06% | 1.44% | 1.44% (c) | 0.52% | 101% | $18,965 |
| Year Ended 8/31/2014 | $31.39 | 18.47% | 1.44% | 1.44% (c) | (0.67%) | 100% | $24,965 |
| Class T |
| Year Ended 8/31/2018 | $28.83 | 22.19% | 1.16% | 1.16% (c) | (0.37%) | 140% | $90 |
| Year Ended 8/31/2017 | $26.91 | 14.01% | 1.19% | 1.19% (c) | (0.37%) | 119% | $132 |
| Year Ended 8/31/2016 | $25.09 | 2.83% | 1.19% | 1.19% (c) | (0.24%) | 130% | $146 |
| Year Ended 8/31/2015 | $28.69 | 5.32% | 1.19% | 1.19% (c) | 0.71% | 101% | $201 |
| Year Ended 8/31/2014 | $32.15 | 18.71% | 1.14% | 1.14% (c) | (0.69%) | 100% | $284 |
| Class V |
| Year Ended 8/31/2018 | $28.71 | 22.19% | 1.16% | 1.16% (c) | (0.37%) | 140% | $25,566 |
| Year Ended 8/31/2017 | $26.81 | 13.97% | 1.19% | 1.19% (c) | (0.36%) | 119% | $22,419 |
| Year Ended 8/31/2016 | $25.01 | 2.83% | 1.19% | 1.19% (c) | (0.23%) | 130% | $21,346 |
| Year Ended 8/31/2015 | $28.61 | 5.34% | 1.20% | 1.20% (c) | 0.80% | 101% | $22,590 |
| Year Ended 8/31/2014 | $32.05 | 18.69% | 1.24% | 1.24% (c) | (0.47%) | 100% | $23,951 |
The accompanying Notes to Financial Statements are an integral part of this statement.
Columbia Mid Cap Growth Fund | Annual Report 2018
| 21 |
Notes to Financial Statements
August 31, 2018
Note 1. Organization
Columbia Mid Cap Growth Fund (the Fund), a series of Columbia Funds Series Trust I (the Trust), is a diversified fund. The Trust is registered under the Investment Company Act of 1940, as amended (the 1940 Act), as an open-end management investment company organized as a Massachusetts business trust.
Fund shares
The Trust may issue an unlimited number of shares (without par value). Although all share classes generally have identical voting, dividend and liquidation rights, each share class votes separately when required by the Trust’s organizational documents or by law. Different share classes pay different distribution amounts to the extent the expenses of such share classes differ, and distributions in liquidation will be proportional to the net asset value of each share class. Each share class has its own expense and sales charge structure. The Fund offers each of the share classes identified below.
Class A shares are subject to a maximum front-end sales charge of 5.75% based on the initial investment amount. Class A shares purchased without an initial sales charge in accounts aggregating $1 million to $50 million at the time of purchase are subject to a contingent deferred sales charge (CDSC) if the shares are sold within 18 months after purchase, charged as follows: 1.00% CDSC if redeemed within 12 months after purchase, and 0.50% CDSC if redeemed more than 12, but less than 18, months after purchase.
Advisor Class shares are not subject to sales charges and are generally available only to omnibus retirement plans and certain investors as described in the Fund’s prospectus. Prior to November 1, 2017, Advisor Class shares were known as Class R4 shares.
Class C shares are subject to a 1.00% CDSC on shares redeemed within 12 months after purchase. Effective July 1, 2018, Class C shares will automatically convert to Class A shares of the same Fund in the month of or the month following the 10-year anniversary of the Class C shares purchase date.
Institutional Class shares are not subject to sales charges and are generally available only to eligible investors, which are subject to different investment minimums as described in the Fund’s prospectus. Prior to November 1, 2017, Institutional Class shares were known as Class Z shares.
Institutional 2 Class shares are not subject to sales charges and are generally available only to investors purchasing through authorized investment professionals and omnibus retirement plans as described in the Fund’s prospectus. Prior to November 1, 2017, Institutional 2 Class shares were known as Class R5 shares.
Institutional 3 Class shares are not subject to sales charges and are available to institutional and certain other investors as described in the Fund’s prospectus. Prior to November 1, 2017, Institutional 3 Class shares were known as Class Y shares.
The Fund no longer accepts investments by existing investors in Class K shares. When available, Class K shares were not subject to sales charges and were made available only to existing investors in Class K shares. On March 9, 2018, Class K shares were redeemed or exchanged for Advisor Class shares of the Fund in a tax free transaction that had no impact on fees and expenses paid by the shareholders.
Class R shares are not subject to sales charges and are generally available only to certain retirement plans and other investors as described in the Fund’s prospectus.
Class T shares are subject to a maximum front-end sales charge of 2.50% per transaction and must be purchased through financial intermediaries that, by written agreement with Columbia Management Investment Distributors, Inc., are specifically authorized to sell Class T shares.
Class V shares are subject to a maximum front-end sales charge of 5.75% based on the investment amount. Class V shares purchased without an initial sales charge in accounts aggregating $1 million to $50 million at the time of purchase are subject to a CDSC if the shares are sold within 18 months after purchase, charged as follows: 1.00% CDSC if redeemed within 12 months after purchase, and 0.50% CDSC if redeemed more than 12, but less than 18, months after purchase. Class V shares are available only to investors who received (and who have continuously held) Class V shares in connection with previous fund reorganizations.
| 22 | Columbia Mid Cap Growth Fund | Annual Report 2018 |
Notes to Financial Statements (continued)
August 31, 2018
Note 2. Summary of significant accounting policies
Basis of preparation
The Fund is an investment company that applies the accounting and reporting guidance in the Financial Accounting Standards Board (FASB) Accounting Standards Codification Topic 946, Financial Services - Investment Companies (ASC 946). The financial statements are prepared in accordance with U.S. generally accepted accounting principles (GAAP), which requires management to make certain estimates and assumptions that affect the reported amounts of assets and liabilities, the disclosure of contingent assets and liabilities at the date of the financial statements and the reported amounts of income and expenses during the reporting period. Actual results could differ from those estimates.
The following is a summary of significant accounting policies followed by the Fund in the preparation of its financial statements.
Security valuation
All equity securities are valued at the close of business of the New York Stock Exchange. Equity securities are valued at the last quoted sales price on the principal exchange or market on which they trade, except for securities traded on the NASDAQ Stock Market, which are valued at the NASDAQ official close price. Unlisted securities or listed securities for which there were no sales during the day are valued at the mean of the latest quoted bid and ask prices on such exchanges or markets.
Foreign equity securities are valued based on the closing price on the foreign exchange in which such securities are primarily traded. If any foreign equity security closing prices are not readily available, the securities are valued at the mean of the latest quoted bid and ask prices on such exchanges or markets. Foreign currency exchange rates are generally determined at 4:00 p.m. Eastern (U.S.) time. Many securities markets and exchanges outside the U.S. close prior to the close of the New York Stock Exchange; therefore, the closing prices for securities in such markets or on such exchanges may not fully reflect events that occur after such close but before the close of the New York Stock Exchange. In those situations, foreign securities will be fair valued pursuant to a policy adopted by the Board of Trustees, including, if available, utilizing a third party pricing service to determine these fair values. The third party pricing service takes into account multiple factors, including, but not limited to, movements in the U.S. securities markets, certain depositary receipts, futures contracts and foreign exchange rates that have occurred subsequent to the close of the foreign exchange or market, to determine a good faith estimate that reasonably reflects the current market conditions as of the close of the New York Stock Exchange. The fair value of a security is likely to be different from the quoted or published price, if available.
Investments in open-end investment companies, including money market funds, are valued at their latest net asset value.
Investments for which market quotations are not readily available, or that have quotations which management believes are not reflective of market value or reliable, are valued at fair value as determined in good faith under procedures approved by and under the general supervision of the Board of Trustees. If a security or class of securities (such as foreign securities) is valued at fair value, such value is likely to be different from the quoted or published price for the security.
The determination of fair value often requires significant judgment. To determine fair value, management may use assumptions including but not limited to future cash flows and estimated risk premiums. Multiple inputs from various sources may be used to determine fair value.
GAAP requires disclosure regarding the inputs and valuation techniques used to measure fair value and any changes in valuation inputs or techniques. In addition, investments shall be disclosed by major category. This information is disclosed following the Fund’s Portfolio of Investments.
Derivative instruments
The Fund invests in certain derivative instruments, as detailed below, to meet its investment objectives. Derivatives are instruments whose values depend on, or are derived from, in whole or in part, the value of one or more securities, currencies, commodities, indices, or other assets or instruments. Derivatives may be used to increase investment flexibility (including to maintain cash reserves while maintaining desired exposure to certain assets), for risk management (hedging) purposes, to facilitate trading, to reduce transaction costs and to pursue higher investment returns. The Fund may also use
Columbia Mid Cap Growth Fund | Annual Report 2018
| 23 |
Notes to Financial Statements (continued)
August 31, 2018
derivative instruments to mitigate certain investment risks, such as foreign currency exchange rate risk, interest rate risk and credit risk. Derivatives may involve various risks, including the potential inability of the counterparty to fulfill its obligations under the terms of the contract, the potential for an illiquid secondary market (making it difficult for the Fund to sell or terminate, including at favorable prices) and the potential for market movements which may expose the Fund to gains or losses in excess of the amount shown in the Statement of Assets and Liabilities. The notional amounts of derivative instruments, if applicable, are not recorded in the financial statements.
A derivative instrument may suffer a marked-to-market loss if the value of the contract decreases due to an unfavorable change in the market rates or values of the underlying instrument. Losses can also occur if the counterparty does not perform its obligations under the contract. The Fund’s risk of loss from counterparty credit risk on over-the-counter derivatives is generally limited to the aggregate unrealized gain netted against any collateral held by the Fund and the amount of any variation margin held by the counterparty, plus any replacement costs or related amounts. With exchange-traded or centrally cleared derivatives, there is reduced counterparty credit risk to the Fund since the clearinghouse or central counterparty (CCP) provides some protection in the case of clearing member default. The clearinghouse or CCP stands between the buyer and the seller of the contract; therefore, additional counterparty credit risk is failure of the clearinghouse or CCP. However, credit risk still exists in exchange-traded or centrally cleared derivatives with respect to initial and variation margin that is held in a broker’s customer account. While brokers are required to segregate customer margin from their own assets, in the event that a broker becomes insolvent or goes into bankruptcy and at that time there is a shortfall in the aggregate amount of margin held by the broker for all its clients, U.S. bankruptcy laws will typically allocate that shortfall on a pro-rata basis across all the broker’s customers (including the Fund), potentially resulting in losses to the Fund.
In order to better define its contractual rights and to secure rights that will help the Fund mitigate its counterparty risk, the Fund may enter into an International Swaps and Derivatives Association, Inc. Master Agreement (ISDA Master Agreement) or similar agreement with its derivatives contract counterparties. An ISDA Master Agreement is an agreement between the Fund and a counterparty that governs over-the-counter derivatives and typically contains, among other things, collateral posting terms and netting provisions in the event of a default and/or termination event. Under an ISDA Master Agreement, the Fund may, under certain circumstances, offset with the counterparty certain derivative instrument’s payables and/or receivables with collateral held and/or posted and create one single net payment. The provisions of the ISDA Master Agreement typically permit a single net payment in the event of default (close-out netting), including the bankruptcy or insolvency of the counterparty. Note, however, that bankruptcy or insolvency laws of a particular jurisdiction may impose restrictions on or prohibitions against the right of offset or netting in bankruptcy, insolvency or other events.
Collateral (margin) requirements differ by type of derivative. Margin requirements are established by the clearinghouse or CCP for exchange-traded and centrally cleared derivatives. Brokers can ask for margin in excess of the minimum in certain circumstances. Collateral terms are contract specific for over-the-counter derivatives. For over-the-counter derivatives traded under an ISDA Master Agreement, the collateral requirements are typically calculated by netting the marked-to-market amount for each transaction under such agreement and comparing that amount to the value of any variation margin currently pledged by the Fund and/or the counterparty. Generally, the amount of collateral due from or to a party has to exceed a minimum transfer amount threshold (e.g., $250,000) before a transfer has to be made. To the extent amounts due to the Fund from its counterparties are not fully collateralized, contractually or otherwise, the Fund bears the risk of loss from counterparty nonperformance. The Fund may also pay interest expense on cash collateral received from the broker. Any interest expense paid by the Fund is shown on the Statement of Operations. The Fund attempts to mitigate counterparty risk by only entering into agreements with counterparties that it believes have the financial resources to honor their obligations and by monitoring the financial stability of those counterparties.
Certain ISDA Master Agreements allow counterparties of over-the-counter derivatives transactions to terminate derivatives contracts prior to maturity in the event the Fund’s net asset value declines by a stated percentage over a specified time period or if the Fund fails to meet certain terms of the ISDA Master Agreement, which would cause the Fund to accelerate payment of any net liability owed to the counterparty. The Fund also has termination rights if the counterparty fails to meet certain terms of the ISDA Master Agreement. In determining whether to exercise such termination rights, the Fund would consider, in addition to counterparty credit risk, whether termination would result in a net liability owed from the counterparty.
For financial reporting purposes, the Fund does not offset derivative assets and derivative liabilities that are subject to netting arrangements in the Statement of Assets and Liabilities.
| 24 | Columbia Mid Cap Growth Fund | Annual Report 2018 |
Notes to Financial Statements (continued)
August 31, 2018
Options contracts
Options are contracts which entitle the holder to purchase or sell securities or other identified assets at a specified price, or in the case of index option contracts, to receive or pay the difference between the index value and the strike price of the index option contract. Option contracts can be either exchange-traded or over-the-counter. The Fund wrote option contracts to decrease the Fund’s exposure to equity market risk and to increase return on investments. These instruments may be used for other purposes in future periods. Completion of transactions for option contracts traded in the over-the-counter market depends upon the performance of the other party. Cash collateral may be collected or posted by the Fund to secure certain over-the-counter option contract trades. Cash collateral held or posted by the Fund for such option contract trades must be returned to the broker or the Fund upon closure, exercise or expiration of the contract.
Options contracts purchased are recorded as investments. When the Fund writes an options contract, the premium received is recorded as an asset and an amount equivalent to the premium is recorded as a liability in the Statement of Assets and Liabilities and is subsequently adjusted to reflect the current fair value of the option written. Changes in the fair value of the written option are recorded as unrealized appreciation or depreciation until the contract is exercised or has expired. The Fund will realize a gain or loss when the option contract is closed or expires. When option contracts are exercised, the proceeds on sales for a written call or purchased put option contract, or the purchase cost for a written put or purchased call option contract, is adjusted by the amount of premium received or paid.
For over-the-counter options purchased, the Fund bears the risk of loss of the amount of the premiums paid plus the positive change in market values net of any collateral held by the Fund should the counterparty fail to perform under the contracts. Option contracts written by the Fund do not typically give rise to significant counterparty credit risk, as options written generally obligate the Fund and not the counterparty to perform. The risk in writing a call option contract is that the Fund gives up the opportunity for profit if the market price of the security increases above the strike price and the option contract is exercised. The risk in writing a put option contract is that the Fund may incur a loss if the market price of the security decreases below the strike price and the option contract is exercised. Exercise of a written option could result in the Fund purchasing or selling a security or foreign currency when it otherwise would not, or at a price different from the current market value. In purchasing and writing options, the Fund bears the risk of an unfavorable change in the value of the underlying instrument or the risk that the Fund may not be able to enter into a closing transaction due to an illiquid market.
Effects of derivative transactions in the financial statements
The following tables are intended to provide additional information about the effect of derivatives on the financial statements of the Fund, including: the fair value of derivatives by risk category and the location of those fair values in the Statement of Assets and Liabilities; and the impact of derivative transactions over the period in the Statement of Operations, including realized and unrealized gains (losses). The derivative instrument schedules following the Portfolio of Investments present additional information regarding derivative instruments outstanding at the end of the period, if any.
The following table indicates the effect of derivative instruments (not considered to be hedging instruments for accounting disclosure purposes) in the Statement of Operations for the year ended August 31, 2018:
| Amount of realized gain (loss) on derivatives recognized in income |
| Risk exposure category | Options
contracts
written
($) |
| Equity risk | (1,521,291) |
The following table is a summary of the average outstanding volume by derivative instrument for the year ended August 31, 2018:
| Derivative instrument | Average
value ($)* |
| Options contracts — written | (636,128) |
| * | Based on the ending daily outstanding amounts for the year ended August 31, 2018. |
Columbia Mid Cap Growth Fund | Annual Report 2018
| 25 |
Notes to Financial Statements (continued)
August 31, 2018
Security transactions
Security transactions are accounted for on the trade date. Cost is determined and gains (losses) are based upon the specific identification method for both financial statement and federal income tax purposes.
Income recognition
Corporate actions and dividend income are generally recorded net of any non-reclaimable tax withholdings, on the ex-dividend date or upon receipt of ex-dividend notification in the case of certain foreign securities.
The Fund may receive distributions from holdings in equity securities, business development companies (BDCs), exchange-traded funds (ETFs), limited partnerships (LPs), other regulated investment companies (RICs), and real estate investment trusts (REITs), which report information on the tax character of their distributions annually. These distributions are allocated to dividend income, capital gain and return of capital based on actual information reported. Return of capital is recorded as a reduction of the cost basis of securities held. If the Fund no longer owns the applicable securities, return of capital is recorded as a realized gain. With respect to REITs, to the extent actual information has not yet been reported, estimates for return of capital are made by the Fund’s management. Management’s estimates are subsequently adjusted when the actual character of the distributions is disclosed by the REITs, which could result in a proportionate change in return of capital to shareholders.
Awards from class action litigation are recorded as a reduction of cost basis if the Fund still owns the applicable securities on the payment date. If the Fund no longer owns the applicable securities, the proceeds are recorded as realized gains.
Expenses
General expenses of the Trust are allocated to the Fund and other funds of the Trust based upon relative net assets or other expense allocation methodologies determined by the nature of the expense. Expenses directly attributable to the Fund are charged to the Fund. Expenses directly attributable to a specific class of shares are charged to that share class.
Determination of class net asset value
All income, expenses (other than class-specific expenses, which are charged to that share class, as shown in the Statement of Operations) and realized and unrealized gains (losses) are allocated to each class of the Fund on a daily basis, based on the relative net assets of each class, for purposes of determining the net asset value of each class.
Federal income tax status
The Fund intends to qualify each year as a regulated investment company under Subchapter M of the Internal Revenue Code, as amended, and will distribute substantially all of its investment company taxable income and net capital gain, if any, for its tax year, and as such will not be subject to federal income taxes. In addition, the Fund intends to distribute in each calendar year substantially all of its ordinary income, capital gain net income and certain other amounts, if any, such that the Fund should not be subject to federal excise tax. Therefore, no federal income or excise tax provision is recorded.
Distributions to shareholders
Distributions from net investment income, if any, are declared and paid annually. Net realized capital gains, if any, are distributed at least annually. Income distributions and capital gain distributions are determined in accordance with federal income tax regulations, which may differ from GAAP.
Guarantees and indemnifications
Under the Trust’s organizational documents and, in some cases, by contract, its officers and trustees are indemnified against certain liabilities arising out of the performance of their duties to the Trust or its funds. In addition, certain of the Fund’s contracts with its service providers contain general indemnification clauses. The Fund’s maximum exposure under these arrangements is unknown since the amount of any future claims that may be made against the Fund cannot be determined, and the Fund has no historical basis for predicting the likelihood of any such claims.
| 26 | Columbia Mid Cap Growth Fund | Annual Report 2018 |
Notes to Financial Statements (continued)
August 31, 2018
Recent accounting pronouncement
Accounting Standards Update 2017-08 Premium Amortization on Purchased Callable Debt Securities
In March 2017, the Financial Accounting Standards Board issued Accounting Standards Update (ASU) No. 2017-08 Premium Amortization on Purchased Callable Debt Securities. ASU No. 2017-08 updates the accounting standards to shorten the amortization period for certain purchased callable debt securities, held at a premium, to be amortized to the earliest call date. The update applies to securities with explicit, noncontingent call features that are callable at fixed prices and on preset dates. The standard is effective for annual periods beginning after December 15, 2018 and interim periods within those fiscal years. At this time, management is evaluating the implication of this guidance and the impact it will have on the financial statement amounts and footnote disclosures, if any.
Note 3. Fees and other transactions with affiliates
Management services fees
The Fund has entered into a Management Agreement with Columbia Management Investment Advisers, LLC (the Investment Manager), a wholly-owned subsidiary of Ameriprise Financial, Inc. (Ameriprise Financial). Under the Management Agreement, the Investment Manager provides the Fund with investment research and advice, as well as administrative and accounting services. The management services fee is an annual fee that is equal to a percentage of the Fund’s daily net assets that declines from 0.82% to 0.65% as the Fund’s net assets increase. The effective management services fee rate for the year ended August 31, 2018 was 0.75% of the Fund’s average daily net assets.
Participating Affiliates
The Investment Manager and its investment advisory affiliates (Affiliates) may coordinate in providing services to their clients. From time to time, the Investment Manager may engage its Affiliates to provide a variety of services such as investment research, investment monitoring, trading and discretionary investment management (including portfolio management) to certain accounts managed by the Investment Manager, including the Fund. These Affiliates will provide services to the Investment Manager pursuant to personnel-sharing agreements or similar inter-company arrangements and the Fund will pay no additional fees and expenses as a result of any such arrangements.
These Affiliates, like the Investment Manager, are direct or indirect subsidiaries of Ameriprise Financial and are registered with the appropriate respective regulators and, where required, the Securities and Exchange Commission and the Commodity Futures Trading Commission in the United States. Pursuant to some of these arrangements, certain employees of these Affiliates may serve as “associated persons” of the Investment Manager and, in this capacity, subject to the oversight and supervision of the Investment Manager and consistent with the investment objectives, policies and limitations set forth in the Fund’s prospectus and SAI, may provide such services to the Fund on behalf of the Investment Manager.
Compensation of board members
Members of the Board of Trustees who are not officers or employees of the Investment Manager or Ameriprise Financial are compensated for their services to the Fund as disclosed in the Statement of Operations. These members of the Board of Trustees may participate in a Deferred Compensation Plan (the Plan) which may be terminated at any time. Obligations of the Plan will be paid solely out of the Fund’s assets, and all amounts payable under the Plan constitute a general unsecured obligation of the Fund.
Compensation of Chief Compliance Officer
The Board of Trustees has appointed a Chief Compliance Officer to the Fund in accordance with federal securities regulations. As disclosed in the Statement of Operations, a portion of the Chief Compliance Officer’s total compensation is allocated to the Fund, along with other allocations to affiliated funds governed by the Board of Trustees, based on relative net assets.
Columbia Mid Cap Growth Fund | Annual Report 2018
| 27 |
Notes to Financial Statements (continued)
August 31, 2018
Transfer agency fees
Under a Transfer and Dividend Disbursing Agent Agreement, Columbia Management Investment Services Corp. (the Transfer Agent), an affiliate of the Investment Manager and a wholly-owned subsidiary of Ameriprise Financial, is responsible for providing transfer agency services to the Fund. The Transfer Agent has contracted with DST Asset Manager Solutions, Inc. (DST) to serve as sub-transfer agent. The Transfer Agent pays the fees of DST for services as sub-transfer agent and DST is not entitled to reimbursement for such fees from the Fund (with the exception of out-of-pocket fees).
The Fund pays the Transfer Agent a monthly transfer agency fee based on the number or the average value of accounts, depending on the type of account. In addition, the Fund pays the Transfer Agent a fee for shareholder services based on the number of accounts or on a percentage of the average aggregate value of the Fund’s shares maintained in omnibus accounts up to the lesser of the amount charged by the financial intermediary or a cap established by the Board of Trustees from time to time.
The Transfer Agent also receives compensation from the Fund for various shareholder services and reimbursements for certain out-of-pocket fees. Total transfer agency fees for Class K, Institutional 2 Class and Institutional 3 Class shares are subject to an annual limitation of not more than 0.07%, 0.07% and 0.02%, respectively, of the average daily net assets attributable to each share class.
For the year ended August 31, 2018, the Fund’s effective transfer agency fee rates as a percentage of average daily net assets of each class were as follows:
| | Effective rate (%) |
| Class A | 0.14 |
| Advisor Class | 0.14 |
| Class C | 0.14 |
| Institutional Class | 0.14 |
| Institutional 2 Class | 0.06 |
| Institutional 3 Class | 0.01 |
| Class K | 0.03 (a) |
| Class R | 0.14 |
| Class T | 0.14 |
| Class V | 0.14 |
The Fund and certain other associated investment companies have severally, but not jointly, guaranteed the performance and observance of all the terms and conditions of a lease entered into by Seligman Data Corp. (SDC), the former transfer agent, including the payment of rent by SDC (the Guaranty). SDC was the legacy Seligman funds’ former transfer agent.
The lease and the Guaranty expire in January 2019. At August 31, 2018, the Fund’s total potential future obligation over the life of the Guaranty is $21,366. The liability remaining at August 31, 2018 for non-recurring charges associated with the lease amounted to $2,138 and is recorded as a part of the payable for other expenses in the Statement of Assets and Liabilities. SDC is owned by six associated investment companies, including the Fund. The Fund’s ownership interest in SDC at August 31, 2018 is recorded as a part of other assets in the Statement of Assets and Liabilities at a cost of $2,199, which approximates the fair value of the ownership interest.
An annual minimum account balance fee of $20 may apply to certain accounts with a value below the applicable share class’s initial minimum investment requirements to reduce the impact of small accounts on transfer agency fees. These minimum account balance fees are remitted to the Fund and recorded as part of expense reductions in the Statement of Operations. For the year ended August 31, 2018, these minimum account balance fees reduced total expenses of the Fund by $4,500.
| 28 | Columbia Mid Cap Growth Fund | Annual Report 2018 |
Notes to Financial Statements (continued)
August 31, 2018
Plan administration fees
Under a Plan Administration Services Agreement with the Transfer Agent, the Fund paid an annual fee at a rate of 0.25% of the Fund’s average daily net assets attributable to Class K shares for the provision of various administrative, recordkeeping, communication and educational services. As a result of all Class K shares of the Fund being redeemed or exchanged for Advisor Class shares, March 9, 2018 was the last day the Fund paid a plan administration fee for Class K shares.
Distribution and service fees
The Fund has entered into an agreement with Columbia Management Investment Distributors, Inc. (the Distributor), an affiliate of the Investment Manager and a wholly-owned subsidiary of Ameriprise Financial, for distribution and shareholder services. The Board of Trustees has approved, and the Fund has adopted, distribution and shareholder service plans (the Plans) applicable to certain share classes, which set the distribution and service fees for the Fund. These fees are calculated daily and are intended to compensate the Distributor and/or eligible selling and/or servicing agents for selling shares of the Fund and providing services to investors.
Under the Plans, the Fund pays a monthly service fee to the Distributor at the maximum annual rate of 0.25% of the average daily net assets attributable to Class A, Class C and Class T shares of the Fund. Also under the Plans, the Fund pays a monthly distribution fee to the Distributor at the maximum annual rates of 0.10%, 0.75%, 0.50% and 0.25% of the average daily net assets attributable to Class A, Class C, Class R and Class T shares of the Fund, respectively.
Although the Fund may pay distribution and service fees up to a maximum annual rate of 0.35% of the Fund’s average daily net assets attributable to Class A shares (comprised of up to 0.10% for distribution services and up to 0.25% for shareholder liaison services), the Fund currently limits such fees to an aggregate fee of not more than 0.25% of the Fund’s average daily net assets attributable to Class A shares.
Although the Fund may pay a distribution fee up to 0.25% of the Fund’s average daily net assets attributable to Class T shares and a service fee of up to 0.25% of the Fund’s average daily net assets attributable to Class T shares, the aggregate fee shall not exceed 0.25% of the Fund’s average daily net assets attributable to Class T shares.
Shareholder services fees
The Fund has adopted a shareholder services plan that permits it to pay for certain services provided to Class V shareholders by their selling and/or servicing agents. The Fund may pay shareholder servicing fees up to an aggregate annual rate of 0.50% of the Fund’s average daily net assets attributable to Class V shares (comprised of up to 0.25% for shareholder liaison services and up to 0.25% for administrative support services). These fees are currently limited to an aggregate annual rate of not more than 0.25% of the Fund’s average daily net assets attributable to Class V shares.
Sales charges (unaudited)
Sales charges, including front-end charges and CDSCs, received by the Distributor for distributing Fund shares for the year ended August 31, 2018, if any, are listed below:
| | Amount ($) |
| Class A | 213,014 |
| Class C | 2,031 |
| Class V | 193 |
Columbia Mid Cap Growth Fund | Annual Report 2018
| 29 |
Notes to Financial Statements (continued)
August 31, 2018
Expenses waived/reimbursed by the Investment Manager and its affiliates
The Investment Manager and certain of its affiliates have contractually agreed to waive fees and/or reimburse expenses (excluding certain fees and expenses described below) for the period(s) disclosed below, unless sooner terminated at the sole discretion of the Board of Trustees, so that the Fund’s net operating expenses, after giving effect to fees waived/expenses reimbursed and any balance credits and/or overdraft charges from the Fund’s custodian, do not exceed the following annual rate(s) as a percentage of the class’ average daily net assets:
| | January 1, 2018
through
December 31, 2018 | Prior to
January 1, 2018 |
| Class A | 1.30% | 1.30% |
| Advisor Class | 1.05 | 1.05 |
| Class C | 2.05 | 2.05 |
| Institutional Class | 1.05 | 1.05 |
| Institutional 2 Class | 0.96 | 0.995 |
| Institutional 3 Class | 0.92 | 0.945 |
| Class R | 1.55 | 1.55 |
| Class T | 1.30 | 1.30 |
| Class V | 1.30 | 1.30 |
Under the agreement governing these fee waivers and/or expense reimbursement arrangements, the following fees and expenses are excluded from the waiver/reimbursement commitment, and therefore will be paid by the Fund, if applicable: taxes (including foreign transaction taxes), expenses associated with investments in affiliated and non-affiliated pooled investment vehicles (including mutual funds and exchange-traded funds), transaction costs and brokerage commissions, costs related to any securities lending program, dividend expenses associated with securities sold short, inverse floater program fees and expenses, transaction charges and interest on borrowed money, interest, infrequent and/or unusual expenses and any other expenses the exclusion of which is specifically approved by the Board of Trustees. This agreement may be modified or amended only with approval from the Investment Manager, certain of its affiliates and the Fund. Any fees waived and/or expenses reimbursed under the expense reimbursement arrangements described above are not recoverable by the Investment Manager or its affiliates in future periods.
Note 4. Federal tax information
The timing and character of income and capital gain distributions are determined in accordance with income tax regulations, which may differ from GAAP because of temporary or permanent book to tax differences.
At August 31, 2018, these differences were primarily due to differing treatment for deferral/reversal of wash sale losses, re-characterization of distributions for investments, trustees’ deferred compensation and net operating loss reclassification. To the extent these differences were permanent, reclassifications were made among the components of the Fund’s net assets in the Statement of Assets and Liabilities. Temporary differences do not require reclassifications.
In the Statement of Assets and Liabilities the following reclassifications were made:
Excess of distributions
over net investment
income ($) | Accumulated
net realized
gain ($) | Paid in
capital ($) |
| 4,975,167 | (4,975,167) | — |
Net investment income (loss) and net realized gains (losses), as disclosed in the Statement of Operations, and net assets were not affected by this reclassification.
| Year Ended August 31, 2018 | Year Ended August 31, 2017 |
Ordinary
income ($) | Long-term
capital gains ($) | Total ($) | Ordinary
income ($) | Long-term
capital gains ($) | Total ($) |
| 63,483,335 | 163,818,827 | 227,302,162 | 3,597,769 | 102,411,557 | 106,009,326 |
| 30 | Columbia Mid Cap Growth Fund | Annual Report 2018 |
Notes to Financial Statements (continued)
August 31, 2018
Short-term capital gain distributions, if any, are considered ordinary income distributions for tax purposes.
At August 31, 2018, the components of distributable earnings on a tax basis were as follows:
Undistributed
ordinary income ($) | Undistributed
long-term
capital gains ($) | Capital loss
carryforwards ($) | Net unrealized
appreciation ($) |
| 29,180,686 | 310,631,151 | — | 348,285,127 |
At August 31, 2018, the cost of all investments for federal income tax purposes along with the aggregate gross unrealized appreciation and depreciation based on that cost was:
Federal
tax cost ($) | Gross unrealized
appreciation ($) | Gross unrealized
(depreciation) ($) | Net unrealized
appreciation ($) |
| 1,586,069,306 | 363,174,305 | (14,889,178) | 348,285,127 |
Tax cost of investments and unrealized appreciation/(depreciation) may also include timing differences that do not constitute adjustments to tax basis.
Management of the Fund has concluded that there are no significant uncertain tax positions in the Fund that would require recognition in the financial statements. However, management’s conclusion may be subject to review and adjustment at a later date based on factors including, but not limited to, new tax laws, regulations, and administrative interpretations (including relevant court decisions). Generally, the Fund’s federal tax returns for the prior three fiscal years remain subject to examination by the Internal Revenue Service.
Note 5. Portfolio information
The cost of purchases and proceeds from sales of securities, excluding short-term investments and derivatives, if any, aggregated to $2,580,224,033 and $2,824,149,382, respectively, for the year ended August 31, 2018. The amount of purchase and sale activity impacts the portfolio turnover rate reported in the Financial Highlights.
Note 6. Affiliated money market fund
The Fund invests in Columbia Short-Term Cash Fund, an affiliated money market fund established for the exclusive use by the Fund and other affiliated funds (the Affiliated MMF). The income earned by the Fund from such investments is included as Dividends - affiliated issuers in the Statement of Operations. As an investing fund, the Fund indirectly bears its proportionate share of the expenses of the Affiliated MMF. The Affiliated MMF prices its shares with a floating net asset value. In addition, the Board of Trustees of the Affiliated MMF may impose a fee on redemptions (sometimes referred to as a liquidity fee) or temporarily suspend redemptions (sometimes referred to as imposing a redemption gate) in the event its liquidity falls below regulatory limits.
Note 7. Interfund lending
Pursuant to an exemptive order granted by the Securities and Exchange Commission, the Fund participates in a program (the Interfund Program) allowing each participating Columbia Fund (each, a Participating Fund) to lend money directly to and, except for closed-end funds and money market funds, borrow money directly from other Participating Funds for temporary purposes. The amounts eligible for borrowing and lending under the Interfund Program are subject to certain restrictions.
Interfund loans are subject to the risk that the borrowing fund could be unable to repay the loan when due, and a delay in repayment to the lending fund could result in lost opportunities and/or additional lending costs. The exemptive order is subject to conditions intended to mitigate conflicts of interest arising from the Investment Manager’s relationship with each Participating Fund.
The Fund did not borrow or lend money under the Interfund Program during the year ended August 31, 2018.
Columbia Mid Cap Growth Fund | Annual Report 2018
| 31 |
Notes to Financial Statements (continued)
August 31, 2018
Note 8. Line of credit
The Fund has access to a revolving credit facility with a syndicate of banks led by Citibank, N.A., HSBC Bank USA, N.A. and JPMorgan Chase Bank, N.A. whereby the Fund may borrow for the temporary funding of shareholder redemptions or for other temporary or emergency purposes. The credit facility, which is a collective agreement between the Fund and certain other funds managed by the Investment Manager, severally and not jointly, permits collective borrowings up to $1 billion. Interest is charged to each participating fund based on its borrowings at a rate equal to the higher of (i) the overnight federal funds rate plus 1.00% or (ii) the one-month LIBOR rate plus 1.00%. Each borrowing under the credit facility matures no later than 60 days after the date of borrowing. The Fund also pays a commitment fee equal to its pro rata share of the amount of the credit facility at a rate of 0.15% per annum. The commitment fee is included in other expenses in the Statement of Operations. This agreement expires annually in December unless extended or renewed.
The Fund had no borrowings during the year ended August 31, 2018.
Note 9. Significant risks
Consumer discretionary sector risk
The Fund may be more susceptible to the particular risks that may affect companies in the consumer discretionary sector than if it were invested in a wider variety of companies in unrelated sectors. Companies in the consumer discretionary sector are subject to certain risks, including fluctuations in the performance of the overall domestic and international economy, interest rate changes, increased competition and consumer confidence. Performance of such companies may be affected by factors including reduced disposable household income, reduced consumer spending, changing demographics and consumer tastes.
Shareholder concentration risk
At August 31, 2018, affiliated shareholders of record owned 32.0% of the outstanding shares of the Fund in one or more accounts. Subscription and redemption activity by concentrated accounts may have a significant effect on the operations of the Fund. In the case of a large redemption, the Fund may be forced to sell investments at inopportune times, including its liquid positions, which may result in Fund losses and the Fund holding a higher percentage of less liquid positions. Large redemptions could result in decreased economies of scale and increased operating expenses for non-redeeming Fund shareholders.
Technology and technology-related investment risk
The Fund may be more susceptible to the particular risks that may affect companies in the information technology sector, as well as other technology-related sectors (collectively, the technology sectors) than if it were invested in a wider variety of companies in unrelated sectors. Companies in the technology sectors are subject to certain risks, including the risk that new services, equipment or technologies will not be accepted by consumers and businesses or will become rapidly obsolete. Performance of such companies may be affected by factors including obtaining and protecting patents (or the failure to do so) and significant competitive pressures, including aggressive pricing of their products or services, new market entrants, competition for market share and short product cycles due to an accelerated rate of technological developments. Such competitive pressures may lead to limited earnings and/or falling profit margins. As a result, the value of their securities may fall or fail to rise. In addition, many technology sector companies have limited operating histories and prices of these companies’ securities historically have been more volatile than other securities, especially over the short term.
Note 10. Subsequent events
Management has evaluated the events and transactions that have occurred through the date the financial statements were issued and noted no items requiring adjustment of the financial statements or additional disclosure.
Note 11. Information regarding pending and settled legal proceedings
Ameriprise Financial and certain of its affiliates have historically been involved in a number of legal, arbitration and regulatory proceedings, including routine litigation, class actions, and governmental actions, concerning matters arising in connection with the conduct of their business activities. Ameriprise Financial believes that the Fund is not currently the subject of, and
| 32 | Columbia Mid Cap Growth Fund | Annual Report 2018 |
Notes to Financial Statements (continued)
August 31, 2018
that neither Ameriprise Financial nor any of its affiliates are the subject of, any pending legal, arbitration or regulatory proceedings that are likely to have a material adverse effect on the Fund or the ability of Ameriprise Financial or its affiliates to perform under their contracts with the Fund. Ameriprise Financial is required to make quarterly (10-Q), annual (10-K) and, as necessary, 8-K filings with the Securities and Exchange Commission (SEC) on legal and regulatory matters that relate to Ameriprise Financial and its affiliates. Copies of these filings may be obtained by accessing the SEC website at www.sec.gov.
There can be no assurance that these matters, or the adverse publicity associated with them, will not result in increased Fund redemptions, reduced sale of Fund shares or other adverse consequences to the Fund. Further, although we believe proceedings are not likely to have a material adverse effect on the Fund or the ability of Ameriprise Financial or its affiliates to perform under their contracts with the Fund, these proceedings are subject to uncertainties and, as such, we are unable to estimate the possible loss or range of loss that may result. An adverse outcome in one or more of these proceedings could result in adverse judgments, settlements, fines, penalties or other relief that could have a material adverse effect on the consolidated financial condition or results of operations of Ameriprise Financial.
Columbia Mid Cap Growth Fund | Annual Report 2018
| 33 |
Report of Independent Registered Public Accounting Firm
To the Board of Trustees of Columbia Funds Series Trust I and Shareholders of Columbia Mid Cap Growth Fund
Opinion on the Financial Statements
We have audited the accompanying statement of assets and liabilities, including the portfolio of investments, of Columbia Mid Cap Growth Fund (one of the funds constituting Columbia Funds Series Trust I, hereafter referred to as the “Fund”) as of August 31, 2018, the related statement of operations for the year ended August 31, 2018, the statement of changes in net assets for each of the two years in the period ended August 31, 2018, including the related notes, and the financial highlights for each of the five years in the period ended August 31, 2018, (collectively referred to as the “financial statements”). In our opinion, the financial statements present fairly, in all material respects, the financial position of the Fund as of August 31, 2018, the results of its operations for the year then ended, the changes in its net assets for each of the two years in the period ended August 31, 2018 and the financial highlights for each of the five years in the period ended August 31, 2018 in conformity with accounting principles generally accepted in the United States of America.
Basis for Opinion
These financial statements are the responsibility of the Fund’s management. Our responsibility is to express an opinion on the Fund’s financial statements based on our audits. We are a public accounting firm registered with the Public Company Accounting Oversight Board (United States) (“PCAOB”) and are required to be independent with respect to the Fund in accordance with the U.S. federal securities laws and the applicable rules and regulations of the Securities and Exchange Commission and the PCAOB.
We conducted our audits of these financial statements in accordance with the standards of the PCAOB. Those standards require that we plan and perform the audit to obtain reasonable assurance about whether the financial statements are free of material misstatement, whether due to error or fraud.
Our audits included performing procedures to assess the risks of material misstatement of the financial statements, whether due to error or fraud, and performing procedures that respond to those risks. Such procedures included examining, on a test basis, evidence regarding the amounts and disclosures in the financial statements. Our audits also included evaluating the accounting principles used and significant estimates made by management, as well as evaluating the overall presentation of the financial statements. Our procedures included confirmation of securities owned as of August 31, 2018, by correspondence with the custodian, transfer agent and brokers; when replies were not received from brokers, we performed other audit procedures. We believe that our audits provide a reasonable basis for our opinion.
/s/PricewaterhouseCoopers LLP
Minneapolis, Minnesota
October 22, 2018
We have served as the auditor of one or more investment companies within the Columbia Funds Complex since 1977.
| 34 | Columbia Mid Cap Growth Fund | Annual Report 2018 |
Federal Income Tax Information
(Unaudited)
The Fund hereby designates the following tax attributes for the fiscal year ended August 31, 2018. Shareholders will be notified in early 2019 of the amounts for use in preparing 2018 income tax returns.
Qualified
dividend
income | Dividends
received
deduction | Capital
gain
dividend |
| 25.83% | 25.03% | $347,686,784 |
Qualified dividend income. For taxable, non-corporate shareholders, the percentage of ordinary income distributed during the fiscal year that represents qualified dividend income subject to reduced tax rates.
Dividends received deduction. The percentage of ordinary income distributed during the fiscal year that qualifies for the corporate dividends received deduction.
Capital gain dividend. The Fund designates as a capital gain dividend the amount reflected above, or if subsequently determined to be different, the net capital gain of such fiscal period.
Columbia Mid Cap Growth Fund | Annual Report 2018
| 35 |
Shareholders elect the Board that oversees the Fund’s operations. The Board appoints officers who are responsible for day-to-day business decisions based on policies set by the Board. The following table provides basic biographical information about the Fund’s Trustees, including their principal occupations during the past five years, although specific titles for individuals may have varied over the period. The year set forth beneath Length of Service in the table below is the year in which the Trustee was first appointed or elected as Trustee to any Fund currently in the Columbia Funds Complex or a predecessor thereof. Under current Board policy, members serve terms of indefinite duration.
Independent trustees
| Name, address, year of birth | Position held with the Trust and length of service | Principal occupation(s) during the past five years and other relevant professional experience | Number of Funds in the Columbia Fund Complex overseen | Other directorships held by Trustee during the past five years |
Janet Langford Carrig
c/o Columbia Management
Investment Advisers, LLC
225 Franklin Street
Mail Drop BX32 05228
Boston, MA 02110
1957 | Trustee
1996 | Senior Vice President, General Counsel and Corporate Secretary, ConocoPhillips (independent energy company) since September 2007 | 69 | None |
Douglas A. Hacker
c/o Columbia Management
Investment Advisers, LLC
225 Franklin Street
Mail Drop BX32 05228
Boston, MA 02110
1955 | Trustee and Chairman of the Board
1996 | Independent business executive since May 2006; Executive Vice President — Strategy of United Airlines from December 2002 to May 2006; President of UAL Loyalty Services (airline marketing company) from September 2001 to December 2002; Executive Vice President and Chief Financial Officer of United Airlines from July 1999 to September 2001 | 69 | Spartan Nash Company, (food distributor); Nash Finch Company (food distributor) from 2005 to 2013; Aircastle Limited (aircraft leasing); SeaCube Container Leasing Ltd. (container leasing) from 2010 to 2013; and Travelport Worldwide Limited (travel information technology) |
Nancy T. Lukitsh
c/o Columbia Management
Investment Advisers, LLC
225 Franklin Street
Mail Drop BX32 05228
Boston, MA 02110
1956 | Trustee
2011 | Senior Vice President, Partner and Director of Marketing, Wellington Management Company, LLP (investment adviser) from 1997 to 2010; Chair, Wellington Management Portfolios (commingled non-U.S. investment pools) from 2007 to 2010; Director, Wellington Trust Company, NA and other Wellington affiliates from 1997 to 2010 | 69 | None |
David M. Moffett
c/o Columbia Management
Investment Advisers, LLC
225 Franklin Street
Mail Drop BX32 05228
Boston, MA 02110
1952 | Trustee
2011 | Retired. Consultant to Bridgewater and Associates | 69 | Director, CSX Corporation (transportation suppliers); Genworth Financial, Inc. (financial and insurance products and services); PayPal Holdings Inc. (payment and data processing services); Trustee, University of Oklahoma Foundation; former Director, eBay Inc. (online trading community), 2007-2015; and former Director, CIT Bank, CIT Group Inc. (commercial and consumer finance), 2010-2016 |
| 36 | Columbia Mid Cap Growth Fund | Annual Report 2018 |
TRUSTEES AND OFFICERS (continued)
Independent trustees (continued)
| Name, address, year of birth | Position held with the Trust and length of service | Principal occupation(s) during the past five years and other relevant professional experience | Number of Funds in the Columbia Fund Complex overseen | Other directorships held by Trustee during the past five years |
John J. Neuhauser
c/o Columbia Management
Investment Advisers, LLC
225 Franklin Street
Mail Drop BX32 05228
Boston, MA 02110
1943 | Trustee
1984 | President, Saint Michael’s College since August 2007; Director or Trustee of several non-profit organizations, including University of Vermont Medical Center; Academic Vice President and Dean of Faculties, Boston College from August 1999 to October 2005; University Professor, Boston College from November 2005 to August 2007 | 69 | Liberty All-Star Equity Fund and Liberty All- Star Growth Fund (closed-end funds) |
Patrick J. Simpson
c/o Columbia Management
Investment Advisers, LLC
225 Franklin Street
Mail Drop BX32 05228
Boston, MA 02110
1944 | Trustee
2000 | Of Counsel, Perkins Coie LLP (law firm) since 2015; Partner, Perkins Coie LLP from 1988 to 2014 | 69 | None |
Anne-Lee Verville
c/o Columbia Management
Investment Advisers, LLC
225 Franklin Street
Mail Drop BX32 05228
Boston, MA 02110
1945 | Trustee
1998 | Retired. General Manager, Global Education Industry from 1994 to 1997, President – Application Systems Division from 1991 to 1994, Chief Financial Officer – US Marketing & Services from 1988 to 1991, and Chief Information Officer from 1987 to 1988, IBM Corporation (computer and technology) | 69 | Enesco Group, Inc. (producer of giftware and home and garden decor products) from 2001 to 2006 |
Consultants to the Independent Trustees*
| Name, address, year of birth | Position held with the Trust and length of service | Principal occupation(s) during the past five years and other relevant professional experience | Number of Funds in the Columbia Funds complex overseen | Other directorships held by Trustee during the past five years |
J. Kevin Connaughton
c/o Columbia
Management Investment
Advisers, LLC,
225 Franklin Street
Mail Drop BX32 05228,
Boston, MA 02110
1964 | Independent Trustee Consultant
2016 | Independent Trustee Consultant, Columbia Funds since March 2016; Adjunct Professor of Finance, Bentley University since November 2017; Managing Director and General Manager of Mutual Fund Products, Columbia Management Investment Advisers, LLC from May 2010 to February 2015; President, Columbia Funds from 2009 to 2015; and senior officer of Columbia Funds and affiliated funds from 2003 to 2015 | 69 | Director, The Autism Project since March 2015; former Trustee, New Century Portfolios, March 2015-December 2017; formerly on Board of Governors, Gateway Healthcare, January 2016 – December 2017 |
Natalie A. Trunow
c/o Columbia
Management Investment
Advisers, LLC,
225 Franklin Street
Mail Drop BX32 05228,
Boston, MA 02110
1967 | Independent Trustee Consultant
2016 | Independent Trustee Consultant, Columbia Funds since September 2016; Chief Executive Officer, Millennial Portfolio Solutions LLC (asset management and consulting services) since January 2016; Director of Investments, Casey Family Programs from April 2016 to September 2016; Senior Vice President and Chief Investment Officer, Calvert Investments from August 2008 to January 2016; Section Head and Portfolio Manager, General Motors Asset Management from June 1997 to August 2008 | 69 | Director, Health Services for Children with Special Needs, Inc.; Director, Guidewell Financial Solutions |
| * | J. Kevin Connaughton was appointed consultant to the Independent Trustees effective March 1, 2016. Natalie A. Trunow was appointed consultant to the Independent Trustees effective September 1, 2016. Shareholders of the Funds are expected to be asked to elect each of Mr. Connaughton and Ms. Trunow as a Trustee at a future shareholder meeting. |
Columbia Mid Cap Growth Fund | Annual Report 2018
| 37 |
TRUSTEES AND OFFICERS (continued)
Interested trustee affiliated with Investment Manager*
| Name, address, year of birth | Position held with the Trust and length of service | Principal occupation(s) during the past five years and other relevant professional experience | Number of Funds in the Columbia Funds Complex overseen | Other directorships held by Trustee during the past five years |
William F. Truscott
c/o Columbia Management
Investment Advisers, LLC
225 Franklin Street
Boston, MA 02110
1960 | Trustee
2012 | Chairman of the Board and President, Columbia Management Investment Advisers, LLC since May 2010 and February 2012, respectively; Chief Executive Officer, Global Asset Management, Ameriprise Financial, Inc. since September 2012 (previously Chief Executive Officer, U.S. Asset Management & President, Annuities, May 2010-September 2012); Director and Chief Executive Officer, Columbia Management Investment Distributors, Inc. since May 2010 and February 2012, respectively; Chairman of the Board and Chief Executive Officer, RiverSource Distributors, Inc. since 2006; Director, Threadneedle Asset Management Holdings, SARL since 2014; President and Chief Executive Officer, Ameriprise Certificate Company, 2006-August 2012 | 193 | Chairman of the Board, Columbia Management Investment Advisers, LLC since May 2010; Director, Columbia Management Investment Distributors, Inc. since May 2010; former Director, Ameriprise Certificate Company, 2006 - January 2013 |
| * | Interested person (as defined under the 1940 Act) by reason of being an officer, director, security holder and/or employee of the Investment Manager or Ameriprise Financial. |
The Statement of Additional Information has additional information about the Fund’s Board members and is available,
without charge, upon request by calling 800.345.6611, contacting your financial intermediary or visiting
investor.columbiathreadneedleus.com.
| 38 | Columbia Mid Cap Growth Fund | Annual Report 2018 |
TRUSTEES AND OFFICERS (continued)
The Board has appointed officers who are responsible for day-to-day business decisions based on policies it has established. The officers serve at the pleasure of the Board. The following table provides basic information about the Officers of the Fund, including principal occupations during the past five years, although their specific titles may have varied over the period. In addition to Mr. Truscott, who is Senior Vice President, the Fund’s other officers are:
Fund officers
Name,
address and
year of birth | Position and year
first appointed to
position for any Fund
in the Columbia
Funds complex or a
predecessor thereof | Principal occupation(s) during past five years |
Christopher O. Petersen
5228 Ameriprise
Financial Center
Minneapolis, MN 55474
Born 1970 | President and Principal Executive Officer (2015) | Vice President and Lead Chief Counsel, Ameriprise Financial, Inc. since January 2015 (previously, Vice President and Chief Counsel, January 2010 - December 2014; officer of Columbia Funds and affiliated funds since 2007. |
Michael G. Clarke
225 Franklin Street
Boston, MA 02110
Born 1969 | Treasurer (2011), Chief Financial Officer (2009) and Chief Accounting Officer (2015) | Vice President — Mutual Fund Administration, Columbia Management Investment Advisers, LLC, since May 2010; senior officer of Columbia Funds and affiliated funds since 2002. |
Paul B. Goucher
100 Park Avenue
New York, NY 10017
Born 1968 | Senior Vice President (2011) and Assistant Secretary (2008) | Senior Vice President and Assistant General Counsel, Ameriprise Financial, Inc. since January 2017 (previously, Vice President and Lead Chief Counsel, November 2008 - January 2017 and January 2013 - January 2017, respectively); Vice President, Chief Legal Officer and Assistant Secretary, Columbia Management Investment Advisers, LLC since May 2010. |
Thomas P. McGuire
225 Franklin Street
Boston, MA 02110
Born 1972 | Senior Vice President and Chief Compliance Officer (2012) | Vice President — Asset Management Compliance, Ameriprise Financial, Inc., since May 2010; Chief Compliance Officer, Ameriprise Certificate Company since September 2010. |
Colin Moore
225 Franklin Street
Boston, MA 02110
Born 1958 | Senior Vice President (2010) | Executive Vice President and Global Chief Investment Officer, Ameriprise Financial, Inc., since July 2013; Executive Vice President and Global Chief Investment Officer, Columbia Management Investment Advisers, LLC since July 2013. |
Ryan C. Larrenaga
225 Franklin Street
Boston, MA 02110
Born 1970 | Senior Vice President (2017), Chief Legal Officer (2017) and Secretary (2015) | Vice President and Chief Counsel, Ameriprise Financial, Inc. since August 2018 (previously, Vice President and Group Counsel, August 2011 - August 2018); officer of Columbia Funds and affiliated funds since 2005. |
Michael E. DeFao
225 Franklin Street
Boston, MA 02110
Born 1968 | Vice President (2011) and Assistant Secretary (2010) | Vice President and Chief Counsel, Ameriprise Financial, Inc. since May 2010. |
Amy Johnson
5228 Ameriprise
Financial Center
Minneapolis, MN 55474
Born 1965 | Vice President (2006) | Managing Director and Global Head of Operations, Columbia Management Investment Advisers, LLC since April 2016 (previously Managing Director and Chief Operating Officer, 2010 - 2016). |
Lyn Kephart-Strong
5228 Ameriprise
Financial Center
Minneapolis, MN 55474
Born 1960 | Vice President (2015) | President, Columbia Management Investment Services Corp. since October 2014; Vice President & Resolution Officer, Ameriprise Trust Company since August 2009. |
Columbia Mid Cap Growth Fund | Annual Report 2018
| 39 |
Board Consideration and Approval of Management
Agreement
On June 12, 2018, the Board of Trustees (the Board) and the Trustees who are not interested persons (as defined in the Investment Company Act of 1940) (the Independent Trustees) of Columbia Funds Series Trust I (the Trust) unanimously approved the continuation of the Management Agreement (the Management Agreement) with Columbia Management Investment Advisers, LLC (the Investment Manager) with respect to Columbia Mid Cap Growth Fund (the Fund), a series of the Trust. As detailed below, the Board’s Advisory Fees and Expenses Committee (the Committee) and the Board met on multiple occasions to review and discuss, among themselves, with the management team of the Investment Manager and with an independent fee consultant, materials provided by the Investment Manager, the independent fee consultant and others before determining to approve the continuation of the Management Agreement.
In connection with their deliberations regarding the continuation of the Management Agreement, the Committee and the Board evaluated materials requested from the Investment Manager regarding the Fund and the Management Agreement, and discussed these materials with representatives of the Investment Manager at Committee meetings held on March 6, 2018, April 26, 2018 and June 11, 2018 and at Board meetings held on March 7, 2018 and June 12, 2018. In addition, the Board and its various committees consider matters bearing on the Management Agreement at other meetings throughout the year and in prior years and meet regularly with senior management of the Trust and the Investment Manager. Through the Board’s Investment Oversight Committees, Trustees also meet with selected portfolio managers of the funds the Trustees oversee and with other investment personnel at various times throughout the year. The Committee and the Board also consulted with the independent fee consultant, Fund counsel and the Independent Trustees’ independent legal counsel, who advised on various matters with respect to the Committee’s and the Board’s considerations and otherwise assisted the Committee and the Board in their deliberations. On June 11, 2018, the Committee recommended that the Board approve the continuation of the Management Agreement. On June 12, 2018, the Board, including the Independent Trustees, voting separately, unanimously approved the continuation of the Management Agreement for the Fund.
The Committee and the Board considered all information that they, their legal counsel or the Investment Manager believed reasonably necessary to evaluate and to determine whether to recommend for approval or approve the continuation of the Management Agreement. The information and factors considered by the Committee and the Board in recommending for approval or approving the continuation of the Management Agreement for the Fund included the following:
| • | Information on the investment performance of the Fund relative to the performance of a group of mutual funds determined to be comparable to the Fund by an independent third-party data provider, as well as performance relative to benchmarks; |
| • | Information on the Fund’s management fees and total expenses, including information comparing the Fund’s expenses to those of a group of comparable mutual funds, as determined by the independent third-party data provider; |
| • | The Investment Manager’s agreement to contractually limit or cap total operating expenses for the Fund through December 31, 2019 so that total operating expenses (excluding certain fees and expenses, such as transaction costs and certain other investment related expenses, interest, taxes, acquired fund fees and expenses, and infrequent and/or unusual expenses) would not exceed a specified annual rate, as a percentage of the Fund’s net assets; |
| • | The terms and conditions of the Management Agreement; |
| • | The current and proposed terms and conditions of other agreements and arrangements with affiliates of the Investment Manager relating to the operations of the Fund, including agreements with respect to the provision of distribution, transfer agency and shareholder services to the Fund; |
| • | Descriptions of various functions performed by the Investment Manager under the Management Agreement, including portfolio management and portfolio trading practices; |
| • | Information regarding the management fees of similarly-managed portfolios of other clients of the Investment Manager, including institutional accounts and collective trusts; |
| • | Information regarding the reputation, regulatory history and resources of the Investment Manager, including information regarding senior management, portfolio managers and other personnel; |
| 40 | Columbia Mid Cap Growth Fund | Annual Report 2018 |
Board Consideration and Approval of Management
Agreement (continued)
| • | Information regarding the capabilities of the Investment Manager with respect to compliance monitoring services, including an assessment of the Investment Manager’s compliance system by the Fund’s Chief Compliance Officer; and |
| • | The profitability to the Investment Manager and its affiliates from their relationships with the Fund. |
Nature, extent and quality of services provided under the Management Agreement
The Committee and the Board considered the nature, extent and quality of services provided to the Fund by the Investment Manager and its affiliates under the Management Agreement and under separate agreements for the provision of transfer agency and shareholder services, and the resources dedicated to the Fund and the other Columbia Funds by the Investment Manager and its affiliates. The Committee and the Board considered, among other things, the Investment Manager’s ability to attract, motivate and retain highly qualified research, advisory and supervisory investment professionals (including compensation programs for personnel involved in fund management, reputation and other attributes), the portfolio management services provided by those investment professionals, and the quality of the Investment Manager’s investment research capabilities and trade execution services. The Committee and the Board also considered the potential benefits to shareholders of investing in a mutual fund that is part of a fund complex offering exposure to a variety of asset classes and investment disciplines and providing a variety of fund and shareholder services.
The Committee and the Board also considered the professional experience and qualifications of the senior personnel of the Investment Manager, which included consideration of the Investment Manager’s experience with similarly-structured funds. The Committee and the Board noted the compliance programs of and the compliance-related resources provided to the Fund by the Investment Manager and its affiliates and the resources dedicated by the Investment Manager and its affiliates to risk management, and considered the Investment Manager’s ability to provide administrative services to the Fund and coordinate the activities of the Fund’s other service providers. After reviewing these and related factors, the Committee and the Board concluded, within the context of their overall conclusions, that the nature, extent and quality of the services provided to the Fund under the Management Agreement supported the continuation of the Management Agreement.
Investment performance
The Committee and the Board reviewed information about the performance of the Fund over various time periods, including performance information relative to benchmarks, information that compared the performance of the Fund to the performance of a group of comparable mutual funds as determined by the independent third-party data provider, and information and analysis provided by the independent fee consultant. The Committee and the Board also reviewed a description of the third party’s methodology for identifying the Fund’s peer groups for purposes of performance and expense comparisons. Although the Fund’s performance lagged that of a relevant peer group for certain (although not necessarily all) periods, the Committee and the Board concluded that other factors relevant to performance were sufficient, in light of other considerations, to support continuation of the Management Agreement. Those factors included one or more of the following: (i) that the Fund’s performance, although lagging in certain recent periods, was stronger over the longer term; (ii) that the underperformance was attributable, to a significant extent, to investment decisions that were reasonable and consistent with the Fund’s investment strategy and policies and that the Fund was performing within a reasonable range of expectations, given those investment decisions, market conditions and the Fund’s investment strategy; (iii) that the Fund’s performance was competitive when compared to other relevant performance benchmarks or peer groups; and (iv) that the Investment Manager had taken or was taking steps designed to help improve the Fund’s investment performance, including, but not limited to, replacing portfolio managers, enhancing the resources supporting the portfolio managers, or modifying investment strategies.
The Committee and the Board noted that, through December 31, 2017, the Fund’s performance was in the seventy-first, forty-sixth and sixty-sixth percentile (where the best performance would be in the first percentile) of its category selected by the independent third-party data provider for the purposes of performance comparisons for the one-, three- and five-year periods, respectively.
The Committee and the Board also considered the Investment Manager’s performance and reputation generally, the Investment Manager’s historical responsiveness to Board concerns about performance, and the Investment Manager’s willingness to take steps intended to improve performance. After reviewing these and related factors, the Committee and the Board concluded, within the context of their overall conclusions, that the performance of the Fund and the Investment Manager was sufficient, in light of other considerations, to support the continuation of the Management Agreement.
Columbia Mid Cap Growth Fund | Annual Report 2018
| 41 |
Board Consideration and Approval of Management
Agreement (continued)
Investment Management fee rates and other expenses
The Committee and the Board considered the management fees charged to the Fund under the Management Agreement as well as the total expenses incurred by the Fund. In assessing the reasonableness of the fees under the Management Agreement, the Committee and the Board considered, among other information, the Fund’s total expense ratio as a percentage of average daily net assets. The Committee and the Board considered data provided by the independent third-party data provider and the independent fee consultant. The Committee and the Board noted that, as of December 31, 2017, the Fund’s actual management fee and net total expense ratio were ranked in the third and second quintiles, respectively, (where the lowest fees and expenses would be in the first quintile) against the Fund’s expense universe as determined by the independent third-party data provider for purposes of expense comparison. The Committee and the Board also took into account the fee waiver and expense limitation arrangements agreed to by the Investment Manager, as noted above.
The Committee and the Board also received and considered information about the management fees charged by the Investment Manager to institutional accounts. In considering the fees charged to those accounts, the Committee and the Board took into account, among other things, the Investment Manager’s representations about the differences between managing mutual funds as compared to other types of accounts, including differences in the services provided, differences in the risk profile of such business for the Investment Manager and the additional resources required to manage mutual funds effectively. The Committee and the Board also received and considered information about the fees charged by the Investment Manager for sub-advisory services it provides to comparable unaffiliated funds. In evaluating the Fund’s management fees, the Committee and the Board also took into account the demands, complexity and quality of the investment management of the Fund.
After reviewing these and related factors, the Committee and the Board concluded, within the context of their overall conclusions, that the management fee rates and expenses of the Fund, in light of other considerations, supported the continuation of the Management Agreement.
Costs of services provided and profitability
The Committee and the Board also took note of the costs the Investment Manager and its affiliates incur in connection with the services provided and the profitability to the Investment Manager and its affiliates from their relationships with the Fund.
The Committee and the Board also considered the compensation directly or indirectly received by the Investment Manager’s affiliates in connection with their relationships with the Fund. The Committee and the Board reviewed information provided by management as to the profitability to the Investment Manager and its affiliates of their relationships with the Fund, information about the allocation of expenses used to calculate profitability, and comparisons of profitability levels realized in 2017 to profitability levels realized in 2016. When reviewing profitability, the Committee and the Board also considered court cases in which adviser profitability was an issue in whole or in part, the performance of similarly managed funds, the performance of the Fund, and the expense ratio of the Fund. In addition, the Committee and the Board considered information provided by the Investment Manager regarding the Investment Manager’s financial condition and comparing its profitability to that of other asset management firms that are, or are subsidiaries of, publicly traded companies. In this regard, the Committee and the Board also considered data provided by the independent fee consultant.
After reviewing these and related factors, the Committee and the Board concluded, within the context of their overall conclusions, that the costs of services provided and the profitability to the Investment Manager and its affiliates from their relationships with the Fund supported the continuation of the Management Agreement.
Economies of scale
The Committee and the Board considered the potential existence of economies of scale in the provision by the Investment Manager of services to the Fund, to groups of related funds, and to the Investment Manager’s investment advisory clients as a whole, and whether those economies of scale were shared with the Fund through breakpoints in investment management fees or other means, such as expense limitation arrangements and additional investments by the Investment Manager in investment, trading, compliance and other resources. The Committee and the Board noted that the management fee schedules for the Fund contained breakpoints that would reduce the fee rate on assets above specified threshold levels.
| 42 | Columbia Mid Cap Growth Fund | Annual Report 2018 |
Board Consideration and Approval of Management
Agreement (continued)
In considering these matters, the Committee and the Board also considered the costs of the services provided and the profitability to the Investment Manager and its affiliates from their relationships with the Fund, as noted above. After reviewing these and related factors, the Committee and the Board concluded, within the context of their overall conclusions, that the extent to which any economies of scale were expected to be shared with the Fund supported the continuation of the Management Agreement.
Other benefits to the Investment Manager
The Committee and the Board received and considered information regarding “fall-out” or ancillary benefits received by the Investment Manager and its affiliates as a result of their relationships with the Fund, such as the engagement of the Investment Manager’s affiliates to provide distribution, transfer agency and shareholder services to the Fund. In this regard, among other matters, the Committee and the Board considered that the Fund’s distributor retains a portion of the distribution fees from the Fund and receives a portion of the sales charges on sales or redemptions of certain classes of shares of the Fund. The Committee and the Board also considered the benefits of research made available to the Investment Manager by reason of brokerage commissions generated by the Fund’s securities transactions, and reviewed information about the Investment Manager’s practices with respect to considering brokerage and research services when allocating portfolio transactions. In this connection, the Board also noted that the amount of research made available to the Investment Manager by reason of brokerage commissions had been declining over time, and may decline further. The Committee and the Board recognized that the Investment Manager’s profitability would be somewhat lower without these benefits.
Conclusion
The Committee and the Board reviewed all of the above considerations in reaching their decisions to recommend or approve the continuation of the Management Agreement. In their deliberations, the Trustees did not identify any particular information that was all-important or controlling, and individual Trustees may have attributed different weights to the various factors. Based on their evaluation of all factors that they deemed to be material, including those factors described above, and assisted by the advice of independent legal counsel, the Board, including the Independent Trustees, voting separately, unanimously approved the continuation of the Management Agreement.
Columbia Mid Cap Growth Fund | Annual Report 2018
| 43 |
The Fund mails one shareholder report to each shareholder address. If you would like more than one report, please call shareholder services at 800.345.6611 and additional reports will be sent to you.
Proxy voting policies and procedures
The policy of the Board of Trustees is to vote the proxies of the companies in which the Fund holds investments consistent with the procedures as stated in the Statement of Additional Information (SAI). You may obtain a copy of the SAI without charge by calling 800.345.6611; contacting your financial intermediary; visiting columbiathreadneedleus.com/investor/; or searching the website of the Securities and Exchange Commission (SEC) at sec.gov. Information regarding how the Fund voted proxies relating to portfolio securities is filed with the SEC by August 31st for the most recent 12-month period ending June 30th of that year, and is available without charge by visiting columbiathreadneedleus.com/investor/, or searching the website of the SEC at sec.gov.
Quarterly schedule of investments
The Fund files a complete schedule of portfolio holdings with the SEC for the first and third quarters of each fiscal year on Form N-Q or Form N-PORT. The Fund’s Form N-Q or Form N-PORT is available on the SEC’s website at sec.gov and may be reviewed and copied at the SEC’s Public Reference Room in Washington, D.C. Information on the operation of the Public Reference Room may be obtained by calling 800.SEC.0330. The Fund’s complete schedule of portfolio holdings, as filed on Form N-Q or Form N-PORT, can also be obtained without charge, upon request, by calling 800.345.6611.
Additional Fund information
For more information about the Fund, please visit columbiathreadneedleus.com/investor/ or call 800.345.6611. Customer Service Representatives are available to answer your questions Monday through Friday from 8 a.m. to 7 p.m. Eastern time.
Fund investment manager
Columbia Management Investment Advisers, LLC
225 Franklin Street
Boston, MA 02110
Fund distributor
Columbia Management Investment Distributors, Inc.
225 Franklin Street
Boston, MA 02110
Fund transfer agent
Columbia Management Investment Services Corp.
Through October 31, 2018:
P.O. Box 8081
Boston, MA 02266-8081
Effective November 1, 2018:
P.O. Box 219104
Kansas City, MO 64121-9104
| 44 | Columbia Mid Cap Growth Fund | Annual Report 2018 |
[THIS PAGE INTENTIONALLY LEFT BLANK]
Columbia Mid Cap Growth Fund
Through October 31, 2018:
P.O. Box 8081
Boston, MA 02266-8081
Effective November 1, 2018:
P.O. Box 219104
Kansas City, MO 64121-9104
Please read and consider the investment objectives, risks, charges and expenses for any fund carefully before investing. For a prospectus and summary prospectus, which contains this and other important information about the Fund, go to
columbiathreadneedleus.com/investor/. The Fund is distributed by Columbia Management Investment Distributors, Inc., member FINRA, and managed by Columbia Management Investment Advisers, LLC.
Columbia Threadneedle Investments (Columbia Threadneedle) is the global brand name of the Columbia and Threadneedle group of companies. All rights reserved.
© 2018 Columbia Management Investment Advisers, LLC.
columbiathreadneedleus .com/investor/

Annual Report
August 31, 2018
Columbia Disciplined Small Core Fund
Not FDIC Insured • No bank guarantee • May lose value
Dear Shareholders,
Volatility exists in financial markets and this is not a comfortable fact of life. How investors deal with this reality, including how they react to short term spikes in volatility as well as to longer periods of increased or decreased volatility, may have a significant impact on their overall investing success.
Too often, investors change their investment strategy based on something that’s happening at a moment in time rather than thinking about how that change in strategy might affect their ability to achieve their longer-term financial goals. Emotion replaces logic and reasoning. Investors may sell in reaction to a market drop (fear or panic), locking in low returns which means they won’t be invested when the market returns, or they invest more at a market peak (greed or conviction), essentially when it is expensive to do so. In both cases, selling and buying at the exact wrong time.
We believe the best outcomes come from a consistent approach to investing. Here are five areas where advisors can help us overcome the tendency to react emotionally as we struggle to make the right choices with our investments:
Long-term focus
The further away long-term goals, aspirations and objectives are, the easier it is to stray away from the goals and priorities that we set out. Advisors help us stay focused on what we want to accomplish.
Discipline through up-and-down markets
Advisors help set rules to prevent us from making rash decisions that we may regret later. Knowing ahead of time what you should do in case of certain situations will help you get through volatile markets and not make emotional decisions.
Tax-awareness
Taxes are one of the biggest drags on investment returns and are critical attributes of investing. Yet few of us take the necessary steps to ease the corrosive effect of taxes. Advisors have tools and knowledge that may help us to manage portfolios more tax-efficiently and keep more of what we earn.
Emotional objectivity
Our emotions are very hard to manage and making investment decisions in an emotional state can lead to exceedingly bad outcomes. An objective advisor can help prevent some of the reactionary mistakes emotions often lead us to.
Education and guidance
The role of the advisor is to teach and guide us toward achieving our financial goals. In terms of working through emotions, guidance is by far the most important component.
By understanding our own behaviors and biases, we can prepare for future challenges. Your success is our priority. Talk to your advisor about how working with Columbia Threadneedle Investments may help you stay the course and position your portfolio for consistent, sustainable outcomes, regardless of market conditions.
Sincerely,
Christopher O. Petersen
President, Columbia Funds
Columbia Funds are distributed by Columbia Management Investment Distributors, Inc., member FINRA, and managed by Columbia Management Investment Advisers, LLC.
© 2018 Columbia Management Investment Advisers, LLC. All rights reserved.
Columbia Disciplined Small Core Fund | Annual Report 2018
Columbia Disciplined Small Core Fund | Annual Report 2018
Investment objective
Columbia Disciplined Small Core Fund (the Fund) seeks long-term capital appreciation.
Portfolio management
Brian Condon, CFA
Co-Portfolio Manager
Managed Fund since 2016
Peter Albanese
Co-Portfolio Manager
Managed Fund since 2017
Morningstar style boxTM
The Morningstar Style Box is based on a fund’s portfolio holdings. For equity funds, the vertical axis shows the market capitalization of the stocks owned, and the horizontal axis shows investment style (value, blend, or growth). Information shown is based on the most recent data provided by Morningstar.
© 2018 Morningstar, Inc. All rights reserved. The Morningstar information contained herein: (1) is proprietary to Morningstar and/or its content providers; (2) may not be copied or distributed; and (3) is not warranted to be accurate, complete or timely. Neither Morningstar nor its content providers are responsible for any damages or losses arising from any use of this information.
| Average annual total returns (%) (for the period ended August 31, 2018) |
| | | Inception | 1 Year | 5 Years | 10 Years |
| Class A | Excluding sales charges | 11/01/98 | 16.70 | 7.09 | 7.59 |
| | Including sales charges | | 9.93 | 5.83 | 6.95 |
| Advisor Class* | 11/08/12 | 17.17 | 7.37 | 7.86 |
| Class C | Excluding sales charges | 11/18/02 | 15.81 | 6.29 | 6.78 |
| | Including sales charges | | 15.00 | 6.29 | 6.78 |
| Institutional Class | 12/14/92 | 17.06 | 7.36 | 7.85 |
| Institutional 2 Class* | 11/08/12 | 17.26 | 7.53 | 7.95 |
| Institutional 3 Class* | 11/08/12 | 17.24 | 7.57 | 7.98 |
| Class T* | Excluding sales charges | 09/27/10 | 16.84 | 7.09 | 7.59 |
| | Including sales charges | | 13.87 | 6.55 | 7.32 |
| Class V | Excluding sales charges | 02/12/93 | 16.87 | 7.09 | 7.56 |
| | Including sales charges | | 10.13 | 5.83 | 6.92 |
| Russell 2000 Index | | 25.45 | 13.00 | 10.46 |
| S&P SmallCap 600 Index | | 32.46 | 15.44 | 12.44 |
Returns for Class A shares and Class V shares are shown with and without the maximum initial sales charge of 5.75%. Returns for Class C shares are shown with and without the 1.00% contingent deferred sales charge for the first year only. Returns for Class T shares are shown with and without the maximum initial sales charge of 2.50% per transaction. The Fund’s other share classes are not subject to sales charges and have limited eligibility. Please see the Fund’s prospectus for details. Performance for different share classes will vary based on differences in sales charges and fees associated with each share class. All results shown assume reinvestment of distributions during the period. Returns do not reflect the deduction of taxes that a shareholder may pay on Fund distributions or on the redemption of Fund shares. Performance results reflect the effect of any fee waivers or reimbursements of Fund expenses by Columbia Management Investment Advisers, LLC and/or any of its affiliates. Absent these fee waivers or expense reimbursement arrangements, performance results would have been lower.
The performance information shown represents past performance and is not a guarantee of future results. The investment return and principal value of your investment will fluctuate so that your shares, when redeemed, may be worth more or less than their original cost. Current performance may be lower or higher than the performance information shown. You may obtain performance information current to the most recent month-end by contacting your financial intermediary, visiting columbiathreadneedleus.com/investor/ or calling 800.345.6611.
| * | The returns shown for periods prior to the share class inception date (including returns for the Life of the Fund, if shown, which are since Fund inception) include the returns of the Fund’s oldest share class. These returns are adjusted to reflect any higher class-related operating expenses of the newer share classes, as applicable. Please visit columbiathreadneedleus.com/investor/investment-products/mutual-funds/appended-performance for more information. |
The Russell 2000 Index measures the performance of the small-cap segment of the U.S. equity universe. The Russell 2000 is a subset of the Russell 3000 Index representing approximately 10% of the total market capitalization of that index. It includes the securities of approximately 2,000 of the smallest companies in the Russell 3000 Index based on a combination of their market capitalization and current index membership.
The S&P SmallCap 600 Index tracks the performance of 600 domestic companies traded on major stock exchanges. The S&P SmallCap 600 is heavily weighted with the stocks of companies with small market capitalizations.
Indices are not available for investment, are not professionally managed and do not reflect sales charges, fees, brokerage commissions, taxes or other expenses of investing. Securities in the Fund may not match those in an index.
| 2 | Columbia Disciplined Small Core Fund | Annual Report 2018 |
Fund at a Glance (continued)
Performance of a hypothetical $10,000 investment (August 31, 2008 — August 31, 2018)
The chart above shows the change in value of a hypothetical $10,000 investment in Class A shares of Columbia Disciplined Small Core Fund during the stated time period, and does not reflect the deduction of taxes that a shareholder may pay on Fund distributions or on the redemption of Fund shares.
| Top 10 holdings (%) (at August 31, 2018) |
| Haemonetics Corp. | 0.9 |
| Radian Group, Inc. | 0.8 |
| Yelp, Inc. | 0.8 |
| MGIC Investment Corp. | 0.8 |
| Essent Group Ltd. | 0.8 |
| Green Dot Corp., Class A | 0.7 |
| Immunomedics, Inc. | 0.7 |
| Integer Holdings Corp. | 0.7 |
| American Equity Investment Life Holding Co. | 0.7 |
| EMCOR Group, Inc. | 0.7 |
Percentages indicated are based upon total investments (excluding Money Market Funds and derivatives, if any).
For further detail about these holdings, please refer to the section entitled “Portfolio of Investments.”
Fund holdings are as of the date given, are subject to change at any time, and are not recommendations to buy or sell any security.
| Portfolio breakdown (%) (at August 31, 2018) |
| Common Stocks | 98.0 |
| Money Market Funds | 2.0 |
| Total | 100.0 |
Percentages indicated are based upon total investments and exclude investments in derivatives, if any. The Fund’s portfolio composition is subject to change.
| Equity sector breakdown (%) (at August 31, 2018) |
| Consumer Discretionary | 13.1 |
| Consumer Staples | 2.9 |
| Energy | 4.4 |
| Financials | 18.0 |
| Health Care | 15.9 |
| Industrials | 15.1 |
| Information Technology | 15.3 |
| Materials | 4.6 |
| Real Estate | 7.0 |
| Telecommunication Services | 0.7 |
| Utilities | 3.0 |
| Total | 100.0 |
Percentages indicated are based upon total equity investments. The Fund’s portfolio composition is subject to change.
Columbia Disciplined Small Core Fund | Annual Report 2018
| 3 |
Manager Discussion of Fund Performance
For the 12-month period that ended August 31, 2018, the Fund’s Class A shares returned 16.70% excluding sales charges. By comparison, the Fund’s benchmarks, the Russell 2000 Index and S&P SmallCap 600 Index, posted returns of 25.45% and 32.46%, respectively. Stock selection, particularly in the health care and information technology sectors, detracted from the Fund’s results relative to its Russell benchmark.
Equity markets moved higher
U.S. equities delivered solid gains for the 12-month period that ended August 31, 2018, hitting record highs along the way. Buoyant corporate earnings along with a strengthening domestic economy and a solid global economy, boosted investor sentiment, outweighing increased geopolitical tensions. Consumer confidence was high, jobs data remained strong and personal income rose as the period wore on. Tax cuts approved by Congress late in 2017 had a favorable impact on corporate earnings and helped fuel investor optimism.
Concerns that interest rates and inflation might rise faster than expected put a damper on equity markets early in 2018, the first such correction in two years. However, equities quickly recovered their lost ground — and then some. For the 12 months ended August 31, 2018, the S&P 500 Index, which measures the performance of 500 widely held, large-capitalization U.S. stocks and is frequently used as a general measure of market performance, gained 19.66%. Information technology and consumer discretionary stocks were among the biggest winners, while consumer staples and telecommunication stocks lagged behind. Growth stocks outperformed value stocks, and small cap stocks outperformed large- and mid-cap stocks.
The Federal Reserve raised the federal funds target rate three times during the period, to 1.75% - 2.00%, citing strong job growth and inflation in line with its 2.0% target. The yield on the 10-year U.S. Treasury ended the period at 2.86%.
Our approach to stock selection
We divide the metrics for our stock selection model into three broad themes: 1) valuation — fundamental measures such as earnings and cash flow relative to market values, 2) catalyst — price momentum and business momentum and 3) quality — quality of earnings and financial strength. We then rank the securities within a sector/industry from one (most attractive) to five (least attractive) based upon the metrics within these categories. The strategy seeks to stay sector and risk neutral relative to the Russell benchmark, in an effort to drive results on the basis of the Fund’s stock selection models.
For the period, model performance was mixed. The Fund’s quality theme performed strongly, as stocks rated the highest on quality measures outperformed and those rated least attractive underperformed the benchmark. The Fund’s valuation theme, which generally favors stocks with lower price-to-earnings and book multiples, did not perform as expected as higher multiple, more growth-oriented stocks outperformed for the period. The Fund’s catalyst theme provided mixed results.
Contributors and detractors
Stock selection within the materials, real estate and financials sectors contributed most to relative performance versus the benchmark. The top contributing name to relative performance for the period was Ablynx. Shares of the clinical stage biotechnology company jumped after an announcement that the firm would be acquired for €3.9 billion. A position in Haemonetics Corporation also made a positive contribution to relative performance. The health care company, which develops and distributes hematology products, reported earnings that beat consensus expectations in multiple quarters during the period. Results were by driven by strong performance across all four of the company’s business units.
Stock selection within health care, information technology and industrials detracted the most from relative performance. Sector allocation also modestly detracted. Pharmaceutical firm Lannett Company was the top detractor for the period. Lannett shares collapsed after an announcement that the company’s distribution agreement with another pharmaceutical company would not be renewed. A position in biotechnology company TESARO, which focuses on oncology products, also detracted from relative results. TESARO shares declined throughout the period as the company posted below consensus earnings and acquisition expectations subsided.
| 4 | Columbia Disciplined Small Core Fund | Annual Report 2018 |
Manager Discussion of Fund Performance (continued)
Portfolio activity
During the period, we made minor updates to some of the Fund’s stock selection models. We refreshed the model for the stable, mature consumer staples sector. The new model expands diversification coverage and captures additional fundamental drivers that were not included in the previous model, most notably earnings quality. We also improved factor and theme diversification within the financial-intermediaries model to provide more balance and incorporate measures of stability and growth that complement valuation, profitability and momentum.
Fund strategy
Our strategy is based on individual quantitative stock selection. Consequently, we do not rely on macroeconomic scenarios or market outlooks to make security selections. We do not try to predict when equities, as an asset class, may perform well or when they may perform poorly. Instead, we keep the Fund substantially invested at all times. Regardless of the economic environment, we seek to identify stocks that we believe have the potential to outperform within each market sector. We also seek to minimize sector weight differences between the Fund and its Russell benchmark. We favor stocks of companies with attractive valuations relative to their peers, strong business and market momentum and good quality of earnings and financial strength. Over the long term, we have found that stocks with these characteristics have tended to outperform their peers in various macroeconomic conditions.
Market risk may affect a single issuer, sector of the economy, industry or the market as a whole. Foreign investments subject the Fund to risks, including political, economic, market, social and others within a particular country, as well as to currency instabilities and less stringent financial and accounting standards generally applicable to U.S. issuers. Investments in small-cap companies involve risks and volatility greater than investments in larger, more established companies. The Fund may invest significantly in issuers within a particular sector, which may be negatively affected by market, economic or other conditions, making the Fund more vulnerable to unfavorable developments in the sector. Investments selected using quantitative methods may perform differently from the market as a whole and may not enable the Fund to achieve its objective. See the Fund’s prospectus for more information on these and other risks.
The views expressed in this report reflect the current views of the respective parties. These views are not guarantees of future performance and involve certain risks, uncertainties and assumptions that are difficult to predict, so actual outcomes and results may differ significantly from the views expressed. These views are subject to change at any time based upon economic, market or other conditions and the respective parties disclaim any responsibility to update such views. These views may not be relied on as investment advice and, because investment decisions for a Columbia fund are based on numerous factors, may not be relied on as an indication of trading intent on behalf of any particular Columbia fund. References to specific securities should not be construed as a recommendation or investment advice.
Columbia Disciplined Small Core Fund | Annual Report 2018
| 5 |
Understanding Your Fund’s Expenses
(Unaudited)
As an investor, you incur two types of costs. There are shareholder transaction costs, which generally include sales charges on purchases and may include redemption fees. There are also ongoing costs, which generally include management fees, distribution and/or service fees, and other fund expenses. The following information is intended to help you understand your ongoing costs (in dollars) of investing in the Fund and to help you compare these costs with the ongoing costs of investing in other mutual funds.
Analyzing your Fund’s expenses
To illustrate these ongoing costs, we have provided examples and calculated the expenses paid by investors in each share class of the Fund during the period. The actual and hypothetical information in the table is based on an initial investment of $1,000 at the beginning of the period indicated and held for the entire period. Expense information is calculated two ways and each method provides you with different information. The amount listed in the “Actual” column is calculated using the Fund’s actual operating expenses and total return for the period. You may use the Actual information, together with the amount invested, to estimate the expenses that you paid over the period. Simply divide your account value by $1,000 (for example, an $8,600 account value divided by $1,000 = 8.6), then multiply the results by the expenses paid during the period under the “Actual” column. The amount listed in the “Hypothetical” column assumes a 5% annual rate of return before expenses (which is not the Fund’s actual return) and then applies the Fund’s actual expense ratio for the period to the hypothetical return. You should not use the hypothetical account values and expenses to estimate either your actual account balance at the end of the period or the expenses you paid during the period. See “Compare with other funds” below for details on how to use the hypothetical data.
Compare with other funds
Since all mutual funds are required to include the same hypothetical calculations about expenses in shareholder reports, you can use this information to compare the ongoing cost of investing in the Fund with other funds. To do so, compare the hypothetical example with the 5% hypothetical examples that appear in the shareholder reports of other funds. As you compare hypothetical examples of other funds, it is important to note that hypothetical examples are meant to highlight the ongoing costs of investing in a fund only and do not reflect any transaction costs, such as sales charges, or redemption or exchange fees. Therefore, the hypothetical calculations are useful in comparing ongoing costs only, and will not help you determine the relative total costs of owning different funds. If transaction costs were included in these calculations, your costs would be higher.
| March 1, 2018 — August 31, 2018 |
| | Account value at the
beginning of the
period ($) | Account value at the
end of the
period ($) | Expenses paid during
the period ($) | Fund’s annualized
expense ratio (%) |
| | Actual | Hypothetical | Actual | Hypothetical | Actual | Hypothetical | Actual |
| Class A | 1,000.00 | 1,000.00 | 1,105.00 | 1,018.30 | 7.27 | 6.97 | 1.37 |
| Advisor Class | 1,000.00 | 1,000.00 | 1,106.70 | 1,019.56 | 5.95 | 5.70 | 1.12 |
| Class C | 1,000.00 | 1,000.00 | 1,099.20 | 1,014.52 | 11.22 | 10.76 | 2.12 |
| Institutional Class | 1,000.00 | 1,000.00 | 1,105.70 | 1,019.56 | 5.94 | 5.70 | 1.12 |
| Institutional 2 Class | 1,000.00 | 1,000.00 | 1,107.00 | 1,020.21 | 5.26 | 5.04 | 0.99 |
| Institutional 3 Class | 1,000.00 | 1,000.00 | 1,106.90 | 1,020.47 | 4.99 | 4.79 | 0.94 |
| Class T | 1,000.00 | 1,000.00 | 1,105.00 | 1,018.30 | 7.27 | 6.97 | 1.37 |
| Class V | 1,000.00 | 1,000.00 | 1,104.60 | 1,018.30 | 7.27 | 6.97 | 1.37 |
Expenses paid during the period are equal to the annualized expense ratio for each class as indicated above, multiplied by the average account value over the period and then multiplied by the number of days in the Fund’s most recent fiscal half year and divided by 365.
Expenses do not include fees and expenses incurred indirectly by the Fund from its investment in underlying funds, including affiliated and non-affiliated pooled investment vehicles, such as mutual funds and exchange-traded funds.
Had Columbia Management Investment Advisers, LLC and/or certain of its affiliates not waived/reimbursed certain fees and expenses, account value at the end of the period would have been reduced.
| 6 | Columbia Disciplined Small Core Fund | Annual Report 2018 |
Portfolio of Investments
August 31, 2018
(Percentages represent value of investments compared to net assets)
Investments in securities
| Common Stocks 97.9% |
| Issuer | Shares | Value ($) |
| Consumer Discretionary 12.8% |
| Auto Components 1.0% |
| Dana, Inc. | 10,700 | 209,399 |
| Modine Manufacturing Co.(a) | 17,800 | 299,930 |
| Tenneco, Inc. | 17,700 | 757,383 |
| Tower International, Inc. | 3,600 | 121,680 |
| Total | | 1,388,392 |
| Automobiles 0.4% |
| Winnebago Industries, Inc. | 16,100 | 594,895 |
| Diversified Consumer Services 1.6% |
| Adtalem Global Education, Inc.(a) | 18,200 | 870,870 |
| American Public Education, Inc.(a) | 1,500 | 52,125 |
| Sotheby’s (a) | 14,100 | 677,082 |
| Weight Watchers International, Inc.(a) | 8,400 | 629,160 |
| Total | | 2,229,237 |
| Hotels, Restaurants & Leisure 2.0% |
| BJ’s Restaurants, Inc. | 3,400 | 257,380 |
| Bloomin’ Brands, Inc. | 16,200 | 312,660 |
| Brinker International, Inc. | 17,800 | 788,184 |
| Cracker Barrel Old Country Store, Inc. | 4,200 | 626,178 |
| Penn National Gaming, Inc.(a) | 23,500 | 809,810 |
| Total | | 2,794,212 |
| Household Durables 0.7% |
| TRI Pointe Group, Inc.(a) | 17,000 | 246,330 |
| Zagg, Inc.(a) | 47,100 | 763,020 |
| Total | | 1,009,350 |
| Leisure Products 0.6% |
| Sturm Ruger & Co., Inc. | 12,500 | 818,125 |
| Media 1.7% |
| Entravision Communications Corp., Class A | 146,000 | 766,500 |
| Gannett Co., Inc. | 71,500 | 735,020 |
| National CineMedia, Inc. | 62,800 | 571,480 |
| World Wrestling Entertainment, Inc., Class A | 2,900 | 253,489 |
| Total | | 2,326,489 |
| Common Stocks (continued) |
| Issuer | Shares | Value ($) |
| Specialty Retail 3.5% |
| Abercrombie & Fitch Co., Class A | 27,800 | 602,426 |
| American Eagle Outfitters, Inc. | 29,300 | 760,628 |
| Hibbett Sports, Inc.(a) | 28,800 | 591,840 |
| Restoration Hardware Holdings, Inc.(a) | 5,700 | 906,300 |
| Signet Jewelers Ltd. | 14,100 | 905,220 |
| Tailored Brands, Inc. | 34,600 | 814,484 |
| Tilly’s, Inc. | 9,700 | 228,144 |
| Total | | 4,809,042 |
| Textiles, Apparel & Luxury Goods 1.3% |
| Deckers Outdoor Corp.(a) | 7,550 | 919,892 |
| Fossil Group, Inc.(a) | 13,600 | 308,312 |
| Movado Group, Inc. | 15,200 | 647,520 |
| Total | | 1,875,724 |
| Total Consumer Discretionary | 17,845,466 |
| Consumer Staples 2.9% |
| Beverages 0.6% |
| Boston Beer Co., Inc. (The), Class A(a) | 2,600 | 788,190 |
| Food & Staples Retailing 0.8% |
| Ingles Markets, Inc., Class A | 6,000 | 215,700 |
| SpartanNash Co. | 24,000 | 512,400 |
| United Natural Foods, Inc.(a) | 5,300 | 188,203 |
| Weis Markets, Inc. | 3,700 | 172,383 |
| Total | | 1,088,686 |
| Food Products 0.8% |
| Cal-Maine Foods, Inc. | 7,500 | 370,875 |
| John B. Sanfilippo & Son, Inc. | 10,100 | 738,007 |
| Total | | 1,108,882 |
| Personal Products 0.7% |
| Medifast, Inc. | 600 | 137,250 |
| Usana Health Sciences, Inc.(a) | 6,430 | 848,439 |
| Total | | 985,689 |
| Total Consumer Staples | 3,971,447 |
The accompanying Notes to Financial Statements are an integral part of this statement.
Columbia Disciplined Small Core Fund | Annual Report 2018
| 7 |
Portfolio of Investments (continued)
August 31, 2018
| Common Stocks (continued) |
| Issuer | Shares | Value ($) |
| Energy 4.3% |
| Energy Equipment & Services 1.7% |
| Diamond Offshore Drilling, Inc.(a) | 37,000 | 644,540 |
| Exterran Corp.(a) | 3,800 | 104,082 |
| ION Geophysical Corp.(a) | 3,800 | 68,210 |
| Mammoth Energy Services, Inc. | 16,300 | 447,924 |
| Matrix Service Co.(a) | 11,900 | 248,710 |
| Profire Energy, Inc.(a) | 56,000 | 159,600 |
| Rowan Companies PLC, Class A(a) | 45,800 | 643,032 |
| SEACOR Holdings, Inc.(a) | 1,600 | 82,320 |
| Total | | 2,398,418 |
| Oil, Gas & Consumable Fuels 2.6% |
| Abraxas Petroleum Corp.(a) | 31,500 | 70,875 |
| Arch Coal, Inc. | 900 | 79,803 |
| California Resources Corp.(a) | 5,400 | 224,316 |
| CVR Energy, Inc. | 14,800 | 563,140 |
| Par Pacific Holdings, Inc.(a) | 28,800 | 584,928 |
| Peabody Energy Corp. | 8,100 | 334,611 |
| Renewable Energy Group, Inc.(a) | 9,700 | 261,415 |
| REX American Resources Corp.(a) | 3,000 | 241,740 |
| Ship Finance International Ltd. | 25,500 | 362,100 |
| Southwestern Energy Co.(a) | 34,000 | 191,080 |
| W&T Offshore, Inc.(a) | 98,300 | 665,491 |
| Total | | 3,579,499 |
| Total Energy | 5,977,917 |
| Financials 17.6% |
| Banks 8.0% |
| BancFirst Corp. | 5,500 | 350,900 |
| Bancorp, Inc. (The)(a) | 69,100 | 693,073 |
| Cathay General Bancorp | 20,400 | 862,920 |
| City Holding Co. | 1,700 | 137,836 |
| Customers Bancorp, Inc.(a) | 24,350 | 601,445 |
| Eagle Bancorp, Inc.(a) | 7,500 | 403,875 |
| Enterprise Financial Services Corp. | 13,300 | 748,790 |
| First Bancorp | 4,100 | 171,052 |
| First BanCorp(a) | 97,600 | 854,000 |
| First Financial Bancorp | 4,900 | 153,860 |
| First Merchants Corp. | 15,600 | 750,672 |
| Common Stocks (continued) |
| Issuer | Shares | Value ($) |
| Hancock Whitney Corp. | 17,900 | 922,745 |
| Hope Bancorp, Inc. | 45,000 | 787,950 |
| International Bancshares Corp. | 14,900 | 698,065 |
| Metropolitan Bank Holding Corp.(a) | 1,900 | 78,356 |
| OFG Bancorp | 48,700 | 788,940 |
| Preferred Bank | 11,600 | 710,036 |
| S&T Bancorp, Inc. | 17,900 | 835,214 |
| Simmons First National Corp., Class A | 7,500 | 237,000 |
| TriState Capital Holdings, Inc.(a) | 3,600 | 107,100 |
| UMB Financial Corp. | 3,100 | 233,244 |
| Total | | 11,127,073 |
| Capital Markets 1.5% |
| Artisan Partners Asset Management, Inc., Class A | 20,800 | 689,520 |
| Cohen & Steers, Inc. | 13,400 | 557,038 |
| Oppenheimer Holdings, Inc., Class A | 3,000 | 93,600 |
| Waddell & Reed Financial, Inc., Class A | 35,600 | 712,712 |
| Total | | 2,052,870 |
| Consumer Finance 2.1% |
| Curo Group Holdings Corp.(a) | 6,100 | 188,246 |
| Encore Capital Group, Inc.(a) | 9,900 | 383,625 |
| Enova International, Inc.(a) | 20,500 | 680,600 |
| Green Dot Corp., Class A(a) | 11,900 | 1,019,473 |
| Nelnet, Inc., Class A | 12,450 | 717,743 |
| Total | | 2,989,687 |
| Insurance 1.9% |
| American Equity Investment Life Holding Co. | 26,700 | 990,303 |
| CNO Financial Group, Inc. | 41,300 | 892,493 |
| Universal Insurance Holdings, Inc. | 18,000 | 802,800 |
| Total | | 2,685,596 |
| Mortgage Real Estate Investment Trusts (REITS) 1.1% |
| AG Mortgage Investment Trust, Inc. | 6,100 | 114,680 |
| Arbor Realty Trust, Inc. | 8,500 | 104,210 |
| Invesco Mortgage Capital, Inc. | 32,500 | 527,475 |
| Ladder Capital Corp., Class A | 47,000 | 816,390 |
| Total | | 1,562,755 |
The accompanying Notes to Financial Statements are an integral part of this statement.
| 8 | Columbia Disciplined Small Core Fund | Annual Report 2018 |
Portfolio of Investments (continued)
August 31, 2018
| Common Stocks (continued) |
| Issuer | Shares | Value ($) |
| Thrifts & Mortgage Finance 3.0% |
| Essent Group Ltd.(a) | 24,300 | 1,053,648 |
| Federal Agricultural Mortgage Corp. | 9,350 | 720,604 |
| Merchants Bancorp | 7,500 | 195,825 |
| MGIC Investment Corp.(a) | 83,400 | 1,060,848 |
| Radian Group, Inc. | 53,100 | 1,079,523 |
| Total | | 4,110,448 |
| Total Financials | 24,528,429 |
| Health Care 15.6% |
| Biotechnology 6.5% |
| Adaptimmune Therapeutics PLC, ADR(a) | 18,800 | 216,576 |
| Alder Biopharmaceuticals, Inc.(a) | 38,061 | 688,904 |
| Atara Biotherapeutics, Inc.(a) | 14,200 | 581,490 |
| bluebird bio, Inc.(a) | 4,290 | 722,007 |
| Clovis Oncology, Inc.(a) | 4,100 | 146,575 |
| Dynavax Technologies Corp.(a) | 17,690 | 245,007 |
| Enanta Pharmaceuticals, Inc.(a) | 1,600 | 145,488 |
| Global Blood Therapeutics, Inc.(a) | 6,800 | 332,860 |
| Immunomedics, Inc.(a) | 37,350 | 999,486 |
| Insmed, Inc.(a) | 14,450 | 287,988 |
| Keryx Biopharmaceuticals, Inc.(a) | 43,055 | 146,818 |
| Loxo Oncology, Inc.(a) | 4,100 | 692,818 |
| Mirati Therapeutics, Inc.(a) | 5,400 | 305,370 |
| Nightstar Therapeutics PLC, ADR(a) | 15,322 | 329,423 |
| OncoMed Pharmaceuticals, Inc.(a) | 43,400 | 99,820 |
| Ovid Therapeutics, Inc.(a) | 29,618 | 197,552 |
| Puma Biotechnology, Inc.(a) | 11,045 | 485,428 |
| Sage Therapeutics, Inc.(a) | 4,330 | 711,246 |
| Sarepta Therapeutics(a) | 4,050 | 559,062 |
| Spark Therapeutics, Inc.(a) | 5,535 | 341,011 |
| TESARO, Inc.(a) | 7,425 | 240,941 |
| uniQure NV(a) | 14,600 | 619,478 |
| Total | | 9,095,348 |
| Health Care Equipment & Supplies 3.2% |
| Angiodynamics, Inc.(a) | 16,700 | 374,414 |
| Haemonetics Corp.(a) | 10,700 | 1,194,548 |
| Integer Holdings Corp.(a) | 12,400 | 990,760 |
| Lantheus Holdings, Inc.(a) | 5,004 | 80,564 |
| Common Stocks (continued) |
| Issuer | Shares | Value ($) |
| LeMaitre Vascular, Inc. | 18,100 | 678,931 |
| SurModics, Inc.(a) | 11,000 | 866,250 |
| Varex Imaging Corp.(a) | 6,400 | 200,960 |
| Total | | 4,386,427 |
| Health Care Providers & Services 2.9% |
| Magellan Health, Inc.(a) | 10,450 | 768,075 |
| Providence Service Corp. (The)(a) | 10,100 | 678,114 |
| RadNet, Inc.(a) | 23,300 | 322,705 |
| Tenet Healthcare Corp.(a) | 25,400 | 856,488 |
| Tivity Health, Inc.(a) | 21,400 | 736,160 |
| Triple-S Management Corp., Class B(a) | 29,750 | 647,657 |
| Total | | 4,009,199 |
| Life Sciences Tools & Services 0.9% |
| Luminex Corp. | 11,500 | 324,415 |
| Medpace Holdings, Inc.(a) | 14,300 | 854,997 |
| NeoGenomics, Inc.(a) | 10,000 | 138,500 |
| Total | | 1,317,912 |
| Pharmaceuticals 2.1% |
| Aerie Pharmaceuticals, Inc.(a) | 10,060 | 617,181 |
| ANI Pharmaceuticals, Inc.(a) | 9,100 | 529,620 |
| Lannett Co., Inc.(a) | 56,200 | 300,670 |
| Odonate Therapeutics, Inc.(a) | 12,500 | 239,875 |
| Phibro Animal Health Corp., Class A | 11,250 | 531,000 |
| Prestige Consumer Healthcare, Inc.(a) | 9,000 | 346,500 |
| Supernus Pharmaceuticals, Inc.(a) | 8,455 | 374,557 |
| Total | | 2,939,403 |
| Total Health Care | 21,748,289 |
| Industrials 14.7% |
| Aerospace & Defense 0.1% |
| National Presto Industries, Inc. | 700 | 92,820 |
| Air Freight & Logistics 0.3% |
| Forward Air Corp. | 6,000 | 385,560 |
| Building Products 1.2% |
| Continental Building Product(a) | 22,900 | 854,170 |
| Insteel Industries, Inc. | 3,200 | 122,720 |
| NCI Building Systems, Inc.(a) | 45,400 | 767,260 |
| Total | | 1,744,150 |
The accompanying Notes to Financial Statements are an integral part of this statement.
Columbia Disciplined Small Core Fund | Annual Report 2018
| 9 |
Portfolio of Investments (continued)
August 31, 2018
| Common Stocks (continued) |
| Issuer | Shares | Value ($) |
| Commercial Services & Supplies 2.2% |
| ACCO Brands Corp. | 54,900 | 680,760 |
| Brady Corp., Class A | 16,700 | 675,515 |
| Deluxe Corp. | 6,200 | 367,164 |
| Quad/Graphics, Inc. | 34,000 | 774,180 |
| SP Plus Corp.(a) | 14,200 | 552,380 |
| Total | | 3,049,999 |
| Construction & Engineering 1.7% |
| Comfort Systems U.S.A., Inc. | 14,300 | 820,820 |
| EMCOR Group, Inc. | 12,300 | 985,230 |
| Primoris Services Corp. | 24,500 | 613,970 |
| Total | | 2,420,020 |
| Electrical Equipment 1.3% |
| Atkore International Group, Inc.(a) | 31,200 | 854,256 |
| Generac Holdings, Inc.(a) | 17,700 | 982,173 |
| Total | | 1,836,429 |
| Machinery 4.5% |
| Federal Signal Corp. | 12,400 | 322,772 |
| Global Brass & Copper Holdings, Inc. | 15,400 | 593,670 |
| Gorman-Rupp Co. | 5,500 | 201,630 |
| Harsco Corp.(a) | 31,300 | 884,225 |
| Hillenbrand, Inc. | 18,000 | 920,700 |
| Kadant, Inc. | 6,250 | 631,562 |
| Meritor, Inc.(a) | 8,500 | 184,110 |
| Milacron Holdings Corp.(a) | 37,400 | 792,880 |
| RBC Bearings, Inc.(a) | 1,800 | 269,658 |
| Rexnord Corp.(a) | 28,900 | 838,967 |
| SPX FLOW, Inc.(a) | 11,500 | 551,310 |
| Watts Water Technologies, Inc., Class A | 1,300 | 107,185 |
| Total | | 6,298,669 |
| Marine 0.1% |
| Genco Shipping & Trading Ltd.(a) | 9,200 | 126,316 |
| Professional Services 1.1% |
| ICF International, Inc. | 3,000 | 244,950 |
| Kforce, Inc. | 20,000 | 841,000 |
| Korn/Ferry International | 5,800 | 389,354 |
| Total | | 1,475,304 |
| Common Stocks (continued) |
| Issuer | Shares | Value ($) |
| Road & Rail 1.0% |
| ArcBest Corp. | 17,700 | 851,370 |
| Saia, Inc.(a) | 5,500 | 435,875 |
| USA Truck, Inc.(a) | 4,200 | 92,022 |
| Total | | 1,379,267 |
| Trading Companies & Distributors 1.2% |
| Applied Industrial Technologies, Inc. | 12,430 | 957,732 |
| Kaman Corp. | 11,700 | 762,957 |
| Total | | 1,720,689 |
| Total Industrials | 20,529,223 |
| Information Technology 15.0% |
| Communications Equipment 2.9% |
| CalAmp Corp.(a) | 33,300 | 782,550 |
| Comtech Telecommunications Corp. | 23,100 | 828,135 |
| InterDigital, Inc. | 10,100 | 834,260 |
| NETGEAR, Inc.(a) | 12,000 | 850,200 |
| Netscout Systems, Inc.(a) | 29,700 | 742,500 |
| Total | | 4,037,645 |
| Electronic Equipment, Instruments & Components 1.9% |
| AVX Corp. | 9,200 | 194,580 |
| Benchmark Electronics, Inc. | 24,201 | 625,596 |
| Fabrinet (a) | 3,300 | 157,971 |
| Methode Electronics, Inc. | 1,700 | 67,405 |
| SYNNEX Corp. | 1,000 | 96,970 |
| Tech Data Corp.(a) | 7,300 | 531,075 |
| TTM Technologies, Inc.(a) | 3,600 | 67,320 |
| Vishay Intertechnology, Inc. | 38,400 | 913,920 |
| Total | | 2,654,837 |
| Internet Software & Services 3.2% |
| Endurance International Group Holdings Inc(a) | 27,400 | 264,410 |
| Etsy, Inc.(a) | 19,900 | 968,931 |
| j2 Global, Inc. | 11,225 | 926,848 |
| Stamps.com, Inc.(a) | 3,850 | 956,533 |
| XO Group, Inc.(a) | 10,800 | 324,648 |
| Yelp, Inc.(a) | 22,600 | 1,064,912 |
| Total | | 4,506,282 |
The accompanying Notes to Financial Statements are an integral part of this statement.
| 10 | Columbia Disciplined Small Core Fund | Annual Report 2018 |
Portfolio of Investments (continued)
August 31, 2018
| Common Stocks (continued) |
| Issuer | Shares | Value ($) |
| IT Services 2.1% |
| CACI International, Inc., Class A(a) | 2,000 | 390,000 |
| Cass Information Systems, Inc. | 1,500 | 107,295 |
| EVERTEC, Inc. | 10,900 | 262,145 |
| MAXIMUS, Inc. | 14,600 | 970,900 |
| Syntel, Inc.(a) | 22,000 | 896,280 |
| TTEC Holdings, Inc. | 8,700 | 227,940 |
| Total | | 2,854,560 |
| Semiconductors & Semiconductor Equipment 2.2% |
| Amkor Technology, Inc.(a) | 79,300 | 692,289 |
| Cirrus Logic, Inc.(a) | 15,700 | 690,015 |
| Diodes, Inc.(a) | 23,300 | 883,536 |
| Synaptics, Inc.(a) | 17,400 | 839,724 |
| Total | | 3,105,564 |
| Software 2.4% |
| Imperva, Inc.(a) | 16,600 | 782,690 |
| MicroStrategy, Inc., Class A(a) | 5,650 | 841,850 |
| OneSpan, Inc.(a) | 4,500 | 84,375 |
| Paylocity Holding Corp.(a) | 10,000 | 794,400 |
| Progress Software Corp. | 20,500 | 839,065 |
| Total | | 3,342,380 |
| Technology Hardware, Storage & Peripherals 0.3% |
| Immersion Corp.(a) | 35,100 | 407,862 |
| Total Information Technology | 20,909,130 |
| Materials 4.5% |
| Chemicals 1.0% |
| Kronos Worldwide, Inc. | 22,000 | 442,860 |
| Trinseo SA | 11,650 | 898,797 |
| Total | | 1,341,657 |
| Metals & Mining 1.6% |
| Materion Corp. | 13,750 | 877,250 |
| Schnitzer Steel Industries, Inc., Class A | 27,400 | 721,990 |
| Warrior Met Coal, Inc. | 27,100 | 651,755 |
| Total | | 2,250,995 |
| Common Stocks (continued) |
| Issuer | Shares | Value ($) |
| Paper & Forest Products 1.9% |
| Boise Cascade Co. | 18,500 | 808,450 |
| Louisiana-Pacific Corp. | 33,400 | 973,944 |
| Verso Corp., Class A(a) | 29,700 | 932,283 |
| Total | | 2,714,677 |
| Total Materials | 6,307,329 |
| Real Estate 6.8% |
| Equity Real Estate Investment Trusts (REITS) 5.9% |
| Armada Hoffler Properties, Inc. | 5,500 | 85,745 |
| Chatham Lodging Trust | 6,500 | 139,425 |
| Chesapeake Lodging Trust | 10,300 | 338,973 |
| CorEnergy Infrastructure Trust, Inc. | 19,306 | 722,623 |
| DiamondRock Hospitality Co. | 51,100 | 611,156 |
| EastGroup Properties, Inc. | 5,500 | 534,985 |
| GEO Group, Inc. (The) | 16,600 | 421,142 |
| InfraREIT, Inc. | 7,000 | 146,230 |
| Investors Real Estate Trust | 51,400 | 280,130 |
| National Health Investors, Inc. | 9,400 | 744,950 |
| Pebblebrook Hotel Trust | 22,500 | 868,725 |
| PS Business Parks, Inc. | 6,330 | 825,622 |
| Ryman Hospitality Properties, Inc. | 2,000 | 177,460 |
| Sunstone Hotel Investors, Inc. | 54,100 | 907,798 |
| Tier REIT, Inc. | 15,200 | 362,368 |
| Washington Prime Group, Inc. | 19,900 | 154,026 |
| Xenia Hotels & Resorts, Inc. | 37,100 | 900,046 |
| Total | | 8,221,404 |
| Real Estate Management & Development 0.9% |
| Altisource Portfolio Solutions SA(a) | 2,300 | 83,145 |
| HFF, Inc., Class A | 17,000 | 771,970 |
| Marcus & Millichap, Inc.(a) | 4,200 | 152,922 |
| RE/MAX Holdings, Inc., Class A | 5,500 | 270,875 |
| Total | | 1,278,912 |
| Total Real Estate | 9,500,316 |
| Telecommunication Services 0.7% |
| Diversified Telecommunication Services 0.1% |
| ATN International, Inc. | 1,100 | 80,553 |
The accompanying Notes to Financial Statements are an integral part of this statement.
Columbia Disciplined Small Core Fund | Annual Report 2018
| 11 |
Portfolio of Investments (continued)
August 31, 2018
| Common Stocks (continued) |
| Issuer | Shares | Value ($) |
| Wireless Telecommunication Services 0.6% |
| Boingo Wireless, Inc.(a) | 26,500 | 876,620 |
| Total Telecommunication Services | 957,173 |
| Utilities 3.0% |
| Electric Utilities 1.7% |
| El Paso Electric Co. | 12,600 | 772,380 |
| IDACORP, Inc. | 6,250 | 611,563 |
| PNM Resources, Inc. | 2,000 | 77,900 |
| Portland General Electric Co. | 18,250 | 846,800 |
| Total | | 2,308,643 |
| Gas Utilities 0.5% |
| Chesapeake Utilities Corp. | 7,975 | 685,850 |
| Independent Power and Renewable Electricity Producers 0.6% |
| Ormat Technologies, Inc. | 15,600 | 821,340 |
| Common Stocks (continued) |
| Issuer | Shares | Value ($) |
| Water Utilities 0.2% |
| SJW Corp. | 5,700 | 330,087 |
| Total Utilities | 4,145,920 |
Total Common Stocks
(Cost $113,532,045) | 136,420,639 |
|
| Money Market Funds 2.0% |
| | Shares | Value ($) |
| Columbia Short-Term Cash Fund, 2.058%(b),(c) | 2,838,511 | 2,838,227 |
Total Money Market Funds
(Cost $2,838,227) | 2,838,227 |
Total Investments in Securities
(Cost: $116,370,272) | 139,258,866 |
| Other Assets & Liabilities, Net | | 120,433 |
| Net Assets | 139,379,299 |
At August 31, 2018, securities and/or cash totaling $138,000 were pledged as collateral.
Investments in derivatives
| Long futures contracts |
| Description | Number of
contracts | Expiration
date | Trading
currency | Notional
amount | Value/Unrealized
appreciation ($) | Value/Unrealized
depreciation ($) |
| Russell 2000 E-mini | 37 | 09/2018 | USD | 3,220,110 | 121,424 | — |
Notes to Portfolio of Investments
| (a) | Non-income producing investment. |
| (b) | The rate shown is the seven-day current annualized yield at August 31, 2018. |
| (c) | As defined in the Investment Company Act of 1940, an affiliated company is one in which the Fund owns 5% or more of the company’s outstanding voting securities, or a company which is under common ownership or control with the Fund. Holdings and transactions in these affiliated companies during the year ended August 31, 2018 are as follows: |
| Issuer | Beginning
shares | Shares
purchased | Shares
sold | Ending
shares | Realized gain
(loss) —
affiliated
issuers ($) | Net change in
unrealized
appreciation
(depreciation) —
affiliated
issuers ($) | Dividends —
affiliated
issuers ($) | Value —
affiliated
issuers
at end of
period ($) |
| Columbia Short-Term Cash Fund, 2.058% |
| | 1,952,238 | 44,118,895 | (43,232,622) | 2,838,511 | (149) | (49) | 48,582 | 2,838,227 |
Abbreviation Legend
| ADR | American Depositary Receipt |
Currency Legend
The accompanying Notes to Financial Statements are an integral part of this statement.
| 12 | Columbia Disciplined Small Core Fund | Annual Report 2018 |
Portfolio of Investments (continued)
August 31, 2018
Fair value measurements
The Fund categorizes its fair value measurements according to a three-level hierarchy that maximizes the use of observable inputs and minimizes the use of unobservable inputs by prioritizing that the most observable input be used when available. Observable inputs are those that market participants would use in pricing an investment based on market data obtained from sources independent of the reporting entity. Unobservable inputs are those that reflect the Fund’s assumptions about the information market participants would use in pricing an investment. An investment’s level within the fair value hierarchy is based on the lowest level of any input that is deemed significant to the asset’s or liability’s fair value measurement. The input levels are not necessarily an indication of the risk or liquidity associated with investments at that level. For example, certain U.S. government securities are generally high quality and liquid, however, they are reflected as Level 2 because the inputs used to determine fair value may not always be quoted prices in an active market.
Fair value inputs are summarized in the three broad levels listed below:
| ■ | Level 1 — Valuations based on quoted prices for investments in active markets that the Fund has the ability to access at the measurement date. Valuation adjustments are not applied to Level 1 investments. |
| ■ | Level 2 — Valuations based on other significant observable inputs (including quoted prices for similar securities, interest rates, prepayment speeds, credit risks, etc.). |
| ■ | Level 3 — Valuations based on significant unobservable inputs (including the Fund’s own assumptions and judgment in determining the fair value of investments). |
Inputs that are used in determining fair value of an investment may include price information, credit data, volatility statistics, and other factors. These inputs can be either observable or unobservable. The availability of observable inputs can vary between investments, and is affected by various factors such as the type of investment, and the volume and level of activity for that investment or similar investments in the marketplace. The inputs will be considered by the Investment Manager, along with any other relevant factors in the calculation of an investment’s fair value. The Fund uses prices and inputs that are current as of the measurement date, which may include periods of market dislocations. During these periods, the availability of prices and inputs may be reduced for many investments. This condition could cause an investment to be reclassified between the various levels within the hierarchy.
Certain investments that have been measured at fair value using the net asset value (NAV) per share (or its equivalent) are not categorized in the fair value hierarchy. The fair value amounts presented in the table are intended to reconcile the fair value hierarchy to the amounts presented in the Portfolio of Investments. The Columbia Short-Term Cash Fund seeks to provide shareholders with maximum current income consistent with liquidity and stability of principal. Columbia Short-Term Cash Fund prices its shares with a floating NAV and no longer seeks to maintain a stable NAV.
Investments falling into the Level 3 category are primarily supported by quoted prices from brokers and dealers participating in the market for those investments. However, these may be classified as Level 3 investments due to lack of market transparency and corroboration to support these quoted prices. Additionally, valuation models may be used as the pricing source for any remaining investments classified as Level 3. These models may rely on one or more significant unobservable inputs and/or significant assumptions by the Investment Manager. Inputs used in valuations may include, but are not limited to, financial statement analysis, capital account balances, discount rates and estimated cash flows, and comparable company data.
Under the direction of the Fund’s Board of Trustees (the Board), the Investment Manager’s Valuation Committee (the Committee) is responsible for overseeing the valuation procedures approved by the Board. The Committee consists of voting and non-voting members from various groups within the Investment Manager’s organization, including operations and accounting, trading and investments, compliance, risk management and legal.
The Committee meets at least monthly to review and approve valuation matters, which may include a description of specific valuation determinations, data regarding pricing information received from approved pricing vendors and brokers and the results of Board-approved valuation control policies and procedures (the Policies). The Policies address, among other things, instances when market quotations are or are not readily available, including recommendations of third party pricing vendors and a determination of appropriate pricing methodologies; events that require specific valuation determinations and assessment of fair value techniques; securities with a potential for stale pricing, including those that are illiquid, restricted, or in default; and the effectiveness of third party pricing vendors, including periodic reviews of vendors. The Committee meets more frequently, as needed, to discuss additional valuation matters, which may include the need to review back-testing results, review time-sensitive information or approve related valuation actions. The Committee reports to the Board, with members of the Committee meeting with the Board at each of its regularly scheduled meetings to discuss valuation matters and actions during the period, similar to those described earlier.
For investments categorized as Level 3, the Committee monitors information similar to that described above, which may include: (i) data specific to the issuer or comparable issuers, (ii) general market or specific sector news and (iii) quoted prices and specific or similar security transactions. The Committee considers this data and any changes from prior periods in order to assess the reasonableness of observable and unobservable inputs, any assumptions or internal models used to value those securities and changes in fair value. This data is also used to corroborate, when available, information received from approved pricing vendors and brokers. Various factors impact the frequency of monitoring this information (which may occur as often as daily). However, the Committee may determine that changes to inputs, assumptions and models are not required as a result of the monitoring procedures performed.
The following table is a summary of the inputs used to value the Fund’s investments at August 31, 2018:
| | Level 1
quoted prices
in active
markets for
identical
assets ($) | Level 2
other
significant
observable
inputs ($) | Level 3
significant
unobservable
inputs ($) | Investments
measured at
net asset
value ($) | Total ($) |
| Investments in Securities | | | | | |
| Common Stocks | | | | | |
| Consumer Discretionary | 17,845,466 | — | — | — | 17,845,466 |
| Consumer Staples | 3,971,447 | — | — | — | 3,971,447 |
| Energy | 5,977,917 | — | — | — | 5,977,917 |
| Financials | 24,528,429 | — | — | — | 24,528,429 |
| Health Care | 21,748,289 | — | — | — | 21,748,289 |
| Industrials | 20,529,223 | — | — | — | 20,529,223 |
| Information Technology | 20,909,130 | — | — | — | 20,909,130 |
| Materials | 6,307,329 | — | — | — | 6,307,329 |
The accompanying Notes to Financial Statements are an integral part of this statement.
Columbia Disciplined Small Core Fund | Annual Report 2018
| 13 |
Portfolio of Investments (continued)
August 31, 2018
Fair value measurements (continued)
| | Level 1
quoted prices
in active
markets for
identical
assets ($) | Level 2
other
significant
observable
inputs ($) | Level 3
significant
unobservable
inputs ($) | Investments
measured at
net asset
value ($) | Total ($) |
| Real Estate | 9,500,316 | — | — | — | 9,500,316 |
| Telecommunication Services | 957,173 | — | — | — | 957,173 |
| Utilities | 4,145,920 | — | — | — | 4,145,920 |
| Total Common Stocks | 136,420,639 | — | — | — | 136,420,639 |
| Money Market Funds | — | — | — | 2,838,227 | 2,838,227 |
| Total Investments in Securities | 136,420,639 | — | — | 2,838,227 | 139,258,866 |
| Investments in Derivatives | | | | | |
| Asset | | | | | |
| Futures Contracts | 121,424 | — | — | — | 121,424 |
| Total | 136,542,063 | — | — | 2,838,227 | 139,380,290 |
See the Portfolio of Investments for all investment classifications not indicated in the table.
Derivative instruments are valued at unrealized appreciation (depreciation).
There were no transfers of financial assets between levels during the period.
The accompanying Notes to Financial Statements are an integral part of this statement.
| 14 | Columbia Disciplined Small Core Fund | Annual Report 2018 |
Statement of Assets and Liabilities
August 31, 2018
| Assets | |
| Investments in securities, at value | |
| Unaffiliated issuers (cost $113,532,045) | $136,420,639 |
| Affiliated issuers (cost $2,838,227) | 2,838,227 |
| Margin deposits on: | |
| Futures contracts | 138,000 |
| Receivable for: | |
| Capital shares sold | 16,033 |
| Dividends | 77,584 |
| Variation margin for futures contracts | 11,400 |
| Expense reimbursement due from Investment Manager | 635 |
| Prepaid expenses | 903 |
| Trustees’ deferred compensation plan | 112,977 |
| Total assets | 139,616,398 |
| Liabilities | |
| Payable for: | |
| Capital shares purchased | 45,051 |
| Variation margin for futures contracts | 1,447 |
| Management services fees | 3,235 |
| Distribution and/or service fees | 829 |
| Transfer agent fees | 27,664 |
| Compensation of chief compliance officer | 10 |
| Audit fees | 32,800 |
| Other expenses | 13,086 |
| Trustees’ deferred compensation plan | 112,977 |
| Total liabilities | 237,099 |
| Net assets applicable to outstanding capital stock | $139,379,299 |
| Represented by | |
| Paid in capital | 91,443,978 |
| Excess of distributions over net investment income | (226,427) |
| Accumulated net realized gain | 25,151,730 |
| Unrealized appreciation (depreciation) on: | |
| Investments - unaffiliated issuers | 22,888,594 |
| Futures contracts | 121,424 |
| Total - representing net assets applicable to outstanding capital stock | $139,379,299 |
The accompanying Notes to Financial Statements are an integral part of this statement.
Columbia Disciplined Small Core Fund | Annual Report 2018
| 15 |
Statement of Assets and Liabilities (continued)
August 31, 2018
| Class A | |
| Net assets | $41,990,639 |
| Shares outstanding | 5,247,672 |
| Net asset value per share | $8.00 |
| Maximum sales charge | 5.75% |
| Maximum offering price per share (calculated by dividing the net asset value per share by 1.0 minus the maximum sales charge for Class A shares) | $8.49 |
| Advisor Class | |
| Net assets | $1,528,572 |
| Shares outstanding | 165,690 |
| Net asset value per share | $9.23 |
| Class C | |
| Net assets | $5,613,043 |
| Shares outstanding | 1,332,384 |
| Net asset value per share | $4.21 |
| Institutional Class | |
| Net assets | $32,221,415 |
| Shares outstanding | 3,578,786 |
| Net asset value per share | $9.00 |
| Institutional 2 Class | |
| Net assets | $508,636 |
| Shares outstanding | 54,652 |
| Net asset value per share | $9.31 |
| Institutional 3 Class | |
| Net assets | $548,434 |
| Shares outstanding | 58,245 |
| Net asset value per share | $9.42 |
| Class T | |
| Net assets | $106,598 |
| Shares outstanding | 13,324 |
| Net asset value per share | $8.00 |
| Maximum sales charge | 2.50% |
| Maximum offering price per share (calculated by dividing the net asset value per share by 1.0 minus the maximum sales charge per transaction for Class T shares) | $8.21 |
| Class V | |
| Net assets | $56,861,962 |
| Shares outstanding | 7,584,182 |
| Net asset value per share | $7.50 |
| Maximum sales charge | 5.75% |
| Maximum offering price per share (calculated by dividing the net asset value per share by 1.0 minus the maximum sales charge for Class V shares) | $7.96 |
The accompanying Notes to Financial Statements are an integral part of this statement.
| 16 | Columbia Disciplined Small Core Fund | Annual Report 2018 |
Statement of Operations
Year Ended August 31, 2018
| Net investment income | |
| Income: | |
| Dividends — unaffiliated issuers | $2,505,421 |
| Dividends — affiliated issuers | 48,582 |
| Interest | 1,838 |
| Foreign taxes withheld | (2,502) |
| Total income | 2,553,339 |
| Expenses: | |
| Management services fees | 1,553,711 |
| Distribution and/or service fees | |
| Class A | 108,882 |
| Class C | 93,388 |
| Class T | 306 |
| Class V | 141,246 |
| Transfer agent fees | |
| Class A | 84,342 |
| Advisor Class | 2,220 |
| Class C | 18,159 |
| Institutional Class | 69,280 |
| Institutional 2 Class | 565 |
| Institutional 3 Class | 2,845 |
| Class T | 237 |
| Class V | 109,250 |
| Compensation of board members | 18,669 |
| Custodian fees | 17,078 |
| Printing and postage fees | 30,124 |
| Registration fees | 115,030 |
| Audit fees | 36,812 |
| Legal fees | 4,217 |
| Line of credit interest | 81 |
| Compensation of chief compliance officer | 72 |
| Other | 16,393 |
| Total expenses | 2,422,907 |
| Fees waived or expenses reimbursed by Investment Manager and its affiliates | (84,447) |
| Fees waived by transfer agent | |
| Institutional 2 Class | (94) |
| Institutional 3 Class | (1,495) |
| Expense reduction | (1,465) |
| Total net expenses | 2,335,406 |
| Net investment income | 217,933 |
| Realized and unrealized gain (loss) — net | |
| Net realized gain (loss) on: | |
| Investments — unaffiliated issuers | 28,984,926 |
| Investments — affiliated issuers | (149) |
| Futures contracts | 445,643 |
| Increase from payment by affiliate (Note 6) | 59,296 |
| Net realized gain | 29,489,716 |
| Net change in unrealized appreciation (depreciation) on: | |
| Investments — unaffiliated issuers | (1,285,770) |
| Investments — affiliated issuers | (49) |
| Futures contracts | 151,603 |
| Net change in unrealized appreciation (depreciation) | (1,134,216) |
| Net realized and unrealized gain | 28,355,500 |
| Net increase in net assets resulting from operations | $28,573,433 |
The accompanying Notes to Financial Statements are an integral part of this statement.
Columbia Disciplined Small Core Fund | Annual Report 2018
| 17 |
Statement of Changes in Net Assets
| | Year Ended
August 31, 2018 | Year Ended
August 31, 2017 |
| Operations | | |
| Net investment income | $217,933 | $886,430 |
| Net realized gain | 29,489,716 | 38,569,067 |
| Net change in unrealized appreciation (depreciation) | (1,134,216) | (17,341,472) |
| Net increase in net assets resulting from operations | 28,573,433 | 22,114,025 |
| Distributions to shareholders | | |
| Net investment income | | |
| Class A | (117,801) | (173,000) |
| Advisor Class | (3,861) | (9,829) |
| Class I | — | (274,529) |
| Institutional Class | (157,929) | (261,063) |
| Institutional 2 Class | (2,701) | (14,276) |
| Institutional 3 Class | (288,519) | (36,572) |
| Class T | (368) | (503) |
| Class V | (150,990) | (144,072) |
| Net realized gains | | |
| Class A | (8,786,999) | (25,795,429) |
| Advisor Class | (147,372) | (743,122) |
| Class B | — | (81,231) |
| Class C | (3,194,732) | (6,630,145) |
| Class I | — | (15,779,743) |
| Institutional Class | (6,027,157) | (19,737,710) |
| Institutional 2 Class | (84,852) | (886,918) |
| Institutional 3 Class | (8,389,930) | (2,102,102) |
| Class T | (27,419) | (75,007) |
| Class V | (11,262,638) | (21,482,049) |
| Total distributions to shareholders | (38,643,268) | (94,227,300) |
| Increase (decrease) in net assets from capital stock activity | (59,793,571) | 8,949,070 |
| Total decrease in net assets | (69,863,406) | (63,164,205) |
| Net assets at beginning of year | 209,242,705 | 272,406,910 |
| Net assets at end of year | $139,379,299 | $209,242,705 |
| Undistributed (excess of distributions over) net investment income | $(226,427) | $8,382 |
The accompanying Notes to Financial Statements are an integral part of this statement.
| 18 | Columbia Disciplined Small Core Fund | Annual Report 2018 |
Statement of Changes in Net Assets (continued)
| | Year Ended | Year Ended |
| | August 31, 2018 | August 31, 2017 |
| | Shares | Dollars ($) | Shares | Dollars ($) |
| Capital stock activity |
| Class A | | | | |
| Subscriptions | 1,003,977 | 7,828,959 | 1,395,615 | 13,466,068 |
| Distributions reinvested | 962,296 | 7,082,498 | 2,570,210 | 21,641,165 |
| Redemptions | (2,418,383) | (19,062,523) | (4,567,051) | (41,417,051) |
| Net decrease | (452,110) | (4,151,066) | (601,226) | (6,309,818) |
| Advisor Class | | | | |
| Subscriptions | 118,622 | 1,046,725 | 48,626 | 496,792 |
| Distributions reinvested | 17,855 | 151,233 | 79,677 | 752,951 |
| Redemptions | (41,088) | (359,090) | (286,796) | (3,010,875) |
| Net increase (decrease) | 95,389 | 838,868 | (158,493) | (1,761,132) |
| Class B | | | | |
| Subscriptions | — | — | 1,583 | 8,231 |
| Distributions reinvested | — | — | 13,901 | 72,284 |
| Redemptions | — | — | (36,701) | (205,142) |
| Net decrease | — | — | (21,217) | (124,627) |
| Class C | | | | |
| Subscriptions | 238,410 | 996,761 | 301,372 | 1,668,145 |
| Distributions reinvested | 725,953 | 2,831,219 | 1,083,432 | 5,655,516 |
| Redemptions | (1,653,648) | (7,002,867) | (1,134,058) | (6,899,588) |
| Net increase (decrease) | (689,285) | (3,174,887) | 250,746 | 424,073 |
| Class I | | | | |
| Subscriptions | — | — | 76,704 | 755,431 |
| Distributions reinvested | — | — | 1,707,843 | 16,053,727 |
| Redemptions | — | — | (5,737,203) | (55,036,426) |
| Net decrease | — | — | (3,952,656) | (38,227,268) |
| Institutional Class | | | | |
| Subscriptions | 427,057 | 3,736,189 | 2,467,312 | 25,523,795 |
| Distributions reinvested | 610,617 | 5,049,807 | 1,446,011 | 13,390,059 |
| Redemptions | (2,125,619) | (19,952,608) | (3,919,368) | (39,174,860) |
| Net decrease | (1,087,945) | (11,166,612) | (6,045) | (261,006) |
| Institutional 2 Class | | | | |
| Subscriptions | 27,494 | 260,982 | 261,636 | 2,593,182 |
| Distributions reinvested | 10,252 | 87,553 | 94,763 | 901,194 |
| Redemptions | (270,793) | (2,696,793) | (292,523) | (2,896,262) |
| Net increase (decrease) | (233,047) | (2,348,258) | 63,876 | 598,114 |
| Institutional 3 Class | | | | |
| Subscriptions | 104,501 | 962,885 | 5,089,953 | 48,792,250 |
| Distributions reinvested | 991,424 | 8,565,902 | 222,723 | 2,138,140 |
| Redemptions | (6,079,741) | (53,906,097) | (791,106) | (7,979,352) |
| Net increase (decrease) | (4,983,816) | (44,377,310) | 4,521,570 | 42,951,038 |
| Class T | | | | |
| Distributions reinvested | 3,746 | 27,567 | 8,903 | 74,960 |
| Redemptions | (7,342) | (56,483) | (10,820) | (96,299) |
| Net decrease | (3,596) | (28,916) | (1,917) | (21,339) |
| Class V | | | | |
| Subscriptions | 422,269 | 2,927,131 | 686,076 | 5,495,087 |
| Distributions reinvested | 1,197,764 | 8,264,569 | 1,935,736 | 15,466,654 |
| Redemptions | (887,544) | (6,577,090) | (1,033,029) | (9,280,706) |
| Net increase | 732,489 | 4,614,610 | 1,588,783 | 11,681,035 |
| Total net increase (decrease) | (6,621,921) | (59,793,571) | 1,683,421 | 8,949,070 |
The accompanying Notes to Financial Statements are an integral part of this statement.
Columbia Disciplined Small Core Fund | Annual Report 2018
| 19 |
The following table is intended to help you understand the Fund’s financial performance. Certain information reflects financial results for a single share of a class held for the periods shown. Per share net investment income (loss) amounts are calculated based on average shares outstanding during the period. Total return assumes reinvestment of all dividends and distributions, if any. Total return does not reflect payment of sales charges, if any. Total return and portfolio turnover are not annualized for periods of less than one year. The portfolio turnover rate is calculated without regard to purchase and sales transactions of short-term instruments and certain derivatives, if any. If such transactions were included, the Fund’s portfolio turnover rate may be higher.
| | Net asset value,
beginning of
period | Net
investment
income
(loss) | Net
realized
and
unrealized
gain (loss) | Increase
from payment
by affiliate | Total from
investment
operations | Distributions
from net
investment
income | Distributions
from net
realized
gains | Total
distributions to
shareholders |
| Class A |
| Year Ended 8/31/2018 | $8.45 | (0.00) (c) | 1.26 | 0.00 (c) | 1.26 | (0.02) | (1.69) | (1.71) |
| Year Ended 8/31/2017 | $11.81 | 0.02 | 0.94 | — | 0.96 | (0.03) | (4.29) | (4.32) |
| Year Ended 8/31/2016 | $16.72 | 0.00 (c) | 0.65 | — | 0.65 | (0.01) | (5.55) | (5.56) |
| Year Ended 8/31/2015 | $19.57 | (0.06) | (1.21) | — | (1.27) | (0.01) | (1.57) | (1.58) |
| Year Ended 8/31/2014 | $18.57 | (0.06) | 2.73 | — | 2.67 | (0.01) | (1.66) | (1.67) |
| Advisor Class |
| Year Ended 8/31/2018 | $9.49 | 0.02 | 1.45 | 0.00 (c) | 1.47 | (0.04) | (1.69) | (1.73) |
| Year Ended 8/31/2017 | $12.79 | 0.05 | 0.99 | — | 1.04 | (0.05) | (4.29) | (4.34) |
| Year Ended 8/31/2016 | $17.63 | 0.03 | 0.70 | — | 0.73 | (0.02) | (5.55) | (5.57) |
| Year Ended 8/31/2015 | $20.51 | (0.02) | (1.26) | — | (1.28) | (0.03) | (1.57) | (1.60) |
| Year Ended 8/31/2014 | $19.37 | (0.02) | 2.86 | — | 2.84 | (0.04) | (1.66) | (1.70) |
| Class C |
| Year Ended 8/31/2018 | $5.21 | (0.03) | 0.72 | 0.00 (c) | 0.69 | — | (1.69) | (1.69) |
| Year Ended 8/31/2017 | $8.84 | (0.03) | 0.69 | — | 0.66 | — | (4.29) | (4.29) |
| Year Ended 8/31/2016 | $13.93 | (0.07) | 0.53 | — | 0.46 | — | (5.55) | (5.55) |
| Year Ended 8/31/2015 | $16.68 | (0.17) | (1.01) | — | (1.18) | — | (1.57) | (1.57) |
| Year Ended 8/31/2014 | $16.15 | (0.18) | 2.37 | — | 2.19 | — | (1.66) | (1.66) |
| Institutional Class |
| Year Ended 8/31/2018 | $9.30 | 0.02 | 1.41 | 0.00 (c) | 1.43 | (0.04) | (1.69) | (1.73) |
| Year Ended 8/31/2017 | $12.61 | 0.05 | 0.98 | — | 1.03 | (0.05) | (4.29) | (4.34) |
| Year Ended 8/31/2016 | $17.46 | 0.03 | 0.69 | — | 0.72 | (0.02) | (5.55) | (5.57) |
| Year Ended 8/31/2015 | $20.33 | (0.02) | (1.25) | — | (1.27) | (0.03) | (1.57) | (1.60) |
| Year Ended 8/31/2014 | $19.21 | (0.01) | 2.83 | — | 2.82 | (0.04) | (1.66) | (1.70) |
| Institutional 2 Class |
| Year Ended 8/31/2018 | $9.56 | 0.02 | 1.47 | 0.00 (c) | 1.49 | (0.05) | (1.69) | (1.74) |
| Year Ended 8/31/2017 | $12.85 | 0.06 | 1.01 | — | 1.07 | (0.07) | (4.29) | (4.36) |
| Year Ended 8/31/2016 | $17.68 | 0.05 | 0.70 | — | 0.75 | (0.03) | (5.55) | (5.58) |
| Year Ended 8/31/2015 | $20.55 | 0.02 | (1.28) | — | (1.26) | (0.04) | (1.57) | (1.61) |
| Year Ended 8/31/2014 | $19.38 | 0.02 | 2.87 | — | 2.89 | (0.06) | (1.66) | (1.72) |
The accompanying Notes to Financial Statements are an integral part of this statement.
| 20 | Columbia Disciplined Small Core Fund | Annual Report 2018 |
Financial Highlights (continued)
| | Net
asset
value,
end of
period | Total
return | Total gross
expense
ratio to
average
net assets(a) | Total net
expense
ratio to
average
net assets(a),(b) | Net investment
income (loss)
ratio to
average
net assets | Portfolio
turnover | Net
assets,
end of
period
(000’s) |
| Class A |
| Year Ended 8/31/2018 | $8.00 | 16.70% (d) | 1.43% (e) | 1.37% (e),(f) | (0.00%) (c) | 87% | $41,991 |
| Year Ended 8/31/2017 | $8.45 | 8.22% | 1.42% (g) | 1.37% (f),(g) | 0.26% | 87% | $48,138 |
| Year Ended 8/31/2016 | $11.81 | 4.32% | 1.39% | 1.38% (f) | 0.01% | 112% | $74,434 |
| Year Ended 8/31/2015 | $16.72 | (6.81%) | 1.36% | 1.36% (f) | (0.35%) | 23% | $137,486 |
| Year Ended 8/31/2014 | $19.57 | 14.73% | 1.35% (e) | 1.35% (e),(f) | (0.32%) | 19% | $418,814 |
| Advisor Class |
| Year Ended 8/31/2018 | $9.23 | 17.17% (d) | 1.19% (e) | 1.12% (e),(f) | 0.20% | 87% | $1,529 |
| Year Ended 8/31/2017 | $9.49 | 8.30% | 1.16% (g) | 1.12% (f),(g) | 0.47% | 87% | $667 |
| Year Ended 8/31/2016 | $12.79 | 4.64% | 1.14% | 1.13% (f) | 0.26% | 112% | $2,926 |
| Year Ended 8/31/2015 | $17.63 | (6.56%) | 1.11% | 1.11% (f) | (0.09%) | 23% | $6,123 |
| Year Ended 8/31/2014 | $20.51 | 15.02% | 1.10% (e) | 1.10% (e),(f) | (0.09%) | 19% | $7,124 |
| Class C |
| Year Ended 8/31/2018 | $4.21 | 15.81% (d) | 2.18% (e) | 2.12% (e),(f) | (0.73%) | 87% | $5,613 |
| Year Ended 8/31/2017 | $5.21 | 7.34% | 2.17% (g) | 2.12% (f),(g) | (0.49%) | 87% | $10,530 |
| Year Ended 8/31/2016 | $8.84 | 3.62% | 2.14% | 2.13% (f) | (0.73%) | 112% | $15,654 |
| Year Ended 8/31/2015 | $13.93 | (7.53%) | 2.11% | 2.11% (f) | (1.09%) | 23% | $22,625 |
| Year Ended 8/31/2014 | $16.68 | 13.90% | 2.10% (e) | 2.10% (e),(f) | (1.06%) | 19% | $31,035 |
| Institutional Class |
| Year Ended 8/31/2018 | $9.00 | 17.06% (d) | 1.18% (e) | 1.12% (e),(f) | 0.27% | 87% | $32,221 |
| Year Ended 8/31/2017 | $9.30 | 8.34% | 1.18% (g) | 1.12% (f),(g) | 0.50% | 87% | $43,415 |
| Year Ended 8/31/2016 | $12.61 | 4.64% | 1.14% | 1.13% (f) | 0.22% | 112% | $58,911 |
| Year Ended 8/31/2015 | $17.46 | (6.56%) | 1.11% | 1.11% (f) | (0.09%) | 23% | $239,255 |
| Year Ended 8/31/2014 | $20.33 | 15.04% | 1.10% (e) | 1.10% (e),(f) | (0.06%) | 19% | $466,376 |
| Institutional 2 Class |
| Year Ended 8/31/2018 | $9.31 | 17.26% (d) | 1.04% (e) | 1.00% (e) | 0.17% | 87% | $509 |
| Year Ended 8/31/2017 | $9.56 | 8.47% | 1.04% (g) | 1.02% (g) | 0.57% | 87% | $2,751 |
| Year Ended 8/31/2016 | $12.85 | 4.76% | 0.98% | 0.98% | 0.35% | 112% | $2,876 |
| Year Ended 8/31/2015 | $17.68 | (6.43%) | 0.93% | 0.93% | 0.10% | 23% | $12,955 |
| Year Ended 8/31/2014 | $20.55 | 15.30% | 0.90% (e) | 0.90% (e) | 0.11% | 19% | $27,726 |
The accompanying Notes to Financial Statements are an integral part of this statement.
Columbia Disciplined Small Core Fund | Annual Report 2018
| 21 |
Financial Highlights (continued)
| | Net asset value,
beginning of
period | Net
investment
income
(loss) | Net
realized
and
unrealized
gain (loss) | Increase
from payment
by affiliate | Total from
investment
operations | Distributions
from net
investment
income | Distributions
from net
realized
gains | Total
distributions to
shareholders |
| Institutional 3 Class |
| Year Ended 8/31/2018 | $9.66 | 0.05 | 1.46 | 0.00 (c) | 1.51 | (0.06) | (1.69) | (1.75) |
| Year Ended 8/31/2017 | $12.94 | 0.06 | 1.02 | — | 1.08 | (0.07) | (4.29) | (4.36) |
| Year Ended 8/31/2016 | $17.76 | 0.06 | 0.70 | — | 0.76 | (0.03) | (5.55) | (5.58) |
| Year Ended 8/31/2015 | $20.63 | 0.03 | (1.29) | — | (1.26) | (0.04) | (1.57) | (1.61) |
| Year Ended 8/31/2014 | $19.45 | 0.03 | 2.88 | — | 2.91 | (0.07) | (1.66) | (1.73) |
| Class T |
| Year Ended 8/31/2018 | $8.44 | 0.00 (c) | 1.27 | 0.00 (c) | 1.27 | (0.02) | (1.69) | (1.71) |
| Year Ended 8/31/2017 | $11.81 | 0.02 | 0.93 | — | 0.95 | (0.03) | (4.29) | (4.32) |
| Year Ended 8/31/2016 | $16.72 | 0.00 (c) | 0.65 | — | 0.65 | (0.01) | (5.55) | (5.56) |
| Year Ended 8/31/2015 | $19.57 | (0.09) | (1.18) | — | (1.27) | (0.01) | (1.57) | (1.58) |
| Year Ended 8/31/2014 | $18.57 | (0.06) | 2.73 | — | 2.67 | (0.01) | (1.66) | (1.67) |
| Class V |
| Year Ended 8/31/2018 | $8.01 | (0.00) (c) | 1.20 | 0.00 (c) | 1.20 | (0.02) | (1.69) | (1.71) |
| Year Ended 8/31/2017 | $11.41 | 0.02 | 0.90 | — | 0.92 | (0.03) | (4.29) | (4.32) |
| Year Ended 8/31/2016 | $16.33 | 0.00 (c) | 0.64 | — | 0.64 | (0.01) | (5.55) | (5.56) |
| Year Ended 8/31/2015 | $19.16 | (0.06) | (1.19) | — | (1.25) | (0.01) | (1.57) | (1.58) |
| Year Ended 8/31/2014 | $18.21 | (0.07) | 2.68 | — | 2.61 | (0.00) (c) | (1.66) | (1.66) |
| Notes to Financial Highlights |
| (a) | In addition to the fees and expenses that the Fund bears directly, the Fund indirectly bears a pro rata share of the fees and expenses of any other funds in which it invests. Such indirect expenses are not included in the Fund’s reported expense ratios. |
| (b) | Total net expenses include the impact of certain fee waivers/expense reimbursements made by the Investment Manager and certain of its affiliates, if applicable. |
| (c) | Rounds to zero. |
| (d) | The Fund received a payment from an affiliate. Had the Fund not received this payment, the total return would have been lower by 0.04%. |
| (e) | Ratios include line of credit interest expense which is less than 0.01%. |
| (f) | The benefits derived from expense reductions had an impact of less than 0.01%. |
| (g) | Expenses have been reduced due to a reimbursement of expenses overbilled by a third party. If the reimbursement had been excluded, the expense ratios would have been higher by the percentages shown for each class in the table below. All fee waivers and expense reimbursements by the Investment Manager and its affiliates were applied before giving effect to this third party reimbursement. |
| Year Ended | Class A | Advisor
Class | Class C | Institutional
Class | Institutional 2
Class | Class T | Class V |
| 08/31/2017 | 0.01 % | 0.01 % | 0.01 % | 0.01 % | 0.01 % | 0.01 % | 0.01 % |
The accompanying Notes to Financial Statements are an integral part of this statement.
| 22 | Columbia Disciplined Small Core Fund | Annual Report 2018 |
Financial Highlights (continued)
| | Net
asset
value,
end of
period | Total
return | Total gross
expense
ratio to
average
net assets(a) | Total net
expense
ratio to
average
net assets(a),(b) | Net investment
income (loss)
ratio to
average
net assets | Portfolio
turnover | Net
assets,
end of
period
(000’s) |
| Institutional 3 Class |
| Year Ended 8/31/2018 | $9.42 | 17.24% (d) | 0.98% (e) | 0.95% (e) | 0.55% | 87% | $548 |
| Year Ended 8/31/2017 | $9.66 | 8.57% | 1.00% | 0.98% | 0.57% | 87% | $48,689 |
| Year Ended 8/31/2016 | $12.94 | 4.83% | 0.94% | 0.94% | 0.49% | 112% | $6,736 |
| Year Ended 8/31/2015 | $17.76 | (6.39%) | 0.88% | 0.88% | 0.17% | 23% | $3,024 |
| Year Ended 8/31/2014 | $20.63 | 15.33% | 0.87% (e) | 0.87% (e) | 0.16% | 19% | $14,600 |
| Class T |
| Year Ended 8/31/2018 | $8.00 | 16.84% (d) | 1.42% (e) | 1.37% (e),(f) | 0.02% | 87% | $107 |
| Year Ended 8/31/2017 | $8.44 | 8.09% | 1.42% (g) | 1.37% (f),(g) | 0.26% | 87% | $143 |
| Year Ended 8/31/2016 | $11.81 | 4.32% | 1.39% | 1.38% (f) | 0.02% | 112% | $223 |
| Year Ended 8/31/2015 | $16.72 | (6.80%) | 1.30% | 1.30% (f) | (0.44%) | 23% | $306 |
| Year Ended 8/31/2014 | $19.57 | 14.73% | 1.35% (e) | 1.35% (e),(f) | (0.32%) | 19% | $69,033 |
| Class V |
| Year Ended 8/31/2018 | $7.50 | 16.87% (d) | 1.43% (e) | 1.37% (e),(f) | (0.01%) | 87% | $56,862 |
| Year Ended 8/31/2017 | $8.01 | 8.12% | 1.43% (g) | 1.37% (f),(g) | 0.25% | 87% | $54,908 |
| Year Ended 8/31/2016 | $11.41 | 4.35% | 1.39% | 1.38% (f) | 0.03% | 112% | $60,071 |
| Year Ended 8/31/2015 | $16.33 | (6.87%) | 1.38% | 1.38% (f) | (0.36%) | 23% | $65,184 |
| Year Ended 8/31/2014 | $19.16 | 14.71% | 1.40% (e) | 1.40% (e),(f) | (0.36%) | 19% | $78,860 |
The accompanying Notes to Financial Statements are an integral part of this statement.
Columbia Disciplined Small Core Fund | Annual Report 2018
| 23 |
Notes to Financial Statements
August 31, 2018
Note 1. Organization
Columbia Disciplined Small Core Fund (the Fund), a series of Columbia Funds Series Trust I (the Trust), is a diversified fund. The Trust is registered under the Investment Company Act of 1940, as amended (the 1940 Act), as an open-end management investment company organized as a Massachusetts business trust.
Fund shares
The Trust may issue an unlimited number of shares (without par value). Although all share classes generally have identical voting, dividend and liquidation rights, each share class votes separately when required by the Trust’s organizational documents or by law. Different share classes pay different distribution amounts to the extent the expenses of such share classes differ, and distributions in liquidation will be proportional to the net asset value of each share class. Each share class has its own expense and sales charge structure. The Fund offers each of the share classes identified below.
Class A shares are subject to a maximum front-end sales charge of 5.75% based on the initial investment amount. Class A shares purchased without an initial sales charge in accounts aggregating $1 million to $50 million at the time of purchase are subject to a contingent deferred sales charge (CDSC) if the shares are sold within 18 months after purchase, charged as follows: 1.00% CDSC if redeemed within 12 months after purchase, and 0.50% CDSC if redeemed more than 12, but less than 18, months after purchase.
Advisor Class shares are not subject to sales charges and are generally available only to omnibus retirement plans and certain investors as described in the Fund’s prospectus. Prior to November 1, 2017, Advisor Class shares were known as Class R4 shares.
Class C shares are subject to a 1.00% CDSC on shares redeemed within 12 months after purchase. Effective July 1, 2018, Class C shares will automatically convert to Class A shares of the same Fund in the month of or the month following the 10-year anniversary of the Class C shares purchase date.
Institutional Class shares are not subject to sales charges and are generally available only to eligible investors, which are subject to different investment minimums as described in the Fund’s prospectus. Prior to November 1, 2017, Institutional Class shares were known as Class Z shares.
Institutional 2 Class shares are not subject to sales charges and are generally available only to investors purchasing through authorized investment professionals and omnibus retirement plans as described in the Fund’s prospectus. Prior to November 1, 2017, Institutional 2 Class shares were known as Class R5 shares.
Institutional 3 Class shares are not subject to sales charges and are available to institutional and certain other investors as described in the Fund’s prospectus. Prior to November 1, 2017, Institutional 3 Class shares were known as Class Y shares.
Class T shares are subject to a maximum front-end sales charge of 2.50% per transaction and must be purchased through financial intermediaries that, by written agreement with Columbia Management Investment Distributors, Inc., are specifically authorized to sell Class T shares.
Class V shares are subject to a maximum front-end sales charge of 5.75% based on the investment amount. Class V shares purchased without an initial sales charge in accounts aggregating $1 million to $50 million at the time of purchase are subject to a CDSC if the shares are sold within 18 months after purchase, charged as follows: 1.00% CDSC if redeemed within 12 months after purchase, and 0.50% CDSC if redeemed more than 12, but less than 18, months after purchase. Class V shares are available only to investors who received (and who have continuously held) Class V shares in connection with previous fund reorganizations.
Note 2. Summary of significant accounting policies
Basis of preparation
The Fund is an investment company that applies the accounting and reporting guidance in the Financial Accounting Standards Board (FASB) Accounting Standards Codification Topic 946, Financial Services - Investment Companies (ASC 946). The financial statements are prepared in accordance with U.S. generally accepted accounting principles (GAAP), which
| 24 | Columbia Disciplined Small Core Fund | Annual Report 2018 |
Notes to Financial Statements (continued)
August 31, 2018
requires management to make certain estimates and assumptions that affect the reported amounts of assets and liabilities, the disclosure of contingent assets and liabilities at the date of the financial statements and the reported amounts of income and expenses during the reporting period. Actual results could differ from those estimates.
The following is a summary of significant accounting policies followed by the Fund in the preparation of its financial statements.
Security valuation
All equity securities are valued at the close of business of the New York Stock Exchange. Equity securities are valued at the last quoted sales price on the principal exchange or market on which they trade, except for securities traded on the NASDAQ Stock Market, which are valued at the NASDAQ official close price. Unlisted securities or listed securities for which there were no sales during the day are valued at the mean of the latest quoted bid and ask prices on such exchanges or markets.
Foreign equity securities are valued based on the closing price on the foreign exchange in which such securities are primarily traded. If any foreign equity security closing prices are not readily available, the securities are valued at the mean of the latest quoted bid and ask prices on such exchanges or markets. Foreign currency exchange rates are generally determined at 4:00 p.m. Eastern (U.S.) time. Many securities markets and exchanges outside the U.S. close prior to the close of the New York Stock Exchange; therefore, the closing prices for securities in such markets or on such exchanges may not fully reflect events that occur after such close but before the close of the New York Stock Exchange. In those situations, foreign securities will be fair valued pursuant to a policy adopted by the Board of Trustees, including, if available, utilizing a third party pricing service to determine these fair values. The third party pricing service takes into account multiple factors, including, but not limited to, movements in the U.S. securities markets, certain depositary receipts, futures contracts and foreign exchange rates that have occurred subsequent to the close of the foreign exchange or market, to determine a good faith estimate that reasonably reflects the current market conditions as of the close of the New York Stock Exchange. The fair value of a security is likely to be different from the quoted or published price, if available.
Investments in open-end investment companies, including money market funds, are valued at their latest net asset value.
Futures and options on futures contracts are valued based upon the settlement price at the close of regular trading on their principal exchanges or, in the absence of transactions, at the mean of the latest quoted bid and ask prices.
Investments for which market quotations are not readily available, or that have quotations which management believes are not reflective of market value or reliable, are valued at fair value as determined in good faith under procedures approved by and under the general supervision of the Board of Trustees. If a security or class of securities (such as foreign securities) is valued at fair value, such value is likely to be different from the quoted or published price for the security.
The determination of fair value often requires significant judgment. To determine fair value, management may use assumptions including but not limited to future cash flows and estimated risk premiums. Multiple inputs from various sources may be used to determine fair value.
GAAP requires disclosure regarding the inputs and valuation techniques used to measure fair value and any changes in valuation inputs or techniques. In addition, investments shall be disclosed by major category. This information is disclosed following the Fund’s Portfolio of Investments.
Derivative instruments
The Fund invests in certain derivative instruments, as detailed below, to meet its investment objectives. Derivatives are instruments whose values depend on, or are derived from, in whole or in part, the value of one or more securities, currencies, commodities, indices, or other assets or instruments. Derivatives may be used to increase investment flexibility (including to maintain cash reserves while maintaining desired exposure to certain assets), for risk management (hedging) purposes, to facilitate trading, to reduce transaction costs and to pursue higher investment returns. The Fund may also use derivative instruments to mitigate certain investment risks, such as foreign currency exchange rate risk, interest rate risk and credit risk. Derivatives may involve various risks, including the potential inability of the counterparty to fulfill its obligations under the terms of the contract, the potential for an illiquid secondary market (making it difficult for the Fund to sell or
Columbia Disciplined Small Core Fund | Annual Report 2018
| 25 |
Notes to Financial Statements (continued)
August 31, 2018
terminate, including at favorable prices) and the potential for market movements which may expose the Fund to gains or losses in excess of the amount shown in the Statement of Assets and Liabilities. The notional amounts of derivative instruments, if applicable, are not recorded in the financial statements.
A derivative instrument may suffer a marked-to-market loss if the value of the contract decreases due to an unfavorable change in the market rates or values of the underlying instrument. Losses can also occur if the counterparty does not perform its obligations under the contract. The Fund’s risk of loss from counterparty credit risk on over-the-counter derivatives is generally limited to the aggregate unrealized gain netted against any collateral held by the Fund and the amount of any variation margin held by the counterparty, plus any replacement costs or related amounts. With exchange-traded or centrally cleared derivatives, there is reduced counterparty credit risk to the Fund since the clearinghouse or central counterparty (CCP) provides some protection in the case of clearing member default. The clearinghouse or CCP stands between the buyer and the seller of the contract; therefore, additional counterparty credit risk is failure of the clearinghouse or CCP. However, credit risk still exists in exchange-traded or centrally cleared derivatives with respect to initial and variation margin that is held in a broker’s customer account. While brokers are required to segregate customer margin from their own assets, in the event that a broker becomes insolvent or goes into bankruptcy and at that time there is a shortfall in the aggregate amount of margin held by the broker for all its clients, U.S. bankruptcy laws will typically allocate that shortfall on a pro-rata basis across all the broker’s customers (including the Fund), potentially resulting in losses to the Fund.
In order to better define its contractual rights and to secure rights that will help the Fund mitigate its counterparty risk, the Fund may enter into an International Swaps and Derivatives Association, Inc. Master Agreement (ISDA Master Agreement) or similar agreement with its derivatives contract counterparties. An ISDA Master Agreement is an agreement between the Fund and a counterparty that governs over-the-counter derivatives and typically contains, among other things, collateral posting terms and netting provisions in the event of a default and/or termination event. Under an ISDA Master Agreement, the Fund may, under certain circumstances, offset with the counterparty certain derivative instrument’s payables and/or receivables with collateral held and/or posted and create one single net payment. The provisions of the ISDA Master Agreement typically permit a single net payment in the event of default (close-out netting), including the bankruptcy or insolvency of the counterparty. Note, however, that bankruptcy or insolvency laws of a particular jurisdiction may impose restrictions on or prohibitions against the right of offset or netting in bankruptcy, insolvency or other events.
Collateral (margin) requirements differ by type of derivative. Margin requirements are established by the clearinghouse or CCP for exchange-traded and centrally cleared derivatives. Brokers can ask for margin in excess of the minimum in certain circumstances. Collateral terms are contract specific for over-the-counter derivatives. For over-the-counter derivatives traded under an ISDA Master Agreement, the collateral requirements are typically calculated by netting the marked-to-market amount for each transaction under such agreement and comparing that amount to the value of any variation margin currently pledged by the Fund and/or the counterparty. Generally, the amount of collateral due from or to a party has to exceed a minimum transfer amount threshold (e.g., $250,000) before a transfer has to be made. To the extent amounts due to the Fund from its counterparties are not fully collateralized, contractually or otherwise, the Fund bears the risk of loss from counterparty nonperformance. The Fund may also pay interest expense on cash collateral received from the broker. Any interest expense paid by the Fund is shown on the Statement of Operations. The Fund attempts to mitigate counterparty risk by only entering into agreements with counterparties that it believes have the financial resources to honor their obligations and by monitoring the financial stability of those counterparties.
Certain ISDA Master Agreements allow counterparties of over-the-counter derivatives transactions to terminate derivatives contracts prior to maturity in the event the Fund’s net asset value declines by a stated percentage over a specified time period or if the Fund fails to meet certain terms of the ISDA Master Agreement, which would cause the Fund to accelerate payment of any net liability owed to the counterparty. The Fund also has termination rights if the counterparty fails to meet certain terms of the ISDA Master Agreement. In determining whether to exercise such termination rights, the Fund would consider, in addition to counterparty credit risk, whether termination would result in a net liability owed from the counterparty.
For financial reporting purposes, the Fund does not offset derivative assets and derivative liabilities that are subject to netting arrangements in the Statement of Assets and Liabilities.
| 26 | Columbia Disciplined Small Core Fund | Annual Report 2018 |
Notes to Financial Statements (continued)
August 31, 2018
Futures contracts
Futures contracts are exchange-traded and represent commitments for the future purchase or sale of an asset at a specified price on a specified date. The Fund bought and sold futures contracts to maintain appropriate equity market exposure while keeping sufficient cash to accommodate daily redemptions. These instruments may be used for other purposes in future periods. Upon entering into futures contracts, the Fund bears risks that it may not achieve the anticipated benefits of the futures contracts and may realize a loss. Additional risks include counterparty credit risk, the possibility of an illiquid market, and that a change in the value of the contract or option may not correlate with changes in the value of the underlying asset.
Upon entering into a futures contract, the Fund deposits cash or securities with the broker, known as a futures commission merchant (FCM), in an amount sufficient to meet the initial margin requirement. The initial margin deposit must be maintained at an established level over the life of the contract. Cash deposited as initial margin is recorded in the Statement of Assets and Liabilities as margin deposits. Securities deposited as initial margin are designated in the Portfolio of Investments. Subsequent payments (variation margin) are made or received by the Fund each day. The variation margin payments are equal to the daily change in the contract value and are recorded as variation margin receivable or payable and are offset in unrealized gains or losses. The Fund recognizes a realized gain or loss when the contract is closed or expires. Futures contracts involve, to varying degrees, risk of loss in excess of the variation margin disclosed in the Statement of Assets and Liabilities.
Effects of derivative transactions in the financial statements
The following tables are intended to provide additional information about the effect of derivatives on the financial statements of the Fund, including: the fair value of derivatives by risk category and the location of those fair values in the Statement of Assets and Liabilities; and the impact of derivative transactions over the period in the Statement of Operations, including realized and unrealized gains (losses). The derivative instrument schedules following the Portfolio of Investments present additional information regarding derivative instruments outstanding at the end of the period, if any.
The following table is a summary of the fair value of derivative instruments (not considered to be hedging instruments for accounting disclosure purposes) at August 31, 2018:
| | Asset derivatives | |
Risk exposure
category | Statement
of assets and liabilities
location | Fair value ($) |
| Equity risk | Net assets — unrealized appreciation on futures contracts | 121,424* |
| * | Includes cumulative appreciation (depreciation) as reported in the tables following the Portfolio of Investments. Only the current day’s variation margin is reported in receivables or payables in the Statement of Assets and Liabilities. |
The following table indicates the effect of derivative instruments (not considered to be hedging instruments for accounting disclosure purposes) in the Statement of Operations for the year ended August 31, 2018:
| Amount of realized gain (loss) on derivatives recognized in income |
| Risk exposure category | Futures
contracts
($) |
| Equity risk | 445,643 |
| |
| Change in unrealized appreciation (depreciation) on derivatives recognized in income |
| Risk exposure category | Futures
contracts
($) |
| Equity risk | 151,603 |
Columbia Disciplined Small Core Fund | Annual Report 2018
| 27 |
Notes to Financial Statements (continued)
August 31, 2018
The following table is a summary of the average outstanding volume by derivative instrument for the year ended August 31, 2018:
| Derivative instrument | Average notional
amounts ($)* |
| Futures contracts — long | 4,414,675 |
| * | Based on the ending quarterly outstanding amounts for the year ended August 31, 2018. |
Security transactions
Security transactions are accounted for on the trade date. Cost is determined and gains (losses) are based upon the specific identification method for both financial statement and federal income tax purposes.
Income recognition
Interest income is recorded on an accrual basis.
Corporate actions and dividend income are generally recorded net of any non-reclaimable tax withholdings, on the ex-dividend date or upon receipt of ex-dividend notification in the case of certain foreign securities.
The Fund may receive distributions from holdings in equity securities, business development companies (BDCs), exchange-traded funds (ETFs), limited partnerships (LPs), other regulated investment companies (RICs), and real estate investment trusts (REITs), which report information on the tax character of their distributions annually. These distributions are allocated to dividend income, capital gain and return of capital based on actual information reported. Return of capital is recorded as a reduction of the cost basis of securities held. If the Fund no longer owns the applicable securities, return of capital is recorded as a realized gain. With respect to REITs, to the extent actual information has not yet been reported, estimates for return of capital are made by the Fund’s management. Management’s estimates are subsequently adjusted when the actual character of the distributions is disclosed by the REITs, which could result in a proportionate change in return of capital to shareholders.
Awards from class action litigation are recorded as a reduction of cost basis if the Fund still owns the applicable securities on the payment date. If the Fund no longer owns the applicable securities, the proceeds are recorded as realized gains.
Expenses
General expenses of the Trust are allocated to the Fund and other funds of the Trust based upon relative net assets or other expense allocation methodologies determined by the nature of the expense. Expenses directly attributable to the Fund are charged to the Fund. Expenses directly attributable to a specific class of shares are charged to that share class.
Determination of class net asset value
All income, expenses (other than class-specific expenses, which are charged to that share class, as shown in the Statement of Operations) and realized and unrealized gains (losses) are allocated to each class of the Fund on a daily basis, based on the relative net assets of each class, for purposes of determining the net asset value of each class.
Federal income tax status
The Fund intends to qualify each year as a regulated investment company under Subchapter M of the Internal Revenue Code, as amended, and will distribute substantially all of its investment company taxable income and net capital gain, if any, for its tax year, and as such will not be subject to federal income taxes. In addition, the Fund intends to distribute in each calendar year substantially all of its ordinary income, capital gain net income and certain other amounts, if any, such that the Fund should not be subject to federal excise tax. Therefore, no federal income or excise tax provision is recorded.
Foreign taxes
The Fund may be subject to foreign taxes on income, gains on investments or currency repatriation, a portion of which may be recoverable. The Fund will accrue such taxes and recoveries, as applicable, based upon its current interpretation of tax rules and regulations that exist in the markets in which it invests.
| 28 | Columbia Disciplined Small Core Fund | Annual Report 2018 |
Notes to Financial Statements (continued)
August 31, 2018
Realized gains in certain countries may be subject to foreign taxes at the Fund level, based on statutory rates. The Fund accrues for such foreign taxes on realized and unrealized gains at the appropriate rate for each jurisdiction, as applicable. The amount, if any, is disclosed as a liability on the Statement of Assets and Liabilities.
Distributions to shareholders
Distributions from net investment income, if any, are declared and paid annually. Net realized capital gains, if any, are distributed at least annually. Income distributions and capital gain distributions are determined in accordance with federal income tax regulations, which may differ from GAAP.
Guarantees and indemnifications
Under the Trust’s organizational documents and, in some cases, by contract, its officers and trustees are indemnified against certain liabilities arising out of the performance of their duties to the Trust or its funds. In addition, certain of the Fund’s contracts with its service providers contain general indemnification clauses. The Fund’s maximum exposure under these arrangements is unknown since the amount of any future claims that may be made against the Fund cannot be determined, and the Fund has no historical basis for predicting the likelihood of any such claims.
Recent accounting pronouncement
Accounting Standards Update 2017-08 Premium Amortization on Purchased Callable Debt Securities
In March 2017, the Financial Accounting Standards Board issued Accounting Standards Update (ASU) No. 2017-08 Premium Amortization on Purchased Callable Debt Securities. ASU No. 2017-08 updates the accounting standards to shorten the amortization period for certain purchased callable debt securities, held at a premium, to be amortized to the earliest call date. The update applies to securities with explicit, noncontingent call features that are callable at fixed prices and on preset dates. The standard is effective for annual periods beginning after December 15, 2018 and interim periods within those fiscal years. At this time, management is evaluating the implication of this guidance and the impact it will have on the financial statement amounts and footnote disclosures, if any.
Note 3. Fees and other transactions with affiliates
Management services fees
The Fund has entered into a Management Agreement with Columbia Management Investment Advisers, LLC (the Investment Manager), a wholly-owned subsidiary of Ameriprise Financial, Inc. (Ameriprise Financial). Under the Management Agreement, the Investment Manager provides the Fund with investment research and advice, as well as administrative and accounting services. The management services fee is an annual fee that is equal to a percentage of the Fund’s daily net assets that declines from 0.85% to 0.73% as the Fund’s net assets increase. The effective management services fee rate for the year ended August 31, 2018 was 0.85% of the Fund’s average daily net assets.
Compensation of board members
Members of the Board of Trustees who are not officers or employees of the Investment Manager or Ameriprise Financial are compensated for their services to the Fund as disclosed in the Statement of Operations. These members of the Board of Trustees may participate in a Deferred Compensation Plan (the Plan) which may be terminated at any time. Obligations of the Plan will be paid solely out of the Fund’s assets, and all amounts payable under the Plan constitute a general unsecured obligation of the Fund.
Compensation of Chief Compliance Officer
The Board of Trustees has appointed a Chief Compliance Officer to the Fund in accordance with federal securities regulations. As disclosed in the Statement of Operations, a portion of the Chief Compliance Officer’s total compensation is allocated to the Fund, along with other allocations to affiliated funds governed by the Board of Trustees, based on relative net assets.
Columbia Disciplined Small Core Fund | Annual Report 2018
| 29 |
Notes to Financial Statements (continued)
August 31, 2018
Transfer agency fees
Under a Transfer and Dividend Disbursing Agent Agreement, Columbia Management Investment Services Corp. (the Transfer Agent), an affiliate of the Investment Manager and a wholly-owned subsidiary of Ameriprise Financial, is responsible for providing transfer agency services to the Fund. The Transfer Agent has contracted with DST Asset Manager Solutions, Inc. (DST) to serve as sub-transfer agent. The Transfer Agent pays the fees of DST for services as sub-transfer agent and DST is not entitled to reimbursement for such fees from the Fund (with the exception of out-of-pocket fees).
The Fund pays the Transfer Agent a monthly transfer agency fee based on the number or the average value of accounts, depending on the type of account. In addition, the Fund pays the Transfer Agent a fee for shareholder services based on the number of accounts or on a percentage of the average aggregate value of the Fund’s shares maintained in omnibus accounts up to the lesser of the amount charged by the financial intermediary or a cap established by the Board of Trustees from time to time.
The Transfer Agent also receives compensation from the Fund for various shareholder services and reimbursements for certain out-of-pocket fees. Total transfer agency fees for Institutional 2 Class and Institutional 3 Class shares are subject to an annual limitation of not more than 0.07% and 0.02%, respectively, of the average daily net assets attributable to each share class. Prior to January 1, 2018, Institutional 3 Class shares were subject to a contractual transfer agency fee limitation of not more than 0.00% and Institutional 2 Class shares were subject to a contractual transfer agency fee annual limitation of not more than 0.05% of the average annual daily net assets attributable to Institutional 2 Class.
For the year ended August 31, 2018, the Fund’s effective transfer agency fee rates as a percentage of average daily net assets of each class were as follows:
| | Effective rate (%) |
| Class A | 0.19 |
| Advisor Class | 0.19 |
| Class C | 0.19 |
| Institutional Class | 0.19 |
| Institutional 2 Class | 0.05 |
| Institutional 3 Class | 0.00 |
| Class T | 0.19 |
| Class V | 0.19 |
An annual minimum account balance fee of $20 may apply to certain accounts with a value below the applicable share class’s initial minimum investment requirements to reduce the impact of small accounts on transfer agency fees. These minimum account balance fees are remitted to the Fund and recorded as part of expense reductions in the Statement of Operations. For the year ended August 31, 2018, these minimum account balance fees reduced total expenses of the Fund by $1,465.
Distribution and service fees
The Fund has entered into an agreement with Columbia Management Investment Distributors, Inc. (the Distributor), an affiliate of the Investment Manager and a wholly-owned subsidiary of Ameriprise Financial, for distribution and shareholder services. The Board of Trustees has approved, and the Fund has adopted, distribution and shareholder service plans (the Plans) applicable to certain share classes, which set the distribution and service fees for the Fund. These fees are calculated daily and are intended to compensate the Distributor and/or eligible selling and/or servicing agents for selling shares of the Fund and providing services to investors.
Under the Plans, the Fund pays a monthly service fee to the Distributor at the maximum annual rate of 0.25% of the average daily net assets attributable to Class A, Class C and Class T shares of the Fund. Also under the Plans, the Fund pays a monthly distribution fee to the Distributor at the maximum annual rates of 0.10%, 0.75% and 0.25% of the average daily net assets attributable to Class A, Class C and Class T shares of the Fund, respectively.
| 30 | Columbia Disciplined Small Core Fund | Annual Report 2018 |
Notes to Financial Statements (continued)
August 31, 2018
Although the Fund may pay distribution and service fees up to a maximum annual rate of 0.35% of the Fund’s average daily net assets attributable to Class A shares (comprised of up to 0.10% for distribution services and up to 0.25% for shareholder liaison services), the Fund currently limits such fees to an aggregate fee of not more than 0.25% of the Fund’s average daily net assets attributable to Class A shares.
Although the Fund may pay a distribution fee up to 0.25% of the Fund’s average daily net assets attributable to Class T shares and a service fee of up to 0.25% of the Fund’s average daily net assets attributable to Class T shares, the aggregate fee shall not exceed 0.25% of the Fund’s average daily net assets attributable to Class T shares.
Shareholder services fees
The Fund has adopted a shareholder services plan that permits it to pay for certain services provided to Class V shareholders by their selling and/or servicing agents. The Fund may pay shareholder servicing fees up to an aggregate annual rate of 0.50% of the Fund’s average daily net assets attributable to Class V shares (comprised of up to 0.25% for shareholder liaison services and up to 0.25% for administrative support services). These fees are currently limited to an aggregate annual rate of not more than 0.25% of the Fund’s average daily net assets attributable to Class V shares.
Sales charges (unaudited)
Sales charges, including front-end charges and CDSCs, received by the Distributor for distributing Fund shares for the year ended August 31, 2018, if any, are listed below:
| | Amount ($) |
| Class A | 9,861 |
| Class C | 1,161 |
| Class V | 3,547 |
Expenses waived/reimbursed by the Investment Manager and its affiliates
The Investment Manager and certain of its affiliates have contractually agreed to waive fees and/or reimburse expenses (excluding certain fees and expenses described below) for the period(s) disclosed below, unless sooner terminated at the sole discretion of the Board of Trustees, so that the Fund’s net operating expenses, after giving effect to fees waived/expenses reimbursed and any balance credits and/or overdraft charges from the Fund’s custodian, do not exceed the following annual rate(s) as a percentage of the class’ average daily net assets:
| | January 1, 2018
through
December 31, 2018 | Prior to
January 1, 2018 |
| Class A | 1.38% | 1.38% |
| Advisor Class | 1.13 | 1.13 |
| Class C | 2.13 | 2.13 |
| Institutional Class | 1.13 | 1.13 |
| Institutional 2 Class | 1.00 | 1.03 |
| Institutional 3 Class | 0.94 | 0.98 |
| Class T | 1.38 | 1.38 |
| Class V | 1.38 | 1.38 |
Under the agreement governing these fee waivers and/or expense reimbursement arrangements, the following fees and expenses are excluded from the waiver/reimbursement commitment, and therefore will be paid by the Fund, if applicable: taxes (including foreign transaction taxes), expenses associated with investments in affiliated and non-affiliated pooled investment vehicles (including mutual funds and exchange-traded funds), transaction costs and brokerage commissions, costs related to any securities lending program, dividend expenses associated with securities sold short, inverse floater program fees and expenses, transaction charges and interest on borrowed money, interest, infrequent and/or unusual expenses and any other expenses the exclusion of which is specifically approved by the Board of Trustees. This agreement may be modified or amended only with approval from the Investment Manager, certain of its affiliates and the Fund. In addition to the contractual agreement, the Investment Manager and certain of its affiliates have voluntarily agreed to
Columbia Disciplined Small Core Fund | Annual Report 2018
| 31 |
Notes to Financial Statements (continued)
August 31, 2018
waive fees and/or reimburse Fund expenses (excluding certain fees and expenses described above) so that Fund level expenses (expenses directly attributable to the Fund and not to a specific share class) are waived proportionately across all share classes, but the Fund’s net operating expenses shall not exceed the contractual annual rates listed in the table above. This arrangement may be revised or discontinued at any time. Reflected in the contractual cap commitment, prior to January 1, 2018, is the Transfer Agent’s contractual agreement to limit total transfer agency fees to an annual rate of not more than 0.00% for Institutional 3 Class and 0.05% for Institutional 2 Class of the average daily net assets attributable to each share class, unless sooner terminated at the sole discretion of the Board of Trustees. Any fees waived and/or expenses reimbursed under the expense reimbursement arrangements described above are not recoverable by the Investment Manager or its affiliates in future periods.
Note 4. Federal tax information
The timing and character of income and capital gain distributions are determined in accordance with income tax regulations, which may differ from GAAP because of temporary or permanent book to tax differences.
At August 31, 2018, these differences were primarily due to differing treatment for deferral/reversal of wash sale losses, passive foreign investment company (PFIC) holdings, derivative investments, trustees’ deferred compensation, re-characterization of distributions for investments and distribution reclassifications. To the extent these differences were permanent, reclassifications were made among the components of the Fund’s net assets in the Statement of Assets and Liabilities. Temporary differences do not require reclassifications.
In the Statement of Assets and Liabilities the following reclassifications were made:
Excess of distributions
over net investment
income ($) | Accumulated
net realized
gain ($) | Paid in
capital ($) |
| 269,427 | (269,427) | — |
Net investment income (loss) and net realized gains (losses), as disclosed in the Statement of Operations, and net assets were not affected by this reclassification.
The tax character of distributions paid during the years indicated was as follows:
| Year Ended August 31, 2018 | Year Ended August 31, 2017 |
Ordinary
income ($) | Long-term
capital gains ($) | Total ($) | Ordinary
income ($) | Long-term
capital gains ($) | Total ($) |
| 10,740,732 | 27,902,536 | 38,643,268 | 7,196,619 | 87,030,681 | 94,227,300 |
Short-term capital gain distributions, if any, are considered ordinary income distributions for tax purposes.
At August 31, 2018, the components of distributable earnings on a tax basis were as follows:
Undistributed
ordinary income ($) | Undistributed
long-term
capital gains ($) | Capital loss
carryforwards ($) | Net unrealized
appreciation ($) |
| 1,703,400 | 24,117,409 | — | 22,227,489 |
At August 31, 2018, the cost of all investments for federal income tax purposes along with the aggregate gross unrealized appreciation and depreciation based on that cost was:
Federal
tax cost ($) | Gross unrealized
appreciation ($) | Gross unrealized
(depreciation) ($) | Net unrealized
appreciation ($) |
| 117,152,801 | 27,045,141 | (4,817,652) | 22,227,489 |
Tax cost of investments and unrealized appreciation/(depreciation) may also include timing differences that do not constitute adjustments to tax basis.
| 32 | Columbia Disciplined Small Core Fund | Annual Report 2018 |
Notes to Financial Statements (continued)
August 31, 2018
Management of the Fund has concluded that there are no significant uncertain tax positions in the Fund that would require recognition in the financial statements. However, management’s conclusion may be subject to review and adjustment at a later date based on factors including, but not limited to, new tax laws, regulations, and administrative interpretations (including relevant court decisions). Generally, the Fund’s federal tax returns for the prior three fiscal years remain subject to examination by the Internal Revenue Service.
Note 5. Portfolio information
The cost of purchases and proceeds from sales of securities, excluding short-term investments and derivatives, if any, aggregated to $155,526,827 and $253,468,647, respectively, for the year ended August 31, 2018. The amount of purchase and sale activity impacts the portfolio turnover rate reported in the Financial Highlights.
Note 6. Payments by affiliates
During the year ended August 31, 2018, the Investment Manager reimbursed the Fund $59,296 for a loss on a trading error.
Note 7. Affiliated money market fund
The Fund invests in Columbia Short-Term Cash Fund, an affiliated money market fund established for the exclusive use by the Fund and other affiliated funds (the Affiliated MMF). The income earned by the Fund from such investments is included as Dividends - affiliated issuers in the Statement of Operations. As an investing fund, the Fund indirectly bears its proportionate share of the expenses of the Affiliated MMF. The Affiliated MMF prices its shares with a floating net asset value. In addition, the Board of Trustees of the Affiliated MMF may impose a fee on redemptions (sometimes referred to as a liquidity fee) or temporarily suspend redemptions (sometimes referred to as imposing a redemption gate) in the event its liquidity falls below regulatory limits.
Note 8. Interfund lending
Pursuant to an exemptive order granted by the Securities and Exchange Commission, the Fund participates in a program (the Interfund Program) allowing each participating Columbia Fund (each, a Participating Fund) to lend money directly to and, except for closed-end funds and money market funds, borrow money directly from other Participating Funds for temporary purposes. The amounts eligible for borrowing and lending under the Interfund Program are subject to certain restrictions.
Interfund loans are subject to the risk that the borrowing fund could be unable to repay the loan when due, and a delay in repayment to the lending fund could result in lost opportunities and/or additional lending costs. The exemptive order is subject to conditions intended to mitigate conflicts of interest arising from the Investment Manager’s relationship with each Participating Fund.
The Fund did not borrow or lend money under the Interfund Program during the year ended August 31, 2018.
Note 9. Line of credit
The Fund has access to a revolving credit facility with a syndicate of banks led by Citibank, N.A., HSBC Bank USA, N.A. and JPMorgan Chase Bank, N.A. whereby the Fund may borrow for the temporary funding of shareholder redemptions or for other temporary or emergency purposes. The credit facility, which is a collective agreement between the Fund and certain other funds managed by the Investment Manager, severally and not jointly, permits collective borrowings up to $1 billion. Interest is charged to each participating fund based on its borrowings at a rate equal to the higher of (i) the overnight federal funds rate plus 1.00% or (ii) the one-month LIBOR rate plus 1.00%. Each borrowing under the credit facility matures no later than 60 days after the date of borrowing. The Fund also pays a commitment fee equal to its pro rata share of the amount of the credit facility at a rate of 0.15% per annum. The commitment fee is included in other expenses in the Statement of Operations. This agreement expires annually in December unless extended or renewed.
Columbia Disciplined Small Core Fund | Annual Report 2018
| 33 |
Notes to Financial Statements (continued)
August 31, 2018
For the year ended August 31, 2018, the Fund’s borrowing activity was as follows:
Average loan
balance ($) | Weighted average
interest rate (%) | Days
outstanding |
| 1,300,000 | 2.24 | 1 |
Interest expense incurred by the Fund is recorded as a line of credit interest expense in the Statement of Operations. The Fund had no outstanding borrowings at August 31, 2018.
Note 10. Significant risks
Shareholder concentration risk
At August 31, 2018, one unaffiliated shareholder of record owned 19.6% of the outstanding shares of the Fund in one or more accounts. The Fund has no knowledge about whether any portion of those shares was owned beneficially. Affiliated shareholders of record owned 10.6% of the outstanding shares of the Fund in one or more accounts. Subscription and redemption activity by concentrated accounts may have a significant effect on the operations of the Fund. In the case of a large redemption, the Fund may be forced to sell investments at inopportune times, including its liquid positions, which may result in Fund losses and the Fund holding a higher percentage of less liquid positions. Large redemptions could result in decreased economies of scale and increased operating expenses for non-redeeming Fund shareholders.
Note 11. Subsequent events
Management has evaluated the events and transactions that have occurred through the date the financial statements were issued and noted no items requiring adjustment of the financial statements or additional disclosure.
Note 12. Information regarding pending and settled legal proceedings
Ameriprise Financial and certain of its affiliates have historically been involved in a number of legal, arbitration and regulatory proceedings, including routine litigation, class actions, and governmental actions, concerning matters arising in connection with the conduct of their business activities. Ameriprise Financial believes that the Fund is not currently the subject of, and that neither Ameriprise Financial nor any of its affiliates are the subject of, any pending legal, arbitration or regulatory proceedings that are likely to have a material adverse effect on the Fund or the ability of Ameriprise Financial or its affiliates to perform under their contracts with the Fund. Ameriprise Financial is required to make quarterly (10-Q), annual (10-K) and, as necessary, 8-K filings with the Securities and Exchange Commission (SEC) on legal and regulatory matters that relate to Ameriprise Financial and its affiliates. Copies of these filings may be obtained by accessing the SEC website at www.sec.gov.
There can be no assurance that these matters, or the adverse publicity associated with them, will not result in increased Fund redemptions, reduced sale of Fund shares or other adverse consequences to the Fund. Further, although we believe proceedings are not likely to have a material adverse effect on the Fund or the ability of Ameriprise Financial or its affiliates to perform under their contracts with the Fund, these proceedings are subject to uncertainties and, as such, we are unable to estimate the possible loss or range of loss that may result. An adverse outcome in one or more of these proceedings could result in adverse judgments, settlements, fines, penalties or other relief that could have a material adverse effect on the consolidated financial condition or results of operations of Ameriprise Financial.
| 34 | Columbia Disciplined Small Core Fund | Annual Report 2018 |
Report of Independent Registered Public Accounting Firm
To the Board of Trustees of Columbia Funds Series Trust I and Shareholders of Columbia Disciplined Small Core Fund
Opinion on the Financial Statements
We have audited the accompanying statement of assets and liabilities, including the portfolio of investments, of Columbia Disciplined Small Core Fund (one of the funds constituting Columbia Funds Series Trust I, hereafter referred to as the “Fund”) as of August 31, 2018, the related statement of operations for the year ended August 31, 2018, the statement of changes in net assets for each of the two years in the period ended August 31, 2018, including the related notes, and the financial highlights for each of the five years in the period ended August 31, 2018, (collectively referred to as the “financial statements”). In our opinion, the financial statements present fairly, in all material respects, the financial position of the Fund as of August 31, 2018, the results of its operations for the year then ended, the changes in its net assets for each of the two years in the period ended August 31, 2018 and the financial highlights for each of the five years in the period ended August 31, 2018 in conformity with accounting principles generally accepted in the United States of America.
Basis for Opinion
These financial statements are the responsibility of the Fund’s management. Our responsibility is to express an opinion on the Fund’s financial statements based on our audits. We are a public accounting firm registered with the Public Company Accounting Oversight Board (United States) (“PCAOB”) and are required to be independent with respect to the Fund in accordance with the U.S. federal securities laws and the applicable rules and regulations of the Securities and Exchange Commission and the PCAOB.
We conducted our audits of these financial statements in accordance with the standards of the PCAOB. Those standards require that we plan and perform the audit to obtain reasonable assurance about whether the financial statements are free of material misstatement, whether due to error or fraud.
Our audits included performing procedures to assess the risks of material misstatement of the financial statements, whether due to error or fraud, and performing procedures that respond to those risks. Such procedures included examining, on a test basis, evidence regarding the amounts and disclosures in the financial statements. Our audits also included evaluating the accounting principles used and significant estimates made by management, as well as evaluating the overall presentation of the financial statements. Our procedures included confirmation of securities owned as of August 31, 2018, by correspondence with the custodian, transfer agent, and brokers. We believe that our audits provide a reasonable basis for our opinion.
/s/PricewaterhouseCoopers LLP
Minneapolis, Minnesota
October 22, 2018
We have served as the auditor of one or more investment companies within the Columbia Funds Complex since 1977.
Columbia Disciplined Small Core Fund | Annual Report 2018
| 35 |
Federal Income Tax Information
(Unaudited)
The Fund hereby designates the following tax attributes for the fiscal year ended August 31, 2018. Shareholders will be notified in early 2019 of the amounts for use in preparing 2018 income tax returns.
Qualified
dividend
income | Dividends
received
deduction | Capital
gain
dividend |
| 23.15% | 22.91% | $28,696,702 |
Qualified dividend income. For taxable, non-corporate shareholders, the percentage of ordinary income distributed during the fiscal year that represents qualified dividend income subject to reduced tax rates.
Dividends received deduction. The percentage of ordinary income distributed during the fiscal year that qualifies for the corporate dividends received deduction.
Capital gain dividend. The Fund designates as a capital gain dividend the amount reflected above, or if subsequently determined to be different, the net capital gain of such fiscal period.
| 36 | Columbia Disciplined Small Core Fund | Annual Report 2018 |
Shareholders elect the Board that oversees the Fund’s operations. The Board appoints officers who are responsible for day-to-day business decisions based on policies set by the Board. The following table provides basic biographical information about the Fund’s Trustees, including their principal occupations during the past five years, although specific titles for individuals may have varied over the period. The year set forth beneath Length of Service in the table below is the year in which the Trustee was first appointed or elected as Trustee to any Fund currently in the Columbia Funds Complex or a predecessor thereof. Under current Board policy, members serve terms of indefinite duration.
Independent trustees
| Name, address, year of birth | Position held with the Trust and length of service | Principal occupation(s) during the past five years and other relevant professional experience | Number of Funds in the Columbia Fund Complex overseen | Other directorships held by Trustee during the past five years |
Janet Langford Carrig
c/o Columbia Management
Investment Advisers, LLC
225 Franklin Street
Mail Drop BX32 05228
Boston, MA 02110
1957 | Trustee
1996 | Senior Vice President, General Counsel and Corporate Secretary, ConocoPhillips (independent energy company) since September 2007 | 69 | None |
Douglas A. Hacker
c/o Columbia Management
Investment Advisers, LLC
225 Franklin Street
Mail Drop BX32 05228
Boston, MA 02110
1955 | Trustee and Chairman of the Board
1996 | Independent business executive since May 2006; Executive Vice President — Strategy of United Airlines from December 2002 to May 2006; President of UAL Loyalty Services (airline marketing company) from September 2001 to December 2002; Executive Vice President and Chief Financial Officer of United Airlines from July 1999 to September 2001 | 69 | Spartan Nash Company, (food distributor); Nash Finch Company (food distributor) from 2005 to 2013; Aircastle Limited (aircraft leasing); SeaCube Container Leasing Ltd. (container leasing) from 2010 to 2013; and Travelport Worldwide Limited (travel information technology) |
Nancy T. Lukitsh
c/o Columbia Management
Investment Advisers, LLC
225 Franklin Street
Mail Drop BX32 05228
Boston, MA 02110
1956 | Trustee
2011 | Senior Vice President, Partner and Director of Marketing, Wellington Management Company, LLP (investment adviser) from 1997 to 2010; Chair, Wellington Management Portfolios (commingled non-U.S. investment pools) from 2007 to 2010; Director, Wellington Trust Company, NA and other Wellington affiliates from 1997 to 2010 | 69 | None |
David M. Moffett
c/o Columbia Management
Investment Advisers, LLC
225 Franklin Street
Mail Drop BX32 05228
Boston, MA 02110
1952 | Trustee
2011 | Retired. Consultant to Bridgewater and Associates | 69 | Director, CSX Corporation (transportation suppliers); Genworth Financial, Inc. (financial and insurance products and services); PayPal Holdings Inc. (payment and data processing services); Trustee, University of Oklahoma Foundation; former Director, eBay Inc. (online trading community), 2007-2015; and former Director, CIT Bank, CIT Group Inc. (commercial and consumer finance), 2010-2016 |
Columbia Disciplined Small Core Fund | Annual Report 2018
| 37 |
TRUSTEES AND OFFICERS (continued)
Independent trustees (continued)
| Name, address, year of birth | Position held with the Trust and length of service | Principal occupation(s) during the past five years and other relevant professional experience | Number of Funds in the Columbia Fund Complex overseen | Other directorships held by Trustee during the past five years |
John J. Neuhauser
c/o Columbia Management
Investment Advisers, LLC
225 Franklin Street
Mail Drop BX32 05228
Boston, MA 02110
1943 | Trustee
1984 | President, Saint Michael’s College since August 2007; Director or Trustee of several non-profit organizations, including University of Vermont Medical Center; Academic Vice President and Dean of Faculties, Boston College from August 1999 to October 2005; University Professor, Boston College from November 2005 to August 2007 | 69 | Liberty All-Star Equity Fund and Liberty All- Star Growth Fund (closed-end funds) |
Patrick J. Simpson
c/o Columbia Management
Investment Advisers, LLC
225 Franklin Street
Mail Drop BX32 05228
Boston, MA 02110
1944 | Trustee
2000 | Of Counsel, Perkins Coie LLP (law firm) since 2015; Partner, Perkins Coie LLP from 1988 to 2014 | 69 | None |
Anne-Lee Verville
c/o Columbia Management
Investment Advisers, LLC
225 Franklin Street
Mail Drop BX32 05228
Boston, MA 02110
1945 | Trustee
1998 | Retired. General Manager, Global Education Industry from 1994 to 1997, President – Application Systems Division from 1991 to 1994, Chief Financial Officer – US Marketing & Services from 1988 to 1991, and Chief Information Officer from 1987 to 1988, IBM Corporation (computer and technology) | 69 | Enesco Group, Inc. (producer of giftware and home and garden decor products) from 2001 to 2006 |
Consultants to the Independent Trustees*
| Name, address, year of birth | Position held with the Trust and length of service | Principal occupation(s) during the past five years and other relevant professional experience | Number of Funds in the Columbia Funds complex overseen | Other directorships held by Trustee during the past five years |
J. Kevin Connaughton
c/o Columbia
Management Investment
Advisers, LLC,
225 Franklin Street
Mail Drop BX32 05228,
Boston, MA 02110
1964 | Independent Trustee Consultant
2016 | Independent Trustee Consultant, Columbia Funds since March 2016; Adjunct Professor of Finance, Bentley University since November 2017; Managing Director and General Manager of Mutual Fund Products, Columbia Management Investment Advisers, LLC from May 2010 to February 2015; President, Columbia Funds from 2009 to 2015; and senior officer of Columbia Funds and affiliated funds from 2003 to 2015 | 69 | Director, The Autism Project since March 2015; former Trustee, New Century Portfolios, March 2015-December 2017; formerly on Board of Governors, Gateway Healthcare, January 2016 – December 2017 |
Natalie A. Trunow
c/o Columbia
Management Investment
Advisers, LLC,
225 Franklin Street
Mail Drop BX32 05228,
Boston, MA 02110
1967 | Independent Trustee Consultant
2016 | Independent Trustee Consultant, Columbia Funds since September 2016; Chief Executive Officer, Millennial Portfolio Solutions LLC (asset management and consulting services) since January 2016; Director of Investments, Casey Family Programs from April 2016 to September 2016; Senior Vice President and Chief Investment Officer, Calvert Investments from August 2008 to January 2016; Section Head and Portfolio Manager, General Motors Asset Management from June 1997 to August 2008 | 69 | Director, Health Services for Children with Special Needs, Inc.; Director, Guidewell Financial Solutions |
| * | J. Kevin Connaughton was appointed consultant to the Independent Trustees effective March 1, 2016. Natalie A. Trunow was appointed consultant to the Independent Trustees effective September 1, 2016. Shareholders of the Funds are expected to be asked to elect each of Mr. Connaughton and Ms. Trunow as a Trustee at a future shareholder meeting. |
| 38 | Columbia Disciplined Small Core Fund | Annual Report 2018 |
TRUSTEES AND OFFICERS (continued)
Interested trustee affiliated with Investment Manager*
| Name, address, year of birth | Position held with the Trust and length of service | Principal occupation(s) during the past five years and other relevant professional experience | Number of Funds in the Columbia Funds Complex overseen | Other directorships held by Trustee during the past five years |
William F. Truscott
c/o Columbia Management
Investment Advisers, LLC
225 Franklin Street
Boston, MA 02110
1960 | Trustee
2012 | Chairman of the Board and President, Columbia Management Investment Advisers, LLC since May 2010 and February 2012, respectively; Chief Executive Officer, Global Asset Management, Ameriprise Financial, Inc. since September 2012 (previously Chief Executive Officer, U.S. Asset Management & President, Annuities, May 2010-September 2012); Director and Chief Executive Officer, Columbia Management Investment Distributors, Inc. since May 2010 and February 2012, respectively; Chairman of the Board and Chief Executive Officer, RiverSource Distributors, Inc. since 2006; Director, Threadneedle Asset Management Holdings, SARL since 2014; President and Chief Executive Officer, Ameriprise Certificate Company, 2006-August 2012 | 193 | Chairman of the Board, Columbia Management Investment Advisers, LLC since May 2010; Director, Columbia Management Investment Distributors, Inc. since May 2010; former Director, Ameriprise Certificate Company, 2006 - January 2013 |
| * | Interested person (as defined under the 1940 Act) by reason of being an officer, director, security holder and/or employee of the Investment Manager or Ameriprise Financial. |
The Statement of Additional Information has additional information about the Fund’s Board members and is available, without charge, upon request by calling 800.345.6611, visiting columbiathreadneedleus.com/investor/ or contacting your financial intermediary.
Columbia Disciplined Small Core Fund | Annual Report 2018
| 39 |
TRUSTEES AND OFFICERS (continued)
The Board has appointed officers who are responsible for day-to-day business decisions based on policies it has established. The officers serve at the pleasure of the Board. The following table provides basic information about the Officers of the Fund, including principal occupations during the past five years, although their specific titles may have varied over the period. In addition to Mr. Truscott, who is Senior Vice President, the Fund’s other officers are:
Fund officers
Name,
address and
year of birth | Position and year
first appointed to
position for any Fund
in the Columbia
Funds complex or a
predecessor thereof | Principal occupation(s) during past five years |
Christopher O. Petersen
5228 Ameriprise
Financial Center
Minneapolis, MN 55474
Born 1970 | President and Principal Executive Officer (2015) | Vice President and Lead Chief Counsel, Ameriprise Financial, Inc. since January 2015 (previously, Vice President and Chief Counsel, January 2010 - December 2014; officer of Columbia Funds and affiliated funds since 2007. |
Michael G. Clarke
225 Franklin Street
Boston, MA 02110
Born 1969 | Treasurer (2011), Chief Financial Officer (2009) and Chief Accounting Officer (2015) | Vice President — Mutual Fund Administration, Columbia Management Investment Advisers, LLC, since May 2010; senior officer of Columbia Funds and affiliated funds since 2002. |
Paul B. Goucher
100 Park Avenue
New York, NY 10017
Born 1968 | Senior Vice President (2011) and Assistant Secretary (2008) | Senior Vice President and Assistant General Counsel, Ameriprise Financial, Inc. since January 2017 (previously, Vice President and Lead Chief Counsel, November 2008 - January 2017 and January 2013 - January 2017, respectively); Vice President, Chief Legal Officer and Assistant Secretary, Columbia Management Investment Advisers, LLC since May 2010. |
Thomas P. McGuire
225 Franklin Street
Boston, MA 02110
Born 1972 | Senior Vice President and Chief Compliance Officer (2012) | Vice President — Asset Management Compliance, Ameriprise Financial, Inc., since May 2010; Chief Compliance Officer, Ameriprise Certificate Company since September 2010. |
Colin Moore
225 Franklin Street
Boston, MA 02110
Born 1958 | Senior Vice President (2010) | Executive Vice President and Global Chief Investment Officer, Ameriprise Financial, Inc., since July 2013; Executive Vice President and Global Chief Investment Officer, Columbia Management Investment Advisers, LLC since July 2013. |
Ryan C. Larrenaga
225 Franklin Street
Boston, MA 02110
Born 1970 | Senior Vice President (2017), Chief Legal Officer (2017) and Secretary (2015) | Vice President and Chief Counsel, Ameriprise Financial, Inc. since August 2018 (previously, Vice President and Group Counsel, August 2011 - August 2018); officer of Columbia Funds and affiliated funds since 2005. |
Michael E. DeFao
225 Franklin Street
Boston, MA 02110
Born 1968 | Vice President (2011) and Assistant Secretary (2010) | Vice President and Chief Counsel, Ameriprise Financial, Inc. since May 2010. |
Amy Johnson
5228 Ameriprise
Financial Center
Minneapolis, MN 55474
Born 1965 | Vice President (2006) | Managing Director and Global Head of Operations, Columbia Management Investment Advisers, LLC since April 2016 (previously Managing Director and Chief Operating Officer, 2010 - 2016). |
Lyn Kephart-Strong
5228 Ameriprise
Financial Center
Minneapolis, MN 55474
Born 1960 | Vice President (2015) | President, Columbia Management Investment Services Corp. since October 2014; Vice President & Resolution Officer, Ameriprise Trust Company since August 2009. |
| 40 | Columbia Disciplined Small Core Fund | Annual Report 2018 |
Board Consideration and Approval of Management
Agreement
On June 12, 2018, the Board of Trustees (the Board) and the Trustees who are not interested persons (as defined in the Investment Company Act of 1940) (the Independent Trustees) of Columbia Funds Series Trust I (the Trust) unanimously approved the continuation of the Management Agreement (the Management Agreement) with Columbia Management Investment Advisers, LLC (the Investment Manager) with respect to Columbia Disciplined Small Core Fund (the Fund), a series of the Trust. As detailed below, the Board’s Advisory Fees and Expenses Committee (the Committee) and the Board met on multiple occasions to review and discuss, among themselves, with the management team of the Investment Manager and with an independent fee consultant, materials provided by the Investment Manager, the independent fee consultant and others before determining to approve the continuation of the Management Agreement.
In connection with their deliberations regarding the continuation of the Management Agreement, the Committee and the Board evaluated materials requested from the Investment Manager regarding the Fund and the Management Agreement, and discussed these materials with representatives of the Investment Manager at Committee meetings held on March 6, 2018, April 26, 2018 and June 11, 2018 and at Board meetings held on March 7, 2018 and June 12, 2018. In addition, the Board and its various committees consider matters bearing on the Management Agreement at other meetings throughout the year and in prior years and meet regularly with senior management of the Trust and the Investment Manager. Through the Board’s Investment Oversight Committees, Trustees also meet with selected portfolio managers of the funds the Trustees oversee and with other investment personnel at various times throughout the year. The Committee and the Board also consulted with the independent fee consultant, Fund counsel and the Independent Trustees’ independent legal counsel, who advised on various matters with respect to the Committee’s and the Board’s considerations and otherwise assisted the Committee and the Board in their deliberations. On June 11, 2018, the Committee recommended that the Board approve the continuation of the Management Agreement. On June 12, 2018, the Board, including the Independent Trustees, voting separately, unanimously approved the continuation of the Management Agreement for the Fund.
The Committee and the Board considered all information that they, their legal counsel or the Investment Manager believed reasonably necessary to evaluate and to determine whether to recommend for approval or approve the continuation of the Management Agreement. The information and factors considered by the Committee and the Board in recommending for approval or approving the continuation of the Management Agreement for the Fund included the following:
| • | Information on the investment performance of the Fund relative to the performance of a group of mutual funds determined to be comparable to the Fund by an independent third-party data provider, as well as performance relative to benchmarks; |
| • | Information on the Fund’s management fees and total expenses, including information comparing the Fund’s expenses to those of a group of comparable mutual funds, as determined by the independent third-party data provider; |
| • | The Investment Manager’s agreement to contractually limit or cap total operating expenses for the Fund through December 31, 2019 so that total operating expenses (excluding certain fees and expenses, such as transaction costs and certain other investment related expenses, interest, taxes, acquired fund fees and expenses, and infrequent and/or unusual expenses) would not exceed a specified annual rate, as a percentage of the Fund’s net assets; |
| • | The terms and conditions of the Management Agreement; |
| • | The current and proposed terms and conditions of other agreements and arrangements with affiliates of the Investment Manager relating to the operations of the Fund, including agreements with respect to the provision of distribution, transfer agency and shareholder services to the Fund; |
| • | Descriptions of various functions performed by the Investment Manager under the Management Agreement, including portfolio management and portfolio trading practices; |
| • | Information regarding the management fees of similarly-managed portfolios of other clients of the Investment Manager, including institutional accounts and collective trusts; |
| • | Information regarding the reputation, regulatory history and resources of the Investment Manager, including information regarding senior management, portfolio managers and other personnel; |
Columbia Disciplined Small Core Fund | Annual Report 2018
| 41 |
Board Consideration and Approval of Management
Agreement (continued)
| • | Information regarding the capabilities of the Investment Manager with respect to compliance monitoring services, including an assessment of the Investment Manager’s compliance system by the Fund’s Chief Compliance Officer; and |
| • | The profitability to the Investment Manager and its affiliates from their relationships with the Fund. |
Nature, extent and quality of services provided under the Management Agreement
The Committee and the Board considered the nature, extent and quality of services provided to the Fund by the Investment Manager and its affiliates under the Management Agreement and under separate agreements for the provision of transfer agency and shareholder services, and the resources dedicated to the Fund and the other Columbia Funds by the Investment Manager and its affiliates. The Committee and the Board considered, among other things, the Investment Manager’s ability to attract, motivate and retain highly qualified research, advisory and supervisory investment professionals (including compensation programs for personnel involved in fund management, reputation and other attributes), the portfolio management services provided by those investment professionals, and the quality of the Investment Manager’s investment research capabilities and trade execution services. The Committee and the Board also considered the potential benefits to shareholders of investing in a mutual fund that is part of a fund complex offering exposure to a variety of asset classes and investment disciplines and providing a variety of fund and shareholder services.
The Committee and the Board also considered the professional experience and qualifications of the senior personnel of the Investment Manager, which included consideration of the Investment Manager’s experience with similarly-structured funds. The Committee and the Board noted the compliance programs of and the compliance-related resources provided to the Fund by the Investment Manager and its affiliates and the resources dedicated by the Investment Manager and its affiliates to risk management, and considered the Investment Manager’s ability to provide administrative services to the Fund and coordinate the activities of the Fund’s other service providers. After reviewing these and related factors, the Committee and the Board concluded, within the context of their overall conclusions, that the nature, extent and quality of the services provided to the Fund under the Management Agreement supported the continuation of the Management Agreement.
Investment performance
The Committee and the Board reviewed information about the performance of the Fund over various time periods, including performance information relative to benchmarks, information that compared the performance of the Fund to the performance of a group of comparable mutual funds as determined by the independent third-party data provider, and information and analysis provided by the independent fee consultant. The Committee and the Board also reviewed a description of the third party’s methodology for identifying the Fund’s peer groups for purposes of performance and expense comparisons. Although the Fund’s performance lagged that of a relevant peer group for certain (although not necessarily all) periods, the Committee and the Board concluded that other factors relevant to performance were sufficient, in light of other considerations, to support continuation of the Management Agreement. Those factors included one or more of the following: (i) that the Fund’s performance, although lagging in certain recent periods, was stronger over the longer term; (ii) that the underperformance was attributable, to a significant extent, to investment decisions that were reasonable and consistent with the Fund’s investment strategy and policies and that the Fund was performing within a reasonable range of expectations, given those investment decisions, market conditions and the Fund’s investment strategy; (iii) that the Fund’s performance was competitive when compared to other relevant performance benchmarks or peer groups; and (iv) that the Investment Manager had taken or was taking steps designed to help improve the Fund’s investment performance, including, but not limited to, replacing portfolio managers, enhancing the resources supporting the portfolio managers, or modifying investment strategies.
The Committee and the Board noted that, through December 31, 2017, the Fund’s performance was in the ninety-second, ninety-second and ninety-third percentile (where the best performance would be in the first percentile) of its category selected by the independent third-party data provider for the purposes of performance comparisons for the one-, three- and five-year periods, respectively.
The Committee and the Board also considered the Investment Manager’s performance and reputation generally, the Investment Manager’s historical responsiveness to Board concerns about performance, and the Investment Manager’s willingness to take steps intended to improve performance. After reviewing these and related factors, the Committee and the Board concluded, within the context of their overall conclusions, that the performance of the Fund and the Investment Manager was sufficient, in light of other considerations, to support the continuation of the Management Agreement.
| 42 | Columbia Disciplined Small Core Fund | Annual Report 2018 |
Board Consideration and Approval of Management
Agreement (continued)
Investment management fee rates and other expenses
The Committee and the Board considered the management fees charged to the Fund under the Management Agreement as well as the total expenses incurred by the Fund. In assessing the reasonableness of the fees under the Management Agreement, the Committee and the Board considered, among other information, the Fund’s total expense ratio as a percentage of average daily net assets. The Committee and the Board considered data provided by the independent third-party data provider and the independent fee consultant. The Committee and the Board noted that, as of December 31, 2017, the Fund’s actual management fee and net total expense ratio were ranked in the third and fourth quintiles, respectively, (where the lowest fees and expenses would be in the first quintile) against the Fund’s expense universe as determined by the independent third-party data provider for purposes of expense comparison. The Committee and the Board also took into account the fee waiver and expense limitation arrangements agreed to by the Investment Manager, as noted above.
The Committee and the Board also received and considered information about the management fees charged by the Investment Manager to institutional accounts. In considering the fees charged to those accounts, the Committee and the Board took into account, among other things, the Investment Manager’s representations about the differences between managing mutual funds as compared to other types of accounts, including differences in the services provided, differences in the risk profile of such business for the Investment Manager and the additional resources required to manage mutual funds effectively. The Committee and the Board also received and considered information about the fees charged by the Investment Manager for sub-advisory services it provides to comparable unaffiliated funds. In evaluating the Fund’s management fees, the Committee and the Board also took into account the demands, complexity and quality of the investment management of the Fund.
After reviewing these and related factors, the Committee and the Board concluded, within the context of their overall conclusions, that the management fee rates and expenses of the Fund, in light of other considerations, supported the continuation of the Management Agreement.
Costs of services provided and profitability
The Committee and the Board also took note of the costs the Investment Manager and its affiliates incur in connection with the services provided and the profitability to the Investment Manager and its affiliates from their relationships with the Fund.
The Committee and the Board also considered the compensation directly or indirectly received by the Investment Manager’s affiliates in connection with their relationships with the Fund. The Committee and the Board reviewed information provided by management as to the profitability to the Investment Manager and its affiliates of their relationships with the Fund, information about the allocation of expenses used to calculate profitability, and comparisons of profitability levels realized in 2017 to profitability levels realized in 2016. When reviewing profitability, the Committee and the Board also considered court cases in which adviser profitability was an issue in whole or in part, the performance of similarly managed funds, the performance of the Fund, and the expense ratio of the Fund. In addition, the Committee and the Board considered information provided by the Investment Manager regarding the Investment Manager’s financial condition and comparing its profitability to that of other asset management firms that are, or are subsidiaries of, publicly traded companies. In this regard, the Committee and the Board also considered data provided by the independent fee consultant.
After reviewing these and related factors, the Committee and the Board concluded, within the context of their overall conclusions, that the costs of services provided and the profitability to the Investment Manager and its affiliates from their relationships with the Fund supported the continuation of the Management Agreement.
Economies of scale
The Committee and the Board considered the potential existence of economies of scale in the provision by the Investment Manager of services to the Fund, to groups of related funds, and to the Investment Manager’s investment advisory clients as a whole, and whether those economies of scale were shared with the Fund through breakpoints in investment management fees or other means, such as expense limitation arrangements and additional investments by the Investment Manager in investment, trading, compliance and other resources. The Committee and the Board noted that the management fee schedules for the Fund contained breakpoints that would reduce the fee rate on assets above specified threshold levels.
Columbia Disciplined Small Core Fund | Annual Report 2018
| 43 |
Board Consideration and Approval of Management
Agreement (continued)
In considering these matters, the Committee and the Board also considered the costs of the services provided and the profitability to the Investment Manager and its affiliates from their relationships with the Fund, as noted above. After reviewing these and related factors, the Committee and the Board concluded, within the context of their overall conclusions, that the extent to which any economies of scale were expected to be shared with the Fund supported the continuation of the Management Agreement.
Other benefits to the Investment Manager
The Committee and the Board received and considered information regarding “fall-out” or ancillary benefits received by the Investment Manager and its affiliates as a result of their relationships with the Fund, such as the engagement of the Investment Manager’s affiliates to provide distribution, transfer agency and shareholder services to the Fund. In this regard, among other matters, the Committee and the Board considered that the Fund’s distributor retains a portion of the distribution fees from the Fund and receives a portion of the sales charges on sales or redemptions of certain classes of shares of the Fund. The Committee and the Board also considered the benefits of research made available to the Investment Manager by reason of brokerage commissions generated by the Fund’s securities transactions, and reviewed information about the Investment Manager’s practices with respect to considering brokerage and research services when allocating portfolio transactions. In this connection, the Board also noted that the amount of research made available to the Investment Manager by reason of brokerage commissions had been declining over time, and may decline further. The Committee and the Board recognized that the Investment Manager’s profitability would be somewhat lower without these benefits.
Conclusion
The Committee and the Board reviewed all of the above considerations in reaching their decisions to recommend or approve the continuation of the Management Agreement. In their deliberations, the Trustees did not identify any particular information that was all-important or controlling, and individual Trustees may have attributed different weights to the various factors. Based on their evaluation of all factors that they deemed to be material, including those factors described above, and assisted by the advice of independent legal counsel, the Board, including the Independent Trustees, voting separately, unanimously approved the continuation of the Management Agreement.
| 44 | Columbia Disciplined Small Core Fund | Annual Report 2018 |
The Fund mails one shareholder report to each shareholder address. If you would like more than one report, please call shareholder services at 800.345.6611 and additional reports will be sent to you.
Proxy voting policies and procedures
The policy of the Board of Trustees is to vote the proxies of the companies in which the Fund holds investments consistent with the procedures as stated in the Statement of Additional Information (SAI). You may obtain a copy of the SAI without charge by calling 800.345.6611; contacting your financial intermediary; visiting columbiathreadneedleus.com/investor/; or searching the website of the Securities and Exchange Commission (SEC) at sec.gov. Information regarding how the Fund voted proxies relating to portfolio securities is filed with the SEC by August 31st for the most recent 12-month period ending June 30th of that year, and is available without charge by visiting columbiathreadneedleus.com/investor/, or searching the website of the SEC at sec.gov.
Quarterly schedule of investments
The Fund files a complete schedule of portfolio holdings with the SEC for the first and third quarters of each fiscal year on Form N-Q or Form N-PORT. The Fund’s Form N-Q or Form N-PORT is available on the SEC’s website at sec.gov and may be reviewed and copied at the SEC’s Public Reference Room in Washington, D.C. Information on the operation of the Public Reference Room may be obtained by calling 800.SEC.0330. The Fund’s complete schedule of portfolio holdings, as filed on Form N-Q or Form N-PORT, can also be obtained without charge, upon request, by calling 800.345.6611.
Additional Fund information
For more information about the Fund, please visit columbiathreadneedleus.com/investor/ or call 800.345.6611. Customer Service Representatives are available to answer your questions Monday through Friday from 8 a.m. to 7 p.m. Eastern time.
Fund investment manager
Columbia Management Investment Advisers, LLC
225 Franklin Street
Boston, MA 02110
Fund distributor
Columbia Management Investment Distributors, Inc.
225 Franklin Street
Boston, MA 02110
Fund transfer agent
Columbia Management Investment Services Corp.
Through October 31, 2018:
P.O. Box 8081
Boston, MA 02266-8081
Effective November 1, 2018:
P.O. Box 219104
Kansas City, MO 64121-9104
Columbia Disciplined Small Core Fund | Annual Report 2018
| 45 |
Columbia Disciplined Small Core Fund
Through October 31, 2018:
P.O. Box 8081
Boston, MA 02266-8081
Effective November 1, 2018:
P.O. Box 219104
Kansas City, MO 64121-9104
Please read and consider the investment objectives, risks, charges and expenses for any fund carefully before investing. For a prospectus and summary prospectus, which contains this and other important information about the Fund, go to
columbiathreadneedleus.com/investor/. The Fund is distributed by Columbia Management Investment Distributors, Inc., member FINRA, and managed by Columbia Management Investment Advisers, LLC.
Columbia Threadneedle Investments (Columbia Threadneedle) is the global brand name of the Columbia and Threadneedle group of companies. All rights reserved.
© 2018 Columbia Management Investment Advisers, LLC.
columbiathreadneedleus .com/investor/

Annual Report
August 31, 2018
Columbia Small Cap Growth Fund I
Not FDIC Insured • No bank guarantee • May lose value
Dear Shareholders,
Volatility exists in financial markets and this is not a comfortable fact of life. How investors deal with this reality, including how they react to short term spikes in volatility as well as to longer periods of increased or decreased volatility, may have a significant impact on their overall investing success.
Too often, investors change their investment strategy based on something that’s happening at a moment in time rather than thinking about how that change in strategy might affect their ability to achieve their longer-term financial goals. Emotion replaces logic and reasoning. Investors may sell in reaction to a market drop (fear or panic), locking in low returns which means they won’t be invested when the market returns, or they invest more at a market peak (greed or conviction), essentially when it is expensive to do so. In both cases, selling and buying at the exact wrong time.
We believe the best outcomes come from a consistent approach to investing. Here are five areas where advisors can help us overcome the tendency to react emotionally as we struggle to make the right choices with our investments:
Long-term focus
The further away long-term goals, aspirations and objectives are, the easier it is to stray away from the goals and priorities that we set out. Advisors help us stay focused on what we want to accomplish.
Discipline through up-and-down markets
Advisors help set rules to prevent us from making rash decisions that we may regret later. Knowing ahead of time what you should do in case of certain situations will help you get through volatile markets and not make emotional decisions.
Tax-awareness
Taxes are one of the biggest drags on investment returns and are critical attributes of investing. Yet few of us take the necessary steps to ease the corrosive effect of taxes. Advisors have tools and knowledge that may help us to manage portfolios more tax-efficiently and keep more of what we earn.
Emotional objectivity
Our emotions are very hard to manage and making investment decisions in an emotional state can lead to exceedingly bad outcomes. An objective advisor can help prevent some of the reactionary mistakes emotions often lead us to.
Education and guidance
The role of the advisor is to teach and guide us toward achieving our financial goals. In terms of working through emotions, guidance is by far the most important component.
By understanding our own behaviors and biases, we can prepare for future challenges. Your success is our priority. Talk to your advisor about how working with Columbia Threadneedle Investments may help you stay the course and position your portfolio for consistent, sustainable outcomes, regardless of market conditions.
Sincerely,
Christopher O. Petersen
President, Columbia Funds
Columbia Funds are distributed by Columbia Management Investment Distributors, Inc., member FINRA, and managed by Columbia Management Investment Advisers, LLC.
© 2018 Columbia Management Investment Advisers, LLC. All rights reserved.
Columbia Small Cap Growth Fund I | Annual Report 2018
Columbia Small Cap Growth Fund I | Annual Report 2018
Investment objective
Columbia Small Cap Growth Fund I (the Fund) seeks capital appreciation, by investing, under normal market conditions, at least 80% of its net assets (plus any borrowings for investment purposes) in stocks of companies with a market capitalization, at the time of initial purchase, equal to or less than, the largest stock in the Standard & Poor’s (S&P) SmallCap 600® Index.
Portfolio management
Daniel Cole, CFA
Co-Portfolio Manager
Managed Fund since 2015
Wayne Collette, CFA
Co-Portfolio Manager
Managed Fund since 2006
Lawrence Lin, CFA
Co-Portfolio Manager
Managed Fund since 2007
Morningstar style boxTM
The Morningstar Style Box is based on a fund’s portfolio holdings. For equity funds, the vertical axis shows the market capitalization of the stocks owned, and the horizontal axis shows investment style (value, blend, or growth). Information shown is based on the most recent data provided by Morningstar.
© 2018 Morningstar, Inc. All rights reserved. The Morningstar information contained herein: (1) is proprietary to Morningstar and/or its content providers; (2) may not be copied or distributed; and (3) is not warranted to be accurate, complete or timely. Neither Morningstar nor its content providers are responsible for any damages or losses arising from any use of this information.
| Average annual total returns (%) (for the period ended August 31, 2018) |
| | | Inception | 1 Year | 5 Years | 10 Years |
| Class A | Excluding sales charges | 11/01/05 | 33.62 | 14.24 | 11.04 |
| | Including sales charges | | 25.92 | 12.90 | 10.39 |
| Advisor Class* | 11/08/12 | 33.91 | 14.52 | 11.32 |
| Class C | Excluding sales charges | 11/01/05 | 32.58 | 13.38 | 10.22 |
| | Including sales charges | | 31.58 | 13.38 | 10.22 |
| Institutional Class | 10/01/96 | 33.91 | 14.52 | 11.32 |
| Institutional 2 Class* | 02/28/13 | 34.07 | 14.73 | 11.43 |
| Institutional 3 Class* | 07/15/09 | 34.12 | 14.72 | 11.49 |
| Class R* | 09/27/10 | 33.26 | 13.95 | 10.77 |
| Russell 2000 Growth Index | | 30.72 | 14.20 | 11.57 |
| Russell 2000 Index | | 25.45 | 13.00 | 10.46 |
Returns for Class A shares are shown with and without the maximum initial sales charge of 5.75%. Returns for Class C shares are shown with and without the 1.00% contingent deferred sales charge for the first year only. The Fund’s other share classes are not subject to sales charges and have limited eligibility. Please see the Fund’s prospectus for details. Performance for different share classes will vary based on differences in sales charges and fees associated with each share class. All results shown assume reinvestment of distributions during the period. Returns do not reflect the deduction of taxes that a shareholder may pay on Fund distributions or on the redemption of Fund shares. Performance results reflect the effect of any fee waivers or reimbursements of Fund expenses by Columbia Management Investment Advisers, LLC and/or any of its affiliates. Absent these fee waivers or expense reimbursement arrangements, performance results would have been lower.
The performance information shown represents past performance and is not a guarantee of future results. The investment return and principal value of your investment will fluctuate so that your shares, when redeemed, may be worth more or less than their original cost. Current performance may be lower or higher than the performance information shown. You may obtain performance information current to the most recent month-end by contacting your financial intermediary, visiting columbiathreadneedleus.com/investor/ or calling 800.345.6611.
| * | The returns shown for periods prior to the share class inception date (including returns for the Life of the Fund, if shown, which are since Fund inception) include the returns of the Fund’s oldest share class. These returns are adjusted to reflect any higher class-related operating expenses of the newer share classes, as applicable. Please visit columbiathreadneedleus.com/investor/investment-products/mutual-funds/appended-performance for more information. |
The Russell 2000 Growth Index, an unmanaged index, measures the performance of those Russell 2000 Index companies with higher price-to-book ratios and higher forecasted growth values.
The Russell 2000 Index measures the performance of the small-cap segment of the U.S. equity universe. The Russell 2000 is a subset of the Russell 3000 Index representing approximately 10% of the total market capitalization of that index. It includes approximately 2,000 of the smallest securities based on a combination of their market cap and current index membership.
Indices are not available for investment, are not professionally managed and do not reflect sales charges, fees, brokerage commissions, taxes or other expenses of investing. Securities in the Fund may not match those in an index.
| 2 | Columbia Small Cap Growth Fund I | Annual Report 2018 |
Fund at a Glance (continued)
Performance of a hypothetical $10,000 investment (August 31, 2008 — August 31, 2018)
The chart above shows the change in value of a hypothetical $10,000 investment in Class A shares of Columbia Small Cap Growth Fund I during the stated time period, and does not reflect the deduction of taxes that a shareholder may pay on Fund distributions or on the redemption of Fund shares.
| Top 10 holdings (%) (at August 31, 2018) |
| Veeva Systems Inc., Class A | 3.3 |
| Paycom Software, Inc. | 3.3 |
| Bio-Techne Corp. | 3.2 |
| Planet Fitness, Inc., Class A | 2.4 |
| Cantel Medical Corp. | 2.4 |
| Simpson Manufacturing Co., Inc. | 2.4 |
| LendingTree, Inc. | 2.4 |
| Teladoc, Inc. | 2.2 |
| Five Below, Inc. | 2.1 |
| Beacon Roofing Supply, Inc. | 2.1 |
Percentages indicated are based upon total investments (excluding Money Market Funds and derivatives, if any).
For further detail about these holdings, please refer to the section entitled “Portfolio of Investments.”
Fund holdings are as of the date given, are subject to change at any time, and are not recommendations to buy or sell any security.
| Portfolio breakdown (%) (at August 31, 2018) |
| Common Stocks | 99.4 |
| Money Market Funds | 0.6 |
| Total | 100.0 |
Percentages indicated are based upon total investments and exclude investments in derivatives, if any. The Fund’s portfolio composition is subject to change.
| Equity sector breakdown (%) (at August 31, 2018) |
| Consumer Discretionary | 19.9 |
| Consumer Staples | 3.0 |
| Energy | 3.9 |
| Financials | 4.2 |
| Health Care | 30.8 |
| Industrials | 13.9 |
| Information Technology | 21.4 |
| Real Estate | 2.9 |
| Total | 100.0 |
Percentages indicated are based upon total equity investments. The Fund’s portfolio composition is subject to change.
Columbia Small Cap Growth Fund I | Annual Report 2018
| 3 |
Manager Discussion of Fund Performance
For the 12-month period that ended August 31, 2018, the Fund’s Class A shares returned 33.62% excluding sales charges. The Fund solidly outperformed its benchmarks, the Russell 2000 Growth Index and the Russell 2000 Index, which returned 30.72% and 25.45%, respectively. Companies in the sweet spot of our target aided performance: companies with 1) two or more of the core competitive advantages we seek, which we believe offer them the potential to earn financial returns that are greater than the industry cost of capital and the potential to increase market share over time; 2) ample five-year+ growth opportunities with the ability to redeploy capital repeatedly with high and/or improving returns and 3) management teams that operate their businesses within a culture of ownership and create an environment that make them a destination of choice for employees within the industry.
Equity markets moved higher
U.S. equities delivered solid gains for the 12-month period that ended August 31, 2018, hitting record highs along the way. Buoyant corporate earnings, especially in the information technology sector, along with a strengthening domestic economy and a solid global economy, boosted investor sentiment. Consumer confidence was high, jobs data remained strong and personal income increased as the period wore on. Tax cuts approved by Congress late in 2017 had a favorable impact on corporate earnings and helped fuel investor optimism. Concerns that interest rates and inflation might rise faster than expected put a damper on equity markets early in 2018, but only briefly. Equities quickly recovered their lost ground — and then some. For the 12 months ended August 31, 2018, the S&P 500 Index, which measures the performance of 500 widely held, large-capitalization U.S. stocks and is frequently used as a general measure of market performance, gained 19.66%. Growth stocks outperformed value stocks, and small-cap stocks outperformed large- and mid-cap stocks.
The Federal Reserve raised the federal funds target rate three times during the period, to 1.75% - 2.00%, citing strong job growth and inflation in line with its 2.0% target. The yield on the 10-year U.S. Treasury ended the period at 2.86%.
Fund strategy
Our fundamental research process favors higher quality companies with histories of consistently earning more than their industry cost of capital, sustainable growth prospects and strong management teams. We seek to identify stocks with one or more of the core competitive advantages that we have categorized. We closely monitor the overall risk characteristics of the strategy versus the benchmark Russell 2000 Growth Index and seek to manage the risk profile within predefined limits around sector over/underweights and other key risk exposures relative to the index. Typically, any sector over- or under-weights are more of a reflection of our bottom-up analysis rather than a top-down call on one sector versus another. As a result, Fund performance is largely driven by individual stock selection. However, we do occasionally take over-/under-weight positions in a sub-sector or industry group that we believe has the potential to aid performance.
Contributors and detractors
The Fund was overweight in technology software, where positions in software companies Paycom and Veeva Systems generated strong returns. Paycom offers payroll management software to small and mid-sized businesses that do not require the frills offered by larger payroll providers. The company’s financial results significantly outpaced industry expectations, and its market expansion potential continued to woo investors. Veeva Systems continued to dominate the market for customer relationship management software for life sciences companies. In the past year, modules from the company’s Vault platform have aided further expansion into the clinical operations of life sciences companies, which has aided the company’s financial return profile.
In the medical devices and supplies industry in the health care sector, Bio-techne aided performance. Bio-techne’s core proteins business supplies the picks and shovels that researchers use in drug discovery. In addition, since fiscal 2016, the company has deployed capital into key areas such as tools for cell therapy workflow and into genomics with tissue and liquid biopsy solutions. Organic growth in the core business has accelerated, and we’re excited about the strong business model that management has developed.
Consumer discretionary stocks also contributed to the Fund’s performance advantage over its benchmark, with standout returns from Planet Fitness and Ollie’s Bargain Outlet Holdings. Planet Fitness has disrupted the fitness industry by going after the 80% of the population that does not regularly exercise at a fitness studio. Planet Fitness has taken the core components of the average gym (weights and cardio) and combined it with a “no judgement” atmosphere, which has
| 4 | Columbia Small Cap Growth Fund I | Annual Report 2018 |
Manager Discussion of Fund Performance (continued)
expanded the market of possible members, while dropping the pool, the basketball court and group fitness classes, all of which require a lot of square footage and are less capital efficient because they focus on low-frequency-use members. Although the entry membership is $10 per month, the average member pays closer to $20 per month by electing additional services. We believe that Planet Fitness’s financial return profile offers the potential for highly favorable returns in the small cap growth universe. Ollie’s Bargain Outlet Holdings is an American chain of retail stores that prides itself in providing solid deals to bargain shoppers. The company expanded its store count and continued to increase its customer base through its loyalty program, both of which, in combination with solid fundamentals, helped drive its share price sharply higher.
By contrast, a position in Pagseguro Digital, a Brazilian payments company, which entered the public markets with an initial public offering in January 2018, was a drag on returns. The company employs a digital distribution model to bring functionality for payments and services to small and mid-sized businesses in Brazil, similar to Square in the United States. They have disrupted the current competitive landscape, which is dominated by the traditional high-cost, bank branch distribution model. This is a similar strategy that Square employed with success in the United States against a similar competitive landscape. However, tariff wars along with political uncertainty ahead of the 2018 fall elections in Brazil caused the stock to stall. We took a tax loss and may revisit the stock at a later time.
At period’s end
Despite solid outperformance during this 12-month period, the last eight months were a challenge for us, given our focus on risk control and on companies in the sweet spot of their profit life cycle. During the period, the market rewarded many fast growing companies that have not proven they can deliver earnings and financial returns in excess of their industry cost of capital. While we like to find companies as early as possible in their profit life cycles, we’re vigilant about assessing a company’s strategy for turning early revenue growth and market share gains into durable profit growth. Many of those early stage companies have exceeded our price targets. As a result, we ended the period more focused on companies that have proven their ability to consistently earn greater than their industry cost of capital. At period end, the Fund was overweight in consumer companies, underweight in cyclicals and continued to have a healthy weight in software disruptors and niche dominators in health care. We reduced the Fund’s weight in earlier-stage companies. We aim to be vigilant about the volatility profile of the strategy and downside risk while still staying exposed to what we consider to be our best business opportunities.
Market risk may affect a single issuer, sector of the economy, industry or the market as a whole. Foreign investments subject the Fund to risks, including political, economic, market, social and others within a particular country, as well as to currency instabilities and less stringent financial and accounting standards generally applicable to U.S. issuers. Investments in small-cap companies involve risks and volatility greater than investments in larger, more established companies. Growth securities, at times, may not perform as well as value securities or the stock market in general and may be out of favor with investors. The Fund may invest significantly in issuers within a particular sector, which may be negatively affected by market, economic or other conditions, making the Fund more vulnerable to unfavorable developments in the sector. See the Fund’s prospectus for more information on these and other risks.
The views expressed in this report reflect the current views of the respective parties. These views are not guarantees of future performance and involve certain risks, uncertainties and assumptions that are difficult to predict, so actual outcomes and results may differ significantly from the views expressed. These views are subject to change at any time based upon economic, market or other conditions and the respective parties disclaim any responsibility to update such views. These views may not be relied on as investment advice and, because investment decisions for a Columbia fund are based on numerous factors, may not be relied on as an indication of trading intent on behalf of any particular Columbia fund. References to specific securities should not be construed as a recommendation or investment advice.
Columbia Small Cap Growth Fund I | Annual Report 2018
| 5 |
Understanding Your Fund’s Expenses
(Unaudited)
As an investor, you incur two types of costs. There are shareholder transaction costs, which generally include sales charges on purchases and may include redemption fees. There are also ongoing costs, which generally include management fees, distribution and/or service fees, and other fund expenses. The following information is intended to help you understand your ongoing costs (in dollars) of investing in the Fund and to help you compare these costs with the ongoing costs of investing in other mutual funds.
Analyzing your Fund’s expenses
To illustrate these ongoing costs, we have provided examples and calculated the expenses paid by investors in each share class of the Fund during the period. The actual and hypothetical information in the table is based on an initial investment of $1,000 at the beginning of the period indicated and held for the entire period. Expense information is calculated two ways and each method provides you with different information. The amount listed in the “Actual” column is calculated using the Fund’s actual operating expenses and total return for the period. You may use the Actual information, together with the amount invested, to estimate the expenses that you paid over the period. Simply divide your account value by $1,000 (for example, an $8,600 account value divided by $1,000 = 8.6), then multiply the results by the expenses paid during the period under the “Actual” column. The amount listed in the “Hypothetical” column assumes a 5% annual rate of return before expenses (which is not the Fund’s actual return) and then applies the Fund’s actual expense ratio for the period to the hypothetical return. You should not use the hypothetical account values and expenses to estimate either your actual account balance at the end of the period or the expenses you paid during the period. See “Compare with other funds” below for details on how to use the hypothetical data.
Compare with other funds
Since all mutual funds are required to include the same hypothetical calculations about expenses in shareholder reports, you can use this information to compare the ongoing cost of investing in the Fund with other funds. To do so, compare the hypothetical example with the 5% hypothetical examples that appear in the shareholder reports of other funds. As you compare hypothetical examples of other funds, it is important to note that hypothetical examples are meant to highlight the ongoing costs of investing in a fund only and do not reflect any transaction costs, such as sales charges, or redemption or exchange fees. Therefore, the hypothetical calculations are useful in comparing ongoing costs only, and will not help you determine the relative total costs of owning different funds. If transaction costs were included in these calculations, your costs would be higher.
| March 1, 2018 — August 31, 2018 |
| | Account value at the
beginning of the
period ($) | Account value at the
end of the
period ($) | Expenses paid during
the period ($) | Fund’s annualized
expense ratio (%) |
| | Actual | Hypothetical | Actual | Hypothetical | Actual | Hypothetical | Actual |
| Class A | 1,000.00 | 1,000.00 | 1,193.20 | 1,018.45 | 7.41 | 6.82 | 1.34 |
| Advisor Class | 1,000.00 | 1,000.00 | 1,194.10 | 1,019.71 | 6.03 | 5.55 | 1.09 |
| Class C | 1,000.00 | 1,000.00 | 1,189.00 | 1,014.67 | 11.53 | 10.61 | 2.09 |
| Institutional Class | 1,000.00 | 1,000.00 | 1,194.30 | 1,019.71 | 6.03 | 5.55 | 1.09 |
| Institutional 2 Class | 1,000.00 | 1,000.00 | 1,195.40 | 1,020.32 | 5.37 | 4.94 | 0.97 |
| Institutional 3 Class | 1,000.00 | 1,000.00 | 1,195.30 | 1,020.52 | 5.15 | 4.74 | 0.93 |
| Class R | 1,000.00 | 1,000.00 | 1,191.70 | 1,017.19 | 8.78 | 8.08 | 1.59 |
Expenses paid during the period are equal to the annualized expense ratio for each class as indicated above, multiplied by the average account value over the period and then multiplied by the number of days in the Fund’s most recent fiscal half year and divided by 365.
Expenses do not include fees and expenses incurred indirectly by the Fund from its investment in underlying funds, including affiliated and non-affiliated pooled investment vehicles, such as mutual funds and exchange-traded funds.
Had Columbia Management Investment Advisers, LLC and/or certain of its affiliates not waived/reimbursed certain fees and expenses, account value at the end of the period would have been reduced.
| 6 | Columbia Small Cap Growth Fund I | Annual Report 2018 |
Portfolio of Investments
August 31, 2018
(Percentages represent value of investments compared to net assets)
Investments in securities
| Common Stocks 100.0% |
| Issuer | Shares | Value ($) |
| Consumer Discretionary 19.9% |
| Auto Components 0.7% |
| LCI Industries | 41,000 | 3,810,950 |
| Hotels, Restaurants & Leisure 11.4% |
| Dave & Buster’s Entertainment, Inc.(a) | 152,300 | 8,859,291 |
| Eldorado Resorts, Inc.(a) | 91,600 | 4,401,380 |
| Hilton Grand Vacations, Inc.(a) | 287,900 | 9,402,814 |
| Penn National Gaming, Inc.(a) | 255,600 | 8,807,976 |
| Planet Fitness, Inc., Class A(a) | 275,400 | 14,147,298 |
| Six Flags Entertainment Corp. | 144,038 | 9,729,767 |
| Wingstop, Inc. | 161,800 | 10,832,510 |
| Total | | 66,181,036 |
| Household Durables 1.2% |
| Roku, Inc.(a) | 117,800 | 7,007,922 |
| Internet & Direct Marketing Retail 0.5% |
| Nutrisystem, Inc. | 68,300 | 2,527,100 |
| Media 1.9% |
| World Wrestling Entertainment, Inc., Class A | 125,800 | 10,996,178 |
| Multiline Retail 1.3% |
| Ollie’s Bargain Outlet Holdings, Inc.(a) | 86,900 | 7,568,990 |
| Specialty Retail 2.9% |
| Five Below, Inc.(a) | 106,400 | 12,392,408 |
| Floor & Decor Holdings, Inc.(a) | 125,369 | 4,608,564 |
| Total | | 17,000,972 |
| Total Consumer Discretionary | 115,093,148 |
| Consumer Staples 3.0% |
| Beverages 1.1% |
| Fever-Tree Drinks PLC | 47,700 | 2,302,328 |
| MGP Ingredients, Inc. | 55,900 | 4,310,449 |
| Total | | 6,612,777 |
| Food Products 1.9% |
| Calavo Growers, Inc. | 46,500 | 4,922,025 |
| Freshpet, Inc.(a) | 157,800 | 5,862,270 |
| Total | | 10,784,295 |
| Total Consumer Staples | 17,397,072 |
| Common Stocks (continued) |
| Issuer | Shares | Value ($) |
| Energy 3.9% |
| Energy Equipment & Services 1.8% |
| Frank’s International NV | 405,200 | 3,577,916 |
| Nabors Industries Ltd. | 460,900 | 2,843,753 |
| Oil States International, Inc.(a) | 110,300 | 3,733,655 |
| Total | | 10,155,324 |
| Oil, Gas & Consumable Fuels 2.1% |
| Delek U.S. Holdings, Inc. | 86,100 | 4,692,450 |
| Matador Resources Co.(a) | 114,100 | 3,735,634 |
| PBF Energy, Inc., Class A | 72,500 | 3,764,200 |
| Total | | 12,192,284 |
| Total Energy | 22,347,608 |
| Financials 4.2% |
| Capital Markets 1.0% |
| MarketAxess Holdings, Inc. | 30,200 | 5,732,564 |
| Thrifts & Mortgage Finance 3.2% |
| LendingTree, Inc.(a) | 55,300 | 14,010,255 |
| WSFS Financial Corp. | 94,800 | 4,626,240 |
| Total | | 18,636,495 |
| Total Financials | 24,369,059 |
| Health Care 30.8% |
| Biotechnology 6.9% |
| Atara Biotherapeutics, Inc.(a) | 81,700 | 3,345,615 |
| bluebird bio, Inc.(a) | 15,522 | 2,612,353 |
| CareDx, Inc.(a) | 150,300 | 3,653,793 |
| Exact Sciences Corp.(a) | 81,200 | 6,081,068 |
| Immunomedics, Inc.(a) | 153,600 | 4,110,336 |
| Loxo Oncology, Inc.(a) | 18,900 | 3,193,722 |
| Nightstar Therapeutics PLC, ADR(a) | 91,690 | 1,971,335 |
| Puma Biotechnology, Inc.(a) | 37,900 | 1,665,705 |
| Sage Therapeutics, Inc.(a) | 26,600 | 4,369,316 |
| Sarepta Therapeutics(a) | 14,800 | 2,042,992 |
| Spark Therapeutics, Inc.(a) | 26,590 | 1,638,210 |
| TESARO, Inc.(a) | 89,648 | 2,909,077 |
| uniQure NV(a) | 60,900 | 2,583,987 |
| Total | | 40,177,509 |
The accompanying Notes to Financial Statements are an integral part of this statement.
Columbia Small Cap Growth Fund I | Annual Report 2018
| 7 |
Portfolio of Investments (continued)
August 31, 2018
| Common Stocks (continued) |
| Issuer | Shares | Value ($) |
| Health Care Equipment & Supplies 9.0% |
| Cantel Medical Corp. | 145,000 | 14,065,000 |
| Inogen, Inc.(a) | 37,300 | 9,881,143 |
| iRhythm Technologies, Inc.(a) | 48,100 | 4,477,629 |
| Quidel Corp.(a) | 121,100 | 9,310,168 |
| Quotient Ltd.(a) | 515,900 | 3,946,635 |
| West Pharmaceutical Services, Inc. | 92,200 | 10,792,010 |
| Total | | 52,472,585 |
| Health Care Providers & Services 2.6% |
| Addus HomeCare Corp.(a) | 73,600 | 4,776,640 |
| Chemed Corp. | 31,783 | 10,283,072 |
| Total | | 15,059,712 |
| Health Care Technology 7.0% |
| Medidata Solutions, Inc.(a) | 105,000 | 8,922,900 |
| Teladoc, Inc.(a) | 160,700 | 12,462,285 |
| Veeva Systems Inc., Class A(a) | 181,400 | 18,930,904 |
| Total | | 40,316,089 |
| Life Sciences Tools & Services 4.0% |
| Bio-Techne Corp. | 96,600 | 18,563,622 |
| Codexis, Inc.(a) | 167,800 | 2,886,160 |
| NanoString Technologies, Inc.(a) | 93,400 | 1,510,278 |
| Total | | 22,960,060 |
| Pharmaceuticals 1.3% |
| Aerie Pharmaceuticals, Inc.(a) | 56,693 | 3,478,116 |
| Medicines Co. (The)(a) | 79,500 | 3,148,995 |
| Odonate Therapeutics, Inc.(a) | 56,400 | 1,082,316 |
| Total | | 7,709,427 |
| Total Health Care | 178,695,382 |
| Industrials 13.9% |
| Airlines 0.8% |
| Copa Holdings SA, Class A | 53,900 | 4,308,766 |
| Building Products 2.4% |
| Simpson Manufacturing Co., Inc. | 183,100 | 14,056,587 |
| Commercial Services & Supplies 2.0% |
| Healthcare Services Group, Inc. | 287,200 | 11,835,512 |
| Common Stocks (continued) |
| Issuer | Shares | Value ($) |
| Machinery 3.1% |
| ITT, Inc. | 130,494 | 7,713,500 |
| John Bean Technologies Corp. | 86,900 | 10,280,270 |
| Total | | 17,993,770 |
| Professional Services 1.5% |
| Exponent, Inc. | 89,200 | 4,669,620 |
| Wageworks, Inc.(a) | 79,500 | 4,253,250 |
| Total | | 8,922,870 |
| Road & Rail 2.0% |
| Knight-Swift Transportation Holdings, Inc. | 200,600 | 6,846,478 |
| Saia, Inc.(a) | 58,700 | 4,651,975 |
| Total | | 11,498,453 |
| Trading Companies & Distributors 2.1% |
| Beacon Roofing Supply, Inc.(a) | 325,219 | 12,059,121 |
| Total Industrials | 80,675,079 |
| Information Technology 21.4% |
| Internet Software & Services 8.9% |
| Coupa Software, Inc.(a) | 54,500 | 3,908,195 |
| Etsy, Inc.(a) | 145,700 | 7,094,133 |
| Five9, Inc.(a) | 60,600 | 2,911,830 |
| GTT Communications, Inc.(a) | 123,500 | 5,316,675 |
| Match Group, Inc.(a) | 137,035 | 6,858,602 |
| Mimecast Ltd.(a) | 147,100 | 6,117,889 |
| New Relic, Inc.(a) | 105,294 | 10,820,012 |
| Q2 Holdings, Inc.(a) | 43,800 | 2,728,740 |
| SendGrid, Inc.(a) | 42,538 | 1,542,853 |
| Trade Desk, Inc. (The), Class A(a) | 31,800 | 4,511,784 |
| Total | | 51,810,713 |
| IT Services 1.1% |
| EPAM Systems, Inc.(a) | 43,429 | 6,207,307 |
| Semiconductors & Semiconductor Equipment 2.3% |
| Entegris, Inc. | 75,000 | 2,542,500 |
| MKS Instruments, Inc. | 29,000 | 2,694,100 |
| Silicon Laboratories, Inc.(a) | 41,800 | 4,096,400 |
| Universal Display Corp. | 34,400 | 4,210,560 |
| Total | | 13,543,560 |
The accompanying Notes to Financial Statements are an integral part of this statement.
| 8 | Columbia Small Cap Growth Fund I | Annual Report 2018 |
Portfolio of Investments (continued)
August 31, 2018
| Common Stocks (continued) |
| Issuer | Shares | Value ($) |
| Software 9.1% |
| Bottomline Technologies de, Inc.(a) | 96,400 | 6,359,508 |
| Ellie Mae, Inc.(a) | 30,594 | 3,223,690 |
| ForeScout Technologies, Inc.(a) | 137,358 | 4,954,503 |
| HubSpot, Inc.(a) | 39,970 | 5,743,689 |
| Paycom Software, Inc.(a) | 121,913 | 18,911,145 |
| RingCentral, Inc., Class A(a) | 55,600 | 5,179,140 |
| SailPoint Technologies Holding, Inc.(a) | 265,478 | 8,211,234 |
| Total | | 52,582,909 |
| Total Information Technology | 124,144,489 |
| Real Estate 2.9% |
| Equity Real Estate Investment Trusts (REITS) 2.9% |
| Coresite Realty Corp. | 70,700 | 8,234,429 |
| Retail Opportunity Investments Corp. | 141,800 | 2,799,132 |
| STORE Capital Corp. | 203,104 | 5,851,426 |
| Total | | 16,884,987 |
| Total Real Estate | 16,884,987 |
Total Common Stocks
(Cost $452,538,087) | 579,606,824 |
|
| Money Market Funds 0.7% |
| | Shares | Value ($) |
| Columbia Short-Term Cash Fund, 2.058%(b),(c) | 3,659,207 | 3,658,841 |
Total Money Market Funds
(Cost $3,658,841) | 3,658,841 |
Total Investments in Securities
(Cost: $456,196,928) | 583,265,665 |
| Other Assets & Liabilities, Net | | (3,786,676) |
| Net Assets | 579,478,989 |
Notes to Portfolio of Investments
| (a) | Non-income producing investment. |
| (b) | The rate shown is the seven-day current annualized yield at August 31, 2018. |
| (c) | As defined in the Investment Company Act of 1940, an affiliated company is one in which the Fund owns 5% or more of the company’s outstanding voting securities, or a company which is under common ownership or control with the Fund. Holdings and transactions in these affiliated companies during the year ended August 31, 2018 are as follows: |
| Issuer | Beginning
shares | Shares
purchased | Shares
sold | Ending
shares | Realized gain
(loss) —
affiliated
issuers ($) | Net change in
unrealized
appreciation
(depreciation) —
affiliated
issuers ($) | Dividends —
affiliated
issuers ($) | Value —
affiliated
issuers
at end of
period ($) |
| Columbia Short-Term Cash Fund, 2.058% |
| | 17,335,056 | 261,692,277 | (275,368,126) | 3,659,207 | (1,857) | (77) | 151,922 | 3,658,841 |
Abbreviation Legend
| ADR | American Depositary Receipt |
Fair value measurements
The Fund categorizes its fair value measurements according to a three-level hierarchy that maximizes the use of observable inputs and minimizes the use of unobservable inputs by prioritizing that the most observable input be used when available. Observable inputs are those that market participants would use in pricing an investment based on market data obtained from sources independent of the reporting entity. Unobservable inputs are those that reflect the Fund’s assumptions about the information market participants would use in
The accompanying Notes to Financial Statements are an integral part of this statement.
Columbia Small Cap Growth Fund I | Annual Report 2018
| 9 |
Portfolio of Investments (continued)
August 31, 2018
Fair value measurements (continued)
pricing an investment. An investment’s level within the fair value hierarchy is based on the lowest level of any input that is deemed significant to the asset’s or liability’s fair value measurement. The input levels are not necessarily an indication of the risk or liquidity associated with investments at that level. For example, certain U.S. government securities are generally high quality and liquid, however, they are reflected as Level 2 because the inputs used to determine fair value may not always be quoted prices in an active market.
Fair value inputs are summarized in the three broad levels listed below:
| ■ | Level 1 — Valuations based on quoted prices for investments in active markets that the Fund has the ability to access at the measurement date. Valuation adjustments are not applied to Level 1 investments. |
| ■ | Level 2 — Valuations based on other significant observable inputs (including quoted prices for similar securities, interest rates, prepayment speeds, credit risks, etc.). |
| ■ | Level 3 — Valuations based on significant unobservable inputs (including the Fund’s own assumptions and judgment in determining the fair value of investments). |
Inputs that are used in determining fair value of an investment may include price information, credit data, volatility statistics, and other factors. These inputs can be either observable or unobservable. The availability of observable inputs can vary between investments, and is affected by various factors such as the type of investment, and the volume and level of activity for that investment or similar investments in the marketplace. The inputs will be considered by the Investment Manager, along with any other relevant factors in the calculation of an investment’s fair value. The Fund uses prices and inputs that are current as of the measurement date, which may include periods of market dislocations. During these periods, the availability of prices and inputs may be reduced for many investments. This condition could cause an investment to be reclassified between the various levels within the hierarchy.
Foreign equity securities actively traded in markets where there is a significant delay in the local close relative to the New York Stock Exchange are classified as Level 2. The values of these securities may include an adjustment to reflect the impact of significant market movements following the close of local trading, as described in Note 2 to the financial statements – Security valuation.
Certain investments that have been measured at fair value using the net asset value (NAV) per share (or its equivalent) are not categorized in the fair value hierarchy. The fair value amounts presented in the table are intended to reconcile the fair value hierarchy to the amounts presented in the Portfolio of Investments. The Columbia Short-Term Cash Fund seeks to provide shareholders with maximum current income consistent with liquidity and stability of principal. Columbia Short-Term Cash Fund prices its shares with a floating NAV and no longer seeks to maintain a stable NAV.
Investments falling into the Level 3 category are primarily supported by quoted prices from brokers and dealers participating in the market for those investments. However, these may be classified as Level 3 investments due to lack of market transparency and corroboration to support these quoted prices. Additionally, valuation models may be used as the pricing source for any remaining investments classified as Level 3. These models may rely on one or more significant unobservable inputs and/or significant assumptions by the Investment Manager. Inputs used in valuations may include, but are not limited to, financial statement analysis, capital account balances, discount rates and estimated cash flows, and comparable company data.
Under the direction of the Fund’s Board of Trustees (the Board), the Investment Manager’s Valuation Committee (the Committee) is responsible for overseeing the valuation procedures approved by the Board. The Committee consists of voting and non-voting members from various groups within the Investment Manager’s organization, including operations and accounting, trading and investments, compliance, risk management and legal.
The Committee meets at least monthly to review and approve valuation matters, which may include a description of specific valuation determinations, data regarding pricing information received from approved pricing vendors and brokers and the results of Board-approved valuation control policies and procedures (the Policies). The Policies address, among other things, instances when market quotations are or are not readily available, including recommendations of third party pricing vendors and a determination of appropriate pricing methodologies; events that require specific valuation determinations and assessment of fair value techniques; securities with a potential for stale pricing, including those that are illiquid, restricted, or in default; and the effectiveness of third party pricing vendors, including periodic reviews of vendors. The Committee meets more frequently, as needed, to discuss additional valuation matters, which may include the need to review back-testing results, review time-sensitive information or approve related valuation actions. The Committee reports to the Board, with members of the Committee meeting with the Board at each of its regularly scheduled meetings to discuss valuation matters and actions during the period, similar to those described earlier.
For investments categorized as Level 3, the Committee monitors information similar to that described above, which may include: (i) data specific to the issuer or comparable issuers, (ii) general market or specific sector news and (iii) quoted prices and specific or similar security transactions. The Committee considers this data and any changes from prior periods in order to assess the reasonableness of observable and unobservable inputs, any assumptions or internal models used to value those securities and changes in fair value. This data is also used to corroborate, when available, information received from approved pricing vendors and brokers. Various factors impact the frequency of monitoring this information (which may occur as often as daily). However, the Committee may determine that changes to inputs, assumptions and models are not required as a result of the monitoring procedures performed.
The following table is a summary of the inputs used to value the Fund’s investments at August 31, 2018:
| | Level 1
quoted prices
in active
markets for
identical
assets ($) | Level 2
other
significant
observable
inputs ($) | Level 3
significant
unobservable
inputs ($) | Investments
measured at
net asset
value ($) | Total ($) |
| Investments in Securities | | | | | |
| Common Stocks | | | | | |
| Consumer Discretionary | 115,093,148 | — | — | — | 115,093,148 |
| Consumer Staples | 15,094,744 | 2,302,328 | — | — | 17,397,072 |
| Energy | 22,347,608 | — | — | — | 22,347,608 |
| Financials | 24,369,059 | — | — | — | 24,369,059 |
| Health Care | 178,695,382 | — | — | — | 178,695,382 |
| Industrials | 80,675,079 | — | — | — | 80,675,079 |
The accompanying Notes to Financial Statements are an integral part of this statement.
| 10 | Columbia Small Cap Growth Fund I | Annual Report 2018 |
Portfolio of Investments (continued)
August 31, 2018
Fair value measurements (continued)
| | Level 1
quoted prices
in active
markets for
identical
assets ($) | Level 2
other
significant
observable
inputs ($) | Level 3
significant
unobservable
inputs ($) | Investments
measured at
net asset
value ($) | Total ($) |
| Information Technology | 124,144,489 | — | — | — | 124,144,489 |
| Real Estate | 16,884,987 | — | — | — | 16,884,987 |
| Total Common Stocks | 577,304,496 | 2,302,328 | — | — | 579,606,824 |
| Money Market Funds | — | — | — | 3,658,841 | 3,658,841 |
| Total Investments in Securities | 577,304,496 | 2,302,328 | — | 3,658,841 | 583,265,665 |
See the Portfolio of Investments for all investment classifications not indicated in the table.
The Fund’s assets assigned to the Level 2 input category are generally valued using the market approach, in which a security’s value is determined through reference to prices and information from market transactions for similar or identical assets. These assets include certain foreign securities for which a third party statistical pricing service may be employed for purposes of fair market valuation. The model utilized by such third party statistical pricing service takes into account a security’s correlation to available market data including, but not limited to, intraday index, ADR, and exchange-traded fund movements.
There were no transfers of financial assets between levels during the period.
The accompanying Notes to Financial Statements are an integral part of this statement.
Columbia Small Cap Growth Fund I | Annual Report 2018
| 11 |
Statement of Assets and Liabilities
August 31, 2018
| Assets | |
| Investments in securities, at value | |
| Unaffiliated issuers (cost $452,538,087) | $579,606,824 |
| Affiliated issuers (cost $3,658,841) | 3,658,841 |
| Receivable for: | |
| Investments sold | 2,837,133 |
| Capital shares sold | 355,629 |
| Dividends | 319,559 |
| Expense reimbursement due from Investment Manager | 191 |
| Prepaid expenses | 3,376 |
| Trustees’ deferred compensation plan | 107,316 |
| Total assets | 586,888,869 |
| Liabilities | |
| Payable for: | |
| Investments purchased | 6,999,361 |
| Capital shares purchased | 140,194 |
| Management services fees | 13,610 |
| Distribution and/or service fees | 1,945 |
| Transfer agent fees | 69,893 |
| Compensation of board members | 19,583 |
| Compensation of chief compliance officer | 33 |
| Other expenses | 57,945 |
| Trustees’ deferred compensation plan | 107,316 |
| Total liabilities | 7,409,880 |
| Net assets applicable to outstanding capital stock | $579,478,989 |
| Represented by | |
| Paid in capital | 391,827,006 |
| Excess of distributions over net investment income | (699,076) |
| Accumulated net realized gain | 61,282,295 |
| Unrealized appreciation (depreciation) on: | |
| Investments - unaffiliated issuers | 127,068,737 |
| Foreign currency translations | 27 |
| Total - representing net assets applicable to outstanding capital stock | $579,478,989 |
The accompanying Notes to Financial Statements are an integral part of this statement.
| 12 | Columbia Small Cap Growth Fund I | Annual Report 2018 |
Statement of Assets and Liabilities (continued)
August 31, 2018
| Class A | |
| Net assets | $249,155,955 |
| Shares outstanding | 11,301,500 |
| Net asset value per share | $22.05 |
| Maximum sales charge | 5.75% |
| Maximum offering price per share (calculated by dividing the net asset value per share by 1.0 minus the maximum sales charge for Class A shares) | $23.40 |
| Advisor Class | |
| Net assets | $8,912,970 |
| Shares outstanding | 362,105 |
| Net asset value per share | $24.61 |
| Class C | |
| Net assets | $8,400,508 |
| Shares outstanding | 468,584 |
| Net asset value per share | $17.93 |
| Institutional Class | |
| Net assets | $226,120,213 |
| Shares outstanding | 9,654,729 |
| Net asset value per share | $23.42 |
| Institutional 2 Class | |
| Net assets | $21,023,854 |
| Shares outstanding | 887,931 |
| Net asset value per share | $23.68 |
| Institutional 3 Class | |
| Net assets | $64,214,460 |
| Shares outstanding | 2,683,067 |
| Net asset value per share | $23.93 |
| Class R | |
| Net assets | $1,651,029 |
| Shares outstanding | 76,550 |
| Net asset value per share | $21.57 |
The accompanying Notes to Financial Statements are an integral part of this statement.
Columbia Small Cap Growth Fund I | Annual Report 2018
| 13 |
Statement of Operations
Year Ended August 31, 2018
| Net investment income | |
| Income: | |
| Dividends — unaffiliated issuers | $2,428,049 |
| Dividends — affiliated issuers | 151,922 |
| Interest | 135,284 |
| Total income | 2,715,255 |
| Expenses: | |
| Management services fees | 4,272,672 |
| Distribution and/or service fees | |
| Class A | 531,914 |
| Class C | 128,031 |
| Class R | 7,107 |
| Transfer agent fees | |
| Class A | 370,054 |
| Advisor Class | 9,317 |
| Class C | 22,355 |
| Institutional Class | 319,498 |
| Institutional 2 Class | 9,786 |
| Institutional 3 Class | 4,468 |
| Class K | 16 |
| Class R | 2,477 |
| Plan administration fees | |
| Class K | 69 |
| Compensation of board members | 26,089 |
| Custodian fees | 13,556 |
| Printing and postage fees | 55,212 |
| Registration fees | 128,896 |
| Audit fees | 36,814 |
| Legal fees | 11,482 |
| Line of credit interest | 346 |
| Compensation of chief compliance officer | 190 |
| Other | 25,806 |
| Total expenses | 5,976,155 |
| Fees waived or expenses reimbursed by Investment Manager and its affiliates | (47,398) |
| Expense reduction | (5,500) |
| Total net expenses | 5,923,257 |
| Net investment loss | (3,208,002) |
| Realized and unrealized gain (loss) — net | |
| Net realized gain (loss) on: | |
| Investments — unaffiliated issuers | 80,020,669 |
| Investments — affiliated issuers | (1,857) |
| Foreign currency translations | (5,539) |
| Net realized gain | 80,013,273 |
| Net change in unrealized appreciation (depreciation) on: | |
| Investments — unaffiliated issuers | 68,934,609 |
| Investments — affiliated issuers | (77) |
| Foreign currency translations | 27 |
| Net change in unrealized appreciation (depreciation) | 68,934,559 |
| Net realized and unrealized gain | 148,947,832 |
| Net increase in net assets resulting from operations | $145,739,830 |
The accompanying Notes to Financial Statements are an integral part of this statement.
| 14 | Columbia Small Cap Growth Fund I | Annual Report 2018 |
Statement of Changes in Net Assets
| | Year Ended
August 31, 2018 | Year Ended
August 31, 2017 |
| Operations | | |
| Net investment loss | $(3,208,002) | $(2,490,400) |
| Net realized gain | 80,013,273 | 63,973,855 |
| Net change in unrealized appreciation (depreciation) | 68,934,559 | 21,727,809 |
| Net increase in net assets resulting from operations | 145,739,830 | 83,211,264 |
| Distributions to shareholders | | |
| Net realized gains | | |
| Class A | (30,755,838) | (14,427,569) |
| Advisor Class | (658,517) | (102,953) |
| Class B | — | (44,363) |
| Class C | (2,144,127) | (1,163,801) |
| Class I | — | (2,897,417) |
| Institutional Class | (24,892,211) | (11,918,433) |
| Institutional 2 Class | (2,219,843) | (1,024,280) |
| Institutional 3 Class | (8,099,292) | (878,940) |
| Class K | (7,567) | (3,329) |
| Class R | (214,788) | (114,255) |
| Total distributions to shareholders | (68,992,183) | (32,575,340) |
| Increase (decrease) in net assets from capital stock activity | 68,865,412 | (21,467,841) |
| Total increase in net assets | 145,613,059 | 29,168,083 |
| Net assets at beginning of year | 433,865,930 | 404,697,847 |
| Net assets at end of year | $579,478,989 | $433,865,930 |
| Excess of distributions over net investment income | $(699,076) | $(121,599) |
The accompanying Notes to Financial Statements are an integral part of this statement.
Columbia Small Cap Growth Fund I | Annual Report 2018
| 15 |
Statement of Changes in Net Assets (continued)
| | Year Ended | Year Ended |
| | August 31, 2018 | August 31, 2017 |
| | Shares | Dollars ($) | Shares | Dollars ($) |
| Capital stock activity |
| Class A | | | | |
| Subscriptions | 1,797,326 | 35,428,984 | 811,805 | 14,645,816 |
| Distributions reinvested | 1,506,195 | 26,328,292 | 729,371 | 12,326,375 |
| Redemptions | (1,713,663) | (33,470,462) | (1,902,417) | (33,806,184) |
| Net increase (decrease) | 1,589,858 | 28,286,814 | (361,241) | (6,833,993) |
| Advisor Class | | | | |
| Subscriptions | 337,404 | 7,486,300 | 303,976 | 6,141,909 |
| Distributions reinvested | 33,793 | 658,285 | 5,550 | 102,842 |
| Redemptions | (90,216) | (1,903,391) | (296,444) | (6,073,632) |
| Net increase | 280,981 | 6,241,194 | 13,082 | 171,119 |
| Class B | | | | |
| Subscriptions | — | — | 346 | 5,073 |
| Distributions reinvested | — | — | 3,059 | 43,649 |
| Redemptions | — | — | (43,256) | (659,312) |
| Net decrease | — | — | (39,851) | (610,590) |
| Class C | | | | |
| Subscriptions | 220,813 | 3,492,513 | 100,035 | 1,497,300 |
| Distributions reinvested | 145,159 | 2,075,777 | 69,775 | 995,689 |
| Redemptions | (648,507) | (10,712,615) | (313,530) | (4,765,688) |
| Net decrease | (282,535) | (5,144,325) | (143,720) | (2,272,699) |
| Class I | | | | |
| Subscriptions | — | — | 43,255 | 822,084 |
| Distributions reinvested | — | — | 160,073 | 2,897,317 |
| Redemptions | — | — | (2,259,882) | (42,472,598) |
| Net decrease | — | — | (2,056,554) | (38,753,197) |
| Institutional Class | | | | |
| Subscriptions | 2,370,671 | 49,045,174 | 1,181,510 | 22,327,660 |
| Distributions reinvested | 1,236,081 | 22,916,948 | 645,571 | 11,465,341 |
| Redemptions | (1,727,964) | (35,613,868) | (2,756,842) | (51,444,002) |
| Net increase (decrease) | 1,878,788 | 36,348,254 | (929,761) | (17,651,001) |
| Institutional 2 Class | | | | |
| Subscriptions | 368,410 | 7,872,631 | 204,966 | 3,869,035 |
| Distributions reinvested | 118,506 | 2,219,604 | 57,184 | 1,024,165 |
| Redemptions | (347,447) | (7,431,467) | (153,897) | (2,943,144) |
| Net increase | 139,469 | 2,660,768 | 108,253 | 1,950,056 |
| Institutional 3 Class | | | | |
| Subscriptions | 342,976 | 7,370,900 | 2,499,742 | 47,382,582 |
| Distributions reinvested | 428,068 | 8,099,045 | 48,634 | 878,821 |
| Redemptions | (702,720) | (15,017,161) | (289,616) | (5,596,085) |
| Net increase | 68,324 | 452,784 | 2,258,760 | 42,665,318 |
| Class K | | | | |
| Distributions reinvested | 399 | 7,344 | 183 | 3,222 |
| Redemptions | (2,800) | (57,962) | — | — |
| Net increase (decrease) | (2,401) | (50,618) | 183 | 3,222 |
| Class R | | | | |
| Subscriptions | 26,914 | 518,546 | 17,930 | 317,936 |
| Distributions reinvested | 11,736 | 201,152 | 6,697 | 111,302 |
| Redemptions | (34,714) | (649,157) | (31,788) | (565,314) |
| Net increase (decrease) | 3,936 | 70,541 | (7,161) | (136,076) |
| Total net increase (decrease) | 3,676,420 | 68,865,412 | (1,158,010) | (21,467,841) |
The accompanying Notes to Financial Statements are an integral part of this statement.
| 16 | Columbia Small Cap Growth Fund I | Annual Report 2018 |
[THIS PAGE INTENTIONALLY LEFT BLANK]
Columbia Small Cap Growth Fund I | Annual Report 2018
| 17 |
The following table is intended to help you understand the Fund’s financial performance. Certain information reflects financial results for a single share of a class held for the periods shown. Per share net investment income (loss) amounts are calculated based on average shares outstanding during the period. Total return assumes reinvestment of all dividends and distributions, if any. Total return does not reflect payment of sales charges, if any. Total return and portfolio turnover are not annualized for periods of less than one year. The portfolio turnover rate is calculated without regard to purchase and sales transactions of short-term instruments and certain derivatives, if any. If such transactions were included, the Fund’s portfolio turnover rate may be higher.
| | Net asset value,
beginning of
period | Net
investment
income
(loss) | Net
realized
and
unrealized
gain | Total from
investment
operations | Distributions
from net
realized
gains | Total
distributions to
shareholders |
| Class A |
| Year Ended 8/31/2018 | $19.46 | (0.15) | 5.87 | 5.72 | (3.13) | (3.13) |
| Year Ended 8/31/2017 | $17.29 | (0.13) | 3.78 | 3.65 | (1.48) | (1.48) |
| Year Ended 8/31/2016 | $27.22 | (0.11) (f) | 0.40 | 0.29 | (10.22) | (10.22) |
| Year Ended 8/31/2015 | $29.40 | (0.27) | 3.09 | 2.82 | (5.11) | (5.11) |
| Year Ended 8/31/2014 | $33.32 | (0.28) | 1.71 | 1.43 | (5.35) | (5.35) |
| Advisor Class |
| Year Ended 8/31/2018 | $21.38 | (0.12) | 6.53 | 6.41 | (3.18) | (3.18) |
| Year Ended 8/31/2017 | $18.86 | (0.09) | 4.13 | 4.04 | (1.52) | (1.52) |
| Year Ended 8/31/2016 | $28.69 | (0.03) (f) | 0.42 | 0.39 | (10.22) | (10.22) |
| Year Ended 8/31/2015 | $30.64 | (0.20) | 3.24 | 3.04 | (5.11) | (5.11) |
| Year Ended 8/31/2014 | $34.52 | (0.23) | 1.78 | 1.55 | (5.43) | (5.43) |
| Class C |
| Year Ended 8/31/2018 | $16.35 | (0.25) | 4.82 | 4.57 | (2.99) | (2.99) |
| Year Ended 8/31/2017 | $14.74 | (0.23) | 3.20 | 2.97 | (1.36) | (1.36) |
| Year Ended 8/31/2016 | $24.87 | (0.21) (f) | 0.30 | 0.09 | (10.22) | (10.22) |
| Year Ended 8/31/2015 | $27.47 | (0.44) | 2.85 | 2.41 | (5.11) | (5.11) |
| Year Ended 8/31/2014 | $31.44 | (0.49) | 1.62 | 1.13 | (5.10) | (5.10) |
| Institutional Class |
| Year Ended 8/31/2018 | $20.49 | (0.11) | 6.22 | 6.11 | (3.18) | (3.18) |
| Year Ended 8/31/2017 | $18.13 | (0.09) | 3.97 | 3.88 | (1.52) | (1.52) |
| Year Ended 8/31/2016 | $27.98 | (0.07) (f) | 0.44 | 0.37 | (10.22) | (10.22) |
| Year Ended 8/31/2015 | $30.01 | (0.20) | 3.16 | 2.96 | (5.11) | (5.11) |
| Year Ended 8/31/2014 | $33.91 | (0.21) | 1.74 | 1.53 | (5.43) | (5.43) |
| Institutional 2 Class |
| Year Ended 8/31/2018 | $20.68 | (0.09) | 6.29 | 6.20 | (3.20) | (3.20) |
| Year Ended 8/31/2017 | $18.28 | (0.07) | 4.01 | 3.94 | (1.54) | (1.54) |
| Year Ended 8/31/2016 | $28.11 | (0.04) (f) | 0.43 | 0.39 | (10.22) | (10.22) |
| Year Ended 8/31/2015 | $30.09 | (0.16) | 3.17 | 3.01 | (5.11) | (5.11) |
| Year Ended 8/31/2014 | $33.90 | (0.14) | 1.80 | 1.66 | (5.48) | (5.48) |
| Institutional 3 Class |
| Year Ended 8/31/2018 | $20.87 | (0.08) | 6.35 | 6.27 | (3.21) | (3.21) |
| Year Ended 8/31/2017 | $18.43 | (0.07) | 4.06 | 3.99 | (1.55) | (1.55) |
| Year Ended 8/31/2016 | $28.24 | (0.03) (f) | 0.44 | 0.41 | (10.22) | (10.22) |
| Year Ended 8/31/2015 | $30.19 | (0.14) | 3.18 | 3.04 | (5.11) | (5.11) |
| Year Ended 8/31/2014 | $34.09 | (0.14) | 1.73 | 1.59 | (5.49) | (5.49) |
The accompanying Notes to Financial Statements are an integral part of this statement.
| 18 | Columbia Small Cap Growth Fund I | Annual Report 2018 |
Financial Highlights (continued)
| | Reimbursement
from affiliate | Proceeds from
regulatory
settlements | Net
asset
value,
end of
period | Total
return | Total gross
expense
ratio to
average
net assets(a) | Total net
expense
ratio to
average
net assets(a),(b) | Net investment
income (loss)
ratio to
average
net assets | Portfolio
turnover | Net
assets,
end of
period
(000’s) |
| Class A |
| Year Ended 8/31/2018 | — | — | $22.05 | 33.62% | 1.35% (c) | 1.34% (c),(d) | (0.79%) | 156% | $249,156 |
| Year Ended 8/31/2017 | — | — | $19.46 | 22.42% | 1.39% (e) | 1.34% (d),(e) | (0.74%) | 174% | $189,019 |
| Year Ended 8/31/2016 | — | — | $17.29 | 2.88% | 1.41% (c) | 1.36% (c),(d) | (0.62%) | 142% | $174,183 |
| Year Ended 8/31/2015 | — | 0.11 | $27.22 | 11.87% (g) | 1.36% | 1.36% (d) | (0.98%) | 117% | $202,566 |
| Year Ended 8/31/2014 | — | — | $29.40 | 3.35% | 1.30% (c) | 1.30% (c),(d) | (0.88%) | 148% | $216,670 |
| Advisor Class |
| Year Ended 8/31/2018 | — | — | $24.61 | 33.91% | 1.10% (c) | 1.09% (c),(d) | (0.53%) | 156% | $8,913 |
| Year Ended 8/31/2017 | — | — | $21.38 | 22.68% | 1.12% (e) | 1.09% (d),(e) | (0.46%) | 174% | $1,734 |
| Year Ended 8/31/2016 | — | — | $18.86 | 3.15% | 1.16% (c) | 1.10% (c),(d) | (0.16%) | 142% | $1,283 |
| Year Ended 8/31/2015 | — | 0.12 | $28.69 | 12.18% (g) | 1.10% | 1.10% (d) | (0.68%) | 117% | $69 |
| Year Ended 8/31/2014 | — | — | $30.64 | 3.59% | 1.04% (c) | 1.04% (c),(d) | (0.67%) | 148% | $167 |
| Class C |
| Year Ended 8/31/2018 | — | — | $17.93 | 32.58% | 2.10% (c) | 2.09% (c),(d) | (1.54%) | 156% | $8,401 |
| Year Ended 8/31/2017 | — | — | $16.35 | 21.48% | 2.14% (e) | 2.09% (d),(e) | (1.49%) | 174% | $12,281 |
| Year Ended 8/31/2016 | — | — | $14.74 | 2.12% | 2.16% (c) | 2.12% (c),(d) | (1.37%) | 142% | $13,187 |
| Year Ended 8/31/2015 | — | 0.10 | $24.87 | 11.07% (g) | 2.11% | 2.11% (d) | (1.72%) | 117% | $16,810 |
| Year Ended 8/31/2014 | — | — | $27.47 | 2.57% | 2.05% (c) | 2.05% (c),(d) | (1.63%) | 148% | $18,762 |
| Institutional Class |
| Year Ended 8/31/2018 | — | — | $23.42 | 33.91% | 1.10% (c) | 1.09% (c),(d) | (0.54%) | 156% | $226,120 |
| Year Ended 8/31/2017 | — | — | $20.49 | 22.72% | 1.14% (e) | 1.09% (d),(e) | (0.49%) | 174% | $159,344 |
| Year Ended 8/31/2016 | — | — | $18.13 | 3.15% | 1.15% (c) | 1.12% (c),(d) | (0.38%) | 142% | $157,826 |
| Year Ended 8/31/2015 | — | 0.12 | $27.98 | 12.16% (g) | 1.11% | 1.11% (d) | (0.69%) | 117% | $215,938 |
| Year Ended 8/31/2014 | — | — | $30.01 | 3.61% | 1.05% (c) | 1.05% (c),(d) | (0.64%) | 148% | $693,432 |
| Institutional 2 Class |
| Year Ended 8/31/2018 | — | — | $23.68 | 34.07% | 0.99% (c) | 0.98% (c) | (0.43%) | 156% | $21,024 |
| Year Ended 8/31/2017 | — | — | $20.68 | 22.87% | 1.00% (e) | 0.99% (e) | (0.39%) | 174% | $15,478 |
| Year Ended 8/31/2016 | — | — | $18.28 | 3.24% | 0.99% (c) | 0.99% (c) | (0.23%) | 142% | $11,704 |
| Year Ended 8/31/2015 | — | 0.12 | $28.11 | 12.33% (g) | 0.96% | 0.96% | (0.58%) | 117% | $11,990 |
| Year Ended 8/31/2014 | 0.01 | — | $30.09 | 4.07% (h) | 0.91% (c) | 0.91% (c) | (0.46%) | 148% | $721 |
| Institutional 3 Class |
| Year Ended 8/31/2018 | — | — | $23.93 | 34.12% | 0.94% (c) | 0.93% (c) | (0.38%) | 156% | $64,214 |
| Year Ended 8/31/2017 | — | — | $20.87 | 22.96% | 0.96% | 0.94% | (0.38%) | 174% | $54,574 |
| Year Ended 8/31/2016 | — | — | $18.43 | 3.30% | 0.94% (c) | 0.94% (c) | (0.14%) | 142% | $6,562 |
| Year Ended 8/31/2015 | — | 0.12 | $28.24 | 12.38% (g) | 0.90% | 0.90% | (0.50%) | 117% | $3,823 |
| Year Ended 8/31/2014 | — | — | $30.19 | 3.78% | 0.86% (c) | 0.86% (c) | (0.43%) | 148% | $4,491 |
The accompanying Notes to Financial Statements are an integral part of this statement.
Columbia Small Cap Growth Fund I | Annual Report 2018
| 19 |
Financial Highlights (continued)
| | Net asset value,
beginning of
period | Net
investment
income
(loss) | Net
realized
and
unrealized
gain | Total from
investment
operations | Distributions
from net
realized
gains | Total
distributions to
shareholders |
| Class R |
| Year Ended 8/31/2018 | $19.10 | (0.20) | 5.75 | 5.55 | (3.08) | (3.08) |
| Year Ended 8/31/2017 | $17.00 | (0.17) | 3.71 | 3.54 | (1.44) | (1.44) |
| Year Ended 8/31/2016 | $26.99 | (0.16) (f) | 0.39 | 0.23 | (10.22) | (10.22) |
| Year Ended 8/31/2015 | $29.25 | (0.33) | 3.07 | 2.74 | (5.11) | (5.11) |
| Year Ended 8/31/2014 | $33.18 | (0.36) | 1.70 | 1.34 | (5.27) | (5.27) |
| Notes to Financial Highlights |
| (a) | In addition to the fees and expenses that the Fund bears directly, the Fund indirectly bears a pro rata share of the fees and expenses of any other funds in which it invests. Such indirect expenses are not included in the Fund’s reported expense ratios. |
| (b) | Total net expenses include the impact of certain fee waivers/expense reimbursements made by the Investment Manager and certain of its affiliates, if applicable. |
| (c) | Ratios include line of credit interest expense which is less than 0.01%. |
| (d) | The benefits derived from expense reductions had an impact of less than 0.01%. |
| (e) | Expenses have been reduced due to a reimbursement of expenses overbilled by a third party. If the reimbursement had been excluded, the expense ratios would have been higher by the percentages shown for each class in the table below. All fee waivers and expense reimbursements by the Investment Manager and its affiliates were applied before giving effect to this third party reimbursement. |
| Year Ended | Class A | Advisor
Class | Class C | Institutional
Class | Institutional 2
Class | Class R |
| 08/31/2017 | 0.01 % | 0.01 % | 0.01 % | 0.01 % | 0.01 % | 0.01 % |
| (f) | Net investment income per share includes special dividends. The per share effect of these dividends amounted to: |
| Year Ended | Class A | Advisor
Class | Class C | Institutional
Class | Institutional 2
Class | Institutional 3
Class | Class R |
| 08/31/2016 | $ 0.04 | $ 0.07 | $ 0.03 | $ 0.04 | $ 0.05 | $ 0.05 | $ 0.04 |
| (g) | The Fund received proceeds from regulatory settlements. Had the Fund not received these proceeds, the total return would have been lower by 0.39%. |
| (h) | The Fund received a payment from an affiliate. Had the Fund not received this payment, the total return would have been lower by 0.05%. |
The accompanying Notes to Financial Statements are an integral part of this statement.
| 20 | Columbia Small Cap Growth Fund I | Annual Report 2018 |
Financial Highlights (continued)
| | Reimbursement
from affiliate | Proceeds from
regulatory
settlements | Net
asset
value,
end of
period | Total
return | Total gross
expense
ratio to
average
net assets(a) | Total net
expense
ratio to
average
net assets(a),(b) | Net investment
income (loss)
ratio to
average
net assets | Portfolio
turnover | Net
assets,
end of
period
(000’s) |
| Class R |
| Year Ended 8/31/2018 | — | — | $21.57 | 33.26% | 1.60% (c) | 1.59% (c),(d) | (1.04%) | 156% | $1,651 |
| Year Ended 8/31/2017 | — | — | $19.10 | 22.10% | 1.64% (e) | 1.59% (d),(e) | (0.99%) | 174% | $1,387 |
| Year Ended 8/31/2016 | — | — | $17.00 | 2.61% | 1.66% (c) | 1.62% (c),(d) | (0.88%) | 142% | $1,356 |
| Year Ended 8/31/2015 | — | 0.11 | $26.99 | 11.63% (g) | 1.61% | 1.61% (d) | (1.22%) | 117% | $1,706 |
| Year Ended 8/31/2014 | — | — | $29.25 | 3.08% | 1.55% (c) | 1.55% (c),(d) | (1.13%) | 148% | $2,500 |
The accompanying Notes to Financial Statements are an integral part of this statement.
Columbia Small Cap Growth Fund I | Annual Report 2018
| 21 |
Notes to Financial Statements
August 31, 2018
Note 1. Organization
Columbia Small Cap Growth Fund I (the Fund), a series of Columbia Funds Series Trust I (the Trust), is a diversified fund. The Trust is registered under the Investment Company Act of 1940, as amended (the 1940 Act), as an open-end management investment company organized as a Massachusetts business trust.
Fund shares
The Trust may issue an unlimited number of shares (without par value). Although all share classes generally have identical voting, dividend and liquidation rights, each share class votes separately when required by the Trust’s organizational documents or by law. Different share classes pay different distribution amounts to the extent the expenses of such share classes differ, and distributions in liquidation will be proportional to the net asset value of each share class. Each share class has its own expense and sales charge structure. The Fund offers each of the share classes identified below.
Class A shares are subject to a maximum front-end sales charge of 5.75% based on the initial investment amount. Class A shares purchased without an initial sales charge in accounts aggregating $1 million to $50 million at the time of purchase are subject to a contingent deferred sales charge (CDSC) if the shares are sold within 18 months after purchase, charged as follows: 1.00% CDSC if redeemed within 12 months after purchase, and 0.50% CDSC if redeemed more than 12, but less than 18, months after purchase.
Advisor Class shares are not subject to sales charges and are generally available only to omnibus retirement plans and certain investors as described in the Fund’s prospectus. Prior to November 1, 2017, Advisor Class shares were known as Class R4 shares.
Class C shares are subject to a 1.00% CDSC on shares redeemed within 12 months after purchase. Effective July 1, 2018, Class C shares will automatically convert to Class A shares of the same Fund in the month of or the month following the 10-year anniversary of the Class C shares purchase date.
Institutional Class shares are not subject to sales charges and are generally available only to eligible investors, which are subject to different investment minimums as described in the Fund’s prospectus. Prior to November 1, 2017, Institutional Class shares were known as Class Z shares.
Institutional 2 Class shares are not subject to sales charges and are generally available only to investors purchasing through authorized investment professionals and omnibus retirement plans as described in the Fund’s prospectus. Prior to November 1, 2017, Institutional 2 Class shares were known as Class R5 shares.
Institutional 3 Class shares are not subject to sales charges and are available to institutional and certain other investors as described in the Fund’s prospectus. Prior to November 1, 2017, Institutional 3 Class shares were known as Class Y shares.
The Fund no longer accepts investments by existing investors in Class K shares. When available, Class K shares were not subject to sales charges and were made available only to existing investors in Class K shares. On March 9, 2018, Class K shares were redeemed or exchanged for Advisor Class shares of the Fund in a tax free transaction that had no impact on fees and expenses paid by the shareholders.
Class R shares are not subject to sales charges and are generally available only to certain retirement plans and other investors as described in the Fund’s prospectus.
Note 2. Summary of significant accounting policies
Basis of preparation
The Fund is an investment company that applies the accounting and reporting guidance in the Financial Accounting Standards Board (FASB) Accounting Standards Codification Topic 946, Financial Services - Investment Companies (ASC 946). The financial statements are prepared in accordance with U.S. generally accepted accounting principles (GAAP), which requires management to make certain estimates and assumptions that affect the reported amounts of assets and liabilities, the disclosure of contingent assets and liabilities at the date of the financial statements and the reported amounts of income and expenses during the reporting period. Actual results could differ from those estimates.
| 22 | Columbia Small Cap Growth Fund I | Annual Report 2018 |
Notes to Financial Statements (continued)
August 31, 2018
The following is a summary of significant accounting policies followed by the Fund in the preparation of its financial statements.
Security valuation
All equity securities are valued at the close of business of the New York Stock Exchange. Equity securities are valued at the last quoted sales price on the principal exchange or market on which they trade, except for securities traded on the NASDAQ Stock Market, which are valued at the NASDAQ official close price. Unlisted securities or listed securities for which there were no sales during the day are valued at the mean of the latest quoted bid and ask prices on such exchanges or markets.
Foreign equity securities are valued based on the closing price on the foreign exchange in which such securities are primarily traded. If any foreign equity security closing prices are not readily available, the securities are valued at the mean of the latest quoted bid and ask prices on such exchanges or markets. Foreign currency exchange rates are generally determined at 4:00 p.m. Eastern (U.S.) time. Many securities markets and exchanges outside the U.S. close prior to the close of the New York Stock Exchange; therefore, the closing prices for securities in such markets or on such exchanges may not fully reflect events that occur after such close but before the close of the New York Stock Exchange. In those situations, foreign securities will be fair valued pursuant to a policy adopted by the Board of Trustees, including, if available, utilizing a third party pricing service to determine these fair values. The third party pricing service takes into account multiple factors, including, but not limited to, movements in the U.S. securities markets, certain depositary receipts, futures contracts and foreign exchange rates that have occurred subsequent to the close of the foreign exchange or market, to determine a good faith estimate that reasonably reflects the current market conditions as of the close of the New York Stock Exchange. The fair value of a security is likely to be different from the quoted or published price, if available.
Investments in open-end investment companies, including money market funds, are valued at their latest net asset value.
Investments for which market quotations are not readily available, or that have quotations which management believes are not reflective of market value or reliable, are valued at fair value as determined in good faith under procedures approved by and under the general supervision of the Board of Trustees. If a security or class of securities (such as foreign securities) is valued at fair value, such value is likely to be different from the quoted or published price for the security.
The determination of fair value often requires significant judgment. To determine fair value, management may use assumptions including but not limited to future cash flows and estimated risk premiums. Multiple inputs from various sources may be used to determine fair value.
GAAP requires disclosure regarding the inputs and valuation techniques used to measure fair value and any changes in valuation inputs or techniques. In addition, investments shall be disclosed by major category. This information is disclosed following the Fund’s Portfolio of Investments.
Foreign currency transactions and translations
The values of all assets and liabilities denominated in foreign currencies are generally translated into U.S. dollars at exchange rates determined at the close of regular trading on the New York Stock Exchange. Net realized and unrealized gains (losses) on foreign currency transactions and translations include gains (losses) arising from the fluctuation in exchange rates between trade and settlement dates on securities transactions, gains (losses) arising from the disposition of foreign currency and currency gains (losses) between the accrual and payment dates on dividends, interest income and foreign withholding taxes.
For financial statement purposes, the Fund does not distinguish that portion of gains (losses) on investments which is due to changes in foreign exchange rates from that which is due to changes in market prices of the investments. Such fluctuations are included with the net realized and unrealized gains (losses) on investments in the Statement of Operations.
Security transactions
Security transactions are accounted for on the trade date. Cost is determined and gains (losses) are based upon the specific identification method for both financial statement and federal income tax purposes.
Columbia Small Cap Growth Fund I | Annual Report 2018
| 23 |
Notes to Financial Statements (continued)
August 31, 2018
Income recognition
Interest income is recorded on an accrual basis. Market premiums and discounts, including original issue discounts, are amortized and accreted, respectively, over the expected life of the security on all debt securities, unless otherwise noted.
The Fund may place a debt security on non-accrual status and reduce related interest income when it becomes probable that the interest will not be collected and the amount of uncollectible interest can be reasonably estimated. A defaulted debt security is removed from non-accrual status when the issuer resumes interest payments or when collectibility of interest is reasonably assured.
Corporate actions and dividend income are generally recorded net of any non-reclaimable tax withholdings, on the ex-dividend date or upon receipt of ex-dividend notification in the case of certain foreign securities.
The Fund may receive distributions from holdings in equity securities, business development companies (BDCs), exchange-traded funds (ETFs), limited partnerships (LPs), other regulated investment companies (RICs), and real estate investment trusts (REITs), which report information on the tax character of their distributions annually. These distributions are allocated to dividend income, capital gain and return of capital based on actual information reported. Return of capital is recorded as a reduction of the cost basis of securities held. If the Fund no longer owns the applicable securities, return of capital is recorded as a realized gain. With respect to REITs, to the extent actual information has not yet been reported, estimates for return of capital are made by the Fund’s management. Management’s estimates are subsequently adjusted when the actual character of the distributions is disclosed by the REITs, which could result in a proportionate change in return of capital to shareholders.
Awards from class action litigation are recorded as a reduction of cost basis if the Fund still owns the applicable securities on the payment date. If the Fund no longer owns the applicable securities, the proceeds are recorded as realized gains.
Expenses
General expenses of the Trust are allocated to the Fund and other funds of the Trust based upon relative net assets or other expense allocation methodologies determined by the nature of the expense. Expenses directly attributable to the Fund are charged to the Fund. Expenses directly attributable to a specific class of shares are charged to that share class.
Determination of class net asset value
All income, expenses (other than class-specific expenses, which are charged to that share class, as shown in the Statement of Operations) and realized and unrealized gains (losses) are allocated to each class of the Fund on a daily basis, based on the relative net assets of each class, for purposes of determining the net asset value of each class.
Federal income tax status
The Fund intends to qualify each year as a regulated investment company under Subchapter M of the Internal Revenue Code, as amended, and will distribute substantially all of its investment company taxable income and net capital gain, if any, for its tax year, and as such will not be subject to federal income taxes. In addition, the Fund intends to distribute in each calendar year substantially all of its ordinary income, capital gain net income and certain other amounts, if any, such that the Fund should not be subject to federal excise tax. Therefore, no federal income or excise tax provision is recorded.
Distributions to shareholders
Distributions from net investment income, if any, are declared and paid annually. Net realized capital gains, if any, are distributed at least annually. Income distributions and capital gain distributions are determined in accordance with federal income tax regulations, which may differ from GAAP.
| 24 | Columbia Small Cap Growth Fund I | Annual Report 2018 |
Notes to Financial Statements (continued)
August 31, 2018
Guarantees and indemnifications
Under the Trust’s organizational documents and, in some cases, by contract, its officers and trustees are indemnified against certain liabilities arising out of the performance of their duties to the Trust or its funds. In addition, certain of the Fund’s contracts with its service providers contain general indemnification clauses. The Fund’s maximum exposure under these arrangements is unknown since the amount of any future claims that may be made against the Fund cannot be determined, and the Fund has no historical basis for predicting the likelihood of any such claims.
Recent accounting pronouncement
Accounting Standards Update 2017-08 Premium Amortization on Purchased Callable Debt Securities
In March 2017, the Financial Accounting Standards Board issued Accounting Standards Update (ASU) No. 2017-08 Premium Amortization on Purchased Callable Debt Securities. ASU No. 2017-08 updates the accounting standards to shorten the amortization period for certain purchased callable debt securities, held at a premium, to be amortized to the earliest call date. The update applies to securities with explicit, noncontingent call features that are callable at fixed prices and on preset dates. The standard is effective for annual periods beginning after December 15, 2018 and interim periods within those fiscal years. At this time, management is evaluating the implication of this guidance and the impact it will have on the financial statement amounts and footnote disclosures, if any.
Note 3. Fees and other transactions with affiliates
Management services fees
The Fund has entered into a Management Agreement with Columbia Management Investment Advisers, LLC (the Investment Manager), a wholly-owned subsidiary of Ameriprise Financial, Inc. (Ameriprise Financial). Under the Management Agreement, the Investment Manager provides the Fund with investment research and advice, as well as administrative and accounting services. The management services fee is an annual fee that is equal to a percentage of the Fund’s daily net assets that declines from 0.87% to 0.75% as the Fund’s net assets increase. The effective management services fee rate for the year ended August 31, 2018 was 0.87% of the Fund’s average daily net assets.
Compensation of board members
Members of the Board of Trustees who are not officers or employees of the Investment Manager or Ameriprise Financial are compensated for their services to the Fund as disclosed in the Statement of Operations. These members of the Board of Trustees may participate in a Deferred Compensation Plan (the Plan) which may be terminated at any time. Obligations of the Plan will be paid solely out of the Fund’s assets, and all amounts payable under the Plan constitute a general unsecured obligation of the Fund.
Compensation of Chief Compliance Officer
The Board of Trustees has appointed a Chief Compliance Officer to the Fund in accordance with federal securities regulations. As disclosed in the Statement of Operations, a portion of the Chief Compliance Officer’s total compensation is allocated to the Fund, along with other allocations to affiliated funds governed by the Board of Trustees, based on relative net assets.
Transfer agency fees
Under a Transfer and Dividend Disbursing Agent Agreement, Columbia Management Investment Services Corp. (the Transfer Agent), an affiliate of the Investment Manager and a wholly-owned subsidiary of Ameriprise Financial, is responsible for providing transfer agency services to the Fund. The Transfer Agent has contracted with DST Asset Manager Solutions, Inc. (DST) to serve as sub-transfer agent. The Transfer Agent pays the fees of DST for services as sub-transfer agent and DST is not entitled to reimbursement for such fees from the Fund (with the exception of out-of-pocket fees).
Columbia Small Cap Growth Fund I | Annual Report 2018
| 25 |
Notes to Financial Statements (continued)
August 31, 2018
The Fund pays the Transfer Agent a monthly transfer agency fee based on the number or the average value of accounts, depending on the type of account. In addition, the Fund pays the Transfer Agent a fee for shareholder services based on the number of accounts or on a percentage of the average aggregate value of the Fund’s shares maintained in omnibus accounts up to the lesser of the amount charged by the financial intermediary or a cap established by the Board of Trustees from time to time.
The Transfer Agent also receives compensation from the Fund for various shareholder services and reimbursements for certain out-of-pocket fees. Total transfer agency fees for Class K, Institutional 2 Class and Institutional 3 Class shares are subject to an annual limitation of not more than 0.07%, 0.07% and 0.02%, respectively, of the average daily net assets attributable to each share class.
For the year ended August 31, 2018, the Fund’s effective transfer agency fee rates as a percentage of average daily net assets of each class were as follows:
| | Effective rate (%) |
| Class A | 0.17 |
| Advisor Class | 0.17 |
| Class C | 0.17 |
| Institutional Class | 0.17 |
| Institutional 2 Class | 0.06 |
| Institutional 3 Class | 0.01 |
| Class K | 0.03 (a) |
| Class R | 0.17 |
The Fund and certain other associated investment companies have severally, but not jointly, guaranteed the performance and observance of all the terms and conditions of a lease entered into by Seligman Data Corp. (SDC), the former transfer agent, including the payment of rent by SDC (the Guaranty). SDC was the legacy Seligman funds’ former transfer agent.
The lease and the Guaranty expire in January 2019. At August 31, 2018, the Fund’s total potential future obligation over the life of the Guaranty is $3,515. The liability remaining at August 31, 2018 for non-recurring charges associated with the lease amounted to $1,943 and is recorded as a part of the payable for other expenses in the Statement of Assets and Liabilities.
An annual minimum account balance fee of $20 may apply to certain accounts with a value below the applicable share class’s initial minimum investment requirements to reduce the impact of small accounts on transfer agency fees. These minimum account balance fees are remitted to the Fund and recorded as part of expense reductions in the Statement of Operations. For the year ended August 31, 2018, these minimum account balance fees reduced total expenses of the Fund by $5,500.
Plan administration fees
Under a Plan Administration Services Agreement with the Transfer Agent, the Fund paid an annual fee at a rate of 0.25% of the Fund’s average daily net assets attributable to Class K shares for the provision of various administrative, recordkeeping, communication and educational services. As a result of all Class K shares of the Fund being redeemed or exchanged for Advisor Class shares, March 9, 2018 was the last day the Fund paid a plan administration fee for Class K shares.
Distribution and service fees
The Fund has entered into an agreement with Columbia Management Investment Distributors, Inc. (the Distributor), an affiliate of the Investment Manager and a wholly-owned subsidiary of Ameriprise Financial, for distribution and shareholder services. The Board of Trustees has approved, and the Fund has adopted, distribution and shareholder service plans (the Plans) applicable to certain share classes, which set the distribution and service fees for the Fund. These fees are calculated daily and are intended to compensate the Distributor and/or eligible selling and/or servicing agents for selling shares of the Fund and providing services to investors.
| 26 | Columbia Small Cap Growth Fund I | Annual Report 2018 |
Notes to Financial Statements (continued)
August 31, 2018
Under the Plans, the Fund pays a monthly service fee to the Distributor at the maximum annual rate of 0.25% of the average daily net assets attributable to Class A and Class C shares of the Fund. Also under the Plans, the Fund pays a monthly distribution fee to the Distributor at the maximum annual rates of 0.10%, 0.75% and 0.50% of the average daily net assets attributable to Class A, Class C and Class R shares of the Fund, respectively.
Although the Fund may pay distribution and service fees up to a maximum annual rate of 0.35% of the Fund’s average daily net assets attributable to Class A shares (comprised of up to 0.10% for distribution services and up to 0.25% for shareholder liaison services), the Fund currently limits such fees to an aggregate fee of not more than 0.25% of the Fund’s average daily net assets attributable to Class A shares.
Sales charges (unaudited)
Sales charges, including front-end charges and CDSCs, received by the Distributor for distributing Fund shares for the year ended August 31, 2018, if any, are listed below:
| | Amount ($) |
| Class A | 146,256 |
| Class C | 1,420 |
Expenses waived/reimbursed by the Investment Manager and its affiliates
The Investment Manager and certain of its affiliates have contractually agreed to waive fees and/or reimburse expenses (excluding certain fees and expenses described below) for the period(s) disclosed below, unless sooner terminated at the sole discretion of the Board of Trustees, so that the Fund’s net operating expenses, after giving effect to fees waived/expenses reimbursed and any balance credits and/or overdraft charges from the Fund’s custodian, do not exceed the following annual rate(s) as a percentage of the class’ average daily net assets:
| | January 1, 2018
through
December 31, 2018 | Prior to
January 1, 2018 |
| Class A | 1.35% | 1.35% |
| Advisor Class | 1.10 | 1.10 |
| Class C | 2.10 | 2.10 |
| Institutional Class | 1.10 | 1.10 |
| Institutional 2 Class | 0.98 | 1.015 |
| Institutional 3 Class | 0.93 | 0.965 |
| Class R | 1.60 | 1.60 |
Under the agreement governing these fee waivers and/or expense reimbursement arrangements, the following fees and expenses are excluded from the waiver/reimbursement commitment, and therefore will be paid by the Fund, if applicable: taxes (including foreign transaction taxes), expenses associated with investments in affiliated and non-affiliated pooled investment vehicles (including mutual funds and exchange-traded funds), transaction costs and brokerage commissions, costs related to any securities lending program, dividend expenses associated with securities sold short, inverse floater program fees and expenses, transaction charges and interest on borrowed money, interest, infrequent and/or unusual expenses and any other expenses the exclusion of which is specifically approved by the Board of Trustees. This agreement may be modified or amended only with approval from the Investment Manager, certain of its affiliates and the Fund. In addition to the contractual agreement, the Investment Manager and certain of its affiliates have voluntarily agreed to waive fees and/or reimburse Fund expenses (excluding certain fees and expenses described above) so that Fund level expenses (expenses directly attributable to the Fund and not to a specific share class) are waived proportionately across all share classes, but the Fund’s net operating expenses shall not exceed the contractual annual rates listed in the table above. This arrangement may be revised or discontinued at any time. Any fees waived and/or expenses reimbursed under the expense reimbursement arrangements described above are not recoverable by the Investment Manager or its affiliates in future periods.
Columbia Small Cap Growth Fund I | Annual Report 2018
| 27 |
Notes to Financial Statements (continued)
August 31, 2018
Note 4. Federal tax information
The timing and character of income and capital gain distributions are determined in accordance with income tax regulations, which may differ from GAAP because of temporary or permanent book to tax differences.
At August 31, 2018, these differences were primarily due to differing treatment for deferral/reversal of wash sale losses, passive foreign investment company (PFIC) holdings, re-characterization of distributions for investments, trustees’ deferred compensation, foreign currency transactions and net operating loss reclassification. To the extent these differences were permanent, reclassifications were made among the components of the Fund’s net assets in the Statement of Assets and Liabilities. Temporary differences do not require reclassifications.
In the Statement of Assets and Liabilities the following reclassifications were made:
Excess of distributions
over net investment
income ($) | Accumulated
net realized
gain ($) | Paid in
capital ($) |
| 2,630,525 | (2,630,525) | — |
Net investment income (loss) and net realized gains (losses), as disclosed in the Statement of Operations, and net assets were not affected by this reclassification.
The tax character of distributions paid during the years indicated was as follows:
| Year Ended August 31, 2018 | Year Ended August 31, 2017 |
Ordinary
income ($) | Long-term
capital gains ($) | Total ($) | Ordinary
income ($) | Long-term
capital gains ($) | Total ($) |
| 47,718,358 | 21,273,825 | 68,992,183 | 4,084,543 | 28,490,797 | 32,575,340 |
Short-term capital gain distributions, if any, are considered ordinary income distributions for tax purposes.
At August 31, 2018, the components of distributable earnings on a tax basis were as follows:
Undistributed
ordinary income ($) | Undistributed
long-term
capital gains ($) | Capital loss
carryforwards ($) | Net unrealized
appreciation ($) |
| 33,432,962 | 28,410,955 | — | 125,935,491 |
At August 31, 2018, the cost of all investments for federal income tax purposes along with the aggregate gross unrealized appreciation and depreciation based on that cost was:
Federal
tax cost ($) | Gross unrealized
appreciation ($) | Gross unrealized
(depreciation) ($) | Net unrealized
appreciation ($) |
| 457,330,174 | 134,299,082 | (8,363,591) | 125,935,491 |
Tax cost of investments and unrealized appreciation/(depreciation) may also include timing differences that do not constitute adjustments to tax basis.
Management of the Fund has concluded that there are no significant uncertain tax positions in the Fund that would require recognition in the financial statements. However, management’s conclusion may be subject to review and adjustment at a later date based on factors including, but not limited to, new tax laws, regulations, and administrative interpretations (including relevant court decisions). Generally, the Fund’s federal tax returns for the prior three fiscal years remain subject to examination by the Internal Revenue Service.
Note 5. Portfolio information
The cost of purchases and proceeds from sales of securities, excluding short-term investments and derivatives, if any, aggregated to $751,828,216 and $749,247,432, respectively, for the year ended August 31, 2018. The amount of purchase and sale activity impacts the portfolio turnover rate reported in the Financial Highlights.
| 28 | Columbia Small Cap Growth Fund I | Annual Report 2018 |
Notes to Financial Statements (continued)
August 31, 2018
Note 6. Affiliated money market fund
The Fund invests in Columbia Short-Term Cash Fund, an affiliated money market fund established for the exclusive use by the Fund and other affiliated funds (the Affiliated MMF). The income earned by the Fund from such investments is included as Dividends - affiliated issuers in the Statement of Operations. As an investing fund, the Fund indirectly bears its proportionate share of the expenses of the Affiliated MMF. The Affiliated MMF prices its shares with a floating net asset value. In addition, the Board of Trustees of the Affiliated MMF may impose a fee on redemptions (sometimes referred to as a liquidity fee) or temporarily suspend redemptions (sometimes referred to as imposing a redemption gate) in the event its liquidity falls below regulatory limits.
Note 7. Interfund lending
Pursuant to an exemptive order granted by the Securities and Exchange Commission, the Fund participates in a program (the Interfund Program) allowing each participating Columbia Fund (each, a Participating Fund) to lend money directly to and, except for closed-end funds and money market funds, borrow money directly from other Participating Funds for temporary purposes. The amounts eligible for borrowing and lending under the Interfund Program are subject to certain restrictions.
Interfund loans are subject to the risk that the borrowing fund could be unable to repay the loan when due, and a delay in repayment to the lending fund could result in lost opportunities and/or additional lending costs. The exemptive order is subject to conditions intended to mitigate conflicts of interest arising from the Investment Manager’s relationship with each Participating Fund.
The Fund did not borrow or lend money under the Interfund Program during the year ended August 31, 2018.
Note 8. Line of credit
The Fund has access to a revolving credit facility with a syndicate of banks led by Citibank, N.A., HSBC Bank USA, N.A. and JPMorgan Chase Bank, N.A. whereby the Fund may borrow for the temporary funding of shareholder redemptions or for other temporary or emergency purposes. The credit facility, which is a collective agreement between the Fund and certain other funds managed by the Investment Manager, severally and not jointly, permits collective borrowings up to $1 billion. Interest is charged to each participating fund based on its borrowings at a rate equal to the higher of (i) the overnight federal funds rate plus 1.00% or (ii) the one-month LIBOR rate plus 1.00%. Each borrowing under the credit facility matures no later than 60 days after the date of borrowing. The Fund also pays a commitment fee equal to its pro rata share of the amount of the credit facility at a rate of 0.15% per annum. The commitment fee is included in other expenses in the Statement of Operations. This agreement expires annually in December unless extended or renewed.
For the year ended August 31, 2018, the Fund’s borrowing activity was as follows:
Average loan
balance ($) | Weighted average
interest rate (%) | Days
outstanding |
| 1,700,000 | 2.44 | 3 |
Interest expense incurred by the Fund is recorded as a line of credit interest expense in the Statement of Operations. The Fund had no outstanding borrowings at August 31, 2018.
Note 9. Significant risks
Consumer discretionary sector risk
The Fund may be more susceptible to the particular risks that may affect companies in the consumer discretionary sector than if it were invested in a wider variety of companies in unrelated sectors. Companies in the consumer discretionary sector are subject to certain risks, including fluctuations in the performance of the overall domestic and international economy, interest rate changes, increased competition and consumer confidence. Performance of such companies may be affected by factors including reduced disposable household income, reduced consumer spending, changing demographics and consumer tastes.
Columbia Small Cap Growth Fund I | Annual Report 2018
| 29 |
Notes to Financial Statements (continued)
August 31, 2018
Health care sector risk
The Fund may be more susceptible to the particular risks that may affect companies in the health care sector than if it were invested in a wider variety of companies in unrelated sectors. Companies in the health care sector are subject to certain risks, including restrictions on government reimbursement for medical expenses, government approval of medical products and services, competitive pricing pressures, and the rising cost of medical products and services (especially for companies dependent upon a relatively limited number of products or services). Performance of such companies may be affected by factors including, government regulation, obtaining and protecting patents (or the failure to do so), product liability and other similar litigation as well as product obsolescence.
Shareholder concentration risk
At August 31, 2018, affiliated shareholders of record owned 18.2% of the outstanding shares of the Fund in one or more accounts. Subscription and redemption activity by concentrated accounts may have a significant effect on the operations of the Fund. In the case of a large redemption, the Fund may be forced to sell investments at inopportune times, including its liquid positions, which may result in Fund losses and the Fund holding a higher percentage of less liquid positions. Large redemptions could result in decreased economies of scale and increased operating expenses for non-redeeming Fund shareholders.
Technology and technology-related investment risk
The Fund may be more susceptible to the particular risks that may affect companies in the information technology sector, as well as other technology-related sectors (collectively, the technology sectors) than if it were invested in a wider variety of companies in unrelated sectors. Companies in the technology sectors are subject to certain risks, including the risk that new services, equipment or technologies will not be accepted by consumers and businesses or will become rapidly obsolete. Performance of such companies may be affected by factors including obtaining and protecting patents (or the failure to do so) and significant competitive pressures, including aggressive pricing of their products or services, new market entrants, competition for market share and short product cycles due to an accelerated rate of technological developments. Such competitive pressures may lead to limited earnings and/or falling profit margins. As a result, the value of their securities may fall or fail to rise. In addition, many technology sector companies have limited operating histories and prices of these companies’ securities historically have been more volatile than other securities, especially over the short term.
Note 10. Subsequent events
Management has evaluated the events and transactions that have occurred through the date the financial statements were issued and noted no items requiring adjustment of the financial statements or additional disclosure.
Note 11. Information regarding pending and settled legal proceedings
Ameriprise Financial and certain of its affiliates have historically been involved in a number of legal, arbitration and regulatory proceedings, including routine litigation, class actions, and governmental actions, concerning matters arising in connection with the conduct of their business activities. Ameriprise Financial believes that the Fund is not currently the subject of, and that neither Ameriprise Financial nor any of its affiliates are the subject of, any pending legal, arbitration or regulatory proceedings that are likely to have a material adverse effect on the Fund or the ability of Ameriprise Financial or its affiliates to perform under their contracts with the Fund. Ameriprise Financial is required to make quarterly (10-Q), annual (10-K) and, as necessary, 8-K filings with the Securities and Exchange Commission (SEC) on legal and regulatory matters that relate to Ameriprise Financial and its affiliates. Copies of these filings may be obtained by accessing the SEC website at www.sec.gov.
There can be no assurance that these matters, or the adverse publicity associated with them, will not result in increased Fund redemptions, reduced sale of Fund shares or other adverse consequences to the Fund. Further, although we believe proceedings are not likely to have a material adverse effect on the Fund or the ability of Ameriprise Financial or its affiliates to perform under their contracts with the Fund, these proceedings are subject to uncertainties and, as such, we are unable to estimate the possible loss or range of loss that may result. An adverse outcome in one or more of these proceedings could result in adverse judgments, settlements, fines, penalties or other relief that could have a material adverse effect on the consolidated financial condition or results of operations of Ameriprise Financial.
| 30 | Columbia Small Cap Growth Fund I | Annual Report 2018 |
Report of Independent Registered Public Accounting Firm
To the Board of Trustees of Columbia Funds Series Trust I and Shareholders of Columbia Small Cap Growth Fund I
Opinion on the Financial Statements
We have audited the accompanying statement of assets and liabilities, including the portfolio of investments, of Columbia Small Cap Growth Fund I (one of the funds constituting Columbia Funds Series Trust I, hereafter referred to as the “Fund”) as of August 31, 2018, the related statement of operations for the year ended August 31, 2018, the statement of changes in net assets for each of the two years in the period ended August 31, 2018, including the related notes, and the financial highlights for each of the five years in the period ended August 31, 2018, (collectively referred to as the “financial statements”). In our opinion, the financial statements present fairly, in all material respects, the financial position of the Fund as of August 31, 2018, the results of its operations for the year then ended, the changes in its net assets for each of the two years in the period ended August 31, 2018 and the financial highlights for each of the five years in the period ended August 31, 2018 in conformity with accounting principles generally accepted in the United States of America.
Basis for Opinion
These financial statements are the responsibility of the Fund’s management. Our responsibility is to express an opinion on the Fund’s financial statements based on our audits. We are a public accounting firm registered with the Public Company Accounting Oversight Board (United States) (“PCAOB”) and are required to be independent with respect to the Fund in accordance with the U.S. federal securities laws and the applicable rules and regulations of the Securities and Exchange Commission and the PCAOB.
We conducted our audits of these financial statements in accordance with the standards of the PCAOB. Those standards require that we plan and perform the audit to obtain reasonable assurance about whether the financial statements are free of material misstatement, whether due to error or fraud.
Our audits included performing procedures to assess the risks of material misstatement of the financial statements, whether due to error or fraud, and performing procedures that respond to those risks. Such procedures included examining, on a test basis, evidence regarding the amounts and disclosures in the financial statements. Our audits also included evaluating the accounting principles used and significant estimates made by management, as well as evaluating the overall presentation of the financial statements. Our procedures included confirmation of securities owned as of August 31, 2018, by correspondence with the custodian, transfer agent and brokers; when replies were not received from brokers, we performed other audit procedures. We believe that our audits provide a reasonable basis for our opinion.
/s/PricewaterhouseCoopers LLP
Minneapolis, Minnesota
October 22, 2018
We have served as the auditor of one or more investment companies within the Columbia Funds Complex since 1977.
Columbia Small Cap Growth Fund I | Annual Report 2018
| 31 |
Federal Income Tax Information
(Unaudited)
The Fund hereby designates the following tax attributes for the fiscal year ended August 31, 2018. Shareholders will be notified in early 2019 of the amounts for use in preparing 2018 income tax returns.
Qualified
dividend
income | Dividends
received
deduction | Capital
gain
dividend |
| 3.97% | 3.91% | $36,793,229 |
Qualified dividend income. For taxable, non-corporate shareholders, the percentage of ordinary income distributed during the fiscal year that represents qualified dividend income subject to reduced tax rates.
Dividends received deduction. The percentage of ordinary income distributed during the fiscal year that qualifies for the corporate dividends received deduction.
Capital gain dividend. The Fund designates as a capital gain dividend the amount reflected above, or if subsequently determined to be different, the net capital gain of such fiscal period.
| 32 | Columbia Small Cap Growth Fund I | Annual Report 2018 |
Shareholders elect the Board that oversees the Fund’s operations. The Board appoints officers who are responsible for day-to-day business decisions based on policies set by the Board. The following table provides basic biographical information about the Fund’s Trustees, including their principal occupations during the past five years, although specific titles for individuals may have varied over the period. The year set forth beneath Length of Service in the table below is the year in which the Trustee was first appointed or elected as Trustee to any Fund currently in the Columbia Funds Complex or a predecessor thereof. Under current Board policy, members serve terms of indefinite duration.
Independent trustees
| Name, address, year of birth | Position held with the Trust and length of service | Principal occupation(s) during the past five years and other relevant professional experience | Number of Funds in the Columbia Fund Complex overseen | Other directorships held by Trustee during the past five years |
Janet Langford Carrig
c/o Columbia Management
Investment Advisers, LLC
225 Franklin Street
Mail Drop BX32 05228
Boston, MA 02110
1957 | Trustee
1996 | Senior Vice President, General Counsel and Corporate Secretary, ConocoPhillips (independent energy company) since September 2007 | 69 | None |
Douglas A. Hacker
c/o Columbia Management
Investment Advisers, LLC
225 Franklin Street
Mail Drop BX32 05228
Boston, MA 02110
1955 | Trustee and Chairman of the Board
1996 | Independent business executive since May 2006; Executive Vice President — Strategy of United Airlines from December 2002 to May 2006; President of UAL Loyalty Services (airline marketing company) from September 2001 to December 2002; Executive Vice President and Chief Financial Officer of United Airlines from July 1999 to September 2001 | 69 | Spartan Nash Company, (food distributor); Nash Finch Company (food distributor) from 2005 to 2013; Aircastle Limited (aircraft leasing); SeaCube Container Leasing Ltd. (container leasing) from 2010 to 2013; and Travelport Worldwide Limited (travel information technology) |
Nancy T. Lukitsh
c/o Columbia Management
Investment Advisers, LLC
225 Franklin Street
Mail Drop BX32 05228
Boston, MA 02110
1956 | Trustee
2011 | Senior Vice President, Partner and Director of Marketing, Wellington Management Company, LLP (investment adviser) from 1997 to 2010; Chair, Wellington Management Portfolios (commingled non-U.S. investment pools) from 2007 to 2010; Director, Wellington Trust Company, NA and other Wellington affiliates from 1997 to 2010 | 69 | None |
David M. Moffett
c/o Columbia Management
Investment Advisers, LLC
225 Franklin Street
Mail Drop BX32 05228
Boston, MA 02110
1952 | Trustee
2011 | Retired. Consultant to Bridgewater and Associates | 69 | Director, CSX Corporation (transportation suppliers); Genworth Financial, Inc. (financial and insurance products and services); PayPal Holdings Inc. (payment and data processing services); Trustee, University of Oklahoma Foundation; former Director, eBay Inc. (online trading community), 2007-2015; and former Director, CIT Bank, CIT Group Inc. (commercial and consumer finance), 2010-2016 |
Columbia Small Cap Growth Fund I | Annual Report 2018
| 33 |
TRUSTEES AND OFFICERS (continued)
Independent trustees (continued)
| Name, address, year of birth | Position held with the Trust and length of service | Principal occupation(s) during the past five years and other relevant professional experience | Number of Funds in the Columbia Fund Complex overseen | Other directorships held by Trustee during the past five years |
John J. Neuhauser
c/o Columbia Management
Investment Advisers, LLC
225 Franklin Street
Mail Drop BX32 05228
Boston, MA 02110
1943 | Trustee
1984 | President, Saint Michael’s College since August 2007; Director or Trustee of several non-profit organizations, including University of Vermont Medical Center; Academic Vice President and Dean of Faculties, Boston College from August 1999 to October 2005; University Professor, Boston College from November 2005 to August 2007 | 69 | Liberty All-Star Equity Fund and Liberty All- Star Growth Fund (closed-end funds) |
Patrick J. Simpson
c/o Columbia Management
Investment Advisers, LLC
225 Franklin Street
Mail Drop BX32 05228
Boston, MA 02110
1944 | Trustee
2000 | Of Counsel, Perkins Coie LLP (law firm) since 2015; Partner, Perkins Coie LLP from 1988 to 2014 | 69 | None |
Anne-Lee Verville
c/o Columbia Management
Investment Advisers, LLC
225 Franklin Street
Mail Drop BX32 05228
Boston, MA 02110
1945 | Trustee
1998 | Retired. General Manager, Global Education Industry from 1994 to 1997, President – Application Systems Division from 1991 to 1994, Chief Financial Officer – US Marketing & Services from 1988 to 1991, and Chief Information Officer from 1987 to 1988, IBM Corporation (computer and technology) | 69 | Enesco Group, Inc. (producer of giftware and home and garden decor products) from 2001 to 2006 |
Consultants to the Independent Trustees*
| Name, address, year of birth | Position held with the Trust and length of service | Principal occupation(s) during the past five years and other relevant professional experience | Number of Funds in the Columbia Funds complex overseen | Other directorships held by Trustee during the past five years |
J. Kevin Connaughton
c/o Columbia
Management Investment
Advisers, LLC,
225 Franklin Street
Mail Drop BX32 05228,
Boston, MA 02110
1964 | Independent Trustee Consultant
2016 | Independent Trustee Consultant, Columbia Funds since March 2016; Adjunct Professor of Finance, Bentley University since November 2017; Managing Director and General Manager of Mutual Fund Products, Columbia Management Investment Advisers, LLC from May 2010 to February 2015; President, Columbia Funds from 2009 to 2015; and senior officer of Columbia Funds and affiliated funds from 2003 to 2015 | 69 | Director, The Autism Project since March 2015; former Trustee, New Century Portfolios, March 2015-December 2017; formerly on Board of Governors, Gateway Healthcare, January 2016 – December 2017 |
Natalie A. Trunow
c/o Columbia
Management Investment
Advisers, LLC,
225 Franklin Street
Mail Drop BX32 05228,
Boston, MA 02110
1967 | Independent Trustee Consultant
2016 | Independent Trustee Consultant, Columbia Funds since September 2016; Chief Executive Officer, Millennial Portfolio Solutions LLC (asset management and consulting services) since January 2016; Director of Investments, Casey Family Programs from April 2016 to September 2016; Senior Vice President and Chief Investment Officer, Calvert Investments from August 2008 to January 2016; Section Head and Portfolio Manager, General Motors Asset Management from June 1997 to August 2008 | 69 | Director, Health Services for Children with Special Needs, Inc.; Director, Guidewell Financial Solutions |
| * | J. Kevin Connaughton was appointed consultant to the Independent Trustees effective March 1, 2016. Natalie A. Trunow was appointed consultant to the Independent Trustees effective September 1, 2016. Shareholders of the Funds are expected to be asked to elect each of Mr. Connaughton and Ms. Trunow as a Trustee at a future shareholder meeting. |
| 34 | Columbia Small Cap Growth Fund I | Annual Report 2018 |
TRUSTEES AND OFFICERS (continued)
Interested trustee affiliated with Investment Manager*
| Name, address, year of birth | Position held with the Trust and length of service | Principal occupation(s) during the past five years and other relevant professional experience | Number of Funds in the Columbia Funds Complex overseen | Other directorships held by Trustee during the past five years |
William F. Truscott
c/o Columbia Management
Investment Advisers, LLC
225 Franklin Street
Boston, MA 02110
1960 | Trustee
2012 | Chairman of the Board and President, Columbia Management Investment Advisers, LLC since May 2010 and February 2012, respectively; Chief Executive Officer, Global Asset Management, Ameriprise Financial, Inc. since September 2012 (previously Chief Executive Officer, U.S. Asset Management & President, Annuities, May 2010-September 2012); Director and Chief Executive Officer, Columbia Management Investment Distributors, Inc. since May 2010 and February 2012, respectively; Chairman of the Board and Chief Executive Officer, RiverSource Distributors, Inc. since 2006; Director, Threadneedle Asset Management Holdings, SARL since 2014; President and Chief Executive Officer, Ameriprise Certificate Company, 2006-August 2012 | 193 | Chairman of the Board, Columbia Management Investment Advisers, LLC since May 2010; Director, Columbia Management Investment Distributors, Inc. since May 2010; former Director, Ameriprise Certificate Company, 2006 - January 2013 |
| * | Interested person (as defined under the 1940 Act) by reason of being an officer, director, security holder and/or employee of the Investment Manager or Ameriprise Financial. |
The Statement of Additional Information has additional information about the Fund’s Board members and is available, without charge, upon request by calling 800.345.6611, visiting columbiathreadneedleus.com/investor/ or contacting your financial intermediary.
Columbia Small Cap Growth Fund I | Annual Report 2018
| 35 |
TRUSTEES AND OFFICERS (continued)
The Board has appointed officers who are responsible for day-to-day business decisions based on policies it has established. The officers serve at the pleasure of the Board. The following table provides basic information about the Officers of the Fund, including principal occupations during the past five years, although their specific titles may have varied over the period. In addition to Mr. Truscott, who is Senior Vice President, the Fund’s other officers are:
Fund officers
Name,
address and
year of birth | Position and year
first appointed to
position for any Fund
in the Columbia
Funds complex or a
predecessor thereof | Principal occupation(s) during past five years |
Christopher O. Petersen
5228 Ameriprise
Financial Center
Minneapolis, MN 55474
Born 1970 | President and Principal Executive Officer (2015) | Vice President and Lead Chief Counsel, Ameriprise Financial, Inc. since January 2015 (previously, Vice President and Chief Counsel, January 2010 - December 2014; officer of Columbia Funds and affiliated funds since 2007. |
Michael G. Clarke
225 Franklin Street
Boston, MA 02110
Born 1969 | Treasurer (2011), Chief Financial Officer (2009) and Chief Accounting Officer (2015) | Vice President — Mutual Fund Administration, Columbia Management Investment Advisers, LLC, since May 2010; senior officer of Columbia Funds and affiliated funds since 2002. |
Paul B. Goucher
100 Park Avenue
New York, NY 10017
Born 1968 | Senior Vice President (2011) and Assistant Secretary (2008) | Senior Vice President and Assistant General Counsel, Ameriprise Financial, Inc. since January 2017 (previously, Vice President and Lead Chief Counsel, November 2008 - January 2017 and January 2013 - January 2017, respectively); Vice President, Chief Legal Officer and Assistant Secretary, Columbia Management Investment Advisers, LLC since May 2010. |
Thomas P. McGuire
225 Franklin Street
Boston, MA 02110
Born 1972 | Senior Vice President and Chief Compliance Officer (2012) | Vice President — Asset Management Compliance, Ameriprise Financial, Inc., since May 2010; Chief Compliance Officer, Ameriprise Certificate Company since September 2010. |
Colin Moore
225 Franklin Street
Boston, MA 02110
Born 1958 | Senior Vice President (2010) | Executive Vice President and Global Chief Investment Officer, Ameriprise Financial, Inc., since July 2013; Executive Vice President and Global Chief Investment Officer, Columbia Management Investment Advisers, LLC since July 2013. |
Ryan C. Larrenaga
225 Franklin Street
Boston, MA 02110
Born 1970 | Senior Vice President (2017), Chief Legal Officer (2017) and Secretary (2015) | Vice President and Chief Counsel, Ameriprise Financial, Inc. since August 2018 (previously, Vice President and Group Counsel, August 2011 - August 2018); officer of Columbia Funds and affiliated funds since 2005. |
Michael E. DeFao
225 Franklin Street
Boston, MA 02110
Born 1968 | Vice President (2011) and Assistant Secretary (2010) | Vice President and Chief Counsel, Ameriprise Financial, Inc. since May 2010. |
Amy Johnson
5228 Ameriprise
Financial Center
Minneapolis, MN 55474
Born 1965 | Vice President (2006) | Managing Director and Global Head of Operations, Columbia Management Investment Advisers, LLC since April 2016 (previously Managing Director and Chief Operating Officer, 2010 - 2016). |
Lyn Kephart-Strong
5228 Ameriprise
Financial Center
Minneapolis, MN 55474
Born 1960 | Vice President (2015) | President, Columbia Management Investment Services Corp. since October 2014; Vice President & Resolution Officer, Ameriprise Trust Company since August 2009. |
| 36 | Columbia Small Cap Growth Fund I | Annual Report 2018 |
Board Consideration and Approval of Management
Agreement
On June 12, 2018, the Board of Trustees (the Board) and the Trustees who are not interested persons (as defined in the Investment Company Act of 1940) (the Independent Trustees) of Columbia Funds Series Trust I (the Trust) unanimously approved the continuation of the Management Agreement (the Management Agreement) with Columbia Management Investment Advisers, LLC (the Investment Manager) with respect to Columbia Small Cap Growth Fund I (the Fund), a series of the Trust. As detailed below, the Board’s Advisory Fees and Expenses Committee (the Committee) and the Board met on multiple occasions to review and discuss, among themselves, with the management team of the Investment Manager and with an independent fee consultant, materials provided by the Investment Manager, the independent fee consultant and others before determining to approve the continuation of the Management Agreement.
In connection with their deliberations regarding the continuation of the Management Agreement, the Committee and the Board evaluated materials requested from the Investment Manager regarding the Fund and the Management Agreement, and discussed these materials with representatives of the Investment Manager at Committee meetings held on March 6, 2018, April 26, 2018 and June 11, 2018 and at Board meetings held on March 7, 2018 and June 12, 2018. In addition, the Board and its various committees consider matters bearing on the Management Agreement at other meetings throughout the year and in prior years and meet regularly with senior management of the Trust and the Investment Manager. Through the Board’s Investment Oversight Committees, Trustees also meet with selected portfolio managers of the funds the Trustees oversee and with other investment personnel at various times throughout the year. The Committee and the Board also consulted with the independent fee consultant, Fund counsel and the Independent Trustees’ independent legal counsel, who advised on various matters with respect to the Committee’s and the Board’s considerations and otherwise assisted the Committee and the Board in their deliberations. On June 11, 2018, the Committee recommended that the Board approve the continuation of the Management Agreement. On June 12, 2018, the Board, including the Independent Trustees, voting separately, unanimously approved the continuation of the Management Agreement for the Fund.
The Committee and the Board considered all information that they, their legal counsel or the Investment Manager believed reasonably necessary to evaluate and to determine whether to recommend for approval or approve the continuation of the Management Agreement. The information and factors considered by the Committee and the Board in recommending for approval or approving the continuation of the Management Agreement for the Fund included the following:
| • | Information on the investment performance of the Fund relative to the performance of a group of mutual funds determined to be comparable to the Fund by an independent third-party data provider, as well as performance relative to benchmarks; |
| • | Information on the Fund’s management fees and total expenses, including information comparing the Fund’s expenses to those of a group of comparable mutual funds, as determined by the independent third-party data provider; |
| • | The Investment Manager’s agreement to contractually limit or cap total operating expenses for the Fund through December 31, 2019 so that total operating expenses (excluding certain fees and expenses, such as transaction costs and certain other investment related expenses, interest, taxes, acquired fund fees and expenses, and infrequent and/or unusual expenses) would not exceed a specified annual rate, as a percentage of the Fund’s net assets; |
| • | The terms and conditions of the Management Agreement; |
| • | The current and proposed terms and conditions of other agreements and arrangements with affiliates of the Investment Manager relating to the operations of the Fund, including agreements with respect to the provision of distribution, transfer agency and shareholder services to the Fund; |
| • | Descriptions of various functions performed by the Investment Manager under the Management Agreement, including portfolio management and portfolio trading practices; |
| • | Information regarding the management fees of similarly-managed portfolios of other clients of the Investment Manager, including institutional accounts and collective trusts; |
| • | Information regarding the reputation, regulatory history and resources of the Investment Manager, including information regarding senior management, portfolio managers and other personnel; |
Columbia Small Cap Growth Fund I | Annual Report 2018
| 37 |
Board Consideration and Approval of Management
Agreement (continued)
| • | Information regarding the capabilities of the Investment Manager with respect to compliance monitoring services, including an assessment of the Investment Manager’s compliance system by the Fund’s Chief Compliance Officer; and |
| • | The profitability to the Investment Manager and its affiliates from their relationships with the Fund. |
Nature, extent and quality of services provided under the Management Agreement
The Committee and the Board considered the nature, extent and quality of services provided to the Fund by the Investment Manager and its affiliates under the Management Agreement and under separate agreements for the provision of transfer agency and shareholder services, and the resources dedicated to the Fund and the other Columbia Funds by the Investment Manager and its affiliates. The Committee and the Board considered, among other things, the Investment Manager’s ability to attract, motivate and retain highly qualified research, advisory and supervisory investment professionals (including compensation programs for personnel involved in fund management, reputation and other attributes), the portfolio management services provided by those investment professionals, and the quality of the Investment Manager’s investment research capabilities and trade execution services. The Committee and the Board also considered the potential benefits to shareholders of investing in a mutual fund that is part of a fund complex offering exposure to a variety of asset classes and investment disciplines and providing a variety of fund and shareholder services.
The Committee and the Board also considered the professional experience and qualifications of the senior personnel of the Investment Manager, which included consideration of the Investment Manager’s experience with similarly-structured funds. The Committee and the Board noted the compliance programs of and the compliance-related resources provided to the Fund by the Investment Manager and its affiliates and the resources dedicated by the Investment Manager and its affiliates to risk management, and considered the Investment Manager’s ability to provide administrative services to the Fund and coordinate the activities of the Fund’s other service providers. After reviewing these and related factors, the Committee and the Board concluded, within the context of their overall conclusions, that the nature, extent and quality of the services provided to the Fund under the Management Agreement supported the continuation of the Management Agreement.
Investment performance
The Committee and the Board reviewed information about the performance of the Fund over various time periods, including performance information relative to benchmarks, information that compared the performance of the Fund to the performance of a group of comparable mutual funds as determined by the independent third-party data provider, and information and analysis provided by the independent fee consultant. The Committee and the Board also reviewed a description of the third party’s methodology for identifying the Fund’s peer groups for purposes of performance and expense comparisons.
The Committee and the Board noted that, through December 31, 2017, the Fund’s performance was in the twenty-first, ninth and thirty-ninth percentile (where the best performance would be in the first percentile) of its category selected by the independent third-party data provider for the purposes of performance comparisons for the one-, three- and five-year periods, respectively.
The Committee and the Board also considered the Investment Manager’s performance and reputation generally, the Investment Manager’s historical responsiveness to Board concerns about performance, and the Investment Manager’s willingness to take steps intended to improve performance. After reviewing these and related factors, the Committee and the Board concluded, within the context of their overall conclusions, that the performance of the Fund and the Investment Manager was sufficient, in light of other considerations, to support the continuation of the Management Agreement.
Investment management fee rates and other expenses
The Committee and the Board considered the management fees charged to the Fund under the Management Agreement as well as the total expenses incurred by the Fund. In assessing the reasonableness of the fees under the Management Agreement, the Committee and the Board considered, among other information, the Fund’s total expense ratio as a percentage of average daily net assets. The Committee and the Board considered data provided by the independent third-party data provider and the independent fee consultant. The Committee and the Board noted that, as of December 31, 2017, the Fund’s actual management fee and net total expense ratio were both ranked in the third quintile (where the lowest
| 38 | Columbia Small Cap Growth Fund I | Annual Report 2018 |
Board Consideration and Approval of Management
Agreement (continued)
fees and expenses would be in the first quintile) against the Fund’s expense universe as determined by the independent third-party data provider for purposes of expense comparison. The Committee and the Board also took into account the fee waiver and expense limitation arrangements agreed to by the Investment Manager, as noted above.
The Committee and the Board also received and considered information about the management fees charged by the Investment Manager to institutional accounts. In considering the fees charged to those accounts, the Committee and the Board took into account, among other things, the Investment Manager’s representations about the differences between managing mutual funds as compared to other types of accounts, including differences in the services provided, differences in the risk profile of such business for the Investment Manager and the additional resources required to manage mutual funds effectively. The Committee and the Board also received and considered information about the fees charged by the Investment Manager for sub-advisory services it provides to comparable unaffiliated funds. In evaluating the Fund’s management fees, the Committee and the Board also took into account the demands, complexity and quality of the investment management of the Fund.
After reviewing these and related factors, the Committee and the Board concluded, within the context of their overall conclusions, that the management fee rates and expenses of the Fund, in light of other considerations, supported the continuation of the Management Agreement.
Costs of services provided and profitability
The Committee and the Board also took note of the costs the Investment Manager and its affiliates incur in connection with the services provided and the profitability to the Investment Manager and its affiliates from their relationships with the Fund.
The Committee and the Board also considered the compensation directly or indirectly received by the Investment Manager’s affiliates in connection with their relationships with the Fund. The Committee and the Board reviewed information provided by management as to the profitability to the Investment Manager and its affiliates of their relationships with the Fund, information about the allocation of expenses used to calculate profitability, and comparisons of profitability levels realized in 2017 to profitability levels realized in 2016. When reviewing profitability, the Committee and the Board also considered court cases in which adviser profitability was an issue in whole or in part, the performance of similarly managed funds, the performance of the Fund, and the expense ratio of the Fund. In addition, the Committee and the Board considered information provided by the Investment Manager regarding the Investment Manager’s financial condition and comparing its profitability to that of other asset management firms that are, or are subsidiaries of, publicly traded companies. In this regard, the Committee and the Board also considered data provided by the independent fee consultant.
After reviewing these and related factors, the Committee and the Board concluded, within the context of their overall conclusions, that the costs of services provided and the profitability to the Investment Manager and its affiliates from their relationships with the Fund supported the continuation of the Management Agreement.
Economies of scale
The Committee and the Board considered the potential existence of economies of scale in the provision by the Investment Manager of services to the Fund, to groups of related funds, and to the Investment Manager’s investment advisory clients as a whole, and whether those economies of scale were shared with the Fund through breakpoints in investment management fees or other means, such as expense limitation arrangements and additional investments by the Investment Manager in investment, trading, compliance and other resources. The Committee and the Board noted that the management fee schedules for the Fund contained breakpoints that would reduce the fee rate on assets above specified threshold levels.
In considering these matters, the Committee and the Board also considered the costs of the services provided and the profitability to the Investment Manager and its affiliates from their relationships with the Fund, as noted above. After reviewing these and related factors, the Committee and the Board concluded, within the context of their overall conclusions, that the extent to which any economies of scale were expected to be shared with the Fund supported the continuation of the Management Agreement.
Columbia Small Cap Growth Fund I | Annual Report 2018
| 39 |
Board Consideration and Approval of Management
Agreement (continued)
Other benefits to the Investment Manager
The Committee and the Board received and considered information regarding “fall-out” or ancillary benefits received by the Investment Manager and its affiliates as a result of their relationships with the Fund, such as the engagement of the Investment Manager’s affiliates to provide distribution, transfer agency and shareholder services to the Fund. In this regard, among other matters, the Committee and the Board considered that the Fund’s distributor retains a portion of the distribution fees from the Fund and receives a portion of the sales charges on sales or redemptions of certain classes of shares of the Fund. The Committee and the Board also considered the benefits of research made available to the Investment Manager by reason of brokerage commissions generated by the Fund’s securities transactions, and reviewed information about the Investment Manager’s practices with respect to considering brokerage and research services when allocating portfolio transactions. In this connection, the Board also noted that the amount of research made available to the Investment Manager by reason of brokerage commissions had been declining over time, and may decline further. The Committee and the Board recognized that the Investment Manager’s profitability would be somewhat lower without these benefits.
Conclusion
The Committee and the Board reviewed all of the above considerations in reaching their decisions to recommend or approve the continuation of the Management Agreement. In their deliberations, the Trustees did not identify any particular information that was all-important or controlling, and individual Trustees may have attributed different weights to the various factors. Based on their evaluation of all factors that they deemed to be material, including those factors described above, and assisted by the advice of independent legal counsel, the Board, including the Independent Trustees, voting separately, unanimously approved the continuation of the Management Agreement.
| 40 | Columbia Small Cap Growth Fund I | Annual Report 2018 |
The Fund mails one shareholder report to each shareholder address. If you would like more than one report, please call shareholder services at 800.345.6611 and additional reports will be sent to you.
Proxy voting policies and procedures
The policy of the Board of Trustees is to vote the proxies of the companies in which the Fund holds investments consistent with the procedures as stated in the Statement of Additional Information (SAI). You may obtain a copy of the SAI without charge by calling 800.345.6611; contacting your financial intermediary; visiting columbiathreadneedleus.com/investor/; or searching the website of the Securities and Exchange Commission (SEC) at sec.gov. Information regarding how the Fund voted proxies relating to portfolio securities is filed with the SEC by August 31st for the most recent 12-month period ending June 30th of that year, and is available without charge by visiting columbiathreadneedleus.com/investor/, or searching the website of the SEC at sec.gov.
Quarterly schedule of investments
The Fund files a complete schedule of portfolio holdings with the SEC for the first and third quarters of each fiscal year on Form N-Q or Form N-PORT. The Fund’s Form N-Q or Form N-PORT is available on the SEC’s website at sec.gov and may be reviewed and copied at the SEC’s Public Reference Room in Washington, D.C. Information on the operation of the Public Reference Room may be obtained by calling 800.SEC.0330. The Fund’s complete schedule of portfolio holdings, as filed on Form N-Q or Form N-PORT, can also be obtained without charge, upon request, by calling 800.345.6611.
Additional Fund information
For more information about the Fund, please visit columbiathreadneedleus.com/investor/ or call 800.345.6611. Customer Service Representatives are available to answer your questions Monday through Friday from 8 a.m. to 7 p.m. Eastern time.
Fund investment manager
Columbia Management Investment Advisers, LLC
225 Franklin Street
Boston, MA 02110
Fund distributor
Columbia Management Investment Distributors, Inc.
225 Franklin Street
Boston, MA 02110
Fund transfer agent
Columbia Management Investment Services Corp.
Through October 31, 2018:
P.O. Box 8081
Boston, MA 02266-8081
Effective November 1, 2018:
P.O. Box 219104
Kansas City, MO 64121-9104
Columbia Small Cap Growth Fund I | Annual Report 2018
| 41 |
Columbia Small Cap Growth Fund I
Through October 31, 2018:
P.O. Box 8081
Boston, MA 02266-8081
Effective November 1, 2018:
P.O. Box 219104
Kansas City, MO 64121-9104
Please read and consider the investment objectives, risks, charges and expenses for any fund carefully before investing. For a prospectus and summary prospectus, which contains this and other important information about the Fund, go to
columbiathreadneedleus.com/investor/. The Fund is distributed by Columbia Management Investment Distributors, Inc., member FINRA, and managed by Columbia Management Investment Advisers, LLC.
Columbia Threadneedle Investments (Columbia Threadneedle) is the global brand name of the Columbia and Threadneedle group of companies. All rights reserved.
© 2018 Columbia Management Investment Advisers, LLC.
columbiathreadneedleus .com/investor/

Annual Report
August 31, 2018
Columbia Global Dividend Opportunity Fund
Not FDIC Insured • No bank guarantee • May lose value
Dear Shareholders,
Volatility exists in financial markets and this is not a comfortable fact of life. How investors deal with this reality, including how they react to short term spikes in volatility as well as to longer periods of increased or decreased volatility, may have a significant impact on their overall investing success.
Too often, investors change their investment strategy based on something that’s happening at a moment in time rather than thinking about how that change in strategy might affect their ability to achieve their longer-term financial goals. Emotion replaces logic and reasoning. Investors may sell in reaction to a market drop (fear or panic), locking in low returns which means they won’t be invested when the market returns, or they invest more at a market peak (greed or conviction), essentially when it is expensive to do so. In both cases, selling and buying at the exact wrong time.
We believe the best outcomes come from a consistent approach to investing. Here are five areas where advisors can help us overcome the tendency to react emotionally as we struggle to make the right choices with our investments:
Long-term focus
The further away long-term goals, aspirations and objectives are, the easier it is to stray away from the goals and priorities that we set out. Advisors help us stay focused on what we want to accomplish.
Discipline through up-and-down markets
Advisors help set rules to prevent us from making rash decisions that we may regret later. Knowing ahead of time what you should do in case of certain situations will help you get through volatile markets and not make emotional decisions.
Tax-awareness
Taxes are one of the biggest drags on investment returns and are critical attributes of investing. Yet few of us take the necessary steps to ease the corrosive effect of taxes. Advisors have tools and knowledge that may help us to manage portfolios more tax-efficiently and keep more of what we earn.
Emotional objectivity
Our emotions are very hard to manage and making investment decisions in an emotional state can lead to exceedingly bad outcomes. An objective advisor can help prevent some of the reactionary mistakes emotions often lead us to.
Education and guidance
The role of the advisor is to teach and guide us toward achieving our financial goals. In terms of working through emotions, guidance is by far the most important component.
By understanding our own behaviors and biases, we can prepare for future challenges. Your success is our priority. Talk to your advisor about how working with Columbia Threadneedle Investments may help you stay the course and position your portfolio for consistent, sustainable outcomes, regardless of market conditions.
Sincerely,
Christopher O. Petersen
President, Columbia Funds
Columbia Funds are distributed by Columbia Management Investment Distributors, Inc., member FINRA, and managed by Columbia Management Investment Advisers, LLC.
© 2018 Columbia Management Investment Advisers, LLC. All rights reserved.
Columbia Global Dividend Opportunity Fund | Annual Report 2018
Columbia Global Dividend Opportunity Fund | Annual Report 2018
Investment objective
Columbia Global Dividend Opportunity Fund (the Fund) seeks total return, consisting of current income and capital appreciation.
Portfolio management
Jonathan Crown
Lead Portfolio Manager
Managed Fund since 2016
Georgina Hellyer, CFA
Portfolio Manager
Managed Fund since January 2018
Morningstar style boxTM
The Morningstar Style Box is based on a fund’s portfolio holdings. For equity funds, the vertical axis shows the market capitalization of the stocks owned, and the horizontal axis shows investment style (value, blend, or growth). Information shown is based on the most recent data provided by Morningstar.
© 2018 Morningstar, Inc. All rights reserved. The Morningstar information contained herein: (1) is proprietary to Morningstar and/or its content providers; (2) may not be copied or distributed; and (3) is not warranted to be accurate, complete or timely. Neither Morningstar nor its content providers are responsible for any damages or losses arising from any use of this information.
| Average annual total returns (%) (for the period ended August 31, 2018) |
| | | Inception | 1 Year | 5 Years | 10 Years |
| Class A | Excluding sales charges | 11/01/02 | 6.21 | 4.99 | 4.68 |
| | Including sales charges | | 0.11 | 3.75 | 4.06 |
| Advisor Class* | 03/19/13 | 6.47 | 5.26 | 4.94 |
| Class C | Excluding sales charges | 10/13/03 | 5.42 | 4.21 | 3.89 |
| | Including sales charges | | 4.42 | 4.21 | 3.89 |
| Institutional Class | 11/09/00 | 6.51 | 5.26 | 4.94 |
| Institutional 2 Class* | 01/08/14 | 6.62 | 5.41 | 5.02 |
| Institutional 3 Class* | 07/15/09 | 6.72 | 5.50 | 5.13 |
| Class R* | 09/27/10 | 5.95 | 4.72 | 4.41 |
| Class T* | Excluding sales charges | 09/27/10 | 6.21 | 5.03 | 4.72 |
| | Including sales charges | | 3.54 | 4.50 | 4.46 |
| MSCI ACWI High Dividend Yield Index (Net) | | 6.00 | 6.85 | 5.88 |
| MSCI ACWI (Net) | | 11.41 | 9.67 | 6.71 |
Returns for Class A shares are shown with and without the maximum initial sales charge of 5.75%. Returns for Class C shares are shown with and without the 1.00% contingent deferred sales charge for the first year only. Returns for Class T shares are shown with and without the maximum initial sales charge of 2.50% per transaction. The Fund’s other share classes are not subject to sales charges and have limited eligibility. Effective November 1, 2017, Class R4, Class R5, Class Y and Class Z shares were renamed Advisor Class, Institutional 2 Class, Institutional 3 Class and Institutional Class shares, respectively. Please see the Fund’s prospectus for details. Performance for different share classes will vary based on differences in sales charges and fees associated with each share class. All results shown assume reinvestment of distributions during the period. Returns do not reflect the deduction of taxes that a shareholder may pay on Fund distributions or on the redemption of Fund shares. Performance results reflect the effect of any fee waivers or reimbursements of Fund expenses by Columbia Management Investment Advisers, LLC and/or any of its affiliates. Absent these fee waivers or expense reimbursement arrangements, performance results would have been lower.
The performance information shown represents past performance and is not a guarantee of future results. The investment return and principal value of your investment will fluctuate so that your shares, when redeemed, may be worth more or less than their original cost. Current performance may be lower or higher than the performance information shown. You may obtain performance information current to the most recent month-end by contacting your financial intermediary, visiting columbiathreadneedleus.com/investor/ or calling 800.345.6611.
| * | The returns shown for periods prior to the share class inception date (including returns for the Life of the Fund, if shown, which are since Fund inception) include the returns of the Fund’s oldest share class. These returns are adjusted to reflect any higher class-related operating expenses of the newer share classes, as applicable. Please visit columbiathreadneedleus.com/investor/investment-products/mutual-funds/appended-performance for more information. |
The MSCI ACWI High Dividend Yield Index (Net) includes large and mid-cap stocks across 23 developed market countries. The index is designed to reflect the performance of equities selected from the MSCI World Index with higher than average dividend yields that are both sustainable and persistent.
The MSCI ACWI (Net) is a free float-adjusted market capitalization weighted index that is designed to measure the equity market performance of developed and emerging markets. The index consists of 45 country indices comprising 24 developed and 21 emerging market country indices.
Indices are not available for investment, are not professionally managed and do not reflect sales charges, fees, brokerage commissions, taxes (except the MSCI ACWI High Dividend Yield Index (Net) and the MSCI ACWI (Net) which reflect reinvested dividends net of withholding taxes) or other expenses of investing. Securities in the Fund may not match those in an index.
| 2 | Columbia Global Dividend Opportunity Fund | Annual Report 2018 |
Fund at a Glance (continued)
Performance of a hypothetical $10,000 investment (August 31, 2008 — August 31, 2018)
The chart above shows the change in value of a hypothetical $10,000 investment in Class A shares of Columbia Global Dividend Opportunity Fund during the stated time period, and does not reflect the deduction of taxes that a shareholder may pay on Fund distributions or on the redemption of Fund shares.
| Top 10 holdings (%) (at August 31, 2018) |
| Wells Fargo & Co. (United States) | 3.2 |
| Unilever NV-CVA (Netherlands) | 2.8 |
| Deutsche Telekom AG, Registered Shares (Germany) | 2.6 |
| Pfizer, Inc. (United States) | 2.6 |
| British American Tobacco PLC (United Kingdom) | 2.5 |
| Royal Dutch Shell PLC, Class A (United Kingdom) | 2.4 |
| Cisco Systems, Inc. (United States) | 2.3 |
| Nutrien Ltd. (Canada) | 2.2 |
| Daiwa Securities Group, Inc. (Japan) | 2.2 |
| Manulife Financial Corp. (Canada) | 2.2 |
Percentages indicated are based upon total investments (excluding Money Market Funds and derivatives, if any).
For further detail about these holdings, please refer to the section entitled “Portfolio of Investments.”
Fund holdings are as of the date given, are subject to change at any time, and are not recommendations to buy or sell any security.
| Equity sector breakdown (%) (at August 31, 2018) |
| Consumer Discretionary | 9.1 |
| Consumer Staples | 11.6 |
| Energy | 9.8 |
| Financials | 22.9 |
| Health Care | 7.9 |
| Industrials | 10.8 |
| Information Technology | 12.0 |
| Materials | 7.5 |
| Real Estate | 1.5 |
| Telecommunication Services | 6.9 |
| Total | 100.0 |
Percentages indicated are based upon total equity investments. The Fund’s portfolio composition is subject to change.
Columbia Global Dividend Opportunity Fund | Annual Report 2018
| 3 |
Fund at a Glance (continued)
| Country breakdown (%) (at August 31, 2018) |
| Australia | 5.3 |
| Austria | 0.8 |
| Brazil | 1.4 |
| Canada | 7.1 |
| China | 2.4 |
| Finland | 1.3 |
| France | 1.3 |
| Germany | 5.3 |
| Hong Kong | 1.5 |
| Indonesia | 2.0 |
| Isle of Man | 1.0 |
| Japan | 6.8 |
| Mexico | 0.1 |
| Netherlands | 3.8 |
| South Africa | 0.4 |
| South Korea | 0.8 |
| Spain | 2.0 |
| Switzerland | 3.4 |
| Taiwan | 3.2 |
| Thailand | 1.9 |
| United Kingdom | 11.4 |
| United States(a) | 36.8 |
| Total | 100.0 |
| (a) | Includes investments in Money Market Funds. |
Country breakdown is based primarily on issuer’s place of organization/incorporation. Percentages indicated are based upon total investments and exclude investments in derivatives, if any. The Fund’s portfolio composition is subject to change.
| 4 | Columbia Global Dividend Opportunity Fund | Annual Report 2018 |
Manager Discussion of Fund Performance
For the 12-month period that ended August 31, 2018, the Fund’s Class A shares returned 6.21% excluding sales charges. The Fund outperformed its primary benchmark, the MSCI ACWI High Dividend Yield Index, which returned 6.00%, but underperformed its secondary benchmark, the MSCI All Country World Index (Net), which returned 11.41% for the same time period. The Fund’s outperformance of its primary benchmark can be attributed primarily to effective stock selection overall. Country allocation and sector allocation as a whole detracted, albeit modestly.
Global equity markets gained but were pressured amid trade tensions
Global equities began the period positively, benefiting in particular from strong third quarter 2017 earnings and anticipation that the U.S. Congress would approve a flagship tax-cutting bill. The bill, passed on December 20, 2017, featured a permanent corporate tax cut and temporary reductions in income taxes for some individuals. Japanese shares fared well, further supported following Prime Minister Abe’s re-election victory. U.K. equity indices rose as well, benefiting from their comparatively large commodities exposure, as oil prices reached two-year highs on output cuts among major producers. European equities performed more modestly, as political uncertainty and the burden of a strong euro on exporters offset healthy economic indicators. Then, 2018 saw the return of volatility to global equity markets. Despite positive economic growth data and strong corporate earnings results, 2017’s steady appreciation came to an end on bouts of political tensions and an escalating trade dispute between the U.S. and China. Against this backdrop, U.S. equities remained the strongest performers in response to buoyant corporate earnings results, particularly within the information technology sector, and solid domestic economic markers. The materialization of the U.S. Administration’s flagship tax reform bill at the start of the new calendar year provided further support to U.S. equity markets. However, having started the calendar year well on ongoing increases in oil prices and strong corporate earnings, European equities subsequently fell on the formation of an Italian euro-sceptic coalition. Emerging market equities also declined on trade tensions, currency pressures and hawkish U.S. Federal Reserve commentary.
Within the primary benchmark, Russia and Austria performed best for the period overall, followed by Qatar, Malaysia and Finland. The U.S. posted double-digit positive absolute returns, but lagged these other nations’ markets. The weakest performers during the period were Turkey, India, Brazil, Sweden and Pakistan. From a sector perspective, information technology and energy were the best performers in the primary benchmark during the period. Conversely, telecommunication services and consumer staples were the weakest sectors in the primary benchmark during the period.
Stock selection aided results most
Stock selection in the consumer discretionary, health care and energy sectors contributed most positively to the Fund’s results during the period. From a country perspective, stock selection in the U.S., Japan and China was most beneficial to Fund results.
During the period, U.S. petroleum refiner Valero Energy, U.S. derivatives exchange operator CME Group and U.S. technology hardware company Cisco Systems were among the top contributors to Fund results. Valero Energy’s shares rose on better refining margins and crude oil price differentials. CME Group’s strong performance was driven by the company’s strategic diversification into new areas of demand, most notably across commodities, base metals and crypto trading. Shares of Cisco Systems rose on improved guidance amid optimism surrounding the company’s transition toward a business model built on subscriptions, which, in turn, promotes visible, recurring revenues.
Telecommunication services positioning dampened Fund results
Stock selection in and having an overweight to the weakly performing telecommunication services sector dampened the Fund’s relative results most, as concerns over increasing capital expenditure requirements plagued the sector. Stock selection in consumer staples and industrials also detracted from Fund performance during the period. From a country perspective, stock selection in Brazil, France and Indonesia detracted most. Having overweights to Brazil and Indonesia, which each posted negative absolute returns during the period, also hurt.
Among the individual holdings that detracted most from relative results during the period were U.K. tobacco company British American Tobacco, Brazilian beer producer and distributor Ambev and U.S.-based diversified conglomerate General Electric. British American Tobacco, along with tobacco companies broadly and traditionally defensive sectors as a whole, largely fell out of favor as signs of wage inflation reinforced expectations that copious central bank stimulus may soon come to a close.
Columbia Global Dividend Opportunity Fund | Annual Report 2018
| 5 |
Manager Discussion of Fund Performance (continued)
Despite this backdrop, at the end of the period, we felt that as one of the most globally diversified tobacco businesses, British American Tobacco displayed strong longer term growth potential on the back of sustained price increases, tax reform gains, cost management and development of synergies from its acquisition of Reynolds American. Ambev posted a negative absolute return during the period, as investors expressed some concerns over the depreciation of the real, higher aluminum prices and the company’s competitive scenario, despite its net sales meeting consensus estimates. At the end of the period, we believed Ambev retained an attractive mix of income and growth potential, coupled with a strong balance sheet. The share price of General Electric declined on concerns about the company’s earnings report. We sold the Fund’s position in General Electric after its management failed to provide detail on different business units despite previous assurances and after anticipated improvements in cash flow generation did not materialize.
Stock selection strategy drove weighting changes
During the period, the Fund’s dividend yield hurdle for individual stocks was shifted from an absolute target of 3% or greater to a relative target of 100% of the yield of the broader market, as represented by the MSCI All Country World Index (Net). We continued to focus on the top 40% of dividend yield stocks and believe the relative yield hurdle enables us to more effectively target this market segment. In implementing our bottom-up selection strategy, the Fund’s allocations to industrials and financials increased relative to the primary benchmark, the latter mainly via the banks subsector. These increases were funded by reductions in allocations to the health care, utilities and materials sectors. Also worth noting was a decrease in exposure to the semiconductor subsector within the information technology sector. Among the most significant purchases for the Fund during the period were German specialty chemicals manufacturer Evonik Industries, which we believe has considerable scope to generate operational and cost-based efficiencies. We also initiated a Fund position in U.S. global alternative asset manager services provider Apollo Global Management, which, in our view, offers good performance and strong prospects following successful fund raising. Conversely, we sold the Fund’s position in entertainment facilities developer Regal Entertainment on growing concerns about competition from premium video on demand services. We also exited the Fund’s position in utility PG&E. Its shares had fallen on rumors of liability in an investigation in the U.S., which led to an unexpected dividend cut, and we felt such uncertainty could persist for some time. From a country perspective, we increased the Fund’s exposure to Japan, the Netherlands, Indonesia and Canada and reduced its exposure to Switzerland and the U.S. relative to the primary benchmark.
At the end of the period, the Fund was most overweight in the financials, materials and telecommunication services sectors and most underweight in the utilities, health care and consumer staples sectors relative to the primary benchmark. By country, the Fund was most overweight in the U.K., Australia, Japan and the Netherlands and was most underweight in Switzerland, the U.S. and France relative to the primary benchmark.
Market risk may affect a single issuer, sector of the economy, industry or the market as a whole. International investing involves certain risks and volatility due to potential political, economic or currency instabilities and different financial and accounting standards. Risks are enhanced for emerging market issuers. Value securities may be unprofitable if the market fails to recognize their intrinsic worth or the portfolio manager misgauged that worth. See the Fund’s prospectus for more information on these and other risks.
The views expressed in this report reflect the current views of the respective parties. These views are not guarantees of future performance and involve certain risks, uncertainties and assumptions that are difficult to predict, so actual outcomes and results may differ significantly from the views expressed. These views are subject to change at any time based upon economic, market or other conditions and the respective parties disclaim any responsibility to update such views. These views may not be relied on as investment advice and, because investment decisions for a Columbia fund are based on numerous factors, may not be relied on as an indication of trading intent on behalf of any particular Columbia fund. References to specific securities should not be construed as a recommendation or investment advice.
| 6 | Columbia Global Dividend Opportunity Fund | Annual Report 2018 |
Understanding Your Fund’s Expenses
(Unaudited)
As an investor, you incur two types of costs. There are shareholder transaction costs, which generally include sales charges on purchases and may include redemption fees. There are also ongoing costs, which generally include management fees, distribution and/or service fees, and other fund expenses. The following information is intended to help you understand your ongoing costs (in dollars) of investing in the Fund and to help you compare these costs with the ongoing costs of investing in other mutual funds.
Analyzing your Fund’s expenses
To illustrate these ongoing costs, we have provided examples and calculated the expenses paid by investors in each share class of the Fund during the period. The actual and hypothetical information in the table is based on an initial investment of $1,000 at the beginning of the period indicated and held for the entire period. Expense information is calculated two ways and each method provides you with different information. The amount listed in the “Actual” column is calculated using the Fund’s actual operating expenses and total return for the period. You may use the Actual information, together with the amount invested, to estimate the expenses that you paid over the period. Simply divide your account value by $1,000 (for example, an $8,600 account value divided by $1,000 = 8.6), then multiply the results by the expenses paid during the period under the “Actual” column. The amount listed in the “Hypothetical” column assumes a 5% annual rate of return before expenses (which is not the Fund’s actual return) and then applies the Fund’s actual expense ratio for the period to the hypothetical return. You should not use the hypothetical account values and expenses to estimate either your actual account balance at the end of the period or the expenses you paid during the period. See “Compare with other funds” below for details on how to use the hypothetical data.
Compare with other funds
Since all mutual funds are required to include the same hypothetical calculations about expenses in shareholder reports, you can use this information to compare the ongoing cost of investing in the Fund with other funds. To do so, compare the hypothetical example with the 5% hypothetical examples that appear in the shareholder reports of other funds. As you compare hypothetical examples of other funds, it is important to note that hypothetical examples are meant to highlight the ongoing costs of investing in a fund only and do not reflect any transaction costs, such as sales charges, or redemption or exchange fees. Therefore, the hypothetical calculations are useful in comparing ongoing costs only, and will not help you determine the relative total costs of owning different funds. If transaction costs were included in these calculations, your costs would be higher.
| March 1, 2018 — August 31, 2018 |
| | Account value at the
beginning of the
period ($) | Account value at the
end of the
period ($) | Expenses paid during
the period ($) | Fund’s annualized
expense ratio (%) |
| | Actual | Hypothetical | Actual | Hypothetical | Actual | Hypothetical | Actual |
| Class A | 1,000.00 | 1,000.00 | 994.20 | 1,018.90 | 6.28 | 6.36 | 1.25 |
| Advisor Class | 1,000.00 | 1,000.00 | 995.50 | 1,020.16 | 5.03 | 5.09 | 1.00 |
| Class C | 1,000.00 | 1,000.00 | 990.30 | 1,015.12 | 10.03 | 10.16 | 2.00 |
| Institutional Class | 1,000.00 | 1,000.00 | 996.00 | 1,020.16 | 5.03 | 5.09 | 1.00 |
| Institutional 2 Class | 1,000.00 | 1,000.00 | 996.20 | 1,020.82 | 4.38 | 4.43 | 0.87 |
| Institutional 3 Class | 1,000.00 | 1,000.00 | 996.50 | 1,021.12 | 4.08 | 4.13 | 0.81 |
| Class R | 1,000.00 | 1,000.00 | 992.90 | 1,017.64 | 7.53 | 7.63 | 1.50 |
| Class T | 1,000.00 | 1,000.00 | 994.20 | 1,018.90 | 6.28 | 6.36 | 1.25 |
Expenses paid during the period are equal to the annualized expense ratio for each class as indicated above, multiplied by the average account value over the period and then multiplied by the number of days in the Fund’s most recent fiscal half year and divided by 365.
Expenses do not include fees and expenses incurred indirectly by the Fund from its investment in underlying funds, including affiliated and non-affiliated pooled investment vehicles, such as mutual funds and exchange-traded funds.
Had Columbia Management Investment Advisers, LLC and/or certain of its affiliates not waived/reimbursed certain fees and expenses, account value at the end of the period would have been reduced.
Columbia Global Dividend Opportunity Fund | Annual Report 2018
| 7 |
Portfolio of Investments
August 31, 2018
(Percentages represent value of investments compared to net assets)
Investments in securities
| Common Stocks 95.1% |
| Issuer | Shares | Value ($) |
| Australia 5.3% |
| Amcor Ltd. | 656,825 | 6,758,455 |
| DuluxGroup Ltd. | 979,182 | 5,538,439 |
| Goodman Group | 578,757 | 4,457,697 |
| Sydney Airport | 1,218,109 | 6,324,861 |
| Transurban Group(a),(b) | 723,186 | 6,269,975 |
| Total | 29,349,427 |
| Austria 0.8% |
| Erste Group Bank AG | 116,369 | 4,629,031 |
| Brazil 1.4% |
| Ambev SA | 1,082,200 | 5,018,968 |
| Kroton Educacional SA | 1,106,500 | 2,776,369 |
| Total | 7,795,337 |
| Canada 7.1% |
| Manulife Financial Corp. | 652,312 | 11,936,560 |
| Nutrien Ltd. | 216,994 | 12,288,370 |
| Suncor Energy, Inc. | 182,305 | 7,504,540 |
| TransCanada Corp. | 180,941 | 7,706,284 |
| Total | 39,435,754 |
| China 2.4% |
| ANTA Sports Products Ltd. | 1,374,000 | 7,492,753 |
| Ping An Insurance Group Co. of China Ltd., Class H | 597,000 | 5,758,573 |
| Total | 13,251,326 |
| Finland 1.3% |
| Sampo OYJ, Class A | 138,352 | 7,077,293 |
| France 1.3% |
| BNP Paribas SA | 126,738 | 7,440,881 |
| Germany 5.3% |
| 1&1 Drillisch AG | 45,282 | 2,291,663 |
| Axel Springer SE | 93,044 | 6,760,851 |
| Deutsche Telekom AG, Registered Shares | 889,601 | 14,363,526 |
| Evonik Industries AG | 171,116 | 6,377,781 |
| Total | 29,793,821 |
| Hong Kong 1.5% |
| HKT Trust & HKT Ltd. | 6,694,000 | 8,649,678 |
| Common Stocks (continued) |
| Issuer | Shares | Value ($) |
| Indonesia 2.0% |
| PT Bank Rakyat Indonesia Persero Tbk | 19,048,600 | 4,115,765 |
| PT Telekomunikasi Indonesia Persero Tbk | 29,136,500 | 6,920,595 |
| Total | 11,036,360 |
| Isle of Man 1.0% |
| GVC Holdings PLC | 382,969 | 5,471,432 |
| Japan 6.8% |
| Bridgestone Corp. | 215,500 | 7,925,932 |
| Daiwa Securities Group, Inc. | 2,027,300 | 12,147,093 |
| Japan Hotel REIT Investment Corp. | 5,155 | 3,905,774 |
| Nintendo Co., Ltd. | 19,200 | 6,911,044 |
| Tokyo Electron Ltd. | 41,100 | 6,997,269 |
| Total | 37,887,112 |
| Mexico 0.1% |
| Wal-Mart de Mexico SAB de CV, Class V | 201,561 | 558,097 |
| Netherlands 3.8% |
| RELX NV | 264,895 | 5,866,658 |
| Unilever NV-CVA | 266,242 | 15,311,406 |
| Total | 21,178,064 |
| South Africa 0.4% |
| SPAR Group Ltd. (The) | 159,352 | 2,223,012 |
| South Korea 0.8% |
| Samsung Electronics Co., Ltd. | 98,440 | 4,279,251 |
| Spain 2.0% |
| Ferrovial SA | 528,900 | 11,434,272 |
| Switzerland 3.4% |
| Novartis AG, ADR | 130,770 | 10,855,218 |
| UBS AG | 512,415 | 8,001,445 |
| Total | 18,856,663 |
| Taiwan 3.2% |
| Eclat Textile Co., Ltd. | 576,000 | 6,991,140 |
| Taiwan Semiconductor Manufacturing Co., Ltd. | 1,302,000 | 10,909,056 |
| Total | 17,900,196 |
The accompanying Notes to Financial Statements are an integral part of this statement.
| 8 | Columbia Global Dividend Opportunity Fund | Annual Report 2018 |
Portfolio of Investments (continued)
August 31, 2018
| Common Stocks (continued) |
| Issuer | Shares | Value ($) |
| Thailand 1.9% |
| Siam Commercial Bank PCL (The), Foreign Registered Shares | 1,858,200 | 8,402,430 |
| Thai Beverage PCL | 5,239,800 | 2,365,123 |
| Total | 10,767,553 |
| United Kingdom 11.4% |
| Anglo American PLC | 182,889 | 3,655,234 |
| BAE Systems PLC | 562,779 | 4,421,467 |
| British American Tobacco PLC | 279,729 | 13,496,195 |
| BT Group PLC | 1,938,521 | 5,462,431 |
| GlaxoSmithKline PLC | 424,553 | 8,588,626 |
| Legal & General Group PLC | 1,251,229 | 4,125,143 |
| Rio Tinto PLC | 136,322 | 6,466,722 |
| Royal Dutch Shell PLC, Class A | 405,750 | 13,158,757 |
| St. James’s Place PLC | 281,420 | 4,128,244 |
| Total | 63,502,819 |
| United States 31.9% |
| 3M Co. | 20,330 | 4,288,004 |
| Altria Group, Inc. | 142,865 | 8,360,460 |
| BB&T Corp. | 133,589 | 6,901,208 |
| Cisco Systems, Inc. | 260,329 | 12,435,916 |
| CME Group, Inc. | 42,278 | 7,387,235 |
| Coca-Cola Co. (The) | 258,661 | 11,528,521 |
| Corning, Inc. | 153,418 | 5,141,037 |
| Emerson Electric Co. | 118,100 | 9,061,813 |
| General Motors Co. | 223,462 | 8,055,805 |
| Lockheed Martin Corp. | 13,045 | 4,179,748 |
| Maxim Integrated Products, Inc. | 139,467 | 8,433,569 |
| Merck & Co., Inc. | 140,102 | 9,609,596 |
| Occidental Petroleum Corp. | 55,948 | 4,468,567 |
| PacWest Bancorp | 181,227 | 9,150,151 |
| Paychex, Inc. | 145,436 | 10,653,187 |
| Common Stocks (continued) |
| Issuer | Shares | Value ($) |
| Pfizer, Inc. | 338,194 | 14,041,815 |
| Philip Morris International, Inc. | 57,864 | 4,507,027 |
| Schlumberger Ltd. | 100,535 | 6,349,791 |
| Six Flags Entertainment Corp. | 67,336 | 4,548,547 |
| Valero Energy Corp. | 37,379 | 4,406,236 |
| Watsco, Inc. | 41,532 | 7,267,685 |
| Wells Fargo & Co. | 299,202 | 17,497,333 |
| Total | 178,273,251 |
Total Common Stocks
(Cost $485,757,960) | 530,790,630 |
|
| Limited Partnerships 3.0% |
| | |
| United States 3.0% |
| Apollo Global Management LLC | 77,180 | 2,665,025 |
| Blackstone Group LP (The) | 117,042 | 4,320,020 |
| Enterprise Products Partners LP | 347,191 | 9,929,663 |
| Total | 16,914,708 |
Total Limited Partnerships
(Cost $12,953,305) | 16,914,708 |
|
| Rights 0.0% |
| | |
| Australia 0.0% |
| Transurban Group(c) | 126,875 | 114,925 |
Total Rights
(Cost $—) | 114,925 |
|
| Money Market Funds 1.8% |
| | Shares | Value ($) |
| Columbia Short-Term Cash Fund, 2.058%(d),(e) | 10,000,767 | 9,999,767 |
Total Money Market Funds
(Cost $9,999,767) | 9,999,767 |
Total Investments in Securities
(Cost $508,711,032) | 557,820,030 |
| Other Assets & Liabilities, Net | | 337,475 |
| Net Assets | $558,157,505 |
Notes to Portfolio of Investments
| (a) | Represents fair value as determined in good faith under procedures approved by the Board of Trustees. At August 31, 2018, the total value of these securities amounted to $6,269,975, which represents 1.12% of total net assets. |
| (b) | Valuation based on significant unobservable inputs. |
| (c) | Non-income producing investment. |
| (d) | The rate shown is the seven-day current annualized yield at August 31, 2018. |
The accompanying Notes to Financial Statements are an integral part of this statement.
Columbia Global Dividend Opportunity Fund | Annual Report 2018
| 9 |
Portfolio of Investments (continued)
August 31, 2018
Notes to Portfolio of Investments (continued)
| (e) | As defined in the Investment Company Act of 1940, an affiliated company is one in which the Fund owns 5% or more of the company’s outstanding voting securities, or a company which is under common ownership or control with the Fund. Holdings and transactions in these affiliated companies during the year ended August 31, 2018 are as follows: |
| Issuer | Beginning
shares | Shares
purchased | Shares
sold | Ending
shares | Realized gain
(loss) —
affiliated
issuers ($) | Net change in
unrealized
appreciation
(depreciation) —
affiliated
issuers ($) | Dividends —
affiliated
issuers ($) | Value —
affiliated
issuers
at end of
period ($) |
| Columbia Short-Term Cash Fund, 2.058% |
| | 3,215,484 | 175,682,611 | (168,897,328) | 10,000,767 | (1,052) | (81) | 119,284 | 9,999,767 |
Abbreviation Legend
| ADR | American Depositary Receipt |
Fair value measurements
The Fund categorizes its fair value measurements according to a three-level hierarchy that maximizes the use of observable inputs and minimizes the use of unobservable inputs by prioritizing that the most observable input be used when available. Observable inputs are those that market participants would use in pricing an investment based on market data obtained from sources independent of the reporting entity. Unobservable inputs are those that reflect the Fund’s assumptions about the information market participants would use in pricing an investment. An investment’s level within the fair value hierarchy is based on the lowest level of any input that is deemed significant to the asset’s or liability’s fair value measurement. The input levels are not necessarily an indication of the risk or liquidity associated with investments at that level. For example, certain U.S. government securities are generally high quality and liquid, however, they are reflected as Level 2 because the inputs used to determine fair value may not always be quoted prices in an active market.
Fair value inputs are summarized in the three broad levels listed below:
| ■ | Level 1 — Valuations based on quoted prices for investments in active markets that the Fund has the ability to access at the measurement date. Valuation adjustments are not applied to Level 1 investments. |
| ■ | Level 2 — Valuations based on other significant observable inputs (including quoted prices for similar securities, interest rates, prepayment speeds, credit risks, etc.). |
| ■ | Level 3 — Valuations based on significant unobservable inputs (including the Fund’s own assumptions and judgment in determining the fair value of investments). |
Inputs that are used in determining fair value of an investment may include price information, credit data, volatility statistics, and other factors. These inputs can be either observable or unobservable. The availability of observable inputs can vary between investments, and is affected by various factors such as the type of investment, and the volume and level of activity for that investment or similar investments in the marketplace. The inputs will be considered by the Investment Manager, along with any other relevant factors in the calculation of an investment’s fair value. The Fund uses prices and inputs that are current as of the measurement date, which may include periods of market dislocations. During these periods, the availability of prices and inputs may be reduced for many investments. This condition could cause an investment to be reclassified between the various levels within the hierarchy.
Foreign equity securities actively traded in markets where there is a significant delay in the local close relative to the New York Stock Exchange are classified as Level 2. The values of these securities may include an adjustment to reflect the impact of significant market movements following the close of local trading, as described in Note 2 to the financial statements – Security valuation.
Certain investments that have been measured at fair value using the net asset value (NAV) per share (or its equivalent) are not categorized in the fair value hierarchy. The fair value amounts presented in the table are intended to reconcile the fair value hierarchy to the amounts presented in the Portfolio of Investments. The Columbia Short-Term Cash Fund seeks to provide shareholders with maximum current income consistent with liquidity and stability of principal. Columbia Short-Term Cash Fund prices its shares with a floating NAV and no longer seeks to maintain a stable NAV.
Investments falling into the Level 3 category are primarily supported by quoted prices from brokers and dealers participating in the market for those investments. However, these may be classified as Level 3 investments due to lack of market transparency and corroboration to support these quoted prices. Additionally, valuation models may be used as the pricing source for any remaining investments classified as Level 3. These models may rely on one or more significant unobservable inputs and/or significant assumptions by the Investment Manager. Inputs used in valuations may include, but are not limited to, financial statement analysis, capital account balances, discount rates and estimated cash flows, and comparable company data.
Under the direction of the Fund’s Board of Trustees (the Board), the Investment Manager’s Valuation Committee (the Committee) is responsible for overseeing the valuation procedures approved by the Board. The Committee consists of voting and non-voting members from various groups within the Investment Manager’s organization, including operations and accounting, trading and investments, compliance, risk management and legal.
The Committee meets at least monthly to review and approve valuation matters, which may include a description of specific valuation determinations, data regarding pricing information received from approved pricing vendors and brokers and the results of Board-approved valuation control policies and procedures (the Policies). The Policies address, among other things, instances when market quotations are or are not readily available, including recommendations of third party pricing vendors and a determination of appropriate pricing methodologies; events that require specific valuation determinations and assessment of fair value techniques; securities with a potential for stale pricing, including those that are illiquid, restricted, or in default; and the effectiveness of third party pricing vendors, including periodic reviews of vendors. The Committee meets more frequently, as needed, to discuss additional valuation matters, which may include the need to review back-testing results, review time-sensitive information or approve related valuation actions. The Committee reports to the Board, with members of the Committee meeting with the Board at each of its regularly scheduled meetings to discuss valuation matters and actions during the period, similar to those described earlier.
The accompanying Notes to Financial Statements are an integral part of this statement.
| 10 | Columbia Global Dividend Opportunity Fund | Annual Report 2018 |
Portfolio of Investments (continued)
August 31, 2018
Fair value measurements (continued)
For investments categorized as Level 3, the Committee monitors information similar to that described above, which may include: (i) data specific to the issuer or comparable issuers, (ii) general market or specific sector news and (iii) quoted prices and specific or similar security transactions. The Committee considers this data and any changes from prior periods in order to assess the reasonableness of observable and unobservable inputs, any assumptions or internal models used to value those securities and changes in fair value. This data is also used to corroborate, when available, information received from approved pricing vendors and brokers. Various factors impact the frequency of monitoring this information (which may occur as often as daily). However, the Committee may determine that changes to inputs, assumptions and models are not required as a result of the monitoring procedures performed.
The following table is a summary of the inputs used to value the Fund’s investments at August 31, 2018:
| | Level 1
quoted prices
in active
markets for
identical
assets ($) | Level 2
other
significant
observable
inputs ($) | Level 3
significant
unobservable
inputs ($) | Investments
measured at
net asset
value ($) | Total ($) |
| Investments in Securities | | | | | |
| Common Stocks | | | | | |
| Australia | — | 23,079,452 | 6,269,975 | — | 29,349,427 |
| Austria | — | 4,629,031 | — | — | 4,629,031 |
| Brazil | 7,795,337 | — | — | — | 7,795,337 |
| Canada | 39,435,754 | — | — | — | 39,435,754 |
| China | — | 13,251,326 | — | — | 13,251,326 |
| Finland | — | 7,077,293 | — | — | 7,077,293 |
| France | — | 7,440,881 | — | — | 7,440,881 |
| Germany | — | 29,793,821 | — | — | 29,793,821 |
| Hong Kong | — | 8,649,678 | — | — | 8,649,678 |
| Indonesia | — | 11,036,360 | — | — | 11,036,360 |
| Isle of Man | — | 5,471,432 | — | — | 5,471,432 |
| Japan | — | 37,887,112 | — | — | 37,887,112 |
| Mexico | 558,097 | — | — | — | 558,097 |
| Netherlands | — | 21,178,064 | — | — | 21,178,064 |
| South Africa | — | 2,223,012 | — | — | 2,223,012 |
| South Korea | — | 4,279,251 | — | — | 4,279,251 |
| Spain | — | 11,434,272 | — | — | 11,434,272 |
| Switzerland | 10,855,218 | 8,001,445 | — | — | 18,856,663 |
| Taiwan | — | 17,900,196 | — | — | 17,900,196 |
| Thailand | — | 10,767,553 | — | — | 10,767,553 |
| United Kingdom | — | 63,502,819 | — | — | 63,502,819 |
| United States | 178,273,251 | — | — | — | 178,273,251 |
| Total Common Stocks | 236,917,657 | 287,602,998 | 6,269,975 | — | 530,790,630 |
| Limited Partnerships | | | | | |
| United States | 16,914,708 | — | — | — | 16,914,708 |
| Total Limited Partnerships | 16,914,708 | — | — | — | 16,914,708 |
| Rights | | | | | |
| Australia | — | 114,925 | — | — | 114,925 |
| Total Rights | — | 114,925 | — | — | 114,925 |
| Money Market Funds | — | — | — | 9,999,767 | 9,999,767 |
| Total Investments in Securities | 253,832,365 | 287,717,923 | 6,269,975 | 9,999,767 | 557,820,030 |
See the Portfolio of Investments for all investment classifications not indicated in the table.
The Fund’s assets assigned to the Level 2 input category are generally valued using the market approach, in which a security’s value is determined through reference to prices and information from market transactions for similar or identical assets. These assets include certain foreign securities for which a third party statistical pricing service may be employed for purposes of fair market valuation. The model utilized by such third party statistical pricing service takes into account a security’s correlation to available market data including, but not limited to, intraday index, ADR, and exchange-traded fund movements.
There were no transfers of financial assets between levels during the period.
The accompanying Notes to Financial Statements are an integral part of this statement.
Columbia Global Dividend Opportunity Fund | Annual Report 2018
| 11 |
Portfolio of Investments (continued)
August 31, 2018
Fair value measurements (continued)
The following table is a reconciliation of Level 3 assets for which significant observable and unobservable inputs were used to determine fair value:
| Investments in securities | Balance
as of
08/31/2017
($) | Increase
(decrease)
in accrued
discounts/
premiums
($) | Realized
gain (loss)
($) | Change
in unrealized
appreciation
(depreciation)(a)
($) | Purchases
($) | Sales
($) | Transfers
into
Level 3
($) | Transfers
out of
Level 3
($) | Balance
as of
08/31/2018
($) |
| Common Stocks | — | — | (25,249) | (724,719) | 7,205,733 | (185,790) | — | — | 6,269,975 |
(a) Change in unrealized appreciation (depreciation) relating to securities held at August 31, 2018 was $(724,719), which is comprised of Common Stocks of $(724,719).
The Fund’s assets assigned to the Level 3 category are valued utilizing the valuation technique deemed the most appropriate in the circumstances. Certain common stocks classified as Level 3 securities are valued using the market approach. To determine fair value for these securities, management considered various factors which may have included, but were not limited to, the halt price of the security, discount rates observed in the market for similar assets as well as the movement in certain foreign or domestic market indices. Significant increases (decreases) to any of these inputs would result in a significantly higher (lower) fair value measurement. Generally, a change in observable yields on comparable securities would result in a directionally similar change to discount rates.
The accompanying Notes to Financial Statements are an integral part of this statement.
| 12 | Columbia Global Dividend Opportunity Fund | Annual Report 2018 |
Statement of Assets and Liabilities
August 31, 2018
| Assets | |
| Investments in securities, at value | |
| Unaffiliated issuers (cost $498,711,265) | $547,820,263 |
| Affiliated issuers (cost $9,999,767) | 9,999,767 |
| Cash | 2,535 |
| Receivable for: | |
| Investments sold | 1,237 |
| Capital shares sold | 19,745 |
| Dividends | 2,252,834 |
| Foreign tax reclaims | 814,403 |
| Expense reimbursement due from Investment Manager | 3,590 |
| Prepaid expenses | 3,637 |
| Trustees’ deferred compensation plan | 177,333 |
| Total assets | 561,095,344 |
| Liabilities | |
| Foreign currency (cost $21,063) | 20,786 |
| Payable for: | |
| Investments purchased | 2,116,238 |
| Capital shares purchased | 473,916 |
| Management services fees | 11,758 |
| Distribution and/or service fees | 758 |
| Transfer agent fees | 53,069 |
| Compensation of chief compliance officer | 37 |
| Other expenses | 83,944 |
| Trustees’ deferred compensation plan | 177,333 |
| Total liabilities | 2,937,839 |
| Net assets applicable to outstanding capital stock | $558,157,505 |
| Represented by | |
| Paid in capital | 497,237,796 |
| Undistributed net investment income | 4,845,224 |
| Accumulated net realized gain | 6,953,037 |
| Unrealized appreciation (depreciation) on: | |
| Investments - unaffiliated issuers | 49,108,998 |
| Foreign currency translations | 12,450 |
| Total - representing net assets applicable to outstanding capital stock | $558,157,505 |
The accompanying Notes to Financial Statements are an integral part of this statement.
Columbia Global Dividend Opportunity Fund | Annual Report 2018
| 13 |
Statement of Assets and Liabilities (continued)
August 31, 2018
| Class A | |
| Net assets | $93,177,013 |
| Shares outstanding | 4,948,513 |
| Net asset value per share | $18.83 |
| Maximum sales charge | 5.75% |
| Maximum offering price per share (calculated by dividing the net asset value per share by 1.0 minus the maximum sales charge for Class A shares) | $19.98 |
| Advisor Class | |
| Net assets | $1,140,984 |
| Shares outstanding | 60,089 |
| Net asset value per share | $18.99 |
| Class C | |
| Net assets | $3,268,312 |
| Shares outstanding | 185,376 |
| Net asset value per share | $17.63 |
| Institutional Class | |
| Net assets | $395,163,201 |
| Shares outstanding | 20,911,920 |
| Net asset value per share | $18.90 |
| Institutional 2 Class | |
| Net assets | $552,686 |
| Shares outstanding | 29,320 |
| Net asset value per share | $18.85 |
| Institutional 3 Class | |
| Net assets | $63,147,711 |
| Shares outstanding | 3,343,681 |
| Net asset value per share | $18.89 |
| Class R | |
| Net assets | $1,705,362 |
| Shares outstanding | 90,700 |
| Net asset value per share | $18.80 |
| Class T | |
| Net assets | $2,236 |
| Shares outstanding | 119 |
| Net asset value per share(a) | $18.82 |
| Maximum sales charge | 2.50% |
| Maximum offering price per share (calculated by dividing the net asset value per share by 1.0 minus the maximum sales charge per transaction for Class T shares) | $19.30 |
| (a) | Net asset value per share rounds to this amount due to fractional shares outstanding. |
The accompanying Notes to Financial Statements are an integral part of this statement.
| 14 | Columbia Global Dividend Opportunity Fund | Annual Report 2018 |
Statement of Operations
Year Ended August 31, 2018
| Net investment income | |
| Income: | |
| Dividends — unaffiliated issuers | $23,511,739 |
| Dividends — affiliated issuers | 119,284 |
| Foreign taxes withheld | (1,188,044) |
| Total income | 22,442,979 |
| Expenses: | |
| Management services fees | 4,511,286 |
| Distribution and/or service fees | |
| Class A | 244,989 |
| Class C | 69,121 |
| Class R | 8,865 |
| Class T | 6 |
| Transfer agent fees | |
| Class A | 344,366 |
| Advisor Class | 3,852 |
| Class C | 24,228 |
| Institutional Class | 1,471,796 |
| Institutional 2 Class | 354 |
| Institutional 3 Class | 4,936 |
| Class R | 6,230 |
| Class T | 8 |
| Compensation of board members | 23,434 |
| Custodian fees | 76,540 |
| Printing and postage fees | 93,241 |
| Registration fees | 114,267 |
| Audit fees | 111,603 |
| Legal fees | 13,777 |
| Compensation of chief compliance officer | 232 |
| Other | 25,507 |
| Total expenses | 7,148,638 |
| Fees waived or expenses reimbursed by Investment Manager and its affiliates | (885,748) |
| Expense reduction | (79,214) |
| Total net expenses | 6,183,676 |
| Net investment income | 16,259,303 |
| Realized and unrealized gain (loss) — net | |
| Net realized gain (loss) on: | |
| Investments — unaffiliated issuers | 25,940,521 |
| Investments — affiliated issuers | (1,052) |
| Foreign currency translations | (87,136) |
| Net realized gain | 25,852,333 |
| Net change in unrealized appreciation (depreciation) on: | |
| Investments — unaffiliated issuers | (3,988,413) |
| Investments — affiliated issuers | (81) |
| Foreign currency translations | (12,467) |
| Net change in unrealized appreciation (depreciation) | (4,000,961) |
| Net realized and unrealized gain | 21,851,372 |
| Net increase in net assets resulting from operations | $38,110,675 |
The accompanying Notes to Financial Statements are an integral part of this statement.
Columbia Global Dividend Opportunity Fund | Annual Report 2018
| 15 |
Statement of Changes in Net Assets
| | Year Ended
August 31, 2018 | Year Ended
August 31, 2017 |
| Operations | | |
| Net investment income | $16,259,303 | $18,093,625 |
| Net realized gain | 25,852,333 | 34,349,605 |
| Net change in unrealized appreciation (depreciation) | (4,000,961) | 8,058,653 |
| Net increase in net assets resulting from operations | 38,110,675 | 60,501,883 |
| Distributions to shareholders | | |
| Net investment income | | |
| Class A | (2,790,164) | (3,367,879) |
| Advisor Class | (32,632) | (31,047) |
| Class B | — | (6,842) |
| Class C | (164,543) | (242,563) |
| Class I | — | (1,846,811) |
| Institutional Class | (12,899,186) | (14,451,472) |
| Institutional 2 Class | (16,467) | (6,666) |
| Institutional 3 Class | (2,123,203) | (493,167) |
| Class R | (46,263) | (48,830) |
| Class T | (64) | (66) |
| Total distributions to shareholders | (18,072,522) | (20,495,343) |
| Decrease in net assets from capital stock activity | (55,488,120) | (57,880,107) |
| Total decrease in net assets | (35,449,967) | (17,873,567) |
| Net assets at beginning of year | 593,607,472 | 611,481,039 |
| Net assets at end of year | $558,157,505 | $593,607,472 |
| Undistributed net investment income | $4,845,224 | $5,828,077 |
The accompanying Notes to Financial Statements are an integral part of this statement.
| 16 | Columbia Global Dividend Opportunity Fund | Annual Report 2018 |
Statement of Changes in Net Assets (continued)
| | Year Ended | Year Ended |
| | August 31, 2018 | August 31, 2017 |
| | Shares | Dollars ($) | Shares | Dollars ($) |
| Capital stock activity |
| Class A | | | | |
| Subscriptions | 301,751 | 5,672,608 | 383,622 | 6,674,576 |
| Distributions reinvested | 134,471 | 2,538,124 | 178,845 | 3,077,201 |
| Redemptions | (979,090) | (18,745,306) | (1,461,049) | (25,361,994) |
| Net decrease | (542,868) | (10,534,574) | (898,582) | (15,610,217) |
| Advisor Class | | | | |
| Subscriptions | 11,591 | 224,578 | 4,462 | 78,747 |
| Distributions reinvested | 1,714 | 32,560 | 1,782 | 30,973 |
| Redemptions | (6,662) | (126,921) | (2,437) | (43,463) |
| Net increase | 6,643 | 130,217 | 3,807 | 66,257 |
| Class B | | | | |
| Subscriptions | — | — | 145 | 2,300 |
| Distributions reinvested | — | — | 281 | 4,478 |
| Redemptions | — | — | (26,432) | (434,120) |
| Net decrease | — | — | (26,006) | (427,342) |
| Class C | | | | |
| Subscriptions | 11,582 | 206,921 | 28,136 | 457,468 |
| Distributions reinvested | 8,968 | 159,104 | 13,274 | 213,959 |
| Redemptions | (291,033) | (5,111,690) | (220,080) | (3,632,823) |
| Net decrease | (270,483) | (4,745,665) | (178,670) | (2,961,396) |
| Class I | | | | |
| Subscriptions | — | — | 29,770 | 520,370 |
| Distributions reinvested | — | — | 108,438 | 1,846,748 |
| Redemptions | — | — | (3,877,313) | (68,144,985) |
| Net decrease | — | — | (3,739,105) | (65,777,867) |
| Institutional Class | | | | |
| Subscriptions | 361,156 | 6,897,051 | 649,068 | 11,381,207 |
| Distributions reinvested | 663,386 | 12,552,315 | 813,794 | 14,064,856 |
| Redemptions | (2,937,324) | (55,959,813) | (3,459,107) | (60,613,251) |
| Net decrease | (1,912,782) | (36,510,447) | (1,996,245) | (35,167,188) |
| Institutional 2 Class | | | | |
| Subscriptions | 3,423 | 64,093 | 39,205 | 708,839 |
| Distributions reinvested | 869 | 16,393 | 376 | 6,590 |
| Redemptions | (2,700) | (50,958) | (22,084) | (391,834) |
| Net increase | 1,592 | 29,528 | 17,497 | 323,595 |
| Institutional 3 Class | | | | |
| Subscriptions | 103,378 | 1,981,411 | 3,643,091 | 64,299,248 |
| Distributions reinvested | 112,334 | 2,123,127 | 27,158 | 493,090 |
| Redemptions | (410,212) | (7,848,185) | (178,282) | (3,223,791) |
| Net increase (decrease) | (194,500) | (3,743,647) | 3,491,967 | 61,568,547 |
| Class R | | | | |
| Subscriptions | 2,429 | 45,845 | 9,050 | 153,485 |
| Distributions reinvested | 2,452 | 46,263 | 2,838 | 48,830 |
| Redemptions | (10,460) | (205,640) | (5,629) | (96,811) |
| Net increase (decrease) | (5,579) | (113,532) | 6,259 | 105,504 |
| Total net decrease | (2,917,977) | (55,488,120) | (3,319,078) | (57,880,107) |
The accompanying Notes to Financial Statements are an integral part of this statement.
Columbia Global Dividend Opportunity Fund | Annual Report 2018
| 17 |
The following table is intended to help you understand the Fund’s financial performance. Certain information reflects financial results for a single share of a class held for the periods shown. Per share net investment income (loss) amounts are calculated based on average shares outstanding during the period. Total return assumes reinvestment of all dividends and distributions, if any. Total return does not reflect payment of sales charges, if any. Total return and portfolio turnover are not annualized for periods of less than one year. The portfolio turnover rate is calculated without regard to purchase and sales transactions of short-term instruments and certain derivatives, if any. If such transactions were included, the Fund’s portfolio turnover rate may be higher.
| | Net asset value,
beginning of
period | Net
investment
income | Net
realized
and
unrealized
gain (loss) | Total from
investment
operations | Distributions
from net
investment
income | Distributions
from net
realized
gains | Total
distributions to
shareholders |
| Class A |
| Year Ended 8/31/2018 | $18.24 | 0.48 | 0.65 | 1.13 | (0.54) | — | (0.54) |
| Year Ended 8/31/2017 | $17.05 | 0.49 | 1.26 | 1.75 | (0.56) | — | (0.56) |
| Year Ended 8/31/2016 | $16.56 | 0.47 | 0.42 | 0.89 | (0.40) | — | (0.40) |
| Year Ended 8/31/2015 | $21.63 | 0.58 | (2.93) | (2.35) | (0.70) | (2.02) | (2.72) |
| Year Ended 8/31/2014 | $19.85 | 0.61 | 2.53 | 3.14 | (0.54) | (0.82) | (1.36) |
| Advisor Class |
| Year Ended 8/31/2018 | $18.39 | 0.54 | 0.64 | 1.18 | (0.58) | — | (0.58) |
| Year Ended 8/31/2017 | $17.19 | 0.54 | 1.26 | 1.80 | (0.60) | — | (0.60) |
| Year Ended 8/31/2016 | $16.69 | 0.52 | 0.43 | 0.95 | (0.45) | — | (0.45) |
| Year Ended 8/31/2015 | $21.78 | 0.67 | (2.99) | (2.32) | (0.75) | (2.02) | (2.77) |
| Year Ended 8/31/2014 | $19.97 | 0.76 | 2.46 | 3.22 | (0.59) | (0.82) | (1.41) |
| Class C |
| Year Ended 8/31/2018 | $17.10 | 0.31 | 0.62 | 0.93 | (0.40) | — | (0.40) |
| Year Ended 8/31/2017 | $16.02 | 0.33 | 1.18 | 1.51 | (0.43) | — | (0.43) |
| Year Ended 8/31/2016 | $15.56 | 0.32 | 0.42 | 0.74 | (0.28) | — | (0.28) |
| Year Ended 8/31/2015 | $20.49 | 0.41 | (2.77) | (2.36) | (0.55) | (2.02) | (2.57) |
| Year Ended 8/31/2014 | $18.86 | 0.43 | 2.41 | 2.84 | (0.39) | (0.82) | (1.21) |
| Institutional Class |
| Year Ended 8/31/2018 | $18.30 | 0.53 | 0.65 | 1.18 | (0.58) | — | (0.58) |
| Year Ended 8/31/2017 | $17.11 | 0.54 | 1.25 | 1.79 | (0.60) | — | (0.60) |
| Year Ended 8/31/2016 | $16.61 | 0.51 | 0.43 | 0.94 | (0.44) | — | (0.44) |
| Year Ended 8/31/2015 | $21.69 | 0.63 | (2.94) | (2.31) | (0.75) | (2.02) | (2.77) |
| Year Ended 8/31/2014 | $19.90 | 0.67 | 2.53 | 3.20 | (0.59) | (0.82) | (1.41) |
| Institutional 2 Class |
| Year Ended 8/31/2018 | $18.26 | 0.56 | 0.64 | 1.20 | (0.61) | — | (0.61) |
| Year Ended 8/31/2017 | $17.07 | 0.60 | 1.22 | 1.82 | (0.63) | — | (0.63) |
| Year Ended 8/31/2016 | $16.58 | 0.54 | 0.42 | 0.96 | (0.47) | — | (0.47) |
| Year Ended 8/31/2015 | $21.66 | 0.64 | (2.92) | (2.28) | (0.78) | (2.02) | (2.80) |
| Year Ended 8/31/2014(e) | $20.57 | 0.39 | 1.01 | 1.40 | (0.31) | — | (0.31) |
The accompanying Notes to Financial Statements are an integral part of this statement.
| 18 | Columbia Global Dividend Opportunity Fund | Annual Report 2018 |
Financial Highlights (continued)
| | Net
asset
value,
end of
period | Total
return | Total gross
expense
ratio to
average
net assets(a) | Total net
expense
ratio to
average
net assets(a),(b) | Net investment
income
ratio to
average
net assets | Portfolio
turnover | Net
assets,
end of
period
(000’s) |
| Class A |
| Year Ended 8/31/2018 | $18.83 | 6.21% | 1.44% | 1.26% (c) | 2.52% | 39% | $93,177 |
| Year Ended 8/31/2017 | $18.24 | 10.48% | 1.46% (d) | 1.29% (c),(d) | 2.79% | 43% | $100,146 |
| Year Ended 8/31/2016 | $17.05 | 5.51% | 1.45% | 1.30% (c) | 2.85% | 115% | $108,978 |
| Year Ended 8/31/2015 | $16.56 | (11.49%) | 1.38% | 1.31% (c) | 3.05% | 63% | $118,275 |
| Year Ended 8/31/2014 | $21.63 | 16.40% | 1.27% | 1.25% (c) | 2.92% | 75% | $152,674 |
| Advisor Class |
| Year Ended 8/31/2018 | $18.99 | 6.47% | 1.19% | 1.01% (c) | 2.82% | 39% | $1,141 |
| Year Ended 8/31/2017 | $18.39 | 10.73% | 1.21% (d) | 1.04% (c),(d) | 3.08% | 43% | $983 |
| Year Ended 8/31/2016 | $17.19 | 5.80% | 1.20% | 1.05% (c) | 3.12% | 115% | $853 |
| Year Ended 8/31/2015 | $16.69 | (11.27%) | 1.16% | 1.04% (c) | 3.68% | 63% | $782 |
| Year Ended 8/31/2014 | $21.78 | 16.74% | 1.03% | 0.99% (c) | 3.56% | 75% | $113 |
| Class C |
| Year Ended 8/31/2018 | $17.63 | 5.42% | 2.19% | 2.01% (c) | 1.76% | 39% | $3,268 |
| Year Ended 8/31/2017 | $17.10 | 9.60% | 2.20% (d) | 2.04% (c),(d) | 2.03% | 43% | $7,795 |
| Year Ended 8/31/2016 | $16.02 | 4.82% | 2.20% | 2.05% (c) | 2.07% | 115% | $10,164 |
| Year Ended 8/31/2015 | $15.56 | (12.18%) | 2.13% | 2.06% (c) | 2.30% | 63% | $12,440 |
| Year Ended 8/31/2014 | $20.49 | 15.55% | 2.02% | 2.00% (c) | 2.17% | 75% | $16,136 |
| Institutional Class |
| Year Ended 8/31/2018 | $18.90 | 6.51% | 1.19% | 1.01% (c) | 2.78% | 39% | $395,163 |
| Year Ended 8/31/2017 | $18.30 | 10.72% | 1.21% (d) | 1.04% (c),(d) | 3.06% | 43% | $417,705 |
| Year Ended 8/31/2016 | $17.11 | 5.82% | 1.20% | 1.05% (c) | 3.10% | 115% | $424,724 |
| Year Ended 8/31/2015 | $16.61 | (11.28%) | 1.13% | 1.06% (c) | 3.30% | 63% | $457,640 |
| Year Ended 8/31/2014 | $21.69 | 16.70% | 1.02% | 1.00% (c) | 3.16% | 75% | $592,910 |
| Institutional 2 Class |
| Year Ended 8/31/2018 | $18.85 | 6.62% | 0.91% | 0.88% | 2.93% | 39% | $553 |
| Year Ended 8/31/2017 | $18.26 | 10.92% | 0.91% | 0.91% | 3.37% | 43% | $506 |
| Year Ended 8/31/2016 | $17.07 | 5.96% | 0.88% | 0.88% | 3.26% | 115% | $175 |
| Year Ended 8/31/2015 | $16.58 | (11.13%) | 0.87% | 0.87% | 3.52% | 63% | $178 |
| Year Ended 8/31/2014(e) | $21.66 | 6.85% | 0.88% (f) | 0.88% (f) | 2.98% (f) | 75% | $33 |
The accompanying Notes to Financial Statements are an integral part of this statement.
Columbia Global Dividend Opportunity Fund | Annual Report 2018
| 19 |
Financial Highlights (continued)
| | Net asset value,
beginning of
period | Net
investment
income | Net
realized
and
unrealized
gain (loss) | Total from
investment
operations | Distributions
from net
investment
income | Distributions
from net
realized
gains | Total
distributions to
shareholders |
| Institutional 3 Class |
| Year Ended 8/31/2018 | $18.29 | 0.57 | 0.65 | 1.22 | (0.62) | — | (0.62) |
| Year Ended 8/31/2017 | $17.10 | 0.68 | 1.15 | 1.83 | (0.64) | — | (0.64) |
| Year Ended 8/31/2016 | $16.60 | 0.53 | 0.45 | 0.98 | (0.48) | — | (0.48) |
| Year Ended 8/31/2015 | $21.68 | 0.70 | (2.96) | (2.26) | (0.80) | (2.02) | (2.82) |
| Year Ended 8/31/2014 | $19.89 | 0.72 | 2.54 | 3.26 | (0.65) | (0.82) | (1.47) |
| Class R |
| Year Ended 8/31/2018 | $18.21 | 0.43 | 0.65 | 1.08 | (0.49) | — | (0.49) |
| Year Ended 8/31/2017 | $17.03 | 0.45 | 1.24 | 1.69 | (0.51) | — | (0.51) |
| Year Ended 8/31/2016 | $16.53 | 0.42 | 0.44 | 0.86 | (0.36) | — | (0.36) |
| Year Ended 8/31/2015 | $21.61 | 0.53 | (2.94) | (2.41) | (0.65) | (2.02) | (2.67) |
| Year Ended 8/31/2014 | $19.83 | 0.57 | 2.52 | 3.09 | (0.49) | (0.82) | (1.31) |
| Class T |
| Year Ended 8/31/2018 | $18.23 | 0.48 | 0.65 | 1.13 | (0.54) | — | (0.54) |
| Year Ended 8/31/2017 | $17.05 | 0.49 | 1.25 | 1.74 | (0.56) | — | (0.56) |
| Year Ended 8/31/2016 | $16.56 | 0.47 | 0.43 | 0.90 | (0.41) | — | (0.41) |
| Year Ended 8/31/2015 | $21.62 | 0.60 | (2.93) | (2.33) | (0.71) | (2.02) | (2.73) |
| Year Ended 8/31/2014 | $19.83 | 0.61 | 2.55 | 3.16 | (0.55) | (0.82) | (1.37) |
| Notes to Financial Highlights |
| (a) | In addition to the fees and expenses that the Fund bears directly, the Fund indirectly bears a pro rata share of the fees and expenses of any other funds in which it invests. Such indirect expenses are not included in the Fund’s reported expense ratios. |
| (b) | Total net expenses include the impact of certain fee waivers/expense reimbursements made by the Investment Manager and certain of its affiliates, if applicable. |
| (c) | The benefits derived from expense reductions had an impact of: |
| Class | 8/31/2018 | 8/31/2017 | 8/31/2016 | 8/31/2015 | 8/31/2014 |
| Class A | 0.01% | 0.02% | 0.01% | 0.01% | 0.02% |
| Advisor Class | 0.02% | 0.02% | 0.01% | 0.02% | 0.03% |
| Class C | 0.02% | 0.02% | 0.01% | 0.01% | 0.02% |
| Institutional Class | 0.02% | 0.02% | 0.01% | 0.01% | 0.02% |
| Class R | 0.01% | 0.02% | 0.01% | 0.01% | 0.02% |
| Class T | 0.02% | 0.02% | 0.01% | 0.01% | 0.02% |
| (d) | Expenses have been reduced due to a reimbursement of expenses overbilled by a third party. If the reimbursement had been excluded, the expense ratios would have been higher by the percentages shown for each class in the table below. All fee waivers and expense reimbursements by the Investment Manager and its affiliates were applied before giving effect to this third party reimbursement. |
| Year Ended | Class A | Advisor
Class | Class C | Institutional
Class | Class R | Class T |
| 08/31/2017 | 0.01 % | 0.01 % | 0.01 % | 0.01 % | 0.01 % | 0.01 % |
| (e) | Institutional 2 Class shares commenced operations on January 8, 2014. Per share data and total return reflect activity from that date. |
| (f) | Annualized. |
The accompanying Notes to Financial Statements are an integral part of this statement.
| 20 | Columbia Global Dividend Opportunity Fund | Annual Report 2018 |
Financial Highlights (continued)
| | Net
asset
value,
end of
period | Total
return | Total gross
expense
ratio to
average
net assets(a) | Total net
expense
ratio to
average
net assets(a),(b) | Net investment
income
ratio to
average
net assets | Portfolio
turnover | Net
assets,
end of
period
(000’s) |
| Institutional 3 Class |
| Year Ended 8/31/2018 | $18.89 | 6.72% | 0.85% | 0.82% | 2.98% | 39% | $63,148 |
| Year Ended 8/31/2017 | $18.29 | 10.95% | 0.85% | 0.85% | 3.77% | 43% | $64,718 |
| Year Ended 8/31/2016 | $17.10 | 6.07% | 0.83% | 0.83% | 3.23% | 115% | $790 |
| Year Ended 8/31/2015 | $16.60 | (11.04%) | 0.82% | 0.82% | 3.89% | 63% | $1,149 |
| Year Ended 8/31/2014 | $21.68 | 17.00% | 0.81% | 0.81% | 3.33% | 75% | $3 |
| Class R |
| Year Ended 8/31/2018 | $18.80 | 5.95% | 1.69% | 1.51% (c) | 2.27% | 39% | $1,705 |
| Year Ended 8/31/2017 | $18.21 | 10.16% | 1.71% (d) | 1.54% (c),(d) | 2.57% | 43% | $1,753 |
| Year Ended 8/31/2016 | $17.03 | 5.32% | 1.70% | 1.55% (c) | 2.57% | 115% | $1,533 |
| Year Ended 8/31/2015 | $16.53 | (11.78%) | 1.62% | 1.55% (c) | 2.77% | 63% | $671 |
| Year Ended 8/31/2014 | $21.61 | 16.13% | 1.52% | 1.50% (c) | 2.72% | 75% | $1,280 |
| Class T |
| Year Ended 8/31/2018 | $18.82 | 6.21% | 1.48% | 1.26% (c) | 2.54% | 39% | $2 |
| Year Ended 8/31/2017 | $18.23 | 10.42% | 1.46% (d) | 1.29% (c),(d) | 2.82% | 43% | $2 |
| Year Ended 8/31/2016 | $17.05 | 5.59% | 1.45% | 1.30% (c) | 2.86% | 115% | $2 |
| Year Ended 8/31/2015 | $16.56 | (11.41%) | 1.38% | 1.31% (c) | 3.04% | 63% | $2 |
| Year Ended 8/31/2014 | $21.62 | 16.50% | 1.28% | 1.26% (c) | 2.85% | 75% | $3 |
The accompanying Notes to Financial Statements are an integral part of this statement.
Columbia Global Dividend Opportunity Fund | Annual Report 2018
| 21 |
Notes to Financial Statements
August 31, 2018
Note 1. Organization
Columbia Global Dividend Opportunity Fund (the Fund), a series of Columbia Funds Series Trust I (the Trust), is a diversified fund. The Trust is registered under the Investment Company Act of 1940, as amended (the 1940 Act), as an open-end management investment company organized as a Massachusetts business trust.
Fund shares
The Trust may issue an unlimited number of shares (without par value). Although all share classes generally have identical voting, dividend and liquidation rights, each share class votes separately when required by the Trust’s organizational documents or by law. Different share classes pay different distribution amounts to the extent the expenses of such share classes differ, and distributions in liquidation will be proportional to the net asset value of each share class. Each share class has its own expense and sales charge structure. The Fund offers each of the share classes identified below.
Class A shares are subject to a maximum front-end sales charge of 5.75% based on the initial investment amount. Class A shares purchased without an initial sales charge in accounts aggregating $1 million to $50 million at the time of purchase are subject to a contingent deferred sales charge (CDSC) if the shares are sold within 18 months after purchase, charged as follows: 1.00% CDSC if redeemed within 12 months after purchase, and 0.50% CDSC if redeemed more than 12, but less than 18, months after purchase.
Advisor Class shares are not subject to sales charges and are generally available only to omnibus retirement plans and certain investors as described in the Fund’s prospectus. Prior to November 1, 2017, Advisor Class shares were known as Class R4 shares.
Class C shares are subject to a 1.00% CDSC on shares redeemed within 12 months after purchase. Effective July 1, 2018, Class C shares will automatically convert to Class A shares of the same Fund in the month of or the month following the 10-year anniversary of the Class C shares purchase date.
Institutional Class shares are not subject to sales charges and are generally available only to eligible investors, which are subject to different investment minimums as described in the Fund’s prospectus. Prior to November 1, 2017, Institutional Class shares were known as Class Z shares.
Institutional 2 Class shares are not subject to sales charges and are generally available only to investors purchasing through authorized investment professionals and omnibus retirement plans as described in the Fund’s prospectus. Prior to November 1, 2017, Institutional 2 Class shares were known as Class R5 shares.
Institutional 3 Class shares are not subject to sales charges and are available to institutional and certain other investors as described in the Fund’s prospectus. Prior to November 1, 2017, Institutional 3 Class shares were known as Class Y shares.
Class R shares are not subject to sales charges and are generally available only to certain retirement plans and other investors as described in the Fund’s prospectus.
Class T shares are subject to a maximum front-end sales charge of 2.50% per transaction and must be purchased through financial intermediaries that, by written agreement with Columbia Management Investment Distributors, Inc., are specifically authorized to sell Class T shares.
Note 2. Summary of significant accounting policies
Basis of preparation
The Fund is an investment company that applies the accounting and reporting guidance in the Financial Accounting Standards Board (FASB) Accounting Standards Codification Topic 946, Financial Services - Investment Companies (ASC 946). The financial statements are prepared in accordance with U.S. generally accepted accounting principles (GAAP), which requires management to make certain estimates and assumptions that affect the reported amounts of assets and liabilities, the disclosure of contingent assets and liabilities at the date of the financial statements and the reported amounts of income and expenses during the reporting period. Actual results could differ from those estimates.
| 22 | Columbia Global Dividend Opportunity Fund | Annual Report 2018 |
Notes to Financial Statements (continued)
August 31, 2018
The following is a summary of significant accounting policies followed by the Fund in the preparation of its financial statements.
Security valuation
All equity securities are valued at the close of business of the New York Stock Exchange. Equity securities are valued at the last quoted sales price on the principal exchange or market on which they trade, except for securities traded on the NASDAQ Stock Market, which are valued at the NASDAQ official close price. Unlisted securities or listed securities for which there were no sales during the day are valued at the mean of the latest quoted bid and ask prices on such exchanges or markets.
Foreign equity securities are valued based on the closing price on the foreign exchange in which such securities are primarily traded. If any foreign equity security closing prices are not readily available, the securities are valued at the mean of the latest quoted bid and ask prices on such exchanges or markets. Foreign currency exchange rates are generally determined at 4:00 p.m. Eastern (U.S.) time. Many securities markets and exchanges outside the U.S. close prior to the close of the New York Stock Exchange; therefore, the closing prices for securities in such markets or on such exchanges may not fully reflect events that occur after such close but before the close of the New York Stock Exchange. In those situations, foreign securities will be fair valued pursuant to a policy adopted by the Board of Trustees, including, if available, utilizing a third party pricing service to determine these fair values. The third party pricing service takes into account multiple factors, including, but not limited to, movements in the U.S. securities markets, certain depositary receipts, futures contracts and foreign exchange rates that have occurred subsequent to the close of the foreign exchange or market, to determine a good faith estimate that reasonably reflects the current market conditions as of the close of the New York Stock Exchange. The fair value of a security is likely to be different from the quoted or published price, if available.
Investments in open-end investment companies, including money market funds, are valued at their latest net asset value.
Investments for which market quotations are not readily available, or that have quotations which management believes are not reflective of market value or reliable, are valued at fair value as determined in good faith under procedures approved by and under the general supervision of the Board of Trustees. If a security or class of securities (such as foreign securities) is valued at fair value, such value is likely to be different from the quoted or published price for the security.
The determination of fair value often requires significant judgment. To determine fair value, management may use assumptions including but not limited to future cash flows and estimated risk premiums. Multiple inputs from various sources may be used to determine fair value.
GAAP requires disclosure regarding the inputs and valuation techniques used to measure fair value and any changes in valuation inputs or techniques. In addition, investments shall be disclosed by major category. This information is disclosed following the Fund’s Portfolio of Investments.
Foreign currency transactions and translations
The values of all assets and liabilities denominated in foreign currencies are generally translated into U.S. dollars at exchange rates determined at the close of regular trading on the New York Stock Exchange. Net realized and unrealized gains (losses) on foreign currency transactions and translations include gains (losses) arising from the fluctuation in exchange rates between trade and settlement dates on securities transactions, gains (losses) arising from the disposition of foreign currency and currency gains (losses) between the accrual and payment dates on dividends, interest income and foreign withholding taxes.
For financial statement purposes, the Fund does not distinguish that portion of gains (losses) on investments which is due to changes in foreign exchange rates from that which is due to changes in market prices of the investments. Such fluctuations are included with the net realized and unrealized gains (losses) on investments in the Statement of Operations.
Security transactions
Security transactions are accounted for on the trade date. Cost is determined and gains (losses) are based upon the specific identification method for both financial statement and federal income tax purposes.
Columbia Global Dividend Opportunity Fund | Annual Report 2018
| 23 |
Notes to Financial Statements (continued)
August 31, 2018
Income recognition
Corporate actions and dividend income are generally recorded net of any non-reclaimable tax withholdings, on the ex-dividend date or upon receipt of ex-dividend notification in the case of certain foreign securities.
The Fund may receive distributions from holdings in equity securities, business development companies (BDCs), exchange-traded funds (ETFs), limited partnerships (LPs), other regulated investment companies (RICs), and real estate investment trusts (REITs), which report information on the tax character of their distributions annually. These distributions are allocated to dividend income, capital gain and return of capital based on actual information reported. Return of capital is recorded as a reduction of the cost basis of securities held. If the Fund no longer owns the applicable securities, return of capital is recorded as a realized gain. With respect to REITs, to the extent actual information has not yet been reported, estimates for return of capital are made by the Fund’s management. Management’s estimates are subsequently adjusted when the actual character of the distributions is disclosed by the REITs, which could result in a proportionate change in return of capital to shareholders.
Awards from class action litigation are recorded as a reduction of cost basis if the Fund still owns the applicable securities on the payment date. If the Fund no longer owns the applicable securities, the proceeds are recorded as realized gains.
Expenses
General expenses of the Trust are allocated to the Fund and other funds of the Trust based upon relative net assets or other expense allocation methodologies determined by the nature of the expense. Expenses directly attributable to the Fund are charged to the Fund. Expenses directly attributable to a specific class of shares are charged to that share class.
Determination of class net asset value
All income, expenses (other than class-specific expenses, which are charged to that share class, as shown in the Statement of Operations) and realized and unrealized gains (losses) are allocated to each class of the Fund on a daily basis, based on the relative net assets of each class, for purposes of determining the net asset value of each class.
Federal income tax status
The Fund intends to qualify each year as a regulated investment company under Subchapter M of the Internal Revenue Code, as amended, and will distribute substantially all of its investment company taxable income and net capital gain, if any, for its tax year, and as such will not be subject to federal income taxes. In addition, the Fund intends to distribute in each calendar year substantially all of its ordinary income, capital gain net income and certain other amounts, if any, such that the Fund should not be subject to federal excise tax. Therefore, no federal income or excise tax provision is recorded.
Foreign taxes
The Fund may be subject to foreign taxes on income, gains on investments or currency repatriation, a portion of which may be recoverable. The Fund will accrue such taxes and recoveries, as applicable, based upon its current interpretation of tax rules and regulations that exist in the markets in which it invests.
Realized gains in certain countries may be subject to foreign taxes at the Fund level, based on statutory rates. The Fund accrues for such foreign taxes on realized and unrealized gains at the appropriate rate for each jurisdiction, as applicable. The amount, if any, is disclosed as a liability on the Statement of Assets and Liabilities.
Distributions to shareholders
Distributions from net investment income, if any, are declared and paid each calendar quarter. Net realized capital gains, if any, are distributed at least annually. Income distributions and capital gain distributions are determined in accordance with federal income tax regulations, which may differ from GAAP.
| 24 | Columbia Global Dividend Opportunity Fund | Annual Report 2018 |
Notes to Financial Statements (continued)
August 31, 2018
Guarantees and indemnifications
Under the Trust’s organizational documents and, in some cases, by contract, its officers and trustees are indemnified against certain liabilities arising out of the performance of their duties to the Trust or its funds. In addition, certain of the Fund’s contracts with its service providers contain general indemnification clauses. The Fund’s maximum exposure under these arrangements is unknown since the amount of any future claims that may be made against the Fund cannot be determined, and the Fund has no historical basis for predicting the likelihood of any such claims.
Recent accounting pronouncement
Accounting Standards Update 2017-08 Premium Amortization on Purchased Callable Debt Securities
In March 2017, the Financial Accounting Standards Board issued Accounting Standards Update (ASU) No. 2017-08 Premium Amortization on Purchased Callable Debt Securities. ASU No. 2017-08 updates the accounting standards to shorten the amortization period for certain purchased callable debt securities, held at a premium, to be amortized to the earliest call date. The update applies to securities with explicit, noncontingent call features that are callable at fixed prices and on preset dates. The standard is effective for annual periods beginning after December 15, 2018 and interim periods within those fiscal years. At this time, management is evaluating the implication of this guidance and the impact it will have on the financial statement amounts and footnote disclosures, if any.
Note 3. Fees and other transactions with affiliates
Management services fees
The Fund has entered into a Management Agreement with Columbia Management Investment Advisers, LLC (the Investment Manager), a wholly-owned subsidiary of Ameriprise Financial, Inc. (Ameriprise Financial). Under the Management Agreement, the Investment Manager provides the Fund with investment research and advice, as well as administrative and accounting services. The management services fee is an annual fee that is equal to a percentage of the Fund’s daily net assets that declines from 0.77% to 0.57% as the Fund’s net assets increase. The effective management services fee rate for the year ended August 31, 2018 was 0.76% of the Fund’s average daily net assets.
Participating Affiliates
The Investment Manager and its investment advisory affiliates (Participating Affiliates) around the world may coordinate in providing services to their clients. From time to time the Investment Manager (or any affiliated investment subadviser to the Fund, as the case may be) may engage its Participating Affiliates to provide a variety of services such as investment research, investment monitoring, trading and discretionary investment management (including portfolio management) to certain accounts managed by the Investment Manager, including the Fund. These Participating Affiliates will provide services to the Investment Manager (or any affiliated investment subadviser to the Fund as the case may be) either pursuant to subadvisory agreements, personnel-sharing agreements or similar inter-company arrangements and the Fund will pay no additional fees and expenses as a result of any such arrangements.
These Participating Affiliates, like the Investment Manager, are direct or indirect subsidiaries of Ameriprise Financial and are registered with appropriate respective regulators in their home jurisdictions and, where required, the Securities and Exchange Commission and the Commodity Futures Trading Commission in the United States.
Pursuant to some of these arrangements, certain employees of these Participating Affiliates may serve as "associated persons" of the Investment Manager and, in this capacity, subject to the oversight and supervision of the Investment Manager and consistent with the investment objectives, policies and limitations set forth in the Fund’s prospectus and Statement of Additional Information (SAI), may provide such services to the Fund on behalf of the Investment Manager.
Columbia Global Dividend Opportunity Fund | Annual Report 2018
| 25 |
Notes to Financial Statements (continued)
August 31, 2018
Compensation of board members
Members of the Board of Trustees who are not officers or employees of the Investment Manager or Ameriprise Financial are compensated for their services to the Fund as disclosed in the Statement of Operations. These members of the Board of Trustees may participate in a Deferred Compensation Plan (the Plan) which may be terminated at any time. Obligations of the Plan will be paid solely out of the Fund’s assets, and all amounts payable under the Plan constitute a general unsecured obligation of the Fund.
Compensation of Chief Compliance Officer
The Board of Trustees has appointed a Chief Compliance Officer to the Fund in accordance with federal securities regulations. As disclosed in the Statement of Operations, a portion of the Chief Compliance Officer’s total compensation is allocated to the Fund, along with other allocations to affiliated funds governed by the Board of Trustees, based on relative net assets.
Transfer agency fees
Under a Transfer and Dividend Disbursing Agent Agreement, Columbia Management Investment Services Corp. (the Transfer Agent), an affiliate of the Investment Manager and a wholly-owned subsidiary of Ameriprise Financial, is responsible for providing transfer agency services to the Fund. The Transfer Agent has contracted with DST Asset Manager Solutions, Inc. (DST) to serve as sub-transfer agent. The Transfer Agent pays the fees of DST for services as sub-transfer agent and DST is not entitled to reimbursement for such fees from the Fund (with the exception of out-of-pocket fees).
The Fund pays the Transfer Agent a monthly transfer agency fee based on the number or the average value of accounts, depending on the type of account. In addition, the Fund pays the Transfer Agent a fee for shareholder services based on the number of accounts or on a percentage of the average aggregate value of the Fund’s shares maintained in omnibus accounts up to the lesser of the amount charged by the financial intermediary or a cap established by the Board of Trustees from time to time.
The Transfer Agent also receives compensation from the Fund for various shareholder services and reimbursements for certain out-of-pocket fees. Total transfer agency fees for Institutional 2 Class and Institutional 3 Class shares are subject to an annual limitation of not more than 0.07% and 0.02%, respectively, of the average daily net assets attributable to each share class.
For the year ended August 31, 2018, the Fund’s effective transfer agency fee rates as a percentage of average daily net assets of each class were as follows:
| | Effective rate (%) |
| Class A | 0.35 |
| Advisor Class | 0.35 |
| Class C | 0.35 |
| Institutional Class | 0.35 |
| Institutional 2 Class | 0.07 |
| Institutional 3 Class | 0.01 |
| Class R | 0.35 |
| Class T | 0.36 |
An annual minimum account balance fee of $20 may apply to certain accounts with a value below the applicable share class’s initial minimum investment requirements to reduce the impact of small accounts on transfer agency fees. These minimum account balance fees are remitted to the Fund and recorded as part of expense reductions in the Statement of Operations. For the year ended August 31, 2018, these minimum account balance fees reduced total expenses of the Fund by $79,214.
| 26 | Columbia Global Dividend Opportunity Fund | Annual Report 2018 |
Notes to Financial Statements (continued)
August 31, 2018
Distribution and service fees
The Fund has entered into an agreement with Columbia Management Investment Distributors, Inc. (the Distributor), an affiliate of the Investment Manager and a wholly-owned subsidiary of Ameriprise Financial, for distribution and shareholder services. The Board of Trustees has approved, and the Fund has adopted, distribution and shareholder service plans (the Plans) applicable to certain share classes, which set the distribution and service fees for the Fund. These fees are calculated daily and are intended to compensate the Distributor and/or eligible selling and/or servicing agents for selling shares of the Fund and providing services to investors.
Under the Plans, the Fund pays a monthly service fee to the Distributor at the maximum annual rate of 0.25% of the average daily net assets attributable to Class A, Class C and Class T shares of the Fund. Also under the Plans, the Fund pays a monthly distribution fee to the Distributor at the maximum annual rates of 0.75%, 0.50% and 0.25% of the average daily net assets attributable to Class C, Class R and Class T shares of the Fund, respectively.
Although the Fund may pay a distribution fee up to 0.25% of the Fund’s average daily net assets attributable to Class T shares and a service fee of up to 0.25% of the Fund’s average daily net assets attributable to Class T shares, the aggregate fee shall not exceed 0.25% of the Fund’s average daily net assets attributable to Class T shares.
Sales charges (unaudited)
Sales charges, including front-end charges and CDSCs, received by the Distributor for distributing Fund shares for the year ended August 31, 2018, if any, are listed below:
| | Amount ($) |
| Class A | 37,449 |
| Class C | 233 |
Expenses waived/reimbursed by the Investment Manager and its affiliates
The Investment Manager and certain of its affiliates have contractually agreed to waive fees and/or reimburse expenses (excluding certain fees and expenses described below) for the period(s) disclosed below, unless sooner terminated at the sole discretion of the Board of Trustees, so that the Fund’s net operating expenses, after giving effect to fees waived/expenses reimbursed and any balance credits and/or overdraft charges from the Fund’s custodian, do not exceed the following annual rate(s) as a percentage of the class’ average daily net assets:
| | January 1, 2018
through
December 31, 2018 | Prior to
January 1, 2018 |
| Class A | 1.25% | 1.30% |
| Advisor Class | 1.00 | 1.05 |
| Class C | 2.00 | 2.05 |
| Institutional Class | 1.00 | 1.05 |
| Institutional 2 Class | 0.87 | 0.925 |
| Institutional 3 Class | 0.81 | 0.875 |
| Class R | 1.50 | 1.55 |
| Class T | 1.25 | 1.30 |
Under the agreement governing these fee waivers and/or expense reimbursement arrangements, the following fees and expenses are excluded from the waiver/reimbursement commitment, and therefore will be paid by the Fund, if applicable: taxes (including foreign transaction taxes), expenses associated with investments in affiliated and non-affiliated pooled investment vehicles (including mutual funds and exchange-traded funds), transaction costs and brokerage commissions, costs related to any securities lending program, dividend expenses associated with securities sold short, inverse floater program fees and expenses, transaction charges and interest on borrowed money, interest, infrequent and/or unusual expenses and any other expenses the exclusion of which is specifically approved by the Board of Trustees. This
Columbia Global Dividend Opportunity Fund | Annual Report 2018
| 27 |
Notes to Financial Statements (continued)
August 31, 2018
agreement may be modified or amended only with approval from the Investment Manager, certain of its affiliates and the Fund. Any fees waived and/or expenses reimbursed under the expense reimbursement arrangements described above are not recoverable by the Investment Manager or its affiliates in future periods.
Note 4. Federal tax information
The timing and character of income and capital gain distributions are determined in accordance with income tax regulations, which may differ from GAAP because of temporary or permanent book to tax differences.
At August 31, 2018, these differences were primarily due to differing treatment for deferral/reversal of wash sale losses, passive foreign investment company (PFIC) holdings, re-characterization of distributions for investments, trustees’ deferred compensation, foreign currency transactions and investments in partnerships. To the extent these differences were permanent, reclassifications were made among the components of the Fund’s net assets in the Statement of Assets and Liabilities. Temporary differences do not require reclassifications.
In the Statement of Assets and Liabilities the following reclassifications were made:
Undistributed net
investment
income ($) | Accumulated
net realized
gain ($) | Paid in
capital ($) |
| 830,366 | (829,929) | (437) |
Net investment income (loss) and net realized gains (losses), as disclosed in the Statement of Operations, and net assets were not affected by this reclassification.
The tax character of distributions paid during the years indicated was as follows:
| Year Ended August 31, 2018 | Year Ended August 31, 2017 |
Ordinary
income ($) | Long-term
capital gains ($) | Total ($) | Ordinary
income ($) | Long-term
capital gains ($) | Total ($) |
| 18,072,522 | — | 18,072,522 | 20,495,343 | — | 20,495,343 |
Short-term capital gain distributions, if any, are considered ordinary income distributions for tax purposes.
At August 31, 2018, the components of distributable earnings on a tax basis were as follows:
Undistributed
ordinary income ($) | Undistributed
long-term
capital gains ($) | Capital loss
carryforwards ($) | Net unrealized
appreciation ($) |
| 4,578,640 | 7,751,324 | — | 48,754,629 |
At August 31, 2018, the cost of all investments for federal income tax purposes along with the aggregate gross unrealized appreciation and depreciation based on that cost was:
Federal
tax cost ($) | Gross unrealized
appreciation ($) | Gross unrealized
(depreciation) ($) | Net unrealized
appreciation ($) |
| 509,065,401 | 71,859,380 | (23,104,751) | 48,754,629 |
Tax cost of investments and unrealized appreciation/(depreciation) may also include timing differences that do not constitute adjustments to tax basis.
The following capital loss carryforwards, determined at August 31, 2018, may be available to reduce taxable income arising from future net realized gains on investments, if any, to the extent permitted by the Internal Revenue Code. Capital loss carryforwards with no expiration are required to be utilized prior to any capital losses which carry an expiration date. As a
| 28 | Columbia Global Dividend Opportunity Fund | Annual Report 2018 |
Notes to Financial Statements (continued)
August 31, 2018
result of this ordering rule, capital loss carryforwards which carry an expiration date may be more likely to expire unused. In addition, for the year ended August 31, 2018, capital loss carryforwards utilized, expired unused and permanently lost, if any, were as follows:
| 2019 ($) | No expiration
short-term ($) | No expiration
long-term ($) | Total ($) | Utilized ($) | Expired ($) | Permanently
lost ($) |
| — | — | — | — | 17,051,810 | — | — |
Management of the Fund has concluded that there are no significant uncertain tax positions in the Fund that would require recognition in the financial statements. However, management’s conclusion may be subject to review and adjustment at a later date based on factors including, but not limited to, new tax laws, regulations, and administrative interpretations (including relevant court decisions). Generally, the Fund’s federal tax returns for the prior three fiscal years remain subject to examination by the Internal Revenue Service.
Note 5. Portfolio information
The cost of purchases and proceeds from sales of securities, excluding short-term investments and derivatives, if any, aggregated to $227,055,674 and $288,344,392, respectively, for the year ended August 31, 2018. The amount of purchase and sale activity impacts the portfolio turnover rate reported in the Financial Highlights.
Note 6. Affiliated money market fund
The Fund invests in Columbia Short-Term Cash Fund, an affiliated money market fund established for the exclusive use by the Fund and other affiliated funds (the Affiliated MMF). The income earned by the Fund from such investments is included as Dividends - affiliated issuers in the Statement of Operations. As an investing fund, the Fund indirectly bears its proportionate share of the expenses of the Affiliated MMF. The Affiliated MMF prices its shares with a floating net asset value. In addition, the Board of Trustees of the Affiliated MMF may impose a fee on redemptions (sometimes referred to as a liquidity fee) or temporarily suspend redemptions (sometimes referred to as imposing a redemption gate) in the event its liquidity falls below regulatory limits.
Note 7. Interfund lending
Pursuant to an exemptive order granted by the Securities and Exchange Commission, the Fund participates in a program (the Interfund Program) allowing each participating Columbia Fund (each, a Participating Fund) to lend money directly to and, except for closed-end funds and money market funds, borrow money directly from other Participating Funds for temporary purposes. The amounts eligible for borrowing and lending under the Interfund Program are subject to certain restrictions.
Interfund loans are subject to the risk that the borrowing fund could be unable to repay the loan when due, and a delay in repayment to the lending fund could result in lost opportunities and/or additional lending costs. The exemptive order is subject to conditions intended to mitigate conflicts of interest arising from the Investment Manager’s relationship with each Participating Fund.
The Fund did not borrow or lend money under the Interfund Program during the year ended August 31, 2018.
Note 8. Line of credit
The Fund has access to a revolving credit facility with a syndicate of banks led by Citibank, N.A., HSBC Bank USA, N.A. and JPMorgan Chase Bank, N.A. whereby the Fund may borrow for the temporary funding of shareholder redemptions or for other temporary or emergency purposes. The credit facility, which is a collective agreement between the Fund and certain other funds managed by the Investment Manager, severally and not jointly, permits collective borrowings up to $1 billion. Interest is charged to each participating fund based on its borrowings at a rate equal to the higher of (i) the overnight federal funds rate plus 1.00% or (ii) the one-month LIBOR rate plus 1.00%. Each borrowing under the credit facility matures no later than 60 days after the date of borrowing. The Fund also pays a commitment fee equal to its pro rata share of the amount of the credit facility at a rate of 0.15% per annum. The commitment fee is included in other expenses in the Statement of Operations. This agreement expires annually in December unless extended or renewed.
Columbia Global Dividend Opportunity Fund | Annual Report 2018
| 29 |
Notes to Financial Statements (continued)
August 31, 2018
The Fund had no borrowings during the year ended August 31, 2018.
Note 9. Significant risks
Financial sector risk
The Fund may be more susceptible to the particular risks that may affect companies in the financial services sector than if it were invested in a wider variety of companies in unrelated sectors. Companies in the financial services sector are subject to certain risks, including the risk of regulatory change, decreased liquidity in credit markets and unstable interest rates. Such companies may have concentrated portfolios, such as a high level of loans to real estate developers, which makes them vulnerable to economic conditions that affect that industry. Performance of such companies may be affected by competitive pressures and exposure to investments or agreements that, under certain circumstances, may lead to losses (e.g., subprime loans). Companies in the financial services sector are subject to extensive governmental regulation that may limit the amount and types of loans and other financial commitments they can make, and interest rates and fees that they may charge. In addition, profitability of such companies is largely dependent upon the availability and the cost of capital.
Foreign securities and emerging market countries risk
Investing in foreign securities may include certain risks and considerations not typically associated with investing in U.S. securities, such as fluctuating currency values and changing local and regional economic, political and social conditions, which may result in greater market volatility. In addition, certain foreign securities may not be as liquid as U.S. securities. Investing in emerging markets may accentuate these risks. These countries are also more likely to experience high levels of inflation, deflation or currency devaluation which could hurt their economies and securities markets. To the extent that the Fund concentrates its investment exposure to any one or a few specific countries, the Fund will be particularly susceptible to the various conditions, events or other factors impacting those countries and may, therefore, have a greater risk than that of a fund which is more geographically diversified.
Shareholder concentration risk
At August 31, 2018, affiliated shareholders of record owned 12.3% of the outstanding shares of the Fund in one or more accounts. Subscription and redemption activity by concentrated accounts may have a significant effect on the operations of the Fund. In the case of a large redemption, the Fund may be forced to sell investments at inopportune times, including its liquid positions, which may result in Fund losses and the Fund holding a higher percentage of less liquid positions. Large redemptions could result in decreased economies of scale and increased operating expenses for non-redeeming Fund shareholders.
Note 10. Subsequent events
Management has evaluated the events and transactions that have occurred through the date the financial statements were issued and noted no items requiring adjustment of the financial statements or additional disclosure.
Note 11. Information regarding pending and settled legal proceedings
Ameriprise Financial and certain of its affiliates have historically been involved in a number of legal, arbitration and regulatory proceedings, including routine litigation, class actions, and governmental actions, concerning matters arising in connection with the conduct of their business activities. Ameriprise Financial believes that the Fund is not currently the subject of, and that neither Ameriprise Financial nor any of its affiliates are the subject of, any pending legal, arbitration or regulatory proceedings that are likely to have a material adverse effect on the Fund or the ability of Ameriprise Financial or its affiliates to perform under their contracts with the Fund. Ameriprise Financial is required to make quarterly (10-Q), annual (10-K) and, as necessary, 8-K filings with the Securities and Exchange Commission (SEC) on legal and regulatory matters that relate to Ameriprise Financial and its affiliates. Copies of these filings may be obtained by accessing the SEC website at www.sec.gov.
There can be no assurance that these matters, or the adverse publicity associated with them, will not result in increased Fund redemptions, reduced sale of Fund shares or other adverse consequences to the Fund. Further, although we believe proceedings are not likely to have a material adverse effect on the Fund or the ability of Ameriprise Financial or its affiliates to perform under their contracts with the Fund, these proceedings are subject to uncertainties and, as such, we are unable to
| 30 | Columbia Global Dividend Opportunity Fund | Annual Report 2018 |
Notes to Financial Statements (continued)
August 31, 2018
estimate the possible loss or range of loss that may result. An adverse outcome in one or more of these proceedings could result in adverse judgments, settlements, fines, penalties or other relief that could have a material adverse effect on the consolidated financial condition or results of operations of Ameriprise Financial.
Columbia Global Dividend Opportunity Fund | Annual Report 2018
| 31 |
Report of Independent Registered Public Accounting Firm
To the Board of Trustees of Columbia Funds Series Trust I and Shareholders of Columbia Global Dividend Opportunity Fund
Opinion on the Financial Statements
We have audited the accompanying statement of assets and liabilities, including the portfolio of investments, of Columbia Global Dividend Opportunity Fund (one of the funds constituting Columbia Funds Series Trust I, hereafter referred to as the “Fund”) as of August 31, 2018, the related statement of operations for the year ended August 31, 2018, the statement of changes in net assets for each of the two years in the period ended August 31, 2018, including the related notes, and the financial highlights for each of the five years in the period ended August 31, 2018, (collectively referred to as the “financial statements”). In our opinion, the financial statements present fairly, in all material respects, the financial position of the Fund as of August 31, 2018, the results of its operations for the year then ended, the changes in its net assets for each of the two years in the period ended August 31, 2018 and the financial highlights for each of the five years in the period ended August 31, 2018 in conformity with accounting principles generally accepted in the United States of America.
Basis for Opinion
These financial statements are the responsibility of the Fund’s management. Our responsibility is to express an opinion on the Fund’s financial statements based on our audits. We are a public accounting firm registered with the Public Company Accounting Oversight Board (United States) (“PCAOB”) and are required to be independent with respect to the Fund in accordance with the U.S. federal securities laws and the applicable rules and regulations of the Securities and Exchange Commission and the PCAOB.
We conducted our audits of these financial statements in accordance with the standards of the PCAOB. Those standards require that we plan and perform the audit to obtain reasonable assurance about whether the financial statements are free of material misstatement, whether due to error or fraud.
Our audits included performing procedures to assess the risks of material misstatement of the financial statements, whether due to error or fraud, and performing procedures that respond to those risks. Such procedures included examining, on a test basis, evidence regarding the amounts and disclosures in the financial statements. Our audits also included evaluating the accounting principles used and significant estimates made by management, as well as evaluating the overall presentation of the financial statements. Our procedures included confirmation of securities owned as of August 31, 2018, by correspondence with the custodian, transfer agent, and brokers; when replies were not received from brokers, we performed other audit procedures. We believe that our audits provide a reasonable basis for our opinion.
/s/PricewaterhouseCoopers LLP
Minneapolis, Minnesota
October 22, 2018
We have served as the auditor of one or more investment companies within the Columbia Funds Complex since 1977.
| 32 | Columbia Global Dividend Opportunity Fund | Annual Report 2018 |
Federal Income Tax Information
(Unaudited)
The Fund hereby designates the following tax attributes for the fiscal year ended August 31, 2018. Shareholders will be notified in early 2019 of the amounts for use in preparing 2018 income tax returns.
Qualified
dividend
income | Dividends
received
deduction | Capital
gain
dividend | Foreign
taxes paid
to foreign
countries | Foreign
taxes paid
per share
to foreign
countries | Foreign
source
income | Foreign
source
income per
share |
| 100.00% | 44.71% | $8,138,890 | $1,070,028 | $0.04 | $14,648,085 | $0.50 |
Qualified dividend income. For taxable, non-corporate shareholders, the percentage of ordinary income distributed during the fiscal year that represents qualified dividend income subject to reduced tax rates.
Dividends received deduction. The percentage of ordinary income distributed during the fiscal year that qualifies for the corporate dividends received deduction.
Capital gain dividend. The Fund designates as a capital gain dividend the amount reflected above, or if subsequently determined to be different, the net capital gain of such fiscal period.
Foreign taxes. The Fund makes the election to pass through to shareholders the foreign taxes paid. Eligible shareholders may claim a foreign tax credit. These taxes, and the corresponding foreign source income, are provided.
Columbia Global Dividend Opportunity Fund | Annual Report 2018
| 33 |
Shareholders elect the Board that oversees the Fund’s operations. The Board appoints officers who are responsible for day-to-day business decisions based on policies set by the Board. The following table provides basic biographical information about the Fund’s Trustees, including their principal occupations during the past five years, although specific titles for individuals may have varied over the period. The year set forth beneath Length of Service in the table below is the year in which the Trustee was first appointed or elected as Trustee to any Fund currently in the Columbia Funds Complex or a predecessor thereof. Under current Board policy, members serve terms of indefinite duration.
Independent trustees
| Name, address, year of birth | Position held with the Trust and length of service | Principal occupation(s) during the past five years and other relevant professional experience | Number of Funds in the Columbia Fund Complex overseen | Other directorships held by Trustee during the past five years |
Janet Langford Carrig
c/o Columbia Management
Investment Advisers, LLC
225 Franklin Street
Mail Drop BX32 05228
Boston, MA 02110
1957 | Trustee
1996 | Senior Vice President, General Counsel and Corporate Secretary, ConocoPhillips (independent energy company) since September 2007 | 69 | None |
Douglas A. Hacker
c/o Columbia Management
Investment Advisers, LLC
225 Franklin Street
Mail Drop BX32 05228
Boston, MA 02110
1955 | Trustee and Chairman of the Board
1996 | Independent business executive since May 2006; Executive Vice President — Strategy of United Airlines from December 2002 to May 2006; President of UAL Loyalty Services (airline marketing company) from September 2001 to December 2002; Executive Vice President and Chief Financial Officer of United Airlines from July 1999 to September 2001 | 69 | Spartan Nash Company, (food distributor); Nash Finch Company (food distributor) from 2005 to 2013; Aircastle Limited (aircraft leasing); SeaCube Container Leasing Ltd. (container leasing) from 2010 to 2013; and Travelport Worldwide Limited (travel information technology) |
Nancy T. Lukitsh
c/o Columbia Management
Investment Advisers, LLC
225 Franklin Street
Mail Drop BX32 05228
Boston, MA 02110
1956 | Trustee
2011 | Senior Vice President, Partner and Director of Marketing, Wellington Management Company, LLP (investment adviser) from 1997 to 2010; Chair, Wellington Management Portfolios (commingled non-U.S. investment pools) from 2007 to 2010; Director, Wellington Trust Company, NA and other Wellington affiliates from 1997 to 2010 | 69 | None |
David M. Moffett
c/o Columbia Management
Investment Advisers, LLC
225 Franklin Street
Mail Drop BX32 05228
Boston, MA 02110
1952 | Trustee
2011 | Retired. Consultant to Bridgewater and Associates | 69 | Director, CSX Corporation (transportation suppliers); Genworth Financial, Inc. (financial and insurance products and services); PayPal Holdings Inc. (payment and data processing services); Trustee, University of Oklahoma Foundation; former Director, eBay Inc. (online trading community), 2007-2015; and former Director, CIT Bank, CIT Group Inc. (commercial and consumer finance), 2010-2016 |
| 34 | Columbia Global Dividend Opportunity Fund | Annual Report 2018 |
TRUSTEES AND OFFICERS (continued)
Independent trustees (continued)
| Name, address, year of birth | Position held with the Trust and length of service | Principal occupation(s) during the past five years and other relevant professional experience | Number of Funds in the Columbia Fund Complex overseen | Other directorships held by Trustee during the past five years |
John J. Neuhauser
c/o Columbia Management
Investment Advisers, LLC
225 Franklin Street
Mail Drop BX32 05228
Boston, MA 02110
1943 | Trustee
1984 | President, Saint Michael’s College since August 2007; Director or Trustee of several non-profit organizations, including University of Vermont Medical Center; Academic Vice President and Dean of Faculties, Boston College from August 1999 to October 2005; University Professor, Boston College from November 2005 to August 2007 | 69 | Liberty All-Star Equity Fund and Liberty All- Star Growth Fund (closed-end funds) |
Patrick J. Simpson
c/o Columbia Management
Investment Advisers, LLC
225 Franklin Street
Mail Drop BX32 05228
Boston, MA 02110
1944 | Trustee
2000 | Of Counsel, Perkins Coie LLP (law firm) since 2015; Partner, Perkins Coie LLP from 1988 to 2014 | 69 | None |
Anne-Lee Verville
c/o Columbia Management
Investment Advisers, LLC
225 Franklin Street
Mail Drop BX32 05228
Boston, MA 02110
1945 | Trustee
1998 | Retired. General Manager, Global Education Industry from 1994 to 1997, President – Application Systems Division from 1991 to 1994, Chief Financial Officer – US Marketing & Services from 1988 to 1991, and Chief Information Officer from 1987 to 1988, IBM Corporation (computer and technology) | 69 | Enesco Group, Inc. (producer of giftware and home and garden decor products) from 2001 to 2006 |
Consultants to the Independent Trustees*
| Name, address, year of birth | Position held with the Trust and length of service | Principal occupation(s) during the past five years and other relevant professional experience | Number of Funds in the Columbia Funds complex overseen | Other directorships held by Trustee during the past five years |
J. Kevin Connaughton
c/o Columbia
Management Investment
Advisers, LLC,
225 Franklin Street
Mail Drop BX32 05228,
Boston, MA 02110
1964 | Independent Trustee Consultant
2016 | Independent Trustee Consultant, Columbia Funds since March 2016; Adjunct Professor of Finance, Bentley University since November 2017; Managing Director and General Manager of Mutual Fund Products, Columbia Management Investment Advisers, LLC from May 2010 to February 2015; President, Columbia Funds from 2009 to 2015; and senior officer of Columbia Funds and affiliated funds from 2003 to 2015 | 69 | Director, The Autism Project since March 2015; former Trustee, New Century Portfolios, March 2015-December 2017; formerly on Board of Governors, Gateway Healthcare, January 2016 – December 2017 |
Natalie A. Trunow
c/o Columbia
Management Investment
Advisers, LLC,
225 Franklin Street
Mail Drop BX32 05228,
Boston, MA 02110
1967 | Independent Trustee Consultant
2016 | Independent Trustee Consultant, Columbia Funds since September 2016; Chief Executive Officer, Millennial Portfolio Solutions LLC (asset management and consulting services) since January 2016; Director of Investments, Casey Family Programs from April 2016 to September 2016; Senior Vice President and Chief Investment Officer, Calvert Investments from August 2008 to January 2016; Section Head and Portfolio Manager, General Motors Asset Management from June 1997 to August 2008 | 69 | Director, Health Services for Children with Special Needs, Inc.; Director, Guidewell Financial Solutions |
| * | J. Kevin Connaughton was appointed consultant to the Independent Trustees effective March 1, 2016. Natalie A. Trunow was appointed consultant to the Independent Trustees effective September 1, 2016. Shareholders of the Funds are expected to be asked to elect each of Mr. Connaughton and Ms. Trunow as a Trustee at a future shareholder meeting. |
Columbia Global Dividend Opportunity Fund | Annual Report 2018
| 35 |
TRUSTEES AND OFFICERS (continued)
Interested trustee affiliated with Investment Manager*
| Name, address, year of birth | Position held with the Trust and length of service | Principal occupation(s) during the past five years and other relevant professional experience | Number of Funds in the Columbia Funds Complex overseen | Other directorships held by Trustee during the past five years |
William F. Truscott
c/o Columbia Management
Investment Advisers, LLC
225 Franklin Street
Boston, MA 02110
1960 | Trustee
2012 | Chairman of the Board and President, Columbia Management Investment Advisers, LLC since May 2010 and February 2012, respectively; Chief Executive Officer, Global Asset Management, Ameriprise Financial, Inc. since September 2012 (previously Chief Executive Officer, U.S. Asset Management & President, Annuities, May 2010-September 2012); Director and Chief Executive Officer, Columbia Management Investment Distributors, Inc. since May 2010 and February 2012, respectively; Chairman of the Board and Chief Executive Officer, RiverSource Distributors, Inc. since 2006; Director, Threadneedle Asset Management Holdings, SARL since 2014; President and Chief Executive Officer, Ameriprise Certificate Company, 2006-August 2012 | 193 | Chairman of the Board, Columbia Management Investment Advisers, LLC since May 2010; Director, Columbia Management Investment Distributors, Inc. since May 2010; former Director, Ameriprise Certificate Company, 2006 - January 2013 |
| * | Interested person (as defined under the 1940 Act) by reason of being an officer, director, security holder and/or employee of the Investment Manager or Ameriprise Financial. |
The Statement of Additional Information has additional information about the Fund’s Board members and is available, without charge, upon request by calling 800.345.6611, visiting columbiathreadneedleus.com/investor/ or contacting your financial intermediary.
| 36 | Columbia Global Dividend Opportunity Fund | Annual Report 2018 |
TRUSTEES AND OFFICERS (continued)
The Board has appointed officers who are responsible for day-to-day business decisions based on policies it has established. The officers serve at the pleasure of the Board. The following table provides basic information about the Officers of the Fund, including principal occupations during the past five years, although their specific titles may have varied over the period. In addition to Mr. Truscott, who is Senior Vice President, the Fund’s other officers are:
Fund officers
Name,
address and
year of birth | Position and year
first appointed to
position for any Fund
in the Columbia
Funds complex or a
predecessor thereof | Principal occupation(s) during past five years |
Christopher O. Petersen
5228 Ameriprise
Financial Center
Minneapolis, MN 55474
Born 1970 | President and Principal Executive Officer (2015) | Vice President and Lead Chief Counsel, Ameriprise Financial, Inc. since January 2015 (previously, Vice President and Chief Counsel, January 2010 - December 2014; officer of Columbia Funds and affiliated funds since 2007. |
Michael G. Clarke
225 Franklin Street
Boston, MA 02110
Born 1969 | Treasurer (2011), Chief Financial Officer (2009) and Chief Accounting Officer (2015) | Vice President — Mutual Fund Administration, Columbia Management Investment Advisers, LLC, since May 2010; senior officer of Columbia Funds and affiliated funds since 2002. |
Paul B. Goucher
100 Park Avenue
New York, NY 10017
Born 1968 | Senior Vice President (2011) and Assistant Secretary (2008) | Senior Vice President and Assistant General Counsel, Ameriprise Financial, Inc. since January 2017 (previously, Vice President and Lead Chief Counsel, November 2008 - January 2017 and January 2013 - January 2017, respectively); Vice President, Chief Legal Officer and Assistant Secretary, Columbia Management Investment Advisers, LLC since May 2010. |
Thomas P. McGuire
225 Franklin Street
Boston, MA 02110
Born 1972 | Senior Vice President and Chief Compliance Officer (2012) | Vice President — Asset Management Compliance, Ameriprise Financial, Inc., since May 2010; Chief Compliance Officer, Ameriprise Certificate Company since September 2010. |
Colin Moore
225 Franklin Street
Boston, MA 02110
Born 1958 | Senior Vice President (2010) | Executive Vice President and Global Chief Investment Officer, Ameriprise Financial, Inc., since July 2013; Executive Vice President and Global Chief Investment Officer, Columbia Management Investment Advisers, LLC since July 2013. |
Ryan C. Larrenaga
225 Franklin Street
Boston, MA 02110
Born 1970 | Senior Vice President (2017), Chief Legal Officer (2017) and Secretary (2015) | Vice President and Chief Counsel, Ameriprise Financial, Inc. since August 2018 (previously, Vice President and Group Counsel, August 2011 - August 2018); officer of Columbia Funds and affiliated funds since 2005. |
Michael E. DeFao
225 Franklin Street
Boston, MA 02110
Born 1968 | Vice President (2011) and Assistant Secretary (2010) | Vice President and Chief Counsel, Ameriprise Financial, Inc. since May 2010. |
Amy Johnson
5228 Ameriprise
Financial Center
Minneapolis, MN 55474
Born 1965 | Vice President (2006) | Managing Director and Global Head of Operations, Columbia Management Investment Advisers, LLC since April 2016 (previously Managing Director and Chief Operating Officer, 2010 - 2016). |
Lyn Kephart-Strong
5228 Ameriprise
Financial Center
Minneapolis, MN 55474
Born 1960 | Vice President (2015) | President, Columbia Management Investment Services Corp. since October 2014; Vice President & Resolution Officer, Ameriprise Trust Company since August 2009. |
Columbia Global Dividend Opportunity Fund | Annual Report 2018
| 37 |
Board Consideration and Approval of Management
Agreement
On June 12, 2018, the Board of Trustees (the Board) and the Trustees who are not interested persons (as defined in the Investment Company Act of 1940) (the Independent Trustees) of Columbia Funds Series Trust I (the Trust) unanimously approved the continuation of the Management Agreement (the Management Agreement) with Columbia Management Investment Advisers, LLC (the Investment Manager) with respect to Columbia Global Dividend Opportunity Fund (the Fund), a series of the Trust. As detailed below, the Board’s Advisory Fees and Expenses Committee (the Committee) and the Board met on multiple occasions to review and discuss, among themselves, with the management team of the Investment Manager and with an independent fee consultant, materials provided by the Investment Manager, the independent fee consultant and others before determining to approve the continuation of the Management Agreement.
In connection with their deliberations regarding the continuation of the Management Agreement, the Committee and the Board evaluated materials requested from the Investment Manager regarding the Fund and the Management Agreement, and discussed these materials with representatives of the Investment Manager at Committee meetings held on March 6, 2018, April 26, 2018 and June 11, 2018 and at Board meetings held on March 7, 2018 and June 12, 2018. In addition, the Board and its various committees consider matters bearing on the Management Agreement at other meetings throughout the year and in prior years and meet regularly with senior management of the Trust and the Investment Manager. Through the Board’s Investment Oversight Committees, Trustees also meet with selected portfolio managers of the funds the Trustees oversee and with other investment personnel at various times throughout the year. The Committee and the Board also consulted with the independent fee consultant, Fund counsel and the Independent Trustees’ independent legal counsel, who advised on various matters with respect to the Committee’s and the Board’s considerations and otherwise assisted the Committee and the Board in their deliberations. On June 11, 2018, the Committee recommended that the Board approve the continuation of the Management Agreement. On June 12, 2018, the Board, including the Independent Trustees, voting separately, unanimously approved the continuation of the Management Agreement for the Fund.
The Committee and the Board considered all information that they, their legal counsel or the Investment Manager believed reasonably necessary to evaluate and to determine whether to recommend for approval or approve the continuation of the Management Agreement. The information and factors considered by the Committee and the Board in recommending for approval or approving the continuation of the Management Agreement for the Fund included the following:
| • | Information on the investment performance of the Fund relative to the performance of a group of mutual funds determined to be comparable to the Fund by an independent third-party data provider, as well as performance relative to benchmarks; |
| • | Information on the Fund’s management fees and total expenses, including information comparing the Fund’s expenses to those of a group of comparable mutual funds, as determined by the independent third-party data provider; |
| • | The Investment Manager’s agreement to contractually limit or cap total operating expenses for the Fund through December 31, 2019 so that total operating expenses (excluding certain fees and expenses, such as transaction costs and certain other investment related expenses, interest, taxes, acquired fund fees and expenses, and infrequent and/or unusual expenses) would not exceed a specified annual rate, as a percentage of the Fund’s net assets; |
| • | The terms and conditions of the Management Agreement; |
| • | The current and proposed terms and conditions of other agreements and arrangements with affiliates of the Investment Manager relating to the operations of the Fund, including agreements with respect to the provision of distribution, transfer agency and shareholder services to the Fund; |
| • | Descriptions of various functions performed by the Investment Manager under the Management Agreement, including portfolio management and portfolio trading practices; |
| • | Information regarding the management fees of similarly-managed portfolios of other clients of the Investment Manager, including institutional accounts and collective trusts; |
| • | Information regarding the reputation, regulatory history and resources of the Investment Manager, including information regarding senior management, portfolio managers and other personnel; |
| 38 | Columbia Global Dividend Opportunity Fund | Annual Report 2018 |
Board Consideration and Approval of Management
Agreement (continued)
| • | Information regarding the capabilities of the Investment Manager with respect to compliance monitoring services, including an assessment of the Investment Manager’s compliance system by the Fund’s Chief Compliance Officer; and |
| • | The profitability to the Investment Manager and its affiliates from their relationships with the Fund. |
Nature, extent and quality of services provided under the Management Agreement
The Committee and the Board considered the nature, extent and quality of services provided to the Fund by the Investment Manager and its affiliates under the Management Agreement and under separate agreements for the provision of transfer agency and shareholder services, and the resources dedicated to the Fund and the other Columbia Funds by the Investment Manager and its affiliates. The Committee and the Board considered, among other things, the Investment Manager’s ability to attract, motivate and retain highly qualified research, advisory and supervisory investment professionals (including compensation programs for personnel involved in fund management, reputation and other attributes), the portfolio management services provided by those investment professionals, and the quality of the Investment Manager’s investment research capabilities and trade execution services. The Committee and the Board also considered the potential benefits to shareholders of investing in a mutual fund that is part of a fund complex offering exposure to a variety of asset classes and investment disciplines and providing a variety of fund and shareholder services.
The Committee and the Board also considered the professional experience and qualifications of the senior personnel of the Investment Manager, which included consideration of the Investment Manager’s experience with similarly-structured funds. The Committee and the Board noted the compliance programs of and the compliance-related resources provided to the Fund by the Investment Manager and its affiliates and the resources dedicated by the Investment Manager and its affiliates to risk management, and considered the Investment Manager’s ability to provide administrative services to the Fund and coordinate the activities of the Fund’s other service providers. After reviewing these and related factors, the Committee and the Board concluded, within the context of their overall conclusions, that the nature, extent and quality of the services provided to the Fund under the Management Agreement supported the continuation of the Management Agreement.
Investment performance
The Committee and the Board reviewed information about the performance of the Fund over various time periods, including performance information relative to benchmarks, information that compared the performance of the Fund to the performance of a group of comparable mutual funds as determined by the independent third-party data provider, and information and analysis provided by the independent fee consultant. The Committee and the Board also reviewed a description of the third party’s methodology for identifying the Fund’s peer groups for purposes of performance and expense comparisons. Although the Fund’s performance lagged that of a relevant peer group for certain (although not necessarily all) periods, the Committee and the Board concluded that other factors relevant to performance were sufficient, in light of other considerations, to support continuation of the Management Agreement. Those factors included one or more of the following: (i) that the Fund’s performance, although lagging in certain recent periods, was stronger over the longer term; (ii) that the underperformance was attributable, to a significant extent, to investment decisions that were reasonable and consistent with the Fund’s investment strategy and policies and that the Fund was performing within a reasonable range of expectations, given those investment decisions, market conditions and the Fund’s investment strategy; (iii) that the Fund’s performance was competitive when compared to other relevant performance benchmarks or peer groups; and (iv) that the Investment Manager had taken or was taking steps designed to help improve the Fund’s investment performance, including, but not limited to, replacing portfolio managers, enhancing the resources supporting the portfolio managers, or modifying investment strategies.
The Committee and the Board noted that, through December 31, 2017, the Fund’s performance was in the twenty-ninth, eighty-seventh and eighty-ninth percentile (where the best performance would be in the first percentile) of its category selected by the independent third-party data provider for the purposes of performance comparisons for the one-, three- and five-year periods, respectively.
The Committee and the Board also considered the Investment Manager’s performance and reputation generally, the Investment Manager’s historical responsiveness to Board concerns about performance, and the Investment Manager’s willingness to take steps intended to improve performance. After reviewing these and related factors, the Committee and the Board concluded, within the context of their overall conclusions, that the performance of the Fund and the Investment Manager was sufficient, in light of other considerations, to support the continuation of the Management Agreement.
Columbia Global Dividend Opportunity Fund | Annual Report 2018
| 39 |
Board Consideration and Approval of Management
Agreement (continued)
Investment management fee rates and other expenses
The Committee and the Board considered the management fees charged to the Fund under the Management Agreement as well as the total expenses incurred by the Fund. In assessing the reasonableness of the fees under the Management Agreement, the Committee and the Board considered, among other information, the Fund’s total expense ratio as a percentage of average daily net assets. The Committee and the Board considered data provided by the independent third-party data provider and the independent fee consultant. The Committee and the Board noted that, as of December 31, 2017, the Fund’s actual management fee and net total expense ratio were ranked in the first and third quintiles, respectively, (where the lowest fees and expenses would be in the first quintile) against the Fund’s expense universe as determined by the independent third-party data provider for purposes of expense comparison. The Committee and the Board also took into account the fee waiver and expense limitation arrangements agreed to by the Investment Manager, as noted above.
The Committee and the Board also received and considered information about the management fees charged by the Investment Manager to institutional accounts. In considering the fees charged to those accounts, the Committee and the Board took into account, among other things, the Investment Manager’s representations about the differences between managing mutual funds as compared to other types of accounts, including differences in the services provided, differences in the risk profile of such business for the Investment Manager and the additional resources required to manage mutual funds effectively. The Committee and the Board also received and considered information about the fees charged by the Investment Manager for sub-advisory services it provides to comparable unaffiliated funds. In evaluating the Fund’s management fees, the Committee and the Board also took into account the demands, complexity and quality of the investment management of the Fund.
After reviewing these and related factors, the Committee and the Board concluded, within the context of their overall conclusions, that the management fee rates and expenses of the Fund, in light of other considerations, supported the continuation of the Management Agreement.
Costs of services provided and profitability
The Committee and the Board also took note of the costs the Investment Manager and its affiliates incur in connection with the services provided and the profitability to the Investment Manager and its affiliates from their relationships with the Fund.
The Committee and the Board also considered the compensation directly or indirectly received by the Investment Manager’s affiliates in connection with their relationships with the Fund. The Committee and the Board reviewed information provided by management as to the profitability to the Investment Manager and its affiliates of their relationships with the Fund, information about the allocation of expenses used to calculate profitability, and comparisons of profitability levels realized in 2017 to profitability levels realized in 2016. When reviewing profitability, the Committee and the Board also considered court cases in which adviser profitability was an issue in whole or in part, the performance of similarly managed funds, the performance of the Fund, and the expense ratio of the Fund. In addition, the Committee and the Board considered information provided by the Investment Manager regarding the Investment Manager’s financial condition and comparing its profitability to that of other asset management firms that are, or are subsidiaries of, publicly traded companies. In this regard, the Committee and the Board also considered data provided by the independent fee consultant.
After reviewing these and related factors, the Committee and the Board concluded, within the context of their overall conclusions, that the costs of services provided and the profitability to the Investment Manager and its affiliates from their relationships with the Fund supported the continuation of the Management Agreement.
Economies of scale
The Committee and the Board considered the potential existence of economies of scale in the provision by the Investment Manager of services to the Fund, to groups of related funds, and to the Investment Manager’s investment advisory clients as a whole, and whether those economies of scale were shared with the Fund through breakpoints in investment management fees or other means, such as expense limitation arrangements and additional investments by the Investment Manager in investment, trading, compliance and other resources. The Committee and the Board noted that the management fee schedules for the Fund contained breakpoints that would reduce the fee rate on assets above specified threshold levels.
| 40 | Columbia Global Dividend Opportunity Fund | Annual Report 2018 |
Board Consideration and Approval of Management
Agreement (continued)
In considering these matters, the Committee and the Board also considered the costs of the services provided and the profitability to the Investment Manager and its affiliates from their relationships with the Fund, as noted above. After reviewing these and related factors, the Committee and the Board concluded, within the context of their overall conclusions, that the extent to which any economies of scale were expected to be shared with the Fund supported the continuation of the Management Agreement.
Other benefits to the Investment Manager
The Committee and the Board received and considered information regarding “fall-out” or ancillary benefits received by the Investment Manager and its affiliates as a result of their relationships with the Fund, such as the engagement of the Investment Manager’s affiliates to provide distribution, transfer agency and shareholder services to the Fund. In this regard, among other matters, the Committee and the Board considered that the Fund’s distributor retains a portion of the distribution fees from the Fund and receives a portion of the sales charges on sales or redemptions of certain classes of shares of the Fund. The Committee and the Board also considered the benefits of research made available to the Investment Manager by reason of brokerage commissions generated by the Fund’s securities transactions, and reviewed information about the Investment Manager’s practices with respect to considering brokerage and research services when allocating portfolio transactions. In this connection, the Board also noted that the amount of research made available to the Investment Manager by reason of brokerage commissions had been declining over time, and may decline further. The Committee and the Board recognized that the Investment Manager’s profitability would be somewhat lower without these benefits.
Conclusion
The Committee and the Board reviewed all of the above considerations in reaching their decisions to recommend or approve the continuation of the Management Agreement. In their deliberations, the Trustees did not identify any particular information that was all-important or controlling, and individual Trustees may have attributed different weights to the various factors. Based on their evaluation of all factors that they deemed to be material, including those factors described above, and assisted by the advice of independent legal counsel, the Board, including the Independent Trustees, voting separately, unanimously approved the continuation of the Management Agreement.
Columbia Global Dividend Opportunity Fund | Annual Report 2018
| 41 |
The Fund mails one shareholder report to each shareholder address. If you would like more than one report, please call shareholder services at 800.345.6611 and additional reports will be sent to you.
Proxy voting policies and procedures
The policy of the Board of Trustees is to vote the proxies of the companies in which the Fund holds investments consistent with the procedures as stated in the Statement of Additional Information (SAI). You may obtain a copy of the SAI without charge by calling 800.345.6611; contacting your financial intermediary; visiting columbiathreadneedleus.com/investor/; or searching the website of the Securities and Exchange Commission (SEC) at sec.gov. Information regarding how the Fund voted proxies relating to portfolio securities is filed with the SEC by August 31st for the most recent 12-month period ending June 30th of that year, and is available without charge by visiting columbiathreadneedleus.com/investor/, or searching the website of the SEC at sec.gov.
Quarterly schedule of investments
The Fund files a complete schedule of portfolio holdings with the SEC for the first and third quarters of each fiscal year on Form N-Q or Form N-PORT. The Fund’s Form N-Q or Form N-PORT is available on the SEC’s website at sec.gov and may be reviewed and copied at the SEC’s Public Reference Room in Washington, D.C. Information on the operation of the Public Reference Room may be obtained by calling 800.SEC.0330. The Fund’s complete schedule of portfolio holdings, as filed on Form N-Q or Form N-PORT, can also be obtained without charge, upon request, by calling 800.345.6611.
Additional Fund information
For more information about the Fund, please visit columbiathreadneedleus.com/investor/ or call 800.345.6611. Customer Service Representatives are available to answer your questions Monday through Friday from 8 a.m. to 7 p.m. Eastern time.
Fund investment manager
Columbia Management Investment Advisers, LLC
225 Franklin Street
Boston, MA 02110
Fund distributor
Columbia Management Investment Distributors, Inc.
225 Franklin Street
Boston, MA 02110
Fund transfer agent
Columbia Management Investment Services Corp.
Through October 31, 2018:
P.O. Box 8081
Boston, MA 02266-8081
Effective November 1, 2018:
P.O. Box 219104
Kansas City, MO 64121-9104
| 42 | Columbia Global Dividend Opportunity Fund | Annual Report 2018 |
[THIS PAGE INTENTIONALLY LEFT BLANK]
[THIS PAGE INTENTIONALLY LEFT BLANK]
[THIS PAGE INTENTIONALLY LEFT BLANK]
Columbia Global Dividend Opportunity Fund
Through October 31, 2018:
P.O. Box 8081
Boston, MA 02266-8081
Effective November 1, 2018:
P.O. Box 219104
Kansas City, MO 64121-9104
Please read and consider the investment objectives, risks, charges and expenses for any fund carefully before investing. For a prospectus and summary prospectus, which contains this and other important information about the Fund, go to
columbiathreadneedleus.com/investor/. The Fund is distributed by Columbia Management Investment Distributors, Inc., member FINRA, and managed by Columbia Management Investment Advisers, LLC.
Columbia Threadneedle Investments (Columbia Threadneedle) is the global brand name of the Columbia and Threadneedle group of companies. All rights reserved.
© 2018 Columbia Management Investment Advisers, LLC.
columbiathreadneedleus .com/investor/

Annual Report
August 31, 2018
Columbia Global Technology Growth Fund
Not FDIC Insured • No bank guarantee • May lose value
Dear Shareholders,
Volatility exists in financial markets and this is not a comfortable fact of life. How investors deal with this reality, including how they react to short term spikes in volatility as well as to longer periods of increased or decreased volatility, may have a significant impact on their overall investing success.
Too often, investors change their investment strategy based on something that’s happening at a moment in time rather than thinking about how that change in strategy might affect their ability to achieve their longer-term financial goals. Emotion replaces logic and reasoning. Investors may sell in reaction to a market drop (fear or panic), locking in low returns which means they won’t be invested when the market returns, or they invest more at a market peak (greed or conviction), essentially when it is expensive to do so. In both cases, selling and buying at the exact wrong time.
We believe the best outcomes come from a consistent approach to investing. Here are five areas where advisors can help us overcome the tendency to react emotionally as we struggle to make the right choices with our investments:
Long-term focus
The further away long-term goals, aspirations and objectives are, the easier it is to stray away from the goals and priorities that we set out. Advisors help us stay focused on what we want to accomplish.
Discipline through up-and-down markets
Advisors help set rules to prevent us from making rash decisions that we may regret later. Knowing ahead of time what you should do in case of certain situations will help you get through volatile markets and not make emotional decisions.
Tax-awareness
Taxes are one of the biggest drags on investment returns and are critical attributes of investing. Yet few of us take the necessary steps to ease the corrosive effect of taxes. Advisors have tools and knowledge that may help us to manage portfolios more tax-efficiently and keep more of what we earn.
Emotional objectivity
Our emotions are very hard to manage and making investment decisions in an emotional state can lead to exceedingly bad outcomes. An objective advisor can help prevent some of the reactionary mistakes emotions often lead us to.
Education and guidance
The role of the advisor is to teach and guide us toward achieving our financial goals. In terms of working through emotions, guidance is by far the most important component.
By understanding our own behaviors and biases, we can prepare for future challenges. Your success is our priority. Talk to your advisor about how working with Columbia Threadneedle Investments may help you stay the course and position your portfolio for consistent, sustainable outcomes, regardless of market conditions.
Sincerely,
Christopher O. Petersen
President, Columbia Funds
Columbia Funds are distributed by Columbia Management Investment Distributors, Inc., member FINRA, and managed by Columbia Management Investment Advisers, LLC.
© 2018 Columbia Management Investment Advisers, LLC. All rights reserved.
Columbia Global Technology Growth Fund | Annual Report 2018
Columbia Global Technology Growth Fund | Annual Report 2018
Investment objective
Columbia Global Technology Growth Fund (the Fund) seeks capital appreciation by investing, under normal market conditions, at least 80% of its total net assets (plus any borrowings for investment purposes) in stocks of technology companies that may benefit from technological improvements, advancements or developments.
Portfolio management
Rahul Narang
Portfolio Manager
Managed Fund since 2012
Morningstar style boxTM
The Morningstar Style Box is based on a fund’s portfolio holdings. For equity funds, the vertical axis shows the market capitalization of the stocks owned, and the horizontal axis shows investment style (value, blend, or growth). Information shown is based on the most recent data provided by Morningstar.
© 2018 Morningstar, Inc. All rights reserved. The Morningstar information contained herein: (1) is proprietary to Morningstar and/or its content providers; (2) may not be copied or distributed; and (3) is not warranted to be accurate, complete or timely. Neither Morningstar nor its content providers are responsible for any damages or losses arising from any use of this information.
| Average annual total returns (%) (for the period ended August 31, 2018) |
| | | Inception | 1 Year | 5 Years | 10 Years |
| Class A | Excluding sales charges | 11/01/02 | 31.32 | 24.42 | 15.24 |
| | Including sales charges | | 23.79 | 22.96 | 14.56 |
| Advisor Class* | 11/08/12 | 31.65 | 24.72 | 15.53 |
| Class C | Excluding sales charges | 10/13/03 | 30.31 | 23.50 | 14.37 |
| | Including sales charges | | 29.31 | 23.50 | 14.37 |
| Institutional Class | 11/09/00 | 31.64 | 24.74 | 15.52 |
| Institutional 2 Class* | 11/08/12 | 31.73 | 24.88 | 15.61 |
| Institutional 3 Class* | 03/01/16 | 31.77 | 24.83 | 15.56 |
| S&P Global 1200 Information Technology Index (Net) | | 26.99 | 21.05 | 13.35 |
Returns for Class A shares are shown with and without the maximum initial sales charge of 5.75%. Returns for Class C shares are shown with and without the 1.00% contingent deferred sales charge for the first year only. The Fund’s other share classes are not subject to sales charges and have limited eligibility. Effective November 1, 2017, Class R4, Class R5, Class Y and Class Z shares were renamed Advisor Class, Institutional 2 Class, Institutional 3 Class and Institutional Class shares, respectively. Please see the Fund’s prospectus for details. Performance for different share classes will vary based on differences in sales charges and fees associated with each share class. All results shown assume reinvestment of distributions during the period. Returns do not reflect the deduction of taxes that a shareholder may pay on Fund distributions or on the redemption of Fund shares. Performance results reflect the effect of any fee waivers or reimbursements of Fund expenses by Columbia Management Investment Advisers, LLC and/or any of its affiliates. Absent these fee waivers or expense reimbursement arrangements, performance results would have been lower.
The performance information shown represents past performance and is not a guarantee of future results. The investment return and principal value of your investment will fluctuate so that your shares, when redeemed, may be worth more or less than their original cost. Current performance may be lower or higher than the performance information shown. You may obtain performance information current to the most recent month-end by contacting your financial intermediary, visiting columbiathreadneedleus.com/investor/ or calling 800.345.6611.
| * | The returns shown for periods prior to the share class inception date (including returns for the Life of the Fund, if shown, which are since Fund inception) include the returns of the Fund’s oldest share class. These returns are adjusted to reflect any higher class-related operating expenses of the newer share classes, as applicable. Please visit columbiathreadneedleus.com/investor/investment-products/mutual-funds/appended-performance for more information. |
The Fund’s performance prior to July 2014 reflects returns achieved pursuant to different principal investment strategies. If the Fund’s current strategies had been in place for the prior periods, results shown may have been different.
Effective September 30, 2017, the Fund compares its performance to the S&P Global 1200 Information Technology Index (Total Return). Prior to this date, the Fund compared its performance to that of the ICE BofA Merrill Lynch 100 Technology Index. The Fund’s investment manager recommended this change because the Fund was notified that the ICE BofA Merrill Lynch 100 Technology Index would be discontinued on October 13, 2017.
Effective March 30, 2018 (the Effective Date), the Fund compares its performance to that of the S&P Global 1200 Information Technology Index (Net) (the New Index). Prior to this date, the Fund compared its performance to that of the S&P Global 1200 Information Technology Index (Total Return) (the Former Index). The Fund’s investment manager believes that the New Index provides a more appropriate basis for comparing the Fund’s performance.
The S&P Global 1200 Information Technology Index (Net) is a float-adjusted, market-cap-weighted index consisting of all members of the S&P Global 1200 that are classified within the GICS Information Technology sector.
Indices are not available for investment, are not professionally managed and do not reflect sales charges, fees, brokerage commissions, taxes or other expenses of investing. Securities in the Fund may not match those in an index.
| 2 | Columbia Global Technology Growth Fund | Annual Report 2018 |
Fund at a Glance (continued)
Performance of a hypothetical $10,000 investment (August 31, 2008 — August 31, 2018)
The chart above shows the change in value of a hypothetical $10,000 investment in Class A shares of Columbia Global Technology Growth Fund during the stated time period, and does not reflect the deduction of taxes that a shareholder may pay on Fund distributions or on the redemption of Fund shares.
| Top 10 holdings (%) (at August 31, 2018) |
| Microsoft Corp. (United States) | 6.1 |
| Apple, Inc. (United States) | 5.5 |
| Alphabet, Inc., Class A (United States) | 5.4 |
| Amazon.com, Inc. (United States) | 5.4 |
| Facebook, Inc., Class A (United States) | 3.2 |
| Visa, Inc., Class A (United States) | 3.2 |
| MasterCard, Inc., Class A (United States) | 2.5 |
| Salesforce.com, Inc. (United States) | 2.3 |
| Cisco Systems, Inc. (United States) | 2.3 |
| NVIDIA Corp. (United States) | 2.2 |
Percentages indicated are based upon total investments (excluding Money Market Funds and derivatives, if any).
For further detail about these holdings, please refer to the section entitled “Portfolio of Investments.”
Fund holdings are as of the date given, are subject to change at any time, and are not recommendations to buy or sell any security.
| Equity sector breakdown (%) (at August 31, 2018) |
| Consumer Discretionary | 7.7 |
| Industrials | 0.4 |
| Information Technology | 91.2 |
| Real Estate | 0.7 |
| Total | 100.0 |
Percentages indicated are based upon total equity investments. The Fund’s portfolio composition is subject to change.
Columbia Global Technology Growth Fund | Annual Report 2018
| 3 |
Fund at a Glance (continued)
| Country breakdown (%) (at August 31, 2018) |
| China | 4.1 |
| Denmark | 0.3 |
| Finland | 0.2 |
| France | 0.2 |
| Germany | 0.8 |
| Guernsey | 0.4 |
| Israel | 0.3 |
| Japan | 2.0 |
| Luxembourg | 0.5 |
| Netherlands | 1.9 |
| Russian Federation | 0.3 |
| Singapore | 0.3 |
| South Africa | 0.2 |
| South Korea | 1.5 |
| Spain | 0.3 |
| Switzerland | 0.5 |
| Taiwan | 1.5 |
| United Kingdom | 0.2 |
| United States(a) | 84.5 |
| Total | 100.0 |
| (a) | Includes investments in Money Market Funds. |
Country breakdown is based primarily on issuer’s place of organization/incorporation. Percentages indicated are based upon total investments and exclude investments in derivatives, if any. The Fund’s portfolio composition is subject to change.
The Fund may use place of organization/incorporation or other factors in determining whether an issuer is domestic (U.S.) or foreign for purposes of its investment policies. At August 31, 2018, the Fund invested at least 40% of its net assets in foreign companies in accordance with its principal investment strategy.
| 4 | Columbia Global Technology Growth Fund | Annual Report 2018 |
Manager Discussion of Fund Performance
For the 12-month period ended August 31, 2018, Class A shares of the Fund returned 31.32% excluding sales charges. The Fund outperformed its benchmark, the S&P Global 1200 Information Technology Index (Net), which returned 26.99% for the same time period. Security selection drove the Fund’s performance relative to the benchmark.
U.S. equities led global markets
Global gross domestic product (GDP) growth accelerated during the 12-month period ended August 31, 2018, aided by a rebound in global trade and robust demand. In the United States, tax reform and moves to reduce regulation in a number of industries lifted growth above 4.0% in the second half of the 12-month period. European economies exceeded expectations in 2017 and appear to have regathered momentum after a slow start in 2018. Asia’s economy remained robust, but China’s slowdown posed risk for smaller Asian countries, which rely on export demand. Even though escalating trade tensions have weighed on sentiment, so far there has been no measurable economic impact at home or abroad.
Against this backdrop, most major global equity markets delivered positive returns. However, U.S. equities far outpaced the pack. The MSCI All Country World Index ex U.S. (Net), a broad measure of global stock market performance outside the United States, gained 3.18% while the S&P 500 Index, a broad measure of U.S. stock market performance, gained 19.66%.
Contributors and detractors
Global technology stocks continued to march higher during the 12 months ended August 31, 2018. From a top-down sector perspective, the global semiconductor complex continued to climb for much of the period, then faltered during the summer as the market became concerned about the impact of tariffs as well as early signs of softness in memory pricing. Financial technology companies, such as Visa and Square, continued to benefit from durable business models and healthy payment volumes. Against a backdrop of increasing budgets spent on technology to modernize business practices, software companies performed well. The key theme that linked the fund’s best individual stock performers is that innovation drove winners to keep winning, with stock appreciation resulting from the recognition of a shift in narrative and earnings growth.
The Fund’s stake in Amazon, a long-term holding and top five position in the portfolio, was the single biggest contributor to performance for the period. Chairman Jeff Bezos launched his exotic-sounding company in Seattle in 1994, and while his vision has always been for the long-term, his company’s ethos has become ingrained into the fabric of daily life. During 2018, Amazon offered for sale more than 12 million products to 310 million active customers, with 90 million U.S-based Amazon Prime subscribers each spending an estimated $1,300 on average per year. Perhaps more telling than the value created by Amazon is the existential angst the company has inflicted on its competition, which encompasses both traditional retailers and increasingly unconventional players, including CVS, Priceline and Johnson & Johnson, among many others. Since then, the stock continued its ascent as the narrative on Amazon shifted from a story of hyper-growth (as exhibited by 64 straight quarters of greater than 20% organic revenue growth) and perceived bottomless investment to still durable, but more mature growth with richer margins. The company had once been maligned for being “uninvestable” due to its history of uneven and hard-to-forecast profit margins, but during 2018 its high margin business — Amazon Web Services and Amazon Marketing Services — also grew the fastest. Amazon remains, in our view, the most disruptive online retailer on the planet and its ability to pivot and attack new markets, despite nearing $1 trillion in market capitalization, merits continued ownership in the portfolio.
NVIDIA’s story is similar to Amazon’s — continued stock outperformance during 2018 as the market came to appreciate a new facet of the company’s growth opportunity. NVIDIA has been a core holding in the Fund for quite some time and is currently a top ten position. At the time of the Fund’s initial purchase several years ago, NVIDIA was perceived to be a PC semiconductor component supplier. Now, a flourishing of innovation and visionary leadership has opened new opportunities in the e-sports, data center and autonomous driving end markets. NVIDIA has gained tremendous market share and is widely regarded as the most innovative semiconductor company, but we believe the innovation story is far from over. NVIDIA just released a new product family based on its Turing architecture, which will have ten times as much processing power as prior generation products and will command unit prices as much as 30% higher. We believe that the Turing architecture and its revolutionary ray-tracing technology will result in photo-realistic graphics for gaming end markets and bolster the company’s already strong foothold in the artificial intelligence and deep learning inferencing market.
Columbia Global Technology Growth Fund | Annual Report 2018
| 5 |
Manager Discussion of Fund Performance (continued)
The period was not without its challenges, as Broadcom, one of the Fund’s larger positions, detracted from performance after paying a 20% premium to purchase CA Technologies, an acquisition the market deemed questionable. (In addition to Broadcom, the Fund held a modest position in CA Technologies.) Since announcing the deal, Broadcom has recovered most of its loss and remains in the portfolio. We will monitor the company’s use of cash going forward.
At period’s end
Over the past few years, technology has delivered strong returns in an environment of low volatility. Going forward, we plan to monitor the impact of tariffs across the global supply chain, which we view as a primary risk to the sector. If volatility increases, the technology sector is unlikely to be immune. That’s why we continue to take a balanced approach in constructing a diversified global portfolio of both growth and value opportunities. In the absence of meaningful fundamental change, we would generally view market pullbacks as buying opportunities.
Market risk may affect a single issuer, sector of the economy, industry or the market as a whole. The products of technology companies may be subject to severe competition and rapid obsolescence, and technology stocks may be subject to greater price fluctuations. Growth securities, at times, may not perform as well as value securities or the stock market in general and may be out of favor with investors. Foreign investments subject the Fund to risks, including political, economic, market, social and others within a particular country, as well as to currency instabilities and less stringent financial and accounting standards generally applicable to U.S. issuers. Risks are enhanced for emerging market issuers. See the Fund’s prospectus for more information on these and other risks.
The views expressed in this report reflect the current views of the respective parties. These views are not guarantees of future performance and involve certain risks, uncertainties and assumptions that are difficult to predict, so actual outcomes and results may differ significantly from the views expressed. These views are subject to change at any time based upon economic, market or other conditions and the respective parties disclaim any responsibility to update such views. These views may not be relied on as investment advice and, because investment decisions for a Columbia fund are based on numerous factors, may not be relied on as an indication of trading intent on behalf of any particular Columbia fund. References to specific securities should not be construed as a recommendation or investment advice.
| 6 | Columbia Global Technology Growth Fund | Annual Report 2018 |
Understanding Your Fund’s Expenses
(Unaudited)
As an investor, you incur two types of costs. There are shareholder transaction costs, which generally include sales charges on purchases and may include redemption fees. There are also ongoing costs, which generally include management fees, distribution and/or service fees, and other fund expenses. The following information is intended to help you understand your ongoing costs (in dollars) of investing in the Fund and to help you compare these costs with the ongoing costs of investing in other mutual funds.
Analyzing your Fund’s expenses
To illustrate these ongoing costs, we have provided examples and calculated the expenses paid by investors in each share class of the Fund during the period. The actual and hypothetical information in the table is based on an initial investment of $1,000 at the beginning of the period indicated and held for the entire period. Expense information is calculated two ways and each method provides you with different information. The amount listed in the “Actual” column is calculated using the Fund’s actual operating expenses and total return for the period. You may use the Actual information, together with the amount invested, to estimate the expenses that you paid over the period. Simply divide your account value by $1,000 (for example, an $8,600 account value divided by $1,000 = 8.6), then multiply the results by the expenses paid during the period under the “Actual” column. The amount listed in the “Hypothetical” column assumes a 5% annual rate of return before expenses (which is not the Fund’s actual return) and then applies the Fund’s actual expense ratio for the period to the hypothetical return. You should not use the hypothetical account values and expenses to estimate either your actual account balance at the end of the period or the expenses you paid during the period. See “Compare with other funds” below for details on how to use the hypothetical data.
Compare with other funds
Since all mutual funds are required to include the same hypothetical calculations about expenses in shareholder reports, you can use this information to compare the ongoing cost of investing in the Fund with other funds. To do so, compare the hypothetical example with the 5% hypothetical examples that appear in the shareholder reports of other funds. As you compare hypothetical examples of other funds, it is important to note that hypothetical examples are meant to highlight the ongoing costs of investing in a fund only and do not reflect any transaction costs, such as sales charges, or redemption or exchange fees. Therefore, the hypothetical calculations are useful in comparing ongoing costs only, and will not help you determine the relative total costs of owning different funds. If transaction costs were included in these calculations, your costs would be higher.
| March 1, 2018 — August 31, 2018 |
| | Account value at the
beginning of the
period ($) | Account value at the
end of the
period ($) | Expenses paid during
the period ($) | Fund’s annualized
expense ratio (%) |
| | Actual | Hypothetical | Actual | Hypothetical | Actual | Hypothetical | Actual |
| Class A | 1,000.00 | 1,000.00 | 1,110.50 | 1,018.95 | 6.60 | 6.31 | 1.24 |
| Advisor Class | 1,000.00 | 1,000.00 | 1,111.70 | 1,020.16 | 5.32 | 5.09 | 1.00 |
| Class C | 1,000.00 | 1,000.00 | 1,106.10 | 1,015.17 | 10.56 | 10.11 | 1.99 |
| Institutional Class | 1,000.00 | 1,000.00 | 1,111.70 | 1,020.21 | 5.27 | 5.04 | 0.99 |
| Institutional 2 Class | 1,000.00 | 1,000.00 | 1,111.90 | 1,020.57 | 4.90 | 4.69 | 0.92 |
| Institutional 3 Class | 1,000.00 | 1,000.00 | 1,112.20 | 1,020.82 | 4.63 | 4.43 | 0.87 |
Expenses paid during the period are equal to the annualized expense ratio for each class as indicated above, multiplied by the average account value over the period and then multiplied by the number of days in the Fund’s most recent fiscal half year and divided by 365.
Expenses do not include fees and expenses incurred indirectly by the Fund from its investment in underlying funds, including affiliated and non-affiliated pooled investment vehicles, such as mutual funds and exchange-traded funds.
Columbia Global Technology Growth Fund | Annual Report 2018
| 7 |
Portfolio of Investments
August 31, 2018
(Percentages represent value of investments compared to net assets)
Investments in securities
| Common Stocks 97.1% |
| Issuer | Shares | Value ($) |
| China 4.0% |
| Alibaba Group Holding Ltd., ADR(a) | 132,560 | 23,199,326 |
| Baidu, Inc., ADR(a) | 28,346 | 6,419,802 |
| Ctrip.com International Ltd., ADR(a) | 80,496 | 3,151,418 |
| NetEase, Inc., ADR | 10,388 | 2,053,811 |
| Tencent Holdings Ltd. | 505,700 | 21,738,613 |
| Weibo Corp., ADR(a) | 37,266 | 2,859,793 |
| Total | 59,422,763 |
| Denmark 0.3% |
| Netcompany Group AS(a) | 106,310 | 4,303,915 |
| Finland 0.2% |
| Nokia OYJ, ADR | 473,603 | 2,628,497 |
| France 0.2% |
| Capgemini SE | 27,083 | 3,481,602 |
| Germany 0.8% |
| SAP SE, ADR | 95,340 | 11,416,012 |
| Guernsey 0.4% |
| Amdocs Ltd. | 88,919 | 5,804,632 |
| Israel 0.3% |
| Check Point Software Technologies Ltd.(a) | 35,439 | 4,117,657 |
| Japan 2.0% |
| Keyence Corp. | 12,900 | 7,302,797 |
| Kyocera Corp. | 29,900 | 1,884,416 |
| Murata Manufacturing Co., Ltd. | 27,700 | 4,776,464 |
| Nintendo Co., Ltd. | 25,200 | 9,070,745 |
| Rohm Co., Ltd. | 28,400 | 2,565,838 |
| TDK Corp. | 28,400 | 3,185,306 |
| Total | 28,785,566 |
| Luxembourg 0.5% |
| Spotify Technology SA(a) | 38,931 | 7,378,203 |
| Netherlands 1.9% |
| ASML Holding NV | 76,888 | 15,765,884 |
| NXP Semiconductors NV(a) | 57,384 | 5,344,746 |
| STMicroelectronics NV, Registered Shares | 345,764 | 7,153,857 |
| Total | 28,264,487 |
| Common Stocks (continued) |
| Issuer | Shares | Value ($) |
| Russian Federation 0.3% |
| Yandex NV, Class A(a) | 127,817 | 4,106,760 |
| Singapore 0.3% |
| Flex Ltd.(a) | 352,805 | 4,865,181 |
| South Africa 0.2% |
| MiX Telematics Ltd., ADR | 204,243 | 3,419,028 |
| South Korea 1.5% |
| NAVER Corp. | 3,124 | 2,109,372 |
| Samsung Electronics Co., Ltd. | 461,361 | 20,055,665 |
| Total | 22,165,037 |
| Spain 0.3% |
| Amadeus IT Group SA, Class A | 47,479 | 4,404,491 |
| Switzerland 0.5% |
| TE Connectivity Ltd. | 77,312 | 7,087,964 |
| Taiwan 1.5% |
| Taiwan Semiconductor Manufacturing Co., Ltd., ADR | 509,303 | 22,205,611 |
| United Kingdom 0.2% |
| Avast PLC(a) | 954,906 | 3,187,819 |
| United States 81.7% |
| Accenture PLC, Class A | 80,715 | 13,646,485 |
| ACM Research, Inc., Class A(a) | 238,713 | 3,368,240 |
| Activision Blizzard, Inc. | 213,292 | 15,378,353 |
| Adobe Systems, Inc.(a) | 80,265 | 21,150,630 |
| Advanced Micro Devices, Inc.(a) | 218,978 | 5,511,676 |
| Alphabet, Inc., Class A(a) | 62,689 | 77,220,310 |
| Altair Engineering, Inc., Class A(a) | 66,855 | 2,792,533 |
| Amazon.com, Inc.(a) | 38,227 | 76,939,865 |
| Amphenol Corp., Class A | 133,964 | 12,670,315 |
| Analog Devices, Inc. | 72,385 | 7,155,257 |
| ANSYS, Inc.(a) | 44,523 | 8,280,388 |
| Apple, Inc. | 341,893 | 77,825,104 |
| Applied Materials, Inc. | 169,755 | 7,302,860 |
| Arista Networks, Inc.(a) | 8,366 | 2,501,267 |
| Arlo Technologies, Inc.(a) | 125,864 | 2,483,297 |
| Autodesk, Inc.(a) | 55,169 | 8,515,335 |
The accompanying Notes to Financial Statements are an integral part of this statement.
| 8 | Columbia Global Technology Growth Fund | Annual Report 2018 |
Portfolio of Investments (continued)
August 31, 2018
| Common Stocks (continued) |
| Issuer | Shares | Value ($) |
| Automatic Data Processing, Inc. | 101,455 | 14,888,521 |
| Booking Holdings, Inc.(a) | 3,685 | 7,191,462 |
| Broadcom, Inc. | 88,580 | 19,401,677 |
| CA, Inc. | 54,663 | 2,394,239 |
| Cadence Design Systems, Inc.(a) | 199,212 | 9,370,932 |
| CDW Corp. | 63,857 | 5,591,319 |
| Ceridian HCM Holding, Inc.(a) | 82,438 | 3,173,863 |
| Cisco Systems, Inc. | 683,046 | 32,629,107 |
| Citrix Systems, Inc.(a) | 58,630 | 6,684,993 |
| Cognizant Technology Solutions Corp., Class A | 92,072 | 7,221,207 |
| Comcast Corp., Class A | 80,085 | 2,962,344 |
| Corning, Inc. | 286,374 | 9,596,393 |
| DocuSign, Inc.(a) | 30,260 | 1,889,434 |
| DXC Technology Co. | 104,312 | 9,501,780 |
| eBay, Inc.(a) | 180,600 | 6,250,566 |
| Electronic Arts, Inc.(a) | 71,802 | 8,143,065 |
| Equinix, Inc. | 14,152 | 6,172,112 |
| Expedia Group, Inc. | 28,977 | 3,781,499 |
| Facebook, Inc., Class A(a) | 263,092 | 46,233,157 |
| Fidelity National Information Services, Inc. | 91,678 | 9,916,809 |
| First Data Corp., Class A(a) | 233,028 | 5,993,480 |
| Fiserv, Inc.(a) | 95,377 | 7,636,836 |
| FleetCor Technologies, Inc.(a) | 26,116 | 5,582,034 |
| FLIR Systems, Inc. | 23,194 | 1,455,192 |
| Gartner, Inc.(a) | 23,009 | 3,445,828 |
| Guidewire Software, Inc.(a) | 76,964 | 7,740,269 |
| Harris Corp. | 35,117 | 5,706,864 |
| HP, Inc. | 404,645 | 9,974,499 |
| Ichor Holdings Ltd.(a) | 166,523 | 4,317,941 |
| Intel Corp. | 316,826 | 15,343,883 |
| International Business Machines Corp. | 79,632 | 11,664,495 |
| Intuit, Inc. | 64,092 | 14,066,271 |
| IPG Photonics Corp.(a) | 12,506 | 2,194,553 |
| KLA-Tencor Corp. | 49,642 | 5,768,897 |
| Lam Research Corp. | 107,447 | 18,598,001 |
| Lattice Semiconductor Corp.(a) | 336,290 | 2,754,215 |
| Leidos Holdings, Inc. | 44,097 | 3,120,745 |
| Marvell Technology Group Ltd. | 349,853 | 7,234,960 |
| MasterCard, Inc., Class A | 163,867 | 35,323,171 |
| Common Stocks (continued) |
| Issuer | Shares | Value ($) |
| Maxim Integrated Products, Inc. | 105,664 | 6,389,502 |
| Microchip Technology, Inc. | 170,408 | 14,660,200 |
| Micron Technology, Inc.(a) | 207,334 | 10,889,182 |
| Microsoft Corp. | 778,299 | 87,426,327 |
| Motorola Solutions, Inc. | 71,745 | 9,209,188 |
| NetApp, Inc. | 93,424 | 8,110,137 |
| Netflix, Inc.(a) | 39,989 | 14,703,156 |
| New Relic, Inc.(a) | 70,000 | 7,193,200 |
| NVIDIA Corp. | 113,225 | 31,779,993 |
| Oracle Corp. | 203,553 | 9,888,605 |
| Palo Alto Networks, Inc.(a) | 39,716 | 9,180,353 |
| PayPal Holdings, Inc.(a) | 172,767 | 15,951,577 |
| Perspecta, Inc. | 131,491 | 3,058,481 |
| Pivotal Software, Inc., Class A(a) | 147,121 | 4,082,608 |
| PTC, Inc.(a) | 52,175 | 5,214,370 |
| QUALCOMM, Inc. | 122,531 | 8,419,105 |
| Red Hat, Inc.(a) | 67,956 | 10,039,140 |
| SailPoint Technologies Holding, Inc.(a) | 156,761 | 4,848,618 |
| Salesforce.com, Inc.(a) | 218,761 | 33,400,429 |
| SBA Communications Corp.(a) | 21,523 | 3,341,015 |
| Seagate Technology PLC | 25,993 | 1,391,665 |
| ServiceNow, Inc.(a) | 54,609 | 10,723,023 |
| Silicon Laboratories, Inc.(a) | 37,848 | 3,709,104 |
| Skyworks Solutions, Inc. | 64,109 | 5,853,152 |
| Sonos, Inc.(a) | 78,008 | 1,502,434 |
| Splunk, Inc.(a) | 65,610 | 8,407,922 |
| Square, Inc., Class A(a) | 149,221 | 13,226,949 |
| Synopsys, Inc.(a) | 194,904 | 19,907,495 |
| Take-Two Interactive Software, Inc.(a) | 33,025 | 4,410,819 |
| Teradyne, Inc. | 88,405 | 3,641,402 |
| Texas Instruments, Inc. | 130,689 | 14,689,444 |
| Total System Services, Inc. | 49,827 | 4,840,195 |
| Trimble Navigation Ltd.(a) | 109,035 | 4,590,374 |
| Universal Display Corp. | 47,878 | 5,860,267 |
| VeriSign, Inc.(a) | 68,548 | 10,872,398 |
| Visa, Inc., Class A | 313,786 | 46,092,026 |
| VMware, Inc., Class A(a) | 52,489 | 8,044,464 |
| Workday, Inc., Class A(a) | 39,168 | 6,053,023 |
The accompanying Notes to Financial Statements are an integral part of this statement.
Columbia Global Technology Growth Fund | Annual Report 2018
| 9 |
Portfolio of Investments (continued)
August 31, 2018
| Common Stocks (continued) |
| Issuer | Shares | Value ($) |
| Worldpay, Inc., Class A(a) | 47,807 | 4,655,924 |
| Total | 1,199,915,794 |
Total Common Stocks
(Cost $908,582,426) | 1,426,961,019 |
|
| Money Market Funds 2.8% |
| | Shares | Value ($) |
| Columbia Short-Term Cash Fund, 2.058%(b),(c) | 40,804,024 | 40,799,943 |
Total Money Market Funds
(Cost $40,799,943) | 40,799,943 |
Total Investments in Securities
(Cost $949,382,369) | 1,467,760,962 |
| Other Assets & Liabilities, Net | | 882,634 |
| Net Assets | $1,468,643,596 |
Notes to Portfolio of Investments
| (a) | Non-income producing investment. |
| (b) | The rate shown is the seven-day current annualized yield at August 31, 2018. |
| (c) | As defined in the Investment Company Act of 1940, an affiliated company is one in which the Fund owns 5% or more of the company’s outstanding voting securities, or a company which is under common ownership or control with the Fund. Holdings and transactions in these affiliated companies during the year ended August 31, 2018 are as follows: |
| Issuer | Beginning
shares | Shares
purchased | Shares
sold | Ending
shares | Realized gain
(loss) —
affiliated
issuers ($) | Net change in
unrealized
appreciation
(depreciation) —
affiliated
issuers ($) | Dividends —
affiliated
issuers ($) | Value —
affiliated
issuers
at end of
period ($) |
| Columbia Short-Term Cash Fund, 2.058% |
| | 17,826,930 | 287,698,971 | (264,721,877) | 40,804,024 | (296) | (1,051) | 425,608 | 40,799,943 |
Abbreviation Legend
| ADR | American Depositary Receipt |
Fair value measurements
The Fund categorizes its fair value measurements according to a three-level hierarchy that maximizes the use of observable inputs and minimizes the use of unobservable inputs by prioritizing that the most observable input be used when available. Observable inputs are those that market participants would use in pricing an investment based on market data obtained from sources independent of the reporting entity. Unobservable inputs are those that reflect the Fund’s assumptions about the information market participants would use in pricing an investment. An investment’s level within the fair value hierarchy is based on the lowest level of any input that is deemed significant to the asset’s or liability’s fair value measurement. The input levels are not necessarily an indication of the risk or liquidity associated with investments at that level. For example, certain U.S. government securities are generally high quality and liquid, however, they are reflected as Level 2 because the inputs used to determine fair value may not always be quoted prices in an active market.
Fair value inputs are summarized in the three broad levels listed below:
| ■ | Level 1 — Valuations based on quoted prices for investments in active markets that the Fund has the ability to access at the measurement date. Valuation adjustments are not applied to Level 1 investments. |
| ■ | Level 2 — Valuations based on other significant observable inputs (including quoted prices for similar securities, interest rates, prepayment speeds, credit risks, etc.). |
| ■ | Level 3 — Valuations based on significant unobservable inputs (including the Fund’s own assumptions and judgment in determining the fair value of investments). |
Inputs that are used in determining fair value of an investment may include price information, credit data, volatility statistics, and other factors. These inputs can be either observable or unobservable. The availability of observable inputs can vary between investments, and is affected by various factors such as the type of investment, and the volume and level of activity for that investment or similar investments in the marketplace. The inputs will be considered by the Investment Manager, along with any other relevant factors in the calculation of an investment’s fair value. The Fund uses prices and inputs that are current as of the measurement date, which may include periods of market dislocations. During these periods, the availability of prices and inputs may be reduced for many investments. This condition could cause an investment to be reclassified between the various levels within the hierarchy.
The accompanying Notes to Financial Statements are an integral part of this statement.
| 10 | Columbia Global Technology Growth Fund | Annual Report 2018 |
Portfolio of Investments (continued)
August 31, 2018
Fair value measurements (continued)
Foreign equity securities actively traded in markets where there is a significant delay in the local close relative to the New York Stock Exchange are classified as Level 2. The values of these securities may include an adjustment to reflect the impact of significant market movements following the close of local trading, as described in Note 2 to the financial statements – Security valuation.
Certain investments that have been measured at fair value using the net asset value (NAV) per share (or its equivalent) are not categorized in the fair value hierarchy. The fair value amounts presented in the table are intended to reconcile the fair value hierarchy to the amounts presented in the Portfolio of Investments. The Columbia Short-Term Cash Fund seeks to provide shareholders with maximum current income consistent with liquidity and stability of principal. Columbia Short-Term Cash Fund prices its shares with a floating NAV and no longer seeks to maintain a stable NAV.
Investments falling into the Level 3 category are primarily supported by quoted prices from brokers and dealers participating in the market for those investments. However, these may be classified as Level 3 investments due to lack of market transparency and corroboration to support these quoted prices. Additionally, valuation models may be used as the pricing source for any remaining investments classified as Level 3. These models may rely on one or more significant unobservable inputs and/or significant assumptions by the Investment Manager. Inputs used in valuations may include, but are not limited to, financial statement analysis, capital account balances, discount rates and estimated cash flows, and comparable company data.
Under the direction of the Fund’s Board of Trustees (the Board), the Investment Manager’s Valuation Committee (the Committee) is responsible for overseeing the valuation procedures approved by the Board. The Committee consists of voting and non-voting members from various groups within the Investment Manager’s organization, including operations and accounting, trading and investments, compliance, risk management and legal.
The Committee meets at least monthly to review and approve valuation matters, which may include a description of specific valuation determinations, data regarding pricing information received from approved pricing vendors and brokers and the results of Board-approved valuation control policies and procedures (the Policies). The Policies address, among other things, instances when market quotations are or are not readily available, including recommendations of third party pricing vendors and a determination of appropriate pricing methodologies; events that require specific valuation determinations and assessment of fair value techniques; securities with a potential for stale pricing, including those that are illiquid, restricted, or in default; and the effectiveness of third party pricing vendors, including periodic reviews of vendors. The Committee meets more frequently, as needed, to discuss additional valuation matters, which may include the need to review back-testing results, review time-sensitive information or approve related valuation actions. The Committee reports to the Board, with members of the Committee meeting with the Board at each of its regularly scheduled meetings to discuss valuation matters and actions during the period, similar to those described earlier.
For investments categorized as Level 3, the Committee monitors information similar to that described above, which may include: (i) data specific to the issuer or comparable issuers, (ii) general market or specific sector news and (iii) quoted prices and specific or similar security transactions. The Committee considers this data and any changes from prior periods in order to assess the reasonableness of observable and unobservable inputs, any assumptions or internal models used to value those securities and changes in fair value. This data is also used to corroborate, when available, information received from approved pricing vendors and brokers. Various factors impact the frequency of monitoring this information (which may occur as often as daily). However, the Committee may determine that changes to inputs, assumptions and models are not required as a result of the monitoring procedures performed.
The following table is a summary of the inputs used to value the Fund’s investments at August 31, 2018:
| | Level 1
quoted prices
in active
markets for
identical
assets ($) | Level 2
other
significant
observable
inputs ($) | Level 3
significant
unobservable
inputs ($) | Investments
measured at
net asset
value ($) | Total ($) |
| Investments in Securities | | | | | |
| Common Stocks | | | | | |
| China | 37,684,150 | 21,738,613 | — | — | 59,422,763 |
| Denmark | — | 4,303,915 | — | — | 4,303,915 |
| Finland | 2,628,497 | — | — | — | 2,628,497 |
| France | — | 3,481,602 | — | — | 3,481,602 |
| Germany | 11,416,012 | — | — | — | 11,416,012 |
| Guernsey | 5,804,632 | — | — | — | 5,804,632 |
| Israel | 4,117,657 | — | — | — | 4,117,657 |
| Japan | — | 28,785,566 | — | — | 28,785,566 |
| Luxembourg | 7,378,203 | — | — | — | 7,378,203 |
| Netherlands | 28,264,487 | — | — | — | 28,264,487 |
| Russian Federation | 4,106,760 | — | — | — | 4,106,760 |
| Singapore | 4,865,181 | — | — | — | 4,865,181 |
| South Africa | 3,419,028 | — | — | — | 3,419,028 |
| South Korea | — | 22,165,037 | — | — | 22,165,037 |
| Spain | — | 4,404,491 | — | — | 4,404,491 |
| Switzerland | 7,087,964 | — | — | — | 7,087,964 |
| Taiwan | 22,205,611 | — | — | — | 22,205,611 |
The accompanying Notes to Financial Statements are an integral part of this statement.
Columbia Global Technology Growth Fund | Annual Report 2018
| 11 |
Portfolio of Investments (continued)
August 31, 2018
Fair value measurements (continued)
| | Level 1
quoted prices
in active
markets for
identical
assets ($) | Level 2
other
significant
observable
inputs ($) | Level 3
significant
unobservable
inputs ($) | Investments
measured at
net asset
value ($) | Total ($) |
| United Kingdom | — | 3,187,819 | — | — | 3,187,819 |
| United States | 1,199,915,794 | — | — | — | 1,199,915,794 |
| Total Common Stocks | 1,338,893,976 | 88,067,043 | — | — | 1,426,961,019 |
| Money Market Funds | — | — | — | 40,799,943 | 40,799,943 |
| Total Investments in Securities | 1,338,893,976 | 88,067,043 | — | 40,799,943 | 1,467,760,962 |
See the Portfolio of Investments for all investment classifications not indicated in the table.
The Fund’s assets assigned to the Level 2 input category are generally valued using the market approach, in which a security’s value is determined through reference to prices and information from market transactions for similar or identical assets. These assets include certain foreign securities for which a third party statistical pricing service may be employed for purposes of fair market valuation. The model utilized by such third party statistical pricing service takes into account a security’s correlation to available market data including, but not limited to, intraday index, ADR, and exchange-traded fund movements.
There were no transfers of financial assets between levels during the period.
The accompanying Notes to Financial Statements are an integral part of this statement.
| 12 | Columbia Global Technology Growth Fund | Annual Report 2018 |
Statement of Assets and Liabilities
August 31, 2018
| Assets | |
| Investments in securities, at value | |
| Unaffiliated issuers (cost $908,582,426) | $1,426,961,019 |
| Affiliated issuers (cost $40,799,943) | 40,799,943 |
| Cash | 25 |
| Foreign currency (cost $1,713,667) | 1,713,667 |
| Receivable for: | |
| Investments sold | 3,751,243 |
| Capital shares sold | 3,917,196 |
| Dividends | 1,062,354 |
| Foreign tax reclaims | 25,973 |
| Prepaid expenses | 8,113 |
| Trustees’ deferred compensation plan | 59,955 |
| Total assets | 1,478,299,488 |
| Liabilities | |
| Payable for: | |
| Investments purchased | 8,442,638 |
| Capital shares purchased | 868,427 |
| Management services fees | 32,916 |
| Distribution and/or service fees | 6,363 |
| Transfer agent fees | 178,090 |
| Compensation of chief compliance officer | 77 |
| Other expenses | 67,426 |
| Trustees’ deferred compensation plan | 59,955 |
| Total liabilities | 9,655,892 |
| Net assets applicable to outstanding capital stock | $1,468,643,596 |
| Represented by | |
| Paid in capital | 895,534,038 |
| Excess of distributions over net investment income | (60,368) |
| Accumulated net realized gain | 54,783,776 |
| Unrealized appreciation (depreciation) on: | |
| Investments - unaffiliated issuers | 518,378,593 |
| Foreign currency translations | 7,557 |
| Total - representing net assets applicable to outstanding capital stock | $1,468,643,596 |
The accompanying Notes to Financial Statements are an integral part of this statement.
Columbia Global Technology Growth Fund | Annual Report 2018
| 13 |
Statement of Assets and Liabilities (continued)
August 31, 2018
| Class A | |
| Net assets | $372,730,129 |
| Shares outstanding | 10,274,408 |
| Net asset value per share | $36.28 |
| Maximum sales charge | 5.75% |
| Maximum offering price per share (calculated by dividing the net asset value per share by 1.0 minus the maximum sales charge for Class A shares) | $38.49 |
| Advisor Class | |
| Net assets | $104,060,633 |
| Shares outstanding | 2,723,671 |
| Net asset value per share | $38.21 |
| Class C | |
| Net assets | $139,589,946 |
| Shares outstanding | 4,289,460 |
| Net asset value per share | $32.54 |
| Institutional Class | |
| Net assets | $686,133,629 |
| Shares outstanding | 18,191,762 |
| Net asset value per share | $37.72 |
| Institutional 2 Class | |
| Net assets | $101,133,775 |
| Shares outstanding | 2,630,164 |
| Net asset value per share | $38.45 |
| Institutional 3 Class | |
| Net assets | $64,995,484 |
| Shares outstanding | 1,685,815 |
| Net asset value per share | $38.55 |
The accompanying Notes to Financial Statements are an integral part of this statement.
| 14 | Columbia Global Technology Growth Fund | Annual Report 2018 |
Statement of Operations
Year Ended August 31, 2018
| Net investment income | |
| Income: | |
| Dividends — unaffiliated issuers | $9,885,960 |
| Dividends — affiliated issuers | 425,608 |
| Interfund lending | 138 |
| Foreign taxes withheld | (344,831) |
| Total income | 9,966,875 |
| Expenses: | |
| Management services fees | 9,088,664 |
| Distribution and/or service fees | |
| Class A | 747,006 |
| Class C | 1,179,452 |
| Transfer agent fees | |
| Class A | 383,573 |
| Advisor Class | 39,641 |
| Class C | 151,357 |
| Institutional Class | 654,498 |
| Institutional 2 Class | 43,421 |
| Institutional 3 Class | 4,518 |
| Compensation of board members | 29,469 |
| Custodian fees | 30,962 |
| Printing and postage fees | 75,404 |
| Registration fees | 153,536 |
| Audit fees | 41,755 |
| Legal fees | 25,460 |
| Compensation of chief compliance officer | 418 |
| Other | 38,129 |
| Total expenses | 12,687,263 |
| Expense reduction | (160) |
| Total net expenses | 12,687,103 |
| Net investment loss | (2,720,228) |
| Realized and unrealized gain (loss) — net | |
| Net realized gain (loss) on: | |
| Investments — unaffiliated issuers | 73,661,082 |
| Investments — affiliated issuers | (296) |
| Foreign currency translations | (64,702) |
| Net realized gain | 73,596,084 |
| Net change in unrealized appreciation (depreciation) on: | |
| Investments — unaffiliated issuers | 218,803,485 |
| Investments — affiliated issuers | (1,051) |
| Foreign currency translations | 7,562 |
| Net change in unrealized appreciation (depreciation) | 218,809,996 |
| Net realized and unrealized gain | 292,406,080 |
| Net increase in net assets resulting from operations | $289,685,852 |
The accompanying Notes to Financial Statements are an integral part of this statement.
Columbia Global Technology Growth Fund | Annual Report 2018
| 15 |
Statement of Changes in Net Assets
| | Year Ended
August 31, 2018 | Year Ended
August 31, 2017 |
| Operations | | |
| Net investment loss | $(2,720,228) | $(1,646,978) |
| Net realized gain | 73,596,084 | 30,281,346 |
| Net change in unrealized appreciation (depreciation) | 218,809,996 | 166,605,379 |
| Net increase in net assets resulting from operations | 289,685,852 | 195,239,747 |
| Distributions to shareholders | | |
| Net realized gains | | |
| Class A | (9,039,993) | (643,027) |
| Advisor Class | (765,620) | (20,824) |
| Class B | — | (563) |
| Class C | (3,335,038) | (265,622) |
| Class I | — | (113,336) |
| Institutional Class | (15,778,111) | (848,799) |
| Institutional 2 Class | (2,022,287) | (74,428) |
| Institutional 3 Class | (1,724,744) | (2,578) |
| Total distributions to shareholders | (32,665,793) | (1,969,177) |
| Increase in net assets from capital stock activity | 392,571,410 | 102,667,496 |
| Total increase in net assets | 649,591,469 | 295,938,066 |
| Net assets at beginning of year | 819,052,127 | 523,114,061 |
| Net assets at end of year | $1,468,643,596 | $819,052,127 |
| Excess of distributions over net investment income | $(60,368) | $(348,695) |
The accompanying Notes to Financial Statements are an integral part of this statement.
| 16 | Columbia Global Technology Growth Fund | Annual Report 2018 |
Statement of Changes in Net Assets (continued)
| | Year Ended | Year Ended |
| | August 31, 2018 | August 31, 2017 |
| | Shares | Dollars ($) | Shares | Dollars ($) |
| Capital stock activity |
| Class A | | | | |
| Subscriptions | 5,228,272 | 171,416,129 | 4,781,457 | 117,817,284 |
| Distributions reinvested | 273,655 | 8,335,524 | 27,330 | 602,083 |
| Redemptions | (3,223,158) | (105,707,338) | (4,612,271) | (112,251,153) |
| Net increase | 2,278,769 | 74,044,315 | 196,516 | 6,168,214 |
| Advisor Class | | | | |
| Subscriptions | 2,626,473 | 95,114,876 | 605,381 | 15,111,546 |
| Distributions reinvested | 23,911 | 765,620 | 901 | 20,824 |
| Redemptions | (380,288) | (12,748,446) | (478,457) | (11,118,179) |
| Net increase | 2,270,096 | 83,132,050 | 127,825 | 4,014,191 |
| Class B | | | | |
| Subscriptions | — | — | 492 | 10,853 |
| Distributions reinvested | — | — | 25 | 507 |
| Redemptions | — | — | (14,679) | (313,385) |
| Net decrease | — | — | (14,162) | (302,025) |
| Class C | | | | |
| Subscriptions | 1,703,988 | 50,186,699 | 1,439,245 | 31,749,242 |
| Distributions reinvested | 101,583 | 2,790,479 | 9,956 | 198,819 |
| Redemptions | (1,091,125) | (32,625,945) | (1,025,474) | (22,909,928) |
| Net increase | 714,446 | 20,351,233 | 423,727 | 9,038,133 |
| Class I | | | | |
| Subscriptions | — | — | 10,072 | 264,513 |
| Distributions reinvested | — | — | 4,723 | 113,296 |
| Redemptions | — | — | (1,609,322) | (42,630,505) |
| Net decrease | — | — | (1,594,527) | (42,252,696) |
| Institutional Class | | | | |
| Subscriptions | 7,685,998 | 263,957,209 | 6,898,209 | 174,382,444 |
| Distributions reinvested | 343,383 | 10,854,349 | 21,544 | 491,843 |
| Redemptions | (3,249,564) | (109,198,998) | (4,162,793) | (101,752,191) |
| Net increase | 4,779,817 | 165,612,560 | 2,756,960 | 73,122,096 |
| Institutional 2 Class | | | | |
| Subscriptions | 1,844,002 | 63,310,391 | 1,007,560 | 26,885,189 |
| Distributions reinvested | 62,779 | 2,022,118 | 3,202 | 74,416 |
| Redemptions | (789,834) | (27,030,387) | (325,770) | (8,461,255) |
| Net increase | 1,116,947 | 38,302,122 | 684,992 | 18,498,350 |
| Institutional 3 Class | | | | |
| Subscriptions | 669,830 | 22,877,348 | 1,487,235 | 39,172,350 |
| Distributions reinvested | 53,409 | 1,724,593 | 110 | 2,568 |
| Redemptions | (386,910) | (13,472,811) | (168,042) | (4,793,685) |
| Net increase | 336,329 | 11,129,130 | 1,319,303 | 34,381,233 |
| Total net increase | 11,496,404 | 392,571,410 | 3,900,634 | 102,667,496 |
The accompanying Notes to Financial Statements are an integral part of this statement.
Columbia Global Technology Growth Fund | Annual Report 2018
| 17 |
The following table is intended to help you understand the Fund’s financial performance. Certain information reflects financial results for a single share of a class held for the periods shown. Per share net investment income (loss) amounts are calculated based on average shares outstanding during the period. Total return assumes reinvestment of all dividends and distributions, if any. Total return does not reflect payment of sales charges, if any. Total return and portfolio turnover are not annualized for periods of less than one year. The portfolio turnover rate is calculated without regard to purchase and sales transactions of short-term instruments and certain derivatives, if any. If such transactions were included, the Fund’s portfolio turnover rate may be higher.
| | Net asset value,
beginning of
period | Net
investment
income
(loss) | Net
realized
and
unrealized
gain | Total from
investment
operations | Distributions
from net
investment
income | Distributions
from net
realized
gains | Total
distributions to
shareholders |
| Class A |
| Year Ended 8/31/2018 | $28.59 | (0.11) | 8.86 | 8.75 | — | (1.06) | (1.06) |
| Year Ended 8/31/2017 | $21.19 | (0.08) | 7.56 | 7.48 | — | (0.08) | (0.08) |
| Year Ended 8/31/2016 | $18.36 | (0.04) | 3.22 | 3.18 | — | (0.35) | (0.35) |
| Year Ended 8/31/2015 | $18.18 | (0.07) | 1.10 | 1.03 | (0.09) | (0.76) | (0.85) |
| Year Ended 8/31/2014 | $13.47 | (0.09) | 4.80 | 4.71 | — | — | — |
| Advisor Class |
| Year Ended 8/31/2018 | $30.05 | (0.02) | 9.31 | 9.29 | — | (1.13) | (1.13) |
| Year Ended 8/31/2017 | $22.21 | (0.02) | 7.94 | 7.92 | — | (0.08) | (0.08) |
| Year Ended 8/31/2016 | $19.19 | 0.01 | 3.36 | 3.37 | — | (0.35) | (0.35) |
| Year Ended 8/31/2015 | $18.92 | (0.04) | 1.17 | 1.13 | (0.10) | (0.76) | (0.86) |
| Year Ended 8/31/2014 | $13.99 | (0.06) | 4.99 | 4.93 | — | — | — |
| Class C |
| Year Ended 8/31/2018 | $25.78 | (0.32) | 7.97 | 7.65 | — | (0.89) | (0.89) |
| Year Ended 8/31/2017 | $19.26 | (0.24) | 6.84 | 6.60 | — | (0.08) | (0.08) |
| Year Ended 8/31/2016 | $16.84 | (0.17) | 2.94 | 2.77 | — | (0.35) | (0.35) |
| Year Ended 8/31/2015 | $16.82 | (0.20) | 1.02 | 0.82 | (0.04) | (0.76) | (0.80) |
| Year Ended 8/31/2014 | $12.55 | (0.20) | 4.47 | 4.27 | — | — | — |
| Institutional Class |
| Year Ended 8/31/2018 | $29.68 | (0.03) | 9.20 | 9.17 | — | (1.13) | (1.13) |
| Year Ended 8/31/2017 | $21.94 | (0.02) | 7.84 | 7.82 | — | (0.08) | (0.08) |
| Year Ended 8/31/2016 | $18.95 | 0.01 | 3.33 | 3.34 | — | (0.35) | (0.35) |
| Year Ended 8/31/2015 | $18.70 | (0.02) | 1.13 | 1.11 | (0.10) | (0.76) | (0.86) |
| Year Ended 8/31/2014 | $13.82 | (0.05) | 4.93 | 4.88 | — | — | — |
The accompanying Notes to Financial Statements are an integral part of this statement.
| 18 | Columbia Global Technology Growth Fund | Annual Report 2018 |
Financial Highlights (continued)
| | Net
asset
value,
end of
period | Total
return | Total gross
expense
ratio to
average
net assets(a) | Total net
expense
ratio to
average
net assets(a),(b) | Net investment
income (loss)
ratio to
average
net assets | Portfolio
turnover | Net
assets,
end of
period
(000’s) |
| Class A |
| Year Ended 8/31/2018 | $36.28 | 31.32% | 1.25% | 1.25% (c) | (0.33%) | 28% | $372,730 |
| Year Ended 8/31/2017 | $28.59 | 35.41% | 1.32% | 1.32% (c) | (0.33%) | 40% | $228,598 |
| Year Ended 8/31/2016 | $21.19 | 17.52% | 1.36% | 1.36% (c) | (0.21%) | 55% | $165,271 |
| Year Ended 8/31/2015 | $18.36 | 5.70% | 1.40% | 1.40% (c) | (0.37%) | 60% | $131,079 |
| Year Ended 8/31/2014 | $18.18 | 34.97% | 1.42% | 1.42% (c) | (0.55%) | 68% | $83,656 |
| Advisor Class |
| Year Ended 8/31/2018 | $38.21 | 31.65% | 1.01% | 1.01% (c) | (0.05%) | 28% | $104,061 |
| Year Ended 8/31/2017 | $30.05 | 35.77% | 1.07% | 1.07% (c) | (0.06%) | 40% | $13,629 |
| Year Ended 8/31/2016 | $22.21 | 17.76% | 1.11% | 1.11% (c) | 0.07% | 55% | $7,235 |
| Year Ended 8/31/2015 | $19.19 | 6.04% | 1.15% | 1.15% (c) | (0.23%) | 60% | $8,345 |
| Year Ended 8/31/2014 | $18.92 | 35.24% | 1.16% | 1.16% (c) | (0.37%) | 68% | $836 |
| Class C |
| Year Ended 8/31/2018 | $32.54 | 30.31% | 2.00% | 2.00% (c) | (1.08%) | 28% | $139,590 |
| Year Ended 8/31/2017 | $25.78 | 34.39% | 2.07% | 2.07% (c) | (1.08%) | 40% | $92,158 |
| Year Ended 8/31/2016 | $19.26 | 16.65% | 2.12% | 2.12% (c) | (0.97%) | 55% | $60,684 |
| Year Ended 8/31/2015 | $16.84 | 4.91% | 2.15% | 2.15% (c) | (1.13%) | 60% | $39,660 |
| Year Ended 8/31/2014 | $16.82 | 34.02% | 2.17% | 2.17% (c) | (1.31%) | 68% | $21,775 |
| Institutional Class |
| Year Ended 8/31/2018 | $37.72 | 31.64% | 1.00% | 1.00% (c) | (0.09%) | 28% | $686,134 |
| Year Ended 8/31/2017 | $29.68 | 35.75% | 1.07% | 1.07% (c) | (0.08%) | 40% | $398,021 |
| Year Ended 8/31/2016 | $21.94 | 17.82% | 1.11% | 1.11% (c) | 0.04% | 55% | $233,750 |
| Year Ended 8/31/2015 | $18.95 | 6.00% | 1.15% | 1.15% (c) | (0.11%) | 60% | $165,748 |
| Year Ended 8/31/2014 | $18.70 | 35.31% | 1.17% | 1.17% (c) | (0.30%) | 68% | $111,506 |
The accompanying Notes to Financial Statements are an integral part of this statement.
Columbia Global Technology Growth Fund | Annual Report 2018
| 19 |
Financial Highlights (continued)
| | Net asset value,
beginning of
period | Net
investment
income
(loss) | Net
realized
and
unrealized
gain | Total from
investment
operations | Distributions
from net
investment
income | Distributions
from net
realized
gains | Total
distributions to
shareholders |
| Institutional 2 Class |
| Year Ended 8/31/2018 | $30.23 | (0.00) (d) | 9.37 | 9.37 | — | (1.15) | (1.15) |
| Year Ended 8/31/2017 | $22.33 | 0.01 | 7.97 | 7.98 | — | (0.08) | (0.08) |
| Year Ended 8/31/2016 | $19.26 | 0.03 | 3.39 | 3.42 | — | (0.35) | (0.35) |
| Year Ended 8/31/2015 | $18.98 | (0.01) | 1.16 | 1.15 | (0.11) | (0.76) | (0.87) |
| Year Ended 8/31/2014 | $14.00 | (0.01) | 4.99 | 4.98 | — | — | — |
| Institutional 3 Class |
| Year Ended 8/31/2018 | $30.31 | 0.01 | 9.39 | 9.40 | — | (1.16) | (1.16) |
| Year Ended 8/31/2017 | $22.37 | 0.03 | 7.99 | 8.02 | — | (0.08) | (0.08) |
| Year Ended 8/31/2016(e) | $19.26 | 0.04 | 3.07 | 3.11 | — | — | — |
| Notes to Financial Highlights |
| (a) | In addition to the fees and expenses that the Fund bears directly, the Fund indirectly bears a pro rata share of the fees and expenses of any other funds in which it invests. Such indirect expenses are not included in the Fund’s reported expense ratios. |
| (b) | Total net expenses include the impact of certain fee waivers/expense reimbursements made by the Investment Manager and certain of its affiliates, if applicable. |
| (c) | The benefits derived from expense reductions had an impact of less than 0.01%. |
| (d) | Rounds to zero. |
| (e) | Institutional 3 Class shares commenced operations on March 1, 2016. Per share data and total return reflect activity from that date. |
| (f) | Annualized. |
The accompanying Notes to Financial Statements are an integral part of this statement.
| 20 | Columbia Global Technology Growth Fund | Annual Report 2018 |
Financial Highlights (continued)
| | Net
asset
value,
end of
period | Total
return | Total gross
expense
ratio to
average
net assets(a) | Total net
expense
ratio to
average
net assets(a),(b) | Net investment
income (loss)
ratio to
average
net assets | Portfolio
turnover | Net
assets,
end of
period
(000’s) |
| Institutional 2 Class |
| Year Ended 8/31/2018 | $38.45 | 31.73% | 0.93% | 0.93% | (0.00%) | 28% | $101,134 |
| Year Ended 8/31/2017 | $30.23 | 35.84% | 0.98% | 0.98% | 0.02% | 40% | $45,747 |
| Year Ended 8/31/2016 | $22.33 | 17.95% | 0.98% | 0.98% | 0.16% | 55% | $18,492 |
| Year Ended 8/31/2015 | $19.26 | 6.13% | 1.00% | 1.00% | (0.05%) | 60% | $9,964 |
| Year Ended 8/31/2014 | $18.98 | 35.57% | 1.03% | 1.03% | (0.09%) | 68% | $3,168 |
| Institutional 3 Class |
| Year Ended 8/31/2018 | $38.55 | 31.77% | 0.88% | 0.88% | 0.03% | 28% | $64,995 |
| Year Ended 8/31/2017 | $30.31 | 35.96% | 0.93% | 0.93% | 0.10% | 40% | $40,899 |
| Year Ended 8/31/2016(e) | $22.37 | 16.15% | 0.94% (f) | 0.94% (f) | 0.33% (f) | 55% | $675 |
The accompanying Notes to Financial Statements are an integral part of this statement.
Columbia Global Technology Growth Fund | Annual Report 2018
| 21 |
Notes to Financial Statements
August 31, 2018
Note 1. Organization
Columbia Global Technology Growth Fund (the Fund), a series of Columbia Funds Series Trust I (the Trust), is a diversified fund. The Trust is registered under the Investment Company Act of 1940, as amended (the 1940 Act), as an open-end management investment company organized as a Massachusetts business trust.
Fund shares
The Trust may issue an unlimited number of shares (without par value). Although all share classes generally have identical voting, dividend and liquidation rights, each share class votes separately when required by the Trust’s organizational documents or by law. Different share classes pay different distribution amounts to the extent the expenses of such share classes differ, and distributions in liquidation will be proportional to the net asset value of each share class. Each share class has its own expense and sales charge structure. The Fund offers each of the share classes identified below.
Class A shares are subject to a maximum front-end sales charge of 5.75% based on the initial investment amount. Class A shares purchased without an initial sales charge in accounts aggregating $1 million to $50 million at the time of purchase are subject to a contingent deferred sales charge (CDSC) if the shares are sold within 18 months after purchase, charged as follows: 1.00% CDSC if redeemed within 12 months after purchase, and 0.50% CDSC if redeemed more than 12, but less than 18, months after purchase.
Advisor Class shares are not subject to sales charges and are generally available only to omnibus retirement plans and certain investors as described in the Fund’s prospectus. Prior to November 1, 2017, Advisor Class shares were known as Class R4 shares.
Class C shares are subject to a 1.00% CDSC on shares redeemed within 12 months after purchase. Effective July 1, 2018, Class C shares will automatically convert to Class A shares of the same Fund in the month of or the month following the 10-year anniversary of the Class C shares purchase date.
Institutional Class shares are not subject to sales charges and are generally available only to eligible investors, which are subject to different investment minimums as described in the Fund’s prospectus. Prior to November 1, 2017, Institutional Class shares were known as Class Z shares.
Institutional 2 Class shares are not subject to sales charges and are generally available only to investors purchasing through authorized investment professionals and omnibus retirement plans as described in the Fund’s prospectus. Prior to November 1, 2017, Institutional 2 Class shares were known as Class R5 shares.
Institutional 3 Class shares are not subject to sales charges and are available to institutional and certain other investors as described in the Fund’s prospectus. Prior to November 1, 2017, Institutional 3 Class shares were known as Class Y shares.
Note 2. Summary of significant accounting policies
Basis of preparation
The Fund is an investment company that applies the accounting and reporting guidance in the Financial Accounting Standards Board (FASB) Accounting Standards Codification Topic 946, Financial Services - Investment Companies (ASC 946). The financial statements are prepared in accordance with U.S. generally accepted accounting principles (GAAP), which requires management to make certain estimates and assumptions that affect the reported amounts of assets and liabilities, the disclosure of contingent assets and liabilities at the date of the financial statements and the reported amounts of income and expenses during the reporting period. Actual results could differ from those estimates.
The following is a summary of significant accounting policies followed by the Fund in the preparation of its financial statements.
| 22 | Columbia Global Technology Growth Fund | Annual Report 2018 |
Notes to Financial Statements (continued)
August 31, 2018
Security valuation
All equity securities are valued at the close of business of the New York Stock Exchange. Equity securities are valued at the last quoted sales price on the principal exchange or market on which they trade, except for securities traded on the NASDAQ Stock Market, which are valued at the NASDAQ official close price. Unlisted securities or listed securities for which there were no sales during the day are valued at the mean of the latest quoted bid and ask prices on such exchanges or markets.
Foreign equity securities are valued based on the closing price on the foreign exchange in which such securities are primarily traded. If any foreign equity security closing prices are not readily available, the securities are valued at the mean of the latest quoted bid and ask prices on such exchanges or markets. Foreign currency exchange rates are generally determined at 4:00 p.m. Eastern (U.S.) time. Many securities markets and exchanges outside the U.S. close prior to the close of the New York Stock Exchange; therefore, the closing prices for securities in such markets or on such exchanges may not fully reflect events that occur after such close but before the close of the New York Stock Exchange. In those situations, foreign securities will be fair valued pursuant to a policy adopted by the Board of Trustees, including, if available, utilizing a third party pricing service to determine these fair values. The third party pricing service takes into account multiple factors, including, but not limited to, movements in the U.S. securities markets, certain depositary receipts, futures contracts and foreign exchange rates that have occurred subsequent to the close of the foreign exchange or market, to determine a good faith estimate that reasonably reflects the current market conditions as of the close of the New York Stock Exchange. The fair value of a security is likely to be different from the quoted or published price, if available.
Investments in open-end investment companies, including money market funds, are valued at their latest net asset value.
Investments for which market quotations are not readily available, or that have quotations which management believes are not reflective of market value or reliable, are valued at fair value as determined in good faith under procedures approved by and under the general supervision of the Board of Trustees. If a security or class of securities (such as foreign securities) is valued at fair value, such value is likely to be different from the quoted or published price for the security.
The determination of fair value often requires significant judgment. To determine fair value, management may use assumptions including but not limited to future cash flows and estimated risk premiums. Multiple inputs from various sources may be used to determine fair value.
GAAP requires disclosure regarding the inputs and valuation techniques used to measure fair value and any changes in valuation inputs or techniques. In addition, investments shall be disclosed by major category. This information is disclosed following the Fund’s Portfolio of Investments.
Foreign currency transactions and translations
The values of all assets and liabilities denominated in foreign currencies are generally translated into U.S. dollars at exchange rates determined at the close of regular trading on the New York Stock Exchange. Net realized and unrealized gains (losses) on foreign currency transactions and translations include gains (losses) arising from the fluctuation in exchange rates between trade and settlement dates on securities transactions, gains (losses) arising from the disposition of foreign currency and currency gains (losses) between the accrual and payment dates on dividends, interest income and foreign withholding taxes.
For financial statement purposes, the Fund does not distinguish that portion of gains (losses) on investments which is due to changes in foreign exchange rates from that which is due to changes in market prices of the investments. Such fluctuations are included with the net realized and unrealized gains (losses) on investments in the Statement of Operations.
Security transactions
Security transactions are accounted for on the trade date. Cost is determined and gains (losses) are based upon the specific identification method for both financial statement and federal income tax purposes.
Income recognition
Corporate actions and dividend income are generally recorded net of any non-reclaimable tax withholdings, on the ex-dividend date or upon receipt of ex-dividend notification in the case of certain foreign securities.
Columbia Global Technology Growth Fund | Annual Report 2018
| 23 |
Notes to Financial Statements (continued)
August 31, 2018
The Fund may receive distributions from holdings in equity securities, business development companies (BDCs), exchange-traded funds (ETFs), limited partnerships (LPs), other regulated investment companies (RICs), and real estate investment trusts (REITs), which report information on the tax character of their distributions annually. These distributions are allocated to dividend income, capital gain and return of capital based on actual information reported. Return of capital is recorded as a reduction of the cost basis of securities held. If the Fund no longer owns the applicable securities, return of capital is recorded as a realized gain. With respect to REITs, to the extent actual information has not yet been reported, estimates for return of capital are made by the Fund’s management. Management’s estimates are subsequently adjusted when the actual character of the distributions is disclosed by the REITs, which could result in a proportionate change in return of capital to shareholders.
Awards from class action litigation are recorded as a reduction of cost basis if the Fund still owns the applicable securities on the payment date. If the Fund no longer owns the applicable securities, the proceeds are recorded as realized gains.
Expenses
General expenses of the Trust are allocated to the Fund and other funds of the Trust based upon relative net assets or other expense allocation methodologies determined by the nature of the expense. Expenses directly attributable to the Fund are charged to the Fund. Expenses directly attributable to a specific class of shares are charged to that share class.
Determination of class net asset value
All income, expenses (other than class-specific expenses, which are charged to that share class, as shown in the Statement of Operations) and realized and unrealized gains (losses) are allocated to each class of the Fund on a daily basis, based on the relative net assets of each class, for purposes of determining the net asset value of each class.
Federal income tax status
The Fund intends to qualify each year as a regulated investment company under Subchapter M of the Internal Revenue Code, as amended, and will distribute substantially all of its investment company taxable income and net capital gain, if any, for its tax year, and as such will not be subject to federal income taxes. In addition, the Fund intends to distribute in each calendar year substantially all of its ordinary income, capital gain net income and certain other amounts, if any, such that the Fund should not be subject to federal excise tax. Therefore, no federal income or excise tax provision is recorded.
Foreign taxes
The Fund may be subject to foreign taxes on income, gains on investments or currency repatriation, a portion of which may be recoverable. The Fund will accrue such taxes and recoveries, as applicable, based upon its current interpretation of tax rules and regulations that exist in the markets in which it invests.
Realized gains in certain countries may be subject to foreign taxes at the Fund level, based on statutory rates. The Fund accrues for such foreign taxes on realized and unrealized gains at the appropriate rate for each jurisdiction, as applicable. The amount, if any, is disclosed as a liability on the Statement of Assets and Liabilities.
Distributions to shareholders
Distributions from net investment income, if any, are declared and paid annually. Net realized capital gains, if any, are distributed at least annually. Income distributions and capital gain distributions are determined in accordance with federal income tax regulations, which may differ from GAAP.
Guarantees and indemnifications
Under the Trust’s organizational documents and, in some cases, by contract, its officers and trustees are indemnified against certain liabilities arising out of the performance of their duties to the Trust or its funds. In addition, certain of the Fund’s contracts with its service providers contain general indemnification clauses. The Fund’s maximum exposure under these arrangements is unknown since the amount of any future claims that may be made against the Fund cannot be determined, and the Fund has no historical basis for predicting the likelihood of any such claims.
| 24 | Columbia Global Technology Growth Fund | Annual Report 2018 |
Notes to Financial Statements (continued)
August 31, 2018
Recent accounting pronouncement
Accounting Standards Update 2017-08 Premium Amortization on Purchased Callable Debt Securities
In March 2017, the Financial Accounting Standards Board issued Accounting Standards Update (ASU) No. 2017-08 Premium Amortization on Purchased Callable Debt Securities. ASU No. 2017-08 updates the accounting standards to shorten the amortization period for certain purchased callable debt securities, held at a premium, to be amortized to the earliest call date. The update applies to securities with explicit, noncontingent call features that are callable at fixed prices and on preset dates. The standard is effective for annual periods beginning after December 15, 2018 and interim periods within those fiscal years. At this time, management is evaluating the implication of this guidance and the impact it will have on the financial statement amounts and footnote disclosures, if any.
Note 3. Fees and other transactions with affiliates
Management services fees
The Fund has entered into a Management Agreement with Columbia Management Investment Advisers, LLC (the Investment Manager), a wholly-owned subsidiary of Ameriprise Financial, Inc. (Ameriprise Financial). Under the Management Agreement, the Investment Manager provides the Fund with investment research and advice, as well as administrative and accounting services. The management services fee is an annual fee that is equal to a percentage of the Fund’s daily net assets that declines from 0.87% to 0.77% as the Fund’s net assets increase. The effective management services fee rate for the year ended August 31, 2018 was 0.84% of the Fund’s average daily net assets.
Compensation of board members
Members of the Board of Trustees who are not officers or employees of the Investment Manager or Ameriprise Financial are compensated for their services to the Fund as disclosed in the Statement of Operations. These members of the Board of Trustees may participate in a Deferred Compensation Plan (the Plan) which may be terminated at any time. Obligations of the Plan will be paid solely out of the Fund’s assets, and all amounts payable under the Plan constitute a general unsecured obligation of the Fund.
Compensation of Chief Compliance Officer
The Board of Trustees has appointed a Chief Compliance Officer to the Fund in accordance with federal securities regulations. As disclosed in the Statement of Operations, a portion of the Chief Compliance Officer’s total compensation is allocated to the Fund, along with other allocations to affiliated funds governed by the Board of Trustees, based on relative net assets.
Transfer agency fees
Under a Transfer and Dividend Disbursing Agent Agreement, Columbia Management Investment Services Corp. (the Transfer Agent), an affiliate of the Investment Manager and a wholly-owned subsidiary of Ameriprise Financial, is responsible for providing transfer agency services to the Fund. The Transfer Agent has contracted with DST Asset Manager Solutions, Inc. (DST) to serve as sub-transfer agent. The Transfer Agent pays the fees of DST for services as sub-transfer agent and DST is not entitled to reimbursement for such fees from the Fund (with the exception of out-of-pocket fees).
The Fund pays the Transfer Agent a monthly transfer agency fee based on the number or the average value of accounts, depending on the type of account. In addition, the Fund pays the Transfer Agent a fee for shareholder services based on the number of accounts or on a percentage of the average aggregate value of the Fund’s shares maintained in omnibus accounts up to the lesser of the amount charged by the financial intermediary or a cap established by the Board of Trustees from time to time.
The Transfer Agent also receives compensation from the Fund for various shareholder services and reimbursements for certain out-of-pocket fees. Total transfer agency fees for Institutional 2 Class and Institutional 3 Class shares are subject to an annual limitation of not more than 0.07% and 0.02%, respectively, of the average daily net assets attributable to each share class.
Columbia Global Technology Growth Fund | Annual Report 2018
| 25 |
Notes to Financial Statements (continued)
August 31, 2018
For the year ended August 31, 2018, the Fund’s effective transfer agency fee rates as a percentage of average daily net assets of each class were as follows:
| | Effective rate (%) |
| Class A | 0.13 |
| Advisor Class | 0.13 |
| Class C | 0.13 |
| Institutional Class | 0.13 |
| Institutional 2 Class | 0.06 |
| Institutional 3 Class | 0.01 |
An annual minimum account balance fee of $20 may apply to certain accounts with a value below the applicable share class’s initial minimum investment requirements to reduce the impact of small accounts on transfer agency fees. These minimum account balance fees are remitted to the Fund and recorded as part of expense reductions in the Statement of Operations. For the year ended August 31, 2018, these minimum account balance fees reduced total expenses of the Fund by $160.
Distribution and service fees
The Fund has entered into an agreement with Columbia Management Investment Distributors, Inc. (the Distributor), an affiliate of the Investment Manager and a wholly-owned subsidiary of Ameriprise Financial, for distribution and shareholder services. The Board of Trustees has approved, and the Fund has adopted, distribution and shareholder service plans (the Plans) applicable to certain share classes, which set the distribution and service fees for the Fund. These fees are calculated daily and are intended to compensate the Distributor and/or eligible selling and/or servicing agents for selling shares of the Fund and providing services to investors.
Under the Plans, the Fund pays a monthly service fee to the Distributor at the maximum annual rate of 0.25% of the average daily net assets attributable to Class A and Class C shares of the Fund. Also under the Plans, the Fund pays a monthly distribution fee to the Distributor at the maximum annual rates of 0.10% and 0.75% of the average daily net assets attributable to Class A and Class C shares of the Fund, respectively.
Although the Fund may pay distribution and service fees up to a maximum annual rate of 0.35% of the Fund’s average daily net assets attributable to Class A shares (comprised of up to 0.10% for distribution services and up to 0.25% for shareholder liaison services), the Fund currently limits such fees to an aggregate fee of not more than 0.25% of the Fund’s average daily net assets attributable to Class A shares.
Sales charges (unaudited)
Sales charges, including front-end charges and CDSCs, received by the Distributor for distributing Fund shares for the year ended August 31, 2018, if any, are listed below:
| | Amount ($) |
| Class A | 1,602,453 |
| Class C | 15,232 |
| 26 | Columbia Global Technology Growth Fund | Annual Report 2018 |
Notes to Financial Statements (continued)
August 31, 2018
Expenses waived/reimbursed by the Investment Manager and its affiliates
The Investment Manager and certain of its affiliates have contractually agreed to waive fees and/or reimburse expenses (excluding certain fees and expenses described below) for the period(s) disclosed below, unless sooner terminated at the sole discretion of the Board of Trustees, so that the Fund’s net operating expenses, after giving effect to fees waived/expenses reimbursed and any balance credits and/or overdraft charges from the Fund’s custodian, do not exceed the following annual rate(s) as a percentage of the class’ average daily net assets:
| | January 1, 2018
through
December 31, 2018 | Prior to
January 1, 2018 |
| Class A | 1.43% | 1.45% |
| Advisor Class | 1.18 | 1.20 |
| Class C | 2.18 | 2.20 |
| Institutional Class | 1.18 | 1.20 |
| Institutional 2 Class | 1.11 | 1.155 |
| Institutional 3 Class | 1.07 | 1.105 |
Under the agreement governing these fee waivers and/or expense reimbursement arrangements, the following fees and expenses are excluded from the waiver/reimbursement commitment, and therefore will be paid by the Fund, if applicable: taxes (including foreign transaction taxes), expenses associated with investments in affiliated and non-affiliated pooled investment vehicles (including mutual funds and exchange-traded funds), transaction costs and brokerage commissions, costs related to any securities lending program, dividend expenses associated with securities sold short, inverse floater program fees and expenses, transaction charges and interest on borrowed money, interest, infrequent and/or unusual expenses and any other expenses the exclusion of which is specifically approved by the Board of Trustees. This agreement may be modified or amended only with approval from the Investment Manager, certain of its affiliates and the Fund. Any fees waived and/or expenses reimbursed under the expense reimbursement arrangements described above are not recoverable by the Investment Manager or its affiliates in future periods.
Note 4. Federal tax information
The timing and character of income and capital gain distributions are determined in accordance with income tax regulations, which may differ from GAAP because of temporary or permanent book to tax differences.
At August 31, 2018, these differences were primarily due to differing treatment for deferral/reversal of wash sale losses, passive foreign investment company (PFIC) holdings, trustees’ deferred compensation, foreign currency transactions, net operating loss reclassification and earnings and profits distributed to shareholders on the redemption of shares. To the extent these differences were permanent, reclassifications were made among the components of the Fund’s net assets in the Statement of Assets and Liabilities. Temporary differences do not require reclassifications.
In the Statement of Assets and Liabilities the following reclassifications were made:
Excess of distributions
over net investment
income ($) | Accumulated
net realized
gain ($) | Paid in
capital ($) |
| 3,008,555 | (8,654,343) | 5,645,788 |
Net investment income (loss) and net realized gains (losses), as disclosed in the Statement of Operations, and net assets were not affected by this reclassification.
The tax character of distributions paid during the years indicated was as follows:
| Year Ended August 31, 2018 | Year Ended August 31, 2017 |
Ordinary
income ($) | Long-term
capital gains ($) | Total ($) | Ordinary
income ($) | Long-term
capital gains ($) | Total ($) |
| 5,842,954 | 26,822,839 | 32,665,793 | — | 1,969,177 | 1,969,177 |
Columbia Global Technology Growth Fund | Annual Report 2018
| 27 |
Notes to Financial Statements (continued)
August 31, 2018
Short-term capital gain distributions, if any, are considered ordinary income distributions for tax purposes.
At August 31, 2018, the components of distributable earnings on a tax basis were as follows:
Undistributed
ordinary income ($) | Undistributed
long-term
capital gains ($) | Capital loss
carryforwards ($) | Net unrealized
appreciation ($) |
| 21,041,139 | 35,861,888 | — | 516,258,929 |
At August 31, 2018, the cost of all investments for federal income tax purposes along with the aggregate gross unrealized appreciation and depreciation based on that cost was:
Federal
tax cost ($) | Gross unrealized
appreciation ($) | Gross unrealized
(depreciation) ($) | Net unrealized
appreciation ($) |
| 951,502,033 | 520,499,312 | (4,240,383) | 516,258,929 |
Tax cost of investments and unrealized appreciation/(depreciation) may also include timing differences that do not constitute adjustments to tax basis.
Management of the Fund has concluded that there are no significant uncertain tax positions in the Fund that would require recognition in the financial statements. However, management’s conclusion may be subject to review and adjustment at a later date based on factors including, but not limited to, new tax laws, regulations, and administrative interpretations (including relevant court decisions). Generally, the Fund’s federal tax returns for the prior three fiscal years remain subject to examination by the Internal Revenue Service.
Note 5. Portfolio information
The cost of purchases and proceeds from sales of securities, excluding short-term investments and derivatives, if any, aggregated to $632,601,003 and $300,515,176, respectively, for the year ended August 31, 2018. The amount of purchase and sale activity impacts the portfolio turnover rate reported in the Financial Highlights.
Note 6. Affiliated money market fund
The Fund invests in Columbia Short-Term Cash Fund, an affiliated money market fund established for the exclusive use by the Fund and other affiliated funds (the Affiliated MMF). The income earned by the Fund from such investments is included as Dividends - affiliated issuers in the Statement of Operations. As an investing fund, the Fund indirectly bears its proportionate share of the expenses of the Affiliated MMF. The Affiliated MMF prices its shares with a floating net asset value. In addition, the Board of Trustees of the Affiliated MMF may impose a fee on redemptions (sometimes referred to as a liquidity fee) or temporarily suspend redemptions (sometimes referred to as imposing a redemption gate) in the event its liquidity falls below regulatory limits.
Note 7. Interfund lending
Pursuant to an exemptive order granted by the Securities and Exchange Commission, the Fund participates in a program (the Interfund Program) allowing each participating Columbia Fund (each, a Participating Fund) to lend money directly to and, except for closed-end funds and money market funds, borrow money directly from other Participating Funds for temporary purposes. The amounts eligible for borrowing and lending under the Interfund Program are subject to certain restrictions.
Interfund loans are subject to the risk that the borrowing fund could be unable to repay the loan when due, and a delay in repayment to the lending fund could result in lost opportunities and/or additional lending costs. The exemptive order is subject to conditions intended to mitigate conflicts of interest arising from the Investment Manager’s relationship with each Participating Fund.
| 28 | Columbia Global Technology Growth Fund | Annual Report 2018 |
Notes to Financial Statements (continued)
August 31, 2018
The Fund’s activity in the Interfund Program during the year ended August 31, 2018 was as follows:
| Borrower or lender | Average loan
balance ($) | Weighted average
interest rate (%) | Days
outstanding |
| Lender | 2,000,000 | 2.49 | 1 |
Interest income earned by the Fund is recorded as interfund lending on the Statement of Operations. The Fund had no outstanding interfund loans at August 31, 2018.
Note 8. Line of credit
The Fund has access to a revolving credit facility with a syndicate of banks led by Citibank, N.A., HSBC Bank USA, N.A. and JPMorgan Chase Bank, N.A. whereby the Fund may borrow for the temporary funding of shareholder redemptions or for other temporary or emergency purposes. The credit facility, which is a collective agreement between the Fund and certain other funds managed by the Investment Manager, severally and not jointly, permits collective borrowings up to $1 billion. Interest is charged to each participating fund based on its borrowings at a rate equal to the higher of (i) the overnight federal funds rate plus 1.00% or (ii) the one-month LIBOR rate plus 1.00%. Each borrowing under the credit facility matures no later than 60 days after the date of borrowing. The Fund also pays a commitment fee equal to its pro rata share of the amount of the credit facility at a rate of 0.15% per annum. The commitment fee is included in other expenses in the Statement of Operations. This agreement expires annually in December unless extended or renewed.
The Fund had no borrowings during the year ended August 31, 2018.
Note 9. Significant risks
Foreign securities and emerging market countries risk
Investing in foreign securities may include certain risks and considerations not typically associated with investing in U.S. securities, such as fluctuating currency values and changing local and regional economic, political and social conditions, which may result in greater market volatility. In addition, certain foreign securities may not be as liquid as U.S. securities. Investing in emerging markets may accentuate these risks. These countries are also more likely to experience high levels of inflation, deflation or currency devaluation which could hurt their economies and securities markets. To the extent that the Fund concentrates its investment exposure to any one or a few specific countries, the Fund will be particularly susceptible to the various conditions, events or other factors impacting those countries and may, therefore, have a greater risk than that of a fund which is more geographically diversified.
Shareholder concentration risk
At August 31, 2018, three unaffiliated shareholders of record owned 39.8% of the outstanding shares of the Fund in one or more accounts. The Fund has no knowledge about whether any portion of those shares was owned beneficially. Affiliated shareholders of record owned 16.9% of the outstanding shares of the Fund in one or more accounts. Subscription and redemption activity by concentrated accounts may have a significant effect on the operations of the Fund. In the case of a large redemption, the Fund may be forced to sell investments at inopportune times, including its liquid positions, which may result in Fund losses and the Fund holding a higher percentage of less liquid positions. Large redemptions could result in decreased economies of scale and increased operating expenses for non-redeeming Fund shareholders.
Technology and technology-related investment risk
The Fund may be more susceptible to the particular risks that may affect companies in the information technology sector, as well as other technology-related sectors (collectively, the technology sectors) than if it were invested in a wider variety of companies in unrelated sectors. Companies in the technology sectors are subject to certain risks, including the risk that new services, equipment or technologies will not be accepted by consumers and businesses or will become rapidly obsolete. Performance of such companies may be affected by factors including obtaining and protecting patents (or the failure to do so) and significant competitive pressures, including aggressive pricing of their products or services, new market entrants, competition for market share and short product cycles due to an accelerated rate of technological developments. Such
Columbia Global Technology Growth Fund | Annual Report 2018
| 29 |
Notes to Financial Statements (continued)
August 31, 2018
competitive pressures may lead to limited earnings and/or falling profit margins. As a result, the value of their securities may fall or fail to rise. In addition, many technology sector companies have limited operating histories and prices of these companies’ securities historically have been more volatile than other securities, especially over the short term.
Note 10. Subsequent events
Management has evaluated the events and transactions that have occurred through the date the financial statements were issued and noted no items requiring adjustment of the financial statements or additional disclosure.
Note 11. Information regarding pending and settled legal proceedings
Ameriprise Financial and certain of its affiliates have historically been involved in a number of legal, arbitration and regulatory proceedings, including routine litigation, class actions, and governmental actions, concerning matters arising in connection with the conduct of their business activities. Ameriprise Financial believes that the Fund is not currently the subject of, and that neither Ameriprise Financial nor any of its affiliates are the subject of, any pending legal, arbitration or regulatory proceedings that are likely to have a material adverse effect on the Fund or the ability of Ameriprise Financial or its affiliates to perform under their contracts with the Fund. Ameriprise Financial is required to make quarterly (10-Q), annual (10-K) and, as necessary, 8-K filings with the Securities and Exchange Commission (SEC) on legal and regulatory matters that relate to Ameriprise Financial and its affiliates. Copies of these filings may be obtained by accessing the SEC website at www.sec.gov.
There can be no assurance that these matters, or the adverse publicity associated with them, will not result in increased Fund redemptions, reduced sale of Fund shares or other adverse consequences to the Fund. Further, although we believe proceedings are not likely to have a material adverse effect on the Fund or the ability of Ameriprise Financial or its affiliates to perform under their contracts with the Fund, these proceedings are subject to uncertainties and, as such, we are unable to estimate the possible loss or range of loss that may result. An adverse outcome in one or more of these proceedings could result in adverse judgments, settlements, fines, penalties or other relief that could have a material adverse effect on the consolidated financial condition or results of operations of Ameriprise Financial.
| 30 | Columbia Global Technology Growth Fund | Annual Report 2018 |
Report of Independent Registered Public Accounting Firm
To the Board of Trustees of Columbia Funds Series Trust I and Shareholders of Columbia Global Technology Growth Fund
Opinion on the Financial Statements
We have audited the accompanying statement of assets and liabilities, including the portfolio of investments, of Columbia Global Technology Growth Fund (one of the funds constituting Columbia Funds Series Trust I, hereafter referred to as the “Fund”) as of August 31, 2018, the related statement of operations for the year ended August 31, 2018, the statement of changes in net assets for each of the two years in the period ended August 31, 2018, including the related notes, and the financial highlights for each of the periods indicated therein (collectively referred to as the “financial statements”). In our opinion, the financial statements present fairly, in all material respects, the financial position of the Fund as of August 31, 2018, the results of its operations for the year then ended, the changes in its net assets for each of the two years in the period ended August 31, 2018 and the financial highlights for each of the periods indicated therein in conformity with accounting principles generally accepted in the United States of America.
Basis for Opinion
These financial statements are the responsibility of the Fund’s management. Our responsibility is to express an opinion on the Fund’s financial statements based on our audits. We are a public accounting firm registered with the Public Company Accounting Oversight Board (United States) (“PCAOB”) and are required to be independent with respect to the Fund in accordance with the U.S. federal securities laws and the applicable rules and regulations of the Securities and Exchange Commission and the PCAOB.
We conducted our audits of these financial statements in accordance with the standards of the PCAOB. Those standards require that we plan and perform the audit to obtain reasonable assurance about whether the financial statements are free of material misstatement, whether due to error or fraud.
Our audits included performing procedures to assess the risks of material misstatement of the financial statements, whether due to error or fraud, and performing procedures that respond to those risks. Such procedures included examining, on a test basis, evidence regarding the amounts and disclosures in the financial statements. Our audits also included evaluating the accounting principles used and significant estimates made by management, as well as evaluating the overall presentation of the financial statements. Our procedures included confirmation of securities owned as of August 31, 2018, by correspondence with the custodian, transfer agent, and brokers; when replies were not received from brokers, we performed other audit procedures. We believe that our audits provide a reasonable basis for our opinion.
/s/PricewaterhouseCoopers LLP
Minneapolis, Minnesota
October 22, 2018
We have served as the auditor of one or more investment companies within the Columbia Funds Complex since 1977.
Columbia Global Technology Growth Fund | Annual Report 2018
| 31 |
Federal Income Tax Information
(Unaudited)
The Fund hereby designates the following tax attributes for the fiscal year ended August 31, 2018. Shareholders will be notified in early 2019 of the amounts for use in preparing 2018 income tax returns.
Qualified
dividend
income | Dividends
received
deduction | Capital
gain
dividend |
| 32.47% | 24.75% | $44,414,062 |
Qualified dividend income. For taxable, non-corporate shareholders, the percentage of ordinary income distributed during the fiscal year that represents qualified dividend income subject to reduced tax rates.
Dividends received deduction. The percentage of ordinary income distributed during the fiscal year that qualifies for the corporate dividends received deduction.
Capital gain dividend. The Fund designates as a capital gain dividend the amount reflected above, or if subsequently determined to be different, the net capital gain of such fiscal period.
| 32 | Columbia Global Technology Growth Fund | Annual Report 2018 |
Shareholders elect the Board that oversees the Fund’s operations. The Board appoints officers who are responsible for day-to-day business decisions based on policies set by the Board. The following table provides basic biographical information about the Fund’s Trustees, including their principal occupations during the past five years, although specific titles for individuals may have varied over the period. The year set forth beneath Length of Service in the table below is the year in which the Trustee was first appointed or elected as Trustee to any Fund currently in the Columbia Funds Complex or a predecessor thereof. Under current Board policy, members serve terms of indefinite duration.
Independent trustees
| Name, address, year of birth | Position held with the Trust and length of service | Principal occupation(s) during the past five years and other relevant professional experience | Number of Funds in the Columbia Fund Complex overseen | Other directorships held by Trustee during the past five years |
Janet Langford Carrig
c/o Columbia Management
Investment Advisers, LLC
225 Franklin Street
Mail Drop BX32 05228
Boston, MA 02110
1957 | Trustee
1996 | Senior Vice President, General Counsel and Corporate Secretary, ConocoPhillips (independent energy company) since September 2007 | 69 | None |
Douglas A. Hacker
c/o Columbia Management
Investment Advisers, LLC
225 Franklin Street
Mail Drop BX32 05228
Boston, MA 02110
1955 | Trustee and Chairman of the Board
1996 | Independent business executive since May 2006; Executive Vice President — Strategy of United Airlines from December 2002 to May 2006; President of UAL Loyalty Services (airline marketing company) from September 2001 to December 2002; Executive Vice President and Chief Financial Officer of United Airlines from July 1999 to September 2001 | 69 | Spartan Nash Company, (food distributor); Nash Finch Company (food distributor) from 2005 to 2013; Aircastle Limited (aircraft leasing); SeaCube Container Leasing Ltd. (container leasing) from 2010 to 2013; and Travelport Worldwide Limited (travel information technology) |
Nancy T. Lukitsh
c/o Columbia Management
Investment Advisers, LLC
225 Franklin Street
Mail Drop BX32 05228
Boston, MA 02110
1956 | Trustee
2011 | Senior Vice President, Partner and Director of Marketing, Wellington Management Company, LLP (investment adviser) from 1997 to 2010; Chair, Wellington Management Portfolios (commingled non-U.S. investment pools) from 2007 to 2010; Director, Wellington Trust Company, NA and other Wellington affiliates from 1997 to 2010 | 69 | None |
David M. Moffett
c/o Columbia Management
Investment Advisers, LLC
225 Franklin Street
Mail Drop BX32 05228
Boston, MA 02110
1952 | Trustee
2011 | Retired. Consultant to Bridgewater and Associates | 69 | Director, CSX Corporation (transportation suppliers); Genworth Financial, Inc. (financial and insurance products and services); PayPal Holdings Inc. (payment and data processing services); Trustee, University of Oklahoma Foundation; former Director, eBay Inc. (online trading community), 2007-2015; and former Director, CIT Bank, CIT Group Inc. (commercial and consumer finance), 2010-2016 |
Columbia Global Technology Growth Fund | Annual Report 2018
| 33 |
TRUSTEES AND OFFICERS (continued)
Independent trustees (continued)
| Name, address, year of birth | Position held with the Trust and length of service | Principal occupation(s) during the past five years and other relevant professional experience | Number of Funds in the Columbia Fund Complex overseen | Other directorships held by Trustee during the past five years |
John J. Neuhauser
c/o Columbia Management
Investment Advisers, LLC
225 Franklin Street
Mail Drop BX32 05228
Boston, MA 02110
1943 | Trustee
1984 | President, Saint Michael’s College since August 2007; Director or Trustee of several non-profit organizations, including University of Vermont Medical Center; Academic Vice President and Dean of Faculties, Boston College from August 1999 to October 2005; University Professor, Boston College from November 2005 to August 2007 | 69 | Liberty All-Star Equity Fund and Liberty All- Star Growth Fund (closed-end funds) |
Patrick J. Simpson
c/o Columbia Management
Investment Advisers, LLC
225 Franklin Street
Mail Drop BX32 05228
Boston, MA 02110
1944 | Trustee
2000 | Of Counsel, Perkins Coie LLP (law firm) since 2015; Partner, Perkins Coie LLP from 1988 to 2014 | 69 | None |
Anne-Lee Verville
c/o Columbia Management
Investment Advisers, LLC
225 Franklin Street
Mail Drop BX32 05228
Boston, MA 02110
1945 | Trustee
1998 | Retired. General Manager, Global Education Industry from 1994 to 1997, President – Application Systems Division from 1991 to 1994, Chief Financial Officer – US Marketing & Services from 1988 to 1991, and Chief Information Officer from 1987 to 1988, IBM Corporation (computer and technology) | 69 | Enesco Group, Inc. (producer of giftware and home and garden decor products) from 2001 to 2006 |
Consultants to the Independent Trustees*
| Name, address, year of birth | Position held with the Trust and length of service | Principal occupation(s) during the past five years and other relevant professional experience | Number of Funds in the Columbia Funds complex overseen | Other directorships held by Trustee during the past five years |
J. Kevin Connaughton
c/o Columbia
Management Investment
Advisers, LLC,
225 Franklin Street
Mail Drop BX32 05228,
Boston, MA 02110
1964 | Independent Trustee Consultant
2016 | Independent Trustee Consultant, Columbia Funds since March 2016; Adjunct Professor of Finance, Bentley University since November 2017; Managing Director and General Manager of Mutual Fund Products, Columbia Management Investment Advisers, LLC from May 2010 to February 2015; President, Columbia Funds from 2009 to 2015; and senior officer of Columbia Funds and affiliated funds from 2003 to 2015 | 69 | Director, The Autism Project since March 2015; former Trustee, New Century Portfolios, March 2015-December 2017; formerly on Board of Governors, Gateway Healthcare, January 2016 – December 2017 |
Natalie A. Trunow
c/o Columbia
Management Investment
Advisers, LLC,
225 Franklin Street
Mail Drop BX32 05228,
Boston, MA 02110
1967 | Independent Trustee Consultant
2016 | Independent Trustee Consultant, Columbia Funds since September 2016; Chief Executive Officer, Millennial Portfolio Solutions LLC (asset management and consulting services) since January 2016; Director of Investments, Casey Family Programs from April 2016 to September 2016; Senior Vice President and Chief Investment Officer, Calvert Investments from August 2008 to January 2016; Section Head and Portfolio Manager, General Motors Asset Management from June 1997 to August 2008 | 69 | Director, Health Services for Children with Special Needs, Inc.; Director, Guidewell Financial Solutions |
| * | J. Kevin Connaughton was appointed consultant to the Independent Trustees effective March 1, 2016. Natalie A. Trunow was appointed consultant to the Independent Trustees effective September 1, 2016. Shareholders of the Funds are expected to be asked to elect each of Mr. Connaughton and Ms. Trunow as a Trustee at a future shareholder meeting. |
| 34 | Columbia Global Technology Growth Fund | Annual Report 2018 |
TRUSTEES AND OFFICERS (continued)
Interested trustee affiliated with Investment Manager*
| Name, address, year of birth | Position held with the Trust and length of service | Principal occupation(s) during the past five years and other relevant professional experience | Number of Funds in the Columbia Funds Complex overseen | Other directorships held by Trustee during the past five years |
William F. Truscott
c/o Columbia Management
Investment Advisers, LLC
225 Franklin Street
Boston, MA 02110
1960 | Trustee
2012 | Chairman of the Board and President, Columbia Management Investment Advisers, LLC since May 2010 and February 2012, respectively; Chief Executive Officer, Global Asset Management, Ameriprise Financial, Inc. since September 2012 (previously Chief Executive Officer, U.S. Asset Management & President, Annuities, May 2010-September 2012); Director and Chief Executive Officer, Columbia Management Investment Distributors, Inc. since May 2010 and February 2012, respectively; Chairman of the Board and Chief Executive Officer, RiverSource Distributors, Inc. since 2006; Director, Threadneedle Asset Management Holdings, SARL since 2014; President and Chief Executive Officer, Ameriprise Certificate Company, 2006-August 2012 | 193 | Chairman of the Board, Columbia Management Investment Advisers, LLC since May 2010; Director, Columbia Management Investment Distributors, Inc. since May 2010; former Director, Ameriprise Certificate Company, 2006 - January 2013 |
| * | Interested person (as defined under the 1940 Act) by reason of being an officer, director, security holder and/or employee of the Investment Manager or Ameriprise Financial. |
The Statement of Additional Information has additional information about the Fund’s Board members and is available, without charge, upon request by calling 800.345.6611, visiting columbiathreadneedleus.com/investor/ or contacting your financial intermediary.
Columbia Global Technology Growth Fund | Annual Report 2018
| 35 |
TRUSTEES AND OFFICERS (continued)
The Board has appointed officers who are responsible for day-to-day business decisions based on policies it has established. The officers serve at the pleasure of the Board. The following table provides basic information about the Officers of the Fund, including principal occupations during the past five years, although their specific titles may have varied over the period. In addition to Mr. Truscott, who is Senior Vice President, the Fund’s other officers are:
Fund officers
Name,
address and
year of birth | Position and year
first appointed to
position for any Fund
in the Columbia
Funds complex or a
predecessor thereof | Principal occupation(s) during past five years |
Christopher O. Petersen
5228 Ameriprise
Financial Center
Minneapolis, MN 55474
Born 1970 | President and Principal Executive Officer (2015) | Vice President and Lead Chief Counsel, Ameriprise Financial, Inc. since January 2015 (previously, Vice President and Chief Counsel, January 2010 - December 2014; officer of Columbia Funds and affiliated funds since 2007. |
Michael G. Clarke
225 Franklin Street
Boston, MA 02110
Born 1969 | Treasurer (2011), Chief Financial Officer (2009) and Chief Accounting Officer (2015) | Vice President — Mutual Fund Administration, Columbia Management Investment Advisers, LLC, since May 2010; senior officer of Columbia Funds and affiliated funds since 2002. |
Paul B. Goucher
100 Park Avenue
New York, NY 10017
Born 1968 | Senior Vice President (2011) and Assistant Secretary (2008) | Senior Vice President and Assistant General Counsel, Ameriprise Financial, Inc. since January 2017 (previously, Vice President and Lead Chief Counsel, November 2008 - January 2017 and January 2013 - January 2017, respectively); Vice President, Chief Legal Officer and Assistant Secretary, Columbia Management Investment Advisers, LLC since May 2010. |
Thomas P. McGuire
225 Franklin Street
Boston, MA 02110
Born 1972 | Senior Vice President and Chief Compliance Officer (2012) | Vice President — Asset Management Compliance, Ameriprise Financial, Inc., since May 2010; Chief Compliance Officer, Ameriprise Certificate Company since September 2010. |
Colin Moore
225 Franklin Street
Boston, MA 02110
Born 1958 | Senior Vice President (2010) | Executive Vice President and Global Chief Investment Officer, Ameriprise Financial, Inc., since July 2013; Executive Vice President and Global Chief Investment Officer, Columbia Management Investment Advisers, LLC since July 2013. |
Ryan C. Larrenaga
225 Franklin Street
Boston, MA 02110
Born 1970 | Senior Vice President (2017), Chief Legal Officer (2017) and Secretary (2015) | Vice President and Chief Counsel, Ameriprise Financial, Inc. since August 2018 (previously, Vice President and Group Counsel, August 2011 - August 2018); officer of Columbia Funds and affiliated funds since 2005. |
Michael E. DeFao
225 Franklin Street
Boston, MA 02110
Born 1968 | Vice President (2011) and Assistant Secretary (2010) | Vice President and Chief Counsel, Ameriprise Financial, Inc. since May 2010. |
Amy Johnson
5228 Ameriprise
Financial Center
Minneapolis, MN 55474
Born 1965 | Vice President (2006) | Managing Director and Global Head of Operations, Columbia Management Investment Advisers, LLC since April 2016 (previously Managing Director and Chief Operating Officer, 2010 - 2016). |
Lyn Kephart-Strong
5228 Ameriprise
Financial Center
Minneapolis, MN 55474
Born 1960 | Vice President (2015) | President, Columbia Management Investment Services Corp. since October 2014; Vice President & Resolution Officer, Ameriprise Trust Company since August 2009. |
| 36 | Columbia Global Technology Growth Fund | Annual Report 2018 |
Board Consideration and Approval of Management
Agreement
On June 12, 2018, the Board of Trustees (the Board) and the Trustees who are not interested persons (as defined in the Investment Company Act of 1940) (the Independent Trustees) of Columbia Funds Series Trust I (the Trust) unanimously approved the continuation of the Management Agreement (the Management Agreement) with Columbia Management Investment Advisers, LLC (the Investment Manager) with respect to Columbia Global Technology Growth Fund (the Fund), a series of the Trust. As detailed below, the Board’s Advisory Fees and Expenses Committee (the Committee) and the Board met on multiple occasions to review and discuss, among themselves, with the management team of the Investment Manager and with an independent fee consultant, materials provided by the Investment Manager, the independent fee consultant and others before determining to approve the continuation of the Management Agreement.
In connection with their deliberations regarding the continuation of the Management Agreement, the Committee and the Board evaluated materials requested from the Investment Manager regarding the Fund and the Management Agreement, and discussed these materials with representatives of the Investment Manager at Committee meetings held on March 6, 2018, April 26, 2018 and June 11, 2018 and at Board meetings held on March 7, 2018 and June 12, 2018. In addition, the Board and its various committees consider matters bearing on the Management Agreement at other meetings throughout the year and in prior years and meet regularly with senior management of the Trust and the Investment Manager. Through the Board’s Investment Oversight Committees, Trustees also meet with selected portfolio managers of the funds the Trustees oversee and with other investment personnel at various times throughout the year. The Committee and the Board also consulted with the independent fee consultant, Fund counsel and the Independent Trustees’ independent legal counsel, who advised on various matters with respect to the Committee’s and the Board’s considerations and otherwise assisted the Committee and the Board in their deliberations. On June 11, 2018, the Committee recommended that the Board approve the continuation of the Management Agreement. On June 12, 2018, the Board, including the Independent Trustees, voting separately, unanimously approved the continuation of the Management Agreement for the Fund.
The Committee and the Board considered all information that they, their legal counsel or the Investment Manager believed reasonably necessary to evaluate and to determine whether to recommend for approval or approve the continuation of the Management Agreement. The information and factors considered by the Committee and the Board in recommending for approval or approving the continuation of the Management Agreement for the Fund included the following:
| • | Information on the investment performance of the Fund relative to the performance of a group of mutual funds determined to be comparable to the Fund by an independent third-party data provider, as well as performance relative to benchmarks; |
| • | Information on the Fund’s management fees and total expenses, including information comparing the Fund’s expenses to those of a group of comparable mutual funds, as determined by the independent third-party data provider; |
| • | The Investment Manager’s agreement to contractually limit or cap total operating expenses for the Fund through December 31, 2019 so that total operating expenses (excluding certain fees and expenses, such as transaction costs and certain other investment related expenses, interest, taxes, acquired fund fees and expenses, and infrequent and/or unusual expenses) would not exceed a specified annual rate, as a percentage of the Fund’s net assets; |
| • | The terms and conditions of the Management Agreement; |
| • | The current and proposed terms and conditions of other agreements and arrangements with affiliates of the Investment Manager relating to the operations of the Fund, including agreements with respect to the provision of distribution, transfer agency and shareholder services to the Fund; |
| • | Descriptions of various functions performed by the Investment Manager under the Management Agreement, including portfolio management and portfolio trading practices; |
| • | Information regarding the management fees of similarly-managed portfolios of other clients of the Investment Manager, including institutional accounts and collective trusts; |
| • | Information regarding the reputation, regulatory history and resources of the Investment Manager, including information regarding senior management, portfolio managers and other personnel; |
Columbia Global Technology Growth Fund | Annual Report 2018
| 37 |
Board Consideration and Approval of Management
Agreement (continued)
| • | Information regarding the capabilities of the Investment Manager with respect to compliance monitoring services, including an assessment of the Investment Manager’s compliance system by the Fund’s Chief Compliance Officer; and |
| • | The profitability to the Investment Manager and its affiliates from their relationships with the Fund. |
Nature, extent and quality of services provided under the Management Agreement
The Committee and the Board considered the nature, extent and quality of services provided to the Fund by the Investment Manager and its affiliates under the Management Agreement and under separate agreements for the provision of transfer agency and shareholder services, and the resources dedicated to the Fund and the other Columbia Funds by the Investment Manager and its affiliates. The Committee and the Board considered, among other things, the Investment Manager’s ability to attract, motivate and retain highly qualified research, advisory and supervisory investment professionals (including compensation programs for personnel involved in fund management, reputation and other attributes), the portfolio management services provided by those investment professionals, and the quality of the Investment Manager’s investment research capabilities and trade execution services. The Committee and the Board also considered the potential benefits to shareholders of investing in a mutual fund that is part of a fund complex offering exposure to a variety of asset classes and investment disciplines and providing a variety of fund and shareholder services.
The Committee and the Board also considered the professional experience and qualifications of the senior personnel of the Investment Manager, which included consideration of the Investment Manager’s experience with similarly-structured funds. The Committee and the Board noted the compliance programs of and the compliance-related resources provided to the Fund by the Investment Manager and its affiliates and the resources dedicated by the Investment Manager and its affiliates to risk management, and considered the Investment Manager’s ability to provide administrative services to the Fund and coordinate the activities of the Fund’s other service providers. After reviewing these and related factors, the Committee and the Board concluded, within the context of their overall conclusions, that the nature, extent and quality of the services provided to the Fund under the Management Agreement supported the continuation of the Management Agreement.
Investment performance
The Committee and the Board reviewed information about the performance of the Fund over various time periods, including performance information relative to benchmarks, information that compared the performance of the Fund to the performance of a group of comparable mutual funds as determined by the independent third-party data provider, and information and analysis provided by the independent fee consultant. The Committee and the Board also reviewed a description of the third party’s methodology for identifying the Fund’s peer groups for purposes of performance and expense comparisons.
The Committee and the Board noted that, through December 31, 2017, the Fund’s performance was in the twenty-first, fourteenth and eleventh percentile (where the best performance would be in the first percentile) of its category selected by the independent third-party data provider for the purposes of performance comparisons for the one-, three- and five-year periods, respectively.
The Committee and the Board also considered the Investment Manager’s performance and reputation generally, the Investment Manager’s historical responsiveness to Board concerns about performance, and the Investment Manager’s willingness to take steps intended to improve performance. After reviewing these and related factors, the Committee and the Board concluded, within the context of their overall conclusions, that the performance of the Fund and the Investment Manager was sufficient, in light of other considerations, to support the continuation of the Management Agreement.
Investment management fee rates and other expenses
The Committee and the Board considered the management fees charged to the Fund under the Management Agreement as well as the total expenses incurred by the Fund. In assessing the reasonableness of the fees under the Management Agreement, the Committee and the Board considered, among other information, the Fund’s total expense ratio as a percentage of average daily net assets. The Committee and the Board considered data provided by the independent third-party data provider and the independent fee consultant. The Committee and the Board noted that, as of December 31, 2017, the Fund’s actual management fee and net total expense ratio were ranked in the fourth and second quintiles,
| 38 | Columbia Global Technology Growth Fund | Annual Report 2018 |
Board Consideration and Approval of Management
Agreement (continued)
respectively, (where the lowest fees and expenses would be in the first quintile) against the Fund’s expense universe as determined by the independent third-party data provider for purposes of expense comparison. The Committee and the Board also took into account the fee waiver and expense limitation arrangements agreed to by the Investment Manager, as noted above.
The Committee and the Board also received and considered information about the management fees charged by the Investment Manager to institutional accounts. In considering the fees charged to those accounts, the Committee and the Board took into account, among other things, the Investment Manager’s representations about the differences between managing mutual funds as compared to other types of accounts, including differences in the services provided, differences in the risk profile of such business for the Investment Manager and the additional resources required to manage mutual funds effectively. The Committee and the Board also received and considered information about the fees charged by the Investment Manager for sub-advisory services it provides to comparable unaffiliated funds. In evaluating the Fund’s management fees, the Committee and the Board also took into account the demands, complexity and quality of the investment management of the Fund.
After reviewing these and related factors, the Committee and the Board concluded, within the context of their overall conclusions, that the management fee rates and expenses of the Fund, in light of other considerations, supported the continuation of the Management Agreement.
Costs of services provided and profitability
The Committee and the Board also took note of the costs the Investment Manager and its affiliates incur in connection with the services provided and the profitability to the Investment Manager and its affiliates from their relationships with the Fund.
The Committee and the Board also considered the compensation directly or indirectly received by the Investment Manager’s affiliates in connection with their relationships with the Fund. The Committee and the Board reviewed information provided by management as to the profitability to the Investment Manager and its affiliates of their relationships with the Fund, information about the allocation of expenses used to calculate profitability, and comparisons of profitability levels realized in 2017 to profitability levels realized in 2016. When reviewing profitability, the Committee and the Board also considered court cases in which adviser profitability was an issue in whole or in part, the performance of similarly managed funds, the performance of the Fund, and the expense ratio of the Fund. In addition, the Committee and the Board considered information provided by the Investment Manager regarding the Investment Manager’s financial condition and comparing its profitability to that of other asset management firms that are, or are subsidiaries of, publicly traded companies. In this regard, the Committee and the Board also considered data provided by the independent fee consultant.
After reviewing these and related factors, the Committee and the Board concluded, within the context of their overall conclusions, that the costs of services provided and the profitability to the Investment Manager and its affiliates from their relationships with the Fund supported the continuation of the Management Agreement.
Economies of scale
The Committee and the Board considered the potential existence of economies of scale in the provision by the Investment Manager of services to the Fund, to groups of related funds, and to the Investment Manager’s investment advisory clients as a whole, and whether those economies of scale were shared with the Fund through breakpoints in investment management fees or other means, such as expense limitation arrangements and additional investments by the Investment Manager in investment, trading, compliance and other resources. The Committee and the Board noted that the management fee schedules for the Fund contained breakpoints that would reduce the fee rate on assets above specified threshold levels.
In considering these matters, the Committee and the Board also considered the costs of the services provided and the profitability to the Investment Manager and its affiliates from their relationships with the Fund, as noted above. After reviewing these and related factors, the Committee and the Board concluded, within the context of their overall conclusions, that the extent to which any economies of scale were expected to be shared with the Fund supported the continuation of the Management Agreement.
Columbia Global Technology Growth Fund | Annual Report 2018
| 39 |
Board Consideration and Approval of Management
Agreement (continued)
Other benefits to the Investment Manager
The Committee and the Board received and considered information regarding “fall-out” or ancillary benefits received by the Investment Manager and its affiliates as a result of their relationships with the Fund, such as the engagement of the Investment Manager’s affiliates to provide distribution, transfer agency and shareholder services to the Fund. In this regard, among other matters, the Committee and the Board considered that the Fund’s distributor retains a portion of the distribution fees from the Fund and receives a portion of the sales charges on sales or redemptions of certain classes of shares of the Fund. The Committee and the Board also considered the benefits of research made available to the Investment Manager by reason of brokerage commissions generated by the Fund’s securities transactions, and reviewed information about the Investment Manager’s practices with respect to considering brokerage and research services when allocating portfolio transactions. In this connection, the Board also noted that the amount of research made available to the Investment Manager by reason of brokerage commissions had been declining over time, and may decline further. The Committee and the Board recognized that the Investment Manager’s profitability would be somewhat lower without these benefits.
Conclusion
The Committee and the Board reviewed all of the above considerations in reaching their decisions to recommend or approve the continuation of the Management Agreement. In their deliberations, the Trustees did not identify any particular information that was all-important or controlling, and individual Trustees may have attributed different weights to the various factors. Based on their evaluation of all factors that they deemed to be material, including those factors described above, and assisted by the advice of independent legal counsel, the Board, including the Independent Trustees, voting separately, unanimously approved the continuation of the Management Agreement.
| 40 | Columbia Global Technology Growth Fund | Annual Report 2018 |
The Fund mails one shareholder report to each shareholder address. If you would like more than one report, please call shareholder services at 800.345.6611 and additional reports will be sent to you.
Proxy voting policies and procedures
The policy of the Board of Trustees is to vote the proxies of the companies in which the Fund holds investments consistent with the procedures as stated in the Statement of Additional Information (SAI). You may obtain a copy of the SAI without charge by calling 800.345.6611; contacting your financial intermediary; visiting columbiathreadneedleus.com/investor/; or searching the website of the Securities and Exchange Commission (SEC) at sec.gov. Information regarding how the Fund voted proxies relating to portfolio securities is filed with the SEC by August 31st for the most recent 12-month period ending June 30th of that year, and is available without charge by visiting columbiathreadneedleus.com/investor/, or searching the website of the SEC at sec.gov.
Quarterly schedule of investments
The Fund files a complete schedule of portfolio holdings with the SEC for the first and third quarters of each fiscal year on Form N-Q or Form N-PORT. The Fund’s Form N-Q or Form N-PORT is available on the SEC’s website at sec.gov and may be reviewed and copied at the SEC’s Public Reference Room in Washington, D.C. Information on the operation of the Public Reference Room may be obtained by calling 800.SEC.0330. The Fund’s complete schedule of portfolio holdings, as filed on Form N-Q or Form N-PORT, can also be obtained without charge, upon request, by calling 800.345.6611.
Additional Fund information
For more information about the Fund, please visit columbiathreadneedleus.com/investor/ or call 800.345.6611. Customer Service Representatives are available to answer your questions Monday through Friday from 8 a.m. to 7 p.m. Eastern time.
Fund investment manager
Columbia Management Investment Advisers, LLC
225 Franklin Street
Boston, MA 02110
Fund distributor
Columbia Management Investment Distributors, Inc.
225 Franklin Street
Boston, MA 02110
Fund transfer agent
Columbia Management Investment Services Corp.
Through October 31, 2018:
P.O. Box 8081
Boston, MA 02266-8081
Effective November 1, 2018:
P.O. Box 219104
Kansas City, MO 64121-9104
Columbia Global Technology Growth Fund | Annual Report 2018
| 41 |
Columbia Global Technology Growth Fund
Through October 31, 2018:
P.O. Box 8081
Boston, MA 02266-8081
Effective November 1, 2018:
P.O. Box 219104
Kansas City, MO 64121-9104
Please read and consider the investment objectives, risks, charges and expenses for any fund carefully before investing. For a prospectus and summary prospectus, which contains this and other important information about the Fund, go to
columbiathreadneedleus.com/investor/. The Fund is distributed by Columbia Management Investment Distributors, Inc., member FINRA, and managed by Columbia Management Investment Advisers, LLC.
Columbia Threadneedle Investments (Columbia Threadneedle) is the global brand name of the Columbia and Threadneedle group of companies. All rights reserved.
© 2018 Columbia Management Investment Advisers, LLC.
columbiathreadneedleus .com/investor/

Annual Report
August 31, 2018
Not FDIC Insured • No bank guarantee • May lose value
Dear Shareholders,
Volatility exists in financial markets and this is not a comfortable fact of life. How investors deal with this reality, including how they react to short term spikes in volatility as well as to longer periods of increased or decreased volatility, may have a significant impact on their overall investing success.
Too often, investors change their investment strategy based on something that’s happening at a moment in time rather than thinking about how that change in strategy might affect their ability to achieve their longer-term financial goals. Emotion replaces logic and reasoning. Investors may sell in reaction to a market drop (fear or panic), locking in low returns which means they won’t be invested when the market returns, or they invest more at a market peak (greed or conviction), essentially when it is expensive to do so. In both cases, selling and buying at the exact wrong time.
We believe the best outcomes come from a consistent approach to investing. Here are five areas where advisors can help us overcome the tendency to react emotionally as we struggle to make the right choices with our investments:
Long-term focus
The further away long-term goals, aspirations and objectives are, the easier it is to stray away from the goals and priorities that we set out. Advisors help us stay focused on what we want to accomplish.
Discipline through up-and-down markets
Advisors help set rules to prevent us from making rash decisions that we may regret later. Knowing ahead of time what you should do in case of certain situations will help you get through volatile markets and not make emotional decisions.
Tax-awareness
Taxes are one of the biggest drags on investment returns and are critical attributes of investing. Yet few of us take the necessary steps to ease the corrosive effect of taxes. Advisors have tools and knowledge that may help us to manage portfolios more tax-efficiently and keep more of what we earn.
Emotional objectivity
Our emotions are very hard to manage and making investment decisions in an emotional state can lead to exceedingly bad outcomes. An objective advisor can help prevent some of the reactionary mistakes emotions often lead us to.
Education and guidance
The role of the advisor is to teach and guide us toward achieving our financial goals. In terms of working through emotions, guidance is by far the most important component.
By understanding our own behaviors and biases, we can prepare for future challenges. Your success is our priority. Talk to your advisor about how working with Columbia Threadneedle Investments may help you stay the course and position your portfolio for consistent, sustainable outcomes, regardless of market conditions.
Sincerely,
Christopher O. Petersen
President, Columbia Funds
Columbia Funds are distributed by Columbia Management Investment Distributors, Inc., member FINRA, and managed by Columbia Management Investment Advisers, LLC.
© 2018 Columbia Management Investment Advisers, LLC. All rights reserved.
Columbia Balanced Fund | Annual Report 2018
Columbia Balanced Fund | Annual Report 2018
Investment objective
Columbia Balanced Fund (the Fund) seeks high total return by investing in common stocks and debt securities.
Portfolio management
Guy Pope, CFA
Co-Lead Portfolio Manager
Managed Fund since 1997
Leonard Aplet, CFA*
Co-Lead Portfolio Manager
Managed Fund since 1991
Jason Callan
Co-Portfolio Manager
Managed Fund since May 2018
Gregory Liechty
Co-Portfolio Manager
Managed Fund since 2011
Ronald Stahl, CFA
Co-Portfolio Manager
Managed Fund since 2005
*Mr. Aplet expects to retire, effective December 31, 2018.
| Average annual total returns (%) (for the period ended August 31, 2018) |
| | | Inception | 1 Year | 5 Years | 10 Years |
| Class A | Excluding sales charges | 11/01/02 | 7.63 | 8.77 | 8.47 |
| | Including sales charges | | 1.45 | 7.49 | 7.82 |
| Advisor Class* | 11/08/12 | 7.89 | 9.05 | 8.73 |
| Class C | Excluding sales charges | 10/13/03 | 6.83 | 7.96 | 7.65 |
| | Including sales charges | | 5.83 | 7.96 | 7.65 |
| Institutional Class | 10/01/91 | 7.91 | 9.05 | 8.73 |
| Institutional 2 Class* | 03/07/11 | 7.96 | 9.15 | 8.80 |
| Institutional 3 Class* | 11/08/12 | 8.01 | 9.20 | 8.82 |
| Class R* | 09/27/10 | 7.36 | 8.51 | 8.19 |
| Class T* | Excluding sales charges | 04/03/17 | 7.61 | 8.80 | 8.48 |
| | Including sales charges | | 4.92 | 8.25 | 8.21 |
| Blended Benchmark | | 11.05 | 9.69 | 8.24 |
| S&P 500 Index | | 19.66 | 14.52 | 10.86 |
| Bloomberg Barclays U.S. Aggregate Bond Index | | -1.05 | 2.49 | 3.70 |
Returns for Class A shares are shown with and without the maximum initial sales charge of 5.75%. Returns for Class C shares are shown with and without the 1.00% contingent deferred sales charge for the first year only. Returns for Class T shares are shown with and without the maximum initial sales charge of 2.50% per transaction. The Fund’s other share classes are not subject to sales charges and have limited eligibility. Effective November 1, 2017, Class R4, Class R5, Class Y and Class Z shares were renamed Advisor Class, Institutional 2 Class, Institutional 3 Class and Institutional Class shares, respectively. Please see the Fund’s prospectus for details. Performance for different share classes will vary based on differences in sales charges and fees associated with each share class. All results shown assume reinvestment of distributions during the period. Returns do not reflect the deduction of taxes that a shareholder may pay on Fund distributions or on the redemption of Fund shares. Performance results reflect the effect of any fee waivers or reimbursements of Fund expenses by Columbia Management Investment Advisers, LLC and/or any of its affiliates. Absent these fee waivers or expense reimbursement arrangements, performance results would have been lower.
The performance information shown represents past performance and is not a guarantee of future results. The investment return and principal value of your investment will fluctuate so that your shares, when redeemed, may be worth more or less than their original cost. Current performance may be lower or higher than the performance information shown. You may obtain performance information current to the most recent month-end by contacting your financial intermediary, visiting investor.columbiathreadneedleus.com or calling 800.345.6611.
| * | The returns shown for periods prior to the share class inception date (including returns for the Life of the Fund, if shown, which are since Fund inception) include the returns of the Fund’s oldest share class. These returns are adjusted to reflect any higher class-related operating expenses of the newer share classes, as applicable. Please visit investor.columbiathreadneedleus.com/investment-products/mutual-funds/appended-performance for more information. |
The Blended Benchmark is a weighted custom composite consisting of 60% S&P 500 Index and 40% Bloomberg Barclays U.S. Aggregate Bond Index.
The S&P 500 Index, an unmanaged index, measures the performance of 500 widely held, large-capitalization U.S. stocks and is frequently used as a general measure of market performance.
The Bloomberg Barclays U.S. Aggregate Bond Index is a broad-based benchmark that measures the investment-grade, U.S. dollar-denominated, fixed-rate taxable bond market, including Treasuries, government-related and corporate securities, mortgage-backed securities (agency fixed-rate and hybrid adjustable-rate mortgage passthroughs), asset-backed securities, and commercial mortgage-backed securities.
Indices are not available for investment, are not professionally managed and do not reflect sales charges, fees, brokerage commissions, taxes or other expenses of investing. Securities in the Fund may not match those in an index.
| 2 | Columbia Balanced Fund | Annual Report 2018 |
Fund at a Glance (continued)
Performance of a hypothetical $10,000 investment (August 31, 2008 — August 31, 2018)
The chart above shows the change in value of a hypothetical $10,000 investment in Class A shares of Columbia Balanced Fund during the stated time period, and does not reflect the deduction of taxes that a shareholder may pay on Fund distributions or on the redemption of Fund shares.
| Top 10 holdings (%) (at August 31, 2018) |
| Apple, Inc. | 3.6 |
| Microsoft Corp. | 3.0 |
| Amazon.com, Inc. | 2.4 |
| JPMorgan Chase & Co. | 2.2 |
| Facebook, Inc., Class A | 2.1 |
U.S. Treasury
02/15/2045 2.500% | 2.0 |
| Medtronic PLC | 1.9 |
| Alphabet, Inc., Class C | 1.9 |
| Berkshire Hathaway, Inc., Class B | 1.8 |
| Johnson & Johnson | 1.7 |
Percentages indicated are based upon total investments (excluding Money Market Funds and derivatives, if any).
For further detail about these holdings, please refer to the section entitled “Portfolio of Investments.”
Fund holdings are as of the date given, are subject to change at any time, and are not recommendations to buy or sell any security.
| Portfolio breakdown (%) (at August 31, 2018) |
| Asset-Backed Securities — Non-Agency | 3.6 |
| Commercial Mortgage-Backed Securities - Agency | 1.7 |
| Commercial Mortgage-Backed Securities - Non-Agency | 2.1 |
| Common Stocks | 62.9 |
| Corporate Bonds & Notes | 10.6 |
| Exchange-Traded Funds | 0.9 |
| Foreign Government Obligations | 0.4 |
| Inflation-Indexed Bonds | 0.9 |
| Money Market Funds | 4.4 |
| Residential Mortgage-Backed Securities - Agency | 7.5 |
| Residential Mortgage-Backed Securities - Non-Agency | 1.8 |
| Senior Loans | 0.0 (a) |
| U.S. Government & Agency Obligations | 1.3 |
| U.S. Treasury Obligations | 1.9 |
| Total | 100.0 |
Percentages indicated are based upon total investments and exclude investments in derivatives, if any. The Fund’s portfolio composition is subject to change.
Columbia Balanced Fund | Annual Report 2018
| 3 |
Fund at a Glance (continued)
| Equity sector breakdown (%) (at August 31, 2018) |
| Consumer Discretionary | 11.3 |
| Consumer Staples | 6.2 |
| Energy | 5.8 |
| Financials | 15.6 |
| Health Care | 16.9 |
| Industrials | 7.7 |
| Information Technology | 28.0 |
| Materials | 3.2 |
| Real Estate | 2.4 |
| Telecommunication Services | 2.1 |
| Utilities | 0.8 |
| Total | 100.0 |
Percentages indicated are based upon total equity investments. The Fund’s portfolio composition is subject to change.
| 4 | Columbia Balanced Fund | Annual Report 2018 |
Manager Discussion of Fund Performance
For the 12-month period that ended August 31, 2018, the Fund’s Class A shares returned 7.63% excluding sales charges. The Fund’s Blended Benchmark, returned 11.05% for the same time period. During the same 12-month period, the Fund’s equity benchmark, the S&P 500 Index, returned 19.66%, while the Fund’s fixed-income benchmark, the Bloomberg Barclays U.S. Aggregate Bond Index, returned -1.05%. Stock selection in the Fund’s equity portfolio generally accounted for the shortfall relative to the Blended Benchmark. However, an overweight in equities had a positive impact on performance, as stocks outperformed bonds for the reporting period. The Fund’s fixed-income portfolio outperformed its fixed-income benchmark, which also helped narrow the performance gap between the Fund and Blended Benchmark returns.
Equity markets move higher while bonds bow to rising rates
U.S. equities delivered solid gains for the 12-month period that ended August 31, 2018, hitting record highs along the way. Buoyant corporate earnings, especially in the information technology sector, along with a strengthening domestic economy and a solid global economy, boosted investor sentiment. Consumer confidence was high, jobs data remained strong and personal income increased as the period wore on. Tax cuts approved by Congress late in 2017 had a favorable impact on corporate earnings and helped fuel investor optimism. Concerns that interest rates and inflation might rise faster than expected briefly put a damper on equity markets early in 2018, the first such correction in two years. Equities quickly recovered their lost ground — and then some. For the 12 months ended August 31, 2018, the S&P 500 Index gained 19.66%. Growth stocks outperformed value stocks, and small-cap stocks outperformed large- and mid-cap stocks.
Rising interest rates weighed on bond prices in most sectors. High-yield bonds, which are less sensitive to interest rate moves, were the exception with positive returns. The Federal Reserve (Fed) raised the federal funds target rate three times during the period, to 1.75% - 2.00%, citing strong job growth and inflation in line with its 2.0% target. As the potential for even higher inflation and economic slowdown increased, the yield curve continued to flatten, as yields in the one- to three-year range rose more than longer-term yields. The yield on the 10-year U.S. Treasury ended the period at 2.86%.
Equity portfolio delivered solid gains
In a generally favorable period for equities, the Fund generated solid gains. Sector allocation decisions were positive for performance, while stock selection generally accounted for the Fund’s shortfall relative to its equity benchmark. Market dynamics shifted, and stylistically, it became more challenging to find gems that were consistent with our contrarian philosophy.
An underweight in utilities and good stock selection in the materials sector aided Fund performance. In utilities, the Fund performed well because it was underweight and the sector underperformed. In the materials sector, a position in Sherwin Williams aided results, as domestic fundamentals for the paint giant were strong.
Elsewhere in the portfolio, disappointments were mostly stock specific. Citigroup, in the financials sector, detracted from performance as investors worried about a global slowdown in economic growth. Citigroup is more international than its peers. Gains from JPMorgan were not enough to offset the loss from Citigroup. In the energy sector, Haliburton was a poor performer, suffering from a slowdown in the pressure pumping business, which faced a deteriorating demand outlook. A significant gain from a position in EOG was not enough to offset this disappointment.
An outsized position in Phillip Morris in the consumer staples sector was a drag on performance as the company suffered from a slowdown in its smokeless business. Demand slowed in Japan, and a strong U.S. dollar hurt expected revenues as well. Despite strong gains from technology positions in Mastercard, Palo Alto, Cisco, Apple and Microsoft, the Fund underperformed the broad sector, with significant disappointments from Facebook and Broadcom. A combination of concerns over privacy, which led to increased spending, and slower revenue growth led investors to mark down future earnings expectations for Facebook. Slower growth for semiconductors, combined with specific investor expectations, led Broadcom lower. The company’s unsuccessful bid for Qualcomm was not well received, nor was the subsequent acquisition of CA Technologies.
Columbia Balanced Fund | Annual Report 2018
| 5 |
Manager Discussion of Fund Performance (continued)
Even though retailers helped boost gains in the consumer discretionary sector, exposure to Comcast was a drag on performance. Investors rejected the company’s efforts to acquire Sky Media and Fox Network. Fears about cable cord cutting also weighed on Comcast share price. Good performance from several key health care stocks, namely Abbott Laboratories and Anthem, was more than offset from negative performance from biotechnology holdings Allergan and Celgene. Patent protection figured into the downfall of both stocks.
Fixed-income portfolio outperformed its benchmark
The Fund’s fixed-income portfolio benefited from its shorter duration relative to its benchmark, an overweight in BBB rated securities and a small allocation to high-yield bonds, which delivered positive returns in an otherwise negative environment for fixed income. As interest rates rose across all maturities, the Fund’s duration positioning helped stem losses (duration is a measure of interest rate sensitivity). Two-year notes rose 130 basis points to 2.63%, while ten-year notes increased 74 basis points to 2.86%, and the 30-year bond was up 29 basis points to 3.02%. (A basis point is one hundredth of one percent.) Treasury future contracts were used to hedge the Fund’s duration and yield curve management.
The yield difference between corporate bonds and similar-duration U.S. Treasuries tightened over the course of the year, helping corporate bonds outperform. Within the corporate market, the Fund’s exposure to energy, wirelines, media and real estate investment trusts aided results, as they were the segment’s best performers. The Fund’s overweight in BBB-rated securities and a small allocation to high-yield bonds also aided relative results, as lower quality securities outperformed higher quality securities.
An overweight in both asset-backed securities (ABS) and commercial mortgage backed securities (CMBS) also had a positive impact on performance, as both sectors outperformed Treasuries. Agency mortgages also outperformed Treasuries. However, the Fund was slightly underweight in agency mortgages in lieu of its overweights in ABS and CMBS. Within CMBS, the Fund remained overweight in agency and non-agency bonds, and continued to find particular value in ABS.
At period’s end
Although the Fund’s equity portfolio underperformed its equity benchmark, we remain believers in our contrarian philosophy. We plan to stay with our core principles in constructing the portfolio and managing it from day to day, as we believe this discipline has served our shareholders well over the long term.
Within the Fund’s fixed-income portfolio, we continue to target a shorter duration than that of the fixed-income benchmark to help mitigate continued rising rates. However, we moved the Fund’s duration closer to that of the fixed-income benchmark as rates rose significantly over the past year. We believe that the Fed’s interest rate policy remains data-dependent with regards to timing of interest rate hikes and the runoff of its balance sheet. We continue to watch inflation expectations, employment, global economic growth and global fiscal and monetary policies. While we expect some volatility, we consider risk premiums in most sectors to be reasonably attractive, although not as attractive as they were in previous years.
The Fund remained underweight in U.S. government securities relative to the benchmark. We continued to favor ABS and CMBS, as they offered relatively attractive yields compared to Treasuries. The Fund also remained overweight in the energy, insurance, communications and electric utility industries within the corporate bond sector.
Market risk may affect a single issuer, sector of the economy, industry or the market as a whole. There are risks associated with fixed-income investments, including credit risk, interest rate risk, and prepayment and extension risk. In general, bond prices rise when interest rates fall and vice versa. This effect is usually more pronounced for longer term securities. A rise in interest rates may result in a price decline of fixed-income instruments held by the Fund, negatively impacting its performance and NAV. Falling rates may result in the Fund investing in lower yielding debt instruments, lowering the Fund’s income and yield. These risks may be heightened for longer maturity and duration securities. Foreign investments subject the Fund to risks, including political, economic, market, social and others within a particular country, as well as to currency instabilities and less stringent financial and accounting standards generally applicable to U.S. issuers. Investing in derivatives is a specialized activity that involves special risks that subject the Fund to significant loss potential, including when used as leverage, and may result in greater fluctuation in Fund value. See the Fund’s prospectus for more information on these and other risks.
| 6 | Columbia Balanced Fund | Annual Report 2018 |
Manager Discussion of Fund Performance (continued)
The views expressed in this report reflect the current views of the respective parties. These views are not guarantees of future performance and involve certain risks, uncertainties and assumptions that are difficult to predict, so actual outcomes and results may differ significantly from the views expressed. These views are subject to change at any time based upon economic, market or other conditions and the respective parties disclaim any responsibility to update such views. These views may not be relied on as investment advice and, because investment decisions for a Columbia fund are based on numerous factors, may not be relied on as an indication of trading intent on behalf of any particular Columbia fund. References to specific securities should not be construed as a recommendation or investment advice.
Columbia Balanced Fund | Annual Report 2018
| 7 |
Understanding Your Fund’s Expenses
(Unaudited)
As an investor, you incur two types of costs. There are shareholder transaction costs, which generally include sales charges on purchases and may include redemption fees. There are also ongoing costs, which generally include management fees, distribution and/or service fees, and other fund expenses. The following information is intended to help you understand your ongoing costs (in dollars) of investing in the Fund and to help you compare these costs with the ongoing costs of investing in other mutual funds.
Analyzing your Fund’s expenses
To illustrate these ongoing costs, we have provided examples and calculated the expenses paid by investors in each share class of the Fund during the period. The actual and hypothetical information in the table is based on an initial investment of $1,000 at the beginning of the period indicated and held for the entire period. Expense information is calculated two ways and each method provides you with different information. The amount listed in the “Actual” column is calculated using the Fund’s actual operating expenses and total return for the period. You may use the Actual information, together with the amount invested, to estimate the expenses that you paid over the period. Simply divide your account value by $1,000 (for example, an $8,600 account value divided by $1,000 = 8.6), then multiply the results by the expenses paid during the period under the “Actual” column. The amount listed in the “Hypothetical” column assumes a 5% annual rate of return before expenses (which is not the Fund’s actual return) and then applies the Fund’s actual expense ratio for the period to the hypothetical return. You should not use the hypothetical account values and expenses to estimate either your actual account balance at the end of the period or the expenses you paid during the period. See “Compare with other funds” below for details on how to use the hypothetical data.
Compare with other funds
Since all mutual funds are required to include the same hypothetical calculations about expenses in shareholder reports, you can use this information to compare the ongoing cost of investing in the Fund with other funds. To do so, compare the hypothetical example with the 5% hypothetical examples that appear in the shareholder reports of other funds. As you compare hypothetical examples of other funds, it is important to note that hypothetical examples are meant to highlight the ongoing costs of investing in a fund only and do not reflect any transaction costs, such as sales charges, or redemption or exchange fees. Therefore, the hypothetical calculations are useful in comparing ongoing costs only, and will not help you determine the relative total costs of owning different funds. If transaction costs were included in these calculations, your costs would be higher.
| March 1, 2018 — August 31, 2018 |
| | Account value at the
beginning of the
period ($) | Account value at the
end of the
period ($) | Expenses paid during
the period ($) | Fund’s annualized
expense ratio (%) |
| | Actual | Hypothetical | Actual | Hypothetical | Actual | Hypothetical | Actual |
| Class A | 1,000.00 | 1,000.00 | 1,035.40 | 1,020.37 | 4.93 | 4.89 | 0.96 |
| Advisor Class | 1,000.00 | 1,000.00 | 1,036.60 | 1,021.68 | 3.59 | 3.57 | 0.70 |
| Class C | 1,000.00 | 1,000.00 | 1,031.40 | 1,016.59 | 8.76 | 8.69 | 1.71 |
| Institutional Class | 1,000.00 | 1,000.00 | 1,036.70 | 1,021.63 | 3.64 | 3.62 | 0.71 |
| Institutional 2 Class | 1,000.00 | 1,000.00 | 1,037.20 | 1,021.93 | 3.34 | 3.31 | 0.65 |
| Institutional 3 Class | 1,000.00 | 1,000.00 | 1,037.30 | 1,022.18 | 3.08 | 3.06 | 0.60 |
| Class R | 1,000.00 | 1,000.00 | 1,034.40 | 1,019.11 | 6.20 | 6.16 | 1.21 |
| Class T | 1,000.00 | 1,000.00 | 1,035.20 | 1,020.37 | 4.92 | 4.89 | 0.96 |
Expenses paid during the period are equal to the annualized expense ratio for each class as indicated above, multiplied by the average account value over the period and then multiplied by the number of days in the Fund’s most recent fiscal half year and divided by 365.
Expenses do not include fees and expenses incurred indirectly by the Fund from its investment in underlying funds, including affiliated and non-affiliated pooled investment vehicles, such as mutual funds and exchange-traded funds.
| 8 | Columbia Balanced Fund | Annual Report 2018 |
Portfolio of Investments
August 31, 2018
(Percentages represent value of investments compared to net assets)
Investments in securities
| Asset-Backed Securities — Non-Agency 3.6% |
| Issuer | Coupon
Rate | | Principal
Amount ($) | Value ($) |
| Ally Master Owner Trust |
| Series 2018-1 Class A2 |
| 01/17/2023 | 2.700% | | 18,850,000 | 18,667,438 |
| Series 2018-4 Class A |
| 07/17/2023 | 3.300% | | 4,250,000 | 4,266,877 |
| Avis Budget Rental Car Funding AESOP LLC(a) |
| Series 2013-1A Class A |
| 09/20/2019 | 1.920% | | 16,667 | 16,660 |
| Series 2015-1A Class A |
| 07/20/2021 | 2.500% | | 17,895,000 | 17,673,703 |
| Series 2016-2A Class A |
| 11/20/2022 | 2.720% | | 4,100,000 | 4,009,241 |
| CarFinance Capital Auto Trust(a) |
| Series 2015-1A Class A |
| 06/15/2021 | 1.750% | | 59,886 | 59,858 |
| Chesapeake Funding II LLC(a) |
| Series 2016-1A Class A1 |
| 03/15/2028 | 2.110% | | 1,682,489 | 1,675,955 |
| Series 2016-2A Class A1 |
| 06/15/2028 | 1.880% | | 2,736,572 | 2,722,526 |
| Series 2017-3A Class A1 |
| 08/15/2029 | 1.910% | | 3,323,314 | 3,279,701 |
| Series 2017-4A Class A1 |
| 11/15/2029 | 2.120% | | 8,704,487 | 8,595,900 |
| Series 2018-2A Class A1 |
| 08/15/2030 | 3.230% | | 7,375,000 | 7,374,147 |
| Chrysler Capital Auto Receivables Trust(a) |
| Series 2016-BA Class A3 |
| 07/15/2021 | 1.640% | | 9,059,342 | 9,011,655 |
| Conn’s Receivables Funding LLC(a) |
| Series 2018-A Class A |
| 01/15/2023 | 3.250% | | 4,125,000 | 4,120,681 |
| Exeter Automobile Receivables Trust(a) |
| Series 2016-3A Class A |
| 11/16/2020 | 1.840% | | 372,235 | 371,823 |
| Ford Credit Auto Owner Trust(a) |
| Series 2015-1 Class A |
| 07/15/2026 | 2.120% | | 8,849,000 | 8,746,753 |
| Series 2017-1 Class A |
| 08/15/2028 | 2.620% | | 15,400,000 | 15,068,695 |
| Ford Credit Floorplan Master Owner Trust A |
| Series 2016-5 Class 1A |
| 11/15/2021 | 1.950% | | 7,800,000 | 7,715,181 |
| Series 2017-1 Class A1 |
| 05/15/2022 | 2.070% | | 10,000,000 | 9,852,376 |
| Asset-Backed Securities — Non-Agency (continued) |
| Issuer | Coupon
Rate | | Principal
Amount ($) | Value ($) |
| GM Financial Automobile Leasing Trust |
| Series 2016-3 Class A3 |
| 12/20/2019 | 1.610% | | 1,731,662 | 1,726,988 |
| Series 2017-2 Class A3 |
| 09/21/2020 | 2.020% | | 4,450,000 | 4,412,330 |
| GMF Floorplan Owner Revolving Trust(a) |
| Series 2017-1 Class A1 |
| 01/18/2022 | 2.220% | | 5,120,000 | 5,069,241 |
| Hertz Fleet Lease Funding LP(a) |
| Series 2016-1 Class A2 |
| 04/10/2030 | 1.960% | | 4,738,623 | 4,723,553 |
| Hertz Vehicle Financing II LP(a) |
| Series 2016-3A Class A |
| 07/25/2020 | 2.270% | | 14,055,000 | 13,963,343 |
| Hilton Grand Vacations Trust(a) |
| Series 2013-A Class A |
| 01/25/2026 | 2.280% | | 364,431 | 362,456 |
| Series 2014-AA Class A |
| 11/25/2026 | 1.770% | | 658,629 | 647,485 |
| Hyundai Auto Lease Securitization Trust(a) |
| Series 2017-A Class A2A |
| 07/15/2019 | 1.560% | | 409,975 | 409,806 |
| Hyundai Floorplan Master Owner Trust(a) |
| Series 2016-1A Class A2 |
| 03/15/2021 | 1.810% | | 5,500,000 | 5,475,719 |
| John Deere Owner Trust |
| Series 2017-B Class A3 |
| 10/15/2021 | 1.820% | | 4,120,000 | 4,066,010 |
| Kubota Credit Owner Trust(a) |
| Series 2016-1A Class A3 |
| 07/15/2020 | 1.500% | | 2,886,713 | 2,864,710 |
| MVW Owner Trust(a) |
| Series 2015-1A Class A |
| 12/20/2032 | 2.520% | | 1,483,497 | 1,450,825 |
| Series 2016-1A Class A |
| 12/20/2033 | 2.250% | | 2,536,435 | 2,469,114 |
| Navient Private Education Refi Loan Trust(a) |
| Series 2018-A Class A1 |
| 02/18/2042 | 2.530% | | 5,522,042 | 5,482,044 |
| Navitas Equipment Receivables LLC(a) |
| Series 2016-1 Class A2 |
| 06/15/2021 | 2.200% | | 1,242,928 | 1,240,620 |
| New York City Tax Lien Trust(a) |
| Series 2017-A Class A |
| 11/10/2030 | 1.870% | | 1,513,368 | 1,494,220 |
The accompanying Notes to Financial Statements are an integral part of this statement.
Columbia Balanced Fund | Annual Report 2018
| 9 |
Portfolio of Investments (continued)
August 31, 2018
| Asset-Backed Securities — Non-Agency (continued) |
| Issuer | Coupon
Rate | | Principal
Amount ($) | Value ($) |
| NextGear Floorplan Master Owner Trust(a) |
| Series 2017-2A Class A2 |
| 10/17/2022 | 2.560% | | 5,900,000 | 5,810,413 |
| Nissan Auto Lease Trust |
| Series 2017-A Class A3 |
| 04/15/2020 | 1.910% | | 3,850,000 | 3,827,094 |
| Sierra Receivables Funding Co., LLC(a) |
| Series 2017-1A Class A |
| 03/20/2034 | 2.910% | | 2,142,706 | 2,125,024 |
| Sierra Timeshare Receivables Funding LLC(a) |
| Series 2016-3A Class A |
| 10/20/2033 | 2.430% | | 2,668,504 | 2,623,360 |
| Series 2018-2A Class A |
| 06/20/2035 | 3.500% | | 5,652,673 | 5,654,806 |
| SLM Private Education Loan Trust(a) |
| Series 2012-A Class A2 |
| 01/17/2045 | 3.830% | | 1,809,613 | 1,816,429 |
| SoFi Consumer Loan Program LLC(a) |
| Series 2017-4 Class A |
| 05/26/2026 | 2.500% | | 3,480,690 | 3,440,490 |
| Verizon Owner Trust(a) |
| Series 2016-1A Class A |
| 01/20/2021 | 1.420% | | 15,907,327 | 15,831,300 |
| Series 2016-2A Class A |
| 05/20/2021 | 1.680% | | 1,540,000 | 1,528,074 |
| Series 2017-1A Class A |
| 09/20/2021 | 2.060% | | 5,150,000 | 5,101,715 |
| Series 2017-2A Class A |
| 12/20/2021 | 1.920% | | 2,925,000 | 2,888,212 |
| Series 2018-1A Class A1A |
| 09/20/2022 | 2.820% | | 3,350,000 | 3,333,740 |
| VSE Voi Mortgage LLC(a) |
| Series 2018-A Class A |
| 02/20/2036 | 3.560% | | 6,800,000 | 6,796,182 |
| World Omni Auto Receivables Trust |
| Series 2017-A Class A3 |
| 09/15/2022 | 1.930% | | 16,511,000 | 16,335,072 |
| Series 2018-A Class A3 |
| 04/17/2023 | 2.500% | | 6,565,000 | 6,496,432 |
Total Asset-Backed Securities — Non-Agency
(Cost $265,059,577) | 262,695,977 |
|
| Commercial Mortgage-Backed Securities - Agency 1.7% |
| | | | |
| Federal Home Loan Mortgage Corp. |
| Series K729 Class A2 |
| 10/25/2024 | 3.136% | | 16,900,000 | 16,910,696 |
| Federal Home Loan Mortgage Corp. Multifamily Structured Pass-Through Certificates |
| Series K041 Class A2 |
| 10/25/2024 | 3.171% | | 11,500,000 | 11,535,586 |
| Commercial Mortgage-Backed Securities - Agency (continued) |
| Issuer | Coupon
Rate | | Principal
Amount ($) | Value ($) |
| Government National Mortgage Association |
| CMO Series 2012-25 Class A |
| 11/16/2042 | 2.575% | | 805,714 | 801,761 |
| CMO Series 2012-58 Class A |
| 01/16/2040 | 2.500% | | 557,414 | 550,602 |
| CMO Series 2013-105 Class A |
| 02/16/2037 | 1.705% | | 2,815,123 | 2,733,858 |
| CMO Series 2013-118 Class AB |
| 06/16/2036 | 2.000% | | 1,703,767 | 1,671,429 |
| CMO Series 2013-12 Class A |
| 10/16/2042 | 1.410% | | 3,475,390 | 3,387,569 |
| CMO Series 2013-126 Class AB |
| 04/16/2038 | 1.540% | | 5,523,963 | 5,355,173 |
| CMO Series 2013-138 Class A |
| 08/16/2035 | 2.150% | | 2,645,147 | 2,620,070 |
| CMO Series 2013-146 Class AH |
| 08/16/2040 | 2.000% | | 1,411,704 | 1,389,116 |
| CMO Series 2013-17 Class AH |
| 10/16/2043 | 1.558% | | 1,017,154 | 979,017 |
| CMO Series 2013-179 Class A |
| 07/16/2037 | 1.800% | | 1,702,941 | 1,656,221 |
| CMO Series 2013-194 Class AB |
| 05/16/2038 | 2.250% | | 1,122,351 | 1,102,271 |
| CMO Series 2013-2 Class AB |
| 12/16/2042 | 1.600% | | 611,416 | 601,490 |
| CMO Series 2013-30 Class A |
| 05/16/2042 | 1.500% | | 1,869,017 | 1,798,072 |
| CMO Series 2013-32 Class AB |
| 01/16/2042 | 1.900% | | 2,084,753 | 2,030,094 |
| CMO Series 2013-33 Class A |
| 07/16/2038 | 1.061% | | 3,087,013 | 2,963,975 |
| CMO Series 2013-40 Class A |
| 10/16/2041 | 1.511% | | 986,487 | 960,845 |
| CMO Series 2013-50 Class AH |
| 06/16/2039 | 2.100% | | 1,296,266 | 1,269,008 |
| CMO Series 2013-57 Class A |
| 06/16/2037 | 1.350% | | 2,651,788 | 2,577,011 |
| CMO Series 2013-61 Class A |
| 01/16/2043 | 1.450% | | 1,380,827 | 1,323,895 |
| CMO Series 2013-73 Class AE |
| 01/16/2039 | 1.350% | | 5,776,127 | 5,568,451 |
| CMO Series 2013-78 Class AB |
| 07/16/2039 | 1.624% | | 1,262,383 | 1,208,669 |
| CMO Series 2014-103 Class AB |
| 06/16/2053 | 1.742% | | 1,884,175 | 1,860,571 |
The accompanying Notes to Financial Statements are an integral part of this statement.
| 10 | Columbia Balanced Fund | Annual Report 2018 |
Portfolio of Investments (continued)
August 31, 2018
| Commercial Mortgage-Backed Securities - Agency (continued) |
| Issuer | Coupon
Rate | | Principal
Amount ($) | Value ($) |
| CMO Series 2014-109 Class A |
| 01/16/2046 | 2.325% | | 3,320,539 | 3,277,698 |
| CMO Series 2014-135 Class AD |
| 08/16/2045 | 2.400% | | 2,926,622 | 2,876,896 |
| CMO Series 2014-138 Class A |
| 01/16/2044 | 2.700% | | 1,070,139 | 1,061,514 |
| CMO Series 2014-148 Class A |
| 11/16/2043 | 2.650% | | 1,316,062 | 1,305,719 |
| CMO Series 2014-169 Class A |
| 11/16/2042 | 2.600% | | 1,300,097 | 1,290,175 |
| CMO Series 2014-24 Class BA |
| 07/16/2038 | 2.100% | | 1,625,551 | 1,606,256 |
| CMO Series 2014-33 Class A |
| 08/16/2039 | 2.300% | | 869,401 | 856,176 |
| CMO Series 2014-64 Class A |
| 02/16/2045 | 2.200% | | 1,516,840 | 1,497,398 |
| CMO Series 2014-67 Class AE |
| 05/16/2039 | 2.150% | | 605,721 | 598,003 |
| CMO Series 2015-109 Class A |
| 02/16/2040 | 2.528% | | 6,825,104 | 6,681,194 |
| CMO Series 2015-21 Class A |
| 11/16/2042 | 2.600% | | 3,118,590 | 3,091,613 |
| CMO Series 2015-33 Class AH |
| 02/16/2045 | 2.650% | | 642,093 | 638,138 |
| CMO Series 2015-5 Class KA |
| 11/16/2039 | 2.500% | | 3,676,809 | 3,596,473 |
| CMO Series 2015-78 Class A |
| 06/16/2040 | 2.918% | | 4,090,345 | 4,035,059 |
| CMO Series 2015-85 Class AF |
| 05/16/2044 | 2.400% | | 4,772,095 | 4,679,459 |
| CMO Series 2015-98 Class AE |
| 04/16/2041 | 2.100% | | 2,557,758 | 2,485,270 |
| CMO Series 2016-39 Class AG |
| 01/16/2043 | 2.300% | | 6,698,816 | 6,502,338 |
| Government National Mortgage Association(b) |
| CMO Series 2015-71 Class DA |
| 09/16/2049 | 2.133% | | 5,980,099 | 5,795,910 |
Total Commercial Mortgage-Backed Securities - Agency
(Cost $127,654,004) | 124,730,739 |
|
| Commercial Mortgage-Backed Securities - Non-Agency 2.1% |
| | | | |
| American Homes 4 Rent Trust(a) |
| Series 2014-SFR2 Class A |
| 10/17/2036 | 3.786% | | 2,837,853 | 2,861,486 |
| Series 2014-SFR3 Class A |
| 12/17/2036 | 3.678% | | 3,321,647 | 3,339,549 |
| Commercial Mortgage-Backed Securities - Non-Agency (continued) |
| Issuer | Coupon
Rate | | Principal
Amount ($) | Value ($) |
| Series 2015-SFR1 Class A |
| 04/17/2052 | 3.467% | | 3,450,991 | 3,426,560 |
| Series 2015-SFR2 Class A |
| 10/17/2045 | 3.732% | | 2,593,401 | 2,613,950 |
| Americold 2010 LLC(a) |
| Series 2010-ARTA Class A1 |
| 01/14/2029 | 3.847% | | 129,943 | 131,038 |
| Ashford Hospitality Trust(a),(c) |
| Series 2018-KEYS Class B |
1-month USD LIBOR + 1.300%
05/15/2035 | 3.500% | | 8,525,000 | 8,530,268 |
| CFCRE Commercial Mortgage Trust |
| Series 2016-C4 Class A1 |
| 05/10/2058 | 1.501% | | 1,923,982 | 1,887,590 |
| Colony Multifamily Mortgage Trust(a) |
| Series 2014-1 Class A |
| 04/20/2050 | 2.543% | | 237,156 | 236,413 |
| Commercial Mortgage Trust |
| Series 2012-LC4 Class A3 |
| 12/10/2044 | 3.069% | | 1,693,461 | 1,692,748 |
| Series 2013-CR8 Class A5 |
| 06/10/2046 | 3.612% | | 10,380,000 | 10,520,944 |
| Series 2014-CR18 Class A2 |
| 07/15/2047 | 2.924% | | 2,616,486 | 2,616,059 |
| Series 2015-CR23 Class A2 |
| 05/10/2048 | 2.852% | | 4,250,000 | 4,239,690 |
| CSAIL Commercial Mortgage Trust |
| Series 2016-C5 Class A1 |
| 11/15/2048 | 1.747% | | 1,841,708 | 1,821,162 |
| Series 2016-C6 Class A2 |
| 01/15/2049 | 2.662% | | 6,875,000 | 6,806,062 |
| DBUBS Mortgage Trust(a) |
| Series 2011-LC1A Class A3 |
| 11/10/2046 | 5.002% | | 150,000 | 154,687 |
| General Electric Capital Assurance Co.(a) |
| Series 2003-1 Class A5 |
| 05/12/2035 | 5.743% | | 46,883 | 47,160 |
| GS Mortgage Securities Trust(a) |
| Series 2011-GC3 Class A4 |
| 03/10/2044 | 4.753% | | 10,803,701 | 11,161,665 |
| Home Partners of America Trust(a),(c) |
| Series 2018-1 Class A |
1-month USD LIBOR + 0.900%
07/17/2037 | 2.960% | | 10,488,949 | 10,483,297 |
| Invitation Homes Trust(a),(c) |
| Series 2018-SFR3 Class A |
1-month USD LIBOR + 1.000%
07/17/2037 | 3.000% | | 11,645,070 | 11,677,160 |
The accompanying Notes to Financial Statements are an integral part of this statement.
Columbia Balanced Fund | Annual Report 2018
| 11 |
Portfolio of Investments (continued)
August 31, 2018
| Commercial Mortgage-Backed Securities - Non-Agency (continued) |
| Issuer | Coupon
Rate | | Principal
Amount ($) | Value ($) |
| JPMBB Commercial Mortgage Securities Trust |
| Series 2013-C14 Class ASB |
| 08/15/2046 | 3.761% | | 4,615,660 | 4,682,909 |
| Series 2014-C18 Class A2 |
| 02/15/2047 | 2.879% | | 3,665,316 | 3,664,717 |
| Series 2014-C19 Class A2 |
| 04/15/2047 | 3.046% | | 3,655,305 | 3,657,843 |
| JPMorgan Chase Commercial Mortgage Securities Trust(a) |
| Series 2009-IWST Class A2 |
| 12/05/2027 | 5.633% | | 300,000 | 309,653 |
| Series 2010-CNTR Class A2 |
| 08/05/2032 | 4.311% | | 320,909 | 328,174 |
| Series 2011-C3 Class A4 |
| 02/15/2046 | 4.717% | | 448,217 | 463,604 |
| Morgan Stanley Capital I Trust(a) |
| Series 2011-C1 Class A4 |
| 09/15/2047 | 5.033% | | 295,787 | 305,378 |
| Morgan Stanley Capital I Trust |
| Series 2016-BNK2 Class A2 |
| 11/15/2049 | 2.454% | | 5,625,000 | 5,485,144 |
| Progress Residential Trust(a) |
| Series 2018-SFR2 Class A |
| 08/17/2035 | 3.712% | | 4,305,000 | 4,321,565 |
| UBS-Barclays Commercial Mortgage Trust |
| Series 2012-C4 Class A5 |
| 12/10/2045 | 2.850% | | 8,550,000 | 8,398,892 |
| Series 2013-C5 Class A3 |
| 03/10/2046 | 2.920% | | 1,727,143 | 1,701,470 |
| Series 2013-C5 Class A4 |
| 03/10/2046 | 3.185% | | 10,651,000 | 10,593,754 |
| WF-RBS Commercial Mortgage Trust |
| Series 2012-C9 Class A3 |
| 11/15/2045 | 2.870% | | 10,398,158 | 10,246,625 |
| Series 2013-C15 Class A3 |
| 08/15/2046 | 3.881% | | 10,375,319 | 10,618,795 |
Total Commercial Mortgage-Backed Securities - Non-Agency
(Cost $151,899,640) | 149,026,011 |
| Common Stocks 62.9% |
| Issuer | Shares | Value ($) |
| Consumer Discretionary 7.1% |
| Hotels, Restaurants & Leisure 1.1% |
| McDonald’s Corp. | 282,294 | 45,796,555 |
| Royal Caribbean Cruises Ltd. | 276,755 | 33,924,628 |
| Total | | 79,721,183 |
| Common Stocks (continued) |
| Issuer | Shares | Value ($) |
| Internet & Direct Marketing Retail 2.6% |
| Amazon.com, Inc.(d) | 82,750 | 166,551,752 |
| Expedia Group, Inc. | 165,385 | 21,582,743 |
| Total | | 188,134,495 |
| Media 1.1% |
| Comcast Corp., Class A | 2,111,877 | 78,118,330 |
| Multiline Retail 0.3% |
| Dollar General Corp. | 188,851 | 20,344,918 |
| Specialty Retail 0.7% |
| AutoZone, Inc.(d) | 28,927 | 22,183,538 |
| Lowe’s Companies, Inc. | 232,252 | 25,257,405 |
| Ulta Beauty, Inc.(d) | 19,369 | 5,035,940 |
| Total | | 52,476,883 |
| Textiles, Apparel & Luxury Goods 1.3% |
| PVH Corp. | 386,886 | 55,386,600 |
| Tapestry, Inc. | 782,220 | 39,650,732 |
| Total | | 95,037,332 |
| Total Consumer Discretionary | 513,833,141 |
| Consumer Staples 3.9% |
| Beverages 0.1% |
| PepsiCo, Inc. | 102,615 | 11,493,906 |
| Food & Staples Retailing 0.5% |
| SYSCO Corp. | 460,411 | 34,447,951 |
| Food Products 2.0% |
| ConAgra Foods, Inc. | 844,105 | 31,020,859 |
| General Mills, Inc. | 742,490 | 34,161,965 |
| Mondelez International, Inc., Class A | 1,810,420 | 77,341,142 |
| Total | | 142,523,966 |
| Tobacco 1.3% |
| Philip Morris International, Inc. | 1,227,035 | 95,573,756 |
| Total Consumer Staples | 284,039,579 |
| Energy 3.6% |
| Energy Equipment & Services 0.6% |
| Halliburton Co. | 1,134,699 | 45,263,143 |
The accompanying Notes to Financial Statements are an integral part of this statement.
| 12 | Columbia Balanced Fund | Annual Report 2018 |
Portfolio of Investments (continued)
August 31, 2018
| Common Stocks (continued) |
| Issuer | Shares | Value ($) |
| Oil, Gas & Consumable Fuels 3.0% |
| Canadian Natural Resources Ltd. | 1,944,374 | 66,439,260 |
| Chevron Corp. | 787,366 | 93,271,376 |
| EOG Resources, Inc. | 490,434 | 57,984,012 |
| Total | | 217,694,648 |
| Total Energy | 262,957,791 |
| Financials 9.8% |
| Banks 5.3% |
| Citigroup, Inc. | 1,233,241 | 87,856,089 |
| JPMorgan Chase & Co. | 1,320,983 | 151,358,232 |
| U.S. Bancorp | 973,675 | 52,685,554 |
| Wells Fargo & Co. | 1,552,835 | 90,809,791 |
| Total | | 382,709,666 |
| Capital Markets 1.6% |
| Bank of New York Mellon Corp. (The) | 625,685 | 32,629,473 |
| BlackRock, Inc. | 75,580 | 36,207,355 |
| Morgan Stanley | 512,575 | 25,029,037 |
| S&P Global, Inc. | 110,120 | 22,800,346 |
| Total | | 116,666,211 |
| Diversified Financial Services 1.7% |
| Berkshire Hathaway, Inc., Class B(d) | 588,020 | 122,731,534 |
| Insurance 1.2% |
| American International Group, Inc. | 821,250 | 43,665,863 |
| Aon PLC | 325,141 | 47,327,524 |
| Total | | 90,993,387 |
| Total Financials | 713,100,798 |
| Health Care 10.6% |
| Biotechnology 2.1% |
| Alexion Pharmaceuticals, Inc.(d) | 286,795 | 35,057,821 |
| Biogen, Inc.(d) | 251,080 | 88,754,269 |
| Vertex Pharmaceuticals, Inc.(d) | 176,590 | 32,563,196 |
| Total | | 156,375,286 |
| Health Care Equipment & Supplies 2.3% |
| Abbott Laboratories | 558,606 | 37,337,225 |
| Medtronic PLC | 1,378,008 | 132,853,751 |
| Total | | 170,190,976 |
| Common Stocks (continued) |
| Issuer | Shares | Value ($) |
| Health Care Providers & Services 1.8% |
| Anthem, Inc. | 284,150 | 75,223,029 |
| CIGNA Corp. | 204,329 | 38,483,324 |
| CVS Health Corp. | 184,840 | 13,907,362 |
| Total | | 127,613,715 |
| Life Sciences Tools & Services 0.3% |
| Agilent Technologies, Inc. | 278,800 | 18,830,152 |
| Pharmaceuticals 4.1% |
| Allergan PLC | 328,665 | 63,008,367 |
| Johnson & Johnson | 885,790 | 119,307,055 |
| Pfizer, Inc. | 2,780,682 | 115,453,917 |
| Total | | 297,769,339 |
| Total Health Care | 770,779,468 |
| Industrials 4.8% |
| Aerospace & Defense 1.0% |
| General Dynamics Corp. | 176,745 | 34,182,483 |
| Lockheed Martin Corp. | 113,980 | 36,520,332 |
| Total | | 70,702,815 |
| Air Freight & Logistics 1.2% |
| FedEx Corp. | 350,380 | 85,475,201 |
| Airlines 0.3% |
| Southwest Airlines Co. | 421,391 | 25,831,268 |
| Electrical Equipment 0.4% |
| Emerson Electric Co. | 376,510 | 28,889,612 |
| Industrial Conglomerates 1.5% |
| Honeywell International, Inc. | 691,233 | 109,947,521 |
| Machinery 0.4% |
| Caterpillar, Inc. | 210,195 | 29,185,576 |
| Total Industrials | 350,031,993 |
| Information Technology 17.7% |
| Communications Equipment 1.0% |
| Cisco Systems, Inc. | 1,135,055 | 54,221,577 |
| Palo Alto Networks, Inc.(d) | 90,570 | 20,935,256 |
| Total | | 75,156,833 |
The accompanying Notes to Financial Statements are an integral part of this statement.
Columbia Balanced Fund | Annual Report 2018
| 13 |
Portfolio of Investments (continued)
August 31, 2018
| Common Stocks (continued) |
| Issuer | Shares | Value ($) |
| Internet Software & Services 5.4% |
| Alphabet, Inc., Class A(d) | 60,819 | 74,916,844 |
| Alphabet, Inc., Class C(d) | 105,948 | 129,064,794 |
| eBay, Inc.(d) | 1,184,150 | 40,983,432 |
| Facebook, Inc., Class A(d) | 840,595 | 147,717,759 |
| Total | | 392,682,829 |
| IT Services 2.8% |
| Fidelity National Information Services, Inc. | 556,880 | 60,237,709 |
| First Data Corp., Class A(d) | 623,865 | 16,045,808 |
| MasterCard, Inc., Class A | 547,214 | 117,957,450 |
| Total System Services, Inc. | 79,485 | 7,721,173 |
| Total | | 201,962,140 |
| Semiconductors & Semiconductor Equipment 1.6% |
| Applied Materials, Inc. | 968,884 | 41,681,390 |
| Broadcom, Inc. | 251,565 | 55,100,282 |
| Microchip Technology, Inc. | 211,540 | 18,198,786 |
| Total | | 114,980,458 |
| Software 3.4% |
| Activision Blizzard, Inc. | 474,439 | 34,207,052 |
| Microsoft Corp. | 1,863,919 | 209,374,021 |
| Total | | 243,581,073 |
| Technology Hardware, Storage & Peripherals 3.5% |
| Apple, Inc. | 1,099,710 | 250,326,987 |
| Total Information Technology | 1,278,690,320 |
| Materials 2.0% |
| Chemicals 1.7% |
| DowDuPont, Inc. | 1,090,100 | 76,448,713 |
| Sherwin-Williams Co. (The) | 104,423 | 47,573,030 |
| Total | | 124,021,743 |
| Containers & Packaging 0.2% |
| Sealed Air Corp. | 345,960 | 13,876,456 |
| Metals & Mining 0.1% |
| Nucor Corp. | 89,214 | 5,575,875 |
| Total Materials | 143,474,074 |
| Common Stocks (continued) |
| Issuer | Shares | Value ($) |
| Real Estate 1.5% |
| Equity Real Estate Investment Trusts (REITS) 1.5% |
| American Tower Corp. | 553,463 | 82,532,403 |
| Equinix, Inc. | 65,040 | 28,365,895 |
| Total | | 110,898,298 |
| Total Real Estate | 110,898,298 |
| Telecommunication Services 1.4% |
| Diversified Telecommunication Services 1.2% |
| AT&T, Inc. | 285,005 | 9,103,060 |
| Verizon Communications, Inc. | 1,444,229 | 78,522,731 |
| Total | | 87,625,791 |
| Wireless Telecommunication Services 0.2% |
| T-Mobile U.S.A., Inc.(d) | 151,860 | 10,028,834 |
| Total Telecommunication Services | 97,654,625 |
| Utilities 0.5% |
| Electric Utilities 0.5% |
| American Electric Power Co., Inc. | 477,745 | 34,268,649 |
| Total Utilities | 34,268,649 |
Total Common Stocks
(Cost $3,250,887,154) | 4,559,728,736 |
| Corporate Bonds & Notes 10.6% |
| Issuer | Coupon
Rate | | Principal
Amount ($) | Value ($) |
| Aerospace & Defense 0.3% |
| Bombardier, Inc.(a) |
| 12/01/2021 | 8.750% | | 161,000 | 177,279 |
| 01/15/2023 | 6.125% | | 75,000 | 75,757 |
| 12/01/2024 | 7.500% | | 132,000 | 138,600 |
| L3 Technologies, Inc. |
| 12/15/2026 | 3.850% | | 6,940,000 | 6,759,317 |
| Lockheed Martin Corp. |
| 05/15/2036 | 4.500% | | 6,000,000 | 6,274,680 |
| Northrop Grumman Systems Corp. |
| 02/15/2031 | 7.750% | | 4,429,000 | 5,916,971 |
| TransDigm, Inc. |
| 05/15/2025 | 6.500% | | 675,000 | 688,318 |
| Total | 20,030,922 |
| Automotive 0.1% |
| Delphi Technologies PLC(a) |
| 10/01/2025 | 5.000% | | 156,000 | 147,606 |
The accompanying Notes to Financial Statements are an integral part of this statement.
| 14 | Columbia Balanced Fund | Annual Report 2018 |
Portfolio of Investments (continued)
August 31, 2018
| Corporate Bonds & Notes (continued) |
| Issuer | Coupon
Rate | | Principal
Amount ($) | Value ($) |
| Ford Motor Co. |
| 12/08/2026 | 4.346% | | 8,640,000 | 8,122,455 |
| Total | 8,270,061 |
| Banking 1.9% |
| Bank of America Corp.(e) |
| 12/20/2028 | 3.419% | | 15,009,000 | 14,150,485 |
| Bank of New York Mellon Corp. (The) |
| 05/15/2024 | 3.400% | | 5,800,000 | 5,765,090 |
| Barclays Bank PLC |
| 05/15/2024 | 3.750% | | 4,500,000 | 4,465,629 |
| BB&T Corp.(c) |
3-month USD LIBOR + 0.530%
05/01/2019 | 2.873% | | 5,625,000 | 5,645,520 |
| Capital One Financial Corp. |
| 03/09/2027 | 3.750% | | 7,000,000 | 6,680,870 |
| Citigroup, Inc. |
| Subordinated |
| 03/09/2026 | 4.600% | | 12,000,000 | 12,122,688 |
| Discover Financial Services |
| 02/09/2027 | 4.100% | | 5,500,000 | 5,339,691 |
| Goldman Sachs Group, Inc. (The) |
| 01/26/2027 | 3.850% | | 13,915,000 | 13,571,133 |
| HSBC Holdings PLC |
| 05/25/2026 | 3.900% | | 9,000,000 | 8,877,429 |
| ING Bank NV(a),(c) |
3-month USD LIBOR + 1.130%
03/22/2019 | 1.777% | | 6,000,000 | 6,033,420 |
| JPMorgan Chase & Co. |
| 05/18/2023 | 2.700% | | 15,275,000 | 14,750,731 |
| Morgan Stanley |
| 01/20/2027 | 3.625% | | 8,135,000 | 7,838,496 |
| PNC Bank NA |
| Subordinated |
| 01/30/2023 | 2.950% | | 6,300,000 | 6,140,560 |
| Regions Financial Corp. |
| 08/14/2022 | 2.750% | | 6,000,000 | 5,822,154 |
| Toronto-Dominion Bank (The)(c) |
3-month USD LIBOR + 0.430%
06/11/2021 | 2.756% | | 5,320,000 | 5,340,333 |
| U.S. Bancorp |
| 07/22/2026 | 2.375% | | 6,075,000 | 5,561,699 |
| Wells Fargo & Co. |
| Subordinated |
| 02/13/2023 | 3.450% | | 11,000,000 | 10,846,825 |
| Total | 138,952,753 |
| Corporate Bonds & Notes (continued) |
| Issuer | Coupon
Rate | | Principal
Amount ($) | Value ($) |
| Brokerage/Asset Managers/Exchanges 0.0% |
| NFP Corp.(a) |
| 07/15/2025 | 6.875% | | 208,000 | 203,840 |
| Building Materials 0.0% |
| American Builders & Contractors Supply Co., Inc.(a) |
| 12/15/2023 | 5.750% | | 359,000 | 368,921 |
| 05/15/2026 | 5.875% | | 186,000 | 186,554 |
| Beacon Roofing Supply, Inc. |
| 10/01/2023 | 6.375% | | 164,000 | 168,897 |
| Beacon Roofing Supply, Inc.(a) |
| 11/01/2025 | 4.875% | | 341,000 | 315,472 |
| Core & Main LP(a) |
| 08/15/2025 | 6.125% | | 152,000 | 146,661 |
| HD Supply, Inc.(a) |
| 04/15/2024 | 5.750% | | 129,000 | 135,657 |
| Total | 1,322,162 |
| Cable and Satellite 0.3% |
| Altice U.S. Finance I Corp.(a) |
| 05/15/2026 | 5.500% | | 527,000 | 519,316 |
| CCO Holdings LLC/Capital Corp.(a) |
| 05/01/2025 | 5.375% | | 262,000 | 261,037 |
| 02/15/2026 | 5.750% | | 434,000 | 435,375 |
| 05/01/2027 | 5.125% | | 205,000 | 196,098 |
| 05/01/2027 | 5.875% | | 70,000 | 69,444 |
| Cequel Communications Holdings I LLC/Capital Corp.(a) |
| 04/01/2028 | 7.500% | | 290,000 | 302,979 |
| CSC Holdings LLC(a) |
| 10/15/2025 | 6.625% | | 370,000 | 387,087 |
| 10/15/2025 | 10.875% | | 225,000 | 263,358 |
| 02/01/2028 | 5.375% | | 158,000 | 151,203 |
| DISH DBS Corp. |
| 11/15/2024 | 5.875% | | 245,000 | 213,298 |
| 07/01/2026 | 7.750% | | 494,000 | 445,790 |
| NBCUniversal Media LLC |
| 04/01/2041 | 5.950% | | 6,100,000 | 7,110,959 |
| Radiate HoldCo LLC/Finance, Inc.(a) |
| 02/15/2023 | 6.875% | | 58,000 | 56,116 |
| 02/15/2025 | 6.625% | | 126,000 | 117,801 |
| Sirius XM Radio, Inc.(a) |
| 04/15/2025 | 5.375% | | 217,000 | 220,385 |
| 07/15/2026 | 5.375% | | 229,000 | 228,680 |
| 08/01/2027 | 5.000% | | 145,000 | 140,489 |
| Sky PLC(a) |
| 09/16/2024 | 3.750% | | 5,500,000 | 5,501,595 |
| Time Warner Cable LLC |
| 05/01/2037 | 6.550% | | 5,000,000 | 5,422,370 |
The accompanying Notes to Financial Statements are an integral part of this statement.
Columbia Balanced Fund | Annual Report 2018
| 15 |
Portfolio of Investments (continued)
August 31, 2018
| Corporate Bonds & Notes (continued) |
| Issuer | Coupon
Rate | | Principal
Amount ($) | Value ($) |
| Unitymedia Hessen GmbH & Co. KG NRW(a) |
| 01/15/2025 | 5.000% | | 527,000 | 535,821 |
| Virgin Media Finance PLC(a) |
| 01/15/2025 | 5.750% | | 519,000 | 501,205 |
| Ziggo Bond Finance BV(a) |
| 01/15/2027 | 6.000% | | 178,000 | 161,187 |
| Ziggo BV(a) |
| 01/15/2027 | 5.500% | | 379,000 | 357,507 |
| Total | 23,599,100 |
| Chemicals 0.3% |
| Alpha 2 BV(a) |
| 06/01/2023 | 8.750% | | 150,000 | 151,383 |
| Angus Chemical Co.(a) |
| 02/15/2023 | 8.750% | | 109,000 | 113,360 |
| Atotech U.S.A., Inc.(a) |
| 02/01/2025 | 6.250% | | 145,000 | 143,787 |
| Axalta Coating Systems LLC(a) |
| 08/15/2024 | 4.875% | | 267,000 | 265,421 |
| Celanese U.S. Holdings LLC |
| 11/15/2022 | 4.625% | | 6,698,000 | 6,878,772 |
| Chemours Co. (The) |
| 05/15/2025 | 7.000% | | 139,000 | 149,008 |
| Dow Chemical Co. (The) |
| 11/01/2029 | 7.375% | | 1,103,000 | 1,390,693 |
| Eastman Chemical Co. |
| 03/15/2025 | 3.800% | | 4,000,000 | 3,984,988 |
| INEOS Group Holdings SA(a) |
| 08/01/2024 | 5.625% | | 202,000 | 199,337 |
| Koppers, Inc.(a) |
| 02/15/2025 | 6.000% | | 84,000 | 84,445 |
| LYB International Finance BV |
| 03/15/2044 | 4.875% | | 4,000,000 | 4,029,304 |
| Olin Corp. |
| 02/01/2030 | 5.000% | | 169,000 | 162,488 |
| Platform Specialty Products Corp.(a) |
| 02/01/2022 | 6.500% | | 55,000 | 56,362 |
| 12/01/2025 | 5.875% | | 299,000 | 297,630 |
| PQ Corp.(a) |
| 11/15/2022 | 6.750% | | 278,000 | 290,733 |
| 12/15/2025 | 5.750% | | 143,000 | 141,213 |
| WR Grace & Co.(a) |
| 10/01/2021 | 5.125% | | 173,000 | 177,795 |
| Total | 18,516,719 |
| Corporate Bonds & Notes (continued) |
| Issuer | Coupon
Rate | | Principal
Amount ($) | Value ($) |
| Construction Machinery 0.2% |
| Caterpillar Financial Services Corp. |
| 06/01/2022 | 2.850% | | 5,000,000 | 4,943,115 |
| H&E Equipment Services, Inc. |
| 09/01/2025 | 5.625% | | 68,000 | 67,498 |
| John Deere Capital Corp. |
| 09/08/2022 | 2.150% | | 6,155,000 | 5,911,330 |
| Ritchie Bros. Auctioneers, Inc.(a) |
| 01/15/2025 | 5.375% | | 140,000 | 138,753 |
| United Rentals North America, Inc. |
| 09/15/2026 | 5.875% | | 428,000 | 441,009 |
| 01/15/2028 | 4.875% | | 118,000 | 112,713 |
| Total | 11,614,418 |
| Consumer Cyclical Services 0.1% |
| Amazon.com, Inc. |
| 08/22/2027 | 3.150% | | 6,000,000 | 5,801,754 |
| APX Group, Inc. |
| 12/01/2020 | 8.750% | | 125,000 | 124,873 |
| 12/01/2022 | 7.875% | | 191,000 | 194,855 |
| 09/01/2023 | 7.625% | | 101,000 | 91,179 |
| frontdoor, Inc.(a) |
| 08/15/2026 | 6.750% | | 52,000 | 53,222 |
| Interval Acquisition Corp. |
| 04/15/2023 | 5.625% | | 304,000 | 306,281 |
| Total | 6,572,164 |
| Consumer Products 0.1% |
| Energizer Gamma Acquisition, Inc.(a) |
| 07/15/2026 | 6.375% | | 52,000 | 53,885 |
| Mattel, Inc.(a) |
| 12/31/2025 | 6.750% | | 147,000 | 143,906 |
| Prestige Brands, Inc.(a) |
| 03/01/2024 | 6.375% | | 232,000 | 235,306 |
| Procter & Gamble Co. (The) |
| 11/03/2026 | 2.450% | | 3,500,000 | 3,263,743 |
| Scotts Miracle-Gro Co. (The) |
| 10/15/2023 | 6.000% | | 345,000 | 351,756 |
| Spectrum Brands, Inc. |
| 12/15/2024 | 6.125% | | 174,000 | 177,973 |
| 07/15/2025 | 5.750% | | 165,000 | 167,213 |
| Total | 4,393,782 |
| Diversified Manufacturing 0.1% |
| Apergy Corp.(a) |
| 05/01/2026 | 6.375% | | 178,000 | 182,043 |
| BWX Technologies, Inc.(a) |
| 07/15/2026 | 5.375% | | 44,000 | 44,459 |
The accompanying Notes to Financial Statements are an integral part of this statement.
| 16 | Columbia Balanced Fund | Annual Report 2018 |
Portfolio of Investments (continued)
August 31, 2018
| Corporate Bonds & Notes (continued) |
| Issuer | Coupon
Rate | | Principal
Amount ($) | Value ($) |
| Gates Global LLC/Co.(a) |
| 07/15/2022 | 6.000% | | 186,000 | 188,040 |
| TriMas Corp.(a) |
| 10/15/2025 | 4.875% | | 144,000 | 138,060 |
| United Technologies Corp. |
| 08/16/2025 | 3.950% | | 5,000,000 | 5,025,450 |
| WESCO Distribution, Inc. |
| 06/15/2024 | 5.375% | | 86,000 | 85,293 |
| Zekelman Industries, Inc.(a) |
| 06/15/2023 | 9.875% | | 109,000 | 118,649 |
| Total | 5,781,994 |
| Electric 1.1% |
| AES Corp. |
| 03/15/2023 | 4.500% | | 97,000 | 97,446 |
| 09/01/2027 | 5.125% | | 195,000 | 197,881 |
| Arizona Public Service Co. |
| 04/01/2042 | 4.500% | | 1,925,000 | 2,020,663 |
| Berkshire Hathaway Energy Co. |
| 02/01/2025 | 3.500% | | 3,090,000 | 3,073,333 |
| Calpine Corp. |
| 01/15/2025 | 5.750% | | 123,000 | 111,727 |
| Calpine Corp.(a) |
| 06/01/2026 | 5.250% | | 60,000 | 56,647 |
| CMS Energy Corp. |
| 03/01/2024 | 3.875% | | 5,876,000 | 5,917,261 |
| Commonwealth Edison Co. |
| 08/15/2028 | 3.700% | | 6,000,000 | 6,041,850 |
| Consolidated Edison Co. of New York, Inc. |
| 12/01/2045 | 4.500% | | 2,500,000 | 2,613,790 |
| Dominion Energy, Inc. |
| 10/01/2025 | 3.900% | | 5,850,000 | 5,804,908 |
| DTE Energy Co. |
| 04/15/2033 | 6.375% | | 3,436,000 | 4,133,773 |
| Indiana Michigan Power Co. |
| 03/15/2037 | 6.050% | | 4,925,000 | 5,995,981 |
| NextEra Energy Capital Holdings, Inc. |
| 06/15/2023 | 3.625% | | 5,070,000 | 5,062,015 |
| NextEra Energy Operating Partners LP(a) |
| 09/15/2027 | 4.500% | | 176,000 | 167,248 |
| NRG Energy, Inc. |
| 05/01/2024 | 6.250% | | 35,000 | 36,339 |
| 05/15/2026 | 7.250% | | 127,000 | 136,959 |
| 01/15/2027 | 6.625% | | 134,000 | 140,651 |
| NRG Energy, Inc.(a) |
| 01/15/2028 | 5.750% | | 77,000 | 77,579 |
| Corporate Bonds & Notes (continued) |
| Issuer | Coupon
Rate | | Principal
Amount ($) | Value ($) |
| NRG Yield Operating LLC |
| 08/15/2024 | 5.375% | | 529,000 | 531,662 |
| Pacific Gas & Electric Co. |
| 03/01/2037 | 5.800% | | 4,376,000 | 4,836,740 |
| PacifiCorp |
| 07/01/2025 | 3.350% | | 1,821,000 | 1,800,854 |
| Pattern Energy Group, Inc.(a) |
| 02/01/2024 | 5.875% | | 230,000 | 231,771 |
| PPL Capital Funding, Inc. |
| 06/01/2023 | 3.400% | | 5,645,000 | 5,561,211 |
| Progress Energy, Inc. |
| 03/01/2031 | 7.750% | | 2,983,000 | 3,975,537 |
| Public Service Co. of Colorado |
| 05/15/2025 | 2.900% | | 3,650,000 | 3,501,467 |
| Southern California Edison Co. |
| 09/01/2040 | 4.500% | | 2,839,000 | 2,920,161 |
| Southern Co. (The) |
| 07/01/2046 | 4.400% | | 7,425,000 | 7,174,674 |
| TerraForm Power Operating LLC(a) |
| 01/31/2028 | 5.000% | | 285,000 | 267,313 |
| Vistra Energy Corp. |
| 11/01/2024 | 7.625% | | 143,000 | 153,964 |
| Vistra Operations Co. LLC(a) |
| 09/01/2026 | 5.500% | | 64,000 | 65,010 |
| WEC Energy Group, Inc. |
| 06/15/2025 | 3.550% | | 5,575,000 | 5,520,989 |
| Total | 78,227,404 |
| Finance Companies 0.2% |
| Avolon Holdings Funding Ltd.(a) |
| 01/15/2023 | 5.500% | | 173,000 | 177,851 |
| GE Capital International Funding Co. Unlimited Co. |
| 11/15/2035 | 4.418% | | 10,000,000 | 9,641,160 |
| iStar, Inc. |
| 04/01/2022 | 6.000% | | 159,000 | 160,649 |
| Navient Corp. |
| 01/25/2023 | 5.500% | | 426,000 | 422,112 |
| 10/25/2024 | 5.875% | | 37,000 | 35,918 |
| 06/15/2026 | 6.750% | | 221,000 | 217,077 |
| Park Aerospace Holdings Ltd.(a) |
| 08/15/2022 | 5.250% | | 18,000 | 18,345 |
| Provident Funding Associates LP/Finance Corp.(a) |
| 06/15/2025 | 6.375% | | 175,000 | 174,987 |
| Quicken Loans, Inc.(a) |
| 05/01/2025 | 5.750% | | 278,000 | 275,938 |
The accompanying Notes to Financial Statements are an integral part of this statement.
Columbia Balanced Fund | Annual Report 2018
| 17 |
Portfolio of Investments (continued)
August 31, 2018
| Corporate Bonds & Notes (continued) |
| Issuer | Coupon
Rate | | Principal
Amount ($) | Value ($) |
| Springleaf Finance Corp. |
| 03/15/2023 | 5.625% | | 106,000 | 105,930 |
| 03/15/2025 | 6.875% | | 136,000 | 136,107 |
| 03/15/2026 | 7.125% | | 80,000 | 79,694 |
| Total | 11,445,768 |
| Food and Beverage 0.6% |
| Anheuser-Busch InBev Worldwide, Inc. |
| 01/15/2042 | 4.950% | | 8,845,000 | 9,224,247 |
| B&G Foods, Inc. |
| 04/01/2025 | 5.250% | | 301,000 | 292,250 |
| Bacardi Ltd.(a) |
| 05/15/2038 | 5.150% | | 6,860,000 | 6,685,372 |
| Chobani LLC/Finance Corp., Inc.(a) |
| 04/15/2025 | 7.500% | | 113,000 | 95,199 |
| Constellation Brands, Inc. |
| 11/15/2024 | 4.750% | | 2,430,000 | 2,533,409 |
| Diageo Capital PLC |
| 07/15/2020 | 4.828% | | 5,160,000 | 5,329,336 |
| FAGE International SA/U.S.A. Dairy Industry, Inc.(a) |
| 08/15/2026 | 5.625% | | 258,000 | 227,138 |
| General Mills, Inc. |
| 04/17/2025 | 4.000% | | 5,000,000 | 4,996,705 |
| Kraft Heinz Co. (The)(a) |
| 02/15/2025 | 4.875% | | 5,000,000 | 5,091,460 |
| Molson Coors Brewing Co. |
| 05/01/2042 | 5.000% | | 4,000,000 | 4,042,232 |
| PepsiCo, Inc. |
| 10/15/2027 | 3.000% | | 5,000,000 | 4,790,520 |
| Pinnacle Foods Finance LLC/Corp. |
| 01/15/2024 | 5.875% | | 125,000 | 131,287 |
| Post Holdings, Inc.(a) |
| 08/15/2026 | 5.000% | | 469,000 | 450,269 |
| 03/01/2027 | 5.750% | | 431,000 | 425,800 |
| Total | 44,315,224 |
| Gaming 0.0% |
| Boyd Gaming Corp. |
| 05/15/2023 | 6.875% | | 49,000 | 51,599 |
| 04/01/2026 | 6.375% | | 255,000 | 260,792 |
| 08/15/2026 | 6.000% | | 15,000 | 15,122 |
| Eldorado Resorts, Inc. |
| 04/01/2025 | 6.000% | | 192,000 | 195,479 |
| GLP Capital LP/Financing II, Inc. |
| 04/15/2026 | 5.375% | | 172,000 | 178,654 |
| 06/01/2028 | 5.750% | | 109,000 | 115,547 |
| International Game Technology PLC(a) |
| 02/15/2025 | 6.500% | | 219,000 | 230,521 |
| Corporate Bonds & Notes (continued) |
| Issuer | Coupon
Rate | | Principal
Amount ($) | Value ($) |
| MGM Growth Properties Operating Partnership LP/Finance Co-Issuer, Inc. |
| 01/15/2028 | 4.500% | | 162,000 | 149,460 |
| MGM Resorts International |
| 03/15/2023 | 6.000% | | 312,000 | 323,818 |
| 06/15/2025 | 5.750% | | 118,000 | 118,870 |
| Penn National Gaming, Inc.(a) |
| 01/15/2027 | 5.625% | | 150,000 | 144,473 |
| Rivers Pittsburgh Borrower LP/Finance Corp.(a) |
| 08/15/2021 | 6.125% | | 69,000 | 68,987 |
| Scientific Games International, Inc. |
| 12/01/2022 | 10.000% | | 320,000 | 338,890 |
| Scientific Games International, Inc.(a) |
| 10/15/2025 | 5.000% | | 235,000 | 223,145 |
| Stars Group Holdings BV/Co-Borrower LLC(a) |
| 07/15/2026 | 7.000% | | 87,000 | 90,528 |
| Tunica-Biloxi Gaming Authority(a) |
| 12/15/2020 | 3.780% | | 33,105 | 9,062 |
| Wynn Las Vegas LLC/Capital Corp.(a) |
| 03/01/2025 | 5.500% | | 148,000 | 146,341 |
| 05/15/2027 | 5.250% | | 36,000 | 33,821 |
| Total | 2,695,109 |
| Health Care 0.5% |
| Acadia Healthcare Co., Inc. |
| 03/01/2024 | 6.500% | | 249,000 | 258,512 |
| Amsurg Corp. |
| 07/15/2022 | 5.625% | | 108,000 | 110,734 |
| Becton Dickinson and Co. |
| 03/01/2023 | 3.300% | | 7,000,000 | 6,861,064 |
| Cardinal Health, Inc. |
| 06/15/2024 | 3.079% | | 6,000,000 | 5,692,434 |
| Change Healthcare Holdings LLC/Finance, Inc.(a) |
| 03/01/2025 | 5.750% | | 219,000 | 214,401 |
| Charles River Laboratories International, Inc.(a) |
| 04/01/2026 | 5.500% | | 54,000 | 54,861 |
| CHS/Community Health Systems, Inc. |
| 03/31/2023 | 6.250% | | 143,000 | 135,899 |
| Covidien International Finance SA |
| 06/15/2022 | 3.200% | | 4,298,000 | 4,282,269 |
| CVS Health Corp. |
| 03/25/2048 | 5.050% | | 6,215,000 | 6,352,004 |
| DaVita, Inc. |
| 08/15/2022 | 5.750% | | 286,000 | 289,948 |
| 05/01/2025 | 5.000% | | 140,000 | 133,118 |
| Envision Healthcare Corp.(a) |
| 12/01/2024 | 6.250% | | 30,000 | 32,070 |
The accompanying Notes to Financial Statements are an integral part of this statement.
| 18 | Columbia Balanced Fund | Annual Report 2018 |
Portfolio of Investments (continued)
August 31, 2018
| Corporate Bonds & Notes (continued) |
| Issuer | Coupon
Rate | | Principal
Amount ($) | Value ($) |
| Express Scripts Holding Co. |
| 07/15/2046 | 4.800% | | 5,090,000 | 4,930,464 |
| HCA, Inc. |
| 03/15/2024 | 5.000% | | 441,000 | 452,071 |
| 02/01/2025 | 5.375% | | 229,000 | 231,792 |
| 04/15/2025 | 5.250% | | 228,000 | 235,150 |
| 02/15/2027 | 4.500% | | 151,000 | 149,490 |
| Hill-Rom Holdings, Inc.(a) |
| 02/15/2025 | 5.000% | | 121,000 | 117,904 |
| Hologic, Inc.(a) |
| 02/01/2028 | 4.625% | | 170,000 | 159,531 |
| IQVIA, Inc.(a) |
| 05/15/2023 | 4.875% | | 108,000 | 108,555 |
| McKesson Corp. |
| 02/16/2028 | 3.950% | | 5,000,000 | 4,852,995 |
| MPH Acquisition Holdings LLC(a) |
| 06/01/2024 | 7.125% | | 227,000 | 234,960 |
| Polaris Intermediate Corp. PIK(a) |
| 12/01/2022 | 8.500% | | 122,000 | 126,191 |
| Sotera Health Holdings LLC(a) |
| 05/15/2023 | 6.500% | | 263,000 | 269,536 |
| Teleflex, Inc. |
| 11/15/2027 | 4.625% | | 116,000 | 110,502 |
| Tenet Healthcare Corp. |
| 06/15/2023 | 6.750% | | 174,000 | 175,185 |
| 07/15/2024 | 4.625% | | 288,000 | 282,282 |
| Total | 36,853,922 |
| Healthcare Insurance 0.2% |
| Anthem, Inc. |
| 03/01/2028 | 4.101% | | 5,000,000 | 4,927,445 |
| Centene Corp. |
| 02/15/2024 | 6.125% | | 279,000 | 293,692 |
| 01/15/2025 | 4.750% | | 189,000 | 190,335 |
| Centene Corp.(a) |
| 06/01/2026 | 5.375% | | 167,000 | 172,680 |
| UnitedHealth Group, Inc. |
| 01/15/2027 | 3.450% | | 7,500,000 | 7,395,960 |
| WellCare Health Plans, Inc. |
| 04/01/2025 | 5.250% | | 299,000 | 307,058 |
| WellCare Health Plans, Inc.(a) |
| 08/15/2026 | 5.375% | | 151,000 | 155,512 |
| Total | 13,442,682 |
| Home Construction 0.0% |
| Lennar Corp. |
| 12/15/2021 | 6.250% | | 36,000 | 37,805 |
| 11/15/2024 | 5.875% | | 295,000 | 305,640 |
| Corporate Bonds & Notes (continued) |
| Issuer | Coupon
Rate | | Principal
Amount ($) | Value ($) |
| Meritage Homes Corp. |
| 04/01/2022 | 7.000% | | 233,000 | 251,300 |
| 06/01/2025 | 6.000% | | 169,000 | 170,908 |
| Taylor Morrison Communities, Inc./Holdings II(a) |
| 04/15/2021 | 5.250% | | 121,000 | 121,007 |
| 03/01/2024 | 5.625% | | 151,000 | 148,358 |
| Total | 1,035,018 |
| Independent Energy 0.4% |
| Anadarko Petroleum Corp. |
| 09/15/2036 | 6.450% | | 3,500,000 | 4,055,958 |
| Callon Petroleum Co. |
| 10/01/2024 | 6.125% | | 82,000 | 83,991 |
| Callon Petroleum Co.(a) |
| 07/01/2026 | 6.375% | | 216,000 | 221,304 |
| Canadian Natural Resources Ltd. |
| 04/15/2024 | 3.800% | | 7,600,000 | 7,575,376 |
| Carrizo Oil & Gas, Inc. |
| 04/15/2023 | 6.250% | | 224,000 | 229,343 |
| Centennial Resource Production LLC(a) |
| 01/15/2026 | 5.375% | | 73,000 | 71,964 |
| Chaparral Energy, Inc.(a) |
| 07/15/2023 | 8.750% | | 89,000 | 88,434 |
| CrownRock LP/Finance, Inc.(a) |
| 10/15/2025 | 5.625% | | 322,000 | 312,997 |
| Diamondback Energy, Inc. |
| 05/31/2025 | 5.375% | | 287,000 | 294,282 |
| Endeavor Energy Resources LP/Finance, Inc.(a) |
| 01/30/2026 | 5.500% | | 33,000 | 32,894 |
| 01/30/2028 | 5.750% | | 262,000 | 261,372 |
| Extraction Oil & Gas, Inc.(a) |
| 05/15/2024 | 7.375% | | 117,000 | 119,035 |
| 02/01/2026 | 5.625% | | 99,000 | 92,686 |
| Halcon Resources Corp. |
| 02/15/2025 | 6.750% | | 310,000 | 288,293 |
| Indigo Natural Resources LLC(a) |
| 02/15/2026 | 6.875% | | 101,000 | 98,045 |
| Jagged Peak Energy LLC(a) |
| 05/01/2026 | 5.875% | | 153,000 | 150,887 |
| Laredo Petroleum, Inc. |
| 03/15/2023 | 6.250% | | 440,000 | 441,676 |
| Matador Resources Co.(a) |
| 09/15/2026 | 5.875% | | 124,000 | 126,195 |
| MEG Energy Corp.(a) |
| 01/15/2025 | 6.500% | | 40,000 | 39,797 |
| Noble Energy, Inc. |
| 03/01/2041 | 6.000% | | 4,000,000 | 4,321,472 |
The accompanying Notes to Financial Statements are an integral part of this statement.
Columbia Balanced Fund | Annual Report 2018
| 19 |
Portfolio of Investments (continued)
August 31, 2018
| Corporate Bonds & Notes (continued) |
| Issuer | Coupon
Rate | | Principal
Amount ($) | Value ($) |
| Parsley Energy LLC/Finance Corp.(a) |
| 08/15/2025 | 5.250% | | 266,000 | 265,052 |
| 10/15/2027 | 5.625% | | 256,000 | 258,870 |
| PDC Energy, Inc. |
| 09/15/2024 | 6.125% | | 410,000 | 408,642 |
| SM Energy Co. |
| 06/01/2025 | 5.625% | | 138,000 | 136,977 |
| 09/15/2026 | 6.750% | | 281,000 | 291,552 |
| 01/15/2027 | 6.625% | | 81,000 | 83,430 |
| Whiting Petroleum Corp. |
| 01/15/2026 | 6.625% | | 146,000 | 151,840 |
| Woodside Finance Ltd.(a) |
| 03/05/2025 | 3.650% | | 6,500,000 | 6,342,083 |
| WPX Energy, Inc. |
| 01/15/2022 | 6.000% | | 65,000 | 67,264 |
| 09/15/2024 | 5.250% | | 183,000 | 183,798 |
| 06/01/2026 | 5.750% | | 76,000 | 77,033 |
| Total | 27,172,542 |
| Integrated Energy 0.2% |
| BP Capital Markets PLC |
| 09/19/2027 | 3.279% | | 6,920,000 | 6,700,650 |
| Cenovus Energy, Inc. |
| 04/15/2027 | 4.250% | | 4,665,000 | 4,511,018 |
| Suncor Energy, Inc. |
| 12/01/2024 | 3.600% | | 5,000,000 | 4,967,975 |
| Total | 16,179,643 |
| Leisure 0.0% |
| Boyne U.S.A., Inc.(a) |
| 05/01/2025 | 7.250% | | 91,000 | 96,517 |
| Cedar Fair LP/Canada’s Wonderland Co./Magnum Management Corp./Millennium Op |
| 04/15/2027 | 5.375% | | 122,000 | 118,247 |
| Live Nation Entertainment, Inc.(a) |
| 11/01/2024 | 4.875% | | 132,000 | 130,170 |
| 03/15/2026 | 5.625% | | 51,000 | 51,260 |
| Viking Cruises Ltd.(a) |
| 09/15/2027 | 5.875% | | 150,000 | 147,160 |
| Total | 543,354 |
| Life Insurance 0.5% |
| American International Group, Inc. |
| 07/10/2025 | 3.750% | | 6,000,000 | 5,870,934 |
| Brighthouse Financial, Inc. |
| 06/22/2027 | 3.700% | | 6,000,000 | 5,367,900 |
| Five Corners Funding Trust(a) |
| 11/15/2023 | 4.419% | | 5,725,000 | 5,914,223 |
| Corporate Bonds & Notes (continued) |
| Issuer | Coupon
Rate | | Principal
Amount ($) | Value ($) |
| High Street Funding Trust I(a) |
| 02/15/2028 | 4.111% | | 5,500,000 | 5,443,707 |
| MetLife Global Funding I(a) |
| 12/18/2026 | 3.450% | | 4,000,000 | 3,917,400 |
| Northwestern Mutual Life Insurance Co. (The)(a) |
| Subordinated |
| 09/30/2047 | 3.850% | | 5,000,000 | 4,680,910 |
| Peachtree Corners Funding Trust(a) |
| 02/15/2025 | 3.976% | | 6,000,000 | 5,893,044 |
| Total | 37,088,118 |
| Lodging 0.0% |
| Marriott Ownership Resorts, Inc.(a) |
| 09/15/2026 | 6.500% | | 31,000 | 31,605 |
| Media and Entertainment 0.3% |
| 21st Century Fox America, Inc. |
| 03/15/2033 | 6.550% | | 2,981,000 | 3,713,584 |
| Discovery Communications LLC |
| 06/01/2040 | 6.350% | | 4,000,000 | 4,403,272 |
| Match Group, Inc. |
| 06/01/2024 | 6.375% | | 187,000 | 199,091 |
| Match Group, Inc.(a) |
| 12/15/2027 | 5.000% | | 66,000 | 64,974 |
| Netflix, Inc.(a) |
| 04/15/2028 | 4.875% | | 417,000 | 395,227 |
| 11/15/2028 | 5.875% | | 421,000 | 422,275 |
| Outfront Media Capital LLC/Corp. |
| 03/15/2025 | 5.875% | | 237,000 | 239,390 |
| RELX Capital, Inc. |
| 10/15/2022 | 3.125% | | 5,675,000 | 5,571,681 |
| Thomson Reuters Corp. |
| 05/23/2043 | 4.500% | | 4,300,000 | 3,957,711 |
| Time Warner, Inc. |
| 01/15/2026 | 3.875% | | 6,000,000 | 5,840,340 |
| Total | 24,807,545 |
| Metals and Mining 0.0% |
| Big River Steel LLC/Finance Corp.(a) |
| 09/01/2025 | 7.250% | | 154,000 | 161,558 |
| Constellium NV(a) |
| 05/15/2024 | 5.750% | | 316,000 | 314,669 |
| 02/15/2026 | 5.875% | | 105,000 | 102,930 |
| Freeport-McMoRan, Inc. |
| 11/14/2024 | 4.550% | | 444,000 | 428,434 |
| 03/15/2043 | 5.450% | | 385,000 | 344,103 |
| Grinding Media, Inc./Moly-Cop AltaSteel Ltd.(a) |
| 12/15/2023 | 7.375% | | 128,000 | 134,477 |
The accompanying Notes to Financial Statements are an integral part of this statement.
| 20 | Columbia Balanced Fund | Annual Report 2018 |
Portfolio of Investments (continued)
August 31, 2018
| Corporate Bonds & Notes (continued) |
| Issuer | Coupon
Rate | | Principal
Amount ($) | Value ($) |
| HudBay Minerals, Inc.(a) |
| 01/15/2025 | 7.625% | | 279,000 | 283,991 |
| Novelis Corp.(a) |
| 08/15/2024 | 6.250% | | 84,000 | 85,680 |
| 09/30/2026 | 5.875% | | 266,000 | 259,292 |
| Teck Resources Ltd.(a) |
| 06/01/2024 | 8.500% | | 144,000 | 158,177 |
| Teck Resources Ltd. |
| 07/15/2041 | 6.250% | | 494,000 | 520,961 |
| Total | 2,794,272 |
| Midstream 0.6% |
| DCP Midstream Operating LP |
| 07/15/2025 | 5.375% | | 106,000 | 108,637 |
| 04/01/2044 | 5.600% | | 86,000 | 82,667 |
| Delek Logistics Partners LP/Finance Corp. |
| 05/15/2025 | 6.750% | | 178,000 | 178,798 |
| Energy Transfer Equity LP |
| 06/01/2027 | 5.500% | | 685,000 | 719,836 |
| Energy Transfer Partners LP |
| 02/01/2042 | 6.500% | | 4,315,000 | 4,750,733 |
| Enterprise Products Operating LLC |
| 02/01/2041 | 5.950% | | 3,500,000 | 4,077,707 |
| Holly Energy Partners LP/Finance Corp.(a) |
| 08/01/2024 | 6.000% | | 363,000 | 370,515 |
| Kinder Morgan Energy Partners LP |
| 03/01/2044 | 5.500% | | 7,000,000 | 7,162,099 |
| MPLX LP |
| 03/01/2027 | 4.125% | | 5,500,000 | 5,391,193 |
| NGPL PipeCo LLC(a) |
| 08/15/2022 | 4.375% | | 64,000 | 64,482 |
| 08/15/2027 | 4.875% | | 78,000 | 78,490 |
| 12/15/2037 | 7.768% | | 55,000 | 67,926 |
| NuStar Logistics LP |
| 04/28/2027 | 5.625% | | 87,000 | 86,633 |
| Plains All American Pipeline LP/Finance Corp. |
| 01/15/2037 | 6.650% | | 5,000,000 | 5,579,560 |
| Rockpoint Gas Storage Canada Ltd.(a) |
| 03/31/2023 | 7.000% | | 137,000 | 138,376 |
| Southern Natural Gas Co. LLC(a) |
| 03/15/2047 | 4.800% | | 2,951,000 | 2,975,402 |
| Sunoco LP/Finance Corp.(a) |
| 01/15/2023 | 4.875% | | 69,000 | 68,060 |
| 02/15/2026 | 5.500% | | 189,000 | 180,974 |
| Tallgrass Energy Partners LP/Finance Corp.(a) |
| 09/15/2024 | 5.500% | | 67,000 | 68,827 |
| 01/15/2028 | 5.500% | | 171,000 | 172,759 |
| Corporate Bonds & Notes (continued) |
| Issuer | Coupon
Rate | | Principal
Amount ($) | Value ($) |
| Targa Resources Partners LP/Finance Corp.(a) |
| 04/15/2026 | 5.875% | | 59,000 | 60,771 |
| 01/15/2028 | 5.000% | | 419,000 | 408,034 |
| Targa Resources Partners LP/Finance Corp. |
| 02/01/2027 | 5.375% | | 370,000 | 370,681 |
| TransMontaigne Partners LP/TLP Finance Corp. |
| 02/15/2026 | 6.125% | | 136,000 | 127,913 |
| Western Gas Partners LP |
| 08/15/2048 | 5.500% | | 4,500,000 | 4,392,157 |
| Williams Partners LP |
| 01/15/2025 | 3.900% | | 6,500,000 | 6,428,571 |
| Total | 44,111,801 |
| Natural Gas 0.1% |
| NiSource, Inc. |
| 02/15/2044 | 4.800% | | 4,000,000 | 4,176,332 |
| Sempra Energy |
| 11/15/2025 | 3.750% | | 6,665,000 | 6,620,271 |
| Total | 10,796,603 |
| Office REIT 0.1% |
| Boston Properties LP |
| 02/01/2026 | 3.650% | | 5,000,000 | 4,887,015 |
| Oil Field Services 0.0% |
| Calfrac Holdings LP(a) |
| 06/15/2026 | 8.500% | | 82,000 | 78,154 |
| Diamond Offshore Drilling, Inc. |
| 08/15/2025 | 7.875% | | 74,000 | 76,059 |
| Nabors Industries, Inc. |
| 01/15/2023 | 5.500% | | 41,000 | 40,878 |
| Nabors Industries, Inc.(a) |
| 02/01/2025 | 5.750% | | 316,000 | 305,392 |
| Rowan Companies, Inc. |
| 01/15/2024 | 4.750% | | 104,000 | 88,890 |
| SESI LLC |
| 09/15/2024 | 7.750% | | 155,000 | 161,100 |
| Transocean Guardian Ltd.(a) |
| 01/15/2024 | 5.875% | | 80,000 | 80,600 |
| Transocean Pontus Ltd.(a) |
| 08/01/2025 | 6.125% | | 41,000 | 41,744 |
| Transocean, Inc.(a) |
| 01/15/2026 | 7.500% | | 58,000 | 59,189 |
| U.S.A. Compression Partners LP/Finance Corp.(a) |
| 04/01/2026 | 6.875% | | 133,000 | 137,887 |
| Weatherford International LLC(a) |
| 03/01/2025 | 9.875% | | 7,000 | 6,573 |
The accompanying Notes to Financial Statements are an integral part of this statement.
Columbia Balanced Fund | Annual Report 2018
| 21 |
Portfolio of Investments (continued)
August 31, 2018
| Corporate Bonds & Notes (continued) |
| Issuer | Coupon
Rate | | Principal
Amount ($) | Value ($) |
| Weatherford International Ltd. |
| 06/15/2023 | 8.250% | | 141,000 | 131,095 |
| 02/15/2024 | 9.875% | | 65,000 | 62,302 |
| Total | 1,269,863 |
| Other Financial Institutions 0.0% |
| Icahn Enterprises LP/Finance Corp. |
| 02/01/2022 | 6.250% | | 133,000 | 136,829 |
| Other Industry 0.0% |
| KAR Auction Services, Inc.(a) |
| 06/01/2025 | 5.125% | | 181,000 | 178,226 |
| WeWork Companies, Inc.(a) |
| 05/01/2025 | 7.875% | | 47,000 | 45,546 |
| Total | 223,772 |
| Other REIT 0.1% |
| CyrusOne LP/Finance Corp. |
| 03/15/2024 | 5.000% | | 110,000 | 111,721 |
| 03/15/2027 | 5.375% | | 319,000 | 323,074 |
| Duke Realty LP |
| 04/15/2023 | 3.625% | | 4,391,000 | 4,362,920 |
| Total | 4,797,715 |
| Packaging 0.0% |
| Ardagh Packaging Finance PLC/Holdings U.S.A., Inc.(a) |
| 05/15/2024 | 7.250% | | 277,000 | 291,729 |
| 02/15/2025 | 6.000% | | 432,000 | 424,573 |
| Berry Global, Inc. |
| 10/15/2022 | 6.000% | | 77,000 | 79,226 |
| 07/15/2023 | 5.125% | | 295,000 | 294,400 |
| Flex Acquisition Co., Inc.(a) |
| 07/15/2026 | 7.875% | | 150,000 | 149,587 |
| Multi-Color Corp.(a) |
| 11/01/2025 | 4.875% | | 186,000 | 173,599 |
| Reynolds Group Issuer, Inc./LLC |
| 10/15/2020 | 5.750% | | 344,033 | 344,917 |
| Reynolds Group Issuer, Inc./LLC(a) |
| 07/15/2024 | 7.000% | | 195,000 | 198,131 |
| Total | 1,956,162 |
| Pharmaceuticals 0.4% |
| AbbVie, Inc. |
| 05/14/2021 | 2.300% | | 5,125,000 | 4,996,634 |
| Allergan Funding SCS |
| 03/15/2035 | 4.550% | | 6,000,000 | 5,893,902 |
| Amgen, Inc. |
| 03/15/2040 | 5.750% | | 2,400,000 | 2,727,886 |
| Corporate Bonds & Notes (continued) |
| Issuer | Coupon
Rate | | Principal
Amount ($) | Value ($) |
| Bausch Health Companies, Inc.(a) |
| 12/01/2021 | 5.625% | | 90,000 | 89,274 |
| 03/15/2024 | 7.000% | | 133,000 | 140,513 |
| 04/15/2025 | 6.125% | | 609,000 | 567,449 |
| 11/01/2025 | 5.500% | | 105,000 | 104,800 |
| Baxalta, Inc. |
| 06/23/2025 | 4.000% | | 3,000,000 | 3,032,157 |
| Catalent Pharma Solutions, Inc.(a) |
| 01/15/2026 | 4.875% | | 98,000 | 93,725 |
| Gilead Sciences, Inc. |
| 04/01/2024 | 3.700% | | 5,200,000 | 5,248,485 |
| Jaguar Holding Co. II/Pharmaceutical Product Development LLC(a) |
| 08/01/2023 | 6.375% | | 274,000 | 276,094 |
| Roche Holdings, Inc.(a) |
| 09/30/2024 | 3.350% | | 3,500,000 | 3,495,324 |
| Valeant Pharmaceuticals International, Inc.(a) |
| 04/01/2026 | 9.250% | | 90,000 | 95,639 |
| 01/31/2027 | 8.500% | | 58,000 | 59,595 |
| Total | 26,821,477 |
| Property & Casualty 0.3% |
| Berkshire Hathaway, Inc. |
| 03/15/2026 | 3.125% | | 4,360,000 | 4,243,671 |
| CNA Financial Corp. |
| 03/01/2026 | 4.500% | | 5,000,000 | 5,103,160 |
| Hartford Financial Services Group, Inc. (The) |
| 04/15/2022 | 5.125% | | 3,865,000 | 4,079,218 |
| HUB International Ltd.(a) |
| 05/01/2026 | 7.000% | | 149,000 | 148,179 |
| Loews Corp. |
| 04/01/2026 | 3.750% | | 5,500,000 | 5,502,981 |
| Transatlantic Holdings, Inc. |
| 11/30/2039 | 8.000% | | 2,725,000 | 3,773,634 |
| Total | 22,850,843 |
| Railroads 0.1% |
| CSX Corp. |
| 03/15/2044 | 4.100% | | 4,170,000 | 3,954,836 |
| Union Pacific Corp. |
| 09/15/2037 | 3.600% | | 4,500,000 | 4,158,320 |
| Total | 8,113,156 |
| Refining 0.0% |
| Marathon Petroleum Corp. |
| 03/01/2041 | 6.500% | | 800,000 | 950,279 |
| Restaurants 0.0% |
| 1011778 BC ULC/New Red Finance, Inc.(a) |
| 05/15/2024 | 4.250% | | 176,000 | 168,586 |
The accompanying Notes to Financial Statements are an integral part of this statement.
| 22 | Columbia Balanced Fund | Annual Report 2018 |
Portfolio of Investments (continued)
August 31, 2018
| Corporate Bonds & Notes (continued) |
| Issuer | Coupon
Rate | | Principal
Amount ($) | Value ($) |
| BC ULC/New Red Finance, Inc.(a) |
| 01/15/2022 | 4.625% | | 255,000 | 255,488 |
| IRB Holding Corp.(a) |
| 02/15/2026 | 6.750% | | 72,000 | 68,756 |
| KFC Holding Co./Pizza Hut Holdings LLC/Taco Bell of America LLC(a) |
| 06/01/2026 | 5.250% | | 211,000 | 211,072 |
| Total | 703,902 |
| Retail REIT 0.1% |
| Kimco Realty Corp. |
| 10/01/2026 | 2.800% | | 6,300,000 | 5,667,146 |
| Simon Property Group LP |
| 02/01/2040 | 6.750% | | 3,610,000 | 4,756,857 |
| Total | 10,424,003 |
| Retailers 0.2% |
| CVS Pass-Through Trust(a) |
| 01/10/2032 | 7.507% | | 273,608 | 320,985 |
| Hanesbrands, Inc.(a) |
| 05/15/2024 | 4.625% | | 102,000 | 99,710 |
| L Brands, Inc. |
| 11/01/2035 | 6.875% | | 121,000 | 100,831 |
| Lowe’s Companies, Inc. |
| 04/15/2026 | 2.500% | | 5,340,000 | 4,945,422 |
| Party City Holdings, Inc.(a) |
| 08/01/2026 | 6.625% | | 52,000 | 52,377 |
| Penske Automotive Group, Inc. |
| 12/01/2024 | 5.375% | | 14,000 | 13,851 |
| 05/15/2026 | 5.500% | | 64,000 | 62,728 |
| Target Corp. |
| 04/15/2026 | 2.500% | | 6,300,000 | 5,869,269 |
| Total | 11,465,173 |
| Supermarkets 0.1% |
| Kroger Co. (The) |
| 01/15/2048 | 4.650% | | 6,115,000 | 5,882,801 |
| Technology 0.4% |
| Apple, Inc. |
| 02/09/2024 | 3.000% | | 8,400,000 | 8,295,378 |
| Ascend Learning LLC(a) |
| 08/01/2025 | 6.875% | | 98,000 | 99,127 |
| Broadcom Corp./Cayman Finance Ltd. |
| 01/15/2027 | 3.875% | | 6,040,000 | 5,651,013 |
| Camelot Finance SA(a) |
| 10/15/2024 | 7.875% | | 209,000 | 208,953 |
| CDK Global, Inc. |
| 06/01/2027 | 4.875% | | 151,000 | 148,024 |
| Corporate Bonds & Notes (continued) |
| Issuer | Coupon
Rate | | Principal
Amount ($) | Value ($) |
| Equinix, Inc. |
| 01/15/2026 | 5.875% | | 397,000 | 411,797 |
| 05/15/2027 | 5.375% | | 172,000 | 175,141 |
| First Data Corp.(a) |
| 08/15/2023 | 5.375% | | 183,000 | 186,174 |
| 12/01/2023 | 7.000% | | 548,000 | 571,195 |
| Gartner, Inc.(a) |
| 04/01/2025 | 5.125% | | 605,000 | 612,562 |
| Informatica LLC(a) |
| 07/15/2023 | 7.125% | | 163,000 | 165,937 |
| Microsoft Corp. |
| 02/06/2024 | 2.875% | | 7,000,000 | 6,889,134 |
| NCR Corp. |
| 12/15/2023 | 6.375% | | 56,000 | 56,624 |
| Oracle Corp. |
| 04/15/2038 | 6.500% | | 5,000,000 | 6,479,615 |
| PTC, Inc. |
| 05/15/2024 | 6.000% | | 257,000 | 269,851 |
| Qualitytech LP/QTS Finance Corp.(a) |
| 11/15/2025 | 4.750% | | 243,000 | 232,672 |
| Sensata Technologies UK Financing Co. PLC(a) |
| 02/15/2026 | 6.250% | | 137,000 | 144,159 |
| Symantec Corp.(a) |
| 04/15/2025 | 5.000% | | 508,000 | 502,282 |
| Tempo Acquisition LLC/Finance Corp.(a) |
| 06/01/2025 | 6.750% | | 202,000 | 196,318 |
| Verscend Escrow Corp.(a) |
| 08/15/2026 | 9.750% | | 81,000 | 82,981 |
| Total | 31,378,937 |
| Transportation Services 0.1% |
| Avis Budget Car Rental LLC/Finance, Inc. |
| 04/01/2023 | 5.500% | | 30,000 | 29,996 |
| Avis Budget Car Rental LLC/Finance, Inc.(a) |
| 03/15/2025 | 5.250% | | 257,000 | 240,938 |
| ERAC U.S.A. Finance LLC(a) |
| 10/15/2037 | 7.000% | | 3,285,000 | 4,146,583 |
| Hertz Corp. (The)(a) |
| 06/01/2022 | 7.625% | | 179,000 | 178,101 |
| Total | 4,595,618 |
| Wireless 0.1% |
| Altice France SA(a) |
| 05/01/2026 | 7.375% | | 678,000 | 666,218 |
| 02/01/2027 | 8.125% | | 122,000 | 123,820 |
| Rogers Communications, Inc. |
| 11/15/2026 | 2.900% | | 5,000,000 | 4,625,300 |
The accompanying Notes to Financial Statements are an integral part of this statement.
Columbia Balanced Fund | Annual Report 2018
| 23 |
Portfolio of Investments (continued)
August 31, 2018
| Corporate Bonds & Notes (continued) |
| Issuer | Coupon
Rate | | Principal
Amount ($) | Value ($) |
| SBA Communications Corp. |
| 07/15/2022 | 4.875% | | 180,000 | 181,959 |
| 09/01/2024 | 4.875% | | 592,000 | 584,067 |
| Sprint Communications, Inc.(a) |
| 03/01/2020 | 7.000% | | 197,000 | 204,899 |
| Sprint Corp. |
| 06/15/2024 | 7.125% | | 46,000 | 47,742 |
| 02/15/2025 | 7.625% | | 689,000 | 731,449 |
| 03/01/2026 | 7.625% | | 155,000 | 162,705 |
| T-Mobile U.S.A., Inc. |
| 01/15/2026 | 6.500% | | 648,000 | 686,275 |
| 02/01/2026 | 4.500% | | 73,000 | 69,546 |
| 02/01/2028 | 4.750% | | 90,000 | 84,797 |
| Wind Tre SpA(a) |
| 01/20/2026 | 5.000% | | 344,000 | 309,423 |
| Total | 8,478,200 |
| Wirelines 0.5% |
| AT&T, Inc. |
| 08/15/2040 | 6.000% | | 8,815,000 | 9,316,274 |
| CenturyLink, Inc. |
| 03/15/2022 | 5.800% | | 120,000 | 122,683 |
| 04/01/2024 | 7.500% | | 309,000 | 330,080 |
| Deutsche Telekom International Finance BV(a) |
| 06/21/2028 | 4.375% | | 5,500,000 | 5,552,866 |
| Frontier Communications Corp. |
| 09/15/2022 | 10.500% | | 55,000 | 48,274 |
| 01/15/2023 | 7.125% | | 119,000 | 81,114 |
| 09/15/2025 | 11.000% | | 100,000 | 76,611 |
| Frontier Communications Corp.(a) |
| 04/01/2026 | 8.500% | | 90,000 | 84,828 |
| Level 3 Financing, Inc. |
| 08/15/2022 | 5.375% | | 127,000 | 128,458 |
| 03/15/2026 | 5.250% | | 152,000 | 148,759 |
| Orange SA |
| 07/08/2019 | 5.375% | | 4,001,000 | 4,086,377 |
| Telecom Italia Capital SA |
| 09/30/2034 | 6.000% | | 246,000 | 242,686 |
| Telecom Italia SpA(a) |
| 05/30/2024 | 5.303% | | 103,000 | 102,883 |
| Telefonica Emisiones SAU |
| 06/20/2036 | 7.045% | | 2,800,000 | 3,408,392 |
| Verizon Communications, Inc. |
| 08/10/2033 | 4.500% | | 9,000,000 | 8,901,081 |
| Corporate Bonds & Notes (continued) |
| Issuer | Coupon
Rate | | Principal
Amount ($) | Value ($) |
| Zayo Group LLC/Capital, Inc.(a) |
| 01/15/2027 | 5.750% | | 383,000 | 383,766 |
| Total | 33,015,132 |
Total Corporate Bonds & Notes
(Cost $780,701,322) | 768,749,402 |
| Exchange-Traded Funds 1.0% |
| | Shares | Value ($) |
| iShares Core MSCI EAFE ETF | 1,079,495 | 68,774,627 |
Total Exchange-Traded Funds
(Cost $72,408,419) | 68,774,627 |
| Foreign Government Obligations(f) 0.4% |
| Issuer | Coupon
Rate | | Principal
Amount ($) | Value ($) |
| Canada 0.3% |
| Province of Ontario |
| 05/21/2020 | 1.875% | | 10,360,000 | 10,190,935 |
| Province of Quebec |
| 07/29/2020 | 3.500% | | 10,275,000 | 10,397,437 |
| Total | 20,588,372 |
| Mexico 0.1% |
| Petroleos Mexicanos |
| 03/13/2027 | 6.500% | | 10,000,000 | 10,106,960 |
Total Foreign Government Obligations
(Cost $31,056,257) | 30,695,332 |
|
| Inflation-Indexed Bonds 0.9% |
| | | | |
| United States 0.9% |
| U.S. Treasury Inflation-Indexed Bond |
| 04/15/2021 | 0.125% | | 69,778,472 | 68,509,486 |
Total Inflation-Indexed Bonds
(Cost $69,395,943) | 68,509,486 |
|
| Residential Mortgage-Backed Securities - Agency 7.5% |
| | | | |
| Federal Home Loan Mortgage Corp. |
10/01/2018-
05/01/2041 | 5.000% | | 984,441 | 1,049,632 |
12/01/2018-
01/01/2039 | 5.500% | | 345,207 | 371,208 |
10/01/2026-
06/01/2046 | 3.500% | | 108,773,426 | 108,822,157 |
10/01/2031-
10/01/2039 | 6.000% | | 677,953 | 744,963 |
01/01/2032-
05/01/2045 | 3.000% | | 31,819,025 | 31,219,148 |
The accompanying Notes to Financial Statements are an integral part of this statement.
| 24 | Columbia Balanced Fund | Annual Report 2018 |
Portfolio of Investments (continued)
August 31, 2018
| Residential Mortgage-Backed Securities - Agency (continued) |
| Issuer | Coupon
Rate | | Principal
Amount ($) | Value ($) |
06/01/2032-
07/01/2032 | 7.000% | | 300,965 | 337,945 |
| 03/01/2038 | 6.500% | | 4,926 | 5,513 |
05/01/2039-
06/01/2041 | 4.500% | | 4,094,645 | 4,296,955 |
12/01/2042-
12/01/2045 | 4.000% | | 50,247,511 | 51,301,370 |
| CMO Series 1614 Class MZ |
| 11/15/2023 | 6.500% | | 8,080 | 8,555 |
| Federal Home Loan Mortgage Corp.(c) |
12-month USD LIBOR + 0.017%
08/01/2036 | 4.013% | | 17,589 | 18,420 |
12-month USD LIBOR + 0.018%
12/01/2036 | 3.515% | | 2,363 | 2,456 |
| Federal Home Loan Mortgage Corp.(g) |
| 09/01/2043 | 3.500% | | 3,229,505 | 3,236,846 |
| Federal Home Loan Mortgage Corp.(h) |
| 09/13/2048 | 3.500% | | 23,075,000 | 22,953,316 |
| Federal National Mortgage Association |
| 12/01/2020 | 5.000% | | 22,511 | 23,134 |
12/01/2025-
07/01/2046 | 3.500% | | 124,876,351 | 125,097,348 |
07/01/2027-
10/01/2046 | 3.000% | | 56,667,807 | 56,171,408 |
01/01/2029-
03/01/2048 | 4.000% | | 129,538,005 | 132,046,380 |
| 06/01/2031 | 7.000% | | 168,719 | 189,232 |
07/01/2032-
03/01/2037 | 6.500% | | 347,433 | 381,732 |
06/01/2037-
02/01/2038 | 5.500% | | 170,270 | 184,317 |
05/01/2040-
06/01/2044 | 4.500% | | 4,931,465 | 5,154,523 |
| Series 2006-M2 Class A2A |
| 10/25/2032 | 5.271% | | 1,200,790 | 1,287,003 |
Total Residential Mortgage-Backed Securities - Agency
(Cost $560,977,424) | 544,903,561 |
|
| Residential Mortgage-Backed Securities - Non-Agency 1.8% |
| | | | |
| Angel Oak Mortgage Trust I LLC(a),(b) |
| CMO Series 2018-3 Class A3 |
| 09/25/2048 | 3.853% | | 9,233,000 | 9,262,455 |
| Angel Oak Mortgage Trust LLC(a),(b) |
| CMO Series 2017-1 Class A1 |
| 01/25/2047 | 2.810% | | 1,559,786 | 1,550,369 |
| Arroyo Mortgage Trust(a),(b) |
| CMO Series 2018-1 Class A1 |
| 04/25/2048 | 3.763% | | 11,041,103 | 11,043,491 |
| Bayview Opportunity Master Fund IVA Trust(a) |
| CMO Series 2016-SPL1 Class A |
| 04/28/2055 | 4.000% | | 3,132,212 | 3,148,630 |
| Residential Mortgage-Backed Securities - Non-Agency (continued) |
| Issuer | Coupon
Rate | | Principal
Amount ($) | Value ($) |
| Bellemeade Re Ltd.(a),(c) |
| CMO Series 2018-2A Class M1A |
1-month USD LIBOR + 0.950%
08/25/2028 | 3.022% | | 9,350,000 | 9,355,702 |
| COLT Mortgage Loan Trust(a) |
| CMO Series 2016-1 Class A1 |
| 05/25/2046 | 3.000% | | 419,462 | 419,451 |
| COLT Mortgage Loan Trust(a),(b) |
| CMO Series 2016-2 Class A1 |
| 09/25/2046 | 2.750% | | 1,324,992 | 1,320,255 |
| CMO Series 2016-3 Class A1 |
| 12/26/2046 | 2.800% | | 2,864,873 | 2,847,338 |
| CMO Series 2017-1 Class A1 |
| 05/27/2047 | 2.614% | | 3,071,377 | 2,985,386 |
| CMO Series 2018-2 Class A1 |
| 07/27/2048 | 3.470% | | 4,778,042 | 4,777,501 |
| Deephaven Residential Mortgage Trust(a),(b) |
| CMO Series 2017-1A Class A1 |
| 12/26/2046 | 2.725% | | 2,991,360 | 2,931,929 |
| CMO Series 2017-2A Class A1 |
| 06/25/2047 | 2.453% | | 5,178,233 | 5,117,558 |
| Equifirst Mortgage Loan Trust(b) |
| CMO Series 2003-1 Class IF1 |
| 12/25/2032 | 4.010% | | 45,034 | 45,355 |
| MetLife Securitization Trust(a) |
| CMO Series 2018-1A Class A |
| 03/25/2057 | 3.750% | | 7,090,000 | 7,107,185 |
| MFA Trust(a),(b) |
| CMO Series 2017-RPL1 Class A1 |
| 02/25/2057 | 2.588% | | 5,590,267 | 5,490,040 |
| Mill City Mortgage Trust(a) |
| CMO Series 2015-2 Class A1 |
| 09/25/2057 | 3.000% | | 571,493 | 570,333 |
| CMO Series 2016-1 Class A1 |
| 04/25/2057 | 2.500% | | 3,030,132 | 2,964,229 |
| New Residential Mortgage Loan Trust(a) |
| CMO Series 2016-3A Class A1 |
| 09/25/2056 | 3.750% | | 2,554,823 | 2,557,186 |
| New Residential Mortgage Loan Trust(a),(b) |
| CMO Series 2017-3A Class A1 |
| 04/25/2057 | 4.000% | | 4,024,396 | 4,066,397 |
| Starwood Mortgage Residential Trust(a),(b) |
| CMO Series 2018-IMC1 Class A3 |
| 03/25/2048 | 3.977% | | 6,208,519 | 6,231,625 |
| Towd Point Mortgage Trust(a) |
| CMO Series 15-5 Class A1 |
| 05/25/2055 | 3.500% | | 2,733,882 | 2,727,751 |
| CMO Series 2015-4 Class A1 |
| 04/25/2055 | 3.500% | | 1,823,007 | 1,818,764 |
The accompanying Notes to Financial Statements are an integral part of this statement.
Columbia Balanced Fund | Annual Report 2018
| 25 |
Portfolio of Investments (continued)
August 31, 2018
| Residential Mortgage-Backed Securities - Non-Agency (continued) |
| Issuer | Coupon
Rate | | Principal
Amount ($) | Value ($) |
| CMO Series 2015-6 Class A1 |
| 04/25/2055 | 3.500% | | 3,256,241 | 3,250,739 |
| CMO Series 2016-1 Class A1 |
| 02/25/2055 | 3.500% | | 3,361,857 | 3,354,272 |
| CMO Series 2016-2 Class A1 |
| 08/25/2055 | 3.000% | | 4,691,256 | 4,620,379 |
| CMO Series 2016-3 Class A1 |
| 04/25/2056 | 2.250% | | 2,501,120 | 2,443,413 |
| CMO Series 2017-1 Class A1 |
| 10/25/2056 | 2.750% | | 3,389,862 | 3,328,151 |
| CMO Series 2017-4 Class A1 |
| 06/25/2057 | 2.750% | | 5,992,460 | 5,856,267 |
| Towd Point Mortgage Trust(a),(b) |
| CMO Series 2018-1 Class A1 |
| 01/25/2058 | 3.000% | | 4,265,284 | 4,197,522 |
| Verus Securitization Trust(a),(b) |
| CMO Series 2017-1A Class A1 |
| 01/25/2047 | 2.853% | | 2,370,083 | 2,358,556 |
| CMO Series 2018-2 Class A3 |
| 06/01/2058 | 3.830% | | 13,333,282 | 13,328,634 |
Total Residential Mortgage-Backed Securities - Non-Agency
(Cost $132,426,051) | 131,076,863 |
|
| Senior Loans 0.0% |
| Borrower | Coupon
Rate | | Principal
Amount ($) | Value ($) |
| Consumer Products 0.0% |
| Serta Simmons Bedding LLC(c),(i) |
| 2nd Lien Term Loan |
3-month USD LIBOR + 8.000%
11/08/2024 | 10.071% | | 171,778 | 118,527 |
| Pharmaceuticals 0.0% |
| Bausch Health Companies, Inc.(c),(i) |
| Term Loan |
3-month USD LIBOR + 3.000%
06/02/2025 | 5.081% | | 42,462 | 42,596 |
| Property & Casualty 0.0% |
| Hub International Ltd.(c),(i) |
| Term Loan |
3-month USD LIBOR + 3.000%
04/25/2025 | 5.335% | | 46,000 | 45,940 |
| Technology 0.0% |
| Ascend Learning LLC(c),(i) |
| Term Loan |
3-month USD LIBOR + 3.000%
07/12/2024 | 5.076% | | 26,798 | 26,731 |
| Senior Loans (continued) |
| Borrower | Coupon
Rate | | Principal
Amount ($) | Value ($) |
| Greeneden US Holdings I LLC/Genesys Telecommunications Laboratories, Inc.(c),(i) |
| Tranche B3 Term Loan |
3-month USD LIBOR + 3.500%
12/01/2023 | 5.576% | | 79,004 | 79,136 |
| Hyland Software, Inc.(c),(i) |
| Tranche 3 1st Lien Term Loan |
3-month USD LIBOR + 3.250%
07/01/2022 | 5.326% | | 47,449 | 47,698 |
| Misys Ltd./Almonde/Tahoe(c),(i) |
| 1st Lien Term Loan |
3-month USD LIBOR + 3.500%
06/13/2024 | 5.576% | | 107,175 | 106,610 |
| Total | 260,175 |
Total Senior Loans
(Cost $517,251) | 467,238 |
|
| U.S. Government & Agency Obligations 1.3% |
| Issuer | Coupon
Rate | | Principal
Amount ($) | Value ($) |
| Federal Farm Credit Banks(c) |
1-month USD LIBOR + 0.000%
09/25/2020 | 2.065% | | 91,025,000 | 91,019,994 |
Total U.S. Government & Agency Obligations
(Cost $91,034,883) | 91,019,994 |
|
| U.S. Treasury Obligations 1.9% |
| | | | |
| U.S. Treasury |
| 02/15/2045 | 2.500% | | 150,075,000 | 136,141,627 |
Total U.S. Treasury Obligations
(Cost $134,028,514) | 136,141,627 |
| Money Market Funds 4.4% |
| | Shares | Value ($) |
| Columbia Short-Term Cash Fund, 2.058%(j),(k) | 315,856,889 | 315,825,304 |
Total Money Market Funds
(Cost $315,849,572) | 315,825,304 |
Total Investments in Securities
(Cost: $5,983,896,011) | 7,252,344,897 |
| Other Assets & Liabilities, Net | | (6,112,364) |
| Net Assets | 7,246,232,533 |
The accompanying Notes to Financial Statements are an integral part of this statement.
| 26 | Columbia Balanced Fund | Annual Report 2018 |
Portfolio of Investments (continued)
August 31, 2018
At August 31, 2018, securities and/or cash totaling $1,429,834 were pledged as collateral.
Investments in derivatives
| Long futures contracts |
| Description | Number of
contracts | Expiration
date | Trading
currency | Notional
amount | Value/Unrealized
appreciation ($) | Value/Unrealized
depreciation ($) |
| U.S. Treasury 10-Year Note | 475 | 12/2018 | USD | 57,364,202 | — | (34,349) |
| U.S. Treasury 5-Year Note | 400 | 12/2018 | USD | 45,414,980 | — | (25,760) |
| U.S. Ultra Bond | 92 | 12/2018 | USD | 14,703,293 | — | (26,068) |
| Total | | | | | — | (86,177) |
Notes to Portfolio of Investments
| (a) | Represents privately placed and other securities and instruments exempt from SEC registration (collectively, private placements), such as Section 4(a)(2) and Rule 144A eligible securities, which are often sold only to qualified institutional buyers. The Fund may invest in private placements determined to be liquid as well as those determined to be illiquid. Private placements may be determined to be liquid under guidelines established by the Fund’s Board of Trustees. At August 31, 2018, the total value of these securities amounted to $480,898,562, which represents 6.64% of total net assets. |
| (b) | Variable or floating rate security, the interest rate of which adjusts periodically based on changes in current interest rates and prepayments on the underlying pool of assets. The interest rate shown was the current rate as of August 31, 2018. |
| (c) | Variable rate security. The interest rate shown was the current rate as of August 31, 2018. |
| (d) | Non-income producing investment. |
| (e) | Represents a variable rate security with a step coupon where the rate adjusts according to a schedule for a series of periods, typically lower for an initial period and then increasing to a higher coupon rate thereafter. The interest rate shown was the current rate as of August 31, 2018. |
| (f) | Principal and interest may not be guaranteed by the government. |
| (g) | This security or a portion of this security has been pledged as collateral in connection with derivative contracts. |
| (h) | Represents a security purchased on a when-issued basis. |
| (i) | The stated interest rate represents the weighted average interest rate at August 31, 2018 of contracts within the senior loan facility. Interest rates on contracts are primarily determined either weekly, monthly or quarterly by reference to the indicated base lending rate and spread and the reset period. These base lending rates are primarily the London Interbank Offered Rate (“LIBOR”) and other short-term rates. Base lending rates may be subject to a floor or minimum rate. The interest rate for senior loans purchased on a when-issued or delayed delivery basis will be determined upon settlement, therefore no interest rate is disclosed. Senior loans often require prepayments from excess cash flows or permit the borrowers to repay at their election. The degree to which borrowers repay, cannot be predicted with accuracy. As a result, remaining maturities of senior loans may be less than the stated maturities. |
| (j) | The rate shown is the seven-day current annualized yield at August 31, 2018. |
| (k) | As defined in the Investment Company Act of 1940, an affiliated company is one in which the Fund owns 5% or more of the company’s outstanding voting securities, or a company which is under common ownership or control with the Fund. Holdings and transactions in these affiliated companies during the year ended August 31, 2018 are as follows: |
| Issuer | Beginning
shares | Shares
purchased | Shares
sold | Ending
shares | Realized gain
(loss) —
affiliated
issuers ($) | Net change in
unrealized
appreciation
(depreciation) —
affiliated
issuers ($) | Dividends —
affiliated
issuers ($) | Value —
affiliated
issuers
at end of
period ($) |
| Columbia Short-Term Cash Fund, 2.058% |
| | 524,679,452 | 1,793,748,090 | (2,002,570,653) | 315,856,889 | (3,381) | (36,020) | 6,685,128 | 315,825,304 |
Abbreviation Legend
| CMO | Collateralized Mortgage Obligation |
| PIK | Payment In Kind |
Currency Legend
The accompanying Notes to Financial Statements are an integral part of this statement.
Columbia Balanced Fund | Annual Report 2018
| 27 |
Portfolio of Investments (continued)
August 31, 2018
Fair value measurements
The Fund categorizes its fair value measurements according to a three-level hierarchy that maximizes the use of observable inputs and minimizes the use of unobservable inputs by prioritizing that the most observable input be used when available. Observable inputs are those that market participants would use in pricing an investment based on market data obtained from sources independent of the reporting entity. Unobservable inputs are those that reflect the Fund’s assumptions about the information market participants would use in pricing an investment. An investment’s level within the fair value hierarchy is based on the lowest level of any input that is deemed significant to the asset’s or liability’s fair value measurement. The input levels are not necessarily an indication of the risk or liquidity associated with investments at that level. For example, certain U.S. government securities are generally high quality and liquid, however, they are reflected as Level 2 because the inputs used to determine fair value may not always be quoted prices in an active market.
Fair value inputs are summarized in the three broad levels listed below:
| ■ | Level 1 — Valuations based on quoted prices for investments in active markets that the Fund has the ability to access at the measurement date. Valuation adjustments are not applied to Level 1 investments. |
| ■ | Level 2 — Valuations based on other significant observable inputs (including quoted prices for similar securities, interest rates, prepayment speeds, credit risks, etc.). |
| ■ | Level 3 — Valuations based on significant unobservable inputs (including the Fund’s own assumptions and judgment in determining the fair value of investments). |
Inputs that are used in determining fair value of an investment may include price information, credit data, volatility statistics, and other factors. These inputs can be either observable or unobservable. The availability of observable inputs can vary between investments, and is affected by various factors such as the type of investment, and the volume and level of activity for that investment or similar investments in the marketplace. The inputs will be considered by the Investment Manager, along with any other relevant factors in the calculation of an investment’s fair value. The Fund uses prices and inputs that are current as of the measurement date, which may include periods of market dislocations. During these periods, the availability of prices and inputs may be reduced for many investments. This condition could cause an investment to be reclassified between the various levels within the hierarchy.
Certain investments that have been measured at fair value using the net asset value (NAV) per share (or its equivalent) are not categorized in the fair value hierarchy. The fair value amounts presented in the table are intended to reconcile the fair value hierarchy to the amounts presented in the Portfolio of Investments. The Columbia Short-Term Cash Fund seeks to provide shareholders with maximum current income consistent with liquidity and stability of principal. Columbia Short-Term Cash Fund prices its shares with a floating NAV and no longer seeks to maintain a stable NAV.
Investments falling into the Level 3 category are primarily supported by quoted prices from brokers and dealers participating in the market for those investments. However, these may be classified as Level 3 investments due to lack of market transparency and corroboration to support these quoted prices. Additionally, valuation models may be used as the pricing source for any remaining investments classified as Level 3. These models may rely on one or more significant unobservable inputs and/or significant assumptions by the Investment Manager. Inputs used in valuations may include, but are not limited to, financial statement analysis, capital account balances, discount rates and estimated cash flows, and comparable company data.
Under the direction of the Fund’s Board of Trustees (the Board), the Investment Manager’s Valuation Committee (the Committee) is responsible for overseeing the valuation procedures approved by the Board. The Committee consists of voting and non-voting members from various groups within the Investment Manager’s organization, including operations and accounting, trading and investments, compliance, risk management and legal.
The Committee meets at least monthly to review and approve valuation matters, which may include a description of specific valuation determinations, data regarding pricing information received from approved pricing vendors and brokers and the results of Board-approved valuation control policies and procedures (the Policies). The Policies address, among other things, instances when market quotations are or are not readily available, including recommendations of third party pricing vendors and a determination of appropriate pricing methodologies; events that require specific valuation determinations and assessment of fair value techniques; securities with a potential for stale pricing, including those that are illiquid, restricted, or in default; and the effectiveness of third party pricing vendors, including periodic reviews of vendors. The Committee meets more frequently, as needed, to discuss additional valuation matters, which may include the need to review back-testing results, review time-sensitive information or approve related valuation actions. The Committee reports to the Board, with members of the Committee meeting with the Board at each of its regularly scheduled meetings to discuss valuation matters and actions during the period, similar to those described earlier.
For investments categorized as Level 3, the Committee monitors information similar to that described above, which may include: (i) data specific to the issuer or comparable issuers, (ii) general market or specific sector news and (iii) quoted prices and specific or similar security transactions. The Committee considers this data and any changes from prior periods in order to assess the reasonableness of observable and unobservable inputs, any assumptions or internal models used to value those securities and changes in fair value. This data is also used to corroborate, when available, information received from approved pricing vendors and brokers. Various factors impact the frequency of monitoring this information (which may occur as often as daily). However, the Committee may determine that changes to inputs, assumptions and models are not required as a result of the monitoring procedures performed.
The following table is a summary of the inputs used to value the Fund’s investments at August 31, 2018:
| | Level 1
quoted prices
in active
markets for
identical
assets ($) | Level 2
other
significant
observable
inputs ($) | Level 3
significant
unobservable
inputs ($) | Investments
measured at
net asset
value ($) | Total ($) |
| Investments in Securities | | | | | |
| Asset-Backed Securities — Non-Agency | — | 262,695,977 | — | — | 262,695,977 |
| Commercial Mortgage-Backed Securities - Agency | — | 124,730,739 | — | — | 124,730,739 |
| Commercial Mortgage-Backed Securities - Non-Agency | — | 149,026,011 | — | — | 149,026,011 |
| Common Stocks | | | | | |
| Consumer Discretionary | 513,833,141 | — | — | — | 513,833,141 |
| Consumer Staples | 284,039,579 | — | — | — | 284,039,579 |
| Energy | 262,957,791 | — | — | — | 262,957,791 |
| Financials | 713,100,798 | — | — | — | 713,100,798 |
| Health Care | 770,779,468 | — | — | — | 770,779,468 |
The accompanying Notes to Financial Statements are an integral part of this statement.
| 28 | Columbia Balanced Fund | Annual Report 2018 |
Portfolio of Investments (continued)
August 31, 2018
Fair value measurements (continued)
| | Level 1
quoted prices
in active
markets for
identical
assets ($) | Level 2
other
significant
observable
inputs ($) | Level 3
significant
unobservable
inputs ($) | Investments
measured at
net asset
value ($) | Total ($) |
| Industrials | 350,031,993 | — | — | — | 350,031,993 |
| Information Technology | 1,278,690,320 | — | — | — | 1,278,690,320 |
| Materials | 143,474,074 | — | — | — | 143,474,074 |
| Real Estate | 110,898,298 | — | — | — | 110,898,298 |
| Telecommunication Services | 97,654,625 | — | — | — | 97,654,625 |
| Utilities | 34,268,649 | — | — | — | 34,268,649 |
| Total Common Stocks | 4,559,728,736 | — | — | — | 4,559,728,736 |
| Corporate Bonds & Notes | — | 768,749,402 | — | — | 768,749,402 |
| Exchange-Traded Funds | — | 68,774,627 | — | — | 68,774,627 |
| Foreign Government Obligations | — | 30,695,332 | — | — | 30,695,332 |
| Inflation-Indexed Bonds | — | 68,509,486 | — | — | 68,509,486 |
| Residential Mortgage-Backed Securities - Agency | — | 544,903,561 | — | — | 544,903,561 |
| Residential Mortgage-Backed Securities - Non-Agency | — | 131,076,863 | — | — | 131,076,863 |
| Senior Loans | — | 467,238 | — | — | 467,238 |
| U.S. Government & Agency Obligations | — | 91,019,994 | — | — | 91,019,994 |
| U.S. Treasury Obligations | 136,141,627 | — | — | — | 136,141,627 |
| Money Market Funds | — | — | — | 315,825,304 | 315,825,304 |
| Total Investments in Securities | 4,695,870,363 | 2,240,649,230 | — | 315,825,304 | 7,252,344,897 |
| Investments in Derivatives | | | | | |
| Liability | | | | | |
| Futures Contracts | (86,177) | — | — | — | (86,177) |
| Total | 4,695,784,186 | 2,240,649,230 | — | 315,825,304 | 7,252,258,720 |
See the Portfolio of Investments for all investment classifications not indicated in the table.
The Fund’s assets assigned to the Level 2 input category are generally valued using the market approach, in which a security’s value is determined through reference to prices and information from market transactions for similar or identical assets.
Derivative instruments are valued at unrealized appreciation (depreciation).
There were no transfers of financial assets between levels during the period.
The accompanying Notes to Financial Statements are an integral part of this statement.
Columbia Balanced Fund | Annual Report 2018
| 29 |
Statement of Assets and Liabilities
August 31, 2018
| Assets | |
| Investments in securities, at value | |
| Unaffiliated issuers (cost $5,668,046,439) | $6,936,519,593 |
| Affiliated issuers (cost $315,849,572) | 315,825,304 |
| Cash | 2,195 |
| Receivable for: | |
| Investments sold | 8,027,807 |
| Capital shares sold | 6,181,448 |
| Dividends | 7,266,027 |
| Interest | 12,083,434 |
| Foreign tax reclaims | 83,118 |
| Variation margin for futures contracts | 92,578 |
| Prepaid expenses | 46,321 |
| Trustees’ deferred compensation plan | 157,264 |
| Other assets | 3,553 |
| Total assets | 7,286,288,642 |
| Liabilities | |
| Payable for: | |
| Investments purchased | 6,897,044 |
| Investments purchased on a delayed delivery basis | 22,878,382 |
| Capital shares purchased | 8,886,273 |
| Variation margin for futures contracts | 8,625 |
| Management services fees | 114,407 |
| Distribution and/or service fees | 64,693 |
| Transfer agent fees | 791,874 |
| Compensation of chief compliance officer | 475 |
| Other expenses | 257,072 |
| Trustees’ deferred compensation plan | 157,264 |
| Total liabilities | 40,056,109 |
| Net assets applicable to outstanding capital stock | $7,246,232,533 |
| Represented by | |
| Paid in capital | 5,778,937,685 |
| Undistributed net investment income | 21,489,491 |
| Accumulated net realized gain | 177,442,648 |
| Unrealized appreciation (depreciation) on: | |
| Investments - unaffiliated issuers | 1,268,473,154 |
| Investments - affiliated issuers | (24,268) |
| Futures contracts | (86,177) |
| Total - representing net assets applicable to outstanding capital stock | $7,246,232,533 |
The accompanying Notes to Financial Statements are an integral part of this statement.
| 30 | Columbia Balanced Fund | Annual Report 2018 |
Statement of Assets and Liabilities (continued)
August 31, 2018
| Class A | |
| Net assets | $2,798,245,766 |
| Shares outstanding | 65,789,780 |
| Net asset value per share | $42.53 |
| Maximum sales charge | 5.75% |
| Maximum offering price per share (calculated by dividing the net asset value per share by 1.0 minus the maximum sales charge for Class A shares) | $45.12 |
| Advisor Class | |
| Net assets | $262,643,728 |
| Shares outstanding | 6,127,792 |
| Net asset value per share | $42.86 |
| Class C | |
| Net assets | $1,591,464,771 |
| Shares outstanding | 37,549,820 |
| Net asset value per share | $42.38 |
| Institutional Class | |
| Net assets | $1,872,366,124 |
| Shares outstanding | 44,089,150 |
| Net asset value per share | $42.47 |
| Institutional 2 Class | |
| Net assets | $279,241,802 |
| Shares outstanding | 6,571,069 |
| Net asset value per share | $42.50 |
| Institutional 3 Class | |
| Net assets | $308,783,077 |
| Shares outstanding | 7,201,931 |
| Net asset value per share | $42.88 |
| Class R | |
| Net assets | $133,484,524 |
| Shares outstanding | 3,138,906 |
| Net asset value per share | $42.53 |
| Class T | |
| Net assets | $2,741 |
| Shares outstanding | 64 |
| Net asset value per share(a) | $42.52 |
| Maximum sales charge | 2.50% |
| Maximum offering price per share (calculated by dividing the net asset value per share by 1.0 minus the maximum sales charge per transaction for Class T shares) | $43.61 |
| (a) | Net asset value per share rounds to this amount due to fractional shares outstanding. |
The accompanying Notes to Financial Statements are an integral part of this statement.
Columbia Balanced Fund | Annual Report 2018
| 31 |
Statement of Operations
Year Ended August 31, 2018
| Net investment income | |
| Income: | |
| Dividends — unaffiliated issuers | $80,241,887 |
| Dividends — affiliated issuers | 6,685,128 |
| Interest | 69,278,298 |
| Interfund lending | 1,071 |
| Foreign taxes withheld | (273,305) |
| Total income | 155,933,079 |
| Expenses: | |
| Management services fees | 42,313,765 |
| Distribution and/or service fees | |
| Class A | 7,202,145 |
| Class C | 15,972,816 |
| Class R | 681,885 |
| Class T | 6 |
| Transfer agent fees | |
| Class A | 3,151,568 |
| Advisor Class | 347,110 |
| Class C | 1,747,868 |
| Institutional Class | 1,993,790 |
| Institutional 2 Class | 189,222 |
| Institutional 3 Class | 27,006 |
| Class K | 147 |
| Class R | 149,178 |
| Class T | 4 |
| Plan administration fees | |
| Class K | 620 |
| Compensation of board members | 126,563 |
| Custodian fees | 83,450 |
| Printing and postage fees | 471,318 |
| Registration fees | 320,332 |
| Audit fees | 47,531 |
| Legal fees | 172,998 |
| Compensation of chief compliance officer | 2,900 |
| Other | 184,124 |
| Total expenses | 75,186,346 |
| Expense reduction | (2,297) |
| Total net expenses | 75,184,049 |
| Net investment income | 80,749,030 |
| Realized and unrealized gain (loss) — net | |
| Net realized gain (loss) on: | |
| Investments — unaffiliated issuers | 253,214,518 |
| Investments — affiliated issuers | (3,381) |
| Foreign currency translations | 2,106 |
| Futures contracts | (3,984,184) |
| Net realized gain | 249,229,059 |
| Net change in unrealized appreciation (depreciation) on: | |
| Investments — unaffiliated issuers | 197,682,178 |
| Investments — affiliated issuers | (36,020) |
| Futures contracts | (239,890) |
| Net change in unrealized appreciation (depreciation) | 197,406,268 |
| Net realized and unrealized gain | 446,635,327 |
| Net increase in net assets resulting from operations | $527,384,357 |
The accompanying Notes to Financial Statements are an integral part of this statement.
| 32 | Columbia Balanced Fund | Annual Report 2018 |
Statement of Changes in Net Assets
| | Year Ended
August 31, 2018 | Year Ended
August 31, 2017 (a) |
| Operations | | |
| Net investment income | $80,749,030 | $64,258,715 |
| Net realized gain | 249,229,059 | 73,773,485 |
| Net change in unrealized appreciation (depreciation) | 197,406,268 | 456,058,348 |
| Net increase in net assets resulting from operations | 527,384,357 | 594,090,548 |
| Distributions to shareholders | | |
| Net investment income | | |
| Class A | (32,119,116) | (31,419,357) |
| Advisor Class | (4,342,151) | (1,891,778) |
| Class B | — | (15,938) |
| Class C | (5,858,667) | (4,281,484) |
| Institutional Class | (24,669,492) | (15,800,647) |
| Institutional 2 Class | (4,667,983) | (3,044,013) |
| Institutional 3 Class | (3,826,408) | (2,015,122) |
| Class K | (3,059) | (152,413) |
| Class R | (1,185,792) | (735,523) |
| Class T | (30) | (6) |
| Net realized gains | | |
| Class A | (43,794,715) | (10,277,146) |
| Advisor Class | (5,173,147) | (429,875) |
| Class B | — | (18,534) |
| Class C | (23,969,628) | (4,465,030) |
| Institutional Class | (27,034,308) | (3,039,354) |
| Institutional 2 Class | (5,273,688) | (637,036) |
| Institutional 3 Class | (4,144,929) | (444,743) |
| Class K | (7,102) | (75,695) |
| Class R | (2,079,860) | (268,851) |
| Class T | (40) | — |
| Total distributions to shareholders | (188,150,115) | (79,012,545) |
| Increase (decrease) in net assets from capital stock activity | (217,869,957) | 994,657,535 |
| Total increase in net assets | 121,364,285 | 1,509,735,538 |
| Net assets at beginning of year | 7,124,868,248 | 5,615,132,710 |
| Net assets at end of year | $7,246,232,533 | $7,124,868,248 |
| Undistributed net investment income | $21,489,491 | $17,750,369 |
| (a) | Class T shares are based on operations from April 3, 2017 (commencement of operations) through the stated period end. |
The accompanying Notes to Financial Statements are an integral part of this statement.
Columbia Balanced Fund | Annual Report 2018
| 33 |
Statement of Changes in Net Assets (continued)
| | Year Ended | Year Ended |
| | August 31, 2018 | August 31, 2017 (a) |
| | Shares | Dollars ($) | Shares | Dollars ($) |
| Capital stock activity |
| Class A | | | | |
| Subscriptions | 11,907,451 | 491,495,200 | 24,772,439 | 945,332,855 |
| Distributions reinvested | 1,767,262 | 72,594,492 | 1,045,100 | 39,678,883 |
| Redemptions | (18,800,971) | (774,256,063) | (33,774,711) | (1,309,765,943) |
| Net decrease | (5,126,258) | (210,166,371) | (7,957,172) | (324,754,205) |
| Advisor Class | | | | |
| Subscriptions | 3,049,876 | 126,357,688 | 5,915,668 | 234,427,027 |
| Distributions reinvested | 227,462 | 9,410,310 | 58,826 | 2,263,044 |
| Redemptions | (4,931,823) | (203,348,145) | (1,156,822) | (45,169,223) |
| Net increase (decrease) | (1,654,485) | (67,580,147) | 4,817,672 | 191,520,848 |
| Class B | | | | |
| Subscriptions | — | — | 14,471 | 541,609 |
| Distributions reinvested | — | — | 846 | 31,720 |
| Redemptions | — | — | (185,775) | (7,216,956) |
| Net decrease | — | — | (170,458) | (6,643,627) |
| Class C | | | | |
| Subscriptions | 7,310,481 | 300,534,318 | 11,563,817 | 441,849,546 |
| Distributions reinvested | 687,910 | 28,197,620 | 213,858 | 8,054,282 |
| Redemptions | (8,466,088) | (348,287,316) | (7,571,868) | (291,220,044) |
| Net increase (decrease) | (467,697) | (19,555,378) | 4,205,807 | 158,683,784 |
| Institutional Class | | | | |
| Subscriptions | 12,547,575 | 516,259,609 | 28,546,277 | 1,101,924,164 |
| Distributions reinvested | 1,062,981 | 43,575,598 | 405,893 | 15,534,982 |
| Redemptions | (12,811,443) | (527,156,600) | (8,808,209) | (338,109,754) |
| Net increase | 799,113 | 32,678,607 | 20,143,961 | 779,349,392 |
| Institutional 2 Class | | | | |
| Subscriptions | 4,231,266 | 174,312,801 | 4,167,519 | 160,934,986 |
| Distributions reinvested | 242,349 | 9,939,541 | 96,352 | 3,675,206 |
| Redemptions | (5,624,483) | (232,142,525) | (1,372,685) | (52,679,229) |
| Net increase (decrease) | (1,150,868) | (47,890,183) | 2,891,186 | 111,930,963 |
| Institutional 3 Class | | | | |
| Subscriptions | 4,090,596 | 168,904,814 | 2,223,648 | 86,597,736 |
| Distributions reinvested | 173,114 | 7,166,163 | 60,495 | 2,323,884 |
| Redemptions | (1,717,571) | (71,525,736) | (761,880) | (29,574,327) |
| Net increase | 2,546,139 | 104,545,241 | 1,522,263 | 59,347,293 |
| Class K | | | | |
| Subscriptions | 58 | 2,342 | 38,103 | 1,428,499 |
| Distributions reinvested | 246 | 10,079 | 6,113 | 227,986 |
| Redemptions | (11,877) | (496,307) | (659,481) | (24,828,066) |
| Net decrease | (11,573) | (483,886) | (615,265) | (23,171,581) |
| Class R | | | | |
| Subscriptions | 976,195 | 40,211,637 | 2,180,027 | 84,852,665 |
| Distributions reinvested | 56,558 | 2,324,052 | 14,354 | 547,735 |
| Redemptions | (1,259,000) | (51,953,529) | (958,372) | (37,008,232) |
| Net increase (decrease) | (226,247) | (9,417,840) | 1,236,009 | 48,392,168 |
| Class T | | | | |
| Subscriptions | — | — | 64 | 2,500 |
| Net increase | — | — | 64 | 2,500 |
| Total net increase (decrease) | (5,291,876) | (217,869,957) | 26,074,067 | 994,657,535 |
| (a) | Class T shares are based on operations from April 3, 2017 (commencement of operations) through the stated period end. |
The accompanying Notes to Financial Statements are an integral part of this statement.
| 34 | Columbia Balanced Fund | Annual Report 2018 |
[THIS PAGE INTENTIONALLY LEFT BLANK]
Columbia Balanced Fund | Annual Report 2018
| 35 |
The following table is intended to help you understand the Fund’s financial performance. Certain information reflects financial results for a single share of a class held for the periods shown. Per share net investment income (loss) amounts are calculated based on average shares outstanding during the period. Total return assumes reinvestment of all dividends and distributions, if any. Total return does not reflect payment of sales charges, if any. Total return and portfolio turnover are not annualized for periods of less than one year. The portfolio turnover rate is calculated without regard to purchase and sales transactions of short-term instruments and certain derivatives, if any. If such transactions were included, the Fund’s portfolio turnover rate may be higher.
| | Net asset value,
beginning of
period | Net
investment
income | Net
realized
and
unrealized
gain (loss) | Total from
investment
operations | Distributions
from net
investment
income | Distributions
from net
realized
gains | Total
distributions to
shareholders |
| Class A |
| Year Ended 8/31/2018 | $40.56 | 0.48 | 2.57 | 3.05 | (0.46) | (0.62) | (1.08) |
| Year Ended 8/31/2017 | $37.54 | 0.42 | 3.12 | 3.54 | (0.40) | (0.12) | (0.52) |
| Year Ended 8/31/2016 | $35.80 | 0.38 | 2.62 | 3.00 | (0.58) | (0.68) | (1.26) |
| Year Ended 8/31/2015 | $37.01 | 0.75 (d) | (0.23) | 0.52 | (0.40) | (1.33) | (1.73) |
| Year Ended 8/31/2014 | $31.83 | 0.32 | 5.16 | 5.48 | (0.30) | — | (0.30) |
| Advisor Class |
| Year Ended 8/31/2018 | $40.87 | 0.58 | 2.59 | 3.17 | (0.56) | (0.62) | (1.18) |
| Year Ended 8/31/2017 | $37.82 | 0.53 | 3.14 | 3.67 | (0.50) | (0.12) | (0.62) |
| Year Ended 8/31/2016 | $36.06 | 0.48 | 2.63 | 3.11 | (0.67) | (0.68) | (1.35) |
| Year Ended 8/31/2015 | $37.27 | 0.88 (d) | (0.27) | 0.61 | (0.49) | (1.33) | (1.82) |
| Year Ended 8/31/2014 | $32.03 | 0.42 | 5.18 | 5.60 | (0.38) | — | (0.38) |
| Class C |
| Year Ended 8/31/2018 | $40.42 | 0.17 | 2.56 | 2.73 | (0.15) | (0.62) | (0.77) |
| Year Ended 8/31/2017 | $37.42 | 0.14 | 3.10 | 3.24 | (0.12) | (0.12) | (0.24) |
| Year Ended 8/31/2016 | $35.68 | 0.11 | 2.62 | 2.73 | (0.31) | (0.68) | (0.99) |
| Year Ended 8/31/2015 | $36.92 | 0.56 (d) | (0.32) | 0.24 | (0.15) | (1.33) | (1.48) |
| Year Ended 8/31/2014 | $31.75 | 0.07 | 5.14 | 5.21 | (0.05) | — | (0.05) |
| Institutional Class |
| Year Ended 8/31/2018 | $40.50 | 0.58 | 2.57 | 3.15 | (0.56) | (0.62) | (1.18) |
| Year Ended 8/31/2017 | $37.48 | 0.53 | 3.11 | 3.64 | (0.50) | (0.12) | (0.62) |
| Year Ended 8/31/2016 | $35.75 | 0.47 | 2.61 | 3.08 | (0.67) | (0.68) | (1.35) |
| Year Ended 8/31/2015 | $36.96 | 0.83 (d) | (0.22) | 0.61 | (0.49) | (1.33) | (1.82) |
| Year Ended 8/31/2014 | $31.78 | 0.41 | 5.15 | 5.56 | (0.38) | — | (0.38) |
| Institutional 2 Class |
| Year Ended 8/31/2018 | $40.53 | 0.60 | 2.57 | 3.17 | (0.58) | (0.62) | (1.20) |
| Year Ended 8/31/2017 | $37.51 | 0.55 | 3.12 | 3.67 | (0.53) | (0.12) | (0.65) |
| Year Ended 8/31/2016 | $35.78 | 0.51 | 2.60 | 3.11 | (0.70) | (0.68) | (1.38) |
| Year Ended 8/31/2015 | $36.99 | 0.97 (d) | (0.32) | 0.65 | (0.53) | (1.33) | (1.86) |
| Year Ended 8/31/2014 | $31.80 | 0.45 | 5.14 | 5.59 | (0.42) | — | (0.42) |
| Institutional 3 Class |
| Year Ended 8/31/2018 | $40.88 | 0.63 | 2.59 | 3.22 | (0.60) | (0.62) | (1.22) |
| Year Ended 8/31/2017 | $37.83 | 0.57 | 3.15 | 3.72 | (0.55) | (0.12) | (0.67) |
| Year Ended 8/31/2016 | $36.07 | 0.53 | 2.63 | 3.16 | (0.72) | (0.68) | (1.40) |
| Year Ended 8/31/2015 | $37.28 | 1.21 (d) | (0.54) | 0.67 | (0.55) | (1.33) | (1.88) |
| Year Ended 8/31/2014 | $32.04 | 0.47 | 5.19 | 5.66 | (0.44) | — | (0.44) |
The accompanying Notes to Financial Statements are an integral part of this statement.
| 36 | Columbia Balanced Fund | Annual Report 2018 |
Financial Highlights (continued)
| | Reimbursement
from affiliate | Net
asset
value,
end of
period | Total
return | Total gross
expense
ratio to
average
net assets(a) | Total net
expense
ratio to
average
net assets(a),(b) | Net investment
income
ratio to
average
net assets | Portfolio
turnover | Net
assets,
end of
period
(000’s) |
| Class A |
| Year Ended 8/31/2018 | — | $42.53 | 7.63% | 0.95% | 0.95% (c) | 1.16% | 76% | $2,798,246 |
| Year Ended 8/31/2017 | — | $40.56 | 9.54% | 0.97% | 0.97% (c) | 1.10% | 63% | $2,876,519 |
| Year Ended 8/31/2016 | — | $37.54 | 8.60% | 1.03% | 1.03% (c) | 1.06% | 60% | $2,960,832 |
| Year Ended 8/31/2015 | — | $35.80 | 1.38% | 1.06% | 1.06% (c) | 2.03% | 102% | $1,885,538 |
| Year Ended 8/31/2014 | — | $37.01 | 17.29% | 1.09% | 1.09% (c) | 0.94% | 109% | $1,344,071 |
| Advisor Class |
| Year Ended 8/31/2018 | — | $42.86 | 7.89% | 0.70% | 0.70% (c) | 1.41% | 76% | $262,644 |
| Year Ended 8/31/2017 | — | $40.87 | 9.82% | 0.72% | 0.72% (c) | 1.37% | 63% | $318,026 |
| Year Ended 8/31/2016 | — | $37.82 | 8.86% | 0.78% | 0.78% (c) | 1.33% | 60% | $112,108 |
| Year Ended 8/31/2015 | — | $36.06 | 1.62% | 0.81% | 0.81% (c) | 2.37% | 102% | $38,489 |
| Year Ended 8/31/2014 | 0.02 | $37.27 | 17.64% (e) | 0.84% | 0.84% (c) | 1.21% | 109% | $15,596 |
| Class C |
| Year Ended 8/31/2018 | — | $42.38 | 6.83% | 1.70% | 1.70% (c) | 0.42% | 76% | $1,591,465 |
| Year Ended 8/31/2017 | — | $40.42 | 8.71% | 1.72% | 1.72% (c) | 0.35% | 63% | $1,536,796 |
| Year Ended 8/31/2016 | — | $37.42 | 7.80% | 1.78% | 1.78% (c) | 0.32% | 60% | $1,265,079 |
| Year Ended 8/31/2015 | — | $35.68 | 0.63% | 1.81% | 1.81% (c) | 1.52% | 102% | $612,243 |
| Year Ended 8/31/2014 | 0.01 | $36.92 | 16.44% (f) | 1.84% | 1.84% (c) | 0.19% | 109% | $295,665 |
| Institutional Class |
| Year Ended 8/31/2018 | — | $42.47 | 7.91% | 0.70% | 0.70% (c) | 1.42% | 76% | $1,872,366 |
| Year Ended 8/31/2017 | — | $40.50 | 9.83% | 0.72% | 0.72% (c) | 1.36% | 63% | $1,753,306 |
| Year Ended 8/31/2016 | — | $37.48 | 8.85% | 0.78% | 0.78% (c) | 1.32% | 60% | $867,554 |
| Year Ended 8/31/2015 | — | $35.75 | 1.64% | 0.81% | 0.81% (c) | 2.24% | 102% | $480,162 |
| Year Ended 8/31/2014 | — | $36.96 | 17.60% | 0.84% | 0.84% (c) | 1.18% | 109% | $364,457 |
| Institutional 2 Class |
| Year Ended 8/31/2018 | — | $42.50 | 7.96% | 0.65% | 0.65% | 1.46% | 76% | $279,242 |
| Year Ended 8/31/2017 | — | $40.53 | 9.91% | 0.66% | 0.66% | 1.42% | 63% | $312,952 |
| Year Ended 8/31/2016 | — | $37.51 | 8.96% | 0.68% | 0.68% | 1.41% | 60% | $181,221 |
| Year Ended 8/31/2015 | — | $35.78 | 1.74% | 0.70% | 0.70% | 2.63% | 102% | $110,946 |
| Year Ended 8/31/2014 | 0.02 | $36.99 | 17.76% (e) | 0.73% | 0.73% | 1.30% | 109% | $47,848 |
| Institutional 3 Class |
| Year Ended 8/31/2018 | — | $42.88 | 8.01% | 0.60% | 0.60% | 1.53% | 76% | $308,783 |
| Year Ended 8/31/2017 | — | $40.88 | 9.96% | 0.61% | 0.61% | 1.47% | 63% | $190,322 |
| Year Ended 8/31/2016 | — | $37.83 | 9.02% | 0.63% | 0.63% | 1.47% | 60% | $118,553 |
| Year Ended 8/31/2015 | — | $36.07 | 1.78% | 0.66% | 0.66% | 3.27% | 102% | $65,758 |
| Year Ended 8/31/2014 | 0.02 | $37.28 | 17.84% (g) | 0.68% | 0.68% | 1.35% | 109% | $17,106 |
The accompanying Notes to Financial Statements are an integral part of this statement.
Columbia Balanced Fund | Annual Report 2018
| 37 |
Financial Highlights (continued)
| | Net asset value,
beginning of
period | Net
investment
income | Net
realized
and
unrealized
gain (loss) | Total from
investment
operations | Distributions
from net
investment
income | Distributions
from net
realized
gains | Total
distributions to
shareholders |
| Class R |
| Year Ended 8/31/2018 | $40.56 | 0.38 | 2.57 | 2.95 | (0.36) | (0.62) | (0.98) |
| Year Ended 8/31/2017 | $37.54 | 0.33 | 3.12 | 3.45 | (0.31) | (0.12) | (0.43) |
| Year Ended 8/31/2016 | $35.79 | 0.29 | 2.63 | 2.92 | (0.49) | (0.68) | (1.17) |
| Year Ended 8/31/2015 | $37.01 | 0.73 (d) | (0.31) | 0.42 | (0.31) | (1.33) | (1.64) |
| Year Ended 8/31/2014 | $31.82 | 0.24 | 5.15 | 5.39 | (0.21) | — | (0.21) |
| Class T |
| Year Ended 8/31/2018 | $40.56 | 0.49 | 2.55 | 3.04 | (0.46) | (0.62) | (1.08) |
| Year Ended 8/31/2017(h) | $38.78 | 0.20 | 1.68 | 1.88 | (0.10) | — | (0.10) |
| Notes to Financial Highlights |
| (a) | In addition to the fees and expenses that the Fund bears directly, the Fund indirectly bears a pro rata share of the fees and expenses of any other funds in which it invests. Such indirect expenses are not included in the Fund’s reported expense ratios. |
| (b) | Total net expenses include the impact of certain fee waivers/expense reimbursements made by the Investment Manager and certain of its affiliates, if applicable. |
| (c) | The benefits derived from expense reductions had an impact of less than 0.01%. |
| (d) | Net investment income per share includes special dividends. The per share effect of these dividends amounted to: |
| Year Ended | Class A | Advisor
Class | Class C | Institutional
Class | Institutional 2
Class | Institutional 3
Class | Class R |
| 08/31/2015 | $ 0.48 | $ 0.51 | $ 0.56 | $ 0.47 | $ 0.57 | $ 0.78 | $ 0.55 |
| (e) | The Fund received a payment from an affiliate. Had the Fund not received this payment, the total return would have been lower by 0.05%. |
| (f) | The Fund received a payment from an affiliate. Had the Fund not received this payment, the total return would have been lower by 0.03%. |
| (g) | The Fund received a payment from an affiliate. Had the Fund not received this payment, the total return would have been lower by 0.04%. |
| (h) | Class T shares commenced operations on April 3, 2017. Per share data and total return reflect activity from that date. |
| (i) | Annualized. |
The accompanying Notes to Financial Statements are an integral part of this statement.
| 38 | Columbia Balanced Fund | Annual Report 2018 |
Financial Highlights (continued)
| | Reimbursement
from affiliate | Net
asset
value,
end of
period | Total
return | Total gross
expense
ratio to
average
net assets(a) | Total net
expense
ratio to
average
net assets(a),(b) | Net investment
income
ratio to
average
net assets | Portfolio
turnover | Net
assets,
end of
period
(000’s) |
| Class R |
| Year Ended 8/31/2018 | — | $42.53 | 7.36% | 1.20% | 1.20% (c) | 0.91% | 76% | $133,485 |
| Year Ended 8/31/2017 | — | $40.56 | 9.27% | 1.22% | 1.22% (c) | 0.86% | 63% | $136,478 |
| Year Ended 8/31/2016 | — | $37.54 | 8.35% | 1.28% | 1.28% (c) | 0.82% | 60% | $79,917 |
| Year Ended 8/31/2015 | — | $35.79 | 1.10% | 1.31% | 1.31% (c) | 1.97% | 102% | $37,089 |
| Year Ended 8/31/2014 | 0.01 | $37.01 | 17.04% (f) | 1.34% | 1.34% (c) | 0.69% | 109% | $21,445 |
| Class T |
| Year Ended 8/31/2018 | — | $42.52 | 7.61% | 0.94% | 0.94% (c) | 1.19% | 76% | $3 |
| Year Ended 8/31/2017(h) | — | $40.56 | 4.84% | 0.97% (i) | 0.97% (c),(i) | 1.22% (i) | 63% | $3 |
The accompanying Notes to Financial Statements are an integral part of this statement.
Columbia Balanced Fund | Annual Report 2018
| 39 |
Notes to Financial Statements
August 31, 2018
Note 1. Organization
Columbia Balanced Fund (the Fund), a series of Columbia Funds Series Trust I (the Trust), is a diversified fund. The Trust is registered under the Investment Company Act of 1940, as amended (the 1940 Act), as an open-end management investment company organized as a Massachusetts business trust.
Fund shares
The Trust may issue an unlimited number of shares (without par value). Although all share classes generally have identical voting, dividend and liquidation rights, each share class votes separately when required by the Trust’s organizational documents or by law. Different share classes pay different distribution amounts to the extent the expenses of such share classes differ, and distributions in liquidation will be proportional to the net asset value of each share class. Each share class has its own expense and sales charge structure. The Fund offers each of the share classes identified below.
Class A shares are subject to a maximum front-end sales charge of 5.75% based on the initial investment amount. Class A shares purchased without an initial sales charge in accounts aggregating $1 million to $50 million at the time of purchase are subject to a contingent deferred sales charge (CDSC) if the shares are sold within 18 months after purchase, charged as follows: 1.00% CDSC if redeemed within 12 months after purchase, and 0.50% CDSC if redeemed more than 12, but less than 18, months after purchase.
Advisor Class shares are not subject to sales charges and are generally available only to omnibus retirement plans and certain investors as described in the Fund’s prospectus. Prior to November 1, 2017, Advisor Class shares were known as Class R4 shares.
Class C shares are subject to a 1.00% CDSC on shares redeemed within 12 months after purchase. Effective July 1, 2018, Class C shares will automatically convert to Class A shares of the same Fund in the month of or the month following the 10-year anniversary of the Class C shares purchase date.
Institutional Class shares are not subject to sales charges and are generally available only to eligible investors, which are subject to different investment minimums as described in the Fund’s prospectus. Prior to November 1, 2017, Institutional Class shares were known as Class Z shares.
Institutional 2 Class shares are not subject to sales charges and are generally available only to investors purchasing through authorized investment professionals and omnibus retirement plans as described in the Fund’s prospectus. Prior to November 1, 2017, Institutional 2 Class shares were known as Class R5 shares.
Institutional 3 Class shares are not subject to sales charges and are available to institutional and certain other investors as described in the Fund’s prospectus. Prior to November 1, 2017, Institutional 3 Class shares were known as Class Y shares.
The Fund no longer accepts investments by existing investors in Class K shares. When available, Class K shares were not subject to sales charges and were made available only to existing investors in Class K shares. On March 9, 2018, Class K shares were redeemed or exchanged for Advisor Class shares of the Fund in a tax free transaction that had no impact on fees and expenses paid by the shareholders.
Class R shares are not subject to sales charges and are generally available only to certain retirement plans and other investors as described in the Fund’s prospectus.
Class T shares are subject to a maximum front-end sales charge of 2.50% per transaction and must be purchased through financial intermediaries that, by written agreement with Columbia Management Investment Distributors, Inc., are specifically authorized to sell Class T shares.
| 40 | Columbia Balanced Fund | Annual Report 2018 |
Notes to Financial Statements (continued)
August 31, 2018
Note 2. Summary of significant accounting policies
Basis of preparation
The Fund is an investment company that applies the accounting and reporting guidance in the Financial Accounting Standards Board (FASB) Accounting Standards Codification Topic 946, Financial Services - Investment Companies (ASC 946). The financial statements are prepared in accordance with U.S. generally accepted accounting principles (GAAP), which requires management to make certain estimates and assumptions that affect the reported amounts of assets and liabilities, the disclosure of contingent assets and liabilities at the date of the financial statements and the reported amounts of income and expenses during the reporting period. Actual results could differ from those estimates.
The following is a summary of significant accounting policies followed by the Fund in the preparation of its financial statements.
Security valuation
All equity securities and exchange-traded funds are valued at the close of business of the New York Stock Exchange. Equity securities and exchange-traded funds are valued at the last quoted sales price on the principal exchange or market on which they trade, except for securities traded on the NASDAQ Stock Market, which are valued at the NASDAQ official close price. Unlisted securities or listed securities for which there were no sales during the day are valued at the mean of the latest quoted bid and ask prices on such exchanges or markets.
Debt securities generally are valued by pricing services approved by the Board of Trustees based upon market transactions for normal, institutional-size trading units of similar securities. The services may use various pricing techniques that take into account, as applicable, factors such as yield, quality, coupon rate, maturity, type of issue, trading characteristics and other data, as well as approved independent broker-dealer quotes. Debt securities for which quotations are not readily available or not believed to be reflective of market value may also be valued based upon a bid quote from an approved independent broker-dealer. Debt securities maturing in 60 days or less are valued primarily at amortized cost value, unless this method results in a valuation that management believes does not approximate market value.
Asset- and mortgage-backed securities are generally valued by pricing services, which utilize pricing models that incorporate the securities’ cash flow and loan performance data. These models also take into account available market data, including trades, market quotations, and benchmark yield curves for identical or similar securities. Factors used to identify similar securities may include, but are not limited to, issuer, collateral type, vintage, prepayment speeds, collateral performance, credit ratings, credit enhancement and expected life. Asset-backed securities for which quotations are readily available may also be valued based upon an over-the-counter or exchange bid quote from an approved independent broker-dealer.
Senior loan securities for which reliable market quotations are readily available are generally valued by pricing services at the average of the bids received.
Foreign equity securities are valued based on the closing price on the foreign exchange in which such securities are primarily traded. If any foreign equity security closing prices are not readily available, the securities are valued at the mean of the latest quoted bid and ask prices on such exchanges or markets. Foreign currency exchange rates are generally determined at 4:00 p.m. Eastern (U.S.) time. Many securities markets and exchanges outside the U.S. close prior to the close of the New York Stock Exchange; therefore, the closing prices for securities in such markets or on such exchanges may not fully reflect events that occur after such close but before the close of the New York Stock Exchange. In those situations, foreign securities will be fair valued pursuant to a policy adopted by the Board of Trustees, including, if available, utilizing a third party pricing service to determine these fair values. The third party pricing service takes into account multiple factors, including, but not limited to, movements in the U.S. securities markets, certain depositary receipts, futures contracts and foreign exchange rates that have occurred subsequent to the close of the foreign exchange or market, to determine a good faith estimate that reasonably reflects the current market conditions as of the close of the New York Stock Exchange. The fair value of a security is likely to be different from the quoted or published price, if available.
Investments in open-end investment companies, including money market funds, are valued at their latest net asset value.
Columbia Balanced Fund | Annual Report 2018
| 41 |
Notes to Financial Statements (continued)
August 31, 2018
Futures and options on futures contracts are valued based upon the settlement price at the close of regular trading on their principal exchanges or, in the absence of transactions, at the mean of the latest quoted bid and ask prices.
Investments for which market quotations are not readily available, or that have quotations which management believes are not reflective of market value or reliable, are valued at fair value as determined in good faith under procedures approved by and under the general supervision of the Board of Trustees. If a security or class of securities (such as foreign securities) is valued at fair value, such value is likely to be different from the quoted or published price for the security.
The determination of fair value often requires significant judgment. To determine fair value, management may use assumptions including but not limited to future cash flows and estimated risk premiums. Multiple inputs from various sources may be used to determine fair value.
GAAP requires disclosure regarding the inputs and valuation techniques used to measure fair value and any changes in valuation inputs or techniques. In addition, investments shall be disclosed by major category. This information is disclosed following the Fund’s Portfolio of Investments.
Foreign currency transactions and translations
The values of all assets and liabilities denominated in foreign currencies are generally translated into U.S. dollars at exchange rates determined at the close of regular trading on the New York Stock Exchange. Net realized and unrealized gains (losses) on foreign currency transactions and translations include gains (losses) arising from the fluctuation in exchange rates between trade and settlement dates on securities transactions, gains (losses) arising from the disposition of foreign currency and currency gains (losses) between the accrual and payment dates on dividends, interest income and foreign withholding taxes.
For financial statement purposes, the Fund does not distinguish that portion of gains (losses) on investments which is due to changes in foreign exchange rates from that which is due to changes in market prices of the investments. Such fluctuations are included with the net realized and unrealized gains (losses) on investments in the Statement of Operations.
Derivative instruments
The Fund invests in certain derivative instruments, as detailed below, to meet its investment objectives. Derivatives are instruments whose values depend on, or are derived from, in whole or in part, the value of one or more securities, currencies, commodities, indices, or other assets or instruments. Derivatives may be used to increase investment flexibility (including to maintain cash reserves while maintaining desired exposure to certain assets), for risk management (hedging) purposes, to facilitate trading, to reduce transaction costs and to pursue higher investment returns. The Fund may also use derivative instruments to mitigate certain investment risks, such as foreign currency exchange rate risk, interest rate risk and credit risk. Derivatives may involve various risks, including the potential inability of the counterparty to fulfill its obligations under the terms of the contract, the potential for an illiquid secondary market (making it difficult for the Fund to sell or terminate, including at favorable prices) and the potential for market movements which may expose the Fund to gains or losses in excess of the amount shown in the Statement of Assets and Liabilities. The notional amounts of derivative instruments, if applicable, are not recorded in the financial statements.
A derivative instrument may suffer a marked-to-market loss if the value of the contract decreases due to an unfavorable change in the market rates or values of the underlying instrument. Losses can also occur if the counterparty does not perform its obligations under the contract. The Fund’s risk of loss from counterparty credit risk on over-the-counter derivatives is generally limited to the aggregate unrealized gain netted against any collateral held by the Fund and the amount of any variation margin held by the counterparty, plus any replacement costs or related amounts. With exchange-traded or centrally cleared derivatives, there is reduced counterparty credit risk to the Fund since the clearinghouse or central counterparty (CCP) provides some protection in the case of clearing member default. The clearinghouse or CCP stands between the buyer and the seller of the contract; therefore, additional counterparty credit risk is failure of the clearinghouse or CCP. However, credit risk still exists in exchange-traded or centrally cleared derivatives with respect to initial and variation margin that is held in a broker’s customer account. While brokers are required to segregate customer margin from their own assets, in the event that a broker becomes insolvent or goes into bankruptcy and at that time there is a shortfall in the aggregate amount of margin held by the broker for all its clients, U.S. bankruptcy laws will typically allocate that shortfall on a pro-rata basis across all the broker’s customers (including the Fund), potentially resulting in losses to the Fund.
| 42 | Columbia Balanced Fund | Annual Report 2018 |
Notes to Financial Statements (continued)
August 31, 2018
In order to better define its contractual rights and to secure rights that will help the Fund mitigate its counterparty risk, the Fund may enter into an International Swaps and Derivatives Association, Inc. Master Agreement (ISDA Master Agreement) or similar agreement with its derivatives contract counterparties. An ISDA Master Agreement is an agreement between the Fund and a counterparty that governs over-the-counter derivatives and typically contains, among other things, collateral posting terms and netting provisions in the event of a default and/or termination event. Under an ISDA Master Agreement, the Fund may, under certain circumstances, offset with the counterparty certain derivative instrument’s payables and/or receivables with collateral held and/or posted and create one single net payment. The provisions of the ISDA Master Agreement typically permit a single net payment in the event of default (close-out netting), including the bankruptcy or insolvency of the counterparty. Note, however, that bankruptcy or insolvency laws of a particular jurisdiction may impose restrictions on or prohibitions against the right of offset or netting in bankruptcy, insolvency or other events.
Collateral (margin) requirements differ by type of derivative. Margin requirements are established by the clearinghouse or CCP for exchange-traded and centrally cleared derivatives. Brokers can ask for margin in excess of the minimum in certain circumstances. Collateral terms are contract specific for over-the-counter derivatives. For over-the-counter derivatives traded under an ISDA Master Agreement, the collateral requirements are typically calculated by netting the marked-to-market amount for each transaction under such agreement and comparing that amount to the value of any variation margin currently pledged by the Fund and/or the counterparty. Generally, the amount of collateral due from or to a party has to exceed a minimum transfer amount threshold (e.g., $250,000) before a transfer has to be made. To the extent amounts due to the Fund from its counterparties are not fully collateralized, contractually or otherwise, the Fund bears the risk of loss from counterparty nonperformance. The Fund may also pay interest expense on cash collateral received from the broker. Any interest expense paid by the Fund is shown on the Statement of Operations. The Fund attempts to mitigate counterparty risk by only entering into agreements with counterparties that it believes have the financial resources to honor their obligations and by monitoring the financial stability of those counterparties.
Certain ISDA Master Agreements allow counterparties of over-the-counter derivatives transactions to terminate derivatives contracts prior to maturity in the event the Fund’s net asset value declines by a stated percentage over a specified time period or if the Fund fails to meet certain terms of the ISDA Master Agreement, which would cause the Fund to accelerate payment of any net liability owed to the counterparty. The Fund also has termination rights if the counterparty fails to meet certain terms of the ISDA Master Agreement. In determining whether to exercise such termination rights, the Fund would consider, in addition to counterparty credit risk, whether termination would result in a net liability owed from the counterparty.
For financial reporting purposes, the Fund does not offset derivative assets and derivative liabilities that are subject to netting arrangements in the Statement of Assets and Liabilities.
Futures contracts
Futures contracts are exchange-traded and represent commitments for the future purchase or sale of an asset at a specified price on a specified date. The Fund bought and sold futures contracts to manage the duration and yield curve exposure of the Fund versus the benchmark and to manage exposure to movements in interest rates. These instruments may be used for other purposes in future periods. Upon entering into futures contracts, the Fund bears risks that it may not achieve the anticipated benefits of the futures contracts and may realize a loss. Additional risks include counterparty credit risk, the possibility of an illiquid market, and that a change in the value of the contract or option may not correlate with changes in the value of the underlying asset.
Upon entering into a futures contract, the Fund deposits cash or securities with the broker, known as a futures commission merchant (FCM), in an amount sufficient to meet the initial margin requirement. The initial margin deposit must be maintained at an established level over the life of the contract. Cash deposited as initial margin is recorded in the Statement of Assets and Liabilities as margin deposits. Securities deposited as initial margin are designated in the Portfolio of Investments. Subsequent payments (variation margin) are made or received by the Fund each day. The variation margin payments are equal to the daily change in the contract value and are recorded as variation margin receivable or payable and are offset in unrealized gains or losses. The Fund recognizes a realized gain or loss when the contract is closed or expires. Futures contracts involve, to varying degrees, risk of loss in excess of the variation margin disclosed in the Statement of Assets and Liabilities.
Columbia Balanced Fund | Annual Report 2018
| 43 |
Notes to Financial Statements (continued)
August 31, 2018
Effects of derivative transactions in the financial statements
The following tables are intended to provide additional information about the effect of derivatives on the financial statements of the Fund, including: the fair value of derivatives by risk category and the location of those fair values in the Statement of Assets and Liabilities; and the impact of derivative transactions over the period in the Statement of Operations, including realized and unrealized gains (losses). The derivative instrument schedules following the Portfolio of Investments present additional information regarding derivative instruments outstanding at the end of the period, if any.
The following table is a summary of the fair value of derivative instruments (not considered to be hedging instruments for accounting disclosure purposes) at August 31, 2018:
| | Liability derivatives | |
Risk exposure
category | Statement
of assets and liabilities
location | Fair value ($) |
| Interest rate risk | Net assets — unrealized depreciation on futures contracts | 86,177* |
| * | Includes cumulative appreciation (depreciation) as reported in the tables following the Portfolio of Investments. Only the current day’s variation margin is reported in receivables or payables in the Statement of Assets and Liabilities. |
The following table indicates the effect of derivative instruments (not considered to be hedging instruments for accounting disclosure purposes) in the Statement of Operations for the year ended August 31, 2018:
| Amount of realized gain (loss) on derivatives recognized in income |
| Risk exposure category | Futures
contracts
($) |
| Interest rate risk | (3,984,184) |
| |
| Change in unrealized appreciation (depreciation) on derivatives recognized in income |
| Risk exposure category | Futures
contracts
($) |
| Interest rate risk | (239,890) |
The following table is a summary of the average outstanding volume by derivative instrument for the year ended August 31, 2018:
| Derivative instrument | Average notional
amounts ($)* |
| Futures contracts — long | 97,684,234 |
| * | Based on the ending quarterly outstanding amounts for the year ended August 31, 2018. |
Investments in senior loans
The Fund may invest in senior loan assignments. When the Fund purchases an assignment of a senior loan, the Fund typically has direct rights against the borrower; provided, however, that the Fund’s rights may be more limited than the lender from which it acquired the assignment and the Fund may be able to enforce its rights only through an administrative agent. Although certain senior loan assignments are secured by collateral, the Fund could experience delays or limitations in realizing such collateral or have its interest subordinated to other indebtedness of the obligor. In the event that the administrator or collateral agent of a loan becomes insolvent or enters into receivership or bankruptcy, the Fund may incur costs and delays in realizing payment or may suffer a loss of principal and/or interest. The risk of loss is greater for unsecured or subordinated loans. In addition, senior loan assignments are vulnerable to market, economic or other conditions or events that may reduce the demand for senior loan assignments and certain senior loan assignments which were liquid when purchased, may become illiquid.
| 44 | Columbia Balanced Fund | Annual Report 2018 |
Notes to Financial Statements (continued)
August 31, 2018
The Fund may enter into senior loan assignments where all or a portion of the loan may be unfunded. The Fund is obligated to fund these commitments at the borrower’s discretion. These commitments, if any, are generally traded and priced in the same manner as other senior loan securities and are disclosed as unfunded senior loan commitments in the Fund’s Portfolio of Investments with a corresponding payable for investments purchased. The Fund designates cash or liquid securities to cover these commitments.
Asset- and mortgage-backed securities
The Fund may invest in asset-backed and mortgage-backed securities. The maturity dates shown represent the original maturity of the underlying obligation. Actual maturity may vary based upon prepayment activity on these obligations. All, or a portion, of the obligation may be prepaid at any time because the underlying asset may be prepaid. As a result, decreasing market interest rates could result in an increased level of prepayment. An increased prepayment rate will have the effect of shortening the maturity of the security. Unless otherwise noted, the coupon rates presented are fixed rates.
Delayed delivery securities
The Fund may trade securities on other than normal settlement terms, including securities purchased or sold on a “when-issued” or "forward commitment" basis. This may increase risk to the Fund since the other party to the transaction may fail to deliver, which could cause the Fund to subsequently invest at less advantageous prices. The Fund designates cash or liquid securities in an amount equal to the delayed delivery commitment.
To be announced securities
The Fund may trade securities on a To Be Announced (TBA) basis. As with other delayed-delivery transactions, a seller agrees to issue a TBA security at a future date. However, the seller does not specify the particular securities to be delivered. Instead, the Fund agrees to accept any security that meets specified terms.
In some cases, Master Securities Forward Transaction Agreements (MSFTAs) may be used to govern transactions of certain forward-settling agency mortgage-backed securities, such as delayed-delivery and TBAs, between the Fund and counterparty. The MSFTA maintains provisions for, among other things, initiation and confirmation, payment and transfer, events of default, termination, and maintenance of collateral relating to such transactions.
Mortgage dollar roll transactions
The Fund may enter into mortgage “dollar rolls” in which the Fund sells securities for delivery in the current month and simultaneously contracts with the same counterparty to repurchase similar but not identical securities (same type, coupon and maturity) on a specified future date. During the roll period, the Fund loses the right to receive principal and interest paid on the securities sold. However, the Fund will benefit because it receives negotiated amounts in the form of reductions of the purchase price for the future purchase plus the interest earned on the cash proceeds of the securities sold until the settlement date of the forward purchase. The Fund records the incremental difference between the forward purchase and sale of each forward roll as a realized gain or loss. Unless any realized gains exceed the income, capital appreciation, and gain or loss due to mortgage prepayments that would have been realized on the securities sold as part of the mortgage dollar roll, the use of this technique will diminish the investment performance of the Fund compared to what the performance would have been without the use of mortgage dollar rolls. All cash proceeds will be invested in instruments that are permissible investments for the Fund. The Fund identifies cash or liquid securities in an amount equal to the forward purchase price.
For financial reporting and tax purposes, the Fund treats “to be announced” mortgage dollar rolls as two separate transactions, one involving the purchase of a security and a separate transaction involving a sale. These transactions may increase the Fund’s portfolio turnover rate. The Fund does not currently enter into mortgage dollar rolls that are accounted for as financing transactions.
Mortgage dollar rolls involve the risk that the market value of the securities the Fund is obligated to repurchase may decline below the repurchase price, or that the counterparty may default on its obligations.
Columbia Balanced Fund | Annual Report 2018
| 45 |
Notes to Financial Statements (continued)
August 31, 2018
Treasury inflation protected securities
The Fund may invest in treasury inflation protected securities (TIPS). The principal amount of TIPS is adjusted periodically and is increased for inflation or decreased for deflation based on a monthly published index. These adjustments are recorded as interest income in the Statement of Operations. Coupon payments are based on the adjusted principal at the time the interest is paid.
Security transactions
Security transactions are accounted for on the trade date. Cost is determined and gains (losses) are based upon the specific identification method for both financial statement and federal income tax purposes.
The trade date for senior loans purchased in the primary market is the date on which the loan is allocated. The trade date for senior loans purchased in the secondary market is the date on which the transaction is entered into.
Income recognition
Interest income is recorded on an accrual basis. Market premiums and discounts, including original issue discounts, are amortized and accreted, respectively, over the expected life of the security on all debt securities, unless otherwise noted. The Fund classifies gains and losses realized on prepayments received on mortgage-backed securities as adjustments to interest income.
The Fund may place a debt security on non-accrual status and reduce related interest income when it becomes probable that the interest will not be collected and the amount of uncollectible interest can be reasonably estimated. A defaulted debt security is removed from non-accrual status when the issuer resumes interest payments or when collectibility of interest is reasonably assured.
Corporate actions and dividend income are generally recorded net of any non-reclaimable tax withholdings, on the ex-dividend date or upon receipt of ex-dividend notification in the case of certain foreign securities.
The Fund may receive distributions from holdings in equity securities, business development companies (BDCs), exchange-traded funds (ETFs), limited partnerships (LPs), other regulated investment companies (RICs), and real estate investment trusts (REITs), which report information on the tax character of their distributions annually. These distributions are allocated to dividend income, capital gain and return of capital based on actual information reported. Return of capital is recorded as a reduction of the cost basis of securities held. If the Fund no longer owns the applicable securities, return of capital is recorded as a realized gain. With respect to REITs, to the extent actual information has not yet been reported, estimates for return of capital are made by the Fund’s management. Management’s estimates are subsequently adjusted when the actual character of the distributions is disclosed by the REITs, which could result in a proportionate change in return of capital to shareholders.
Awards from class action litigation are recorded as a reduction of cost basis if the Fund still owns the applicable securities on the payment date. If the Fund no longer owns the applicable securities, the proceeds are recorded as realized gains.
The value of additional securities received as an income payment through a payment in kind, if any, is recorded as interest income and increases the cost basis of such securities.
The Fund may receive other income from senior loans, including amendment fees, consent fees and commitment fees. These fees are recorded as income when received by the Fund. These amounts are included in Interest Income in the Statement of Operations.
Expenses
General expenses of the Trust are allocated to the Fund and other funds of the Trust based upon relative net assets or other expense allocation methodologies determined by the nature of the expense. Expenses directly attributable to the Fund are charged to the Fund. Expenses directly attributable to a specific class of shares are charged to that share class.
| 46 | Columbia Balanced Fund | Annual Report 2018 |
Notes to Financial Statements (continued)
August 31, 2018
Determination of class net asset value
All income, expenses (other than class-specific expenses, which are charged to that share class, as shown in the Statement of Operations) and realized and unrealized gains (losses) are allocated to each class of the Fund on a daily basis, based on the relative net assets of each class, for purposes of determining the net asset value of each class.
Federal income tax status
The Fund intends to qualify each year as a regulated investment company under Subchapter M of the Internal Revenue Code, as amended, and will distribute substantially all of its investment company taxable income and net capital gain, if any, for its tax year, and as such will not be subject to federal income taxes. In addition, the Fund intends to distribute in each calendar year substantially all of its ordinary income, capital gain net income and certain other amounts, if any, such that the Fund should not be subject to federal excise tax. Therefore, no federal income or excise tax provision is recorded.
Foreign taxes
The Fund may be subject to foreign taxes on income, gains on investments or currency repatriation, a portion of which may be recoverable. The Fund will accrue such taxes and recoveries, as applicable, based upon its current interpretation of tax rules and regulations that exist in the markets in which it invests.
Realized gains in certain countries may be subject to foreign taxes at the Fund level, based on statutory rates. The Fund accrues for such foreign taxes on realized and unrealized gains at the appropriate rate for each jurisdiction, as applicable. The amount, if any, is disclosed as a liability on the Statement of Assets and Liabilities.
Distributions to shareholders
Distributions from net investment income, if any, are declared and paid each calendar quarter. Net realized capital gains, if any, are distributed at least annually. Income distributions and capital gain distributions are determined in accordance with federal income tax regulations, which may differ from GAAP.
Guarantees and indemnifications
Under the Trust’s organizational documents and, in some cases, by contract, its officers and trustees are indemnified against certain liabilities arising out of the performance of their duties to the Trust or its funds. In addition, certain of the Fund’s contracts with its service providers contain general indemnification clauses. The Fund’s maximum exposure under these arrangements is unknown since the amount of any future claims that may be made against the Fund cannot be determined, and the Fund has no historical basis for predicting the likelihood of any such claims.
Recent accounting pronouncement
Accounting Standards Update 2017-08 Premium Amortization on Purchased Callable Debt Securities
In March 2017, the Financial Accounting Standards Board issued Accounting Standards Update (ASU) No. 2017-08 Premium Amortization on Purchased Callable Debt Securities. ASU No. 2017-08 updates the accounting standards to shorten the amortization period for certain purchased callable debt securities, held at a premium, to be amortized to the earliest call date. The update applies to securities with explicit, noncontingent call features that are callable at fixed prices and on preset dates. The standard is effective for annual periods beginning after December 15, 2018 and interim periods within those fiscal years. At this time, management is evaluating the implication of this guidance and the impact it will have on the financial statement amounts and footnote disclosures, if any.
Note 3. Fees and other transactions with affiliates
Management services fees
The Fund has entered into a Management Agreement with Columbia Management Investment Advisers, LLC (the Investment Manager), a wholly-owned subsidiary of Ameriprise Financial, Inc. (Ameriprise Financial). Under the Management Agreement, the Investment Manager provides the Fund with investment research and advice, as well as administrative and accounting
Columbia Balanced Fund | Annual Report 2018
| 47 |
Notes to Financial Statements (continued)
August 31, 2018
services. The management services fee is an annual fee that is equal to a percentage of the Fund’s daily net assets that declines from 0.72% to 0.52% as the Fund’s net assets increase. The effective management services fee rate for the year ended August 31, 2018 was 0.57% of the Fund’s average daily net assets.
Compensation of board members
Members of the Board of Trustees who are not officers or employees of the Investment Manager or Ameriprise Financial are compensated for their services to the Fund as disclosed in the Statement of Operations. These members of the Board of Trustees may participate in a Deferred Compensation Plan (the Plan) which may be terminated at any time. Obligations of the Plan will be paid solely out of the Fund’s assets, and all amounts payable under the Plan constitute a general unsecured obligation of the Fund.
Compensation of Chief Compliance Officer
The Board of Trustees has appointed a Chief Compliance Officer to the Fund in accordance with federal securities regulations. As disclosed in the Statement of Operations, a portion of the Chief Compliance Officer’s total compensation is allocated to the Fund, along with other allocations to affiliated funds governed by the Board of Trustees, based on relative net assets.
Transfer agency fees
Under a Transfer and Dividend Disbursing Agent Agreement, Columbia Management Investment Services Corp. (the Transfer Agent), an affiliate of the Investment Manager and a wholly-owned subsidiary of Ameriprise Financial, is responsible for providing transfer agency services to the Fund. The Transfer Agent has contracted with DST Asset Manager Solutions, Inc. (DST) to serve as sub-transfer agent. The Transfer Agent pays the fees of DST for services as sub-transfer agent and DST is not entitled to reimbursement for such fees from the Fund (with the exception of out-of-pocket fees).
The Fund pays the Transfer Agent a monthly transfer agency fee based on the number or the average value of accounts, depending on the type of account. In addition, the Fund pays the Transfer Agent a fee for shareholder services based on the number of accounts or on a percentage of the average aggregate value of the Fund’s shares maintained in omnibus accounts up to the lesser of the amount charged by the financial intermediary or a cap established by the Board of Trustees from time to time.
The Transfer Agent also receives compensation from the Fund for various shareholder services and reimbursements for certain out-of-pocket fees. Total transfer agency fees for Class K, Institutional 2 Class and Institutional 3 Class shares are subject to an annual limitation of not more than 0.07%, 0.07% and 0.02%, respectively, of the average daily net assets attributable to each share class.
For the year ended August 31, 2018, the Fund’s effective transfer agency fee rates as a percentage of average daily net assets of each class were as follows:
| | Effective rate (%) |
| Class A | 0.11 |
| Advisor Class | 0.11 |
| Class C | 0.11 |
| Institutional Class | 0.11 |
| Institutional 2 Class | 0.06 |
| Institutional 3 Class | 0.01 |
| Class K | 0.03 (a) |
| Class R | 0.11 |
| Class T | 0.14 |
The Fund and certain other associated investment companies have severally, but not jointly, guaranteed the performance and observance of all the terms and conditions of a lease entered into by Seligman Data Corp. (SDC), the former transfer agent, including the payment of rent by SDC (the Guaranty). SDC was the legacy Seligman funds’ former transfer agent.
| 48 | Columbia Balanced Fund | Annual Report 2018 |
Notes to Financial Statements (continued)
August 31, 2018
The lease and the Guaranty expire in January 2019. At August 31, 2018, the Fund’s total potential future obligation over the life of the Guaranty is $3,659. The liability remaining at August 31, 2018 for non-recurring charges associated with the lease amounted to $1,467 and is recorded as a part of the payable for other expenses in the Statement of Assets and Liabilities. SDC is owned by six associated investment companies, including the Fund. The Fund’s ownership interest in SDC at August 31, 2018 is recorded as a part of other assets in the Statement of Assets and Liabilities at a cost of $3,553, which approximates the fair value of the ownership interest.
An annual minimum account balance fee of $20 may apply to certain accounts with a value below the applicable share class’s initial minimum investment requirements to reduce the impact of small accounts on transfer agency fees. These minimum account balance fees are remitted to the Fund and recorded as part of expense reductions in the Statement of Operations. For the year ended August 31, 2018, these minimum account balance fees reduced total expenses of the Fund by $2,297.
Plan administration fees
Under a Plan Administration Services Agreement with the Transfer Agent, the Fund paid an annual fee at a rate of 0.25% of the Fund’s average daily net assets attributable to Class K shares for the provision of various administrative, recordkeeping, communication and educational services. As a result of all Class K shares of the Fund being redeemed or exchanged for Advisor Class shares, March 9, 2018 was the last day the Fund paid a plan administration fee for Class K shares.
Distribution and service fees
The Fund has entered into an agreement with Columbia Management Investment Distributors, Inc. (the Distributor), an affiliate of the Investment Manager and a wholly-owned subsidiary of Ameriprise Financial, for distribution and shareholder services. The Board of Trustees has approved, and the Fund has adopted, distribution and shareholder service plans (the Plans) applicable to certain share classes, which set the distribution and service fees for the Fund. These fees are calculated daily and are intended to compensate the Distributor and/or eligible selling and/or servicing agents for selling shares of the Fund and providing services to investors.
Under the Plans, the Fund pays a monthly service fee to the Distributor at the maximum annual rate of 0.25% of the average daily net assets attributable to Class A, Class C and Class T shares of the Fund. Also under the Plans, the Fund pays a monthly distribution fee to the Distributor at the maximum annual rates of 0.10%, 0.75%, 0.50% and 0.25% of the average daily net assets attributable to Class A, Class C, Class R and Class T shares of the Fund, respectively.
Although the Fund may pay distribution and service fees up to a maximum annual rate of 0.35% of the Fund’s average daily net assets attributable to Class A shares (comprised of up to 0.10% for distribution services and up to 0.25% for shareholder liaison services), the Fund currently limits such fees to an aggregate fee of not more than 0.25% of the Fund’s average daily net assets attributable to Class A shares.
Although the Fund may pay a distribution fee up to 0.25% of the Fund’s average daily net assets attributable to Class T shares and a service fee of up to 0.25% of the Fund’s average daily net assets attributable to Class T shares, the aggregate fee shall not exceed 0.25% of the Fund’s average daily net assets attributable to Class T shares.
Sales charges (unaudited)
Sales charges, including front-end charges and CDSCs, received by the Distributor for distributing Fund shares for the year ended August 31, 2018, if any, are listed below:
| | Amount ($) |
| Class A | 6,760,202 |
| Class C | 181,054 |
Columbia Balanced Fund | Annual Report 2018
| 49 |
Notes to Financial Statements (continued)
August 31, 2018
Expenses waived/reimbursed by the Investment Manager and its affiliates
The Investment Manager and certain of its affiliates have contractually agreed to waive fees and/or reimburse expenses (excluding certain fees and expenses described below) for the period(s) disclosed below, unless sooner terminated at the sole discretion of the Board of Trustees, so that the Fund’s net operating expenses, after giving effect to fees waived/expenses reimbursed and any balance credits and/or overdraft charges from the Fund’s custodian, do not exceed the following annual rate(s) as a percentage of the class’ average daily net assets:
| | January 1, 2018
through
December 31, 2018 | Prior to
January 1, 2018 |
| Class A | 1.15% | 1.18% |
| Advisor Class | 0.90 | 0.93 |
| Class C | 1.90 | 1.93 |
| Institutional Class | 0.90 | 0.93 |
| Institutional 2 Class | 0.85 | 0.915 |
| Institutional 3 Class | 0.80 | 0.865 |
| Class R | 1.40 | 1.43 |
| Class T | 1.15 | 1.18 |
Under the agreement governing these fee waivers and/or expense reimbursement arrangements, the following fees and expenses are excluded from the waiver/reimbursement commitment, and therefore will be paid by the Fund, if applicable: taxes (including foreign transaction taxes), expenses associated with investments in affiliated and non-affiliated pooled investment vehicles (including mutual funds and exchange-traded funds), transaction costs and brokerage commissions, costs related to any securities lending program, dividend expenses associated with securities sold short, inverse floater program fees and expenses, transaction charges and interest on borrowed money, interest, infrequent and/or unusual expenses and any other expenses the exclusion of which is specifically approved by the Board of Trustees. This agreement may be modified or amended only with approval from the Investment Manager, certain of its affiliates and the Fund. Any fees waived and/or expenses reimbursed under the expense reimbursement arrangements described above are not recoverable by the Investment Manager or its affiliates in future periods.
Note 4. Federal tax information
The timing and character of income and capital gain distributions are determined in accordance with income tax regulations, which may differ from GAAP because of temporary or permanent book to tax differences.
At August 31, 2018, these differences were primarily due to differing treatment for deferral/reversal of wash sale losses, derivative investments, tax straddles, trustees’ deferred compensation, principal and/or interest from fixed income securities and foreign currency transactions. To the extent these differences were permanent, reclassifications were made among the components of the Fund’s net assets in the Statement of Assets and Liabilities. Temporary differences do not require reclassifications.
In the Statement of Assets and Liabilities the following reclassifications were made:
Undistributed net
investment
income ($) | Accumulated
net realized
gain ($) | Paid in
capital ($) |
| (337,210) | 337,210 | — |
Net investment income (loss) and net realized gains (losses), as disclosed in the Statement of Operations, and net assets were not affected by this reclassification.
| 50 | Columbia Balanced Fund | Annual Report 2018 |
Notes to Financial Statements (continued)
August 31, 2018
The tax character of distributions paid during the years indicated was as follows:
| Year Ended August 31, 2018 | Year Ended August 31, 2017 |
Ordinary
income ($) | Long-term
capital gains ($) | Total ($) | Ordinary
income ($) | Long-term
capital gains ($) | Total ($) |
| 76,672,698 | 111,477,417 | 188,150,115 | 59,845,410 | 19,167,135 | 79,012,545 |
Short-term capital gain distributions, if any, are considered ordinary income distributions for tax purposes.
At August 31, 2018, the components of distributable earnings on a tax basis were as follows:
Undistributed
ordinary income ($) | Undistributed
long-term
capital gains ($) | Capital loss
carryforwards ($) | Net unrealized
appreciation ($) |
| 21,651,807 | 213,835,506 | — | 1,231,964,799 |
At August 31, 2018, the cost of all investments for federal income tax purposes along with the aggregate gross unrealized appreciation and depreciation based on that cost was:
Federal
tax cost ($) | Gross unrealized
appreciation ($) | Gross unrealized
(depreciation) ($) | Net unrealized
appreciation ($) |
| 6,020,293,921 | 1,316,865,821 | (84,901,022) | 1,231,964,799 |
Tax cost of investments and unrealized appreciation/(depreciation) may also include timing differences that do not constitute adjustments to tax basis.
Management of the Fund has concluded that there are no significant uncertain tax positions in the Fund that would require recognition in the financial statements. However, management’s conclusion may be subject to review and adjustment at a later date based on factors including, but not limited to, new tax laws, regulations, and administrative interpretations (including relevant court decisions). Generally, the Fund’s federal tax returns for the prior three fiscal years remain subject to examination by the Internal Revenue Service.
Note 5. Portfolio information
The cost of purchases and proceeds from sales of securities, excluding short-term investments and derivatives, if any, aggregated to $5,233,376,945 and $5,376,819,704, respectively, for the year ended August 31, 2018, of which $1,625,103,750 and $1,602,139,259, respectively, were U.S. government securities. The amount of purchase and sale activity impacts the portfolio turnover rate reported in the Financial Highlights.
Note 6. Affiliated money market fund
The Fund invests in Columbia Short-Term Cash Fund, an affiliated money market fund established for the exclusive use by the Fund and other affiliated funds (the Affiliated MMF). The income earned by the Fund from such investments is included as Dividends - affiliated issuers in the Statement of Operations. As an investing fund, the Fund indirectly bears its proportionate share of the expenses of the Affiliated MMF. The Affiliated MMF prices its shares with a floating net asset value. In addition, the Board of Trustees of the Affiliated MMF may impose a fee on redemptions (sometimes referred to as a liquidity fee) or temporarily suspend redemptions (sometimes referred to as imposing a redemption gate) in the event its liquidity falls below regulatory limits.
Note 7. Interfund lending
Pursuant to an exemptive order granted by the Securities and Exchange Commission, the Fund participates in a program (the Interfund Program) allowing each participating Columbia Fund (each, a Participating Fund) to lend money directly to and, except for closed-end funds and money market funds, borrow money directly from other Participating Funds for temporary purposes. The amounts eligible for borrowing and lending under the Interfund Program are subject to certain restrictions.
Columbia Balanced Fund | Annual Report 2018
| 51 |
Notes to Financial Statements (continued)
August 31, 2018
Interfund loans are subject to the risk that the borrowing fund could be unable to repay the loan when due, and a delay in repayment to the lending fund could result in lost opportunities and/or additional lending costs. The exemptive order is subject to conditions intended to mitigate conflicts of interest arising from the Investment Manager’s relationship with each Participating Fund.
The Fund’s activity in the Interfund Program during the year ended August 31, 2018 was as follows:
| Borrower or lender | Average loan
balance ($) | Weighted average
interest rate (%) | Days
outstanding |
| Lender | 2,666,667 | 2.36 | 6 |
Interest income earned by the Fund is recorded as interfund lending on the Statement of Operations. The Fund had no outstanding interfund loans at August 31, 2018.
Note 8. Line of credit
The Fund has access to a revolving credit facility with a syndicate of banks led by Citibank, N.A., HSBC Bank USA, N.A. and JPMorgan Chase Bank, N.A. whereby the Fund may borrow for the temporary funding of shareholder redemptions or for other temporary or emergency purposes. The credit facility, which is a collective agreement between the Fund and certain other funds managed by the Investment Manager, severally and not jointly, permits collective borrowings up to $1 billion. Interest is charged to each participating fund based on its borrowings at a rate equal to the higher of (i) the overnight federal funds rate plus 1.00% or (ii) the one-month LIBOR rate plus 1.00%. Each borrowing under the credit facility matures no later than 60 days after the date of borrowing. The Fund also pays a commitment fee equal to its pro rata share of the amount of the credit facility at a rate of 0.15% per annum. The commitment fee is included in other expenses in the Statement of Operations. This agreement expires annually in December unless extended or renewed.
The Fund had no borrowings during the year ended August 31, 2018.
Note 9. Significant risks
Credit risk
Credit risk is the risk that the value of debt securities in the Fund’s portfolio may decline because the issuer may default and fail to pay interest or repay principal when due. Rating agencies assign credit ratings to debt securities to indicate their credit risk. Lower rated or unrated debt securities held by the Fund may present increased credit risk as compared to higher-rated debt securities.
Interest rate risk
Interest rate risk is the risk of losses attributable to changes in interest rates. In general, if prevailing interest rates rise, the values of debt securities tend to fall, and if interest rates fall, the values of debt securities tend to rise. Actions by governments and central banking authorities can result in increases in interest rates. Increasing interest rates may negatively affect the value of debt securities held by the Fund, resulting in a negative impact on the Fund’s performance and net asset value per share. In general, the longer the maturity or duration of a debt security, the greater its sensitivity to changes in interest rates.
Liquidity risk
Liquidity risk is the risk associated with a lack of marketability of investments which may make it difficult to sell the investment at a desirable time or price. Changing regulatory, market or other conditions or environments (for example, the interest rate or credit environments) may adversely affect the liquidity of the Fund’s investments. The Fund may have to accept a lower selling price for the holding, sell other investments, or forego another, more appealing investment opportunity. Generally, the less liquid the market at the time the Fund sells a portfolio investment, the greater the risk of loss or decline of value to the Fund. A less liquid market can lead to an increase in Fund redemptions, which may negatively impact Fund performance and net asset value per share, including, for example, if the Fund is forced to sell securities in a down market.
| 52 | Columbia Balanced Fund | Annual Report 2018 |
Notes to Financial Statements (continued)
August 31, 2018
Shareholder concentration risk
At August 31, 2018, affiliated shareholders of record owned 38.3% of the outstanding shares of the Fund in one or more accounts. Subscription and redemption activity by concentrated accounts may have a significant effect on the operations of the Fund. In the case of a large redemption, the Fund may be forced to sell investments at inopportune times, including its liquid positions, which may result in Fund losses and the Fund holding a higher percentage of less liquid positions. Large redemptions could result in decreased economies of scale and increased operating expenses for non-redeeming Fund shareholders.
Note 10. Subsequent events
Management has evaluated the events and transactions that have occurred through the date the financial statements were issued and noted no items requiring adjustment of the financial statements or additional disclosure.
Note 11. Information regarding pending and settled legal proceedings
Ameriprise Financial and certain of its affiliates have historically been involved in a number of legal, arbitration and regulatory proceedings, including routine litigation, class actions, and governmental actions, concerning matters arising in connection with the conduct of their business activities. Ameriprise Financial believes that the Fund is not currently the subject of, and that neither Ameriprise Financial nor any of its affiliates are the subject of, any pending legal, arbitration or regulatory proceedings that are likely to have a material adverse effect on the Fund or the ability of Ameriprise Financial or its affiliates to perform under their contracts with the Fund. Ameriprise Financial is required to make quarterly (10-Q), annual (10-K) and, as necessary, 8-K filings with the Securities and Exchange Commission (SEC) on legal and regulatory matters that relate to Ameriprise Financial and its affiliates. Copies of these filings may be obtained by accessing the SEC website at www.sec.gov.
There can be no assurance that these matters, or the adverse publicity associated with them, will not result in increased Fund redemptions, reduced sale of Fund shares or other adverse consequences to the Fund. Further, although we believe proceedings are not likely to have a material adverse effect on the Fund or the ability of Ameriprise Financial or its affiliates to perform under their contracts with the Fund, these proceedings are subject to uncertainties and, as such, we are unable to estimate the possible loss or range of loss that may result. An adverse outcome in one or more of these proceedings could result in adverse judgments, settlements, fines, penalties or other relief that could have a material adverse effect on the consolidated financial condition or results of operations of Ameriprise Financial.
Columbia Balanced Fund | Annual Report 2018
| 53 |
Report of Independent Registered Public Accounting Firm
To the Board of Trustees of Columbia Funds Series Trust I and Shareholders of Columbia Balanced Fund
Opinion on the Financial Statements
We have audited the accompanying statement of assets and liabilities, including the portfolio of investments, of Columbia Balanced Fund (one of the funds constituting Columbia Funds Series Trust I, hereafter referred to as the “Fund”) as of August 31, 2018, the related statement of operations for the year ended August 31, 2018, the statement of changes in net assets for each of the two years in the period ended August 31, 2018, including the related notes, and the financial highlights for each of the periods indicated therein (collectively referred to as the “financial statements”). In our opinion, the financial statements present fairly, in all material respects, the financial position of the Fund as of August 31, 2018, the results of its operations for the year then ended, the changes in its net assets for each of the two years in the period ended August 31, 2018 and the financial highlights for each of the periods indicated therein in conformity with accounting principles generally accepted in the United States of America.
Basis for Opinion
These financial statements are the responsibility of the Fund’s management. Our responsibility is to express an opinion on the Fund’s financial statements based on our audits. We are a public accounting firm registered with the Public Company Accounting Oversight Board (United States) (“PCAOB”) and are required to be independent with respect to the Fund in accordance with the U.S. federal securities laws and the applicable rules and regulations of the Securities and Exchange Commission and the PCAOB.
We conducted our audits of these financial statements in accordance with the standards of the PCAOB. Those standards require that we plan and perform the audit to obtain reasonable assurance about whether the financial statements are free of material misstatement, whether due to error or fraud.
Our audits included performing procedures to assess the risks of material misstatement of the financial statements, whether due to error or fraud, and performing procedures that respond to those risks. Such procedures included examining, on a test basis, evidence regarding the amounts and disclosures in the financial statements. Our audits also included evaluating the accounting principles used and significant estimates made by management, as well as evaluating the overall presentation of the financial statements. Our procedures included confirmation of securities owned as of August 31, 2018, by correspondence with the custodian, transfer agent, agent banks, and brokers; when replies were not received from brokers, we performed other audit procedures. We believe that our audits provide a reasonable basis for our opinion.
/s/PricewaterhouseCoopers LLP
Minneapolis, Minnesota
October 22, 2018
We have served as the auditor of one or more investment companies within the Columbia Funds Complex since 1977.
| 54 | Columbia Balanced Fund | Annual Report 2018 |
Federal Income Tax Information
(Unaudited)
The Fund hereby designates the following tax attributes for the fiscal year ended August 31, 2018. Shareholders will be notified in early 2019 of the amounts for use in preparing 2018 income tax returns.
Qualified
dividend
income | Dividends
received
deduction | Capital
gain
dividend |
| 93.62% | 88.05% | $268,497,744 |
Qualified dividend income. For taxable, non-corporate shareholders, the percentage of ordinary income distributed during the fiscal year that represents qualified dividend income subject to reduced tax rates.
Dividends received deduction. The percentage of ordinary income distributed during the fiscal year that qualifies for the corporate dividends received deduction.
Capital gain dividend. The Fund designates as a capital gain dividend the amount reflected above, or if subsequently determined to be different, the net capital gain of such fiscal period.
Columbia Balanced Fund | Annual Report 2018
| 55 |
Shareholders elect the Board that oversees the Fund’s operations. The Board appoints officers who are responsible for day-to-day business decisions based on policies set by the Board. The following table provides basic biographical information about the Fund’s Trustees, including their principal occupations during the past five years, although specific titles for individuals may have varied over the period. The year set forth beneath Length of Service in the table below is the year in which the Trustee was first appointed or elected as Trustee to any Fund currently in the Columbia Funds Complex or a predecessor thereof. Under current Board policy, members serve terms of indefinite duration.
Independent trustees
| Name, address, year of birth | Position held with the Trust and length of service | Principal occupation(s) during the past five years and other relevant professional experience | Number of Funds in the Columbia Fund Complex overseen | Other directorships held by Trustee during the past five years |
Janet Langford Carrig
c/o Columbia Management
Investment Advisers, LLC
225 Franklin Street
Mail Drop BX32 05228
Boston, MA 02110
1957 | Trustee
1996 | Senior Vice President, General Counsel and Corporate Secretary, ConocoPhillips (independent energy company) since September 2007 | 69 | None |
Douglas A. Hacker
c/o Columbia Management
Investment Advisers, LLC
225 Franklin Street
Mail Drop BX32 05228
Boston, MA 02110
1955 | Trustee and Chairman of the Board
1996 | Independent business executive since May 2006; Executive Vice President — Strategy of United Airlines from December 2002 to May 2006; President of UAL Loyalty Services (airline marketing company) from September 2001 to December 2002; Executive Vice President and Chief Financial Officer of United Airlines from July 1999 to September 2001 | 69 | Spartan Nash Company, (food distributor); Nash Finch Company (food distributor) from 2005 to 2013; Aircastle Limited (aircraft leasing); SeaCube Container Leasing Ltd. (container leasing) from 2010 to 2013; and Travelport Worldwide Limited (travel information technology) |
Nancy T. Lukitsh
c/o Columbia Management
Investment Advisers, LLC
225 Franklin Street
Mail Drop BX32 05228
Boston, MA 02110
1956 | Trustee
2011 | Senior Vice President, Partner and Director of Marketing, Wellington Management Company, LLP (investment adviser) from 1997 to 2010; Chair, Wellington Management Portfolios (commingled non-U.S. investment pools) from 2007 to 2010; Director, Wellington Trust Company, NA and other Wellington affiliates from 1997 to 2010 | 69 | None |
David M. Moffett
c/o Columbia Management
Investment Advisers, LLC
225 Franklin Street
Mail Drop BX32 05228
Boston, MA 02110
1952 | Trustee
2011 | Retired. Consultant to Bridgewater and Associates | 69 | Director, CSX Corporation (transportation suppliers); Genworth Financial, Inc. (financial and insurance products and services); PayPal Holdings Inc. (payment and data processing services); Trustee, University of Oklahoma Foundation; former Director, eBay Inc. (online trading community), 2007-2015; and former Director, CIT Bank, CIT Group Inc. (commercial and consumer finance), 2010-2016 |
| 56 | Columbia Balanced Fund | Annual Report 2018 |
TRUSTEES AND OFFICERS (continued)
Independent trustees (continued)
| Name, address, year of birth | Position held with the Trust and length of service | Principal occupation(s) during the past five years and other relevant professional experience | Number of Funds in the Columbia Fund Complex overseen | Other directorships held by Trustee during the past five years |
John J. Neuhauser
c/o Columbia Management
Investment Advisers, LLC
225 Franklin Street
Mail Drop BX32 05228
Boston, MA 02110
1943 | Trustee
1984 | President, Saint Michael’s College since August 2007; Director or Trustee of several non-profit organizations, including University of Vermont Medical Center; Academic Vice President and Dean of Faculties, Boston College from August 1999 to October 2005; University Professor, Boston College from November 2005 to August 2007 | 69 | Liberty All-Star Equity Fund and Liberty All- Star Growth Fund (closed-end funds) |
Patrick J. Simpson
c/o Columbia Management
Investment Advisers, LLC
225 Franklin Street
Mail Drop BX32 05228
Boston, MA 02110
1944 | Trustee
2000 | Of Counsel, Perkins Coie LLP (law firm) since 2015; Partner, Perkins Coie LLP from 1988 to 2014 | 69 | None |
Anne-Lee Verville
c/o Columbia Management
Investment Advisers, LLC
225 Franklin Street
Mail Drop BX32 05228
Boston, MA 02110
1945 | Trustee
1998 | Retired. General Manager, Global Education Industry from 1994 to 1997, President – Application Systems Division from 1991 to 1994, Chief Financial Officer – US Marketing & Services from 1988 to 1991, and Chief Information Officer from 1987 to 1988, IBM Corporation (computer and technology) | 69 | Enesco Group, Inc. (producer of giftware and home and garden decor products) from 2001 to 2006 |
Consultants to the Independent Trustees*
| Name, address, year of birth | Position held with the Trust and length of service | Principal occupation(s) during the past five years and other relevant professional experience | Number of Funds in the Columbia Funds complex overseen | Other directorships held by Trustee during the past five years |
J. Kevin Connaughton
c/o Columbia
Management Investment
Advisers, LLC,
225 Franklin Street
Mail Drop BX32 05228,
Boston, MA 02110
1964 | Independent Trustee Consultant
2016 | Independent Trustee Consultant, Columbia Funds since March 2016; Adjunct Professor of Finance, Bentley University since November 2017; Managing Director and General Manager of Mutual Fund Products, Columbia Management Investment Advisers, LLC from May 2010 to February 2015; President, Columbia Funds from 2009 to 2015; and senior officer of Columbia Funds and affiliated funds from 2003 to 2015 | 69 | Director, The Autism Project since March 2015; former Trustee, New Century Portfolios, March 2015-December 2017; formerly on Board of Governors, Gateway Healthcare, January 2016 – December 2017 |
Natalie A. Trunow
c/o Columbia
Management Investment
Advisers, LLC,
225 Franklin Street
Mail Drop BX32 05228,
Boston, MA 02110
1967 | Independent Trustee Consultant
2016 | Independent Trustee Consultant, Columbia Funds since September 2016; Chief Executive Officer, Millennial Portfolio Solutions LLC (asset management and consulting services) since January 2016; Director of Investments, Casey Family Programs from April 2016 to September 2016; Senior Vice President and Chief Investment Officer, Calvert Investments from August 2008 to January 2016; Section Head and Portfolio Manager, General Motors Asset Management from June 1997 to August 2008 | 69 | Director, Health Services for Children with Special Needs, Inc.; Director, Guidewell Financial Solutions |
| * | J. Kevin Connaughton was appointed consultant to the Independent Trustees effective March 1, 2016. Natalie A. Trunow was appointed consultant to the Independent Trustees effective September 1, 2016. Shareholders of the Funds are expected to be asked to elect each of Mr. Connaughton and Ms. Trunow as a Trustee at a future shareholder meeting. |
Columbia Balanced Fund | Annual Report 2018
| 57 |
TRUSTEES AND OFFICERS (continued)
Interested trustee affiliated with Investment Manager*
| Name, address, year of birth | Position held with the Trust and length of service | Principal occupation(s) during the past five years and other relevant professional experience | Number of Funds in the Columbia Funds Complex overseen | Other directorships held by Trustee during the past five years |
William F. Truscott
c/o Columbia Management
Investment Advisers, LLC
225 Franklin Street
Boston, MA 02110
1960 | Trustee
2012 | Chairman of the Board and President, Columbia Management Investment Advisers, LLC since May 2010 and February 2012, respectively; Chief Executive Officer, Global Asset Management, Ameriprise Financial, Inc. since September 2012 (previously Chief Executive Officer, U.S. Asset Management & President, Annuities, May 2010-September 2012); Director and Chief Executive Officer, Columbia Management Investment Distributors, Inc. since May 2010 and February 2012, respectively; Chairman of the Board and Chief Executive Officer, RiverSource Distributors, Inc. since 2006; Director, Threadneedle Asset Management Holdings, SARL since 2014; President and Chief Executive Officer, Ameriprise Certificate Company, 2006-August 2012 | 193 | Chairman of the Board, Columbia Management Investment Advisers, LLC since May 2010; Director, Columbia Management Investment Distributors, Inc. since May 2010; former Director, Ameriprise Certificate Company, 2006 - January 2013 |
| * | Interested person (as defined under the 1940 Act) by reason of being an officer, director, security holder and/or employee of the Investment Manager or Ameriprise Financial. |
The Statement of Additional Information has additional information about the Fund’s Board members and is available, without charge, upon request by calling 800.345.6611, visiting columbiathreadneedleus.com/investor/ or contacting your financial intermediary.
| 58 | Columbia Balanced Fund | Annual Report 2018 |
TRUSTEES AND OFFICERS (continued)
The Board has appointed officers who are responsible for day-to-day business decisions based on policies it has established. The officers serve at the pleasure of the Board. The following table provides basic information about the Officers of the Fund, including principal occupations during the past five years, although their specific titles may have varied over the period. In addition to Mr. Truscott, who is Senior Vice President, the Fund’s other officers are:
Fund officers
Name,
address and
year of birth | Position and year
first appointed to
position for any Fund
in the Columbia
Funds complex or a
predecessor thereof | Principal occupation(s) during past five years |
Christopher O. Petersen
5228 Ameriprise
Financial Center
Minneapolis, MN 55474
Born 1970 | President and Principal Executive Officer (2015) | Vice President and Lead Chief Counsel, Ameriprise Financial, Inc. since January 2015 (previously, Vice President and Chief Counsel, January 2010 - December 2014; officer of Columbia Funds and affiliated funds since 2007. |
Michael G. Clarke
225 Franklin Street
Boston, MA 02110
Born 1969 | Treasurer (2011), Chief Financial Officer (2009) and Chief Accounting Officer (2015) | Vice President — Mutual Fund Administration, Columbia Management Investment Advisers, LLC, since May 2010; senior officer of Columbia Funds and affiliated funds since 2002. |
Paul B. Goucher
100 Park Avenue
New York, NY 10017
Born 1968 | Senior Vice President (2011) and Assistant Secretary (2008) | Senior Vice President and Assistant General Counsel, Ameriprise Financial, Inc. since January 2017 (previously, Vice President and Lead Chief Counsel, November 2008 - January 2017 and January 2013 - January 2017, respectively); Vice President, Chief Legal Officer and Assistant Secretary, Columbia Management Investment Advisers, LLC since May 2010. |
Thomas P. McGuire
225 Franklin Street
Boston, MA 02110
Born 1972 | Senior Vice President and Chief Compliance Officer (2012) | Vice President — Asset Management Compliance, Ameriprise Financial, Inc., since May 2010; Chief Compliance Officer, Ameriprise Certificate Company since September 2010. |
Colin Moore
225 Franklin Street
Boston, MA 02110
Born 1958 | Senior Vice President (2010) | Executive Vice President and Global Chief Investment Officer, Ameriprise Financial, Inc., since July 2013; Executive Vice President and Global Chief Investment Officer, Columbia Management Investment Advisers, LLC since July 2013. |
Ryan C. Larrenaga
225 Franklin Street
Boston, MA 02110
Born 1970 | Senior Vice President (2017), Chief Legal Officer (2017) and Secretary (2015) | Vice President and Chief Counsel, Ameriprise Financial, Inc. since August 2018 (previously, Vice President and Group Counsel, August 2011 - August 2018); officer of Columbia Funds and affiliated funds since 2005. |
Michael E. DeFao
225 Franklin Street
Boston, MA 02110
Born 1968 | Vice President (2011) and Assistant Secretary (2010) | Vice President and Chief Counsel, Ameriprise Financial, Inc. since May 2010. |
Amy Johnson
5228 Ameriprise
Financial Center
Minneapolis, MN 55474
Born 1965 | Vice President (2006) | Managing Director and Global Head of Operations, Columbia Management Investment Advisers, LLC since April 2016 (previously Managing Director and Chief Operating Officer, 2010 - 2016). |
Lyn Kephart-Strong
5228 Ameriprise
Financial Center
Minneapolis, MN 55474
Born 1960 | Vice President (2015) | President, Columbia Management Investment Services Corp. since October 2014; Vice President & Resolution Officer, Ameriprise Trust Company since August 2009. |
Columbia Balanced Fund | Annual Report 2018
| 59 |
Board Consideration and Approval of Management
Agreement
On June 12, 2018, the Board of Trustees (the Board) and the Trustees who are not interested persons (as defined in the Investment Company Act of 1940) (the Independent Trustees) of Columbia Funds Series Trust I (the Trust) unanimously approved the continuation of the Management Agreement (the Management Agreement) with Columbia Management Investment Advisers, LLC (the Investment Manager) with respect to Columbia Balanced Fund (the Fund), a series of the Trust. As detailed below, the Board’s Advisory Fees and Expenses Committee (the Committee) and the Board met on multiple occasions to review and discuss, among themselves, with the management team of the Investment Manager and with an independent fee consultant, materials provided by the Investment Manager, the independent fee consultant and others before determining to approve the continuation of the Management Agreement.
In connection with their deliberations regarding the continuation of the Management Agreement, the Committee and the Board evaluated materials requested from the Investment Manager regarding the Fund and the Management Agreement, and discussed these materials with representatives of the Investment Manager at Committee meetings held on March 6, 2018, April 26, 2018 and June 11, 2018 and at Board meetings held on March 7, 2018 and June 12, 2018. In addition, the Board and its various committees consider matters bearing on the Management Agreement at other meetings throughout the year and in prior years and meet regularly with senior management of the Trust and the Investment Manager. Through the Board’s Investment Oversight Committees, Trustees also meet with selected portfolio managers of the funds the Trustees oversee and with other investment personnel at various times throughout the year. The Committee and the Board also consulted with the independent fee consultant, Fund counsel and the Independent Trustees’ independent legal counsel, who advised on various matters with respect to the Committee’s and the Board’s considerations and otherwise assisted the Committee and the Board in their deliberations. On June 11, 2018, the Committee recommended that the Board approve the continuation of the Management Agreement. On June 12, 2018, the Board, including the Independent Trustees, voting separately, unanimously approved the continuation of the Management Agreement for the Fund.
The Committee and the Board considered all information that they, their legal counsel or the Investment Manager believed reasonably necessary to evaluate and to determine whether to recommend for approval or approve the continuation of the Management Agreement. The information and factors considered by the Committee and the Board in recommending for approval or approving the continuation of the Management Agreement for the Fund included the following:
| • | Information on the investment performance of the Fund relative to the performance of a group of mutual funds determined to be comparable to the Fund by an independent third-party data provider, as well as performance relative to benchmarks; |
| • | Information on the Fund’s management fees and total expenses, including information comparing the Fund’s expenses to those of a group of comparable mutual funds, as determined by the independent third-party data provider; |
| • | The Investment Manager’s agreement to contractually limit or cap total operating expenses for the Fund through December 31, 2019 so that total operating expenses (excluding certain fees and expenses, such as transaction costs and certain other investment related expenses, interest, taxes, acquired fund fees and expenses, and infrequent and/or unusual expenses) would not exceed a specified annual rate, as a percentage of the Fund’s net assets; |
| • | The terms and conditions of the Management Agreement; |
| • | The current and proposed terms and conditions of other agreements and arrangements with affiliates of the Investment Manager relating to the operations of the Fund, including agreements with respect to the provision of distribution, transfer agency and shareholder services to the Fund; |
| • | Descriptions of various functions performed by the Investment Manager under the Management Agreement, including portfolio management and portfolio trading practices; |
| • | Information regarding the management fees of similarly-managed portfolios of other clients of the Investment Manager, including institutional accounts and collective trusts; |
| • | Information regarding the reputation, regulatory history and resources of the Investment Manager, including information regarding senior management, portfolio managers and other personnel; |
| 60 | Columbia Balanced Fund | Annual Report 2018 |
Board Consideration and Approval of Management
Agreement (continued)
| • | Information regarding the capabilities of the Investment Manager with respect to compliance monitoring services, including an assessment of the Investment Manager’s compliance system by the Fund’s Chief Compliance Officer; and |
| • | The profitability to the Investment Manager and its affiliates from their relationships with the Fund. |
Nature, extent and quality of services provided under the Management Agreement
The Committee and the Board considered the nature, extent and quality of services provided to the Fund by the Investment Manager and its affiliates under the Management Agreement and under separate agreements for the provision of transfer agency and shareholder services, and the resources dedicated to the Fund and the other Columbia Funds by the Investment Manager and its affiliates. The Committee and the Board considered, among other things, the Investment Manager’s ability to attract, motivate and retain highly qualified research, advisory and supervisory investment professionals (including compensation programs for personnel involved in fund management, reputation and other attributes), the portfolio management services provided by those investment professionals, and the quality of the Investment Manager’s investment research capabilities and trade execution services. The Committee and the Board also considered the potential benefits to shareholders of investing in a mutual fund that is part of a fund complex offering exposure to a variety of asset classes and investment disciplines and providing a variety of fund and shareholder services.
The Committee and the Board also considered the professional experience and qualifications of the senior personnel of the Investment Manager, which included consideration of the Investment Manager’s experience with similarly-structured funds. The Committee and the Board noted the compliance programs of and the compliance-related resources provided to the Fund by the Investment Manager and its affiliates and the resources dedicated by the Investment Manager and its affiliates to risk management, and considered the Investment Manager’s ability to provide administrative services to the Fund and coordinate the activities of the Fund’s other service providers. After reviewing these and related factors, the Committee and the Board concluded, within the context of their overall conclusions, that the nature, extent and quality of the services provided to the Fund under the Management Agreement supported the continuation of the Management Agreement.
Investment performance
The Committee and the Board reviewed information about the performance of the Fund over various time periods, including performance information relative to benchmarks, information that compared the performance of the Fund to the performance of a group of comparable mutual funds as determined by the independent third-party data provider, and information and analysis provided by the independent fee consultant. The Committee and the Board also reviewed a description of the third party’s methodology for identifying the Fund’s peer groups for purposes of performance and expense comparisons. Although the Fund’s performance lagged that of a relevant peer group for certain (although not necessarily all) periods, the Committee and the Board concluded that other factors relevant to performance were sufficient, in light of other considerations, to support continuation of the Management Agreement. Those factors included one or more of the following: (i) that the Fund’s performance, although lagging in certain recent periods, was stronger over the longer term; (ii) that the underperformance was attributable, to a significant extent, to investment decisions that were reasonable and consistent with the Fund’s investment strategy and policies and that the Fund was performing within a reasonable range of expectations, given those investment decisions, market conditions and the Fund’s investment strategy; (iii) that the Fund’s performance was competitive when compared to other relevant performance benchmarks or peer groups; and (iv) that the Investment Manager had taken or was taking steps designed to help improve the Fund’s investment performance, including, but not limited to, replacing portfolio managers, enhancing the resources supporting the portfolio managers, or modifying investment strategies.
The Committee and the Board noted that, through December 31, 2017, the Fund’s performance was in the seventy-third, forty-fifth and eighteenth percentile (where the best performance would be in the first percentile) of its category selected by the independent third-party data provider for the purposes of performance comparisons for the one-, three- and five-year periods, respectively.
The Committee and the Board also considered the Investment Manager’s performance and reputation generally, the Investment Manager’s historical responsiveness to Board concerns about performance, and the Investment Manager’s willingness to take steps intended to improve performance. After reviewing these and related factors, the Committee and the Board concluded, within the context of their overall conclusions, that the performance of the Fund and the Investment Manager was sufficient, in light of other considerations, to support the continuation of the Management Agreement.
Columbia Balanced Fund | Annual Report 2018
| 61 |
Board Consideration and Approval of Management
Agreement (continued)
Investment management fee rates and other expenses
The Committee and the Board considered the management fees charged to the Fund under the Management Agreement as well as the total expenses incurred by the Fund. In assessing the reasonableness of the fees under the Management Agreement, the Committee and the Board considered, among other information, the Fund’s total expense ratio as a percentage of average daily net assets. The Committee and the Board considered data provided by the independent third-party data provider and the independent fee consultant. The Committee and the Board noted that, as of December 31, 2017, the Fund’s actual management fee and net total expense ratio were ranked in the third and first quintiles, respectively, (where the lowest fees and expenses would be in the first quintile) against the Fund’s expense universe as determined by the independent third-party data provider for purposes of expense comparison. The Committee and the Board also took into account the fee waiver and expense limitation arrangements agreed to by the Investment Manager, as noted above.
The Committee and the Board also received and considered information about the management fees charged by the Investment Manager to institutional accounts. In considering the fees charged to those accounts, the Committee and the Board took into account, among other things, the Investment Manager’s representations about the differences between managing mutual funds as compared to other types of accounts, including differences in the services provided, differences in the risk profile of such business for the Investment Manager and the additional resources required to manage mutual funds effectively. The Committee and the Board also received and considered information about the fees charged by the Investment Manager for sub-advisory services it provides to comparable unaffiliated funds. In evaluating the Fund’s management fees, the Committee and the Board also took into account the demands, complexity and quality of the investment management of the Fund.
After reviewing these and related factors, the Committee and the Board concluded, within the context of their overall conclusions, that the management fee rates and expenses of the Fund, in light of other considerations, supported the continuation of the Management Agreement.
Costs of services provided and profitability
The Committee and the Board also took note of the costs the Investment Manager and its affiliates incur in connection with the services provided and the profitability to the Investment Manager and its affiliates from their relationships with the Fund.
The Committee and the Board also considered the compensation directly or indirectly received by the Investment Manager’s affiliates in connection with their relationships with the Fund. The Committee and the Board reviewed information provided by management as to the profitability to the Investment Manager and its affiliates of their relationships with the Fund, information about the allocation of expenses used to calculate profitability, and comparisons of profitability levels realized in 2017 to profitability levels realized in 2016. When reviewing profitability, the Committee and the Board also considered court cases in which adviser profitability was an issue in whole or in part, the performance of similarly managed funds, the performance of the Fund, and the expense ratio of the Fund. In addition, the Committee and the Board considered information provided by the Investment Manager regarding the Investment Manager’s financial condition and comparing its profitability to that of other asset management firms that are, or are subsidiaries of, publicly traded companies. In this regard, the Committee and the Board also considered data provided by the independent fee consultant.
After reviewing these and related factors, the Committee and the Board concluded, within the context of their overall conclusions, that the costs of services provided and the profitability to the Investment Manager and its affiliates from their relationships with the Fund supported the continuation of the Management Agreement.
Economies of scale
The Committee and the Board considered the potential existence of economies of scale in the provision by the Investment Manager of services to the Fund, to groups of related funds, and to the Investment Manager’s investment advisory clients as a whole, and whether those economies of scale were shared with the Fund through breakpoints in investment management fees or other means, such as expense limitation arrangements and additional investments by the Investment Manager in investment, trading, compliance and other resources. The Committee and the Board noted that the management fee schedules for the Fund contained breakpoints that would reduce the fee rate on assets above specified threshold levels.
| 62 | Columbia Balanced Fund | Annual Report 2018 |
Board Consideration and Approval of Management
Agreement (continued)
In considering these matters, the Committee and the Board also considered the costs of the services provided and the profitability to the Investment Manager and its affiliates from their relationships with the Fund, as noted above. After reviewing these and related factors, the Committee and the Board concluded, within the context of their overall conclusions, that the extent to which any economies of scale were expected to be shared with the Fund supported the continuation of the Management Agreement.
Other benefits to the Investment Manager
The Committee and the Board received and considered information regarding “fall-out” or ancillary benefits received by the Investment Manager and its affiliates as a result of their relationships with the Fund, such as the engagement of the Investment Manager’s affiliates to provide distribution, transfer agency and shareholder services to the Fund. In this regard, among other matters, the Committee and the Board considered that the Fund’s distributor retains a portion of the distribution fees from the Fund and receives a portion of the sales charges on sales or redemptions of certain classes of shares of the Fund. The Committee and the Board also considered the benefits of research made available to the Investment Manager by reason of brokerage commissions generated by the Fund’s securities transactions, and reviewed information about the Investment Manager’s practices with respect to considering brokerage and research services when allocating portfolio transactions. In this connection, the Board also noted that the amount of research made available to the Investment Manager by reason of brokerage commissions had been declining over time, and may decline further. The Committee and the Board recognized that the Investment Manager’s profitability would be somewhat lower without these benefits.
Conclusion
The Committee and the Board reviewed all of the above considerations in reaching their decisions to recommend or approve the continuation of the Management Agreement. In their deliberations, the Trustees did not identify any particular information that was all-important or controlling, and individual Trustees may have attributed different weights to the various factors. Based on their evaluation of all factors that they deemed to be material, including those factors described above, and assisted by the advice of independent legal counsel, the Board, including the Independent Trustees, voting separately, unanimously approved the continuation of the Management Agreement.
Columbia Balanced Fund | Annual Report 2018
| 63 |
The Fund mails one shareholder report to each shareholder address. If you would like more than one report, please call shareholder services at 800.345.6611 and additional reports will be sent to you.
Proxy voting policies and procedures
The policy of the Board of Trustees is to vote the proxies of the companies in which the Fund holds investments consistent with the procedures as stated in the Statement of Additional Information (SAI). You may obtain a copy of the SAI without charge by calling 800.345.6611; contacting your financial intermediary; visiting columbiathreadneedleus.com/investor/; or searching the website of the Securities and Exchange Commission (SEC) at sec.gov. Information regarding how the Fund voted proxies relating to portfolio securities is filed with the SEC by August 31st for the most recent 12-month period ending June 30th of that year, and is available without charge by visiting columbiathreadneedleus.com/investor/, or searching the website of the SEC at sec.gov.
Quarterly schedule of investments
The Fund files a complete schedule of portfolio holdings with the SEC for the first and third quarters of each fiscal year on Form N-Q or Form N-PORT. The Fund’s Form N-Q or Form N-PORT is available on the SEC’s website at sec.gov and may be reviewed and copied at the SEC’s Public Reference Room in Washington, D.C. Information on the operation of the Public Reference Room may be obtained by calling 800.SEC.0330. The Fund’s complete schedule of portfolio holdings, as filed on Form N-Q or Form N-PORT, can also be obtained without charge, upon request, by calling 800.345.6611.
Additional Fund information
For more information about the Fund, please visit columbiathreadneedleus.com/investor/ or call 800.345.6611. Customer Service Representatives are available to answer your questions Monday through Friday from 8 a.m. to 7 p.m. Eastern time.
Fund investment manager
Columbia Management Investment Advisers, LLC
225 Franklin Street
Boston, MA 02110
Fund distributor
Columbia Management Investment Distributors, Inc.
225 Franklin Street
Boston, MA 02110
Fund transfer agent
Columbia Management Investment Services Corp.
Through October 31, 2018:
P.O. Box 8081
Boston, MA 02266-8081
Effective November 1, 2018:
P.O. Box 219104
Kansas City, MO 64121-9104
| 64 | Columbia Balanced Fund | Annual Report 2018 |
[THIS PAGE INTENTIONALLY LEFT BLANK]
Columbia Balanced Fund
Through October 31, 2018:
P.O. Box 8081
Boston, MA 02266-8081
Effective November 1, 2018:
P.O. Box 219104
Kansas City, MO 64121-9104
Please read and consider the investment objectives, risks, charges and expenses for any fund carefully before investing. For a prospectus and summary prospectus, which contains this and other important information about the Fund, go to
columbiathreadneedleus.com/investor/. The Fund is distributed by Columbia Management Investment Distributors, Inc., member FINRA, and managed by Columbia Management Investment Advisers, LLC.
Columbia Threadneedle Investments (Columbia Threadneedle) is the global brand name of the Columbia and Threadneedle group of companies. All rights reserved.
© 2018 Columbia Management Investment Advisers, LLC.
columbiathreadneedleus .com/investor/

Annual Report
August 31, 2018
Multi-Manager Total Return Bond Strategies Fund
Not FDIC Insured • No bank guarantee • May lose value
Dear Shareholders,
Volatility exists in financial markets and this is not a comfortable fact of life. How investors deal with this reality, including how they react to short term spikes in volatility as well as to longer periods of increased or decreased volatility, may have a significant impact on their overall investing success.
Too often, investors change their investment strategy based on something that’s happening at a moment in time rather than thinking about how that change in strategy might affect their ability to achieve their longer-term financial goals. Emotion replaces logic and reasoning. Investors may sell in reaction to a market drop (fear or panic), locking in low returns which means they won’t be invested when the market returns, or they invest more at a market peak (greed or conviction), essentially when it is expensive to do so. In both cases, selling and buying at the exact wrong time.
We believe the best outcomes come from a consistent approach to investing. Here are five areas where advisors can help us overcome the tendency to react emotionally as we struggle to make the right choices with our investments:
Long-term focus
The further away long-term goals, aspirations and objectives are, the easier it is to stray away from the goals and priorities that we set out. Advisors help us stay focused on what we want to accomplish.
Discipline through up-and-down markets
Advisors help set rules to prevent us from making rash decisions that we may regret later. Knowing ahead of time what you should do in case of certain situations will help you get through volatile markets and not make emotional decisions.
Tax-awareness
Taxes are one of the biggest drags on investment returns and are critical attributes of investing. Yet few of us take the necessary steps to ease the corrosive effect of taxes. Advisors have tools and knowledge that may help us to manage portfolios more tax-efficiently and keep more of what we earn.
Emotional objectivity
Our emotions are very hard to manage and making investment decisions in an emotional state can lead to exceedingly bad outcomes. An objective advisor can help prevent some of the reactionary mistakes emotions often lead us to.
Education and guidance
The role of the advisor is to teach and guide us toward achieving our financial goals. In terms of working through emotions, guidance is by far the most important component.
By understanding our own behaviors and biases, we can prepare for future challenges. Your success is our priority. Talk to your advisor about how working with Columbia Threadneedle Investments may help you stay the course and position your portfolio for consistent, sustainable outcomes, regardless of market conditions.
Sincerely,
Christopher O. Petersen
President, Columbia Funds
Columbia Funds are distributed by Columbia Management Investment Distributors, Inc., member FINRA, and managed by Columbia Management Investment Advisers, LLC.
© 2018 Columbia Management Investment Advisers, LLC. All rights reserved.
Multi-Manager Total Return Bond Strategies Fund | Annual Report 2018
Multi-Manager Total Return Bond Strategies Fund | Annual Report 2018
Investment objective
Multi-Manager Total Return Bond Strategies Fund (the Fund) seeks total return, consisting of capital appreciation and current income.
Portfolio management
Loomis, Sayles & Company, L.P.
Christopher Harms
Clifton Rowe, CFA
Kurt Wagner, CFA, CIC
PGIM, Inc.
Michael Collins, CFA
Robert Tipp, CFA
Richard Piccirillo
Gregory Peters
TCW Investment Management Company LLC
Stephen Kane, CFA
Laird Landmann
Tad Rivelle
Bryan Whalen, CFA
| Average annual total returns (%) (for the period ended August 31, 2018) |
| | | Inception | 1 Year | 5 Years | Life |
| Class A | 04/20/12 | -1.51 | 2.32 | 2.13 |
| Institutional Class* | 01/03/17 | -1.16 | 2.43 | 2.22 |
| Bloomberg Barclays U.S. Aggregate Bond Index | | -1.05 | 2.49 | 1.96 |
All results shown assume reinvestment of distributions during the period. Returns do not reflect the deduction of taxes that a shareholder may pay on Fund distributions or on the redemption of Fund shares. Performance results reflect the effect of any fee waivers or reimbursements of Fund expenses by Columbia Management Investment Advisers, LLC and/or any of its affiliates. Absent these fee waivers or expense reimbursement arrangements, performance results would have been lower. Effective November 1, 2017, Class Z shares were renamed Institutional Class shares.
The performance information shown represents past performance and is not a guarantee of future results. The investment return and principal value of your investment will fluctuate so that your shares, when redeemed, may be worth more or less than their original cost. Current performance may be lower or higher than the performance information shown. You may obtain performance information current to the most recent month-end by contacting your financial intermediary, visiting columbiathreadneedleus.com/investor/ or calling 800.345.6611.
| * | The returns shown for periods prior to the share class inception date (including returns for the Life of the Fund, if shown, which are since Fund inception) include the returns of the Fund’s oldest share class. These returns are adjusted to reflect any higher class-related operating expenses of the newer share classes, as applicable. Please visit columbiathreadneedleus.com/investor/investment-products/mutual-funds/appended-performance for more information. |
The Bloomberg Barclays U.S. Aggregate Bond Index is a broad-based benchmark that measures the investment-grade, U.S. dollar-denominated, fixed-rate taxable bond market, including Treasuries, government-related and corporate securities, mortgage-backed securities (agency fixed-rate and hybrid adjustable-rate mortgage passthroughs), asset-backed securities, and commercial mortgage-backed securities.
Indices are not available for investment, are not professionally managed and do not reflect sales charges, fees, brokerage commissions, taxes or other expenses of investing. Securities in the Fund may not match those in an index.
| 2 | Multi-Manager Total Return Bond Strategies Fund | Annual Report 2018 |
Fund at a Glance (continued)
Performance of a hypothetical $10,000 investment (April 20, 2012 — August 31, 2018)
The chart above shows the change in value of a hypothetical $10,000 investment in Class A shares of Multi-Manager Total Return Bond Strategies Fund during the stated time period, and does not reflect the deduction of taxes that a shareholder may pay on Fund distributions or on the redemption of Fund shares.
| Portfolio breakdown (%) (at August 31, 2018) |
| Asset-Backed Securities — Non-Agency | 14.5 |
| Commercial Mortgage-Backed Securities - Agency | 3.1 |
| Commercial Mortgage-Backed Securities - Non-Agency | 5.9 |
| Commercial Paper | 0.1 |
| Common Stocks | 0.0 (a) |
| Convertible Bonds | 0.1 |
| Corporate Bonds & Notes | 35.1 |
| Foreign Government Obligations | 2.4 |
| Inflation-Indexed Bonds | 0.1 |
| Money Market Funds | 2.6 |
| Municipal Bonds | 0.4 |
| Residential Mortgage-Backed Securities - Agency | 18.2 |
| Residential Mortgage-Backed Securities - Non-Agency | 2.8 |
| Senior Loans | 0.2 |
| Treasury Bills | 3.0 |
| U.S. Government & Agency Obligations | 0.2 |
| U.S. Treasury Obligations | 11.3 |
| Total | 100.0 |
Percentages indicated are based upon total investments and exclude investments in derivatives, if any. The Fund’s portfolio composition is subject to change.
Multi-Manager Total Return Bond Strategies Fund | Annual Report 2018
| 3 |
Fund at a Glance (continued)
| Quality breakdown (%) (at August 31, 2018) |
| AAA rating | 55.1 |
| AA rating | 5.3 |
| A rating | 11.3 |
| BBB rating | 21.1 |
| BB rating | 3.0 |
| B rating | 2.0 |
| CCC rating | 0.8 |
| CC rating | 0.5 |
| C rating | 0.0 (a) |
| D rating | 0.0 (a) |
| Not rated | 0.9 |
| Total | 100.0 |
Percentages indicated are based upon total fixed income investments (excluding Money Market Funds and derivatives, if any).
Bond ratings apply to the underlying holdings of the Fund and not the Fund itself and are divided into categories ranging from highest to lowest credit quality, determined by using the middle rating of Moody’s, S&P and Fitch, after dropping the highest and lowest available ratings. When ratings are available from only two rating agencies, the lower rating is used. When a rating is available from only one rating agency, that rating is used. When a bond is not rated by any rating agency, it is designated as “Not rated.” Credit quality ratings assigned by a rating agency are subjective opinions, not statements of fact, and are subject to change, including daily. The ratings assigned by credit rating agencies are but one of the considerations that the Investment Manager and/or Fund’s subadviser incorporates into its credit analysis process, along with such other issuer-specific factors as cash flows, capital structure and leverage ratios, ability to de-leverage (repay) through free cash flow, quality of management, market positioning and access to capital, as well as such security-specific factors as the terms of the security (e.g., interest rate and time to maturity) and the amount and type of any collateral.
| Market exposure through derivatives investments (% of notional exposure) (at August 31, 2018)(a) |
| | Long | Short | Net |
| Fixed Income Derivative Contracts | 103.8 | (202.7) | (98.9) |
| Foreign Currency Derivative Contracts | — | (1.1) | (1.1) |
| Total Notional Market Value of Derivative Contracts | 103.8 | (203.8) | (100.0) |
(a) The Fund has market exposure (long and/or short) to fixed income and foreign currency through its investments in derivatives. The notional exposure of a financial instrument is the nominal or face amount that is used to calculate payments made on that instrument and/or changes in value for the instrument. The notional exposure is a hypothetical underlying quantity upon which payment obligations are computed. Notional exposures provide a gauge for how the Fund may behave given changes in individual markets. For a description of the Fund’s investments in derivatives, see Investments in derivatives following the Portfolio of Investments, and Note 2 to the Notes to Financial Statements.
| 4 | Multi-Manager Total Return Bond Strategies Fund | Annual Report 2018 |
Manager Discussion of Fund Performance
At the start of the reporting period, the Fund’s portfolio was managed by Columbia Management Investment Advisers, LLC (CMIA) and three independent money management firms, TCW Investment Management Company (TCW), PGIM, Inc. (PGIM Fixed Income) and Loomis, Sayles & Company, L.P. (Loomis Sayles). In December 2017, approximately 60% of the portion of the portfolio managed by CMIA was transitioned to TCW, Loomis Sayles and PGIM. The remaining portion of the portfolio that was managed by CMIA was liquidated. Effective January 1, 2018, CMIA no longer managed a portion of the Fund’s portfolio. As of August 31, 2018, TCW, PGIM and Loomis Sayles managed approximately 35%, 35% and 30% of the portfolio, respectively.
For the 12-month period that ended August 31, 2018, the Fund’s Class A shares returned -1.51%. The Fund modestly underperformed its benchmark, the Bloomberg Barclays U.S. Aggregate Bond Index, which returned -1.05% over the same time period. The Fund’s performance can be attributed primarily to sector allocation, security selection and duration and yield curve positioning decisions as well as to fees and expenses that unmanaged indices do not incur.
Fixed-income markets struggled against a backdrop of rising interest rates
A backdrop of rising interest rates proved a challenging headwind for fixed-income markets during the 12-month period ended August 31, 2018. The U.S. economy outperformed that of the rest of the world for the majority of the period, driven by strong corporate profits, job gains and income growth. Stable to rising oil prices and U.S. tax reform also contributed to a positive tone. At the same time, trade war tensions, pressured emerging market economies and political instability in the eurozone periphery lowered investors’ confidence. Still, global economic growth remained positive, and inflation drivers remained largely contained. U.S. inflation indicators, propelled by a strong labor market and persistent economic growth, approximated the Federal Reserve’s (the Fed) 2% target.
Given these market conditions, the Fed hiked interest rates three times during the period — in December 2017 and March and June 2018. The U.S. Treasury yield curve, or spectrum of maturities, flattened, as yields at the front, or short-term, end increased substantially based on the Fed’s rate hikes, while yields at the long-term end rose more moderately as economic growth and inflation expectations remained rather steady. Two-year U.S. Treasury yields rose approximately 130 basis points, while bellwether 10-year U.S. Treasury yields were up approximately 74 basis points, and 30-year U.S. Treasury yields increased approximately 29 basis points. (A basis point is 1/100th of a percentage point.)
Despite global macro concerns and spread widening during the second half of the period, investment-grade corporate bonds ended August 2018 with modestly better returns than those of U.S. Treasuries. The underlying strength of the U.S. economy helped credit markets shrug off the daily volatility in emerging markets and trade headlines. The sector was also well supported by the global thirst for yield, improving corporate earnings and expected lower bond supply. High-yield corporate bonds held up even better, reinforced by rather stable financial conditions. Securitized assets as a whole outperformed duration-matched U.S. Treasuries, though the rise in the short-term end of the U.S. yield curve limited total returns. Within the securitized sector, commercial mortgage-backed securities (CMBS) were the best performers, followed by mortgage-backed securities (MBS) and asset-backed securities (ABS). Non-agency MBS benefited from durable housing fundamentals along with limited new supply, while agency MBS declined modestly, pressured by the backdrop of a less accommodative Fed and uptick in rates. Among ABS, non-traditional collateral, such as student loans, performed especially well.
Sector allocations, security selection and duration positioning drove Fund returns
CMIA: We managed a portion of the Fund’s portfolio from the start of the reporting period through December 2017. During that time, performance for our portion of the portfolio was driven by an overweight to investment-grade credit as the option-adjusted spread on the Bloomberg Barclays Corporate Index tightened by 15 basis points over this timeframe. Also, being underweight in Treasury securities added to relative performance as yields on 10-year Treasuries rose by only 23 basis points. Negative performance from security selection within high-yield credits detracted from performance in our portion of the portfolio.
TCW: Performance for our portion of the Fund was driven in part by our defensive duration positioning and in part by effective sector allocation and issue selection overall. More specifically, duration positioning proved most beneficial to relative results during the first half of the period when interest rates rose significantly and our portion of the Fund maintained a duration shorter than that of the benchmark. An allocation to securitized products also contributed positively, particularly an emphasis on federally-guaranteed student loans, which led traditional ABS. An overweight to CMBS also added value, as the sector
Multi-Manager Total Return Bond Strategies Fund | Annual Report 2018
| 5 |
Manager Discussion of Fund Performance (continued)
meaningfully outpaced the benchmark during the period. Within corporate credit, positive contributions came from an emphasis on strong financial and communication credits. Finally, our portion of the Fund benefited from a small position in Japanese government bonds, with the yen exposure fully hedged out using a U.S. dollar/yen cross currency swap.
Only partially offsetting these positive contributors was our portion of the Fund’s relative underweight to top performing industrial segments within the corporate credit sectors, such as energy and metals and mining, which outpaced duration-matched U.S. Treasuries. A relative underweight to municipal bonds also dampened results, as the sector outperformed the benchmark during the period.
Our portion of the Fund’s yield curve positioning had a rather neutral effect on relative results during the period.
Loomis Sayles: Performance for our portion of the Fund was driven primarily by effective security selection, sector allocation and yield curve positioning. More specifically, we favored risk assets during the period, as economic conditions and corporate fundamentals remained healthy, in our view. As a result, our portion of the Fund maintained a meaningful underweight to U.S. Treasuries and overweights to corporate bonds and securitized sectors. Such sector allocation positioning overall contributed most positively to relative results during the period, muted only modestly by overweights to ABS and agency CMBS, which detracted. Within the corporate bond sector, overweight allocations to the energy, technology and banking industries helped most.
Security selection among corporate bonds, ABS and CMBS also contributed positively overall. Within the investment-grade corporate bond sector, security selection proved especially effective within the industrial and utilities segments, primarily choices within the communications, consumer non-cyclical and electric industries, offset only partially by issue selection within the financials segment, via the insurance industry, which detracted. We viewed ABS and CMBS as attractive alternatives to short-duration government bonds. We maintained an allocation to super-senior CMBS issues and, within the ABS sector, we maintained exposures to senior and subordinate debt of prime and subprime issues.
Agency-backed securitized assets detracted modestly from our portion of the Fund’s relative performance during the period, as an underweight in pass-through securities and weak security selection among collateralized mortgage obligations more than offset the positive security selection generated in agency CMBS. While valuations of MBS improved during the period, we continued to have prepayment risk concerns and favored securities with less extension risk.
While our portion of the Fund’s overall duration was near neutral to that of the benchmark throughout the period, we emphasized longer duration securities and were underweight securities from the front, or short-term, end of the yield curve. This yield curve positioning added value, given that interest rates rose during the period, as the Fed tightened monetary policy.
PGIM: Within our portion of the Fund sector allocation, security selection and yield curve positioning contributed positively to relative results, offsetting duration positioning, which detracted. Our portion of the Fund generally maintained a barbell position between high quality structured products and lower quality investment-grade and high-yield allocations. More specifically, overweight allocations to high-yield corporate bonds and CMBS contributed positively. Allocation positioning in investment-grade corporate bonds, ABS, municipal bonds and U.S. Treasuries added value as well. Issue selection among collateralized loan obligations (CLOs) was also a key positive contributor, consisting mainly of AAA-rated securities. A robust stream of deals and new buyers, coupled with the underlying collateral of bank loans, which performed well, supported CLOs’ strong performance. Issue selection among interest rate swap spread wideners boosted our portion of the Fund’s relative results, the position reflected our thesis that U.S. Treasuries would outperform swap spreads. Among corporate and emerging market debt positions, overweights in energy, electric utilities and banking contributed positively, while overweights to foreign non-corporate bonds and to the cable industry detracted. At the corporate issuer level, the bonds of Dynegy, Devon Energy, Calpine and JP Morgan were top contributors, while the bonds of Dish Network and non-U.S. sovereign bonds, including those of Argentina, Turkey and Italy, detracted. We sold our position in Dynegy. Yield curve positioning contributed positively to relative results, as we maintained a curve flattener position, which helped as the differential in yields between longer term and shorter term maturities narrowed.
Duration positioning detracted. Our portion of the Fund had a longer duration than that of the benchmark, which hurt as yields rose during the period. Security selection within the emerging market debt sector also detracted from results during the period.
| 6 | Multi-Manager Total Return Bond Strategies Fund | Annual Report 2018 |
Manager Discussion of Fund Performance (continued)
Shifting market conditions drove portfolio changes
The Fund’s portfolio turnover rate for the 12-month period was 228%. A significant portion of the turnover was the result of rolling-maturity mortgage securities, processing of prepayments and opportunistic changes our managers made at the margin in response to valuations or market developments.
CMIA: In December 2017, approximately 60% of our portion of the portfolio was transitioned to the three subadvisers to the Fund. The remaining portion was liquidated.
TCW: Given the ongoing aging of the credit cycle, we continued to position our portion of the Fund with an eye toward risk reduction by moving into higher quality securities up in the capital structure. In terms of sector positioning, our portion of the Fund remained underweight to corporate credit with an emphasis on financials. During the period, we increased our portion of the Fund’s relative overweight to financials, particularly among high quality, short-dated real estate investment trusts and banking credits. Among industrials, we increased our portion of the Fund’s allocation to communications and consumer non-cyclicals and moved to a modest overweight in energy credits via the addition of high quality, high conviction midstream names.
Our portion of the Fund’s duration profile was defensive for the majority of the period, which added value as interest rates rose. Consistent with our value discipline, as rate volatility eased and U.S. Treasury yields approached what we believed was closer to fair value, we gradually extended our portion of the Fund’s duration via tactical trades, moving from approximately three-tenths of a year short to one-tenth of a year longer than the duration of the benchmark by the end of the period.
At the end of the period, our portion of the Fund remained committed to a disciplined, value-based approach, reflected in a focus on higher quality, better collateralized areas of the market. Securitized products remained an emphasis, and positioning favored higher quality, more senior issues. Non-agency MBS remained one of the more attractive opportunities in fixed income, in our view, given the defensive nature of an asset that continued to de-lever. We believe agency MBS offered many positive attributes, including high quality, liquidity and some yield premium versus U.S. Treasuries but also faced the significant potential headwind of slackening demand as the Fed reduces its holdings of the bonds. Among CMBS, exposure was skewed toward agency-backed as well as seasoned non-agency issues at the top of the capital structure and single asset single borrower deals to avoid the underwriting challenges faced by current vintage non-agency CMBS. Consistent with this defensive posture, our portion of the Fund’s allocation to ABS favored more robust structures, such as federally guaranteed student loans and AAA-rated CLOs that we believe offer value. With wariness of embedded risks in the corporate credit market, our portion of the Fund emphasized more defensive sectors we believed were better equipped to withstand volatility, while building ample liquidity to take advantage of opportunities, including high-yield and emerging market debt, where appropriate, that may arise in such environments. Finally, our portion of the Fund continued to hold fully currency-hedged Japanese government bonds at the end of the period as a higher yielding cash substitute.
Loomis Sayles: Our portion of the Fund’s exposure to corporate bond risk had been declining during the period and reached a low point in February 2018. As spreads, or yield differentials between corporate bonds and U.S. Treasuries, subsequently widened during the second half of the period, we increased the corporate beta, or volatility factor, within our portion of the Fund, seeking to take advantage of new issues with the purchase of concessions and secondary bonds that offered what we viewed as healthy risk/return opportunities. We also increased our portion of the Fund’s overweight to BBB-rated bonds, which performed well during the period. That said, it is important to note that our focus remained on selecting fundamentally solid credits that we believe have the ability to maintain investment-grade ratings based on industry trends, operating performance and commitment of management teams. We have and continue to monitor exposures, position sizes and risk tolerance within our portion of the Fund’s portfolio, closely watching market events and trading levels for potential opportunities.
We added to our portion of the Fund’s agency MBS positioning, as valuations in that sector improved, but we remained defensively positioned, as spreads, in our opinion, did not warrant an overweighted allocation. We added to our portion of the Fund’s Yankee bond overweight in the banking industry, as we viewed European bank balance sheet health to be more favorable during these months relative to their U.S. counterparts. (A Yankee bond is a bond issued by a foreign entity, such as a bank or company, but is issued and traded in the U.S. and denominated in U.S. dollars.) We maintained an overall duration that was neutral to that of the benchmark throughout but tilted partial durations toward mid to longer durations, as we anticipated a yield curve flattening, which did indeed materialize.
Multi-Manager Total Return Bond Strategies Fund | Annual Report 2018
| 7 |
Manager Discussion of Fund Performance (continued)
At the end of the period, our portion of the Fund was overweight relative to the benchmark in U.S. credit, particularly the banking, insurance, consumer cyclical and electric industries, as well as ABS and CMBS. Our portion of the Fund was underweight on a relative basis to U.S. Treasuries, MBS and agency securities. We were targeting a neutral duration position at the end of the period.
PGIM: During the period, modest changes were made to active duration positioning. We also sold into certain sectors’ strength, reducing our portion of the Fund’s exposure to bank loans, high-yield corporate bonds and investment-grade corporate bonds. We modestly increased exposure to structured products, including CLOs and CMBS, and to U.S. Treasuries.
At the end of the period, our portion of the Fund was underweight in U.S. Treasuries and MBS and was overweight in structured products, high-yield corporate bonds, emerging market debt and investment-grade corporate bonds relative to the benchmark. Our portion of the Fund was rather neutrally weighted relative to the benchmark in the remaining components of the benchmark and also had exposure to bank loans, which are not represented in the benchmark. As of August 31, 2018, our portion of the Fund had a duration approximately one-quarter year longer than that of the benchmark.
Derivative positions in the Fund
Overall for the Fund, on a stand-alone basis, the use of derivatives had a net negative impact on the Fund’s performance for the period.
CMIA: During the time we managed a portion of the Fund’s portfolio, our portion used US Treasury futures to manage duration and yield curve positioning. As rates generally rose over this period, the overall long duration contribution from futures detracted slightly. Credit default swaps were used to hedge the credit exposure of individual credit issuers and credit index swaps were used to provide overall protection when we viewed the credit market in general to be expensive or inexpensive in general. The use of these swaps detracted slightly as we were long in protection and spreads tightened during the period.
TCW: Our portion of the Fund held U.S. Treasury futures as a method of managing duration. The use of these futures detracted modestly from our portion of the Fund’s results during the period against a backdrop of rising rates. Our portion of the Fund also used currency swaps, maintaining a position in Japanese government bonds, with the yen exposure fully hedged out using a U.S. dollar-yen cross currency swap given what we saw as an attractive yield premium. The currency swap position added value during the period.
Loomis Sayles: Our portion of the Fund used U.S. Treasury futures to help manage duration relative to the benchmark. The use of these futures detracted slightly from our portion of the Fund’s results during the period.
PGIM: Our portion of the Fund utilized U.S. Treasury futures, interest rate swaps and overnight indexed swaps to hedge interest rate risk, duration and yield curve positioning and for relative value trading. Overall, positioning in U.S. Treasury futures modestly detracted from our portion of the Fund’s performance, while positioning in interest rate swaps and overnight indexed swaps added value during the annual period.
Market risk may affect a single issuer, sector of the economy, industry or the market as a whole. Mortgage- and asset-backed securities are affected by interest rates, financial health of issuers/originators, creditworthiness of entities providing credit enhancements and the value of underlying assets. Fixed-income securities present issuer default risk. Non-investment-grade (high-yield or junk) securities present greater price volatility and more risk to principal and income than higher rated securities. A rise in interest rates may result in a price decline of fixed-income instruments held by the Fund, negatively impacting its performance and NAV. Falling rates may result in the Fund investing in lower yielding debt instruments, lowering the Fund’s income and yield. These risks may be heightened for longer maturity and duration securities. Prepayment and extension risk exists because a loan, bond or other investment may be called, prepaid or redeemed before maturity and similar yielding investments may not be available for purchase. Investing in derivatives is a specialized activity that involves special risks that subject the Fund to significant loss potential, including when used as leverage, and may result in greater fluctuation in fund value. The Fund is managed by multiple advisers independently of one another, which may result in contradicting trades (i.e., with no net benefit to the Fund), while increasing transaction costs. Market or other (e.g.,interest rate) environments may adversely affect the liquidity of fund investments, negatively impacting their price. Generally, the less liquid the market at the time the Fund sells a holding, the greater the risk of loss or decline of value to the Fund. See the Fund’s prospectus for information on these and other risks.
| 8 | Multi-Manager Total Return Bond Strategies Fund | Annual Report 2018 |
Manager Discussion of Fund Performance (continued)
The views expressed in this report reflect the current views of the respective parties. These views are not guarantees of future performance and involve certain risks, uncertainties and assumptions that are difficult to predict, so actual outcomes and results may differ significantly from the views expressed. These views are subject to change at any time based upon economic, market or other conditions and the respective parties disclaim any responsibility to update such views. These views may not be relied on as investment advice and, because investment decisions for a Columbia fund are based on numerous factors, may not be relied on as an indication of trading intent on behalf of any particular Columbia fund. References to specific securities should not be construed as a recommendation or investment advice.
Multi-Manager Total Return Bond Strategies Fund | Annual Report 2018
| 9 |
Understanding Your Fund’s Expenses
(Unaudited)
As an investor, you incur two types of costs. There are shareholder transaction costs, which may include redemption fees. There are also ongoing costs, which generally include management fees, distribution and/or service fees, and other fund expenses. The following information is intended to help you understand your ongoing costs (in dollars) of investing in the Fund and to help you compare these costs with the ongoing costs of investing in other mutual funds.
Analyzing your Fund’s expenses
To illustrate these ongoing costs, we have provided examples and calculated the expenses paid by investors in each share class of the Fund during the period. The actual and hypothetical information in the table is based on an initial investment of $1,000 at the beginning of the period indicated and held for the entire period. Expense information is calculated two ways and each method provides you with different information. The amount listed in the “Actual” column is calculated using the Fund’s actual operating expenses and total return for the period. You may use the Actual information, together with the amount invested, to estimate the expenses that you paid over the period. Simply divide your account value by $1,000 (for example, an $8,600 account value divided by $1,000 = 8.6), then multiply the results by the expenses paid during the period under the “Actual” column. The amount listed in the “Hypothetical” column assumes a 5% annual rate of return before expenses (which is not the Fund’s actual return) and then applies the Fund’s actual expense ratio for the period to the hypothetical return. You should not use the hypothetical account values and expenses to estimate either your actual account balance at the end of the period or the expenses you paid during the period. See “Compare with other funds” below for details on how to use the hypothetical data.
Compare with other funds
Since all mutual funds are required to include the same hypothetical calculations about expenses in shareholder reports, you can use this information to compare the ongoing cost of investing in the Fund with other funds. To do so, compare the hypothetical example with the 5% hypothetical examples that appear in the shareholder reports of other funds. As you compare hypothetical examples of other funds, it is important to note that hypothetical examples are meant to highlight the ongoing costs of investing in a fund only and do not reflect any transaction costs, such as redemption or exchange fees. Therefore, the hypothetical calculations are useful in comparing ongoing costs only, and will not help you determine the relative total costs of owning different funds. If transaction costs were included in these calculations, your costs would be higher.
| March 1, 2018 — August 31, 2018 |
| | Account value at the
beginning of the
period ($) | Account value at the
end of the
period ($) | Expenses paid during
the period ($) | Fund’s annualized
expense ratio (%) |
| | Actual | Hypothetical | Actual | Hypothetical | Actual | Hypothetical | Actual |
| Class A | 1,000.00 | 1,000.00 | 1,008.40 | 1,021.32 | 3.90 | 3.92 | 0.77 |
| Institutional Class | 1,000.00 | 1,000.00 | 1,009.60 | 1,022.58 | 2.63 | 2.65 | 0.52 |
Expenses paid during the period are equal to the annualized expense ratio for each class as indicated above, multiplied by the average account value over the period and then multiplied by the number of days in the Fund’s most recent fiscal half year and divided by 365.
Expenses do not include fees and expenses incurred indirectly by the Fund from its investment in underlying funds, including affiliated and non-affiliated pooled investment vehicles, such as mutual funds and exchange-traded funds.
Had Columbia Management Investment Advisers, LLC and/or certain of its affiliates not waived/reimbursed certain fees and expenses, account value at the end of the period would have been reduced.
The Fund is offered only through certain wrap fee programs sponsored and/or managed by Ameriprise Financial, Inc. or its affiliates. Participants in wrap fee programs pay other fees that are not included in the above table. Please refer to the wrap program documents for information about the fees charged.
| 10 | Multi-Manager Total Return Bond Strategies Fund | Annual Report 2018 |
Portfolio of Investments
August 31, 2018
(Percentages represent value of investments compared to net assets)
Investments in securities
| Asset-Backed Securities — Non-Agency 14.8% |
| Issuer | Coupon
Rate | | Principal
Amount ($) | Value ($) |
| ACC Trust(a) |
| Series 2018-1 Class A |
| 12/21/2020 | 3.700% | | 1,259,570 | 1,258,220 |
| Allegro CLO VII Ltd.(a),(b) |
| Series 2018-1A Class A |
3-month USD LIBOR + 1.100%
06/13/2031 | 3.489% | | 7,500,000 | 7,499,227 |
| Ally Auto Receivables Trust |
| Series 2017-2 Class A2 |
| 11/15/2019 | 1.490% | | 753,221 | 752,787 |
| AmeriCredit Automobile Receivables Trust |
| Series 2017-1 Class B |
| 02/18/2022 | 2.300% | | 730,000 | 720,178 |
| Series 2017-3 Class B |
| 06/19/2023 | 2.240% | | 585,000 | 574,675 |
| Subordinated, Series 2016-3 Class C |
| 04/08/2022 | 2.240% | | 6,430,000 | 6,328,627 |
| Subordinated, Series 2016-4 Class B |
| 12/08/2021 | 1.830% | | 6,360,000 | 6,260,684 |
| Subordinated, Series 2017-2 Class B |
| 05/18/2022 | 2.400% | | 2,280,000 | 2,251,562 |
| Anchorage Capital CLO Ltd.(a),(b) |
| Series 2013-1A Class A1R |
3-month USD LIBOR + 1.250%
10/13/2030 | 3.587% | | 5,250,000 | 5,267,986 |
| Series 2015-6A Class AR |
3-month USD LIBOR + 1.270%
07/15/2030 | 3.609% | | 11,500,000 | 11,518,687 |
| Ares XXXIX CLO Ltd.(a),(b) |
| Series 2016-39A Class A |
3-month USD LIBOR + 1.530%
07/18/2028 | 3.863% | | 14,000,000 | 14,012,866 |
| ArrowMark Colorado Holdings(a),(b) |
| Series 2017-6A Class A1 |
3-month USD LIBOR + 1.280%
07/15/2029 | 3.619% | | 2,250,000 | 2,252,095 |
| Atlas Senior Loan Fund Ltd.(a),(b) |
| Series 2017-8A Class A |
3-month USD LIBOR + 1.300%
01/16/2030 | 3.639% | | 5,250,000 | 5,260,558 |
| Atlas Senior Loan Fund V Ltd.(a),(b) |
| Series 2014-1A Class AR2 |
3-month USD LIBOR + 1.260%
07/16/2029 | 3.599% | | 13,750,000 | 13,787,964 |
| Atrium XII(a),(b) |
| Series 2012A Class AR |
3-month USD LIBOR + 0.830%
04/22/2027 | 3.177% | | 16,975,000 | 16,908,662 |
| Asset-Backed Securities — Non-Agency (continued) |
| Issuer | Coupon
Rate | | Principal
Amount ($) | Value ($) |
| Avis Budget Rental Car Funding AESOP LLC(a) |
| Series 2013-1A Class A |
| 09/20/2019 | 1.920% | | 528,333 | 528,114 |
| Series 2014-1A Class A |
| 07/20/2020 | 2.460% | | 3,140,000 | 3,129,463 |
| Series 2015-1A Class A |
| 07/20/2021 | 2.500% | | 3,600,000 | 3,555,481 |
| Series 2015-2A Class A |
| 12/20/2021 | 2.630% | | 3,125,000 | 3,084,102 |
| Series 2016-1A Class A |
| 06/20/2022 | 2.990% | | 2,800,000 | 2,776,202 |
| Series 2016-2A Class A |
| 11/20/2022 | 2.720% | | 8,600,000 | 8,409,629 |
| Series 2017-2A Class A |
| 03/20/2024 | 2.970% | | 750,000 | 731,394 |
| Ballyrock CLO Ltd.(a),(b) |
| Series 2016-1A Class A |
3-month USD LIBOR + 1.590%
10/15/2028 | 2.406% | | 16,500,000 | 16,550,935 |
| Battalion CLO X Ltd.(a),(b) |
| Series 2016-10A Class A1 |
3-month USD LIBOR + 1.550%
01/24/2029 | 3.892% | | 4,750,000 | 4,755,605 |
| Birchwood Park CLO Ltd.(a),(b) |
| Series 2014-1A Class AR |
3-month USD LIBOR + 1.180%
07/15/2026 | 3.519% | | 2,000,000 | 2,000,510 |
| Burnham Park CLO Ltd.(a),(b) |
| Series 2016-1A Class A |
3-month USD LIBOR + 1.430%
10/20/2029 | 3.778% | | 9,500,000 | 9,515,808 |
| California Republic Auto Receivables Trust |
| Series 2016-2 Class A3 |
| 07/15/2020 | 1.560% | | 457,405 | 456,866 |
| Series 2017-1 Class A4 |
| 06/15/2022 | 2.280% | | 4,210,000 | 4,162,108 |
| Capital Auto Receivables Asset Trust(a) |
| Series 2017-1 Class A3 |
| 08/20/2021 | 2.020% | | 1,060,000 | 1,051,458 |
| Capital One Multi-Asset Execution Trust |
| Series 2015-A4 Class A4 |
| 05/15/2025 | 2.750% | | 5,665,000 | 5,593,069 |
| Series 2017-A3 Class A3 |
| 01/15/2025 | 2.430% | | 11,235,000 | 10,995,205 |
The accompanying Notes to Financial Statements are an integral part of this statement.
Multi-Manager Total Return Bond Strategies Fund | Annual Report 2018
| 11 |
Portfolio of Investments (continued)
August 31, 2018
| Asset-Backed Securities — Non-Agency (continued) |
| Issuer | Coupon
Rate | | Principal
Amount ($) | Value ($) |
| Carlyle Global Market Strategies CLO Ltd.(a),(b) |
| Series 2012-4A Class AR |
3-month USD LIBOR + 1.450%
01/20/2029 | 2.330% | | 6,250,000 | 6,262,237 |
| Series 2014-1A Class A1R2 |
3-month USD LIBOR + 0.970%
04/17/2031 | 3.306% | | 7,000,000 | 6,961,976 |
| Series 2014-3RA Class A1A |
3-month USD LIBOR + 1.050%
07/27/2031 | 3.138% | | 21,750,000 | 21,688,469 |
| CarMax Auto Owner Trust |
| Series 2016-3 Class A3 |
| 05/17/2021 | 1.390% | | 3,533,778 | 3,501,197 |
| Series 2017-2 Class A2 |
| 06/15/2020 | 1.630% | | 3,326,684 | 3,320,405 |
| Catamaran CLO Ltd.(a),(b) |
| Series 2014-1A Class A1AR |
3-month USD LIBOR + 1.260%
04/22/2030 | 3.608% | | 13,750,000 | 13,749,931 |
| Chancelight, Inc.(a),(b) |
| Series 2012-2 Class A |
1-month USD LIBOR + 0.730%
04/25/2039 | 2.795% | | 1,176,952 | 1,179,273 |
| CIFC Funding Ltd.(a),(b) |
| Series 2015-1A Class ARR |
3-month USD LIBOR + 1.110%
01/22/2031 | 3.457% | | 7,000,000 | 6,989,500 |
| Series 2015-3A Class AR |
3-month USD LIBOR + 0.870%
04/19/2029 | 3.212% | | 6,000,000 | 5,976,102 |
| Series 2018-2A Class A1 |
3-month USD LIBOR + 1.040%
04/20/2031 | 3.093% | | 12,000,000 | 11,966,880 |
| CIG Auto Receivables Trust(a) |
| Series 2017-1A |
| 05/15/2023 | 2.710% | | 610,820 | 607,050 |
| CIT Education Loan Trust(a),(b) |
| Series 2007-1 Class B |
3-month USD LIBOR + 0.300%
06/25/2042 | 2.635% | | 757,808 | 686,331 |
| CIT Mortgage Loan Trust(a),(b) |
| Series 2007-1 Class 1A |
1-month USD LIBOR + 1.350%
10/25/2037 | 3.415% | | 8,654,138 | 8,721,702 |
| CPS Auto Receivables Trust(a) |
| Series 2018-A Class C |
| 12/15/2023 | 3.050% | | 625,000 | 619,330 |
| Subordinated, Series 2016-B Class B |
| 09/15/2020 | 3.180% | | 1,429,154 | 1,431,179 |
| Asset-Backed Securities — Non-Agency (continued) |
| Issuer | Coupon
Rate | | Principal
Amount ($) | Value ($) |
| Subordinated, Series 2017-C Class B |
| 07/15/2021 | 2.300% | | 1,310,000 | 1,302,476 |
| Credit Acceptance Auto Loan Trust(a) |
| Series 2016-3A Class A |
| 04/15/2024 | 2.150% | | 2,130,000 | 2,118,884 |
| Series 2017-1A Class A |
| 10/15/2025 | 2.560% | | 685,000 | 681,683 |
| Series 2017-3A Class A |
| 06/15/2026 | 2.650% | | 1,785,000 | 1,765,713 |
| Series 2018-2A Class A |
| 05/17/2027 | 3.470% | | 515,000 | 516,380 |
| Subordinated, Series 2016-2A Class B |
| 05/15/2024 | 3.180% | | 6,300,000 | 6,302,761 |
| Diamond Resorts Owner Trust(a) |
| Series 2018-1 Class A |
| 01/21/2031 | 3.700% | | 4,860,000 | 4,872,791 |
| Drive Auto Receivables Trust |
| Series 2017-3 Class C |
| 07/15/2022 | 2.800% | | 1,515,000 | 1,510,360 |
| Subordinated, Series 2018-1 Class B |
| 02/15/2022 | 2.880% | | 4,305,000 | 4,295,442 |
| Drive Auto Receivables Trust(a) |
| Series 2017-AA Class C |
| 01/18/2022 | 2.980% | | 1,240,000 | 1,239,809 |
| Subordinated, Series 2016-BA Class C |
| 07/15/2022 | 3.190% | | 4,538,476 | 4,544,026 |
| Subordinated, Series 2016-CA Class B |
| 11/16/2020 | 2.370% | | 411,593 | 411,520 |
| Dryden 33 Senior Loan Fund(a),(b) |
| Series 2014-33A Class AR |
3-month USD LIBOR + 1.430%
10/15/2028 | 3.769% | | 5,000,000 | 5,012,515 |
| DT Auto Owner Trust(a) |
| Series 2017-3A Class B |
| 05/17/2021 | 2.400% | | 2,600,000 | 2,592,117 |
| Series 2018-2A Class C |
| 03/15/2024 | 3.670% | | 4,120,000 | 4,125,295 |
| Subordinated, Series 2016-4A Class C |
| 10/17/2022 | 2.740% | | 8,658,394 | 8,655,003 |
| Subordinated, Series 2017-1 Class C |
| 11/15/2022 | 2.700% | | 300,000 | 298,801 |
| Earnest Student Loan Program LLC(a),(b) |
| Series 2016-D Class A1 |
1-month USD LIBOR + 1.400%
01/25/2041 | 3.465% | | 368,821 | 372,001 |
The accompanying Notes to Financial Statements are an integral part of this statement.
| 12 | Multi-Manager Total Return Bond Strategies Fund | Annual Report 2018 |
Portfolio of Investments (continued)
August 31, 2018
| Asset-Backed Securities — Non-Agency (continued) |
| Issuer | Coupon
Rate | | Principal
Amount ($) | Value ($) |
| Education Loan Asset-Backed Trust I(a),(b) |
| Series 2013-1 Class A2 |
1-month USD LIBOR + 0.800%
04/26/2032 | 2.865% | | 4,650,000 | 4,671,735 |
| Educational Funding of the South, Inc.(b) |
| Series 2011-1 Class A2 |
3-month USD LIBOR + 0.650%
04/25/2035 | 2.985% | | 2,475,298 | 2,477,887 |
| EFS Volunteer No. 2 LLC(a),(b) |
| Series 2012-1 Class A2 |
1-month USD LIBOR + 1.350%
03/25/2036 | 3.415% | | 2,700,000 | 2,745,126 |
| Elevation CLO Ltd.(a),(b) |
| Series 2014-2A Class A1R |
3-month USD LIBOR + 1.230%
10/15/2029 | 3.569% | | 13,000,000 | 13,041,665 |
| Series 2017-7A Class A |
3-month USD LIBOR + 1.220%
07/15/2030 | 3.559% | | 4,750,000 | 4,752,157 |
| Ellington CLO II Ltd.(a),(b) |
| Series 2017-2A Class A |
3-month USD LIBOR + 1.700%
02/15/2029 | 4.014% | | 20,000,000 | 20,114,860 |
| Enterprise Fleet Financing LLC(a) |
| Series 2016-2 Class A2 |
| 02/22/2022 | 1.740% | | 664,992 | 662,522 |
| Exeter Automobile Receivables Trust(a) |
| Series 2017-3A Class A |
| 12/15/2021 | 2.050% | | 1,295,212 | 1,289,705 |
| Series 2018-1A Class B |
| 04/15/2022 | 2.750% | | 2,685,000 | 2,663,714 |
| Series 2018-2A Class B |
| 05/16/2022 | 3.270% | | 5,400,000 | 5,390,540 |
| Subordinated, Series 2017-2A Class B |
| 05/16/2022 | 2.820% | | 1,760,000 | 1,750,755 |
| Fifth Third Auto Trust |
| Series 2017-1 Class A2A |
| 04/15/2020 | 1.590% | | 1,227,468 | 1,224,915 |
| First Investors Auto Owner Trust(a) |
| Series 2017-1A Class A2 |
| 03/15/2022 | 2.200% | | 2,170,000 | 2,153,968 |
| Flagship CLO VII Ltd.(a),(b) |
| Series 2014-8A Class ARR |
3-month USD LIBOR + 0.850%
01/16/2026 | 3.189% | | 10,000,000 | 9,977,810 |
| Flagship Credit Auto Trust(a) |
| Subordinated, Series 2015-3 Class B |
| 03/15/2022 | 3.680% | | 827,000 | 830,984 |
| Subordinated, Series 2016-2 |
| 09/15/2022 | 3.840% | | 1,855,000 | 1,860,198 |
| Asset-Backed Securities — Non-Agency (continued) |
| Issuer | Coupon
Rate | | Principal
Amount ($) | Value ($) |
| Subordinated, Series 2016-3 Class B |
| 06/15/2021 | 2.430% | | 2,195,000 | 2,184,266 |
| Subordinated, Series 2016-4 Class B |
| 10/15/2021 | 2.410% | | 1,160,000 | 1,147,570 |
| Subordinated, Series 2018-2 Class B |
| 05/15/2023 | 3.560% | | 3,869,000 | 3,871,576 |
| Ford Credit Auto Owner Trust(a) |
| Series 2015-1 Class A |
| 07/15/2026 | 2.120% | | 5,574,000 | 5,509,595 |
| Series 2015-2 Class A |
| 01/15/2027 | 2.440% | | 2,655,000 | 2,626,376 |
| Series 2016-1 Class A |
| 08/15/2027 | 2.310% | | 6,960,000 | 6,822,182 |
| Series 2016-2 Class A |
| 12/15/2027 | 2.030% | | 16,140,000 | 15,631,359 |
| Series 2017-2 Class A |
| 03/15/2029 | 2.360% | | 7,075,000 | 6,815,646 |
| Series 2018-1 Class A |
| 07/15/2031 | 3.190% | | 7,110,000 | 6,983,028 |
| Ford Credit Auto Owner Trust |
| Series 2016-B Class A3 |
| 10/15/2020 | 1.330% | | 1,219,604 | 1,213,311 |
| Ford Credit Floorplan Master Owner Trust(a) |
| Series 2013-2 Class A |
| 03/15/2022 | 2.090% | | 3,775,000 | 3,723,475 |
| Ford Credit Floorplan Master Owner Trust |
| Series 2017-3 Class A |
| 09/15/2024 | 2.480% | | 9,600,000 | 9,328,665 |
| Galaxy XXIX CLO Ltd.(a),(b) |
| Series 2018-29A Class A |
3-month USD LIBOR + 0.790%
11/15/2026 | 3.104% | | 11,250,000 | 11,208,465 |
| Global SC Finance II SRL(a) |
| Series 2014-1A Class A2 |
| 07/17/2029 | 3.090% | | 2,269,042 | 2,211,294 |
| GM Financial Automobile Leasing Trust |
| Series 2016-2 Class A3 |
| 09/20/2019 | 1.620% | | 1,614,787 | 1,612,418 |
| Series 2017-3 Class A2A |
| 01/21/2020 | 1.720% | | 2,059,918 | 2,052,042 |
| Goal Capital Funding Trust(b) |
| Series 2006-1 Class B |
3-month USD LIBOR + 0.450%
08/25/2042 | 2.761% | | 978,223 | 911,039 |
| Greenwood Park CLO Ltd.(a),(b) |
| Series 2018-1A Class A2 |
3-month USD LIBOR + 1.010%
04/15/2031 | 3.035% | | 15,000,000 | 14,966,610 |
The accompanying Notes to Financial Statements are an integral part of this statement.
Multi-Manager Total Return Bond Strategies Fund | Annual Report 2018
| 13 |
Portfolio of Investments (continued)
August 31, 2018
| Asset-Backed Securities — Non-Agency (continued) |
| Issuer | Coupon
Rate | | Principal
Amount ($) | Value ($) |
| Henderson Receivables LLC(a) |
| Series 2013-3A Class A |
| 01/17/2073 | 4.080% | | 2,185,787 | 2,217,767 |
| Series 2014-2A Class A |
| 01/17/2073 | 3.610% | | 2,689,105 | 2,602,527 |
| Hertz Vehicle Financing II LP(a) |
| Series 2015-1A Class A |
| 03/25/2021 | 2.730% | | 5,500,000 | 5,453,823 |
| Series 2015-3A Class A |
| 09/25/2021 | 2.670% | | 1,390,000 | 1,368,532 |
| Series 2016-1A Class A |
| 03/25/2020 | 2.320% | | 1,620,000 | 1,614,686 |
| Series 2016-2A Class A |
| 03/25/2022 | 2.950% | | 6,270,000 | 6,184,107 |
| Series 2016-3A Class A |
| 07/25/2020 | 2.270% | | 4,080,000 | 4,053,393 |
| Higher Education Funding I(a),(b) |
| Series 2014-1 Class A |
3-month USD LIBOR + 1.050%
05/25/2034 | 3.361% | | 3,818,318 | 3,844,380 |
| ICG US CLO Ltd.(a),(b) |
| Series 2017-2A Class A1 |
3-month USD LIBOR + 1.280%
10/23/2029 | 3.627% | | 1,000,000 | 1,001,790 |
| Jamestown CLO IX Ltd.(a),(b) |
| Series 2016-9A Class A1B |
3-month USD LIBOR + 1.500%
10/20/2028 | 2.320% | | 18,400,000 | 18,403,514 |
| KKR CLO Ltd.(a),(b) |
| Series 2018 Class A |
3-month USD LIBOR + 1.270%
07/18/2030 | 3.603% | | 9,000,000 | 9,014,589 |
| KVK CLO Ltd.(a),(b) |
| Series 2014-1A Class A1R |
3-month USD LIBOR + 1.300%
05/15/2026 | 3.614% | | 4,207,902 | 4,210,851 |
| Series 2018-1A Class A |
3-month USD LIBOR + 0.930%
05/20/2029 | 3.261% | | 17,000,000 | 16,874,727 |
| Lendmark Funding Trust(a) |
| Series 2016-2A Class A |
| 04/21/2025 | 3.260% | | 1,100,000 | 1,100,423 |
| Series 2017-1A Class A |
| 12/22/2025 | 2.830% | | 2,060,000 | 2,052,212 |
| Series 2018-1A Class A |
| 12/21/2026 | 3.810% | | 7,200,000 | 7,233,060 |
| Asset-Backed Securities — Non-Agency (continued) |
| Issuer | Coupon
Rate | | Principal
Amount ($) | Value ($) |
| Magnetite VII Ltd.(a),(b) |
| Series 2012-7A Class A1R2 |
3-month USD LIBOR + 0.800%
01/15/2028 | 3.139% | | 710,000 | 705,742 |
| Magnetite XI Ltd.(a),(b) |
| Series 2014-11A Class A1R |
3-month USD LIBOR + 1.120%
01/18/2027 | 3.453% | | 5,000,000 | 5,001,035 |
| Mariner CLO 5 Ltd.(a),(b) |
| Series 2018-5A Class A |
3-month USD LIBOR + 1.110%
04/25/2031 | 3.324% | | 5,500,000 | 5,476,168 |
| Mariner Finance Issuance Trust(a) |
| Series 2017-BA Class A |
| 12/20/2029 | 2.920% | | 6,145,000 | 6,059,337 |
| Mercedes-Benz Auto Lease Trust |
| Series 2017-A Class A2A |
| 08/15/2019 | 1.530% | | 2,969,806 | 2,967,407 |
| Merlin Aviation Holdings DAC(a) |
| Series 2016-1 Class A |
| 12/15/2032 | 4.500% | | 2,722,730 | 2,760,025 |
| Midocean Credit CLO VIII(a),(b) |
| Series 2018-8A Class A1 |
3-month USD LIBOR + 1.150%
02/20/2031 | 3.037% | | 8,000,000 | 7,987,392 |
| Series 2018-8A Class B |
3-month USD LIBOR + 1.650%
02/20/2031 | 3.537% | | 6,600,000 | 6,599,927 |
| Mid-State Capital Corp. Trust(a) |
| Series 2006-1 Class A |
| 10/15/2040 | 5.787% | | 1,125,556 | 1,229,527 |
| Mid-State Trust VII |
| Series 7 Class A (AMBAC) |
| 12/15/2036 | 6.340% | | 1,357,349 | 1,447,370 |
| Mountain View CLO LLC(a),(b) |
| Series 2017-2A Class A |
3-month USD LIBOR + 1.210%
01/16/2031 | 3.549% | | 6,500,000 | 6,499,863 |
| Mountain View CLO Ltd.(a),(b) |
| Series 2015-9A Class A1R |
3-month USD LIBOR + 1.120%
07/15/2031 | 3.169% | | 15,000,000 | 14,983,455 |
| Navient Student Loan Trust(b) |
| Series 2014-2 Class A |
1-month USD LIBOR + 0.640%
03/25/2083 | 2.705% | | 6,283,420 | 6,246,889 |
| Series 2014-3 Class A |
1-month USD LIBOR + 0.620%
03/25/2083 | 2.685% | | 6,382,438 | 6,353,478 |
The accompanying Notes to Financial Statements are an integral part of this statement.
| 14 | Multi-Manager Total Return Bond Strategies Fund | Annual Report 2018 |
Portfolio of Investments (continued)
August 31, 2018
| Asset-Backed Securities — Non-Agency (continued) |
| Issuer | Coupon
Rate | | Principal
Amount ($) | Value ($) |
| Series 2014-4 Class A |
1-month USD LIBOR + 0.620%
03/25/2083 | 2.685% | | 2,832,431 | 2,830,119 |
| Series 2015-2 Class A3 |
1-month USD LIBOR + 0.570%
11/26/2040 | 2.635% | | 5,400,000 | 5,399,995 |
| Navient Student Loan Trust(a),(b) |
| Series 2017-1A Class A3 |
1-month USD LIBOR + 1.150%
07/26/2066 | 3.215% | | 3,530,000 | 3,617,374 |
| Series 2017-3A Class A3 |
1-month USD LIBOR + 1.050%
07/26/2066 | 3.115% | | 13,281,000 | 13,578,629 |
| Series 2017-5A Class A |
1-month USD LIBOR + 0.800%
07/26/2066 | 2.865% | | 12,540,295 | 12,666,924 |
| Nelnet Student Loan Trust(a),(b) |
| Series 2012-5A Class A |
1-month USD LIBOR + 0.600%
10/27/2036 | 2.665% | | 1,826,732 | 1,822,760 |
| Series 2014-4A Class A2 |
1-month USD LIBOR + 0.950%
11/25/2048 | 3.015% | | 4,210,000 | 4,240,355 |
| Series 2015-1A Class A |
1-month USD LIBOR + 0.590%
04/25/2046 | 2.655% | | 6,171,794 | 6,171,788 |
| Neuberger Berman CLO XVI-S Ltd.(a),(b) |
| Series 2017-16SA Class A |
3-month USD LIBOR + 0.850%
01/15/2028 | 3.189% | | 7,000,000 | 6,969,221 |
| NextGear Floorplan Master Owner Trust(a) |
| Series 2016-1A Class A2 |
| 04/15/2021 | 2.740% | | 3,380,000 | 3,377,853 |
| Series 2016-2A Class A2 |
| 09/15/2021 | 2.190% | | 1,845,000 | 1,830,074 |
| Series 2017-1A Class A2 |
| 04/18/2022 | 2.540% | | 2,990,000 | 2,959,571 |
| Series 2017-2A Class A2 |
| 10/17/2022 | 2.560% | | 595,000 | 585,965 |
| Series 2018-1A Class A2 |
| 02/15/2023 | 3.220% | | 2,230,000 | 2,221,901 |
| Nissan Auto Receivables Owner Trust |
| Series 2016-B Class A3 |
| 01/15/2021 | 1.320% | | 1,556,004 | 1,544,106 |
| Nissan Master Owner Trust Receivables(b) |
| Series 2017-A Class A |
1-month USD LIBOR + 0.310%
04/15/2021 | 2.373% | | 8,300,000 | 8,308,269 |
| Asset-Backed Securities — Non-Agency (continued) |
| Issuer | Coupon
Rate | | Principal
Amount ($) | Value ($) |
| OCP CLO Ltd.(a),(b) |
| Series 2017-13A Class A1A |
3-month USD LIBOR + 1.260%
07/15/2030 | 3.599% | | 4,500,000 | 4,508,528 |
| Octagon Investment Partners 25 Ltd.(a),(b) |
| Series 2015-1A Class AR |
3-month USD LIBOR + 0.800%
10/20/2026 | 3.148% | | 5,000,000 | 4,968,845 |
| Octagon Investment Partners 30 Ltd.(a),(b) |
| Series 2017-1A Class A1 |
3-month USD LIBOR + 1.320%
03/17/2030 | 3.668% | | 2,000,000 | 2,008,626 |
| OneMain Direct Auto Receivables Trust(a) |
| Series 2017-1A Class B |
| 06/15/2021 | 2.880% | | 2,600,000 | 2,574,989 |
| Subordinated Series 2018-1A Class B |
| 04/14/2025 | 3.710% | | 11,400,000 | 11,404,934 |
| Subordinated, Series 2017-2A Class D |
| 10/15/2024 | 3.420% | | 1,200,000 | 1,182,918 |
| OneMain Financial Issuance Trust(a) |
| Series 2015-1A Class A |
| 03/18/2026 | 3.190% | | 2,133,613 | 2,137,496 |
| Series 2015-2A Class A |
| 07/18/2025 | 2.570% | | 470,711 | 470,673 |
| Series 2018-1A Class A |
| 03/14/2029 | 3.300% | | 16,615,000 | 16,556,823 |
| Subordinated, Series 2017-1A Class B |
| 09/14/2032 | 2.790% | | 1,000,000 | 968,412 |
| Subordinated, Series 2017-1A Class C |
| 09/14/2032 | 3.350% | | 800,000 | 787,173 |
| OZLM Funding IV Ltd.(a),(b) |
| Series 2013-4A |
3-month USD LIBOR + 1.250%
10/22/2030 | 3.597% | | 14,000,000 | 14,036,106 |
| Palmer Square CLO Ltd.(a),(b) |
| Series 2014-1A Class A1R2 |
3-month USD LIBOR + 1.130%
01/17/2031 | 3.466% | | 8,000,000 | 8,002,016 |
| Series 2015-2A Class A1AR |
3-month USD LIBOR + 1.270%
07/20/2030 | 3.618% | | 10,500,000 | 10,520,212 |
| Park Avenue Institutional Advisers CLO Ltd.(a),(b) |
| Series 2017-1A Class A1 |
3-month USD LIBOR + 1.220%
11/14/2029 | 3.539% | | 6,000,000 | 6,007,062 |
| Planet Fitness Master Issuer LLC(a) |
| Series 2018-1A Class A2II |
| 09/05/2048 | 4.666% | | 8,350,000 | 8,336,666 |
The accompanying Notes to Financial Statements are an integral part of this statement.
Multi-Manager Total Return Bond Strategies Fund | Annual Report 2018
| 15 |
Portfolio of Investments (continued)
August 31, 2018
| Asset-Backed Securities — Non-Agency (continued) |
| Issuer | Coupon
Rate | | Principal
Amount ($) | Value ($) |
| Prestige Auto Receivables Trust(a) |
| Series 2016-2A Class A3 |
| 01/15/2021 | 1.760% | | 6,300,000 | 6,281,281 |
| Regatta VII Funding Ltd.(a),(b) |
| Series 2016-1A Class A1 |
3-month USD LIBOR + 1.520%
12/20/2028 | 3.845% | | 10,000,000 | 10,004,420 |
| Santander Drive Auto Receivables Trust |
| Series 2016-3 Class B |
| 06/15/2021 | 1.890% | | 4,095,000 | 4,083,238 |
| Series 2018-1 Class B |
| 07/15/2022 | 2.630% | | 4,615,000 | 4,590,347 |
| Series 2018-2 Class B |
| 09/15/2022 | 3.030% | | 3,275,000 | 3,266,064 |
| Subordinated, Series 2016-2 Class C |
| 11/15/2021 | 2.660% | | 2,775,000 | 2,767,220 |
| Subordinated, Series 2017-3 Class C |
| 12/15/2022 | 2.760% | | 1,200,000 | 1,186,262 |
| SCF Equipment Leasing LLC(a) |
| Series 2018-1A Class A2 |
| 10/20/2024 | 3.630% | | 7,692,000 | 7,703,215 |
| Scholar Funding Trust(a),(b) |
| Series 2011-A Class A |
3-month USD LIBOR + 0.900%
10/28/2043 | 3.239% | | 670,526 | 672,143 |
| Shackleton VII CLO Ltd.(a),(b) |
| Series 2015-7RA Class A1 |
3-month USD LIBOR + 1.170%
07/15/2031 | 3.509% | | 10,250,000 | 10,249,385 |
| Shackleton VR CLO Ltd.(a),(b) |
| Series 2014-5RA Class A |
3-month USD LIBOR + 1.100%
05/07/2031 | 3.463% | | 11,000,000 | 10,975,261 |
| Sierra Receivables Funding Co., LLC(a) |
| Series 2017-1A Class A |
| 03/20/2034 | 2.910% | | 845,805 | 838,825 |
| S-Jets Ltd.(a) |
| Series 2017-1 Class A |
| 08/15/2042 | 3.970% | | 2,179,333 | 2,171,738 |
| SLM Student Loan Trust(a),(b) |
| Series 2004-3 Class A6A |
3-month USD LIBOR + 0.550%
10/25/2064 | 2.885% | | 5,120,000 | 5,115,421 |
| SLM Student Loan Trust(b) |
| Series 2008-2 Class A3 |
3-month USD LIBOR + 0.750%
04/25/2023 | 3.085% | | 4,622,330 | 4,615,910 |
| Series 2008-2 Class B |
3-month USD LIBOR + 1.200%
01/25/2083 | 3.535% | | 1,165,000 | 1,141,877 |
| Asset-Backed Securities — Non-Agency (continued) |
| Issuer | Coupon
Rate | | Principal
Amount ($) | Value ($) |
| Series 2008-3 Class B |
3-month USD LIBOR + 1.200%
04/26/2083 | 3.535% | | 1,165,000 | 1,138,610 |
| Series 2008-4 Class B |
3-month USD LIBOR + 1.850%
04/25/2073 | 4.185% | | 1,165,000 | 1,192,584 |
| Series 2008-5 Class B |
3-month USD LIBOR + 1.850%
07/25/2073 | 4.185% | | 4,060,000 | 4,202,459 |
| Series 2008-6 Class B |
3-month USD LIBOR + 1.850%
07/26/2083 | 4.185% | | 1,165,000 | 1,197,808 |
| Series 2008-7 Class B |
3-month USD LIBOR + 1.850%
07/26/2083 | 4.185% | | 1,165,000 | 1,194,529 |
| Series 2008-8 Class B |
3-month USD LIBOR + 2.250%
10/25/2075 | 4.585% | | 1,165,000 | 1,231,734 |
| Series 2008-9 Class B |
3-month USD LIBOR + 2.250%
10/25/2083 | 4.585% | | 1,165,000 | 1,210,946 |
| Series 2011-1 Class A2 |
1-month USD LIBOR + 1.150%
10/25/2034 | 3.215% | | 3,285,000 | 3,361,116 |
| Series 2012-2 Class A |
1-month USD LIBOR + 0.700%
01/25/2029 | 2.765% | | 7,507,067 | 7,468,914 |
| Series 2012-7 Class A3 |
1-month USD LIBOR + 0.650%
05/26/2026 | 2.715% | | 3,690,768 | 3,653,833 |
| Series 2013-2 Class A |
1-month USD LIBOR + 0.450%
09/25/2043 | 2.515% | | 4,828,408 | 4,834,106 |
| SoFi Consumer Loan Program Trust(a) |
| Series 2018-1 Class A2 |
| 02/25/2027 | 3.140% | | 3,025,000 | 3,005,885 |
| Series 2018-2 Class A2 |
| 04/26/2027 | 3.350% | | 9,785,000 | 9,805,571 |
| SoFi Professional Loan Program LLC(a) |
| Series 2016-B Class A2B |
| 10/25/2032 | 2.740% | | 2,331,275 | 2,301,414 |
| Series 2016-C Class A2B |
| 12/27/2032 | 2.360% | | 1,405,000 | 1,378,404 |
| Series 2017-A Class A2B |
| 03/26/2040 | 2.400% | | 805,000 | 782,749 |
| Series 2017-D Class A2FX |
| 09/25/2040 | 2.650% | | 1,500,000 | 1,462,944 |
| Series 2017-E Class A2B |
| 11/26/2040 | 2.720% | | 205,000 | 199,318 |
The accompanying Notes to Financial Statements are an integral part of this statement.
| 16 | Multi-Manager Total Return Bond Strategies Fund | Annual Report 2018 |
Portfolio of Investments (continued)
August 31, 2018
| Asset-Backed Securities — Non-Agency (continued) |
| Issuer | Coupon
Rate | | Principal
Amount ($) | Value ($) |
| Series 2018-A Class A2B |
| 02/25/2042 | 2.950% | | 335,000 | 328,537 |
| SoFi Professional Loan Program LLC(a),(b) |
| Series 2016-D Class A1 |
1-month USD LIBOR + 0.950%
01/25/2039 | 3.015% | | 387,970 | 390,166 |
| Sound Point CLO II Ltd.(a),(b) |
| Series 2013-1A Class A1R |
3-month USD LIBOR + 1.070%
01/26/2031 | 3.405% | | 6,000,000 | 5,979,270 |
| Sound Point CLO XII Ltd.(a),(b) |
| Series 2016-2A Class A |
3-month USD LIBOR + 1.660%
10/20/2028 | 4.008% | | 15,000,000 | 15,002,835 |
| Sound Point CLO XVI Ltd.(a),(b) |
| Series 2017-2A Class A |
3-month USD LIBOR + 1.280%
07/25/2030 | 3.615% | | 6,250,000 | 6,257,125 |
| Springleaf Funding Trust(a) |
| Series 2015-AA Class A |
| 11/15/2024 | 3.160% | | 1,604,792 | 1,604,217 |
| Series 2016-AA Class A |
| 11/15/2029 | 2.900% | | 10,200,000 | 10,201,327 |
| Series 2017-AA Class A |
| 07/15/2030 | 2.680% | | 4,500,000 | 4,424,472 |
| Subordinated, Series 2017-AA Class B |
| 07/15/2030 | 3.100% | | 600,000 | 587,041 |
| Symphony CLO V Ltd.(a),(b) |
| Series 2007-5A Class A1 |
3-month USD LIBOR + 0.750%
01/15/2024 | 3.089% | | 582,212 | 582,403 |
| Synchrony Credit Card Master Note Trust |
| Series 2017-2 Class A |
| 10/15/2025 | 2.620% | | 5,400,000 | 5,252,448 |
| Telos CLO Ltd.(a),(b) |
| Series 2013-4A Class AR |
3-month USD LIBOR + 1.240%
01/17/2030 | 3.576% | | 13,000,000 | 12,976,626 |
| TIAA CLO I Ltd.(a),(b) |
| Series 2016-1A Class AR |
3-month USD LIBOR + 1.200%
07/20/2031 | 3.548% | | 6,750,000 | 6,749,851 |
| TICP CLO I Ltd.(a),(b) |
| Series 2015-1A Class BR |
3-month USD LIBOR + 1.300%
07/20/2027 | 3.648% | | 10,000,000 | 9,987,900 |
| TICP CLO IX Ltd.(a),(b) |
| Series 2017-9A Class A |
3-month USD LIBOR + 1.140%
01/20/2031 | 3.488% | | 10,000,000 | 9,984,980 |
| Asset-Backed Securities — Non-Agency (continued) |
| Issuer | Coupon
Rate | | Principal
Amount ($) | Value ($) |
| Toyota Auto Receivables Owner Trust |
| Series 2016-B Class A3 |
| 04/15/2020 | 1.300% | | 647,377 | 644,507 |
| Toyota Auto Receivables Owner Trust(b) |
| Series 2017-B Class A2B |
1-month USD LIBOR + 0.060%
01/15/2020 | 2.123% | | 1,848,434 | 1,848,549 |
| Trinitas CLO VI Ltd.(a),(b) |
| Series 2017-6A Class A |
3-month USD LIBOR + 1.320%
07/25/2029 | 3.655% | | 6,000,000 | 6,008,976 |
| Trinitas CLO VII Ltd.(a),(b) |
| Series 2017-7A Class B |
3-month USD LIBOR + 1.600%
01/25/2031 | 3.935% | | 9,000,000 | 8,997,300 |
| Trintas CLO Ltd.(a),(b) |
| Series 2016-5A Class A |
3-month USD LIBOR + 1.700%
10/25/2028 | 4.035% | | 16,175,000 | 16,178,284 |
| Verizon Owner Trust(a) |
| Series 2016-1A Class A |
| 01/20/2021 | 1.420% | | 752,825 | 749,227 |
| Voya CLO Ltd.(a),(b) |
| Series 2013-1A Class A1AR |
3-month USD LIBOR + 1.210%
10/15/2030 | 3.549% | | 7,500,000 | 7,522,365 |
| Series 2016-1A Class A1R |
3-month USD LIBOR + 1.070%
01/20/2031 | 2.787% | | 10,000,000 | 9,990,010 |
| Voya Ltd.(a),(b) |
| Series 2012-4A Class A1R |
3-month USD LIBOR + 1.450%
10/15/2028 | 3.789% | | 7,000,000 | 7,004,389 |
| Series 2013-3A Class A1R |
3-month USD LIBOR + 1.050%
01/18/2026 | 3.383% | | 3,467,901 | 3,468,528 |
| Wachovia Student Loan Trust(a),(b) |
| Series 2006-1 Class A6 |
3-month USD LIBOR + 0.170%
04/25/2040 | 2.505% | | 9,000,000 | 8,813,205 |
| Wellfleet CLO Ltd.(a),(b) |
| Series 2016-2A Class A1 |
3-month USD LIBOR + 1.650%
10/20/2028 | 2.507% | | 4,250,000 | 4,252,338 |
| Series 2018-1A Class SUB |
3-month USD LIBOR + 1.100%
07/17/2031 | 3.500% | | 17,000,000 | 16,903,627 |
| Westcott Park CLO Ltd.(a),(b) |
| Series 2016-1A Class A |
3-month USD LIBOR + 1.530%
07/20/2028 | 3.878% | | 15,000,000 | 15,014,010 |
The accompanying Notes to Financial Statements are an integral part of this statement.
Multi-Manager Total Return Bond Strategies Fund | Annual Report 2018
| 17 |
Portfolio of Investments (continued)
August 31, 2018
| Asset-Backed Securities — Non-Agency (continued) |
| Issuer | Coupon
Rate | | Principal
Amount ($) | Value ($) |
| Westlake Automobile Receivables Trust(a) |
| Series 2018-1A Class B |
| 05/17/2021 | 2.670% | | 5,610,000 | 5,583,697 |
| World Financial Network Credit Card Master Trust |
| Series 2012-D Class A |
| 04/17/2023 | 2.150% | | 2,150,000 | 2,138,584 |
| Series 2015-B Class A |
| 06/17/2024 | 2.550% | | 5,030,000 | 4,971,347 |
| Zais CLO 8 Ltd.(a),(b) |
| Series 2018-1A Class A |
3-month USD LIBOR + 0.950%
04/15/2029 | 3.075% | | 5,500,000 | 5,482,625 |
| Zais CLO 9 Ltd.(a),(b) |
| Series 2018-2A Class A |
3-month USD LIBOR + 1.200%
07/20/2031 | 3.720% | | 13,000,000 | 12,999,246 |
| Zais CLO Ltd.(a),(b) |
| Series 2017-2A Class A |
3-month USD LIBOR + 1.290%
04/15/2030 | 3.629% | | 4,000,000 | 4,019,212 |
Total Asset-Backed Securities — Non-Agency
(Cost $1,184,545,293) | 1,182,986,458 |
|
| Commercial Mortgage-Backed Securities - Agency 3.1% |
| | | | |
| Federal Home Loan Mortgage Corp. |
| 01/01/2027 | 3.275% | | 2,980,215 | 2,954,759 |
| 08/01/2031 | 3.513% | | 2,787,737 | 2,734,549 |
| Federal Home Loan Mortgage Corp. Multifamily Structured Pass-Through Certificates(c),(d) |
| CMO Series K028 Class X1 |
| 02/25/2023 | 0.424% | | 123,139,745 | 1,358,552 |
| CMO Series K055 Class X1 |
| 03/25/2026 | 1.501% | | 2,152,371 | 182,632 |
| CMO Series K057 Class X1 |
| 07/25/2026 | 1.326% | | 2,520,024 | 190,324 |
| CMO Series K059 Class X1 |
| 09/25/2026 | 0.436% | | 7,404,054 | 160,292 |
| CMO Series K060 Class X1 |
| 10/25/2026 | 0.204% | | 26,818,901 | 194,062 |
| CMO Series K152 Class X1 |
| 01/25/2031 | 0.952% | | 4,385,259 | 369,005 |
| CMO Series K718 Class X1 |
| 01/25/2022 | 0.760% | | 23,176,343 | 419,214 |
| Series K069 Class X1 |
| 09/25/2027 | 0.496% | | 39,484,889 | 1,171,568 |
| Series K728 Class X1 |
| 08/25/2024 | 0.532% | | 289,693,287 | 6,159,690 |
| Series K729 Class X1 |
| 10/25/2024 | 0.492% | | 182,995,139 | 3,497,861 |
| Commercial Mortgage-Backed Securities - Agency (continued) |
| Issuer | Coupon
Rate | | Principal
Amount ($) | Value ($) |
| Federal Home Loan Mortgage Corp. Multifamily Structured Pass-Through Certificates(c) |
| Series 2017-K070 Class A2 |
| 11/25/2027 | 3.303% | | 3,330,000 | 3,306,431 |
| Federal Home Loan Mortgage Corp. Multifamily Structured Pass-Through Certificates |
| Series K055 Class A2 |
| 03/25/2026 | 2.673% | | 9,110,000 | 8,768,327 |
| Series K056 Class A2 |
| 05/25/2026 | 2.525% | | 6,137,000 | 5,838,551 |
| Series K155 Class A3 |
| 04/25/2033 | 3.750% | | 6,935,000 | 7,031,253 |
| Series KJ18 Class A1 |
| 03/25/2022 | 2.455% | | 5,078,096 | 5,013,572 |
| Series KP03 Class A2 |
| 07/25/2019 | 1.780% | | 495,643 | 492,767 |
| Federal Home Loan Mortgage Corp. Multifamily Structured Pass-Through Certificates(b) |
| Series KF34 Class A |
1-month USD LIBOR + 0.360%
08/25/2024 | 2.450% | | 3,758,486 | 3,758,483 |
| Federal National Mortgage Association |
| 09/01/2020 | 3.601% | | 3,938,355 | 3,984,063 |
| 12/01/2020 | 3.574% | | 1,631,021 | 1,647,656 |
| 12/01/2020 | 3.772% | | 5,070,834 | 5,151,125 |
| 04/01/2021 | 4.250% | | 3,730,000 | 3,835,536 |
| 04/01/2021 | 4.380% | | 3,172,558 | 3,258,641 |
| 06/01/2021 | 4.377% | | 3,667,494 | 3,782,524 |
| 08/01/2022 | 2.668% | | 6,829,980 | 6,756,801 |
| 04/01/2023 | 2.610% | | 12,585,407 | 12,369,507 |
| 06/01/2023 | 4.650% | | 2,835,818 | 2,982,480 |
| 03/01/2024 | 3.550% | | 3,091,010 | 3,131,424 |
| 04/01/2027 | 3.320% | | 3,771,000 | 3,756,932 |
| 03/01/2028 | 3.690% | | 4,153,467 | 4,241,850 |
| 05/01/2028 | 2.780% | | 2,115,000 | 2,016,423 |
| 05/01/2028 | 3.010% | | 3,117,115 | 3,029,397 |
| 11/01/2028 | 2.810% | | 1,736,000 | 1,646,657 |
| 02/01/2029 | 4.140% | | 6,546,364 | 6,926,829 |
| 06/01/2029 | 3.210% | | 10,500,000 | 10,253,181 |
| 08/01/2029 | 3.245% | | 10,944,000 | 10,778,398 |
| 08/01/2029 | 3.580% | | 2,096,701 | 2,120,702 |
| 09/01/2029 | 3.180% | | 14,365,000 | 13,971,082 |
| 10/01/2029 | 3.200% | | 8,600,000 | 8,433,773 |
| 11/01/2029 | 3.100% | | 7,940,000 | 7,673,048 |
| 12/01/2029 | 3.090% | | 3,000,000 | 2,899,998 |
| 02/01/2030 | 3.370% | | 12,000,000 | 11,887,993 |
| 06/01/2030 | 3.710% | | 6,650,000 | 6,789,817 |
| 11/01/2031 | 2.770% | | 5,419,803 | 5,121,488 |
| 11/01/2031 | 3.400% | | 1,500,000 | 1,456,676 |
| 10/01/2032 | 3.180% | | 6,113,661 | 5,910,000 |
| 01/01/2037 | 3.610% | | 1,994,893 | 1,990,195 |
| Federal National Mortgage Association(c) |
| Series 2013-M6 Class 1AC |
| 02/25/2043 | 3.835% | | 5,225,000 | 5,104,296 |
The accompanying Notes to Financial Statements are an integral part of this statement.
| 18 | Multi-Manager Total Return Bond Strategies Fund | Annual Report 2018 |
Portfolio of Investments (continued)
August 31, 2018
| Commercial Mortgage-Backed Securities - Agency (continued) |
| Issuer | Coupon
Rate | | Principal
Amount ($) | Value ($) |
| Government National Mortgage Association(c),(d) |
| CMO Series 2011-38 Class IO |
| 04/16/2053 | 0.088% | | 10,777,507 | 189,165 |
| CMO Series 2013-162 Class IO |
| 09/16/2046 | 0.802% | | 86,657,785 | 3,291,540 |
| CMO Series 2014-134 Class IA |
| 01/16/2055 | 0.606% | | 24,929,303 | 652,480 |
| CMO Series 2015-101 Class IO |
| 03/16/2052 | 0.877% | | 16,910,156 | 943,889 |
| CMO Series 2015-114 |
| 03/15/2057 | 0.940% | | 4,394,249 | 270,382 |
| CMO Series 2015-120 Class IO |
| 03/16/2057 | 0.881% | | 20,042,552 | 1,187,734 |
| CMO Series 2015-125 Class IB |
| 01/16/2055 | 1.285% | | 61,054,436 | 3,591,613 |
| CMO Series 2015-125 Class IO |
| 07/16/2055 | 0.776% | | 51,405,680 | 2,648,565 |
| CMO Series 2015-146 Class IC |
| 07/16/2055 | 0.848% | | 39,691,252 | 2,167,333 |
| CMO Series 2015-171 Class IO |
| 11/16/2055 | 0.892% | | 14,145,302 | 881,414 |
| CMO Series 2015-174 Class IO |
| 11/16/2055 | 0.943% | | 53,429,997 | 2,911,310 |
| CMO Series 2015-21 Class IO |
| 07/16/2056 | 0.993% | | 13,536,889 | 790,057 |
| CMO Series 2015-29 Class EI |
| 09/16/2049 | 0.759% | | 40,912,450 | 2,259,906 |
| CMO Series 2015-41 Class IO |
| 09/16/2056 | 0.671% | | 6,015,067 | 306,505 |
| CMO Series 2015-6 Class IO |
| 02/16/2051 | 0.720% | | 14,914,549 | 732,662 |
| CMO Series 2015-70 Class IO |
| 12/16/2049 | 1.046% | | 21,976,187 | 1,397,934 |
| CMO Series 2016-39 Class IO |
| 01/16/2056 | 0.835% | | 7,662,108 | 461,251 |
| Series 2014-101 Class IO |
| 04/16/2056 | 0.813% | | 50,439,093 | 2,529,505 |
| Series 2016-152 Class IO |
| 08/15/2058 | 0.926% | | 22,494,362 | 1,713,004 |
| Series 2018-2 Class IO |
| 12/16/2059 | 0.768% | | 20,032,933 | 1,414,932 |
| Government National Mortgage Association(b) |
| CMO Series 2013-H08 Class FA |
1-month USD LIBOR + 0.350%
03/20/2063 | 2.450% | | 697,562 | 696,921 |
| Commercial Mortgage-Backed Securities - Agency (continued) |
| Issuer | Coupon
Rate | | Principal
Amount ($) | Value ($) |
| Government National Mortgage Association(c) |
| Series 2003-88 Class Z |
| 03/16/2046 | 4.766% | | 1,025,346 | 1,046,439 |
Total Commercial Mortgage-Backed Securities - Agency
(Cost $258,350,656) | 248,594,925 |
|
| Commercial Mortgage-Backed Securities - Non-Agency 6.0% |
| | | | |
| 1211 Avenue of the Americas Trust(a) |
| Series 2015-1211 Class A1A2 |
| 08/10/2035 | 3.901% | | 2,130,000 | 2,168,267 |
| 225 Liberty Street Trust(a) |
| Series 2016-225L Class A |
| 02/10/2036 | 3.597% | | 2,650,000 | 2,632,088 |
| Banc of America Merrill Lynch Commercial Mortgage Securities Trust(a) |
| Series 2012-PARK Class A |
| 12/10/2030 | 2.959% | | 2,845,000 | 2,806,773 |
| BBCMS Mortgage Trust(a) |
| Series 2013-TYSN Class A2 |
| 09/05/2032 | 3.756% | | 2,000,000 | 2,023,093 |
| Subordinated, Series 2016-ETC Class A |
| 08/14/2036 | 2.937% | | 13,500,000 | 12,678,313 |
| Subordinated, Series 2016-ETC Class B |
| 08/14/2036 | 3.189% | | 900,000 | 846,095 |
| Subordinated, Series 2016-ETC Class C |
| 08/14/2036 | 3.391% | | 770,000 | 724,609 |
| BBCMS Mortgage Trust(a),(c) |
| Series 2016-ETC Class D |
| 08/14/2036 | 3.729% | | 2,790,000 | 2,630,631 |
| BBCMS Mortgage Trust |
| Series 2017-C1 Class A2 |
| 02/15/2050 | 3.189% | | 4,645,000 | 4,647,490 |
| BB-UBS Trust(a) |
| Series 2012-TFT Class A |
| 06/05/2030 | 2.892% | | 6,260,000 | 6,145,242 |
| BENCHMARK Mortgage Trust |
| Series 2018-B2 Class A4 |
| 02/15/2051 | 3.615% | | 27,000,000 | 26,874,434 |
| CD Mortgage Trust |
| Series 2016-CD1 Class A3 |
| 08/10/2049 | 2.459% | | 17,000,000 | 15,876,220 |
| Series 2017-CD6 Class A3 |
| 11/13/2050 | 3.104% | | 10,000,000 | 9,817,099 |
| Series 2017-CD6 Class A4 |
| 11/13/2050 | 3.190% | | 20,000,000 | 19,420,252 |
| CFCRE Commercial Mortgage Trust |
| Series 2016-C4 Class A4 |
| 05/10/2058 | 3.283% | | 5,900,000 | 5,727,642 |
The accompanying Notes to Financial Statements are an integral part of this statement.
Multi-Manager Total Return Bond Strategies Fund | Annual Report 2018
| 19 |
Portfolio of Investments (continued)
August 31, 2018
| Commercial Mortgage-Backed Securities - Non-Agency (continued) |
| Issuer | Coupon
Rate | | Principal
Amount ($) | Value ($) |
| CGRBS Commercial Mortgage Trust(a) |
| Series 2013-VNO5 Class A |
| 03/13/2035 | 3.369% | | 2,020,000 | 2,017,896 |
| Citigroup Commercial Mortgage Trust |
| Series 2015-GC27 Class A5 |
| 02/10/2048 | 3.137% | | 2,945,000 | 2,882,298 |
| Series 2015-GC35 Class A3 |
| 11/10/2048 | 3.549% | | 10,000,000 | 9,946,589 |
| Series 2016-GC37 Class A4 |
| 04/10/2049 | 3.314% | | 8,000,000 | 7,855,546 |
| CityLine Commercial Mortgage Trust(a),(c) |
| Subordinated, Series 2016-CLNE Class B |
| 11/10/2031 | 2.871% | | 3,600,000 | 3,409,687 |
| Subordinated, Series 2016-CLNE Class C |
| 11/10/2031 | 2.871% | | 1,350,000 | 1,259,422 |
| COMM Mortgage Trust |
| Series 2013-CR8 Class A4 |
| 06/10/2046 | 3.334% | | 2,645,000 | 2,651,803 |
| Commercial Mortgage Pass-Through Certificates(a) |
| Series 2012-LTRT Class A2 |
| 10/05/2030 | 3.400% | | 3,793,000 | 3,671,543 |
| Commercial Mortgage Trust |
| Series 2012-CR2 Class A4 |
| 08/15/2045 | 3.147% | | 7,350,000 | 7,328,136 |
| Series 2013-CR13 Class A3 |
| 11/12/2046 | 3.928% | | 5,955,000 | 6,127,343 |
| Series 2014-UBS2 Class A5 |
| 03/10/2047 | 3.961% | | 1,165,000 | 1,193,141 |
| Series 2014-UBS4 Class A5 |
| 08/10/2047 | 3.694% | | 5,000,000 | 5,049,002 |
| Series 2014-UBS6 Class A4 |
| 12/10/2047 | 3.378% | | 3,605,000 | 3,581,082 |
| Series 2014-UBS6 Class A5 |
| 12/10/2047 | 3.644% | | 7,300,000 | 7,350,751 |
| Series 2015-CR26 Class A4 |
| 10/10/2048 | 3.630% | | 1,600,000 | 1,604,728 |
| Series 2015-DC1 Class A5 |
| 02/10/2048 | 3.350% | | 13,495,000 | 13,351,467 |
| Series 2015-LC19 Class A4 |
| 02/10/2048 | 3.183% | | 835,000 | 821,838 |
| Series 2015-PC1 Class A5 |
| 07/10/2050 | 3.902% | | 5,515,000 | 5,619,455 |
| Series 2016-COR1 Class A3 |
| 10/10/2049 | 2.826% | | 8,500,000 | 8,101,317 |
| Series 2016-DC2 Class A5 |
| 02/10/2049 | 3.765% | | 4,832,000 | 4,878,590 |
| Commercial Mortgage-Backed Securities - Non-Agency (continued) |
| Issuer | Coupon
Rate | | Principal
Amount ($) | Value ($) |
| Commercial Mortgage Trust(c) |
| Series 2013-CR9 Class A4 |
| 07/10/2045 | 4.367% | | 4,855,255 | 5,064,768 |
| Commercial Mortgage Trust(a),(c) |
| Series 2016-667M Class C |
| 10/10/2036 | 3.285% | | 6,770,000 | 6,361,940 |
| Commercial Mortgage Trust(a) |
| Series 2016-787S Class A |
| 02/10/2036 | 3.545% | | 2,115,000 | 2,093,459 |
| CoreVest American Finance Trust(a) |
| Series 2017-1 Class A |
| 10/15/2049 | 2.968% | | 2,302,634 | 2,262,378 |
| Credit Suisse Mortgage Capital Trust(a) |
| Series 2014-USA Class A2 |
| 09/15/2037 | 3.953% | | 15,780,000 | 15,909,996 |
| DBGS Mortgage Trust(a),(b) |
| Series 2018-BIOD Class E |
1-month USD LIBOR + 1.700%
05/15/2035 | 3.763% | | 2,839,952 | 2,818,891 |
| Series 2018-BIOD Class F |
1-month USD LIBOR + 2.000%
05/15/2035 | 4.063% | | 11,170,477 | 11,163,562 |
| DBUBS Mortgage Trust(a) |
| Series 2011-LC2A Class A4 |
| 07/10/2044 | 4.537% | | 12,869,022 | 13,267,352 |
| Series 2017-BRBK Class A |
| 10/10/2034 | 3.452% | | 2,800,000 | 2,776,317 |
| DBWF Mortgage Trust(a),(c) |
| Series 2016-85T Class D |
| 12/10/2036 | 3.808% | | 2,000,000 | 1,890,730 |
| Series 2016-85T Class E |
| 12/10/2036 | 3.808% | | 2,000,000 | 1,815,903 |
| General Electric Capital Assurance Co.(a) |
| Series 2003-1 Class A5 |
| 05/12/2035 | 5.743% | | 319,552 | 321,446 |
| GS Mortgage Securities Trust |
| Series 2015-GC28 Class A5 |
| 02/10/2048 | 3.396% | | 13,766,500 | 13,662,899 |
| Series 2015-GC34 Class A3 |
| 10/10/2048 | 3.244% | | 15,000,000 | 14,728,563 |
| Series 2016-GS2 Class A3 |
| 05/10/2049 | 2.791% | | 4,500,000 | 4,273,313 |
| Series 2017-GS7 Class A3 |
| 08/10/2050 | 3.167% | | 10,000,000 | 9,634,429 |
| Series 2017-GS8 Class A3 |
| 11/10/2050 | 3.205% | | 20,000,000 | 19,458,886 |
| Hudsons Bay Simon JV Trust(a) |
| Series 2015-HB10 Class A10 |
| 08/05/2034 | 4.155% | | 1,820,000 | 1,795,325 |
The accompanying Notes to Financial Statements are an integral part of this statement.
| 20 | Multi-Manager Total Return Bond Strategies Fund | Annual Report 2018 |
Portfolio of Investments (continued)
August 31, 2018
| Commercial Mortgage-Backed Securities - Non-Agency (continued) |
| Issuer | Coupon
Rate | | Principal
Amount ($) | Value ($) |
| Series 2015-HB7 Class A7 |
| 08/05/2034 | 3.914% | | 2,520,000 | 2,491,708 |
| IMT Trust(a) |
| Series 2017-APTS Class AFX |
| 06/15/2034 | 3.478% | | 5,410,000 | 5,383,120 |
| Irvine Core Office Trust(a) |
| Series 2013-IRV Class A1 |
| 05/15/2048 | 2.068% | | 1,311,007 | 1,276,976 |
| JPMBB Commercial Mortgage Securities Trust |
| Series 2013-C14 Class A4 |
| 08/15/2046 | 4.133% | | 3,430,000 | 3,550,016 |
| Series 2014-C26 Class A3 |
| 01/15/2048 | 3.231% | | 360,000 | 355,689 |
| JPMDB Commercial Mortgage Securities Trust |
| Series 2016-C4 Class A2 |
| 12/15/2049 | 2.882% | | 8,500,000 | 8,198,632 |
| JPMorgan Chase Commercial Mortgage Securities Trust(a) |
| Series 2012-HSBC Class A |
| 07/05/2032 | 3.093% | | 497,323 | 496,083 |
| JPMorgan Chase Commercial Mortgage Securities Trust |
| Series 2013-C13 Class A3 |
| 01/15/2046 | 3.525% | | 3,960,000 | 3,979,833 |
| Series 2013-C13 Class A4 |
| 01/15/2046 | 3.994% | | 4,795,000 | 4,930,601 |
| JPMorgan Chase Commercial Mortgage Securities Trust(a),(c) |
| Series 2016-NINE Class A |
| 10/06/2038 | 2.949% | | 3,235,000 | 3,047,211 |
| LSTAR Commercial Mortgage Trust(a) |
| Series 2017-5 Class A4 |
| 03/10/2050 | 3.390% | | 800,000 | 782,560 |
| Madison Avenue Trust(a) |
| Series 2013-650M Class A |
| 10/12/2032 | 3.843% | | 2,705,000 | 2,734,314 |
| Morgan Stanley Bank of America Merrill Lynch Trust |
| Series 2013-C12 Class A4 |
| 10/15/2046 | 4.259% | | 1,885,000 | 1,958,174 |
| Series 2015-C21 Class A3 |
| 03/15/2048 | 3.077% | | 525,000 | 511,448 |
| Series 2016-C29 Class ASB |
| 05/15/2049 | 3.140% | | 1,000,000 | 990,231 |
| Morgan Stanley Capital I Trust |
| Series 2016-UB11 Class A3 |
| 08/15/2049 | 2.531% | | 8,500,000 | 7,854,849 |
| OBP Depositor LLC Trust(a) |
| Series 2010-OBP Class A |
| 07/15/2045 | 4.646% | | 1,952,000 | 2,007,742 |
| RBS Commercial Funding, Inc., Trust(a),(c) |
| Series 2013-GSP Class A |
| 01/13/2032 | 3.961% | | 2,420,000 | 2,464,324 |
| Commercial Mortgage-Backed Securities - Non-Agency (continued) |
| Issuer | Coupon
Rate | | Principal
Amount ($) | Value ($) |
| SG Commercial Mortgage Securities Trust |
| Series 2016-C5 Class A4 |
| 10/10/2048 | 3.055% | | 5,120,000 | 4,894,328 |
| Starwood Retail Property Trust(a),(b) |
| Series 2014-STAR Class A |
1-month USD LIBOR + 1.220%
11/15/2027 | 3.533% | | 2,543,208 | 2,544,206 |
| UBS Commercial Mortgage Trust |
| Series 2018-C10 Class A3 |
| 05/15/2051 | 4.048% | | 5,500,000 | 5,604,409 |
| Series 2018-C8 Class A3 |
| 02/15/2051 | 3.720% | | 27,000,000 | 26,996,028 |
| UBS-Barclays Commercial Mortgage Trust |
| Series 2012-C4 Class A5 |
| 12/10/2045 | 2.850% | | 5,168,582 | 5,077,235 |
| Series 2013-C5 Class A4 |
| 03/10/2046 | 3.185% | | 5,410,000 | 5,380,923 |
| Series 2013-C6 Class A4 |
| 04/10/2046 | 3.244% | | 1,935,000 | 1,928,961 |
| Wells Fargo Commercial Mortgage Trust(a) |
| Series 2010-C1 Class A2 |
| 11/15/2043 | 4.393% | | 1,930,000 | 1,971,700 |
| Wells Fargo Commercial Mortgage Trust(a),(c) |
| Series 2013-120B Class A |
| 03/18/2028 | 2.800% | | 1,600,000 | 1,585,794 |
| Wells Fargo Commercial Mortgage Trust |
| Series 2015-LC20 Class A4 |
| 04/15/2050 | 2.925% | | 1,965,000 | 1,897,689 |
| Series 2018-C45 Class A3 |
| 06/15/2051 | 3.920% | | 20,000,000 | 20,174,676 |
| WF-RBS Commercial Mortgage Trust(a) |
| Series 2011-C4 Class A3 |
| 06/15/2044 | 4.394% | | 655,934 | 658,792 |
| WF-RBS Commercial Mortgage Trust |
| Series 2013-C18 Class A2 |
| 12/15/2046 | 3.027% | | 804,326 | 804,014 |
| Series 2014-C24 Class A3 |
| 11/15/2047 | 3.428% | | 1,345,000 | 1,349,309 |
Total Commercial Mortgage-Backed Securities - Non-Agency
(Cost $496,255,061) | 476,901,614 |
|
The accompanying Notes to Financial Statements are an integral part of this statement.
Multi-Manager Total Return Bond Strategies Fund | Annual Report 2018
| 21 |
Portfolio of Investments (continued)
August 31, 2018
| Commercial Paper 0.1% |
| Issuer | Effective
Yield | | Principal
Amount ($) | Value ($) |
| Automotive 0.1% |
| Ford Motor Credit Co. LLC(a) |
| 04/09/2019 | 3.240% | | 10,000,000 | 9,807,600 |
Total Commercial Paper
(Cost $9,813,000) | 9,807,600 |
| Common Stocks 0.0% |
| Issuer | Shares | Value ($) |
| Energy —% |
| Energy Equipment & Services —% |
| Ocean Rig UDW, Inc.(e) | 35,390 | 958,361 |
| Oil, Gas & Consumable Fuels —% |
| Prairie Provident Resources, Inc.(e) | 1,728 | 608 |
| Total Energy | 958,969 |
Total Common Stocks
(Cost $856,856) | 958,969 |
| Convertible Bonds 0.1% |
| Issuer | Coupon
Rate | | Principal
Amount ($) | Value ($) |
| Banking 0.1% |
| Credit Suisse Group AG(a),(b) |
3-month USD LIBOR + 1.240%
06/12/2024 | 3.566% | | 5,935,000 | 5,964,006 |
Total Convertible Bonds
(Cost $5,935,000) | 5,964,006 |
|
| Corporate Bonds & Notes 35.8% |
| | | | |
| Aerospace & Defense 0.5% |
| Alcoa, Inc. |
| 04/15/2021 | 5.400% | | 2,250,000 | 2,317,093 |
| Bombardier, Inc.(a) |
| 12/01/2021 | 8.750% | | 130,000 | 143,145 |
| 12/01/2024 | 7.500% | | 3,250,000 | 3,412,490 |
| Embraer Netherlands Finance BV |
| 06/15/2025 | 5.050% | | 1,550,000 | 1,551,902 |
| Embraer SA |
| 06/15/2022 | 5.150% | | 160,000 | 164,506 |
| General Dynamics Corp. |
| 05/11/2021 | 3.000% | | 15,270,000 | 15,242,835 |
| L3 Technologies, Inc. |
| 06/15/2028 | 4.400% | | 6,235,000 | 6,274,405 |
| Lockheed Martin Corp. |
| 12/15/2042 | 4.070% | | 1,690,000 | 1,647,327 |
| Corporate Bonds & Notes (continued) |
| Issuer | Coupon
Rate | | Principal
Amount ($) | Value ($) |
| Northrop Grumman Corp. |
| 01/15/2025 | 2.930% | | 4,935,000 | 4,704,368 |
| 10/15/2047 | 4.030% | | 715,000 | 670,033 |
| Spirit AeroSystems, Inc. |
| 06/15/2028 | 4.600% | | 1,390,000 | 1,401,005 |
| Textron, Inc. |
| 03/01/2024 | 4.300% | | 690,000 | 701,965 |
| 03/01/2025 | 3.875% | | 300,000 | 297,216 |
| TransDigm, Inc. |
| 05/15/2025 | 6.500% | | 175,000 | 178,453 |
| 06/15/2026 | 6.375% | | 496,000 | 501,294 |
| Total | 39,208,037 |
| Agencies 0.0% |
| Israel Government AID Bond(f) |
| 03/15/2022 | 0.000% | | 3,000,000 | 2,664,273 |
| Airlines 0.3% |
| Air Canada Pass-Through Trust(a) |
| Series 2017-1 Class A |
| 01/15/2030 | 3.550% | | 860,000 | 819,855 |
| American Airlines Pass-Through Trust |
| 01/15/2023 | 4.950% | | 693,055 | 712,712 |
| Continental Airlines Pass-Through Trust |
| 02/02/2019 | 6.545% | | 644,898 | 653,233 |
| 04/19/2022 | 5.983% | | 2,710,736 | 2,866,051 |
| Delta Air Lines Pass-Through Trust |
| 01/02/2023 | 6.718% | | 2,829,349 | 3,019,410 |
| Southwest Airlines Co. |
| 11/16/2027 | 3.450% | | 4,880,000 | 4,664,407 |
| U.S. Airways Pass-Through Trust |
| 10/01/2024 | 5.900% | | 691,333 | 740,897 |
| 06/03/2025 | 4.625% | | 3,033,989 | 3,117,223 |
| United Airlines, Inc. Pass-Through Trust |
| Series 2016-1 Class AA |
| 07/07/2028 | 3.100% | | 6,782,176 | 6,452,752 |
| Total | 23,046,540 |
| Apartment REIT 0.0% |
| American Homes 4 Rent LP |
| 02/15/2028 | 4.250% | | 1,910,000 | 1,848,725 |
| AvalonBay Communities, Inc. |
| 03/15/2020 | 6.100% | | 1,865,000 | 1,944,274 |
| Total | 3,792,999 |
| Automotive 1.2% |
| American Honda Finance Corp.(a) |
| 10/01/2018 | 7.625% | | 2,250,000 | 2,259,682 |
The accompanying Notes to Financial Statements are an integral part of this statement.
| 22 | Multi-Manager Total Return Bond Strategies Fund | Annual Report 2018 |
Portfolio of Investments (continued)
August 31, 2018
| Corporate Bonds & Notes (continued) |
| Issuer | Coupon
Rate | | Principal
Amount ($) | Value ($) |
| BMW US Capital LLC(a),(b) |
3-month USD LIBOR + 0.410%
04/12/2021 | 2.747% | | 1,030,000 | 1,032,405 |
| BMW US Capital LLC(a) |
| 04/12/2021 | 3.100% | | 1,370,000 | 1,363,776 |
| Daimler Finance North America LLC(a) |
| 07/05/2019 | 1.500% | | 5,500,000 | 5,440,540 |
| 03/02/2020 | 2.250% | | 1,500,000 | 1,479,911 |
| 05/04/2020 | 3.100% | | 2,135,000 | 2,131,324 |
| 05/04/2021 | 3.350% | | 3,555,000 | 3,549,735 |
| Delphi Technologies PLC(a) |
| 10/01/2025 | 5.000% | | 126,000 | 119,220 |
| Ford Motor Co. |
| 02/01/2029 | 6.375% | | 925,000 | 966,111 |
| 01/15/2043 | 4.750% | | 2,640,000 | 2,186,110 |
| 12/08/2046 | 5.291% | | 1,415,000 | 1,259,190 |
| Ford Motor Credit Co. LLC |
| 11/04/2019 | 2.597% | | 2,282,000 | 2,263,612 |
| 08/03/2022 | 2.979% | | 7,135,000 | 6,773,783 |
| 09/20/2022 | 4.250% | | 1,100,000 | 1,091,012 |
| 02/15/2023 | 4.140% | | 1,400,000 | 1,376,390 |
| General Motors Co. |
| 10/02/2018 | 3.500% | | 2,500,000 | 2,501,810 |
| 04/01/2025 | 4.000% | | 1,060,000 | 1,030,316 |
| 10/02/2043 | 6.250% | | 1,925,000 | 1,997,965 |
| General Motors Financial Co., Inc. |
| 07/13/2020 | 3.200% | | 1,500,000 | 1,494,405 |
| 04/09/2021 | 3.550% | | 8,350,000 | 8,338,819 |
| 06/19/2023 | 4.150% | | 8,315,000 | 8,277,741 |
| 04/09/2025 | 4.350% | | 3,775,000 | 3,727,371 |
| 03/01/2026 | 5.250% | | 2,345,000 | 2,417,470 |
| General Motors Financial Co., Inc.(b) |
3-month USD LIBOR + 0.850%
04/09/2021 | 3.189% | | 3,690,000 | 3,703,542 |
| Harley-Davidson Financial Services, Inc.(a) |
| 02/15/2023 | 3.350% | | 8,645,000 | 8,488,033 |
| Hyundai Capital America(a) |
| 02/06/2019 | 2.550% | | 180,000 | 179,649 |
| 03/19/2020 | 2.600% | | 680,000 | 670,968 |
| 09/18/2020 | 2.750% | | 7,576,000 | 7,450,276 |
| IHO Verwaltungs GmbH PIK(a) |
| 09/15/2026 | 4.750% | | 2,925,000 | 2,781,356 |
| Lear Corp. |
| 03/15/2024 | 5.375% | | 1,242,000 | 1,280,087 |
| Magna International, Inc. |
| 06/15/2024 | 3.625% | | 1,100,000 | 1,096,214 |
| PACCAR Financial Corp. |
| 08/12/2019 | 1.200% | | 1,110,000 | 1,093,980 |
| Corporate Bonds & Notes (continued) |
| Issuer | Coupon
Rate | | Principal
Amount ($) | Value ($) |
| Schaeffler Finance BV(a) |
| 05/15/2023 | 4.750% | | 6,315,000 | 6,394,057 |
| Total | 96,216,860 |
| Banking 10.6% |
| Ally Financial, Inc. |
| 09/10/2018 | 4.750% | | 575,000 | 575,209 |
| 03/30/2020 | 4.125% | | 50,000 | 50,277 |
| 03/30/2025 | 4.625% | | 150,000 | 149,741 |
| Subordinated |
| 11/20/2025 | 5.750% | | 350,000 | 364,488 |
| American Express Co. |
| 05/17/2021 | 3.375% | | 9,125,000 | 9,158,534 |
| 08/03/2023 | 3.700% | | 11,950,000 | 11,998,290 |
| ASB Bank Ltd.(a) |
| 06/14/2023 | 3.750% | | 1,815,000 | 1,812,793 |
| Banco de Credito del Peru(a) |
| 09/16/2020 | 5.375% | | 150,000 | 155,619 |
| Banco Santander SA(a) |
| 11/09/2022 | 4.125% | | 150,000 | 149,632 |
| Banco Santander SA(b) |
3-month USD LIBOR + 1.120%
04/12/2023 | 3.459% | | 1,400,000 | 1,406,458 |
| Banco Santander SA |
| 04/12/2023 | 3.848% | | 2,000,000 | 1,970,012 |
| Bank of America Corp. |
| 10/19/2020 | 2.625% | | 2,000,000 | 1,977,350 |
| 01/11/2023 | 3.300% | | 2,000,000 | 1,983,424 |
| 01/22/2024 | 4.125% | | 3,000,000 | 3,067,239 |
| Subordinated |
| 01/22/2025 | 4.000% | | 795,000 | 785,822 |
| 04/21/2025 | 3.950% | | 2,500,000 | 2,455,768 |
| 03/03/2026 | 4.450% | | 2,000,000 | 2,009,112 |
| Bank of America Corp.(g) |
| 07/21/2021 | 2.369% | | 3,085,000 | 3,034,060 |
| 12/20/2023 | 3.004% | | 1,619,000 | 1,576,623 |
| 10/01/2025 | 3.093% | | 4,015,000 | 3,842,556 |
| 04/24/2028 | 3.705% | | 8,890,000 | 8,596,203 |
| 07/23/2029 | 4.271% | | 11,000,000 | 11,121,231 |
| Junior Subordinated |
| 12/31/2049 | 6.100% | | 5,000,000 | 5,264,345 |
| Bank of Montreal(b) |
3-month USD LIBOR + 0.460%
04/13/2021 | 2.797% | | 1,400,000 | 1,405,839 |
| Bank of Montreal |
| 04/13/2021 | 3.100% | | 1,580,000 | 1,574,102 |
| 08/27/2021 | 1.900% | | 7,170,000 | 6,908,345 |
The accompanying Notes to Financial Statements are an integral part of this statement.
Multi-Manager Total Return Bond Strategies Fund | Annual Report 2018
| 23 |
Portfolio of Investments (continued)
August 31, 2018
| Corporate Bonds & Notes (continued) |
| Issuer | Coupon
Rate | | Principal
Amount ($) | Value ($) |
| Bank of New York Mellon Corp. (The) |
| 05/15/2019 | 5.450% | | 800,000 | 815,510 |
| 01/29/2023 | 2.950% | | 995,000 | 977,861 |
| 08/16/2023 | 2.200% | | 3,185,000 | 3,009,370 |
| 09/11/2024 | 3.250% | | 1,960,000 | 1,935,137 |
| Banque Federative du Credit Mutuel SA(a) |
| 07/20/2023 | 3.750% | | 8,375,000 | 8,375,452 |
| Barclays PLC |
| 01/10/2023 | 3.684% | | 4,045,000 | 3,959,816 |
| 03/16/2025 | 3.650% | | 270,000 | 255,195 |
| 01/10/2028 | 4.337% | | 1,195,000 | 1,143,809 |
| Subordinated |
| 05/12/2026 | 5.200% | | 2,518,000 | 2,486,311 |
| Barclays PLC(g) |
| 05/16/2029 | 4.972% | | 13,210,000 | 13,188,692 |
| BB&T Corp |
| 06/05/2025 | 3.700% | | 4,165,000 | 4,170,452 |
| BB&T Corp. |
| 02/01/2019 | 2.250% | | 1,600,000 | 1,598,192 |
| BBVA Bancomer SA(a) |
| Junior Subordinated |
| 04/22/2020 | 7.250% | | 200,000 | 209,022 |
| BNP Paribas SA(a) |
| 03/01/2023 | 3.500% | | 5,740,000 | 5,627,157 |
| 01/09/2025 | 3.375% | | 2,755,000 | 2,616,696 |
| 08/14/2028 | 4.400% | | 10,135,000 | 10,055,815 |
| BNZ International Funding Ltd.(a) |
| 02/21/2020 | 2.400% | | 5,745,000 | 5,675,261 |
| BPCE SA(a) |
| 01/11/2028 | 3.250% | | 460,000 | 428,157 |
| Subordinated |
| 07/11/2024 | 4.625% | | 4,200,000 | 4,192,243 |
| Capital One Financial Corp. |
| 11/21/2018 | 2.150% | | 1,150,000 | 1,149,164 |
| 05/12/2020 | 2.500% | | 5,040,000 | 4,986,087 |
| 04/30/2021 | 3.450% | | 10,575,000 | 10,589,541 |
| 10/30/2024 | 3.300% | | 8,095,000 | 7,768,950 |
| Capital One NA |
| 01/31/2020 | 2.350% | | 3,225,000 | 3,193,469 |
| 07/23/2021 | 2.950% | | 1,050,000 | 1,035,134 |
| Citibank NA |
| 05/01/2020 | 3.050% | | 16,020,000 | 16,014,713 |
| 07/23/2021 | 3.400% | | 1,220,000 | 1,222,314 |
| Citigroup, Inc. |
| 09/26/2018 | 2.500% | | 6,921,000 | 6,922,097 |
| 12/07/2018 | 2.050% | | 8,000,000 | 7,991,296 |
| 05/22/2019 | 8.500% | | 3,000,000 | 3,121,374 |
| 07/29/2019 | 2.500% | | 21,000,000 | 20,954,073 |
| 08/09/2020 | 5.375% | | 5,000,000 | 5,205,160 |
| 03/30/2021 | 2.700% | | 4,340,000 | 4,275,564 |
| Corporate Bonds & Notes (continued) |
| Issuer | Coupon
Rate | | Principal
Amount ($) | Value ($) |
| 05/01/2026 | 3.400% | | 10,695,000 | 10,262,623 |
| 07/23/2048 | 4.650% | | 4,180,000 | 4,271,509 |
| Subordinated |
| 06/10/2025 | 4.400% | | 4,250,000 | 4,262,053 |
| 05/18/2046 | 4.750% | | 2,910,000 | 2,875,484 |
| Citigroup, Inc.(g) |
| 01/24/2023 | 3.142% | | 5,515,000 | 5,431,530 |
| 06/01/2024 | 4.044% | | 3,965,000 | 4,007,945 |
| Junior Subordinated |
| 12/31/2049 | 5.950% | | 5,000,000 | 5,086,935 |
| Citizens Bank NA |
| 03/29/2023 | 3.700% | | 4,840,000 | 4,849,177 |
| Comerica, Inc. |
| 05/23/2019 | 2.125% | | 645,000 | 641,262 |
| 07/31/2023 | 3.700% | | 7,890,000 | 7,924,416 |
| Subordinated |
| 07/22/2026 | 3.800% | | 900,000 | 876,107 |
| Compass Bank |
| 09/29/2019 | 2.750% | | 1,400,000 | 1,395,233 |
| Cooperatieve Rabobank UA |
| 04/26/2021 | 3.125% | | 5,500,000 | 5,475,520 |
| 01/10/2023 | 2.750% | | 6,080,000 | 5,893,849 |
| Credit Agricole SA(a) |
| 04/24/2023 | 3.750% | | 9,040,000 | 8,923,592 |
| Credit Suisse Group Funding Guernsey Ltd. |
| 06/09/2023 | 3.800% | | 4,890,000 | 4,866,249 |
| Danske Bank A/S(a) |
| 03/02/2020 | 2.200% | | 10,465,000 | 10,305,765 |
| 09/12/2023 | 3.875% | | 9,990,000 | 9,930,500 |
| Deutsche Bank AG |
| 01/22/2021 | 3.150% | | 9,220,000 | 9,006,852 |
| 05/12/2021 | 3.375% | | 1,988,000 | 1,958,846 |
| 11/16/2022 | 3.300% | | 1,205,000 | 1,146,574 |
| 01/13/2026 | 4.100% | | 8,050,000 | 7,694,319 |
| Discover Bank |
| 08/08/2023 | 4.200% | | 4,000,000 | 4,041,876 |
| Discover Financial Services |
| 04/27/2022 | 5.200% | | 2,697,000 | 2,809,910 |
| 11/21/2022 | 3.850% | | 1,000,000 | 996,123 |
| Fifth Third Bancorp |
| 03/01/2019 | 2.300% | | 310,000 | 309,496 |
| 06/15/2022 | 2.600% | | 1,595,000 | 1,544,081 |
| Fifth Third Bank |
| 07/28/2025 | 3.950% | | 5,510,000 | 5,555,391 |
| Goldman Sachs Group, Inc. (The) |
| 02/15/2019 | 7.500% | | 20,635,000 | 21,069,635 |
| 10/23/2019 | 2.550% | | 6,000,000 | 5,977,920 |
| 06/15/2020 | 6.000% | | 2,030,000 | 2,126,563 |
| 01/24/2022 | 5.750% | | 3,800,000 | 4,062,804 |
The accompanying Notes to Financial Statements are an integral part of this statement.
| 24 | Multi-Manager Total Return Bond Strategies Fund | Annual Report 2018 |
Portfolio of Investments (continued)
August 31, 2018
| Corporate Bonds & Notes (continued) |
| Issuer | Coupon
Rate | | Principal
Amount ($) | Value ($) |
| 07/08/2024 | 3.850% | | 3,605,000 | 3,600,050 |
| 01/23/2025 | 3.500% | | 4,375,000 | 4,260,432 |
| 01/26/2027 | 3.850% | | 5,640,000 | 5,500,624 |
| Subordinated |
| 10/21/2025 | 4.250% | | 2,300,000 | 2,288,663 |
| 05/22/2045 | 5.150% | | 2,100,000 | 2,151,236 |
| Goldman Sachs Group, Inc. (The)(g) |
| 10/31/2022 | 2.876% | | 7,990,000 | 7,828,027 |
| 04/23/2029 | 3.814% | | 3,475,000 | 3,323,719 |
| 05/01/2029 | 4.223% | | 7,820,000 | 7,746,304 |
| Junior Subordinated |
| 12/31/2049 | 5.700% | | 5,000,000 | 5,067,140 |
| Grupo Aval Ltd.(a) |
| 09/26/2022 | 4.750% | | 200,000 | 198,555 |
| HSBC Holdings PLC(b) |
3-month USD LIBOR + 0.600%
05/18/2021 | 2.922% | | 4,415,000 | 4,428,735 |
3-month USD LIBOR + 1.000%
05/18/2024 | 3.322% | | 4,460,000 | 4,471,743 |
| HSBC Holdings PLC(g) |
| 06/19/2029 | 4.583% | | 4,340,000 | 4,408,485 |
| HSBC U.S.A., Inc. |
| 03/05/2020 | 2.350% | | 2,575,000 | 2,548,104 |
| Huntington Bancshares, Inc. |
| 05/15/2025 | 4.000% | | 7,045,000 | 7,077,640 |
| Huntington National Bank (The) |
| 04/01/2019 | 2.200% | | 1,500,000 | 1,496,778 |
| JPMorgan Chase & Co. |
| 04/23/2019 | 6.300% | | 5,000,000 | 5,115,625 |
| 10/15/2020 | 4.250% | | 2,000,000 | 2,041,422 |
| 01/24/2022 | 4.500% | | 1,000,000 | 1,035,778 |
| 07/15/2025 | 3.900% | | 10,300,000 | 10,366,033 |
| 10/01/2026 | 2.950% | | 1,180,000 | 1,104,099 |
| Subordinated |
| 05/01/2023 | 3.375% | | 1,000,000 | 982,937 |
| 09/10/2024 | 3.875% | | 5,440,000 | 5,404,227 |
| JPMorgan Chase & Co.(g) |
| 06/18/2022 | 3.514% | | 5,100,000 | 5,116,050 |
| 03/01/2025 | 3.220% | | 6,050,000 | 5,885,367 |
| 02/01/2028 | 3.782% | | 5,540,000 | 5,421,533 |
| 05/01/2028 | 3.540% | | 4,500,000 | 4,321,134 |
| 01/23/2029 | 3.509% | | 3,570,000 | 3,404,995 |
| 04/23/2029 | 4.005% | | 3,180,000 | 3,147,764 |
| 07/23/2029 | 4.203% | | 8,360,000 | 8,405,721 |
| 11/15/2048 | 3.964% | | 2,475,000 | 2,300,008 |
| Junior Subordinated |
| 12/31/2049 | 5.300% | | 5,905,000 | 6,054,278 |
| 12/31/2049 | 6.100% | | 5,000,000 | 5,201,350 |
| Corporate Bonds & Notes (continued) |
| Issuer | Coupon
Rate | | Principal
Amount ($) | Value ($) |
| JPMorgan Chase Bank NA(b) |
3-month USD LIBOR + 0.250%
02/13/2020 | 2.588% | | 10,700,000 | 10,706,880 |
| JPMorgan Chase Bank NA(g) |
| 02/01/2021 | 2.604% | | 10,785,000 | 10,707,801 |
| 04/26/2021 | 3.086% | | 9,750,000 | 9,734,761 |
| KeyCorp |
| 04/30/2028 | 4.100% | | 2,070,000 | 2,077,373 |
| Lloyds Bank PLC |
| 05/07/2021 | 3.300% | | 4,000,000 | 3,998,144 |
| Lloyds Banking Group PLC |
| 08/16/2023 | 4.050% | | 9,585,000 | 9,569,281 |
| 03/22/2028 | 4.375% | | 1,975,000 | 1,949,959 |
| Subordinated |
| 11/04/2024 | 4.500% | | 5,560,000 | 5,523,649 |
| Lloyds Banking Group PLC(g) |
| 11/07/2023 | 2.907% | | 3,000,000 | 2,867,934 |
| M&T Bank Corp. |
| 07/25/2019 | 2.250% | | 3,000,000 | 2,986,917 |
| Merrill Lynch & Co., Inc. |
| 11/15/2018 | 6.875% | | 2,000,000 | 2,017,578 |
| Mitsubishi UFJ Financial Group, Inc. |
| 03/02/2028 | 3.961% | | 5,285,000 | 5,293,530 |
| Morgan Stanley |
| 05/13/2019 | 7.300% | | 6,000,000 | 6,182,904 |
| 07/23/2025 | 4.000% | | 280,000 | 280,601 |
| 07/24/2042 | 6.375% | | 1,375,000 | 1,714,345 |
| Subordinated |
| 11/24/2025 | 5.000% | | 4,950,000 | 5,149,049 |
| Morgan Stanley(b) |
3-month USD LIBOR + 0.800%
02/14/2020 | 3.119% | | 14,250,000 | 14,282,048 |
3-month USD LIBOR + 0.930%
07/22/2022 | 3.277% | | 4,050,000 | 4,087,969 |
| Morgan Stanley(g) |
| 07/22/2028 | 3.591% | | 7,245,000 | 6,903,275 |
| 01/24/2029 | 3.772% | | 3,155,000 | 3,043,357 |
| 07/22/2038 | 3.971% | | 1,475,000 | 1,387,594 |
| Junior Subordinated |
| 12/31/2049 | 5.450% | | 5,000,000 | 5,063,835 |
| MUFG Union Bank NA |
| 09/26/2018 | 2.625% | | 1,925,000 | 1,924,992 |
| 05/06/2019 | 2.250% | | 825,000 | 822,630 |
| Nationwide Building Society(a),(g) |
| 08/01/2024 | 4.363% | | 8,400,000 | 8,436,448 |
| Northern Trust Corp.(g) |
| Junior Subordinated |
| 05/08/2032 | 3.375% | | 2,005,000 | 1,890,454 |
The accompanying Notes to Financial Statements are an integral part of this statement.
Multi-Manager Total Return Bond Strategies Fund | Annual Report 2018
| 25 |
Portfolio of Investments (continued)
August 31, 2018
| Corporate Bonds & Notes (continued) |
| Issuer | Coupon
Rate | | Principal
Amount ($) | Value ($) |
| PNC Bank NA |
| 04/29/2021 | 2.150% | | 2,050,000 | 1,998,356 |
| PNC Financial Services Group, Inc. (The) |
| 02/08/2020 | 5.125% | | 5,000,000 | 5,147,675 |
| Royal Bank of Canada(b) |
3-month USD LIBOR + 0.390%
04/30/2021 | 2.729% | | 4,710,000 | 4,724,653 |
| Royal Bank of Canada |
| 04/30/2021 | 3.200% | | 12,775,000 | 12,780,251 |
| Santander Holdings U.S.A., Inc. |
| 03/28/2022 | 3.700% | | 5,205,000 | 5,162,683 |
| Santander UK Group Holdings PLC |
| 08/05/2021 | 2.875% | | 7,660,000 | 7,486,555 |
| Santander UK Group Holdings PLC(a) |
| Subordinated |
| 09/15/2025 | 4.750% | | 5,972,000 | 5,886,905 |
| Santander UK PLC |
| 09/10/2019 | 2.350% | | 600,000 | 596,873 |
| 01/05/2021 | 2.500% | | 2,375,000 | 2,330,360 |
| 06/01/2021 | 3.400% | | 4,840,000 | 4,840,334 |
| Santander UK PLC(b) |
3-month USD LIBOR + 0.620%
06/01/2021 | 2.941% | | 4,535,000 | 4,558,909 |
| Sumitomo Mitsui Financial Group, Inc. |
| 07/12/2022 | 2.784% | | 1,720,000 | 1,675,106 |
| SunTrust Banks, Inc. |
| 05/01/2019 | 2.500% | | 1,770,000 | 1,768,517 |
| 01/31/2020 | 2.250% | | 6,930,000 | 6,855,253 |
| 03/03/2021 | 2.900% | | 920,000 | 911,803 |
| 05/01/2025 | 4.000% | | 4,960,000 | 5,006,981 |
| Svenska Handelsbanken AB |
| 09/07/2021 | 1.875% | | 6,215,000 | 5,957,208 |
| Synchrony Financial |
| 07/23/2025 | 4.500% | | 2,135,000 | 2,079,388 |
| Toronto-Dominion Bank (The) |
| 06/11/2021 | 3.250% | | 11,875,000 | 11,903,488 |
| U.S. Bancorp(g) |
| Junior Subordinated |
| 12/31/2049 | 5.300% | | 2,980,000 | 2,987,974 |
| UBS Group Funding Switzerland AG(a) |
| 03/23/2028 | 4.253% | | 2,790,000 | 2,794,232 |
| UniCredit SpA(a) |
| 04/12/2022 | 3.750% | | 4,150,000 | 3,966,844 |
| Wells Fargo & Co. |
| 07/22/2022 | 2.625% | | 12,730,000 | 12,320,909 |
| 04/22/2026 | 3.000% | | 9,000,000 | 8,452,458 |
| 10/23/2026 | 3.000% | | 10,280,000 | 9,606,958 |
| Corporate Bonds & Notes (continued) |
| Issuer | Coupon
Rate | | Principal
Amount ($) | Value ($) |
| Wells Fargo & Co.(g) |
| 05/22/2028 | 3.584% | | 7,000,000 | 6,750,814 |
| Wells Fargo Bank NA |
| 12/06/2019 | 2.150% | | 5,060,000 | 5,014,981 |
| 01/15/2020 | 2.400% | | 5,000,000 | 4,967,405 |
| Wells Fargo Bank NA(g) |
| 07/23/2021 | 3.325% | | 6,670,000 | 6,678,251 |
| Westpac Banking Corp. |
| 05/15/2023 | 3.650% | | 2,945,000 | 2,965,798 |
| Total | 842,608,081 |
| Brokerage/Asset Managers/Exchanges 0.1% |
| Charles Schwab Corp. (The) |
| 05/21/2025 | 3.850% | | 1,565,000 | 1,592,059 |
| Jefferies Group LLC |
| 07/15/2019 | 8.500% | | 2,800,000 | 2,929,575 |
| 01/20/2043 | 6.500% | | 600,000 | 627,781 |
| Nasdaq, Inc. |
| 01/15/2020 | 5.550% | | 600,000 | 619,104 |
| Stifel Financial Corp. |
| 12/01/2020 | 3.500% | | 980,000 | 974,573 |
| 07/18/2024 | 4.250% | | 750,000 | 754,602 |
| Total | 7,497,694 |
| Building Materials 0.1% |
| Beacon Roofing Supply, Inc. |
| 10/01/2023 | 6.375% | | 367,000 | 377,959 |
| Beacon Roofing Supply, Inc.(a) |
| 11/01/2025 | 4.875% | | 148,000 | 136,920 |
| CRH America Finance, Inc.(a) |
| 04/04/2048 | 4.500% | | 3,545,000 | 3,367,619 |
| Standard Industries, Inc.(a) |
| 10/15/2025 | 6.000% | | 1,853,000 | 1,902,192 |
| Vulcan Materials Co. |
| 06/15/2047 | 4.500% | | 2,610,000 | 2,378,733 |
| Total | 8,163,423 |
| Cable and Satellite 0.8% |
| Altice U.S. Finance I Corp.(a) |
| 05/15/2026 | 5.500% | | 4,554,000 | 4,487,603 |
| CCO Holdings LLC/Capital Corp. |
| 09/30/2022 | 5.250% | | 4,050,000 | 4,076,807 |
| 09/01/2023 | 5.750% | | 1,000,000 | 1,017,332 |
| CCO Holdings LLC/Capital Corp.(a) |
| 05/01/2025 | 5.375% | | 225,000 | 224,173 |
| 02/15/2026 | 5.750% | | 125,000 | 125,396 |
| 05/01/2027 | 5.125% | | 758,000 | 725,084 |
| 05/01/2027 | 5.875% | | 516,000 | 511,904 |
| 02/01/2028 | 5.000% | | 1,904,000 | 1,784,130 |
The accompanying Notes to Financial Statements are an integral part of this statement.
| 26 | Multi-Manager Total Return Bond Strategies Fund | Annual Report 2018 |
Portfolio of Investments (continued)
August 31, 2018
| Corporate Bonds & Notes (continued) |
| Issuer | Coupon
Rate | | Principal
Amount ($) | Value ($) |
| Cequel Communications Holdings I LLC/Capital Corp.(a) |
| 12/15/2021 | 5.125% | | 1,300,000 | 1,301,400 |
| 12/15/2021 | 5.125% | | 50,000 | 50,016 |
| 07/15/2025 | 7.750% | | 350,000 | 373,835 |
| 04/01/2028 | 7.500% | | 4,875,000 | 5,093,176 |
| Charter Communications Operating LLC/Capital |
| 02/01/2024 | 4.500% | | 2,000,000 | 2,022,104 |
| 07/23/2025 | 4.908% | | 1,415,000 | 1,443,516 |
| 02/15/2028 | 3.750% | | 450,000 | 415,803 |
| 10/23/2045 | 6.484% | | 4,170,000 | 4,452,438 |
| Comcast Corp. |
| 02/15/2028 | 3.150% | | 2,000,000 | 1,876,638 |
| Cox Communications, Inc.(a) |
| 12/15/2022 | 3.250% | | 500,000 | 487,080 |
| 08/15/2024 | 3.150% | | 3,005,000 | 2,863,588 |
| CSC Holdings LLC |
| 02/15/2019 | 8.625% | | 250,000 | 255,676 |
| CSC Holdings LLC(a) |
| 02/01/2028 | 5.375% | | 2,350,000 | 2,248,910 |
| DISH DBS Corp. |
| 05/01/2020 | 5.125% | | 1,400,000 | 1,410,335 |
| 07/15/2022 | 5.875% | | 300,000 | 290,085 |
| 07/01/2026 | 7.750% | | 3,489,000 | 3,148,505 |
| Intelsat Connect Finance SA(a) |
| 02/15/2023 | 9.500% | | 570,000 | 567,905 |
| Intelsat Jackson Holdings SA |
| 08/01/2023 | 5.500% | | 182,000 | 165,827 |
| Intelsat Jackson Holdings SA(a) |
| 07/15/2025 | 9.750% | | 1,416,000 | 1,499,783 |
| Intelsat Luxembourg SA |
| 06/01/2023 | 8.125% | | 1,079,000 | 935,968 |
| NBCUniversal Media LLC |
| 04/30/2020 | 5.150% | | 2,280,000 | 2,358,277 |
| 01/15/2023 | 2.875% | | 720,000 | 705,131 |
| Time Warner Cable LLC |
| 07/01/2038 | 7.300% | | 215,000 | 250,257 |
| 09/01/2041 | 5.500% | | 5,255,000 | 5,086,593 |
| Time Warner Cable, Inc. |
| 02/01/2020 | 5.000% | | 1,500,000 | 1,529,658 |
| 09/01/2021 | 4.000% | | 1,500,000 | 1,511,352 |
| Time Warner Entertainment Co. LP |
| 07/15/2033 | 8.375% | | 1,820,000 | 2,287,733 |
| Unitymedia Hessen GmbH & Co. KG NRW(a) |
| 01/15/2025 | 5.000% | | 446,000 | 453,465 |
| UPCB Finance IV Ltd.(a) |
| 01/15/2025 | 5.375% | | 3,450,000 | 3,407,348 |
| Videotron Ltd. |
| 07/15/2022 | 5.000% | | 2,750,000 | 2,815,585 |
| Corporate Bonds & Notes (continued) |
| Issuer | Coupon
Rate | | Principal
Amount ($) | Value ($) |
| Videotron Ltd.(a) |
| 04/15/2027 | 5.125% | | 122,000 | 120,821 |
| Virgin Media Secured Finance PLC(a) |
| 01/15/2026 | 5.250% | | 313,000 | 304,899 |
| Ziggo Bond Finance BV(a) |
| 01/15/2027 | 6.000% | | 1,800,000 | 1,629,984 |
| Total | 66,316,120 |
| Chemicals 0.4% |
| Albemarle Corp. |
| 12/01/2024 | 4.150% | | 535,000 | 542,523 |
| 12/01/2044 | 5.450% | | 545,000 | 574,022 |
| Atotech U.S.A., Inc.(a) |
| 02/01/2025 | 6.250% | | 219,000 | 217,168 |
| Axalta Coating Systems LLC(a) |
| 08/15/2024 | 4.875% | | 1,616,000 | 1,606,444 |
| Celanese U.S. Holdings LLC |
| 11/15/2022 | 4.625% | | 100,000 | 102,699 |
| CF Industries, Inc. |
| 03/15/2044 | 5.375% | | 1,350,000 | 1,233,760 |
| Chemours Co. (The) |
| 05/15/2023 | 6.625% | | 182,000 | 190,935 |
| Dow Chemical Co. (The) |
| 05/15/2019 | 8.550% | | 6,500,000 | 6,751,413 |
| Eastman Chemical Co. |
| 10/15/2044 | 4.650% | | 2,511,000 | 2,463,532 |
| Incitec Pivot Finance LLC(a) |
| 12/10/2019 | 6.000% | | 1,000,000 | 1,029,972 |
| Israel Chemicals Ltd.(a) |
| 05/31/2038 | 6.375% | | 3,435,000 | 3,438,662 |
| LYB International Finance BV |
| 07/15/2043 | 5.250% | | 1,215,000 | 1,273,513 |
| LyondellBasell Industries NV |
| 04/15/2024 | 5.750% | | 1,778,000 | 1,935,986 |
| 02/26/2055 | 4.625% | | 455,000 | 428,522 |
| Mexichem SAB de CV(a) |
| 01/15/2048 | 5.500% | | 4,250,000 | 3,910,795 |
| Mosaic Co. (The) |
| 11/15/2043 | 5.625% | | 985,000 | 1,008,169 |
| Platform Specialty Products Corp.(a) |
| 12/01/2025 | 5.875% | | 88,000 | 87,597 |
| PPG Industries, Inc. |
| 03/15/2028 | 3.750% | | 3,195,000 | 3,186,236 |
| PQ Corp.(a) |
| 11/15/2022 | 6.750% | | 279,000 | 291,778 |
The accompanying Notes to Financial Statements are an integral part of this statement.
Multi-Manager Total Return Bond Strategies Fund | Annual Report 2018
| 27 |
Portfolio of Investments (continued)
August 31, 2018
| Corporate Bonds & Notes (continued) |
| Issuer | Coupon
Rate | | Principal
Amount ($) | Value ($) |
| Sherwin-Williams Co. (The) |
| 08/01/2025 | 3.450% | | 755,000 | 729,171 |
| Total | 31,002,897 |
| Construction Machinery 0.2% |
| Caterpillar Financial Services Corp. |
| 10/01/2021 | 1.931% | | 6,180,000 | 5,960,449 |
| 11/29/2022 | 2.550% | | 3,380,000 | 3,296,294 |
| United Rentals North America, Inc. |
| 07/15/2025 | 5.500% | | 5,300,000 | 5,414,671 |
| 09/15/2026 | 5.875% | | 215,000 | 221,535 |
| 05/15/2027 | 5.500% | | 278,000 | 277,360 |
| Total | 15,170,309 |
| Consumer Cyclical Services 0.5% |
| Alibaba Group Holding Ltd. |
| 11/28/2019 | 2.500% | | 9,145,000 | 9,085,210 |
| Amazon.com, Inc. |
| 02/22/2023 | 2.400% | | 4,825,000 | 4,658,031 |
| 12/03/2025 | 5.200% | | 3,160,000 | 3,492,985 |
| Expedia Group, Inc. |
| 02/15/2028 | 3.800% | | 5,895,000 | 5,548,451 |
| IHS Markit Ltd.(a) |
| 11/01/2022 | 5.000% | | 1,000,000 | 1,035,877 |
| 03/01/2026 | 4.000% | | 1,350,000 | 1,300,142 |
| IHS Markit Ltd. |
| 08/01/2028 | 4.750% | | 1,875,000 | 1,886,938 |
| Western Union Co. (The)(b) |
3-month USD LIBOR + 0.800%
05/22/2019 | 3.110% | | 5,000,000 | 5,006,035 |
| Western Union Co. (The) |
| 06/09/2023 | 4.250% | | 11,870,000 | 11,918,441 |
| Total | 43,932,110 |
| Consumer Products 0.2% |
| Central Garden & Pet Co. |
| 02/01/2028 | 5.125% | | 1,580,000 | 1,486,048 |
| Clorox Co. (The) |
| 05/15/2028 | 3.900% | | 3,205,000 | 3,222,791 |
| First Quality Finance Co., Inc.(a) |
| 05/15/2021 | 4.625% | | 147,000 | 146,070 |
| 07/01/2025 | 5.000% | | 1,548,000 | 1,451,250 |
| Mead Johnson Nutrition Co. |
| 11/15/2025 | 4.125% | | 640,000 | 655,254 |
| Newell Brands, Inc. |
| 04/01/2046 | 5.500% | | 2,175,000 | 2,092,881 |
| Newell, Inc. |
| 04/01/2026 | 4.200% | | 4,150,000 | 4,004,563 |
| Corporate Bonds & Notes (continued) |
| Issuer | Coupon
Rate | | Principal
Amount ($) | Value ($) |
| Scotts Miracle-Gro Co. (The) |
| 10/15/2023 | 6.000% | | 52,000 | 53,018 |
| 12/15/2026 | 5.250% | | 235,000 | 224,018 |
| Valvoline, Inc. |
| 08/15/2025 | 4.375% | | 1,022,000 | 978,949 |
| Total | 14,314,842 |
| Diversified Manufacturing 0.5% |
| EnerSys (a) |
| 04/30/2023 | 5.000% | | 200,000 | 202,443 |
| General Electric Co. |
| 01/08/2020 | 5.500% | | 3,302,000 | 3,408,390 |
| 10/17/2021 | 4.650% | | 487,000 | 506,628 |
| 09/07/2022 | 3.150% | | 337,000 | 335,309 |
| 10/09/2022 | 2.700% | | 139,000 | 135,478 |
| 01/09/2023 | 3.100% | | 1,007,000 | 994,597 |
| 01/14/2038 | 5.875% | | 1,196,000 | 1,367,351 |
| General Electric Co.(b) |
3-month USD LIBOR + 0.480%
08/15/2036 | 2.794% | | 5,380,000 | 4,510,022 |
| Itron, Inc.(a) |
| 01/15/2026 | 5.000% | | 600,000 | 573,836 |
| Johnson Controls International PLC |
| 07/02/2064 | 4.950% | | 1,530,000 | 1,473,238 |
| Kennametal, Inc. |
| 06/15/2028 | 4.625% | | 6,345,000 | 6,339,391 |
| Nvent Finance Sarl(a) |
| 04/15/2028 | 4.550% | | 6,340,000 | 6,262,639 |
| Roper Technologies, Inc. |
| 09/15/2023 | 3.650% | | 6,865,000 | 6,873,973 |
| Timken Co. (The)(h) |
| 12/15/2028 | 4.500% | | 3,685,000 | 3,680,239 |
| United Technologies Corp. |
| 11/16/2048 | 4.625% | | 3,775,000 | 3,821,976 |
| Valmont Industries, Inc. |
| 10/01/2054 | 5.250% | | 2,050,000 | 1,834,145 |
| Zekelman Industries, Inc.(a) |
| 06/15/2023 | 9.875% | | 129,000 | 140,419 |
| Total | 42,460,074 |
| Electric 2.8% |
| AEP Texas Central Co.(a) |
| 10/01/2025 | 3.850% | | 880,000 | 879,403 |
| AEP Texas Central Co. |
| 02/15/2033 | 6.650% | | 1,730,000 | 2,178,660 |
| AEP Texas, Inc.(a) |
| 06/01/2028 | 3.950% | | 2,330,000 | 2,346,026 |
The accompanying Notes to Financial Statements are an integral part of this statement.
| 28 | Multi-Manager Total Return Bond Strategies Fund | Annual Report 2018 |
Portfolio of Investments (continued)
August 31, 2018
| Corporate Bonds & Notes (continued) |
| Issuer | Coupon
Rate | | Principal
Amount ($) | Value ($) |
| AES Corp. |
| 09/01/2027 | 5.125% | | 118,000 | 119,743 |
| Alliant Energy Finance LLC(a) |
| 06/15/2028 | 4.250% | | 7,000,000 | 7,031,920 |
| Ameren Corp. |
| 02/15/2026 | 3.650% | | 590,000 | 578,123 |
| American Electric Power Co., Inc. |
| 12/15/2022 | 2.950% | | 750,000 | 732,515 |
| 11/13/2027 | 3.200% | | 1,285,000 | 1,213,566 |
| Black Hills Corp. |
| 05/01/2033 | 4.350% | | 1,670,000 | 1,677,143 |
| Calpine Corp.(a) |
| 01/15/2024 | 5.875% | | 75,000 | 75,608 |
| Calpine Corp. |
| 01/15/2025 | 5.750% | | 5,632,000 | 5,115,810 |
| Cleveland Electric Illuminating Co. (The)(a) |
| 04/01/2028 | 3.500% | | 2,275,000 | 2,176,574 |
| Cleveland Electric Illuminating Co. (The) |
| 12/15/2036 | 5.950% | | 1,279,000 | 1,513,014 |
| CMS Energy Corp. |
| 03/01/2024 | 3.875% | | 1,275,000 | 1,283,953 |
| 02/15/2027 | 2.950% | | 80,000 | 74,042 |
| Consolidated Edison Co. of New York, Inc. |
| 06/15/2046 | 3.850% | | 1,310,000 | 1,245,682 |
| 06/15/2047 | 3.875% | | 2,050,000 | 1,959,039 |
| Dominion Energy, Inc. |
| 08/15/2026 | 2.850% | | 750,000 | 689,501 |
| Dominion Energy, Inc.(g) |
| Junior Subordinated |
| 07/01/2019 | 2.962% | | 845,000 | 845,196 |
| DPL, Inc. |
| 10/15/2021 | 7.250% | | 2,875,000 | 3,120,298 |
| DTE Energy Co. |
| 10/01/2026 | 2.850% | | 10,155,000 | 9,410,415 |
| Duke Energy Corp. |
| 09/01/2026 | 2.650% | | 7,445,000 | 6,786,438 |
| Duke Energy Florida LLC |
| 07/15/2048 | 4.200% | | 4,150,000 | 4,217,774 |
| Duke Energy Progress LLC |
| 08/15/2025 | 3.250% | | 3,000,000 | 2,946,432 |
| 03/30/2044 | 4.375% | | 960,000 | 999,370 |
| 09/15/2047 | 3.600% | | 1,175,000 | 1,074,859 |
| Duke Energy Progress, Inc. |
| 08/15/2045 | 4.200% | | 1,780,000 | 1,801,273 |
| Duquesne Light Holdings, Inc.(a) |
| 09/15/2020 | 6.400% | | 5,000,000 | 5,260,895 |
| Corporate Bonds & Notes (continued) |
| Issuer | Coupon
Rate | | Principal
Amount ($) | Value ($) |
| Enel Americas SA |
| 10/25/2026 | 4.000% | | 375,000 | 358,498 |
| Enel Finance International NV(a) |
| 04/06/2028 | 3.500% | | 2,370,000 | 2,142,899 |
| Entergy Mississippi, Inc. |
| 07/01/2023 | 3.100% | | 2,000,000 | 1,960,220 |
| Entergy Texas, Inc. |
| 12/01/2027 | 3.450% | | 3,335,000 | 3,219,449 |
| Exelon Corp. |
| 06/15/2025 | 3.950% | | 1,300,000 | 1,305,408 |
| 04/15/2046 | 4.450% | | 1,050,000 | 1,041,702 |
| Exelon Corp.(g) |
| Junior Subordinated |
| 06/01/2022 | 3.497% | | 4,600,000 | 4,546,879 |
| Exelon Generation Co. LLC |
| 10/01/2041 | 5.750% | | 2,000,000 | 2,044,092 |
| Fortis, Inc. |
| 10/04/2021 | 2.100% | | 3,215,000 | 3,076,610 |
| Gulf Power Co. |
| 10/01/2044 | 4.550% | | 1,350,000 | 1,376,490 |
| Indiana Michigan Power Co. |
| 08/15/2048 | 4.250% | | 5,830,000 | 5,874,291 |
| ITC Holdings Corp. |
| 06/15/2024 | 3.650% | | 3,810,000 | 3,775,001 |
| Jersey Central Power & Light Co.(a) |
| 04/01/2024 | 4.700% | | 2,000,000 | 2,089,772 |
| Jersey Central Power & Light Co. |
| 06/01/2037 | 6.150% | | 1,985,000 | 2,375,721 |
| Kansas City Power & Light Co. |
| 08/15/2025 | 3.650% | | 665,000 | 659,917 |
| Metropolitan Edison Co. |
| 01/15/2019 | 7.700% | | 2,115,000 | 2,149,756 |
| MidAmerican Energy Co. |
| 05/01/2046 | 4.250% | | 3,433,000 | 3,534,401 |
| National Rural Utilities Cooperative Finance Corp. |
| 11/01/2018 | 10.375% | | 1,749,000 | 1,769,416 |
| 02/07/2024 | 2.950% | | 7,535,000 | 7,334,516 |
| National Rural Utilities Cooperative Finance Corp.(g) |
| Subordinated |
| 04/20/2046 | 5.250% | | 1,750,000 | 1,796,588 |
| NextEra Energy Capital Holdings, Inc.(b) |
3-month USD LIBOR + 0.480%
05/04/2021 | 2.821% | | 13,845,000 | 13,875,071 |
| NextEra Energy Capital Holdings, Inc. |
| 06/15/2023 | 3.625% | | 3,000,000 | 2,995,275 |
| NextEra Energy Operating Partners LP(a) |
| 09/15/2027 | 4.500% | | 791,000 | 751,666 |
The accompanying Notes to Financial Statements are an integral part of this statement.
Multi-Manager Total Return Bond Strategies Fund | Annual Report 2018
| 29 |
Portfolio of Investments (continued)
August 31, 2018
| Corporate Bonds & Notes (continued) |
| Issuer | Coupon
Rate | | Principal
Amount ($) | Value ($) |
| NRG Energy, Inc. |
| 07/15/2022 | 6.250% | | 1,269,000 | 1,309,841 |
| 05/01/2024 | 6.250% | | 2,227,000 | 2,312,198 |
| Oklahoma Gas & Electric Co. |
| 08/15/2028 | 3.800% | | 2,735,000 | 2,741,947 |
| Oncor Electric Delivery Co. LLC |
| 09/30/2040 | 5.250% | | 2,000,000 | 2,317,810 |
| Pacific Gas & Electric Co. |
| 06/15/2025 | 3.500% | | 2,591,000 | 2,463,748 |
| 03/01/2034 | 6.050% | | 2,917,000 | 3,271,331 |
| 06/15/2043 | 4.600% | | 1,190,000 | 1,139,781 |
| 12/01/2046 | 4.000% | | 3,340,000 | 2,973,121 |
| Pennsylvania Electric Co.(a) |
| 03/15/2028 | 3.250% | | 1,990,000 | 1,878,132 |
| PNM Resources, Inc. |
| 03/09/2021 | 3.250% | | 4,145,000 | 4,118,874 |
| PPL Capital Funding, Inc. |
| 06/15/2022 | 4.200% | | 603,000 | 614,078 |
| 03/15/2024 | 3.950% | | 1,200,000 | 1,209,950 |
| PSEG Power LLC |
| 11/15/2018 | 2.450% | | 840,000 | 839,588 |
| 06/01/2023 | 3.850% | | 7,355,000 | 7,364,694 |
| Public Service Co. of Oklahoma |
| 02/01/2021 | 4.400% | | 3,500,000 | 3,589,544 |
| San Diego Gas & Electric Co. |
| 05/15/2048 | 4.125% | | 8,500,000 | 8,477,050 |
| Southern California Edison Co. |
| 03/01/2048 | 4.125% | | 3,260,000 | 3,181,551 |
| Southern Co. (The) |
| 07/01/2026 | 3.250% | | 8,166,000 | 7,685,945 |
| 07/01/2036 | 4.250% | | 745,000 | 723,237 |
| Southwestern Electric Power Co. |
| 10/01/2026 | 2.750% | | 6,450,000 | 5,964,592 |
| Toledo Edison Co. (The) |
| 05/15/2037 | 6.150% | | 951,000 | 1,166,459 |
| Tucson Electric Power Co. |
| 03/15/2023 | 3.850% | | 3,100,000 | 3,083,604 |
| Virginia Electric & Power Co. |
| 06/30/2019 | 5.000% | | 1,280,000 | 1,302,572 |
| Vistra Energy Corp. |
| 11/01/2022 | 7.375% | | 6,535,000 | 6,812,672 |
| 11/01/2024 | 7.625% | | 466,000 | 501,731 |
| Vistra Operations Co. LLC(a) |
| 09/01/2026 | 5.500% | | 3,350,000 | 3,402,863 |
| Xcel Energy, Inc. |
| 06/01/2025 | 3.300% | | 2,535,000 | 2,474,221 |
| Total | 220,328,044 |
| Corporate Bonds & Notes (continued) |
| Issuer | Coupon
Rate | | Principal
Amount ($) | Value ($) |
| Finance Companies 0.7% |
| AerCap Ireland Capital DAC/Global Aviation Trust |
| 05/15/2019 | 3.750% | | 4,000,000 | 4,020,252 |
| AerCap Ireland Capital Ltd./Global Aviation Trust |
| 05/15/2021 | 4.500% | | 3,505,000 | 3,564,880 |
| 10/01/2021 | 5.000% | | 6,000,000 | 6,198,948 |
| Air Lease Corp. |
| 03/01/2020 | 4.750% | | 4,530,000 | 4,619,526 |
| 12/01/2027 | 3.625% | | 2,580,000 | 2,404,459 |
| Ares Capital Corp. |
| 01/19/2022 | 3.625% | | 4,830,000 | 4,721,427 |
| Aviation Capital Group LLC(a) |
| 05/01/2023 | 3.875% | | 4,145,000 | 4,134,803 |
| Avolon Holdings Funding Ltd.(a) |
| 01/15/2023 | 5.500% | | 4,000,000 | 4,112,152 |
| CIT Group, Inc. |
| 08/01/2023 | 5.000% | | 325,000 | 331,893 |
| GATX Corp. |
| 11/07/2028 | 4.550% | | 1,985,000 | 2,002,571 |
| GE Capital International Funding Co. Unlimited Co. |
| 11/15/2020 | 2.342% | | 5,522,000 | 5,408,639 |
| 11/15/2025 | 3.373% | | 2,980,000 | 2,880,456 |
| 11/15/2035 | 4.418% | | 8,645,000 | 8,334,783 |
| Navient Corp. |
| 01/25/2023 | 5.500% | | 50,000 | 49,544 |
| 10/25/2024 | 5.875% | | 350,000 | 339,760 |
| Total | 53,124,093 |
| Food and Beverage 1.2% |
| Anheuser-Busch InBev Finance, Inc. |
| 02/01/2026 | 3.650% | | 16,765,000 | 16,413,488 |
| 02/01/2046 | 4.900% | | 8,060,000 | 8,272,002 |
| Anheuser-Busch InBev Worldwide, Inc. |
| 04/15/2048 | 4.600% | | 2,560,000 | 2,521,349 |
| Bacardi Ltd.(a) |
| 05/15/2048 | 5.300% | | 7,260,000 | 7,100,099 |
| Brown-Forman Corp. |
| 04/15/2025 | 3.500% | | 3,290,000 | 3,273,409 |
| Campbell Soup Co. |
| 03/15/2021 | 3.300% | | 4,145,000 | 4,122,721 |
| Central America Botling Corp.(a) |
| 01/31/2027 | 5.750% | | 1,600,000 | 1,591,614 |
| Chobani LLC/Finance Corp., Inc.(a) |
| 04/15/2025 | 7.500% | | 659,000 | 555,189 |
| General Mills, Inc. |
| 04/17/2028 | 4.200% | | 3,470,000 | 3,455,443 |
The accompanying Notes to Financial Statements are an integral part of this statement.
| 30 | Multi-Manager Total Return Bond Strategies Fund | Annual Report 2018 |
Portfolio of Investments (continued)
August 31, 2018
| Corporate Bonds & Notes (continued) |
| Issuer | Coupon
Rate | | Principal
Amount ($) | Value ($) |
| JBS U.S.A. LUX SA/Finance, Inc.(a) |
| 06/15/2025 | 5.750% | | 100,000 | 93,946 |
| Kellogg Co. |
| 05/15/2028 | 4.300% | | 3,705,000 | 3,737,522 |
| Kraft Heinz Foods Co. |
| 02/10/2020 | 5.375% | | 1,000,000 | 1,031,804 |
| 06/15/2023 | 4.000% | | 11,870,000 | 11,918,335 |
| 07/15/2025 | 3.950% | | 4,000,000 | 3,943,800 |
| 06/01/2026 | 3.000% | | 1,000,000 | 914,852 |
| 06/01/2046 | 4.375% | | 1,600,000 | 1,403,354 |
| Maple Escrow Subsidiary, Inc.(a) |
| 05/25/2021 | 3.551% | | 2,405,000 | 2,410,897 |
| Molson Coors Brewing Co. |
| 07/15/2019 | 1.450% | | 2,000,000 | 1,975,722 |
| 03/15/2020 | 2.250% | | 1,625,000 | 1,602,455 |
| Mondelez International, Inc.(a) |
| 10/28/2019 | 1.625% | | 6,000,000 | 5,909,382 |
| Mondelez International, Inc. |
| 05/07/2020 | 3.000% | | 3,870,000 | 3,862,194 |
| PepsiCo, Inc. |
| 04/30/2025 | 2.750% | | 1,300,000 | 1,254,447 |
| Pilgrim’s Pride Corp.(a) |
| 09/30/2027 | 5.875% | | 767,000 | 727,690 |
| Post Holdings, Inc.(a) |
| 08/15/2026 | 5.000% | | 422,000 | 405,147 |
| 03/01/2027 | 5.750% | | 994,000 | 982,007 |
| Smithfield Foods, Inc.(a) |
| 02/01/2022 | 3.350% | | 1,110,000 | 1,073,433 |
| Sysco Corp. |
| 03/15/2025 | 3.550% | | 4,200,000 | 4,139,453 |
| Tyson Foods, Inc.(b) |
3-month USD LIBOR + 0.450%
08/21/2020 | 2.762% | | 2,015,000 | 2,017,885 |
| Tyson Foods, Inc. |
| 08/15/2044 | 5.150% | | 200,000 | 204,302 |
| Total | 96,913,941 |
| Gaming 0.2% |
| Caesars Resort Collection LLC/CRC Finco, Inc.(a) |
| 10/15/2025 | 5.250% | | 78,000 | 74,611 |
| Eldorado Resorts, Inc. |
| 04/01/2025 | 6.000% | | 146,000 | 148,646 |
| GLP Capital LP/Financing II, Inc. |
| 11/01/2023 | 5.375% | | 125,000 | 131,612 |
| 04/15/2026 | 5.375% | | 1,215,000 | 1,262,001 |
| Jack Ohio Finance LLC/1 Corp.(a) |
| 11/15/2021 | 6.750% | | 165,000 | 170,902 |
| Corporate Bonds & Notes (continued) |
| Issuer | Coupon
Rate | | Principal
Amount ($) | Value ($) |
| MGM Growth Properties Operating Partnership LP/Finance Co-Issuer, Inc. |
| 05/01/2024 | 5.625% | | 975,000 | 1,003,179 |
| 09/01/2026 | 4.500% | | 1,915,000 | 1,829,583 |
| 01/15/2028 | 4.500% | | 25,000 | 23,065 |
| MGM Resorts International |
| 03/15/2023 | 6.000% | | 4,228,000 | 4,388,144 |
| 09/01/2026 | 4.625% | | 245,000 | 230,231 |
| Pinnacle Entertainment, Inc. |
| 05/01/2024 | 5.625% | | 1,575,000 | 1,654,122 |
| Scientific Games International, Inc. |
| 12/01/2022 | 10.000% | | 3,818,000 | 4,043,384 |
| Studio City Co., Ltd.(a) |
| 11/30/2021 | 7.250% | | 600,000 | 623,033 |
| Total | 15,582,513 |
| Health Care 1.4% |
| Abbott Laboratories |
| 11/22/2019 | 2.350% | | 1,188,000 | 1,183,773 |
| 11/30/2023 | 3.400% | | 5,185,000 | 5,162,367 |
| Acadia Healthcare Co., Inc. |
| 03/01/2024 | 6.500% | | 258,000 | 267,856 |
| Ascension Health Alliance |
| 11/15/2046 | 3.945% | | 375,000 | 370,139 |
| Barnabas Health, Inc. |
| 07/01/2028 | 4.000% | | 4,000,000 | 3,971,936 |
| Becton Dickinson and Co.(b) |
3-month USD LIBOR + 0.875%
12/29/2020 | 3.209% | | 2,000,000 | 2,015,148 |
3-month USD LIBOR + 1.030%
06/06/2022 | 3.344% | | 3,933,000 | 3,956,091 |
| Becton Dickinson and Co. |
| 06/06/2022 | 2.894% | | 2,000,000 | 1,948,674 |
| 12/15/2024 | 3.734% | | 158,000 | 155,628 |
| 05/15/2044 | 4.875% | | 1,945,000 | 1,906,271 |
| Boston Scientific Corp. |
| 01/15/2020 | 6.000% | | 4,000,000 | 4,152,940 |
| Change Healthcare Holdings LLC/Finance, Inc.(a) |
| 03/01/2025 | 5.750% | | 780,000 | 763,621 |
| CHS/Community Health Systems, Inc. |
| 02/01/2022 | 6.875% | | 838,000 | 427,395 |
| 03/31/2023 | 6.250% | | 597,000 | 567,354 |
| CHS/Community Health Systems, Inc.(a) |
| 01/15/2024 | 8.625% | | 399,000 | 417,154 |
| 06/30/2024 | 8.125% | | 4,393,000 | 3,613,242 |
| CVS Health Corp. |
| 12/05/2023 | 4.000% | | 515,000 | 519,261 |
| 07/20/2025 | 3.875% | | 877,000 | 865,217 |
| 06/01/2026 | 2.875% | | 2,320,000 | 2,132,999 |
| 03/25/2038 | 4.780% | | 1,270,000 | 1,265,517 |
| 07/20/2045 | 5.125% | | 525,000 | 538,731 |
The accompanying Notes to Financial Statements are an integral part of this statement.
Multi-Manager Total Return Bond Strategies Fund | Annual Report 2018
| 31 |
Portfolio of Investments (continued)
August 31, 2018
| Corporate Bonds & Notes (continued) |
| Issuer | Coupon
Rate | | Principal
Amount ($) | Value ($) |
| 03/25/2048 | 5.050% | | 9,250,000 | 9,453,907 |
| DaVita, Inc. |
| 08/15/2022 | 5.750% | | 150,000 | 152,071 |
| 05/01/2025 | 5.000% | | 150,000 | 142,626 |
| Duke University Health System, Inc. |
| 06/01/2047 | 3.920% | | 875,000 | 871,389 |
| Edwards Lifesciences Corp. |
| 06/15/2028 | 4.300% | | 3,960,000 | 4,013,119 |
| Express Scripts Holding Co. |
| 11/15/2021 | 4.750% | | 825,000 | 853,813 |
| 07/15/2023 | 3.000% | | 620,000 | 594,854 |
| 03/01/2027 | 3.400% | | 2,190,000 | 2,032,605 |
| 07/15/2046 | 4.800% | | 6,819,000 | 6,605,272 |
| Fresenius Medical Care U.S. Finance II, Inc.(a) |
| 07/31/2019 | 5.625% | | 8,000,000 | 8,168,760 |
| HCA, Inc. |
| 02/15/2020 | 6.500% | | 2,595,000 | 2,698,021 |
| 02/15/2022 | 7.500% | | 125,000 | 137,501 |
| 05/01/2023 | 4.750% | | 175,000 | 178,237 |
| 03/15/2024 | 5.000% | | 175,000 | 179,393 |
| 02/01/2025 | 5.375% | | 5,275,000 | 5,339,313 |
| 04/15/2025 | 5.250% | | 2,845,000 | 2,934,222 |
| Kaiser Foundation Hospitals |
| 05/01/2047 | 4.150% | | 2,000,000 | 2,048,150 |
| Mayo Clinic |
| 11/15/2052 | 4.128% | | 750,000 | 769,060 |
| McKesson Corp. |
| 02/16/2028 | 3.950% | | 2,310,000 | 2,242,084 |
| Memorial Sloan-Kettering Cancer Center |
| 07/01/2052 | 4.125% | | 4,630,000 | 4,678,166 |
| New York and Presbyterian Hospital (The) |
| 08/01/2116 | 4.763% | | 1,050,000 | 1,062,577 |
| NYU Langone Hospitals |
| 07/01/2042 | 4.428% | | 3,507,000 | 3,580,612 |
| 07/01/2043 | 5.750% | | 705,000 | 875,243 |
| Polaris Intermediate Corp. PIK(a) |
| 12/01/2022 | 8.500% | | 69,000 | 71,370 |
| Quest Diagnostics, Inc. |
| 06/01/2026 | 3.450% | | 3,255,000 | 3,113,147 |
| Surgery Center Holdings, Inc.(a) |
| 07/01/2025 | 6.750% | | 43,000 | 41,488 |
| Sutter Health |
| 08/15/2053 | 2.286% | | 2,300,000 | 2,265,031 |
| Teleflex, Inc. |
| 11/15/2027 | 4.625% | | 572,000 | 544,891 |
| Corporate Bonds & Notes (continued) |
| Issuer | Coupon
Rate | | Principal
Amount ($) | Value ($) |
| Tenet Healthcare Corp. |
| 02/01/2020 | 6.750% | | 2,800,000 | 2,884,210 |
| 04/01/2021 | 4.500% | | 559,000 | 559,715 |
| 10/01/2021 | 4.375% | | 25,000 | 25,070 |
| 06/15/2023 | 6.750% | | 375,000 | 377,554 |
| 07/15/2024 | 4.625% | | 1,701,000 | 1,667,225 |
| 05/01/2025 | 5.125% | | 106,000 | 105,205 |
| 08/01/2025 | 7.000% | | 154,000 | 153,998 |
| Texas Health Resources |
| 11/15/2055 | 4.330% | | 700,000 | 735,774 |
| Zimmer Biomet Holdings, Inc.(b) |
3-month USD LIBOR + 0.750%
03/19/2021 | 3.076% | | 4,145,000 | 4,163,839 |
| Zimmer Biomet Holdings, Inc. |
| 04/01/2025 | 3.550% | | 985,000 | 949,773 |
| Total | 113,470,599 |
| Healthcare Insurance 0.4% |
| Aetna, Inc. |
| 06/01/2021 | 4.125% | | 7,000,000 | 7,131,803 |
| Anthem, Inc. |
| 08/15/2019 | 2.250% | | 5,000,000 | 4,970,630 |
| 01/15/2043 | 4.650% | | 3,250,000 | 3,191,399 |
| Centene Corp. |
| 05/15/2022 | 4.750% | | 2,580,000 | 2,624,913 |
| 01/15/2025 | 4.750% | | 505,000 | 508,568 |
| Cigna Corp. |
| 10/15/2027 | 3.050% | | 3,015,000 | 2,733,842 |
| Humana, Inc. |
| 10/01/2019 | 2.625% | | 4,320,000 | 4,301,644 |
| Molina Healthcare, Inc. |
| 11/15/2022 | 5.375% | | 831,000 | 851,853 |
| UnitedHealth Group, Inc. |
| 07/15/2045 | 4.750% | | 2,460,000 | 2,655,268 |
| WellCare Health Plans, Inc. |
| 04/01/2025 | 5.250% | | 1,175,000 | 1,206,665 |
| Total | 30,176,585 |
| Healthcare REIT 0.6% |
| Alexandria Real Estate Equities, Inc. |
| 06/15/2023 | 3.900% | | 8,000,000 | 8,073,160 |
| HCP, Inc. |
| 02/01/2020 | 2.625% | | 6,000,000 | 5,959,686 |
| 11/15/2023 | 4.250% | | 4,896,000 | 4,936,701 |
| 08/15/2024 | 3.875% | | 782,000 | 769,935 |
| Healthcare Realty Trust, Inc. |
| 05/01/2025 | 3.875% | | 550,000 | 538,960 |
| Healthcare Trust of America Holdings LP |
| 07/15/2021 | 3.375% | | 3,455,000 | 3,443,284 |
The accompanying Notes to Financial Statements are an integral part of this statement.
| 32 | Multi-Manager Total Return Bond Strategies Fund | Annual Report 2018 |
Portfolio of Investments (continued)
August 31, 2018
| Corporate Bonds & Notes (continued) |
| Issuer | Coupon
Rate | | Principal
Amount ($) | Value ($) |
| Omega Healthcare Investors, Inc. |
| 01/15/2025 | 4.500% | | 975,000 | 965,367 |
| 04/01/2027 | 4.500% | | 2,480,000 | 2,410,359 |
| Ventas Realty LP |
| 03/01/2028 | 4.000% | | 2,845,000 | 2,785,212 |
| Ventas Realty LP/Capital Corp. |
| 04/01/2020 | 2.700% | | 3,000,000 | 2,976,855 |
| Welltower, Inc. |
| 04/01/2019 | 4.125% | | 9,651,000 | 9,691,679 |
| 09/01/2048 | 4.950% | | 8,340,000 | 8,437,903 |
| Total | 50,989,101 |
| Home Construction 0.2% |
| AV Homes, Inc. |
| 05/15/2022 | 6.625% | | 3,101,000 | 3,179,021 |
| Lennar Corp. |
| 11/15/2024 | 5.875% | | 146,000 | 151,266 |
| 06/01/2026 | 5.250% | | 2,323,000 | 2,302,532 |
| 11/29/2027 | 4.750% | | 11,000 | 10,512 |
| Mattamy Group Corp.(a) |
| 12/15/2023 | 6.875% | | 4,037,000 | 4,107,236 |
| Meritage Homes Corp. |
| 04/01/2022 | 7.000% | | 198,000 | 213,551 |
| 06/06/2027 | 5.125% | | 200,000 | 185,937 |
| PulteGroup, Inc. |
| 03/01/2026 | 5.500% | | 1,700,000 | 1,698,868 |
| 01/15/2027 | 5.000% | | 1,425,000 | 1,355,018 |
| Taylor Morrison Communities, Inc./Holdings II(a) |
| 04/15/2023 | 5.875% | | 3,446,000 | 3,456,476 |
| William Lyon Homes, Inc. |
| 01/31/2025 | 5.875% | | 1,625,000 | 1,546,750 |
| Total | 18,207,167 |
| Independent Energy 0.4% |
| Afren PLC(a),(i) |
| 12/09/2020 | 0.000% | | 195,168 | 97 |
| Anadarko Petroleum Corp. |
| 07/15/2024 | 3.450% | | 2,100,000 | 2,038,031 |
| Anadarko Petroleum Corp.(f) |
| 10/10/2036 | 0.000% | | 3,000,000 | 1,298,304 |
| Apache Corp. |
| 01/15/2023 | 2.625% | | 1,500,000 | 1,438,636 |
| 10/15/2028 | 4.375% | | 8,330,000 | 8,243,843 |
| Canadian Natural Resources Ltd. |
| 06/30/2033 | 6.450% | | 730,000 | 868,658 |
| Centennial Resource Production LLC(a) |
| 01/15/2026 | 5.375% | | 42,000 | 41,404 |
| Corporate Bonds & Notes (continued) |
| Issuer | Coupon
Rate | | Principal
Amount ($) | Value ($) |
| CNX Resources Corp. |
| 04/01/2023 | 8.000% | | 1,171,000 | 1,241,260 |
| Conoco Funding Co. |
| 10/15/2031 | 7.250% | | 2,000,000 | 2,597,546 |
| Continental Resources, Inc. |
| 04/15/2023 | 4.500% | | 385,000 | 393,364 |
| 06/01/2024 | 3.800% | | 1,683,000 | 1,655,052 |
| CrownRock LP/Finance, Inc.(a) |
| 10/15/2025 | 5.625% | | 187,000 | 181,771 |
| Devon Energy Corp. |
| 07/15/2041 | 5.600% | | 2,000,000 | 2,151,154 |
| Diamondback Energy, Inc. |
| 11/01/2024 | 4.750% | | 848,000 | 854,965 |
| 05/31/2025 | 5.375% | | 2,566,000 | 2,631,105 |
| EOG Resources, Inc. |
| 03/15/2023 | 2.625% | | 1,195,000 | 1,155,808 |
| EQT Corp. |
| 10/01/2027 | 3.900% | | 1,830,000 | 1,726,497 |
| Extraction Oil & Gas, Inc.(a) |
| 05/15/2024 | 7.375% | | 99,000 | 100,722 |
| Gulfport Energy Corp. |
| 05/15/2025 | 6.375% | | 175,000 | 172,945 |
| MEG Energy Corp.(a) |
| 03/31/2024 | 7.000% | | 3,000,000 | 2,734,209 |
| Noble Energy, Inc. |
| 11/15/2024 | 3.900% | | 1,000,000 | 992,909 |
| Occidental Petroleum Corp. |
| 04/15/2026 | 3.400% | | 775,000 | 767,203 |
| Parsley Energy LLC/Finance Corp.(a) |
| 01/15/2025 | 5.375% | | 1,000,000 | 1,008,735 |
| 08/15/2025 | 5.250% | | 312,000 | 310,888 |
| QEP Resources, Inc. |
| 03/01/2026 | 5.625% | | 35,000 | 33,461 |
| Range Resources Corp. |
| 05/15/2025 | 4.875% | | 350,000 | 334,966 |
| WPX Energy, Inc. |
| 01/15/2022 | 6.000% | | 161,000 | 166,609 |
| 09/15/2024 | 5.250% | | 78,000 | 78,340 |
| Total | 35,218,482 |
| Integrated Energy 0.3% |
| BP Capital Markets PLC |
| 05/06/2022 | 3.245% | | 1,875,000 | 1,873,110 |
| 05/10/2023 | 2.750% | | 1,500,000 | 1,459,215 |
| Cenovus Energy, Inc. |
| 11/15/2039 | 6.750% | | 8,555,000 | 9,755,335 |
The accompanying Notes to Financial Statements are an integral part of this statement.
Multi-Manager Total Return Bond Strategies Fund | Annual Report 2018
| 33 |
Portfolio of Investments (continued)
August 31, 2018
| Corporate Bonds & Notes (continued) |
| Issuer | Coupon
Rate | | Principal
Amount ($) | Value ($) |
| Chevron Corp. |
| 06/24/2023 | 3.191% | | 700,000 | 699,964 |
| 05/16/2026 | 2.954% | | 2,490,000 | 2,393,597 |
| Husky Energy, Inc. |
| 04/15/2022 | 3.950% | | 3,000,000 | 3,030,678 |
| Sasol Financing International Ltd. |
| 11/14/2022 | 4.500% | | 3,800,000 | 3,677,804 |
| Total | 22,889,703 |
| Leisure 0.0% |
| Cinemark U.S.A., Inc. |
| 06/01/2023 | 4.875% | | 1,925,000 | 1,904,198 |
| Life Insurance 0.9% |
| AIG Global Funding(a) |
| 07/02/2020 | 2.150% | | 590,000 | 579,119 |
| American International Group, Inc. |
| 02/15/2024 | 4.125% | | 1,600,000 | 1,620,214 |
| Athene Global Funding(a) |
| 04/20/2020 | 2.750% | | 3,165,000 | 3,128,967 |
| 07/01/2022 | 3.000% | | 1,270,000 | 1,236,454 |
| Athene Holding Ltd. |
| 01/12/2028 | 4.125% | | 7,910,000 | 7,428,360 |
| AXA Equitable Holdings, Inc.(a) |
| 04/20/2048 | 5.000% | | 8,260,000 | 7,776,740 |
| Brighthouse Financial, Inc. |
| 06/22/2027 | 3.700% | | 1,385,000 | 1,239,090 |
| 06/22/2047 | 4.700% | | 7,960,000 | 6,664,844 |
| Guardian Life Global Funding(a) |
| 04/26/2021 | 2.000% | | 4,600,000 | 4,461,834 |
| Guardian Life Insurance Co. of America (The)(a) |
| Subordinated |
| 06/19/2064 | 4.875% | | 1,530,000 | 1,571,644 |
| Jackson National Life Global Funding(a) |
| 01/30/2020 | 2.200% | | 6,585,000 | 6,502,516 |
| Lincoln National Corp. |
| 06/15/2040 | 7.000% | | 930,000 | 1,195,259 |
| Massachusetts Mutual Life Insurance Co.(a) |
| Subordinated |
| 04/15/2065 | 4.500% | | 955,000 | 912,138 |
| Northwestern Mutual Life Insurance Co. (The)(a) |
| Subordinated |
| 03/30/2040 | 6.063% | | 325,000 | 408,384 |
| 09/30/2047 | 3.850% | | 2,990,000 | 2,799,184 |
| Nuveen Finance LLC(a) |
| 11/01/2024 | 4.125% | | 1,050,000 | 1,048,228 |
| Pricoa Global Funding I(a) |
| 05/16/2019 | 2.200% | | 4,850,000 | 4,836,827 |
| 09/13/2019 | 1.450% | | 3,750,000 | 3,699,833 |
| Corporate Bonds & Notes (continued) |
| Issuer | Coupon
Rate | | Principal
Amount ($) | Value ($) |
| Principal Financial Group, Inc. |
| 09/15/2022 | 3.300% | | 1,510,000 | 1,499,370 |
| 05/15/2023 | 3.125% | | 667,000 | 654,394 |
| Teachers Insurance & Annuity Association of America(a) |
| Subordinated |
| 09/15/2044 | 4.900% | | 4,077,000 | 4,406,780 |
| 05/15/2047 | 4.270% | | 4,575,000 | 4,540,999 |
| Unum Group |
| 05/15/2021 | 3.000% | | 1,250,000 | 1,234,493 |
| Total | 69,445,671 |
| Lodging 0.1% |
| Hyatt Hotels Corp. |
| 09/15/2028 | 4.375% | | 3,310,000 | 3,291,229 |
| Marriott International, Inc. |
| 06/15/2026 | 3.125% | | 1,460,000 | 1,368,559 |
| RHP Hotel Properties LP/Finance Corp. |
| 04/15/2023 | 5.000% | | 2,400,000 | 2,395,485 |
| Total | 7,055,273 |
| Media and Entertainment 0.6% |
| 21st Century Fox America, Inc. |
| 03/01/2019 | 6.900% | | 5,000,000 | 5,099,290 |
| 08/15/2020 | 5.650% | | 1,760,000 | 1,841,623 |
| 03/15/2033 | 6.550% | | 1,000,000 | 1,245,751 |
| Activision Blizzard, Inc. |
| 09/15/2021 | 2.300% | | 795,000 | 770,723 |
| AMC Networks, Inc. |
| 04/01/2024 | 5.000% | | 2,550,000 | 2,518,092 |
| CBS Corp.(a) |
| 06/01/2023 | 2.900% | | 3,330,000 | 3,181,149 |
| Clear Channel International BV(a) |
| 12/15/2020 | 8.750% | | 537,000 | 555,214 |
| Clear Channel Worldwide Holdings, Inc. |
| 11/15/2022 | 6.500% | | 800,000 | 814,974 |
| 11/15/2022 | 6.500% | | 625,000 | 639,301 |
| Discovery Communications LLC(a) |
| 11/15/2019 | 2.750% | | 3,000,000 | 2,984,517 |
| 06/15/2022 | 3.500% | | 3,739,000 | 3,707,196 |
| Discovery Communications LLC |
| 09/20/2037 | 5.000% | | 650,000 | 633,552 |
| 09/20/2047 | 5.200% | | 340,000 | 330,882 |
| Electronic Arts, Inc. |
| 03/01/2021 | 3.700% | | 2,000,000 | 2,023,748 |
| Grupo Televisa SAB |
| 05/13/2045 | 5.000% | | 1,000,000 | 927,202 |
| Lin Television Corp. |
| 11/15/2022 | 5.875% | | 300,000 | 304,987 |
The accompanying Notes to Financial Statements are an integral part of this statement.
| 34 | Multi-Manager Total Return Bond Strategies Fund | Annual Report 2018 |
Portfolio of Investments (continued)
August 31, 2018
| Corporate Bonds & Notes (continued) |
| Issuer | Coupon
Rate | | Principal
Amount ($) | Value ($) |
| Nielsen Finance Co. SARL (The)(a) |
| 10/01/2021 | 5.500% | | 75,000 | 75,282 |
| Nielsen Finance LLC/Co.(a) |
| 04/15/2022 | 5.000% | | 3,350,000 | 3,252,086 |
| S&P Global, Inc. |
| 05/15/2048 | 4.500% | | 3,425,000 | 3,500,888 |
| Sinclair Television Group, Inc. |
| 10/01/2022 | 6.125% | | 75,000 | 76,791 |
| Sinclair Television Group, Inc.(a) |
| 08/01/2024 | 5.625% | | 550,000 | 542,816 |
| TEGNA, Inc. |
| 10/15/2023 | 6.375% | | 325,000 | 336,429 |
| Time Warner, Inc. |
| 06/01/2024 | 3.550% | | 895,000 | 872,643 |
| 02/15/2027 | 3.800% | | 735,000 | 705,413 |
| Univision Communications, Inc.(a) |
| 02/15/2025 | 5.125% | | 100,000 | 91,989 |
| Viacom, Inc. |
| 09/01/2023 | 4.250% | | 2,410,000 | 2,426,694 |
| 04/30/2036 | 6.875% | | 5,910,000 | 6,703,872 |
| Total | 46,163,104 |
| Metals and Mining 0.1% |
| Constellium NV(a) |
| 05/15/2024 | 5.750% | | 320,000 | 318,652 |
| Freeport-McMoRan, Inc. |
| 03/15/2023 | 3.875% | | 543,000 | 521,794 |
| 11/14/2024 | 4.550% | | 36,000 | 34,738 |
| 11/14/2034 | 5.400% | | 300,000 | 277,460 |
| 03/15/2043 | 5.450% | | 132,000 | 117,978 |
| Gerdau Holdings, Inc.(a) |
| 01/20/2020 | 7.000% | | 137,000 | 142,403 |
| Novelis Corp.(a) |
| 09/30/2026 | 5.875% | | 195,000 | 190,082 |
| Southern Copper Corp. |
| 11/08/2022 | 3.500% | | 130,000 | 128,666 |
| 04/23/2025 | 3.875% | | 600,000 | 588,811 |
| 11/08/2042 | 5.250% | | 1,400,000 | 1,408,786 |
| 04/23/2045 | 5.875% | | 1,663,000 | 1,810,789 |
| Vale Overseas Ltd. |
| 01/11/2022 | 4.375% | | 36,000 | 36,228 |
| 08/10/2026 | 6.250% | | 416,000 | 456,907 |
| 11/10/2039 | 6.875% | | 80,000 | 92,876 |
| Volcan Cia Minera SAA(a) |
| 02/02/2022 | 5.375% | | 100,000 | 100,896 |
| Total | 6,227,066 |
| Corporate Bonds & Notes (continued) |
| Issuer | Coupon
Rate | | Principal
Amount ($) | Value ($) |
| Midstream 1.3% |
| Buckeye Partners LP |
| 12/01/2026 | 3.950% | | 1,550,000 | 1,428,764 |
| Colorado Interstate Gas Co. LLC/Issuing Corp.(a) |
| 08/15/2026 | 4.150% | | 2,290,000 | 2,251,466 |
| Crestwood Midstream Partners LP/Finance Corp. |
| 04/01/2023 | 6.250% | | 50,000 | 51,509 |
| Enbridge, Inc. |
| 06/10/2024 | 3.500% | | 1,182,000 | 1,158,200 |
| Energy Transfer Equity LP |
| 01/15/2024 | 5.875% | | 575,000 | 610,206 |
| 06/01/2027 | 5.500% | | 1,692,000 | 1,778,047 |
| Energy Transfer Partners LP |
| 02/01/2024 | 4.900% | | 5,605,000 | 5,794,146 |
| 10/01/2043 | 5.950% | | 350,000 | 361,698 |
| 03/15/2045 | 5.150% | | 2,775,000 | 2,626,687 |
| Energy Transfer Partners LP/Regency Finance Corp. |
| 11/01/2023 | 4.500% | | 1,000,000 | 1,019,559 |
| Enterprise Products Operating LLC |
| 02/15/2024 | 3.900% | | 500,000 | 506,698 |
| 02/15/2025 | 3.750% | | 600,000 | 601,426 |
| 05/15/2046 | 4.900% | | 1,400,000 | 1,457,050 |
| Enterprise Products Operating LLC(g) |
| 02/15/2078 | 5.375% | | 7,295,000 | 6,853,091 |
| EQT Midstream Partners LP |
| 07/15/2028 | 5.500% | | 4,200,000 | 4,327,344 |
| Ferrellgas Partners LP/Finance Corp. |
| 05/01/2021 | 6.500% | | 350,000 | 320,387 |
| 01/15/2022 | 6.750% | | 150,000 | 134,814 |
| 06/15/2023 | 6.750% | | 200,000 | 171,956 |
| Kinder Morgan Energy Partners LP |
| 02/01/2024 | 4.150% | | 5,990,000 | 6,041,442 |
| 03/15/2032 | 7.750% | | 795,000 | 973,564 |
| 01/15/2038 | 6.950% | | 325,000 | 383,291 |
| 09/01/2039 | 6.500% | | 1,000,000 | 1,121,854 |
| 11/15/2040 | 7.500% | | 910,000 | 1,117,946 |
| Kinder Morgan, Inc. |
| 12/01/2034 | 5.300% | | 1,000,000 | 1,017,422 |
| Magellan Midstream Partners LP |
| 09/15/2046 | 4.250% | | 320,000 | 304,734 |
| MPLX LP |
| 12/01/2024 | 4.875% | | 325,000 | 337,679 |
| 06/01/2025 | 4.875% | | 200,000 | 207,883 |
| 03/01/2047 | 5.200% | | 1,500,000 | 1,499,806 |
| 04/15/2058 | 4.900% | | 5,660,000 | 5,145,766 |
| NGPL PipeCo LLC(a) |
| 08/15/2022 | 4.375% | | 151,000 | 152,138 |
| 08/15/2027 | 4.875% | | 412,000 | 414,590 |
The accompanying Notes to Financial Statements are an integral part of this statement.
Multi-Manager Total Return Bond Strategies Fund | Annual Report 2018
| 35 |
Portfolio of Investments (continued)
August 31, 2018
| Corporate Bonds & Notes (continued) |
| Issuer | Coupon
Rate | | Principal
Amount ($) | Value ($) |
| ONEOK, Inc. |
| 07/13/2047 | 4.950% | | 2,050,000 | 2,056,921 |
| Phillips 66 Partners LP |
| 02/15/2045 | 4.680% | | 1,300,000 | 1,231,595 |
| Plains All American Pipeline LP/Finance Corp. |
| 01/31/2023 | 2.850% | | 6,980,000 | 6,650,118 |
| 10/15/2023 | 3.850% | | 3,025,000 | 2,985,306 |
| 10/15/2025 | 4.650% | | 2,500,000 | 2,533,142 |
| 06/01/2042 | 5.150% | | 2,185,000 | 2,051,728 |
| Rockies Express Pipeline LLC(a) |
| 01/15/2019 | 6.000% | | 500,000 | 504,897 |
| 04/15/2020 | 5.625% | | 3,583,000 | 3,693,826 |
| Ruby Pipeline LLC(a) |
| 04/01/2022 | 6.000% | | 2,681,818 | 2,774,167 |
| Southern Natural Gas Co. LLC |
| 02/15/2031 | 7.350% | | 2,910,000 | 3,470,879 |
| Suburban Propane Partners LP/Energy Finance Corp. |
| 03/01/2025 | 5.750% | | 225,000 | 216,378 |
| Sunoco Logistics Partners Operations LP |
| 10/01/2047 | 5.400% | | 2,000,000 | 1,969,654 |
| Tallgrass Energy Partners LP/Finance Corp.(a) |
| 01/15/2028 | 5.500% | | 142,000 | 143,460 |
| Targa Pipeline Partners LP/Finance Corp. |
| 08/01/2023 | 5.875% | | 100,000 | 98,623 |
| Targa Resources Partners LP/Finance Corp. |
| 02/01/2027 | 5.375% | | 512,000 | 512,942 |
| Tennessee Gas Pipeline Co. LLC |
| 06/15/2032 | 8.375% | | 2,465,000 | 3,108,969 |
| 04/01/2037 | 7.625% | | 550,000 | 676,407 |
| Texas Eastern Transmission LP(a) |
| 10/15/2022 | 2.800% | | 1,000,000 | 967,516 |
| Transcontinental Gas Pipe Line Co. LLC(a) |
| 03/15/2048 | 4.600% | | 4,875,000 | 4,790,662 |
| Williams Companies, Inc. (The) |
| 01/15/2023 | 3.700% | | 800,000 | 792,350 |
| Williams Partners LP |
| 11/15/2020 | 4.125% | | 1,000,000 | 1,013,204 |
| 03/04/2024 | 4.300% | | 2,787,000 | 2,824,669 |
| 01/15/2025 | 3.900% | | 1,050,000 | 1,038,462 |
| 09/15/2025 | 4.000% | | 900,000 | 891,995 |
| 04/15/2040 | 6.300% | | 3,150,000 | 3,605,881 |
| Total | 100,774,914 |
| Natural Gas 0.2% |
| Atmos Energy Corp. |
| 10/15/2044 | 4.125% | | 2,045,000 | 2,029,409 |
| Boston Gas Co.(a) |
| 08/01/2027 | 3.150% | | 1,842,000 | 1,760,980 |
| Corporate Bonds & Notes (continued) |
| Issuer | Coupon
Rate | | Principal
Amount ($) | Value ($) |
| KeySpan Corp. |
| 11/15/2030 | 8.000% | | 670,000 | 901,445 |
| NiSource, Inc. |
| 02/15/2023 | 3.850% | | 1,175,000 | 1,183,509 |
| Sempra Energy |
| 02/15/2019 | 9.800% | | 1,000,000 | 1,029,773 |
| 11/15/2020 | 2.850% | | 3,455,000 | 3,413,751 |
| 06/15/2024 | 3.550% | | 1,500,000 | 1,476,450 |
| 06/15/2027 | 3.250% | | 242,000 | 226,786 |
| 02/01/2048 | 4.000% | | 2,920,000 | 2,659,752 |
| Total | 14,681,855 |
| Office REIT 0.2% |
| Boston Properties LP |
| 11/15/2020 | 5.625% | | 4,590,000 | 4,795,866 |
| 02/01/2023 | 3.850% | | 2,500,000 | 2,526,382 |
| Highwoods Realty LP |
| 06/15/2021 | 3.200% | | 2,275,000 | 2,245,889 |
| SL Green Operating Partnership LP |
| 10/15/2022 | 3.250% | | 2,825,000 | 2,757,076 |
| Total | 12,325,213 |
| Oil Field Services 0.1% |
| Baker Hughes a GE Co. LLC/Co-Obligor, Inc. |
| 12/15/2047 | 4.080% | | 2,250,000 | 2,058,001 |
| Schlumberger Holdings Corp.(a) |
| 12/21/2025 | 4.000% | | 2,100,000 | 2,113,688 |
| Transocean Pontus Ltd.(a) |
| 08/01/2025 | 6.125% | | 562,000 | 572,204 |
| Transocean Proteus Ltd.(a) |
| 12/01/2024 | 6.250% | | 472,600 | 482,052 |
| Total | 5,225,945 |
| Other Financial Institutions 0.1% |
| Mitsubishi UFJ Lease & Finance Co., Ltd.(a) |
| 09/19/2022 | 2.652% | | 3,905,000 | 3,752,923 |
| ORIX Corp. |
| 12/04/2024 | 3.250% | | 3,115,000 | 2,997,219 |
| Total | 6,750,142 |
| Other Industry 0.3% |
| Anixter, Inc. |
| 03/01/2023 | 5.500% | | 75,000 | 78,411 |
| Five Point Operating Co. LP/Capital Corp.(a) |
| 11/15/2025 | 7.875% | | 2,350,000 | 2,375,387 |
| Fluor Corp. |
| 09/15/2028 | 4.250% | | 6,745,000 | 6,694,608 |
| Greystar Real Estate Partners LLC(a) |
| 12/01/2025 | 5.750% | | 1,475,000 | 1,445,652 |
The accompanying Notes to Financial Statements are an integral part of this statement.
| 36 | Multi-Manager Total Return Bond Strategies Fund | Annual Report 2018 |
Portfolio of Investments (continued)
August 31, 2018
| Corporate Bonds & Notes (continued) |
| Issuer | Coupon
Rate | | Principal
Amount ($) | Value ($) |
| Massachusetts Institute of Technology |
| 07/01/2114 | 4.678% | | 1,768,000 | 1,931,982 |
| 07/01/2116 | 3.885% | | 1,850,000 | 1,718,911 |
| Northwestern University |
| 12/01/2057 | 3.662% | | 1,350,000 | 1,296,958 |
| President and Fellows of Harvard College |
| 07/15/2046 | 3.150% | | 3,031,000 | 2,703,100 |
| 07/15/2056 | 3.300% | | 2,230,000 | 2,002,493 |
| Trustees of the University of Pennsylvania (The) |
| 09/01/2112 | 4.674% | | 1,620,000 | 1,664,035 |
| University of Southern California |
| 10/01/2039 | 3.028% | | 4,525,000 | 4,112,542 |
| Total | 26,024,079 |
| Other REIT 0.4% |
| American Campus Communities Operating Partnership LP |
| 10/01/2020 | 3.350% | | 3,196,000 | 3,186,025 |
| 04/15/2023 | 3.750% | | 3,000,000 | 2,986,056 |
| Digital Realty Trust LP |
| 02/01/2020 | 5.875% | | 4,000,000 | 4,114,636 |
| Duke Realty LP |
| 02/15/2021 | 3.875% | | 3,150,000 | 3,185,639 |
| EPR Properties |
| 04/15/2028 | 4.950% | | 4,815,000 | 4,773,658 |
| Host Hotels & Resorts LP |
| 06/15/2025 | 4.000% | | 1,050,000 | 1,030,691 |
| 02/01/2026 | 4.500% | | 520,000 | 521,002 |
| Liberty Property LP |
| 06/15/2023 | 3.375% | | 2,500,000 | 2,458,760 |
| Life Storage LP |
| 12/15/2027 | 3.875% | | 2,500,000 | 2,384,618 |
| ProLogis LP |
| 08/15/2023 | 4.250% | | 1,600,000 | 1,655,923 |
| Select Income REIT |
| 05/15/2024 | 4.250% | | 1,865,000 | 1,797,804 |
| Total | 28,094,812 |
| Packaging 0.2% |
| Amcor Finance U.S.A., Inc.(a) |
| 04/28/2026 | 3.625% | | 1,250,000 | 1,197,389 |
| 05/15/2028 | 4.500% | | 2,000,000 | 2,022,292 |
| Ardagh Packaging Finance PLC/Holdings U.S.A., Inc.(a) |
| 05/15/2023 | 4.625% | | 500,000 | 495,840 |
| 05/15/2024 | 7.250% | | 575,000 | 605,575 |
| 02/15/2025 | 6.000% | | 800,000 | 786,246 |
| Ball Corp. |
| 11/15/2023 | 4.000% | | 300,000 | 293,288 |
| 03/15/2026 | 4.875% | | 600,000 | 597,291 |
| Corporate Bonds & Notes (continued) |
| Issuer | Coupon
Rate | | Principal
Amount ($) | Value ($) |
| Berry Global, Inc. |
| 07/15/2023 | 5.125% | | 418,000 | 417,150 |
| Berry Global, Inc.(a) |
| 02/15/2026 | 4.500% | | 1,250,000 | 1,171,875 |
| Crown Americas LLC/Capital Corp. V |
| 09/30/2026 | 4.250% | | 250,000 | 229,560 |
| Multi-Color Corp.(a) |
| 11/01/2025 | 4.875% | | 123,000 | 114,799 |
| OI European Group BV(a) |
| 03/15/2023 | 4.000% | | 1,000,000 | 950,573 |
| Owens-Brockway Glass Container, Inc.(a) |
| 01/15/2022 | 5.000% | | 50,000 | 50,283 |
| 08/15/2023 | 5.875% | | 100,000 | 102,606 |
| 01/15/2025 | 5.375% | | 150,000 | 148,125 |
| Reynolds Group Issuer, Inc./LLC |
| 10/15/2020 | 5.750% | | 7,396,230 | 7,415,224 |
| Total | 16,598,116 |
| Paper 0.1% |
| International Paper Co. |
| 11/15/2039 | 7.300% | | 2,000,000 | 2,545,608 |
| 08/15/2047 | 4.400% | | 55,000 | 51,065 |
| Plum Creek Timberlands LP |
| 03/15/2023 | 3.250% | | 1,630,000 | 1,594,197 |
| WestRock MWV LLC |
| 09/01/2019 | 7.375% | | 4,000,000 | 4,160,672 |
| Weyerhaeuser Co. |
| 10/01/2019 | 7.375% | | 1,000,000 | 1,045,633 |
| Total | 9,397,175 |
| Pharmaceuticals 1.6% |
| AbbVie, Inc. |
| 05/14/2020 | 2.500% | | 1,200,000 | 1,187,850 |
| 05/14/2025 | 3.600% | | 5,975,000 | 5,840,210 |
| 05/14/2026 | 3.200% | | 850,000 | 800,709 |
| Allergan Finance LLC |
| 10/01/2022 | 3.250% | | 2,000,000 | 1,963,650 |
| 10/01/2042 | 4.625% | | 1,000,000 | 950,640 |
| Allergan Funding SCS |
| 06/15/2019 | 2.450% | | 2,000,000 | 1,993,250 |
| 03/15/2035 | 4.550% | | 5,329,000 | 5,234,767 |
| Amgen, Inc. |
| 05/01/2045 | 4.400% | | 2,735,000 | 2,630,635 |
| 06/15/2048 | 4.563% | | 2,043,000 | 2,018,539 |
| AstraZeneca PLC |
| 06/12/2027 | 3.125% | | 1,854,000 | 1,744,258 |
| 08/17/2048 | 4.375% | | 8,345,000 | 8,234,487 |
The accompanying Notes to Financial Statements are an integral part of this statement.
Multi-Manager Total Return Bond Strategies Fund | Annual Report 2018
| 37 |
Portfolio of Investments (continued)
August 31, 2018
| Corporate Bonds & Notes (continued) |
| Issuer | Coupon
Rate | | Principal
Amount ($) | Value ($) |
| Bausch Health Companies, Inc.(a) |
| 12/01/2021 | 5.625% | | 225,000 | 223,186 |
| 05/15/2023 | 5.875% | | 75,000 | 71,689 |
| 04/15/2025 | 6.125% | | 1,517,000 | 1,413,497 |
| 11/01/2025 | 5.500% | | 1,804,000 | 1,800,571 |
| Baxalta, Inc. |
| 06/23/2020 | 2.875% | | 1,000,000 | 997,853 |
| Bayer US Finance II LLC(a),(b) |
3-month USD LIBOR + 0.630%
06/25/2021 | 2.965% | | 1,825,000 | 1,833,789 |
| Bayer US Finance II LLC(a) |
| 06/25/2021 | 3.500% | | 800,000 | 799,640 |
| 07/15/2024 | 3.375% | | 3,555,000 | 3,417,215 |
| 12/15/2028 | 4.375% | | 5,625,000 | 5,576,889 |
| Bayer US Finance LLC(a) |
| 10/08/2019 | 2.375% | | 7,035,000 | 6,979,058 |
| 10/08/2024 | 3.375% | | 520,000 | 499,372 |
| Catalent Pharma Solutions, Inc.(a) |
| 01/15/2026 | 4.875% | | 600,000 | 573,826 |
| Celgene Corp. |
| 08/15/2025 | 3.875% | | 690,000 | 680,657 |
| 05/15/2044 | 4.625% | | 555,000 | 525,758 |
| 08/15/2045 | 5.000% | | 4,000,000 | 3,976,224 |
| 11/15/2047 | 4.350% | | 2,060,000 | 1,886,630 |
| Endo Dac/Finance LLC/Finco, Inc.(a) |
| 07/15/2023 | 6.000% | | 250,000 | 215,014 |
| Endo Dac/Finance LLC/Finco, Inc.(a),(g) |
| 02/01/2025 | 6.000% | | 475,000 | 393,433 |
| Gilead Sciences, Inc. |
| 09/20/2019 | 1.850% | | 2,240,000 | 2,219,759 |
| 04/01/2021 | 4.500% | | 1,500,000 | 1,546,181 |
| 09/01/2023 | 2.500% | | 1,355,000 | 1,299,132 |
| 02/01/2045 | 4.500% | | 3,114,000 | 3,139,470 |
| Johnson & Johnson |
| 12/05/2033 | 4.375% | | 2,625,000 | 2,845,306 |
| 03/03/2037 | 3.625% | | 2,280,000 | 2,235,225 |
| 01/15/2038 | 3.400% | | 3,705,000 | 3,498,365 |
| Mallinckrodt International Finance SA |
| 04/15/2023 | 4.750% | | 375,000 | 324,688 |
| Mallinckrodt International Finance SA/CB LLC(a) |
| 04/15/2020 | 4.875% | | 50,000 | 49,951 |
| 10/15/2023 | 5.625% | | 150,000 | 134,223 |
| 04/15/2025 | 5.500% | | 200,000 | 170,790 |
| Mylan NV |
| 06/15/2021 | 3.150% | | 2,050,000 | 2,021,327 |
| Mylan, Inc.(a) |
| 01/15/2023 | 3.125% | | 2,480,000 | 2,375,741 |
| Corporate Bonds & Notes (continued) |
| Issuer | Coupon
Rate | | Principal
Amount ($) | Value ($) |
| Shire Acquisitions Investments Ireland DAC |
| 09/23/2019 | 1.900% | | 12,995,000 | 12,844,531 |
| 09/23/2021 | 2.400% | | 10,120,000 | 9,787,244 |
| 09/23/2023 | 2.875% | | 2,640,000 | 2,522,758 |
| 09/23/2026 | 3.200% | | 2,310,000 | 2,153,791 |
| Teva Pharmaceutical Finance Co. BV |
| 12/18/2022 | 2.950% | | 2,175,000 | 1,999,732 |
| Zoetis, Inc. |
| 09/12/2027 | 3.000% | | 2,220,000 | 2,082,746 |
| 08/20/2048 | 4.450% | | 8,345,000 | 8,340,327 |
| Total | 126,054,583 |
| Property & Casualty 0.5% |
| American Financial Group, Inc. |
| 08/15/2026 | 3.500% | | 3,555,000 | 3,357,321 |
| Arch Capital Finance LLC |
| 12/15/2046 | 5.031% | | 970,000 | 1,033,582 |
| Assurant, Inc. |
| 09/27/2023 | 4.200% | | 2,360,000 | 2,368,173 |
| Berkshire Hathaway, Inc. |
| 03/15/2026 | 3.125% | | 850,000 | 827,321 |
| Chubb INA Holdings, Inc. |
| 05/15/2024 | 3.350% | | 910,000 | 901,450 |
| CNA Financial Corp. |
| 08/15/2021 | 5.750% | | 925,000 | 979,867 |
| 08/15/2027 | 3.450% | | 3,828,000 | 3,590,055 |
| Fairfax Financial Holdings Ltd.(a) |
| 04/17/2028 | 4.850% | | 5,550,000 | 5,547,192 |
| Farmers Exchange Capital(a) |
| Subordinated |
| 07/15/2028 | 7.050% | | 1,000,000 | 1,180,380 |
| 07/15/2048 | 7.200% | | 1,615,000 | 1,942,197 |
| Farmers Exchange Capital II(a),(g) |
| Subordinated |
| 11/01/2053 | 6.151% | | 2,700,000 | 2,919,494 |
| Hartford Financial Services Group, Inc. (The) |
| 03/15/2048 | 4.400% | | 2,055,000 | 2,019,601 |
| Liberty Mutual Group, Inc.(a) |
| 05/01/2022 | 4.950% | | 2,570,000 | 2,676,033 |
| 06/15/2023 | 4.250% | | 275,000 | 280,064 |
| 05/01/2042 | 6.500% | | 1,080,000 | 1,335,215 |
| 08/01/2044 | 4.850% | | 1,000,000 | 1,025,120 |
| Marsh & McLennan Companies, Inc. |
| 03/01/2048 | 4.200% | | 5,775,000 | 5,715,090 |
| Nationstar Mortgage Holdings, Inc.(a) |
| 07/15/2023 | 8.125% | | 2,575,000 | 2,682,058 |
The accompanying Notes to Financial Statements are an integral part of this statement.
| 38 | Multi-Manager Total Return Bond Strategies Fund | Annual Report 2018 |
Portfolio of Investments (continued)
August 31, 2018
| Corporate Bonds & Notes (continued) |
| Issuer | Coupon
Rate | | Principal
Amount ($) | Value ($) |
| Nationwide Mutual Insurance Co.(a),(b) |
| Subordinated |
3-month USD LIBOR + 2.290%
12/15/2024 | 4.631% | | 1,725,000 | 1,723,518 |
| Total | 42,103,731 |
| Railroads 0.3% |
| Burlington Northern Santa Fe LLC |
| 09/15/2021 | 3.450% | | 295,000 | 297,333 |
| 09/01/2022 | 3.050% | | 475,000 | 472,083 |
| Canadian National Railway Co. |
| 02/03/2048 | 3.650% | | 2,770,000 | 2,612,113 |
| Canadian Pacific Railway Ltd. |
| 01/15/2022 | 4.500% | | 600,000 | 620,309 |
| CSX Corp. |
| 05/30/2042 | 4.750% | | 1,071,000 | 1,111,083 |
| 03/01/2048 | 4.300% | | 3,645,000 | 3,549,614 |
| 11/01/2066 | 4.250% | | 4,319,000 | 3,894,965 |
| Norfolk Southern Corp. |
| 02/28/2048 | 4.150% | | 3,300,000 | 3,209,445 |
| Union Pacific Corp. |
| 02/15/2019 | 2.250% | | 765,000 | 763,703 |
| 09/10/2028 | 3.950% | | 2,000,000 | 2,018,270 |
| 09/10/2048 | 4.500% | | 4,140,000 | 4,235,411 |
| Total | 22,784,329 |
| Refining 0.0% |
| Andeavor |
| 04/01/2024 | 5.125% | | 225,000 | 231,590 |
| Marathon Petroleum Corp. |
| 03/01/2021 | 5.125% | | 1,000,000 | 1,040,424 |
| Raizen Fuels Finance SA(a) |
| 01/20/2027 | 5.300% | | 450,000 | 423,422 |
| Total | 1,695,436 |
| Restaurants 0.2% |
| 1011778 BC ULC/New Red Finance, Inc.(a) |
| 05/15/2024 | 4.250% | | 1,563,000 | 1,497,157 |
| Brinker International, Inc.(a) |
| 10/01/2024 | 5.000% | | 1,425,000 | 1,375,194 |
| KFC Holding Co./Pizza Hut Holdings LLC/Taco Bell of America LLC(a) |
| 06/01/2026 | 5.250% | | 188,000 | 188,064 |
| 06/01/2027 | 4.750% | | 1,000,000 | 955,883 |
| McDonald’s Corp. |
| 04/01/2023 | 3.350% | | 14,065,000 | 14,028,065 |
| Total | 18,044,363 |
| Corporate Bonds & Notes (continued) |
| Issuer | Coupon
Rate | | Principal
Amount ($) | Value ($) |
| Retail REIT 0.2% |
| Brixmor Operating Partnership LP |
| 06/15/2024 | 3.650% | | 2,740,000 | 2,658,732 |
| Kimco Realty Corp. |
| 11/01/2022 | 3.400% | | 290,000 | 286,443 |
| 03/01/2024 | 2.700% | | 2,698,000 | 2,524,246 |
| Realty Income Corp. |
| 04/15/2025 | 3.875% | | 4,120,000 | 4,127,692 |
| WEA Finance LLC/Westfield UK & Europe Finance PLC(a) |
| 09/17/2019 | 2.700% | | 1,000,000 | 996,574 |
| 10/05/2020 | 3.250% | | 6,975,000 | 6,963,359 |
| Total | 17,557,046 |
| Retailers 0.6% |
| Alimentation Couche-Tard, Inc.(a) |
| 12/13/2019 | 2.350% | | 4,000,000 | 3,959,748 |
| 07/26/2022 | 2.700% | | 2,790,000 | 2,695,743 |
| 07/26/2027 | 3.550% | | 2,500,000 | 2,377,772 |
| AutoNation, Inc. |
| 01/15/2021 | 3.350% | | 660,000 | 655,648 |
| 11/15/2024 | 3.500% | | 5,725,000 | 5,464,724 |
| AutoZone, Inc. |
| 04/21/2026 | 3.125% | | 415,000 | 388,462 |
| Hanesbrands, Inc.(a) |
| 05/15/2026 | 4.875% | | 75,000 | 72,481 |
| Hot Topic, Inc.(a) |
| 06/15/2021 | 9.250% | | 1,700,000 | 1,654,284 |
| L Brands, Inc. |
| 02/15/2022 | 5.625% | | 4,550,000 | 4,613,882 |
| 11/01/2035 | 6.875% | | 141,000 | 117,498 |
| Macy’s Retail Holdings, Inc. |
| 02/15/2043 | 4.300% | | 1,888,000 | 1,440,134 |
| O’Reilly Automotive, Inc. |
| 03/15/2026 | 3.550% | | 680,000 | 655,385 |
| Party City Holdings, Inc.(a) |
| 08/15/2023 | 6.125% | | 425,000 | 432,407 |
| PetSmart, Inc.(a) |
| 06/01/2025 | 5.875% | | 920,000 | 746,920 |
| Ralph Lauren Corp. |
| 09/15/2025 | 3.750% | | 6,525,000 | 6,523,845 |
| Rite Aid Corp.(a) |
| 04/01/2023 | 6.125% | | 183,000 | 164,443 |
| Walgreens Boots Alliance, Inc. |
| 11/18/2024 | 3.800% | | 3,050,000 | 3,019,235 |
| 11/18/2044 | 4.800% | | 1,950,000 | 1,872,645 |
The accompanying Notes to Financial Statements are an integral part of this statement.
Multi-Manager Total Return Bond Strategies Fund | Annual Report 2018
| 39 |
Portfolio of Investments (continued)
August 31, 2018
| Corporate Bonds & Notes (continued) |
| Issuer | Coupon
Rate | | Principal
Amount ($) | Value ($) |
| Walmart, Inc. |
| 04/22/2024 | 3.300% | | 2,100,000 | 2,104,253 |
| 06/26/2025 | 3.550% | | 5,820,000 | 5,882,454 |
| Total | 44,841,963 |
| Supermarkets 0.1% |
| Ahold Finance U.S.A. LLC |
| 05/01/2029 | 6.875% | | 1,800,000 | 2,124,319 |
| Kroger Co. (The) |
| 12/15/2018 | 6.800% | | 3,060,000 | 3,094,755 |
| 04/15/2042 | 5.000% | | 1,209,000 | 1,204,800 |
| 01/15/2048 | 4.650% | | 3,326,000 | 3,199,705 |
| Total | 9,623,579 |
| Supranational 0.4% |
| Asian Development Bank |
| 06/16/2028 | 5.820% | | 5,000,000 | 6,048,260 |
| Corp. Andina de Fomento |
| 01/06/2023 | 2.750% | | 3,000,000 | 2,904,048 |
| Corporación Andina de Fomento |
| 06/04/2019 | 8.125% | | 1,400,000 | 1,452,499 |
| 09/27/2021 | 2.125% | | 5,805,000 | 5,585,768 |
| 06/15/2022 | 4.375% | | 400,000 | 412,352 |
| Inter-American Development Bank |
| 10/15/2025 | 6.800% | | 2,500,000 | 3,055,713 |
| 07/15/2027 | 6.750% | | 4,000,000 | 4,933,708 |
| International Bank for Reconstruction & Development(f) |
| 09/17/2030 | 0.000% | | 13,000,000 | 8,618,558 |
| North American Development Bank |
| 10/26/2022 | 2.400% | | 1,950,000 | 1,882,046 |
| Total | 34,892,952 |
| Technology 1.7% |
| Apple, Inc. |
| 02/09/2022 | 2.150% | | 1,460,000 | 1,419,373 |
| 02/09/2022 | 2.500% | | 540,000 | 530,971 |
| 05/11/2027 | 3.200% | | 3,025,000 | 2,948,495 |
| 05/06/2044 | 4.450% | | 550,000 | 584,352 |
| BMC Software Finance, Inc.(a) |
| 07/15/2021 | 8.125% | | 3,000,000 | 3,067,479 |
| Broadcom Corp./Cayman Finance Ltd. |
| 01/15/2020 | 2.375% | | 7,800,000 | 7,712,164 |
| 01/15/2027 | 3.875% | | 4,000,000 | 3,742,393 |
| CDW LLC/Finance Corp. |
| 09/01/2023 | 5.000% | | 175,000 | 178,913 |
| 12/01/2024 | 5.500% | | 300,000 | 312,348 |
| Cisco Systems, Inc.(b) |
3-month USD LIBOR + 0.340%
09/20/2019 | 2.665% | | 3,645,000 | 3,657,254 |
| Corporate Bonds & Notes (continued) |
| Issuer | Coupon
Rate | | Principal
Amount ($) | Value ($) |
| CommScope Technologies LLC(a) |
| 06/15/2025 | 6.000% | | 3,200,000 | 3,270,170 |
| CommScope, Inc.(a) |
| 06/15/2024 | 5.500% | | 250,000 | 253,941 |
| Corning, Inc. |
| 11/15/2057 | 4.375% | | 5,235,000 | 4,669,819 |
| Dell International LLC/EMC Corp.(a) |
| 06/01/2019 | 3.480% | | 10,120,000 | 10,153,922 |
| 06/15/2026 | 6.020% | | 870,000 | 921,755 |
| Equifax, Inc. |
| 06/15/2023 | 3.950% | | 4,380,000 | 4,384,481 |
| Equinix, Inc. |
| 01/15/2026 | 5.875% | | 484,000 | 502,039 |
| Fidelity National Information Services, Inc. |
| 04/15/2023 | 3.500% | | 2,500,000 | 2,487,167 |
| First Data Corp.(a) |
| 08/15/2023 | 5.375% | | 225,000 | 228,903 |
| 12/01/2023 | 7.000% | | 7,238,000 | 7,544,356 |
| 01/15/2024 | 5.000% | | 450,000 | 451,784 |
| Flextronics International Ltd. |
| 06/15/2025 | 4.750% | | 385,000 | 390,556 |
| Genpact Luxembourg SARL |
| 04/01/2022 | 3.700% | | 3,425,000 | 3,355,311 |
| Hewlett Packard Enterprise Co.(g) |
| 10/05/2018 | 2.850% | | 788,000 | 788,265 |
| 10/15/2020 | 3.600% | | 690,000 | 695,074 |
| 10/15/2025 | 4.900% | | 6,925,000 | 7,134,391 |
| Hewlett Packard Enterprise Co.(a) |
| 10/04/2019 | 2.100% | | 4,350,000 | 4,308,014 |
| Infor US, Inc. |
| 05/15/2022 | 6.500% | | 350,000 | 355,641 |
| Jabil, Inc. |
| 12/15/2020 | 5.625% | | 1,000,000 | 1,042,461 |
| Marvell Technology Group Ltd. |
| 06/22/2023 | 4.200% | | 4,970,000 | 4,986,451 |
| Microchip Technology, Inc.(a) |
| 06/01/2021 | 3.922% | | 1,845,000 | 1,845,018 |
| Microsoft Corp. |
| 11/03/2045 | 4.450% | | 811,000 | 881,772 |
| 02/12/2055 | 4.000% | | 640,000 | 639,706 |
| 02/06/2057 | 4.500% | | 3,620,000 | 3,951,961 |
| MSCI, Inc.(a) |
| 08/01/2026 | 4.750% | | 382,000 | 381,045 |
| NCR Corp. |
| 02/15/2021 | 4.625% | | 600,000 | 592,757 |
| 07/15/2022 | 5.000% | | 50,000 | 48,952 |
| 12/15/2023 | 6.375% | | 125,000 | 126,392 |
The accompanying Notes to Financial Statements are an integral part of this statement.
| 40 | Multi-Manager Total Return Bond Strategies Fund | Annual Report 2018 |
Portfolio of Investments (continued)
August 31, 2018
| Corporate Bonds & Notes (continued) |
| Issuer | Coupon
Rate | | Principal
Amount ($) | Value ($) |
| Nuance Communications, Inc.(a) |
| 08/15/2020 | 5.375% | | 988,000 | 991,186 |
| NXP BV/Funding LLC(a) |
| 06/01/2021 | 4.125% | | 850,000 | 853,221 |
| Oracle Corp. |
| 10/08/2019 | 2.250% | | 3,000,000 | 2,987,589 |
| 09/15/2023 | 2.400% | | 9,770,000 | 9,366,294 |
| 11/15/2027 | 3.250% | | 8,100,000 | 7,860,475 |
| Pitney Bowes, Inc.(g) |
| 05/15/2022 | 4.375% | | 1,725,000 | 1,579,041 |
| 04/01/2023 | 4.700% | | 3,520,000 | 3,156,602 |
| QUALCOMM, Inc. |
| 05/20/2020 | 2.250% | | 3,000,000 | 2,964,591 |
| Seagate HDD Cayman |
| 03/01/2024 | 4.875% | | 2,305,000 | 2,273,456 |
| Sensata Technologies UK Financing Co. PLC(a) |
| 02/15/2026 | 6.250% | | 2,825,000 | 2,972,615 |
| Tempo Acquisition LLC/Finance Corp.(a) |
| 06/01/2025 | 6.750% | | 116,000 | 112,737 |
| Trimble, Inc. |
| 06/15/2023 | 4.150% | | 2,690,000 | 2,702,522 |
| Xerox Corp. |
| 03/15/2023 | 3.625% | | 7,670,000 | 7,239,705 |
| Total | 135,605,880 |
| Tobacco 0.1% |
| BAT Capital Corp.(a) |
| 08/14/2020 | 2.297% | | 5,040,000 | 4,949,280 |
| 08/15/2022 | 2.764% | | 1,000,000 | 969,267 |
| Reynolds American, Inc. |
| 06/12/2025 | 4.450% | | 1,325,000 | 1,344,703 |
| 08/04/2041 | 7.000% | | 1,170,000 | 1,422,902 |
| 08/15/2045 | 5.850% | | 1,450,000 | 1,583,583 |
| Total | 10,269,735 |
| Transportation Services 0.4% |
| CH Robinson Worldwide, Inc. |
| 04/15/2028 | 4.200% | | 1,875,000 | 1,859,873 |
| ERAC U.S.A. Finance LLC(a) |
| 10/01/2020 | 5.250% | | 2,500,000 | 2,588,112 |
| 11/15/2024 | 3.850% | | 2,500,000 | 2,502,337 |
| 12/01/2026 | 3.300% | | 3,435,000 | 3,250,826 |
| 03/15/2042 | 5.625% | | 1,689,000 | 1,867,586 |
| 11/01/2046 | 4.200% | | 1,041,000 | 956,696 |
| Penske Truck Leasing Co. LP/Finance Corp.(a) |
| 04/01/2021 | 3.300% | | 2,000,000 | 1,987,712 |
| 02/01/2022 | 3.375% | | 1,200,000 | 1,189,960 |
| 08/01/2023 | 4.125% | | 7,840,000 | 7,890,192 |
| Corporate Bonds & Notes (continued) |
| Issuer | Coupon
Rate | | Principal
Amount ($) | Value ($) |
| Ryder System, Inc. |
| 11/15/2018 | 2.450% | | 660,000 | 659,707 |
| 06/01/2019 | 2.550% | | 1,500,000 | 1,496,238 |
| 06/09/2023 | 3.750% | | 7,030,000 | 7,068,503 |
| Total | 33,317,742 |
| Wireless 0.6% |
| America Movil SAB de CV |
| 03/30/2020 | 5.000% | | 300,000 | 307,327 |
| 07/16/2022 | 3.125% | | 200,000 | 196,349 |
| American Tower Corp. |
| 02/15/2019 | 3.400% | | 3,000,000 | 3,008,328 |
| 06/15/2023 | 3.000% | | 2,070,000 | 1,995,358 |
| 02/15/2024 | 5.000% | | 665,000 | 698,252 |
| Digicel Group Ltd.(a) |
| 09/30/2020 | 8.250% | | 600,000 | 449,980 |
| SK Telecom Co., Ltd.(a) |
| 04/16/2023 | 3.750% | | 2,490,000 | 2,482,368 |
| Sprint Capital Corp. |
| 11/15/2028 | 6.875% | | 476,000 | 473,918 |
| 03/15/2032 | 8.750% | | 1,000,000 | 1,105,085 |
| Sprint Communications, Inc.(a) |
| 11/15/2018 | 9.000% | | 2,444,000 | 2,471,561 |
| 03/01/2020 | 7.000% | | 3,305,000 | 3,437,511 |
| Sprint Corp. |
| 09/15/2023 | 7.875% | | 525,000 | 564,421 |
| 06/15/2024 | 7.125% | | 425,000 | 441,095 |
| 02/15/2025 | 7.625% | | 462,000 | 490,463 |
| Sprint Spectrum Co. I/II/III LLC(a) |
| 09/20/2021 | 3.360% | | 9,173,125 | 9,141,716 |
| 03/20/2025 | 4.738% | | 6,340,000 | 6,342,809 |
| T-Mobile U.S.A., Inc. |
| 03/01/2023 | 6.000% | | 50,000 | 51,418 |
| 01/15/2026 | 6.500% | | 591,000 | 625,909 |
| 02/01/2026 | 4.500% | | 647,000 | 616,390 |
| 02/01/2028 | 4.750% | | 2,070,000 | 1,950,323 |
| Vodafone Group PLC |
| 05/30/2025 | 4.125% | | 1,880,000 | 1,880,143 |
| 05/30/2028 | 4.375% | | 2,800,000 | 2,779,308 |
| 05/30/2048 | 5.250% | | 2,875,000 | 2,898,917 |
| Wind Tre SpA(a) |
| 01/20/2026 | 5.000% | | 2,000,000 | 1,798,972 |
| Total | 46,207,921 |
| Wirelines 0.9% |
| AT&T, Inc.(b) |
3-month USD LIBOR + 1.180%
06/12/2024 | 3.490% | | 9,165,000 | 9,183,449 |
The accompanying Notes to Financial Statements are an integral part of this statement.
Multi-Manager Total Return Bond Strategies Fund | Annual Report 2018
| 41 |
Portfolio of Investments (continued)
August 31, 2018
| Corporate Bonds & Notes (continued) |
| Issuer | Coupon
Rate | | Principal
Amount ($) | Value ($) |
| AT&T, Inc. |
| 03/01/2037 | 5.250% | | 8,285,000 | 8,238,554 |
| 06/15/2044 | 4.800% | | 4,250,000 | 3,870,075 |
| 05/15/2046 | 4.750% | | 2,610,000 | 2,360,789 |
| 03/01/2047 | 5.450% | | 285,000 | 283,712 |
| 03/09/2049 | 4.550% | | 3,385,000 | 2,944,351 |
| AT&T, Inc.(a) |
| 11/15/2046 | 5.150% | | 2,985,000 | 2,839,216 |
| CenturyLink, Inc. |
| 04/01/2020 | 5.625% | | 2,500,000 | 2,555,873 |
| 06/15/2021 | 6.450% | | 1,240,000 | 1,292,241 |
| Deutsche Telekom International Finance BV(a) |
| 06/21/2038 | 4.750% | | 11,865,000 | 11,931,895 |
| Level 3 Financing, Inc. |
| 01/15/2024 | 5.375% | | 526,000 | 526,810 |
| 05/01/2025 | 5.375% | | 625,000 | 619,887 |
| 03/15/2026 | 5.250% | | 555,000 | 543,164 |
| Qwest Corp. |
| 09/15/2025 | 7.250% | | 3,978,000 | 4,264,484 |
| Verizon Communications, Inc. |
| 02/15/2025 | 3.376% | | 622,000 | 605,562 |
| 08/10/2033 | 4.500% | | 9,435,000 | 9,331,300 |
| 11/01/2034 | 4.400% | | 2,000,000 | 1,931,764 |
| 11/01/2042 | 3.850% | | 1,395,000 | 1,205,457 |
| 08/21/2046 | 4.862% | | 3,500,000 | 3,462,207 |
| Zayo Group LLC/Capital, Inc.(a) |
| 01/15/2027 | 5.750% | | 1,001,000 | 1,003,003 |
| Total | 68,993,793 |
Total Corporate Bonds & Notes
(Cost $2,890,233,272) | 2,855,955,103 |
|
| Foreign Government Obligations(j) 2.5% |
| | | | |
| Argentina 0.2% |
| Argentine Republic Government International Bond |
| 04/22/2021 | 6.875% | | 1,800,000 | 1,606,559 |
| 01/11/2023 | 4.625% | | 3,875,000 | 3,051,768 |
| 04/22/2026 | 7.500% | | 2,000,000 | 1,650,418 |
| Argentine Republic Government International Bond(i) |
| 12/31/2033 | 0.000% | | 2,537,689 | 2,105,800 |
| Argentine Republic Government International Bond(g) |
| 12/31/2033 | 8.280% | | 1,934,812 | 1,577,573 |
| Provincia de Buenos Aires(a) |
| 06/09/2021 | 9.950% | | 3,370,000 | 3,111,238 |
| 02/15/2023 | 6.500% | | 1,070,000 | 868,324 |
| YPF SA(a) |
| 03/23/2021 | 8.500% | | 1,480,000 | 1,425,382 |
| Total | 15,397,062 |
| Foreign Government Obligations(j) (continued) |
| Issuer | Coupon
Rate | | Principal
Amount ($) | Value ($) |
| Brazil 0.1% |
| Banco Nacional de Desenvolvimento Economico e Social(a) |
| 06/10/2019 | 6.500% | | 100,000 | 102,012 |
| 06/10/2019 | 6.500% | | 100,000 | 102,012 |
| Brazil Minas SPE via State of Minas Gerais(a) |
| 02/15/2028 | 5.333% | | 2,900,000 | 2,757,442 |
| Brazilian Government International Bond |
| 04/07/2026 | 6.000% | | 1,100,000 | 1,105,554 |
| 01/20/2034 | 8.250% | | 150,000 | 171,938 |
| 01/07/2041 | 5.625% | | 800,000 | 689,091 |
| Petrobras Global Finance BV |
| 05/23/2021 | 8.375% | | 394,000 | 429,344 |
| 05/20/2023 | 4.375% | | 1,950,000 | 1,828,339 |
| 01/17/2027 | 7.375% | | 3,950,000 | 3,920,284 |
| Total | 11,106,016 |
| Canada 0.3% |
| CDP Financial, Inc.(a) |
| 11/25/2019 | 4.400% | | 10,000,000 | 10,197,810 |
| NOVA Chemicals Corp.(a) |
| 06/01/2024 | 4.875% | | 120,000 | 117,247 |
| Ontario Teachers’ Finance Trust(a) |
| 04/16/2021 | 2.750% | | 1,250,000 | 1,241,840 |
| Province of Alberta |
| 03/15/2028 | 3.300% | | 3,000,000 | 2,991,900 |
| Province of Manitoba |
| 11/30/2020 | 2.050% | | 2,500,000 | 2,452,710 |
| 06/22/2026 | 2.125% | | 300,000 | 275,868 |
| Province of Ontario |
| 04/14/2020 | 4.400% | | 600,000 | 614,623 |
| Province of Quebec(g) |
| 02/27/2026 | 7.140% | | 1,230,000 | 1,534,393 |
| 03/02/2026 | 7.485% | | 2,000,000 | 2,523,068 |
| Total | 21,949,459 |
| Chile 0.0% |
| Chile Government International Bond |
| 10/30/2022 | 2.250% | | 1,040,000 | 994,331 |
| Corporación Nacional del Cobre de Chile(a) |
| 11/04/2044 | 4.875% | | 200,000 | 204,412 |
| Total | 1,198,743 |
| China 0.1% |
| Industrial & Commercial Bank of China Ltd.(a),(g) |
| Junior Subordinated |
| 12/31/2049 | 6.000% | | 200,000 | 202,915 |
The accompanying Notes to Financial Statements are an integral part of this statement.
| 42 | Multi-Manager Total Return Bond Strategies Fund | Annual Report 2018 |
Portfolio of Investments (continued)
August 31, 2018
| Foreign Government Obligations(j) (continued) |
| Issuer | Coupon
Rate | | Principal
Amount ($) | Value ($) |
| Syngenta Finance NV(a) |
| 04/24/2028 | 5.182% | | 4,515,000 | 4,371,491 |
| Total | 4,574,406 |
| Colombia 0.0% |
| Colombia Government International Bond |
| 01/28/2026 | 4.500% | | 1,270,000 | 1,298,951 |
| 06/15/2045 | 5.000% | | 600,000 | 600,590 |
| Total | 1,899,541 |
| Costa Rica 0.0% |
| Costa Rica Government International Bond(a) |
| 01/26/2023 | 4.250% | | 900,000 | 846,214 |
| Croatia 0.0% |
| Croatia Government International Bond(a) |
| 01/26/2024 | 6.000% | | 700,000 | 758,715 |
| 01/26/2024 | 6.000% | | 300,000 | 325,164 |
| Total | 1,083,879 |
| Dominican Republic 0.1% |
| Dominican Republic International Bond(a) |
| 05/06/2021 | 7.500% | | 4,000,000 | 4,201,832 |
| 05/06/2021 | 7.500% | | 100,000 | 105,046 |
| 01/28/2024 | 6.600% | | 1,100,000 | 1,163,632 |
| 01/27/2025 | 5.500% | | 100,000 | 100,569 |
| 01/27/2025 | 5.500% | | 100,000 | 100,568 |
| 07/19/2028 | 6.000% | | 1,400,000 | 1,423,962 |
| Total | 7,095,609 |
| Egypt 0.1% |
| Egypt Government International Bond(a) |
| 02/21/2028 | 6.588% | | 3,900,000 | 3,661,144 |
| Finland 0.0% |
| Republic of Finland |
| 02/15/2026 | 6.950% | | 1,500,000 | 1,839,208 |
| France 0.1% |
| Dexia Credit Local SA(a) |
| 01/25/2021 | 2.500% | | 3,250,000 | 3,212,300 |
| 09/15/2021 | 1.875% | | 1,750,000 | 1,689,998 |
| Total | 4,902,298 |
| Hungary 0.1% |
| Hungary Government International Bond |
| 03/29/2021 | 6.375% | | 546,000 | 585,094 |
| 02/21/2023 | 5.375% | | 3,400,000 | 3,623,183 |
| 11/22/2023 | 5.750% | | 2,200,000 | 2,391,065 |
| 03/25/2024 | 5.375% | | 430,000 | 461,466 |
| Foreign Government Obligations(j) (continued) |
| Issuer | Coupon
Rate | | Principal
Amount ($) | Value ($) |
| Magyar Export-Import Bank Zrt.(a) |
| 01/30/2020 | 4.000% | | 800,000 | 802,771 |
| Total | 7,863,579 |
| India 0.0% |
| Export-Import Bank of India(a) |
| 08/05/2026 | 3.375% | | 860,000 | 798,414 |
| 02/01/2028 | 3.875% | | 1,025,000 | 972,425 |
| Total | 1,770,839 |
| Indonesia 0.1% |
| Indonesia Government International Bond(a) |
| 01/17/2038 | 7.750% | | 1,000,000 | 1,323,077 |
| Indonesia Government International Bond |
| 01/11/2048 | 4.350% | | 2,885,000 | 2,671,363 |
| PT Pertamina Persero(a) |
| 05/20/2043 | 5.625% | | 250,000 | 247,313 |
| 05/30/2044 | 6.450% | | 200,000 | 218,420 |
| PT Perusahaan Gas Negara Persero Tbk(a) |
| 05/16/2024 | 5.125% | | 1,900,000 | 1,926,452 |
| PT Perusahaan Listrik Negara(a) |
| 05/15/2027 | 4.125% | | 5,000,000 | 4,731,930 |
| Total | 11,118,555 |
| Iraq 0.0% |
| Iraq International Bond(a) |
| 03/09/2023 | 6.752% | | 900,000 | 877,373 |
| 01/15/2028 | 5.800% | | 750,000 | 687,910 |
| Total | 1,565,283 |
| Israel 0.0% |
| Israel Electric Corp., Ltd.(a) |
| 01/15/2019 | 7.250% | | 72,000 | 73,022 |
| 08/14/2028 | 4.250% | | 2,600,000 | 2,501,392 |
| Total | 2,574,414 |
| Italy 0.2% |
| Republic of Italy |
| 09/27/2023 | 6.875% | | 8,500,000 | 9,334,368 |
| Republic of Italy Government International Bond |
| 06/15/2033 | 5.375% | | 2,000,000 | 2,126,584 |
| Total | 11,460,952 |
| Japan 0.1% |
| Development Bank of Japan, Inc.(a) |
| 09/01/2022 | 2.125% | | 2,600,000 | 2,499,188 |
| Japan Bank for International Cooperation |
| 05/29/2019 | 1.750% | | 3,400,000 | 3,377,363 |
| 02/24/2020 | 2.250% | | 1,400,000 | 1,387,768 |
The accompanying Notes to Financial Statements are an integral part of this statement.
Multi-Manager Total Return Bond Strategies Fund | Annual Report 2018
| 43 |
Portfolio of Investments (continued)
August 31, 2018
| Foreign Government Obligations(j) (continued) |
| Issuer | Coupon
Rate | | Principal
Amount ($) | Value ($) |
| Japan Finance Organization for Municipalities(a) |
| 04/20/2022 | 2.625% | | 1,600,000 | 1,564,872 |
| Total | 8,829,191 |
| Kazakhstan 0.0% |
| Kazakhstan Government International Bond(a) |
| 07/21/2025 | 5.125% | | 1,100,000 | 1,185,119 |
| KazMunayGas National Co. JSC(a) |
| 04/19/2022 | 3.875% | | 950,000 | 943,410 |
| 04/19/2027 | 4.750% | | 600,000 | 597,790 |
| Total | 2,726,319 |
| Mexico 0.5% |
| Banco Nacional de Comercio Exterior SNC(a),(g) |
| Subordinated |
| 08/11/2026 | 3.800% | | 600,000 | 584,083 |
| Mexico Government International Bond |
| 03/15/2022 | 3.625% | | 1,974,000 | 1,975,417 |
| 10/02/2023 | 4.000% | | 200,000 | 200,531 |
| 01/30/2025 | 3.600% | | 1,000,000 | 972,930 |
| 03/08/2044 | 4.750% | | 2,738,000 | 2,612,411 |
| Pemex Project Funding Master Trust |
| 03/05/2020 | 6.000% | | 3,000,000 | 3,095,388 |
| 01/21/2021 | 5.500% | | 1,600,000 | 1,643,461 |
| 06/15/2038 | 6.625% | | 50,000 | 47,399 |
| Petroleos Mexicanos |
| 02/04/2021 | 6.375% | | 6,380,000 | 6,667,840 |
| 03/13/2022 | 5.375% | | 6,050,000 | 6,188,333 |
| 12/20/2022 | 1.700% | | 461,250 | 438,982 |
| 01/15/2025 | 4.250% | | 300,000 | 280,302 |
| 08/04/2026 | 6.875% | | 4,060,000 | 4,211,138 |
| 03/13/2027 | 6.500% | | 2,683,000 | 2,711,697 |
| 01/23/2045 | 6.375% | | 940,000 | 840,195 |
| 01/23/2046 | 5.625% | | 300,000 | 246,312 |
| 09/21/2047 | 6.750% | | 4,200,000 | 3,880,325 |
| Petroleos Mexicanos(a) |
| 02/12/2028 | 5.350% | | 625,000 | 582,798 |
| Total | 37,179,542 |
| Netherlands 0.0% |
| Petrobras Global Finance BV |
| 01/17/2022 | 6.125% | | 80,000 | 81,659 |
| 02/01/2029 | 5.750% | | 1,700,000 | 1,481,946 |
| Total | 1,563,605 |
| Oman 0.0% |
| Oman Government International Bond(a) |
| 01/17/2028 | 5.625% | | 580,000 | 557,961 |
| Foreign Government Obligations(j) (continued) |
| Issuer | Coupon
Rate | | Principal
Amount ($) | Value ($) |
| Panama 0.0% |
| Panama Government International Bond |
| 09/22/2024 | 4.000% | | 600,000 | 610,502 |
| 03/16/2025 | 3.750% | | 200,000 | 199,471 |
| 01/26/2036 | 6.700% | | 840,000 | 1,046,839 |
| Total | 1,856,812 |
| Paraguay 0.0% |
| Paraguay Government International Bond(a) |
| 01/25/2023 | 4.625% | | 600,000 | 615,077 |
| Peru 0.1% |
| Corporación Financiera de Desarrollo SA(a) |
| 07/15/2019 | 3.250% | | 200,000 | 200,049 |
| 07/15/2025 | 4.750% | | 520,000 | 525,442 |
| Fondo MIVIVIENDA SA(a) |
| 01/31/2023 | 3.500% | | 500,000 | 485,372 |
| Peruvian Government International Bond |
| 03/14/2037 | 6.550% | | 1,785,000 | 2,274,390 |
| 11/18/2050 | 5.625% | | 150,000 | 179,611 |
| Petroleos del Peru SA(a) |
| 06/19/2032 | 4.750% | | 400,000 | 389,980 |
| Total | 4,054,844 |
| Philippines 0.0% |
| Philippine Government International Bond |
| 01/15/2032 | 6.375% | | 400,000 | 488,488 |
| 10/23/2034 | 6.375% | | 275,000 | 343,622 |
| Power Sector Assets & Liabilities Management Corp.(a) |
| 05/27/2019 | 7.250% | | 100,000 | 103,002 |
| Total | 935,112 |
| Poland 0.0% |
| Poland Government International Bond |
| 03/17/2023 | 3.000% | | 300,000 | 294,748 |
| Qatar 0.1% |
| Nakilat, Inc.(a) |
| 12/31/2033 | 6.067% | | 1,164,000 | 1,283,310 |
| Qatar Government International Bond(a) |
| 04/23/2048 | 5.103% | | 2,545,000 | 2,613,611 |
| QNB Finance Ltd.(a) |
| 10/31/2018 | 2.750% | | 200,000 | 199,748 |
| Ras Laffan Liquefied Natural Gas Co., Ltd. II(a) |
| 09/30/2020 | 5.298% | | 448,704 | 458,670 |
| Total | 4,555,339 |
The accompanying Notes to Financial Statements are an integral part of this statement.
| 44 | Multi-Manager Total Return Bond Strategies Fund | Annual Report 2018 |
Portfolio of Investments (continued)
August 31, 2018
| Foreign Government Obligations(j) (continued) |
| Issuer | Coupon
Rate | | Principal
Amount ($) | Value ($) |
| Romania 0.0% |
| Romanian Government International Bond(a) |
| 08/22/2023 | 4.375% | | 150,000 | 151,888 |
| 06/15/2048 | 5.125% | | 2,000,000 | 1,983,498 |
| Total | 2,135,386 |
| Russian Federation 0.0% |
| Gazprom OAO Via Gaz Capital SA(a) |
| 04/28/2034 | 8.625% | | 200,000 | 245,042 |
| Russian Foreign Bond - Eurobond(a) |
| 04/04/2022 | 4.500% | | 1,000,000 | 1,010,671 |
| 09/16/2023 | 4.875% | | 200,000 | 205,010 |
| 04/04/2042 | 5.625% | | 800,000 | 827,872 |
| Total | 2,288,595 |
| Saudi Arabia 0.0% |
| Saudi Arabia Government International Bond(a) |
| 04/17/2025 | 4.000% | | 1,675,000 | 1,677,672 |
| Singapore 0.0% |
| Temasek Financial I Ltd.(a) |
| 08/01/2028 | 3.625% | | 2,060,000 | 2,071,872 |
| South Africa 0.1% |
| Eskom Holdings SOC Ltd.(a) |
| 08/10/2028 | 6.350% | | 1,400,000 | 1,399,444 |
| South Africa Government International Bond |
| 01/17/2024 | 4.665% | | 1,300,000 | 1,261,442 |
| 09/16/2025 | 5.875% | | 2,385,000 | 2,418,035 |
| Total | 5,078,921 |
| South Korea 0.0% |
| Export-Import Bank of Korea |
| 12/30/2020 | 2.625% | | 400,000 | 393,521 |
| Korea Development Bank (The) |
| 03/11/2020 | 2.500% | | 300,000 | 296,837 |
| 09/14/2022 | 3.000% | | 200,000 | 195,877 |
| Total | 886,235 |
| Turkey 0.1% |
| Turkey Government International Bond |
| 03/30/2021 | 5.625% | | 3,400,000 | 3,110,412 |
| 03/23/2023 | 3.250% | | 950,000 | 764,455 |
| Total | 3,874,867 |
| United Arab Emirates 0.0% |
| DP World Ltd.(a) |
| 07/02/2037 | 6.850% | | 300,000 | 352,942 |
| Foreign Government Obligations(j) (continued) |
| Issuer | Coupon
Rate | | Principal
Amount ($) | Value ($) |
| Uruguay 0.1% |
| Uruguay Government International Bond |
| 10/27/2027 | 4.375% | | 850,000 | 864,982 |
| 06/18/2050 | 5.100% | | 200,000 | 203,590 |
| 04/20/2055 | 4.975% | | 2,145,000 | 2,142,621 |
| Total | 3,211,193 |
| Virgin Islands 0.0% |
| CNPC General Capital Ltd.(a) |
| 11/25/2019 | 2.700% | | 300,000 | 297,894 |
| Franshion Brilliant Ltd.(a) |
| 03/19/2019 | 5.750% | | 400,000 | 404,541 |
| Sinochem Offshore Capital Co., Ltd.(a) |
| 04/29/2019 | 3.250% | | 200,000 | 199,706 |
| Sinopec Group Overseas Development Ltd.(a) |
| 04/28/2025 | 3.250% | | 400,000 | 380,966 |
| 04/28/2025 | 3.250% | | 300,000 | 285,724 |
| Total | 1,568,831 |
Total Foreign Government Obligations
(Cost $206,783,782) | 198,222,265 |
|
| Inflation-Indexed Bonds 0.1% |
| | | | |
| United States 0.1% |
| U.S. Treasury Inflation-Indexed Bond |
| 02/15/2048 | 1.000% | | 6,897,622 | 7,075,772 |
Total Inflation-Indexed Bonds
(Cost $6,937,544) | 7,075,772 |
|
| Municipal Bonds 0.4% |
| Issue Description | Coupon
Rate | | Principal
Amount ($) | Value ($) |
| Higher Education 0.1% |
| University of California |
| Refunding Revenue Bonds |
| Taxable General |
| Series 2017AX |
| 07/01/2025 | 3.063% | | 5,700,000 | 5,592,612 |
| University of Texas System (The) |
| Revenue Bonds |
| Taxable Permanent University Fund |
| Series 2017 |
| 07/01/2047 | 3.376% | | 3,025,000 | 2,800,757 |
| University of Virginia |
| Revenue Bonds |
| Taxable |
| Series 2017C |
| 09/01/2117 | 4.179% | | 725,000 | 726,167 |
| Total | 9,119,536 |
The accompanying Notes to Financial Statements are an integral part of this statement.
Multi-Manager Total Return Bond Strategies Fund | Annual Report 2018
| 45 |
Portfolio of Investments (continued)
August 31, 2018
| Municipal Bonds (continued) |
| Issue Description | Coupon
Rate | | Principal
Amount ($) | Value ($) |
| Local General Obligation 0.1% |
| City of New York |
| Unlimited General Obligation Bonds |
| Series 2010 (BAM) |
| 03/01/2036 | 5.968% | | 3,100,000 | 3,859,066 |
| Los Angeles Unified School District |
| Unlimited General Obligation Bonds |
| Taxable Build America Bonds |
| Series 2009 |
| 07/01/2034 | 5.750% | | 2,685,000 | 3,268,853 |
| Total | 7,127,919 |
| Municipal Power 0.0% |
| Los Angeles Department of Water & Power System |
| Revenue Bonds |
| Series 2010 (BAM) |
| 07/01/2045 | 6.574% | | 1,595,000 | 2,262,492 |
| Special Non Property Tax 0.0% |
| State of Illinois |
| Revenue Bonds |
| Taxable Sales Tax |
| Series 2013 |
| 06/15/2028 | 3.350% | | 2,500,000 | 2,349,525 |
| Special Property Tax 0.0% |
| New York State Urban Development Corp. |
| Revenue Bonds |
| Taxable State Personal Income Tax |
| Series 2013 |
| 03/15/2022 | 3.200% | | 2,650,000 | 2,662,402 |
| State General Obligation 0.1% |
| State of California |
| Unlimited General Obligation Bonds |
| Build America Bonds |
| Series 2010 |
| 03/01/2040 | 7.625% | | 800,000 | 1,184,656 |
| Taxable-Various Purpose |
| Series 2010 |
| 03/01/2019 | 6.200% | | 2,700,000 | 2,748,303 |
| Total | 3,932,959 |
| Turnpike / Bridge / Toll Road 0.1% |
| Bay Area Toll Authority |
| Revenue Bonds |
| Series 2009 (BAM) |
| 04/01/2049 | 6.263% | | 1,920,000 | 2,662,983 |
| Municipal Bonds (continued) |
| Issue Description | Coupon
Rate | | Principal
Amount ($) | Value ($) |
| Pennsylvania Turnpike Commission |
| Revenue Bonds |
| Build America Bonds |
| Series 2009 |
| 12/01/2039 | 6.105% | | 1,620,000 | 2,066,180 |
| Total | 4,729,163 |
Total Municipal Bonds
(Cost $32,852,960) | 32,183,996 |
|
| Residential Mortgage-Backed Securities - Agency 18.6% |
| Issuer | Coupon
Rate | | Principal
Amount ($) | Value ($) |
| Federal Home Loan Mortgage Corp. |
| 04/01/2021 | 9.000% | | 153 | 154 |
03/01/2022-
08/01/2022 | 8.500% | | 3,788 | 3,963 |
08/01/2024-
02/01/2025 | 8.000% | | 19,612 | 20,884 |
10/01/2028-
07/01/2032 | 7.000% | | 274,853 | 307,655 |
03/01/2031-
12/01/2047 | 3.000% | | 75,000,121 | 72,743,525 |
10/01/2031-
07/01/2037 | 6.000% | | 838,831 | 930,776 |
04/01/2033-
09/01/2039 | 5.500% | | 1,655,466 | 1,799,949 |
10/01/2039-
08/01/2048 | 5.000% | | 4,745,269 | 5,025,622 |
09/01/2040-
06/01/2048 | 4.000% | | 18,778,023 | 19,251,981 |
09/01/2040-
07/01/2041 | 4.500% | | 2,584,080 | 2,713,268 |
08/01/2045-
03/01/2048 | 3.500% | | 177,345,018 | 177,003,864 |
| CMO Series 3071 Class ZP |
| 11/15/2035 | 5.500% | | 6,079,392 | 6,980,407 |
| CMO Series 3741 Class PD |
| 10/15/2040 | 4.000% | | 1,855,000 | 1,927,442 |
| CMO Series 3809 Class HZ |
| 02/15/2041 | 4.000% | | 2,379,241 | 2,450,076 |
| CMO Series 3928 Class MB |
| 09/15/2041 | 4.500% | | 2,435,000 | 2,537,057 |
| CMO Series 3963 Class JB |
| 11/15/2041 | 4.500% | | 6,742,422 | 7,265,426 |
| CMO Series 4013 Class PL |
| 03/15/2042 | 3.500% | | 1,281,000 | 1,264,530 |
| CMO Series 4034 Class PB |
| 04/15/2042 | 4.500% | | 730,566 | 793,512 |
| CMO Series 4059 Class DY |
| 06/15/2042 | 3.500% | | 5,074,000 | 5,001,944 |
The accompanying Notes to Financial Statements are an integral part of this statement.
| 46 | Multi-Manager Total Return Bond Strategies Fund | Annual Report 2018 |
Portfolio of Investments (continued)
August 31, 2018
| Residential Mortgage-Backed Securities - Agency (continued) |
| Issuer | Coupon
Rate | | Principal
Amount ($) | Value ($) |
| CMO Series 4247 Class AY |
| 09/15/2043 | 4.500% | | 1,500,000 | 1,613,606 |
| CMO Series 4396 Class PZ |
| 06/15/2037 | 3.000% | | 693,360 | 616,828 |
| CMO Series 4421 Class PB |
| 12/15/2044 | 4.000% | | 5,941,237 | 6,029,193 |
| CMO Series 4496 Class PZ |
| 07/15/2045 | 2.500% | | 618,866 | 508,655 |
| CMO Series 4627 Class PL |
| 10/15/2046 | 3.000% | | 2,541,000 | 2,381,107 |
| CMO Series 4649 Class BP |
| 01/15/2047 | 3.500% | | 2,286,452 | 2,205,202 |
| CMO Series 4745 Class VD |
| 01/15/2040 | 4.000% | | 5,493,630 | 5,724,130 |
| CMO Series 4767 Class HN |
| 03/15/2048 | 3.500% | | 4,621,584 | 4,473,712 |
| Federal Home Loan Mortgage Corp.(h) |
| 09/13/2048 | 4.500% | | 38,750,000 | 40,261,401 |
| Federal Home Loan Mortgage Corp.(b) |
| CMO Series 1486 Class FA |
1-month USD LIBOR + 1.300%
04/15/2023 | 3.363% | | 360,739 | 366,527 |
| CMO Series 2380 Class F |
1-month USD LIBOR + 0.450%
11/15/2031 | 2.513% | | 344,116 | 344,935 |
| CMO Series 2557 Class FG |
1-month USD LIBOR + 0.400%
01/15/2033 | 2.463% | | 773,967 | 772,104 |
| CMO Series 2962 Class PF |
1-month USD LIBOR + 0.250%
03/15/2035 | 2.313% | | 386,124 | 386,364 |
| CMO Series 2981 Class FU |
1-month USD LIBOR + 0.200%
05/15/2030 | 2.263% | | 559,615 | 555,978 |
| CMO Series 3065 Class EB |
1-month USD LIBOR + 19.890%
11/15/2035 | 13.702% | | 798,722 | 1,004,438 |
| CMO Series 3081 Class GC |
1-month USD LIBOR + 23.833%
12/15/2035 | 16.270% | | 1,209,467 | 1,663,022 |
| CMO Series 3085 Class FV |
1-month USD LIBOR + 0.700%
08/15/2035 | 2.763% | | 1,288,126 | 1,310,228 |
| CMO Series 3135 Class FC |
1-month USD LIBOR + 0.300%
04/15/2026 | 2.363% | | 1,066,309 | 1,067,006 |
| Residential Mortgage-Backed Securities - Agency (continued) |
| Issuer | Coupon
Rate | | Principal
Amount ($) | Value ($) |
| CMO Series 3564 Class FC |
1-month USD LIBOR + 1.250%
01/15/2037 | 3.332% | | 590,371 | 594,424 |
| CMO Series 3785 Class LS |
1-month USD LIBOR + 9.900%
01/15/2041 | 5.775% | | 2,032,007 | 2,036,205 |
| CMO Series 3852 Class QN |
1-month USD LIBOR + 27.211%
05/15/2041 | 5.500% | | 78,536 | 79,116 |
| CMO Series 3973 Class FP |
1-month USD LIBOR + 0.300%
12/15/2026 | 2.363% | | 1,014,554 | 1,015,778 |
| CMO Series 4048 Class FJ |
1-month USD LIBOR + 0.400%
07/15/2037 | 2.492% | | 619,332 | 620,279 |
| CMO Series 4203 Class QF |
1-month USD LIBOR + 0.250%
05/15/2043 | 2.313% | | 5,759,191 | 5,751,145 |
| CMO Series 4238 Class FD |
1-month USD LIBOR + 0.300%
02/15/2042 | 2.363% | | 2,685,817 | 2,680,902 |
| CMO Series 4311 Class PF |
1-month USD LIBOR + 0.350%
06/15/2042 | 2.413% | | 422,335 | 423,511 |
| CMO Series 4364 Class FE |
1-month USD LIBOR + 0.300%
12/15/2039 | 2.363% | | 587,984 | 588,853 |
| Federal Home Loan Mortgage Corp.(b),(d) |
| CMO Series 3404 Class AS |
1-month USD LIBOR + 5.895%
01/15/2038 | 3.832% | | 3,798,197 | 501,461 |
| CMO Series 4087 Class SC |
1-month USD LIBOR + 5.550%
07/15/2042 | 3.487% | | 13,540,657 | 1,437,163 |
| Federal Home Loan Mortgage Corp.(c),(d) |
| CMO Series 3833 Class LI |
| 10/15/2040 | 1.389% | | 19,888,791 | 1,122,476 |
| Federal Home Loan Mortgage Corp. Multifamily Structured Pass-Through Certificates(c),(d) |
| CMO Series K051 Class X1 |
| 09/25/2025 | 0.684% | | 19,009,947 | 613,181 |
| CMO Series K058 Class X1 |
| 08/25/2026 | 1.058% | | 2,475,419 | 152,953 |
| CMO Series KW02 Class X1 |
| 12/25/2026 | 0.446% | | 11,694,296 | 203,404 |
The accompanying Notes to Financial Statements are an integral part of this statement.
Multi-Manager Total Return Bond Strategies Fund | Annual Report 2018
| 47 |
Portfolio of Investments (continued)
August 31, 2018
| Residential Mortgage-Backed Securities - Agency (continued) |
| Issuer | Coupon
Rate | | Principal
Amount ($) | Value ($) |
| Federal National Mortgage Association |
| 04/01/2023 | 8.500% | | 698 | 702 |
| 06/01/2024 | 9.000% | | 2,916 | 2,995 |
02/01/2025-
08/01/2027 | 8.000% | | 39,276 | 42,695 |
03/01/2026-
07/01/2038 | 7.000% | | 840,721 | 943,924 |
04/01/2027-
06/01/2032 | 7.500% | | 73,850 | 81,128 |
05/01/2029-
10/01/2040 | 6.000% | | 2,888,024 | 3,190,189 |
08/01/2029-
02/01/2057 | 3.000% | | 123,540,783 | 120,109,849 |
| 06/01/2030 | 4.960% | | 1,106,789 | 1,203,874 |
01/01/2031-
11/01/2046 | 2.500% | | 6,411,439 | 6,159,806 |
03/01/2033-
04/01/2041 | 5.500% | | 1,381,348 | 1,505,285 |
10/01/2033-
02/01/2048 | 3.500% | | 185,945,647 | 185,565,650 |
07/01/2039-
10/01/2041 | 5.000% | | 5,643,967 | 6,044,563 |
10/01/2040-
12/01/2043 | 4.500% | | 7,451,302 | 7,798,023 |
02/01/2041-
01/01/2048 | 4.000% | | 130,316,266 | 133,315,452 |
| CMO Series 2003-82 Class Z |
| 08/25/2033 | 5.500% | | 204,757 | 220,327 |
| CMO Series 2005-110 Class GL |
| 12/25/2035 | 5.500% | | 2,333,000 | 2,536,283 |
| CMO Series 2005-68 Class KZ |
| 08/25/2035 | 5.750% | | 18,403,816 | 20,114,384 |
| CMO Series 2009-100 Class PL |
| 12/25/2039 | 5.000% | | 770,652 | 847,150 |
| CMO Series 2009-111 Class DA |
| 12/25/2039 | 5.000% | | 129,867 | 132,101 |
| CMO Series 2010-81 Class PB |
| 08/25/2040 | 5.000% | | 829,499 | 885,396 |
| CMO Series 2012-103 Class PY |
| 09/25/2042 | 3.000% | | 1,000,000 | 933,600 |
| CMO Series 2013-15 Class BL |
| 03/25/2043 | 2.500% | | 2,323,879 | 1,943,607 |
| CMO Series 2013-17 Class JP |
| 03/25/2043 | 3.000% | | 650,000 | 598,209 |
| CMO Series 2013-66 Class AP |
| 05/25/2043 | 6.000% | | 1,534,544 | 1,784,121 |
| CMO Series 2015-18 Class NB |
| 04/25/2045 | 3.000% | | 2,002,796 | 1,841,283 |
| CMO Series 2016-25 Class LB |
| 05/25/2046 | 3.000% | | 3,000,000 | 2,764,448 |
| Residential Mortgage-Backed Securities - Agency (continued) |
| Issuer | Coupon
Rate | | Principal
Amount ($) | Value ($) |
| CMO Series 2017-107 Class JM |
| 01/25/2048 | 3.000% | | 6,445,481 | 5,931,655 |
| CMO Series 2017-82 Class ML |
| 10/25/2047 | 4.000% | | 546,948 | 559,333 |
| CMO Series 2017-82 Class PL |
| 10/25/2047 | 3.000% | | 1,062,000 | 978,986 |
| CMO Series 2017-89 Class CY |
| 11/25/2047 | 3.000% | | 2,377,511 | 2,186,918 |
| CMO Series 2018-55 Class PA |
| 01/25/2047 | 3.500% | | 13,959,514 | 14,035,395 |
| Federal National Mortgage Association(h) |
| 09/18/2033 | 3.000% | | 4,845,000 | 4,816,706 |
| 10/12/2047 | 4.000% | | 82,025,000 | 83,425,316 |
| 10/12/2047 | 4.500% | | 50,500,000 | 52,381,283 |
| Federal National Mortgage Association(b) |
6-month USD LIBOR + 0.014%
04/01/2034 | 3.884% | | 140,386 | 144,922 |
| CMO Series 2002-59 Class HF |
1-month USD LIBOR + 0.350%
08/17/2032 | 2.410% | | 330,225 | 330,327 |
| CMO Series 2003-134 Class FC |
1-month USD LIBOR + 0.600%
12/25/2032 | 2.665% | | 2,003,979 | 2,032,175 |
| CMO Series 2004-93 Class FC |
1-month USD LIBOR + 0.200%
12/25/2034 | 2.265% | | 1,248,209 | 1,240,742 |
| CMO Series 2006-71 Class SH |
1-month USD LIBOR + 15.738%
05/25/2035 | 10.322% | | 255,632 | 317,722 |
| CMO Series 2007-90 Class F |
1-month USD LIBOR + 0.490%
09/25/2037 | 2.555% | | 736,376 | 734,758 |
| CMO Series 2007-W7 Class 1A4 |
1-month USD LIBOR + 39.180%
07/25/2037 | 26.792% | | 129,671 | 197,772 |
| CMO Series 2008-15 Class AS |
1-month USD LIBOR + 33.000%
08/25/2036 | 22.676% | | 637,958 | 958,836 |
| CMO Series 2010-135 Class FD |
1-month USD LIBOR + 0.500%
06/25/2039 | 2.565% | | 2,213,198 | 2,225,067 |
| CMO Series 2010-142 Class HS |
1-month USD LIBOR + 10.000%
12/25/2040 | 5.837% | | 1,124,332 | 1,034,538 |
The accompanying Notes to Financial Statements are an integral part of this statement.
| 48 | Multi-Manager Total Return Bond Strategies Fund | Annual Report 2018 |
Portfolio of Investments (continued)
August 31, 2018
| Residential Mortgage-Backed Securities - Agency (continued) |
| Issuer | Coupon
Rate | | Principal
Amount ($) | Value ($) |
| CMO Series 2010-150 Class FL |
1-month USD LIBOR + 0.550%
10/25/2040 | 2.615% | | 649,033 | 653,006 |
| CMO Series 2010-74 Class WF |
1-month USD LIBOR + 0.600%
07/25/2034 | 2.665% | | 1,083,123 | 1,095,985 |
| CMO Series 2010-86 Class FE |
1-month USD LIBOR + 0.450%
08/25/2025 | 2.515% | | 1,009,165 | 1,009,981 |
| CMO Series 2011-99 Class KF |
1-month USD LIBOR + 0.300%
10/25/2026 | 2.365% | | 1,042,608 | 1,042,019 |
| CMO Series 2012-1 Class FA |
1-month USD LIBOR + 0.500%
02/25/2042 | 2.565% | | 2,544,658 | 2,568,044 |
| CMO Series 2012-115 Class MT |
1-month USD LIBOR + 13.500%
10/25/2042 | 4.500% | | 2,011,880 | 1,695,687 |
| CMO Series 2012-14 Class FB |
1-month USD LIBOR + 0.450%
08/25/2037 | 2.515% | | 253,878 | 254,990 |
| CMO Series 2012-47 Class HF |
1-month USD LIBOR + 0.400%
05/25/2027 | 2.465% | | 1,604,759 | 1,614,193 |
| CMO Series 2012-73 Class LF |
1-month USD LIBOR + 0.450%
06/25/2039 | 2.515% | | 1,793,606 | 1,791,231 |
| CMO Series 2016-32 Class GT |
1-month USD LIBOR + 18.000%
01/25/2043 | 4.500% | | 1,928,491 | 1,735,143 |
| CMO Series 2017-82 Class FG |
1-month USD LIBOR + 0.250%
11/25/2032 | 2.315% | | 2,563,033 | 2,565,140 |
| Federal National Mortgage Association(k) |
05/01/2048-
08/01/2048 | 4.500% | | 37,335,646 | 38,779,493 |
| Federal National Mortgage Association(b),(d) |
| CMO Series 2004-29 Class PS |
1-month USD LIBOR + 7.600%
05/25/2034 | 5.535% | | 2,620,836 | 517,364 |
| CMO Series 2006-43 Class SJ |
1-month USD LIBOR + 6.590%
06/25/2036 | 4.525% | | 2,045,182 | 276,247 |
| CMO Series 2009-87 Class NS |
1-month USD LIBOR + 6.250%
11/25/2039 | 4.185% | | 10,697,410 | 1,369,679 |
| Residential Mortgage-Backed Securities - Agency (continued) |
| Issuer | Coupon
Rate | | Principal
Amount ($) | Value ($) |
| CMO Series 2010-57 Class SA |
1-month USD LIBOR + 6.450%
06/25/2040 | 4.385% | | 3,928,599 | 557,543 |
| CMO Series 2011-47 Class GS |
1-month USD LIBOR + 5.930%
06/25/2041 | 3.865% | | 13,431,436 | 1,551,526 |
| CMO Series 2016-19 Class SA |
1-month USD LIBOR + 6.100%
04/25/2046 | 4.035% | | 12,894,276 | 1,581,483 |
| CMO Series 2016-32 Class SA |
1-month USD LIBOR + 6.100%
10/25/2034 | 4.035% | | 5,964,804 | 744,447 |
| CMO Series 2016-60 Class SE |
1-month USD LIBOR + 6.250%
09/25/2046 | 4.185% | | 16,427,149 | 2,160,597 |
| CMO Series 2016-82 Class SG |
1-month USD LIBOR + 6.100%
11/25/2046 | 4.035% | | 21,047,153 | 2,772,038 |
| CMO Series 2016-93 Class SL |
1-month USD LIBOR + 6.650%
12/25/2046 | 4.585% | | 10,687,984 | 1,548,895 |
| CMO Series 2017-57 Class SD |
1-month USD LIBOR + 3.950%
08/25/2047 | 1.885% | | 18,870,660 | 1,102,671 |
| Federal National Mortgage Association(c) |
| CMO Series 2016-32 Class TG |
| 01/25/2043 | 4.500% | | 1,802,411 | 1,610,972 |
| CMO Series 2016-40 Class GA |
| 07/25/2046 | 3.897% | | 6,904,571 | 7,199,790 |
| Federal National Mortgage Association(f),(l) |
| CMO Series G93-28 Class E |
| 07/25/2022 | 0.000% | | 185,503 | 176,649 |
| Government National Mortgage Association |
05/15/2040-
09/20/2047 | 5.000% | | 10,167,696 | 10,694,713 |
| 05/20/2041 | 4.500% | | 1,338,410 | 1,410,496 |
02/15/2042-
11/20/2047 | 4.000% | | 13,829,404 | 14,206,446 |
03/20/2046-
01/20/2048 | 3.500% | | 64,063,678 | 64,371,415 |
12/20/2046-
01/20/2048 | 3.000% | | 31,013,228 | 30,372,068 |
| 01/20/2061 | 5.304% | | 49,586 | 50,479 |
04/20/2061-
09/20/2062 | 4.506% | | 470,534 | 476,911 |
01/20/2062-
08/20/2067 | 4.616% | | 878,069 | 915,964 |
| 03/20/2062 | 4.516% | | 113,935 | 115,084 |
| 05/20/2062 | 4.105% | | 1,377,653 | 1,392,517 |
| 05/20/2062 | 4.455% | | 109,918 | 111,160 |
| 05/20/2062 | 4.510% | | 118,414 | 119,937 |
| 06/20/2062 | 4.547% | | 101,681 | 102,803 |
The accompanying Notes to Financial Statements are an integral part of this statement.
Multi-Manager Total Return Bond Strategies Fund | Annual Report 2018
| 49 |
Portfolio of Investments (continued)
August 31, 2018
| Residential Mortgage-Backed Securities - Agency (continued) |
| Issuer | Coupon
Rate | | Principal
Amount ($) | Value ($) |
| 07/20/2062 | 4.643% | | 67,856 | 68,694 |
| 08/20/2062 | 4.471% | | 126,216 | 127,975 |
08/20/2062-
01/20/2066 | 4.519% | | 4,041,127 | 4,205,635 |
| 08/20/2062 | 4.522% | | 656,598 | 663,938 |
| 09/20/2062 | 4.488% | | 879,573 | 891,454 |
10/20/2062-
04/20/2063 | 4.423% | | 1,303,340 | 1,326,736 |
| 10/20/2062 | 4.484% | | 1,264,639 | 1,279,944 |
| 11/20/2062 | 4.607% | | 379,468 | 384,884 |
| 11/20/2062 | 4.635% | | 1,114,434 | 1,131,488 |
| 12/20/2062 | 4.604% | | 1,172,907 | 1,190,750 |
| 02/20/2063 | 4.264% | | 195,408 | 198,827 |
| 02/20/2063 | 4.284% | | 398,232 | 403,448 |
| 02/20/2063 | 4.412% | | 854,469 | 868,798 |
| 02/20/2063 | 4.589% | | 164,042 | 166,746 |
| 03/20/2063 | 4.502% | | 83,052 | 84,398 |
| 03/20/2063 | 4.556% | | 456,540 | 464,657 |
| 04/20/2063 | 4.178% | | 1,393,984 | 1,418,230 |
| 04/20/2063 | 4.511% | | 198,167 | 201,447 |
| 04/20/2063 | 4.526% | | 82,851 | 84,367 |
| 04/20/2063 | 5.032% | | 3,694 | 3,750 |
| 05/20/2063 | 4.383% | | 1,537,761 | 1,564,938 |
| 05/20/2063 | 4.439% | | 1,986,082 | 2,023,515 |
| 06/20/2063 | 4.386% | | 742,753 | 756,572 |
| 06/20/2063 | 4.397% | | 4,072,152 | 4,154,979 |
| 06/20/2063 | 4.561% | | 950,474 | 970,546 |
| 06/20/2063 | 4.600% | | 2,528,757 | 2,579,309 |
| 01/20/2064 | 4.632% | | 45,259 | 45,885 |
| 01/20/2064 | 4.644% | | 385,736 | 399,077 |
| 02/20/2064 | 4.618% | | 423,826 | 446,467 |
| 05/20/2064 | 4.671% | | 317,332 | 331,368 |
| 06/20/2064 | 4.106% | | 500,020 | 515,745 |
| 12/20/2064 | 4.495% | | 929,722 | 943,171 |
| 12/20/2064 | 4.625% | | 4,195,950 | 4,421,815 |
| 02/20/2065 | 4.572% | | 326,868 | 342,509 |
| 01/20/2066 | 4.548% | | 774,495 | 815,733 |
| 01/20/2066 | 4.577% | | 1,023,612 | 1,081,880 |
| 02/20/2066 | 4.478% | | 3,294,032 | 3,477,528 |
| 02/20/2066 | 4.538% | | 2,505,034 | 2,639,513 |
| 04/20/2066 | 4.565% | | 2,354,351 | 2,483,203 |
| 07/20/2066 | 4.646% | | 531,938 | 557,748 |
| 08/20/2066 | 4.608% | | 1,048,957 | 1,115,599 |
| 12/20/2066 | 4.431% | | 496,923 | 524,782 |
| 12/20/2066 | 4.534% | | 633,016 | 670,540 |
| 12/20/2066 | 4.566% | | 2,071,742 | 2,174,773 |
| 01/20/2067 | 4.602% | | 400,892 | 420,771 |
| 04/20/2067 | 4.555% | | 2,647,985 | 2,809,384 |
| 04/20/2067 | 4.560% | | 468,043 | 490,276 |
| 06/20/2067 | 4.442% | | 1,911,221 | 2,018,883 |
| 06/20/2067 | 4.629% | | 803,486 | 860,003 |
| 08/20/2067 | 4.641% | | 2,245,262 | 2,404,415 |
| 08/20/2067 | 4.668% | | 1,155,893 | 1,238,894 |
| CMO Series 2011-22 Class PL |
| 02/20/2041 | 5.000% | | 1,935,000 | 2,176,663 |
| Residential Mortgage-Backed Securities - Agency (continued) |
| Issuer | Coupon
Rate | | Principal
Amount ($) | Value ($) |
| CMO Series 2013-116 Class BY |
| 08/16/2043 | 4.000% | | 3,648,396 | 3,771,637 |
| CMO Series 2013-170 Class WZ |
| 11/16/2043 | 3.000% | | 767,543 | 678,148 |
| CMO Series 2013-H07 Class JA |
| 03/20/2063 | 1.750% | | 701,688 | 691,601 |
| CMO Series 2018-115 Class DE |
| 08/20/2048 | 3.500% | | 6,585,000 | 6,561,472 |
| Government National Mortgage Association(h) |
| 09/21/2047 | 4.000% | | 15,000 | 15,363 |
| 09/20/2048 | 3.000% | | 45,000 | 44,019 |
| 09/20/2048 | 4.500% | | 29,330,000 | 30,484,502 |
| 09/20/2048 | 5.000% | | 5,500,000 | 5,776,356 |
| Government National Mortgage Association(k) |
| 11/20/2047 | 3.000% | | 4,258,003 | 4,167,925 |
| Government National Mortgage Association(b) |
1-year CMT + 0.011%
03/20/2066 | 3.444% | | 732,627 | 746,515 |
1-year CMT + 0.007%
04/20/2066 | 1.376% | | 829,333 | 840,471 |
| CMO Series 2003-60 Class GS |
1-month USD LIBOR + 12.417%
05/16/2033 | 8.978% | | 311,316 | 326,718 |
| CMO Series 2006-37 Class AS |
1-month USD LIBOR + 39.660%
07/20/2036 | 27.196% | | 1,267,472 | 2,175,080 |
| CMO Series 2010-H03 Class FA |
1-month USD LIBOR + 0.550%
03/20/2060 | 2.653% | | 1,071,137 | 1,075,200 |
| CMO Series 2010-H26 Class LF |
1-month USD LIBOR + 0.350%
08/20/2058 | 2.450% | | 408,979 | 408,624 |
| CMO Series 2011-114 Class KF |
1-month USD LIBOR + 0.450%
03/20/2041 | 2.527% | | 458,340 | 459,643 |
| CMO Series 2011-H03 Class FA |
1-month USD LIBOR + 0.500%
01/20/2061 | 2.600% | | 1,385,426 | 1,389,561 |
| CMO Series 2012-H20 Class BA |
1-month USD LIBOR + 0.560%
09/20/2062 | 2.660% | | 358,752 | 360,098 |
| CMO Series 2012-H21 Class CF |
1-month USD LIBOR + 0.700%
05/20/2061 | 2.800% | | 50,814 | 50,940 |
| CMO Series 2012-H21 Class DF |
1-month USD LIBOR + 0.650%
05/20/2061 | 2.750% | | 45,308 | 45,401 |
The accompanying Notes to Financial Statements are an integral part of this statement.
| 50 | Multi-Manager Total Return Bond Strategies Fund | Annual Report 2018 |
Portfolio of Investments (continued)
August 31, 2018
| Residential Mortgage-Backed Securities - Agency (continued) |
| Issuer | Coupon
Rate | | Principal
Amount ($) | Value ($) |
| CMO Series 2012-H22 Class FD |
1-month USD LIBOR + 0.470%
01/20/2061 | 2.570% | | 297,840 | 298,163 |
| CMO Series 2012-H24 Class FD |
1-month USD LIBOR + 0.590%
09/20/2062 | 2.690% | | 223,798 | 223,860 |
| CMO Series 2013-115 Class EF |
1-month USD LIBOR + 0.250%
04/16/2028 | 2.314% | | 609,392 | 607,902 |
| CMO Series 2013-135 Class FH |
1-month USD LIBOR + 0.150%
09/16/2043 | 2.214% | | 2,108,029 | 2,106,036 |
| CMO Series 2013-H02 Class FD |
1-month USD LIBOR + 0.340%
12/20/2062 | 2.440% | | 472,023 | 471,470 |
| CMO Series 2013-H05 Class FB |
1-month USD LIBOR + 0.400%
02/20/2062 | 2.500% | | 93,626 | 93,542 |
| CMO Series 2013-H08 Class BF |
1-month USD LIBOR + 0.400%
03/20/2063 | 2.500% | | 2,570,388 | 2,567,800 |
| CMO Series 2013-H14 Class FD |
1-month USD LIBOR + 0.470%
06/20/2063 | 2.570% | | 2,187,163 | 2,191,695 |
| CMO Series 2013-H17 Class FA |
1-month USD LIBOR + 0.550%
07/20/2063 | 2.650% | | 753,464 | 756,258 |
| CMO Series 2013-H18 Class EA |
1-month USD LIBOR + 0.500%
07/20/2063 | 2.600% | | 756,968 | 758,816 |
| CMO Series 2013-H19 Class FC |
1-month USD LIBOR + 0.600%
08/20/2063 | 2.700% | | 4,938,372 | 4,961,004 |
| CMO Series 2015-H31 Class FT |
1-month USD LIBOR + 0.650%
11/20/2065 | 2.750% | | 5,897,250 | 5,915,870 |
| CMO Series 2016-H04 Class FG |
1-month USD LIBOR + 0.700%
12/20/2061 | 2.800% | | 649,214 | 650,131 |
| CMO Series 2016-H10 Class FJ |
1-month USD LIBOR + 0.600%
04/20/2066 | 2.700% | | 7,526,027 | 7,535,494 |
| CMO Series 2016-H13 Class FT |
1-month USD LIBOR + 0.580%
05/20/2066 | 2.680% | | 9,897,276 | 9,924,547 |
| CMO Series 2017-H03 Class FB |
1-month USD LIBOR + 0.650%
06/20/2066 | 2.750% | | 5,886,867 | 5,917,216 |
| Residential Mortgage-Backed Securities - Agency (continued) |
| Issuer | Coupon
Rate | | Principal
Amount ($) | Value ($) |
| CMO Series 2017-H19 Class FA |
1-month USD LIBOR + 0.450%
08/20/2067 | 2.550% | | 24,708,369 | 24,742,323 |
| CMO Series 2018-H04 Class FM |
1-month USD LIBOR + 0.300%
03/20/2068 | 2.400% | | 4,816,075 | 4,803,417 |
| Government National Mortgage Association(c) |
| CMO Series 2010-H17 Class XQ |
| 07/20/2060 | 5.242% | | 923,594 | 938,053 |
| CMO Series 2017-H04 Class DA |
| 12/20/2066 | 4.654% | | 151,875 | 153,274 |
| Series 2003-72 Class Z |
| 11/16/2045 | 5.269% | | 633,481 | 656,896 |
| Government National Mortgage Association(c),(d) |
| CMO Series 2014-150 Class IO |
| 07/16/2056 | 0.757% | | 34,967,939 | 1,623,687 |
| CMO Series 2014-H05 Class AI |
| 02/20/2064 | 1.334% | | 6,473,349 | 434,472 |
| CMO Series 2014-H14 Class BI |
| 06/20/2064 | 1.631% | | 8,271,922 | 667,108 |
| CMO Series 2014-H15 Class HI |
| 05/20/2064 | 1.422% | | 10,920,376 | 686,284 |
| CMO Series 2014-H20 Class HI |
| 10/20/2064 | 1.206% | | 3,750,477 | 212,164 |
| CMO Series 2015-163 Class IO |
| 12/16/2057 | 0.796% | | 5,083,323 | 301,256 |
| CMO Series 2015-189 Class IG |
| 01/16/2057 | 0.928% | | 30,638,293 | 1,977,683 |
| CMO Series 2015-30 Class IO |
| 07/16/2056 | 1.025% | | 7,514,995 | 485,947 |
| CMO Series 2015-32 Class IO |
| 09/16/2049 | 0.841% | | 11,879,920 | 663,416 |
| CMO Series 2015-73 Class IO |
| 11/16/2055 | 0.785% | | 8,081,660 | 421,242 |
| CMO Series 2015-9 Class IO |
| 02/16/2049 | 0.974% | | 25,214,129 | 1,474,434 |
| CMO Series 2016-72 Class IO |
| 12/16/2055 | 0.889% | | 17,731,552 | 1,157,670 |
| Government National Mortgage Association(c),(d),(m) |
| CMO Series 2015-H22 Class BI |
| 09/20/2065 | 1.769% | | 3,337,990 | 275,718 |
Total Residential Mortgage-Backed Securities - Agency
(Cost $1,515,405,743) | 1,482,886,395 |
|
| Residential Mortgage-Backed Securities - Non-Agency 2.9% |
| | | | |
| Ajax Mortgage Loan Trust(a) |
| CMO Series 2017-A Class A |
| 04/25/2057 | 3.470% | | 2,967,982 | 2,967,898 |
The accompanying Notes to Financial Statements are an integral part of this statement.
Multi-Manager Total Return Bond Strategies Fund | Annual Report 2018
| 51 |
Portfolio of Investments (continued)
August 31, 2018
| Residential Mortgage-Backed Securities - Non-Agency (continued) |
| Issuer | Coupon
Rate | | Principal
Amount ($) | Value ($) |
| ASG Resecuritization Trust(a),(c) |
| CMO Series 2009-2 Class G70 |
| 05/24/2036 | 3.455% | | 144,657 | 144,334 |
| CMO Series 2009-2 Class G75 |
| 05/24/2036 | 3.455% | | 1,925,000 | 1,906,381 |
| Asset-Backed Securities Corp. Home Equity Loan Trust(b) |
| CMO Series 2006-HE1 Class A4 |
1-month USD LIBOR + 0.300%
01/25/2036 | 2.365% | | 3,230,000 | 3,180,930 |
| Banc of America Funding Trust |
| CMO Series 2006-3 Class 4A14 |
| 03/25/2036 | 6.000% | | 1,263,432 | 1,278,793 |
| CMO Series 2006-3 Class 5A3 |
| 03/25/2036 | 5.500% | | 1,083,001 | 1,026,652 |
| Banc of America Funding Trust(n) |
| CMO Series 2006-D Class 3A1 |
| 05/20/2036 | 3.917% | | 1,730,380 | 1,671,488 |
| Bayview Opportunity Master Fund IIIa Trust(a) |
| CMO Series 2017-RN7 Class A1 |
| 09/28/2032 | 3.105% | | 172,496 | 172,509 |
| Bayview Opportunity Master Fund IVA Trust(a) |
| CMO Series 2016-SPL1 Class A |
| 04/28/2055 | 4.000% | | 2,577,925 | 2,591,438 |
| BCAP LLC Trust(a),(c) |
| CMO Series 2012-RR10 Class 9A1 |
| 10/26/2035 | 3.819% | | 2,920 | 2,916 |
| BCAP LLC Trust(a) |
| CMO Series 2013-RR5 Class 3A1 |
| 09/26/2036 | 3.500% | | 169,138 | 168,249 |
| Carrington Mortgage Loan Trust(b) |
| CMO Series 2006-NC3 Class A3 |
1-month USD LIBOR + 0.150%
08/25/2036 | 2.215% | | 3,585,327 | 2,971,278 |
| CIM Trust(a),(b) |
| CMO Series 2017-3 Class A1 |
1-month USD LIBOR + 2.000%
01/25/2057 | 4.104% | | 7,970,676 | 8,125,596 |
| CIM Trust(a) |
| CMO Series 2017-6 Class A1 |
| 06/25/2057 | 3.015% | | 15,174,796 | 14,624,916 |
| Citicorp Mortgage Securities Trust |
| CMO Series 2007-8 Class 1A3 |
| 09/25/2037 | 6.000% | | 873,997 | 897,932 |
| Citigroup Commercial Mortgage Trust(a),(c),(d) |
| CMO Series 2017-1500 Class XCP |
| 07/15/2032 | 1.445% | | 153,533,000 | 1,835,456 |
| Citigroup Mortgage Loan Trust, Inc.(a),(c) |
| CMO Series 2013-2 Class 1A1 |
| 11/25/2037 | 3.984% | | 25,655 | 25,617 |
| Residential Mortgage-Backed Securities - Non-Agency (continued) |
| Issuer | Coupon
Rate | | Principal
Amount ($) | Value ($) |
| CMO Series 2014-12 Class 3A1 |
| 10/25/2035 | 3.966% | | 1,431,691 | 1,447,183 |
| CMO Series 2015-A Class A4 |
| 06/25/2058 | 4.250% | | 967,683 | 983,026 |
| Countrywide Home Loan Mortgage Pass-Through Trust(c) |
| CMO Series 2007-HY5 Class 1A1 |
| 09/25/2047 | 4.454% | | 770,752 | 747,890 |
| Credit Suisse Mortgage Capital Certificates(a),(c) |
| CMO Series 2009-14R Class 4A9 |
| 10/26/2035 | 4.128% | | 2,713,087 | 2,822,037 |
| CMO Series 2011-12R Class 3A1 |
| 07/27/2036 | 3.883% | | 1,756,566 | 1,765,035 |
| Credit Suisse Mortgage Capital Certificates(a),(b) |
| CMO Series 2016-RPL1 Class A1 |
1-month USD LIBOR + 3.150%
12/26/2046 | 5.232% | | 5,679,865 | 5,792,908 |
| Credit-Based Asset Servicing & Securitization LLC(c) |
| CMO Series 2005-CB7 Class AF3 |
| 11/25/2035 | 3.781% | | 361,686 | 360,426 |
| CMO Series 2007-CB1 Class AF3 |
| 01/25/2037 | 3.645% | | 4,334,241 | 2,151,580 |
| Downey Savings & Loan Association Mortgage Loan Trust(b) |
| CMO Series 2005-AR6 Class 2A1A |
1-month USD LIBOR + 0.290%
10/19/2045 | 2.367% | | 2,060,337 | 2,045,406 |
| CMO Series 2006-AR2 Class 2A1A |
1-month USD LIBOR + 0.200%
10/19/2036 | 2.277% | | 2,827,786 | 2,567,009 |
| First Franklin Mortgage Loan Trust(b) |
| CMO Series 2006-FF18 Class A2D |
1-month USD LIBOR + 0.210%
12/25/2037 | 2.275% | | 3,036,892 | 2,653,334 |
| CMO Series 2007-FF2 Class A2B |
1-month USD LIBOR + 0.100%
03/25/2037 | 2.165% | | 5,209,812 | 3,369,003 |
| First Horizon Mortgage Pass-Through Trust(c) |
| CMO Series 2007-AR1 Class 1A1 |
| 05/25/2037 | 4.031% | | 542,783 | 446,513 |
| Freddie Mac Structured Agency Credit Risk Debt Notes(b) |
| CMO Series 2014-DN2 Class M2 |
1-month USD LIBOR + 1.650%
04/25/2024 | 3.715% | | 1,687,560 | 1,710,326 |
| GSAMP Trust(b) |
| CMO Series 2004-OPT Class M1 |
1-month USD LIBOR + 0.870%
11/25/2034 | 2.935% | | 1,946,903 | 1,930,803 |
| CMO Series 2007-HE1 Class A1 |
1-month USD LIBOR + 0.140%
03/25/2047 | 2.205% | | 3,207,820 | 3,034,107 |
The accompanying Notes to Financial Statements are an integral part of this statement.
| 52 | Multi-Manager Total Return Bond Strategies Fund | Annual Report 2018 |
Portfolio of Investments (continued)
August 31, 2018
| Residential Mortgage-Backed Securities - Non-Agency (continued) |
| Issuer | Coupon
Rate | | Principal
Amount ($) | Value ($) |
| GSR Mortgage Loan Trust(c) |
| CMO Series 2006-AR2 Class 2A1 |
| 04/25/2036 | 3.613% | | 1,850,164 | 1,680,902 |
| HarborView Mortgage Loan Trust(b) |
| CMO Series 2006-10 Class 1A1A |
1-month USD LIBOR + 0.200%
11/19/2036 | 2.277% | | 9,694,631 | 8,483,334 |
| CMO Series 2007-4 Class 2A1 |
1-month USD LIBOR + 0.220%
07/19/2047 | 2.297% | | 820,763 | 800,779 |
| CMO Series 2007-6 Class 1A1A |
1-month USD LIBOR + 0.200%
08/19/2037 | 2.277% | | 9,629,929 | 8,909,644 |
| HSI Asset Securitization Corp. Trust(b) |
| CMO Series 2006-OPT1 Class M1 |
1-month USD LIBOR + 0.360%
12/25/2035 | 2.425% | | 5,920,000 | 5,881,244 |
| JPMorgan Alternative Loan Trust(b) |
| CMO Series 2007-S1 Class A1 |
1-month USD LIBOR + 0.280%
04/25/2047 | 2.345% | | 7,239,855 | 7,115,984 |
| JPMorgan Mortgage Trust |
| CMO Series 2006-S2 Class 2A2 |
| 06/25/2021 | 5.875% | | 450,966 | 427,470 |
| CMO Series 2007-S1 Class 1A2 |
| 03/25/2022 | 5.500% | | 169,399 | 185,823 |
| JPMorgan Mortgage Trust(a),(b) |
| CMO Series 2018-7FRB Class A1 |
1-month USD LIBOR + 0.750%
04/25/2046 | 2.814% | | 2,830,681 | 2,842,171 |
| JPMorgan Resecuritization Trust(a),(c) |
| CMO Series 2014-1 Class 1016 |
| 03/26/2036 | 3.775% | | 1,882,971 | 1,878,609 |
| JPMorgan Resecuritization Trust(a) |
| CMO Series 2014-5 Class 6A |
| 09/27/2036 | 4.000% | | 409,339 | 407,959 |
| Legacy Mortgage Asset Trust(a) |
| CMO Series 2017-GS1 Class A1 |
| 01/25/2057 | 3.500% | | 4,487,668 | 4,441,121 |
| Lehman XS Trust(b) |
| CMO Series 2005-4 Class 1A3 |
1-month USD LIBOR + 0.800%
10/25/2035 | 2.865% | | 1,259,624 | 1,246,728 |
| CMO Series 2005-5N Class 3A1A |
1-month USD LIBOR + 0.300%
11/25/2035 | 2.365% | | 3,155,201 | 3,092,908 |
| CMO Series 2006-GP4 Class 1A1 |
1-month USD LIBOR + 0.205%
08/25/2046 | 2.269% | | 1,962,661 | 1,919,609 |
| Residential Mortgage-Backed Securities - Non-Agency (continued) |
| Issuer | Coupon
Rate | | Principal
Amount ($) | Value ($) |
| Long Beach Mortgage Loan Trust(b) |
| CMO Series 2005-1 Class M3 |
1-month USD LIBOR + 0.870%
02/25/2035 | 2.935% | | 4,953,855 | 4,984,010 |
| MASTR Alternative Loan Trust |
| CMO Series 2004-12 Class 4A1 |
| 12/25/2034 | 5.500% | | 1,037,719 | 1,092,691 |
| Merrill Lynch First Franklin Mortgage Loan Trust(b) |
| CMO Series 2007-1 Class A2D |
1-month USD LIBOR + 0.340%
04/25/2037 | 2.405% | | 23,037,678 | 14,088,683 |
| Mill City Mortgage Trust(a) |
| CMO Series 2016-1 Class A1 |
| 04/25/2057 | 2.500% | | 1,177,090 | 1,151,489 |
| Morgan Stanley Mortgage Loan Trust(b) |
| CMO Series 2005-2AR Class A |
1-month USD LIBOR + 0.260%
04/25/2035 | 2.325% | | 3,395,724 | 3,364,329 |
| Morgan Stanley Re-Remic Trust(a),(c) |
| CMO Series 2010-R1 Class 2B |
| 07/26/2035 | 3.778% | | 143,930 | 143,671 |
| CMO Series 2013-R3 Class 10A |
| 10/26/2035 | 4.128% | | 39,109 | 38,926 |
| Morgan Stanley Resecuritization Trust(a),(c) |
| CMO Series 2013-R9 Class 2A |
| 06/26/2046 | 3.622% | | 66,042 | 65,903 |
| MortgageIT Trust(b) |
| CMO Series 2005-5 Class A1 |
1-month USD LIBOR + 0.260%
12/25/2035 | 2.585% | | 1,954,875 | 1,937,330 |
| Nationstar Home Equity Loan Trust(b) |
| CMO Series 2007-B Class 2AV3 |
1-month USD LIBOR + 0.250%
04/25/2037 | 2.315% | | 5,143,810 | 5,129,769 |
| Nomura Resecuritization Trust(a),(b) |
| CMO Series 2014-6R Class 3A1 |
1-month USD LIBOR + 0.260%
01/26/2036 | 2.584% | | 678,775 | 673,258 |
| Oaktown Re II Ltd.(a),(b) |
| CMO Series 2018-1A Class M1 |
1-month USD LIBOR + 1.550%
07/25/2028 | 3.614% | | 1,200,000 | 1,201,554 |
| RALI Trust(c) |
| CMO Series 2005-QA4 Class A41 |
| 04/25/2035 | 4.261% | | 784,225 | 744,663 |
| RALI Trust(c),(d) |
| CMO Series 2006-QS18 Class 1AV |
| 12/25/2036 | 0.437% | | 50,426,561 | 682,463 |
| CMO Series 2006-QS9 Class 1AV |
| 07/25/2036 | 0.588% | | 23,883,386 | 563,653 |
The accompanying Notes to Financial Statements are an integral part of this statement.
Multi-Manager Total Return Bond Strategies Fund | Annual Report 2018
| 53 |
Portfolio of Investments (continued)
August 31, 2018
| Residential Mortgage-Backed Securities - Non-Agency (continued) |
| Issuer | Coupon
Rate | | Principal
Amount ($) | Value ($) |
| CMO Series 2007-QS1 Class 2AV |
| 01/25/2037 | 0.177% | | 49,403,223 | 362,402 |
| Residential Asset Mortgage Products Trust(b) |
| CMO Series 2006-RZ3 Class A3 |
1-month USD LIBOR + 0.290%
08/25/2036 | 2.355% | | 2,534,423 | 2,529,440 |
| RFMSI Trust(c) |
| CMO Series 2005-SA5 Class 1A |
| 11/25/2035 | 3.777% | | 1,837,590 | 1,501,354 |
| CMO Series 2006-SA4 Class 2A1 |
| 11/25/2036 | 4.895% | | 523,393 | 497,602 |
| Securitized Asset-Backed Receivables LLC Trust(b) |
| Subordinated, CMO Series 2006-OP1 Class M2 |
1-month USD LIBOR + 0.390%
10/25/2035 | 2.455% | | 6,421,000 | 6,373,217 |
| Structured Adjustable Rate Mortgage Loan Trust(c) |
| CMO Series 2004-20 Class 1A2 |
| 01/25/2035 | 4.078% | | 1,138,865 | 1,133,282 |
| CMO Series 2006-5 Class 1A1 |
| 06/25/2036 | 4.123% | | 2,090,270 | 2,107,822 |
| Structured Asset Securities Corp. Mortgage Loan Trust(a),(b) |
| CMO Series 2006-GEL4 Class A3 |
1-month USD LIBOR + 0.300%
10/25/2036 | 2.365% | | 3,994,846 | 3,981,759 |
| Towd Point Mortgage Trust(a) |
| CMO Series 2017-1 Class A1 |
| 10/25/2056 | 2.750% | | 4,341,834 | 4,262,792 |
| Towd Point Mortgage Trust(a),(c) |
| CMO Series 2017-6 Class A1 |
| 10/25/2057 | 2.750% | | 6,252,420 | 6,120,292 |
| Vericrest Opportunity Loan Transferee LVII LLC(a) |
| CMO Series 2017-NPL4 Class A1 |
| 04/25/2047 | 3.375% | | 384,436 | 383,248 |
| Vericrest Opportunity Loan Transferee LX LLC(a) |
| CMO Series 2017-NPL7 Class A1 |
| 04/25/2059 | 3.250% | | 504,314 | 504,383 |
| Vericrest Opportunity Loan Transferee LXII LLC(a) |
| CMO Series 2017-NPL9 Class A1 |
| 09/25/2047 | 3.125% | | 1,438,941 | 1,423,648 |
| Vericrest Opportunity Loan Transferee LXIII LLC(a) |
| CMO Series 2017-NP10 Class A1 |
| 10/25/2047 | 3.000% | | 1,981,745 | 1,961,548 |
| WaMu Asset-Backed Certificates(b) |
| CMO Series 2007-HE1 Class 2A3 |
1-month USD LIBOR + 0.150%
01/25/2037 | 2.215% | | 4,790,611 | 3,066,560 |
| WaMu Mortgage Pass-Through Certificates(c),(k) |
| CMO Series 2004-AR4 Class A6 |
| 06/25/2034 | 4.121% | | 6,505,694 | 6,649,563 |
| Residential Mortgage-Backed Securities - Non-Agency (continued) |
| Issuer | Coupon
Rate | | Principal
Amount ($) | Value ($) |
| WaMu Mortgage Pass-Through Certificates Trust(c) |
| CMO Series 2003-AR8 Class A |
| 08/25/2033 | 4.222% | | 657,626 | 666,727 |
| CMO Series 2007-HY1 Class 3A3 |
| 02/25/2037 | 3.458% | | 5,150,180 | 4,981,016 |
| CMO Series 2007-HY3 Class 1A1 |
| 03/25/2037 | 3.112% | | 796,993 | 721,849 |
| WaMu Mortgage Pass-Through Certificates Trust(b) |
| CMO Series 2005-AR11 Class A1A |
1-month USD LIBOR + 0.320%
08/25/2045 | 2.705% | | 1,861,128 | 1,861,280 |
| CMO Series 2005-AR17 Class A1A1 |
1-month USD LIBOR + 0.270%
12/25/2045 | 2.335% | | 4,726,830 | 4,683,282 |
| CMO Series 2005-AR2 Class 2A1A |
1-month USD LIBOR + 0.310%
01/25/2045 | 2.685% | | 1,936,666 | 1,924,858 |
| CMO Series 2005-AR8 Class 2A1A |
1-month USD LIBOR + 0.290%
07/25/2045 | 2.645% | | 1,517,234 | 1,526,693 |
| CMO Series 2005-AR9 Class A1A |
1-month USD LIBOR + 0.640%
07/25/2045 | 2.705% | | 1,336,665 | 1,331,526 |
| CMO Series 2006-AR4 Class 1A1A |
1-year MTA + 0.940%
05/25/2046 | 2.784% | | 2,736,645 | 2,728,784 |
| CMO Series 2006-AR5 Class A12A |
1-year MTA + 0.980%
06/25/2046 | 2.824% | | 858,470 | 861,756 |
| CMO Series 2007-OC2 Class A3 |
1-month USD LIBOR + 0.310%
06/25/2037 | 2.375% | | 3,644,510 | 3,338,356 |
Total Residential Mortgage-Backed Securities - Non-Agency
(Cost $216,952,543) | 230,080,685 |
|
| Senior Loans 0.2% |
| Borrower | Coupon
Rate | | Principal
Amount ($) | Value ($) |
| Cable and Satellite 0.0% |
| Telenet Financing LLC(b),(k),(o) |
| Term Loan |
3-month USD LIBOR + 2.250%
08/15/2026 | | | 750,000 | 740,415 |
| Unitymedia Finance LLC(b),(o) |
| Tranche E Term Loan |
3-month USD LIBOR + 2.000%
06/01/2023 | 4.063% | | 850,000 | 848,580 |
| Total | 1,588,995 |
The accompanying Notes to Financial Statements are an integral part of this statement.
| 54 | Multi-Manager Total Return Bond Strategies Fund | Annual Report 2018 |
Portfolio of Investments (continued)
August 31, 2018
| Senior Loans (continued) |
| Borrower | Coupon
Rate | | Principal
Amount ($) | Value ($) |
| Electric 0.0% |
| Vistra Operations Co. LLC(b),(o) |
| Term Loan |
3-month USD LIBOR + 2.000%
08/04/2023 | 4.076% | | 128,954 | 128,699 |
| Environmental 0.0% |
| Clean Harbors, Inc.(b),(o) |
| Term Loan |
3-month USD LIBOR + 1.750%
06/30/2024 | 3.826% | | 400,000 | 400,124 |
| STI Infrastructure SARL(b),(o) |
| Term Loan |
3-month USD LIBOR + 5.500%
08/22/2020 | 7.834% | | 673,372 | 582,467 |
| Total | 982,591 |
| Finance Companies 0.0% |
| Delos Finance SARL(b),(k),(o) |
| Term Loan |
3-month USD LIBOR + 1.750%
10/06/2023 | | | 500,000 | 501,250 |
| Gaming 0.1% |
| Caesars Entertainment Corp. LLC(b),(k),(o) |
| Term Loan |
3-month USD LIBOR + 2.000%
10/07/2024 | | | 420,000 | 419,475 |
| Churchill Downs, Inc.(b),(o) |
| Tranche B Term Loan |
3-month USD LIBOR + 2.000%
12/27/2024 | 4.080% | | 400,000 | 400,168 |
| Las Vegas Sands LLC(b),(o) |
| Term Loan |
3-month USD LIBOR + 1.750%
03/27/2025 | 3.826% | | 1,396,500 | 1,393,540 |
| Twin River Management Group, Inc.(b),(o) |
| Term Loan |
3-month USD LIBOR + 3.500%
07/10/2020 | 5.834% | | 1,077,622 | 1,081,329 |
| Total | 3,294,512 |
| Health Care 0.0% |
| Gentiva Health Services, Inc.(b),(o) |
| 1st Lien Term Loan |
3-month USD LIBOR + 3.750%
07/02/2025 | 6.125% | | 250,000 | 251,562 |
| Iqvia, Inc./Quintiles IMS(b),(k),(o) |
| Term Loan |
3-month USD LIBOR + 2.000%
06/11/2025 | | | 600,000 | 599,100 |
| Senior Loans (continued) |
| Borrower | Coupon
Rate | | Principal
Amount ($) | Value ($) |
| MPH Acquisition Holdings LLC(b),(k),(o) |
| Term Loan |
3-month USD LIBOR + 2.750%
06/07/2023 | | | 525,000 | 524,491 |
| Total | 1,375,153 |
| Integrated Energy 0.0% |
| PowerTeam Services, LLC(b),(o) |
| 1st Lien Term Loan |
3-month USD LIBOR + 3.250%
03/06/2025 | 5.584% | | 1,496,250 | 1,483,158 |
| Oil Field Services 0.0% |
| EMG Utica LLC(b),(o) |
| Term Loan |
3-month USD LIBOR + 3.750%
03/27/2020 | 6.250% | | 766,274 | 769,783 |
| Packaging 0.0% |
| Reynolds Group Holdings, Inc.(b),(o) |
| Term Loan |
3-month USD LIBOR + 2.750%
02/05/2023 | 4.826% | | 574,785 | 576,428 |
| Restaurants 0.0% |
| New Red Finance, Inc./Burger King/Tim Hortons(b),(k),(o) |
| Tranche B3 Term Loan |
3-month USD LIBOR + 2.250%
02/16/2024 | | | 420,000 | 419,740 |
| Technology 0.1% |
| BMC Software Finance, Inc.(b),(o) |
| Tranche B2 Term Loan |
3-month USD LIBOR + 3.250%
09/10/2022 | 5.326% | | 426,270 | 426,538 |
| Dell International LLC/EMC Corp.(b),(o) |
| Tranche A3 Term Loan |
3-month USD LIBOR + 1.500%
12/31/2018 | 3.580% | | 2,290,986 | 2,289,566 |
| First Data Corp.(b),(o) |
| Term Loan |
3-month USD LIBOR + 2.000%
07/08/2022 | 4.066% | | 1,231,666 | 1,230,829 |
| SS&C Technologies Holdings, Inc.(b),(o) |
| Tranche B3 Term Loan |
3-month USD LIBOR + 2.500%
04/16/2025 | 4.326% | | 348,195 | 348,369 |
| Tranche B4 Term Loan |
3-month USD LIBOR + 2.500%
04/16/2025 | 4.326% | | 137,333 | 137,402 |
| Total | 4,432,704 |
The accompanying Notes to Financial Statements are an integral part of this statement.
Multi-Manager Total Return Bond Strategies Fund | Annual Report 2018
| 55 |
Portfolio of Investments (continued)
August 31, 2018
| Senior Loans (continued) |
| Borrower | Coupon
Rate | | Principal
Amount ($) | Value ($) |
| Wireless 0.0% |
| SBA Senior Finance II LLC(b),(o) |
| Term Loan |
3-month USD LIBOR + 2.000%
04/11/2025 | 4.080% | | 745,000 | 742,310 |
| Sprint Communications, Inc.(b),(k),(o) |
| Term Loan |
3-month USD LIBOR + 2.500%
02/02/2024 | | | 475,000 | 475,000 |
| Total | 1,217,310 |
Total Senior Loans
(Cost $16,879,189) | 16,770,323 |
|
| Treasury Bills(p) 3.0% |
| Issuer | Effective
Yield | | Principal
Amount ($) | Value ($) |
| Japan 0.3% |
| Japan Treasury Discount Bills |
| 10/15/2018 | (0.160%) | JPY | 1,585,000,000 | 14,267,911 |
| 11/05/2018 | (0.150%) | JPY | 1,550,000,000 | 13,954,045 |
| Total | 28,221,956 |
| Spain 0.0% |
| Instituto de Credito Oficial(a) |
| 09/14/2018 | 2.450% | | 1,900,000 | 1,899,374 |
| United States 2.7% |
| U.S. Treasury Bills(q) |
| 09/13/2018 | 1.850% | | 3,056,000 | 3,053,991 |
| U.S. Treasury Bills |
| 10/25/2018 | 1.930% | | 30,663,000 | 30,574,039 |
| 11/23/2018 | 1.990% | | 1,930,000 | 1,921,206 |
| 01/03/2019 | 2.100% | | 23,817,000 | 23,647,323 |
| 01/24/2019 | 2.160% | | 8,004,000 | 7,935,549 |
| 04/25/2019 | 2.280% | | 71,235,000 | 70,195,289 |
| 05/23/2019 | 2.320% | | 45,300,000 | 44,549,449 |
| 06/20/2019 | 2.360% | | 23,500,000 | 23,063,516 |
| 07/18/2019 | 2.390% | | 8,000,000 | 7,835,199 |
| Total | 212,775,561 |
Total Treasury Bills
(Cost $242,735,974) | 242,896,891 |
|
| U.S. Government & Agency Obligations 0.2% |
| Issuer | Coupon
Rate | | Principal
Amount ($) | Value ($) |
| Federal Farm Credit Banks |
| 03/26/2031 | 3.220% | | 1,650,000 | 1,610,753 |
| Federal Home Loan Mortgage Corp. |
| 12/11/2025 | 0.000% | | 7,000,000 | 5,519,640 |
| U.S. Government & Agency Obligations (continued) |
| Issuer | Coupon
Rate | | Principal
Amount ($) | Value ($) |
| Federal National Mortgage Association |
| 10/05/2022 | 2.000% | | 5,000,000 | 4,849,950 |
| Federal National Mortgage Association(f) |
| STRIPS |
| 05/15/2030 | 0.000% | | 1,000,000 | 670,754 |
| Residual Funding Corp.(f) |
| STRIPS |
| 01/15/2030 | 0.000% | | 7,351,000 | 5,034,906 |
| Resolution Funding Corp.(f) |
| STRIPS |
| 01/15/2029 | 0.000% | | 1,935,000 | 1,354,088 |
| 04/15/2029 | 0.000% | | 1,220,000 | 846,744 |
Total U.S. Government & Agency Obligations
(Cost $20,211,273) | 19,886,835 |
|
| U.S. Treasury Obligations 11.6% |
| | | | |
| U.S. Treasury(q) |
| 04/30/2020 | 2.375% | | 20,000,000 | 19,925,781 |
| 06/30/2020 | 2.500% | | 2,770,000 | 2,763,818 |
| 08/15/2021 | 2.125% | | 23,720,000 | 23,338,912 |
| 07/31/2023 | 2.750% | | 166,890,000 | 166,988,078 |
| 08/15/2043 | 3.625% | | 3,835,000 | 4,249,500 |
| U.S. Treasury |
| 08/15/2020 | 1.500% | | 26,280,000 | 25,721,597 |
| 07/15/2021 | 2.625% | | 18,040,000 | 18,008,254 |
| 02/28/2023 | 1.500% | | 965,000 | 914,943 |
| 06/30/2023 | 2.625% | | 65,210,000 | 64,879,664 |
| 07/31/2025 | 2.875% | | 6,990,000 | 7,021,345 |
| 08/31/2025 | 2.750% | | 18,325,000 | 18,259,144 |
| 05/15/2028 | 2.875% | | 122,665,000 | 122,820,462 |
| 08/15/2028 | 2.875% | | 34,435,000 | 34,499,748 |
| 05/15/2039 | 4.250% | | 69,575,000 | 83,571,202 |
| 11/15/2041 | 3.125% | | 20,860,000 | 21,328,771 |
| 11/15/2043 | 3.750% | | 2,535,000 | 2,866,593 |
| 02/15/2044 | 3.625% | | 905,000 | 1,004,308 |
| 11/15/2044 | 3.000% | | 2,790,000 | 2,786,585 |
| 05/15/2045 | 3.000% | | 6,500,000 | 6,492,907 |
| 02/15/2048 | 3.000% | | 7,090,000 | 7,078,429 |
| 05/15/2048 | 3.125% | | 217,315,000 | 222,410,107 |
| 08/15/2048 | 3.000% | | 45,045,000 | 44,973,867 |
| U.S. Treasury(f),(q) |
| STRIPS |
| 05/15/2043 | 0.000% | | 18,157,000 | 8,657,910 |
| 11/15/2043 | 0.000% | | 7,025,000 | 3,297,908 |
| 02/15/2045 | 0.000% | | 19,275,000 | 8,721,185 |
Total U.S. Treasury Obligations
(Cost $924,728,586) | 922,581,018 |
The accompanying Notes to Financial Statements are an integral part of this statement.
| 56 | Multi-Manager Total Return Bond Strategies Fund | Annual Report 2018 |
Portfolio of Investments (continued)
August 31, 2018
| Money Market Funds 2.7% |
| | Shares | Value ($) |
| Columbia Short-Term Cash Fund, 2.058%(r),(s) | 214,471,894 | 214,450,447 |
Total Money Market Funds
(Cost $214,453,778) | 214,450,447 |
Total Investments in Securities
(Cost: $8,243,930,510) | 8,148,203,302 |
| Other Assets & Liabilities, Net | | (164,185,377) |
| Net Assets | 7,984,017,925 |
At August 31, 2018, securities and/or cash totaling $105,908,129 were pledged as collateral.
Investments in derivatives
| Forward foreign currency exchange contracts |
Currency to
be sold | Currency to
be purchased | Counterparty | Settlement
date | Unrealized
appreciation ($) | Unrealized
depreciation ($) |
| 1,585,000,000 JPY | 14,145,786 USD | Goldman Sachs | 10/15/2018 | — | (160,222) |
| 1,550,000,000 JPY | 14,086,709 USD | Goldman Sachs | 11/05/2018 | 74,536 | — |
| Total | | | | 74,536 | (160,222) |
| Long futures contracts |
| Description | Number of
contracts | Expiration
date | Trading
currency | Notional
amount | Value/Unrealized
appreciation ($) | Value/Unrealized
depreciation ($) |
| U.S. Long Bond | 361 | 12/2018 | USD | 52,375,382 | — | (109,402) |
| U.S. Treasury 10-Year Note | 4,789 | 12/2018 | USD | 578,351,918 | 342,455 | — |
| U.S. Treasury 2-Year Note | 277 | 12/2018 | USD | 58,789,336 | 64,202 | — |
| U.S. Treasury 2-Year Note | 870 | 12/2018 | USD | 184,645,207 | — | (31,619) |
| U.S. Treasury 5-Year Note | 9,741 | 12/2018 | USD | 1,105,968,300 | 237,540 | — |
| U.S. Treasury 5-Year Note | 1,777 | 12/2018 | USD | 201,756,049 | 232,395 | — |
| U.S. Treasury 5-Year Note | 1,818 | 12/2018 | USD | 206,411,084 | — | (118,656) |
| U.S. Ultra Bond | 136 | 12/2018 | USD | 21,735,302 | 96,734 | — |
| U.S. Ultra Bond | 1,081 | 12/2018 | USD | 172,763,690 | — | (744,001) |
| Total | | | | | 973,326 | (1,003,678) |
| Short futures contracts |
| Description | Number of
contracts | Expiration
date | Trading
currency | Notional
amount | Value/Unrealized
appreciation ($) | Value/Unrealized
depreciation ($) |
| U.S. Treasury 2-Year Note | (1,701) | 12/2018 | USD | (361,013,215) | — | (198,287) |
| U.S. Treasury Ultra 10-Year Note | (692) | 12/2018 | USD | (89,480,845) | — | (233,425) |
| Total | | | | | — | (431,712) |
The accompanying Notes to Financial Statements are an integral part of this statement.
Multi-Manager Total Return Bond Strategies Fund | Annual Report 2018
| 57 |
Portfolio of Investments (continued)
August 31, 2018
| Cleared interest rate swap contracts |
| Fund receives | Fund pays | Payment
frequency | Counterparty | Maturity
date | Notional
currency | Notional
amount | Value
($) | Upfront
payments
($) | Upfront
receipts
($) | Unrealized
appreciation
($) | Unrealized
depreciation
($) |
| 1-Day Overnight Fed Funds Effective Rate | Fixed rate of 0.655% | Receives Annually, Pays Annually | JPMorgan | 09/30/2018 | USD | 64,700,000 | 599,591 | — | — | 599,591 | — |
| 1-Day Overnight Fed Funds Effective Rate | Fixed rate of 1.253% | Receives Annually, Pays Annually | JPMorgan | 10/07/2018 | USD | 37,880,000 | 135,046 | — | — | 135,046 | — |
| 1-Day Overnight Fed Funds Effective Rate | Fixed rate of 1.080% | Receives Annually, Pays Annually | JPMorgan | 11/17/2018 | USD | 81,845,000 | 529,210 | — | — | 529,210 | — |
| 1-Day Overnight Fed Funds Effective Rate | Fixed rate of 0.911% | Receives Annually, Pays Annually | JPMorgan | 11/18/2018 | USD | 203,045,000 | 1,599,317 | — | — | 1,599,317 | — |
| 1-Day Overnight Fed Funds Effective Rate | Fixed rate of 1.820% | Receives Annually, Pays Annually | JPMorgan | 02/15/2019 | USD | 217,420,000 | 285,923 | — | — | 285,923 | — |
| 1-Day Overnight Fed Funds Effective Rate | Fixed rate of 1.431% | Receives Annually, Pays Annually | JPMorgan | 03/31/2019 | USD | 67,286,000 | 420,839 | — | — | 420,839 | — |
| 1-Day Overnight Fed Funds Effective Rate | Fixed rate of 1.502% | Receives Annually, Pays Annually | JPMorgan | 06/30/2019 | USD | 35,945,000 | 284,401 | — | — | 284,401 | — |
| 1-Day Overnight Fed Funds Effective Rate | Fixed rate of 1.840% | Receives Annually, Pays Annually | JPMorgan | 12/31/2019 | USD | 188,360,000 | 1,355,471 | — | — | 1,355,471 | — |
| 1-Day Overnight Fed Funds Effective Rate | Fixed rate of 1.950% | Receives Annually, Pays Annually | JPMorgan | 12/31/2019 | USD | 184,690,000 | 1,063,191 | — | — | 1,063,191 | — |
| 1-Day Overnight Fed Funds Effective Rate | Fixed rate of 2.107% | Receives Annually, Pays Annually | JPMorgan | 12/31/2019 | USD | 199,650,000 | 630,808 | — | — | 630,808 | — |
| 1-Day Overnight Fed Funds Effective Rate | Fixed rate of 2.040% | Receives Annually, Pays Annually | JPMorgan | 12/31/2019 | USD | 39,985,000 | 170,108 | — | — | 170,108 | — |
| 1-Day Overnight Fed Funds Effective Rate | Fixed rate of 2.157% | Receives Annually, Pays Annually | JPMorgan | 03/08/2020 | USD | 49,815,000 | 119,047 | — | — | 119,047 | — |
| 1-Day Overnight Fed Funds Effective Rate | Fixed rate of 2.369% | Receives Annually, Pays Annually | JPMorgan | 03/31/2020 | USD | 350,895,000 | 825,147 | — | — | 825,147 | — |
| 1-Day Overnight Fed Funds Effective Rate | Fixed rate of 2.295% | Receives Annually, Pays Annually | JPMorgan | 03/31/2020 | USD | 158,400,000 | 308,242 | — | — | 308,242 | — |
| 1-Day Overnight Fed Funds Effective Rate | Fixed rate of 2.311% | Receives Annually, Pays Annually | JPMorgan | 04/24/2020 | USD | 71,820,000 | 77,535 | — | — | 77,535 | — |
| 1-Day Overnight Fed Funds Effective Rate | Fixed rate of 2.353% | Receives Annually, Pays Annually | JPMorgan | 05/31/2022 | USD | 38,295,000 | 220,061 | — | — | 220,061 | — |
| 1-Day Overnight Fed Funds Effective Rate | Fixed rate of 2.360% | Receives Annually, Pays Annually | JPMorgan | 09/27/2022 | USD | 148,540,000 | 707,501 | — | — | 707,501 | — |
| 3-Month USD LIBOR | Fixed rate of 2.969% | Receives Quarterly, Pays Semi annually | JPMorgan | 11/30/2022 | USD | 13,195,000 | (47,107) | — | — | — | (47,107) |
| 3-Month USD LIBOR | Fixed rate of 2.167% | Receives Quarterly, Pays Semi annually | JPMorgan | 02/15/2024 | USD | 42,560,000 | 1,719,491 | — | — | 1,719,491 | — |
| 3-Month USD LIBOR | Fixed rate of 2.151% | Receives Quarterly, Pays Semi annually | JPMorgan | 02/15/2024 | USD | 6,690,000 | 245,316 | — | — | 245,316 | — |
The accompanying Notes to Financial Statements are an integral part of this statement.
| 58 | Multi-Manager Total Return Bond Strategies Fund | Annual Report 2018 |
Portfolio of Investments (continued)
August 31, 2018
| Cleared interest rate swap contracts (continued) |
| Fund receives | Fund pays | Payment
frequency | Counterparty | Maturity
date | Notional
currency | Notional
amount | Value
($) | Upfront
payments
($) | Upfront
receipts
($) | Unrealized
appreciation
($) | Unrealized
depreciation
($) |
| 3-Month USD LIBOR | Fixed rate of 2.115% | Receives Quarterly, Pays Semi annually | JPMorgan | 02/15/2024 | USD | 3,420,000 | 131,639 | — | — | 131,639 | — |
| 3-Month USD LIBOR | Fixed rate of 1.956% | Receives Quarterly, Pays Semi annually | JPMorgan | 05/15/2024 | USD | 69,165,000 | 2,855,666 | — | — | 2,855,666 | — |
| 3-Month USD LIBOR | Fixed rate of 2.170% | Receives Quarterly, Pays Semi annually | JPMorgan | 08/15/2024 | USD | 140,200,000 | 5,032,685 | — | — | 5,032,685 | — |
| 3-Month USD LIBOR | Fixed rate of 2.176% | Receives Quarterly, Pays Semi annually | JPMorgan | 08/15/2024 | USD | 41,140,000 | 1,434,904 | — | — | 1,434,904 | — |
| 3-Month USD LIBOR | Fixed rate of 2.168% | Receives Quarterly, Pays Semi annually | JPMorgan | 08/15/2024 | USD | 15,675,000 | 609,594 | — | — | 609,594 | — |
| 3-Month USD LIBOR | Fixed rate of 2.334% | Receives Quarterly, Pays Semi annually | JPMorgan | 11/15/2024 | USD | 165,925,000 | 3,638,251 | — | — | 3,638,251 | — |
| 1-Day Overnight Fed Funds Effective Rate | Fixed rate of 2.454% | Receives Annually, Pays Annually | JPMorgan | 02/28/2025 | USD | 41,250,000 | 119,820 | — | — | 119,820 | — |
| 3-Month USD LIBOR | Fixed rate of 3.019% | Receives Quarterly, Pays Semi annually | JPMorgan | 02/28/2025 | USD | 22,215,000 | (187,723) | — | — | — | (187,723) |
| 3-Month USD LIBOR | Fixed rate of 2.998% | Receives Quarterly, Pays Semi annually | JPMorgan | 05/31/2025 | USD | 67,233,000 | (419,788) | — | — | — | (419,788) |
| 1-Day Overnight Fed Funds Effective Rate | Fixed rate of 1.824% | Receives Annually, Pays Annually | JPMorgan | 02/15/2027 | USD | 14,238,000 | 636,208 | — | — | 636,208 | — |
| 1-Day Overnight Fed Funds Effective Rate | Fixed rate of 2.067% | Receives Annually, Pays Annually | JPMorgan | 02/15/2027 | USD | 15,490,000 | 546,813 | — | — | 546,813 | — |
| 1-Day Overnight Fed Funds Effective Rate | Fixed rate of 1.965% | Receives Annually, Pays Annually | JPMorgan | 02/15/2027 | USD | 8,075,000 | 348,186 | — | — | 348,186 | — |
| 3-Month USD LIBOR | Fixed rate of 2.309% | Receives Quarterly, Pays Semi annually | JPMorgan | 05/08/2027 | USD | 8,490,000 | 343,153 | — | — | 343,153 | — |
| 1-Day Overnight Fed Funds Effective Rate | Fixed rate of 1.823% | Receives Annually, Pays Annually | JPMorgan | 05/15/2027 | USD | 5,535,000 | 314,814 | — | — | 314,814 | — |
| 3-Month USD LIBOR | Fixed rate of 2.295% | Receives Quarterly, Pays Semi annually | JPMorgan | 05/15/2027 | USD | 5,500,000 | 228,643 | — | — | 228,643 | — |
| Fixed rate of 2.434% | 3-Month USD LIBOR | Receives Semi annually, Pays Quarterly | JPMorgan | 05/03/2032 | USD | 16,855,000 | (912,491) | — | — | — | (912,491) |
| Fixed rate of 2.338% | 3-Month USD LIBOR | Receives Semi annually, Pays Quarterly | JPMorgan | 02/15/2036 | USD | 26,145,000 | (2,161,900) | — | — | — | (2,161,900) |
| 3-Month USD LIBOR | Fixed rate of 2.508% | Receives Quarterly, Pays Semi annually | JPMorgan | 05/03/2037 | USD | 13,340,000 | 834,940 | — | — | 834,940 | — |
| Fixed rate of 2.987% | 3-Month USD LIBOR | Receives Semi annually, Pays Quarterly | JPMorgan | 03/16/2038 | USD | 11,280,000 | 129,144 | — | — | 129,144 | — |
| 1-Day Overnight Fed Funds Effective Rate | Fixed rate of 1.369% | Receives Annually, Pays Annually | JPMorgan | 02/15/2042 | USD | 4,280,000 | 912,346 | — | — | 912,346 | — |
| Fixed rate of 2.527% | 3-Month USD LIBOR | Receives Semi annually, Pays Quarterly | JPMorgan | 10/04/2042 | USD | 5,410,000 | (391,703) | — | — | — | (391,703) |
| 1-Day Overnight Fed Funds Effective Rate | Fixed rate of 1.380% | Receives Annually, Pays Annually | JPMorgan | 09/27/2046 | USD | 2,780,000 | 654,457 | — | — | 654,457 | — |
| 3-Month USD LIBOR | Fixed rate of 2.536% | Receives Quarterly, Pays Semi annually | JPMorgan | 10/04/2047 | USD | 4,770,000 | 377,168 | — | — | 377,168 | — |
| 3-Month USD LIBOR | Fixed rate of 2.970% | Receives Quarterly, Pays Semi annually | JPMorgan | 03/16/2048 | USD | 8,465,000 | (108,614) | — | — | — | (108,614) |
| 3-Month USD LIBOR | Fixed rate of 2.979% | Receives Quarterly, Pays Semi annually | Morgan Stanley | 08/10/2023 | USD | 764,000,000 | (3,576,650) | — | — | — | (3,576,650) |
The accompanying Notes to Financial Statements are an integral part of this statement.
Multi-Manager Total Return Bond Strategies Fund | Annual Report 2018
| 59 |
Portfolio of Investments (continued)
August 31, 2018
| Cleared interest rate swap contracts (continued) |
| Fund receives | Fund pays | Payment
frequency | Counterparty | Maturity
date | Notional
currency | Notional
amount | Value
($) | Upfront
payments
($) | Upfront
receipts
($) | Unrealized
appreciation
($) | Unrealized
depreciation
($) |
| 3-Month USD LIBOR | Fixed rate of 3.050% | Receives Quarterly, Pays Semi annually | Morgan Stanley | 08/10/2028 | USD | 482,000,000 | (4,225,668) | — | — | — | (4,225,668) |
| 3-Month USD LIBOR | Fixed rate of 3.102% | Receives Quarterly, Pays Semi annually | Morgan Stanley | 08/10/2048 | USD | 297,000,000 | (6,568,953) | — | — | — | (6,568,953) |
| Total | | | | | | | 11,844,079 | — | — | 30,444,676 | (18,600,597) |
| Cleared credit default swap contracts - buy protection |
Reference
entity | Counterparty | Maturity
date | Pay
fixed
rate
(%) | Payment
frequency | Notional
currency | Notional
amount | Value
($) | Upfront
payments
($) | Upfront
receipts
($) | Unrealized
appreciation
($) | Unrealized
depreciation
($) |
| Markit CDX North America High Yield Index, Series 30 | Morgan Stanley | 06/20/2023 | 5.000 | Quarterly | USD | 309,000,000 | (6,887,103) | — | — | — | (6,887,103) |
Notes to Portfolio of Investments
| (a) | Represents privately placed and other securities and instruments exempt from SEC registration (collectively, private placements), such as Section 4(a)(2) and Rule 144A eligible securities, which are often sold only to qualified institutional buyers. The Fund may invest in private placements determined to be liquid as well as those determined to be illiquid. Private placements may be determined to be liquid under guidelines established by the Fund’s Board of Trustees. At August 31, 2018, the total value of these securities amounted to $1,877,432,841, which represents 23.51% of total net assets. |
| (b) | Variable rate security. The interest rate shown was the current rate as of August 31, 2018. |
| (c) | Variable or floating rate security, the interest rate of which adjusts periodically based on changes in current interest rates and prepayments on the underlying pool of assets. The interest rate shown was the current rate as of August 31, 2018. |
| (d) | Represents interest only securities which have the right to receive the monthly interest payments on an underlying pool of mortgage loans. |
| (e) | Non-income producing investment. |
| (f) | Zero coupon bond. |
| (g) | Represents a variable rate security with a step coupon where the rate adjusts according to a schedule for a series of periods, typically lower for an initial period and then increasing to a higher coupon rate thereafter. The interest rate shown was the current rate as of August 31, 2018. |
| (h) | Represents a security purchased on a when-issued basis. |
| (i) | Represents securities that have defaulted on payment of interest. The Fund has stopped accruing interest on these securities. At August 31, 2018, the total value of these securities amounted to $2,105,897, which represents 0.03% of total net assets. |
| (j) | Principal and interest may not be guaranteed by the government. |
| (k) | Represents a security purchased on a forward commitment basis. |
| (l) | Represents principal only securities which have the right to receive the principal portion only on an underlying pool of mortgage loans. |
| (m) | Valuation based on significant unobservable inputs. |
| (n) | Represents a variable rate security where the coupon adjusts periodically through an auction process. |
| (o) | The stated interest rate represents the weighted average interest rate at August 31, 2018 of contracts within the senior loan facility. Interest rates on contracts are primarily determined either weekly, monthly or quarterly by reference to the indicated base lending rate and spread and the reset period. These base lending rates are primarily the London Interbank Offered Rate (“LIBOR”) and other short-term rates. Base lending rates may be subject to a floor or minimum rate. The interest rate for senior loans purchased on a when-issued or delayed delivery basis will be determined upon settlement, therefore no interest rate is disclosed. Senior loans often require prepayments from excess cash flows or permit the borrowers to repay at their election. The degree to which borrowers repay, cannot be predicted with accuracy. As a result, remaining maturities of senior loans may be less than the stated maturities. |
| (p) | Principal amounts are denominated in United States Dollars unless otherwise noted. |
| (q) | This security or a portion of this security has been pledged as collateral in connection with derivative contracts. |
| (r) | The rate shown is the seven-day current annualized yield at August 31, 2018. |
The accompanying Notes to Financial Statements are an integral part of this statement.
| 60 | Multi-Manager Total Return Bond Strategies Fund | Annual Report 2018 |
Portfolio of Investments (continued)
August 31, 2018
Notes to Portfolio of Investments (continued)
| (s) | As defined in the Investment Company Act of 1940, an affiliated company is one in which the Fund owns 5% or more of the company’s outstanding voting securities, or a company which is under common ownership or control with the Fund. Holdings and transactions in these affiliated companies during the year ended August 31, 2018 are as follows: |
| Issuer | Beginning
shares | Shares
purchased | Shares
sold | Ending
shares | Realized gain
(loss) —
affiliated
issuers ($) | Net change in
unrealized
appreciation
(depreciation) —
affiliated
issuers ($) | Dividends —
affiliated
issuers ($) | Value —
affiliated
issuers
at end of
period ($) |
| Columbia Mortgage Opportunities Fund, Institutional 3 Class |
| | 7,059,306 | 59,287 | (7,118,593) | — | 1,470,135 | (1,225,607) | 589,289 | — |
| Columbia Short-Term Cash Fund, 2.058% |
| | 305,159,668 | 6,818,370,700 | (6,909,058,474) | 214,471,894 | (31,130) | (3,331) | 5,153,175 | 214,450,447 |
| Total | | | | | 1,439,005 | (1,228,938) | 5,742,464 | 214,450,447 |
Abbreviation Legend
| AID | Agency for International Development |
| AMBAC | Ambac Assurance Corporation |
| BAM | Build America Mutual Assurance Co. |
| CMO | Collateralized Mortgage Obligation |
| PIK | Payment In Kind |
| STRIPS | Separate Trading of Registered Interest and Principal Securities |
Currency Legend
| JPY | Japanese Yen |
| USD | US Dollar |
Fair value measurements
The Fund categorizes its fair value measurements according to a three-level hierarchy that maximizes the use of observable inputs and minimizes the use of unobservable inputs by prioritizing that the most observable input be used when available. Observable inputs are those that market participants would use in pricing an investment based on market data obtained from sources independent of the reporting entity. Unobservable inputs are those that reflect the Fund’s assumptions about the information market participants would use in pricing an investment. An investment’s level within the fair value hierarchy is based on the lowest level of any input that is deemed significant to the asset’s or liability’s fair value measurement. The input levels are not necessarily an indication of the risk or liquidity associated with investments at that level. For example, certain U.S. government securities are generally high quality and liquid, however, they are reflected as Level 2 because the inputs used to determine fair value may not always be quoted prices in an active market.
Fair value inputs are summarized in the three broad levels listed below:
| ■ | Level 1 — Valuations based on quoted prices for investments in active markets that the Fund has the ability to access at the measurement date. Valuation adjustments are not applied to Level 1 investments. |
| ■ | Level 2 — Valuations based on other significant observable inputs (including quoted prices for similar securities, interest rates, prepayment speeds, credit risks, etc.). |
| ■ | Level 3 — Valuations based on significant unobservable inputs (including the Fund’s own assumptions and judgment in determining the fair value of investments). |
Inputs that are used in determining fair value of an investment may include price information, credit data, volatility statistics, and other factors. These inputs can be either observable or unobservable. The availability of observable inputs can vary between investments, and is affected by various factors such as the type of investment, and the volume and level of activity for that investment or similar investments in the marketplace. The inputs will be considered by the Investment Manager, along with any other relevant factors in the calculation of an investment’s fair value. The Fund uses prices and inputs that are current as of the measurement date, which may include periods of market dislocations. During these periods, the availability of prices and inputs may be reduced for many investments. This condition could cause an investment to be reclassified between the various levels within the hierarchy.
Certain investments that have been measured at fair value using the net asset value (NAV) per share (or its equivalent) are not categorized in the fair value hierarchy. The fair value amounts presented in the table are intended to reconcile the fair value hierarchy to the amounts presented in the Portfolio of Investments. The Columbia Short-Term Cash Fund seeks to provide shareholders with maximum current income consistent with liquidity and stability of principal. Columbia Short-Term Cash Fund prices its shares with a floating NAV and no longer seeks to maintain a stable NAV.
Investments falling into the Level 3 category are primarily supported by quoted prices from brokers and dealers participating in the market for those investments. However, these may be classified as Level 3 investments due to lack of market transparency and corroboration to support these quoted prices. Additionally, valuation models may be used as the pricing source for any remaining investments classified as Level 3. These models may rely on one or more significant unobservable inputs and/or significant assumptions by the Investment Manager. Inputs used in valuations may include, but are not limited to, financial statement analysis, capital account balances, discount rates and estimated cash flows, and comparable company data.
The accompanying Notes to Financial Statements are an integral part of this statement.
Multi-Manager Total Return Bond Strategies Fund | Annual Report 2018
| 61 |
Portfolio of Investments (continued)
August 31, 2018
Fair value measurements (continued)
Under the direction of the Fund’s Board of Trustees (the Board), the Investment Manager’s Valuation Committee (the Committee) is responsible for overseeing the valuation procedures approved by the Board. The Committee consists of voting and non-voting members from various groups within the Investment Manager’s organization, including operations and accounting, trading and investments, compliance, risk management and legal.
The Committee meets at least monthly to review and approve valuation matters, which may include a description of specific valuation determinations, data regarding pricing information received from approved pricing vendors and brokers and the results of Board-approved valuation control policies and procedures (the Policies). The Policies address, among other things, instances when market quotations are or are not readily available, including recommendations of third party pricing vendors and a determination of appropriate pricing methodologies; events that require specific valuation determinations and assessment of fair value techniques; securities with a potential for stale pricing, including those that are illiquid, restricted, or in default; and the effectiveness of third party pricing vendors, including periodic reviews of vendors. The Committee meets more frequently, as needed, to discuss additional valuation matters, which may include the need to review back-testing results, review time-sensitive information or approve related valuation actions. The Committee reports to the Board, with members of the Committee meeting with the Board at each of its regularly scheduled meetings to discuss valuation matters and actions during the period, similar to those described earlier.
For investments categorized as Level 3, the Committee monitors information similar to that described above, which may include: (i) data specific to the issuer or comparable issuers, (ii) general market or specific sector news and (iii) quoted prices and specific or similar security transactions. The Committee considers this data and any changes from prior periods in order to assess the reasonableness of observable and unobservable inputs, any assumptions or internal models used to value those securities and changes in fair value. This data is also used to corroborate, when available, information received from approved pricing vendors and brokers. Various factors impact the frequency of monitoring this information (which may occur as often as daily). However, the Committee may determine that changes to inputs, assumptions and models are not required as a result of the monitoring procedures performed.
The following table is a summary of the inputs used to value the Fund’s investments at August 31, 2018:
| | Level 1
quoted prices
in active
markets for
identical
assets ($) | Level 2
other
significant
observable
inputs ($) | Level 3
significant
unobservable
inputs ($) | Investments
measured at
net asset
value ($) | Total ($) |
| Investments in Securities | | | | | |
| Asset-Backed Securities — Non-Agency | — | 1,182,986,458 | — | — | 1,182,986,458 |
| Commercial Mortgage-Backed Securities - Agency | — | 248,594,925 | — | — | 248,594,925 |
| Commercial Mortgage-Backed Securities - Non-Agency | — | 476,901,614 | — | — | 476,901,614 |
| Commercial Paper | — | 9,807,600 | — | — | 9,807,600 |
| Common Stocks | | | | | |
| Energy | 958,361 | 608 | — | — | 958,969 |
| Convertible Bonds | — | 5,964,006 | — | — | 5,964,006 |
| Corporate Bonds & Notes | — | 2,855,955,103 | — | — | 2,855,955,103 |
| Foreign Government Obligations | — | 198,222,265 | — | — | 198,222,265 |
| Inflation-Indexed Bonds | — | 7,075,772 | — | — | 7,075,772 |
| Municipal Bonds | — | 32,183,996 | — | — | 32,183,996 |
| Residential Mortgage-Backed Securities - Agency | — | 1,482,610,677 | 275,718 | — | 1,482,886,395 |
| Residential Mortgage-Backed Securities - Non-Agency | — | 230,080,685 | — | — | 230,080,685 |
| Senior Loans | — | 16,770,323 | — | — | 16,770,323 |
| Treasury Bills | 212,775,561 | 30,121,330 | — | — | 242,896,891 |
| U.S. Government & Agency Obligations | — | 19,886,835 | — | — | 19,886,835 |
| U.S. Treasury Obligations | 901,904,015 | 20,677,003 | — | — | 922,581,018 |
| Money Market Funds | — | — | — | 214,450,447 | 214,450,447 |
| Total Investments in Securities | 1,115,637,937 | 6,817,839,200 | 275,718 | 214,450,447 | 8,148,203,302 |
| Investments in Derivatives | | | | | |
| Asset | | | | | |
| Forward Foreign Currency Exchange Contracts | — | 74,536 | — | — | 74,536 |
| Futures Contracts | 973,326 | — | — | — | 973,326 |
| Swap Contracts | — | 30,444,676 | — | — | 30,444,676 |
| Liability | | | | | |
| Forward Foreign Currency Exchange Contracts | — | (160,222) | — | — | (160,222) |
| Futures Contracts | (1,435,390) | — | — | — | (1,435,390) |
| Swap Contracts | — | (25,487,700) | — | — | (25,487,700) |
| Total | 1,115,175,873 | 6,822,710,490 | 275,718 | 214,450,447 | 8,152,612,528 |
See the Portfolio of Investments for all investment classifications not indicated in the table.
The Fund’s assets assigned to the Level 2 input category are generally valued using the market approach, in which a security’s value is determined through reference to prices and information from market transactions for similar or identical assets.
The accompanying Notes to Financial Statements are an integral part of this statement.
| 62 | Multi-Manager Total Return Bond Strategies Fund | Annual Report 2018 |
Portfolio of Investments (continued)
August 31, 2018
Fair value measurements (continued)
Derivative instruments are valued at unrealized appreciation (depreciation).
There were no transfers of financial assets between Levels 1 and 2 during the period.
Financial assets were transferred from Level 3 to Level 2 as observable market inputs were utilized and management determined that there was sufficient, reliable and observable market data to value these assets as of period end.
Transfers between levels are determined based on the fair value at the beginning of the period for security positions held throughout the period.
The following table(s) show(s) transfers between levels of the fair value hierarchy:
| Transfers In | Transfers Out |
| Level 2 ($) | Level 3 ($) | Level 2 ($) | Level 3 ($) |
| 26,597,830 | — | — | 26,597,830 |
The Fund does not hold any significant investments (greater than one percent of net assets) categorized as Level 3.
The Fund’s assets assigned to the Level 3 category are valued utilizing the valuation technique deemed the most appropriate in the circumstances.
Certain residential mortgage backed securities classified as Level 3 securities are valued using the market approach and utilize single market quotations from broker dealers which may have included, but not limited to, observable transactions for identical or similar assets in the market and the distressed nature of the security. The appropriateness of fair values for these securities is monitored on an ongoing basis which may include results of back testing, manual price reviews and other control procedures. Significant increases (decreases) to any of these inputs would result in a significantly higher (lower) valuation measurement.
The accompanying Notes to Financial Statements are an integral part of this statement.
Multi-Manager Total Return Bond Strategies Fund | Annual Report 2018
| 63 |
Statement of Assets and Liabilities
August 31, 2018
| Assets | |
| Investments in securities, at value | |
| Unaffiliated issuers (cost $8,029,476,732) | $7,933,752,855 |
| Affiliated issuers (cost $214,453,778) | 214,450,447 |
| Cash | 24,591 |
| Margin deposits on: | |
| Futures contracts | 995,000 |
| Swap contracts | 58,683,752 |
| Unrealized appreciation on forward foreign currency exchange contracts | 74,536 |
| Receivable for: | |
| Investments sold | 20,945,597 |
| Investments sold on a delayed delivery basis | 210,728,026 |
| Capital shares sold | 31,229,219 |
| Dividends | 376,328 |
| Interest | 49,246,570 |
| Foreign tax reclaims | 235,555 |
| Variation margin for futures contracts | 1,973,244 |
| Variation margin for swap contracts | 76,159 |
| Prepaid expenses | 50,970 |
| Trustees’ deferred compensation plan | 173,705 |
| Total assets | 8,523,016,554 |
| Liabilities | |
| Unrealized depreciation on forward foreign currency exchange contracts | 160,222 |
| Payable for: | |
| Investments purchased | 24,071,568 |
| Investments purchased on a delayed delivery basis | 477,621,501 |
| Capital shares purchased | 14,285,330 |
| Distributions to shareholders | 18,518,953 |
| Variation margin for futures contracts | 414,948 |
| Variation margin for swap contracts | 3,150,402 |
| Management services fees | 99,361 |
| Distribution and/or service fees | 97 |
| Transfer agent fees | 284,664 |
| Compensation of chief compliance officer | 517 |
| Other expenses | 217,361 |
| Trustees’ deferred compensation plan | 173,705 |
| Total liabilities | 538,998,629 |
| Net assets applicable to outstanding capital stock | $7,984,017,925 |
| Represented by | |
| Paid in capital | 8,188,165,790 |
| Undistributed net investment income | 13,653,976 |
| Accumulated net realized loss | (126,483,859) |
| Unrealized appreciation (depreciation) on: | |
| Investments - unaffiliated issuers | (95,723,877) |
| Investments - affiliated issuers | (3,331) |
| Forward foreign currency exchange contracts | (85,686) |
| Futures contracts | (462,064) |
| Swap contracts | 4,956,976 |
| Total - representing net assets applicable to outstanding capital stock | $7,984,017,925 |
| Class A | |
| Net assets | $14,134,674 |
| Shares outstanding | 1,443,370 |
| Net asset value per share | $9.79 |
| Institutional Class | |
| Net assets | $7,969,883,251 |
| Shares outstanding | 813,549,336 |
| Net asset value per share | $9.80 |
The accompanying Notes to Financial Statements are an integral part of this statement.
| 64 | Multi-Manager Total Return Bond Strategies Fund | Annual Report 2018 |
Statement of Operations
Year Ended August 31, 2018
| Net investment income | |
| Income: | |
| Dividends — unaffiliated issuers | $101,688 |
| Dividends — affiliated issuers | 5,742,464 |
| Interest | 242,269,077 |
| Foreign taxes withheld | (27,411) |
| Total income | 248,085,818 |
| Expenses: | |
| Management services fees | 35,602,737 |
| Distribution and/or service fees | |
| Class A | 42,615 |
| Transfer agent fees | |
| Class A | 8,436 |
| Institutional Class | 3,841,597 |
| Compensation of board members | 131,930 |
| Custodian fees | 138,352 |
| Printing and postage fees | 311,405 |
| Registration fees | 218,217 |
| Audit fees | 57,625 |
| Legal fees | 183,465 |
| Compensation of chief compliance officer | 3,044 |
| Other | 183,816 |
| Total expenses | 40,723,239 |
| Fees waived or expenses reimbursed by Investment Manager and its affiliates | (60,825) |
| Total net expenses | 40,662,414 |
| Net investment income | 207,423,404 |
| Realized and unrealized gain (loss) — net | |
| Net realized gain (loss) on: | |
| Investments — unaffiliated issuers | (63,607,551) |
| Investments — affiliated issuers | 1,439,005 |
| Foreign currency translations | (47,676) |
| Forward foreign currency exchange contracts | 1,001,956 |
| Futures contracts | (39,987,091) |
| Swap contracts | (14,468,681) |
| Net realized loss | (115,670,038) |
| Net change in unrealized appreciation (depreciation) on: | |
| Investments — unaffiliated issuers | (189,438,361) |
| Investments — affiliated issuers | (1,228,938) |
| Foreign currency translations | 13,452 |
| Forward foreign currency exchange contracts | (8,734) |
| Futures contracts | (3,701,945) |
| Swap contracts | 13,858,578 |
| Net change in unrealized appreciation (depreciation) | (180,505,948) |
| Net realized and unrealized loss | (296,175,986) |
| Net decrease in net assets resulting from operations | $(88,752,582) |
The accompanying Notes to Financial Statements are an integral part of this statement.
Multi-Manager Total Return Bond Strategies Fund | Annual Report 2018
| 65 |
Statement of Changes in Net Assets
| | Year Ended
August 31, 2018 | Year Ended
August 31, 2017 (a) |
| Operations | | |
| Net investment income | $207,423,404 | $156,093,227 |
| Net realized gain (loss) | (115,670,038) | 4,638,444 |
| Net change in unrealized appreciation (depreciation) | (180,505,948) | (53,772,674) |
| Net increase (decrease) in net assets resulting from operations | (88,752,582) | 106,958,997 |
| Distributions to shareholders | | |
| Net investment income | | |
| Class A | (378,682) | (72,687,460) |
| Institutional Class | (195,325,065) | (81,134,740) |
| Net realized gains | | |
| Class A | (7,581) | (88,689,055) |
| Institutional Class | (3,047,967) | — |
| Total distributions to shareholders | (198,759,295) | (242,511,255) |
| Increase in net assets from capital stock activity | 701,288,464 | 1,091,113,982 |
| Total increase in net assets | 413,776,587 | 955,561,724 |
| Net assets at beginning of year | 7,570,241,338 | 6,614,679,614 |
| Net assets at end of year | $7,984,017,925 | $7,570,241,338 |
| Undistributed net investment income | $13,653,976 | $1,708,885 |
| | Year Ended | Year Ended |
| | August 31, 2018 | August 31, 2017 (a) |
| | Shares | Dollars ($) | Shares | Dollars ($) |
| Capital stock activity |
| Class A | | | | |
| Subscriptions | 685 | 6,764 | 175,198,699 | 1,750,723,586 |
| Distributions reinvested | 38,932 | 386,032 | 16,189,824 | 161,376,159 |
| Redemptions | (663,842) | (6,600,929) | (824,632,018) | (8,178,534,846) |
| Net decrease | (624,225) | (6,208,133) | (633,243,495) | (6,266,435,101) |
| Institutional Class | | | | |
| Subscriptions | 198,219,874 | 1,965,645,540 | 811,402,435 | 8,053,277,002 |
| Distributions reinvested | 20,032,838 | 198,372,778 | 8,045,258 | 81,134,577 |
| Redemptions | (146,978,253) | (1,456,521,721) | (77,172,816) | (776,862,496) |
| Net increase | 71,274,459 | 707,496,597 | 742,274,877 | 7,357,549,083 |
| Total net increase | 70,650,234 | 701,288,464 | 109,031,382 | 1,091,113,982 |
| (a) | Institutional Class shares are based on operations from January 3, 2017 (commencement of operations) through the stated period end. |
The accompanying Notes to Financial Statements are an integral part of this statement.
| 66 | Multi-Manager Total Return Bond Strategies Fund | Annual Report 2018 |
[THIS PAGE INTENTIONALLY LEFT BLANK]
Multi-Manager Total Return Bond Strategies Fund | Annual Report 2018
| 67 |
The following table is intended to help you understand the Fund’s financial performance. Certain information reflects financial results for a single share of a class held for the periods shown. Per share net investment income (loss) amounts are calculated based on average shares outstanding during the period. Total return assumes reinvestment of all dividends and distributions, if any. Total return does not reflect payment of sales charges, if any. Total return and portfolio turnover are not annualized for periods of less than one year. The portfolio turnover rate is calculated without regard to purchase and sales transactions of short-term instruments and certain derivatives, if any. If such transactions were included, the Fund’s portfolio turnover rate may be higher.
| | Net asset value,
beginning of
period | Net
investment
income | Net
realized
and
unrealized
gain (loss) | Total from
investment
operations | Distributions
from net
investment
income | Distributions
from net
realized
gains | Total
distributions to
shareholders |
| Class A |
| Year Ended 8/31/2018 | $10.17 | 0.24 | (0.39) | (0.15) | (0.23) | (0.00) (c) | (0.23) |
| Year Ended 8/31/2017 | $10.41 | 0.22 | (0.11) | 0.11 | (0.21) | (0.14) | (0.35) |
| Year Ended 8/31/2016 | $10.06 | 0.20 | 0.38 | 0.58 | (0.19) | (0.04) | (0.23) |
| Year Ended 8/31/2015 | $10.21 | 0.19 | (0.14) | 0.05 | (0.20) | — | (0.20) |
| Year Ended 8/31/2014 | $9.87 | 0.21 | 0.36 | 0.57 | (0.20) | (0.03) | (0.23) |
| Institutional Class |
| Year Ended 8/31/2018 | $10.17 | 0.26 | (0.38) | (0.12) | (0.25) | (0.00) (c) | (0.25) |
| Year Ended 8/31/2017(d) | $9.91 | 0.16 | 0.26 (e) | 0.42 | (0.16) | — | (0.16) |
| Notes to Financial Highlights |
| (a) | In addition to the fees and expenses that the Fund bears directly, the Fund indirectly bears a pro rata share of the fees and expenses of any other funds in which it invests. Such indirect expenses are not included in the Fund’s reported expense ratios. |
| (b) | Total net expenses include the impact of certain fee waivers/expense reimbursements made by the Investment Manager and certain of its affiliates, if applicable. |
| (c) | Rounds to zero. |
| (d) | Institutional Class shares commenced operations on January 3, 2017. Per share data and total return reflect activity from that date. |
| (e) | Calculation of the net gain (loss) per share (both realized and unrealized) does not correlate to the aggregate realized and unrealized gain (loss) presented in the Statement of Operations due to the timing of subscriptions and redemptions of Fund shares in relation to fluctuations in the market value of the portfolio. |
| (f) | Annualized. |
The accompanying Notes to Financial Statements are an integral part of this statement.
| 68 | Multi-Manager Total Return Bond Strategies Fund | Annual Report 2018 |
Financial Highlights (continued)
| | Net
asset
value,
end of
period | Total
return | Total gross
expense
ratio to
average
net assets(a) | Total net
expense
ratio to
average
net assets(a),(b) | Net investment
income
ratio to
average
net assets | Portfolio
turnover | Net
assets,
end of
period
(000’s) |
| Class A |
| Year Ended 8/31/2018 | $9.79 | (1.51%) | 0.77% | 0.77% | 2.37% | 228% | $14,135 |
| Year Ended 8/31/2017 | $10.17 | 1.14% | 0.79% | 0.78% | 2.14% | 345% | $21,021 |
| Year Ended 8/31/2016 | $10.41 | 5.82% | 0.80% | 0.80% | 2.01% | 289% | $6,614,680 |
| Year Ended 8/31/2015 | $10.06 | 0.49% | 0.80% | 0.80% | 1.86% | 269% | $5,097,458 |
| Year Ended 8/31/2014 | $10.21 | 5.86% | 0.80% | 0.80% | 2.09% | 207% | $4,656,220 |
| Institutional Class |
| Year Ended 8/31/2018 | $9.80 | (1.16%) | 0.52% | 0.52% | 2.66% | 228% | $7,969,883 |
| Year Ended 8/31/2017(d) | $10.17 | 4.28% | 0.54% (f) | 0.53% (f) | 2.48% (f) | 345% | $7,549,220 |
The accompanying Notes to Financial Statements are an integral part of this statement.
Multi-Manager Total Return Bond Strategies Fund | Annual Report 2018
| 69 |
Notes to Financial Statements
August 31, 2018
Note 1. Organization
Multi-Manager Total Return Bond Strategies Fund (the Fund), a series of Columbia Funds Series Trust I (the Trust), is a diversified fund. The Trust is registered under the Investment Company Act of 1940, as amended (the 1940 Act), as an open-end management investment company organized as a Massachusetts business trust.
Fund shares
The Trust may issue an unlimited number of shares (without par value). The Fund is offered only through certain wrap fee programs sponsored and/or managed by Ameriprise Financial, Inc. (Ameriprise Financial) or its affiliates. The Fund offers each of the share classes identified below.
Class A shares are not subject to any front-end sales charge or contingent deferred sales charge.
Institutional Class shares are not subject to any front-end sales charge or contingent deferred sales charge. Prior to November 1, 2017, Institutional Class shares were known as Class Z shares.
Note 2. Summary of significant accounting policies
Basis of preparation
The Fund is an investment company that applies the accounting and reporting guidance in the Financial Accounting Standards Board (FASB) Accounting Standards Codification Topic 946, Financial Services - Investment Companies (ASC 946). The financial statements are prepared in accordance with U.S. generally accepted accounting principles (GAAP), which requires management to make certain estimates and assumptions that affect the reported amounts of assets and liabilities, the disclosure of contingent assets and liabilities at the date of the financial statements and the reported amounts of income and expenses during the reporting period. Actual results could differ from those estimates.
The following is a summary of significant accounting policies followed by the Fund in the preparation of its financial statements.
Security valuation
All equity securities are valued at the close of business of the New York Stock Exchange. Equity securities are valued at the last quoted sales price on the principal exchange or market on which they trade, except for securities traded on the NASDAQ Stock Market, which are valued at the NASDAQ official close price. Unlisted securities or listed securities for which there were no sales during the day are valued at the mean of the latest quoted bid and ask prices on such exchanges or markets.
Debt securities generally are valued by pricing services approved by the Board of Trustees based upon market transactions for normal, institutional-size trading units of similar securities. The services may use various pricing techniques that take into account, as applicable, factors such as yield, quality, coupon rate, maturity, type of issue, trading characteristics and other data, as well as approved independent broker-dealer quotes. Debt securities for which quotations are not readily available or not believed to be reflective of market value may also be valued based upon a bid quote from an approved independent broker-dealer. Debt securities maturing in 60 days or less are valued primarily at amortized cost value, unless this method results in a valuation that management believes does not approximate market value.
Asset- and mortgage-backed securities are generally valued by pricing services, which utilize pricing models that incorporate the securities’ cash flow and loan performance data. These models also take into account available market data, including trades, market quotations, and benchmark yield curves for identical or similar securities. Factors used to identify similar securities may include, but are not limited to, issuer, collateral type, vintage, prepayment speeds, collateral performance, credit ratings, credit enhancement and expected life. Asset-backed securities for which quotations are readily available may also be valued based upon an over-the-counter or exchange bid quote from an approved independent broker-dealer.
Senior loan securities for which reliable market quotations are readily available are generally valued by pricing services at the average of the bids received.
| 70 | Multi-Manager Total Return Bond Strategies Fund | Annual Report 2018 |
Notes to Financial Statements (continued)
August 31, 2018
Foreign equity securities are valued based on the closing price on the foreign exchange in which such securities are primarily traded. If any foreign equity security closing prices are not readily available, the securities are valued at the mean of the latest quoted bid and ask prices on such exchanges or markets. Foreign currency exchange rates are generally determined at 4:00 p.m. Eastern (U.S.) time. Many securities markets and exchanges outside the U.S. close prior to the close of the New York Stock Exchange; therefore, the closing prices for securities in such markets or on such exchanges may not fully reflect events that occur after such close but before the close of the New York Stock Exchange. In those situations, foreign securities will be fair valued pursuant to a policy adopted by the Board of Trustees, including, if available, utilizing a third party pricing service to determine these fair values. The third party pricing service takes into account multiple factors, including, but not limited to, movements in the U.S. securities markets, certain depositary receipts, futures contracts and foreign exchange rates that have occurred subsequent to the close of the foreign exchange or market, to determine a good faith estimate that reasonably reflects the current market conditions as of the close of the New York Stock Exchange. The fair value of a security is likely to be different from the quoted or published price, if available.
Investments in open-end investment companies, including money market funds, are valued at their latest net asset value.
Forward foreign currency exchange contracts are marked-to-market based upon foreign currency exchange rates provided by a pricing service.
Futures and options on futures contracts are valued based upon the settlement price at the close of regular trading on their principal exchanges or, in the absence of transactions, at the mean of the latest quoted bid and ask prices.
Swap transactions are valued through an independent pricing service or broker, or if neither is available, through an internal model based upon observable inputs.
Investments for which market quotations are not readily available, or that have quotations which management believes are not reflective of market value or reliable, are valued at fair value as determined in good faith under procedures approved by and under the general supervision of the Board of Trustees. If a security or class of securities (such as foreign securities) is valued at fair value, such value is likely to be different from the quoted or published price for the security.
The determination of fair value often requires significant judgment. To determine fair value, management may use assumptions including but not limited to future cash flows and estimated risk premiums. Multiple inputs from various sources may be used to determine fair value.
GAAP requires disclosure regarding the inputs and valuation techniques used to measure fair value and any changes in valuation inputs or techniques. In addition, investments shall be disclosed by major category. This information is disclosed following the Fund’s Portfolio of Investments.
Foreign currency transactions and translations
The values of all assets and liabilities denominated in foreign currencies are generally translated into U.S. dollars at exchange rates determined at the close of regular trading on the New York Stock Exchange. Net realized and unrealized gains (losses) on foreign currency transactions and translations include gains (losses) arising from the fluctuation in exchange rates between trade and settlement dates on securities transactions, gains (losses) arising from the disposition of foreign currency and currency gains (losses) between the accrual and payment dates on dividends, interest income and foreign withholding taxes.
For financial statement purposes, the Fund does not distinguish that portion of gains (losses) on investments which is due to changes in foreign exchange rates from that which is due to changes in market prices of the investments. Such fluctuations are included with the net realized and unrealized gains (losses) on investments in the Statement of Operations.
Derivative instruments
The Fund invests in certain derivative instruments, as detailed below, to meet its investment objectives. Derivatives are instruments whose values depend on, or are derived from, in whole or in part, the value of one or more securities, currencies, commodities, indices, or other assets or instruments. Derivatives may be used to increase investment flexibility (including to maintain cash reserves while maintaining desired exposure to certain assets), for risk management (hedging)
Multi-Manager Total Return Bond Strategies Fund | Annual Report 2018
| 71 |
Notes to Financial Statements (continued)
August 31, 2018
purposes, to facilitate trading, to reduce transaction costs and to pursue higher investment returns. The Fund may also use derivative instruments to mitigate certain investment risks, such as foreign currency exchange rate risk, interest rate risk and credit risk. Derivatives may involve various risks, including the potential inability of the counterparty to fulfill its obligations under the terms of the contract, the potential for an illiquid secondary market (making it difficult for the Fund to sell or terminate, including at favorable prices) and the potential for market movements which may expose the Fund to gains or losses in excess of the amount shown in the Statement of Assets and Liabilities. The notional amounts of derivative instruments, if applicable, are not recorded in the financial statements.
A derivative instrument may suffer a marked-to-market loss if the value of the contract decreases due to an unfavorable change in the market rates or values of the underlying instrument. Losses can also occur if the counterparty does not perform its obligations under the contract. The Fund’s risk of loss from counterparty credit risk on over-the-counter derivatives is generally limited to the aggregate unrealized gain netted against any collateral held by the Fund and the amount of any variation margin held by the counterparty, plus any replacement costs or related amounts. With exchange-traded or centrally cleared derivatives, there is reduced counterparty credit risk to the Fund since the clearinghouse or central counterparty (CCP) provides some protection in the case of clearing member default. The clearinghouse or CCP stands between the buyer and the seller of the contract; therefore, additional counterparty credit risk is failure of the clearinghouse or CCP. However, credit risk still exists in exchange-traded or centrally cleared derivatives with respect to initial and variation margin that is held in a broker’s customer account. While brokers are required to segregate customer margin from their own assets, in the event that a broker becomes insolvent or goes into bankruptcy and at that time there is a shortfall in the aggregate amount of margin held by the broker for all its clients, U.S. bankruptcy laws will typically allocate that shortfall on a pro-rata basis across all the broker’s customers (including the Fund), potentially resulting in losses to the Fund.
In order to better define its contractual rights and to secure rights that will help the Fund mitigate its counterparty risk, the Fund may enter into an International Swaps and Derivatives Association, Inc. Master Agreement (ISDA Master Agreement) or similar agreement with its derivatives contract counterparties. An ISDA Master Agreement is an agreement between the Fund and a counterparty that governs over-the-counter derivatives and typically contains, among other things, collateral posting terms and netting provisions in the event of a default and/or termination event. Under an ISDA Master Agreement, the Fund may, under certain circumstances, offset with the counterparty certain derivative instrument’s payables and/or receivables with collateral held and/or posted and create one single net payment. The provisions of the ISDA Master Agreement typically permit a single net payment in the event of default (close-out netting), including the bankruptcy or insolvency of the counterparty. Note, however, that bankruptcy or insolvency laws of a particular jurisdiction may impose restrictions on or prohibitions against the right of offset or netting in bankruptcy, insolvency or other events.
Collateral (margin) requirements differ by type of derivative. Margin requirements are established by the clearinghouse or CCP for exchange-traded and centrally cleared derivatives. Brokers can ask for margin in excess of the minimum in certain circumstances. Collateral terms are contract specific for over-the-counter derivatives. For over-the-counter derivatives traded under an ISDA Master Agreement, the collateral requirements are typically calculated by netting the marked-to-market amount for each transaction under such agreement and comparing that amount to the value of any variation margin currently pledged by the Fund and/or the counterparty. Generally, the amount of collateral due from or to a party has to exceed a minimum transfer amount threshold (e.g., $250,000) before a transfer has to be made. To the extent amounts due to the Fund from its counterparties are not fully collateralized, contractually or otherwise, the Fund bears the risk of loss from counterparty nonperformance. The Fund may also pay interest expense on cash collateral received from the broker. Any interest expense paid by the Fund is shown on the Statement of Operations. The Fund attempts to mitigate counterparty risk by only entering into agreements with counterparties that it believes have the financial resources to honor their obligations and by monitoring the financial stability of those counterparties.
Certain ISDA Master Agreements allow counterparties of over-the-counter derivatives transactions to terminate derivatives contracts prior to maturity in the event the Fund’s net asset value declines by a stated percentage over a specified time period or if the Fund fails to meet certain terms of the ISDA Master Agreement, which would cause the Fund to accelerate payment of any net liability owed to the counterparty. The Fund also has termination rights if the counterparty fails to meet certain terms of the ISDA Master Agreement. In determining whether to exercise such termination rights, the Fund would consider, in addition to counterparty credit risk, whether termination would result in a net liability owed from the counterparty.
| 72 | Multi-Manager Total Return Bond Strategies Fund | Annual Report 2018 |
Notes to Financial Statements (continued)
August 31, 2018
For financial reporting purposes, the Fund does not offset derivative assets and derivative liabilities that are subject to netting arrangements in the Statement of Assets and Liabilities.
Forward foreign currency exchange contracts
Forward foreign currency exchange contracts are over-the-counter agreements between two parties to buy and sell a currency at a set price on a future date. The Fund utilized forward foreign currency exchange contracts to hedge the currency exposure associated with some or all of the Fund’s securities and to shift foreign currency exposure back to U.S. dollars. These instruments may be used for other purposes in future periods.
The values of forward foreign currency exchange contracts fluctuate daily with changes in foreign currency exchange rates. Changes in the value of these contracts are recorded as unrealized appreciation or depreciation until the contract is exercised or has expired. The Fund will realize a gain or loss when the forward foreign currency exchange contract is closed or expires.
The use of forward foreign currency exchange contracts does not eliminate fluctuations in the prices of the Fund’s portfolio securities. The risks of forward foreign currency exchange contracts include movement in the values of the foreign currencies relative to the U.S. dollar (or other foreign currencies) and the possibility that counterparties will not complete their contractual obligations, which may be in excess of the amount reflected, if any, in the Statement of Assets and Liabilities.
Futures contracts
Futures contracts are exchange-traded and represent commitments for the future purchase or sale of an asset at a specified price on a specified date. The Fund bought and sold futures contracts to produce incremental earnings, to manage the duration and yield curve exposure of the Fund versus the benchmark and to manage exposure to movements in interest rates. These instruments may be used for other purposes in future periods. Upon entering into futures contracts, the Fund bears risks that it may not achieve the anticipated benefits of the futures contracts and may realize a loss. Additional risks include counterparty credit risk, the possibility of an illiquid market, and that a change in the value of the contract or option may not correlate with changes in the value of the underlying asset.
Upon entering into a futures contract, the Fund deposits cash or securities with the broker, known as a futures commission merchant (FCM), in an amount sufficient to meet the initial margin requirement. The initial margin deposit must be maintained at an established level over the life of the contract. Cash deposited as initial margin is recorded in the Statement of Assets and Liabilities as margin deposits. Securities deposited as initial margin are designated in the Portfolio of Investments. Subsequent payments (variation margin) are made or received by the Fund each day. The variation margin payments are equal to the daily change in the contract value and are recorded as variation margin receivable or payable and are offset in unrealized gains or losses. The Fund recognizes a realized gain or loss when the contract is closed or expires. Futures contracts involve, to varying degrees, risk of loss in excess of the variation margin disclosed in the Statement of Assets and Liabilities.
Swap contracts
Swap contracts are negotiated in the over-the-counter market and may be entered into as a bilateral contract or centrally cleared (centrally cleared swap contract). In a centrally cleared swap contract, immediately following execution of the swap contract with a broker, the swap contract is novated to a central counterparty (the CCP) and the CCP becomes the Fund’s counterparty to the centrally cleared swap contract. The Fund is required to deposit initial margin with the futures commission merchant (FCM), which pledges it through to the CCP in the form of cash or securities in an amount that varies depending on the size and risk profile of the particular swap contract. Securities deposited as initial margin are designated in the Portfolio of Investments and cash deposited is recorded in the Statement of Assets and Liabilities as margin deposits. Unlike a bilateral swap contract, for centrally cleared swap contracts, the Fund has minimal credit exposure to the FCM because the CCP stands between the Fund and the relevant buyer/seller on the other side of the contract. Swap contracts are marked-to-market daily and changes in value are recorded as unrealized appreciation (depreciation). The daily change in valuation of centrally cleared swap contracts, if any, is recorded as a receivable or payable for variation margin in the Statement of Assets and Liabilities.
Multi-Manager Total Return Bond Strategies Fund | Annual Report 2018
| 73 |
Notes to Financial Statements (continued)
August 31, 2018
Entering into these contracts involves, to varying degrees, elements of interest, liquidity and counterparty credit risk in excess of the amounts recognized in the Statement of Assets and Liabilities. Such risks involve the possibility that there may be unfavorable changes in interest rates, market conditions or other conditions, that it may be difficult to initiate a swap transaction or liquidate a position at an advantageous time or price which may result in significant losses, and that the FCM or CCP may not fulfill its obligation under the contract.
Credit default swap contracts
The Fund entered into credit default swap contracts to increase or decrease its credit exposure to an index, increase or decrease its credit exposure to a single issuer of debt securities, and to manage credit risk exposure. These instruments may be used for other purposes in future periods. Credit default swap contracts are agreements in which one party pays fixed periodic payments to a counterparty in consideration for an agreement from the counterparty to make a specific payment should a specified credit event(s) take place. Although specified credit events are contract specific, credit events are generally defined as bankruptcy, failure to pay, restructuring, obligation acceleration, obligation default, or repudiation/moratorium.
As the purchaser of a credit default swap contract, the Fund purchases protection by paying a periodic interest rate on the notional amount to the counterparty. The interest amount is accrued daily as a component of unrealized appreciation (depreciation) and is recorded as a realized loss upon payment. If a credit event as specified in the contract occurs, the Fund may have the option either to deliver the reference obligation to the seller in exchange for a cash payment of its par amount, or to receive a net cash settlement equal to the par amount less an agreed-upon value of the reference obligation as of the date of the credit event. The difference between the value of the obligation or cash delivered and the notional amount received will be recorded as a realized gain (loss).
As the seller of a credit default swap contract, the Fund sells protection to a buyer and will generally receive a periodic interest rate on a notional amount. The interest amount is accrued daily as a component of unrealized appreciation (depreciation) and is recorded as a realized gain upon receipt of the payment. If a credit event as specified in the contract with the counterparty occurs, the Fund may either be required to accept the reference obligation from the buyer in exchange for a cash payment of its notional amount, or to pay the buyer a net cash settlement equal to the notional amount less an agreed-upon value of the reference obligation (recovery value) as of the date of the credit event. The difference between the value of the obligation or cash received and the notional amount paid will be recorded as a realized gain (loss). The maximum potential amount of undiscounted future payments the Fund could be required to make as the seller of protection under a credit default swap contract is equal to the notional amount of the reference obligation. These potential amounts may be partially offset by any recovery values of the respective reference obligations or upfront receipts upon entering into the agreement. The notional amounts and market values of all credit default swap contracts in which the Fund is the seller of protection, if any, are disclosed in the Credit Default Swap Contracts Outstanding schedule following the Portfolio of Investments.
As a protection seller, the Fund bears the risk of loss from the credit events specified in the contract with the counterparty. For credit default swap contracts on credit indices, quoted market prices and resulting market values serve as an indicator of the current status of the payment/performance risk. Increasing market values, in absolute terms when compared to the notional amount of the swap, represent a deterioration of the reference entity’s credit soundness and a greater likelihood or risk of default or other credit event occurring as defined under the terms of the contract.
Any upfront payments or receipts by the Fund upon entering into a credit default swap contract is recorded as an asset or liability, respectively, and amortized daily as a component of realized gain (loss) in the Statement of Operations. Credit default swap contracts are valued daily, and the change in value is recorded as unrealized appreciation (depreciation) until the termination of the swap, at which time a realized gain (loss) is recorded.
Credit default swap contracts can involve greater risks than if a fund had invested in the reference obligation directly since, in addition to general market risks, credit default swaps are subject to counterparty credit risk, leverage risk, hedging risk, correlation risk and liquidity risk.
| 74 | Multi-Manager Total Return Bond Strategies Fund | Annual Report 2018 |
Notes to Financial Statements (continued)
August 31, 2018
Interest rate swap contracts
The Fund entered into interest rate swap transactions which may include inflation rate swap contracts to produce incremental earnings, to manage interest rate and market risk exposure to produce incremental earnings, to gain exposure to or protect itself from market rate changes, and to hedge the portfolio risk associated with some or all of the Fund’s securities. These instruments may be used for other purposes in future periods. An interest rate swap is an agreement between two parties where there are two flows and payments are made between the two counterparties and the payments are dependent upon changes in an interest rate, inflation rate or inflation index calculated on a nominal amount. Interest rate swaps are agreements between two parties that involve the exchange of one type of interest rate for another type of interest rate cash flow on specified dates in the future, based on a predetermined, specified notional amount. Certain interest rate swaps are considered forward-starting, whereby the accrual for the exchange of cash flows does not begin until a specified date in the future. The net cash flow for a standard interest rate swap transaction is generally the difference between a floating market interest rate versus a fixed interest rate.
Interest rate swaps are valued daily and unrealized appreciation (depreciation) is recorded. Certain interest rate swaps may accrue periodic interest on a daily basis as a component of unrealized appreciation (depreciation); the Fund will realize a gain or loss upon the payment or receipt of accrued interest. The Fund will realize a gain or a loss when the interest rate swap is terminated.
Effects of derivative transactions in the financial statements
The following tables are intended to provide additional information about the effect of derivatives on the financial statements of the Fund, including: the fair value of derivatives by risk category and the location of those fair values in the Statement of Assets and Liabilities; and the impact of derivative transactions over the period in the Statement of Operations, including realized and unrealized gains (losses). The derivative instrument schedules following the Portfolio of Investments present additional information regarding derivative instruments outstanding at the end of the period, if any.
The following table is a summary of the fair value of derivative instruments (not considered to be hedging instruments for accounting disclosure purposes) at August 31, 2018:
| | Asset derivatives | |
Risk exposure
category | Statement
of assets and liabilities
location | Fair value ($) |
| Foreign exchange risk | Unrealized appreciation on forward foreign currency exchange contracts | 74,536 |
| Interest rate risk | Net assets — unrealized appreciation on futures contracts | 973,326* |
| Interest rate risk | Net assets — unrealized appreciation on swap contracts | 30,444,676* |
| Total | | 31,492,538 |
| | Liability derivatives | |
Risk exposure
category | Statement
of assets and liabilities
location | Fair value ($) |
| Credit risk | Net assets — unrealized depreciation on swap contracts | 6,887,103* |
| Foreign exchange risk | Unrealized depreciation on forward foreign currency exchange contracts | 160,222 |
| Interest rate risk | Net assets — unrealized depreciation on futures contracts | 1,435,390* |
| Interest rate risk | Net assets — unrealized depreciation on swap contracts | 18,600,597* |
| Total | | 27,083,312 |
| * | Includes cumulative appreciation (depreciation) as reported in the tables following the Portfolio of Investments. Only the current day’s variation margin is reported in receivables or payables in the Statement of Assets and Liabilities. |
Multi-Manager Total Return Bond Strategies Fund | Annual Report 2018
| 75 |
Notes to Financial Statements (continued)
August 31, 2018
The following table indicates the effect of derivative instruments (not considered to be hedging instruments for accounting disclosure purposes) in the Statement of Operations for the year ended August 31, 2018:
| Amount of realized gain (loss) on derivatives recognized in income |
| Risk exposure category | Forward
foreign
currency
exchange
contracts
($) | Futures
contracts
($) | Swap
contracts
($) | Total
($) |
| Credit risk | — | — | (17,319,571) | (17,319,571) |
| Foreign exchange risk | 1,001,956 | — | — | 1,001,956 |
| Interest rate risk | — | (39,987,091) | 2,850,890 | (37,136,201) |
| Total | 1,001,956 | (39,987,091) | (14,468,681) | (53,453,816) |
| |
| Change in unrealized appreciation (depreciation) on derivatives recognized in income |
| Risk exposure category | Forward
foreign
currency
exchange
contracts
($) | Futures
contracts
($) | Swap
contracts
($) | Total
($) |
| Credit risk | — | — | (2,338,437) | (2,338,437) |
| Foreign exchange risk | (8,734) | — | — | (8,734) |
| Interest rate risk | — | (3,701,945) | 16,197,015 | 12,495,070 |
| Total | (8,734) | (3,701,945) | 13,858,578 | 10,147,899 |
The following table is a summary of the average outstanding volume by derivative instrument for the year ended August 31, 2018:
| Derivative instrument | Average notional
amounts ($) |
| Futures contracts — long | 2,231,920,628* |
| Futures contracts — short | 480,210,205* |
| Credit default swap contracts — buy protection | 334,318,000* |
| Credit default swap contracts — sell protection | 164,702,473** |
| Derivative instrument | Average unrealized
appreciation ($) | Average unrealized
depreciation ($) |
| Forward foreign currency exchange contracts | 203,138* | (89,514)** |
| Interest rate swap contracts | 23,093,480* | (7,439,197)* |
| * | Based on the ending quarterly outstanding amounts for the year ended August 31, 2018. |
| ** | Based on the ending daily outstanding amounts for the year ended August 31, 2018. |
Investments in senior loans
The Fund may invest in senior loan assignments. When the Fund purchases an assignment of a senior loan, the Fund typically has direct rights against the borrower; provided, however, that the Fund’s rights may be more limited than the lender from which it acquired the assignment and the Fund may be able to enforce its rights only through an administrative agent. Although certain senior loan assignments are secured by collateral, the Fund could experience delays or limitations in realizing such collateral or have its interest subordinated to other indebtedness of the obligor. In the event that the administrator or collateral agent of a loan becomes insolvent or enters into receivership or bankruptcy, the Fund may incur costs and delays in realizing payment or may suffer a loss of principal and/or interest. The risk of loss is greater for unsecured or subordinated loans. In addition, senior loan assignments are vulnerable to market, economic or other conditions or events that may reduce the demand for senior loan assignments and certain senior loan assignments which were liquid when purchased, may become illiquid.
| 76 | Multi-Manager Total Return Bond Strategies Fund | Annual Report 2018 |
Notes to Financial Statements (continued)
August 31, 2018
The Fund may enter into senior loan assignments where all or a portion of the loan may be unfunded. The Fund is obligated to fund these commitments at the borrower’s discretion. These commitments, if any, are generally traded and priced in the same manner as other senior loan securities and are disclosed as unfunded senior loan commitments in the Fund’s Portfolio of Investments with a corresponding payable for investments purchased. The Fund designates cash or liquid securities to cover these commitments.
Asset- and mortgage-backed securities
The Fund may invest in asset-backed and mortgage-backed securities. The maturity dates shown represent the original maturity of the underlying obligation. Actual maturity may vary based upon prepayment activity on these obligations. All, or a portion, of the obligation may be prepaid at any time because the underlying asset may be prepaid. As a result, decreasing market interest rates could result in an increased level of prepayment. An increased prepayment rate will have the effect of shortening the maturity of the security. Unless otherwise noted, the coupon rates presented are fixed rates.
Delayed delivery securities
The Fund may trade securities on other than normal settlement terms, including securities purchased or sold on a “when-issued” or "forward commitment" basis. This may increase risk to the Fund since the other party to the transaction may fail to deliver, which could cause the Fund to subsequently invest at less advantageous prices. The Fund designates cash or liquid securities in an amount equal to the delayed delivery commitment.
Mortgage dollar roll transactions
The Fund may enter into mortgage “dollar rolls” in which the Fund sells securities for delivery in the current month and simultaneously contracts with the same counterparty to repurchase similar but not identical securities (same type, coupon and maturity) on a specified future date. During the roll period, the Fund loses the right to receive principal and interest paid on the securities sold. However, the Fund will benefit because it receives negotiated amounts in the form of reductions of the purchase price for the future purchase plus the interest earned on the cash proceeds of the securities sold until the settlement date of the forward purchase. The Fund records the incremental difference between the forward purchase and sale of each forward roll as a realized gain or loss. Unless any realized gains exceed the income, capital appreciation, and gain or loss due to mortgage prepayments that would have been realized on the securities sold as part of the mortgage dollar roll, the use of this technique will diminish the investment performance of the Fund compared to what the performance would have been without the use of mortgage dollar rolls. All cash proceeds will be invested in instruments that are permissible investments for the Fund. The Fund identifies cash or liquid securities in an amount equal to the forward purchase price.
For financial reporting and tax purposes, the Fund treats “to be announced” mortgage dollar rolls as two separate transactions, one involving the purchase of a security and a separate transaction involving a sale. These transactions may increase the Fund’s portfolio turnover rate. The Fund does not currently enter into mortgage dollar rolls that are accounted for as financing transactions.
Mortgage dollar rolls involve the risk that the market value of the securities the Fund is obligated to repurchase may decline below the repurchase price, or that the counterparty may default on its obligations.
To be announced securities
The Fund may trade securities on a To Be Announced (TBA) basis. As with other delayed-delivery transactions, a seller agrees to issue a TBA security at a future date. However, the seller does not specify the particular securities to be delivered. Instead, the Fund agrees to accept any security that meets specified terms.
In some cases, Master Securities Forward Transaction Agreements (MSFTAs) may be used to govern transactions of certain forward-settling agency mortgage-backed securities, such as delayed-delivery and TBAs, between the Fund and counterparty. The MSFTA maintains provisions for, among other things, initiation and confirmation, payment and transfer, events of default, termination, and maintenance of collateral relating to such transactions.
Multi-Manager Total Return Bond Strategies Fund | Annual Report 2018
| 77 |
Notes to Financial Statements (continued)
August 31, 2018
Treasury inflation protected securities
The Fund may invest in treasury inflation protected securities (TIPS). The principal amount of TIPS is adjusted periodically and is increased for inflation or decreased for deflation based on a monthly published index. These adjustments are recorded as interest income in the Statement of Operations. Coupon payments are based on the adjusted principal at the time the interest is paid.
Interest only and principal only securities
The Fund may invest in Interest Only (IO) or Principal Only (PO) securities. IOs are stripped securities entitled to receive all of the security’s interest, but none of its principal. IOs are particularly sensitive to changes in interest rates and therefore subject to greater fluctuations in price than typical interest bearing debt securities. IOs are also subject to credit risk because the Fund may not receive all or part of the interest payments if the issuer, obligor, guarantor or counterparty defaults on its obligation. Payments received for IOs are included in interest income on the Statement of Operations. Because no principal will be received at the maturity of an IO, adjustments are made to the cost of the security on a monthly basis until maturity. These adjustments are included in interest income on the Statement of Operations. POs are stripped securities entitled to receive the principal from the underlying obligation, but not the interest. POs are particularly sensitive to changes in interest rates and therefore are subject to fluctuations in price. POs are also subject to credit risk because the Fund may not receive all or part of its principal if the issuer, obligor, guarantor or counterparty defaults on its obligation. The Fund may also invest in IO or PO stripped mortgage-backed securities. Payments received for POs are treated as reductions to the cost and par value of the securities.
Offsetting of assets and liabilities
The following table presents the Fund’s gross and net amount of assets and liabilities available for offset under netting arrangements as well as any related collateral received or pledged by the Fund as of August 31, 2018:
| | Goldman
Sachs ($) | JPMorgan ($) | Morgan
Stanley ($) | Total ($) |
| Assets | | | | |
| Centrally cleared interest rate swap contracts (a) | - | 76,159 | - | 76,159 |
| Forward foreign currency exchange contracts | 74,536 | - | - | 74,536 |
| Total assets | 74,536 | 76,159 | - | 150,695 |
| Liabilities | | | | |
| Centrally cleared credit default swap contracts (a) | - | - | 312,340 | 312,340 |
| Centrally cleared interest rate swap contracts (a) | - | 1,316,987 | 1,521,075 | 2,838,062 |
| Forward foreign currency exchange contracts | 160,222 | - | - | 160,222 |
| Total liabilities | 160,222 | 1,316,987 | 1,833,415 | 3,310,624 |
| Total financial and derivative net assets | (85,686) | (1,240,828) | (1,833,415) | (3,159,929) |
| Total collateral received (pledged) (b) | - | (1,240,828) | (1,833,415) | (3,074,243) |
| Net amount (c) | (85,686) | - | - | (85,686) |
| (a) | Centrally cleared swaps are included within payable/receivable for variation margin on the Statement of Assets and Liabilities. |
| (b) | In some instances, the actual collateral received and/or pledged may be more than the amount shown due to overcollateralization. |
| (c) | Represents the net amount due from/(to) counterparties in the event of default. |
Security transactions
Security transactions are accounted for on the trade date. Cost is determined and gains (losses) are based upon the specific identification method for both financial statement and federal income tax purposes.
The trade date for senior loans purchased in the primary market is the date on which the loan is allocated. The trade date for senior loans purchased in the secondary market is the date on which the transaction is entered into.
| 78 | Multi-Manager Total Return Bond Strategies Fund | Annual Report 2018 |
Notes to Financial Statements (continued)
August 31, 2018
Income recognition
Interest income is recorded on an accrual basis. Market premiums and discounts, including original issue discounts, are amortized and accreted, respectively, over the expected life of the security on all debt securities, unless otherwise noted. The Fund classifies gains and losses realized on prepayments received on mortgage-backed securities as adjustments to interest income.
The Fund may place a debt security on non-accrual status and reduce related interest income when it becomes probable that the interest will not be collected and the amount of uncollectible interest can be reasonably estimated. A defaulted debt security is removed from non-accrual status when the issuer resumes interest payments or when collectibility of interest is reasonably assured.
Corporate actions and dividend income are generally recorded net of any non-reclaimable tax withholdings, on the ex-dividend date or upon receipt of ex-dividend notification in the case of certain foreign securities.
The Fund may receive distributions from holdings in equity securities, business development companies (BDCs), exchange-traded funds (ETFs), limited partnerships (LPs), other regulated investment companies (RICs), and real estate investment trusts (REITs), which report information on the tax character of their distributions annually. These distributions are allocated to dividend income, capital gain and return of capital based on actual information reported. Return of capital is recorded as a reduction of the cost basis of securities held. If the Fund no longer owns the applicable securities, return of capital is recorded as a realized gain. With respect to REITs, to the extent actual information has not yet been reported, estimates for return of capital are made by the Fund’s management. Management’s estimates are subsequently adjusted when the actual character of the distributions is disclosed by the REITs, which could result in a proportionate change in return of capital to shareholders.
Awards from class action litigation are recorded as a reduction of cost basis if the Fund still owns the applicable securities on the payment date. If the Fund no longer owns the applicable securities, the proceeds are recorded as realized gains.
The value of additional securities received as an income payment through a payment in kind, if any, is recorded as interest income and increases the cost basis of such securities.
The Fund may receive other income from senior loans, including amendment fees, consent fees and commitment fees. These fees are recorded as income when received by the Fund. These amounts are included in Interest Income in the Statement of Operations.
Income and capital gain distributions from the Underlying Funds, if any, are recorded on the ex-dividend date.
Expenses
General expenses of the Trust are allocated to the Fund and other funds of the Trust based upon relative net assets or other expense allocation methodologies determined by the nature of the expense. Expenses directly attributable to the Fund are charged to the Fund. Expenses directly attributable to a specific class of shares are charged to that share class.
Determination of class net asset value
All income, expenses (other than class-specific expenses, which are charged to that share class, as shown in the Statement of Operations) and realized and unrealized gains (losses) are allocated to each class of the Fund on a daily basis, based on the relative net assets of each class, for purposes of determining the net asset value of each class.
Federal income tax status
The Fund intends to qualify each year as a regulated investment company under Subchapter M of the Internal Revenue Code, as amended, and will distribute substantially all of its investment company taxable income and net capital gain, if any, for its tax year, and as such will not be subject to federal income taxes. In addition, the Fund intends to distribute in each calendar year substantially all of its ordinary income, capital gain net income and certain other amounts, if any, such that the Fund should not be subject to federal excise tax. Therefore, no federal income or excise tax provision is recorded.
Multi-Manager Total Return Bond Strategies Fund | Annual Report 2018
| 79 |
Notes to Financial Statements (continued)
August 31, 2018
Foreign taxes
The Fund may be subject to foreign taxes on income, gains on investments or currency repatriation, a portion of which may be recoverable. The Fund will accrue such taxes and recoveries, as applicable, based upon its current interpretation of tax rules and regulations that exist in the markets in which it invests.
Realized gains in certain countries may be subject to foreign taxes at the Fund level, based on statutory rates. The Fund accrues for such foreign taxes on realized and unrealized gains at the appropriate rate for each jurisdiction, as applicable. The amount, if any, is disclosed as a liability on the Statement of Assets and Liabilities.
Distributions to shareholders
Distributions from net investment income, if any, are declared daily and paid monthly. Net realized capital gains, if any, are distributed at least annually. Income distributions and capital gain distributions are determined in accordance with federal income tax regulations, which may differ from GAAP.
Guarantees and indemnifications
Under the Trust’s organizational documents and, in some cases, by contract, its officers and trustees are indemnified against certain liabilities arising out of the performance of their duties to the Trust or its funds. In addition, certain of the Fund’s contracts with its service providers contain general indemnification clauses. The Fund’s maximum exposure under these arrangements is unknown since the amount of any future claims that may be made against the Fund cannot be determined, and the Fund has no historical basis for predicting the likelihood of any such claims.
Recent accounting pronouncement
Accounting Standards Update 2017-08 Premium Amortization on Purchased Callable Debt Securities
In March 2017, the Financial Accounting Standards Board issued Accounting Standards Update (ASU) No. 2017-08 Premium Amortization on Purchased Callable Debt Securities. ASU No. 2017-08 updates the accounting standards to shorten the amortization period for certain purchased callable debt securities, held at a premium, to be amortized to the earliest call date. The update applies to securities with explicit, noncontingent call features that are callable at fixed prices and on preset dates. The standard is effective for annual periods beginning after December 15, 2018 and interim periods within those fiscal years. At this time, management is evaluating the implication of this guidance and the impact it will have on the financial statement amounts and footnote disclosures, if any.
Note 3. Fees and other transactions with affiliates
Management services fees
The Fund has entered into a Management Agreement with Columbia Management Investment Advisers, LLC (the Investment Manager), a wholly-owned subsidiary of Ameriprise Financial, Inc. (Ameriprise Financial). Under the Management Agreement, the Investment Manager provides the Fund with investment research and advice, as well as administrative and accounting services. The Investment Manager is responsible for the ultimate oversight of investments made by the Fund. The Fund’s subadvisers (see Subadvisory agreement below) have the primary responsibility for the day-to-day portfolio management of their portion of the Fund. The management services fee is an annual fee that is equal to a percentage of the Fund’s daily net assets that declines from 0.50% to 0.34% as the Fund’s net assets increase. The effective management services fee rate, net of waivers, for the year ended August 31, 2018 was 0.46% of the Fund’s average daily net assets.
The Investment Manager has voluntarily agreed to waive a portion of the management services fee on Fund assets that are invested in affiliated mutual funds, exchange-traded funds and closed-end funds that pay a management services fee, or where applicable, an advisory fee to the Investment Manager. The Investment Manager, in its discretion, may revise or discontinue this arrangement at any time.
| 80 | Multi-Manager Total Return Bond Strategies Fund | Annual Report 2018 |
Notes to Financial Statements (continued)
August 31, 2018
Subadvisory agreement
The Investment Manager has entered into Subadvisory Agreements with Loomis Sayles & Company, L.P., PGIM, Inc., the asset management arm of Prudential Financial and TCW Investment Management Company, LLC, each of which, together with the Investment Manager, manage a portion of the assets of the Fund. New investments in the Fund, net of any redemptions, are allocated in accordance with the Investment Manager’s determination, subject to the oversight of the Fund’s Board of Trustees. Each subadviser’s proportionate share of investments in the Fund may also vary due to market fluctuations. The Investment Manager compensates each subadviser to manage the investment of the Fund’s assets.
Compensation of board members
Members of the Board of Trustees who are not officers or employees of the Investment Manager or Ameriprise Financial are compensated for their services to the Fund as disclosed in the Statement of Operations. These members of the Board of Trustees may participate in a Deferred Compensation Plan (the Plan) which may be terminated at any time. Obligations of the Plan will be paid solely out of the Fund’s assets, and all amounts payable under the Plan constitute a general unsecured obligation of the Fund.
Compensation of Chief Compliance Officer
The Board of Trustees has appointed a Chief Compliance Officer to the Fund in accordance with federal securities regulations. As disclosed in the Statement of Operations, a portion of the Chief Compliance Officer’s total compensation is allocated to the Fund, along with other allocations to affiliated funds governed by the Board of Trustees, based on relative net assets.
Transactions with affiliates
For the year ended August 31, 2018, the Fund engaged in purchase and/or sale transactions with affiliates and/or accounts that have a common investment manager (or affiliated investment managers), common directors/trustees, and/or common officers. Those purchase and sale transactions complied with provisions of Rule 17a-7 under the 1940 Act and were $3,607,874 and $0, respectively.
Transfer agency fees
Under a Transfer and Dividend Disbursing Agent Agreement, Columbia Management Investment Services Corp. (the Transfer Agent), an affiliate of the Investment Manager and a wholly-owned subsidiary of Ameriprise Financial, is responsible for providing transfer agency services to the Fund. The Transfer Agent has contracted with DST Asset Manager Solutions, Inc. (DST) to serve as sub-transfer agent. The Transfer Agent pays the fees of DST for services as sub-transfer agent and DST is not entitled to reimbursement for such fees from the Fund (with the exception of out-of-pocket fees).
The Fund pays the Transfer Agent a monthly transfer agency fee based on the number or the average value of accounts, depending on the type of account. In addition, the Fund pays the Transfer Agent a fee for shareholder services based on the number of accounts or on a percentage of the average aggregate value of the Fund’s shares maintained in omnibus accounts up to the lesser of the amount charged by the financial intermediary or a cap established by the Board of Trustees from time to time.
The Transfer Agent also receives compensation from the Fund for various shareholder services and reimbursements for certain out-of-pocket fees.
For the year ended August 31, 2018, the Fund’s effective transfer agency fee rates as a percentage of average daily net assets of each class were as follows:
| | Effective rate (%) |
| Class A | 0.05 |
| Institutional Class | 0.05 |
Multi-Manager Total Return Bond Strategies Fund | Annual Report 2018
| 81 |
Notes to Financial Statements (continued)
August 31, 2018
Distribution and service fees
The Fund has entered into an agreement with Columbia Management Investment Distributors, Inc. (the Distributor), an affiliate of the Investment Manager and a wholly-owned subsidiary of Ameriprise Financial, for distribution and shareholder services. The Board of Trustees has approved, and the Fund has adopted, distribution and shareholder service plans (the Plans) applicable to certain share classes, which set the distribution and service fees for the Fund. These fees are calculated daily and are intended to compensate the Distributor and/or eligible selling and/or servicing agents for selling shares of the Fund and providing services to investors.
The Fund may pay distribution fee of up to 0.25% of the Fund’s average daily net assets attributable to Class A shares and a service fee of up to 0.25% of the Fund’s average daily net assets attributable to Class A shares, provided that the aggregate fee shall not exceed 0.25% of the Fund’s average daily net assets attributable to Class A shares.
Expenses waived/reimbursed by the Investment Manager and its affiliates
The Investment Manager and certain of its affiliates have contractually agreed to waive fees and/or reimburse expenses (excluding certain fees and expenses described below) for the period(s) disclosed below, unless sooner terminated at the sole discretion of the Board of Trustees, so that the Fund’s net operating expenses, after giving effect to fees waived/expenses reimbursed and any balance credits and/or overdraft charges from the Fund’s custodian, do not exceed the following annual rate(s) as a percentage of the class’ average daily net assets:
| | Fee rate(s) contractual
through
December 31, 2018 |
| Class A | 0.86% |
| Institutional Class | 0.61 |
Under the agreement governing these fee waivers and/or expense reimbursement arrangements, the following fees and expenses are excluded from the waiver/reimbursement commitment, and therefore will be paid by the Fund, if applicable: taxes (including foreign transaction taxes), expenses associated with investments in affiliated and non-affiliated pooled investment vehicles (including mutual funds and exchange-traded funds), transaction costs and brokerage commissions, costs related to any securities lending program, dividend expenses associated with securities sold short, inverse floater program fees and expenses, transaction charges and interest on borrowed money, interest, infrequent and/or unusual expenses and any other expenses the exclusion of which is specifically approved by the Board of Trustees. This agreement may be modified or amended only with approval from the Investment Manager, certain of its affiliates and the Fund. Any fees waived and/or expenses reimbursed under the expense reimbursement arrangements described above are not recoverable by the Investment Manager or its affiliates in future periods.
Note 4. Federal tax information
The timing and character of income and capital gain distributions are determined in accordance with income tax regulations, which may differ from GAAP because of temporary or permanent book to tax differences.
At August 31, 2018, these differences were primarily due to differing treatment for deferral/reversal of wash sale losses, derivative investments, tax straddles, swap investments, capital loss carryforwards, trustees’ deferred compensation, distributions, principal and/or interest from fixed income securities, foreign currency transactions, distribution reclassifications, non-deductible expenses, investments in partnerships and amortization/accretion on certain convertible securities. To the extent these differences were permanent, reclassifications were made among the components of the Fund’s net assets in the Statement of Assets and Liabilities. Temporary differences do not require reclassifications.
In the Statement of Assets and Liabilities the following reclassifications were made:
Undistributed net
investment
income ($) | Accumulated
net realized
(loss) ($) | Paid in
capital ($) |
| 225,434 | (225,434) | — |
| 82 | Multi-Manager Total Return Bond Strategies Fund | Annual Report 2018 |
Notes to Financial Statements (continued)
August 31, 2018
Net investment income (loss) and net realized gains (losses), as disclosed in the Statement of Operations, and net assets were not affected by this reclassification.
The tax character of distributions paid during the years indicated was as follows:
| Year Ended August 31, 2018 | Year Ended August 31, 2017 |
Ordinary
income ($) | Long-term
capital gains ($) | Total ($) | Ordinary
income ($) | Long-term
capital gains ($) | Total ($) |
| 195,850,785 | 2,908,510 | 198,759,295 | 222,130,332 | 20,380,923 | 242,511,255 |
Short-term capital gain distributions, if any, are considered ordinary income distributions for tax purposes.
At August 31, 2018, the components of distributable earnings on a tax basis were as follows:
Undistributed
ordinary income ($) | Undistributed
long-term
capital gains ($) | Capital loss
carryforwards ($) | Net unrealized
(depreciation) ($) |
| 31,107,866 | — | (120,451,960) | (96,106,253) |
At August 31, 2018, the cost of all investments for federal income tax purposes along with the aggregate gross unrealized appreciation and depreciation based on that cost was:
Federal
tax cost ($) | Gross unrealized
appreciation ($) | Gross unrealized
(depreciation) ($) | Net unrealized
(depreciation) ($) |
| 8,248,718,781 | 47,848,694 | (143,954,947) | (96,106,253) |
Tax cost of investments and unrealized appreciation/(depreciation) may also include timing differences that do not constitute adjustments to tax basis.
The following capital loss carryforwards, determined at August 31, 2018, may be available to reduce taxable income arising from future net realized gains on investments, if any, to the extent permitted by the Internal Revenue Code. Capital loss carryforwards with no expiration are required to be utilized prior to any capital losses which carry an expiration date. As a result of this ordering rule, capital loss carryforwards which carry an expiration date may be more likely to expire unused. In addition, for the year ended August 31, 2018, capital loss carryforwards utilized, expired unused and permanently lost, if any, were as follows:
| 2019 ($) | No expiration
short-term ($) | No expiration
long-term ($) | Total ($) | Utilized ($) | Expired ($) | Permanently
lost ($) |
| — | 78,503,005 | 41,948,955 | 120,451,960 | — | — | — |
Management of the Fund has concluded that there are no significant uncertain tax positions in the Fund that would require recognition in the financial statements. However, management’s conclusion may be subject to review and adjustment at a later date based on factors including, but not limited to, new tax laws, regulations, and administrative interpretations (including relevant court decisions). Generally, the Fund’s federal tax returns for the prior three fiscal years remain subject to examination by the Internal Revenue Service.
Note 5. Portfolio information
The cost of purchases and proceeds from sales of securities, excluding short-term investments and derivatives, if any, aggregated to $17,969,733,549 and $17,498,843,820, respectively, for the year ended August 31, 2018, of which $13,364,869,018 and $13,710,238,421, respectively, were U.S. government securities. The amount of purchase and sale activity impacts the portfolio turnover rate reported in the Financial Highlights.
Multi-Manager Total Return Bond Strategies Fund | Annual Report 2018
| 83 |
Notes to Financial Statements (continued)
August 31, 2018
Note 6. Affiliated money market fund
The Fund invests in Columbia Short-Term Cash Fund, an affiliated money market fund established for the exclusive use by the Fund and other affiliated funds (the Affiliated MMF). The income earned by the Fund from such investments is included as Dividends - affiliated issuers in the Statement of Operations. As an investing fund, the Fund indirectly bears its proportionate share of the expenses of the Affiliated MMF. The Affiliated MMF prices its shares with a floating net asset value. In addition, the Board of Trustees of the Affiliated MMF may impose a fee on redemptions (sometimes referred to as a liquidity fee) or temporarily suspend redemptions (sometimes referred to as imposing a redemption gate) in the event its liquidity falls below regulatory limits.
Note 7. Interfund lending
Pursuant to an exemptive order granted by the Securities and Exchange Commission, the Fund participates in a program (the Interfund Program) allowing each participating Columbia Fund (each, a Participating Fund) to lend money directly to and, except for closed-end funds and money market funds, borrow money directly from other Participating Funds for temporary purposes. The amounts eligible for borrowing and lending under the Interfund Program are subject to certain restrictions.
Interfund loans are subject to the risk that the borrowing fund could be unable to repay the loan when due, and a delay in repayment to the lending fund could result in lost opportunities and/or additional lending costs. The exemptive order is subject to conditions intended to mitigate conflicts of interest arising from the Investment Manager’s relationship with each Participating Fund.
The Fund did not borrow or lend money under the Interfund Program during the year ended August 31, 2018.
Note 8. Line of credit
The Fund has access to a revolving credit facility with a syndicate of banks led by Citibank, N.A., HSBC Bank USA, N.A. and JPMorgan Chase Bank, N.A. whereby the Fund may borrow for the temporary funding of shareholder redemptions or for other temporary or emergency purposes. The credit facility, which is a collective agreement between the Fund and certain other funds managed by the Investment Manager, severally and not jointly, permits collective borrowings up to $1 billion. Interest is charged to each participating fund based on its borrowings at a rate equal to the higher of (i) the overnight federal funds rate plus 1.00% or (ii) the one-month LIBOR rate plus 1.00%. Each borrowing under the credit facility matures no later than 60 days after the date of borrowing. The Fund also pays a commitment fee equal to its pro rata share of the amount of the credit facility at a rate of 0.15% per annum. The commitment fee is included in other expenses in the Statement of Operations. This agreement expires annually in December unless extended or renewed.
The Fund had no borrowings during the year ended August 31, 2018.
Note 9. Significant risks
Shareholder concentration risk
At August 31, 2018, affiliated shareholders of record owned 100.0% of the outstanding shares of the Fund in one or more accounts. Subscription and redemption activity by concentrated accounts may have a significant effect on the operations of the Fund. In the case of a large redemption, the Fund may be forced to sell investments at inopportune times, including its liquid positions, which may result in Fund losses and the Fund holding a higher percentage of less liquid positions. Large redemptions could result in decreased economies of scale and increased operating expenses for non-redeeming Fund shareholders.
Credit risk
Credit risk is the risk that the value of debt securities in the Fund’s portfolio may decline because the issuer may default and fail to pay interest or repay principal when due. Rating agencies assign credit ratings to debt securities to indicate their credit risk. Lower rated or unrated debt securities held by the Fund may present increased credit risk as compared to higher-rated debt securities.
| 84 | Multi-Manager Total Return Bond Strategies Fund | Annual Report 2018 |
Notes to Financial Statements (continued)
August 31, 2018
Derivatives risk
Losses involving derivative instruments may be substantial, because a relatively small price movement in the underlying security(ies), commodity, currency or index or other instrument or asset may result in a substantial loss for the Fund. In addition to the potential for increased losses, the use of derivative instruments may lead to increased volatility within the Fund. Derivatives will typically increase the Fund’s exposure to principal risks to which it is otherwise exposed, and may expose the Fund to additional risks, including correlation risk, counterparty risk, hedging risk, leverage risk and liquidity risk.
Interest rate risk
Interest rate risk is the risk of losses attributable to changes in interest rates. In general, if prevailing interest rates rise, the values of debt securities tend to fall, and if interest rates fall, the values of debt securities tend to rise. Actions by governments and central banking authorities can result in increases in interest rates. Increasing interest rates may negatively affect the value of debt securities held by the Fund, resulting in a negative impact on the Fund’s performance and net asset value per share. In general, the longer the maturity or duration of a debt security, the greater its sensitivity to changes in interest rates.
Liquidity risk
Liquidity risk is the risk associated with a lack of marketability of investments which may make it difficult to sell the investment at a desirable time or price. Changing regulatory, market or other conditions or environments (for example, the interest rate or credit environments) may adversely affect the liquidity of the Fund’s investments. The Fund may have to accept a lower selling price for the holding, sell other investments, or forego another, more appealing investment opportunity. Generally, the less liquid the market at the time the Fund sells a portfolio investment, the greater the risk of loss or decline of value to the Fund. A less liquid market can lead to an increase in Fund redemptions, which may negatively impact Fund performance and net asset value per share, including, for example, if the Fund is forced to sell securities in a down market.
Mortgage- and other asset-backed securities risk
The value of any mortgage-backed and other asset-backed securities held by the Fund may be affected by, among other things, changes or perceived changes in: interest rates; factors concerning the interests in and structure of the issuer or the originator of the mortgages or other assets; the creditworthiness of the entities that provide any supporting letters of credit, surety bonds or other credit enhancements; or the market’s assessment of the quality of underlying assets. Payment of principal and interest on some mortgage-backed securities (but not the market value of the securities themselves) may be guaranteed by the full faith and credit of a particular U.S. Government agency, authority, enterprise or instrumentality, and some, but not all, are also insured or guaranteed by the U.S. Government. Mortgage-backed securities issued by non-governmental issuers (such as commercial banks, savings and loan institutions, private mortgage insurance companies, mortgage bankers and other secondary market issuers) may entail greater risk than obligations guaranteed by the U.S. Government. Mortgage- and other asset-backed securities are subject to prepayment risk, which is the possibility that the underlying mortgage or other asset may be refinanced or prepaid prior to maturity during periods of declining or low interest rates, causing the Fund to have to reinvest the money received in securities that have lower yields. Rising or high interest rates tend to extend the duration of mortgage- and other asset-backed securities, making their prices more volatile and more sensitive to changes in interest rates.
Note 10. Subsequent events
Management has evaluated the events and transactions that have occurred through the date the financial statements were issued and noted no items requiring adjustment of the financial statements or additional disclosure.
Note 11. Information regarding pending and settled legal proceedings
Ameriprise Financial and certain of its affiliates have historically been involved in a number of legal, arbitration and regulatory proceedings, including routine litigation, class actions, and governmental actions, concerning matters arising in connection with the conduct of their business activities. Ameriprise Financial believes that the Fund is not currently the subject of, and that neither Ameriprise Financial nor any of its affiliates are the subject of, any pending legal, arbitration or regulatory proceedings that are likely to have a material adverse effect on the Fund or the ability of Ameriprise Financial or its affiliates
Multi-Manager Total Return Bond Strategies Fund | Annual Report 2018
| 85 |
Notes to Financial Statements (continued)
August 31, 2018
to perform under their contracts with the Fund. Ameriprise Financial is required to make quarterly (10-Q), annual (10-K) and, as necessary, 8-K filings with the Securities and Exchange Commission (SEC) on legal and regulatory matters that relate to Ameriprise Financial and its affiliates. Copies of these filings may be obtained by accessing the SEC website at www.sec.gov.
There can be no assurance that these matters, or the adverse publicity associated with them, will not result in increased Fund redemptions, reduced sale of Fund shares or other adverse consequences to the Fund. Further, although we believe proceedings are not likely to have a material adverse effect on the Fund or the ability of Ameriprise Financial or its affiliates to perform under their contracts with the Fund, these proceedings are subject to uncertainties and, as such, we are unable to estimate the possible loss or range of loss that may result. An adverse outcome in one or more of these proceedings could result in adverse judgments, settlements, fines, penalties or other relief that could have a material adverse effect on the consolidated financial condition or results of operations of Ameriprise Financial.
| 86 | Multi-Manager Total Return Bond Strategies Fund | Annual Report 2018 |
Report of Independent Registered Public Accounting Firm
To the Board of Trustees of Columbia Funds Series Trust I and Shareholders of Multi-Manager Total Return Bond Strategies Fund
Opinion on the Financial Statements
We have audited the accompanying statement of assets and liabilities, including the portfolio of investments, of Multi-Manager Total Return Bond Strategies Fund (one of the funds constituting Columbia Funds Series Trust I, hereafter referred to as the “Fund”) as of August 31, 2018, the related statement of operations for the year ended August 31, 2018, the statement of changes in net assets for each of the two years in the period ended August 31, 2018, including the related notes, and the financial highlights for each of the periods indicated therein (collectively referred to as the “financial statements”). In our opinion, the financial statements present fairly, in all material respects, the financial position of the Fund as of August 31, 2018, the results of its operations for the year then ended, the changes in its net assets for each of the two years in the period ended August 31, 2018 and the financial highlights for each of the periods indicated therein in conformity with accounting principles generally accepted in the United States of America.
Basis for Opinion
These financial statements are the responsibility of the Fund’s management. Our responsibility is to express an opinion on the Fund’s financial statements based on our audits. We are a public accounting firm registered with the Public Company Accounting Oversight Board (United States) (“PCAOB”) and are required to be independent with respect to the Fund in accordance with the U.S. federal securities laws and the applicable rules and regulations of the Securities and Exchange Commission and the PCAOB.
We conducted our audits of these financial statements in accordance with the standards of the PCAOB. Those standards require that we plan and perform the audit to obtain reasonable assurance about whether the financial statements are free of material misstatement, whether due to error or fraud.
Our audits included performing procedures to assess the risks of material misstatement of the financial statements, whether due to error or fraud, and performing procedures that respond to those risks. Such procedures included examining, on a test basis, evidence regarding the amounts and disclosures in the financial statements. Our audits also included evaluating the accounting principles used and significant estimates made by management, as well as evaluating the overall presentation of the financial statements. Our procedures included confirmation of securities owned as of August 31, 2018, by correspondence with the custodian, transfer agent, agent banks, and brokers; when replies were not received from brokers, we performed other audit procedures. We believe that our audits provide a reasonable basis for our opinion.
/s/PricewaterhouseCoopers LLP
Minneapolis, Minnesota
October 22, 2018
We have served as the auditor of one or more investment companies within the Columbia Funds Complex since 1977.
Multi-Manager Total Return Bond Strategies Fund | Annual Report 2018
| 87 |
Shareholders elect the Board that oversees the Fund’s operations. The Board appoints officers who are responsible for day-to-day business decisions based on policies set by the Board. The following table provides basic biographical information about the Fund’s Trustees, including their principal occupations during the past five years, although specific titles for individuals may have varied over the period. The year set forth beneath Length of Service in the table below is the year in which the Trustee was first appointed or elected as Trustee to any Fund currently in the Columbia Funds Complex or a predecessor thereof. Under current Board policy, members serve terms of indefinite duration.
Independent trustees
| Name, address, year of birth | Position held with the Trust and length of service | Principal occupation(s) during the past five years and other relevant professional experience | Number of Funds in the Columbia Fund Complex overseen | Other directorships held by Trustee during the past five years |
Janet Langford Carrig
c/o Columbia Management
Investment Advisers, LLC
225 Franklin Street
Mail Drop BX32 05228
Boston, MA 02110
1957 | Trustee
1996 | Senior Vice President, General Counsel and Corporate Secretary, ConocoPhillips (independent energy company) since September 2007 | 69 | None |
Douglas A. Hacker
c/o Columbia Management
Investment Advisers, LLC
225 Franklin Street
Mail Drop BX32 05228
Boston, MA 02110
1955 | Trustee and Chairman of the Board
1996 | Independent business executive since May 2006; Executive Vice President — Strategy of United Airlines from December 2002 to May 2006; President of UAL Loyalty Services (airline marketing company) from September 2001 to December 2002; Executive Vice President and Chief Financial Officer of United Airlines from July 1999 to September 2001 | 69 | Spartan Nash Company, (food distributor); Nash Finch Company (food distributor) from 2005 to 2013; Aircastle Limited (aircraft leasing); SeaCube Container Leasing Ltd. (container leasing) from 2010 to 2013; and Travelport Worldwide Limited (travel information technology) |
Nancy T. Lukitsh
c/o Columbia Management
Investment Advisers, LLC
225 Franklin Street
Mail Drop BX32 05228
Boston, MA 02110
1956 | Trustee
2011 | Senior Vice President, Partner and Director of Marketing, Wellington Management Company, LLP (investment adviser) from 1997 to 2010; Chair, Wellington Management Portfolios (commingled non-U.S. investment pools) from 2007 to 2010; Director, Wellington Trust Company, NA and other Wellington affiliates from 1997 to 2010 | 69 | None |
David M. Moffett
c/o Columbia Management
Investment Advisers, LLC
225 Franklin Street
Mail Drop BX32 05228
Boston, MA 02110
1952 | Trustee
2011 | Retired. Consultant to Bridgewater and Associates | 69 | Director, CSX Corporation (transportation suppliers); Genworth Financial, Inc. (financial and insurance products and services); PayPal Holdings Inc. (payment and data processing services); Trustee, University of Oklahoma Foundation; former Director, eBay Inc. (online trading community), 2007-2015; and former Director, CIT Bank, CIT Group Inc. (commercial and consumer finance), 2010-2016 |
| 88 | Multi-Manager Total Return Bond Strategies Fund | Annual Report 2018 |
TRUSTEES AND OFFICERS (continued)
Independent trustees (continued)
| Name, address, year of birth | Position held with the Trust and length of service | Principal occupation(s) during the past five years and other relevant professional experience | Number of Funds in the Columbia Fund Complex overseen | Other directorships held by Trustee during the past five years |
John J. Neuhauser
c/o Columbia Management
Investment Advisers, LLC
225 Franklin Street
Mail Drop BX32 05228
Boston, MA 02110
1943 | Trustee
1984 | President, Saint Michael’s College since August 2007; Director or Trustee of several non-profit organizations, including University of Vermont Medical Center; Academic Vice President and Dean of Faculties, Boston College from August 1999 to October 2005; University Professor, Boston College from November 2005 to August 2007 | 69 | Liberty All-Star Equity Fund and Liberty All- Star Growth Fund (closed-end funds) |
Patrick J. Simpson
c/o Columbia Management
Investment Advisers, LLC
225 Franklin Street
Mail Drop BX32 05228
Boston, MA 02110
1944 | Trustee
2000 | Of Counsel, Perkins Coie LLP (law firm) since 2015; Partner, Perkins Coie LLP from 1988 to 2014 | 69 | None |
Anne-Lee Verville
c/o Columbia Management
Investment Advisers, LLC
225 Franklin Street
Mail Drop BX32 05228
Boston, MA 02110
1945 | Trustee
1998 | Retired. General Manager, Global Education Industry from 1994 to 1997, President – Application Systems Division from 1991 to 1994, Chief Financial Officer – US Marketing & Services from 1988 to 1991, and Chief Information Officer from 1987 to 1988, IBM Corporation (computer and technology) | 69 | Enesco Group, Inc. (producer of giftware and home and garden decor products) from 2001 to 2006 |
Consultants to the Independent Trustees*
| Name, address, year of birth | Position held with the Trust and length of service | Principal occupation(s) during the past five years and other relevant professional experience | Number of Funds in the Columbia Funds complex overseen | Other directorships held by Trustee during the past five years |
J. Kevin Connaughton
c/o Columbia
Management Investment
Advisers, LLC,
225 Franklin Street
Mail Drop BX32 05228,
Boston, MA 02110
1964 | Independent Trustee Consultant
2016 | Independent Trustee Consultant, Columbia Funds since March 2016; Adjunct Professor of Finance, Bentley University since November 2017; Managing Director and General Manager of Mutual Fund Products, Columbia Management Investment Advisers, LLC from May 2010 to February 2015; President, Columbia Funds from 2009 to 2015; and senior officer of Columbia Funds and affiliated funds from 2003 to 2015 | 69 | Director, The Autism Project since March 2015; former Trustee, New Century Portfolios, March 2015-December 2017; formerly on Board of Governors, Gateway Healthcare, January 2016 – December 2017 |
Natalie A. Trunow
c/o Columbia
Management Investment
Advisers, LLC,
225 Franklin Street
Mail Drop BX32 05228,
Boston, MA 02110
1967 | Independent Trustee Consultant
2016 | Independent Trustee Consultant, Columbia Funds since September 2016; Chief Executive Officer, Millennial Portfolio Solutions LLC (asset management and consulting services) since January 2016; Director of Investments, Casey Family Programs from April 2016 to September 2016; Senior Vice President and Chief Investment Officer, Calvert Investments from August 2008 to January 2016; Section Head and Portfolio Manager, General Motors Asset Management from June 1997 to August 2008 | 69 | Director, Health Services for Children with Special Needs, Inc.; Director, Guidewell Financial Solutions |
| * | J. Kevin Connaughton was appointed consultant to the Independent Trustees effective March 1, 2016. Natalie A. Trunow was appointed consultant to the Independent Trustees effective September 1, 2016. Shareholders of the Funds are expected to be asked to elect each of Mr. Connaughton and Ms. Trunow as a Trustee at a future shareholder meeting. |
Multi-Manager Total Return Bond Strategies Fund | Annual Report 2018
| 89 |
TRUSTEES AND OFFICERS (continued)
Interested trustee affiliated with Investment Manager*
| Name, address, year of birth | Position held with the Trust and length of service | Principal occupation(s) during the past five years and other relevant professional experience | Number of Funds in the Columbia Funds Complex overseen | Other directorships held by Trustee during the past five years |
William F. Truscott
c/o Columbia Management
Investment Advisers, LLC
225 Franklin Street
Boston, MA 02110
1960 | Trustee
2012 | Chairman of the Board and President, Columbia Management Investment Advisers, LLC since May 2010 and February 2012, respectively; Chief Executive Officer, Global Asset Management, Ameriprise Financial, Inc. since September 2012 (previously Chief Executive Officer, U.S. Asset Management & President, Annuities, May 2010-September 2012); Director and Chief Executive Officer, Columbia Management Investment Distributors, Inc. since May 2010 and February 2012, respectively; Chairman of the Board and Chief Executive Officer, RiverSource Distributors, Inc. since 2006; Director, Threadneedle Asset Management Holdings, SARL since 2014; President and Chief Executive Officer, Ameriprise Certificate Company, 2006-August 2012 | 193 | Chairman of the Board, Columbia Management Investment Advisers, LLC since May 2010; Director, Columbia Management Investment Distributors, Inc. since May 2010; former Director, Ameriprise Certificate Company, 2006 - January 2013 |
| * | Interested person (as defined under the 1940 Act) by reason of being an officer, director, security holder and/or employee of the Investment Manager or Ameriprise Financial. |
The Statement of Additional Information has additional information about the Fund’s Board members and is available,
without charge, upon request by calling 800.345.6611, contacting your financial intermediary or visiting
investor.columbiathreadneedleus.com.
| 90 | Multi-Manager Total Return Bond Strategies Fund | Annual Report 2018 |
TRUSTEES AND OFFICERS (continued)
The Board has appointed officers who are responsible for day-to-day business decisions based on policies it has established. The officers serve at the pleasure of the Board. The following table provides basic information about the Officers of the Fund, including principal occupations during the past five years, although their specific titles may have varied over the period. In addition to Mr. Truscott, who is Senior Vice President, the Fund’s other officers are:
Name,
address and
year of birth | Position and year
first appointed to
position for any Fund
in the Columbia
Funds complex or a
predecessor thereof | Principal occupation(s) during past five years |
Christopher O. Petersen
5228 Ameriprise
Financial Center
Minneapolis, MN 55474
Born 1970 | President and Principal Executive Officer (2015) | Vice President and Lead Chief Counsel, Ameriprise Financial, Inc. since January 2015 (previously, Vice President and Chief Counsel, January 2010 - December 2014; officer of Columbia Funds and affiliated funds since 2007. |
Michael G. Clarke
225 Franklin Street
Boston, MA 02110
Born 1969 | Treasurer (2011), Chief Financial Officer (2009) and Chief Accounting Officer (2015) | Vice President — Mutual Fund Administration, Columbia Management Investment Advisers, LLC, since May 2010; senior officer of Columbia Funds and affiliated funds since 2002. |
Paul B. Goucher
100 Park Avenue
New York, NY 10017
Born 1968 | Senior Vice President (2011) and Assistant Secretary (2008) | Senior Vice President and Assistant General Counsel, Ameriprise Financial, Inc. since January 2017 (previously, Vice President and Lead Chief Counsel, November 2008 - January 2017 and January 2013 - January 2017, respectively); Vice President, Chief Legal Officer and Assistant Secretary, Columbia Management Investment Advisers, LLC since May 2010. |
Thomas P. McGuire
225 Franklin Street
Boston, MA 02110
Born 1972 | Senior Vice President and Chief Compliance Officer (2012) | Vice President — Asset Management Compliance, Ameriprise Financial, Inc., since May 2010; Chief Compliance Officer, Ameriprise Certificate Company since September 2010. |
Colin Moore
225 Franklin Street
Boston, MA 02110
Born 1958 | Senior Vice President (2010) | Executive Vice President and Global Chief Investment Officer, Ameriprise Financial, Inc., since July 2013; Executive Vice President and Global Chief Investment Officer, Columbia Management Investment Advisers, LLC since July 2013. |
Ryan C. Larrenaga
225 Franklin Street
Boston, MA 02110
Born 1970 | Senior Vice President (2017), Chief Legal Officer (2017) and Secretary (2015) | Vice President and Chief Counsel, Ameriprise Financial, Inc. since August 2018 (previously, Vice President and Group Counsel, August 2011 - August 2018); officer of Columbia Funds and affiliated funds since 2005. |
Michael E. DeFao
225 Franklin Street
Boston, MA 02110
Born 1968 | Vice President (2011) and Assistant Secretary (2010) | Vice President and Chief Counsel, Ameriprise Financial, Inc. since May 2010. |
Amy Johnson
5228 Ameriprise
Financial Center
Minneapolis, MN 55474
Born 1965 | Vice President (2006) | Managing Director and Global Head of Operations, Columbia Management Investment Advisers, LLC since April 2016 (previously Managing Director and Chief Operating Officer, 2010 - 2016). |
Lyn Kephart-Strong
5228 Ameriprise
Financial Center
Minneapolis, MN 55474
Born 1960 | Vice President (2015) | President, Columbia Management Investment Services Corp. since October 2014; Vice President & Resolution Officer, Ameriprise Trust Company since August 2009. |
Multi-Manager Total Return Bond Strategies Fund | Annual Report 2018
| 91 |
Board Consideration and Approval of Management and Subadvisory Agreements
On June 12, 2018, the Board of Trustees (the Board) and the Trustees who are not interested persons (as defined in the Investment Company Act of 1940) (the Independent Trustees) of Columbia Funds Series Trust I (the Trust) unanimously approved the continuation of the Management Agreement (the Management Agreement) with Columbia Management Investment Advisers, LLC (the Investment Manager) and the Subadvisory Agreements and, to more closely conform the Subadvisory Agreements to a revised form of subadvisory agreement with the same material terms, an amendment to the Subadvisory Agreements (together, the Subadvisory Agreements) between the Investment Manager and Loomis, Sayles & Company, L.P., PGIM, Inc. and TCW Investment Management Company LLC (the Subadvisers) with respect to Multi-Manager Total Return Bond Strategies Fund (the Fund), a series of the Trust. As detailed below, the Board’s Advisory Fees and Expenses Committee (the Committee) and the Board met on multiple occasions to review and discuss, among themselves, with the management team of the Investment Manager and with an independent fee consultant, materials provided by the Investment Manager, the independent fee consultant and others before determining to approve the continuation of the Management Agreement and the Subadvisory Agreements (collectively, the Agreements).
In connection with their deliberations regarding the continuation of the Management Agreement and the Subadvisory Agreements, the Committee and the Board evaluated materials requested from the Investment Manager regarding the Fund and the Agreements, and discussed these materials with representatives of the Investment Manager at Committee meetings held on March 6, 2018, April 26, 2018 and June 11, 2018 and at Board meetings held on March 7, 2018 and June 12, 2018. In addition, the Board and its various committees consider matters bearing on the Agreements at other meetings throughout the year and in prior years and meet regularly with senior management of the Trust and the Investment Manager. Through the Board’s Investment Oversight Committees, Trustees also meet with selected portfolio managers of the funds the Trustees oversee and with other investment personnel at various times throughout the year. The Committee and the Board also consulted with the independent fee consultant, Fund counsel and the Independent Trustees’ independent legal counsel, who advised on various matters with respect to the Committee’s and the Board’s considerations and otherwise assisted the Committee and the Board in their deliberations. On June 11, 2018, the Committee recommended that the Board approve the continuation of the Management Agreement and the Subadvisory Agreements. On June 12, 2018, the Board, including the Independent Trustees, voting separately, unanimously approved the continuation of the Management Agreement and the Subadvisory Agreements for the Fund.
The Committee and the Board considered all information that they, their legal counsel or the Investment Manager believed reasonably necessary to evaluate and to determine whether to recommend for approval or approve the continuation of the Management Agreement and the Subadvisory Agreements. The information and factors considered by the Committee and the Board in recommending for approval or approving the continuation of the Management Agreement and the Subadvisory Agreements for the Fund included the following:
| • | Information on the investment performance of the Fund relative to the performance of a group of mutual funds determined to be comparable to the Fund by an independent third-party data provider, as well as performance relative to benchmarks; |
| • | Information on the Fund’s management fees and total expenses, including information comparing the Fund’s expenses to those of a group of comparable mutual funds, as determined by the independent third-party data provider; |
| • | The Investment Manager’s agreement to contractually limit or cap total operating expenses for the Fund through December 31, 2019 so that total operating expenses (excluding certain fees and expenses, such as transaction costs and certain other investment related expenses, interest, taxes, acquired fund fees and expenses, and infrequent and/or unusual expenses) would not exceed a specified annual rate, as a percentage of the Fund’s net assets; |
| • | The terms and conditions of the Agreements; |
| • | The subadvisory fees payable by the Investment Manager under the Subadvisory Agreements; |
| • | The current and proposed terms and conditions of other agreements and arrangements with affiliates of the Investment Manager relating to the operations of the Fund, including agreements with respect to the provision of distribution, transfer agency and shareholder services to the Fund; |
| 92 | Multi-Manager Total Return Bond Strategies Fund | Annual Report 2018 |
Board Consideration and Approval of Management and Subadvisory Agreements (continued)
| • | Descriptions of various functions performed by the Investment Manager and the Subadvisers under the Agreements, including portfolio management and portfolio trading practices; |
| • | Information regarding the management fees of similarly-managed portfolios of other clients of the Investment Manager, including institutional accounts and collective trusts; |
| • | Information regarding the reputation, regulatory history and resources of the Investment Manager and Subadvisers, including information regarding senior management, portfolio managers and other personnel; |
| • | Information regarding the capabilities of the Investment Manager and the Subadvisers with respect to compliance monitoring services, including an assessment of the Investment Manager’s and the Subadvisers’ compliance systems by the Fund’s Chief Compliance Officer; and |
| • | The profitability to the Investment Manager and its affiliates from their relationships with the Fund. |
Nature, extent and quality of services provided under the Agreements
The Committee and the Board considered the nature, extent and quality of services provided to the Fund by the Investment Manager, the Subadvisers and the Investment Manager’s affiliates under the Agreements and under separate agreements for the provision of transfer agency and shareholder services, and the resources dedicated to the Fund and the other Columbia Funds by the Investment Manager, the Subadvisers and the Investment Manager’s affiliates. The Committee and the Board considered, among other things, the Investment Manager’s ability to attract, motivate and retain highly qualified research, advisory and supervisory investment professionals (including compensation programs for personnel involved in fund management, reputation and other attributes), the portfolio management services provided by those investment professionals, and the quality of the Investment Manager’s and the Subadvisers’ investment research capabilities and trade execution services. The Committee and the Board also considered the potential benefits to shareholders of investing in a mutual fund that is part of a fund complex offering exposure to a variety of asset classes and investment disciplines and providing a variety of fund and shareholder services.
The Committee and the Board also considered the professional experience and qualifications of the senior personnel of the Investment Manager and the Subadvisers, which included consideration of the Investment Manager’s and the Subadvisers’ experience with similarly-structured funds. The Committee and the Board noted the compliance programs of and the compliance-related resources provided to the Fund by the Investment Manager and its affiliates and the resources dedicated by the Investment Manager and its affiliates to risk management, and considered the Investment Manager’s ability to provide administrative services to the Fund and coordinate the activities of the Fund’s other service providers. The Board also noted that the Board had approved each Subadviser’s code of ethics and compliance program, and that the Chief Compliance Officer of the Funds reports to the Trustees on each Subadviser’s compliance program.
The Committee and the Board considered the diligence and selection process undertaken by the Investment Manager to select each Subadviser, including the Investment Manager’s rationale for recommending the continuation of the Subadvisory Agreements, and the process for monitoring each Subadviser’s ongoing performance of services for the Fund. As part of these deliberations, the Committee and the Board considered the ability of the Investment Manager, subject to the approval of the Board, to modify or enter into new subadvisory agreements without a shareholder vote pursuant to an exemptive order of the Securities and Exchange Commission. The Committee and the Board also considered the scope of services provided to the Fund by the Investment Manager that are distinct from and in addition to those provided by the Subadvisers, including cash flow management, treasury services, risk oversight, investment oversight and Subadviser selection, oversight and transition management. After reviewing these and related factors, the Committee and the Board concluded, within the context of their overall conclusions, that the nature, extent and quality of the services provided to the Fund under the Agreements supported the continuation of the Management Agreement and the Subadvisory Agreements.
Multi-Manager Total Return Bond Strategies Fund | Annual Report 2018
| 93 |
Board Consideration and Approval of Management and Subadvisory Agreements (continued)
Investment performance
The Committee and the Board reviewed information about the performance of the Fund over various time periods, including performance information relative to benchmarks, information that compared the performance of the Fund to the performance of a group of comparable mutual funds as determined by the independent third-party data provider and information and analysis provided by the independent fee consultant. The Committee and the Board also reviewed a description of the third party’s methodology for identifying the Fund’s peer groups for purposes of performance and expense comparisons.
The Committee and the Board noted that, through December 31, 2017, the Fund’s performance was in the thirty-eighth, thirty-third and thirty-seventh percentile (where the best performance would be in the first percentile) of its category selected by the independent third-party data provider for the purposes of performance comparisons for the one-, three- and five-year periods, respectively.
The Committee and the Board also considered the Investment Manager’s and Subadvisers’ performance and reputation generally, the Investment Manager’s evaluation of each Subadviser’s contribution to the Fund’s broader investment mandate, the Investment Manager’s historical responsiveness to Board concerns about performance, and the Investment Manager’s willingness to take steps intended to improve performance. After reviewing these and related factors, the Committee and the Board concluded, within the context of their overall conclusions, that the performance of the Fund, the Investment Manager and the Subadvisers were sufficient, in light of other considerations, to support the continuation of the Management Agreement and the Subadvisory Agreements.
Investment Management fee rates and other expenses
The Committee and the Board considered the management fees charged to the Fund under the Management Agreement and the Subadvisory Agreements, as well as the total expenses incurred by the Fund. In assessing the reasonableness of the fees under the Management Agreement, the Committee and the Board considered, among other information, the Fund’s total expense ratio as a percentage of average daily net assets. The Committee and the Board considered data provided by the independent third-party data provider and the independent fee consultant. The Committee and the Board noted that, as of December 31, 2017, the Fund’s actual management fee and net total expense ratio were ranked in the fifth and second quintiles, respectively, (where the lowest fees and expenses would be in the first quintile) against the Fund’s expense universe as determined by the independent third-party data provider for purposes of expense comparison. The Committee and the Board also considered the fees that the Subadvisers charge to their other clients, and noted that the Investment Manager pays the fees of the Subadvisers. The Committee and the Board also took into account the fee waiver and expense limitation arrangements agreed to by the Investment Manager, as noted above.
The Committee and the Board also received and considered information about the management fees charged by the Investment Manager to institutional accounts. In considering the fees charged to those accounts, the Committee and the Board took into account, among other things, the Investment Manager’s representations about the differences between managing mutual funds as compared to other types of accounts, including differences in the services provided, differences in the risk profile of such business for the Investment Manager and the additional resources required to manage mutual funds effectively. The Committee and the Board also received and considered information about the fees charged by the Investment Manager for sub-advisory services it provides to comparable unaffiliated funds. In evaluating the Fund’s management fees, the Committee and the Board also took into account the demands, complexity and quality of the investment management of the Fund.
After reviewing these and related factors, the Committee and the Board concluded, within the context of their overall conclusions, that the management fee rates and expenses of the Fund, in light of other considerations, supported the continuation of the Management Agreement and the Subadvisory Agreements.
Costs of Services Provided and Profitability
The Committee and the Board also took note of the costs the Investment Manager and its affiliates incur in connection with the services provided and the profitability to the Investment Manager and its affiliates from their relationships with the Fund.
| 94 | Multi-Manager Total Return Bond Strategies Fund | Annual Report 2018 |
Board Consideration and Approval of Management and Subadvisory Agreements (continued)
The Committee and the Board also considered the compensation directly or indirectly received by the Investment Manager’s affiliates in connection with their relationships with the Fund. The Committee and the Board reviewed information provided by management as to the profitability to the Investment Manager and its affiliates of their relationships with the Fund, including with respect to funds for which unaffiliated subadvisers provide services, information about the allocation of expenses used to calculate profitability, and comparisons of profitability levels realized in 2017 to profitability levels realized in 2016. When reviewing profitability, the Committee and the Board also considered court cases in which adviser profitability was an issue in whole or in part, the performance of similarly managed funds, the performance of the Fund, and the expense ratio of the Fund. In addition, the Committee and the Board considered information provided by the Investment Manager regarding the Investment Manager’s financial condition and comparing its profitability to that of other asset management firms that are, or are subsidiaries of, publicly traded companies. In this regard, the Committee and the Board also considered data provided by the independent fee consultant. Because the Subadvisory Agreements were negotiated at arms-length by the Investment Manager, which is responsible for payments to the Subadvisers thereunder, the Committee and the Board did not consider the profitability to each Subadviser of its relationship with the Fund.
After reviewing these and related factors, the Committee and the Board concluded, within the context of their overall conclusions, that the costs of services provided and the profitability to the Investment Manager and its affiliates from their relationships with the Fund supported the continuation of the Management Agreement and the Subadvisory Agreements.
Economies of scale
The Committee and the Board considered the potential existence of economies of scale in the provision by the Investment Manager of services to the Fund, to groups of related funds, and to the Investment Manager’s investment advisory clients as a whole, and whether those economies of scale were shared with the Fund through breakpoints in investment management fees or other means, such as expense limitation arrangements and additional investments by the Investment Manager in investment, trading, compliance and other resources. The Committee and the Board noted that the management fee schedules for the Fund contained breakpoints that would reduce the fee rate on assets above specified threshold levels.
The Committee and the Board noted that the breakpoints, if any, in the Subadvisory Agreements did not occur at the same levels as the breakpoints in the Management Agreement. The Committee and the Board noted that absent a shareholder vote, the Investment Manager would bear any increase in fees payable under the Subadvisory Agreements. The Committee and the Board also noted the potential challenges of seeking to tailor the Management Agreement breakpoints to those of a subadvisory agreement in this context, and the effect that capacity constraints on a subadviser’s ability to manage assets could potentially have on the ability of the Investment Manager to achieve economies of scale, as new subadvisers may need to be added as the Fund grows, increasing the Investment Manager’s cost of compensating and overseeing the Fund’s subadvisers.
In considering these matters, the Committee and the Board also considered the costs of the services provided and the profitability to the Investment Manager and its affiliates from their relationships with the Fund, as noted above. After reviewing these and related factors, the Committee and the Board concluded, within the context of their overall conclusions, that the extent to which any economies of scale were expected to be shared with the Fund supported the continuation of the Management Agreement and the Subadvisory Agreements.
Other benefits to the Investment Manager and Subadvisers
The Committee and the Board received and considered information regarding “fall-out” or ancillary benefits received by the Investment Manager and its affiliates as a result of their relationships with the Fund, such as the engagement of the Investment Manager’s affiliates to provide distribution, transfer agency and shareholder services to the Fund. In this regard, among other matters, the Committee and the Board considered that the Fund’s distributor retains a portion of the distribution fees from the Fund and receives a portion of the sales charges on sales or redemptions of certain classes of shares of the Fund. The Committee and the Board also considered the benefits of research made available to the Investment Manager and the Subadvisers by reason of brokerage commissions generated by the Fund’s securities transactions, and reviewed information about the Investment Manager’s practices with respect to considering brokerage and research services when
Multi-Manager Total Return Bond Strategies Fund | Annual Report 2018
| 95 |
Board Consideration and Approval of Management and Subadvisory Agreements (continued)
allocating portfolio transactions. In this connection, the Board also noted that the amount of research made available to the Investment Manager by reason of brokerage commissions had been declining over time, and may decline further. The Committee and the Board recognized that the Investment Manager’s profitability would be somewhat lower without these benefits.
Conclusion
The Committee and the Board reviewed all of the above considerations in reaching their decisions to recommend or approve the continuation of the Management Agreement and the Subadvisory Agreements. In their deliberations, the Trustees did not identify any particular information that was all-important or controlling, and individual Trustees may have attributed different weights to the various factors. Based on their evaluation of all factors that they deemed to be material, including those factors described above, and assisted by the advice of independent legal counsel, the Board, including the Independent Trustees, voting separately, unanimously approved the continuation of the Management Agreement and the Subadvisory Agreements.
| 96 | Multi-Manager Total Return Bond Strategies Fund | Annual Report 2018 |
The Fund mails one shareholder report to each shareholder address. If you would like more than one report, please call shareholder services at 800.345.6611 and additional reports will be sent to you.
Proxy voting policies and procedures
The policy of the Board of Trustees is to vote the proxies of the companies in which the Fund holds investments consistent with the procedures as stated in the Statement of Additional Information (SAI). You may obtain a copy of the SAI without charge by calling 800.345.6611; contacting your financial intermediary; visiting columbiathreadneedleus.com/investor/; or searching the website of the Securities and Exchange Commission (SEC) at sec.gov. Information regarding how the Fund voted proxies relating to portfolio securities is filed with the SEC by August 31st for the most recent 12-month period ending June 30th of that year, and is available without charge by visiting columbiathreadneedleus.com/investor/, or searching the website of the SEC at sec.gov.
Quarterly schedule of investments
The Fund files a complete schedule of portfolio holdings with the SEC for the first and third quarters of each fiscal year on Form N-Q or Form N-PORT. The Fund’s Form N-Q or Form N-PORT is available on the SEC’s website at sec.gov and may be reviewed and copied at the SEC’s Public Reference Room in Washington, D.C. Information on the operation of the Public Reference Room may be obtained by calling 800.SEC.0330. The Fund’s complete schedule of portfolio holdings, as filed on Form N-Q or Form N-PORT, can also be obtained without charge, upon request, by calling 800.345.6611.
Additional Fund information
For more information about the Fund, please visit columbiathreadneedleus.com/investor/ or call 800.345.6611. Customer Service Representatives are available to answer your questions Monday through Friday from 8 a.m. to 7 p.m. Eastern time.
Fund investment manager
Columbia Management Investment Advisers, LLC
225 Franklin Street
Boston, MA 02110
Fund distributor
Columbia Management Investment Distributors, Inc.
225 Franklin Street
Boston, MA 02110
Fund transfer agent
Columbia Management Investment Services Corp.
Through October 31, 2018:
P.O. Box 8081
Boston, MA 02266-8081
Effective November 1, 2018:
P.O. Box 219104
Kansas City, MO 64121-9104
Multi-Manager Total Return Bond Strategies Fund | Annual Report 2018
| 97 |
Multi-Manager Total Return Bond Strategies Fund
Through October 31, 2018:
P.O. Box 8081
Boston, MA 02266-8081
Effective November 1, 2018:
P.O. Box 219104
Kansas City, MO 64121-9104
Please read and consider the investment objectives, risks, charges and expenses for any fund carefully before investing. For a prospectus and summary prospectus, which contains this and other important information about the Fund, go to
columbiathreadneedleus.com/investor/. The Fund is distributed by Columbia Management Investment Distributors, Inc., member FINRA, and managed by Columbia Management Investment Advisers, LLC.
Columbia Threadneedle Investments (Columbia Threadneedle) is the global brand name of the Columbia and Threadneedle group of companies. All rights reserved.
© 2018 Columbia Management Investment Advisers, LLC.
columbiathreadneedleus .com/investor/

Annual Report
August 31, 2018
Multi-Manager Small Cap Equity Strategies Fund
Not FDIC Insured • No bank guarantee • May lose value
Dear Shareholders,
Volatility exists in financial markets and this is not a comfortable fact of life. How investors deal with this reality, including how they react to short term spikes in volatility as well as to longer periods of increased or decreased volatility, may have a significant impact on their overall investing success.
Too often, investors change their investment strategy based on something that’s happening at a moment in time rather than thinking about how that change in strategy might affect their ability to achieve their longer-term financial goals. Emotion replaces logic and reasoning. Investors may sell in reaction to a market drop (fear or panic), locking in low returns which means they won’t be invested when the market returns, or they invest more at a market peak (greed or conviction), essentially when it is expensive to do so. In both cases, selling and buying at the exact wrong time.
We believe the best outcomes come from a consistent approach to investing. Here are five areas where advisors can help us overcome the tendency to react emotionally as we struggle to make the right choices with our investments:
Long-term focus
The further away long-term goals, aspirations and objectives are, the easier it is to stray away from the goals and priorities that we set out. Advisors help us stay focused on what we want to accomplish.
Discipline through up-and-down markets
Advisors help set rules to prevent us from making rash decisions that we may regret later. Knowing ahead of time what you should do in case of certain situations will help you get through volatile markets and not make emotional decisions.
Tax-awareness
Taxes are one of the biggest drags on investment returns and are critical attributes of investing. Yet few of us take the necessary steps to ease the corrosive effect of taxes. Advisors have tools and knowledge that may help us to manage portfolios more tax-efficiently and keep more of what we earn.
Emotional objectivity
Our emotions are very hard to manage and making investment decisions in an emotional state can lead to exceedingly bad outcomes. An objective advisor can help prevent some of the reactionary mistakes emotions often lead us to.
Education and guidance
The role of the advisor is to teach and guide us toward achieving our financial goals. In terms of working through emotions, guidance is by far the most important component.
By understanding our own behaviors and biases, we can prepare for future challenges. Your success is our priority. Talk to your advisor about how working with Columbia Threadneedle Investments may help you stay the course and position your portfolio for consistent, sustainable outcomes, regardless of market conditions.
Sincerely,
Christopher O. Petersen
President, Columbia Funds
Columbia Funds are distributed by Columbia Management Investment Distributors, Inc., member FINRA, and managed by Columbia Management Investment Advisers, LLC.
© 2018 Columbia Management Investment Advisers, LLC. All rights reserved.
Multi-Manager Small Cap Equity Strategies Fund | Annual Report 2018
| 2 |
| 4 |
| 10 |
| 11 |
| 21 |
| 22 |
| 23 |
| 24 |
| 26 |
| 33 |
| 34 |
| 35 |
| 39 |
| 44 |
Multi-Manager Small Cap Equity Strategies Fund | Annual Report 2018
Investment objective
Multi-Manager Small Cap Equity Strategies Fund (the Fund) seeks long-term capital appreciation.
Portfolio management
BMO Asset Management Corp.
David Corris, CFA
Thomas Lettenberger, CFA
Columbia Management Investment Advisers, LLC
Christian Stadlinger, Ph.D, CFA
Jarl Ginsberg, CFA, CAIA
Conestoga Capital Advisors, LLC
Robert Mitchell
Joseph Monahan, CFA
Dalton, Greiner, Hartman, Maher & Co., LLC
Bruce Geller, CFA
Jeffrey Baker, CFA
Peter Gulli, CFA
Edward Turville, CFA
EAM Investors, LLC
Montie Weisenberger
Travis Prentice
Morningstar style boxTM
The Morningstar Style Box is based on a fund’s portfolio holdings. For equity funds, the vertical axis shows the market capitalization of the stocks owned, and the horizontal axis shows investment style (value, blend, or growth). Information shown is based on the most recent data provided by Morningstar.
© 2018 Morningstar, Inc. All rights reserved. The Morningstar information contained herein: (1) is proprietary to Morningstar and/or its content providers; (2) may not be copied or distributed; and (3) is not warranted to be accurate, complete or timely. Neither Morningstar nor its content providers are responsible for any damages or losses arising from any use of this information.
| Average annual total returns (%) (for the period ended August 31, 2018) |
| | | Inception | 1 Year | 5 Years | Life |
| Class A | 04/20/12 | 25.88 | 12.53 | 14.05 |
| Institutional Class* | 01/03/17 | 26.26 | 12.63 | 14.13 |
| Russell 2000 Index | | 25.45 | 13.00 | 14.46 |
All results shown assume reinvestment of distributions during the period. Returns do not reflect the deduction of taxes that a shareholder may pay on Fund distributions or on the redemption of Fund shares. Performance results reflect the effect of any fee waivers or reimbursements of Fund expenses by Columbia Management Investment Advisers, LLC and/or any of its affiliates. Absent these fee waivers or expense reimbursement arrangements, performance results would have been lower. Effective November 1, 2017, Class Z shares were renamed Institutional Class shares.
The performance information shown represents past performance and is not a guarantee of future results. The investment return and principal value of your investment will fluctuate so that your shares, when redeemed, may be worth more or less than their original cost. Current performance may be lower or higher than the performance information shown. You may obtain performance information current to the most recent month-end by contacting your financial intermediary, visiting columbiathreadneedleus.com/investor/ or calling 800.345.6611.
| * | The returns shown for periods prior to the share class inception date (including returns for the Life of the Fund, if shown, which are since Fund inception) include the returns of the Fund’s oldest share class. These returns are adjusted to reflect any higher class-related operating expenses of the newer share classes, as applicable. Please visit columbiathreadneedleus.com/investor/investment-products/mutual-funds/appended-performance for more information. |
The Russell 2000 Index measures the performance of the small-cap segment of the U.S. equity universe. The Russell 2000 is a subset of the Russell 3000 Index representing approximately 10% of the total market capitalization of that index. It includes the securities of approximately 2,000 of the smallest companies in the Russell 3000 Index based on a combination of their market capitalization and current index membership.
Indices are not available for investment, are not professionally managed and do not reflect sales charges, fees, brokerage commissions, taxes or other expenses of investing. Securities in the Fund may not match those in an index.
| 2 | Multi-Manager Small Cap Equity Strategies Fund | Annual Report 2018 |
Fund at a Glance (continued)
Performance of a hypothetical $10,000 investment (April 20, 2012 — August 31, 2018)
The chart above shows the change in value of a hypothetical $10,000 investment in Class A shares of Multi-Manager Small Cap Equity Strategies Fund during the stated time period, and does not reflect the deduction of taxes that a shareholder may pay on Fund distributions or on the redemption of Fund shares.
| Top 10 holdings (%) (at August 31, 2018) |
| iShares Russell 2000 Growth ETF | 9.2 |
| Ligand Pharmaceuticals, Inc. | 0.9 |
| Omnicell, Inc. | 0.9 |
| Bottomline Technologies de, Inc. | 0.8 |
| Simpson Manufacturing Co., Inc. | 0.8 |
| Neogen Corp. | 0.8 |
| Ciena Corp. | 0.8 |
| Fox Factory Holding Corp. | 0.7 |
| Portland General Electric Co. | 0.7 |
| Hancock Whitney Corp. | 0.7 |
Percentages indicated are based upon total investments (excluding Money Market Funds and derivatives, if any).
For further detail about these holdings, please refer to the section entitled “Portfolio of Investments.”
Fund holdings are as of the date given, are subject to change at any time, and are not recommendations to buy or sell any security.
| Portfolio breakdown (%) (at August 31, 2018) |
| Common Stocks | 88.2 |
| Exchange-Traded Funds | 8.9 |
| Money Market Funds | 2.9 |
| Total | 100.0 |
Percentages indicated are based upon total investments and exclude investments in derivatives, if any. The Fund’s portfolio composition is subject to change.
| Equity sector breakdown (%) (at August 31, 2018) |
| Consumer Discretionary | 10.9 |
| Consumer Staples | 2.5 |
| Energy | 4.4 |
| Financials | 18.6 |
| Health Care | 14.8 |
| Industrials | 18.2 |
| Information Technology | 15.7 |
| Materials | 4.6 |
| Real Estate | 5.6 |
| Telecommunication Services | 0.8 |
| Utilities | 3.9 |
| Total | 100.0 |
Percentages indicated are based upon total equity investments. The Fund’s portfolio composition is subject to change.
Multi-Manager Small Cap Equity Strategies Fund | Annual Report 2018
| 3 |
Manager Discussion of Fund Performance
The Fund is managed by four independent money management firms and by Columbia Management and each invests a portion of the portfolio’s assets. As of August 31, 2018, Dalton, Greiner, Harman, Maher & Co., LLC (DGHM), EAM Investors, LLC (EAM), Conestoga Capital Advisors LLC (Conestoga), BMO Asset Corp. (BMO) and Columbia Management (CMIA) managed approximately 20%, 10%, 20%, 20% and 30% of the portfolio, respectively.
For the 12-month period that ended August 31, 2018, the Fund’s Class A shares returned 25.88% excluding sales charges. The Fund outperformed its benchmark, the Russell 2000 Index, which returned 25.45% over the same period. Individual stock selection and sector allocation among the Fund’s managers generally accounted for the relative results.
Small cap equities outpaced larger cap counterparts amid strong U.S. economy
Small cap equities, particularly those of growth-oriented companies, performed quite strongly during the period, benefiting from the tailwinds of strong U.S. economic growth, healthy corporate earnings, corporate tax cuts and ongoing supportive monetary policy. Larger capitalization stocks and non-U.S. stocks struggled to keep pace, as investors appeared to lose confidence in the “synchronized” global economic growth theme that had previously supported markets. Further, the U.S. dollar strengthened during the period, which may have dampened enthusiasm for larger cap multi-nationals and non-U.S. stocks.
U.S. tax reform had an outsized effect on small cap equities because U.S. small cap companies on average had higher tax rates and usually have a higher percentage of their business in the U.S., therefore benefiting more from a lower tax structure. In addition, lower tax rates have the effect of raising both profit margins and cash flows, with some portion of that increase typically being used to reinvest in the business. This was perceived as a particular benefit to smaller companies that have more of a domestically-focused business. Concerns about geopolitics, tariffs and trade wars also had less effect on small cap equities than on their larger cap counterparts because smaller companies tend to have more revenue being sourced from the U.S. economy. All that said, the period was not a consistently upward market for small cap stocks. Uncertainty regarding the U.S. political agenda, inflation trends, interest rates and global macro issues led to leadership changes among styles and sectors, driving what may be characterized as choppy gains during the period.
Within the small cap universe, as across the capitalization spectrum, growth stocks sharply outperformed value stocks. For the period as a whole, there was also a wide dispersion of returns across sectors of the benchmark. Health care, information technology, consumer discretionary and energy posted strong results, while utilities, real estate, materials and telecommunication services posted positive returns but significantly lagged the benchmark.
Individual stock selection impacted Fund performance most
DGHM: Our portion of the Fund underperformed the benchmark, attributable to both stock selection and sector allocation. Stock selection in the health care, real estate and consumer staples sectors detracted most from our portion of the Fund’s results. Having an underweight in health care, which was the strongest sector in the benchmark during the period, and having overweights in real estate and financials, which significantly lagged the benchmark during the period, also hurt. Having a position in cash during a period when the benchmark rallied further dampened relative results. These detractors were partially offset by effective stock selection in the basic materials, retail/apparel and transportation market segments, which contributed positively.
Individual positions that disappointed most during the period were Colony Capital, ABM Industries and Edgewell Personal Care. Diversified real estate investment trust Colony Capital reported worse than expected cash flow resulting in a 60% dividend reduction. Also, while asset sales were on track, the company was unable to raise new funds and poorly underwrote some real estate investments bought from Northstar Realty. Based on our view that it will take a long time to reposition the company, we decided to exit the position. ABM Industries, a facilities service provider, reported inconsistent results. While we liked the defensive nature of the business, we grew concerned about poor execution, rising labor costs and weak free cash flow, so we sold the position. Shares of personal care product manufacturer Edgewell Personal Care declined after reporting a sales shortfall even amid better earnings. We became concerned about the competitive dynamics in the razor business, and thus decided to sell the position.
| 4 | Multi-Manager Small Cap Equity Strategies Fund | Annual Report 2018 |
Manager Discussion of Fund Performance (continued)
The individual positions in our portion of the Fund’s portfolio that contributed most positively were American Eagle Outfitters, WPX Energy and Greenhill & Co. American Eagle Outfitters, a leading retailer targeting the 15 to 25 year old consumer, posted results that were better than its peers, especially in its Aerie division. WPX Energy, a North American shale energy producer, benefited from higher oil prices. The company also announced what the market viewed as value enhancing moves to spin off its coal assets and split the company between exploration and production and midstream operations. Greenhill & Co, a mergers and acquisitions advisory firm, reported record quarterly results, as global merger and acquisition activity heightened.
EAM: Our portion of the Fund outperformed the benchmark mostly due to effective stock selection, while sector allocation effects added further value. Stock selection in health care, information technology and consumer discretionary contributed most positively. Having an underweight to real estate, which lagged the benchmark during the period, and having an overweight to health care, which was the strongest sector in the benchmark during the period, also helped. The only sector to detract from our portion of the Fund’s relative results during the period was energy. While stock selection within energy added value, having an underweighted allocation to this strongly performing sector dampened relative results.
From a risk attribution perspective, our portion of the Fund’s outperformance of the benchmark can be explained by positive management of stock specific risk, particularly within the health care and information technology sectors. From a factors perspective, exposure to relative price strength, or medium-term momentum, provided a positive tailwind during the period. On the downside, overall market volatility and underexposure to higher return on equity stocks detracted.
Positions in Nektar Therapeutics, Tandem Diabetes and Madrigal Pharmaceuticals were top contributors to our portion of the Fund’s results. Nektar Therapeutics is a biopharmaceutical company that develops medicines in the areas of immunology, immune-oncology (IO) and pain. The stock had performed well, but we then exited the position in May 2018 on a negative shift in investor sentiment toward pure IO combination approaches, which could directly impact data evaluation of one of the company’s products. The stock then pulled back significantly on Phase II trial data that did not meet expectations, and thus the timing of our sale proved to be especially prudent, adding to the relative value of the name. Tandem Diabetes is an insulin pump company, which was fueled during the period by favorable competitive dynamics, international expansion and key new product developments. Madrigal Pharmaceuticals is a clinical-stage biopharmaceutical company. It benefited during the period from follow-through from positive Phase II trial data for a drug treating fatty liver disease, which could be a significant market opportunity for the company.
The biggest individual detractors from our portion of the Fund’s results during the period were ImmunoGen, ViewRay and KEMET. ImmunoGen is a biotechnology company focused on the development of antibody-drug conjugate therapeutics for the treatment of cancer. Its shares declined on safety concerns for its lead leukemia drug, and we sold the position. ViewRay is a radiation oncology company. Its weakness during the period can be attributed to mixed financial results and to concerns regarding system placement timing, revenue recognition and overall lackluster guidance given growth expectations. We continued to hold the position in our portion of the Fund at the end of the period. KEMET is a manufacturer of passive electronic components, initially bought for upside potential coming from synergies from its acquisition of TOKIN and on our favorable view of the refinancing of the company’s senior debt. However, we sold the position in November 2017, as its revenue was guided down.
Conestoga: Our portion of the Fund outperformed the benchmark during the period due primarily to stock selection. Sector allocation also added to relative returns, albeit more modestly.
More specifically, stock selection was strongest in the information technology, industrials and health care sectors. Having overweights in information technology and industrials, which were among the best performers in the benchmark during the period, also helped. Only partially offsetting these positive contributors was our portion of the Fund’s single financials sector holding, which underperformed the benchmark during the period. However, this was more than offset by the positive effect of being underweight this lagging sector. The only significant detractor from relative results was having a position in cash during an annual period when the benchmark rallied.
The biggest individual contributors to our portion of the Fund’s results were software provider Bottomline Technologies, drug developer Ligand Pharmaceuticals and construction materials manufacturer Trex Company. Bottomline Technologies saw its subscription and transaction revenues grow. Also, the company recorded significant bookings growth and showed progress in signing up new customers to its more profitable vendor pay model. Ligand Pharmaceuticals had robust financial results that
Multi-Manager Small Cap Equity Strategies Fund | Annual Report 2018
| 5 |
Manager Discussion of Fund Performance (continued)
included better than expected revenue and earnings growth. The company also added partnerships more quickly than expected, particularly for its OmniAb platform to develop human therapeutic antibodies. In addition, Ligand Pharmaceuticals announced a partnership for its internally developed diabetes program. During the period, Trex Company performed well primarily due to a significant acceleration of organic growth. In our view, the reasons behind its strong growth are the company’s best-of-breed products, its strong support of the channel that trains its installers via a Trex university the company established in 2017, and a shift in the market away from wood decks to composite materials.
Positions in Healthcare Services Group, WageWorks and Westwood Holding Group detracted most from our portion of the Fund’s results. Healthcare Services Group provides housekeeping, laundry, linen, facility maintenance and food services to the health care industry. The catalyst for its shares’ decline was a downgrade of the stock by a sell-side firm. Its call on the stock was based on 2018 being a period of digestion of several large contracts and concerns about customer credit quality. Shares of WageWorks, which provides tax-advantaged programs for employee spending account benefits, declined after filing a 10-K, or financial statement, extension. The company noted material internal control weaknesses for financial reporting in fiscal 2016 and 2017, citing revenue recognition for a government contract in fiscal 2016. Shares of Westwood Holdings Group, an investment advisory services provider, declined as the firm’s assets under management remained relatively flat during the period. Additionally, the firm’s chief investment officer announced that he is retiring, and the firm had not yet named a successor. Finally, the firm’s investment in technology hampered its earnings growth. We continued to hold all three positions at the end of the period.
BMO: Our portion of the Fund underperformed the benchmark in large part because of our emphasis on attractively valued securities during a period when value-oriented equities underperformed growth-oriented equities. In addition, our strategy’s style detracted, as the Russell 2000 Value Index underperformed the broad Russell 2000 Index for the period. Both sector allocation and stock selection overall detracted from relative results. Weak stock selection can be explained by our stock selection model, which is designed to identify fundamentally strong, attractively valued stocks with positive investor sentiment. While company fundamentals were a positive contributor to performance, valuations and investor sentiment detracted.
More specifically, stock selection in the financials, utilities and energy sectors detracted most from our portion of the Fund’s relative results. Having overweight positions in financials and utilities, which each underperformed the benchmark during the period, also hurt. The strongest-contributing sectors to our portion of the Fund were consumer discretionary, telecommunication services and materials, wherein stock selection supported relative results. Having an underweight allocation to telecommunication services, which underperformed the benchmark during the period, also helped.
From an individual holdings perspective, the biggest detractors from our portion of the Fund’s results included Mack-Cali Realty, an office real estate investment trust (REIT) with holdings throughout the northeast U.S. The company suffered deteriorating fundamentals, coupled with management turnover, which was met with negative investor sentiment. We exited the position based on weakening fundamentals. A position in Hilltop Holdings, a Dallas-based financial holding company, detracted from performance, driven by lower than expected earnings. One-time events, such as the impact from Hurricanes Harvey/Irma, affected its results. We maintained the position, however, as company valuations remained attractive relative to peers, in our view. PNM Resources, an energy holding company, detracted as well, driven primarily by a difficult regulatory environment. Though the company experienced headwinds early in the period, its performance subsequently improved, and we maintained the position based on both what we saw as its attractive valuation and its strong fundamental characteristics.
Conversely, individual positive contributors included Enanta Pharmaceuticals, a company within the biotechnology industry, which benefited during the period from improved earnings through an increase in revenues. In addition, the Food and Drug Administration awarded “fast track” designation to a few of its newest development programs. The company’s strong performance led to less attractive valuations, in our view, and so we eliminated the position from our portion of the Fund. Shares of Deckers Outdoor, a casual lifestyle footwear and clothing company, posted strong returns, contributing positively to our portion of the Fund’s relative results. The company accelerated earnings through organic growth in both the U.S. and international markets and saw an improvement in operating margins. Another strong contributor to relative results was Integer Holdings, a leading medical device outsource manufacturer. The company benefited during the period from improved earnings, a refocused product line and a significant reduction of debt.
| 6 | Multi-Manager Small Cap Equity Strategies Fund | Annual Report 2018 |
Manager Discussion of Fund Performance (continued)
CMIA: Our portion of the Fund underperformed the Russell 2000 Value Index, against which our portion of the Fund is managed, primarily due to market dynamics during the second half of the period. Investors increased their U.S. small cap exposure, primarily through passive investment vehicles, as it was generally believed small caps should be able to better weather potential global trade wars, as smaller cap equities usually derive more of their revenues domestically when compared to larger, multinational companies. However, due to the strong inflows into passive investment vehicles, the smallest and cheapest areas of the small cap market performed best. Our portion of the Fund is generally underweight in this market segment, as many of these names, in our view, do not have the liquidity we require and are more risky than our strategy seeks. Over the long term, we believe fundamentals drive stock prices; however, during periods dominated by these market dynamics, our portion of the Fund underperformed.
Both stock selection and sector allocation detracted from our portion of the Fund’s relative results during the period. Stock selection in industrials, energy and financials hurt most. Having an underweight to energy, which outperformed the Russell 2000 Value Index during the period, and an overweight to financials, which lagged the Russell 2000 Value Index during the period, also dampened relative results. Having a position in cash during a period when the Russell 2000 Value Index generated double-digit gains detracted as well. Only partially offsetting these detractors was effective stock selection in the materials sector, which contributed most positively. Having underweighted allocations to the real estate and telecommunication services sectors, which each lagged the Russell 2000 Value Index during the period, also added value.
Among the biggest individual detractors from our portion of the Fund’s results was concrete producer U.S. Concrete, which saw its shares fall after announcing disappointing quarterly results in February 2018, with the particularly snowy winter weather impacting its results. A position in homebuilder William Lyon Homes also detracted. Its shares sold off alongside other home building firms at the beginning of 2018, and its share price continued to decline as the calendar year progressed, as concerns regarding rising interest rates negatively affected the homebuilding industry. A position in technology firm Extreme Networks was another notable detractor. Shares in the network infrastructure developer dropped substantially after reporting consecutive quarterly results that disappointed investors as the firm struggled to integrate its recent acquisitions. We maintained our portion of the Fund’s positions in U.S. Concrete and William Lyon Homes at the end of the period but sold its position in Extreme Networks.
From an individual holdings perspective, the top three positive contributors to our portion of the Fund’s results were airline SkyWest, apparel company American Eagle Outfitters and paper and packaging manufacturer KapStone Paper and Packaging. Shares of SkyWest climbed early in the period after the company announced it had ordered 45 new aircrafts and reached new flying agreements. Its shares also jumped toward the end of the period when the company posted strong quarterly results driven by improved operational performance. American Eagle Outfitters’ shares rose during a strong holiday season and after posting strong quarterly results driven by better store traffic despite mall-related headwinds. KapStone Paper and Packaging announced in January 2018 it would be acquired by a competitor at a significant premium to its stock price at the time, and its share price rose substantially on the news. At the end of the period, our portion of the Fund maintained positions in SkyWest and American Eagle Outfitters, but we exited the position in KapStone Paper and Packaging on the acquisition announcement.
Sector weighting changes were driven by bottom-up stock selection
DGHM: We initiated a position in our portion of the Fund during the period in NorthWestern, a 100% regulated electric and gas utility primarily operating in Montana and South Dakota, with smaller operations in Nebraska, Wyoming and North Dakota. In our view, the company’s return on equity was solid, and its valuation was attractive versus both its utilities peers and versus the broader U.S. equity market. We also believed the company was less exposed to rising inflation than its peers due to a relatively large portion of existing renewable energy generation and less capital growth, leading to positive free cash flow. We established a position in Ciena, an optical networking equipment, software and services provider. We believed the company could benefit from demand for faster, more efficient and automated networking products, driven by cloud, video streaming, on demand and mobile applications, as well as from long-term industry trends, like 5G and Fiber Deep. We like that Ciena had diversified its end-markets and that it was a technology leader, with the first 400 gigabyte products in the market. In our view, Ciena’s stock had strong appreciation potential. Conversely, as mentioned earlier, we sold our portion of the Fund’s positions in ABM Industries and Edgewell Personal Care during the period.
Multi-Manager Small Cap Equity Strategies Fund | Annual Report 2018
| 7 |
Manager Discussion of Fund Performance (continued)
We do not engage in significant sector timing activities. Based on individual stock selection, our portion of the Fund was overweight relative to the benchmark in financials, industrials and utilities and was underweight non-cyclicals, technology and consumer cyclicals at the end of the period.
EAM: We initiated a Fund position in Tabula Rasa Healthcare, a provider of technology-enabled medication services that optimizes medication regimens. We bought the position on what we viewed as solid fundamental performance and an outlook supported by its competitive position in the medication management and safety space; a favorable secular backdrop with medication management and pharmacists paying a more integral role in value-based care; and the potential for 2018 revenue outperformance and potential for organic revenue growth. We established a position in Carvana, a next-generation, e-commerce-based, pre-owned auto retailer, on reported substantial organic growth and gross profit expansion. We purchased shares of Freshpet, a major manufacturer of fresh, refrigerated pet food. In our view, Freshpet had benefited from industry trends toward wholesome pet food, as the only pure fresh pet food offering. Freshpet reported accelerating monthly sales significantly above market estimates, attributed to its stepped-up advertising campaign.
We sold our portion of the Fund’s position in New Relic, credited with having created the first software-as-a-service full-service application for performance management and monitoring products. Its shares had increased substantially since we bought the stock in April 2017 and had reached, in our view, full valuation and a plateau in new business accounts. We exited our portion of the Fund’s position in Conn’s, a specialty retailer of home-related goods, including consumer electronics, appliances, furniture and mattresses. We sold the stock as it had pulled back on difficult year-over-year comparisons, earnings headwinds from Hurricane Harvey and overall deceleration in consumer/retail industry sales. We eliminated our portion of the Fund’s position in GrubHub, a leading online and mobile provider of food delivery and pick-up services, as its shares came under pressure after the company failed to meet expectations in daily average orders. Additionally, we believed investors may well be sensitive to potential execution-related risks from its new partnership with Yum! Brands.
Changes in sector allocation are a by-product of our purely bottom-up investment process. That said, overall, we increased our portion of the Fund’s exposure relative to the benchmark in consumer discretionary and consumer staples during the period. We decreased relative allocations to information technology and industrials. As of August 31, 2018, our portion of the Fund was overweight relative to the benchmark in health care, information technology and telecommunication services and underweight relative to the benchmark in financials, real estate, industrials, energy, materials and utilities. Our portion of the Fund was rather neutrally weighted to the benchmark in consumer staples at the end of the period.
Conestoga: During the period, we established a new position in our portion of the Fund in Novanta, a leading global supplier of photonics, vision and motion control solutions. We believed its management’s growth forecast and acquisition strategy could lead to revenue and earnings growth consistent with our long-term investment criteria. We initiated a position in Mercury Systems, a leading commercial provider of secure sensors and safety-critical processing subsystems sold to defense prime contractors. In our view, the company was benefiting from a number of tailwinds, including a stronger defense budget and the U.S. military’s focus on weapons modernization. Conversely, we sold our portion of the Fund’s position in EXA, a developer and distributor of computer-aided engineering software. On September 28, 2017, EXA received a tender offer for 100% of the company by Dassault Systems at a 43% premium to the previous trading day’s close, and so we exited the position, taking profits. We eliminated our portion of the Fund’s position in CoStar Group, which provides technology services to the real estate industry, as its market capitalization climbed above the portfolio’s small cap investment criteria.
At Conestoga, sector allocations are driven more by our bottom-up stock selection process than by any top-down or sector level research. That said, we did not make any material changes in sector weightings relative to the benchmark during the period. At the end of August 2018, our portion of the Fund was overweight relative to the benchmark in industrials, information technology, health care and consumer staples and was underweight in financials, consumer discretionary, energy and financials.
BMO: During the period, we established a position in our portion of the Fund in W&T Offshore, an oil and natural gas producer. In our view, the company has positive investor sentiment, attractive valuations and strong fundamental characteristics. We initiated a position in DSW, a company that operates as a branded footwear and accessories retailer, based on improving company fundamentals and positive investor sentiment. We later added to the position due to its valuations ranking in the top decile in the small cap value universe. Conversely, we sold our portion of the Fund’s position in Tronox, a company engaged in the exploration and mining of mineral sands deposits. We eliminated the position as its
| 8 | Multi-Manager Small Cap Equity Strategies Fund | Annual Report 2018 |
Manager Discussion of Fund Performance (continued)
valuations became stretched following its strong performance. We exited our portion of the Fund’s position in Pacific Ethanol, which produces and markets low-carbon renewable fuels in the U.S. Despite its attractive valuations, we sold the position based on the stock’s relative ranking within the small cap value universe, driven by rapidly decreasing investor sentiment.
As a result of our bottom-up stock attractiveness strategy, rather than top-down sector positioning, our portion of the Fund’s weights to consumer discretionary, energy, information technology and telecommunication services increased and its weights in industrials, real estate and consumer staples decreased. As of August 31, 2018, our portion of the Fund was overweight relative to the benchmark in health care, industrials, information technology, materials, telecommunication services and utilities and was underweight relative to the benchmark in consumer discretionary, consumer staples, financials and real estate. Our portion of the Fund was rather neutrally weighted compared to the benchmark in energy at the end of August 2018.
CMIA: During the period, we established positions in footwear and headwear retailer Genesco and retail and commercial banking services provider TCF Financial. We purchased these names as, in our view, they each met our value criteria, were exhibiting upward progress and had strong fundamentals. Each performed strongly from their respective purchase dates through the end of the period. In addition to the sales already mentioned, we exited our portion of the Fund’s position in specialty restaurant chain owner and operator Red Robin Gourmet Burgers, as the company had been facing pressure from competitors and had missed earnings estimates.
In general, changes in sector weights are a function of the number of value opportunities with upward inflection points we can find. Based on our individual fundamental, bottom-up stock selection process, notable sector shifts in our portion of the Fund during the period included increased allocations to industrials and financials and decreased exposure to materials and information technology. At the end of the period, our portion of the Fund was overweight relative to the Russell 2000 Value Index in financials, industrials, materials and health care. Our portion of the Fund was underweight relative to the Russell 2000 Value Index in real estate, information technology, consumer discretionary and energy at the end of August 2018.
Market risk may affect a single issuer, sector of the economy, industry or the market as a whole. Foreign investments subject the Fund to risks, including political, economic, market, social and others within a particular country, as well as to currency instabilities and less stringent financial and accounting standards generally applicable to U.S. issuers. Investments in small-cap companies involve risks and volatility greater than investments in larger, more established companies. The Fund may invest significantly in issuers within a particular sector, which may be negatively affected by market, economic or other conditions, making the Fund more vulnerable to unfavorable developments in the sector. The Fund is managed by multiple advisers independently of one another, which may result in contradicting trades (i.e., with no net benefit to the Fund), while increasing transaction costs. Market or other (e.g., interest rate) environments may adversely affect the liquidity of fund investments, negatively impacting their price. Generally, the less liquid the market at the time the Fund sells a holding, the greater the risk of loss or decline of value to the Fund.See the Fund’s prospectus for information on these and other risks.
The views expressed in this report reflect the current views of the respective parties. These views are not guarantees of future performance and involve certain risks, uncertainties and assumptions that are difficult to predict, so actual outcomes and results may differ significantly from the views expressed. These views are subject to change at any time based upon economic, market or other conditions and the respective parties disclaim any responsibility to update such views. These views may not be relied on as investment advice and, because investment decisions for a Columbia fund are based on numerous factors, may not be relied on as an indication of trading intent on behalf of any particular Columbia fund. References to specific securities should not be construed as a recommendation or investment advice.
Multi-Manager Small Cap Equity Strategies Fund | Annual Report 2018
| 9 |
Understanding Your Fund’s Expenses
(Unaudited)
As an investor, you incur two types of costs. There are shareholder transaction costs, which may include redemption fees. There are also ongoing costs, which generally include management fees, distribution and/or service fees, and other fund expenses. The following information is intended to help you understand your ongoing costs (in dollars) of investing in the Fund and to help you compare these costs with the ongoing costs of investing in other mutual funds.
Analyzing your Fund’s expenses
To illustrate these ongoing costs, we have provided examples and calculated the expenses paid by investors in each share class of the Fund during the period. The actual and hypothetical information in the table is based on an initial investment of $1,000 at the beginning of the period indicated and held for the entire period. Expense information is calculated two ways and each method provides you with different information. The amount listed in the “Actual” column is calculated using the Fund’s actual operating expenses and total return for the period. You may use the Actual information, together with the amount invested, to estimate the expenses that you paid over the period. Simply divide your account value by $1,000 (for example, an $8,600 account value divided by $1,000 = 8.6), then multiply the results by the expenses paid during the period under the “Actual” column. The amount listed in the “Hypothetical” column assumes a 5% annual rate of return before expenses (which is not the Fund’s actual return) and then applies the Fund’s actual expense ratio for the period to the hypothetical return. You should not use the hypothetical account values and expenses to estimate either your actual account balance at the end of the period or the expenses you paid during the period. See “Compare with other funds” below for details on how to use the hypothetical data.
Compare with other funds
Since all mutual funds are required to include the same hypothetical calculations about expenses in shareholder reports, you can use this information to compare the ongoing cost of investing in the Fund with other funds. To do so, compare the hypothetical example with the 5% hypothetical examples that appear in the shareholder reports of other funds. As you compare hypothetical examples of other funds, it is important to note that hypothetical examples are meant to highlight the ongoing costs of investing in a fund only and do not reflect any transaction costs, such as redemption or exchange fees. Therefore, the hypothetical calculations are useful in comparing ongoing costs only, and will not help you determine the relative total costs of owning different funds. If transaction costs were included in these calculations, your costs would be higher.
| March 1, 2018 — August 31, 2018 |
| | Account value at the
beginning of the
period ($) | Account value at the
end of the
period ($) | Expenses paid during
the period ($) | Fund’s annualized
expense ratio (%) |
| | Actual | Hypothetical | Actual | Hypothetical | Actual | Hypothetical | Actual |
| Class A | 1,000.00 | 1,000.00 | 1,169.10 | 1,018.45 | 7.33 | 6.82 | 1.34 |
| Institutional Class | 1,000.00 | 1,000.00 | 1,170.80 | 1,019.71 | 5.96 | 5.55 | 1.09 |
Expenses paid during the period are equal to the annualized expense ratio for each class as indicated above, multiplied by the average account value over the period and then multiplied by the number of days in the Fund’s most recent fiscal half year and divided by 365.
Expenses do not include fees and expenses incurred indirectly by the Fund from its investment in underlying funds, including affiliated and non-affiliated pooled investment vehicles, such as mutual funds and exchange-traded funds.
Had Columbia Management Investment Advisers, LLC and/or certain of its affiliates not waived/reimbursed certain fees and expenses, account value at the end of the period would have been reduced.
The Fund is offered only through certain wrap fee programs sponsored and/or managed by Ameriprise Financial, Inc. or its affiliates. Participants in wrap fee programs pay other fees that are not included in the above table. Please refer to the wrap program documents for information about the fees charged.
| 10 | Multi-Manager Small Cap Equity Strategies Fund | Annual Report 2018 |
Portfolio of Investments
August 31, 2018
(Percentages represent value of investments compared to net assets)
Investments in securities
| Common Stocks 88.3% |
| Issuer | Shares | Value ($) |
| Consumer Discretionary 9.6% |
| Auto Components 2.1% |
| American Axle & Manufacturing Holdings, Inc.(a) | 190,707 | 3,377,421 |
| Cooper-Standard Holding, Inc.(a) | 55,641 | 7,702,384 |
| Dorman Products, Inc.(a) | 75,825 | 6,140,309 |
| Fox Factory Holding Corp.(a) | 195,637 | 12,921,824 |
| Stoneridge, Inc.(a) | 100,854 | 3,018,560 |
| Tenneco, Inc. | 34,217 | 1,464,145 |
| Tower International, Inc. | 118,420 | 4,002,596 |
| Total | | 38,627,239 |
| Diversified Consumer Services 1.6% |
| Adtalem Global Education, Inc.(a) | 72,000 | 3,445,200 |
| Bright Horizons Family Solutions, Inc.(a) | 11,705 | 1,397,928 |
| Chegg, Inc.(a) | 43,260 | 1,400,759 |
| Grand Canyon Education, Inc.(a) | 73,400 | 8,744,876 |
| ServiceMaster Global Holdings, Inc.(a) | 89,884 | 5,417,308 |
| Sotheby’s (a) | 149,000 | 7,154,980 |
| Strategic Education, Inc. | 10,179 | 1,412,540 |
| Total | | 28,973,591 |
| Hotels, Restaurants & Leisure 0.7% |
| BJ’s Restaurants, Inc. | 20,023 | 1,515,741 |
| Brinker International, Inc. | 63,000 | 2,789,640 |
| Dine Brands Global, Inc. | 39,000 | 3,253,380 |
| Fiesta Restaurant Group, Inc.(a) | 33,561 | 964,879 |
| Planet Fitness, Inc., Class A(a) | 24,613 | 1,264,370 |
| SeaWorld Entertainment, Inc.(a) | 50,944 | 1,493,678 |
| Wingstop, Inc. | 21,154 | 1,416,260 |
| Total | | 12,697,948 |
| Household Durables 0.6% |
| Cavco Industries, Inc.(a) | 5,974 | 1,466,020 |
| iRobot Corp.(a) | 12,945 | 1,469,257 |
| KB Home | 121,001 | 3,006,875 |
| Roku, Inc.(a) | 23,289 | 1,385,463 |
| Turtle Beach Corp.(a) | 37,234 | 853,031 |
| William Lyon Homes, Inc., Class A(a) | 100,000 | 1,957,000 |
| Total | | 10,137,646 |
| Common Stocks (continued) |
| Issuer | Shares | Value ($) |
| Internet & Direct Marketing Retail 0.1% |
| Stitch Fix, Inc., Class A(a) | 38,796 | 1,574,342 |
| Leisure Products 0.2% |
| Callaway Golf Co. | 64,935 | 1,481,167 |
| Johnson Outdoors, Inc., Class A | 19,655 | 1,990,659 |
| Malibu Boats, Inc., Class A(a) | 23,028 | 1,110,180 |
| Total | | 4,582,006 |
| Media 1.1% |
| Cable One, Inc. | 6,157 | 5,157,965 |
| Marcus Corp. (The) | 31,180 | 1,265,908 |
| Nexstar Media Group, Inc., Class A | 138,734 | 11,376,188 |
| Sinclair Broadcast Group, Inc., Class A | 53,798 | 1,557,452 |
| World Wrestling Entertainment, Inc., Class A | 11,765 | 1,028,379 |
| Total | | 20,385,892 |
| Multiline Retail 0.1% |
| Ollie’s Bargain Outlet Holdings, Inc.(a) | 11,394 | 992,417 |
| Specialty Retail 2.9% |
| Aaron’s, Inc. | 68,000 | 3,380,960 |
| American Eagle Outfitters, Inc. | 407,183 | 10,570,471 |
| At Home Group, Inc.(a) | 7,155 | 246,204 |
| Boot Barn Holdings, Inc.(a) | 37,081 | 1,109,834 |
| Caleres, Inc. | 141,599 | 5,731,927 |
| Carvana Co.(a) | 19,308 | 1,250,000 |
| Chico’s FAS, Inc. | 435,122 | 3,968,313 |
| Children’s Place, Inc. (The) | 17,000 | 2,392,750 |
| DSW, Inc., Class A | 117,098 | 3,894,679 |
| Five Below, Inc.(a) | 10,532 | 1,226,662 |
| Genesco, Inc.(a) | 100,638 | 5,117,442 |
| Hibbett Sports, Inc.(a) | 181,714 | 3,734,223 |
| Restoration Hardware Holdings, Inc.(a) | 7,554 | 1,201,086 |
| Sleep Number Corp.(a) | 156,743 | 5,282,239 |
| Tailored Brands, Inc. | 80,445 | 1,893,675 |
| Urban Outfitters, Inc.(a) | 22,645 | 1,052,540 |
| Total | | 52,053,005 |
The accompanying Notes to Financial Statements are an integral part of this statement.
Multi-Manager Small Cap Equity Strategies Fund | Annual Report 2018
| 11 |
Portfolio of Investments (continued)
August 31, 2018
| Common Stocks (continued) |
| Issuer | Shares | Value ($) |
| Textiles, Apparel & Luxury Goods 0.2% |
| Deckers Outdoor Corp.(a) | 26,747 | 3,258,854 |
| Total Consumer Discretionary | 173,282,940 |
| Consumer Staples 2.2% |
| Beverages 0.5% |
| MGP Ingredients, Inc. | 112,055 | 8,640,561 |
| Food & Staples Retailing 0.8% |
| BJ’s Wholesale Club Holdings, Inc.(a) | 121,000 | 3,569,500 |
| Smart & Final Stores, Inc.(a) | 246,161 | 1,723,127 |
| The Chefs’ Warehouse(a) | 166,810 | 4,904,214 |
| United Natural Foods, Inc.(a) | 105,261 | 3,737,818 |
| Total | | 13,934,659 |
| Food Products 0.3% |
| Freshpet, Inc.(a) | 41,287 | 1,533,812 |
| Simply Good Foods Co. (The)(a) | 79,265 | 1,426,770 |
| TreeHouse Foods, Inc.(a) | 55,000 | 2,865,500 |
| Total | | 5,826,082 |
| Household Products 0.5% |
| Central Garden & Pet Co., Class A(a) | 44,743 | 1,625,513 |
| WD-40 Co. | 45,350 | 8,047,358 |
| Total | | 9,672,871 |
| Personal Products 0.1% |
| Medifast, Inc. | 4,227 | 966,926 |
| Usana Health Sciences, Inc.(a) | 8,056 | 1,062,989 |
| Total | | 2,029,915 |
| Total Consumer Staples | 40,104,088 |
| Energy 3.9% |
| Energy Equipment & Services 1.4% |
| C&J Energy Services, Inc.(a) | 219,366 | 4,595,718 |
| Diamond Offshore Drilling, Inc.(a) | 129,000 | 2,247,180 |
| Dril-Quip, Inc.(a) | 71,393 | 3,758,841 |
| Exterran Corp.(a) | 71,908 | 1,969,560 |
| FTS International, Inc.(a) | 36,563 | 403,290 |
| Matrix Service Co.(a) | 97,244 | 2,032,399 |
| Newpark Resources, Inc.(a) | 241,206 | 2,532,663 |
| Oceaneering International, Inc. | 53,800 | 1,520,926 |
| Patterson-UTI Energy, Inc. | 104,000 | 1,781,520 |
| Common Stocks (continued) |
| Issuer | Shares | Value ($) |
| Tetra Technologies, Inc.(a) | 443,957 | 2,037,763 |
| US Silica Holdings, Inc. | 87,156 | 1,846,836 |
| Total | | 24,726,696 |
| Oil, Gas & Consumable Fuels 2.5% |
| Arch Coal, Inc. | 39,500 | 3,502,465 |
| Callon Petroleum Co.(a) | 284,613 | 3,216,127 |
| Carrizo Oil & Gas, Inc.(a) | 90,000 | 2,179,800 |
| CNX Resources Corp.(a) | 240,050 | 3,826,397 |
| Delek U.S. Holdings, Inc. | 53,579 | 2,920,055 |
| Gulfport Energy Corp.(a) | 165,805 | 1,949,867 |
| Matador Resources Co.(a) | 120,400 | 3,941,896 |
| Oasis Petroleum, Inc.(a) | 226,000 | 3,041,960 |
| PBF Energy, Inc., Class A | 39,000 | 2,024,880 |
| PDC Energy, Inc.(a) | 37,246 | 1,962,492 |
| SM Energy Co. | 60,900 | 1,832,481 |
| Southwestern Energy Co.(a) | 496,888 | 2,792,511 |
| SRC Energy, Inc.(a) | 398,314 | 3,708,303 |
| W&T Offshore, Inc.(a) | 351,724 | 2,381,171 |
| WPX Energy, Inc.(a) | 298,153 | 5,685,778 |
| Total | | 44,966,183 |
| Total Energy | 69,692,879 |
| Financials 16.4% |
| Banks 8.9% |
| 1st Source Corp. | 30,608 | 1,713,742 |
| Ameris Bancorp | 86,000 | 4,269,900 |
| Associated Banc-Corp. | 228,008 | 6,213,218 |
| BancFirst Corp. | 27,549 | 1,757,626 |
| Banner Corp. | 57,801 | 3,718,338 |
| Cathay General Bancorp | 194,119 | 8,211,234 |
| Central Pacific Financial Corp. | 87,698 | 2,484,484 |
| Chemical Financial Corp. | 61,000 | 3,484,320 |
| Community Bank System, Inc. | 78,000 | 5,158,140 |
| Community Trust Bancorp, Inc. | 140,649 | 6,948,061 |
| Customers Bancorp, Inc.(a) | 98,075 | 2,422,452 |
| Eagle Bancorp, Inc.(a) | 42,340 | 2,280,009 |
| Enterprise Financial Services Corp. | 41,596 | 2,341,855 |
| FCB Financial Holdings, Inc., Class A(a) | 45,000 | 2,331,000 |
| Financial Institutions, Inc. | 28,970 | 935,731 |
| First Horizon National Corp. | 321,661 | 5,924,996 |
The accompanying Notes to Financial Statements are an integral part of this statement.
| 12 | Multi-Manager Small Cap Equity Strategies Fund | Annual Report 2018 |
Portfolio of Investments (continued)
August 31, 2018
| Common Stocks (continued) |
| Issuer | Shares | Value ($) |
| Franklin Financial Network, Inc.(a) | 30,676 | 1,185,627 |
| Fulton Financial Corp. | 311,554 | 5,670,283 |
| Great Southern Bancorp, Inc. | 12,878 | 763,665 |
| Great Western Bancorp, Inc. | 92,435 | 4,024,620 |
| Hancock Whitney Corp. | 247,469 | 12,757,027 |
| Hanmi Financial Corp. | 100,043 | 2,611,122 |
| Heritage Commerce Corp. | 150,000 | 2,376,000 |
| Heritage Financial Corp. | 89,000 | 3,230,700 |
| Hilltop Holdings, Inc. | 153,117 | 3,177,178 |
| Independent Bank Corp. | 58,000 | 5,283,800 |
| Independent Bank Corp. | 58,180 | 1,451,591 |
| International Bancshares Corp. | 79,967 | 3,746,454 |
| Investors Bancorp, Inc. | 288,152 | 3,688,346 |
| MB Financial, Inc. | 37,000 | 1,793,020 |
| Old National Bancorp | 231,069 | 4,690,701 |
| Pacific Premier Bancorp, Inc.(a) | 93,000 | 3,678,150 |
| Peapack Gladstone Financial Corp. | 33,886 | 1,132,131 |
| Peoples Bancorp, Inc. | 23,013 | 825,246 |
| Renasant Corp. | 111,000 | 5,182,590 |
| S&T Bancorp, Inc. | 24,861 | 1,160,014 |
| Sandy Spring Bancorp, Inc. | 243,812 | 9,508,668 |
| TCF Financial Corp. | 145,000 | 3,675,750 |
| Trico Bancshares | 50,076 | 1,946,955 |
| UMB Financial Corp. | 57,000 | 4,288,680 |
| Union Bankshares Corp. | 136,000 | 5,657,600 |
| WesBanco, Inc. | 69,959 | 3,452,477 |
| Wintrust Financial Corp. | 32,967 | 2,919,228 |
| Total | | 160,072,729 |
| Capital Markets 1.4% |
| Greenhill & Co., Inc. | 178,934 | 4,920,685 |
| Houlihan Lokey, Inc. | 87,500 | 4,115,125 |
| Moelis & Co., ADR, Class A | 54,500 | 3,163,725 |
| PJT Partners, Inc. | 16,413 | 950,641 |
| Stifel Financial Corp. | 81,440 | 4,550,053 |
| Virtu Financial, Inc. Class A | 58,000 | 1,264,400 |
| Waddell & Reed Financial, Inc., Class A | 101,793 | 2,037,896 |
| Westwood Holdings Group, Inc. | 66,820 | 3,844,154 |
| Total | | 24,846,679 |
| Common Stocks (continued) |
| Issuer | Shares | Value ($) |
| Consumer Finance 0.6% |
| Curo Group Holdings Corp.(a) | 48,389 | 1,493,285 |
| Encore Capital Group, Inc.(a) | 71,000 | 2,751,250 |
| Green Dot Corp., Class A(a) | 14,493 | 1,241,615 |
| Nelnet, Inc., Class A | 32,348 | 1,864,862 |
| SLM Corp.(a) | 250,000 | 2,930,000 |
| Total | | 10,281,012 |
| Insurance 3.0% |
| American Equity Investment Life Holding Co. | 207,522 | 7,696,991 |
| AMERISAFE, Inc. | 54,000 | 3,445,200 |
| Argo Group International Holdings Ltd. | 112,413 | 7,160,708 |
| CNO Financial Group, Inc. | 457,257 | 9,881,324 |
| eHealth, Inc.(a) | 41,564 | 1,213,253 |
| Employers Holdings, Inc. | 71,095 | 3,259,706 |
| FBL Financial Group, Inc., Class A | 33,024 | 2,686,502 |
| Health Insurance Innovations, Inc., Class A(a) | 34,713 | 1,836,318 |
| Horace Mann Educators Corp. | 193,755 | 8,970,856 |
| MBIA, Inc.(a) | 275,000 | 2,824,250 |
| National General Holdings Corp. | 105,178 | 2,872,411 |
| Safety Insurance Group, Inc. | 22,565 | 2,182,036 |
| Total | | 54,029,555 |
| Mortgage Real Estate Investment Trusts (REITS) 0.2% |
| Blackstone Mortgage Trust, Inc. | 69,000 | 2,350,140 |
| Invesco Mortgage Capital, Inc. | 70,000 | 1,136,100 |
| Total | | 3,486,240 |
| Thrifts & Mortgage Finance 2.3% |
| BofI Holding, Inc.(a) | 105,000 | 3,910,200 |
| First Defiance Financial Corp. | 32,474 | 1,038,843 |
| MGIC Investment Corp.(a) | 367,000 | 4,668,240 |
| NMI Holdings, Inc., Class A(a) | 121,776 | 2,630,362 |
| OceanFirst Financial Corp. | 85,000 | 2,482,000 |
| Provident Financial Services, Inc. | 233,606 | 5,893,879 |
| Radian Group, Inc. | 292,230 | 5,941,036 |
| TrustCo Bank Corp. | 180,321 | 1,667,969 |
| Walker & Dunlop, Inc. | 63,317 | 3,450,777 |
The accompanying Notes to Financial Statements are an integral part of this statement.
Multi-Manager Small Cap Equity Strategies Fund | Annual Report 2018
| 13 |
Portfolio of Investments (continued)
August 31, 2018
| Common Stocks (continued) |
| Issuer | Shares | Value ($) |
| Washington Federal, Inc. | 181,430 | 6,186,763 |
| WSFS Financial Corp. | 91,000 | 4,440,800 |
| Total | | 42,310,869 |
| Total Financials | 295,027,084 |
| Health Care 13.1% |
| Biotechnology 3.0% |
| Alder Biopharmaceuticals, Inc.(a) | 104,000 | 1,882,400 |
| Arbutus Biopharma Corp.(a) | 103,966 | 946,091 |
| Deciphera Pharmaceuticals, Inc.(a) | 24,807 | 917,611 |
| Emergent Biosolutions, Inc.(a) | 38,612 | 2,393,944 |
| Genomic Health, Inc.(a) | 27,644 | 1,690,984 |
| Heron Therapeutics, Inc.(a) | 28,079 | 1,082,445 |
| Immunomedics, Inc.(a) | 110,678 | 2,961,743 |
| Ligand Pharmaceuticals, Inc.(a) | 62,410 | 16,207,253 |
| Loxo Oncology, Inc.(a) | 5,777 | 976,198 |
| Madrigal Pharmaceuticals, Inc.(a) | 4,871 | 1,165,192 |
| Mirati Therapeutics, Inc.(a) | 23,926 | 1,353,015 |
| Myriad Genetics, Inc.(a) | 96,057 | 4,782,678 |
| Natera, Inc.(a) | 52,399 | 1,448,308 |
| REGENXBIO, Inc.(a) | 12,407 | 874,073 |
| Repligen Corp.(a) | 219,940 | 12,070,307 |
| Sarepta Therapeutics(a) | 8,763 | 1,209,645 |
| Verastem, Inc.(a) | 142,139 | 1,415,704 |
| Viking Therapeutics, Inc.(a) | 109,618 | 1,432,707 |
| Total | | 54,810,298 |
| Health Care Equipment & Supplies 4.3% |
| Angiodynamics, Inc.(a) | 59,502 | 1,334,035 |
| AtriCure, Inc.(a) | 44,644 | 1,542,450 |
| Avanos Medical, Inc.(a) | 20,402 | 1,470,984 |
| AxoGen, Inc.(a) | 19,863 | 870,993 |
| Cantel Medical Corp. | 96,595 | 9,369,715 |
| CONMED Corp. | 41,096 | 3,305,351 |
| CryoLife, Inc.(a) | 35,717 | 1,239,380 |
| Haemonetics Corp.(a) | 14,910 | 1,664,552 |
| ICU Medical, Inc.(a) | 4,484 | 1,372,104 |
| Inogen, Inc.(a) | 5,826 | 1,543,366 |
| Integer Holdings Corp.(a) | 67,686 | 5,408,111 |
| Invacare Corp. | 199,938 | 3,039,058 |
| iRhythm Technologies, Inc.(a) | 15,629 | 1,454,904 |
| Common Stocks (continued) |
| Issuer | Shares | Value ($) |
| Lantheus Holdings, Inc.(a) | 94,706 | 1,524,767 |
| LeMaitre Vascular, Inc. | 156,700 | 5,877,817 |
| LivaNova PLC(a) | 21,000 | 2,636,550 |
| Masimo Corp.(a) | 11,995 | 1,414,091 |
| Meridian Bioscience, Inc. | 56,545 | 887,756 |
| Merit Medical Systems, Inc.(a) | 95,785 | 5,636,947 |
| Natus Medical, Inc.(a) | 44,679 | 1,666,527 |
| Neogen Corp.(a) | 143,482 | 13,406,958 |
| Novocure Ltd.(a) | 36,209 | 1,631,215 |
| Orthofix Medical, Inc.(a) | 35,643 | 1,909,039 |
| Sientra, Inc.(a) | 54,662 | 1,373,109 |
| STAAR Surgical Co.(a) | 28,992 | 1,382,918 |
| Tactile Systems Technology, Inc.(a) | 24,312 | 1,645,193 |
| Tandem Diabetes Care, Inc.(a) | 37,323 | 1,705,288 |
| ViewRay, Inc.(a) | 91,770 | 925,042 |
| Total | | 77,238,220 |
| Health Care Providers & Services 1.3% |
| Amedisys, Inc.(a) | 7,608 | 951,076 |
| BioTelemetry, Inc.(a) | 28,244 | 1,745,479 |
| Encompass Health Corp. | 16,684 | 1,361,248 |
| Ensign Group, Inc. (The) | 26,592 | 1,038,949 |
| HealthEquity, Inc.(a) | 16,138 | 1,520,361 |
| LHC Group, Inc.(a) | 115,936 | 11,469,549 |
| Molina Healthcare, Inc.(a) | 23,000 | 3,174,000 |
| National Research Corp., Class A | 56,535 | 2,213,345 |
| Total | | 23,474,007 |
| Health Care Technology 2.9% |
| Allscripts Healthcare Solutions, Inc.(a) | 547,328 | 7,996,462 |
| Computer Programs & Systems, Inc. | 41,894 | 1,143,706 |
| HealthStream, Inc. | 185,750 | 5,893,848 |
| HMS Holdings Corp.(a) | 96,455 | 3,091,383 |
| Inspire Medical Systems, Inc.(a) | 30,279 | 1,665,042 |
| Medidata Solutions, Inc.(a) | 81,775 | 6,949,239 |
| Omnicell, Inc.(a) | 219,919 | 15,119,431 |
| Quality Systems, Inc.(a) | 68,631 | 1,570,964 |
| Tabula Rasa HealthCare, Inc.(a) | 13,637 | 1,195,556 |
| Teladoc, Inc.(a) | 17,876 | 1,386,284 |
| Vocera Communications, Inc.(a) | 180,600 | 5,988,696 |
| Total | | 52,000,611 |
The accompanying Notes to Financial Statements are an integral part of this statement.
| 14 | Multi-Manager Small Cap Equity Strategies Fund | Annual Report 2018 |
Portfolio of Investments (continued)
August 31, 2018
| Common Stocks (continued) |
| Issuer | Shares | Value ($) |
| Life Sciences Tools & Services 0.6% |
| Bio-Techne Corp. | 35,709 | 6,862,199 |
| Cambrex Corp.(a) | 30,091 | 2,028,133 |
| Medpace Holdings, Inc.(a) | 20,768 | 1,241,719 |
| Total | | 10,132,051 |
| Pharmaceuticals 1.0% |
| Amneal Pharmaceuticals, Inc.(a) | 118,000 | 2,725,800 |
| Assertio Therapeutics, Inc.(a) | 194,988 | 1,244,023 |
| Horizon Pharma PLC(a) | 180,000 | 3,805,200 |
| Phibro Animal Health Corp., Class A | 66,136 | 3,121,619 |
| Prestige Consumer Healthcare, Inc.(a) | 95,346 | 3,670,821 |
| Reata Pharmaceuticals, Inc., Class A(a) | 20,788 | 1,795,252 |
| Zogenix, Inc.(a) | 20,043 | 968,077 |
| Total | | 17,330,792 |
| Total Health Care | 234,985,979 |
| Industrials 16.1% |
| Aerospace & Defense 0.9% |
| Aerovironment, Inc.(a) | 18,640 | 1,639,574 |
| Esterline Technologies Corp.(a) | 20,312 | 1,745,816 |
| Mercury Systems, Inc.(a) | 128,540 | 7,006,716 |
| Moog, Inc., Class A | 71,973 | 5,679,390 |
| Total | | 16,071,496 |
| Air Freight & Logistics 0.4% |
| Forward Air Corp. | 102,625 | 6,594,683 |
| Airlines 0.5% |
| Hawaiian Holdings, Inc. | 134,722 | 5,590,963 |
| Skywest, Inc. | 62,500 | 4,081,250 |
| Total | | 9,672,213 |
| Building Products 2.9% |
| AAON, Inc. | 221,650 | 8,954,660 |
| Apogee Enterprises, Inc. | 31,846 | 1,567,460 |
| Armstrong World Industries, Inc.(a) | 57,000 | 3,978,600 |
| Continental Building Product(a) | 136,573 | 5,094,173 |
| Gibraltar Industries, Inc.(a) | 122,847 | 5,577,254 |
| PGT, Inc.(a) | 53,101 | 1,290,354 |
| Quanex Building Products Corp. | 96,615 | 1,584,486 |
| Common Stocks (continued) |
| Issuer | Shares | Value ($) |
| Simpson Manufacturing Co., Inc. | 175,529 | 13,475,361 |
| Trex Co., Inc.(a) | 128,635 | 10,895,385 |
| Total | | 52,417,733 |
| Commercial Services & Supplies 1.5% |
| ACCO Brands Corp. | 537,301 | 6,662,532 |
| Deluxe Corp. | 20,716 | 1,226,802 |
| Healthcare Services Group, Inc. | 141,450 | 5,829,154 |
| Herman Miller, Inc. | 74,492 | 2,853,044 |
| Kimball International, Inc., Class B | 59,937 | 1,047,099 |
| Rollins, Inc. | 46,225 | 2,777,198 |
| Steelcase, Inc., Class A | 186,161 | 2,717,951 |
| Tetra Tech, Inc. | 20,361 | 1,421,198 |
| Unifirst Corp. | 14,009 | 2,594,467 |
| Total | | 27,129,445 |
| Construction & Engineering 0.8% |
| EMCOR Group, Inc. | 36,256 | 2,904,105 |
| Granite Construction, Inc. | 61,500 | 2,809,320 |
| MasTec, Inc.(a) | 72,735 | 3,185,793 |
| Quanta Services, Inc.(a) | 168,779 | 5,838,066 |
| Total | | 14,737,284 |
| Electrical Equipment 0.5% |
| Atkore International Group, Inc.(a) | 163,195 | 4,468,279 |
| Sunrun, Inc.(a) | 178,500 | 2,341,920 |
| Vicor Corp.(a) | 22,343 | 1,395,320 |
| Total | | 8,205,519 |
| Machinery 4.1% |
| Albany International Corp., Class A | 17,311 | 1,335,544 |
| Allison Transmission Holdings, Inc. | 27,901 | 1,385,564 |
| Barnes Group, Inc. | 56,000 | 3,811,360 |
| Chart Industries, Inc.(a) | 12,637 | 954,725 |
| Columbus McKinnon Corp. | 36,265 | 1,542,350 |
| Douglas Dynamics, Inc. | 86,930 | 3,981,394 |
| ESCO Technologies, Inc. | 110,799 | 7,495,552 |
| Global Brass & Copper Holdings, Inc. | 156,099 | 6,017,617 |
| Greenbrier Companies, Inc. (The) | 131,739 | 7,640,862 |
| ITT, Inc. | 21,281 | 1,257,920 |
| John Bean Technologies Corp. | 51,400 | 6,080,620 |
| Kennametal, Inc. | 95,500 | 3,900,220 |
The accompanying Notes to Financial Statements are an integral part of this statement.
Multi-Manager Small Cap Equity Strategies Fund | Annual Report 2018
| 15 |
Portfolio of Investments (continued)
August 31, 2018
| Common Stocks (continued) |
| Issuer | Shares | Value ($) |
| Meritor, Inc.(a) | 63,875 | 1,383,533 |
| Mueller Industries, Inc. | 108,456 | 3,467,338 |
| Navistar International Corp.(a) | 97,000 | 4,226,290 |
| Proto Labs, Inc.(a) | 68,700 | 10,679,415 |
| Rexnord Corp.(a) | 71,595 | 2,078,403 |
| Sun Hydraulics Corp. | 137,800 | 6,936,852 |
| Total | | 74,175,559 |
| Professional Services 3.0% |
| ASGN, Inc.(a) | 72,216 | 6,686,479 |
| Exponent, Inc. | 223,300 | 11,689,755 |
| FTI Consulting, Inc.(a) | 16,390 | 1,249,246 |
| ICF International, Inc. | 110,528 | 9,024,611 |
| Kforce, Inc. | 70,000 | 2,943,500 |
| Korn/Ferry International | 111,905 | 7,512,183 |
| TrueBlue, Inc.(a) | 101,066 | 2,961,234 |
| Wageworks, Inc.(a) | 203,875 | 10,907,312 |
| Total | | 52,974,320 |
| Road & Rail 0.5% |
| ArcBest Corp. | 53,626 | 2,579,411 |
| Covenant Transportation Group, Inc., Class A(a) | 161,174 | 4,814,267 |
| Hertz Global Holdings, Inc.(a) | 110,879 | 1,952,579 |
| Total | | 9,346,257 |
| Trading Companies & Distributors 1.0% |
| EnviroStar, Inc. | 47,250 | 2,232,562 |
| GATX Corp. | 14,957 | 1,263,119 |
| NOW, Inc.(a) | 85,100 | 1,462,869 |
| Rush Enterprises, Inc., Class A | 61,976 | 2,662,489 |
| SiteOne Landscape Supply, Inc.(a) | 90,525 | 8,180,744 |
| Triton International Ltd. | 73,500 | 2,776,830 |
| Total | | 18,578,613 |
| Total Industrials | 289,903,122 |
| Information Technology 13.8% |
| Communications Equipment 1.0% |
| Ciena Corp.(a) | 421,291 | 13,304,370 |
| Comtech Telecommunications Corp. | 115,500 | 4,140,675 |
| Total | | 17,445,045 |
| Common Stocks (continued) |
| Issuer | Shares | Value ($) |
| Electronic Equipment, Instruments & Components 2.5% |
| Benchmark Electronics, Inc. | 69,189 | 1,788,536 |
| Control4 Corp.(a) | 35,733 | 1,158,106 |
| Insight Enterprises, Inc.(a) | 49,734 | 2,742,333 |
| Mesa Laboratories, Inc. | 43,417 | 8,715,963 |
| Novanta, Inc.(a) | 79,037 | 6,054,234 |
| Rogers Corp.(a) | 53,775 | 7,424,714 |
| Tech Data Corp.(a) | 31,089 | 2,261,725 |
| TTM Technologies, Inc.(a) | 643,558 | 12,034,534 |
| Vishay Intertechnology, Inc. | 143,937 | 3,425,701 |
| Total | | 45,605,846 |
| Internet Software & Services 2.0% |
| Alarm.com Holdings, Inc.(a) | 25,208 | 1,418,958 |
| Alteryx, Inc., Class A(a) | 20,525 | 1,191,476 |
| Appfolio, Inc., Class A(a) | 17,761 | 1,516,789 |
| Carbonite, Inc.(a) | 33,698 | 1,400,152 |
| Cornerstone OnDemand, Inc.(a) | 25,782 | 1,458,230 |
| Etsy, Inc.(a) | 39,175 | 1,907,431 |
| Five9, Inc.(a) | 27,569 | 1,324,690 |
| LivePerson, Inc.(a) | 59,523 | 1,601,169 |
| MongoDB, Inc.(a) | 17,290 | 1,244,188 |
| SPS Commerce, Inc.(a) | 64,058 | 6,294,980 |
| Stamps.com, Inc.(a) | 37,100 | 9,217,495 |
| Trade Desk, Inc. (The), Class A(a) | 10,786 | 1,530,318 |
| Twilio, Inc., Class A(a) | 17,394 | 1,403,000 |
| XO Group, Inc.(a) | 48,793 | 1,466,718 |
| Yelp, Inc.(a) | 29,903 | 1,409,029 |
| Yext, Inc.(a) | 57,753 | 1,435,740 |
| Total | | 35,820,363 |
| IT Services 1.3% |
| Acxiom Corp.(a) | 32,041 | 1,463,953 |
| CACI International, Inc., Class A(a) | 13,578 | 2,647,710 |
| CSG Systems International, Inc. | 44,344 | 1,656,248 |
| EPAM Systems, Inc.(a) | 6,858 | 980,214 |
| NIC, Inc. | 202,500 | 3,402,000 |
| Perficient, Inc.(a) | 42,921 | 1,233,120 |
| Science Applications International Corp. | 36,000 | 3,247,920 |
| Sykes Enterprises, Inc.(a) | 67,498 | 2,041,140 |
The accompanying Notes to Financial Statements are an integral part of this statement.
| 16 | Multi-Manager Small Cap Equity Strategies Fund | Annual Report 2018 |
Portfolio of Investments (continued)
August 31, 2018
| Common Stocks (continued) |
| Issuer | Shares | Value ($) |
| Travelport Worldwide Ltd. | 182,710 | 3,392,925 |
| Virtusa Corp.(a) | 44,197 | 2,574,917 |
| Total | | 22,640,147 |
| Semiconductors & Semiconductor Equipment 2.3% |
| Amkor Technology, Inc.(a) | 286,602 | 2,502,035 |
| Brooks Automation, Inc. | 36,247 | 1,428,494 |
| Cohu, Inc. | 168,152 | 4,435,850 |
| Cree, Inc.(a) | 50,000 | 2,405,500 |
| Diodes, Inc.(a) | 121,776 | 4,617,746 |
| Entegris, Inc. | 122,860 | 4,164,954 |
| Ichor Holdings Ltd.(a) | 58,500 | 1,516,905 |
| Kulicke & Soffa Industries, Inc. | 101,000 | 2,604,790 |
| NVE Corp. | 37,950 | 4,314,156 |
| Rambus, Inc.(a) | 358,333 | 4,378,829 |
| Rudolph Technologies, Inc.(a) | 84,160 | 2,339,648 |
| Semtech Corp.(a) | 24,590 | 1,469,253 |
| Teradyne, Inc. | 151,710 | 6,248,935 |
| Total | | 42,427,095 |
| Software 4.4% |
| ACI Worldwide, Inc.(a) | 248,200 | 7,051,362 |
| Aspen Technology, Inc.(a) | 12,469 | 1,438,424 |
| Avaya Holdings Corp.(a) | 125,000 | 2,920,000 |
| Blackbaud, Inc. | 82,725 | 8,650,553 |
| Blackline, Inc.(a) | 108,200 | 5,708,632 |
| Bottomline Technologies de, Inc.(a) | 206,393 | 13,615,746 |
| Descartes Systems Group, Inc. (The)(a) | 325,500 | 11,392,500 |
| Ebix, Inc. | 29,000 | 2,309,850 |
| Everbridge, Inc.(a) | 22,205 | 1,336,963 |
| Fair Isaac Corp.(a) | 6,978 | 1,611,778 |
| Glu Mobile, Inc.(a) | 174,862 | 1,346,437 |
| HubSpot, Inc.(a) | 8,625 | 1,239,413 |
| Paylocity Holding Corp.(a) | 18,330 | 1,456,135 |
| PROS Holdings, Inc.(a) | 229,523 | 8,464,808 |
| Rapid7, Inc.(a) | 32,740 | 1,249,031 |
| RingCentral, Inc., Class A(a) | 16,504 | 1,537,348 |
| SailPoint Technologies Holding, Inc.(a) | 41,492 | 1,283,348 |
| Tyler Technologies, Inc.(a) | 17,325 | 4,278,409 |
| Common Stocks (continued) |
| Issuer | Shares | Value ($) |
| Verint Systems, Inc.(a) | 26,989 | 1,310,316 |
| Zendesk, Inc.(a) | 19,383 | 1,335,295 |
| Total | | 79,536,348 |
| Technology Hardware, Storage & Peripherals 0.3% |
| 3D Systems Corp.(a) | 59,092 | 1,202,522 |
| Electronics for Imaging, Inc.(a) | 52,000 | 1,809,080 |
| Pure Storage, Inc., Class A(a) | 52,469 | 1,408,268 |
| USA Technologies, Inc.(a) | 79,386 | 1,290,023 |
| Total | | 5,709,893 |
| Total Information Technology | 249,184,737 |
| Materials 4.1% |
| Chemicals 2.2% |
| Balchem Corp. | 74,150 | 8,222,493 |
| Ingevity Corp.(a) | 14,881 | 1,503,130 |
| Koppers Holdings, Inc.(a) | 57,268 | 2,030,151 |
| Kraton Performance Polymers, Inc.(a) | 70,085 | 3,296,097 |
| Orion Engineered Carbons SA | 339,438 | 12,219,768 |
| PolyOne Corp. | 135,164 | 5,712,031 |
| Stepan Co. | 32,985 | 2,942,592 |
| Trinseo SA | 42,885 | 3,308,578 |
| Total | | 39,234,840 |
| Construction Materials 0.1% |
| U.S. Concrete, Inc.(a) | 28,500 | 1,373,700 |
| Containers & Packaging 0.1% |
| Owens-Illinois, Inc.(a) | 73,190 | 1,293,267 |
| Metals & Mining 1.1% |
| Allegheny Technologies, Inc.(a) | 146,000 | 3,946,380 |
| Carpenter Technology Corp. | 61,000 | 3,639,870 |
| Cleveland-Cliffs, Inc.(a) | 242,000 | 2,432,100 |
| Kaiser Aluminum Corp. | 60,221 | 6,599,619 |
| Materion Corp. | 61,000 | 3,891,800 |
| Total | | 20,509,769 |
The accompanying Notes to Financial Statements are an integral part of this statement.
Multi-Manager Small Cap Equity Strategies Fund | Annual Report 2018
| 17 |
Portfolio of Investments (continued)
August 31, 2018
| Common Stocks (continued) |
| Issuer | Shares | Value ($) |
| Paper & Forest Products 0.6% |
| Boise Cascade Co. | 60,254 | 2,633,100 |
| Domtar Corp. | 29,463 | 1,499,667 |
| Louisiana-Pacific Corp. | 145,666 | 4,247,620 |
| Neenah, Inc. | 23,000 | 2,098,750 |
| Total | | 10,479,137 |
| Total Materials | 72,890,713 |
| Real Estate 5.0% |
| Equity Real Estate Investment Trusts (REITS) 4.5% |
| American Assets Trust, Inc. | 170,253 | 6,724,994 |
| Ashford Hospitality Trust, Inc. | 114,106 | 740,548 |
| Brandywine Realty Trust | 733,340 | 12,290,778 |
| Chesapeake Lodging Trust | 238,709 | 7,855,913 |
| Cousins Properties, Inc. | 712,811 | 6,664,783 |
| First Industrial Realty Trust, Inc. | 207,574 | 6,737,852 |
| Hersha Hospitality Trust | 438,558 | 10,349,969 |
| Hudson Pacific Properties, Inc. | 72,000 | 2,436,480 |
| Kite Realty Group Trust | 155,653 | 2,720,814 |
| Mack-Cali Realty Corp. | 138,500 | 3,024,840 |
| Piedmont Office Realty Trust, Inc. | 192,461 | 3,818,426 |
| Preferred Apartment Communities, Inc., Class A | 155,707 | 2,774,699 |
| PS Business Parks, Inc. | 31,000 | 4,043,330 |
| Saul Centers, Inc. | 16,294 | 977,640 |
| STAG Industrial, Inc. | 64,404 | 1,859,344 |
| Sunstone Hotel Investors, Inc. | 230,000 | 3,859,400 |
| Xenia Hotels & Resorts, Inc. | 164,050 | 3,979,853 |
| Total | | 80,859,663 |
| Real Estate Management & Development 0.5% |
| Kennedy-Wilson Holdings, Inc. | 283,626 | 6,083,778 |
| Realogy Holdings Corp. | 129,799 | 2,776,400 |
| Total | | 8,860,178 |
| Total Real Estate | 89,719,841 |
| Telecommunication Services 0.7% |
| Diversified Telecommunication Services 0.6% |
| Iridium Communications, Inc.(a) | 278,685 | 5,643,371 |
| Vonage Holdings Corp.(a) | 349,610 | 4,957,470 |
| Total | | 10,600,841 |
| Common Stocks (continued) |
| Issuer | Shares | Value ($) |
| Wireless Telecommunication Services 0.1% |
| Boingo Wireless, Inc.(a) | 42,271 | 1,398,325 |
| Total Telecommunication Services | 11,999,166 |
| Utilities 3.4% |
| Electric Utilities 1.9% |
| El Paso Electric Co. | 164,896 | 10,108,125 |
| IDACORP, Inc. | 47,537 | 4,651,496 |
| PNM Resources, Inc. | 150,496 | 5,861,819 |
| Portland General Electric Co. | 276,398 | 12,824,867 |
| Total | | 33,446,307 |
| Gas Utilities 0.8% |
| New Jersey Resources Corp. | 116,000 | 5,289,600 |
| ONE Gas, Inc. | 46,000 | 3,612,380 |
| South Jersey Industries, Inc. | 114,000 | 3,782,520 |
| Southwest Gas Holdings, Inc. | 33,000 | 2,551,560 |
| Total | | 15,236,060 |
| Multi-Utilities 0.7% |
| Black Hills Corp. | 66,841 | 3,933,593 |
| NorthWestern Corp. | 144,013 | 8,635,019 |
| Total | | 12,568,612 |
| Total Utilities | 61,250,979 |
Total Common Stocks
(Cost $1,306,112,005) | 1,588,041,528 |
|
| Exchange-Traded Funds 8.9% |
| | Shares | Value ($) |
| iShares Russell 2000 Growth ETF | 729,978 | 160,836,053 |
Total Exchange-Traded Funds
(Cost $142,385,047) | 160,836,053 |
|
| Money Market Funds 2.9% |
| | |
| Columbia Short-Term Cash Fund, 2.058%(b),(c) | 52,399,234 | 52,393,994 |
Total Money Market Funds
(Cost $52,394,074) | 52,393,994 |
Total Investments in Securities
(Cost: $1,500,891,126) | 1,801,271,575 |
| Other Assets & Liabilities, Net | | (1,840,501) |
| Net Assets | 1,799,431,074 |
The accompanying Notes to Financial Statements are an integral part of this statement.
| 18 | Multi-Manager Small Cap Equity Strategies Fund | Annual Report 2018 |
Portfolio of Investments (continued)
August 31, 2018
Notes to Portfolio of Investments
| (a) | Non-income producing investment. |
| (b) | The rate shown is the seven-day current annualized yield at August 31, 2018. |
| (c) | As defined in the Investment Company Act of 1940, an affiliated company is one in which the Fund owns 5% or more of the company’s outstanding voting securities, or a company which is under common ownership or control with the Fund. Holdings and transactions in these affiliated companies during the year ended August 31, 2018 are as follows: |
| Issuer | Beginning
shares | Shares
purchased | Shares
sold | Ending
shares | Realized gain
(loss) —
affiliated
issuers ($) | Net change in
unrealized
appreciation
(depreciation) —
affiliated
issuers ($) | Dividends —
affiliated
issuers ($) | Value —
affiliated
issuers
at end of
period ($) |
| Columbia Short-Term Cash Fund, 2.058% |
| | 30,072,528 | 790,999,185 | (768,672,479) | 52,399,234 | (4,349) | (118) | 600,362 | 52,393,994 |
Abbreviation Legend
| ADR | American Depositary Receipt |
Fair value measurements
The Fund categorizes its fair value measurements according to a three-level hierarchy that maximizes the use of observable inputs and minimizes the use of unobservable inputs by prioritizing that the most observable input be used when available. Observable inputs are those that market participants would use in pricing an investment based on market data obtained from sources independent of the reporting entity. Unobservable inputs are those that reflect the Fund’s assumptions about the information market participants would use in pricing an investment. An investment’s level within the fair value hierarchy is based on the lowest level of any input that is deemed significant to the asset’s or liability’s fair value measurement. The input levels are not necessarily an indication of the risk or liquidity associated with investments at that level. For example, certain U.S. government securities are generally high quality and liquid, however, they are reflected as Level 2 because the inputs used to determine fair value may not always be quoted prices in an active market.
Fair value inputs are summarized in the three broad levels listed below:
| ■ | Level 1 — Valuations based on quoted prices for investments in active markets that the Fund has the ability to access at the measurement date. Valuation adjustments are not applied to Level 1 investments. |
| ■ | Level 2 — Valuations based on other significant observable inputs (including quoted prices for similar securities, interest rates, prepayment speeds, credit risks, etc.). |
| ■ | Level 3 — Valuations based on significant unobservable inputs (including the Fund’s own assumptions and judgment in determining the fair value of investments). |
Inputs that are used in determining fair value of an investment may include price information, credit data, volatility statistics, and other factors. These inputs can be either observable or unobservable. The availability of observable inputs can vary between investments, and is affected by various factors such as the type of investment, and the volume and level of activity for that investment or similar investments in the marketplace. The inputs will be considered by the Investment Manager, along with any other relevant factors in the calculation of an investment’s fair value. The Fund uses prices and inputs that are current as of the measurement date, which may include periods of market dislocations. During these periods, the availability of prices and inputs may be reduced for many investments. This condition could cause an investment to be reclassified between the various levels within the hierarchy.
Certain investments that have been measured at fair value using the net asset value (NAV) per share (or its equivalent) are not categorized in the fair value hierarchy. The fair value amounts presented in the table are intended to reconcile the fair value hierarchy to the amounts presented in the Portfolio of Investments. The Columbia Short-Term Cash Fund seeks to provide shareholders with maximum current income consistent with liquidity and stability of principal. Columbia Short-Term Cash Fund prices its shares with a floating NAV and no longer seeks to maintain a stable NAV.
Investments falling into the Level 3 category are primarily supported by quoted prices from brokers and dealers participating in the market for those investments. However, these may be classified as Level 3 investments due to lack of market transparency and corroboration to support these quoted prices. Additionally, valuation models may be used as the pricing source for any remaining investments classified as Level 3. These models may rely on one or more significant unobservable inputs and/or significant assumptions by the Investment Manager. Inputs used in valuations may include, but are not limited to, financial statement analysis, capital account balances, discount rates and estimated cash flows, and comparable company data.
Under the direction of the Fund’s Board of Trustees (the Board), the Investment Manager’s Valuation Committee (the Committee) is responsible for overseeing the valuation procedures approved by the Board. The Committee consists of voting and non-voting members from various groups within the Investment Manager’s organization, including operations and accounting, trading and investments, compliance, risk management and legal.
The Committee meets at least monthly to review and approve valuation matters, which may include a description of specific valuation determinations, data regarding pricing information received from approved pricing vendors and brokers and the results of Board-approved valuation control policies and procedures (the Policies). The Policies address, among other things, instances when market quotations are or are not readily available, including recommendations of third party pricing vendors and a determination of appropriate pricing methodologies; events that require specific valuation determinations and assessment of fair value techniques; securities with a potential for stale pricing, including those that are illiquid, restricted, or in default; and the effectiveness of third party pricing vendors, including periodic reviews of vendors. The Committee meets more frequently, as needed, to discuss additional valuation matters, which may include the need to review back-testing results, review time-sensitive information or approve related valuation actions. The Committee reports to the Board, with members of the Committee meeting with the Board at each of its regularly scheduled meetings to discuss valuation matters and actions during the period, similar to those described earlier.
The accompanying Notes to Financial Statements are an integral part of this statement.
Multi-Manager Small Cap Equity Strategies Fund | Annual Report 2018
| 19 |
Portfolio of Investments (continued)
August 31, 2018
Fair value measurements (continued)
For investments categorized as Level 3, the Committee monitors information similar to that described above, which may include: (i) data specific to the issuer or comparable issuers, (ii) general market or specific sector news and (iii) quoted prices and specific or similar security transactions. The Committee considers this data and any changes from prior periods in order to assess the reasonableness of observable and unobservable inputs, any assumptions or internal models used to value those securities and changes in fair value. This data is also used to corroborate, when available, information received from approved pricing vendors and brokers. Various factors impact the frequency of monitoring this information (which may occur as often as daily). However, the Committee may determine that changes to inputs, assumptions and models are not required as a result of the monitoring procedures performed.
The following table is a summary of the inputs used to value the Fund’s investments at August 31, 2018:
| | Level 1
quoted prices
in active
markets for
identical
assets ($) | Level 2
other
significant
observable
inputs ($) | Level 3
significant
unobservable
inputs ($) | Investments
measured at
net asset
value ($) | Total ($) |
| Investments in Securities | | | | | |
| Common Stocks | | | | | |
| Consumer Discretionary | 173,282,940 | — | — | — | 173,282,940 |
| Consumer Staples | 40,104,088 | — | — | — | 40,104,088 |
| Energy | 69,692,879 | — | — | — | 69,692,879 |
| Financials | 295,027,084 | — | — | — | 295,027,084 |
| Health Care | 234,985,979 | — | — | — | 234,985,979 |
| Industrials | 289,903,122 | — | — | — | 289,903,122 |
| Information Technology | 249,184,737 | — | — | — | 249,184,737 |
| Materials | 72,890,713 | — | — | — | 72,890,713 |
| Real Estate | 89,719,841 | — | — | — | 89,719,841 |
| Telecommunication Services | 11,999,166 | — | — | — | 11,999,166 |
| Utilities | 61,250,979 | — | — | — | 61,250,979 |
| Total Common Stocks | 1,588,041,528 | — | — | — | 1,588,041,528 |
| Exchange-Traded Funds | 160,836,053 | — | — | — | 160,836,053 |
| Money Market Funds | — | — | — | 52,393,994 | 52,393,994 |
| Total Investments in Securities | 1,748,877,581 | — | — | 52,393,994 | 1,801,271,575 |
See the Portfolio of Investments for all investment classifications not indicated in the table.
There were no transfers of financial assets between levels during the period.
The accompanying Notes to Financial Statements are an integral part of this statement.
| 20 | Multi-Manager Small Cap Equity Strategies Fund | Annual Report 2018 |
Statement of Assets and Liabilities
August 31, 2018
| Assets | |
| Investments in securities, at value | |
| Unaffiliated issuers (cost $1,448,497,052) | $1,748,877,581 |
| Affiliated issuers (cost $52,394,074) | 52,393,994 |
| Receivable for: | |
| Investments sold | 1,340,843 |
| Capital shares sold | 2,688,207 |
| Dividends | 955,335 |
| Expense reimbursement due from Investment Manager | 983 |
| Prepaid expenses | 8,296 |
| Trustees’ deferred compensation plan | 46,364 |
| Total assets | 1,806,311,603 |
| Liabilities | |
| Due to custodian | 286,685 |
| Payable for: | |
| Investments purchased | 3,525,734 |
| Capital shares purchased | 2,483,006 |
| Management services fees | 39,809 |
| Distribution and/or service fees | 31 |
| Transfer agent fees | 351,018 |
| Compensation of chief compliance officer | 84 |
| Other expenses | 147,798 |
| Trustees’ deferred compensation plan | 46,364 |
| Total liabilities | 6,880,529 |
| Net assets applicable to outstanding capital stock | $1,799,431,074 |
| Represented by | |
| Paid in capital | 1,389,510,932 |
| Excess of distributions over net investment income | (49,275) |
| Accumulated net realized gain | 109,588,968 |
| Unrealized appreciation (depreciation) on: | |
| Investments - unaffiliated issuers | 300,380,529 |
| Investments - affiliated issuers | (80) |
| Total - representing net assets applicable to outstanding capital stock | $1,799,431,074 |
| Class A | |
| Net assets | $4,544,709 |
| Shares outstanding | 255,760 |
| Net asset value per share | $17.77 |
| Institutional Class | |
| Net assets | $1,794,886,365 |
| Shares outstanding | 101,131,267 |
| Net asset value per share | $17.75 |
The accompanying Notes to Financial Statements are an integral part of this statement.
Multi-Manager Small Cap Equity Strategies Fund | Annual Report 2018
| 21 |
Statement of Operations
Year Ended August 31, 2018
| Net investment income | |
| Income: | |
| Dividends — unaffiliated issuers | $12,534,475 |
| Dividends — affiliated issuers | 600,362 |
| Foreign taxes withheld | (32,963) |
| Total income | 13,101,874 |
| Expenses: | |
| Management services fees | 10,337,126 |
| Distribution and/or service fees | |
| Class A | 12,362 |
| Transfer agent fees | |
| Class A | 14,654 |
| Institutional Class | 3,617,987 |
| Compensation of board members | 32,910 |
| Custodian fees | 49,005 |
| Printing and postage fees | 294,500 |
| Registration fees | 64,787 |
| Audit fees | 37,564 |
| Legal fees | 28,871 |
| Line of credit interest | 4,215 |
| Compensation of chief compliance officer | 477 |
| Other | 37,811 |
| Total expenses | 14,532,269 |
| Fees waived or expenses reimbursed by Investment Manager and its affiliates | (943,335) |
| Total net expenses | 13,588,934 |
| Net investment loss | (487,060) |
| Realized and unrealized gain (loss) — net | |
| Net realized gain (loss) on: | |
| Investments — unaffiliated issuers | 134,896,294 |
| Investments — affiliated issuers | (4,349) |
| Net realized gain | 134,891,945 |
| Net change in unrealized appreciation (depreciation) on: | |
| Investments — unaffiliated issuers | 162,273,067 |
| Investments — affiliated issuers | (118) |
| Net change in unrealized appreciation (depreciation) | 162,272,949 |
| Net realized and unrealized gain | 297,164,894 |
| Net increase in net assets resulting from operations | $296,677,834 |
The accompanying Notes to Financial Statements are an integral part of this statement.
| 22 | Multi-Manager Small Cap Equity Strategies Fund | Annual Report 2018 |
Statement of Changes in Net Assets
| | Year Ended
August 31, 2018 | Year Ended
August 31, 2017 (a) |
| Operations | | |
| Net investment loss | $(487,060) | $(2,169,630) |
| Net realized gain | 134,891,945 | 101,038,957 |
| Net change in unrealized appreciation (depreciation) | 162,272,949 | 36,188,545 |
| Net increase in net assets resulting from operations | 296,677,834 | 135,057,872 |
| Distributions to shareholders | | |
| Net investment income | | |
| Class A | — | (715,704) |
| Institutional Class | (690,526) | — |
| Net realized gains | | |
| Class A | (382,132) | (11,307,853) |
| Institutional Class | (90,388,847) | — |
| Total distributions to shareholders | (91,461,505) | (12,023,557) |
| Increase (decrease) in net assets from capital stock activity | 624,555,700 | (103,971,871) |
| Total increase in net assets | 829,772,029 | 19,062,444 |
| Net assets at beginning of year | 969,659,045 | 950,596,601 |
| Net assets at end of year | $1,799,431,074 | $969,659,045 |
| Excess of distributions over net investment income | $(49,275) | $(97,155) |
| | Year Ended | Year Ended |
| | August 31, 2018 | August 31, 2017 (a) |
| | Shares | Dollars ($) | Shares | Dollars ($) |
| Capital stock activity |
| Class A | | | | |
| Subscriptions | 48 | 794 | 8,100,484 | 116,177,389 |
| Distributions reinvested | 24,862 | 381,884 | 813,499 | 12,023,520 |
| Redemptions | (115,727) | (1,865,179) | (79,570,365) | (1,163,521,713) |
| Net decrease | (90,817) | (1,482,501) | (70,656,382) | (1,035,320,804) |
| Institutional Class | | | | |
| Subscriptions | 49,283,161 | 820,047,143 | 69,535,667 | 1,020,885,223 |
| Distributions reinvested | 5,948,999 | 91,079,165 | — | — |
| Redemptions | (17,613,056) | (285,088,107) | (6,023,504) | (89,536,290) |
| Net increase | 37,619,104 | 626,038,201 | 63,512,163 | 931,348,933 |
| Total net increase (decrease) | 37,528,287 | 624,555,700 | (7,144,219) | (103,971,871) |
| (a) | Institutional Class shares are based on operations from January 3, 2017 (commencement of operations) through the stated period end. |
The accompanying Notes to Financial Statements are an integral part of this statement.
Multi-Manager Small Cap Equity Strategies Fund | Annual Report 2018
| 23 |
The following table is intended to help you understand the Fund’s financial performance. Certain information reflects financial results for a single share of a class held for the periods shown. Per share net investment income (loss) amounts are calculated based on average shares outstanding during the period. Total return assumes reinvestment of all dividends and distributions, if any. Total return does not reflect payment of sales charges, if any. Total return and portfolio turnover are not annualized for periods of less than one year. The portfolio turnover rate is calculated without regard to purchase and sales transactions of short-term instruments and certain derivatives, if any. If such transactions were included, the Fund’s portfolio turnover rate may be higher.
| | Net asset value,
beginning of
period | Net
investment
income
(loss) | Net
realized
and
unrealized
gain | Total from
investment
operations | Distributions
from net
investment
income | Distributions
from net
realized
gains | Total
distributions to
shareholders |
| Class A |
| Year Ended 8/31/2018 | $15.23 | (0.05) | 3.80 | 3.75 | — | (1.21) | (1.21) |
| Year Ended 8/31/2017 | $13.39 | (0.02) | 2.04 | 2.02 | (0.01) | (0.17) | (0.18) |
| Year Ended 8/31/2016 | $12.79 | (0.00) (d) | 0.86 | 0.86 | — | (0.26) | (0.26) |
| Year Ended 8/31/2015 | $13.68 | (0.05) | 0.28 (e) | 0.23 | — | (1.12) | (1.12) |
| Year Ended 8/31/2014 | $12.73 | (0.07) | 1.86 | 1.79 | — | (0.84) | (0.84) |
| Institutional Class |
| Year Ended 8/31/2018 | $15.18 | (0.01) | 3.80 | 3.79 | (0.01) | (1.21) | (1.22) |
| Year Ended 8/31/2017(f) | $14.60 | (0.04) | 0.62 | 0.58 | — | — | — |
| Notes to Financial Highlights |
| (a) | In addition to the fees and expenses that the Fund bears directly, the Fund indirectly bears a pro rata share of the fees and expenses of any other funds in which it invests. Such indirect expenses are not included in the Fund’s reported expense ratios. |
| (b) | Total net expenses include the impact of certain fee waivers/expense reimbursements made by the Investment Manager and certain of its affiliates, if applicable. |
| (c) | Ratios include line of credit interest expense which is less than 0.01%. |
| (d) | Rounds to zero. |
| (e) | Calculation of the net gain (loss) per share (both realized and unrealized) does not correlate to the aggregate realized and unrealized gain (loss) presented in the Statement of Operations due to the timing of subscriptions and redemptions of Fund shares in relation to fluctuations in the market value of the portfolio. |
| (f) | Institutional Class shares commenced operations on January 3, 2017. Per share data and total return reflect activity from that date. |
| (g) | Annualized. |
The accompanying Notes to Financial Statements are an integral part of this statement.
| 24 | Multi-Manager Small Cap Equity Strategies Fund | Annual Report 2018 |
Financial Highlights (continued)
| | Net
asset
value,
end of
period | Total
return | Total gross
expense
ratio to
average
net assets(a) | Total net
expense
ratio to
average
net assets(a),(b) | Net investment
income (loss)
ratio to
average
net assets | Portfolio
turnover | Net
assets,
end of
period
(000’s) |
| Class A |
| Year Ended 8/31/2018 | $17.77 | 25.88% | 1.42% (c) | 1.34% (c) | (0.29%) | 82% | $4,545 |
| Year Ended 8/31/2017 | $15.23 | 15.12% | 1.59% | 1.36% | (0.12%) | 85% | $5,278 |
| Year Ended 8/31/2016 | $13.39 | 6.91% | 1.52% | 1.38% | 0.00% (d) | 115% | $950,597 |
| Year Ended 8/31/2015 | $12.79 | 1.90% | 1.58% (c) | 1.37% (c) | (0.38%) | 75% | $1,340,275 |
| Year Ended 8/31/2014 | $13.68 | 14.28% | 1.57% | 1.34% | (0.48%) | 73% | $628,100 |
| Institutional Class |
| Year Ended 8/31/2018 | $17.75 | 26.26% | 1.17% (c) | 1.09% (c) | (0.04%) | 82% | $1,794,886 |
| Year Ended 8/31/2017(f) | $15.18 | 3.97% | 1.33% (g) | 1.09% (g) | (0.37%) (g) | 85% | $964,381 |
The accompanying Notes to Financial Statements are an integral part of this statement.
Multi-Manager Small Cap Equity Strategies Fund | Annual Report 2018
| 25 |
Notes to Financial Statements
August 31, 2018
Note 1. Organization
Multi-Manager Small Cap Equity Strategies Fund (the Fund), a series of Columbia Funds Series Trust I (the Trust), is a diversified fund. The Trust is registered under the Investment Company Act of 1940, as amended (the 1940 Act), as an open-end management investment company organized as a Massachusetts business trust.
Fund shares
The Trust may issue an unlimited number of shares (without par value). The Fund is offered only through certain wrap fee programs sponsored and/or managed by Ameriprise Financial, Inc. (Ameriprise Financial) or its affiliates. The Fund offers each of the share classes identified below.
Class A shares are not subject to any front-end sales charge or contingent deferred sales charge.
Institutional Class shares are not subject to any front-end sales charge or contingent deferred sales charge. Prior to November 1, 2017, Institutional Class shares were known as Class Z shares.
Note 2. Summary of significant accounting policies
Basis of preparation
The Fund is an investment company that applies the accounting and reporting guidance in the Financial Accounting Standards Board (FASB) Accounting Standards Codification Topic 946, Financial Services - Investment Companies (ASC 946). The financial statements are prepared in accordance with U.S. generally accepted accounting principles (GAAP), which requires management to make certain estimates and assumptions that affect the reported amounts of assets and liabilities, the disclosure of contingent assets and liabilities at the date of the financial statements and the reported amounts of income and expenses during the reporting period. Actual results could differ from those estimates. The Fund received a reimbursement for expenses overbilled by a third party. Such reimbursement is included as an offset to other expenses on the Statement of Operations. All fee waivers and expense reimbursements by Columbia Management Investment Advisers, LLC and its affiliates were applied before giving effect to the third party reimbursement.
The following is a summary of significant accounting policies followed by the Fund in the preparation of its financial statements.
Security valuation
All equity securities and exchange-traded funds are valued at the close of business of the New York Stock Exchange. Equity securities and exchange-traded funds are valued at the last quoted sales price on the principal exchange or market on which they trade, except for securities traded on the NASDAQ Stock Market, which are valued at the NASDAQ official close price. Unlisted securities or listed securities for which there were no sales during the day are valued at the mean of the latest quoted bid and ask prices on such exchanges or markets.
Foreign equity securities are valued based on the closing price on the foreign exchange in which such securities are primarily traded. If any foreign equity security closing prices are not readily available, the securities are valued at the mean of the latest quoted bid and ask prices on such exchanges or markets. Foreign currency exchange rates are generally determined at 4:00 p.m. Eastern (U.S.) time. Many securities markets and exchanges outside the U.S. close prior to the close of the New York Stock Exchange; therefore, the closing prices for securities in such markets or on such exchanges may not fully reflect events that occur after such close but before the close of the New York Stock Exchange. In those situations, foreign securities will be fair valued pursuant to a policy adopted by the Board of Trustees, including, if available, utilizing a third party pricing service to determine these fair values. The third party pricing service takes into account multiple factors, including, but not limited to, movements in the U.S. securities markets, certain depositary receipts, futures contracts and foreign exchange rates that have occurred subsequent to the close of the foreign exchange or market, to determine a good faith estimate that reasonably reflects the current market conditions as of the close of the New York Stock Exchange. The fair value of a security is likely to be different from the quoted or published price, if available.
Investments in open-end investment companies, including money market funds, are valued at their latest net asset value.
| 26 | Multi-Manager Small Cap Equity Strategies Fund | Annual Report 2018 |
Notes to Financial Statements (continued)
August 31, 2018
Investments for which market quotations are not readily available, or that have quotations which management believes are not reflective of market value or reliable, are valued at fair value as determined in good faith under procedures approved by and under the general supervision of the Board of Trustees. If a security or class of securities (such as foreign securities) is valued at fair value, such value is likely to be different from the quoted or published price for the security.
The determination of fair value often requires significant judgment. To determine fair value, management may use assumptions including but not limited to future cash flows and estimated risk premiums. Multiple inputs from various sources may be used to determine fair value.
GAAP requires disclosure regarding the inputs and valuation techniques used to measure fair value and any changes in valuation inputs or techniques. In addition, investments shall be disclosed by major category. This information is disclosed following the Fund’s Portfolio of Investments.
Security transactions
Security transactions are accounted for on the trade date. Cost is determined and gains (losses) are based upon the specific identification method for both financial statement and federal income tax purposes.
Income recognition
Corporate actions and dividend income are recorded on the ex-dividend date.
The Fund may receive distributions from holdings in equity securities, business development companies (BDCs), exchange-traded funds (ETFs), limited partnerships (LPs), other regulated investment companies (RICs), and real estate investment trusts (REITs), which report information on the tax character of their distributions annually. These distributions are allocated to dividend income, capital gain and return of capital based on actual information reported. Return of capital is recorded as a reduction of the cost basis of securities held. If the Fund no longer owns the applicable securities, return of capital is recorded as a realized gain. With respect to REITs, to the extent actual information has not yet been reported, estimates for return of capital are made by the Fund’s management. Management’s estimates are subsequently adjusted when the actual character of the distributions is disclosed by the REITs, which could result in a proportionate change in return of capital to shareholders.
Awards from class action litigation are recorded as a reduction of cost basis if the Fund still owns the applicable securities on the payment date. If the Fund no longer owns the applicable securities, the proceeds are recorded as realized gains.
Expenses
General expenses of the Trust are allocated to the Fund and other funds of the Trust based upon relative net assets or other expense allocation methodologies determined by the nature of the expense. Expenses directly attributable to the Fund are charged to the Fund. Expenses directly attributable to a specific class of shares are charged to that share class.
Determination of class net asset value
All income, expenses (other than class-specific expenses, which are charged to that share class, as shown in the Statement of Operations) and realized and unrealized gains (losses) are allocated to each class of the Fund on a daily basis, based on the relative net assets of each class, for purposes of determining the net asset value of each class.
Federal income tax status
The Fund intends to qualify each year as a regulated investment company under Subchapter M of the Internal Revenue Code, as amended, and will distribute substantially all of its investment company taxable income and net capital gain, if any, for its tax year, and as such will not be subject to federal income taxes. In addition, the Fund intends to distribute in each calendar year substantially all of its ordinary income, capital gain net income and certain other amounts, if any, such that the Fund should not be subject to federal excise tax. Therefore, no federal income or excise tax provision is recorded.
Multi-Manager Small Cap Equity Strategies Fund | Annual Report 2018
| 27 |
Notes to Financial Statements (continued)
August 31, 2018
Foreign taxes
The Fund may be subject to foreign taxes on income, gains on investments or currency repatriation, a portion of which may be recoverable. The Fund will accrue such taxes and recoveries, as applicable, based upon its current interpretation of tax rules and regulations that exist in the markets in which it invests.
Realized gains in certain countries may be subject to foreign taxes at the Fund level, based on statutory rates. The Fund accrues for such foreign taxes on realized and unrealized gains at the appropriate rate for each jurisdiction, as applicable. The amount, if any, is disclosed as a liability on the Statement of Assets and Liabilities.
Distributions to shareholders
Distributions from net investment income, if any, are declared and paid annually. Net realized capital gains, if any, are distributed at least annually. Income distributions and capital gain distributions are determined in accordance with federal income tax regulations, which may differ from GAAP.
Guarantees and indemnifications
Under the Trust’s organizational documents and, in some cases, by contract, its officers and trustees are indemnified against certain liabilities arising out of the performance of their duties to the Trust or its funds. In addition, certain of the Fund’s contracts with its service providers contain general indemnification clauses. The Fund’s maximum exposure under these arrangements is unknown since the amount of any future claims that may be made against the Fund cannot be determined, and the Fund has no historical basis for predicting the likelihood of any such claims.
Recent accounting pronouncement
Accounting Standards Update 2017-08 Premium Amortization on Purchased Callable Debt Securities
In March 2017, the Financial Accounting Standards Board issued Accounting Standards Update (ASU) No. 2017-08 Premium Amortization on Purchased Callable Debt Securities. ASU No. 2017-08 updates the accounting standards to shorten the amortization period for certain purchased callable debt securities, held at a premium, to be amortized to the earliest call date. The update applies to securities with explicit, noncontingent call features that are callable at fixed prices and on preset dates. The standard is effective for annual periods beginning after December 15, 2018 and interim periods within those fiscal years. At this time, management is evaluating the implication of this guidance and the impact it will have on the financial statement amounts and footnote disclosures, if any.
Note 3. Fees and other transactions with affiliates
Management services fees
The Fund has entered into a Management Agreement with Columbia Management Investment Advisers, LLC (the Investment Manager), a wholly-owned subsidiary of Ameriprise Financial, Inc. (Ameriprise Financial). Under the Management Agreement, the Investment Manager provides the Fund with investment research and advice, as well as administrative and accounting services. The Investment Manager is responsible for the ultimate oversight of investments made by the Fund. The Fund’s subadvisers (see Subadvisory agreement below) have the primary responsibility for the day-to-day portfolio management of their portion of the Fund. The management services fee is an annual fee that is equal to a percentage of the Fund’s daily net assets that declines from 0.87% to 0.75% as the Fund’s net assets increase. The effective management services fee rate for the year ended August 31, 2018 was 0.83% of the Fund’s average daily net assets.
Subadvisory agreement
The Investment Manager has entered into Subadvisory Agreements with Conestoga Capital Advisors, LLC, Dalton, Greiner, Hartman, Maher & Co., LLC (DGHM), EAM Investors, LLC and BMO Asset Management Corp., with each serving as a subadviser to the Fund. In addition, Real Estate Management Services Group, LLC provides advisory services with respect to REITs in DGHM’s sleeve of investments. New investments in the Fund, net of any redemptions, are allocated in accordance with the Investment Manager’s determination, subject to the oversight of the Fund’s Board of Trustees. Each subadviser’s proportionate share of investments in the Fund will vary due to market fluctuations. The Investment Manager compensates each subadviser to manage the investment of the Fund’s assets.
| 28 | Multi-Manager Small Cap Equity Strategies Fund | Annual Report 2018 |
Notes to Financial Statements (continued)
August 31, 2018
Compensation of board members
Members of the Board of Trustees who are not officers or employees of the Investment Manager or Ameriprise Financial are compensated for their services to the Fund as disclosed in the Statement of Operations. These members of the Board of Trustees may participate in a Deferred Compensation Plan (the Plan) which may be terminated at any time. Obligations of the Plan will be paid solely out of the Fund’s assets, and all amounts payable under the Plan constitute a general unsecured obligation of the Fund.
Compensation of Chief Compliance Officer
The Board of Trustees has appointed a Chief Compliance Officer to the Fund in accordance with federal securities regulations. As disclosed in the Statement of Operations, a portion of the Chief Compliance Officer’s total compensation is allocated to the Fund, along with other allocations to affiliated funds governed by the Board of Trustees, based on relative net assets.
Transfer agency fees
Under a Transfer and Dividend Disbursing Agent Agreement, Columbia Management Investment Services Corp. (the Transfer Agent), an affiliate of the Investment Manager and a wholly-owned subsidiary of Ameriprise Financial, is responsible for providing transfer agency services to the Fund. The Transfer Agent has contracted with DST Asset Manager Solutions, Inc. (DST) to serve as sub-transfer agent. The Transfer Agent pays the fees of DST for services as sub-transfer agent and DST is not entitled to reimbursement for such fees from the Fund (with the exception of out-of-pocket fees).
The Fund pays the Transfer Agent a monthly transfer agency fee based on the number or the average value of accounts, depending on the type of account. In addition, the Fund pays the Transfer Agent a fee for shareholder services based on the number of accounts or on a percentage of the average aggregate value of the Fund’s shares maintained in omnibus accounts up to the lesser of the amount charged by the financial intermediary or a cap established by the Board of Trustees from time to time.
The Transfer Agent also receives compensation from the Fund for various shareholder services and reimbursements for certain out-of-pocket fees.
For the year ended August 31, 2018, the Fund’s effective transfer agency fee rates as a percentage of average daily net assets of each class were as follows:
| | Effective rate (%) |
| Class A | 0.30 |
| Institutional Class | 0.29 |
Distribution and service fees
The Fund has entered into an agreement with Columbia Management Investment Distributors, Inc. (the Distributor), an affiliate of the Investment Manager and a wholly-owned subsidiary of Ameriprise Financial, for distribution and shareholder services. The Board of Trustees has approved, and the Fund has adopted, distribution and shareholder service plans (the Plans) applicable to certain share classes, which set the distribution and service fees for the Fund. These fees are calculated daily and are intended to compensate the Distributor and/or eligible selling and/or servicing agents for selling shares of the Fund and providing services to investors.
The Fund may pay distribution fee of up to 0.25% of the Fund’s average daily net assets attributable to Class A shares and a service fee of up to 0.25% of the Fund’s average daily net assets attributable to Class A shares, provided that the aggregate fee shall not exceed 0.25% of the Fund’s average daily net assets attributable to Class A shares.
Multi-Manager Small Cap Equity Strategies Fund | Annual Report 2018
| 29 |
Notes to Financial Statements (continued)
August 31, 2018
Expenses waived/reimbursed by the Investment Manager and its affiliates
The Investment Manager and certain of its affiliates have contractually agreed to waive fees and/or reimburse expenses (excluding certain fees and expenses described below) for the period(s) disclosed below, unless sooner terminated at the sole discretion of the Board of Trustees, so that the Fund’s net operating expenses, after giving effect to fees waived/expenses reimbursed and any balance credits and/or overdraft charges from the Fund’s custodian, do not exceed the following annual rate(s) as a percentage of the class’ average daily net assets:
| | Fee rate(s) contractual
through
December 31, 2018 |
| Class A | 1.34% |
| Institutional Class | 1.09 |
Under the agreement governing these fee waivers and/or expense reimbursement arrangements, the following fees and expenses are excluded from the waiver/reimbursement commitment, and therefore will be paid by the Fund, if applicable: taxes (including foreign transaction taxes), expenses associated with investments in affiliated and non-affiliated pooled investment vehicles (including mutual funds and exchange-traded funds), transaction costs and brokerage commissions, costs related to any securities lending program, dividend expenses associated with securities sold short, inverse floater program fees and expenses, transaction charges and interest on borrowed money, interest, infrequent and/or unusual expenses and any other expenses the exclusion of which is specifically approved by the Board of Trustees. This agreement may be modified or amended only with approval from the Investment Manager, certain of its affiliates and the Fund. Any fees waived and/or expenses reimbursed under the expense reimbursement arrangements described above are not recoverable by the Investment Manager or its affiliates in future periods.
Note 4. Federal tax information
The timing and character of income and capital gain distributions are determined in accordance with income tax regulations, which may differ from GAAP because of temporary or permanent book to tax differences.
At August 31, 2018, these differences were primarily due to differing treatment for deferral/reversal of wash sale losses, re-characterization of distributions for investments, trustees’ deferred compensation, distribution reclassifications, net operating loss reclassification and earnings and profits distributed to shareholders on the redemption of shares. To the extent these differences were permanent, reclassifications were made among the components of the Fund’s net assets in the Statement of Assets and Liabilities. Temporary differences do not require reclassifications.
In the Statement of Assets and Liabilities the following reclassifications were made:
Excess of distributions
over net investment
income ($) | Accumulated
net realized
gain ($) | Paid in
capital ($) |
| 1,225,466 | (9,123,038) | 7,897,572 |
Net investment income (loss) and net realized gains (losses), as disclosed in the Statement of Operations, and net assets were not affected by this reclassification.
The tax character of distributions paid during the years indicated was as follows:
| Year Ended August 31, 2018 | Year Ended August 31, 2017 |
Ordinary
income ($) | Long-term
capital gains ($) | Total ($) | Ordinary
income ($) | Long-term
capital gains ($) | Total ($) |
| 24,393,485 | 67,068,020 | 91,461,505 | 6,057,348 | 5,966,209 | 12,023,557 |
Short-term capital gain distributions, if any, are considered ordinary income distributions for tax purposes.
| 30 | Multi-Manager Small Cap Equity Strategies Fund | Annual Report 2018 |
Notes to Financial Statements (continued)
August 31, 2018
At August 31, 2018, the components of distributable earnings on a tax basis were as follows:
Undistributed
ordinary income ($) | Undistributed
long-term
capital gains ($) | Capital loss
carryforwards ($) | Net unrealized
appreciation ($) |
| 39,737,768 | 75,823,320 | — | 294,408,329 |
At August 31, 2018, the cost of all investments for federal income tax purposes along with the aggregate gross unrealized appreciation and depreciation based on that cost was:
Federal
tax cost ($) | Gross unrealized
appreciation ($) | Gross unrealized
(depreciation) ($) | Net unrealized
appreciation ($) |
| 1,506,863,246 | 307,127,476 | (12,719,147) | 294,408,329 |
Tax cost of investments and unrealized appreciation/(depreciation) may also include timing differences that do not constitute adjustments to tax basis.
Management of the Fund has concluded that there are no significant uncertain tax positions in the Fund that would require recognition in the financial statements. However, management’s conclusion may be subject to review and adjustment at a later date based on factors including, but not limited to, new tax laws, regulations, and administrative interpretations (including relevant court decisions). Generally, the Fund’s federal tax returns for the prior three fiscal years remain subject to examination by the Internal Revenue Service.
Note 5. Portfolio information
The cost of purchases and proceeds from sales of securities, excluding short-term investments and derivatives, if any, aggregated to $1,512,313,017 and $1,002,631,106, respectively, for the year ended August 31, 2018. The amount of purchase and sale activity impacts the portfolio turnover rate reported in the Financial Highlights.
Note 6. Affiliated money market fund
The Fund invests in Columbia Short-Term Cash Fund, an affiliated money market fund established for the exclusive use by the Fund and other affiliated funds (the Affiliated MMF). The income earned by the Fund from such investments is included as Dividends - affiliated issuers in the Statement of Operations. As an investing fund, the Fund indirectly bears its proportionate share of the expenses of the Affiliated MMF. The Affiliated MMF prices its shares with a floating net asset value. In addition, the Board of Trustees of the Affiliated MMF may impose a fee on redemptions (sometimes referred to as a liquidity fee) or temporarily suspend redemptions (sometimes referred to as imposing a redemption gate) in the event its liquidity falls below regulatory limits.
Note 7. Interfund lending
Pursuant to an exemptive order granted by the Securities and Exchange Commission, the Fund participates in a program (the Interfund Program) allowing each participating Columbia Fund (each, a Participating Fund) to lend money directly to and, except for closed-end funds and money market funds, borrow money directly from other Participating Funds for temporary purposes. The amounts eligible for borrowing and lending under the Interfund Program are subject to certain restrictions.
Interfund loans are subject to the risk that the borrowing fund could be unable to repay the loan when due, and a delay in repayment to the lending fund could result in lost opportunities and/or additional lending costs. The exemptive order is subject to conditions intended to mitigate conflicts of interest arising from the Investment Manager’s relationship with each Participating Fund.
The Fund did not borrow or lend money under the Interfund Program during the year ended August 31, 2018.
Multi-Manager Small Cap Equity Strategies Fund | Annual Report 2018
| 31 |
Notes to Financial Statements (continued)
August 31, 2018
Note 8. Line of credit
The Fund has access to a revolving credit facility with a syndicate of banks led by Citibank, N.A., HSBC Bank USA, N.A. and JPMorgan Chase Bank, N.A. whereby the Fund may borrow for the temporary funding of shareholder redemptions or for other temporary or emergency purposes. The credit facility, which is a collective agreement between the Fund and certain other funds managed by the Investment Manager, severally and not jointly, permits collective borrowings up to $1 billion. Interest is charged to each participating fund based on its borrowings at a rate equal to the higher of (i) the overnight federal funds rate plus 1.00% or (ii) the one-month LIBOR rate plus 1.00%. Each borrowing under the credit facility matures no later than 60 days after the date of borrowing. The Fund also pays a commitment fee equal to its pro rata share of the amount of the credit facility at a rate of 0.15% per annum. The commitment fee is included in other expenses in the Statement of Operations. This agreement expires annually in December unless extended or renewed.
For the year ended August 31, 2018, the Fund’s borrowing activity was as follows:
Average loan
balance ($) | Weighted average
interest rate (%) | Days
outstanding |
| 32,600,000 | 2.33 | 2 |
Interest expense incurred by the Fund is recorded as a line of credit interest expense in the Statement of Operations. The Fund had no outstanding borrowings at August 31, 2018.
Note 9. Significant risks
Shareholder concentration risk
At August 31, 2018, affiliated shareholders of record owned 100.0% of the outstanding shares of the Fund in one or more accounts. Subscription and redemption activity by concentrated accounts may have a significant effect on the operations of the Fund. In the case of a large redemption, the Fund may be forced to sell investments at inopportune times, including its liquid positions, which may result in Fund losses and the Fund holding a higher percentage of less liquid positions. Large redemptions could result in decreased economies of scale and increased operating expenses for non-redeeming Fund shareholders.
Note 10. Subsequent events
Management has evaluated the events and transactions that have occurred through the date the financial statements were issued and noted no items requiring adjustment of the financial statements or additional disclosure.
Note 11. Information regarding pending and settled legal proceedings
Ameriprise Financial and certain of its affiliates have historically been involved in a number of legal, arbitration and regulatory proceedings, including routine litigation, class actions, and governmental actions, concerning matters arising in connection with the conduct of their business activities. Ameriprise Financial believes that the Fund is not currently the subject of, and that neither Ameriprise Financial nor any of its affiliates are the subject of, any pending legal, arbitration or regulatory proceedings that are likely to have a material adverse effect on the Fund or the ability of Ameriprise Financial or its affiliates to perform under their contracts with the Fund. Ameriprise Financial is required to make quarterly (10-Q), annual (10-K) and, as necessary, 8-K filings with the Securities and Exchange Commission (SEC) on legal and regulatory matters that relate to Ameriprise Financial and its affiliates. Copies of these filings may be obtained by accessing the SEC website at www.sec.gov.
There can be no assurance that these matters, or the adverse publicity associated with them, will not result in increased Fund redemptions, reduced sale of Fund shares or other adverse consequences to the Fund. Further, although we believe proceedings are not likely to have a material adverse effect on the Fund or the ability of Ameriprise Financial or its affiliates to perform under their contracts with the Fund, these proceedings are subject to uncertainties and, as such, we are unable to estimate the possible loss or range of loss that may result. An adverse outcome in one or more of these proceedings could result in adverse judgments, settlements, fines, penalties or other relief that could have a material adverse effect on the consolidated financial condition or results of operations of Ameriprise Financial.
| 32 | Multi-Manager Small Cap Equity Strategies Fund | Annual Report 2018 |
Report of Independent Registered Public Accounting Firm
To the Board of Trustees of Columbia Funds Series Trust I and Shareholders of Multi-Manager Small Cap Equity Strategies Fund
Opinion on the Financial Statements
We have audited the accompanying statement of assets and liabilities, including the portfolio of investments, of Multi-Manager Small Cap Equity Strategies Fund (one of the funds constituting Columbia Funds Series Trust I, hereafter referred to as the “Fund”) as of August 31, 2018, the related statement of operations for the year ended August 31, 2018, the statement of changes in net assets for each of the two years in the period ended August 31, 2018, including the related notes, and the financial highlights for each of the periods indicated therein (collectively referred to as the “financial statements”). In our opinion, the financial statements present fairly, in all material respects, the financial position of the Fund as of August 31, 2018, the results of its operations for the year then ended, the changes in its net assets for each of the two years in the period ended August 31, 2018 and the financial highlights for each of the periods indicated therein in conformity with accounting principles generally accepted in the United States of America.
Basis for Opinion
These financial statements are the responsibility of the Fund’s management. Our responsibility is to express an opinion on the Fund’s financial statements based on our audits. We are a public accounting firm registered with the Public Company Accounting Oversight Board (United States) (“PCAOB”) and are required to be independent with respect to the Fund in accordance with the U.S. federal securities laws and the applicable rules and regulations of the Securities and Exchange Commission and the PCAOB.
We conducted our audits of these financial statements in accordance with the standards of the PCAOB. Those standards require that we plan and perform the audit to obtain reasonable assurance about whether the financial statements are free of material misstatement, whether due to error or fraud.
Our audits included performing procedures to assess the risks of material misstatement of the financial statements, whether due to error or fraud, and performing procedures that respond to those risks. Such procedures included examining, on a test basis, evidence regarding the amounts and disclosures in the financial statements. Our audits also included evaluating the accounting principles used and significant estimates made by management, as well as evaluating the overall presentation of the financial statements. Our procedures included confirmation of securities owned as of August 31, 2018, by correspondence with the custodian, transfer agent, and brokers; when replies were not received from brokers, we performed other audit procedures. We believe that our audits provide a reasonable basis for our opinion.
/s/PricewaterhouseCoopers LLP
Minneapolis, Minnesota
October 22, 2018
We have served as the auditor of one or more investment companies within the Columbia Funds Complex since 1977.
Multi-Manager Small Cap Equity Strategies Fund | Annual Report 2018
| 33 |
Federal Income Tax Information
(Unaudited)
The Fund hereby designates the following tax attributes for the fiscal year ended August 31, 2018. Shareholders will be notified in early 2019 of the amounts for use in preparing 2018 income tax returns.
Qualified
dividend
income | Dividends
received
deduction | Capital
gain
dividend |
| 28.42% | 27.98% | $95,713,555 |
Qualified dividend income. For taxable, non-corporate shareholders, the percentage of ordinary income distributed during the fiscal year that represents qualified dividend income subject to reduced tax rates.
Dividends received deduction. The percentage of ordinary income distributed during the fiscal year that qualifies for the corporate dividends received deduction.
Capital gain dividend. The Fund designates as a capital gain dividend the amount reflected above, or if subsequently determined to be different, the net capital gain of such fiscal period.
| 34 | Multi-Manager Small Cap Equity Strategies Fund | Annual Report 2018 |
Shareholders elect the Board that oversees the Fund’s operations. The Board appoints officers who are responsible for day-to-day business decisions based on policies set by the Board. The following table provides basic biographical information about the Fund’s Trustees, including their principal occupations during the past five years, although specific titles for individuals may have varied over the period. The year set forth beneath Length of Service in the table below is the year in which the Trustee was first appointed or elected as Trustee to any Fund currently in the Columbia Funds Complex or a predecessor thereof. Under current Board policy, members serve terms of indefinite duration.
Independent trustees
| Name, address, year of birth | Position held with the Trust and length of service | Principal occupation(s) during the past five years and other relevant professional experience | Number of Funds in the Columbia Fund Complex overseen | Other directorships held by Trustee during the past five years |
Janet Langford Carrig
c/o Columbia Management
Investment Advisers, LLC
225 Franklin Street
Mail Drop BX32 05228
Boston, MA 02110
1957 | Trustee
1996 | Senior Vice President, General Counsel and Corporate Secretary, ConocoPhillips (independent energy company) since September 2007 | 69 | None |
Douglas A. Hacker
c/o Columbia Management
Investment Advisers, LLC
225 Franklin Street
Mail Drop BX32 05228
Boston, MA 02110
1955 | Trustee and Chairman of the Board
1996 | Independent business executive since May 2006; Executive Vice President — Strategy of United Airlines from December 2002 to May 2006; President of UAL Loyalty Services (airline marketing company) from September 2001 to December 2002; Executive Vice President and Chief Financial Officer of United Airlines from July 1999 to September 2001 | 69 | Spartan Nash Company, (food distributor); Nash Finch Company (food distributor) from 2005 to 2013; Aircastle Limited (aircraft leasing); SeaCube Container Leasing Ltd. (container leasing) from 2010 to 2013; and Travelport Worldwide Limited (travel information technology) |
Nancy T. Lukitsh
c/o Columbia Management
Investment Advisers, LLC
225 Franklin Street
Mail Drop BX32 05228
Boston, MA 02110
1956 | Trustee
2011 | Senior Vice President, Partner and Director of Marketing, Wellington Management Company, LLP (investment adviser) from 1997 to 2010; Chair, Wellington Management Portfolios (commingled non-U.S. investment pools) from 2007 to 2010; Director, Wellington Trust Company, NA and other Wellington affiliates from 1997 to 2010 | 69 | None |
David M. Moffett
c/o Columbia Management
Investment Advisers, LLC
225 Franklin Street
Mail Drop BX32 05228
Boston, MA 02110
1952 | Trustee
2011 | Retired. Consultant to Bridgewater and Associates | 69 | Director, CSX Corporation (transportation suppliers); Genworth Financial, Inc. (financial and insurance products and services); PayPal Holdings Inc. (payment and data processing services); Trustee, University of Oklahoma Foundation; former Director, eBay Inc. (online trading community), 2007-2015; and former Director, CIT Bank, CIT Group Inc. (commercial and consumer finance), 2010-2016 |
Multi-Manager Small Cap Equity Strategies Fund | Annual Report 2018
| 35 |
TRUSTEES AND OFFICERS (continued)
Independent trustees (continued)
| Name, address, year of birth | Position held with the Trust and length of service | Principal occupation(s) during the past five years and other relevant professional experience | Number of Funds in the Columbia Fund Complex overseen | Other directorships held by Trustee during the past five years |
John J. Neuhauser
c/o Columbia Management
Investment Advisers, LLC
225 Franklin Street
Mail Drop BX32 05228
Boston, MA 02110
1943 | Trustee
1984 | President, Saint Michael’s College since August 2007; Director or Trustee of several non-profit organizations, including University of Vermont Medical Center; Academic Vice President and Dean of Faculties, Boston College from August 1999 to October 2005; University Professor, Boston College from November 2005 to August 2007 | 69 | Liberty All-Star Equity Fund and Liberty All- Star Growth Fund (closed-end funds) |
Patrick J. Simpson
c/o Columbia Management
Investment Advisers, LLC
225 Franklin Street
Mail Drop BX32 05228
Boston, MA 02110
1944 | Trustee
2000 | Of Counsel, Perkins Coie LLP (law firm) since 2015; Partner, Perkins Coie LLP from 1988 to 2014 | 69 | None |
Anne-Lee Verville
c/o Columbia Management
Investment Advisers, LLC
225 Franklin Street
Mail Drop BX32 05228
Boston, MA 02110
1945 | Trustee
1998 | Retired. General Manager, Global Education Industry from 1994 to 1997, President – Application Systems Division from 1991 to 1994, Chief Financial Officer – US Marketing & Services from 1988 to 1991, and Chief Information Officer from 1987 to 1988, IBM Corporation (computer and technology) | 69 | Enesco Group, Inc. (producer of giftware and home and garden decor products) from 2001 to 2006 |
Consultants to the Independent Trustees*
| Name, address, year of birth | Position held with the Trust and length of service | Principal occupation(s) during the past five years and other relevant professional experience | Number of Funds in the Columbia Funds complex overseen | Other directorships held by Trustee during the past five years |
J. Kevin Connaughton
c/o Columbia
Management Investment
Advisers, LLC,
225 Franklin Street
Mail Drop BX32 05228,
Boston, MA 02110
1964 | Independent Trustee Consultant
2016 | Independent Trustee Consultant, Columbia Funds since March 2016; Adjunct Professor of Finance, Bentley University since November 2017; Managing Director and General Manager of Mutual Fund Products, Columbia Management Investment Advisers, LLC from May 2010 to February 2015; President, Columbia Funds from 2009 to 2015; and senior officer of Columbia Funds and affiliated funds from 2003 to 2015 | 69 | Director, The Autism Project since March 2015; former Trustee, New Century Portfolios, March 2015-December 2017; formerly on Board of Governors, Gateway Healthcare, January 2016 – December 2017 |
Natalie A. Trunow
c/o Columbia
Management Investment
Advisers, LLC,
225 Franklin Street
Mail Drop BX32 05228,
Boston, MA 02110
1967 | Independent Trustee Consultant
2016 | Independent Trustee Consultant, Columbia Funds since September 2016; Chief Executive Officer, Millennial Portfolio Solutions LLC (asset management and consulting services) since January 2016; Director of Investments, Casey Family Programs from April 2016 to September 2016; Senior Vice President and Chief Investment Officer, Calvert Investments from August 2008 to January 2016; Section Head and Portfolio Manager, General Motors Asset Management from June 1997 to August 2008 | 69 | Director, Health Services for Children with Special Needs, Inc.; Director, Guidewell Financial Solutions |
| * | J. Kevin Connaughton was appointed consultant to the Independent Trustees effective March 1, 2016. Natalie A. Trunow was appointed consultant to the Independent Trustees effective September 1, 2016. Shareholders of the Funds are expected to be asked to elect each of Mr. Connaughton and Ms. Trunow as a Trustee at a future shareholder meeting. |
| 36 | Multi-Manager Small Cap Equity Strategies Fund | Annual Report 2018 |
TRUSTEES AND OFFICERS (continued)
Interested trustee affiliated with Investment Manager*
| Name, address, year of birth | Position held with the Trust and length of service | Principal occupation(s) during the past five years and other relevant professional experience | Number of Funds in the Columbia Funds Complex overseen | Other directorships held by Trustee during the past five years |
William F. Truscott
c/o Columbia Management
Investment Advisers, LLC
225 Franklin Street
Boston, MA 02110
1960 | Trustee
2012 | Chairman of the Board and President, Columbia Management Investment Advisers, LLC since May 2010 and February 2012, respectively; Chief Executive Officer, Global Asset Management, Ameriprise Financial, Inc. since September 2012 (previously Chief Executive Officer, U.S. Asset Management & President, Annuities, May 2010-September 2012); Director and Chief Executive Officer, Columbia Management Investment Distributors, Inc. since May 2010 and February 2012, respectively; Chairman of the Board and Chief Executive Officer, RiverSource Distributors, Inc. since 2006; Director, Threadneedle Asset Management Holdings, SARL since 2014; President and Chief Executive Officer, Ameriprise Certificate Company, 2006-August 2012 | 193 | Chairman of the Board, Columbia Management Investment Advisers, LLC since May 2010; Director, Columbia Management Investment Distributors, Inc. since May 2010; former Director, Ameriprise Certificate Company, 2006 - January 2013 |
| * | Interested person (as defined under the 1940 Act) by reason of being an officer, director, security holder and/or employee of the Investment Manager or Ameriprise Financial. |
The Statement of Additional Information has additional information about the Fund’s Board members and is available,
without charge, upon request by calling 800.345.6611, contacting your financial intermediary or visiting
investor.columbiathreadneedleus.com.
Multi-Manager Small Cap Equity Strategies Fund | Annual Report 2018
| 37 |
TRUSTEES AND OFFICERS (continued)
The Board has appointed officers who are responsible for day-to-day business decisions based on policies it has established. The officers serve at the pleasure of the Board. The following table provides basic information about the Officers of the Fund, including principal occupations during the past five years, although their specific titles may have varied over the period. In addition to Mr. Truscott, who is Senior Vice President, the Fund’s other officers are:
Fund officers
Name,
address and
year of birth | Position and year
first appointed to
position for any Fund
in the Columbia
Funds complex or a
predecessor thereof | Principal occupation(s) during past five years |
Christopher O. Petersen
5228 Ameriprise
Financial Center
Minneapolis, MN 55474
Born 1970 | President and Principal Executive Officer (2015) | Vice President and Lead Chief Counsel, Ameriprise Financial, Inc. since January 2015 (previously, Vice President and Chief Counsel, January 2010 - December 2014; officer of Columbia Funds and affiliated funds since 2007. |
Michael G. Clarke
225 Franklin Street
Boston, MA 02110
Born 1969 | Treasurer (2011), Chief Financial Officer (2009) and Chief Accounting Officer (2015) | Vice President — Mutual Fund Administration, Columbia Management Investment Advisers, LLC, since May 2010; senior officer of Columbia Funds and affiliated funds since 2002. |
Paul B. Goucher
100 Park Avenue
New York, NY 10017
Born 1968 | Senior Vice President (2011) and Assistant Secretary (2008) | Senior Vice President and Assistant General Counsel, Ameriprise Financial, Inc. since January 2017 (previously, Vice President and Lead Chief Counsel, November 2008 - January 2017 and January 2013 - January 2017, respectively); Vice President, Chief Legal Officer and Assistant Secretary, Columbia Management Investment Advisers, LLC since May 2010. |
Thomas P. McGuire
225 Franklin Street
Boston, MA 02110
Born 1972 | Senior Vice President and Chief Compliance Officer (2012) | Vice President — Asset Management Compliance, Ameriprise Financial, Inc., since May 2010; Chief Compliance Officer, Ameriprise Certificate Company since September 2010. |
Colin Moore
225 Franklin Street
Boston, MA 02110
Born 1958 | Senior Vice President (2010) | Executive Vice President and Global Chief Investment Officer, Ameriprise Financial, Inc., since July 2013; Executive Vice President and Global Chief Investment Officer, Columbia Management Investment Advisers, LLC since July 2013. |
Ryan C. Larrenaga
225 Franklin Street
Boston, MA 02110
Born 1970 | Senior Vice President (2017), Chief Legal Officer (2017) and Secretary (2015) | Vice President and Chief Counsel, Ameriprise Financial, Inc. since August 2018 (previously, Vice President and Group Counsel, August 2011 - August 2018); officer of Columbia Funds and affiliated funds since 2005. |
Michael E. DeFao
225 Franklin Street
Boston, MA 02110
Born 1968 | Vice President (2011) and Assistant Secretary (2010) | Vice President and Chief Counsel, Ameriprise Financial, Inc. since May 2010. |
Amy Johnson
5228 Ameriprise
Financial Center
Minneapolis, MN 55474
Born 1965 | Vice President (2006) | Managing Director and Global Head of Operations, Columbia Management Investment Advisers, LLC since April 2016 (previously Managing Director and Chief Operating Officer, 2010 - 2016). |
Lyn Kephart-Strong
5228 Ameriprise
Financial Center
Minneapolis, MN 55474
Born 1960 | Vice President (2015) | President, Columbia Management Investment Services Corp. since October 2014; Vice President & Resolution Officer, Ameriprise Trust Company since August 2009. |
| 38 | Multi-Manager Small Cap Equity Strategies Fund | Annual Report 2018 |
Board Consideration and Approval of Management Agreement and Subadvisory Agreements
On June 12, 2018, the Board of Trustees (the Board) and the Trustees who are not interested persons (as defined in the Investment Company Act of 1940) (the Independent Trustees) of Columbia Funds Series Trust I (the Trust) unanimously approved the continuation of the Management Agreement (the Management Agreement) with Columbia Management Investment Advisers, LLC (the Investment Manager) and the Subadvisory Agreements and, to more closely conform the Subadvisory Agreements to a revised form of subadvisory agreement with the same material terms, an amendment to the Subadvisory Agreements (together, the Subadvisory Agreements) between the Investment Manager and BMO Asset Management Corp., Conestoga Capital Advisers, LLC, Dalton, Greiner, Hartman, Maher & Co., LLC and EAM Investors, LLC (the Subadvisers) with respect to Multi-Manager Small Cap Equity Strategies Fund (the Fund), a series of the Trust. As detailed below, the Board’s Advisory Fees and Expenses Committee (the Committee) and the Board met on multiple occasions to review and discuss, among themselves, with the management team of the Investment Manager and with an independent fee consultant, materials provided by the Investment Manager, the independent fee consultant and others before determining to approve the continuation of the Management Agreement and the Subadvisory Agreements (collectively, the Agreements).
In connection with their deliberations regarding the continuation of the Management Agreement and the Subadvisory Agreements, the Committee and the Board evaluated materials requested from the Investment Manager regarding the Fund and the Agreements, and discussed these materials with representatives of the Investment Manager at Committee meetings held on March 6, 2018, April 26, 2018 and June 11, 2018 and at Board meetings held on March 7, 2018 and June 12, 2018. In addition, the Board and its various committees consider matters bearing on the Agreements at other meetings throughout the year and in prior years and meet regularly with senior management of the Trust and the Investment Manager. Through the Board’s Investment Oversight Committees, Trustees also meet with selected portfolio managers of the funds the Trustees oversee and with other investment personnel at various times throughout the year. The Committee and the Board also consulted with the independent fee consultant, Fund counsel and the Independent Trustees’ independent legal counsel, who advised on various matters with respect to the Committee’s and the Board’s considerations and otherwise assisted the Committee and the Board in their deliberations. On June 11, 2018, the Committee recommended that the Board approve the continuation of the Management Agreement and the Subadvisory Agreements. On June 12, 2018, the Board, including the Independent Trustees, voting separately, unanimously approved the continuation of the Management Agreement and the Subadvisory Agreements for the Fund.
The Committee and the Board considered all information that they, their legal counsel or the Investment Manager believed reasonably necessary to evaluate and to determine whether to recommend for approval or approve the continuation of the Management Agreement and the Subadvisory Agreements. The information and factors considered by the Committee and the Board in recommending for approval or approving the continuation of the Management Agreement and the Subadvisory Agreements for the Fund included the following:
| • | Information on the investment performance of the Fund relative to the performance of a group of mutual funds determined to be comparable to the Fund by an independent third-party data provider, as well as performance relative to benchmarks; |
| • | Information on the Fund’s management fees and total expenses, including information comparing the Fund’s expenses to those of a group of comparable mutual funds, as determined by the independent third-party data provider; |
| • | The Investment Manager’s agreement to contractually limit or cap total operating expenses for the Fund through December 31, 2019 so that total operating expenses (excluding certain fees and expenses, such as transaction costs and certain other investment related expenses, interest, taxes, acquired fund fees and expenses, and infrequent and/or unusual expenses) would not exceed a specified annual rate, as a percentage of the Fund’s net assets; |
| • | The terms and conditions of the Agreements; |
| • | The subadvisory fees payable by the Investment Manager under the Subadvisory Agreements; |
| • | The current and proposed terms and conditions of other agreements and arrangements with affiliates of the Investment Manager relating to the operations of the Fund, including agreements with respect to the provision of distribution, transfer agency and shareholder services to the Fund; |
Multi-Manager Small Cap Equity Strategies Fund | Annual Report 2018
| 39 |
Board Consideration and Approval of Management Agreement and Subadvisory Agreements (continued)
| • | Descriptions of various functions performed by the Investment Manager and the Subadvisers under the Agreements, including portfolio management and portfolio trading practices; |
| • | Information regarding the management fees of similarly-managed portfolios of other clients of the Investment Manager, including institutional accounts and collective trusts; |
| • | Information regarding the reputation, regulatory history and resources of the Investment Manager and Subadvisers, including information regarding senior management, portfolio managers and other personnel; |
| • | Information regarding the capabilities of the Investment Manager and the Subadvisers with respect to compliance monitoring services, including an assessment of the Investment Manager’s and the Subadvisers’ compliance systems by the Fund’s Chief Compliance Officer; and |
| • | The profitability to the Investment Manager and its affiliates from their relationships with the Fund. |
Nature, extent and quality of services provided under the Agreements
The Committee and the Board considered the nature, extent and quality of services provided to the Fund by the Investment Manager, the Subadvisers and the Investment Manager’s affiliates under the Agreements and under separate agreements for the provision of transfer agency and shareholder services, and the resources dedicated to the Fund and the other Columbia Funds by the Investment Manager, the Subadvisers and the Investment Manager’s affiliates. The Committee and the Board considered, among other things, the Investment Manager’s ability to attract, motivate and retain highly qualified research, advisory and supervisory investment professionals (including compensation programs for personnel involved in fund management, reputation and other attributes), the portfolio management services provided by those investment professionals, and the quality of the Investment Manager’s and the Subadvisers’ investment research capabilities and trade execution services. The Committee and the Board also considered the potential benefits to shareholders of investing in a mutual fund that is part of a fund complex offering exposure to a variety of asset classes and investment disciplines and providing a variety of fund and shareholder services.
The Committee and the Board also considered the professional experience and qualifications of the senior personnel of the Investment Manager and the Subadvisers, which included consideration of the Investment Manager’s and the Subadvisers’ experience with similarly-structured funds. The Committee and the Board noted the compliance programs of and the compliance-related resources provided to the Fund by the Investment Manager and its affiliates and the resources dedicated by the Investment Manager and its affiliates to risk management, and considered the Investment Manager’s ability to provide administrative services to the Fund and coordinate the activities of the Fund’s other service providers. The Board also noted that the Board had approved each Subadviser’s code of ethics and compliance program, and that the Chief Compliance Officer of the Funds reports to the Trustees on each Subadviser’s compliance program.
The Committee and the Board considered the diligence and selection process undertaken by the Investment Manager to select each Subadviser, including the Investment Manager’s rationale for recommending the continuation of the Subadvisory Agreements, and the process for monitoring each Subadviser’s ongoing performance of services for the Fund. As part of these deliberations, the Committee and the Board considered the ability of the Investment Manager, subject to the approval of the Board, to modify or enter into new subadvisory agreements without a shareholder vote pursuant to an exemptive order of the Securities and Exchange Commission. The Committee and the Board also considered the scope of services provided to the Fund by the Investment Manager that are distinct from and in addition to those provided by the Subadvisers, including cash flow management, treasury services, risk oversight, investment oversight and Subadviser selection, oversight and transition management. After reviewing these and related factors, the Committee and the Board concluded, within the context of their overall conclusions, that the nature, extent and quality of the services provided to the Fund under the Agreements supported the continuation of the Management Agreement and the Subadvisory Agreements.
| 40 | Multi-Manager Small Cap Equity Strategies Fund | Annual Report 2018 |
Board Consideration and Approval of Management Agreement and Subadvisory Agreements (continued)
Investment performance
The Committee and the Board reviewed information about the performance of the Fund over various time periods, including performance information relative to benchmarks, information that compared the performance of the Fund to the performance of a group of comparable mutual funds as determined by the independent third-party data provider and information and analysis provided by the independent fee consultant. The Committee and the Board also reviewed a description of the third party’s methodology for identifying the Fund’s peer groups for purposes of performance and expense comparisons.
The Committee and the Board noted that, through December 31, 2017, the Fund’s performance was in the twenty-fourth, twenty-third and twenty-eighth percentile (where the best performance would be in the first percentile) of its category selected by the independent third-party data provider for the purposes of performance comparisons for the one-, three- and five-year periods, respectively.
The Committee and the Board also considered the Investment Manager’s and Subadvisers’ performance and reputation generally, the Investment Manager’s evaluation of each Subadviser’s contribution to the Fund’s broader investment mandate, the Investment Manager’s historical responsiveness to Board concerns about performance, and the Investment Manager’s willingness to take steps intended to improve performance. After reviewing these and related factors, the Committee and the Board concluded, within the context of their overall conclusions, that the performance of the Fund, the Investment Manager and the Subadvisers were sufficient, in light of other considerations, to support the continuation of the Management Agreement and the Subadvisory Agreements.
Investment Management fee rates and other expenses
The Committee and the Board considered the management fees charged to the Fund under the Management Agreement and the Subadvisory Agreements, as well as the total expenses incurred by the Fund. In assessing the reasonableness of the fees under the Management Agreement, the Committee and the Board considered, among other information, the Fund’s total expense ratio as a percentage of average daily net assets. The Committee and the Board considered data provided by the independent third-party data provider and the independent fee consultant. The Committee and the Board noted that, as of December 31, 2017, the Fund’s actual management fee and net total expense ratio were ranked in the first and third quintiles, respectively, (where the lowest fees and expenses would be in the first quintile) against the Fund’s expense universe as determined by the independent third-party data provider for purposes of expense comparison. The Committee and the Board also considered the fees that the Subadvisers charge to their other clients, and noted that the Investment Manager pays the fees of the Subadvisers. The Committee and the Board also took into account the fee waiver and expense limitation arrangements agreed to by the Investment Manager, as noted above.
The Committee and the Board also received and considered information about the management fees charged by the Investment Manager to institutional accounts. In considering the fees charged to those accounts, the Committee and the Board took into account, among other things, the Investment Manager’s representations about the differences between managing mutual funds as compared to other types of accounts, including differences in the services provided, differences in the risk profile of such business for the Investment Manager and the additional resources required to manage mutual funds effectively. The Committee and the Board also received and considered information about the fees charged by the Investment Manager for sub-advisory services it provides to comparable unaffiliated funds. In evaluating the Fund’s management fees, the Committee and the Board also took into account the demands, complexity and quality of the investment management of the Fund.
After reviewing these and related factors, the Committee and the Board concluded, within the context of their overall conclusions, that the management fee rates and expenses of the Fund, in light of other considerations, supported the continuation of the Management Agreement and the Subadvisory Agreements.
Costs of services provided and profitability
The Committee and the Board also took note of the costs the Investment Manager and its affiliates incur in connection with the services provided and the profitability to the Investment Manager and its affiliates from their relationships with the Fund.
Multi-Manager Small Cap Equity Strategies Fund | Annual Report 2018
| 41 |
Board Consideration and Approval of Management Agreement and Subadvisory Agreements (continued)
The Committee and the Board also considered the compensation directly or indirectly received by the Investment Manager’s affiliates in connection with their relationships with the Fund. The Committee and the Board reviewed information provided by management as to the profitability to the Investment Manager and its affiliates of their relationships with the Fund, including with respect to funds for which unaffiliated subadvisers provide services, information about the allocation of expenses used to calculate profitability, and comparisons of profitability levels realized in 2017 to profitability levels realized in 2016. When reviewing profitability, the Committee and the Board also considered court cases in which adviser profitability was an issue in whole or in part, the performance of similarly managed funds, the performance of the Fund, and the expense ratio of the Fund. In addition, the Committee and the Board considered information provided by the Investment Manager regarding the Investment Manager’s financial condition and comparing its profitability to that of other asset management firms that are, or are subsidiaries of, publicly traded companies. In this regard, the Committee and the Board also considered data provided by the independent fee consultant. Because the Subadvisory Agreements were negotiated at arms-length by the Investment Manager, which is responsible for payments to the Subadvisers thereunder, the Committee and the Board did not consider the profitability to each Subadviser of its relationship with the Fund.
After reviewing these and related factors, the Committee and the Board concluded, within the context of their overall conclusions, that the costs of services provided and the profitability to the Investment Manager and its affiliates from their relationships with the Fund supported the continuation of the Management Agreement and the Subadvisory Agreements.
Economies of scale
The Committee and the Board considered the potential existence of economies of scale in the provision by the Investment Manager of services to the Fund, to groups of related funds, and to the Investment Manager’s investment advisory clients as a whole, and whether those economies of scale were shared with the Fund through breakpoints in investment management fees or other means, such as expense limitation arrangements and additional investments by the Investment Manager in investment, trading, compliance and other resources. The Committee and the Board noted that the management fee schedules for the Fund contained breakpoints that would reduce the fee rate on assets above specified threshold levels.
The Committee and the Board noted that the breakpoints, if any, in the Subadvisory Agreements did not occur at the same levels as the breakpoints in the Management Agreement. The Committee and the Board noted that absent a shareholder vote, the Investment Manager would bear any increase in fees payable under the Subadvisory Agreements. The Committee and the Board also noted the potential challenges of seeking to tailor the Management Agreement breakpoints to those of a subadvisory agreement in this context, and the effect that capacity constraints on a subadviser’s ability to manage assets could potentially have on the ability of the Investment Manager to achieve economies of scale, as new subadvisers may need to be added as the Fund grows, increasing the Investment Manager’s cost of compensating and overseeing the Fund’s subadvisers.
In considering these matters, the Committee and the Board also considered the costs of the services provided and the profitability to the Investment Manager and its affiliates from their relationships with the Fund, as noted above. After reviewing these and related factors, the Committee and the Board concluded, within the context of their overall conclusions, that the extent to which any economies of scale were expected to be shared with the Fund supported the continuation of the Management Agreement and the Subadvisory Agreements.
Other benefits to the Investment Manager and Subadvisers
The Committee and the Board received and considered information regarding “fall-out” or ancillary benefits received by the Investment Manager and its affiliates as a result of their relationships with the Fund, such as the engagement of the Investment Manager’s affiliates to provide distribution, transfer agency and shareholder services to the Fund. In this regard, among other matters, the Committee and the Board considered that the Fund’s distributor retains a portion of the distribution fees from the Fund and receives a portion of the sales charges on sales or redemptions of certain classes of shares of the Fund. The Committee and the Board also considered the benefits of research made available to the Investment Manager and the Subadvisers by reason of brokerage commissions generated by the Fund’s securities transactions, and reviewed information about the Investment Manager’s practices with respect to considering brokerage and research services when
| 42 | Multi-Manager Small Cap Equity Strategies Fund | Annual Report 2018 |
Board Consideration and Approval of Management Agreement and Subadvisory Agreements (continued)
allocating portfolio transactions. In this connection, the Board also noted that the amount of research made available to the Investment Manager by reason of brokerage commissions had been declining over time, and may decline further. The Committee and the Board recognized that the Investment Manager’s profitability would be somewhat lower without these benefits.
Conclusion
The Committee and the Board reviewed all of the above considerations in reaching their decisions to recommend or approve the continuation of the Management Agreement and the Subadvisory Agreements. In their deliberations, the Trustees did not identify any particular information that was all-important or controlling, and individual Trustees may have attributed different weights to the various factors. Based on their evaluation of all factors that they deemed to be material, including those factors described above, and assisted by the advice of independent legal counsel, the Board, including the Independent Trustees, voting separately, unanimously approved the continuation of the Management Agreement and the Subadvisory Agreements.
Multi-Manager Small Cap Equity Strategies Fund | Annual Report 2018
| 43 |
The Fund mails one shareholder report to each shareholder address. If you would like more than one report, please call shareholder services at 800.345.6611 and additional reports will be sent to you.
Proxy voting policies and procedures
The policy of the Board of Trustees is to vote the proxies of the companies in which the Fund holds investments consistent with the procedures as stated in the Statement of Additional Information (SAI). You may obtain a copy of the SAI without charge by calling 800.345.6611; contacting your financial intermediary; visiting columbiathreadneedleus.com/investor/; or searching the website of the Securities and Exchange Commission (SEC) at sec.gov. Information regarding how the Fund voted proxies relating to portfolio securities is filed with the SEC by August 31st for the most recent 12-month period ending June 30th of that year, and is available without charge by visiting columbiathreadneedleus.com/investor/, or searching the website of the SEC at sec.gov.
Quarterly schedule of investments
The Fund files a complete schedule of portfolio holdings with the SEC for the first and third quarters of each fiscal year on Form N-Q or Form N-PORT. The Fund’s Form N-Q or Form N-PORT is available on the SEC’s website at sec.gov and may be reviewed and copied at the SEC’s Public Reference Room in Washington, D.C. Information on the operation of the Public Reference Room may be obtained by calling 800.SEC.0330. The Fund’s complete schedule of portfolio holdings, as filed on Form N-Q or Form N-PORT, can also be obtained without charge, upon request, by calling 800.345.6611.
Additional Fund information
For more information about the Fund, please visit columbiathreadneedleus.com/investor/ or call 800.345.6611. Customer Service Representatives are available to answer your questions Monday through Friday from 8 a.m. to 7 p.m. Eastern time.
Fund investment manager
Columbia Management Investment Advisers, LLC
225 Franklin Street
Boston, MA 02110
Fund distributor
Columbia Management Investment Distributors, Inc.
225 Franklin Street
Boston, MA 02110
Fund transfer agent
Columbia Management Investment Services Corp.
Through October 31, 2018:
P.O. Box 8081
Boston, MA 02266-8081
Effective November 1, 2018:
P.O. Box 219104
Kansas City, MO 64121-9104
| 44 | Multi-Manager Small Cap Equity Strategies Fund | Annual Report 2018 |
[THIS PAGE INTENTIONALLY LEFT BLANK]
Multi-Manager Small Cap Equity Strategies Fund
Through October 31, 2018:
P.O. Box 8081
Boston, MA 02266-8081
Effective November 1, 2018:
P.O. Box 219104
Kansas City, MO 64121-9104
Please read and consider the investment objectives, risks, charges and expenses for any fund carefully before investing. For a prospectus and summary prospectus, which contains this and other important information about the Fund, go to
columbiathreadneedleus.com/investor/. The Fund is distributed by Columbia Management Investment Distributors, Inc., member FINRA, and managed by Columbia Management Investment Advisers, LLC.
Columbia Threadneedle Investments (Columbia Threadneedle) is the global brand name of the Columbia and Threadneedle group of companies. All rights reserved.
© 2018 Columbia Management Investment Advisers, LLC.
columbiathreadneedleus .com/investor/

Annual Report
August 31, 2018
Multi-Manager Alternative Strategies Fund
Not FDIC Insured • No bank guarantee • May lose value
Dear Shareholders,
Volatility exists in financial markets and this is not a comfortable fact of life. How investors deal with this reality, including how they react to short term spikes in volatility as well as to longer periods of increased or decreased volatility, may have a significant impact on their overall investing success.
Too often, investors change their investment strategy based on something that’s happening at a moment in time rather than thinking about how that change in strategy might affect their ability to achieve their longer-term financial goals. Emotion replaces logic and reasoning. Investors may sell in reaction to a market drop (fear or panic), locking in low returns which means they won’t be invested when the market returns, or they invest more at a market peak (greed or conviction), essentially when it is expensive to do so. In both cases, selling and buying at the exact wrong time.
We believe the best outcomes come from a consistent approach to investing. Here are five areas where advisors can help us overcome the tendency to react emotionally as we struggle to make the right choices with our investments:
Long-term focus
The further away long-term goals, aspirations and objectives are, the easier it is to stray away from the goals and priorities that we set out. Advisors help us stay focused on what we want to accomplish.
Discipline through up-and-down markets
Advisors help set rules to prevent us from making rash decisions that we may regret later. Knowing ahead of time what you should do in case of certain situations will help you get through volatile markets and not make emotional decisions.
Tax-awareness
Taxes are one of the biggest drags on investment returns and are critical attributes of investing. Yet few of us take the necessary steps to ease the corrosive effect of taxes. Advisors have tools and knowledge that may help us to manage portfolios more tax-efficiently and keep more of what we earn.
Emotional objectivity
Our emotions are very hard to manage and making investment decisions in an emotional state can lead to exceedingly bad outcomes. An objective advisor can help prevent some of the reactionary mistakes emotions often lead us to.
Education and guidance
The role of the advisor is to teach and guide us toward achieving our financial goals. In terms of working through emotions, guidance is by far the most important component.
By understanding our own behaviors and biases, we can prepare for future challenges. Your success is our priority. Talk to your advisor about how working with Columbia Threadneedle Investments may help you stay the course and position your portfolio for consistent, sustainable outcomes, regardless of market conditions.
Sincerely,
Christopher O. Petersen
President, Columbia Funds
Columbia Funds are distributed by Columbia Management Investment Distributors, Inc., member FINRA, and managed by Columbia Management Investment Advisers, LLC.
© 2018 Columbia Management Investment Advisers, LLC. All rights reserved.
Multi-Manager Alternative Strategies Fund | Annual Report 2018
Multi-Manager Alternative Strategies Fund | Annual Report 2018
Investment objective
Multi-Manager Alternative Strategies Fund (the Fund) seeks capital appreciation with an emphasis on absolute (positive) returns.
Portfolio management
AlphaSimplex Group, LLC
Alexander Healy, Ph.D.
Kathryn Kaminski, Ph.D., CAIA
Philippe Lüdi, Ph.D., CFA
John Perry, Ph.D.
Robert Rickard
Robert Sinnott
AQR Capital Management, LLC
Clifford Asness, Ph.D., M.B.A.
Brian Hurst
John Liew, Ph.D., M.B.A.
Yao Hua Ooi
Ari Levine, M.S.
Manulife Asset Management (US) LLC
Daniel Janis III
Christopher Chapman, CFA
Thomas Goggins
Kisoo Park
TCW Investment Management Company, LLC
Stephen Kane, CFA
Laird Landmann
Tad Rivelle
Bryan Whalen, CFA
Water Island Capital, LLC
Edward Chen
Roger Foltynowicz, CFA, CAIA
Gregg Loprete
Todd Munn
| Average annual total returns (%) (for the period ended August 31, 2018) |
| | | Inception | 1 Year | 5 Years | Life |
| Class A | 04/23/12 | 0.22 | 0.02 | 0.91 |
| Institutional Class* | 01/03/17 | 0.55 | 0.15 | 1.02 |
| FTSE Three-Month U.S. Treasury Bill Index | | 1.49 | 0.46 | 0.38 |
All results shown assume reinvestment of distributions during the period. Returns do not reflect the deduction of taxes that a shareholder may pay on Fund distributions or on the redemption of Fund shares. Performance results reflect the effect of any fee waivers or reimbursements of Fund expenses by Columbia Management Investment Advisers, LLC and/or any of its affiliates. Absent these fee waivers or expense reimbursement arrangements, performance results would have been lower. Effective November 1, 2017, Class Z shares were renamed Institutional Class shares.
The performance information shown represents past performance and is not a guarantee of future results. The investment return and principal value of your investment will fluctuate so that your shares, when redeemed, may be worth more or less than their original cost. Current performance may be lower or higher than the performance information shown. You may obtain performance information current to the most recent month-end by contacting your financial intermediary, visiting columbiathreadneedleus.com/investor/ or calling 800.345.6611.
| * | The returns shown for periods prior to the share class inception date (including returns for the Life of the Fund, if shown, which are since Fund inception) include the returns of the Fund’s oldest share class. These returns are adjusted to reflect any higher class-related operating expenses of the newer share classes, as applicable. Please visit columbiathreadneedleus.com/investor/investment-products/mutual-funds/appended-performance for more information. |
The FTSE Three-Month U.S. Treasury Bill Index, an unmanaged index, is representative of the performance of three-month Treasury bills.
Indices are not available for investment, are not professionally managed and do not reflect sales charges, fees, brokerage commissions, taxes or other expenses of investing. Securities in the Fund may not match those in an index.
| 2 | Multi-Manager Alternative Strategies Fund | Annual Report 2018 |
Fund at a Glance (continued)
Performance of a hypothetical $10,000 investment (April 23, 2012 — August 31, 2018)
The chart above shows the change in value of a hypothetical $10,000 investment in Class A shares of Multi-Manager Alternative Strategies Fund during the stated time period, and does not reflect the deduction of taxes that a shareholder may pay on Fund distributions or on the redemption of Fund shares.
| Portfolio breakdown — long positions (%) (at August 31, 2018) |
| Alternative Strategies Funds | 0.4 |
| Asset-Backed Securities — Non-Agency | 5.9 |
| Commercial Mortgage-Backed Securities - Agency | 4.2 |
| Commercial Mortgage-Backed Securities - Non-Agency | 2.8 |
| Common Stocks | 18.0 |
| Convertible Bonds | 1.0 |
| Convertible Preferred Stocks | 0.6 |
| Corporate Bonds & Notes | 24.5 |
| Equity Funds | 1.2 |
| Exchange-Traded Funds | 0.8 |
| Foreign Government Obligations | 6.8 |
| Municipal Bonds | 0.7 |
| Options Purchased Calls | 0.0 (a) |
| Options Purchased Puts | 0.0 (a) |
| Preferred Debt | 0.1 |
| Preferred Stocks | 0.3 |
| Residential Mortgage-Backed Securities - Agency | 0.3 |
| Residential Mortgage-Backed Securities - Non-Agency | 8.8 |
| Senior Loans | 2.5 |
| Treasury Bills | 6.0 |
| U.S. Treasury Obligations | 0.2 |
| Warrants | 0.0 (a) |
| Short-Term Investments Segregated in Connection with Open Derivatives Contracts(b) | 26.0 |
| Total | 111.1 |
| (a) | Rounds to zero. |
| (b) | Includes investments in Money Market Funds (amounting to $129.6 million) which have been segregated to cover obligations relating to the Fund’s investment in derivatives which provide exposure to multiple markets. For a description of the Fund’s investments in derivatives, see Investments in derivatives following the Consolidated Portfolio of Investments and Note 2 to the Notes to Consolidated Financial Statements. |
Percentages indicated are based upon total investments, net of investments sold short and exclude investments in derivatives, if any. The Fund’s portfolio composition is subject to change.
Multi-Manager Alternative Strategies Fund | Annual Report 2018
| 3 |
Fund at a Glance (continued)
| Portfolio breakdown — short positions (%) (at August 31, 2018) |
| Common Stocks | (6.9) |
| Corporate Bonds & Notes | (0.4) |
| Exchange-Traded Funds | (3.8) |
| Total | (11.1) |
Percentages indicated are based upon total investments, net of investments sold short and exclude investments in derivatives, if any. The Fund’s portfolio composition is subject to change.
| Market exposure through derivatives investments (% of notional exposure) (at August 31, 2018)(a) |
| | Long | Short | Net |
| Fixed Income Derivative Contracts | 112.8 | (201.7) | (88.9) |
| Commodities Derivative Contracts | 10.9 | (18.8) | (7.9) |
| Equity Derivative Contracts | 54.7 | (6.5) | 48.2 |
| Foreign Currency Derivative Contracts | 125.7 | (177.1) | (51.4) |
| Total Notional Market Value of Derivative Contracts | 304.1 | (404.1) | (100.0) |
(a) The Fund has market exposure (long and/or short) to fixed income, commodity and equity assets classes and foreign currency through its investments in derivatives. The notional exposure of a financial instrument is the nominal or face amount that is used to calculate payments made on that instrument and/or changes in value for the instrument. The notional exposure is a hypothetical underlying quantity upon which payment obligations are computed. Notional exposures provide a gauge for how the Fund may behave given changes in individual markets. For a description of the Fund’s investments in derivatives, see Investments in derivatives following the Consolidated Portfolio of Investments, and Note 2 to the Notes to Consolidated Financial Statements.
| 4 | Multi-Manager Alternative Strategies Fund | Annual Report 2018 |
Manager Discussion of Fund Performance
Effective September 13, 2017, Manulife Asset Management (US) LLC (Manulife) was added as a manager of a portion of the Fund. Effective May 23, 2018, AlphaSimplex Group, LLC (AlphaSimplex) was added as a manager of a portion of the Fund. Currently, the Fund is managed by five independent money management firms and each invests a portion of the portfolio’s assets. As of August 31, 2018, AQR Capital Management, LLC (AQR), Water Island Capital, LLC (Water Island), TCW Investment Management Company, LLC (TCW), Manulife and AlphaSimplex managed approximately 12%, 25%, 30%, 20% and 13% of the portfolio, respectively.
For the 12-month period that ended August 31, 2018, the Fund’s Class A shares returned 0.22%. The Fund underperformed its benchmark, the FTSE 3-Month U.S. Treasury Bill Index, which returned 1.49% over the same period. The Fund’s underperformance can be attributed primarily to implementation of various alternative strategies.
Upward-trending equity markets proved overarching theme despite heightened volatility
Notwithstanding brief bouts of market volatility, highlighted by a severe stock market sell-off in February 2018, the overarching theme during the 12-month period ended August 31, 2018 was one of upward-trending equity markets. This was propagated by positive macroeconomic developments, such as strong corporate earnings, a pickup in U.S. economic growth and steady employment data that brought the jobless rate down to 3.8%. Further, long-dormant pricing pressures finally surfaced, as the core personal consumption expenditures index, the Federal Reserve’s (Fed) preferred inflation measure, hit the long-sought 2% year-over-year target in May 2018. However, at the same time, there was less accommodative Fed policy, with three interest rate hikes during the period, which resulted in higher short-term rates and a flatter U.S. Treasury yield curve, meaning the differential in shorter term and longer term yields narrowed. Also, a sharp and export-slowing appreciation of the U.S. dollar, combined with tariffs and trade skirmishes, gave rise to concern about lower economic growth prospects in the U.S. and globally. Further, market volatility increased considerably in the first eight months of 2018 following a near absence of it in 2017. This, too, weighed on investor confidence.
From a returns perspective, equities rallied strongly, with the S&P 500 Index, which measures the performance of 500 widely held, large-capitalization U.S. stocks and is frequently used as a general measure of market performance, gaining 19.66% during the period, despite a negative first quarter of 2018. In contrast, a backdrop of rising rates proved a challenging headwind for fixed-income markets, and the Bloomberg Barclays US Aggregate Bond Index returned -1.05% during the 12-month period ended August 31, 2018. U.S. Treasuries declined even more during the reporting period. Investment-grade corporate debt significantly lagged high-yield corporate bonds, owing to, among other factors, greater issuance and increased leverage. Among securitized issues, non-agency mortgage-backed securities benefited from durable housing fundamentals along with limited new supply to post solid returns, while agency mortgage-backed securities declined as a less accommodative Fed and uptick in rates proved to be headwinds. Asset-backed securities posted slightly positive returns, with non-traditional collateral, such as student loans, performing well. Finally, commercial mortgage-backed securities declined, though the sector significantly outpaced duration-matched U.S. Treasuries, led by non-agency commercial mortgage-backed securities.
Money management firms delivered results based on variety of alternative strategies
AQR: Our portion of the Fund, which pursues an active managed futures strategy, underperformed the benchmark during the period. We invest in a diverse portfolio of futures and forward contracts, both long and short, across the global equity, fixed-income, commodity and currency markets. In implementing our strategy, we utilize both short-term and long-term trend-following signals to attempt to profit from different types of trends that occur in each of these markets. Trend following can be simply described as taking long positions in markets that are rising in price and taking short positions in markets that are falling in price. In addition to trend-following signals, we also incorporate signals that seek to identify over-extended trends and seek to reduce risk when the chance of a reversal is perceived as higher than normal, since market reversals generally cause losses for trend-following strategies. The period saw mixed performance, with strong returns for trend following during the start and end of the period, but more challenging performance from February through July 2018.
By asset class, currencies detracted from our portion of the Fund’s performance during the period, while commodities, equities and fixed income contributed positively. By signal, over-extended trend signals, which attempt to identify trends that have gone too far and are due for reversals, detracted as did short-term trend following signals. Long-term trend-following signals contributed positively.
Multi-Manager Alternative Strategies Fund | Annual Report 2018
| 5 |
Manager Discussion of Fund Performance (continued)
TCW: Our portion of the Fund, which implements an unconstrained bond strategy, outperformed the benchmark during the period, largely due to relative positioning among spread, or non-government bond, sectors. In particular, exposure to securitized products proved beneficial, driven by an emphasis on non-agency mortgage-backed securities backed by subprime and alt-A collateral given solid investor sponsorship and improving collateral characteristics amidst rising home prices. (Alt-A loans are loans issued without significant documentation of employment or income by the borrower. They are generally considered to fall between prime and subprime mortgages with regard to risk.) A focus on federally guaranteed student loans, which led among asset-backed securities, was also additive. Smaller contributions came from higher quality more senior commercial mortgage-backed securities holdings. An allocation to high yield credit and favorable issue selection among investment-grade credit also contributed positively to returns, with the biggest gains coming from consumer non-cyclicals, energy, banking and communications.
All that said, returns faced the headwinds of a rising rate environment, with five- and 10-year U.S. Treasury yields increasing approximately 101 and 74 basis points, respectively, during the period. (A basis point is 1/100th of a percentage point.) As such, duration positioning in our portion of the Fund, which was extended to 2.1 years during the period as rates rose, was the largest detractor from returns. To a lesser extent, exposure to emerging market debt also detracted.
Water Island: Our portion of the Fund, which employs a variety of alternative strategies, outperformed the benchmark during the period. All three sub-strategies we employ — merger arbitrage, credit opportunities and equity special situations — contributed positively to our portion of the Fund’s results during the period.
The sectors that contributed most to returns were materials and health care. Performance in materials was mainly driven by a merger arbitrage position in the Monsanto/Bayer deal and by an equity special situations position in global diversified chemicals company Huntsman. Performance in health care was mostly driven by equity special situations positions in physician services provider Envision Healthcare and in healthcare benefits provider Aetna. On an individual event or deal basis, the largest contributors during the period were merger arbitrage positions in the Sky/Twenty-First Century Fox and Monsanto/Bayer deals as well as an equity special situations position in copper and aluminum wire and cable products manufacturer General Cable. The countries that made the strongest positive contributions to performance were the U.S., the U.K. and Bermuda.
The sector that detracted most from returns was information technology, followed by our portion of the Fund’s broad market hedges. In information technology, underperformance was driven mainly by a merger arbitrage position in the NXP Semiconductors/Qualcomm deal. As for market hedges, from time to time, in addition to various issuer-specific hedges, we may choose to implement broader market hedges in our portion of the Fund. The intent of these hedges is to reduce directional exposure and market risk while providing the portfolio with lower volatility and drawdowns. During the period, these hedges served their intended purpose. Short positions in certain broad equity index exchange-traded funds led to losses for the portfolio as equity markets rallied, but these losses were offset by gains in long positions. From an individual event or deal perspective, the largest detractors during the period were merger arbitrage positions in the NXP Semiconductors/Qualcomm and Time Warner/AT&T deals and an equity special situation position in U.S.-based biotechnology company Paratek Pharmaceuticals. The countries that detracted most from our portion of the Fund’s performance were the Netherlands, Germany and Switzerland.
Manulife: During the period from September 13, 2017, when we assumed management of a portion of the Fund, through August 31, 2018 (the “reporting period”), our portion of the Fund underperformed the benchmark. Our portion of the Fund, which employs a strategic fixed-income opportunity strategy, primarily seeks to add alpha, or value, through security selection, sector rotation, regional allocation and opportunistic currency investments. During the reporting period, we maintained a relatively defensive posture while also focusing on portfolio liquidity to minimize the impact of potential market volatility in the near term.
We embraced credit risk across corporate bonds and select emerging markets, with core positions in non-U.S. government bonds and segments of the asset-backed securities and commercial mortgage-backed securities sector for diversification. In currencies, we gradually increased currency risk with a view that the strong U.S. dollar trend had likely peaked. Lastly, with respect to duration, we had a bias toward the shorter end of our zero- to eight-year range in efforts to mitigate the overall
| 6 | Multi-Manager Alternative Strategies Fund | Annual Report 2018 |
Manager Discussion of Fund Performance (continued)
interest rate risk of the portfolio. From a macro perspective, increased volatility, driven by softer global economic data, higher global interest rates and escalation of global trade tensions, leading to a strengthening U.S. dollar and broad-based weakness across most emerging markets, had the largest effect on our portion of the Fund’s relative results.
More specifically, the primary detractors from our portion of the Fund’s relative results were currency management, duration positioning, particularly in the U.S., and allocations within emerging market sovereign bonds. Among currency allocations, overweights to the euro and to emerging market currencies, notably the Brazilian real, Mexican peso and Indonesian rupiah, detracted most. As for duration positioning, our portion of the Fund was positioned with a relatively short duration profile relative to the FTSE 3-Month U.S. Treasury Bill Index, but such positioning hurt primarily due to higher interest rates in the U.S. In emerging markets, allocations to government bonds of Indonesia, the Philippines and Mexico detracted most.
On the positive side, the primary contributors to our portion of the Fund’s relative results were asset allocation and sector allocation. Allocations within credit and securitized sectors helped most, as these sectors benefited from tighter spreads, or yield differentials to U.S. Treasuries, given strong U.S. economic growth and healthy corporate fundamentals. Within credit, an allocation to high-yield corporate bonds proved especially beneficial. Our portion of the Fund was positioned across a diverse set of industries, with a positive view on financials, technology/media/telecommunications and capital goods industries. Elsewhere within the fixed-income asset class, convertible bonds added value. We were opportunistic in convertible bond investments, with an emphasis on defensive companies and energy issuers, while avoiding biotechnology and pharmaceuticals companies. Holdings in Australia, New Zealand and euro-denominated government bond holdings boosted our portion of the Fund’s relative results as well. Select equity issues also contributed positively to relative results, especially in the banking industry, which benefited from rising rates in the U.S.
AlphaSimplex: During the period from May 23, 2018, when we assumed management of a portion of the Fund, through August 31, 2018 (the “reporting period”), our portion of the Fund outperformed the benchmark. Our portion of the Fund, which utilizes a managed futures strategy, benefited most from short positions in commodities. More specifically, short positions in precious metals and some agricultural contracts, including coffee, soybeans, sugar and corn, drove our portion of the Fund’s performance. Equities and currencies also contributed to positive performance. In equities, gains came from long positions in U.S. equities. Long positions in some international developed market equities also provided gains, including futures contracts on the equity indexes of Australia and Stockholm. Among currencies, the strategy’s overweight to the U.S. dollar and short positions in Australasia currencies, including both the New Zealand dollar and Australian dollar, contributed positively.
Within the different model types we employ, we saw positive performance from the adaptive models in equities and currencies, from the short-horizon models in currencies and commodities and from the basic trend models in equities and commodities. Overall, the adaptive models outperformed the other two on a risk-adjusted basis.
Losses came primarily from our portion of the Fund’s fixed-income positions. In particular, short positions in U.S. Treasury notes and Canadian 10-year government bonds hurt. However, these losses were partially offset by long exposures to European fixed income, which contributed positively, especially long positions in German bunds and French government bonds. Short positions in the Eurodollar, which is a measure of interest rates, and to the Japanese yen and Swiss franc also detracted. Within commodities, short positions in wheat and long positions in aluminum detracted slightly from performance. Our portion of the Fund also saw losses from most international developed and emerging markets equities, especially futures contracts on the equity indexes of the U.K., Germany and China.
Changes to the Fund’s portfolio based on strategy implementation
The Fund’s portfolio turnover rate for the 12-month period was 256%. A significant portion of the turnover was the result of rolling-maturity mortgage securities, processing of prepayments and opportunistic changes our managers made at the margin in response to valuations or market developments.
AQR: Our portion of the Fund aims to take a risk-balanced approach to asset classes, allowing for tactical deviation as a result of attractiveness of trends. Overall, trend following in the Canadian dollar vs. U.S. dollar, U.S. dollar vs. pound sterling and U.S. dollar vs. Mexican peso crosses were the largest detractors from performance during the period. These detractors were partially offset by trend following in the U.S. dollar vs. Turkish lira crosses, Brent crude oil and the Eurodollar, which contributed positively.
Multi-Manager Alternative Strategies Fund | Annual Report 2018
| 7 |
Manager Discussion of Fund Performance (continued)
By asset class, currencies detracted most from our portion of the Fund’s results during the period, driven by negative performance in U.S. dollar, euro and Japanese yen crosses. (Currency crosses are transactions consisting of a pair of currencies traded in foreign exchanges.) Reversals in the U.S. dollar contributed to losses. Ongoing trade negotiations caused short-term reversals throughout the period, especially versus the Canadian dollar and Mexican peso. The longer term U.S. dollar depreciation trend reversed sharply in April 2018 due to relative U.S. economic strength versus Europe. Reversals toward the end of the period around rising eurozone crisis concerns resulted in negative performance for euro and Japanese yen crosses. Japanese yen crosses detracted, as the currency reversed its bearish trend into the beginning of 2018, as the Bank of Japan announced it would curtail purchases of longer dated bonds. Later in the period, depreciation trends in the Turkish lira contributed positively to performance and contributed some offsetting gains.
Conversely, commodities contributed most positively to our portion of the Fund’s performance, driven by sustained long-term bullish trends in energy and over-extended signals viewing the sector as cheap. Still, reversals in agricultural commodities and base metals detracted during the period. Agricultural markets whipsawed during the period and caused losses for long-term signals on changing expectations for crop conditions, lower planted acreage and China’s announcement of tariffs on U.S. agriculturals. Rising concerns about trade tensions and softer economic growth data in China also led to reversals in base metals, particularly in the latter half of the period.
Trend following in equities also contributed positively to our portion of the Fund’s performance. Global equities broadly rallied, particularly in the U.S., aside from the sharp reversal in February and March 2018. Long-term signals drove gains, as they maintained bullish views during the period, while short-term signals experienced more difficult performance due to changing equity market dynamics in 2018 through August 31.
Fixed-income markets contributed positively to our portion of the Fund’s returns as well. Gains were driven by short positioning in short- to intermediate-term U.S. fixed income, which benefited from rising U.S. interest rates. Reversals in other geographies led to losses that partially offset these gains. Specifically, temporary spans of risk aversion around rising eurozone risks relative to Italian politics and Brexit negotiations led to reversals in Italian and U.K. fixed income that caused losses. By signal type, short-term trend signals and over-extended signals drove gains due to bearish views in U.S. fixed income, while longer term trend signals detracted due to reversals in European fixed income.
At the end of the period, our portion of the Fund was broadly long across geographies within equities based on ongoing agreement between short-term and long-term trend following signals. Within fixed income, our portion of the Fund ended the period long in German bund futures and short in U.S. bond futures. Within currencies, our portion of the Fund ended the period net short in U.S. dollar and Japanese yen crosses and net long in euro crosses. Within commodities, our portion of the Fund ended the period net long in energy and base metals and net short in agricultural products.
TCW: Given the ongoing aging of the credit cycle, we positioned our portion of the Fund with an eye toward risk reduction by moving into higher quality securities up in the capital structure. In terms of sector positioning, we modestly increased our portion of the Fund’s exposure to high quality, short-dated corporate credit holdings, with additions focused within financials. Also, as U.S. Treasury yields approached what we believed was closer to fair value, we gradually extended our portion of the Fund’s duration, moving from approximately 1.6 year to 2.1 years by the end of August 2018.
Water Island: During the period, we established a position in the acquisition of Validus Holdings by American International Group (AIG), a deal successfully completed in July 2018 and representing the first major acquisition by AIG since shedding its “too big to fail” designation in the latter half of 2017. We also initiated a position in Apergy, a spin-off of Dover Corporation’s well-site energy business into a separate public company focused on oilfield services. Upon completion of the spin-off, Apergy quickly re-rated to our expected valuation, and we sold the position. Also, upon a successful deal closing, our portion of the Fund no longer held a position in the acquisition of Microsemi by Microchip Technology. We chose to exit the position in JC Penney. During the first quarter of 2018, the company announced tender offers for a substantial portion of its near-dated bonds, including our portion of the Fund’s 2019 and 2020 maturity bonds. The company ultimately completed the offer during the second quarter of 2018, leading to a profit for our portion of the Fund.
Any shifts in sector exposure are largely the result of the available opportunity set in terms of corporate activity and the subset of events that meet our risk/reward criteria. That said, the sectors in which we saw the highest levels of corporate activity during the period were information technology, health care and consumer discretionary. While there were no changes to our portion of the Fund’s credit portfolio with regard to quality emphasis, yield curve or duration positioning, it is worth
| 8 | Multi-Manager Alternative Strategies Fund | Annual Report 2018 |
Manager Discussion of Fund Performance (continued)
noting that we focused on maintaining a short duration in the portfolio’s credit sleeve. We maintained this focus not only from the perspective of effective duration but also when viewed through the lens of “duration to catalyst” — our proprietary metric that takes into account the potential for a shortened timeline should a particular expected corporate event come to fruition. As always, we seek returns driven by the outcomes of specific, idiosyncratic corporate events, rather than by the overall market. Our strategy is agnostic in terms of capitalization, style, sector or country weighting.
Manulife: With tighter spreads and a view for higher interest rates, we rotated a portion of holdings out of fixed-rate investment-grade corporate bonds and short-term developed market government sovereigns. Against a backdrop of an improving macroeconomic environment and robust data in the U.S., the capital was redeployed into higher yielding assets, such as bank loans, high-yield corporate bonds and select emerging market sovereign bonds. In response to our expectation of rising rates, particularly in the U.S., we strategically managed duration lower from about 2.4 years to 1.6 years, primarily via U.S. Treasury and German bund futures contracts.
From a regional and country allocation perspective, we looked for opportunities to rotate out of developed markets and into select higher quality emerging markets, where we believe fundamentals are strong or improving and that offer better liquidity versus frontier markets. Additionally, we built an allocation within the eurozone, with a positive view on the currency. With respect to developed markets, we believed yields were compressed and valuations at or near fair value in many cases. Thus, we reduced holdings in high quality U.S. corporate bonds as well as those of Canada, Australia and New Zealand, and we added to positions in Brazil, Mexico, Indonesia and Malaysia.
At the end of the reporting period, our portion of the Fund continued to avoid holding U.S. Treasuries in favor of allocations to high-yield corporate bonds, bank loans and investment-grade corporate bonds. Our portion of the Fund also allocated capital to select emerging market sovereign bonds and asset-backed securities as of August 31, 2018. From a regional/country perspective, our portion of the Fund had core allocations in developed countries, primarily in the U.S. but also to Canada, Norway, Germany and Ireland. In emerging markets, our portion of the Fund favored investment grade countries, such as Mexico, Indonesia and the Philippines, in addition to Brazil.
AlphaSimplex: Our team focuses on developing quantitative and automated investment processes rather than employing discretion in managing portfolios. All aspects of our trading — which typically includes 18 to 25 securities per day — are governed by systematic algorithms. That said, shifts in positioning were made over the course of the reporting period, as the algorithms mandated. For example, overall, long positions in equities and bonds increased during the reporting period, as did, correspondingly, short positions in interest rates and currencies. Our portion of the Fund shifted from a long position in commodities at the start of the reporting period to a short exposure overall.
At the end of the reporting period, as a whole, our portion of the Fund had long exposures, all via futures contracts, to equities and bonds, and short exposures, all via futures contracts, to interest rates, currencies and commodities.
Derivative positions in the Fund
AQR: Our portion of the Fund invests mostly via derivatives, primarily futures contracts and futures-related instruments. These include global developed and emerging market equity index futures; global developed and emerging market currency forwards; commodity futures and swaps on commodity futures; and global developed market bonds and interest rate futures as well as swaps on bond futures. Our portion of the Fund is implemented using derivative instruments because we believe derivatives benerally offer a liquid, low cost and efficient way to gain diversified market exposure across asset classes. The overall impact of derivatives on performance was varied and linked to the strategies within which they are implemented.
TCW: Our portion of the Fund held U.S. Treasury futures as a method of managing duration. The use of these futures contributed positively, albeit modestly, to our portion of the Fund’s results during the period. Our portion of the Fund also used currency swaps, maintaining a position in Japanese government bonds, with the yen exposure fully hedged out using a U.S. dollar-yen cross currency swap given what we saw as an attractive yield premium. The currency swap position added value during the period.
Multi-Manager Alternative Strategies Fund | Annual Report 2018
| 9 |
Manager Discussion of Fund Performance (continued)
Water Island: During the period, our portion of the Fund employed total return equity swaps, equity options and currency forwards for four core purposes — to hedge currency risk, to invest outside the U.S. more efficiently, to create income and optionality, and to limit volatility and correlation. During the period, derivatives contributed positively to our portion of the Fund’s performance.
Manulife: During the reporting period, our portion of the Fund used interest rate futures and currency forwards to manage risk, provide diversification and enhance returns. The impact of currency forwards was mixed, as they also reflect hedging effects. However, overall, currency-related investments, including derivatives, detracted. The impact of interest rate futures was also mixed, as contributions from short positions in U.S. Treasury futures were offset by short positions in German bund futures, which were hurt by falling rates in Europe during the reporting period.
AlphaSimplex: Our portion of the Fund invests mostly via derivatives, primarily futures contracts and futures-related instruments. The derivatives employed are primarily exchange-traded futures contracts, which are used to gain liquid exposure to and rotate among a broad array of markets. We used these derivatives in pursuit of our portion of the Fund’s investment objective, to manage overall market exposure, and for alpha, or value, generation. Derivatives may be used to obtain long or short exposure to a particular asset class, region, currency, commodity or index. With the exception of returns generated by our portion of the Fund’s short-term cash portfolio, the overall impact of derivatives on performance was varied and linked to the asset class, region, currency, commodity or index within which they are implemented.
Market risk may affect a single issuer, sector of the economy, industry or the market as a whole. Investing in derivatives is a specialized activity that involves special risks that subject the Fund to significant loss potential, including when used as leverage, and may result in greater fluctuation in fund value. Commodity investments may be affected by the overall market and industry- and commodity-specific factors, and may be more volatile and less liquid than other investments. Fixed-income securities present issuer default risk. Non-investment-grade (high-yield or junk) securities present greater price volatility and more risk to principal and income than higher rated securities. A rise in interest rates may result in a price decline of fixed-income instruments held by the Fund, negatively impacting its performance and NAV. Falling rates may result in the Fund investing in lower yielding debt instruments, lowering the Fund’s income and yield. These risks may be heightened for longer maturity and duration securities. International investing involves certain risks and volatility due to potential political, economic or currency instabilities and different financial and accounting standards. Certain issuer events, including initial public offerings, business consolidation or restructuring, may present heightened risks to securities from the high degree of uncertainty associated with such events. Short positions (where the underlying asset is not owned) can create unlimited risk. Risks are enhanced for emerging market and sovereign debt issuers. The Fund is managed by multiple advisers independently of one another, which may result in contradicting trades (i.e., with no net benefit to the Fund), while increasing transaction costs. As a non-diversified fund, fewer investments could have a greater effect on performance. Market or other (e.g., interest rate) environments may adversely affect the liquidity of fund investments, negatively impacting their price. Generally, the less liquid the market at the time the Fund sells a holding, the greater the risk of loss or decline of value to the Fund. See the Fund’s prospectus for information on these and other risks.
The views expressed in this report reflect the current views of the respective parties. These views are not guarantees of future performance and involve certain risks, uncertainties and assumptions that are difficult to predict, so actual outcomes and results may differ significantly from the views expressed. These views are subject to change at any time based upon economic, market or other conditions and the respective parties disclaim any responsibility to update such views. These views may not be relied on as investment advice and, because investment decisions for a Columbia fund are based on numerous factors, may not be relied on as an indication of trading intent on behalf of any particular Columbia fund. References to specific securities should not be construed as a recommendation or investment advice.
| 10 | Multi-Manager Alternative Strategies Fund | Annual Report 2018 |
Understanding Your Fund’s Expenses
(Unaudited)
As an investor, you incur two types of costs. There are shareholder transaction costs, which may include redemption fees. There are also ongoing costs, which generally include management fees, distribution and/or service fees, and other fund expenses. The following information is intended to help you understand your ongoing costs (in dollars) of investing in the Fund and to help you compare these costs with the ongoing costs of investing in other mutual funds.
Analyzing your Fund’s expenses
To illustrate these ongoing costs, we have provided examples and calculated the expenses paid by investors in each share class of the Fund during the period. The actual and hypothetical information in the table is based on an initial investment of $1,000 at the beginning of the period indicated and held for the entire period. Expense information is calculated two ways and each method provides you with different information. The amount listed in the “Actual” column is calculated using the Fund’s actual operating expenses and total return for the period. You may use the Actual information, together with the amount invested, to estimate the expenses that you paid over the period. Simply divide your account value by $1,000 (for example, an $8,600 account value divided by $1,000 = 8.6), then multiply the results by the expenses paid during the period under the “Actual” column. The amount listed in the “Hypothetical” column assumes a 5% annual rate of return before expenses (which is not the Fund’s actual return) and then applies the Fund’s actual expense ratio for the period to the hypothetical return. You should not use the hypothetical account values and expenses to estimate either your actual account balance at the end of the period or the expenses you paid during the period. See “Compare with other funds” below for details on how to use the hypothetical data.
Compare with other funds
Since all mutual funds are required to include the same hypothetical calculations about expenses in shareholder reports, you can use this information to compare the ongoing cost of investing in the Fund with other funds. To do so, compare the hypothetical example with the 5% hypothetical examples that appear in the shareholder reports of other funds. As you compare hypothetical examples of other funds, it is important to note that hypothetical examples are meant to highlight the ongoing costs of investing in a fund only and do not reflect any transaction costs, such as redemption or exchange fees. Therefore, the hypothetical calculations are useful in comparing ongoing costs only, and will not help you determine the relative total costs of owning different funds. If transaction costs were included in these calculations, your costs would be higher.
| March 1, 2018 — August 31, 2018 |
| | Account value at the
beginning of the
period ($) | Account value at the
end of the
period ($) | Expenses paid during
the period ($) | Fund’s annualized
expense ratio (%) |
| | Actual | Hypothetical | Actual | Hypothetical | Actual | Hypothetical | Actual |
| Class A | 1,000.00 | 1,000.00 | 995.60 | 1,017.14 | 8.05 | 8.13 | 1.60 |
| Institutional Class | 1,000.00 | 1,000.00 | 996.70 | 1,018.40 | 6.79 | 6.87 | 1.35 |
Expenses paid during the period are equal to the annualized expense ratio for each class as indicated above, multiplied by the average account value over the period and then multiplied by the number of days in the Fund’s most recent fiscal half year and divided by 365.
Expenses do not include fees and expenses incurred indirectly by the Fund from its investment in underlying funds, including affiliated and non-affiliated pooled investment vehicles, such as mutual funds and exchange-traded funds.
The Fund is offered only through certain wrap fee programs sponsored and/or managed by Ameriprise Financial, Inc. or its affiliates. Participants in wrap fee programs pay other fees that are not included in the above table. Please refer to the wrap program documents for information about the fees charged.
Multi-Manager Alternative Strategies Fund | Annual Report 2018
| 11 |
Consolidated Portfolio of Investments
August 31, 2018
(Percentages represent value of investments compared to net assets)
Investments in securities
| Alternative Strategies Funds 0.3% |
| | Shares | Value ($) |
| John Laing Infrastructure Fund Ltd. | 935,798 | 1,768,868 |
Total Alternative Strategies Funds
(Cost $1,734,482) | 1,768,868 |
| Asset-Backed Securities — Non-Agency 5.2% |
| Issuer | Coupon
Rate | | Principal
Amount ($) | Value ($) |
| AIMCO CLO(a),(b) |
| Series 2014-AA Class AR |
3-month USD LIBOR + 1.100%
07/20/2026 | 3.448% | | 370,000 | 370,073 |
| Barings CLO Ltd.(a),(b) |
| Series 2013-IA Class AR |
3-month USD LIBOR + 0.800%
01/20/2028 | 3.148% | | 120,000 | 119,461 |
| Series 2018-3A Class A1 |
3-month USD LIBOR + 0.950%
07/20/2029 | 3.020% | | 450,000 | 449,033 |
| BlueMountain CLO Ltd.(a),(b) |
| Series 2014-2A Class AR |
3-month USD LIBOR + 0.930%
07/20/2026 | 3.278% | | 415,000 | 414,843 |
| Series 2015-2A Class A1R |
3-month USD LIBOR + 0.930%
07/18/2027 | 3.150% | | 425,000 | 424,578 |
| Capital One Multi-Asset Execution Trust |
| Series 2016-A3 Class A3 |
| 04/15/2022 | 1.340% | | 285,000 | 282,087 |
| Cedar Funding VI CLO Ltd.(a),(b) |
| Series 2016-6A Class A1 |
3-month USD LIBOR + 1.470%
10/20/2028 | 3.818% | | 400,000 | 400,077 |
| Chase Issuance Trust |
| Series 2016-A2 Class A |
| 06/15/2021 | 1.370% | | 330,000 | 326,724 |
| Series 2016-A5 Class A5 |
| 07/15/2021 | 1.270% | | 575,000 | 568,165 |
| Coinstar Funding LLC(a) |
| CMO Series 2017-1 Class A2 |
| 04/25/2047 | 5.216% | | 390,062 | 394,695 |
| Conseco Finance Corp.(c) |
| Series 2096-9 Class M1 |
| 08/15/2027 | 7.630% | | 774,900 | 848,532 |
| DB Master Finance LLC(a) |
| CMO Series 2015-1A Class A2II |
| 02/20/2045 | 3.980% | | 675,500 | 678,405 |
| CMO Series 2017-1A Class A2I |
| 11/20/2047 | 3.629% | | 99,250 | 97,312 |
| Asset-Backed Securities — Non-Agency (continued) |
| Issuer | Coupon
Rate | | Principal
Amount ($) | Value ($) |
| Discover Card Execution Note Trust |
| Series 2016-A4 Class A4 |
| 03/15/2022 | 1.390% | | 575,000 | 567,211 |
| Domino’s Pizza Master Issuer LLC(a),(b) |
| CMO Series 2017-1A Class A2I |
3-month USD LIBOR + 1.250%
07/25/2047 | 3.585% | | 371,250 | 372,898 |
| Dryden 30 Senior Loan Fund(a),(b) |
| Series 2013-30A Class AR |
3-month USD LIBOR + 0.820%
11/15/2028 | 3.134% | | 260,000 | 258,782 |
| Dryden XXV Senior Loan Fund(a),(b) |
| Series 2012-25A Class ARR |
3-month USD LIBOR + 0.900%
10/15/2027 | 3.239% | | 425,000 | 424,308 |
| Education Loan Asset-Backed Trust I(a),(b) |
| Series 2013-1 Class A2 |
1-month USD LIBOR + 0.800%
04/26/2032 | 2.865% | | 436,000 | 438,038 |
| EFS Volunteer No. 2 LLC(a),(b) |
| Series 2012-1 Class A2 |
1-month USD LIBOR + 1.350%
03/25/2036 | 3.415% | | 555,000 | 564,276 |
| FOCUS Brands Funding LLC(a) |
| CMO Series 2017-1 Class A2II |
| 04/30/2047 | 5.093% | | 162,937 | 166,107 |
| Ford Credit Auto Owner Trust |
| Series 2016-C Class A3 |
| 03/15/2021 | 1.220% | | 302,732 | 299,922 |
| Honda Auto Receivables Owner Trust |
| Series 2015-4 Class A3 |
| 09/23/2019 | 1.230% | | 101,219 | 100,971 |
| JG Wentworth XXII LLC(a) |
| Series 2010-3A Class A |
| 12/15/2048 | 3.820% | | 720,844 | 728,356 |
| LCM XXI LP(a),(b) |
| Series 20 18-21A Class AR |
3-month USD LIBOR + 0.880%
04/20/2028 | 3.239% | | 450,000 | 448,923 |
| Madison Park Funding XXX Ltd.(a),(b) |
| Series 2018-30A Class A |
3-month USD LIBOR + 0.750%
04/15/2029 | 3.089% | | 400,000 | 396,210 |
| Magnetite IX Ltd.(a),(b) |
| Series 2014-9A |
3-month USD LIBOR + 1.000%
07/25/2026 | 3.335% | | 370,000 | 370,171 |
The accompanying Notes to Consolidated Financial Statements are an integral part of this statement.
| 12 | Multi-Manager Alternative Strategies Fund | Annual Report 2018 |
Consolidated Portfolio of Investments (continued)
August 31, 2018
| Asset-Backed Securities — Non-Agency (continued) |
| Issuer | Coupon
Rate | | Principal
Amount ($) | Value ($) |
| Magnetite VII Ltd.(a),(b) |
| Series 2012-7A Class A1R2 |
3-month USD LIBOR + 0.800%
01/15/2028 | 3.139% | | 425,000 | 422,451 |
| METAL LLC(a) |
| Series 2017-1 Class A |
| 10/15/2042 | 4.581% | | 231,312 | 233,552 |
| MVW Owner Trust(a) |
| Series 2018-1A Class A |
| 01/21/2036 | 3.450% | | 142,384 | 142,599 |
| Navient Student Loan Trust(b) |
| Series 2014-1 Class A3 |
1-month USD LIBOR + 0.510%
06/25/2031 | 2.575% | | 703,104 | 706,749 |
| Navient Student Loan Trust(a),(b) |
| Series 2016-1A Class A |
1-month USD LIBOR + 0.700%
02/25/2070 | 2.765% | | 583,709 | 585,916 |
| Series 2016-2 Class A3 |
1-month USD LIBOR + 1.500%
06/25/2065 | 3.565% | | 729,000 | 760,282 |
| Series 2017-3A Class A3 |
1-month USD LIBOR + 1.050%
07/26/2066 | 3.115% | | 750,000 | 766,808 |
| Series 2018-3A Class A3 |
1-month USD LIBOR + 0.800%
03/25/2067 | 2.888% | | 900,000 | 900,020 |
| Nelnet Student Loan Trust(a),(b) |
| Series 2012-1A Class A |
1-month USD LIBOR + 0.800%
12/27/2039 | 2.865% | | 567,274 | 573,735 |
| Series 2012-2A Class A |
1-month USD LIBOR + 0.800%
12/26/2033 | 2.865% | | 863,029 | 867,232 |
| Nissan Auto Receivables Owner Trust |
| Series 2015-B Class A4 |
| 01/17/2022 | 1.790% | | 480,000 | 476,229 |
| SLC Student Loan Trust(b) |
| Series 2006-1 Class A6 |
3-month USD LIBOR + 0.160%
03/15/2055 | 2.501% | | 841,000 | 815,938 |
| SLM Student Loan Trust(a),(b) |
| Series 2003-10A Class A3 |
3-month USD LIBOR + 0.470%
12/15/2027 | 2.811% | | 523,134 | 525,025 |
| Series 2004-3 Class A6A |
3-month USD LIBOR + 0.550%
10/25/2064 | 2.885% | | 900,000 | 899,195 |
| Asset-Backed Securities — Non-Agency (continued) |
| Issuer | Coupon
Rate | | Principal
Amount ($) | Value ($) |
| SLM Student Loan Trust(b) |
| Series 2007-3 Class A4 |
3-month USD LIBOR + 0.060%
01/25/2022 | 2.395% | | 870,000 | 853,028 |
| Series 2007-6 Class A4 |
3-month USD LIBOR + 0.380%
10/25/2024 | 2.715% | | 469,924 | 470,802 |
| Series 2008-2 Class B |
3-month USD LIBOR + 1.200%
01/25/2083 | 3.535% | | 740,000 | 725,312 |
| Series 2008-4 Class A4 |
3-month USD LIBOR + 1.650%
07/25/2022 | 3.985% | | 518,787 | 529,680 |
| Series 2008-5 Class A4 |
3-month USD LIBOR + 1.700%
07/25/2023 | 4.035% | | 617,567 | 634,420 |
| Series 2008-7 Class B |
3-month USD LIBOR + 1.850%
07/26/2083 | 4.185% | | 500,000 | 512,674 |
| Series 2008-9 Class A |
3-month USD LIBOR + 1.500%
04/25/2023 | 3.835% | | 537,588 | 547,507 |
| Series 2011-2 Class A2 |
1-month USD LIBOR + 1.200%
10/25/2034 | 3.265% | | 1,040,000 | 1,067,843 |
| Series 2012-1 Class A3 |
1-month USD LIBOR + 0.950%
09/25/2028 | 3.015% | | 620,855 | 622,288 |
| Series 2014-2 Class A3 |
1-month USD LIBOR + 0.590%
03/25/2055 | 2.655% | | 527,022 | 530,816 |
| Subordinated, Series 2004-10 Class B |
3-month USD LIBOR + 0.370%
01/25/2040 | 2.705% | | 495,146 | 470,442 |
| Subordinated, Series 2007-2 Class B |
3-month USD LIBOR + 0.170%
07/25/2025 | 2.505% | | 700,000 | 642,836 |
| Subordinated, Series 2007-3 Class B |
3-month USD LIBOR + 0.150%
01/25/2028 | 2.485% | | 700,000 | 644,640 |
| Subordinated, Series 2012-7 Class B |
1-month USD LIBOR + 1.800%
09/25/2043 | 3.865% | | 550,000 | 551,906 |
| Taco Bell Funding LLC(a) |
| Series 2016-1A Class A23 |
| 05/25/2046 | 4.970% | | 379,225 | 389,828 |
| Textainer Marine Containers VII Ltd.(a) |
| Series 2018-1A Class A |
| 08/20/2043 | 4.110% | | 178,920 | 178,724 |
The accompanying Notes to Consolidated Financial Statements are an integral part of this statement.
Multi-Manager Alternative Strategies Fund | Annual Report 2018
| 13 |
Consolidated Portfolio of Investments (continued)
August 31, 2018
| Asset-Backed Securities — Non-Agency (continued) |
| Issuer | Coupon
Rate | | Principal
Amount ($) | Value ($) |
| Verizon Owner Trust(a) |
| Series 2017-1A Class A |
| 09/20/2021 | 2.060% | | 225,000 | 222,890 |
| Voya CLO Ltd.(a),(b) |
| Series 2015-2A Class AR |
3-month USD LIBOR + 0.970%
07/23/2027 | 3.317% | | 405,000 | 404,993 |
| Wendy’s Funding LLC(a) |
| CMO Series 2015-1 Class A2II |
| 06/15/2045 | 4.080% | | 258,685 | 260,237 |
| Series 2018-1A Class A2I |
| 03/15/2048 | 3.573% | | 99,500 | 96,982 |
Total Asset-Backed Securities — Non-Agency
(Cost $29,231,738) | 29,543,737 |
|
| Commercial Mortgage-Backed Securities - Agency 3.6% |
| | | | |
| Federal Home Loan Mortgage Corp. Multifamily Structured Pass-Through Certificates(c),(d) |
| CMO Series K014 Class X1 |
| 04/25/2021 | 1.323% | | 5,199,840 | 133,091 |
| Series K006 Class AX1 |
| 01/25/2020 | 1.112% | | 9,031,439 | 95,454 |
| Series K015 Class X3 |
| 08/25/2039 | 2.896% | | 2,000,000 | 153,938 |
| Series K021 Class X3 |
| 07/25/2040 | 2.035% | | 1,550,000 | 110,014 |
| Series K022 Class X3 |
| 08/25/2040 | 1.875% | | 1,550,000 | 101,038 |
| Series K025 Class X3 |
| 11/25/2040 | 1.812% | | 2,400,000 | 159,572 |
| Series K705 Class X3 |
| 09/25/2039 | 2.072% | | 10,000,000 | 33,021 |
| Series K712 Class X1 |
| 11/25/2019 | 1.445% | | 5,752,268 | 60,867 |
| Series K712 Class X3 |
| 05/25/2040 | 1.489% | | 6,500,000 | 118,444 |
| Series K714 Class X1 |
| 10/25/2020 | 0.802% | | 6,220,201 | 70,143 |
| Series K717 Class X3 |
| 11/25/2042 | 1.681% | | 3,500,000 | 159,376 |
| Series Q004 Class XFL |
| 10/25/2021 | 0.986% | | 6,354,335 | 153,195 |
| Federal Home Loan Mortgage Corp. Multifamily Structured Pass-Through Certificates |
| CMO Series K151 Class A3 |
| 04/25/2030 | 3.511% | | 710,000 | 711,127 |
| CMO Series KJ02 Class A2 |
| 09/25/2020 | 2.597% | | 296,402 | 294,506 |
| Commercial Mortgage-Backed Securities - Agency (continued) |
| Issuer | Coupon
Rate | | Principal
Amount ($) | Value ($) |
| Series K004 Class A3 |
| 08/25/2019 | 4.241% | | 700,000 | 707,140 |
| Series KJ05 Class A1 |
| 05/25/2021 | 1.418% | | 140,446 | 138,334 |
| Series KJ13 |
| 09/25/2021 | 2.055% | | 740,753 | 731,691 |
| Series X3FX Class A1FX |
| 03/25/2025 | 3.000% | | 423,820 | 419,324 |
| Federal Home Loan Mortgage Corp. Multifamily Structured Pass-Through Certificates(b) |
| Series KF09 Class A |
1-month USD LIBOR + 0.380%
05/25/2022 | 2.470% | | 400,974 | 401,222 |
| Series KF10 Class A |
1-month USD LIBOR + 0.380%
07/25/2022 | 2.470% | | 412,879 | 413,727 |
| Series KS02 Class A |
1-month USD LIBOR + 0.380%
08/25/2023 | 2.470% | | 613,694 | 613,882 |
| Federal Home Loan Mortgage Corp. Multifamily Structured Pass-Through Certificates(c) |
| Series Q004 Class A2H |
| 01/25/2021 | 2.749% | | 902,153 | 903,185 |
| Series Q006 Class APT1 |
| 07/25/2026 | 2.506% | | 1,071,500 | 1,085,132 |
| Federal National Mortgage Association |
| 10/01/2020 | 3.270% | | 340,129 | 341,078 |
| 12/01/2020 | 3.480% | | 446,433 | 449,201 |
| 04/01/2021 | 4.380% | | 423,008 | 434,486 |
| 07/01/2021 | 3.840% | | 337,599 | 344,558 |
| 07/01/2021 | 3.980% | | 555,000 | 567,510 |
| 08/01/2021 | 4.020% | | 245,449 | 250,622 |
| 09/01/2021 | 4.092% | | 232,717 | 238,200 |
| 10/01/2021 | 3.440% | | 265,491 | 268,244 |
| 12/01/2021 | 3.300% | | 808,705 | 816,823 |
| 04/01/2022 | 3.710% | | 211,531 | 215,510 |
| 11/01/2022 | 2.135% | | 787,682 | 761,436 |
| 04/01/2028 | 3.050% | | 390,000 | 377,892 |
| 01/01/2030 | 3.370% | | 446,256 | 444,141 |
| 05/01/2030 | 3.490% | | 600,000 | 598,314 |
| 03/01/2031 | 3.030% | | 402,567 | 383,898 |
| 07/01/2032 | 3.130% | | 350,000 | 330,829 |
| Series 2011-M2 Class A3 |
| 04/25/2021 | 3.764% | | 934,376 | 952,599 |
| Series 2011-M4 Class A2 |
| 06/25/2021 | 3.726% | | 739,365 | 752,537 |
| Series 2012-M1 Class A2 |
| 10/25/2021 | 2.729% | | 770,000 | 762,065 |
| Federal National Mortgage Association(b),(d) |
| Series 2011-M9 Class SA |
1-month USD LIBOR + 6.350%
01/25/2021 | 4.285% | | 1,723,306 | 90,191 |
The accompanying Notes to Consolidated Financial Statements are an integral part of this statement.
| 14 | Multi-Manager Alternative Strategies Fund | Annual Report 2018 |
Consolidated Portfolio of Investments (continued)
August 31, 2018
| Commercial Mortgage-Backed Securities - Agency (continued) |
| Issuer | Coupon
Rate | | Principal
Amount ($) | Value ($) |
| Federal National Mortgage Association(c),(d) |
| Series 2012-M14 Class X2 |
| 09/25/2022 | 0.565% | | 7,161,423 | 107,726 |
| Series 2016-M11B Class X2 |
| 07/25/2039 | 2.718% | | 3,682,231 | 185,735 |
| Series 2016-M4 Class X2 |
| 01/25/2039 | 2.684% | | 1,225,072 | 123,433 |
| Government National Mortgage Association |
| CMO Series 2010-140 Class C |
| 10/16/2043 | 3.674% | | 623,294 | 620,389 |
| CMO Series 2011-165 Class A |
| 10/16/2037 | 2.194% | | 472,354 | 467,874 |
| Government National Mortgage Association(c),(d) |
| CMO Series 2014-103 Class IO |
| 05/16/2055 | 0.618% | | 3,206,078 | 105,840 |
| CMO Series 2017-181 Class IO |
| 10/16/2059 | 0.626% | | 2,617,133 | 161,730 |
| Series 2011-53 Class IO |
| 05/16/2051 | 0.739% | | 5,003,409 | 143,178 |
| Series 2012-4 Class IO |
| 05/16/2052 | 0.214% | | 9,296,827 | 115,461 |
| Series 2014-88 Class IE |
| 03/16/2055 | 0.332% | | 4,550,448 | 115,915 |
| Series 2017-105 Class IO |
| 05/16/2059 | 0.736% | | 1,434,896 | 108,393 |
| Series 2017-145 Class IO |
| 04/16/2057 | 0.666% | | 2,957,324 | 184,001 |
| Series 2017-148 Class IO |
| 07/16/2059 | 0.658% | | 2,574,779 | 158,491 |
| Government National Mortgage Association(c) |
| Series 2011-65 |
| 09/16/2050 | 4.055% | | 475,003 | 478,448 |
| Series 2011-67 |
| 09/16/2051 | 3.984% | | 626,624 | 627,373 |
Total Commercial Mortgage-Backed Securities - Agency
(Cost $21,547,437) | 20,851,544 |
|
| Commercial Mortgage-Backed Securities - Non-Agency 2.4% |
| | | | |
| BBCMS Mortgage Trust(a),(b) |
| Subordinated, Series 2018-TALL Class E |
1-month USD LIBOR + 2.437%
03/15/2037 | 4.500% | | 160,000 | 160,454 |
| Bear Stearns Commercial Mortgage Securities Trust(a),(c) |
| Series 2004-PWR4 Class G |
| 06/11/2041 | 6.193% | | 480,000 | 488,936 |
| Bear Stearns Deutsche Bank Trust(a) |
| Subordinated, Series 2005-AFR1 Class G |
| 09/15/2027 | 5.293% | | 525,000 | 537,748 |
| Commercial Mortgage-Backed Securities - Non-Agency (continued) |
| Issuer | Coupon
Rate | | Principal
Amount ($) | Value ($) |
| BHMS Mortgage Trust(a),(b) |
| Series 2018-ATLS Class C |
1-month USD LIBOR + 1.900%
07/15/2035 | 3.972% | | 140,000 | 140,538 |
| Series 2018-ATLS Class D |
1-month USD LIBOR + 2.250%
07/15/2035 | 4.322% | | 100,000 | 100,377 |
| BX Commercial Mortgage Trust(a),(b) |
| Series 2018-BIOA Class E |
1-month USD LIBOR + 1.951%
03/15/2037 | 4.013% | | 305,000 | 305,859 |
| Citigroup Commercial Mortgage Trust |
| Series 2013-GC15 Class A2 |
| 09/10/2046 | 3.161% | | 248,607 | 248,426 |
| CLNS Trust(a),(b) |
| Subordinated, Series 2017-IKPR Class C |
1-month USD LIBOR + 1.100%
06/11/2032 | 3.179% | | 100,000 | 100,250 |
| Cold Storage Trust(a),(b) |
| Series 2017-ICE3 Class C |
1-month USD LIBOR + 1.350%
04/15/2036 | 3.413% | | 230,000 | 231,005 |
| Commercial Mortgage Pass-Through Certificates(c),(d) |
| Series 2012-CR3 Class XA |
| 10/15/2045 | 2.037% | | 1,778,753 | 111,087 |
| Commercial Mortgage Trust |
| Series 2006-C8 Class AJ |
| 12/10/2046 | 5.377% | | 14,537 | 14,626 |
| Series 2014-CR16 Class A2 |
| 04/10/2047 | 3.042% | | 405,000 | 405,407 |
| Series 2014-UBS4 Class A2 |
| 08/10/2047 | 2.963% | | 562,643 | 563,195 |
| Commercial Mortgage Trust(c),(d) |
| Series 2012-CR4 Class XA |
| 10/15/2045 | 1.942% | | 3,882,441 | 208,676 |
| Series 2013-CR13 Class XA |
| 11/12/2046 | 1.029% | | 3,627,176 | 104,115 |
| Series 2013-LC6 Class XA |
| 01/10/2046 | 1.507% | | 2,021,033 | 97,308 |
| Commercial Mortgage Trust(a),(c),(d) |
| Series 2012-LC4 Class XA |
| 12/10/2044 | 2.381% | | 3,259,475 | 174,079 |
| Commercial Mortgage Trust(a),(c) |
| Series 2014-277P Class A |
| 08/10/2049 | 3.732% | | 165,000 | 166,642 |
| Core Industrial Trust(a) |
| Series 2015-CALW Class A |
| 02/10/2034 | 3.040% | | 184,991 | 184,043 |
The accompanying Notes to Consolidated Financial Statements are an integral part of this statement.
Multi-Manager Alternative Strategies Fund | Annual Report 2018
| 15 |
Consolidated Portfolio of Investments (continued)
August 31, 2018
| Commercial Mortgage-Backed Securities - Non-Agency (continued) |
| Issuer | Coupon
Rate | | Principal
Amount ($) | Value ($) |
| Credit Suisse First Boston Mortgage Securities Corp.(c),(d) |
| Series 98-C1 Class AX |
| 05/17/2040 | 0.729% | | 535,478 | 7,504 |
| CSAIL Commercial Mortgage Trust |
| Series 2015-C1 Class A2 |
| 04/15/2050 | 2.970% | | 1,000,000 | 999,242 |
| DBGS Mortgage Trust(a),(b) |
| Series 2018-BIOD Class B |
1-month USD LIBOR + 0.888%
05/15/2035 | 2.951% | | 146,731 | 146,285 |
| Grace Mortgage Trust(a) |
| Series 2014-GRCE Class A |
| 06/10/2028 | 3.369% | | 145,000 | 145,712 |
| GS Mortgage Securities Corp. II(a) |
| Series 2012-ALOH Class A |
| 04/10/2034 | 3.551% | | 290,000 | 292,667 |
| Series 2013-KING Class A |
| 12/10/2027 | 2.706% | | 163,490 | 162,827 |
| GS Mortgage Securities Corp. Trust(a) |
| Series 2012-SHOP Class A |
| 06/05/2031 | 2.933% | | 170,000 | 170,149 |
| GS Mortgage Securities Corp. Trust(a),(c),(d) |
| Series 2017-GPTX Class XCP |
| 05/10/2034 | 0.911% | | 6,000,000 | 80,199 |
| GS Mortgage Securities Corp. Trust(a),(b) |
| Series 2018-CHLL Class F |
1-month USD LIBOR + 3.300%
02/15/2037 | 5.363% | | 100,000 | 100,073 |
| Series 2018-TWR Class A |
1-month USD LIBOR + 0.900%
07/15/2031 | 2.974% | | 135,000 | 135,004 |
| GS Mortgage Securities Trust(a),(c),(d) |
| 08/10/2043 | 1.365% | | 6,907,926 | 145,225 |
| Series 2012-GC6 Class XB |
| 01/10/2045 | 0.257% | | 10,648,392 | 76,652 |
| Home Partners of America Trust(a),(b) |
| Subordinated, Series 2018-1 Class D |
1-month USD LIBOR + 1.450%
07/17/2037 | 3.384% | | 120,000 | 118,921 |
| Irvine Core Office Trust(a),(c) |
| Series 2013-IRV Class A2 |
| 05/15/2048 | 3.279% | | 170,000 | 168,813 |
| JPMBB Commercial Mortgage Securities Trust |
| Series 2013-C14 Class A2 |
| 08/15/2046 | 3.019% | | 245,069 | 245,236 |
| JPMBB Commercial Mortgage Securities Trust(c),(d) |
| Series 2014-C23 Class XA |
| 09/15/2047 | 0.930% | | 4,261,217 | 109,128 |
| Commercial Mortgage-Backed Securities - Non-Agency (continued) |
| Issuer | Coupon
Rate | | Principal
Amount ($) | Value ($) |
| Series 2014-C26 Class XA |
| 01/15/2048 | 1.257% | | 3,825,933 | 160,259 |
| JPMorgan Chase Commercial Mortgage Securities Corp.(a),(c) |
| Series 2018-AON Class D |
| 07/05/2031 | 4.613% | | 55,000 | 56,642 |
| JPMorgan Chase Commercial Mortgage Securities Trust(a) |
| Series 2009-IWST Class A2 |
| 12/05/2027 | 5.633% | | 650,000 | 670,915 |
| Series 2012-HSBC Class A |
| 07/05/2032 | 3.093% | | 209,656 | 209,133 |
| Series 2018-BCON Class A |
| 01/05/2031 | 3.735% | | 170,000 | 172,314 |
| JPMorgan Chase Commercial Mortgage Securities Trust(c),(d) |
| Series 2012-LC9 Class XA |
| 12/15/2047 | 1.701% | | 4,479,845 | 214,424 |
| JPMorgan Chase Commercial Mortgage Securities Trust |
| Series 2013-C16 Class A2 |
| 12/15/2046 | 3.070% | | 366,209 | 365,689 |
| JPMorgan Chase Commercial Mortgage Securities Trust(a),(b) |
| Series 2018-PHH Class C |
1-month USD LIBOR + 1.360%
06/15/2020 | 3.410% | | 55,000 | 55,121 |
| Madison Avenue Trust(a) |
| Series 2013-650M Class A |
| 10/12/2032 | 3.843% | | 155,000 | 156,680 |
| Morgan Stanley Bank of America Merrill Lynch Trust(c),(d) |
| Series 2013-C7 Class XA |
| 02/15/2046 | 1.521% | | 2,663,303 | 128,840 |
| Morgan Stanley Capital I Trust(a),(c),(d) |
| Series 2012-C4 Class XA |
| 03/15/2045 | 2.269% | | 3,483,746 | 201,871 |
| Morgan Stanley Capital I Trust(a) |
| Series 2013-WLSR Class A |
| 01/11/2032 | 2.695% | | 180,000 | 178,595 |
| Series 2014-MP Class A |
| 08/11/2033 | 3.469% | | 140,000 | 141,453 |
| Morgan Stanley Capital I Trust(a),(b) |
| Subordinated, Series 2017-CLS Class D |
1-month USD LIBOR + 1.400%
11/15/2034 | 3.463% | | 70,000 | 70,044 |
| MSDB Trust(a),(c) |
| Subordinated, Series 2017-712F Class B |
| 07/11/2039 | 3.568% | | 280,000 | 269,089 |
| OBP Depositor LLC Trust(a) |
| Series 2010-OBP Class A |
| 07/15/2045 | 4.646% | | 150,000 | 154,283 |
| RBS Commercial Funding, Inc., Trust(a),(c) |
| Series 2013-GSP Class A |
| 01/13/2032 | 3.961% | | 165,000 | 168,022 |
The accompanying Notes to Consolidated Financial Statements are an integral part of this statement.
| 16 | Multi-Manager Alternative Strategies Fund | Annual Report 2018 |
Consolidated Portfolio of Investments (continued)
August 31, 2018
| Commercial Mortgage-Backed Securities - Non-Agency (continued) |
| Issuer | Coupon
Rate | | Principal
Amount ($) | Value ($) |
| SFAVE Commercial Mortgage Securities Trust(a),(c) |
| Subordinated, Series 2015-5AVE Class D |
| 01/05/2043 | 4.534% | | 200,000 | 163,715 |
| UBS Commercial Mortgage Trust(a),(c),(d) |
| Series 2012-C1 Class XA |
| 05/10/2045 | 2.256% | | 2,433,894 | 146,624 |
| UBS Commercial Mortgage Trust |
| Series 2018-C12 Class A1 |
| 08/15/2051 | 3.294% | | 655,000 | 656,121 |
| VNDO Mortgage Trust(a) |
| Series 2012-6AVE Class A |
| 11/15/2030 | 2.996% | | 170,000 | 168,183 |
| Series 2013-PENN Class A |
| 12/13/2029 | 3.808% | | 170,000 | 171,842 |
| Vornado DP LLC Trust(a) |
| Series 2010-VNO Class A2FX |
| 09/13/2028 | 4.004% | | 335,000 | 341,881 |
| Wells Fargo Commercial Mortgage Trust(a),(c) |
| Series 2013-120B Class A |
| 03/18/2028 | 2.800% | | 170,000 | 168,491 |
| WF-RBS Commercial Mortgage Trust |
| Series 2012-C10 Class ASB |
| 12/15/2045 | 2.453% | | 843,322 | 831,333 |
| WF-RBS Commercial Mortgage Trust(a),(c),(d) |
| Series 2012-C8 Class XA |
| 08/15/2045 | 2.004% | | 1,753,697 | 101,382 |
| Series 2012-C9 Class XA |
| 11/15/2045 | 2.049% | | 1,857,551 | 117,869 |
| WF-RBS Commercial Mortgage Trust(c),(d) |
| Series 2014-C24 Class XA |
| 11/15/2047 | 1.031% | | 2,830,369 | 110,509 |
| Series 2014-LC14 Class XA |
| 03/15/2047 | 1.457% | | 2,480,505 | 104,398 |
| Worldwide Plaza Trust(a),(c) |
| Series 2017-WWP Class D |
| 11/10/2036 | 3.715% | | 120,000 | 113,643 |
Total Commercial Mortgage-Backed Securities - Non-Agency
(Cost $14,253,180) | 14,015,773 |
| Common Stocks 15.7% |
| Issuer | Shares | Value ($) |
| Consumer Discretionary 3.9% |
| Auto Components 0.4% |
| Federal-Mogul Holdings Corp.(e),(f),(g) | 146,838 | 1,468,380 |
| Grammer AG | 10,182 | 673,669 |
| Total | | 2,142,049 |
| Common Stocks (continued) |
| Issuer | Shares | Value ($) |
| Hotels, Restaurants & Leisure 0.6% |
| Hilton Grand Vacations, Inc.(f) | 8,040 | 262,586 |
| Wyndham Destinations, Inc. | 6,704 | 296,317 |
| Wyndham Hotels & Resorts, Inc.(h),(i) | 46,268 | 2,625,709 |
| Total | | 3,184,612 |
| Household Durables —% |
| Lennar Corp., Class A | 2,025 | 104,632 |
| Media 2.8% |
| 21st Century Fox, Inc., Class A(h),(i) | 168,981 | 7,671,737 |
| CBS Corp., Class B Non Voting(h),(i) | 17,688 | 937,818 |
| Kabel Deutschland Holding AG | 4,300 | 529,070 |
| Sky PLC | 103,700 | 2,071,077 |
| Starz Acquisition LLC(e),(f),(g) | 89,648 | 3,184,297 |
| Tribune Media Co. | 32,492 | 1,198,630 |
| Viacom, Inc., Class B(h),(i) | 17,688 | 517,905 |
| Total | | 16,110,534 |
| Specialty Retail 0.1% |
| Home Depot, Inc. (The) | 1,633 | 327,857 |
| Tractor Supply Co. | 2,061 | 181,945 |
| Total | | 509,802 |
| Total Consumer Discretionary | 22,051,629 |
| Consumer Staples 1.3% |
| Food Products 1.2% |
| Dole Food Co., Inc.(e),(f),(g) | 96,900 | 67,830 |
| Hain Celestial Group, Inc. (The)(f) | 53,419 | 1,525,647 |
| Pinnacle Foods, Inc.(h),(i) | 81,472 | 5,411,370 |
| Total | | 7,004,847 |
| Personal Products 0.1% |
| Ontex Group NV | 16,731 | 480,075 |
| Total Consumer Staples | 7,484,922 |
| Energy 0.5% |
| Oil, Gas & Consumable Fuels 0.5% |
| Andeavor | 20,215 | 3,088,650 |
| Total Energy | 3,088,650 |
The accompanying Notes to Consolidated Financial Statements are an integral part of this statement.
Multi-Manager Alternative Strategies Fund | Annual Report 2018
| 17 |
Consolidated Portfolio of Investments (continued)
August 31, 2018
| Common Stocks (continued) |
| Issuer | Shares | Value ($) |
| Financials 1.2% |
| Banks 0.6% |
| Ameris Bancorp | 3,335 | 165,583 |
| BankUnited, Inc. | 3,508 | 136,075 |
| BOK Financial Corp. | 2,331 | 239,044 |
| Citigroup, Inc. | 4,085 | 291,016 |
| Columbia Banking System, Inc. | 8,249 | 348,520 |
| Comerica, Inc. | 3,030 | 295,365 |
| Cullen/Frost Bankers, Inc. | 497 | 55,112 |
| German American Bancorp, Inc. | 809 | 30,410 |
| Investors Bancorp, Inc. | 8,750 | 112,000 |
| JPMorgan Chase & Co. | 4,172 | 478,028 |
| M&T Bank Corp. | 909 | 161,029 |
| Park National Corp. | 456 | 50,228 |
| Pinnacle Financial Partners, Inc. | 867 | 55,965 |
| Prosperity Bancshares, Inc. | 2,124 | 158,960 |
| Renasant Corp. | 4,770 | 222,711 |
| Stock Yards Bancorp, Inc. | 803 | 31,076 |
| U.S. Bancorp | 5,625 | 304,369 |
| Washington Trust Bancorp, Inc. | 1,934 | 116,040 |
| Zions Bancorporation | 1,048 | 55,848 |
| Total | | 3,307,379 |
| Consumer Finance —% |
| Capital One Financial Corp. | 2,184 | 216,412 |
| Insurance 0.6% |
| Xl Group Ltd.(h),(i) | 58,840 | 3,376,828 |
| Total Financials | 6,900,619 |
| Health Care 1.8% |
| Health Care Equipment & Supplies 0.3% |
| NxStage Medical, Inc.(f),(h),(i) | 62,541 | 1,772,412 |
| Health Care Providers & Services 1.2% |
| Aetna, Inc. | 7,729 | 1,547,887 |
| Air Methods Corp.(e),(f),(g) | 238,585 | 2,564,789 |
| Aveta, Inc. Escrow(e),(f),(g) | 6,409,000 | 6 |
| Aveta, Inc. Escrow(e),(f),(g) | 2,397,000 | 2 |
| Envision Healthcare Corp.(f),(h),(i) | 23,178 | 1,051,354 |
| Common Stocks (continued) |
| Issuer | Shares | Value ($) |
| Express Scripts Holding Co.(f) | 5,398 | 475,132 |
| Humana, Inc.(h),(i) | 3,688 | 1,229,063 |
| Total | | 6,868,233 |
| Pharmaceuticals 0.3% |
| Akorn, Inc.(f),(j) | 13,250 | 207,892 |
| Bayer AG, Registered Shares | 9,435 | 880,296 |
| Paratek Pharmaceuticals, Inc.(f),(h),(i) | 79,636 | 816,269 |
| Total | | 1,904,457 |
| Total Health Care | 10,545,102 |
| Industrials 1.0% |
| Construction & Engineering —% |
| HC2 Holdings, Inc.(f) | 11,950 | 74,927 |
| Machinery 0.5% |
| Trinity Industries, Inc.(h),(i) | 83,797 | 3,003,284 |
| Professional Services 0.2% |
| Nielsen Holdings PLC(h),(i) | 39,575 | 1,028,950 |
| Road & Rail 0.3% |
| Norfolk Southern Corp.(h),(i) | 10,495 | 1,824,451 |
| Total Industrials | 5,931,612 |
| Information Technology 2.1% |
| Communications Equipment 0.2% |
| NETGEAR, Inc.(f),(h),(i) | 18,158 | 1,286,494 |
| Electronic Equipment, Instruments & Components —% |
| Radisys Corp.(f),(h),(i) | 38,722 | 61,568 |
| IT Services 0.8% |
| DXC Technology Co.(h),(i),(j) | 15,174 | 1,382,200 |
| Perspecta, Inc. | 65,267 | 1,518,110 |
| Travelport Worldwide Ltd.(h),(i) | 85,168 | 1,581,570 |
| Total | | 4,481,880 |
| Semiconductors & Semiconductor Equipment 0.2% |
| Integrated Device Technology, Inc.(f) | 16,362 | 695,221 |
| NXP Semiconductors NV(f) | 3,749 | 349,182 |
| Total | | 1,044,403 |
The accompanying Notes to Consolidated Financial Statements are an integral part of this statement.
| 18 | Multi-Manager Alternative Strategies Fund | Annual Report 2018 |
Consolidated Portfolio of Investments (continued)
August 31, 2018
| Common Stocks (continued) |
| Issuer | Shares | Value ($) |
| Software 0.6% |
| Dell Technologies, Inc. - VMware, Inc., Class V(f),(h),(i) | 11,971 | 1,151,251 |
| Gemalto NV | 15,171 | 880,839 |
| Link Mobility Group ASA(f) | 24,035 | 634,827 |
| Symantec Corp. | 41,286 | 832,326 |
| Total | | 3,499,243 |
| Technology Hardware, Storage & Peripherals 0.3% |
| Xerox Corp.(h),(i) | 60,272 | 1,679,178 |
| Total Information Technology | 12,052,766 |
| Materials 0.8% |
| Chemicals 0.5% |
| Ashland Global Holdings, Inc. | 26,470 | 2,228,774 |
| Axalta Coating Systems Ltd.(f) | 15,004 | 457,622 |
| Total | | 2,686,396 |
| Metals & Mining 0.3% |
| Vedanta Resources PLC | 148,277 | 1,597,685 |
| Total Materials | 4,284,081 |
| Real Estate 2.6% |
| Equity Real Estate Investment Trusts (REITS) 2.6% |
| CorePoint Lodging, Inc.(h),(i) | 82,058 | 1,710,909 |
| Education Realty Trust, Inc.(h),(i) | 95,176 | 3,938,383 |
| Forest City Realty Trust, Inc., Class A | 186,752 | 4,696,813 |
| Macerich Co. (The)(h),(i) | 34,457 | 2,024,004 |
| ProLogis, Inc. | 77 | 5,173 |
| Spirit MTA REIT(f) | 27,870 | 298,766 |
| Spirit Realty Capital, Inc.(h),(i) | 225,842 | 1,890,298 |
| Total | | 14,564,346 |
| Total Real Estate | 14,564,346 |
| Utilities 0.5% |
| Multi-Utilities 0.5% |
| Vectren Corp.(h),(i) | 38,791 | 2,761,919 |
| Total Utilities | 2,761,919 |
Total Common Stocks
(Cost $87,791,365) | 89,665,646 |
| Convertible Bonds(k) 0.9% |
| Issuer | Coupon
Rate | | Principal
Amount ($) | Value ($) |
| Aerospace & Defense 0.3% |
| RTI International Metals, Inc. |
| 10/15/2019 | 1.625% | | 1,879,000 | 1,934,733 |
| Cable and Satellite 0.0% |
| DISH Network Corp. |
| 08/15/2026 | 3.375% | | 80,000 | 75,248 |
| Consumer Cyclical Services 0.1% |
| Liberty Expedia Holdings, Inc.(a) |
| 06/30/2047 | 1.000% | | 270,000 | 270,793 |
| Electric 0.1% |
| NextEra Energy Partners LP(a) |
| 09/15/2020 | 1.500% | | 300,000 | 306,633 |
| NRG Energy, Inc.(a) |
| 06/01/2048 | 2.750% | | 200,000 | 205,031 |
| Total | 511,664 |
| Health Care 0.1% |
| Danaher Corp.(l) |
| 01/22/2021 | 0.000% | | 100,000 | 395,349 |
| Healthcare Insurance 0.1% |
| Anthem, Inc. |
| 10/15/2042 | 2.750% | | 95,000 | 344,783 |
| Independent Energy 0.0% |
| Oasis Petroleum, Inc. |
| 09/15/2023 | 2.625% | | 185,000 | 243,198 |
| Other REIT 0.0% |
| Redwood Trust, Inc. |
| 07/15/2024 | 5.625% | | 130,000 | 129,105 |
| Pharmaceuticals 0.0% |
| Bayer Capital Corp BV(a) |
| Subordinated |
| 11/22/2019 | 5.625% | EUR | 200,000 | 220,833 |
| Technology 0.1% |
| Novellus Systems, Inc. |
| 05/15/2041 | 2.625% | | 30,000 | 156,347 |
| Sony Corp.(l) |
| 09/30/2022 | 0.000% | JPY | 26,000,000 | 325,673 |
| Total | 482,020 |
| Wireless 0.0% |
| Avaya Holdings Corp.(a) |
| 06/15/2023 | 2.250% | | 210,000 | 220,277 |
The accompanying Notes to Consolidated Financial Statements are an integral part of this statement.
Multi-Manager Alternative Strategies Fund | Annual Report 2018
| 19 |
Consolidated Portfolio of Investments (continued)
August 31, 2018
| Convertible Bonds(k) (continued) |
| Issuer | Coupon
Rate | | Principal
Amount ($) | Value ($) |
| Wirelines 0.1% |
| GCI Liberty, Inc.(a) |
| 09/30/2046 | 1.750% | | 325,000 | 339,668 |
Total Convertible Bonds
(Cost $4,901,512) | 5,167,671 |
| Convertible Preferred Stocks 0.6% |
| Issuer | | Shares | Value ($) |
| Energy 0.1% |
| Oil, Gas & Consumable Fuels 0.1% |
| Hess Corp. | 8.000% | 2,900 | 216,340 |
| Kinder Morgan, Inc. | 9.750% | 13,600 | 454,376 |
| Total | | | 670,716 |
| Total Energy | 670,716 |
| Health Care 0.1% |
| Health Care Equipment & Supplies 0.1% |
| Becton Dickinson and Co. | 6.125% | 9,350 | 613,921 |
| Total Health Care | 613,921 |
| Industrials 0.1% |
| Machinery 0.1% |
| Fortive Corp. | 5.000% | 390 | 419,210 |
| Stanley Black & Decker, Inc. | 5.375% | 1,535 | 167,699 |
| Total | | | 586,909 |
| Total Industrials | 586,909 |
| Real Estate 0.1% |
| Equity Real Estate Investment Trusts (REITS) 0.1% |
| Crown Castle International Corp. | 6.875% | 260 | 286,242 |
| Total Real Estate | 286,242 |
| Utilities 0.2% |
| Electric Utilities 0.1% |
| NextEra Energy, Inc. | 6.123% | 9,000 | 513,900 |
| Gas Utilities —% |
| South Jersey Industries, Inc. | 7.250% | 2,050 | 110,823 |
| Multi-Utilities 0.1% |
| Dominion Resources, Inc. | 6.750% | 7,925 | 372,792 |
| Total Utilities | 997,515 |
Total Convertible Preferred Stocks
(Cost $3,135,250) | 3,155,303 |
| Corporate Bonds & Notes(k) 21.3% |
| Issuer | Coupon
Rate | | Principal
Amount ($) | Value ($) |
| Aerospace & Defense 0.2% |
| BAE Systems Holdings, Inc.(a) |
| 06/01/2019 | 6.375% | | 350,000 | 358,713 |
| L3 Technologies, Inc. |
| 06/15/2028 | 4.400% | | 260,000 | 261,643 |
| Northrop Grumman Corp. |
| 01/15/2025 | 2.930% | | 355,000 | 338,410 |
| Total | 958,766 |
| Airlines 0.1% |
| American Airlines Pass-Through Trust |
| Series 2016-2 Class AA |
| 06/15/2028 | 3.200% | | 230,500 | 219,062 |
| Continental Airlines Pass-Through Trust |
| 04/19/2022 | 5.983% | | 119,230 | 126,062 |
| U.S. Airways Pass-Through Trust |
| 04/22/2023 | 6.250% | | 274,043 | 292,893 |
| Total | 638,017 |
| Apartment REIT 0.1% |
| Mid-America Apartments LP |
| 10/15/2023 | 4.300% | | 325,000 | 331,107 |
| Automotive 0.1% |
| General Motors Financial Co., Inc. |
| 04/13/2020 | 2.650% | | 370,000 | 366,009 |
| 07/13/2020 | 3.200% | | 200,000 | 199,254 |
| Total | 565,263 |
| Banking 2.8% |
| Bank of America Corp.(m) |
| 12/20/2023 | 3.004% | | 1,079,000 | 1,050,757 |
| 10/01/2025 | 3.093% | | 225,000 | 215,336 |
| 04/24/2028 | 3.705% | | 750,000 | 725,214 |
| 07/23/2029 | 4.271% | | 270,000 | 272,976 |
| Citibank NA |
| 05/01/2020 | 3.050% | | 1,100,000 | 1,099,637 |
| 07/23/2021 | 3.400% | | 360,000 | 360,683 |
| Citigroup, Inc. |
| 12/07/2018 | 2.050% | | 500,000 | 499,456 |
| 05/22/2019 | 8.500% | | 250,000 | 260,115 |
| Citigroup, Inc.(b) |
3-month AUD BBR + 1.550%
05/04/2021 | 3.516% | AUD | 280,000 | 204,573 |
| ConnectOne Bancorp, Inc.(m) |
| Subordinated |
| 02/01/2028 | 5.200% | | 65,000 | 63,213 |
| Dime Community Bancshares, Inc.(m) |
| Subordinated |
| 06/15/2027 | 4.500% | | 200,000 | 198,127 |
The accompanying Notes to Consolidated Financial Statements are an integral part of this statement.
| 20 | Multi-Manager Alternative Strategies Fund | Annual Report 2018 |
Consolidated Portfolio of Investments (continued)
August 31, 2018
| Corporate Bonds & Notes(k) (continued) |
| Issuer | Coupon
Rate | | Principal
Amount ($) | Value ($) |
| Fifth Third Bancorp(m) |
| Junior Subordinated |
| 12/31/2049 | 5.100% | | 455,000 | 447,037 |
| Goldman Sachs Group, Inc. (The)(b) |
3-month USD LIBOR + 0.750%
02/23/2023 | 3.060% | | 380,000 | 381,146 |
| Goldman Sachs Group, Inc. (The)(a) |
| 05/15/2024 | 1.375% | EUR | 186,000 | 218,508 |
| Goldman Sachs Group, Inc. (The) |
| 01/23/2025 | 3.500% | | 500,000 | 486,906 |
| 05/22/2025 | 3.750% | | 400,000 | 394,364 |
| Goldman Sachs Group, Inc. (The)(m) |
| 09/29/2025 | 3.272% | | 260,000 | 249,781 |
| Huntington Bancshares, Inc.(m) |
| 12/31/2049 | 5.700% | | 155,000 | 153,923 |
| JPMorgan Chase & Co.(b) |
3-month USD LIBOR + 0.680%
06/01/2021 | 3.001% | | 500,000 | 502,902 |
| JPMorgan Chase & Co.(m) |
| 05/01/2028 | 3.540% | | 750,000 | 720,189 |
| 01/23/2029 | 3.509% | | 450,000 | 429,201 |
| JPMorgan Chase Bank NA(b) |
3-month USD LIBOR + 0.250%
02/13/2020 | 2.588% | | 690,000 | 690,444 |
| Lloyds Banking Group PLC(m) |
| 11/07/2023 | 2.907% | | 200,000 | 191,196 |
| M&T Bank Corp.(m) |
| Junior Subordinated |
| 12/31/2049 | 5.125% | | 270,000 | 270,379 |
| Morgan Stanley |
| 05/13/2019 | 7.300% | | 500,000 | 515,242 |
| Morgan Stanley(b) |
3-month USD LIBOR + 0.800%
02/14/2020 | 3.119% | | 1,000,000 | 1,002,249 |
3-month USD LIBOR + 0.930%
07/22/2022 | 3.277% | | 800,000 | 807,500 |
| Santander UK Group Holdings PLC |
| 10/16/2020 | 2.875% | | 500,000 | 493,812 |
| Santander UK PLC |
| 06/01/2021 | 3.400% | | 370,000 | 370,026 |
| SunTrust Banks, Inc.(m) |
| Junior Subordinated |
| 12/31/2049 | 5.050% | | 275,000 | 271,727 |
| Synovus Financial Corp.(m) |
| Subordinated |
| 12/15/2025 | 5.750% | | 435,000 | 449,197 |
| U.S. Bancorp |
| 06/07/2024 | 0.850% | EUR | 100,000 | 116,095 |
| Corporate Bonds & Notes(k) (continued) |
| Issuer | Coupon
Rate | | Principal
Amount ($) | Value ($) |
| UBS AG |
| 08/14/2019 | 2.375% | | 450,000 | 448,427 |
| Wells Fargo & Co.(b) |
3-month AUD BBR + 1.320%
07/27/2021 | 3.285% | AUD | 300,000 | 218,124 |
| Wells Fargo & Co. |
| 04/27/2022 | 3.250% | AUD | 300,000 | 217,059 |
| 04/22/2026 | 3.000% | | 260,000 | 244,182 |
| Wells Fargo & Co.(m) |
| 05/22/2028 | 3.584% | | 310,000 | 298,965 |
| Wells Fargo Bank NA(m) |
| 07/23/2021 | 3.325% | | 435,000 | 435,538 |
| Westpac Banking Corp.(a) |
| 10/21/2019 | 5.000% | GBP | 150,000 | 202,668 |
| Zions Bancorporation(m) |
| Junior Subordinated |
| 12/31/2049 | 5.800% | | 99,000 | 99,321 |
| Total | 16,276,195 |
| Brokerage/Asset Managers/Exchanges 0.0% |
| E*TRADE Financial Corp.(m) |
| 12/31/2049 | 5.875% | | 65,000 | 67,249 |
| Raymond James Financial, Inc. |
| 07/15/2046 | 4.950% | | 200,000 | 206,273 |
| Total | 273,522 |
| Building Materials 0.4% |
| Cemex SAB de CV(a) |
| 05/05/2025 | 6.125% | | 315,000 | 324,528 |
| USG Corp.(a) |
| 06/01/2027 | 4.875% | | 2,130,000 | 2,156,625 |
| Total | 2,481,153 |
| Cable and Satellite 0.7% |
| Altice Financing SA(a) |
| 05/15/2026 | 7.500% | | 329,000 | 313,359 |
| Altice U.S. Finance I Corp.(a) |
| 05/15/2026 | 5.500% | | 250,000 | 246,355 |
| Cablevision Systems Corp. |
| 09/15/2022 | 5.875% | | 20,000 | 20,453 |
| CCO Holdings LLC/Capital Corp. |
| 01/15/2024 | 5.750% | | 275,000 | 279,565 |
| CCO Holdings LLC/Capital Corp.(a) |
| 05/01/2027 | 5.125% | | 371,000 | 354,889 |
| 02/01/2028 | 5.000% | | 268,000 | 251,128 |
| Cequel Communications Holdings I LLC/Capital Corp.(a) |
| 04/01/2028 | 7.500% | | 200,000 | 208,951 |
The accompanying Notes to Consolidated Financial Statements are an integral part of this statement.
Multi-Manager Alternative Strategies Fund | Annual Report 2018
| 21 |
Consolidated Portfolio of Investments (continued)
August 31, 2018
| Corporate Bonds & Notes(k) (continued) |
| Issuer | Coupon
Rate | | Principal
Amount ($) | Value ($) |
| Charter Communications Operating LLC/Capital |
| 02/01/2024 | 4.500% | | 260,000 | 262,874 |
| 02/15/2028 | 3.750% | | 200,000 | 184,801 |
| Comcast Corp. |
| 02/15/2028 | 3.150% | | 150,000 | 140,748 |
| CSC Holdings LLC(a) |
| 04/15/2027 | 5.500% | | 200,000 | 194,885 |
| 02/01/2028 | 5.375% | | 275,000 | 263,170 |
| Intelsat Connect Finance SA(a) |
| 02/15/2023 | 9.500% | | 70,000 | 69,743 |
| Intelsat Jackson Holdings SA |
| 08/01/2023 | 5.500% | | 84,000 | 76,535 |
| Intelsat Jackson Holdings SA(a) |
| 07/15/2025 | 9.750% | | 36,000 | 38,130 |
| Intelsat Luxembourg SA |
| 06/01/2023 | 8.125% | | 105,000 | 91,081 |
| Radiate HoldCo LLC/Finance, Inc.(a) |
| 02/15/2025 | 6.625% | | 270,000 | 252,431 |
| Sirius XM Radio, Inc.(a) |
| 05/15/2023 | 4.625% | | 220,000 | 219,420 |
| 07/15/2026 | 5.375% | | 215,000 | 214,699 |
| 08/01/2027 | 5.000% | | 115,000 | 111,422 |
| Total | 3,794,639 |
| Chemicals 1.1% |
| Axalta Coating Systems LLC(a) |
| 08/15/2024 | 4.875% | | 150,000 | 149,113 |
| Dow Chemical Co. (The) |
| 05/15/2019 | 8.550% | | 500,000 | 519,339 |
| Hexion, Inc. |
| 04/15/2020 | 6.625% | | 1,328,000 | 1,259,392 |
| Hexion, Inc./Finance ULC |
| 11/15/2020 | 9.000% | | 584,000 | 495,304 |
| Platform Specialty Products Corp.(a) |
| 02/01/2022 | 6.500% | | 2,210,000 | 2,264,744 |
| 12/01/2025 | 5.875% | | 1,741,000 | 1,733,021 |
| Total | 6,420,913 |
| Construction Machinery 0.1% |
| United Rentals North America, Inc. |
| 07/15/2023 | 4.625% | | 225,000 | 227,726 |
| 05/15/2027 | 5.500% | | 325,000 | 324,252 |
| Total | 551,978 |
| Consumer Cyclical Services 0.3% |
| Amazon.com, Inc. |
| 08/22/2027 | 3.150% | | 285,000 | 275,583 |
| Corporate Bonds & Notes(k) (continued) |
| Issuer | Coupon
Rate | | Principal
Amount ($) | Value ($) |
| Cimpress NV(a) |
| 06/15/2026 | 7.000% | | 165,000 | 168,641 |
| Expedia Group, Inc. |
| 02/15/2026 | 5.000% | | 260,000 | 268,597 |
| 02/15/2028 | 3.800% | | 265,000 | 249,422 |
| IHS Markit Ltd. |
| 08/01/2028 | 4.750% | | 515,000 | 518,279 |
| Matthews International Corp.(a) |
| 12/01/2025 | 5.250% | | 85,000 | 81,847 |
| QVC, Inc. |
| 02/15/2025 | 4.450% | | 16,000 | 15,347 |
| Total | 1,577,716 |
| Consumer Products 0.1% |
| Central Garden & Pet Co. |
| 11/15/2023 | 6.125% | | 144,000 | 148,776 |
| First Quality Finance Co., Inc.(a) |
| 07/01/2025 | 5.000% | | 132,000 | 123,750 |
| Natura Cosmeticos SA(a) |
| 02/01/2023 | 5.375% | | 265,000 | 252,704 |
| Valvoline, Inc. |
| 07/15/2024 | 5.500% | | 100,000 | 102,184 |
| Total | 627,414 |
| Diversified Manufacturing 0.1% |
| General Electric Co.(m) |
| Junior Subordinated |
| 12/31/2049 | 5.000% | | 375,000 | 370,286 |
| Itron, Inc.(a) |
| 01/15/2026 | 5.000% | | 90,000 | 86,076 |
| Total | 456,362 |
| Electric 1.1% |
| Dominion Energy, Inc.(a),(b) |
3-month USD LIBOR + 0.550%
06/01/2019 | 2.871% | | 540,000 | 541,548 |
| Duke Energy Progress LLC |
| 12/01/2044 | 4.150% | | 425,000 | 426,465 |
| Emera U.S. Finance LP |
| 06/15/2026 | 3.550% | | 450,000 | 429,502 |
| Emera, Inc.(m) |
| Subordinated |
| 06/15/2076 | 6.750% | | 450,000 | 477,496 |
| Entergy Louisiana LLC |
| 09/01/2018 | 6.500% | | 500,000 | 500,047 |
| Indiana Michigan Power Co. |
| 03/15/2023 | 3.200% | | 300,000 | 296,844 |
The accompanying Notes to Consolidated Financial Statements are an integral part of this statement.
| 22 | Multi-Manager Alternative Strategies Fund | Annual Report 2018 |
Consolidated Portfolio of Investments (continued)
August 31, 2018
| Corporate Bonds & Notes(k) (continued) |
| Issuer | Coupon
Rate | | Principal
Amount ($) | Value ($) |
| ITC Holdings Corp. |
| 11/15/2027 | 3.350% | | 150,000 | 141,715 |
| Metropolitan Edison Co. |
| 01/15/2019 | 7.700% | | 500,000 | 508,217 |
| MidAmerican Energy Co. |
| 05/01/2046 | 4.250% | | 400,000 | 411,815 |
| NextEra Energy Capital Holdings, Inc.(b) |
3-month USD LIBOR + 0.480%
05/04/2021 | 2.821% | | 520,000 | 521,129 |
| NextEra Energy Operating Partners LP(a) |
| 09/15/2024 | 4.250% | | 245,000 | 239,659 |
| 09/15/2027 | 4.500% | | 540,000 | 513,147 |
| NRG Energy, Inc. |
| 01/15/2027 | 6.625% | | 220,000 | 230,919 |
| NSTAR Electric Co. |
| 05/15/2027 | 3.200% | | 520,000 | 503,669 |
| Tucson Electric Power Co. |
| 11/15/2021 | 5.150% | | 450,000 | 466,568 |
| Total | 6,208,740 |
| Environmental 0.0% |
| GFL Environmental, Inc.(a) |
| 03/01/2023 | 5.375% | | 100,000 | 95,020 |
| Finance Companies 0.3% |
| AerCap Ireland Capital Ltd./Global Aviation Trust |
| 05/15/2021 | 4.500% | | 250,000 | 254,271 |
| Air Lease Corp. |
| 01/15/2020 | 2.125% | | 400,000 | 393,805 |
| Freedom Mortgage Corp.(a) |
| 04/15/2025 | 8.250% | | 285,000 | 278,100 |
| International Lease Finance Corp.(a) |
| 09/01/2018 | 7.125% | | 500,000 | 500,052 |
| Total | 1,426,228 |
| Food and Beverage 0.5% |
| Aramark Services, Inc.(a) |
| 04/01/2025 | 5.000% | | 275,000 | 277,538 |
| Bacardi Ltd.(a) |
| 05/15/2028 | 4.700% | | 90,000 | 89,990 |
| Chobani LLC/Finance Corp., Inc.(a) |
| 04/15/2025 | 7.500% | | 68,000 | 57,288 |
| Constellation Brands, Inc. |
| 05/01/2023 | 4.250% | | 370,000 | 377,249 |
| 12/01/2025 | 4.750% | | 200,000 | 207,114 |
| Darling Global Finance BV(a) |
| 05/15/2026 | 3.625% | EUR | 100,000 | 118,661 |
| Corporate Bonds & Notes(k) (continued) |
| Issuer | Coupon
Rate | | Principal
Amount ($) | Value ($) |
| General Mills, Inc. |
| 04/17/2028 | 4.200% | | 225,000 | 224,056 |
| Kraft Heinz Foods Co. |
| 01/30/2029 | 4.625% | | 275,000 | 275,367 |
| 06/01/2046 | 4.375% | | 200,000 | 175,419 |
| Molson Coors Brewing Co. |
| 07/15/2024 | 1.250% | EUR | 200,000 | 230,741 |
| Pilgrim’s Pride Corp.(a) |
| 09/30/2027 | 5.875% | | 90,000 | 85,387 |
| Post Holdings, Inc.(a) |
| 08/15/2026 | 5.000% | | 345,000 | 331,222 |
| 03/01/2027 | 5.750% | | 455,000 | 449,510 |
| Total | 2,899,542 |
| Gaming 0.1% |
| GLP Capital LP/Financing II, Inc. |
| 04/15/2026 | 5.375% | | 80,000 | 83,095 |
| 06/01/2028 | 5.750% | | 5,000 | 5,300 |
| MGM Growth Properties Operating Partnership LP/Finance Co-Issuer, Inc. |
| 05/01/2024 | 5.625% | | 75,000 | 77,168 |
| Rivers Pittsburgh Borrower LP/Finance Corp.(a) |
| 08/15/2021 | 6.125% | | 83,000 | 82,984 |
| Sugarhouse HSP Gaming Prop. Mezz LP/Finance Corp.(a) |
| 05/15/2025 | 5.875% | | 92,000 | 86,247 |
| Total | 334,794 |
| Health Care 2.2% |
| Abbott Laboratories |
| 11/30/2046 | 4.900% | | 225,000 | 244,940 |
| Baylor Scott & White Holdings |
| 11/15/2026 | 2.650% | | 500,000 | 460,461 |
| Becton Dickinson and Co. |
| 12/15/2019 | 2.675% | | 400,000 | 397,919 |
| Change Healthcare Holdings LLC/Finance, Inc.(a) |
| 03/01/2025 | 5.750% | | 86,000 | 84,194 |
| CHS/Community Health Systems, Inc. |
| 03/31/2023 | 6.250% | | 67,000 | 63,673 |
| CVS Health Corp. |
| 03/25/2025 | 4.100% | | 355,000 | 355,691 |
| 03/25/2028 | 4.300% | | 230,000 | 228,307 |
| 03/25/2048 | 5.050% | | 435,000 | 444,589 |
| Envision Healthcare Corp.(a) |
| 12/01/2024 | 6.250% | | 125,000 | 133,626 |
| Fresenius Medical Care U.S. Finance II, Inc.(a) |
| 09/15/2018 | 6.500% | | 200,000 | 200,259 |
| Hackensack Meridian Health, Inc. |
| 07/01/2057 | 4.500% | | 300,000 | 321,087 |
The accompanying Notes to Consolidated Financial Statements are an integral part of this statement.
Multi-Manager Alternative Strategies Fund | Annual Report 2018
| 23 |
Consolidated Portfolio of Investments (continued)
August 31, 2018
| Corporate Bonds & Notes(k) (continued) |
| Issuer | Coupon
Rate | | Principal
Amount ($) | Value ($) |
| HCA Healthcare, Inc. |
| Junior Subordinated |
| 02/15/2021 | 6.250% | | 320,000 | 334,315 |
| HCA, Inc. |
| 02/15/2022 | 7.500% | | 300,000 | 330,003 |
| 05/01/2023 | 4.750% | | 205,000 | 208,792 |
| 03/15/2024 | 5.000% | | 465,000 | 476,673 |
| 02/15/2027 | 4.500% | | 285,000 | 282,150 |
| Hologic, Inc.(a) |
| 02/01/2028 | 4.625% | | 42,000 | 39,414 |
| IQVIA, Inc.(a) |
| 05/15/2023 | 4.875% | | 160,000 | 160,823 |
| LifePoint Health, Inc. |
| 05/01/2024 | 5.375% | | 4,274,000 | 4,441,575 |
| New York and Presbyterian Hospital (The) |
| 08/01/2036 | 3.563% | | 390,000 | 369,983 |
| Stryker Corp. |
| 03/08/2019 | 2.000% | | 300,000 | 298,796 |
| Surgery Center Holdings, Inc.(a) |
| 07/01/2025 | 6.750% | | 55,000 | 53,066 |
| Tenet Healthcare Corp. |
| 06/01/2020 | 4.750% | | 100,000 | 101,167 |
| 07/15/2024 | 4.625% | | 54,000 | 52,928 |
| Thermo Fisher Scientific, Inc. |
| 09/12/2024 | 0.750% | EUR | 100,000 | 114,980 |
| Universal Hospital Services, Inc. |
| 08/15/2020 | 7.625% | | 2,317,000 | 2,324,220 |
| Zimmer Biomet Holdings, Inc.(b) |
3-month USD LIBOR + 0.750%
03/19/2021 | 3.076% | | 200,000 | 200,909 |
| Total | 12,724,540 |
| Healthcare Insurance 0.2% |
| Aetna, Inc. |
| 06/01/2021 | 4.125% | | 400,000 | 407,532 |
| Centene Corp. |
| 02/15/2021 | 5.625% | | 60,000 | 61,270 |
| 05/15/2022 | 4.750% | | 62,000 | 63,079 |
| 01/15/2025 | 4.750% | | 31,000 | 31,219 |
| Cigna Corp. |
| 04/15/2025 | 3.250% | | 150,000 | 142,435 |
| 10/15/2027 | 3.050% | | 200,000 | 181,349 |
| 10/15/2047 | 3.875% | | 75,000 | 63,901 |
| WellCare Health Plans, Inc. |
| 04/01/2025 | 5.250% | | 33,000 | 33,889 |
| WellCare Health Plans, Inc.(a) |
| 08/15/2026 | 5.375% | | 17,000 | 17,508 |
| Total | 1,002,182 |
| Corporate Bonds & Notes(k) (continued) |
| Issuer | Coupon
Rate | | Principal
Amount ($) | Value ($) |
| Healthcare REIT 0.4% |
| HCP, Inc. |
| 02/01/2019 | 3.750% | | 825,000 | 825,931 |
| Healthcare Realty Trust, Inc. |
| 04/15/2023 | 3.750% | | 600,000 | 590,501 |
| Ventas Realty LP |
| 04/01/2027 | 3.850% | | 300,000 | 291,134 |
| Welltower, Inc. |
| 04/01/2019 | 4.125% | | 500,000 | 502,107 |
| Total | 2,209,673 |
| Independent Energy 0.9% |
| Antero Resources Corp. |
| 12/01/2022 | 5.125% | | 55,000 | 55,776 |
| 06/01/2023 | 5.625% | | 275,000 | 283,176 |
| 03/01/2025 | 5.000% | | 290,000 | 292,170 |
| Centennial Resource Production LLC(a) |
| 01/15/2026 | 5.375% | | 50,000 | 49,291 |
| Concho Resources, Inc. |
| 01/15/2025 | 4.375% | | 225,000 | 227,052 |
| CrownRock LP/Finance, Inc.(a) |
| 10/15/2025 | 5.625% | | 43,000 | 41,798 |
| Denbury Resources, Inc.(a) |
| 02/15/2024 | 7.500% | | 235,000 | 238,024 |
| Diamondback Energy, Inc. |
| 05/31/2025 | 5.375% | | 425,000 | 435,783 |
| Endeavor Energy Resources LP/Finance, Inc.(a) |
| 01/30/2026 | 5.500% | | 85,000 | 84,727 |
| EQT Corp. |
| 10/01/2027 | 3.900% | | 260,000 | 245,295 |
| Gulfport Energy Corp. |
| 05/15/2025 | 6.375% | | 21,000 | 20,753 |
| Murphy Oil Corp. |
| 08/15/2024 | 6.875% | | 325,000 | 343,243 |
| Newfield Exploration Co. |
| 07/01/2024 | 5.625% | | 502,000 | 534,466 |
| 01/01/2026 | 5.375% | | 305,000 | 317,947 |
| Occidental Petroleum Corp. |
| 06/15/2025 | 3.500% | | 380,000 | 379,555 |
| Parsley Energy LLC/Finance Corp.(a) |
| 06/01/2024 | 6.250% | | 108,000 | 112,725 |
| 01/15/2025 | 5.375% | | 455,000 | 458,974 |
| 08/15/2025 | 5.250% | | 60,000 | 59,786 |
| 10/15/2027 | 5.625% | | 345,000 | 348,867 |
| Seven Generations Energy Ltd.(a) |
| 09/30/2025 | 5.375% | | 85,000 | 82,451 |
The accompanying Notes to Consolidated Financial Statements are an integral part of this statement.
| 24 | Multi-Manager Alternative Strategies Fund | Annual Report 2018 |
Consolidated Portfolio of Investments (continued)
August 31, 2018
| Corporate Bonds & Notes(k) (continued) |
| Issuer | Coupon
Rate | | Principal
Amount ($) | Value ($) |
| SM Energy Co. |
| 01/15/2027 | 6.625% | | 225,000 | 231,751 |
| WPX Energy, Inc. |
| 01/15/2022 | 6.000% | | 88,000 | 91,066 |
| 06/01/2026 | 5.750% | | 244,000 | 247,318 |
| Total | 5,181,994 |
| Leisure 0.1% |
| AMC Entertainment Holdings, Inc. |
| 11/15/2024 | 6.375% | GBP | 225,000 | 300,458 |
| Lodging 0.2% |
| Hilton Grand Vacations Borrower LLC/Inc. |
| 12/01/2024 | 6.125% | | 1,002,000 | 1,027,666 |
| Media and Entertainment 0.6% |
| AMC Networks, Inc. |
| 08/01/2025 | 4.750% | | 75,000 | 72,350 |
| Clear Channel International BV(a) |
| 12/15/2020 | 8.750% | | 58,000 | 59,967 |
| Graham Holdings Co.(a) |
| 06/01/2026 | 5.750% | | 175,000 | 178,929 |
| Lin Television Corp. |
| 11/15/2022 | 5.875% | | 149,000 | 151,477 |
| Lions Gate Capital Holdings LLC(a) |
| 11/01/2024 | 5.875% | | 270,000 | 278,242 |
| Meredith Corp.(a) |
| 02/01/2026 | 6.875% | | 310,000 | 314,018 |
| Netflix, Inc. |
| 05/15/2027 | 3.625% | EUR | 200,000 | 227,847 |
| Netflix, Inc.(a) |
| 04/15/2028 | 4.875% | | 350,000 | 331,726 |
| Nexstar Broadcasting, Inc.(a) |
| 08/01/2024 | 5.625% | | 275,000 | 270,429 |
| Nielsen Luxembourg SARL(a) |
| 02/01/2025 | 5.000% | | 320,000 | 309,879 |
| Sinclair Television Group, Inc.(a) |
| 08/01/2024 | 5.625% | | 200,000 | 197,388 |
| Tribune Media Co. |
| 07/15/2022 | 5.875% | | 165,000 | 167,937 |
| Viacom, Inc. |
| 09/01/2043 | 5.850% | | 78,000 | 81,716 |
| Viacom, Inc.(m) |
| Junior Subordinated |
| 02/28/2057 | 6.250% | | 350,000 | 344,753 |
| WMG Acquisition Corp.(a) |
| 04/15/2026 | 5.500% | | 220,000 | 216,254 |
| Total | 3,202,912 |
| Corporate Bonds & Notes(k) (continued) |
| Issuer | Coupon
Rate | | Principal
Amount ($) | Value ($) |
| Metals and Mining 0.3% |
| Indika Energy Capital III Pte, Ltd.(a) |
| 11/09/2024 | 5.875% | | 200,000 | 184,863 |
| Lundin Mining Corp.(a) |
| 11/01/2022 | 7.875% | | 1,074,000 | 1,122,666 |
| Southern Copper Corp. |
| 04/23/2025 | 3.875% | | 395,000 | 387,634 |
| Vedanta Resources PLC(a) |
| 07/30/2022 | 6.375% | | 275,000 | 263,848 |
| Total | 1,959,011 |
| Midstream 0.9% |
| AmeriGas Partners LP/Finance Corp. |
| 05/20/2027 | 5.750% | | 250,000 | 246,716 |
| Antero Midstream Partners LP/Finance Corp. |
| 09/15/2024 | 5.375% | | 330,000 | 333,207 |
| Blue Racer Midstream LLC/Finance Corp.(a) |
| 11/15/2022 | 6.125% | | 40,000 | 40,842 |
| DCP Midstream Operating LP |
| 03/15/2023 | 3.875% | | 15,000 | 14,630 |
| 07/15/2025 | 5.375% | | 255,000 | 261,343 |
| Enbridge Energy Partners LP |
| 10/15/2045 | 7.375% | | 137,000 | 179,600 |
| Enbridge, Inc. |
| 12/01/2026 | 4.250% | | 380,000 | 382,119 |
| Enbridge, Inc.(m) |
| 01/15/2077 | 6.000% | | 300,000 | 293,602 |
| Energy Transfer Equity LP |
| 01/15/2024 | 5.875% | | 92,000 | 97,633 |
| 06/01/2027 | 5.500% | | 85,000 | 89,323 |
| EQT Midstream Partners LP |
| 07/15/2028 | 5.500% | | 260,000 | 267,883 |
| Kinder Morgan Energy Partners LP |
| 09/01/2023 | 3.500% | | 200,000 | 196,711 |
| NGPL PipeCo LLC(a) |
| 08/15/2022 | 4.375% | | 95,000 | 95,716 |
| Plains All American Pipeline LP/Finance Corp. |
| 11/01/2024 | 3.600% | | 275,000 | 265,325 |
| Rockies Express Pipeline LLC(a) |
| 01/15/2019 | 6.000% | | 75,000 | 75,734 |
| 04/15/2020 | 5.625% | | 343,000 | 353,609 |
| Sabine Pass Liquefaction LLC |
| 03/01/2025 | 5.625% | | 200,000 | 213,613 |
| Sunoco Logistics Partners Operations LP |
| 10/01/2047 | 5.400% | | 261,000 | 257,040 |
| Sunoco LP/Finance Corp.(a) |
| 01/15/2023 | 4.875% | | 125,000 | 123,298 |
The accompanying Notes to Consolidated Financial Statements are an integral part of this statement.
Multi-Manager Alternative Strategies Fund | Annual Report 2018
| 25 |
Consolidated Portfolio of Investments (continued)
August 31, 2018
| Corporate Bonds & Notes(k) (continued) |
| Issuer | Coupon
Rate | | Principal
Amount ($) | Value ($) |
| Targa Resources Partners LP/Finance Corp.(a) |
| 04/15/2026 | 5.875% | | 165,000 | 169,952 |
| Texas Eastern Transmission LP(a) |
| 10/15/2022 | 2.800% | | 250,000 | 241,879 |
| TransMontaigne Partners LP/TLP Finance Corp. |
| 02/15/2026 | 6.125% | | 80,000 | 75,243 |
| Williams Companies, Inc. (The) |
| 06/24/2024 | 4.550% | | 290,000 | 296,040 |
| Williams Partners LP |
| 03/15/2022 | 3.600% | | 200,000 | 199,821 |
| 09/15/2025 | 4.000% | | 225,000 | 222,999 |
| 06/15/2027 | 3.750% | | 350,000 | 335,790 |
| Total | 5,329,668 |
| Natural Gas 0.0% |
| NiSource, Inc. |
| 11/17/2022 | 2.650% | | 250,000 | 241,166 |
| Office REIT 0.1% |
| Boston Properties LP |
| 02/01/2024 | 3.800% | | 500,000 | 500,516 |
| SL Green Operating Partnership LP |
| 10/15/2022 | 3.250% | | 260,000 | 253,749 |
| Total | 754,265 |
| Oil Field Services 0.1% |
| FTS International, Inc. |
| 05/01/2022 | 6.250% | | 125,000 | 122,526 |
| Transocean Pontus Ltd.(a) |
| 08/01/2025 | 6.125% | | 52,000 | 52,944 |
| Transocean Proteus Ltd.(a) |
| 12/01/2024 | 6.250% | | 85,000 | 86,700 |
| U.S.A. Compression Partners LP/Finance Corp.(a) |
| 04/01/2026 | 6.875% | | 87,000 | 90,196 |
| Total | 352,366 |
| Other Financial Institutions 0.1% |
| Swiss Insured Brazil Power Finance SARL(a) |
| 09/24/2046 | 9.850% | BRL | 3,230,000 | 735,515 |
| Other Industry 0.1% |
| AECOM |
| 10/15/2024 | 5.875% | | 255,000 | 271,937 |
| 03/15/2027 | 5.125% | | 550,000 | 539,818 |
| Total | 811,755 |
| Other REIT 0.3% |
| American Campus Communities Operating Partnership LP |
| 04/15/2023 | 3.750% | | 500,000 | 497,676 |
| Corporate Bonds & Notes(k) (continued) |
| Issuer | Coupon
Rate | | Principal
Amount ($) | Value ($) |
| CyrusOne LP/Finance Corp. |
| 03/15/2024 | 5.000% | | 175,000 | 177,737 |
| Education Realty Operating Partnership LP |
| 12/01/2024 | 4.600% | | 350,000 | 358,209 |
| ESH Hospitality, Inc.(a) |
| 05/01/2025 | 5.250% | | 275,000 | 266,426 |
| Fibra Uno Administracion SA de CV(a) |
| 12/15/2024 | 5.250% | | 275,000 | 279,340 |
| Total | 1,579,388 |
| Packaging 0.5% |
| Ardagh Packaging Finance PLC/Holdings U.S.A., Inc.(a) |
| 09/15/2022 | 4.250% | | 200,000 | 197,133 |
| Ball Corp. |
| 12/15/2020 | 4.375% | | 170,000 | 172,463 |
| 11/15/2023 | 4.000% | | 280,000 | 273,735 |
| 07/01/2025 | 5.250% | | 375,000 | 386,778 |
| 03/15/2026 | 4.875% | | 265,000 | 263,804 |
| Berry Global, Inc. |
| 07/15/2023 | 5.125% | | 40,000 | 39,919 |
| Berry Global, Inc.(a) |
| 02/15/2026 | 4.500% | | 58,000 | 54,375 |
| Crown Americas LLC/Capital Corp. IV |
| 01/15/2023 | 4.500% | | 325,000 | 326,374 |
| Crown Americas LLC/Capital Corp. V |
| 09/30/2026 | 4.250% | | 17,000 | 15,610 |
| Crown Cork & Seal Co., Inc. |
| 12/15/2026 | 7.375% | | 195,000 | 212,215 |
| Flex Acquisition Co., Inc.(a) |
| 07/15/2026 | 7.875% | | 55,000 | 54,848 |
| Sealed Air Corp.(a) |
| 12/01/2020 | 6.500% | | 310,000 | 326,463 |
| 12/01/2024 | 5.125% | | 215,000 | 217,913 |
| 09/15/2025 | 5.500% | | 80,000 | 81,435 |
| Total | 2,623,065 |
| Paper 0.1% |
| Graphic Packaging International, Inc. |
| 11/15/2022 | 4.875% | | 150,000 | 151,196 |
| WestRock RKT Co. |
| 03/01/2019 | 4.450% | | 425,000 | 428,242 |
| Total | 579,438 |
| Pharmaceuticals 1.4% |
| AbbVie, Inc. |
| 11/06/2022 | 2.900% | | 125,000 | 122,118 |
| 05/17/2024 | 1.375% | EUR | 130,000 | 153,038 |
The accompanying Notes to Consolidated Financial Statements are an integral part of this statement.
| 26 | Multi-Manager Alternative Strategies Fund | Annual Report 2018 |
Consolidated Portfolio of Investments (continued)
August 31, 2018
| Corporate Bonds & Notes(k) (continued) |
| Issuer | Coupon
Rate | | Principal
Amount ($) | Value ($) |
| Allergan Funding SCS |
| 06/01/2024 | 1.250% | EUR | 100,000 | 114,714 |
| 03/15/2025 | 3.800% | | 140,000 | 138,810 |
| 03/15/2035 | 4.550% | | 110,000 | 108,055 |
| AMAG Pharmaceuticals, Inc.(a) |
| 09/01/2023 | 7.875% | | 4,203,000 | 4,451,229 |
| Amgen, Inc. |
| 05/01/2045 | 4.400% | | 200,000 | 192,368 |
| AstraZeneca PLC |
| 11/16/2025 | 3.375% | | 300,000 | 291,919 |
| Bausch Health Companies, Inc.(a) |
| 04/15/2025 | 6.125% | | 183,000 | 170,514 |
| 11/01/2025 | 5.500% | | 109,000 | 108,793 |
| Bayer US Finance II LLC(a) |
| 12/15/2028 | 4.375% | | 345,000 | 342,049 |
| Catalent Pharma Solutions, Inc.(a) |
| 01/15/2026 | 4.875% | | 85,000 | 81,292 |
| Celgene Corp. |
| 08/15/2045 | 5.000% | | 200,000 | 198,811 |
| Elanco Animal Health, Inc.(a) |
| 08/28/2023 | 4.272% | | 345,000 | 347,036 |
| Gilead Sciences, Inc. |
| 03/01/2026 | 3.650% | | 200,000 | 198,544 |
| 03/01/2047 | 4.150% | | 110,000 | 105,548 |
| Teva Pharmaceutical Finance III BV |
| 07/19/2019 | 1.700% | | 200,000 | 196,594 |
| Teva Pharmaceutical Finance Netherlands II BV(a) |
| 03/01/2025 | 4.500% | EUR | 200,000 | 245,582 |
| Teva Pharmaceutical Finance Netherlands III BV |
| 04/15/2024 | 6.000% | | 400,000 | 404,269 |
| Valeant Pharmaceuticals International, Inc.(a) |
| 04/01/2026 | 9.250% | | 29,000 | 30,817 |
| Total | 8,002,100 |
| Property & Casualty 0.2% |
| Farmers Exchange Capital III(a),(m) |
| Subordinated |
| 10/15/2054 | 5.454% | | 500,000 | 501,838 |
| MGIC Investment Corp. |
| 08/15/2023 | 5.750% | | 175,000 | 182,887 |
| Nationstar Mortgage Holdings, Inc.(a) |
| 07/15/2023 | 8.125% | | 185,000 | 192,692 |
| Nationwide Mutual Insurance Co.(a),(b) |
| Subordinated |
3-month USD LIBOR + 2.290%
12/15/2024 | 4.631% | | 450,000 | 449,613 |
| Total | 1,327,030 |
| Corporate Bonds & Notes(k) (continued) |
| Issuer | Coupon
Rate | | Principal
Amount ($) | Value ($) |
| Railroads 0.0% |
| Union Pacific Corp. |
| 09/10/2028 | 3.950% | | 175,000 | 176,599 |
| Refining 0.2% |
| Andeavor |
| 12/15/2023 | 4.750% | | 320,000 | 333,938 |
| 12/15/2026 | 5.125% | | 150,000 | 159,091 |
| Phillips 66(a),(b) |
3-month USD LIBOR + 0.650%
04/15/2019 | 2.989% | | 500,000 | 500,640 |
| Total | 993,669 |
| Restaurants 0.3% |
| 1011778 BC ULC/New Red Finance, Inc.(a) |
| 05/15/2024 | 4.250% | | 405,000 | 387,939 |
| 10/15/2025 | 5.000% | | 285,000 | 276,421 |
| BC ULC/New Red Finance, Inc.(a) |
| 01/15/2022 | 4.625% | | 380,000 | 380,727 |
| KFC Holding Co./Pizza Hut Holdings LLC/Taco Bell of America LLC(a) |
| 06/01/2024 | 5.000% | | 350,000 | 349,403 |
| 06/01/2026 | 5.250% | | 390,000 | 390,134 |
| Total | 1,784,624 |
| Retail REIT 0.1% |
| WEA Finance LLC/Westfield UK & Europe Finance PLC(a) |
| 09/17/2019 | 2.700% | | 500,000 | 498,287 |
| Retailers 1.2% |
| Cumberland Farms, Inc.(a) |
| 05/01/2025 | 6.750% | | 120,000 | 122,455 |
| GameStop Corp.(a) |
| 03/15/2021 | 6.750% | | 3,474,000 | 3,505,377 |
| Party City Holdings, Inc.(a) |
| 08/01/2026 | 6.625% | | 80,000 | 80,580 |
| Rent-A-Center, Inc. |
| 11/15/2020 | 6.625% | | 2,734,000 | 2,758,333 |
| Rite Aid Corp.(a) |
| 04/01/2023 | 6.125% | | 82,000 | 73,685 |
| Walmart, Inc. |
| 06/26/2025 | 3.550% | | 380,000 | 384,078 |
| Total | 6,924,508 |
| Supermarkets 0.3% |
| SUPERVALU, Inc. |
| 11/15/2022 | 7.750% | | 1,384,000 | 1,438,552 |
The accompanying Notes to Consolidated Financial Statements are an integral part of this statement.
Multi-Manager Alternative Strategies Fund | Annual Report 2018
| 27 |
Consolidated Portfolio of Investments (continued)
August 31, 2018
| Corporate Bonds & Notes(k) (continued) |
| Issuer | Coupon
Rate | | Principal
Amount ($) | Value ($) |
| Supranational 0.9% |
| Asian Development Bank |
| 03/06/2019 | 4.625% | NZD | 385,000 | 258,046 |
| 08/08/2021 | 6.450% | INR | 18,500,000 | 255,159 |
| 03/09/2022 | 5.000% | AUD | 165,000 | 129,053 |
| Asian Development Bank(a) |
| 01/16/2020 | 6.950% | INR | 17,800,000 | 248,509 |
| European Bank for Reconstruction & Development |
| 04/15/2019 | 7.375% | IDR | 1,550,000,000 | 102,667 |
| European Financial Stability Facility(a) |
| 01/20/2023 | 0.500% | EUR | 135,000 | 160,461 |
| 05/23/2023 | 1.875% | EUR | 190,000 | 240,137 |
| 10/17/2023 | 0.125% | EUR | 350,000 | 407,156 |
| Inter-American Development Bank |
| 10/09/2018 | 3.750% | AUD | 345,000 | 248,411 |
| 08/20/2019 | 6.500% | AUD | 330,000 | 246,900 |
| International Bank for Reconstruction & Development |
| 02/26/2019 | 4.625% | NZD | 310,000 | 207,590 |
| 10/28/2019 | 5.750% | INR | 17,400,000 | 240,332 |
| 03/12/2020 | 2.500% | AUD | 355,000 | 256,460 |
| 01/13/2021 | 2.800% | AUD | 190,000 | 138,293 |
| 01/22/2021 | 3.500% | NZD | 620,000 | 422,247 |
| 08/20/2021 | 7.450% | IDR | 3,250,000,000 | 212,349 |
| 10/06/2021 | 4.625% | NZD | 440,000 | 310,741 |
| 01/25/2022 | 3.375% | NZD | 385,000 | 262,681 |
| International Finance Corp. |
| 10/30/2018 | 6.450% | INR | 21,500,000 | 302,252 |
| 08/15/2022 | 2.800% | AUD | 355,000 | 258,721 |
| Nordic Investment Bank |
| 03/19/2020 | 4.125% | NZD | 300,000 | 204,439 |
| Total | 5,112,604 |
| Technology 0.7% |
| Apple, Inc. |
| 05/06/2024 | 3.450% | | 270,000 | 272,330 |
| 05/13/2025 | 3.200% | | 225,000 | 222,686 |
| Banff Merger Sub, Inc.(a) |
| 09/01/2026 | 9.750% | | 175,000 | 175,444 |
| Broadcom Corp./Cayman Finance Ltd. |
| 01/15/2020 | 2.375% | | 350,000 | 346,059 |
| CDK Global, Inc. |
| 06/15/2026 | 5.875% | | 210,000 | 216,006 |
| Citrix Systems, Inc. |
| 12/01/2027 | 4.500% | | 180,000 | 175,035 |
| Dell International LLC/EMC Corp.(a) |
| 06/01/2019 | 3.480% | | 250,000 | 250,838 |
| Equinix, Inc. |
| 03/15/2024 | 2.875% | EUR | 140,000 | 163,761 |
| 05/15/2027 | 5.375% | | 545,000 | 554,951 |
| Corporate Bonds & Notes(k) (continued) |
| Issuer | Coupon
Rate | | Principal
Amount ($) | Value ($) |
| First Data Corp.(a) |
| 01/15/2024 | 5.000% | | 110,000 | 110,436 |
| International Business Machines Corp. |
| 12/21/2020 | 2.750% | GBP | 200,000 | 267,819 |
| Motorola Solutions, Inc. |
| 02/23/2028 | 4.600% | | 120,000 | 119,476 |
| NXP BV/Funding LLC(a) |
| 06/01/2023 | 4.625% | | 265,000 | 268,967 |
| Rackspace Hosting, Inc.(a) |
| 11/15/2024 | 8.625% | | 125,000 | 122,882 |
| Total System Services, Inc. |
| 06/01/2028 | 4.450% | | 260,000 | 263,685 |
| Travelport Corporate Finance PLC(a) |
| 03/15/2026 | 6.000% | | 172,000 | 175,157 |
| Trimble, Inc. |
| 06/15/2023 | 4.150% | | 190,000 | 190,885 |
| Western Digital Corp. |
| 02/15/2026 | 4.750% | | 163,000 | 159,609 |
| Total | 4,056,026 |
| Tobacco 0.1% |
| Altria Group, Inc. |
| 11/10/2018 | 9.700% | | 500,000 | 506,228 |
| BAT Capital Corp.(a) |
| 08/14/2020 | 2.297% | | 300,000 | 294,600 |
| Total | 800,828 |
| Transportation Services 0.0% |
| Teekay Offshore Partners LP/Finance Corp.(a) |
| 07/15/2023 | 8.500% | | 160,000 | 164,953 |
| Wireless 0.4% |
| America Movil SAB de CV |
| 12/09/2024 | 7.125% | MXN | 5,200,000 | 250,408 |
| American Tower Corp. |
| 02/15/2019 | 3.400% | | 250,000 | 250,694 |
| 06/15/2023 | 3.000% | | 140,000 | 134,952 |
| CC Holdings GS V LLC/Crown Castle GS III Corp. |
| 04/15/2023 | 3.849% | | 250,000 | 249,276 |
| SBA Communications Corp. |
| 10/01/2022 | 4.000% | | 207,000 | 202,848 |
| 09/01/2024 | 4.875% | | 140,000 | 138,124 |
| Sprint Capital Corp. |
| 11/15/2028 | 6.875% | | 64,000 | 63,720 |
| Sprint Communications, Inc.(a) |
| 11/15/2018 | 9.000% | | 189,000 | 191,131 |
The accompanying Notes to Consolidated Financial Statements are an integral part of this statement.
| 28 | Multi-Manager Alternative Strategies Fund | Annual Report 2018 |
Consolidated Portfolio of Investments (continued)
August 31, 2018
| Corporate Bonds & Notes(k) (continued) |
| Issuer | Coupon
Rate | | Principal
Amount ($) | Value ($) |
| Sprint Spectrum Co. I/II/III LLC(a) |
| 09/20/2021 | 3.360% | | 351,000 | 349,798 |
| 03/20/2025 | 4.738% | | 345,000 | 345,153 |
| T-Mobile U.S.A., Inc. |
| 02/01/2026 | 4.500% | | 69,000 | 65,736 |
| 02/01/2028 | 4.750% | | 104,000 | 97,987 |
| Vodafone Group PLC |
| 05/30/2028 | 4.375% | | 175,000 | 173,707 |
| Total | 2,513,534 |
| Wirelines 0.3% |
| AT&T, Inc. |
| 03/01/2037 | 5.250% | | 145,000 | 144,187 |
| 06/15/2044 | 4.800% | | 700,000 | 637,424 |
| Level 3 Financing, Inc. |
| 02/01/2023 | 5.625% | | 100,000 | 101,156 |
| 05/01/2023 | 5.125% | | 65,000 | 64,919 |
| Qwest Corp. |
| 12/01/2021 | 6.750% | | 90,000 | 96,566 |
| Verizon Communications, Inc. |
| 08/15/2046 | 4.125% | | 280,000 | 248,828 |
| 04/15/2049 | 5.012% | | 275,000 | 277,486 |
| Zayo Group LLC/Capital, Inc.(a) |
| 01/15/2027 | 5.750% | | 86,000 | 86,172 |
| Total | 1,656,738 |
Total Corporate Bonds & Notes
(Cost $124,234,183) | 121,982,483 |
| Equity Funds 1.1% |
| | Shares | Value ($) |
| International 1.1% |
| Altaba, Inc.(f),(h),(i) | 88,975 | 6,188,211 |
Total Equity Funds
(Cost $5,865,503) | 6,188,211 |
|
| Exchange-Traded Funds 0.7% |
| | |
| Consumer Discretionary Select Sector SPDR Fund | 4,569 | 534,344 |
| Consumer Staples Select Sector SPDR Fund(h),(i) | 47,024 | 2,528,951 |
| Industrial Select Sector SPDR Fund | 10,320 | 795,672 |
Total Exchange-Traded Funds
(Cost $3,773,773) | 3,858,967 |
| Foreign Government Obligations(k),(n) 5.9% |
| Issuer | Coupon
Rate | | Principal
Amount ($) | Value ($) |
| Australia 0.1% |
| Australia Government Bond(a) |
| 07/15/2022 | 5.750% | AUD | 150,000 | 122,692 |
| New South Wales Treasury Corp. |
| 03/01/2022 | 6.000% | AUD | 345,000 | 279,765 |
| Queensland Treasury Corp.(a) |
| 07/21/2022 | 6.000% | AUD | 500,000 | 408,632 |
| Total | 811,089 |
| Austria 0.1% |
| Republic of Austria Government Bond(a),(l) |
| 07/15/2023 | 0.000% | EUR | 285,000 | 332,555 |
| Brazil 0.4% |
| Brazil Notas do Tesouro Nacional |
| 01/01/2021 | 10.000% | BRL | 2,670,000 | 670,623 |
| Brazil Notas do Tesouro Nacional Series F |
| 01/01/2023 | 10.000% | BRL | 4,400,000 | 1,056,840 |
| Brazilian Government International Bond |
| 04/07/2026 | 6.000% | | 275,000 | 276,389 |
| Total | 2,003,852 |
| Canada 0.2% |
| Canada Housing Trust No. 1(a) |
| 06/15/2023 | 2.350% | CAD | 345,000 | 263,008 |
| Canadian Government Bond |
| 03/01/2023 | 1.750% | CAD | 740,000 | 557,464 |
| Export Development Canada |
| 06/07/2021 | 2.400% | AUD | 220,000 | 158,566 |
| Province of Alberta |
| 12/01/2023 | 3.400% | CAD | 310,000 | 246,873 |
| Province of British Columbia(a) |
| 01/09/2020 | 6.600% | INR | 11,000,000 | 153,167 |
| Total | 1,379,078 |
| Chile 0.1% |
| Chile Government International Bond |
| 10/30/2022 | 2.250% | | 300,000 | 286,826 |
| China 0.0% |
| Syngenta Finance NV(a) |
| 04/24/2028 | 5.182% | | 210,000 | 203,325 |
| Colombia 0.2% |
| Colombia Government International Bond |
| 01/28/2026 | 4.500% | | 625,000 | 639,248 |
| Colombian TES |
| 05/04/2022 | 7.000% | COP | 1,389,000,000 | 474,073 |
| Total | 1,113,321 |
The accompanying Notes to Consolidated Financial Statements are an integral part of this statement.
Multi-Manager Alternative Strategies Fund | Annual Report 2018
| 29 |
Consolidated Portfolio of Investments (continued)
August 31, 2018
| Foreign Government Obligations(k),(n) (continued) |
| Issuer | Coupon
Rate | | Principal
Amount ($) | Value ($) |
| Costa Rica 0.0% |
| Costa Rica Government International Bond(a) |
| 01/26/2023 | 4.250% | | 200,000 | 188,048 |
| Croatia 0.0% |
| Croatia Government International Bond(a) |
| 07/14/2020 | 6.625% | | 120,000 | 126,460 |
| Dominican Republic 0.0% |
| Dominican Republic International Bond(a) |
| 01/28/2024 | 6.600% | | 100,000 | 105,785 |
| Finland 0.1% |
| Finland Government Bond(a) |
| 04/15/2023 | 1.500% | EUR | 260,000 | 325,605 |
| Germany 0.2% |
| Kreditanstalt fuer Wiederaufbau |
| 05/29/2020 | 3.750% | NZD | 300,000 | 203,781 |
| 08/20/2020 | 6.000% | AUD | 435,000 | 335,394 |
| 03/15/2023 | 0.375% | EUR | 160,000 | 189,620 |
| 08/15/2023 | 2.125% | EUR | 370,000 | 474,746 |
| Kreditanstalt fuer Wiederaufbau(l) |
| 09/15/2023 | 0.000% | EUR | 80,000 | 92,821 |
| Total | 1,296,362 |
| Hungary 0.2% |
| Hungary Government International Bond |
| 01/29/2020 | 6.250% | | 485,000 | 505,873 |
| 03/29/2021 | 6.375% | | 514,000 | 550,802 |
| 11/22/2023 | 5.750% | | 140,000 | 152,159 |
| Total | 1,208,834 |
| India 0.1% |
| NTPC Ltd.(a) |
| 05/03/2022 | 7.250% | INR | 20,000,000 | 271,569 |
| Indonesia 0.9% |
| Indonesia Government International Bond(a) |
| 06/14/2023 | 2.625% | EUR | 225,000 | 274,227 |
| 07/18/2024 | 2.150% | EUR | 200,000 | 236,090 |
| Indonesia Treasury Bond |
| 07/15/2021 | 8.250% | IDR | 4,950,000,000 | 342,854 |
| 05/15/2022 | 7.000% | IDR | 5,067,000,000 | 335,994 |
| 05/15/2023 | 5.625% | IDR | 1,027,000,000 | 63,534 |
| 03/15/2024 | 8.375% | IDR | 5,369,000,000 | 368,735 |
| 09/15/2026 | 8.375% | IDR | 4,630,000,000 | 318,411 |
| 05/15/2027 | 7.000% | IDR | 3,615,000,000 | 227,445 |
| 05/15/2028 | 6.125% | IDR | 5,966,000,000 | 350,330 |
| 03/15/2029 | 9.000% | IDR | 2,610,000,000 | 186,935 |
| 05/15/2031 | 8.750% | IDR | 3,900,000,000 | 272,974 |
| 08/15/2032 | 7.500% | IDR | 1,158,000,000 | 72,719 |
| Foreign Government Obligations(k),(n) (continued) |
| Issuer | Coupon
Rate | | Principal
Amount ($) | Value ($) |
| 05/15/2033 | 6.625% | IDR | 3,528,000,000 | 205,976 |
| 05/15/2038 | 7.500% | IDR | 2,420,000,000 | 147,508 |
| Pelabuhan Indonesia II PT(a) |
| 05/05/2025 | 4.250% | | 225,000 | 218,650 |
| Perusahaan Penerbit SBSN Indonesia III(a) |
| 03/29/2027 | 4.150% | | 270,000 | 263,821 |
| PT Jasa Marga Persero Tbk(a) |
| 12/11/2020 | 7.500% | IDR | 2,000,000,000 | 127,631 |
| PT Pertamina Persero(a) |
| 05/20/2023 | 4.300% | | 400,000 | 399,219 |
| 05/20/2023 | 4.300% | | 270,000 | 269,473 |
| PT Perusahaan Listrik Negara(a) |
| 05/15/2027 | 4.125% | | 280,000 | 264,988 |
| Total | 4,947,514 |
| Ireland 0.5% |
| Ireland Government Bond(a) |
| 03/20/2023 | 3.900% | EUR | 970,000 | 1,327,655 |
| 03/18/2024 | 3.400% | EUR | 985,000 | 1,347,264 |
| Total | 2,674,919 |
| Kazakhstan 0.0% |
| Kazakhstan Government International Bond(a) |
| 07/21/2025 | 5.125% | | 200,000 | 215,476 |
| Malaysia 0.3% |
| Malaysia Government Bond |
| 07/15/2021 | 4.160% | MYR | 1,300,000 | 321,381 |
| 11/30/2021 | 3.620% | MYR | 450,000 | 109,960 |
| 09/30/2024 | 4.059% | MYR | 2,200,000 | 537,564 |
| 03/14/2025 | 3.882% | MYR | 545,000 | 132,149 |
| 11/16/2027 | 3.899% | MYR | 650,000 | 155,043 |
| 06/15/2028 | 3.733% | MYR | 375,000 | 89,032 |
| 04/15/2033 | 3.844% | MYR | 1,223,000 | 276,099 |
| Total | 1,621,228 |
| Mexico 1.0% |
| Banco Nacional de Comercio Exterior SNC(a) |
| 10/14/2025 | 4.375% | | 275,000 | 271,411 |
| Banco Nacional de Comercio Exterior SNC(a),(m) |
| Subordinated |
| 08/11/2026 | 3.800% | | 200,000 | 194,694 |
| Mexican Bonos |
| 12/13/2018 | 8.500% | MXN | 4,940,000 | 258,868 |
| 06/11/2020 | 8.000% | MXN | 5,740,000 | 301,124 |
| 06/10/2021 | 6.500% | MXN | 10,200,000 | 515,747 |
| 12/07/2023 | 8.000% | MXN | 3,790,000 | 199,625 |
| 12/05/2024 | 10.000% | MXN | 6,540,000 | 378,693 |
The accompanying Notes to Consolidated Financial Statements are an integral part of this statement.
| 30 | Multi-Manager Alternative Strategies Fund | Annual Report 2018 |
Consolidated Portfolio of Investments (continued)
August 31, 2018
| Foreign Government Obligations(k),(n) (continued) |
| Issuer | Coupon
Rate | | Principal
Amount ($) | Value ($) |
| Mexico City Airport Trust(a) |
| 10/31/2026 | 4.250% | | 550,000 | 518,630 |
| 04/30/2028 | 3.875% | | 575,000 | 521,884 |
| 10/31/2046 | 5.500% | | 325,000 | 288,429 |
| 07/31/2047 | 5.500% | | 1,225,000 | 1,088,678 |
| Mexico Government International Bond |
| 05/29/2031 | 7.750% | MXN | 4,730,000 | 243,405 |
| 01/23/2046 | 4.600% | | 230,000 | 213,885 |
| Petroleos Mexicanos(a) |
| 11/24/2021 | 7.650% | MXN | 5,190,000 | 256,196 |
| 09/12/2024 | 7.190% | MXN | 2,440,000 | 110,250 |
| Petroleos Mexicanos |
| 03/13/2022 | 5.375% | | 320,000 | 327,317 |
| 09/21/2023 | 4.625% | | 150,000 | 147,419 |
| Total | 5,836,255 |
| Netherlands 0.1% |
| Bank Nederlandse Gemeenten NV(a) |
| 02/22/2023 | 0.250% | EUR | 160,000 | 187,912 |
| 06/07/2024 | 0.250% | EUR | 155,000 | 180,429 |
| Greenko Dutch BV(a) |
| 07/24/2024 | 5.250% | | 225,000 | 208,313 |
| Total | 576,654 |
| New Zealand 0.2% |
| New Zealand Government Bond(a) |
| 04/15/2020 | 3.000% | NZD | 225,000 | 152,054 |
| 05/15/2021 | 6.000% | NZD | 405,000 | 298,245 |
| New Zealand Local Government Funding Agency Bond |
| 03/15/2019 | 5.000% | NZD | 540,000 | 362,911 |
| 04/15/2023 | 5.500% | NZD | 85,000 | 63,470 |
| Total | 876,680 |
| Norway 0.3% |
| Norway Government Bond(a) |
| 05/22/2019 | 4.500% | NOK | 5,025,000 | 615,184 |
| 05/25/2021 | 3.750% | NOK | 7,280,000 | 928,368 |
| 05/24/2023 | 2.000% | NOK | 2,825,000 | 346,409 |
| Total | 1,889,961 |
| Peru 0.1% |
| Corporación Financiera de Desarrollo SA(a) |
| 07/15/2025 | 4.750% | | 220,000 | 222,303 |
| Petroleos del Peru SA(a) |
| 06/19/2047 | 5.625% | | 215,000 | 215,545 |
| Total | 437,848 |
| Foreign Government Obligations(k),(n) (continued) |
| Issuer | Coupon
Rate | | Principal
Amount ($) | Value ($) |
| Philippines 0.3% |
| Philippine Government Bond |
| 03/20/2021 | 3.500% | PHP | 12,000,000 | 215,525 |
| 04/21/2023 | 3.500% | PHP | 18,000,000 | 303,375 |
| 07/19/2031 | 8.000% | PHP | 18,000,000 | 373,445 |
| Philippine Government International Bond |
| 01/15/2021 | 4.950% | PHP | 22,000,000 | 413,400 |
| 01/14/2036 | 6.250% | PHP | 20,000,000 | 373,120 |
| Total | 1,678,865 |
| Portugal 0.2% |
| Portugal Government International Bond(a) |
| 10/15/2024 | 5.125% | | 375,000 | 392,213 |
| Portugal Obrigacoes do Tesouro OT(a) |
| 04/15/2021 | 3.850% | EUR | 470,000 | 601,176 |
| Total | 993,389 |
| Russian Federation 0.0% |
| Russian Foreign Bond - Eurobond(a) |
| 09/16/2023 | 4.875% | | 200,000 | 205,010 |
| Singapore 0.2% |
| BOC Aviation Ltd.(a),(b) |
3-month USD LIBOR + 1.050%
05/02/2021 | 3.399% | | 200,000 | 201,347 |
| BOC Aviation Ltd.(a) |
| 09/18/2022 | 2.750% | | 200,000 | 190,842 |
| Singapore Government Bond |
| 09/01/2020 | 3.250% | SGD | 1,065,000 | 796,747 |
| Total | 1,188,936 |
| South Africa 0.0% |
| South Africa Government International Bond |
| 01/17/2024 | 4.665% | | 100,000 | 97,034 |
| Sweden 0.1% |
| Sweden Government International Bond(a) |
| 04/24/2023 | 0.125% | EUR | 480,000 | 561,895 |
| Turkey 0.0% |
| Turkey Government International Bond |
| 03/23/2023 | 3.250% | | 240,000 | 193,126 |
| Uruguay 0.0% |
| Uruguay Government International Bond |
| 10/27/2027 | 4.375% | | 125,000 | 127,203 |
Total Foreign Government Obligations
(Cost $36,789,875) | 33,774,702 |
|
The accompanying Notes to Consolidated Financial Statements are an integral part of this statement.
Multi-Manager Alternative Strategies Fund | Annual Report 2018
| 31 |
Consolidated Portfolio of Investments (continued)
August 31, 2018
| Municipal Bonds 0.6% |
| Issue Description | Coupon
Rate | | Principal
Amount ($) | Value ($) |
| Higher Education 0.1% |
| University of California |
| Revenue Bonds |
| Taxable General |
| Series 2013-AJ |
| 05/15/2031 | 4.601% | | 500,000 | 533,855 |
| Local General Obligation 0.0% |
| Los Angeles Unified School District |
| Unlimited General Obligation Bonds |
| Build America Bonds -Taxable |
| Series 2009 |
| 07/01/2029 | 5.755% | | 250,000 | 290,468 |
| Sales Tax 0.0% |
| Santa Clara Valley Transportation Authority |
| Revenue Bonds |
| Build America Bonds |
| Series 2010 |
| 04/01/2032 | 5.876% | | 250,000 | 292,483 |
| Special Non Property Tax 0.1% |
| New York State Dormitory Authority |
| Revenue Bonds |
| Build America Bonds |
| Series 2010 |
| 03/15/2030 | 5.500% | | 500,000 | 567,955 |
| State General Obligation 0.1% |
| State of California |
| Unlimited General Obligation Bonds |
| Taxable High Speed Passenger Train |
| Series 2017 |
| 04/01/2047 | 2.193% | | 500,000 | 493,665 |
| Transportation 0.1% |
| Metropolitan Transportation Authority |
| Revenue Bonds |
| Build America Bonds |
| Series 2010 |
| 11/15/2031 | 6.548% | | 250,000 | 308,532 |
| Water & Sewer 0.2% |
| City of Houston Combined Utility System |
| Revenue Bonds |
| Taxable 1st Lien |
| Series 2014B |
| 05/15/2028 | 3.828% | | 500,000 | 508,265 |
| Municipal Bonds (continued) |
| Issue Description | Coupon
Rate | | Principal
Amount ($) | Value ($) |
| Metropolitan Water District of Southern California |
| Revenue Bonds |
| Build America Bonds |
| Subordinated Series 2010 |
| 07/01/2040 | 6.947% | | 400,000 | 427,312 |
| Total | 935,577 |
Total Municipal Bonds
(Cost $3,503,710) | 3,422,535 |
| Preferred Debt 0.1% |
| Issuer | Coupon
Rate | | Shares | Value ($) |
| Banking 0.1% |
| U.S. Bancorp(m) |
| 12/31/2049 | 6.500% | | 9,950 | 278,401 |
| Wells Fargo & Co.(m) |
| 12/31/2049 | 5.850% | | 8,485 | 218,404 |
| Total | 496,805 |
Total Preferred Debt
(Cost $521,306) | 496,805 |
| Preferred Stocks 0.3% |
| Issuer | | Shares | Value ($) |
| Financials 0.3% |
| Banks 0.2% |
| First Republic Bank | 5.125% | 6,900 | 172,845 |
| People’s United Financial, Inc.(m) | 5.625% | 8,645 | 225,548 |
| U.S. Bancorp(m) | 3.500% | 480 | 448,320 |
| U.S. Bancorp | 5.500% | 8,300 | 211,899 |
| Valley National Bancorp(m) | 5.500% | 6,350 | 166,370 |
| Total | | | 1,224,982 |
| Capital Markets —% |
| Stifel Financial Corp. | 5.200% | 10,225 | 253,273 |
| Insurance 0.1% |
| Hartford Financial Services Group, Inc. (The)(m) | 7.875% | 9,258 | 263,113 |
| Total Financials | 1,741,368 |
Total Preferred Stocks
(Cost $1,758,336) | 1,741,368 |
The accompanying Notes to Consolidated Financial Statements are an integral part of this statement.
| 32 | Multi-Manager Alternative Strategies Fund | Annual Report 2018 |
Consolidated Portfolio of Investments (continued)
August 31, 2018
| Residential Mortgage-Backed Securities - Agency 0.3% |
| Issuer | Coupon
Rate | | Principal
Amount ($) | Value ($) |
| Federal Home Loan Mortgage Corp.(b) |
| CMO Series 4638 Class UF |
1-month USD LIBOR + 1.000%
09/15/2044 | 3.082% | | 569,479 | 579,978 |
| Federal National Mortgage Association(b) |
| CMO Series 2013-5 Class GF |
1-month USD LIBOR + 1.100%
10/25/2042 | 3.165% | | 571,265 | 580,609 |
| Government National Mortgage Association(d) |
| CMO Series 2017-136 Class IO |
| 09/20/2047 | 5.000% | | 2,695,390 | 441,716 |
Total Residential Mortgage-Backed Securities - Agency
(Cost $1,642,032) | 1,602,303 |
|
| Residential Mortgage-Backed Securities - Non-Agency 7.7% |
| | | | |
| Adjustable Rate Mortgage Trust(b) |
| CMO Series 2005-9 Class 5A3 |
1-month USD LIBOR + 0.640%
11/25/2035 | 2.705% | | 552,746 | 543,135 |
| Alternative Loan Trust(c) |
| CMO Series 2005-43 Class 1A |
| 10/25/2035 | 3.396% | | 540,486 | 527,219 |
| American Home Mortgage Investment Trust(b) |
| CMO Series 2005-1 Class 6A |
6-month USD LIBOR + 2.000%
06/25/2045 | 4.534% | | 528,811 | 543,012 |
| Ameriquest Mortgage Securities, Inc. Asset Backed Pass-Through Certificates(b) |
| CMO Series 2005-R11 Class A1 |
1-month USD LIBOR + 0.230%
01/25/2036 | 2.295% | | 47,513 | 47,509 |
| CMO Series 2005-R11 Class M1 |
1-month USD LIBOR + 0.450%
01/25/2036 | 2.515% | | 500,000 | 499,695 |
| Arroyo Mortgage Trust(a),(c) |
| CMO Series 2018-1 Class A1 |
| 04/25/2048 | 3.763% | | 246,301 | 246,355 |
| ASG Resecuritization Trust(a),(b) |
| CMO Series 2010-3 Class 3A68 |
1-month USD LIBOR + 0.290%
12/28/2045 | 1.911% | | 8,051 | 8,049 |
| Asset-Backed Securities Corp. Home Equity Loan Trust(b) |
| CMO Series 2004-HE6 Class M1 |
1-month USD LIBOR + 0.945%
09/25/2034 | 3.010% | | 466,168 | 470,589 |
| Banc of America Funding Trust(b) |
| CMO Series 2006-G Class 2A1 |
1-month USD LIBOR + 0.220%
07/20/2036 | 2.297% | | 636,512 | 633,506 |
| Banc of America Funding Trust(a),(c) |
| CMO Series 2016-R1 Class A1 |
| 03/25/2040 | 2.500% | | 420,760 | 408,722 |
| Residential Mortgage-Backed Securities - Non-Agency (continued) |
| Issuer | Coupon
Rate | | Principal
Amount ($) | Value ($) |
| Subordinated, CMO Series 2014-R6 Class 2A13 |
| 07/26/2036 | 2.194% | | 925,000 | 891,081 |
| BCAP LLC Trust(a),(c) |
| CMO Series 2012-RR11 Class 2A3 |
| 08/26/2036 | 2.184% | | 204,366 | 204,191 |
| BCAP LLC Trust(a),(b) |
| CMO Series 2014-RR1 Class 3A3 |
1-month USD LIBOR + 0.160%
03/26/2037 | 2.224% | | 340,542 | 337,005 |
| CMO Series 2014-RR2 Class 6A1 |
1-month USD LIBOR + 0.240%
10/26/2036 | 2.304% | | 522,679 | 516,602 |
| CMO Series 2014-RR5 Class 1A4 |
1-month USD LIBOR + 0.225%
01/26/2036 | 2.275% | | 849,000 | 815,732 |
| Bear Stearns ALT-A Trust(b) |
| CMO Series 2004-6 Class M1 |
1-month USD LIBOR + 0.825%
07/25/2034 | 2.890% | | 788,770 | 748,795 |
| Bear Stearns Mortgage Funding Trust(b) |
| CMO Series 2006-AR3 Class 1A1 |
1-month USD LIBOR + 0.180%
10/25/2036 | 2.245% | | 771,520 | 723,105 |
| CMO Series 2006-AR4 Class A1 |
1-month USD LIBOR + 0.210%
12/25/2036 | 2.275% | | 501,509 | 483,041 |
| CMO Series 2007-AR3 Class 21A1 |
1-month USD LIBOR + 0.150%
04/25/2037 | 2.215% | | 779,080 | 744,938 |
| Bear Stearns Trust(b) |
| CMO Series 2005-1 Class A1 |
1-month USD LIBOR + 0.560%
01/25/2035 | 2.625% | | 302,785 | 303,504 |
| Centex Home Equity Loan Trust(b) |
| CMO Series 2005-A Class M1 |
1-month USD LIBOR + 0.720%
01/25/2035 | 2.785% | | 523,672 | 524,186 |
| CMO Series 2005-D Class M3 |
1-month USD LIBOR + 0.480%
10/25/2035 | 2.785% | | 900,000 | 902,945 |
| CIM Trust(a),(c) |
| CMO Series 2017-5 Class A1 |
| 05/25/2057 | 2.300% | | 291,658 | 287,995 |
| CMO Series 2018-R2 Class A1 |
| 08/27/2057 | 3.690% | | 773,533 | 769,993 |
| CMO Series 2018-R4 Class A1 |
| 12/26/2057 | 4.070% | | 825,535 | 825,540 |
| CIM Trust(a) |
| CMO Series 2017-7 Class A |
| 04/25/2057 | 3.000% | | 800,306 | 791,452 |
The accompanying Notes to Consolidated Financial Statements are an integral part of this statement.
Multi-Manager Alternative Strategies Fund | Annual Report 2018
| 33 |
Consolidated Portfolio of Investments (continued)
August 31, 2018
| Residential Mortgage-Backed Securities - Non-Agency (continued) |
| Issuer | Coupon
Rate | | Principal
Amount ($) | Value ($) |
| Citigroup Mortgage Loan Trust(b) |
| CMO Series 2006-HE1 Class M2 |
1-month USD LIBOR + 0.340%
01/25/2036 | 2.575% | | 197,664 | 197,741 |
| CMO Series 2006-HE1 Class M3 |
1-month USD LIBOR + 0.360%
01/25/2036 | 2.605% | | 750,000 | 750,247 |
| COLT Mortgage Loan Trust(a),(c) |
| CMO Series 2017-1 Class A1 |
| 05/27/2047 | 2.614% | | 648,883 | 630,715 |
| Countrywide Asset-Backed Certificates(b) |
| CMO Series 2004-AB2 Class M2 |
1-month USD LIBOR + 0.855%
05/25/2036 | 2.920% | | 777,570 | 783,635 |
| CMO Series 2007-13 Class 2A1 |
1-month USD LIBOR + 0.900%
10/25/2047 | 2.965% | | 264,661 | 264,086 |
| CMO Series 2007-13 Class 2A2 |
1-month USD LIBOR + 0.800%
10/25/2047 | 2.865% | | 526,115 | 520,724 |
| Credit Suisse Mortgage Capital Trust(a) |
| CMO Series 2015-2R Class 1A1 |
| 08/27/2037 | 3.000% | | 516,014 | 518,805 |
| CMO Series 20154R Class 5A1 |
| 10/27/2036 | 3.000% | | 416,111 | 418,506 |
| Credit-Based Asset Servicing & Securitization LLC(b) |
| CMO Series 2005-CB4 Class M2 |
1-month USD LIBOR + 0.450%
07/25/2035 | 2.515% | | 560,000 | 561,491 |
| CWABS Asset-Backed Certificates Trust(b) |
| CMO Series 2005-14 Class M2 |
1-month USD LIBOR + 0.470%
04/25/2036 | 2.535% | | 880,000 | 877,400 |
| Deephaven Residential Mortgage Trust(a),(c) |
| CMO Series 2017-1A Class A1 |
| 12/26/2046 | 2.725% | | 294,167 | 288,323 |
| Fannie Mae Connecticut Avenue Securities(b) |
| CMO Series 2014-C02 Class 1M1 |
1-month USD LIBOR + 0.950%
05/25/2024 | 3.015% | | 29,668 | 29,732 |
| CMO Series 2017-C03 Class 1M1 |
1-month USD LIBOR + 0.950%
10/25/2029 | 3.015% | | 406,270 | 408,365 |
| CMO Series 2017-C04 Class 2M1 |
1-month USD LIBOR + 0.850%
11/25/2029 | 2.915% | | 345,343 | 346,500 |
| First Franklin Mortgage Loan Trust(b) |
| CMO Series 2004-FF11 Class M3 |
1-month USD LIBOR + 0.900%
01/25/2035 | 2.965% | | 747,906 | 753,394 |
| Residential Mortgage-Backed Securities - Non-Agency (continued) |
| Issuer | Coupon
Rate | | Principal
Amount ($) | Value ($) |
| CMO Series 2006-FF4 Class A3 |
1-month USD LIBOR + 0.280%
03/25/2036 | 2.345% | | 700,000 | 687,716 |
| First Horizon Mortgage Pass-Through Trust(c) |
| CMO Series 2005-AR4 Class 2A1 |
| 10/25/2035 | 3.788% | | 594,200 | 574,821 |
| First NLC Trust(b) |
| CMO Series 2005-4 Class A4 |
1-month USD LIBOR + 0.390%
02/25/2036 | 2.455% | | 827,110 | 824,324 |
| Freddie Mac Structured Agency Credit Risk Debt Notes(b) |
| CMO Series 2016-DNA2 Class M2 |
1-month USD LIBOR + 2.200%
10/25/2028 | 4.265% | | 236,902 | 239,244 |
| CMO Series 2016-HQA3 Class M1 |
1-month USD LIBOR + 0.800%
03/25/2029 | 2.865% | | 123,975 | 124,094 |
| CMO Series 2017-DNA3 Class M1 |
1-month USD LIBOR + 0.750%
03/25/2030 | 2.815% | | 268,011 | 268,440 |
| GE-WMC Asset-Backed Pass-Through Certificates(b) |
| CMO Series 2005-1 Class M1 |
1-month USD LIBOR + 0.660%
10/25/2035 | 2.725% | | 865,827 | 863,732 |
| GMACM Mortgage Loan Trust(c) |
| CMO Series 2006-AR1 Class 1A1 |
| 04/19/2036 | 3.805% | | 709,342 | 659,466 |
| GSAMP Trust(b) |
| CMO Series 2005-WMC3 Class A2C |
1-month USD LIBOR + 0.330%
12/25/2035 | 2.725% | | 810,000 | 774,765 |
| HarborView Mortgage Loan Trust(b) |
| CMO Series 2007-6 Class 1A1A |
1-month USD LIBOR + 0.200%
08/19/2037 | 2.277% | | 703,726 | 651,089 |
| Home Equity Mortgage Loan Asset-Backed Trust(b) |
| CMO Series 2005-D Class AII4 |
1-month USD LIBOR + 0.350%
03/25/2036 | 2.415% | | 604,944 | 603,833 |
| Impac CMB Trust(b) |
| CMO Series 2004-8 Class 2A1 (FGIC) |
1-month USD LIBOR + 0.700%
10/25/2034 | 2.765% | | 635,512 | 625,352 |
| Impac Secured Assets Corp.(b) |
| CMO Series 2004-3 Class 2A2 |
1-month USD LIBOR + 0.640%
11/25/2034 | 2.705% | | 57,231 | 57,305 |
| JPMorgan Alternative Loan Trust(b) |
| CMO Series 2007-S1 Class A2 |
1-month USD LIBOR + 0.340%
04/25/2047 | 2.405% | | 474,382 | 460,281 |
The accompanying Notes to Consolidated Financial Statements are an integral part of this statement.
| 34 | Multi-Manager Alternative Strategies Fund | Annual Report 2018 |
Consolidated Portfolio of Investments (continued)
August 31, 2018
| Residential Mortgage-Backed Securities - Non-Agency (continued) |
| Issuer | Coupon
Rate | | Principal
Amount ($) | Value ($) |
| JPMorgan Mortgage Acquisition Corp.(b) |
| CMO Series 2006-FRE1 Class M1 |
1-month USD LIBOR + 0.390%
05/25/2035 | 2.455% | | 600,000 | 596,119 |
| JPMorgan Mortgage Acquisition Trust(b) |
| CMO Series 2007-CH2 Class AV5 |
1-month USD LIBOR + 0.260%
01/25/2037 | 2.325% | | 630,000 | 622,322 |
| CMO Series 2007-CH3 Class A5 |
1-month USD LIBOR + 0.260%
03/25/2037 | 2.325% | | 895,000 | 874,966 |
| CMO Series 2007-HE1 Class AV4 |
1-month USD LIBOR + 0.280%
03/25/2047 | 2.345% | | 1,103,000 | 975,061 |
| Lehman XS Trust(b) |
| CMO Series 2007-16N Class 2A2 |
1-month USD LIBOR + 0.850%
09/25/2047 | 2.914% | | 701,032 | 684,671 |
| Morgan Stanley Mortgage Loan Trust(b) |
| CMO Series 2005-6AR Class 1A1 |
1-month USD LIBOR + 0.280%
11/25/2035 | 2.625% | | 252,895 | 253,805 |
| Morgan Stanley Resecuritization Trust(a),(b) |
| CMO Series 2013-R6 Class 2A |
1-month USD LIBOR + 0.260%
04/26/2053 | 1.881% | | 555,131 | 550,745 |
| MortgageIT Trust(b) |
| CMO Series 2005-4 Class A1 |
1-month USD LIBOR + 0.280%
10/25/2035 | 2.345% | | 574,086 | 567,557 |
| Nomura Resecuritization Trust(a),(b) |
| CMO Series 2014-6R Class 2A1 |
1-month USD LIBOR + 0.160%
03/26/2037 | 1.188% | | 420,067 | 398,700 |
| Nomura Resecuritization Trust(a),(c) |
| CMO Series 2015-6R Class 2A1 |
| 01/26/2037 | 4.000% | | 234,822 | 234,291 |
| Option One Mortgage Loan Trust(b) |
| CMO Series 2005-2 Class M1 |
1-month USD LIBOR + 0.660%
05/25/2035 | 2.725% | | 549,030 | 550,001 |
| CMO Series 2006-1 Class 1A1 |
1-month USD LIBOR + 0.220%
01/25/2036 | 2.285% | | 584,005 | 575,573 |
| RALI Series Trust(b) |
| CMO Series 2006-QA6 Class A3 |
1-month USD LIBOR + 0.190%
07/25/2036 | 2.255% | | 756,989 | 697,272 |
| CMO Series 2007-QH6 Class A1 |
1-month USD LIBOR + 0.190%
07/25/2037 | 2.255% | | 707,621 | 688,562 |
| Residential Mortgage-Backed Securities - Non-Agency (continued) |
| Issuer | Coupon
Rate | | Principal
Amount ($) | Value ($) |
| RAMP Series Trust(b) |
| CMO Series 2005-RZ4 Class M1 |
1-month USD LIBOR + 0.480%
11/25/2035 | 2.545% | | 250,270 | 250,737 |
| RAMP Trust(b) |
| CMO Series 2005-RS4 Class M4 |
1-month USD LIBOR + 0.640%
04/25/2035 | 3.025% | | 745,000 | 746,746 |
| CMO Series 2005-RZ3 Class M3 |
1-month USD LIBOR + 0.550%
09/25/2035 | 2.890% | | 850,000 | 845,155 |
| Soundview Home Loan Trust(b) |
| CMO Series 2006-OPT5 Class 1A1 |
1-month USD LIBOR + 0.140%
07/25/2036 | 2.205% | | 856,450 | 830,135 |
| Specialty Underwriting & Residential Finance Trust(b) |
| CMO Series 2005-AB3 Class A1A |
1-month USD LIBOR + 0.260%
09/25/2036 | 2.585% | | 446,531 | 446,797 |
| Structured Adjustable Rate Mortgage Loan Trust(b) |
| CMO Series 2005-19XS Class 2A1 |
1-month USD LIBOR + 0.300%
10/25/2035 | 2.365% | | 456,679 | 450,322 |
| Structured Asset Investment Loan Trust(b) |
| CMO Series 2004-6 Class A3 |
1-month USD LIBOR + 0.800%
07/25/2034 | 2.865% | | 775,082 | 772,182 |
| CMO Series 2005-10 Class A6 |
1-month USD LIBOR + 0.330%
12/25/2035 | 2.725% | | 547,626 | 547,166 |
| Towd Point Mortgage Trust(a),(c) |
| CMO Series 2015-6 Class M2 |
| 04/25/2055 | 3.750% | | 125,000 | 124,385 |
| CMO Series 2018-3 Class A1 |
| 05/25/2058 | 3.750% | | 145,493 | 146,036 |
| Towd Point Mortgage Trust(a) |
| CMO Series 2017-3 Class A1 |
| 07/25/2057 | 2.750% | | 79,713 | 78,198 |
| Towd Point Mortgage Trust(a),(b) |
| CMO Series 2017-5 Class A1 |
1-month USD LIBOR + 0.600%
02/25/2057 | 2.665% | | 692,077 | 692,703 |
| Towd Point Mortgage Trust |
| CMO Series 2018-4 Class A1 |
| 06/25/2058 | 3.000% | | 315,000 | 306,408 |
| Verus Securitization Trust(a) |
| CMO Series 2018-1 Class A1 |
| 02/25/2048 | 2.929% | | 103,195 | 102,077 |
The accompanying Notes to Consolidated Financial Statements are an integral part of this statement.
Multi-Manager Alternative Strategies Fund | Annual Report 2018
| 35 |
Consolidated Portfolio of Investments (continued)
August 31, 2018
| Residential Mortgage-Backed Securities - Non-Agency (continued) |
| Issuer | Coupon
Rate | | Principal
Amount ($) | Value ($) |
| Washington Mutual Mortgage Pass-Through Certificates WMALT Trust(b) |
| CMO Series 2006-AR2 Class A1A |
1-year MTA + 0.940%
04/25/2046 | 2.784% | | 438,470 | 393,489 |
| Wells Fargo Alternative Loan Trust(b) |
| CMO Series 2005-2 Class M1 |
1-month USD LIBOR + 0.675%
10/25/2035 | 2.740% | | 504,099 | 502,329 |
Total Residential Mortgage-Backed Securities - Non-Agency
(Cost $43,610,740) | 44,066,532 |
|
| Senior Loans(k) 2.1% |
| Borrower | Coupon
Rate | | Principal
Amount ($) | Value ($) |
| Aerospace & Defense 0.0% |
| DAE Aviation Holdings, Inc.(b),(o) |
| Term Loan |
3-month USD LIBOR + 3.750%
07/07/2022 | 5.830% | | 114,120 | 114,335 |
| Airlines 0.1% |
| American Airlines, Inc.(b),(o) |
| Tranche B Term Loan |
3-month USD LIBOR + 2.000%
04/28/2023 | 4.065% | | 227,677 | 225,873 |
| United AirLines, Inc.(b),(o) |
| Term Loan |
3-month USD LIBOR + 1.750%
04/01/2024 | 3.826% | | 227,694 | 227,221 |
| Total | 453,094 |
| Automotive 0.0% |
| American Axle & Manufacturing, Inc.(b),(o) |
| Tranche B Term Loan |
3-month USD LIBOR + 2.250%
04/06/2024 | 4.373% | | 226,515 | 226,289 |
| Cable and Satellite 0.1% |
| Charter Communications Operating, LLC/Safari LLC(b),(o) |
| Tranche B Term Loan |
3-month USD LIBOR + 2.000%
04/30/2025 | 4.080% | | 497,500 | 497,500 |
| Virgin Media Bristol LLC(b),(o) |
| Tranche K Term Loan |
3-month USD LIBOR + 2.500%
01/15/2026 | 4.563% | | 210,000 | 209,857 |
| Total | 707,357 |
| Senior Loans(k) (continued) |
| Borrower | Coupon
Rate | | Principal
Amount ($) | Value ($) |
| Consumer Cyclical Services 0.0% |
| ServiceMaster Co. LLC (The)(b),(o) |
| Tranche C Term Loan |
3-month USD LIBOR + 2.500%
11/08/2023 | 4.576% | | 135,174 | 135,198 |
| Uber Technologies, Inc.(b),(o) |
| Term Loan |
3-month USD LIBOR + 4.000%
04/04/2025 | 6.080% | | 90,000 | 90,562 |
| Total | 225,760 |
| Consumer Products 0.1% |
| Energizer Holdings, Inc.(b),(o),(p) |
| Tranche B Term Loan |
3-month USD LIBOR + 2.250%
06/20/2025 | | | 265,000 | 266,325 |
| Revlon Consumer Products Corp.(b),(o) |
| Tranche B Term Loan |
3-month USD LIBOR + 3.500%
09/07/2023 | 5.811% | | 661,633 | 491,024 |
| Total | 757,349 |
| Food and Beverage 0.1% |
| Aramark Intermediate HoldCo Corp.(b),(o) |
| Tranche B2 Term Loan |
3-month USD LIBOR + 1.750%
03/28/2024 | 4.084% | | 230,306 | 230,691 |
| Tranche B3 Term Loan |
3-month USD LIBOR + 1.750%
03/11/2025 | 4.084% | | 79,800 | 79,900 |
| US Foods, Inc./US Foodservice, Inc.(b),(o),(p) |
| Term Loan |
3-month USD LIBOR + 2.000%
06/27/2023 | | | 10,000 | 9,981 |
| Total | 320,572 |
| Health Care 0.0% |
| Gentiva Health Services, Inc.(b),(o) |
| 1st Lien Term Loan |
3-month USD LIBOR + 3.750%
07/02/2025 | 6.125% | | 205,294 | 206,577 |
| Home Construction 0.1% |
| Brookfield WEC Holdings, Inc.(b),(o),(p) |
| Term Loan |
3-month USD LIBOR + 2.500%
08/01/2025 | 6.500% | | 365,000 | 362,467 |
The accompanying Notes to Consolidated Financial Statements are an integral part of this statement.
| 36 | Multi-Manager Alternative Strategies Fund | Annual Report 2018 |
Consolidated Portfolio of Investments (continued)
August 31, 2018
| Senior Loans(k) (continued) |
| Borrower | Coupon
Rate | | Principal
Amount ($) | Value ($) |
| Independent Energy 0.0% |
| MEG Energy Corp.(b),(o) |
| Term Loan |
3-month USD LIBOR + 3.500%
12/31/2023 | 0.000% | | 43,233 | 43,266 |
| Leisure 0.0% |
| Cinemark U.S.A., Inc.(b),(o) |
| Term Loan |
3-month USD LIBOR + 1.750%
03/31/2025 | 3.835% | | 113,932 | 113,980 |
| Metro-Goldwyn-Mayer, Inc.(b),(o) |
| 2nd Lien Term Loan |
3-month USD LIBOR + 4.500%
07/03/2026 | 6.580% | | 205,000 | 205,000 |
| Total | 318,980 |
| Lodging 0.2% |
| Four Seasons Holdings, Inc.(b),(o) |
| 1st Lien Term Loan |
3-month USD LIBOR + 2.000%
11/30/2023 | 4.076% | | 366,129 | 365,804 |
| Hilton Worldwide Finance LLC(b),(o) |
| Tranche B2 Term Loan |
3-month USD LIBOR + 1.750%
10/25/2023 | 3.815% | | 251,101 | 251,834 |
| Marriott Ownership(b),(o),(p) |
| Term Loan |
3-month USD LIBOR + 2.250%
08/29/2025 | | | 275,000 | 275,344 |
| Wyndham Hotels & Resorts, Inc,(b),(o),(p) |
| Tranche B Term Loan |
3-month USD LIBOR + 1.750%
05/30/2025 | 3.826% | | 125,000 | 125,125 |
| Total | 1,018,107 |
| Media and Entertainment 0.1% |
| Cengage Learning, Inc.(b),(o) |
| Term Loan |
3-month USD LIBOR + 4.250%
06/07/2023 | 6.327% | | 250,000 | 231,375 |
| Meredith Corp.(b),(o) |
| Term Loan |
3-month USD LIBOR + 3.000%
01/31/2025 | 5.076% | | 169,550 | 169,926 |
| Total | 401,301 |
| Senior Loans(k) (continued) |
| Borrower | Coupon
Rate | | Principal
Amount ($) | Value ($) |
| Midstream 0.0% |
| Energy Transfer Equity LP(b),(o),(p) |
| Term Loan |
3-month USD LIBOR + 2.000%
02/02/2024 | | | 120,000 | 119,981 |
| Other Financial Institutions 0.1% |
| WP CPP Holdings, LLC(b),(o) |
| 1st Lien Term Loan |
3-month USD LIBOR + 3.750%
04/30/2025 | 6.214% | | 345,000 | 346,080 |
| Other Industry 0.1% |
| AECOM (b),(o) |
| Tranche B Term Loan |
3-month USD LIBOR + 1.750%
03/13/2025 | 3.826% | | 233,113 | 233,259 |
| Altran Technologies(b),(o) |
| Tranche B Term Loan |
3-month Euribor + 2.750%
03/20/2025 | 2.750% | EUR | 58,723 | 67,829 |
| RBS Global, Inc./Rexnord LLC(b),(o) |
| Term Loan |
3-month USD LIBOR + 2.000%
08/21/2024 | 4.065% | | 87,591 | 87,837 |
| Total | 388,925 |
| Packaging 0.2% |
| Berry Global, Inc.(b),(o) |
| Tranche Q Term Loan |
3-month USD LIBOR + 2.000%
10/01/2022 | 4.186% | | 145,576 | 145,613 |
| Tranche R Term Loan |
3-month USD LIBOR + 2.000%
01/19/2024 | 4.186% | | 341,541 | 341,306 |
| Tranche S Term Loan |
3-month USD LIBOR + 1.750%
02/08/2020 | 3.936% | | 136,000 | 135,891 |
| BWAY Holding Co.(b),(o) |
| Term Loan |
3-month USD LIBOR + 3.250%
04/03/2024 | 5.581% | | 195,000 | 194,163 |
| Crown Holdings, Inc.(b),(o) |
| Tranche B Term Loan |
3-month USD LIBOR + 2.000%
04/03/2025 | 4.076% | | 50,000 | 50,134 |
3-month Euribor + 2.375%
04/03/2025 | 2.375% | EUR | 50,000 | 58,150 |
| Total | 925,257 |
The accompanying Notes to Consolidated Financial Statements are an integral part of this statement.
Multi-Manager Alternative Strategies Fund | Annual Report 2018
| 37 |
Consolidated Portfolio of Investments (continued)
August 31, 2018
| Senior Loans(k) (continued) |
| Borrower | Coupon
Rate | | Principal
Amount ($) | Value ($) |
| Pharmaceuticals 0.0% |
| Catalent Pharma Solutions, Inc.(b),(o) |
| Term Loan |
3-month USD LIBOR + 2.250%
05/20/2024 | 4.326% | | 15,786 | 15,830 |
| Grifols Worldwide Operations Ltd.(b),(o) |
| Tranche B Term Loan |
3-month USD LIBOR + 2.250%
01/31/2025 | 4.207% | | 287,093 | 288,204 |
| Total | 304,034 |
| Property & Casualty 0.0% |
| USI, Inc.(b),(o) |
| Term Loan |
3-month USD LIBOR + 3.000%
05/16/2024 | 5.334% | | 173,687 | 173,180 |
| Restaurants 0.1% |
| New Red Finance, Inc./Burger King/Tim Hortons(b),(o) |
| Tranche B3 Term Loan |
3-month USD LIBOR + 2.250%
02/16/2024 | 4.326% | | 380,118 | 379,882 |
| Retailers 0.1% |
| Neiman Marcus Group, Ltd. LLC(b),(o),(p) |
| Term Loan |
3-month USD LIBOR + 3.250%
10/25/2020 | 5.330% | | 423,281 | 392,382 |
| Technology 0.5% |
| Ascend Learning LLC(b),(o) |
| Term Loan |
3-month USD LIBOR + 3.000%
07/12/2024 | 5.076% | | 114,138 | 113,852 |
| Avaya, Inc.(b),(o) |
| Tranche B Term Loan |
3-month USD LIBOR + 4.250%
12/15/2024 | 6.313% | | 194,025 | 195,214 |
| Barracuda Networks, Inc.(b),(o) |
| 1st Lien Term Loan |
3-month USD LIBOR + 3.250%
02/12/2025 | 5.314% | | 144,637 | 144,638 |
| Dell International LLC/EMC Corp.(b),(o) |
| Tranche A3 Term Loan |
3-month USD LIBOR + 1.500%
12/31/2018 | 3.580% | | 185,300 | 185,186 |
| Tranche B Term Loan |
3-month USD LIBOR + 2.000%
09/07/2023 | 4.080% | | 263,573 | 263,462 |
| Senior Loans(k) (continued) |
| Borrower | Coupon
Rate | | Principal
Amount ($) | Value ($) |
| First Data Corp.(b),(o) |
| Term Loan |
3-month USD LIBOR + 2.000%
07/08/2022 | 4.066% | | 309,196 | 308,986 |
| Microchip Technology, Inc.(b),(o) |
| Term Loan |
3-month USD LIBOR + 2.000%
05/29/2025 | 4.080% | | 190,000 | 189,645 |
| Micron Technology, Inc.(b),(o) |
| Term Loan |
3-month USD LIBOR + 1.750%
04/26/2022 | 3.830% | | 209,733 | 210,345 |
| Rackspace Hosting, Inc.(b),(o) |
| Tranche B 1st Lien Term Loan |
3-month USD LIBOR + 3.000%
11/03/2023 | 5.348% | | 59,549 | 59,140 |
| RP Crown Parent, LLC(b),(o) |
| Term Loan |
3-month USD LIBOR + 2.750%
10/12/2023 | 4.826% | | 307,657 | 308,171 |
| SS&C Technologies Holdings, Inc.(b),(o) |
| Tranche B3 Term Loan |
3-month USD LIBOR + 2.500%
04/16/2025 | 4.326% | | 138,400 | 138,469 |
| Tranche B4 Term Loan |
3-month USD LIBOR + 2.500%
04/16/2025 | 4.326% | | 53,552 | 53,578 |
| SS&C Technologies Holdings, Inc.(b),(o),(p) |
| Tranche B5 Term Loan |
3-month USD LIBOR + 2.500%
04/16/2025 | | | 195,000 | 195,041 |
| West Corp.(b),(o) |
| Tranche B Term Loan |
3-month USD LIBOR + 4.000%
10/10/2024 | 6.076% | | 153,558 | 152,838 |
| Worldplay LLC(b),(o),(p) |
| Tranche B4 Term Loan |
3-month USD LIBOR + 1.750%
08/09/2024 | 3.813% | | 230,624 | 230,541 |
| Zebra Technologies Corp./Diamond Holdings Ltd.(b),(o) |
| Tranche B Term Loan |
3-month USD LIBOR + 1.750%
10/27/2021 | 4.063% | | 151,199 | 151,891 |
| Total | 2,900,997 |
| Transportation Services 0.0% |
| XPO Logistics, Inc.(b),(o),(p) |
| Term Loan |
3-month USD LIBOR + 2.000%
02/24/2025 | | | 40,000 | 40,077 |
The accompanying Notes to Consolidated Financial Statements are an integral part of this statement.
| 38 | Multi-Manager Alternative Strategies Fund | Annual Report 2018 |
Consolidated Portfolio of Investments (continued)
August 31, 2018
| Senior Loans(k) (continued) |
| Borrower | Coupon
Rate | | Principal
Amount ($) | Value ($) |
| Wireless 0.1% |
| SBA Senior Finance II LLC(b),(o) |
| Term Loan |
3-month USD LIBOR + 2.000%
04/11/2025 | 4.080% | | 342,333 | 341,097 |
| Sprint Communications, Inc.(b),(o) |
| Term Loan |
3-month USD LIBOR + 2.500%
02/02/2024 | 4.625% | | 341,541 | 341,541 |
| Total | 682,638 |
| Wirelines 0.1% |
| CenturyLink, Inc.(b),(o) |
| Tranche B Term Loan |
3-month USD LIBOR + 2.750%
01/31/2025 | 4.826% | | 175,120 | 173,019 |
| Coral-US Co-Borrower LLC/Cable & Wireless Ltd.(b),(o) |
| Tranche B4 Term Loan |
3-month USD LIBOR + 3.250%
01/30/2026 | 5.326% | | 270,000 | 269,943 |
| Total | 442,962 |
Total Senior Loans
(Cost $12,300,475) | 12,251,849 |
|
| Treasury Bills(k) 5.2% |
| Issuer | Effective
Yield | | Principal
Amount ($) | Value ($) |
| Japan 0.6% |
| Japan Treasury Discount Bills |
| 09/10/2018 | (0.120%) | JPY | 255,000,000 | 2,295,100 |
| 10/15/2018 | (0.160%) | JPY | 115,000,000 | 1,035,211 |
| Total | 3,330,311 |
| United States 4.6% |
| U.S. Treasury Bills |
| 09/06/2018 | 1.830% | | 1,254,000 | 1,253,623 |
| 10/18/2018 | 1.900% | | 1,010,000 | 1,007,481 |
| 01/03/2019 | 2.100% | | 4,508,000 | 4,475,884 |
| 01/10/2019 | 2.120% | | 1,860,000 | 1,845,864 |
| 01/31/2019 | 2.180% | | 9,275,000 | 9,191,195 |
| 02/07/2019 | 2.180% | | 6,288,000 | 6,228,465 |
| 02/14/2019 | 2.200% | | 1,307,000 | 1,293,987 |
| 02/21/2019 | 2.200% | | 1,225,000 | 1,212,260 |
| U.S. Treasury Bills(h) |
| 09/13/2018 | 1.850% | | 102,000 | 101,933 |
| Total | 26,610,692 |
Total Treasury Bills
(Cost $29,934,056) | 29,941,003 |
|
| U.S. Treasury Obligations 0.2% |
| Issuer | Coupon
Rate | | Principal
Amount ($) | Value ($) |
| U.S. Treasury |
| 02/15/2048 | 3.000% | | 913,300 | 911,809 |
Total U.S. Treasury Obligations
(Cost $905,552) | 911,809 |
| Warrants 0.0% |
| Issuer | Shares | Value ($) |
| Information Technology —% |
| Software —% |
| Avaya Holdings Corp.(f),(g) | 9,192 | 43,662 |
| Total Information Technology | 43,662 |
Total Warrants
(Cost $—) | 43,662 |
| Options Purchased Calls 0.0% |
| | | | | Value ($) |
| (Cost $54,901) | 38,132 |
|
| Options Purchased Puts 0.0% |
| | | | |
| (Cost $233,407) | 73,726 |
| Money Market Funds 22.7% |
| | Shares | Value ($) |
| Columbia Short-Term Cash Fund, 2.058%(q),(r),(s) | 129,624,362 | 129,611,399 |
Total Money Market Funds
(Cost $129,612,893) | 129,611,399 |
Total Investments in Securities
(Cost $557,335,706) | 554,174,028 |
|
| Investments in securities sold short |
| |
| Common Stocks (6.0)% |
| Issuer | Shares | Value ($) |
| Consumer Discretionary (1.6)% |
| Hotels, Restaurants & Leisure (0.6)% |
| Choice Hotels International, Inc. | (10,687) | (834,121) |
| Extended Stay America, Inc. | (7,385) | (149,029) |
| Hilton Worldwide Holdings, Inc. | (11,103) | (861,815) |
| Marriott International, Inc., Class A | (6,517) | (824,205) |
| Marriott Vacations World | (5,638) | (670,922) |
| Total | | (3,340,092) |
The accompanying Notes to Consolidated Financial Statements are an integral part of this statement.
Multi-Manager Alternative Strategies Fund | Annual Report 2018
| 39 |
Consolidated Portfolio of Investments (continued)
August 31, 2018
|
| Common Stocks (continued) |
| Issuer | Shares | Value ($) |
| Media (0.8)% |
| Discovery, Inc., Class A(f) | (39,044) | (1,086,594) |
| Walt Disney Co. (The) | (33,730) | (3,778,435) |
| Total | | (4,865,029) |
| Specialty Retail (0.2)% |
| Lowe’s Companies, Inc. | (9,955) | (1,082,606) |
| Total Consumer Discretionary | (9,287,727) |
| Consumer Staples (0.8)% |
| Beverages (0.3)% |
| Keurig Dr. Pepper, Inc. | (70,753) | (1,613,169) |
| Food Products (0.3)% |
| ConAgra Foods, Inc. | (52,908) | (1,944,369) |
| Household Products (0.2)% |
| Energizer Holdings, Inc. | (16,434) | (1,045,038) |
| Total Consumer Staples | (4,602,576) |
| Energy (0.5)% |
| Oil, Gas & Consumable Fuels (0.5)% |
| Marathon Petroleum Corp. | (32,129) | (2,643,895) |
| Total Energy | (2,643,895) |
| Health Care (0.3)% |
| Health Care Providers & Services (0.1)% |
| Cigna Corp. | (1,315) | (247,667) |
| CVS Health Corp. | (6,476) | (487,254) |
| Total | | (734,921) |
| Life Sciences Tools & Services (0.1)% |
| Cambrex Corp.(f) | (8,470) | (570,878) |
| Pharmaceuticals (0.1)% |
| Merck KGaA | (4,380) | (460,008) |
| Total Health Care | (1,765,807) |
| Industrials (1.0)% |
| Machinery (0.3)% |
| Dover Corp. | (9,971) | (856,210) |
| Greenbrier Companies, Inc. (The) | (8,380) | (486,040) |
| Total | | (1,342,250) |
| Road & Rail (0.4)% |
| CSX Corp. | (31,326) | (2,323,136) |
|
| Common Stocks (continued) |
| Issuer | Shares | Value ($) |
| Trading Companies & Distributors (0.3)% |
| GATX Corp. | (20,949) | (1,769,143) |
| Total Industrials | (5,434,529) |
| Information Technology (1.3)% |
| Internet Software & Services (0.9)% |
| Alibaba Group Holding Ltd., ADR(f) | (31,214) | (5,462,762) |
| IT Services (0.3)% |
| Booz Allen Hamilton Holding Corp. | (6,246) | (319,545) |
| CACI International, Inc., Class A(f) | (1,680) | (327,600) |
| CGI Group, Inc., Class A(f) | (5,562) | (364,700) |
| International Business Machines Corp. | (2,313) | (338,808) |
| Science Applications International Corp. | (3,198) | (288,524) |
| Total | | (1,639,177) |
| Software (0.1)% |
| Pivotal Software, Inc., Class A(f) | (1,389) | (38,545) |
| SecureWorks Corp., Class A(f) | (719) | (9,570) |
| VMware, Inc., Class A(f) | (3,508) | (537,636) |
| Total | | (585,751) |
| Total Information Technology | (7,687,690) |
| Materials (0.2)% |
| Chemicals (0.2)% |
| Eastman Chemical Co. | (2,038) | (197,747) |
| International Flavors & Fragrances, Inc. | (3,588) | (467,481) |
| PPG Industries, Inc. | (719) | (79,478) |
| RPM International, Inc. | (1,210) | (81,675) |
| Sensient Technologies Corp. | (5,977) | (424,487) |
| Sherwin-Williams Co. (The) | (161) | (73,348) |
| Total | | (1,324,216) |
| Total Materials | (1,324,216) |
| Real Estate (0.3)% |
| Equity Real Estate Investment Trusts (REITS) (0.3)% |
| DiamondRock Hospitality Co. | (12,883) | (154,081) |
| Hospitality Properties Trust | (5,087) | (147,472) |
| Host Hotels & Resorts, Inc. | (21,663) | (466,404) |
| National Retail Properties, Inc. | (11,021) | (507,958) |
| Realty Income Corp. | (7,757) | (454,328) |
| Total | | (1,730,243) |
| Total Real Estate | (1,730,243) |
The accompanying Notes to Consolidated Financial Statements are an integral part of this statement.
| 40 | Multi-Manager Alternative Strategies Fund | Annual Report 2018 |
Consolidated Portfolio of Investments (continued)
August 31, 2018
|
| Common Stocks (continued) |
| Issuer | Shares | Value ($) |
| Utilities (0.0)% |
| Electric Utilities (0.0)% |
| Evergy, Inc. | — | (33) |
| Total Utilities | (33) |
Total Common Stocks
(Proceeds $33,257,150) | (34,476,716) |
| Corporate Bonds & Notes (0.4)% |
| Issuer | Coupon
Rate | | Principal
Amount ($) | Value ($) |
| Food and Beverage (0.2)% |
| Keurig Dr. Pepper, Inc. |
| 12/15/2046 | 4.420% | | (1,237,000) | (1,144,944) |
| Lodging (0.2)% |
| Wyndham Destinations, Inc. |
| 03/01/2023 | 3.900% | | (1,002,000) | (936,293) |
Total Corporate Bonds & Notes
(Proceeds $2,059,630) | (2,081,237) |
| Exchange-Traded Funds (3.3)% |
| | Shares | Value ($) |
| Consumer Staples Select Sector SPDR Fund | (20,323) | (1,092,971) |
| Industrial Select Sector SPDR Fund | (7,123) | (549,183) |
| iShares Russell 2000 Value ETF | (8,637) | (1,182,146) |
| SPDR S&P 500 ETF Trust | (48,678) | (14,131,710) |
| VanEck Vectors Semiconductor ETF | (1,153) | (125,608) |
| Vanguard REIT ETF | (22,290) | (1,873,475) |
Total Exchange-Traded Funds
(Proceeds $18,450,880) | (18,955,093) |
Total Investments in Securities Sold Short
(Proceeds $53,767,660) | (55,513,046) |
| Total Investments in Securities, Net of Securities Sold Short | 498,660,982 |
| Other Assets & Liabilities, Net | | 73,503,602 |
| Net Assets | 572,164,584 |
At August 31, 2018, securities and/or cash totaling $115,169,965 were pledged as collateral.
Investments in derivatives
| Forward foreign currency exchange contracts |
Currency to
be sold | Currency to
be purchased | Counterparty | Settlement
date | Unrealized
appreciation ($) | Unrealized
depreciation ($) |
| 1,930,000 AUD | 158,328,220 JPY | ANZ Securities | 09/19/2018 | 38,920 | — |
| 1,245,000 AUD | 1,369,232 NZD | ANZ Securities | 09/19/2018 | 10,865 | — |
| 4,788,681 AUD | 3,661,088 USD | ANZ Securities | 09/19/2018 | 218,572 | — |
| 635,000 EUR | 753,878 USD | ANZ Securities | 09/19/2018 | 16,035 | — |
| 630,000 EUR | 720,172 USD | ANZ Securities | 09/19/2018 | — | (11,862) |
| 52,117,935 JPY | 645,000 AUD | ANZ Securities | 09/19/2018 | — | (5,846) |
| 3,445,419 NZD | 3,115,000 AUD | ANZ Securities | 09/19/2018 | — | (40,144) |
| 4,985,521 NZD | 3,471,750 USD | ANZ Securities | 09/19/2018 | 173,352 | — |
| 4,954,240 USD | 6,698,892 AUD | ANZ Securities | 09/19/2018 | — | (138,500) |
| 419,986 USD | 635,000 NZD | ANZ Securities | 09/19/2018 | 127 | — |
| 1,554,538 USD | 2,290,122 NZD | ANZ Securities | 09/19/2018 | — | (39,404) |
| 1,665,958 CAD | 1,280,000 USD | BMO | 09/19/2018 | 3,061 | — |
| 1,106,011 CAD | 1,285,000 NZD | Canadian Imperial Bank of Commerce | 09/19/2018 | 2,405 | — |
| 6,715,670 CAD | 5,160,000 USD | Canadian Imperial Bank of Commerce | 09/19/2018 | 12,512 | — |
| 221,263,700 JPY | 2,590,000 CAD | Canadian Imperial Bank of Commerce | 09/19/2018 | — | (8,146) |
| 650,000 USD | 848,380 CAD | Canadian Imperial Bank of Commerce | 09/19/2018 | 274 | — |
| 1,295,000 USD | 1,682,218 CAD | Canadian Imperial Bank of Commerce | 09/19/2018 | — | (5,598) |
| 138,504,870 JPY | 1,262,868 USD | Citi | 09/18/2018 | 15,173 | — |
| 1,260,000 USD | 138,504,870 JPY | Citi | 09/18/2018 | — | (12,305) |
| 4,209,200 AUD | 3,152,898 USD | Citi | 09/19/2018 | 126,963 | — |
| 4,066,000 BRL | 1,093,473 USD | Citi | 09/19/2018 | 96,801 | — |
| 1,631,861 CAD | 1,251,488 USD | Citi | 09/19/2018 | 684 | — |
| 5,947,200 CAD | 4,504,749 USD | Citi | 09/19/2018 | — | (53,715) |
| 38,400 CHF | 39,151 USD | Citi | 09/19/2018 | — | (515) |
The accompanying Notes to Consolidated Financial Statements are an integral part of this statement.
Multi-Manager Alternative Strategies Fund | Annual Report 2018
| 41 |
Consolidated Portfolio of Investments (continued)
August 31, 2018
| Forward foreign currency exchange contracts (continued) |
Currency to
be sold | Currency to
be purchased | Counterparty | Settlement
date | Unrealized
appreciation ($) | Unrealized
depreciation ($) |
| 739,826,010 COP | 253,737 USD | Citi | 09/19/2018 | 11,061 | — |
| 1,640,000 COP | 538 USD | Citi | 09/19/2018 | — | — |
| 1,240,000 EUR | 1,106,133 GBP | Citi | 09/19/2018 | — | (5,966) |
| 315,000 EUR | 3,290,049 SEK | Citi | 09/19/2018 | — | (5,869) |
| 13,715,025 EUR | 16,133,410 USD | Citi | 09/19/2018 | 197,118 | — |
| 1,134,880 EUR | 1,312,087 USD | Citi | 09/19/2018 | — | (6,597) |
| 1,124,230 GBP | 1,250,000 EUR | Citi | 09/19/2018 | — | (5,889) |
| 776,800 GBP | 1,022,051 USD | Citi | 09/19/2018 | 14,395 | — |
| 1,453,127 GBP | 1,878,590 USD | Citi | 09/19/2018 | — | (6,388) |
| 544,400 HKD | 69,455 USD | Citi | 09/19/2018 | 78 | — |
| 159,397,600 HUF | 589,379 USD | Citi | 09/19/2018 | 22,450 | — |
| 4,033,600 HUF | 14,222 USD | Citi | 09/19/2018 | — | (125) |
| 8,257,258,691 IDR | 570,864 USD | Citi | 09/19/2018 | 16,265 | — |
| 116,858,483 INR | 1,683,815 USD | Citi | 09/19/2018 | 38,466 | — |
| 50,458,750 JPY | 625,000 AUD | Citi | 09/19/2018 | — | (5,276) |
| 804,247,939 JPY | 7,334,452 USD | Citi | 09/19/2018 | 89,026 | — |
| 403,552,524 JPY | 3,615,902 USD | Citi | 09/19/2018 | — | (19,681) |
| 1,155,722,394 KRW | 1,045,215 USD | Citi | 09/19/2018 | 7,700 | — |
| 510,455,994 KRW | 456,092 USD | Citi | 09/19/2018 | — | (2,154) |
| 57,091,130 MXN | 3,036,116 USD | Citi | 09/19/2018 | 54,592 | — |
| 112,060,241 MXN | 5,372,706 USD | Citi | 09/19/2018 | — | (479,521) |
| 9,600 NOK | 1,152 USD | Citi | 09/19/2018 | 7 | — |
| 3,162,400 NOK | 374,427 USD | Citi | 09/19/2018 | — | (2,882) |
| 4,244,800 NZD | 2,931,849 USD | Citi | 09/19/2018 | 123,509 | — |
| 8,044,400 PHP | 151,606 USD | Citi | 09/19/2018 | 1,509 | — |
| 4,968,400 PLN | 1,365,384 USD | Citi | 09/19/2018 | 24,673 | — |
| 1,553,200 PLN | 414,862 USD | Citi | 09/19/2018 | — | (4,266) |
| 28,933,200 SEK | 3,368,592 USD | Citi | 09/19/2018 | 201,391 | — |
| 398,000 SEK | 43,447 USD | Citi | 09/19/2018 | — | (121) |
| 1,717,600 SGD | 1,267,026 USD | Citi | 09/19/2018 | 15,394 | — |
| 12,291,600 TRY | 2,463,635 USD | Citi | 09/19/2018 | 607,299 | — |
| 39,700,800 TWD | 1,330,568 USD | Citi | 09/19/2018 | 36,162 | — |
| 370,000 TWD | 12,026 USD | Citi | 09/19/2018 | — | (37) |
| 2,230,663 USD | 2,949,200 AUD | Citi | 09/19/2018 | — | (110,524) |
| 529,925 USD | 2,196,000 BRL | Citi | 09/19/2018 | 8,367 | — |
| 505,973 USD | 1,870,000 BRL | Citi | 09/19/2018 | — | (47,592) |
| 3,689,924 USD | 4,850,504 CAD | Citi | 09/19/2018 | 27,934 | — |
| 5,919,065 USD | 7,682,582 CAD | Citi | 09/19/2018 | — | (30,449) |
| 38,802 USD | 38,400 CHF | Citi | 09/19/2018 | 864 | — |
| 256,264 USD | 741,466,010 COP | Citi | 09/19/2018 | — | (13,050) |
| 5,052,651 USD | 4,366,883 EUR | Citi | 09/19/2018 | 21,486 | — |
| 18,192,702 USD | 15,473,470 EUR | Citi | 09/19/2018 | — | (213,171) |
| 255,282 USD | 198,400 GBP | Citi | 09/19/2018 | 2,080 | — |
| 409,234 USD | 306,800 GBP | Citi | 09/19/2018 | — | (11,257) |
| 69,429 USD | 544,400 HKD | Citi | 09/19/2018 | — | (52) |
| 592,879 USD | 163,431,200 HUF | Citi | 09/19/2018 | — | (11,604) |
| 573,467 USD | 8,257,258,691 IDR | Citi | 09/19/2018 | — | (18,868) |
| 1,688,220 USD | 116,858,483 INR | Citi | 09/19/2018 | — | (42,870) |
| 552,785 USD | 61,365,600 JPY | Citi | 09/19/2018 | 54 | — |
| 8,216,284 USD | 900,593,084 JPY | Citi | 09/19/2018 | — | (102,889) |
| 1,485,584 USD | 1,666,178,388 KRW | Citi | 09/19/2018 | 10,178 | — |
| 2,300,021 USD | 44,463,516 MXN | Citi | 09/19/2018 | 22,039 | — |
| 3,411,743 USD | 64,452,438 MXN | Citi | 09/19/2018 | — | (45,783) |
| 380,260 USD | 3,172,000 NOK | Citi | 09/19/2018 | — | (1,807) |
| 3,717,711 USD | 5,507,300 NZD | Citi | 09/19/2018 | — | (74,106) |
| 151,561 USD | 8,044,400 PHP | Citi | 09/19/2018 | — | (1,464) |
| 863 USD | 3,200 PLN | Citi | 09/19/2018 | 1 | — |
| 1,782,719 USD | 6,518,400 PLN | Citi | 09/19/2018 | — | (23,744) |
The accompanying Notes to Consolidated Financial Statements are an integral part of this statement.
| 42 | Multi-Manager Alternative Strategies Fund | Annual Report 2018 |
Consolidated Portfolio of Investments (continued)
August 31, 2018
| Forward foreign currency exchange contracts (continued) |
Currency to
be sold | Currency to
be purchased | Counterparty | Settlement
date | Unrealized
appreciation ($) | Unrealized
depreciation ($) |
| 3,286,805 USD | 29,331,200 SEK | Citi | 09/19/2018 | — | (76,037) |
| 1,275,028 USD | 1,717,600 SGD | Citi | 09/19/2018 | — | (23,396) |
| 314,259 USD | 2,106,000 TRY | Citi | 09/19/2018 | 3,799 | — |
| 1,873,348 USD | 10,185,600 TRY | Citi | 09/19/2018 | — | (335,070) |
| 789,439 USD | 24,271,200 TWD | Citi | 09/19/2018 | 1,900 | — |
| 531,737 USD | 15,799,600 TWD | Citi | 09/19/2018 | — | (16,606) |
| 3,626,528 USD | 47,939,200 ZAR | Citi | 09/19/2018 | — | (370,537) |
| 45,487,600 ZAR | 3,333,772 USD | Citi | 09/19/2018 | 244,292 | — |
| 2,451,600 ZAR | 164,832 USD | Citi | 09/19/2018 | — | (1,679) |
| 574,944,803 CLP | 894,056 USD | Citi | 09/20/2018 | 50,038 | — |
| 356,800 ILS | 99,747 USD | Citi | 09/20/2018 | 670 | — |
| 1,344,800 ILS | 370,400 USD | Citi | 09/20/2018 | — | (3,026) |
| 902,805 USD | 574,944,803 CLP | Citi | 09/20/2018 | — | (58,787) |
| 467,981 USD | 1,701,600 ILS | Citi | 09/20/2018 | 4,522 | — |
| 60,400 AUD | 43,826 USD | Citi | 12/19/2018 | 386 | — |
| 27,600 BRL | 6,745 USD | Citi | 12/19/2018 | 40 | — |
| 2,276,800 BRL | 544,958 USD | Citi | 12/19/2018 | — | (8,156) |
| 205,200 CAD | 157,472 USD | Citi | 12/19/2018 | — | (75) |
| 178,085,603 CLP | 269,567 USD | Citi | 12/19/2018 | 7,906 | — |
| 385,500,032 COP | 128,884 USD | Citi | 12/19/2018 | 2,992 | — |
| 18,000 EUR | 21,167 USD | Citi | 12/19/2018 | 99 | — |
| 2,422,800 EUR | 2,825,476 USD | Citi | 12/19/2018 | — | (10,227) |
| 357,600 GBP | 462,506 USD | Citi | 12/19/2018 | — | (3,258) |
| 158,800 HKD | 20,271 USD | Citi | 12/19/2018 | 2 | — |
| 89,487,197 HUF | 321,227 USD | Citi | 12/19/2018 | 1,029 | — |
| 4,167,668,304 IDR | 279,240 USD | Citi | 12/19/2018 | 7,691 | — |
| 1,179,200 ILS | 326,758 USD | Citi | 12/19/2018 | — | (2,813) |
| 42,522,882 INR | 597,296 USD | Citi | 12/19/2018 | 5,718 | — |
| 3,700,400 INR | 51,323 USD | Citi | 12/19/2018 | — | (157) |
| 20,846,400 JPY | 189,163 USD | Citi | 12/19/2018 | 89 | — |
| 62,494,800 JPY | 565,367 USD | Citi | 12/19/2018 | — | (1,453) |
| 2,010,400 KRW | 1,811 USD | Citi | 12/19/2018 | 4 | — |
| 1,641,321,987 KRW | 1,468,108 USD | Citi | 12/19/2018 | — | (7,241) |
| 31,600 MXN | 1,654 USD | Citi | 12/19/2018 | 27 | — |
| 11,977,200 NOK | 1,440,312 USD | Citi | 12/19/2018 | 6,080 | — |
| 2,332,400 NZD | 1,549,792 USD | Citi | 12/19/2018 | 6,137 | — |
| 17,482,400 SEK | 1,932,976 USD | Citi | 12/19/2018 | 4,972 | — |
| 22,800 SEK | 2,509 USD | Citi | 12/19/2018 | — | (5) |
| 1,454,800 SGD | 1,067,643 USD | Citi | 12/19/2018 | 5,499 | — |
| 170,000 SGD | 124,089 USD | Citi | 12/19/2018 | — | (28) |
| 24,330,400 TWD | 796,932 USD | Citi | 12/19/2018 | — | (2,260) |
| 19,953 USD | 26,000 CAD | Citi | 12/19/2018 | 9 | — |
| 40,238 USD | 52,000 CAD | Citi | 12/19/2018 | — | (313) |
| 1,004,958 USD | 975,200 CHF | Citi | 12/19/2018 | 10,721 | — |
| 141,112 USD | 135,200 CHF | Citi | 12/19/2018 | — | (300) |
| 1,373,520 USD | 1,177,200 EUR | Citi | 12/19/2018 | 4,303 | — |
| 1,773,466 USD | 1,507,200 EUR | Citi | 12/19/2018 | — | (9,403) |
| 117,076 USD | 89,600 GBP | Citi | 12/19/2018 | — | (375) |
| 81,999 USD | 294,800 ILS | Citi | 12/19/2018 | 394 | — |
| 41,180 USD | 147,200 ILS | Citi | 12/19/2018 | — | (39) |
| 1,508,958 USD | 166,726,419 JPY | Citi | 12/19/2018 | 3,230 | — |
| 3,801 USD | 4,202,400 KRW | Citi | 12/19/2018 | — | (24) |
| 15,348 USD | 298,800 MXN | Citi | 12/19/2018 | 38 | — |
| 1,978,001 USD | 37,562,000 MXN | Citi | 12/19/2018 | — | (43,857) |
| 7,229 USD | 10,800 NZD | Citi | 12/19/2018 | — | (81) |
| 2,635 USD | 141,600 PHP | Citi | 12/19/2018 | — | (15) |
| 2,382 USD | 8,800 PLN | Citi | 12/19/2018 | — | (3) |
| 12,773,200 ZAR | 877,792 USD | Citi | 12/19/2018 | 20,949 | — |
The accompanying Notes to Consolidated Financial Statements are an integral part of this statement.
Multi-Manager Alternative Strategies Fund | Annual Report 2018
| 43 |
Consolidated Portfolio of Investments (continued)
August 31, 2018
| Forward foreign currency exchange contracts (continued) |
Currency to
be sold | Currency to
be purchased | Counterparty | Settlement
date | Unrealized
appreciation ($) | Unrealized
depreciation ($) |
| 90,000 ZAR | 6,033 USD | Citi | 12/19/2018 | — | (4) |
| 255,000,000 JPY | 2,321,797 USD | Goldman Sachs | 09/10/2018 | 25,968 | — |
| 4,077,700 EUR | 4,809,422 USD | Goldman Sachs | 09/14/2018 | 73,063 | — |
| 359,600 EUR | 409,319 USD | Goldman Sachs | 09/14/2018 | — | (8,366) |
| 2,896,900 GBP | 3,854,100 USD | Goldman Sachs | 09/14/2018 | 97,040 | — |
| 728,600 GBP | 938,490 USD | Goldman Sachs | 09/14/2018 | — | (6,449) |
| 5,407,900 NOK | 659,851 USD | Goldman Sachs | 09/14/2018 | 14,759 | — |
| 476,633 USD | 412,200 EUR | Goldman Sachs | 09/14/2018 | 2,148 | — |
| 1,581,845 USD | 1,351,500 EUR | Goldman Sachs | 09/14/2018 | — | (12,041) |
| 865,427 USD | 658,000 GBP | Goldman Sachs | 09/14/2018 | — | (12,051) |
| 1,689,750 AUD | 1,238,370 USD | Goldman Sachs | 09/19/2018 | 23,632 | — |
| 939,248 CAD | 629,000 EUR | Goldman Sachs | 09/19/2018 | 10,949 | — |
| 3,396,778 CAD | 2,611,667 USD | Goldman Sachs | 09/19/2018 | 8,073 | — |
| 1,608,441 CAD | 1,229,564 USD | Goldman Sachs | 09/19/2018 | — | (3,289) |
| 3,153,107 EUR | 32,302,082 SEK | Goldman Sachs | 09/19/2018 | — | (127,801) |
| 4,349,095 EUR | 5,116,343 USD | Goldman Sachs | 09/19/2018 | 62,875 | — |
| 52,334,655 JPY | 645,000 AUD | Goldman Sachs | 09/19/2018 | — | (7,799) |
| 34,775,370 JPY | 315,000 USD | Goldman Sachs | 09/19/2018 | 1,711 | — |
| 6,095,715 MXN | 325,136 USD | Goldman Sachs | 09/19/2018 | 6,794 | — |
| 1,330,000 NZD | 883,020 USD | Goldman Sachs | 09/19/2018 | 3,098 | — |
| 51,249,045 SEK | 4,970,000 EUR | Goldman Sachs | 09/19/2018 | 164,907 | — |
| 2,485,000 USD | 3,251,647 CAD | Goldman Sachs | 09/19/2018 | 7,352 | — |
| 5,657,330 USD | 7,342,211 CAD | Goldman Sachs | 09/19/2018 | — | (29,605) |
| 1,689,485 USD | 1,466,000 EUR | Goldman Sachs | 09/19/2018 | 13,947 | — |
| 1,295,063 USD | 1,107,891 EUR | Goldman Sachs | 09/19/2018 | — | (7,740) |
| 3,147,500 USD | 65,216,200 MXN | Goldman Sachs | 09/19/2018 | 258,348 | — |
| 321,694 USD | 6,091,810 MXN | Goldman Sachs | 09/19/2018 | — | (3,556) |
| 886,240 USD | 1,312,500 NZD | Goldman Sachs | 09/19/2018 | — | (17,896) |
| 115,000,000 JPY | 1,026,350 USD | Goldman Sachs | 10/15/2018 | — | (11,625) |
| 1,255,000 AUD | 101,762,007 JPY | HSBC | 09/19/2018 | 14,566 | — |
| 1,885,000 AUD | 1,436,600 USD | HSBC | 09/19/2018 | 81,500 | — |
| 5,772,774 CAD | 4,400,000 USD | HSBC | 09/19/2018 | — | (24,768) |
| 1,250,000 EUR | 1,124,594 GBP | HSBC | 09/19/2018 | 6,361 | — |
| 3,354,375 EUR | 3,921,636 USD | HSBC | 09/19/2018 | 23,991 | — |
| 7,288,793 EUR | 8,409,575 USD | HSBC | 09/19/2018 | — | (59,701) |
| 595,000 GBP | 798,681 USD | HSBC | 09/19/2018 | 26,854 | — |
| 50,841,000 JPY | 630,000 AUD | HSBC | 09/19/2018 | — | (5,126) |
| 104,027,940 JPY | 930,000 USD | HSBC | 09/19/2018 | — | (7,182) |
| 3,165,521 NZD | 2,104,141 USD | HSBC | 09/19/2018 | 9,847 | — |
| 623,438 NZD | 411,503 USD | HSBC | 09/19/2018 | — | (960) |
| 1,251,328 SGD | 916,382 USD | HSBC | 09/19/2018 | 4,527 | — |
| 2,179,826 USD | 2,950,000 AUD | HSBC | 09/19/2018 | — | (59,112) |
| 2,959,109 USD | 2,512,500 EUR | HSBC | 09/19/2018 | — | (39,688) |
| 384,429 USD | 291,851 GBP | HSBC | 09/19/2018 | — | (5,844) |
| 3,100,000 USD | 347,203,875 JPY | HSBC | 09/19/2018 | 27,941 | — |
| 198,374 USD | 298,994 NZD | HSBC | 09/19/2018 | — | (560) |
| 4,423,800 AUD | 3,290,594 USD | JPMorgan | 09/19/2018 | 110,386 | — |
| 6,099,000 BRL | 1,640,208 USD | JPMorgan | 09/19/2018 | 145,199 | — |
| 828,141 CAD | 638,483 USD | JPMorgan | 09/19/2018 | 3,721 | — |
| 8,920,800 CAD | 6,757,115 USD | JPMorgan | 09/19/2018 | — | (80,582) |
| 57,600 CHF | 58,726 USD | JPMorgan | 09/19/2018 | — | (773) |
| 1,109,739,014 COP | 380,605 USD | JPMorgan | 09/19/2018 | 16,591 | — |
| 2,460,000 COP | 806 USD | JPMorgan | 09/19/2018 | — | (1) |
| 3,780,000 EUR | 38,697,390 SEK | JPMorgan | 09/19/2018 | — | (156,156) |
| 16,572,505 EUR | 19,488,229 USD | JPMorgan | 09/19/2018 | 231,664 | — |
| 1,339,400 EUR | 1,542,678 USD | JPMorgan | 09/19/2018 | — | (13,649) |
| 235,200 GBP | 312,681 USD | JPMorgan | 09/19/2018 | 7,583 | — |
| 522,600 GBP | 669,542 USD | JPMorgan | 09/19/2018 | — | (8,369) |
The accompanying Notes to Consolidated Financial Statements are an integral part of this statement.
| 44 | Multi-Manager Alternative Strategies Fund | Annual Report 2018 |
Consolidated Portfolio of Investments (continued)
August 31, 2018
| Forward foreign currency exchange contracts (continued) |
Currency to
be sold | Currency to
be purchased | Counterparty | Settlement
date | Unrealized
appreciation ($) | Unrealized
depreciation ($) |
| 816,600 HKD | 104,183 USD | JPMorgan | 09/19/2018 | 117 | — |
| 239,096,400 HUF | 884,068 USD | JPMorgan | 09/19/2018 | 33,674 | — |
| 6,050,400 HUF | 21,332 USD | JPMorgan | 09/19/2018 | — | (187) |
| 12,385,888,037 IDR | 856,295 USD | JPMorgan | 09/19/2018 | 24,397 | — |
| 175,287,723 INR | 2,525,720 USD | JPMorgan | 09/19/2018 | 57,696 | — |
| 941,403,567 JPY | 8,601,668 USD | JPMorgan | 09/19/2018 | 120,614 | — |
| 397,628,428 JPY | 3,564,705 USD | JPMorgan | 09/19/2018 | — | (17,508) |
| 1,733,583,590 KRW | 1,567,821 USD | JPMorgan | 09/19/2018 | 11,548 | — |
| 765,683,990 KRW | 684,138 USD | JPMorgan | 09/19/2018 | — | (3,232) |
| 62,815,079 MXN | 3,350,361 USD | JPMorgan | 09/19/2018 | 69,910 | — |
| 55,248,600 MXN | 2,646,897 USD | JPMorgan | 09/19/2018 | — | (238,403) |
| 14,400 NOK | 1,728 USD | JPMorgan | 09/19/2018 | 10 | — |
| 4,743,600 NOK | 561,639 USD | JPMorgan | 09/19/2018 | — | (4,323) |
| 6,367,200 NZD | 4,397,710 USD | JPMorgan | 09/19/2018 | 185,199 | — |
| 748,125 NZD | 494,170 USD | JPMorgan | 09/19/2018 | — | (786) |
| 12,066,600 PHP | 227,409 USD | JPMorgan | 09/19/2018 | 2,263 | — |
| 7,452,600 PLN | 2,048,073 USD | JPMorgan | 09/19/2018 | 37,007 | — |
| 2,329,800 PLN | 622,292 USD | JPMorgan | 09/19/2018 | — | (6,400) |
| 43,399,800 SEK | 5,052,882 USD | JPMorgan | 09/19/2018 | 302,081 | — |
| 597,000 SEK | 65,170 USD | JPMorgan | 09/19/2018 | — | (181) |
| 2,576,400 SGD | 1,900,536 USD | JPMorgan | 09/19/2018 | 23,089 | — |
| 18,437,400 TRY | 3,695,448 USD | JPMorgan | 09/19/2018 | 910,944 | — |
| 59,551,200 TWD | 1,995,849 USD | JPMorgan | 09/19/2018 | 54,240 | — |
| 555,000 TWD | 18,039 USD | JPMorgan | 09/19/2018 | — | (56) |
| 3,345,999 USD | 4,423,800 AUD | JPMorgan | 09/19/2018 | — | (165,791) |
| 794,888 USD | 3,294,000 BRL | JPMorgan | 09/19/2018 | 12,549 | — |
| 758,960 USD | 2,805,000 BRL | JPMorgan | 09/19/2018 | — | (71,389) |
| 1,769,888 USD | 2,317,800 CAD | JPMorgan | 09/19/2018 | 6,680 | — |
| 5,098,604 USD | 6,615,600 CAD | JPMorgan | 09/19/2018 | — | (27,818) |
| 58,203 USD | 57,600 CHF | JPMorgan | 09/19/2018 | 1,296 | — |
| 384,397 USD | 1,112,199,014 COP | JPMorgan | 09/19/2018 | — | (19,575) |
| 7,708,226 USD | 6,663,400 EUR | JPMorgan | 09/19/2018 | 34,368 | — |
| 17,074,824 USD | 14,476,983 EUR | JPMorgan | 09/19/2018 | — | (253,170) |
| 382,924 USD | 297,600 GBP | JPMorgan | 09/19/2018 | 3,119 | — |
| 2,650,969 USD | 2,006,943 GBP | JPMorgan | 09/19/2018 | — | (47,587) |
| 104,144 USD | 816,600 HKD | JPMorgan | 09/19/2018 | — | (78) |
| 889,320 USD | 245,146,800 HUF | JPMorgan | 09/19/2018 | — | (17,407) |
| 860,201 USD | 12,385,888,037 IDR | JPMorgan | 09/19/2018 | — | (28,303) |
| 2,532,333 USD | 175,287,723 INR | JPMorgan | 09/19/2018 | — | (64,309) |
| 2,724,179 USD | 304,421,050 JPY | JPMorgan | 09/19/2018 | 18,334 | — |
| 11,386,625 USD | 1,246,983,595 JPY | JPMorgan | 09/19/2018 | — | (152,617) |
| 2,228,379 USD | 2,499,267,580 KRW | JPMorgan | 09/19/2018 | 15,264 | — |
| 1,742,930 USD | 33,814,200 MXN | JPMorgan | 09/19/2018 | 22,981 | — |
| 4,180,120 USD | 78,891,000 MXN | JPMorgan | 09/19/2018 | — | (60,121) |
| 570,391 USD | 4,758,000 NOK | JPMorgan | 09/19/2018 | — | (2,711) |
| 5,118,656 USD | 7,582,200 NZD | JPMorgan | 09/19/2018 | — | (102,307) |
| 227,342 USD | 12,066,600 PHP | JPMorgan | 09/19/2018 | — | (2,196) |
| 1,294 USD | 4,800 PLN | JPMorgan | 09/19/2018 | 1 | — |
| 2,674,082 USD | 9,777,600 PLN | JPMorgan | 09/19/2018 | — | (35,619) |
| 4,930,214 USD | 43,996,800 SEK | JPMorgan | 09/19/2018 | — | (114,061) |
| 1,912,544 USD | 2,576,400 SGD | JPMorgan | 09/19/2018 | — | (35,096) |
| 471,389 USD | 3,159,000 TRY | JPMorgan | 09/19/2018 | 5,698 | — |
| 2,809,632 USD | 15,278,400 TRY | JPMorgan | 09/19/2018 | — | (502,215) |
| 1,184,159 USD | 36,406,800 TWD | JPMorgan | 09/19/2018 | 2,849 | — |
| 797,606 USD | 23,699,400 TWD | JPMorgan | 09/19/2018 | — | (24,911) |
| 5,439,799 USD | 71,908,800 ZAR | JPMorgan | 09/19/2018 | — | (555,812) |
| 68,231,400 ZAR | 5,001,126 USD | JPMorgan | 09/19/2018 | 366,906 | — |
| 3,677,400 ZAR | 247,247 USD | JPMorgan | 09/19/2018 | — | (2,519) |
The accompanying Notes to Consolidated Financial Statements are an integral part of this statement.
Multi-Manager Alternative Strategies Fund | Annual Report 2018
| 45 |
Consolidated Portfolio of Investments (continued)
August 31, 2018
| Forward foreign currency exchange contracts (continued) |
Currency to
be sold | Currency to
be purchased | Counterparty | Settlement
date | Unrealized
appreciation ($) | Unrealized
depreciation ($) |
| 862,417,205 CLP | 1,341,083 USD | JPMorgan | 09/20/2018 | 75,056 | — |
| 535,200 ILS | 149,620 USD | JPMorgan | 09/20/2018 | 1,004 | — |
| 2,017,200 ILS | 555,599 USD | JPMorgan | 09/20/2018 | — | (4,540) |
| 1,354,209 USD | 862,417,205 CLP | JPMorgan | 09/20/2018 | — | (88,183) |
| 701,973 USD | 2,552,400 ILS | JPMorgan | 09/20/2018 | 6,782 | — |
| 90,600 AUD | 65,738 USD | JPMorgan | 12/19/2018 | 580 | — |
| 41,400 BRL | 10,117 USD | JPMorgan | 12/19/2018 | 60 | — |
| 3,415,200 BRL | 817,436 USD | JPMorgan | 12/19/2018 | — | (12,236) |
| 307,800 CAD | 236,208 USD | JPMorgan | 12/19/2018 | — | (112) |
| 267,128,405 CLP | 404,350 USD | JPMorgan | 12/19/2018 | 11,859 | — |
| 578,250,048 COP | 193,326 USD | JPMorgan | 12/19/2018 | 4,488 | — |
| 27,000 EUR | 31,750 USD | JPMorgan | 12/19/2018 | 149 | — |
| 3,634,200 EUR | 4,238,208 USD | JPMorgan | 12/19/2018 | — | (15,346) |
| 536,400 GBP | 693,758 USD | JPMorgan | 12/19/2018 | — | (4,887) |
| 93,000 HKD | 11,872 USD | JPMorgan | 12/19/2018 | 1 | — |
| 134,230,795 HUF | 481,840 USD | JPMorgan | 12/19/2018 | 1,542 | — |
| 6,251,502,456 IDR | 418,859 USD | JPMorgan | 12/19/2018 | 11,536 | — |
| 1,768,800 ILS | 490,137 USD | JPMorgan | 12/19/2018 | — | (4,221) |
| 63,784,324 INR | 895,944 USD | JPMorgan | 12/19/2018 | 8,576 | — |
| 5,550,600 INR | 76,984 USD | JPMorgan | 12/19/2018 | — | (236) |
| 31,269,600 JPY | 283,744 USD | JPMorgan | 12/19/2018 | 133 | — |
| 93,742,200 JPY | 848,050 USD | JPMorgan | 12/19/2018 | — | (2,180) |
| 3,015,600 KRW | 2,717 USD | JPMorgan | 12/19/2018 | 6 | — |
| 2,461,982,981 KRW | 2,202,159 USD | JPMorgan | 12/19/2018 | — | (10,864) |
| 47,400 MXN | 2,481 USD | JPMorgan | 12/19/2018 | 40 | — |
| 17,965,800 NOK | 2,160,466 USD | JPMorgan | 12/19/2018 | 9,118 | — |
| 3,498,600 NZD | 2,324,686 USD | JPMorgan | 12/19/2018 | 9,202 | — |
| 26,223,600 SEK | 2,899,461 USD | JPMorgan | 12/19/2018 | 7,454 | — |
| 34,200 SEK | 3,763 USD | JPMorgan | 12/19/2018 | — | (8) |
| 2,182,200 SGD | 1,601,463 USD | JPMorgan | 12/19/2018 | 8,247 | — |
| 255,000 SGD | 186,133 USD | JPMorgan | 12/19/2018 | — | (42) |
| 36,495,600 TWD | 1,195,396 USD | JPMorgan | 12/19/2018 | — | (3,391) |
| 29,930 USD | 39,000 CAD | JPMorgan | 12/19/2018 | 13 | — |
| 60,356 USD | 78,000 CAD | JPMorgan | 12/19/2018 | — | (470) |
| 1,507,439 USD | 1,462,800 CHF | JPMorgan | 12/19/2018 | 16,080 | — |
| 211,668 USD | 202,800 CHF | JPMorgan | 12/19/2018 | — | (451) |
| 2,060,283 USD | 1,765,800 EUR | JPMorgan | 12/19/2018 | 6,451 | — |
| 2,660,202 USD | 2,260,800 EUR | JPMorgan | 12/19/2018 | — | (14,108) |
| 175,615 USD | 134,400 GBP | JPMorgan | 12/19/2018 | — | (563) |
| 122,999 USD | 442,200 ILS | JPMorgan | 12/19/2018 | 590 | — |
| 61,770 USD | 220,800 ILS | JPMorgan | 12/19/2018 | — | (59) |
| 2,263,440 USD | 250,089,629 JPY | JPMorgan | 12/19/2018 | 4,842 | — |
| 5,702 USD | 6,303,600 KRW | JPMorgan | 12/19/2018 | — | (36) |
| 23,022 USD | 448,200 MXN | JPMorgan | 12/19/2018 | 57 | — |
| 2,967,006 USD | 56,343,000 MXN | JPMorgan | 12/19/2018 | — | (65,790) |
| 10,844 USD | 16,200 NZD | JPMorgan | 12/19/2018 | — | (122) |
| 3,953 USD | 212,400 PHP | JPMorgan | 12/19/2018 | — | (23) |
| 3,573 USD | 13,200 PLN | JPMorgan | 12/19/2018 | — | (4) |
| 19,159,800 ZAR | 1,316,686 USD | JPMorgan | 12/19/2018 | 31,422 | — |
| 135,000 ZAR | 9,050 USD | JPMorgan | 12/19/2018 | — | (6) |
| 3,425,777 CAD | 2,635,000 USD | Morgan Stanley | 09/18/2018 | 9,230 | — |
| 2,635,000 USD | 3,429,492 CAD | Morgan Stanley | 09/18/2018 | — | (6,382) |
| 3,429,453 CAD | 2,635,000 USD | Morgan Stanley | 09/19/2018 | 6,362 | — |
| 1,315,000 USD | 1,720,500 CAD | Morgan Stanley | 09/19/2018 | 3,745 | — |
| 6,480,000 USD | 8,408,474 CAD | Morgan Stanley | 09/19/2018 | — | (34,996) |
| 866,013 USD | 739,458 EUR | Morgan Stanley | 09/19/2018 | — | (6,793) |
| 1,719,881 USD | 1,320,000 GBP | Morgan Stanley | 09/19/2018 | — | (7,593) |
| 660,000 USD | 73,166,715 JPY | Morgan Stanley | 09/19/2018 | — | (845) |
The accompanying Notes to Consolidated Financial Statements are an integral part of this statement.
| 46 | Multi-Manager Alternative Strategies Fund | Annual Report 2018 |
Consolidated Portfolio of Investments (continued)
August 31, 2018
| Forward foreign currency exchange contracts (continued) |
Currency to
be sold | Currency to
be purchased | Counterparty | Settlement
date | Unrealized
appreciation ($) | Unrealized
depreciation ($) |
| 939,234 CAD | 629,000 EUR | RBC | 09/19/2018 | 10,959 | — |
| 3,755,117 CAD | 2,475,000 EUR | RBC | 09/19/2018 | — | (2,409) |
| 1,062,174 CAD | 1,235,000 NZD | RBC | 09/19/2018 | 2,925 | — |
| 10,963,270 CAD | 8,420,000 USD | RBC | 09/19/2018 | 16,772 | — |
| 4,096,107 CAD | 3,125,000 USD | RBC | 09/19/2018 | — | (14,622) |
| 625,000 EUR | 5,975,006 NOK | RBC | 09/19/2018 | — | (13,342) |
| 6,555,000 USD | 8,594,262 CAD | RBC | 09/19/2018 | 32,409 | — |
| 5,715,000 USD | 7,431,131 CAD | RBC | 09/19/2018 | — | (19,119) |
| 1,250,000 USD | 1,626,038 CAD | Scotia Capital | 09/19/2018 | — | (3,660) |
| 5,765,000 AUD | 4,241,576 USD | Standard Chartered | 09/19/2018 | 97,198 | — |
| 645,000 EUR | 767,673 USD | Standard Chartered | 09/19/2018 | 18,209 | — |
| 2,515,000 EUR | 2,870,143 USD | Standard Chartered | 09/19/2018 | — | (52,183) |
| 33,056,809 JPY | 303,431 USD | Standard Chartered | 09/19/2018 | 5,624 | — |
| 95,265,056 JPY | 855,571 USD | Standard Chartered | 09/19/2018 | — | (2,667) |
| 623,438 NZD | 411,443 USD | Standard Chartered | 09/19/2018 | — | (1,021) |
| 2,807,870 USD | 2,394,088 EUR | Standard Chartered | 09/19/2018 | — | (26,038) |
| 630,000 USD | 69,875,190 JPY | Standard Chartered | 09/19/2018 | — | (498) |
| 680,787 AUD | 499,919 USD | State Street | 09/19/2018 | 10,511 | — |
| 477,264 CAD | 366,952 USD | State Street | 09/19/2018 | 1,134 | — |
| 2,045,000 EUR | 3,165,229 AUD | State Street | 09/19/2018 | — | (100,767) |
| 1,250,000 EUR | 1,127,550 GBP | State Street | 09/19/2018 | 10,196 | — |
| 1,865,000 EUR | 19,063,404 SEK | State Street | 09/19/2018 | — | (80,259) |
| 5,640,000 EUR | 6,645,678 USD | State Street | 09/19/2018 | 92,232 | — |
| 1,106,516 EUR | 1,263,611 USD | State Street | 09/19/2018 | — | (22,114) |
| 1,118,474 GBP | 1,250,000 EUR | State Street | 09/19/2018 | 1,578 | — |
| 70,057,839 JPY | 630,000 USD | State Street | 09/19/2018 | — | (1,147) |
| 37,455,273 MXN | 1,983,631 USD | State Street | 09/19/2018 | 27,569 | — |
| 24,051,144 MXN | 1,196,785 USD | State Street | 09/19/2018 | — | (59,261) |
| 460,793 USD | 620,000 AUD | State Street | 09/19/2018 | — | (15,084) |
| 939,000 USD | 1,224,620 CAD | State Street | 09/19/2018 | — | (342) |
| 6,739,387 USD | 5,726,015 EUR | State Street | 09/19/2018 | — | (85,995) |
| 773,423 USD | 14,916,436 MXN | State Street | 09/19/2018 | 5,572 | — |
| 1,789,744 USD | 34,005,831 MXN | State Street | 09/19/2018 | — | (13,825) |
| 20,281 USD | 27,000 SGD | State Street | 09/19/2018 | — | (606) |
| 5,440,720 CAD | 4,180,000 USD | TD Securities | 09/19/2018 | 9,747 | — |
| 1,680,590 CAD | 1,280,000 USD | TD Securities | 09/19/2018 | — | (8,154) |
| 1,605,000 USD | 2,110,186 CAD | TD Securities | 09/19/2018 | 12,435 | — |
| 6,445,000 USD | 8,379,834 CAD | TD Securities | 09/19/2018 | — | (21,948) |
| 3,115,000 AUD | 2,291,892 USD | UBS | 09/19/2018 | 52,562 | — |
| 811,444 CAD | 619,127 USD | UBS | 09/19/2018 | — | (2,836) |
| 630,000 EUR | 5,957,721 NOK | UBS | 09/19/2018 | — | (21,214) |
| 1,885,000 EUR | 19,347,469 SEK | UBS | 09/19/2018 | — | (72,402) |
| 1,880,000 EUR | 2,203,583 USD | UBS | 09/19/2018 | 19,101 | — |
| 735,000 EUR | 837,665 USD | UBS | 09/19/2018 | — | (16,375) |
| 625,000 GBP | 819,899 USD | UBS | 09/19/2018 | 9,157 | — |
| 51,571,200 JPY | 640,000 AUD | UBS | 09/19/2018 | — | (4,515) |
| 3,206,866 MXN | 160,000 USD | UBS | 09/19/2018 | — | (7,475) |
| 5,970,189 NOK | 630,000 EUR | UBS | 09/19/2018 | 19,726 | — |
| 29,951,191 SEK | 2,920,000 EUR | UBS | 09/19/2018 | 114,283 | — |
| 619,127 USD | 814,598 CAD | UBS | 09/19/2018 | 5,253 | — |
| 1,255,000 USD | 1,636,765 CAD | UBS | 09/19/2018 | — | (438) |
| 3,101,242 USD | 2,649,380 EUR | UBS | 09/19/2018 | — | (22,772) |
| 630,000 USD | 69,611,535 JPY | UBS | 09/19/2018 | — | (2,873) |
| Total | | | | 7,281,384 | (6,833,087) |
The accompanying Notes to Consolidated Financial Statements are an integral part of this statement.
Multi-Manager Alternative Strategies Fund | Annual Report 2018
| 47 |
Consolidated Portfolio of Investments (continued)
August 31, 2018
| Long futures contracts |
| Description | Number of
contracts | Expiration
date | Trading
currency | Notional
amount | Value/Unrealized
appreciation ($) | Value/Unrealized
depreciation ($) |
| 3-Month Euro Euribor | 111 | 12/2018 | EUR | 27,829,088 | — | (4,455) |
| 3-Month Euro Euribor | 18 | 06/2019 | EUR | 4,511,250 | — | (186) |
| 3-Month Euro Euribor | 28 | 09/2019 | EUR | 7,013,650 | 568 | — |
| 3-Month Euro Euribor | 33 | 12/2019 | EUR | 8,260,313 | 2,710 | — |
| 3-Month Euro Euribor | 31 | 03/2020 | EUR | 7,753,875 | 1,947 | — |
| 3-Month Euro Euribor | 25 | 06/2020 | EUR | 6,248,438 | 7,007 | — |
| Amsterdam IDX | 5 | 09/2018 | EUR | 558,200 | — | (4,209) |
| Amsterdam IDX | 31 | 09/2018 | EUR | 3,460,840 | — | (25,943) |
| Australian 10-Year Bond | 224 | 09/2018 | AUD | 29,252,682 | 93,233 | — |
| Australian 10-Year Bond | 17 | 09/2018 | AUD | 2,220,070 | 2,460 | — |
| Australian 3-Year Bond | 338 | 09/2018 | AUD | 37,722,977 | 24,323 | — |
| Brent Crude | 47 | 09/2018 | USD | 3,649,080 | 204,269 | — |
| Brent Crude | 29 | 09/2018 | USD | 2,251,560 | 128,606 | — |
| CAC40 Index | 56 | 09/2018 | EUR | 3,027,080 | — | (7,527) |
| CAC40 Index | 27 | 09/2018 | EUR | 1,459,485 | — | (20,678) |
| Cocoa | 6 | 12/2018 | USD | 140,160 | 6,579 | — |
| Cotton | 18 | 12/2018 | USD | 739,980 | — | (62,757) |
| DAX Index | 1 | 09/2018 | EUR | 308,738 | — | (5,603) |
| DJIA Mini E | 49 | 09/2018 | USD | 6,367,060 | 180,953 | — |
| DJIA Mini E | 18 | 09/2018 | USD | 2,338,920 | 121,712 | — |
| Euro CHF 3-Month ICE | 5 | 12/2018 | CHF | 1,259,250 | 8 | — |
| Euro CHF 3-Month ICE | 3 | 03/2019 | CHF | 755,550 | 183 | — |
| Euro CHF 3-Month ICE | 2 | 06/2019 | CHF | 503,550 | 599 | — |
| Euro FX | 4 | 09/2018 | USD | 580,450 | — | (2,167) |
| EURO STOXX 50 | 47 | 09/2018 | EUR | 1,592,830 | — | (48,063) |
| Euro-Bobl | 106 | 12/2018 | EUR | 14,055,705 | 31,352 | — |
| Euro-Bobl | 56 | 12/2018 | EUR | 7,425,655 | 5,833 | — |
| Euro-Bund | 128 | 12/2018 | EUR | 20,638,961 | 142,089 | — |
| Euro-Bund | 11 | 12/2018 | EUR | 1,773,661 | 4,110 | — |
| Euro-Buxl 30-Year | 42 | 12/2018 | EUR | 7,508,226 | 91,680 | — |
| Euro-OAT | 140 | 12/2018 | EUR | 21,934,077 | 52,360 | — |
| Euro-Schatz | 225 | 12/2018 | EUR | 25,466,285 | 14,743 | — |
| FTSE 100 Index | 29 | 09/2018 | GBP | 2,152,960 | — | (49,551) |
| FTSE 100 Index | 38 | 09/2018 | GBP | 2,821,120 | — | (101,588) |
| FTSE/JSE Top 40 Index | 17 | 09/2018 | ZAR | 8,874,510 | — | (9,327) |
| FTSE/JSE Top 40 Index | 20 | 09/2018 | ZAR | 10,440,600 | — | (19,447) |
| Hang Seng Index | 7 | 09/2018 | HKD | 9,717,750 | — | (12,266) |
| HSCEI | 10 | 09/2018 | HKD | 5,422,500 | — | (13,781) |
| JPY Currency | 83 | 09/2018 | USD | 9,355,138 | — | (42,411) |
| Long Gilt | 50 | 12/2018 | GBP | 6,237,659 | — | (10,027) |
| Low Sulphur Gasoil | 37 | 10/2018 | USD | 2,560,400 | 115,775 | — |
| Low Sulphur Gasoil | 18 | 10/2018 | USD | 1,245,600 | 72,079 | — |
| MSCI EAFE Index | 17 | 09/2018 | USD | 1,664,980 | — | (26,571) |
| MSCI Singapore IX ETS | 22 | 09/2018 | SGD | 799,040 | — | (3,544) |
| MSCI Taiwan Index | 71 | 09/2018 | USD | 2,928,750 | 55,506 | — |
| NASDAQ 100 E-mini | 35 | 09/2018 | USD | 5,362,875 | 327,512 | — |
| NASDAQ 100 E-mini | 43 | 09/2018 | USD | 6,588,675 | 251,870 | — |
| Nickel | 2 | 12/2018 | USD | 153,864 | — | (6,341) |
| Nickel | 4 | 12/2018 | USD | 307,728 | — | (19,645) |
| Nikkei 225 | 16 | 09/2018 | JPY | 365,760,000 | 48,343 | — |
| NY Harbor ULSD | 39 | 09/2018 | USD | 3,674,198 | 119,637 | — |
| OMXS30 Index | 245 | 09/2018 | SEK | 40,608,750 | 121,045 | — |
| OMXS30 Index | 57 | 09/2018 | SEK | 9,447,750 | 29,079 | — |
| RBOB Gasoline | 43 | 09/2018 | USD | 3,606,582 | 93,580 | — |
| Russell 2000 E-mini | 69 | 09/2018 | USD | 6,005,070 | 218,905 | — |
| Russell 2000 E-mini | 70 | 09/2018 | USD | 6,092,100 | 177,440 | — |
| S&P 500 E-mini | 76 | 09/2018 | USD | 11,027,980 | 478,205 | — |
| S&P 500 E-mini | 46 | 09/2018 | USD | 6,674,830 | 214,225 | — |
The accompanying Notes to Consolidated Financial Statements are an integral part of this statement.
| 48 | Multi-Manager Alternative Strategies Fund | Annual Report 2018 |
Consolidated Portfolio of Investments (continued)
August 31, 2018
| Long futures contracts (continued) |
| Description | Number of
contracts | Expiration
date | Trading
currency | Notional
amount | Value/Unrealized
appreciation ($) | Value/Unrealized
depreciation ($) |
| S&P Mid 400 E-mini | 31 | 09/2018 | USD | 6,341,360 | 123,476 | — |
| S&P Mid 400 E-mini | 5 | 09/2018 | USD | 1,022,800 | 42,952 | — |
| S&P/TSX 60 Index | 41 | 09/2018 | CAD | 7,913,820 | 36,036 | — |
| S&P/TSX 60 Index | 11 | 09/2018 | CAD | 2,123,220 | 12,947 | — |
| SPI 200 Index | 54 | 09/2018 | AUD | 8,510,400 | 127,736 | — |
| SPI 200 Index | 17 | 09/2018 | AUD | 2,679,200 | 68,964 | — |
| TOPIX Index | 12 | 09/2018 | JPY | 208,020,000 | — | (37,139) |
| U.S. Treasury 2-Year Note | 32 | 12/2018 | USD | 6,791,548 | 1,517 | — |
| U.S. Treasury 5-Year Note | 44 | 12/2018 | USD | 4,995,648 | 4,849 | — |
| U.S. Treasury 5-Year Note | 34 | 12/2018 | USD | 3,860,273 | — | (2,194) |
| Wheat | 12 | 12/2018 | USD | 327,300 | — | (28,189) |
| WTI Crude | 91 | 09/2018 | USD | 6,351,800 | 226,981 | — |
| Total | | | | | 4,085,983 | (563,609) |
| Short futures contracts |
| Description | Number of
contracts | Expiration
date | Trading
currency | Notional
amount | Value/Unrealized
appreciation ($) | Value/Unrealized
depreciation ($) |
| 3-Month Euro Euribor | (17) | 03/2019 | EUR | (4,261,475) | 70 | — |
| 90-Day Euro$ | (98) | 12/2018 | USD | (23,859,325) | 1,289 | — |
| 90-Day Euro$ | (279) | 12/2018 | USD | (67,926,038) | — | (38,224) |
| 90-Day Euro$ | (92) | 03/2019 | USD | (22,365,200) | — | (1,958) |
| 90-Day Euro$ | (90) | 06/2019 | USD | (21,856,500) | — | (5,044) |
| 90-Day Euro$ | (89) | 09/2019 | USD | (21,601,413) | — | (9,119) |
| 90-Day Euro$ | (90) | 12/2019 | USD | (21,835,125) | — | (14,170) |
| 90-Day Euro$ | (91) | 03/2020 | USD | (22,077,738) | — | (19,962) |
| 90-Day Euro$ | (82) | 06/2020 | USD | (19,896,275) | — | (11,597) |
| 90-Day Sterling | (26) | 12/2018 | GBP | (3,221,400) | — | (142) |
| 90-Day Sterling | (18) | 12/2018 | GBP | (2,230,200) | — | (1,182) |
| 90-Day Sterling | (28) | 03/2019 | GBP | (3,466,050) | 783 | — |
| 90-Day Sterling | (31) | 06/2019 | GBP | (3,834,313) | 1,635 | — |
| 90-Day Sterling | (49) | 09/2019 | GBP | (6,057,013) | — | (1,496) |
| 90-Day Sterling | (37) | 12/2019 | GBP | (4,570,888) | — | (1,587) |
| 90-Day Sterling | (37) | 03/2020 | GBP | (4,568,575) | — | (1,309) |
| 90-Day Sterling | (23) | 06/2020 | GBP | (2,838,775) | — | (945) |
| AUD/USD Currency | (257) | 09/2018 | USD | (18,452,600) | 442,129 | — |
| Banker’s Acceptance | (14) | 03/2019 | CAD | (3,417,225) | 1,685 | — |
| BP Currency | (177) | 09/2018 | USD | (14,341,425) | 66,078 | — |
| BP Currency | (139) | 09/2018 | USD | (11,262,475) | — | (151,246) |
| C$ Currency | (39) | 09/2018 | USD | (2,989,155) | 9,776 | — |
| C$ Currency | (193) | 09/2018 | USD | (14,792,485) | — | (54,750) |
| Canadian Government 10-Year Bond | (43) | 12/2018 | CAD | (5,811,155) | — | (27,161) |
| CHF Currency | (27) | 09/2018 | USD | (3,485,363) | — | (79,360) |
| Coffee C | (63) | 12/2018 | USD | (2,405,025) | 204,493 | — |
| Copper | (18) | 12/2018 | USD | (2,689,988) | 82,403 | — |
| Copper | (7) | 12/2018 | USD | (1,046,106) | 25,599 | — |
| Copper | (21) | 12/2018 | USD | (1,402,275) | 10,851 | — |
| Copper | (47) | 12/2018 | USD | (3,138,425) | — | (29,944) |
| Corn | (160) | 12/2018 | USD | (2,920,000) | 170,195 | — |
| Cotton | (1) | 12/2018 | USD | (41,110) | 88 | — |
| Euro FX | (71) | 09/2018 | USD | (10,302,988) | — | (118,221) |
| Euro-BTP | (36) | 12/2018 | EUR | (4,439,394) | 26,268 | — |
| Euro-Bund | (53) | 09/2018 | EUR | (8,653,991) | — | (138,597) |
| Euro-Buxl 30-Year | (11) | 09/2018 | EUR | (1,969,780) | — | (34,766) |
| FTSE/MIB Index | (4) | 09/2018 | EUR | (404,900) | 24,532 | — |
| FTSE/MIB Index | (7) | 09/2018 | EUR | (708,575) | 11,454 | — |
| Gold 100 oz. | (85) | 12/2018 | USD | (10,256,950) | 198,467 | — |
| Hang Seng Index | (18) | 09/2018 | HKD | (24,988,500) | 54,662 | — |
The accompanying Notes to Consolidated Financial Statements are an integral part of this statement.
Multi-Manager Alternative Strategies Fund | Annual Report 2018
| 49 |
Consolidated Portfolio of Investments (continued)
August 31, 2018
| Short futures contracts (continued) |
| Description | Number of
contracts | Expiration
date | Trading
currency | Notional
amount | Value/Unrealized
appreciation ($) | Value/Unrealized
depreciation ($) |
| HRW Wheat | (9) | 12/2018 | USD | (248,963) | — | (4,773) |
| HSCEI | (28) | 09/2018 | HKD | (15,183,000) | 37,995 | — |
| IBEX 35 Index | (10) | 09/2018 | EUR | (938,620) | 5,737 | — |
| IBEX 35 Index | (6) | 09/2018 | EUR | (563,172) | 5,089 | — |
| JPY Currency | (2) | 09/2018 | USD | (225,425) | — | (1,417) |
| KOSPI 200 Index | (37) | 09/2018 | KRW | (2,770,837,500) | 39,234 | — |
| Lean Hogs | (8) | 10/2018 | USD | (161,360) | 10,646 | — |
| Live Cattle | (21) | 12/2018 | USD | (948,990) | — | (2,169) |
| MSCI EAFE Index | (6) | 09/2018 | USD | (587,640) | — | (5,187) |
| MSCI Emerging Markets Index | (16) | 09/2018 | USD | (843,920) | — | (17,640) |
| MSCI Singapore IX ETS | (2) | 09/2018 | SGD | (72,640) | 117 | — |
| Natural Gas | (21) | 09/2018 | USD | (612,360) | 6,764 | — |
| Natural Gas | (7) | 09/2018 | USD | (204,120) | — | (2,476) |
| New Zealand $ | (280) | 09/2018 | USD | (18,510,800) | 445,261 | — |
| Platinum | (13) | 10/2018 | USD | (511,615) | 42,053 | — |
| Primary Aluminum | (22) | 12/2018 | USD | (1,172,050) | 5,840 | — |
| Short Term Euro-BTP | (51) | 12/2018 | EUR | (5,585,831) | 35,418 | — |
| Silver | (65) | 12/2018 | USD | (4,731,025) | 86,806 | — |
| Soybean | (78) | 11/2018 | USD | (3,289,650) | 308,595 | — |
| Soybean Meal | (45) | 12/2018 | USD | (1,382,400) | 48,213 | — |
| Soybean Oil | (49) | 12/2018 | USD | (845,838) | 46,116 | — |
| Soybean Oil | (6) | 12/2018 | USD | (103,572) | — | (100) |
| Sugar #11 | (300) | 09/2018 | USD | (3,561,600) | 200,646 | — |
| TOPIX Index | (2) | 09/2018 | JPY | (34,670,000) | — | (1,923) |
| U.S. Long Bond | (7) | 12/2018 | USD | (1,015,589) | 2,898 | — |
| U.S. Long Bond | (6) | 12/2018 | USD | (870,505) | 879 | — |
| U.S. Long Bond | (4) | 12/2018 | USD | (580,337) | — | (1,202) |
| U.S. Treasury 10-Year Note | (31) | 12/2018 | USD | (3,743,769) | 1,296 | — |
| U.S. Treasury 10-Year Note | (142) | 12/2018 | USD | (17,148,877) | — | (996) |
| U.S. Treasury 10-Year Note | (37) | 12/2018 | USD | (4,468,369) | — | (1,537) |
| U.S. Treasury 2-Year Note | (240) | 12/2018 | USD | (50,936,609) | 587 | — |
| U.S. Treasury 2-Year Note | (127) | 12/2018 | USD | (26,953,955) | — | (9,144) |
| U.S. Treasury 5-Year Note | (56) | 12/2018 | USD | (6,358,097) | — | (1,448) |
| U.S. Treasury 5-Year Note | (471) | 12/2018 | USD | (53,476,139) | — | (2,779) |
| U.S. Treasury Ultra 10-Year Note | (13) | 12/2018 | USD | (1,680,999) | 3,426 | — |
| U.S. Treasury Ultra 10-Year Note | (13) | 12/2018 | USD | (1,680,999) | 170 | — |
| U.S. Treasury Ultra 10-Year Note | (12) | 12/2018 | USD | (1,551,691) | — | (3,627) |
| U.S. Ultra Bond | (6) | 12/2018 | USD | (958,910) | 5,940 | — |
| U.S. Ultra Bond | (4) | 12/2018 | USD | (639,274) | 1,093 | — |
| Wheat | (18) | 12/2018 | USD | (490,950) | — | (10,105) |
| Zinc | (21) | 12/2018 | USD | (1,288,350) | 42,426 | — |
| Zinc | (6) | 12/2018 | USD | (368,100) | 6,310 | — |
| Total | | | | | 2,722,012 | (807,303) |
| Call option contracts purchased |
| Description | Counterparty | Trading
currency | Notional
amount | Number of
contracts | Exercise
price/Rate | Expiration
date | Cost ($) | Value ($) |
| Akorn, Inc. | Goldman Sachs | USD | 81,588 | 52 | 15.00 | 09/21/2018 | 15,934 | 13,260 |
| Akorn, Inc. | Goldman Sachs | USD | 3,138 | 2 | 17.50 | 09/21/2018 | 929 | 334 |
| Keurig Dr. Pepper, Inc. | Goldman Sachs | USD | 453,720 | 199 | 25.00 | 10/19/2018 | 27,607 | 2,488 |
| NETGEAR, Inc. | Goldman Sachs | USD | 247,975 | 35 | 65.00 | 09/21/2018 | 10,431 | 22,050 |
| Total | | | | | | | 54,901 | 38,132 |
The accompanying Notes to Consolidated Financial Statements are an integral part of this statement.
| 50 | Multi-Manager Alternative Strategies Fund | Annual Report 2018 |
Consolidated Portfolio of Investments (continued)
August 31, 2018
| Put option contracts purchased |
| Description | Counterparty | Trading
currency | Notional
amount | Number of
contracts | Exercise
price/Rate | Expiration
date | Cost ($) | Value ($) |
| 21st Century Fox, Inc., Class A | Goldman Sachs | USD | 1,684,340 | 371 | 36.00 | 01/18/2019 | 14,518 | 14,840 |
| 21st Century Fox, Inc., Class A | Goldman Sachs | USD | 1,411,940 | 311 | 35.00 | 01/18/2019 | 10,075 | 10,107 |
| 21st Century Fox, Inc., Class A | Goldman Sachs | USD | 603,820 | 133 | 37.00 | 01/18/2019 | 6,051 | 5,653 |
| 21st Century Fox, Inc., Class A | Goldman Sachs | USD | 36,320 | 8 | 38.00 | 01/18/2019 | 407 | 400 |
| Akorn, Inc. | Goldman Sachs | USD | 125,520 | 80 | 12.50 | 09/21/2018 | 26,797 | 6,600 |
| Akorn, Inc. | Goldman Sachs | USD | 125,520 | 80 | 12.50 | 10/19/2018 | 22,583 | 18,000 |
| SPDR S&P 500 ETF Trust | Goldman Sachs | USD | 2,903,100 | 100 | 278.00 | 09/21/2018 | 30,883 | 5,850 |
| SPDR S&P 500 ETF Trust | Goldman Sachs | USD | 2,874,069 | 99 | 275.00 | 09/21/2018 | 61,976 | 4,554 |
| SPDR S&P 500 ETF Trust | Goldman Sachs | USD | 2,874,069 | 99 | 273.00 | 09/21/2018 | 55,861 | 4,010 |
| Walt Disney Co. (The) | Goldman Sachs | USD | 179,232 | 16 | 105.00 | 01/18/2019 | 4,256 | 3,712 |
| Total | | | | | | | 233,407 | 73,726 |
| Call option contracts written |
| Description | Counterparty | Trading
currency | Notional
amount | Number of
contracts | Exercise
price/Rate | Expiration
date | Premium
received ($) | Value ($) |
| Akorn, Inc. | Goldman Sachs | USD | (84,726) | (54) | 20.00 | 9/21/2018 | (14,590) | (5,804) |
| DXC Technology Co. | Goldman Sachs | USD | (546,540) | (60) | 90.00 | 9/21/2018 | (9,151) | (12,000) |
| Walt Disney Co. (The) | Goldman Sachs | USD | (179,232) | (16) | 110.00 | 9/21/2018 | (7,112) | (4,680) |
| Total | | | | | | | (30,853) | (22,484) |
| Put option contracts written |
| Description | Counterparty | Trading
currency | Notional
amount | Number of
contracts | Exercise
price/Rate | Expiration
date | Premium
received ($) | Value ($) |
| DXC Technology Co. | Goldman Sachs | USD | (273,270) | (30) | 82.50 | 09/21/2018 | (1,375) | (225) |
| DXC Technology Co. | Goldman Sachs | USD | (273,270) | (30) | 85.00 | 09/21/2018 | (2,475) | (600) |
| SPDR S&P 500 ETF Trust | Goldman Sachs | USD | (174,186) | (6) | 286.00 | 09/07/2018 | (265) | (186) |
| SPDR S&P 500 ETF Trust | Goldman Sachs | USD | (174,186) | (6) | 287.00 | 09/07/2018 | (343) | (252) |
| SPDR S&P 500 ETF Trust | Goldman Sachs | USD | (174,186) | (6) | 288.00 | 09/07/2018 | (455) | (342) |
| Walt Disney Co. (The) | Goldman Sachs | USD | (168,030) | (15) | 105.00 | 09/21/2018 | (646) | (248) |
| Total | | | | | | | (5,559) | (1,853) |
| Total return swap contracts |
| Fund receives | Fund pays | Payment
frequency | Counterparty | Maturity
date | Notional
currency | Notional
amount | Value
($) | Periodic
payments
receivable
(payable)
($) | Upfront
payments | Upfront
receipts | Unrealized
appreciation
($) | Unrealized
depreciation
($) |
| Total return on Sky PLC | 1-week GBP LIBOR plus 0.450% | Monthly | Goldman Sachs | 02/22/2019 | GBP | 1,073,641 | 15,532 | (1,341) | — | — | 14,191 | — |
| Total return on Sky PLC | 1-week GBP LIBOR plus 0.450% | Monthly | Goldman Sachs | 02/22/2019 | GBP | 90,740 | 1,313 | (112) | — | — | 1,201 | — |
| Total return on Sky PLC | 1-week GBP LIBOR plus 0.450% | Monthly | Goldman Sachs | 02/22/2019 | GBP | 89,810 | 1,299 | (111) | — | — | 1,188 | — |
| Total return on Sky PLC | 1-week GBP LIBOR plus 0.450% | Monthly | Goldman Sachs | 02/22/2019 | GBP | 87,845 | 1,270 | (108) | — | — | 1,162 | — |
| Total return on Sky PLC | 1-week GBP LIBOR plus 0.450% | Monthly | Goldman Sachs | 02/22/2019 | GBP | 87,281 | 1,263 | (108) | — | — | 1,155 | — |
| Total return on Sky PLC | 1-month GBP LIBOR plus 0.450% | Monthly | Goldman Sachs | 02/22/2019 | GBP | 85,027 | 1,230 | (105) | — | — | 1,125 | — |
| Total return on Sky PLC | 1-month GBP LIBOR plus 0.450% | Monthly | Goldman Sachs | 02/22/2019 | GBP | 85,405 | 1,198 | (108) | — | — | 1,090 | — |
The accompanying Notes to Consolidated Financial Statements are an integral part of this statement.
Multi-Manager Alternative Strategies Fund | Annual Report 2018
| 51 |
Consolidated Portfolio of Investments (continued)
August 31, 2018
| Total return swap contracts (continued) |
| Fund receives | Fund pays | Payment
frequency | Counterparty | Maturity
date | Notional
currency | Notional
amount | Value
($) | Periodic
payments
receivable
(payable)
($) | Upfront
payments | Upfront
receipts | Unrealized
appreciation
($) | Unrealized
depreciation
($) |
| Total return on Sky PLC | 1-week GBP LIBOR plus 0.450% | Monthly | Goldman Sachs | 02/22/2019 | GBP | 76,647 | 1,108 | (90) | — | — | 1,018 | — |
| Total return on Sky PLC | 1-week GBP LIBOR plus 0.450% | Monthly | Goldman Sachs | 02/22/2019 | GBP | 31,582 | 457 | (39) | — | — | 418 | — |
| Total return on Sky PLC | 1-week GBP LIBOR plus 0.450% | Monthly | Goldman Sachs | 02/22/2019 | GBP | 22,578 | 327 | (28) | — | — | 299 | — |
| Total return on Sky PLC | 1-week GBP LIBOR plus 0.450% | Monthly | Goldman Sachs | 02/22/2019 | GBP | 14,077 | 203 | (17) | — | — | 186 | — |
| Total return on Sky PLC | 1-week GBP LIBOR plus 0.450% | Monthly | Goldman Sachs | 02/22/2019 | GBP | 6,216 | 90 | (7) | — | — | 83 | — |
| Total return on Sky PLC | 1-week GBP LIBOR plus 0.450% | Monthly | Goldman Sachs | 02/22/2019 | GBP | 5,835 | 85 | (7) | — | — | 78 | — |
| Total return on Sky PLC | 1-week GBP LIBOR plus 0.450% | Monthly | Goldman Sachs | 02/22/2019 | GBP | 5,850 | 85 | (7) | — | — | 78 | — |
| Total return on FirstGroup PLC | 1-month GBP LIBOR plus 0.450% | Monthly | Goldman Sachs | 05/31/2019 | GBP | 102,127 | 525 | (127) | — | — | 398 | — |
| Total return on FirstGroup PLC | 1-month GBP LIBOR plus 0.450% | Monthly | Goldman Sachs | 05/31/2019 | GBP | 24,128 | 123 | (30) | — | — | 93 | — |
| Total return on FirstGroup PLC | 1-month GBP LIBOR plus 0.450% | Monthly | Goldman Sachs | 05/31/2019 | GBP | 20,993 | 108 | (26) | — | — | 82 | — |
| Total return on FirstGroup PLC | 1-month GBP LIBOR plus 0.450% | Monthly | Goldman Sachs | 05/31/2019 | GBP | 20,600 | 106 | (26) | — | — | 80 | — |
| Total return on FirstGroup PLC | 1-month GBP LIBOR plus 0.450% | Monthly | Goldman Sachs | 05/31/2019 | GBP | 10,948 | 57 | (14) | — | — | 43 | — |
| Total return on FirstGroup PLC | 1-month GBP LIBOR plus 0.450% | Monthly | Goldman Sachs | 05/31/2019 | GBP | 8,341 | 42 | (10) | — | — | 32 | — |
| Total return on FirstGroup PLC | 1-month GBP LIBOR plus 0.450% | Monthly | Goldman Sachs | 05/31/2019 | GBP | 6,857 | 36 | (9) | — | — | 27 | — |
| Total return on FirstGroup PLC | 1-month GBP LIBOR plus 0.450% | Monthly | Goldman Sachs | 05/31/2019 | GBP | 2,555 | 13 | (3) | — | — | 10 | — |
| Total return on FirstGroup PLC | 1-month GBP LIBOR plus 0.450% | Monthly | Goldman Sachs | 05/31/2019 | GBP | 932 | 5 | (1) | — | — | 4 | — |
| Total return on FirstGroup PLC | 1-month GBP LIBOR plus 0.450% | Monthly | Goldman Sachs | 05/31/2019 | GBP | 607 | 3 | (1) | — | — | 2 | — |
| Total | | | | | | | 26,478 | (2,435) | — | — | 24,043 | — |
| Total return swap contracts on futures |
| Reference instrument | Counterparty | Expiration
date | Trading
currency | Notional amount
long(short) | Upfront
payments ($) | Upfront
receipts ($) | Value/Unrealized
appreciation
($) | Value/Unrealized
depreciation
($) |
| Euro-Bobl Dec 18 | Barclays | 12/2018 | EUR | 7,370,160 | — | — | 12,495 | — |
| Euro-Bund Dec 18 | Barclays | 12/2018 | EUR | 21,062,180 | — | — | 95,585 | — |
| Euro-Buxl 30-Year Sep 18 | Barclays | 09/2018 | EUR | 4,291,200 | — | — | 48,619 | — |
| Coffe Dec 18 | Citi | 12/2018 | USD | (534,450) | — | — | 46,434 | — |
| Corn Dec 18 | Citi | 12/2018 | USD | (1,551,250) | — | — | 66,279 | — |
| Cotton No.2 Dec 18 | Citi | 12/2018 | USD | 82,220 | — | — | — | (10,800) |
The accompanying Notes to Consolidated Financial Statements are an integral part of this statement.
| 52 | Multi-Manager Alternative Strategies Fund | Annual Report 2018 |
Consolidated Portfolio of Investments (continued)
August 31, 2018
| Total return swap contracts on futures (continued) |
| Reference instrument | Counterparty | Expiration
date | Trading
currency | Notional amount
long(short) | Upfront
payments ($) | Upfront
receipts ($) | Value/Unrealized
appreciation
($) | Value/Unrealized
depreciation
($) |
| Soybean Meal Dec 18 | Citi | 12/2018 | USD | (399,360) | — | — | 24,347 | — |
| Soybean Nov 18 | Citi | 11/2018 | USD | (2,193,100) | — | — | 174,034 | — |
| Soybean Oil Dec 18 | Citi | 12/2018 | USD | (552,384) | — | — | 38,562 | — |
| H-Shares Index Sep 18 | JP Morgan | 09/2018 | HKD | (10,845,000) | — | — | 29,605 | — |
| MSCI Taiwan Index Sep 18 | JP Morgan | 09/2018 | USD | 660,000 | — | — | 5,229 | — |
| Swiss Market Index Sep 18 | JP Morgan | 09/2018 | CHF | 1,701,260 | — | — | — | (19,094) |
| Total | | | | | — | — | 541,189 | (29,894) |
Notes to Consolidated Portfolio of Investments
| (a) | Represents privately placed and other securities and instruments exempt from SEC registration (collectively, private placements), such as Section 4(a)(2) and Rule 144A eligible securities, which are often sold only to qualified institutional buyers. The Fund may invest in private placements determined to be liquid as well as those determined to be illiquid. Private placements may be determined to be liquid under guidelines established by the Fund’s Board of Trustees. At August 31, 2018, the total value of these securities amounted to $93,252,288, which represents 16.30% of total net assets. |
| (b) | Variable rate security. The interest rate shown was the current rate as of August 31, 2018. |
| (c) | Variable or floating rate security, the interest rate of which adjusts periodically based on changes in current interest rates and prepayments on the underlying pool of assets. The interest rate shown was the current rate as of August 31, 2018. |
| (d) | Represents interest only securities which have the right to receive the monthly interest payments on an underlying pool of mortgage loans. |
| (e) | Represents fair value as determined in good faith under procedures approved by the Board of Trustees. At August 31, 2018, the total value of these securities amounted to $7,285,304, which represents 1.27% of total net assets. |
| (f) | Non-income producing investment. |
| (g) | Valuation based on significant unobservable inputs. |
| (h) | This security or a portion of this security has been pledged as collateral in connection with derivative contracts. |
| (i) | This security or a portion of this security has been pledged as collateral in connection with investments sold short. |
| (j) | At August 31, 2018, securities valued at $631,266 were held to cover open call options written. |
| (k) | Principal amounts are denominated in United States Dollars unless otherwise noted. |
| (l) | Zero coupon bond. |
| (m) | Represents a variable rate security with a step coupon where the rate adjusts according to a schedule for a series of periods, typically lower for an initial period and then increasing to a higher coupon rate thereafter. The interest rate shown was the current rate as of August 31, 2018. |
| (n) | Principal and interest may not be guaranteed by the government. |
| (o) | The stated interest rate represents the weighted average interest rate at August 31, 2018 of contracts within the senior loan facility. Interest rates on contracts are primarily determined either weekly, monthly or quarterly by reference to the indicated base lending rate and spread and the reset period. These base lending rates are primarily the London Interbank Offered Rate (“LIBOR”) and other short-term rates. Base lending rates may be subject to a floor or minimum rate. The interest rate for senior loans purchased on a when-issued or delayed delivery basis will be determined upon settlement, therefore no interest rate is disclosed. Senior loans often require prepayments from excess cash flows or permit the borrowers to repay at their election. The degree to which borrowers repay, cannot be predicted with accuracy. As a result, remaining maturities of senior loans may be less than the stated maturities. |
| (p) | Represents a security purchased on a forward commitment basis. |
| (q) | The rate shown is the seven-day current annualized yield at August 31, 2018. |
| (r) | As defined in the Investment Company Act of 1940, an affiliated company is one in which the Fund owns 5% or more of the company’s outstanding voting securities, or a company which is under common ownership or control with the Fund. Holdings and transactions in these affiliated companies during the year ended August 31, 2018 are as follows: |
| Issuer | Beginning
shares | Shares
purchased | Shares
sold | Ending
shares | Realized gain
(loss) —
affiliated
issuers ($) | Net change in
unrealized
appreciation
(depreciation) —
affiliated
issuers ($) | Dividends —
affiliated
issuers ($) | Value —
affiliated
issuers
at end of
period ($) |
| Columbia Short-Term Cash Fund, 2.058% |
| | 183,395,540 | 776,971,109 | (830,742,287) | 129,624,362 | (4,802) | (3,528) | 1,768,629 | 129,611,399 |
| (s) | At August 31, 2018, cash or short-term securities were designated to cover open put and/or call options written. |
The accompanying Notes to Consolidated Financial Statements are an integral part of this statement.
Multi-Manager Alternative Strategies Fund | Annual Report 2018
| 53 |
Consolidated Portfolio of Investments (continued)
August 31, 2018
Abbreviation Legend
| ADR | American Depositary Receipt |
| CMO | Collateralized Mortgage Obligation |
| FGIC | Financial Guaranty Insurance Corporation |
Currency Legend
| AUD | Australian Dollar |
| BRL | Brazilian Real |
| CAD | Canada Dollar |
| CHF | Swiss Franc |
| CLP | Chilean Peso |
| COP | Colombian Peso |
| EUR | Euro |
| GBP | British Pound |
| HKD | Hong Kong Dollar |
| HUF | Hungarian Forint |
| IDR | Indonesian Rupiah |
| ILS | New Israeli Sheqel |
| INR | Indian Rupee |
| JPY | Japanese Yen |
| KRW | South Korean Won |
| MXN | Mexican Peso |
| MYR | Malaysian Ringgit |
| NOK | Norwegian Krone |
| NZD | New Zealand Dollar |
| PHP | Philippine Peso |
| PLN | Polish Zloty |
| SEK | Swedish Krona |
| SGD | Singapore Dollar |
| TRY | Turkish Lira |
| TWD | New Taiwan Dollar |
| USD | US Dollar |
| ZAR | South African Rand |
Fair value measurements
The Fund categorizes its fair value measurements according to a three-level hierarchy that maximizes the use of observable inputs and minimizes the use of unobservable inputs by prioritizing that the most observable input be used when available. Observable inputs are those that market participants would use in pricing an investment based on market data obtained from sources independent of the reporting entity. Unobservable inputs are those that reflect the Fund’s assumptions about the information market participants would use in pricing an investment. An investment’s level within the fair value hierarchy is based on the lowest level of any input that is deemed significant to the asset’s or liability’s fair value measurement. The input levels are not necessarily an indication of the risk or liquidity associated with investments at that level. For example, certain U.S. government securities are generally high quality and liquid, however, they are reflected as Level 2 because the inputs used to determine fair value may not always be quoted prices in an active market.
Fair value inputs are summarized in the three broad levels listed below:
| ■ | Level 1 — Valuations based on quoted prices for investments in active markets that the Fund has the ability to access at the measurement date. Valuation adjustments are not applied to Level 1 investments. |
| ■ | Level 2 — Valuations based on other significant observable inputs (including quoted prices for similar securities, interest rates, prepayment speeds, credit risks, etc.). |
| ■ | Level 3 — Valuations based on significant unobservable inputs (including the Fund’s own assumptions and judgment in determining the fair value of investments). |
Inputs that are used in determining fair value of an investment may include price information, credit data, volatility statistics, and other factors. These inputs can be either observable or unobservable. The availability of observable inputs can vary between investments, and is affected by various factors such as the type of investment, and the volume and level of activity for that investment or similar investments in the marketplace. The inputs will be considered by the Investment Manager, along with any other relevant factors in the calculation of an investment’s fair value. The Fund uses prices and inputs that are current as of the measurement date, which may include periods of market dislocations. During these periods, the availability of prices and inputs may be reduced for many investments. This condition could cause an investment to be reclassified between the various levels within the hierarchy.
The accompanying Notes to Consolidated Financial Statements are an integral part of this statement.
| 54 | Multi-Manager Alternative Strategies Fund | Annual Report 2018 |
Consolidated Portfolio of Investments (continued)
August 31, 2018
Fair value measurements (continued)
Foreign equity securities actively traded in markets where there is a significant delay in the local close relative to the New York Stock Exchange are classified as Level 2. The values of these securities may include an adjustment to reflect the impact of significant market movements following the close of local trading, as described in Note 2 to the consolidated financial statements – Security valuation.
Certain investments that have been measured at fair value using the net asset value (NAV) per share (or its equivalent) are not categorized in the fair value hierarchy. The fair value amounts presented in the table are intended to reconcile the fair value hierarchy to the amounts presented in the Consolidated Portfolio of Investments. The Columbia Short-Term Cash Fund seeks to provide shareholders with maximum current income consistent with liquidity and stability of principal. Columbia Short-Term Cash Fund prices its shares with a floating NAV and no longer seeks to maintain a stable NAV.
Investments falling into the Level 3 category are primarily supported by quoted prices from brokers and dealers participating in the market for those investments. However, these may be classified as Level 3 investments due to lack of market transparency and corroboration to support these quoted prices. Additionally, valuation models may be used as the pricing source for any remaining investments classified as Level 3. These models may rely on one or more significant unobservable inputs and/or significant assumptions by the Investment Manager. Inputs used in valuations may include, but are not limited to, financial statement analysis, capital account balances, discount rates and estimated cash flows, and comparable company data.
Under the direction of the Fund’s Board of Trustees (the Board), the Investment Manager’s Valuation Committee (the Committee) is responsible for overseeing the valuation procedures approved by the Board. The Committee consists of voting and non-voting members from various groups within the Investment Manager’s organization, including operations and accounting, trading and investments, compliance, risk management and legal.
The Committee meets at least monthly to review and approve valuation matters, which may include a description of specific valuation determinations, data regarding pricing information received from approved pricing vendors and brokers and the results of Board-approved valuation control policies and procedures (the Policies). The Policies address, among other things, instances when market quotations are or are not readily available, including recommendations of third party pricing vendors and a determination of appropriate pricing methodologies; events that require specific valuation determinations and assessment of fair value techniques; securities with a potential for stale pricing, including those that are illiquid, restricted, or in default; and the effectiveness of third party pricing vendors, including periodic reviews of vendors. The Committee meets more frequently, as needed, to discuss additional valuation matters, which may include the need to review back-testing results, review time-sensitive information or approve related valuation actions. The Committee reports to the Board, with members of the Committee meeting with the Board at each of its regularly scheduled meetings to discuss valuation matters and actions during the period, similar to those described earlier.
For investments categorized as Level 3, the Committee monitors information similar to that described above, which may include: (i) data specific to the issuer or comparable issuers, (ii) general market or specific sector news and (iii) quoted prices and specific or similar security transactions. The Committee considers this data and any changes from prior periods in order to assess the reasonableness of observable and unobservable inputs, any assumptions or internal models used to value those securities and changes in fair value. This data is also used to corroborate, when available, information received from approved pricing vendors and brokers. Various factors impact the frequency of monitoring this information (which may occur as often as daily). However, the Committee may determine that changes to inputs, assumptions and models are not required as a result of the monitoring procedures performed.
The following table is a summary of the inputs used to value the Fund’s investments at August 31, 2018:
| | Level 1
quoted prices
in active
markets for
identical
assets ($) | Level 2
other
significant
observable
inputs ($) | Level 3
significant
unobservable
inputs ($) | Investments
measured at
net asset
value ($) | Total ($) |
| Investments in Securities | | | | | |
| Alternative Strategies Funds | — | 1,768,868 | — | — | 1,768,868 |
| Asset-Backed Securities — Non-Agency | — | 29,543,737 | — | — | 29,543,737 |
| Commercial Mortgage-Backed Securities - Agency | — | 20,851,544 | — | — | 20,851,544 |
| Commercial Mortgage-Backed Securities - Non-Agency | — | 14,015,773 | — | — | 14,015,773 |
| Common Stocks | | | | | |
| Consumer Discretionary | 14,125,136 | 3,273,816 | 4,652,677 | — | 22,051,629 |
| Consumer Staples | 6,937,017 | 480,075 | 67,830 | — | 7,484,922 |
| Energy | 3,088,650 | — | — | — | 3,088,650 |
| Financials | 6,900,619 | — | — | — | 6,900,619 |
| Health Care | 7,100,009 | 880,296 | 2,564,797 | — | 10,545,102 |
| Industrials | 5,931,612 | — | — | — | 5,931,612 |
| Information Technology | 10,537,100 | 1,515,666 | — | — | 12,052,766 |
| Materials | 4,284,081 | — | — | — | 4,284,081 |
| Real Estate | 14,564,346 | — | — | — | 14,564,346 |
| Utilities | 2,761,919 | — | — | — | 2,761,919 |
| Total Common Stocks | 76,230,489 | 6,149,853 | 7,285,304 | — | 89,665,646 |
| Convertible Bonds | — | 5,167,671 | — | — | 5,167,671 |
| Convertible Preferred Stocks | | | | | |
| Energy | 670,716 | — | — | — | 670,716 |
| Health Care | 613,921 | — | — | — | 613,921 |
| Industrials | 167,699 | 419,210 | — | — | 586,909 |
The accompanying Notes to Consolidated Financial Statements are an integral part of this statement.
Multi-Manager Alternative Strategies Fund | Annual Report 2018
| 55 |
Consolidated Portfolio of Investments (continued)
August 31, 2018
Fair value measurements (continued)
| | Level 1
quoted prices
in active
markets for
identical
assets ($) | Level 2
other
significant
observable
inputs ($) | Level 3
significant
unobservable
inputs ($) | Investments
measured at
net asset
value ($) | Total ($) |
| Real Estate | 286,242 | — | — | — | 286,242 |
| Utilities | 886,692 | 110,823 | — | — | 997,515 |
| Total Convertible Preferred Stocks | 2,625,270 | 530,033 | — | — | 3,155,303 |
| Corporate Bonds & Notes | — | 121,982,483 | — | — | 121,982,483 |
| Equity Funds | 6,188,211 | — | — | — | 6,188,211 |
| Exchange-Traded Funds | 3,858,967 | — | — | — | 3,858,967 |
| Foreign Government Obligations | — | 33,774,702 | — | — | 33,774,702 |
| Municipal Bonds | — | 3,422,535 | — | — | 3,422,535 |
| Preferred Debt | 496,805 | — | — | — | 496,805 |
| Preferred Stocks | | | | | |
| Financials | 1,529,469 | 211,899 | — | — | 1,741,368 |
| Residential Mortgage-Backed Securities - Agency | — | 1,602,303 | — | — | 1,602,303 |
| Residential Mortgage-Backed Securities - Non-Agency | — | 44,066,532 | — | — | 44,066,532 |
| Senior Loans | — | 12,251,849 | — | — | 12,251,849 |
| Treasury Bills | 26,610,692 | 3,330,311 | — | — | 29,941,003 |
| U.S. Treasury Obligations | 911,809 | — | — | — | 911,809 |
| Warrants | | | | | |
| Information Technology | — | — | 43,662 | — | 43,662 |
| Options Purchased Calls | 38,132 | — | — | — | 38,132 |
| Options Purchased Puts | 73,726 | — | — | — | 73,726 |
| Money Market Funds | — | — | — | 129,611,399 | 129,611,399 |
| Total Investments in Securities | 118,563,570 | 298,670,093 | 7,328,966 | 129,611,399 | 554,174,028 |
| Investments in Securities Sold Short | | | | | |
| Common Stocks | | | | | |
| Consumer Discretionary | (9,287,727) | — | — | — | (9,287,727) |
| Consumer Staples | (4,602,576) | — | — | — | (4,602,576) |
| Energy | (2,643,895) | — | — | — | (2,643,895) |
| Health Care | (1,305,799) | (460,008) | — | — | (1,765,807) |
| Industrials | (5,434,529) | — | — | — | (5,434,529) |
| Information Technology | (7,687,690) | — | — | — | (7,687,690) |
| Materials | (1,324,216) | — | — | — | (1,324,216) |
| Real Estate | (1,730,243) | — | — | — | (1,730,243) |
| Utilities | (33) | — | — | — | (33) |
| Total Common Stocks | (34,016,708) | (460,008) | — | — | (34,476,716) |
| Corporate Bonds & Notes | — | (2,081,237) | — | — | (2,081,237) |
| Exchange-Traded Funds | (18,955,093) | — | — | — | (18,955,093) |
| Total Investments in Securities Sold Short | (52,971,801) | (2,541,245) | — | — | (55,513,046) |
| Total Investments in Securities, Net of Securities Sold Short | 65,591,769 | 296,128,848 | 7,328,966 | 129,611,399 | 498,660,982 |
| Investments in Derivatives | | | | | |
| Asset | | | | | |
| Forward Foreign Currency Exchange Contracts | — | 7,281,384 | — | — | 7,281,384 |
| Futures Contracts | 6,807,995 | — | — | — | 6,807,995 |
| Swap Contracts | — | 565,232 | — | — | 565,232 |
| Liability | | | | | |
| Forward Foreign Currency Exchange Contracts | — | (6,833,087) | — | — | (6,833,087) |
| Futures Contracts | (1,370,912) | — | — | — | (1,370,912) |
| Options Contracts Written | (24,337) | — | — | — | (24,337) |
| Swap Contracts | — | (29,894) | — | — | (29,894) |
| Total | 71,004,515 | 297,112,483 | 7,328,966 | 129,611,399 | 505,057,363 |
See the Consolidated Portfolio of Investments for all investment classifications not indicated in the table.
The accompanying Notes to Consolidated Financial Statements are an integral part of this statement.
| 56 | Multi-Manager Alternative Strategies Fund | Annual Report 2018 |
Consolidated Portfolio of Investments (continued)
August 31, 2018
Fair value measurements (continued)
The Fund’s assets assigned to the Level 2 input category are generally valued using the market approach, in which a security’s value is determined through reference to prices and information from market transactions for similar or identical assets. These assets include certain foreign securities for which a third party statistical pricing service may be employed for purposes of fair market valuation. The model utilized by such third party statistical pricing service takes into account a security’s correlation to available market data including, but not limited to, intraday index, ADR, and exchange-traded fund movements.
Forward foreign currency exchange contracts, futures contracts and swap contracts are valued at unrealized appreciation (depreciation).
There were no transfers of financial assets between levels during the period.
The following table is a reconciliation of Level 3 assets for which significant observable and unobservable inputs were used to determine fair value:
| Investments in securities | Balance
as of
08/31/2017
($) | Increase
(decrease)
in accrued
discounts/
premiums
($) | Realized
gain (loss)
($) | Change
in unrealized
appreciation
(depreciation)(a)
($) | Purchases
($) | Sales
($) | Transfers
into
Level 3
($) | Transfers
out of
Level 3
($) | Balance
as of
08/31/2018
($) |
| Common Stocks | 7,713,377 | — | 217,714 | (376,764) | — | (269,023) | — | — | 7,285,304 |
| Warrants | — | — | 2,128 | 43,662 | — | (2,128) | — | — | 43,662 |
| Total | 7,713,377 | — | 219,842 | (333,102) | — | (271,151) | — | — | 7,328,966 |
(a) Change in unrealized appreciation (depreciation) relating to securities held at August 31, 2018 was $(92,835), which is comprised of Common Stocks of $(136,497) and Warrants of $43,662.
The Fund’s assets assigned to the Level 3 category are valued utilizing the valuation technique deemed the most appropriate in the circumstances. Certain common stocks and warrants classified as Level 3 are valued using the market approach. To determine fair value for these securities, management considered various factors which may have included, but were not limited to, estimated cash flows of the securities, observed yields on securities deemed comparable, the subscription price of the security, closing prices of similar securities from the issuer and single market quotations from broker dealers. Significant increases (decreases) to any of these inputs would result in a significantly lower (higher) fair value measurement.
The accompanying Notes to Consolidated Financial Statements are an integral part of this statement.
Multi-Manager Alternative Strategies Fund | Annual Report 2018
| 57 |
Consolidated Statement of Assets and Liabilities
August 31, 2018
| Assets | |
| Investments in securities, at value | |
| Unaffiliated issuers (cost $427,434,505) | $424,450,771 |
| Affiliated issuers (cost $129,612,893) | 129,611,399 |
| Options purchased (cost $288,308) | 111,858 |
| Foreign currency (cost $267,459) | 266,899 |
| Cash collateral held at broker for: | |
| Forward foreign currency exchange contracts | 310,000 |
| Swap contracts | 780,000 |
| Other (a) | 56,098,452 |
| Margin deposits on: | |
| Futures contracts | 15,802,248 |
| Unrealized appreciation on forward foreign currency exchange contracts | 7,281,384 |
| Unrealized appreciation on swap contracts | 565,232 |
| Receivable for: | |
| Investments sold | 3,797,204 |
| Investments sold on a delayed delivery basis | 126,094 |
| Capital shares sold | 370,260 |
| Dividends | 373,158 |
| Interest | 3,140,753 |
| Foreign tax reclaims | 18,896 |
| Variation margin for futures contracts | 1,218,644 |
| Prepaid expenses | 3,668 |
| Trustees’ deferred compensation plan | 43,319 |
| Total assets | 644,370,239 |
| Liabilities | |
| Securities sold short, at value (proceeds $53,767,660) | 55,513,046 |
| Option contracts written, at value (premiums received $36,412) | 24,337 |
| Due to custodian | 1,085,069 |
| Unrealized depreciation on forward foreign currency exchange contracts | 6,833,087 |
| Unrealized depreciation on swap contracts | 29,894 |
| Cash collateral due to broker for: | |
| Foreign forward currency exchange contracts | 110,000 |
| Swap contracts | 320,000 |
| Payable for: | |
| Investments purchased | 4,051,745 |
| Investments purchased on a delayed delivery basis | 1,583,263 |
| Capital shares purchased | 1,317,902 |
| Dividends and interest on securities sold short | 67,898 |
| Variation margin for futures contracts | 1,053,674 |
| Management services fees | 17,156 |
| Distribution and/or service fees | 9 |
| Transfer agent fees | 50,709 |
| Compensation of chief compliance officer | 38 |
| Other expenses | 104,509 |
| Trustees’ deferred compensation plan | 43,319 |
| Total liabilities | 72,205,655 |
| Net assets applicable to outstanding capital stock | $572,164,584 |
The accompanying Notes to Consolidated Financial Statements are an integral part of this statement.
| 58 | Multi-Manager Alternative Strategies Fund | Annual Report 2018 |
Consolidated Statement of Assets and Liabilities (continued)
August 31, 2018
| Represented by | |
| Paid in capital | $655,257,702 |
| Excess of distributions over net investment income | (47,854,115) |
| Accumulated net realized loss | (36,708,983) |
| Unrealized appreciation (depreciation) on: | |
| Investments - unaffiliated issuers | (2,983,734) |
| Investments - affiliated issuers | (1,494) |
| Foreign currency translations | (55,749) |
| Forward foreign currency exchange contracts | 448,297 |
| Futures contracts | 5,437,083 |
| Options purchased | (176,450) |
| Options contracts written | 12,075 |
| Securities sold short | (1,745,386) |
| Swap contracts | 535,338 |
| Total - representing net assets applicable to outstanding capital stock | $572,164,584 |
| Class A | |
| Net assets | $1,325,173 |
| Shares outstanding | 146,362 |
| Net asset value per share | $9.05 |
| Institutional Class | |
| Net assets | $570,839,411 |
| Shares outstanding | 62,836,145 |
| Net asset value per share | $9.08 |
| (a) | Includes collateral related to options contracts written, forward foreign currency exchange contracts, swap contracts and securities sold short. |
The accompanying Notes to Consolidated Financial Statements are an integral part of this statement.
Multi-Manager Alternative Strategies Fund | Annual Report 2018
| 59 |
Consolidated Statement of Operations
Year Ended August 31, 2018
| Net investment income | |
| Income: | |
| Dividends — unaffiliated issuers | $2,341,988 |
| Dividends — affiliated issuers | 1,768,629 |
| Interest | 10,503,987 |
| Foreign taxes withheld | (56,092) |
| Total income | 14,558,512 |
| Expenses: | |
| Management services fees | 6,324,434 |
| Distribution and/or service fees | |
| Class A | 4,053 |
| Transfer agent fees | |
| Class A | 1,796 |
| Institutional Class | 637,455 |
| Compensation of board members | 23,186 |
| Custodian fees | 116,807 |
| Printing and postage fees | 93,403 |
| Registration fees | 53,838 |
| Audit fees | 31,937 |
| Legal fees | 13,531 |
| Interest on collateral | 442 |
| Dividends and interest on securities sold short | 407,795 |
| Compensation of chief compliance officer | 225 |
| Other | 34,128 |
| Total expenses | 7,743,030 |
| Net investment income | 6,815,482 |
| Realized and unrealized gain (loss) — net | |
| Net realized gain (loss) on: | |
| Investments — unaffiliated issuers | 8,929,489 |
| Investments — affiliated issuers | (4,802) |
| Foreign currency translations | 135,050 |
| Forward foreign currency exchange contracts | (252,021) |
| Futures contracts | 1,495,532 |
| Options purchased | (872,449) |
| Options contracts written | 1,539,901 |
| Securities sold short | (7,133,651) |
| Swap contracts | (2,393,550) |
| Net realized gain | 1,443,499 |
| Net change in unrealized appreciation (depreciation) on: | |
| Investments — unaffiliated issuers | (9,023,211) |
| Investments — affiliated issuers | (3,528) |
| Foreign currency translations | (164,619) |
| Forward foreign currency exchange contracts | (296,981) |
| Futures contracts | 3,147,866 |
| Options purchased | (121,064) |
| Options contracts written | (31,751) |
| Securities sold short | 871,389 |
| Swap contracts | 605,099 |
| Net change in unrealized appreciation (depreciation) | (5,016,800) |
| Net realized and unrealized loss | (3,573,301) |
| Net increase in net assets resulting from operations | $3,242,181 |
The accompanying Notes to Consolidated Financial Statements are an integral part of this statement.
| 60 | Multi-Manager Alternative Strategies Fund | Annual Report 2018 |
Consolidated Statement of Changes in Net Assets
| | Year Ended
August 31, 2018 | Year Ended
August 31, 2017 |
| Operations | | |
| Net investment income (loss) | $6,815,482 | $(1,898,513) |
| Net realized gain (loss) | 1,443,499 | (26,346,435) |
| Net change in unrealized appreciation (depreciation) | (5,016,800) | 54,274 |
| Net increase (decrease) in net assets resulting from operations | 3,242,181 | (28,190,674) |
| Decrease in net assets from capital stock activity | (11,270,175) | (139,092,973) |
| Total decrease in net assets | (8,027,994) | (167,283,647) |
| Net assets at beginning of year | 580,192,578 | 747,476,225 |
| Net assets at end of year | $572,164,584 | $580,192,578 |
| Excess of distributions over net investment income | $(47,854,115) | $(50,241,444) |
| | Year Ended | Year Ended |
| | August 31, 2018 | August 31, 2017 (a) |
| | Shares | Dollars ($) | Shares | Dollars ($) |
| Capital stock activity |
| Class A | | | | |
| Subscriptions | — | — | 15,207,720 | 140,714,297 |
| Redemptions | (70,043) | (633,963) | (94,092,240) | (864,114,185) |
| Net decrease | (70,043) | (633,963) | (78,884,520) | (723,399,888) |
| Institutional Class | | | | |
| Subscriptions | 10,247,779 | 93,115,640 | 71,597,470 | 652,815,075 |
| Redemptions | (11,423,931) | (103,751,852) | (7,585,173) | (68,508,160) |
| Net increase (decrease) | (1,176,152) | (10,636,212) | 64,012,297 | 584,306,915 |
| Total net decrease | (1,246,195) | (11,270,175) | (14,872,223) | (139,092,973) |
| (a) | Institutional Class shares are based on operations from January 3, 2017 (commencement of operations) through the stated period end. |
The accompanying Notes to Consolidated Financial Statements are an integral part of this statement.
Multi-Manager Alternative Strategies Fund | Annual Report 2018
| 61 |
Consolidated Financial Highlights
The following table is intended to help you understand the Fund’s financial performance. Certain information reflects financial results for a single share of a class held for the periods shown. Per share net investment income (loss) amounts are calculated based on average shares outstanding during the period. Total return assumes reinvestment of all dividends and distributions, if any. Total return does not reflect payment of sales charges, if any. Total return and portfolio turnover are not annualized for periods of less than one year. The portfolio turnover rate is calculated without regard to purchase and sales transactions of short-term instruments and certain derivatives, if any. If such transactions were included, the Fund’s portfolio turnover rate may be higher.
| | Net asset value,
beginning of
period | Net
investment
income
(loss) | Net
realized
and
unrealized
gain (loss) | Total from
investment
operations | Distributions
from net
investment
income | Distributions
from net
realized
gains | Total
distributions to
shareholders |
| Class A |
| Year Ended 8/31/2018 | $9.03 | 0.08 | (0.06) | 0.02 | — | — | — |
| Year Ended 8/31/2017 | $9.45 | (0.07) | (0.35) | (0.42) | — | — | — |
| Year Ended 8/31/2016 | $10.07 | (0.05) | 0.10 | 0.05 | (0.67) | — | (0.67) |
| Year Ended 8/31/2015 | $10.88 | 0.03 (d) | (0.26) | (0.23) | (0.10) | (0.48) | (0.58) |
| Year Ended 8/31/2014 | $10.49 | (0.03) | 0.67 | 0.64 | (0.13) | (0.12) | (0.25) |
| Institutional Class |
| Year Ended 8/31/2018 | $9.03 | 0.11 | (0.06) | 0.05 | — | — | — |
| Year Ended 8/31/2017(e) | $9.10 | 0.02 | (0.09) | (0.07) | — | — | — |
| Notes to Consolidated Financial Highlights |
| (a) | In addition to the fees and expenses that the Fund bears directly, the Fund indirectly bears a pro rata share of the fees and expenses of any other funds in which it invests. Such indirect expenses are not included in the Fund’s reported expense ratios. |
| (b) | Total net expenses include the impact of certain fee waivers/expense reimbursements made by the Investment Manager and certain of its affiliates, if applicable. |
| (c) | Ratios include dividends and interest on securities sold short. If dividends and interest on securities sold short had been excluded, expenses would have been lower by: |
| Class | 8/31/2018 | 8/31/2017 | 8/31/2016 | 8/31/2015 | 8/31/2014 |
| Class A | 0.07% | 0.28% | 0.32% | 0.35% | 0.31% |
| Institutional Class | 0.07% | 0.15% | —% | —% | —% |
| (d) | Net investment income per share includes special dividends. The effect of these dividends amounted to $0.08 per share. |
| (e) | Institutional Class shares commenced operations on January 3, 2017. Per share data and total return reflect activity from that date. |
| (f) | Annualized. |
The accompanying Notes to Consolidated Financial Statements are an integral part of this statement.
| 62 | Multi-Manager Alternative Strategies Fund | Annual Report 2018 |
Consolidated Financial Highlights (continued)
| | Net
asset
value,
end of
period | Total
return | Total gross
expense
ratio to
average
net assets(a) | Total net
expense
ratio to
average
net assets(a),(b) | Net investment
income (loss)
ratio to
average
net assets | Portfolio
turnover | Net
assets,
end of
period
(000’s) |
| Class A |
| Year Ended 8/31/2018 | $9.05 | 0.22% | 1.59% (c) | 1.59% (c) | 0.87% | 256% | $1,325 |
| Year Ended 8/31/2017 | $9.03 | (4.44%) | 1.75% (c) | 1.75% (c) | (0.77%) | 444% | $1,953 |
| Year Ended 8/31/2016 | $9.45 | 0.79% | 1.80% (c) | 1.80% (c) | (0.49%) | 289% | $747,476 |
| Year Ended 8/31/2015 | $10.07 | (2.30%) | 1.83% (c) | 1.83% (c) | 0.27% | 304% | $784,940 |
| Year Ended 8/31/2014 | $10.88 | 6.15% | 1.79% (c) | 1.79% (c) | (0.27%) | 246% | $777,811 |
| Institutional Class |
| Year Ended 8/31/2018 | $9.08 | 0.55% | 1.34% (c) | 1.34% (c) | 1.18% | 256% | $570,839 |
| Year Ended 8/31/2017(e) | $9.03 | (0.77%) | 1.45% (c),(f) | 1.45% (c),(f) | 0.34% (f) | 444% | $578,239 |
The accompanying Notes to Consolidated Financial Statements are an integral part of this statement.
Multi-Manager Alternative Strategies Fund | Annual Report 2018
| 63 |
Notes to Consolidated Financial Statements
August 31, 2018
Note 1. Organization
Multi-Manager Alternative Strategies Fund (the Fund), a series of Columbia Funds Series Trust I (the Trust), is a non-diversified fund. The Trust is registered under the Investment Company Act of 1940, as amended (the 1940 Act), as an open-end management investment company organized as a Massachusetts business trust.
Basis for consolidation
ASGM Offshore Fund, Ltd. and ASMF Offshore Fund, Ltd. (each, a Subsidiary) are each a Cayman Islands exempted company and wholly-owned subsidiary of the Fund. Each Subsidiary acts as an investment vehicle in order to effect certain investment strategies consistent with the Fund’s investment objective and policies as stated in its current prospectus and statement of additional information. In accordance with the Memorandum and Articles of Association of the Subsidiary (the Articles), the Fund owns the sole issued share of each Subsidiary and retains all rights associated with such share, including the right to receive notice of, attend and vote at general meetings of the Subsidiaries, rights in a winding-up or repayment of capital and the right to participate in the profits or assets of the Subsidiaries. The consolidated financial statements (financial statements) include the accounts of the consolidated Fund and each respective Subsidiary. Subsequent references to the Fund within the Notes to Consolidated Financial Statements collectively refer to the Fund and each Subsidiary. All intercompany transactions and balances have been eliminated in the consolidation process.
At August 31, 2018, each Subsidiary’s financial statement information is as follows:
| | ASGM Offshore Fund, Ltd. | ASMF Offshore Fund, Ltd. |
| % of consolidated fund net assets | 1.63% | 1.99% |
| Net assets | $9,306,439 | $11,402,874 |
| Net investment income (loss) | 15,279 | 83,624 |
| Net realized gain (loss) | (531,453) | 3,981,962 |
| Net change in unrealized appreciation (depreciation) | 1,271,911 | 187,788 |
The financial statements present the portfolio holdings, financial position and results of operations of the Fund and the Subsidiaries on a consolidated basis.
Fund shares
The Trust may issue an unlimited number of shares (without par value). The Fund is offered only through certain wrap fee programs sponsored and/or managed by Ameriprise Financial, Inc. (Ameriprise Financial) or its affiliates. The Fund offers each of the share classes identified below.
Class A shares are not subject to any front-end sales charge or contingent deferred sales charge.
Institutional Class shares are not subject to any front-end sales charge or contingent deferred sales charge. Prior to November 1, 2017, Institutional Class shares were known as Class Z shares.
Note 2. Summary of significant accounting policies
Basis of preparation
The Fund is an investment company that applies the accounting and reporting guidance in the Financial Accounting Standards Board (FASB) Accounting Standards Codification Topic 946, Financial Services - Investment Companies (ASC 946). The financial statements are prepared in accordance with U.S. generally accepted accounting principles (GAAP), which requires management to make certain estimates and assumptions that affect the reported amounts of assets and liabilities, the disclosure of contingent assets and liabilities at the date of the financial statements and the reported amounts of income and expenses during the reporting period. Actual results could differ from those estimates.
The following is a summary of significant accounting policies followed by the Fund in the preparation of its financial statements.
| 64 | Multi-Manager Alternative Strategies Fund | Annual Report 2018 |
Notes to Consolidated Financial Statements (continued)
August 31, 2018
Security valuation
All equity securities and exchange-traded funds are valued at the close of business of the New York Stock Exchange. Equity securities and exchange-traded funds are valued at the last quoted sales price on the principal exchange or market on which they trade, except for securities traded on the NASDAQ Stock Market, which are valued at the NASDAQ official close price. Unlisted securities or listed securities for which there were no sales during the day are valued at the mean of the latest quoted bid and ask prices on such exchanges or markets.
Debt securities generally are valued by pricing services approved by the Board of Trustees based upon market transactions for normal, institutional-size trading units of similar securities. The services may use various pricing techniques that take into account, as applicable, factors such as yield, quality, coupon rate, maturity, type of issue, trading characteristics and other data, as well as approved independent broker-dealer quotes. Debt securities for which quotations are not readily available or not believed to be reflective of market value may also be valued based upon a bid quote from an approved independent broker-dealer. Debt securities maturing in 60 days or less are valued primarily at amortized cost value, unless this method results in a valuation that management believes does not approximate market value.
Asset- and mortgage-backed securities are generally valued by pricing services, which utilize pricing models that incorporate the securities’ cash flow and loan performance data. These models also take into account available market data, including trades, market quotations, and benchmark yield curves for identical or similar securities. Factors used to identify similar securities may include, but are not limited to, issuer, collateral type, vintage, prepayment speeds, collateral performance, credit ratings, credit enhancement and expected life. Asset-backed securities for which quotations are readily available may also be valued based upon an over-the-counter or exchange bid quote from an approved independent broker-dealer.
Senior loan securities for which reliable market quotations are readily available are generally valued by pricing services at the average of the bids received.
Foreign equity securities are valued based on the closing price on the foreign exchange in which such securities are primarily traded. If any foreign equity security closing prices are not readily available, the securities are valued at the mean of the latest quoted bid and ask prices on such exchanges or markets. Foreign currency exchange rates are generally determined at 4:00 p.m. Eastern (U.S.) time. Many securities markets and exchanges outside the U.S. close prior to the close of the New York Stock Exchange; therefore, the closing prices for securities in such markets or on such exchanges may not fully reflect events that occur after such close but before the close of the New York Stock Exchange. In those situations, foreign securities will be fair valued pursuant to a policy adopted by the Board of Trustees, including, if available, utilizing a third party pricing service to determine these fair values. The third party pricing service takes into account multiple factors, including, but not limited to, movements in the U.S. securities markets, certain depositary receipts, futures contracts and foreign exchange rates that have occurred subsequent to the close of the foreign exchange or market, to determine a good faith estimate that reasonably reflects the current market conditions as of the close of the New York Stock Exchange. The fair value of a security is likely to be different from the quoted or published price, if available.
Investments in open-end investment companies, including money market funds, are valued at their latest net asset value.
Forward foreign currency exchange contracts are marked-to-market based upon foreign currency exchange rates provided by a pricing service.
Futures and options on futures contracts are valued based upon the settlement price at the close of regular trading on their principal exchanges or, in the absence of transactions, at the mean of the latest quoted bid and ask prices.
Option contracts are valued at the mean of the latest quoted bid and ask prices on their primary exchanges. Option contracts, including over-the-counter option contracts, with no readily available market quotations are valued using quotes obtained from independent brokers as of the close of the New York Stock Exchange.
Swap transactions are valued through an independent pricing service or broker, or if neither is available, through an internal model based upon observable inputs.
Multi-Manager Alternative Strategies Fund | Annual Report 2018
| 65 |
Notes to Consolidated Financial Statements (continued)
August 31, 2018
Investments for which market quotations are not readily available, or that have quotations which management believes are not reflective of market value or reliable, are valued at fair value as determined in good faith under procedures approved by and under the general supervision of the Board of Trustees. If a security or class of securities (such as foreign securities) is valued at fair value, such value is likely to be different from the quoted or published price for the security.
The determination of fair value often requires significant judgment. To determine fair value, management may use assumptions including but not limited to future cash flows and estimated risk premiums. Multiple inputs from various sources may be used to determine fair value.
GAAP requires disclosure regarding the inputs and valuation techniques used to measure fair value and any changes in valuation inputs or techniques. In addition, investments shall be disclosed by major category. This information is disclosed following the Fund’s Consolidated Portfolio of Investments.
Foreign currency transactions and translations
The values of all assets and liabilities denominated in foreign currencies are generally translated into U.S. dollars at exchange rates determined at the close of regular trading on the New York Stock Exchange. Net realized and unrealized gains (losses) on foreign currency transactions and translations include gains (losses) arising from the fluctuation in exchange rates between trade and settlement dates on securities transactions, gains (losses) arising from the disposition of foreign currency and currency gains (losses) between the accrual and payment dates on dividends, interest income and foreign withholding taxes.
For financial statement purposes, the Fund does not distinguish that portion of gains (losses) on investments which is due to changes in foreign exchange rates from that which is due to changes in market prices of the investments. Such fluctuations are included with the net realized and unrealized gains (losses) on investments in the Consolidated Statement of Operations.
Derivative instruments
The Fund invests in certain derivative instruments, as detailed below, to meet its investment objectives. Derivatives are instruments whose values depend on, or are derived from, in whole or in part, the value of one or more securities, currencies, commodities, indices, or other assets or instruments. Derivatives may be used to increase investment flexibility (including to maintain cash reserves while maintaining desired exposure to certain assets), for risk management (hedging) purposes, to facilitate trading, to reduce transaction costs and to pursue higher investment returns. The Fund may also use derivative instruments to mitigate certain investment risks, such as foreign currency exchange rate risk, interest rate risk and credit risk. Derivatives may involve various risks, including the potential inability of the counterparty to fulfill its obligations under the terms of the contract, the potential for an illiquid secondary market (making it difficult for the Fund to sell or terminate, including at favorable prices) and the potential for market movements which may expose the Fund to gains or losses in excess of the amount shown in the Consolidated Statement of Assets and Liabilities. The notional amounts of derivative instruments, if applicable, are not recorded in the financial statements.
A derivative instrument may suffer a marked-to-market loss if the value of the contract decreases due to an unfavorable change in the market rates or values of the underlying instrument. Losses can also occur if the counterparty does not perform its obligations under the contract. The Fund’s risk of loss from counterparty credit risk on over-the-counter derivatives is generally limited to the aggregate unrealized gain netted against any collateral held by the Fund and the amount of any variation margin held by the counterparty, plus any replacement costs or related amounts. With exchange-traded or centrally cleared derivatives, there is reduced counterparty credit risk to the Fund since the clearinghouse or central counterparty (CCP) provides some protection in the case of clearing member default. The clearinghouse or CCP stands between the buyer and the seller of the contract; therefore, additional counterparty credit risk is failure of the clearinghouse or CCP. However, credit risk still exists in exchange-traded or centrally cleared derivatives with respect to initial and variation margin that is held in a broker’s customer account. While brokers are required to segregate customer margin from their own assets, in the event that a broker becomes insolvent or goes into bankruptcy and at that time there is a shortfall in the aggregate amount of margin held by the broker for all its clients, U.S. bankruptcy laws will typically allocate that shortfall on a pro-rata basis across all the broker’s customers (including the Fund), potentially resulting in losses to the Fund.
| 66 | Multi-Manager Alternative Strategies Fund | Annual Report 2018 |
Notes to Consolidated Financial Statements (continued)
August 31, 2018
In order to better define its contractual rights and to secure rights that will help the Fund mitigate its counterparty risk, the Fund may enter into an International Swaps and Derivatives Association, Inc. Master Agreement (ISDA Master Agreement) or similar agreement with its derivatives contract counterparties. An ISDA Master Agreement is an agreement between the Fund and a counterparty that governs over-the-counter derivatives and typically contains, among other things, collateral posting terms and netting provisions in the event of a default and/or termination event. Under an ISDA Master Agreement, the Fund may, under certain circumstances, offset with the counterparty certain derivative instrument’s payables and/or receivables with collateral held and/or posted and create one single net payment. The provisions of the ISDA Master Agreement typically permit a single net payment in the event of default (close-out netting), including the bankruptcy or insolvency of the counterparty. Note, however, that bankruptcy or insolvency laws of a particular jurisdiction may impose restrictions on or prohibitions against the right of offset or netting in bankruptcy, insolvency or other events.
Collateral (margin) requirements differ by type of derivative. Margin requirements are established by the clearinghouse or CCP for exchange-traded and centrally cleared derivatives. Brokers can ask for margin in excess of the minimum in certain circumstances. Collateral terms are contract specific for over-the-counter derivatives. For over-the-counter derivatives traded under an ISDA Master Agreement, the collateral requirements are typically calculated by netting the marked-to-market amount for each transaction under such agreement and comparing that amount to the value of any variation margin currently pledged by the Fund and/or the counterparty. Generally, the amount of collateral due from or to a party has to exceed a minimum transfer amount threshold (e.g., $250,000) before a transfer has to be made. To the extent amounts due to the Fund from its counterparties are not fully collateralized, contractually or otherwise, the Fund bears the risk of loss from counterparty nonperformance. The Fund may also pay interest expense on cash collateral received from the broker. Any interest expense paid by the Fund is shown on the Consolidated Statement of Operations. The Fund attempts to mitigate counterparty risk by only entering into agreements with counterparties that it believes have the financial resources to honor their obligations and by monitoring the financial stability of those counterparties.
Certain ISDA Master Agreements allow counterparties of over-the-counter derivatives transactions to terminate derivatives contracts prior to maturity in the event the Fund’s net asset value declines by a stated percentage over a specified time period or if the Fund fails to meet certain terms of the ISDA Master Agreement, which would cause the Fund to accelerate payment of any net liability owed to the counterparty. The Fund also has termination rights if the counterparty fails to meet certain terms of the ISDA Master Agreement. In determining whether to exercise such termination rights, the Fund would consider, in addition to counterparty credit risk, whether termination would result in a net liability owed from the counterparty.
For financial reporting purposes, the Fund does not offset derivative assets and derivative liabilities that are subject to netting arrangements in the Consolidated Statement of Assets and Liabilities.
Forward foreign currency exchange contracts
Forward foreign currency exchange contracts are over-the-counter agreements between two parties to buy and sell a currency at a set price on a future date. The Fund utilized forward foreign currency exchange contracts to hedge the currency exposure associated with some or all of the Fund’s securities, to shift foreign currency exposure back to U.S. dollars, to shift investment exposure from one currency to another and to generate total return through long and short currency positions versus the U.S. dollar. These instruments may be used for other purposes in future periods.
The values of forward foreign currency exchange contracts fluctuate daily with changes in foreign currency exchange rates. Changes in the value of these contracts are recorded as unrealized appreciation or depreciation until the contract is exercised or has expired. The Fund will realize a gain or loss when the forward foreign currency exchange contract is closed or expires.
The use of forward foreign currency exchange contracts does not eliminate fluctuations in the prices of the Fund’s portfolio securities. The risks of forward foreign currency exchange contracts include movement in the values of the foreign currencies relative to the U.S. dollar (or other foreign currencies) and the possibility that counterparties will not complete their contractual obligations, which may be in excess of the amount reflected, if any, in the Consolidated Statement of Assets and Liabilities.
Multi-Manager Alternative Strategies Fund | Annual Report 2018
| 67 |
Notes to Consolidated Financial Statements (continued)
August 31, 2018
Futures contracts
Futures contracts are exchange-traded and represent commitments for the future purchase or sale of an asset at a specified price on a specified date. The Fund bought and sold futures contracts to produce incremental earnings, to manage the duration and yield curve exposure of the Fund versus the benchmark, to manage exposure to movements in interest rates, to manage exposure to government bonds, to manage exposure to the securities market, to manage exposure to commodity markets, to manage exposure to currency markets and to gain commodity and currency exposure. These instruments may be used for other purposes in future periods. Upon entering into futures contracts, the Fund bears risks that it may not achieve the anticipated benefits of the futures contracts and may realize a loss. Additional risks include counterparty credit risk, the possibility of an illiquid market, and that a change in the value of the contract or option may not correlate with changes in the value of the underlying asset.
Upon entering into a futures contract, the Fund deposits cash or securities with the broker, known as a futures commission merchant (FCM), in an amount sufficient to meet the initial margin requirement. The initial margin deposit must be maintained at an established level over the life of the contract. Cash deposited as initial margin is recorded in the Consolidated Statement of Assets and Liabilities as margin deposits. Securities deposited as initial margin are designated in the Consolidated Portfolio of Investments. Subsequent payments (variation margin) are made or received by the Fund each day. The variation margin payments are equal to the daily change in the contract value and are recorded as variation margin receivable or payable and are offset in unrealized gains or losses. The Fund recognizes a realized gain or loss when the contract is closed or expires. Futures contracts involve, to varying degrees, risk of loss in excess of the variation margin disclosed in the Consolidated Statement of Assets and Liabilities.
Options contracts
Options are contracts which entitle the holder to purchase or sell securities or other identified assets at a specified price, or in the case of index option contracts, to receive or pay the difference between the index value and the strike price of the index option contract. Option contracts can be either exchange-traded or over-the-counter. The Fund purchased and wrote option contracts to decrease the Fund’s exposure to equity market risk and to increase return on investments, to protect gains and to facilitate buying and selling of securities for investments. These instruments may be used for other purposes in future periods. Completion of transactions for option contracts traded in the over-the-counter market depends upon the performance of the other party. Cash collateral may be collected or posted by the Fund to secure certain over-the-counter option contract trades. Cash collateral held or posted by the Fund for such option contract trades must be returned to the broker or the Fund upon closure, exercise or expiration of the contract.
Options contracts purchased are recorded as investments. When the Fund writes an options contract, the premium received is recorded as an asset and an amount equivalent to the premium is recorded as a liability in the Consolidated Statement of Assets and Liabilities and is subsequently adjusted to reflect the current fair value of the option written. Changes in the fair value of the written option are recorded as unrealized appreciation or depreciation until the contract is exercised or has expired. The Fund will realize a gain or loss when the option contract is closed or expires. When option contracts are exercised, the proceeds on sales for a written call or purchased put option contract, or the purchase cost for a written put or purchased call option contract, is adjusted by the amount of premium received or paid.
For over-the-counter options purchased, the Fund bears the risk of loss of the amount of the premiums paid plus the positive change in market values net of any collateral held by the Fund should the counterparty fail to perform under the contracts. Option contracts written by the Fund do not typically give rise to significant counterparty credit risk, as options written generally obligate the Fund and not the counterparty to perform. The risk in writing a call option contract is that the Fund gives up the opportunity for profit if the market price of the security increases above the strike price and the option contract is exercised. The risk in writing a put option contract is that the Fund may incur a loss if the market price of the security decreases below the strike price and the option contract is exercised. Exercise of a written option could result in the Fund purchasing or selling a security or foreign currency when it otherwise would not, or at a price different from the current market value. In purchasing and writing options, the Fund bears the risk of an unfavorable change in the value of the underlying instrument or the risk that the Fund may not be able to enter into a closing transaction due to an illiquid market.
| 68 | Multi-Manager Alternative Strategies Fund | Annual Report 2018 |
Notes to Consolidated Financial Statements (continued)
August 31, 2018
Swap contracts
Swap contracts are negotiated in the over-the-counter market and may be entered into as a bilateral contract or centrally cleared (centrally cleared swap contract). In a centrally cleared swap contract, immediately following execution of the swap contract with a broker, the swap contract is novated to a central counterparty (the CCP) and the CCP becomes the Fund’s counterparty to the centrally cleared swap contract. The Fund is required to deposit initial margin with the futures commission merchant (FCM), which pledges it through to the CCP in the form of cash or securities in an amount that varies depending on the size and risk profile of the particular swap contract. Securities deposited as initial margin are designated in the Consolidated Portfolio of Investments and cash deposited is recorded in the Consolidated Statement of Assets and Liabilities as margin deposits. Unlike a bilateral swap contract, for centrally cleared swap contracts, the Fund has minimal credit exposure to the FCM because the CCP stands between the Fund and the relevant buyer/seller on the other side of the contract. Swap contracts are marked-to-market daily and changes in value are recorded as unrealized appreciation (depreciation). The daily change in valuation of centrally cleared swap contracts, if any, is recorded as a receivable or payable for variation margin in the Consolidated Statement of Assets and Liabilities.
Entering into these contracts involves, to varying degrees, elements of interest, liquidity and counterparty credit risk in excess of the amounts recognized in the Consolidated Statement of Assets and Liabilities. Such risks involve the possibility that there may be unfavorable changes in interest rates, market conditions or other conditions, that it may be difficult to initiate a swap transaction or liquidate a position at an advantageous time or price which may result in significant losses, and that the FCM or CCP may not fulfill its obligation under the contract.
Total return swap contracts
The Fund entered into total return swap contracts to manage long or short exposure to the total return on a specified reference security in return for periodic payments based on a fixed or variable interest rate, to manage long or short exposure to the total return on a reference security index in return for periodic payments based on a fixed or variable interest rate and to get synthetic exposure to bond, commodity and equity index futures. These instruments may be used for other purposes in future periods. Total return swap contracts may be used to obtain exposure to an underlying reference security, instrument, or other asset or index or market without owning, taking physical custody of, or short selling any such security, instrument or asset in a market.
Total return swap contracts are valued daily, and the change in value is recorded as unrealized appreciation (depreciation) until the termination of the swap, at which time the Fund will realize a gain (loss). Periodic payments received (or made) by the Fund over the term of the contract are recorded as realized gains (losses). Total return swap contracts are subject to the risk associated with the investment in the underlying reference security, instrument or asset. The risk in the case of short total return swap contracts is unlimited based on the potential for unlimited increases in the market value of the underlying reference security, instrument or asset. This risk may be offset if the Fund holds any of the underlying reference security, instrument or asset. The risk in the case of long total return swap contracts is limited to the current notional amount of the total return swap contract.
Effects of derivative transactions in the financial statements
The following tables are intended to provide additional information about the effect of derivatives on the financial statements of the Fund, including: the fair value of derivatives by risk category and the location of those fair values in the Consolidated Statement of Assets and Liabilities; and the impact of derivative transactions over the period in the Consolidated Statement of Operations, including realized and unrealized gains (losses). The derivative instrument schedules following the Consolidated Portfolio of Investments present additional information regarding derivative instruments outstanding at the end of the period, if any.
Multi-Manager Alternative Strategies Fund | Annual Report 2018
| 69 |
Notes to Consolidated Financial Statements (continued)
August 31, 2018
The following table is a summary of the fair value of derivative instruments (not considered to be hedging instruments for accounting disclosure purposes) at August 31, 2018:
| | Asset derivatives | |
Risk exposure
category | Consolidated statement
of assets and liabilities
location | Fair value ($) |
| Equity risk | Net assets — unrealized appreciation on futures contracts | 2,815,726* |
| Equity risk | Investments, at value — Options Purchased | 111,858 |
| Equity risk | Net assets — unrealized appreciation on swap contracts | 58,877* |
| Foreign exchange risk | Unrealized appreciation on forward foreign currency exchange contracts | 7,281,384 |
| Foreign exchange risk | Net assets — unrealized appreciation on futures contracts | 963,244* |
| Interest rate risk | Net assets — unrealized appreciation on futures contracts | 565,008* |
| Interest rate risk | Net assets — unrealized appreciation on swap contracts | 156,699 |
| Commodity-related investment risk | Net assets — unrealized appreciation on futures contracts | 2,464,017* |
| Commodity-related investment risk | Net assets — unrealized appreciation on swap contracts | 349,656* |
| Total | | 14,766,469 |
| | Liability derivatives | |
Risk exposure
category | Consolidated statement
of assets and liabilities
location | Fair value ($) |
| Equity risk | Net assets — unrealized depreciation on futures contracts | 409,987* |
| Equity risk | Options contracts written, at value | 24,337 |
| Equity risk | Net assets — unrealized depreciation on swap contracts | 19,094* |
| Foreign exchange risk | Unrealized depreciation on forward foreign currency exchange contracts | 6,833,087 |
| Foreign exchange risk | Net assets — unrealized depreciation on futures contracts | 449,572* |
| Interest rate risk | Net assets — unrealized depreciation on futures contracts | 344,854* |
| Commodity-related investment risk | Net assets — unrealized depreciation on futures contracts | 166,499* |
| Commodity-related investment risk | Net assets — unrealized depreciation on swap contracts | 10,800* |
| Total | | 8,258,230 |
| * | Includes cumulative appreciation (depreciation) as reported in the tables following the Consolidated Portfolio of Investments. Only the current day’s variation margin is reported in receivables or payables in the Consolidated Statement of Assets and Liabilities. |
| 70 | Multi-Manager Alternative Strategies Fund | Annual Report 2018 |
Notes to Consolidated Financial Statements (continued)
August 31, 2018
The following table indicates the effect of derivative instruments (not considered to be hedging instruments for accounting disclosure purposes) in the Consolidated Statement of Operations for the year ended August 31, 2018:
| Amount of realized gain (loss) on derivatives recognized in income |
| Risk exposure category | Forward
foreign
currency
exchange
contracts
($) | Futures
contracts
($) | Options
contracts
written
($) | Options
contracts
purchased
($) | Swap
contracts
($) | Total
($) |
| Commodity-related investment risk | — | 4,534,581 | — | — | (1,053,061) | 3,481,520 |
| Equity risk | — | 332,557 | 1,539,901 | (872,449) | (35,685) | 964,324 |
| Foreign exchange risk | (252,021) | (5,171,437) | — | — | — | (5,423,458) |
| Interest rate risk | — | 1,799,831 | — | — | (1,304,804) | 495,027 |
| Total | (252,021) | 1,495,532 | 1,539,901 | (872,449) | (2,393,550) | (482,587) |
| |
| Change in unrealized appreciation (depreciation) on derivatives recognized in income |
| Risk exposure category | Forward
foreign
currency
exchange
contracts
($) | Futures
contracts
($) | Options
contracts
written
($) | Options
contracts
purchased
($) | Swap
contracts
($) | Total
($) |
| Commodity-related investment risk | — | 1,142,703 | — | — | 322,912 | 1,465,615 |
| Equity risk | — | 1,892,527 | (31,751) | (121,064) | 73,339 | 1,813,051 |
| Foreign exchange risk | (296,981) | (652,774) | — | — | — | (949,755) |
| Interest rate risk | — | 765,410 | — | — | 208,848 | 974,258 |
| Total | (296,981) | 3,147,866 | (31,751) | (121,064) | 605,099 | 3,303,169 |
The following table is a summary of the average outstanding volume by derivative instrument for the year ended August 31, 2018:
| Derivative instrument | Average notional
amounts ($)* |
| Futures contracts — long | 276,931,120 |
| Futures contracts — short | 597,666,133 |
| Derivative instrument | Average
value ($)* |
| Options contracts — purchased | 821,246 |
| Options contracts — written | (295,687) |
| Derivative instrument | Average unrealized
appreciation ($)* | Average unrealized
depreciation ($)* |
| Forward foreign currency exchange contracts | 9,275,878 | (9,300,047) |
| Total return swap contracts | 232,998 | (277,853) |
| * | Based on the ending quarterly outstanding amounts for the year ended August 31, 2018. |
Investments in senior loans
The Fund may invest in senior loan assignments. When the Fund purchases an assignment of a senior loan, the Fund typically has direct rights against the borrower; provided, however, that the Fund’s rights may be more limited than the lender from which it acquired the assignment and the Fund may be able to enforce its rights only through an administrative agent. Although certain senior loan assignments are secured by collateral, the Fund could experience delays or limitations in realizing such collateral or have its interest subordinated to other indebtedness of the obligor. In the event that the administrator or collateral agent of a loan becomes insolvent or enters into receivership or bankruptcy, the Fund may incur costs and delays in realizing payment or may suffer a loss of principal and/or interest. The risk of loss is greater for
Multi-Manager Alternative Strategies Fund | Annual Report 2018
| 71 |
Notes to Consolidated Financial Statements (continued)
August 31, 2018
unsecured or subordinated loans. In addition, senior loan assignments are vulnerable to market, economic or other conditions or events that may reduce the demand for senior loan assignments and certain senior loan assignments which were liquid when purchased, may become illiquid.
The Fund may enter into senior loan assignments where all or a portion of the loan may be unfunded. The Fund is obligated to fund these commitments at the borrower’s discretion. These commitments, if any, are generally traded and priced in the same manner as other senior loan securities and are disclosed as unfunded senior loan commitments in the Fund’s Portfolio of Investments with a corresponding payable for investments purchased. The Fund designates cash or liquid securities to cover these commitments.
Asset- and mortgage-backed securities
The Fund may invest in asset-backed and mortgage-backed securities. The maturity dates shown represent the original maturity of the underlying obligation. Actual maturity may vary based upon prepayment activity on these obligations. All, or a portion, of the obligation may be prepaid at any time because the underlying asset may be prepaid. As a result, decreasing market interest rates could result in an increased level of prepayment. An increased prepayment rate will have the effect of shortening the maturity of the security. Unless otherwise noted, the coupon rates presented are fixed rates.
Delayed delivery securities
The Fund may trade securities on other than normal settlement terms, including securities purchased or sold on a “when-issued” or "forward commitment" basis. This may increase risk to the Fund since the other party to the transaction may fail to deliver, which could cause the Fund to subsequently invest at less advantageous prices. The Fund designates cash or liquid securities in an amount equal to the delayed delivery commitment.
Mortgage dollar roll transactions
The Fund may enter into mortgage “dollar rolls” in which the Fund sells securities for delivery in the current month and simultaneously contracts with the same counterparty to repurchase similar but not identical securities (same type, coupon and maturity) on a specified future date. During the roll period, the Fund loses the right to receive principal and interest paid on the securities sold. However, the Fund will benefit because it receives negotiated amounts in the form of reductions of the purchase price for the future purchase plus the interest earned on the cash proceeds of the securities sold until the settlement date of the forward purchase. The Fund records the incremental difference between the forward purchase and sale of each forward roll as a realized gain or loss. Unless any realized gains exceed the income, capital appreciation, and gain or loss due to mortgage prepayments that would have been realized on the securities sold as part of the mortgage dollar roll, the use of this technique will diminish the investment performance of the Fund compared to what the performance would have been without the use of mortgage dollar rolls. All cash proceeds will be invested in instruments that are permissible investments for the Fund. The Fund identifies cash or liquid securities in an amount equal to the forward purchase price.
For financial reporting and tax purposes, the Fund treats “to be announced” mortgage dollar rolls as two separate transactions, one involving the purchase of a security and a separate transaction involving a sale. These transactions may increase the Fund’s portfolio turnover rate. The Fund does not currently enter into mortgage dollar rolls that are accounted for as financing transactions.
Mortgage dollar rolls involve the risk that the market value of the securities the Fund is obligated to repurchase may decline below the repurchase price, or that the counterparty may default on its obligations.
Interest only and principal only securities
The Fund may invest in Interest Only (IO) or Principal Only (PO) securities. IOs are stripped securities entitled to receive all of the security’s interest, but none of its principal. IOs are particularly sensitive to changes in interest rates and therefore subject to greater fluctuations in price than typical interest bearing debt securities. IOs are also subject to credit risk because the Fund may not receive all or part of the interest payments if the issuer, obligor, guarantor or counterparty defaults on its obligation. Payments received for IOs are included in interest income on the Consolidated Statement of Operations. Because no principal will be received at the maturity of an IO, adjustments are made to the cost of the security on a monthly basis until maturity. These adjustments are included in interest income on the Consolidated Statement of Operations. POs are stripped securities entitled to receive the principal from the underlying obligation, but not the interest. POs are particularly
| 72 | Multi-Manager Alternative Strategies Fund | Annual Report 2018 |
Notes to Consolidated Financial Statements (continued)
August 31, 2018
sensitive to changes in interest rates and therefore are subject to fluctuations in price. POs are also subject to credit risk because the Fund may not receive all or part of its principal if the issuer, obligor, guarantor or counterparty defaults on its obligation. The Fund may also invest in IO or PO stripped mortgage-backed securities. Payments received for POs are treated as reductions to the cost and par value of the securities.
Short sales
The Fund may sell a security it does not own in anticipation of a decline in the fair value of the security. When the Fund sells a security short, it must borrow the security sold short and deliver it to the broker-dealer through which it made the short sale. The Fund is required to maintain a margin account with the broker and to pledge assets to the broker as collateral for the borrowed security. Securities pledged as collateral are designated in the Consolidated Portfolio of Investments and the collateral is recorded as cash collateral held at broker in the Consolidated Statement of Assets and Liabilities. The Fund can purchase the same security at the current market price and deliver it to the broker to close out the short sale. The Fund is obligated to pay the broker a fee for borrowing the security. The fee is included in "Dividends and interest on securities sold short" in the Consolidated Statement of Operations and a short position is reported as a liability at fair value in the Consolidated Statement of Assets and Liabilities. The Fund must also pay the broker for any dividends accrued (recognized on ex-date) on the borrowed security. This amount is recorded as an expense in the Consolidated Statement of Operations. The Fund will record a gain if the security declines in value, and will realize a loss if the security appreciates. Such gain, limited to the price at which the Fund sold the security short, or such loss, potentially unlimited in size because the short position loses value as the market price of the security sold short increases, will be recognized upon the termination of a short sale.
Multi-Manager Alternative Strategies Fund | Annual Report 2018
| 73 |
Notes to Consolidated Financial Statements (continued)
August 31, 2018
Offsetting of assets and liabilities
The following table presents the Fund’s gross and net amount of assets and liabilities available for offset under netting arrangements as well as any related collateral received or pledged by the Fund as of August 31, 2018:
| | ANZ
Securities
($) | Barclays
($) | BMO
($) | Canadian
Imperial Bank
of Commerce
($) | Citi
($)(a) | Citi
($)(a) | Citi
($)(a) | Goldman
Sachs
($)(a) | Goldman
Sachs
($)(a) | Goldman
Sachs
($)(a) | Goldman
Sachs
($)(a) |
| Assets | | | | | | | | | | | |
| Forward foreign currency exchange contracts | 457,871 | - | 3,061 | 15,191 | 2,008,492 | 178,763 | - | 187,011 | - | 25,968 | 561,685 |
| Options purchased calls | - | - | - | - | - | - | - | 38,132 | - | - | - |
| Options purchased puts | - | - | - | - | - | - | - | 73,726 | - | - | - |
| OTC total return swap contracts (b) | - | - | - | - | - | - | - | - | 24,043 | - | - |
| OTC total return swap contracts on futures (b) | - | 156,699 | - | - | - | - | 349,656 | - | - | - | - |
| Total assets | 457,871 | 156,699 | 3,061 | 15,191 | 2,008,492 | 178,763 | 349,656 | 298,869 | 24,043 | 25,968 | 561,685 |
| Liabilities | | | | | | | | | | | |
| Forward foreign currency exchange contracts | 235,756 | - | - | 13,744 | 1,851,766 | 483,996 | - | 38,907 | - | 11,625 | 197,686 |
| Options contracts written | - | - | - | - | - | - | - | 24,337 | - | - | - |
| OTC total return swap contracts on futures (b) | - | - | - | - | - | - | 10,800 | - | - | - | - |
| Securities borrowed | - | - | - | - | - | - | - | 55,513,046 | - | - | - |
| Total liabilities | 235,756 | - | - | 13,744 | 1,851,766 | 483,996 | 10,800 | 55,576,290 | - | 11,625 | 197,686 |
| Total financial and derivative net assets | 222,115 | 156,699 | 3,061 | 1,447 | 156,726 | (305,233) | 338,856 | (55,277,421) | 24,043 | 14,343 | 363,999 |
| Total collateral received (pledged) (c) | - | - | - | - | - | - | - | (55,277,421) | - | - | - |
| Net amount (d) | 222,115 | 156,699 | 3,061 | 1,447 | 156,726 | (305,233) | 338,856 | - | 24,043 | 14,343 | 363,999 |
| (a) | Exposure can only be netted across transactions governed under the same master agreement with the same legal entity. |
| (b) | Over-the-Counter (OTC) Swap Contracts are presented at market value plus periodic payments receivable (payable), which is comprised of unrealized appreciation, unrealized depreciation, upfront payments and upfront receipts. |
| (c) | In some instances, the actual collateral received and/or pledged may be more than the amount shown due to overcollateralization. |
| (d) | Represents the net amount due from/(to) counterparties in the event of default. |
| 74 | Multi-Manager Alternative Strategies Fund | Annual Report 2018 |
Notes to Consolidated Financial Statements (continued)
August 31, 2018
Offsetting of assets and liabilities (continued)
| | HSBC
($) | JPMorgan
($)(a) | JPMorgan
($)(a) | Morgan
Stanley
($) | RBC
Capital
Markets
($) | Scotia
Capital
($) | Standard
Chartered
($) | State
Street
($) | TD
Securities
($) | UBS
($) | Total
($) |
| Assets | | | | | | | | | | | |
| Forward foreign currency exchange contracts | 195,587 | 3,013,023 | 40,243 | 19,337 | 63,065 | - | 121,031 | 148,792 | 22,182 | 220,082 | 7,281,384 |
| Options purchased calls | - | - | - | - | - | - | - | - | - | - | 38,132 |
| Options purchased puts | - | - | - | - | - | - | - | - | - | - | 73,726 |
| OTC total return swap contracts (b) | - | - | - | - | - | - | - | - | - | - | 24,043 |
| OTC total return swap contracts on futures (b) | - | 34,834 | - | - | - | - | - | - | - | - | 541,189 |
| Total assets | 195,587 | 3,047,857 | 40,243 | 19,337 | 63,065 | - | 121,031 | 148,792 | 22,182 | 220,082 | 7,958,474 |
| Liabilities | | | | | | | | | | | |
| Forward foreign currency exchange contracts | 202,941 | 2,781,011 | 263,085 | 56,609 | 49,492 | 3,660 | 82,407 | 379,400 | 30,102 | 150,900 | 6,833,087 |
| Options contracts written | - | - | - | - | - | - | - | - | - | - | 24,337 |
| OTC total return swap contracts on futures (b) | - | 19,094 | - | - | - | - | - | - | - | - | 29,894 |
| Securities borrowed | - | - | - | - | - | - | - | - | - | - | 55,513,046 |
| Total liabilities | 202,941 | 2,800,105 | 263,085 | 56,609 | 49,492 | 3,660 | 82,407 | 379,400 | 30,102 | 150,900 | 62,400,364 |
Total financial and derivative net
assets | (7,354) | 247,752 | (222,842) | (37,272) | 13,573 | (3,660) | 38,624 | (230,608) | (7,920) | 69,182 | (54,441,890) |
| Total collateral received (pledged) (c) | - | - | - | - | - | - | - | - | - | - | (55,277,421) |
| Net amount (d) | (7,354) | 247,752 | (222,842) | (37,272) | 13,573 | (3,660) | 38,624 | (230,608) | (7,920) | 69,182 | 835,531 |
Multi-Manager Alternative Strategies Fund | Annual Report 2018
| 75 |
Notes to Consolidated Financial Statements (continued)
August 31, 2018
Security transactions
Security transactions are accounted for on the trade date. Cost is determined and gains (losses) are based upon the specific identification method for both financial statement and federal income tax purposes.
The trade date for senior loans purchased in the primary market is the date on which the loan is allocated. The trade date for senior loans purchased in the secondary market is the date on which the transaction is entered into.
Income recognition
Interest income is recorded on an accrual basis. Market premiums and discounts, including original issue discounts, are amortized and accreted, respectively, over the expected life of the security on all debt securities, unless otherwise noted. The Fund classifies gains and losses realized on prepayments received on mortgage-backed securities as adjustments to interest income.
The Fund may place a debt security on non-accrual status and reduce related interest income when it becomes probable that the interest will not be collected and the amount of uncollectible interest can be reasonably estimated. A defaulted debt security is removed from non-accrual status when the issuer resumes interest payments or when collectibility of interest is reasonably assured.
Corporate actions and dividend income are generally recorded net of any non-reclaimable tax withholdings, on the ex-dividend date or upon receipt of ex-dividend notification in the case of certain foreign securities.
The Fund may receive distributions from holdings in equity securities, business development companies (BDCs), exchange-traded funds (ETFs), limited partnerships (LPs), other regulated investment companies (RICs), and real estate investment trusts (REITs), which report information on the tax character of their distributions annually. These distributions are allocated to dividend income, capital gain and return of capital based on actual information reported. Return of capital is recorded as a reduction of the cost basis of securities held. If the Fund no longer owns the applicable securities, return of capital is recorded as a realized gain. With respect to REITs, to the extent actual information has not yet been reported, estimates for return of capital are made by the Fund’s management. Management’s estimates are subsequently adjusted when the actual character of the distributions is disclosed by the REITs, which could result in a proportionate change in return of capital to shareholders.
Awards from class action litigation are recorded as a reduction of cost basis if the Fund still owns the applicable securities on the payment date. If the Fund no longer owns the applicable securities, the proceeds are recorded as realized gains.
The Fund may receive other income from senior loans, including amendment fees, consent fees and commitment fees. These fees are recorded as income when received by the Fund. These amounts are included in Interest Income in the Statement of Operations.
Expenses
General expenses of the Trust are allocated to the Fund and other funds of the Trust based upon relative net assets or other expense allocation methodologies determined by the nature of the expense. Expenses directly attributable to the Fund are charged to the Fund. Expenses directly attributable to a specific class of shares are charged to that share class.
Determination of class net asset value
All income, expenses (other than class-specific expenses, which are charged to that share class, as shown in the Consolidated Statement of Operations) and realized and unrealized gains (losses) are allocated to each class of the Fund on a daily basis, based on the relative net assets of each class, for purposes of determining the net asset value of each class.
| 76 | Multi-Manager Alternative Strategies Fund | Annual Report 2018 |
Notes to Consolidated Financial Statements (continued)
August 31, 2018
Federal income tax status
The Fund intends to qualify each year as a regulated investment company under Subchapter M of the Internal Revenue Code, as amended, and will distribute substantially all of its investment company taxable income and net capital gain, if any, for its tax year, and as such will not be subject to federal income taxes. In addition, the Fund intends to distribute in each calendar year substantially all of its ordinary income, capital gain net income and certain other amounts, if any, such that the Fund should not be subject to federal excise tax. Therefore, no federal income or excise tax provision is recorded.
Foreign taxes
The Fund may be subject to foreign taxes on income, gains on investments or currency repatriation, a portion of which may be recoverable. The Fund will accrue such taxes and recoveries, as applicable, based upon its current interpretation of tax rules and regulations that exist in the markets in which it invests.
Realized gains in certain countries may be subject to foreign taxes at the Fund level, based on statutory rates. The Fund accrues for such foreign taxes on realized and unrealized gains at the appropriate rate for each jurisdiction, as applicable. The amount, if any, is disclosed as a liability on the Consolidated Statement of Assets and Liabilities.
Distributions to shareholders
Distributions from net investment income, if any, are declared and paid annually. Net realized capital gains, if any, are distributed at least annually. Income distributions and capital gain distributions are determined in accordance with federal income tax regulations, which may differ from GAAP.
Guarantees and indemnifications
Under the Trust’s organizational documents and, in some cases, by contract, its officers and trustees are indemnified against certain liabilities arising out of the performance of their duties to the Trust or its funds. In addition, certain of the Fund’s contracts with its service providers contain general indemnification clauses. The Fund’s maximum exposure under these arrangements is unknown since the amount of any future claims that may be made against the Fund cannot be determined, and the Fund has no historical basis for predicting the likelihood of any such claims.
Recent accounting pronouncement
Accounting Standards Update 2017-08 Premium Amortization on Purchased Callable Debt Securities
In March 2017, the Financial Accounting Standards Board issued Accounting Standards Update (ASU) No. 2017-08 Premium Amortization on Purchased Callable Debt Securities. ASU No. 2017-08 updates the accounting standards to shorten the amortization period for certain purchased callable debt securities, held at a premium, to be amortized to the earliest call date. The update applies to securities with explicit, noncontingent call features that are callable at fixed prices and on preset dates. The standard is effective for annual periods beginning after December 15, 2018 and interim periods within those fiscal years. At this time, management is evaluating the implication of this guidance and the impact it will have on the financial statement amounts and footnote disclosures, if any.
Note 3. Fees and other transactions with affiliates
Management services fees
The Fund has entered into a Management Agreement with Columbia Management Investment Advisers, LLC (the Investment Manager), a wholly-owned subsidiary of Ameriprise Financial, Inc. (Ameriprise Financial). Under the Management Agreement, the Investment Manager provides the Fund with investment research and advice, as well as administrative and accounting services. The Investment Manager is responsible for the ultimate oversight of investments made by the Fund. The Fund’s subadvisers (see Subadvisory agreement below) have the primary responsibility for the day-to-day portfolio management of their portion of the Fund. The management services fee is an annual fee that is equal to a percentage of the Fund’s daily net assets that declines from 1.10% to 0.95% as the Fund’s net assets increase. The effective management services fee rate for the year ended August 31, 2018 was 1.09% of the Fund’s average daily net assets.
Multi-Manager Alternative Strategies Fund | Annual Report 2018
| 77 |
Notes to Consolidated Financial Statements (continued)
August 31, 2018
Subadvisory agreement
The Investment Manager has entered into Subadvisory Agreements with AQR Capital Management, LLC, Manulife Asset Management (US) LLC, TCW Investment Management Company LLC and Water Island Capital, LLC, each of which subadvises a portion of the assets of the Fund. Effective May 23, 2018, the Investment Manager has entered into a Subadvisory Agreement with AlphaSimplex Group, LLC to subadvise a portion of the assets of the Fund. New investments in the Fund, net of any redemptions, are allocated in accordance with the Investment Manager’s determination, subject to the oversight of the Fund’s Board of Trustees. Each subadviser’s proportionate share of investments in the Fund will vary due to market fluctuations. The Investment Manager compensates each subadviser to manage the investment of the Fund’s assets.
Compensation of board members
Members of the Board of Trustees who are not officers or employees of the Investment Manager or Ameriprise Financial are compensated for their services to the Fund as disclosed in the Consolidated Statement of Operations. These members of the Board of Trustees may participate in a Deferred Compensation Plan (the Plan) which may be terminated at any time. Obligations of the Plan will be paid solely out of the Fund’s assets, and all amounts payable under the Plan constitute a general unsecured obligation of the Fund.
Compensation of Chief Compliance Officer
The Board of Trustees has appointed a Chief Compliance Officer to the Fund in accordance with federal securities regulations. As disclosed in the Consolidated Statement of Operations, a portion of the Chief Compliance Officer’s total compensation is allocated to the Fund, along with other allocations to affiliated funds governed by the Board of Trustees, based on relative net assets.
Transfer agency fees
Under a Transfer and Dividend Disbursing Agent Agreement, Columbia Management Investment Services Corp. (the Transfer Agent), an affiliate of the Investment Manager and a wholly-owned subsidiary of Ameriprise Financial, is responsible for providing transfer agency services to the Fund. The Transfer Agent has contracted with DST Asset Manager Solutions, Inc. (DST) to serve as sub-transfer agent. The Transfer Agent pays the fees of DST for services as sub-transfer agent and DST is not entitled to reimbursement for such fees from the Fund (with the exception of out-of-pocket fees).
The Fund pays the Transfer Agent a monthly transfer agency fee based on the number or the average value of accounts, depending on the type of account. In addition, the Fund pays the Transfer Agent a fee for shareholder services based on the number of accounts or on a percentage of the average aggregate value of the Fund’s shares maintained in omnibus accounts up to the lesser of the amount charged by the financial intermediary or a cap established by the Board of Trustees from time to time.
The Transfer Agent also receives compensation from the Fund for various shareholder services and reimbursements for certain out-of-pocket fees.
For the year ended August 31, 2018, the Fund’s effective transfer agency fee rates as a percentage of average daily net assets of each class were as follows:
| | Effective rate (%) |
| Class A | 0.11 |
| Institutional Class | 0.11 |
Distribution and service fees
The Fund has entered into an agreement with Columbia Management Investment Distributors, Inc. (the Distributor), an affiliate of the Investment Manager and a wholly-owned subsidiary of Ameriprise Financial, for distribution and shareholder services. The Board of Trustees has approved, and the Fund has adopted, distribution and shareholder service plans (the Plans) applicable to certain share classes, which set the distribution and service fees for the Fund. These fees are calculated daily and are intended to compensate the Distributor and/or eligible selling and/or servicing agents for selling shares of the Fund and providing services to investors.
| 78 | Multi-Manager Alternative Strategies Fund | Annual Report 2018 |
Notes to Consolidated Financial Statements (continued)
August 31, 2018
The Fund may pay distribution fee of up to 0.25% of the Fund’s average daily net assets attributable to Class A shares and a service fee of up to 0.25% of the Fund’s average daily net assets attributable to Class A shares, provided that the aggregate fee shall not exceed 0.25% of the Fund’s average daily net assets attributable to Class A shares.
Expenses waived/reimbursed by the Investment Manager and its affiliates
The Investment Manager and certain of its affiliates have contractually agreed to waive fees and/or reimburse expenses (excluding certain fees and expenses described below) for the period(s) disclosed below, unless sooner terminated at the sole discretion of the Board of Trustees, so that the Fund’s net operating expenses, after giving effect to fees waived/expenses reimbursed and any balance credits and/or overdraft charges from the Fund’s custodian, do not exceed the following annual rate(s) as a percentage of the class’ average daily net assets:
| | January 1, 2018
through
December 31, 2018 | Prior to
January 1, 2018 |
| Class A | 1.88% | 1.82% |
| Institutional Class | 1.63 | 1.57 |
Under the agreement governing these fee waivers and/or expense reimbursement arrangements, the following fees and expenses are excluded from the waiver/reimbursement commitment, and therefore will be paid by the Fund, if applicable: taxes (including foreign transaction taxes), expenses associated with investments in affiliated and non-affiliated pooled investment vehicles (including mutual funds and exchange-traded funds), transaction costs and brokerage commissions, costs related to any securities lending program, dividend expenses associated with securities sold short, inverse floater program fees and expenses, transaction charges and interest on borrowed money, interest, infrequent and/or unusual expenses and any other expenses the exclusion of which is specifically approved by the Board of Trustees. This agreement may be modified or amended only with approval from the Investment Manager, certain of its affiliates and the Fund. Any fees waived and/or expenses reimbursed under the expense reimbursement arrangements described above are not recoverable by the Investment Manager or its affiliates in future periods.
Note 4. Federal tax information
The timing and character of income and capital gain distributions are determined in accordance with income tax regulations, which may differ from GAAP because of temporary or permanent book to tax differences.
At August 31, 2018, these differences were primarily due to differing treatment for deferral/reversal of wash sale losses, passive foreign investment company (PFIC) holdings, derivative investments, tax straddles, swap investments, capital loss carryforwards, trustees’ deferred compensation, principal and/or interest from fixed income securities, foreign currency transactions, foreign capital gains tax, non-deductible expenses, investments in partnerships, investments in commodity subsidiaries and constructive sales of appreciated financial positions. To the extent these differences were permanent, reclassifications were made among the components of the Fund’s net assets in the Statement of Assets and Liabilities. Temporary differences do not require reclassifications.
In the Statement of Assets and Liabilities the following reclassifications were made:
Excess of distributions
over net investment
income ($) | Accumulated
net realized
(loss) ($) | Paid in
capital ($) |
| (4,428,153) | 1,427,562 | 3,000,591 |
Net investment income (loss) and net realized gains (losses), as disclosed in the Consolidated Statement of Operations, and net assets were not affected by this reclassification.
For the years ended August 31, 2018 and August 31, 2017, there were no distributions.
Multi-Manager Alternative Strategies Fund | Annual Report 2018
| 79 |
Notes to Consolidated Financial Statements (continued)
August 31, 2018
At August 31, 2018, the components of distributable earnings on a tax basis were as follows:
Undistributed
ordinary income ($) | Undistributed
long-term
capital gains ($) | Capital loss
carryforwards ($) | Net unrealized
(depreciation) ($) |
| 1,846,242 | — | (43,826,754) | (39,299,000) |
At August 31, 2018, the cost of all investments for federal income tax purposes along with the aggregate gross unrealized appreciation and depreciation based on that cost was:
Federal
tax cost ($) | Gross unrealized
appreciation ($) | Gross unrealized
(depreciation) ($) | Net unrealized
(depreciation) ($) |
| 595,215,034 | 16,699,660 | (55,998,660) | (39,299,000) |
Tax cost of investments and unrealized appreciation/(depreciation) may also include timing differences that do not constitute adjustments to tax basis.
The following capital loss carryforwards, determined at August 31, 2018, may be available to reduce taxable income arising from future net realized gains on investments, if any, to the extent permitted by the Internal Revenue Code. Capital loss carryforwards with no expiration are required to be utilized prior to any capital losses which carry an expiration date. As a result of this ordering rule, capital loss carryforwards which carry an expiration date may be more likely to expire unused. In addition, for the year ended August 31, 2018, capital loss carryforwards utilized, expired unused and permanently lost, if any, were as follows:
| 2019 ($) | No expiration
short-term ($) | No expiration
long-term ($) | Total ($) | Utilized ($) | Expired ($) | Permanently
lost ($) |
| — | 9,364,945 | 34,461,809 | 43,826,754 | 1,881,681 | — | — |
Management of the Fund has concluded that there are no significant uncertain tax positions in the Fund that would require recognition in the financial statements. However, management’s conclusion may be subject to review and adjustment at a later date based on factors including, but not limited to, new tax laws, regulations, and administrative interpretations (including relevant court decisions). Generally, the Fund’s federal tax returns for the prior three fiscal years remain subject to examination by the Internal Revenue Service.
Note 5. Portfolio information
The cost of purchases and proceeds from sales of securities, excluding short-term investments and derivatives, if any, aggregated to $1,201,591,521 and $1,125,666,030, respectively, for the year ended August 31, 2018, of which $10,429,030 and $6,617,289, respectively, were U.S. government securities. The amount of purchase and sale activity impacts the portfolio turnover rate reported in the Consolidated Financial Highlights.
Note 6. Affiliated money market fund
The Fund invests in Columbia Short-Term Cash Fund, an affiliated money market fund established for the exclusive use by the Fund and other affiliated funds (the Affiliated MMF). The income earned by the Fund from such investments is included as Dividends - affiliated issuers in the Consolidated Statement of Operations. As an investing fund, the Fund indirectly bears its proportionate share of the expenses of the Affiliated MMF. The Affiliated MMF prices its shares with a floating net asset value. In addition, the Board of Trustees of the Affiliated MMF may impose a fee on redemptions (sometimes referred to as a liquidity fee) or temporarily suspend redemptions (sometimes referred to as imposing a redemption gate) in the event its liquidity falls below regulatory limits.
Note 7. Interfund lending
Pursuant to an exemptive order granted by the Securities and Exchange Commission, the Fund participates in a program (the Interfund Program) allowing each participating Columbia Fund (each, a Participating Fund) to lend money directly to and, except for closed-end funds and money market funds, borrow money directly from other Participating Funds for temporary purposes. The amounts eligible for borrowing and lending under the Interfund Program are subject to certain restrictions.
| 80 | Multi-Manager Alternative Strategies Fund | Annual Report 2018 |
Notes to Consolidated Financial Statements (continued)
August 31, 2018
Interfund loans are subject to the risk that the borrowing fund could be unable to repay the loan when due, and a delay in repayment to the lending fund could result in lost opportunities and/or additional lending costs. The exemptive order is subject to conditions intended to mitigate conflicts of interest arising from the Investment Manager’s relationship with each Participating Fund.
The Fund did not borrow or lend money under the Interfund Program during the year ended August 31, 2018.
Note 8. Line of credit
The Fund has access to a revolving credit facility with a syndicate of banks led by Citibank, N.A., HSBC Bank USA, N.A. and JPMorgan Chase Bank, N.A. whereby the Fund may borrow for the temporary funding of shareholder redemptions or for other temporary or emergency purposes. The credit facility, which is a collective agreement between the Fund and certain other funds managed by the Investment Manager, severally and not jointly, permits collective borrowings up to $1 billion. Interest is charged to each participating fund based on its borrowings at a rate equal to the higher of (i) the overnight federal funds rate plus 1.00% or (ii) the one-month LIBOR rate plus 1.00%. Each borrowing under the credit facility matures no later than 60 days after the date of borrowing. The Fund also pays a commitment fee equal to its pro rata share of the amount of the credit facility at a rate of 0.15% per annum. The commitment fee is included in other expenses in the Consolidated Statement of Operations. This agreement expires annually in December unless extended or renewed.
The Fund had no borrowings during the year ended August 31, 2018.
Note 9. Significant risks
Shareholder concentration risk
At August 31, 2018, affiliated shareholders of record owned 100.0% of the outstanding shares of the Fund in one or more accounts. Subscription and redemption activity by concentrated accounts may have a significant effect on the operations of the Fund. In the case of a large redemption, the Fund may be forced to sell investments at inopportune times, including its liquid positions, which may result in Fund losses and the Fund holding a higher percentage of less liquid positions. Large redemptions could result in decreased economies of scale and increased operating expenses for non-redeeming Fund shareholders.
Credit risk
Credit risk is the risk that the value of debt securities in the Fund’s portfolio may decline because the issuer may default and fail to pay interest or repay principal when due. Rating agencies assign credit ratings to debt securities to indicate their credit risk. Lower rated or unrated debt securities held by the Fund may present increased credit risk as compared to higher-rated debt securities.
Derivatives risk
Losses involving derivative instruments may be substantial, because a relatively small price movement in the underlying security(ies), commodity, currency or index or other instrument or asset may result in a substantial loss for the Fund. In addition to the potential for increased losses, the use of derivative instruments may lead to increased volatility within the Fund. Derivatives will typically increase the Fund’s exposure to principal risks to which it is otherwise exposed, and may expose the Fund to additional risks, including correlation risk, counterparty risk, hedging risk, leverage risk and liquidity risk.
Interest rate risk
Interest rate risk is the risk of losses attributable to changes in interest rates. In general, if prevailing interest rates rise, the values of debt securities tend to fall, and if interest rates fall, the values of debt securities tend to rise. Actions by governments and central banking authorities can result in increases in interest rates. Increasing interest rates may negatively affect the value of debt securities held by the Fund, resulting in a negative impact on the Fund’s performance and net asset value per share. In general, the longer the maturity or duration of a debt security, the greater its sensitivity to changes in interest rates.
Multi-Manager Alternative Strategies Fund | Annual Report 2018
| 81 |
Notes to Consolidated Financial Statements (continued)
August 31, 2018
Liquidity risk
Liquidity risk is the risk associated with a lack of marketability of investments which may make it difficult to sell the investment at a desirable time or price. Changing regulatory, market or other conditions or environments (for example, the interest rate or credit environments) may adversely affect the liquidity of the Fund’s investments. The Fund may have to accept a lower selling price for the holding, sell other investments, or forego another, more appealing investment opportunity. Generally, the less liquid the market at the time the Fund sells a portfolio investment, the greater the risk of loss or decline of value to the Fund. A less liquid market can lead to an increase in Fund redemptions, which may negatively impact Fund performance and net asset value per share, including, for example, if the Fund is forced to sell securities in a down market.
Non-diversification risk
A non-diversified fund is permitted to invest a greater percentage of its total assets in fewer issuers than a diversified fund. The Fund may, therefore, have a greater risk of loss from a few issuers than a similar fund that invests more broadly.
Short selling risk
Leverage occurs when the Fund increases its assets available for investment using borrowings, short sales, derivatives, or similar instruments or techniques. Because short sales involve borrowing securities and then selling them, the Fund’s short sales effectively leverage the Fund’s assets. The Fund’s assets that are used as collateral to secure the Fund’s obligations to return the securities sold short may decrease in value while the short positions are outstanding, which may force the Fund to use its other assets to increase the collateral. Leverage can create an interest expense that may lower the Fund’s overall returns. Leverage presents the opportunity for increased net income and capital gains, but may also exaggerate the Fund’s volatility and risk of loss. There can be no guarantee that a leveraging strategy will be successful.
Note 10. Subsequent events
Management has evaluated the events and transactions that have occurred through the date the financial statements were issued and noted no items requiring adjustment of the financial statements or additional disclosure.
Note 11. Information regarding pending and settled legal proceedings
Ameriprise Financial and certain of its affiliates have historically been involved in a number of legal, arbitration and regulatory proceedings, including routine litigation, class actions, and governmental actions, concerning matters arising in connection with the conduct of their business activities. Ameriprise Financial believes that the Fund is not currently the subject of, and that neither Ameriprise Financial nor any of its affiliates are the subject of, any pending legal, arbitration or regulatory proceedings that are likely to have a material adverse effect on the Fund or the ability of Ameriprise Financial or its affiliates to perform under their contracts with the Fund. Ameriprise Financial is required to make quarterly (10-Q), annual (10-K) and, as necessary, 8-K filings with the Securities and Exchange Commission (SEC) on legal and regulatory matters that relate to Ameriprise Financial and its affiliates. Copies of these filings may be obtained by accessing the SEC website at www.sec.gov.
There can be no assurance that these matters, or the adverse publicity associated with them, will not result in increased Fund redemptions, reduced sale of Fund shares or other adverse consequences to the Fund. Further, although we believe proceedings are not likely to have a material adverse effect on the Fund or the ability of Ameriprise Financial or its affiliates to perform under their contracts with the Fund, these proceedings are subject to uncertainties and, as such, we are unable to estimate the possible loss or range of loss that may result. An adverse outcome in one or more of these proceedings could result in adverse judgments, settlements, fines, penalties or other relief that could have a material adverse effect on the consolidated financial condition or results of operations of Ameriprise Financial.
| 82 | Multi-Manager Alternative Strategies Fund | Annual Report 2018 |
Report of Independent Registered Public Accounting Firm
To the Board of Trustees of Columbia Funds Series Trust I and Shareholders of Multi-Manager Alternative Strategies Fund
Opinion on the Financial Statements
We have audited the accompanying consolidated statement of assets and liabilities, including the consolidated portfolio of investments, of Multi-Manager Alternative Strategies Fund (one of the funds constituting Columbia Funds Series Trust I, hereafter referred to as the “Fund”) as of August 31, 2018, the related consolidated statement of operations for the year ended August 31, 2018, the consolidated statement of changes in net assets for each of the two years in the period ended August 31, 2018, including the related notes, and the financial highlights for each of the periods indicated therein (collectively referred to as the “consolidated financial statements”). In our opinion, the financial statements present fairly, in all material respects, the financial position of the Fund as of August 31, 2018, the results of its operations for the year then ended, the changes in its net assets for each of the two years in the period ended August 31, 2018 and the financial highlights for each of the periods indicated therein in conformity with accounting principles generally accepted in the United States of America.
Basis for Opinion
These consolidated financial statements are the responsibility of the Fund’s management. Our responsibility is to express an opinion on the Fund’s consolidated financial statements based on our audits. We are a public accounting firm registered with the Public Company Accounting Oversight Board (United States) (“PCAOB”) and are required to be independent with respect to the Fund in accordance with the U.S. federal securities laws and the applicable rules and regulations of the Securities and Exchange Commission and the PCAOB.
We conducted our audits of these consolidated financial statements in accordance with the standards of the PCAOB. Those standards require that we plan and perform the audit to obtain reasonable assurance about whether the financial statements are free of material misstatement, whether due to error or fraud.
Our audits included performing procedures to assess the risks of material misstatement of the consolidated financial statements, whether due to error or fraud, and performing procedures that respond to those risks. Such procedures included examining, on a test basis, evidence regarding the amounts and disclosures in the consolidated financial statements. Our audits also included evaluating the accounting principles used and significant estimates made by management, as well as evaluating the overall presentation of the consolidated financial statements. Our procedures included confirmation of securities owned as of August 31, 2018, by correspondence with the custodian, transfer agent, agent banks, and brokers; when replies were not received from brokers, we performed other audit procedures. We believe that our audits provide a reasonable basis for our opinion.
/s/PricewaterhouseCoopers LLP
Minneapolis, Minnesota
October 24, 2018
We have served as the auditor of one or more investment companies within the Columbia Funds Complex since 1977.
Multi-Manager Alternative Strategies Fund | Annual Report 2018
| 83 |
Shareholders elect the Board that oversees the Fund’s operations. The Board appoints officers who are responsible for day-to-day business decisions based on policies set by the Board. The following table provides basic biographical information about the Fund’s Trustees, including their principal occupations during the past five years, although specific titles for individuals may have varied over the period. The year set forth beneath Length of Service in the table below is the year in which the Trustee was first appointed or elected as Trustee to any Fund currently in the Columbia Funds Complex or a predecessor thereof. Under current Board policy, members serve terms of indefinite duration.
Independent trustees
| Name, address, year of birth | Position held with the Trust and length of service | Principal occupation(s) during the past five years and other relevant professional experience | Number of Funds in the Columbia Fund Complex overseen | Other directorships held by Trustee during the past five years |
Janet Langford Carrig
c/o Columbia Management
Investment Advisers, LLC
225 Franklin Street
Mail Drop BX32 05228
Boston, MA 02110
1957 | Trustee
1996 | Senior Vice President, General Counsel and Corporate Secretary, ConocoPhillips (independent energy company) since September 2007 | 69 | None |
Douglas A. Hacker
c/o Columbia Management
Investment Advisers, LLC
225 Franklin Street
Mail Drop BX32 05228
Boston, MA 02110
1955 | Trustee and Chairman of the Board
1996 | Independent business executive since May 2006; Executive Vice President — Strategy of United Airlines from December 2002 to May 2006; President of UAL Loyalty Services (airline marketing company) from September 2001 to December 2002; Executive Vice President and Chief Financial Officer of United Airlines from July 1999 to September 2001 | 69 | Spartan Nash Company, (food distributor); Nash Finch Company (food distributor) from 2005 to 2013; Aircastle Limited (aircraft leasing); SeaCube Container Leasing Ltd. (container leasing) from 2010 to 2013; and Travelport Worldwide Limited (travel information technology) |
Nancy T. Lukitsh
c/o Columbia Management
Investment Advisers, LLC
225 Franklin Street
Mail Drop BX32 05228
Boston, MA 02110
1956 | Trustee
2011 | Senior Vice President, Partner and Director of Marketing, Wellington Management Company, LLP (investment adviser) from 1997 to 2010; Chair, Wellington Management Portfolios (commingled non-U.S. investment pools) from 2007 to 2010; Director, Wellington Trust Company, NA and other Wellington affiliates from 1997 to 2010 | 69 | None |
David M. Moffett
c/o Columbia Management
Investment Advisers, LLC
225 Franklin Street
Mail Drop BX32 05228
Boston, MA 02110
1952 | Trustee
2011 | Retired. Consultant to Bridgewater and Associates | 69 | Director, CSX Corporation (transportation suppliers); Genworth Financial, Inc. (financial and insurance products and services); PayPal Holdings Inc. (payment and data processing services); Trustee, University of Oklahoma Foundation; former Director, eBay Inc. (online trading community), 2007-2015; and former Director, CIT Bank, CIT Group Inc. (commercial and consumer finance), 2010-2016 |
| 84 | Multi-Manager Alternative Strategies Fund | Annual Report 2018 |
TRUSTEES AND OFFICERS (continued)
Independent trustees (continued)
| Name, address, year of birth | Position held with the Trust and length of service | Principal occupation(s) during the past five years and other relevant professional experience | Number of Funds in the Columbia Fund Complex overseen | Other directorships held by Trustee during the past five years |
John J. Neuhauser
c/o Columbia Management
Investment Advisers, LLC
225 Franklin Street
Mail Drop BX32 05228
Boston, MA 02110
1943 | Trustee
1984 | President, Saint Michael’s College since August 2007; Director or Trustee of several non-profit organizations, including University of Vermont Medical Center; Academic Vice President and Dean of Faculties, Boston College from August 1999 to October 2005; University Professor, Boston College from November 2005 to August 2007 | 69 | Liberty All-Star Equity Fund and Liberty All- Star Growth Fund (closed-end funds) |
Patrick J. Simpson
c/o Columbia Management
Investment Advisers, LLC
225 Franklin Street
Mail Drop BX32 05228
Boston, MA 02110
1944 | Trustee
2000 | Of Counsel, Perkins Coie LLP (law firm) since 2015; Partner, Perkins Coie LLP from 1988 to 2014 | 69 | None |
Anne-Lee Verville
c/o Columbia Management
Investment Advisers, LLC
225 Franklin Street
Mail Drop BX32 05228
Boston, MA 02110
1945 | Trustee
1998 | Retired. General Manager, Global Education Industry from 1994 to 1997, President – Application Systems Division from 1991 to 1994, Chief Financial Officer – US Marketing & Services from 1988 to 1991, and Chief Information Officer from 1987 to 1988, IBM Corporation (computer and technology) | 69 | Enesco Group, Inc. (producer of giftware and home and garden decor products) from 2001 to 2006 |
Consultants to the Independent Trustees*
| Name, address, year of birth | Position held with the Trust and length of service | Principal occupation(s) during the past five years and other relevant professional experience | Number of Funds in the Columbia Funds complex overseen | Other directorships held by Trustee during the past five years |
J. Kevin Connaughton
c/o Columbia
Management Investment
Advisers, LLC,
225 Franklin Street
Mail Drop BX32 05228,
Boston, MA 02110
1964 | Independent Trustee Consultant
2016 | Independent Trustee Consultant, Columbia Funds since March 2016; Adjunct Professor of Finance, Bentley University since November 2017; Managing Director and General Manager of Mutual Fund Products, Columbia Management Investment Advisers, LLC from May 2010 to February 2015; President, Columbia Funds from 2009 to 2015; and senior officer of Columbia Funds and affiliated funds from 2003 to 2015 | 69 | Director, The Autism Project since March 2015; former Trustee, New Century Portfolios, March 2015-December 2017; formerly on Board of Governors, Gateway Healthcare, January 2016 – December 2017 |
Natalie A. Trunow
c/o Columbia
Management Investment
Advisers, LLC,
225 Franklin Street
Mail Drop BX32 05228,
Boston, MA 02110
1967 | Independent Trustee Consultant
2016 | Independent Trustee Consultant, Columbia Funds since September 2016; Chief Executive Officer, Millennial Portfolio Solutions LLC (asset management and consulting services) since January 2016; Director of Investments, Casey Family Programs from April 2016 to September 2016; Senior Vice President and Chief Investment Officer, Calvert Investments from August 2008 to January 2016; Section Head and Portfolio Manager, General Motors Asset Management from June 1997 to August 2008 | 69 | Director, Health Services for Children with Special Needs, Inc.; Director, Guidewell Financial Solutions |
| * | J. Kevin Connaughton was appointed consultant to the Independent Trustees effective March 1, 2016. Natalie A. Trunow was appointed consultant to the Independent Trustees effective September 1, 2016. Shareholders of the Funds are expected to be asked to elect each of Mr. Connaughton and Ms. Trunow as a Trustee at a future shareholder meeting. |
Multi-Manager Alternative Strategies Fund | Annual Report 2018
| 85 |
TRUSTEES AND OFFICERS (continued)
Interested trustee affiliated with Investment Manager*
| Name, address, year of birth | Position held with the Trust and length of service | Principal occupation(s) during the past five years and other relevant professional experience | Number of Funds in the Columbia Funds Complex overseen | Other directorships held by Trustee during the past five years |
William F. Truscott
c/o Columbia Management
Investment Advisers, LLC
225 Franklin Street
Boston, MA 02110
1960 | Trustee
2012 | Chairman of the Board and President, Columbia Management Investment Advisers, LLC since May 2010 and February 2012, respectively; Chief Executive Officer, Global Asset Management, Ameriprise Financial, Inc. since September 2012 (previously Chief Executive Officer, U.S. Asset Management & President, Annuities, May 2010-September 2012); Director and Chief Executive Officer, Columbia Management Investment Distributors, Inc. since May 2010 and February 2012, respectively; Chairman of the Board and Chief Executive Officer, RiverSource Distributors, Inc. since 2006; Director, Threadneedle Asset Management Holdings, SARL since 2014; President and Chief Executive Officer, Ameriprise Certificate Company, 2006-August 2012 | 193 | Chairman of the Board, Columbia Management Investment Advisers, LLC since May 2010; Director, Columbia Management Investment Distributors, Inc. since May 2010; former Director, Ameriprise Certificate Company, 2006 - January 2013 |
| * | Interested person (as defined under the 1940 Act) by reason of being an officer, director, security holder and/or employee of the Investment Manager or Ameriprise Financial. |
The Statement of Additional Information has additional information about the Fund’s Board members and is available, without charge, upon request by calling 800.345.6611, visiting columbiathreadneedleus.com/investor/ or contacting your financial intermediary.
| 86 | Multi-Manager Alternative Strategies Fund | Annual Report 2018 |
TRUSTEES AND OFFICERS (continued)
The Board has appointed officers who are responsible for day-to-day business decisions based on policies it has established. The officers serve at the pleasure of the Board. The following table provides basic information about the Officers of the Fund, including principal occupations during the past five years, although their specific titles may have varied over the period. In addition to Mr. Truscott, who is Senior Vice President, the Fund’s other officers are:
Fund officers
Name,
address and
year of birth | Position and year
first appointed to
position for any Fund
in the Columbia
Funds complex or a
predecessor thereof | Principal occupation(s) during past five years |
Christopher O. Petersen
5228 Ameriprise
Financial Center
Minneapolis, MN 55474
Born 1970 | President and Principal Executive Officer (2015) | Vice President and Lead Chief Counsel, Ameriprise Financial, Inc. since January 2015 (previously, Vice President and Chief Counsel, January 2010 - December 2014; officer of Columbia Funds and affiliated funds since 2007. |
Michael G. Clarke
225 Franklin Street
Boston, MA 02110
Born 1969 | Treasurer (2011), Chief Financial Officer (2009) and Chief Accounting Officer (2015) | Vice President — Mutual Fund Administration, Columbia Management Investment Advisers, LLC, since May 2010; senior officer of Columbia Funds and affiliated funds since 2002. |
Paul B. Goucher
100 Park Avenue
New York, NY 10017
Born 1968 | Senior Vice President (2011) and Assistant Secretary (2008) | Senior Vice President and Assistant General Counsel, Ameriprise Financial, Inc. since January 2017 (previously, Vice President and Lead Chief Counsel, November 2008 - January 2017 and January 2013 - January 2017, respectively); Vice President, Chief Legal Officer and Assistant Secretary, Columbia Management Investment Advisers, LLC since May 2010. |
Thomas P. McGuire
225 Franklin Street
Boston, MA 02110
Born 1972 | Senior Vice President and Chief Compliance Officer (2012) | Vice President — Asset Management Compliance, Ameriprise Financial, Inc., since May 2010; Chief Compliance Officer, Ameriprise Certificate Company since September 2010. |
Colin Moore
225 Franklin Street
Boston, MA 02110
Born 1958 | Senior Vice President (2010) | Executive Vice President and Global Chief Investment Officer, Ameriprise Financial, Inc., since July 2013; Executive Vice President and Global Chief Investment Officer, Columbia Management Investment Advisers, LLC since July 2013. |
Ryan C. Larrenaga
225 Franklin Street
Boston, MA 02110
Born 1970 | Senior Vice President (2017), Chief Legal Officer (2017) and Secretary (2015) | Vice President and Chief Counsel, Ameriprise Financial, Inc. since August 2018 (previously, Vice President and Group Counsel, August 2011 - August 2018); officer of Columbia Funds and affiliated funds since 2005. |
Michael E. DeFao
225 Franklin Street
Boston, MA 02110
Born 1968 | Vice President (2011) and Assistant Secretary (2010) | Vice President and Chief Counsel, Ameriprise Financial, Inc. since May 2010. |
Amy Johnson
5228 Ameriprise
Financial Center
Minneapolis, MN 55474
Born 1965 | Vice President (2006) | Managing Director and Global Head of Operations, Columbia Management Investment Advisers, LLC since April 2016 (previously Managing Director and Chief Operating Officer, 2010 - 2016). |
Lyn Kephart-Strong
5228 Ameriprise
Financial Center
Minneapolis, MN 55474
Born 1960 | Vice President (2015) | President, Columbia Management Investment Services Corp. since October 2014; Vice President & Resolution Officer, Ameriprise Trust Company since August 2009. |
Multi-Manager Alternative Strategies Fund | Annual Report 2018
| 87 |
Board Consideration and Approval of Management and Subadvisory Agreements
On June 12, 2018, the Board of Trustees (the Board) and the Trustees who are not interested persons (as defined in the Investment Company Act of 1940) (the Independent Trustees) of Columbia Funds Series Trust I (the Trust) unanimously approved the continuation of the Management Agreement (the Management Agreement) with Columbia Management Investment Advisers, LLC (the Investment Manager) and the Subadvisory Agreements and, to more closely conform the Subadvisory Agreements to a revised form of subadvisory agreement with the same material terms, an amendment to the Subadvisory Agreements (together, the Subadvisory Agreements) between the Investment Manager and AlphaSimplex Group, LLC (AlphaSimplex), AQR Capital Management, LLC (AQR), Manulife Asset Management (US) LLC (Manulife), TCW Investment Management Company LLC (TCW) and Water Island Capital, LLC (Water Island) (the Subadvisers) with respect to Multi-Manager Alternative Strategies Fund (the Fund), a series of the Trust. As detailed below, the Board’s Advisory Fees and Expenses Committee (the Committee) and the Board met on multiple occasions to review and discuss, among themselves, with the management team of the Investment Manager and with an independent fee consultant, materials provided by the Investment Manager, the independent fee consultant and others before determining to approve the continuation of the Management Agreement and the Subadvisory Agreements (collectively, the Agreements).
In connection with their deliberations regarding the continuation of the Management Agreement and the Subadvisory Agreements, the Committee and the Board evaluated materials requested from the Investment Manager regarding the Fund and the Agreements, and discussed these materials with representatives of the Investment Manager at Committee meetings held on March 6, 2018, April 26, 2018 and June 11, 2018 and at Board meetings held on March 7, 2018 and June 12, 2018. In addition, the Board and its various committees consider matters bearing on the Agreements at other meetings throughout the year and in prior years and meet regularly with senior management of the Trust and the Investment Manager. Through the Board’s Investment Oversight Committees, Trustees also meet with selected portfolio managers of the funds the Trustees oversee and with other investment personnel at various times throughout the year. The Committee and the Board also consulted with the independent fee consultant, Fund counsel and the Independent Trustees’ independent legal counsel, who advised on various matters with respect to the Committee’s and the Board’s considerations and otherwise assisted the Committee and the Board in their deliberations. On June 11, 2018, the Committee recommended that the Board approve the continuation of the Management Agreement and the Subadvisory Agreements. On June 12, 2018, the Board, including the Independent Trustees, voting separately, unanimously approved the continuation of the Management Agreement and the Subadvisory Agreements for the Fund.
The Committee and the Board considered all information that they, their legal counsel or the Investment Manager believed reasonably necessary to evaluate and to determine whether to recommend for approval or approve the continuation of the Management Agreement and the Subadvisory Agreements. The information and factors considered by the Committee and the Board in recommending for approval or approving the continuation of the Management Agreement and the Subadvisory Agreements for the Fund included the following:
| • | Information on the investment performance of the Fund relative to the performance of a group of mutual funds determined to be comparable to the Fund by an independent third-party data provider, as well as performance relative to benchmarks; |
| • | Information on the Fund’s management fees and total expenses, including information comparing the Fund’s expenses to those of a group of comparable mutual funds, as determined by the independent third-party data provider; |
| • | The Investment Manager’s agreement to contractually limit or cap total operating expenses for the Fund through December 31, 2019 so that total operating expenses (excluding certain fees and expenses, such as transaction costs and certain other investment related expenses, interest, taxes, acquired fund fees and expenses, and infrequent and/or unusual expenses) would not exceed a specified annual rate, as a percentage of the Fund’s net assets; |
| • | The terms and conditions of the Agreements; |
| • | The subadvisory fees payable by the Investment Manager under the Subadvisory Agreements; |
| • | The current and proposed terms and conditions of other agreements and arrangements with affiliates of the Investment Manager relating to the operations of the Fund, including agreements with respect to the provision of distribution, transfer agency and shareholder services to the Fund; |
| 88 | Multi-Manager Alternative Strategies Fund | Annual Report 2018 |
Board Consideration and Approval of Management and Subadvisory Agreements (continued)
| • | Descriptions of various functions performed by the Investment Manager and the Subadvisers under the Agreements, including portfolio management and portfolio trading practices; |
| • | Information regarding the management fees of similarly-managed portfolios of other clients of the Investment Manager, including institutional accounts and collective trusts; |
| • | Information regarding the reputation, regulatory history and resources of the Investment Manager and Subadvisers, including information regarding senior management, portfolio managers and other personnel; |
| • | Information regarding the capabilities of the Investment Manager and the Subadvisers with respect to compliance monitoring services, including an assessment of the Investment Manager’s and the Subadvisers’ compliance systems by the Fund’s Chief Compliance Officer; and |
| • | The profitability to the Investment Manager and its affiliates from their relationships with the Fund. |
Nature, extent and quality of services provided under the Agreements
The Committee and the Board considered the nature, extent and quality of services provided to the Fund by the Investment Manager, the Subadvisers and the Investment Manager’s affiliates under the Agreements and under separate agreements for the provision of transfer agency and shareholder services, and the resources dedicated to the Fund and the other Columbia Funds by the Investment Manager, the Subadvisers and the Investment Manager’s affiliates. The Committee and the Board considered, among other things, the Investment Manager’s ability to attract, motivate and retain highly qualified research, advisory and supervisory investment professionals (including compensation programs for personnel involved in fund management, reputation and other attributes), the portfolio management services provided by those investment professionals, and the quality of the Investment Manager’s and the Subadvisers’ investment research capabilities and trade execution services. The Committee and the Board also considered the potential benefits to shareholders of investing in a mutual fund that is part of a fund complex offering exposure to a variety of asset classes and investment disciplines and providing a variety of fund and shareholder services.
The Committee and the Board also considered the professional experience and qualifications of the senior personnel of the Investment Manager and the Subadvisers, which included consideration of the Investment Manager’s and the Subadvisers’ experience with similarly-structured funds. The Committee and the Board noted the compliance programs of and the compliance-related resources provided to the Fund by the Investment Manager and its affiliates and the resources dedicated by the Investment Manager and its affiliates to risk management, and considered the Investment Manager’s ability to provide administrative services to the Fund and coordinate the activities of the Fund’s other service providers. The Board also noted that the Board had approved each Subadviser’s code of ethics and compliance program, and that the Chief Compliance Officer of the Funds reports to the Trustees on each Subadviser’s compliance program.
The Committee and the Board considered the diligence and selection process undertaken by the Investment Manager to select each Subadviser, including the Investment Manager’s rationale for recommending the continuation of the Subadvisory Agreements, and the process for monitoring each Subadviser’s ongoing performance of services for the Fund. As part of these deliberations, the Committee and the Board considered the ability of the Investment Manager, subject to the approval of the Board, to modify or enter into new subadvisory agreements without a shareholder vote pursuant to an exemptive order of the Securities and Exchange Commission. The Committee and the Board also considered the scope of services provided to the Fund by the Investment Manager that are distinct from and in addition to those provided by the Subadvisers, including cash flow management, treasury services, risk oversight, investment oversight and Subadviser selection, oversight and transition management. After reviewing these and related factors, the Committee and the Board concluded, within the context of their overall conclusions, that the nature, extent and quality of the services provided to the Fund under the Agreements supported the continuation of the Management Agreement and the Subadvisory Agreements.
Investment performance
The Committee and the Board reviewed information about the performance of the Fund over various time periods, including performance information relative to benchmarks, information that compared the performance of the Fund to the performance of a group of comparable mutual funds as determined by the independent third-party data provider and information and
Multi-Manager Alternative Strategies Fund | Annual Report 2018
| 89 |
Board Consideration and Approval of Management and Subadvisory Agreements (continued)
analysis provided by the independent fee consultant. The Committee and the Board also reviewed a description of the third party’s methodology for identifying the Fund’s peer groups for purposes of performance and expense comparisons. Although the Fund’s performance lagged that of a relevant peer group for certain (although not necessarily all) periods, the Committee and the Board concluded that other factors relevant to performance were sufficient, in light of other considerations, to support continuation of the Management Agreement and the Subadvisory Agreements. Those factors included one or more of the following: (i) that the Fund’s performance, although lagging in certain recent periods, was stronger over the longer term; (ii) that the underperformance was attributable, to a significant extent, to investment decisions that were reasonable and consistent with the Fund’s investment strategy and policies and that the Fund was performing within a reasonable range of expectations, given those investment decisions, market conditions and the Fund’s investment strategy; (iii) that the Fund’s performance was competitive when compared to other relevant performance benchmarks or peer groups; and (iv) that the Investment Manager had taken or was taking steps designed to help improve the Fund’s investment performance, including, but not limited to, replacing portfolio managers, enhancing the resources supporting the portfolio managers, or modifying investment strategies.
The Committee and the Board noted that, through December 31, 2017, the Fund’s performance was in the eighty-fifth, ninety-eighth and ninety-fifth percentile (where the best performance would be in the first percentile) of its category selected by the independent third-party data provider for the purposes of performance comparisons for the one-, three- and five-year periods, respectively.
The Committee and the Board also considered the Investment Manager’s and Subadvisers’ performance and reputation generally, the Investment Manager’s evaluation of each Subadviser’s contribution to the Fund’s broader investment mandate, the Investment Manager’s historical responsiveness to Board concerns about performance, and the Investment Manager’s willingness to take steps intended to improve performance. After reviewing these and related factors, the Committee and the Board concluded, within the context of their overall conclusions, that the performance of the Fund, the Investment Manager and the Subadvisers were sufficient, in light of other considerations, to support the continuation of the Management Agreement and the Subadvisory Agreements.
Investment Management fee rates and oher expenses
The Committee and the Board considered the management fees charged to the Fund under the Management Agreement and the Subadvisory Agreements, as well as the total expenses incurred by the Fund. In assessing the reasonableness of the fees under the Management Agreement, the Committee and the Board considered, among other information, the Fund’s total expense ratio as a percentage of average daily net assets. The Committee and the Board considered data provided by the independent third-party data provider and the independent fee consultant. The Committee and the Board noted that, as of December 31, 2017, the Fund’s actual management fee and net total expense ratio were ranked in the third and second quintiles, respectively, (where the lowest fees and expenses would be in the first quintile) against the Fund’s expense universe as determined by the independent third-party data provider for purposes of expense comparison. The Committee and the Board also considered the fees that the Subadvisers charge to their other clients, and noted that the Investment Manager pays the fees of the Subadvisers. The Committee and the Board also took into account the fee waiver and expense limitation arrangements agreed to by the Investment Manager, as noted above.
The Committee and the Board also received and considered information about the management fees charged by the Investment Manager to institutional accounts. In considering the fees charged to those accounts, the Committee and the Board took into account, among other things, the Investment Manager’s representations about the differences between managing mutual funds as compared to other types of accounts, including differences in the services provided, differences in the risk profile of such business for the Investment Manager and the additional resources required to manage mutual funds effectively. The Committee and the Board also received and considered information about the fees charged by the Investment Manager for sub-advisory services it provides to comparable unaffiliated funds. In evaluating the Fund’s management fees, the Committee and the Board also took into account the demands, complexity and quality of the investment management of the Fund.
After reviewing these and related factors, the Committee and the Board concluded, within the context of their overall conclusions, that the management fee rates and expenses of the Fund, in light of other considerations, supported the continuation of the Management Agreement and the Subadvisory Agreements.
| 90 | Multi-Manager Alternative Strategies Fund | Annual Report 2018 |
Board Consideration and Approval of Management and Subadvisory Agreements (continued)
Costs of services provided and profitability
The Committee and the Board also took note of the costs the Investment Manager and its affiliates incur in connection with the services provided and the profitability to the Investment Manager and its affiliates from their relationships with the Fund.
The Committee and the Board also considered the compensation directly or indirectly received by the Investment Manager’s affiliates in connection with their relationships with the Fund. The Committee and the Board reviewed information provided by management as to the profitability to the Investment Manager and its affiliates of their relationships with the Fund, including with respect to funds for which unaffiliated subadvisers provide services, information about changes in profitability in connection with a change in the Fund’s subadviser, information about the allocation of expenses used to calculate profitability, and comparisons of profitability levels realized in 2017 to profitability levels realized in 2016. When reviewing profitability, the Committee and the Board also considered court cases in which adviser profitability was an issue in whole or in part, the performance of similarly managed funds, the performance of the Fund, and the expense ratio of the Fund. In addition, the Committee and the Board considered information provided by the Investment Manager regarding the Investment Manager’s financial condition and comparing its profitability to that of other asset management firms that are, or are subsidiaries of, publicly traded companies. In this regard, the Committee and the Board also considered data provided by the independent fee consultant. Because the Subadvisory Agreements were negotiated at arms-length by the Investment Manager, which is responsible for payments to the Subadvisers thereunder, the Committee and the Board did not consider the profitability to each Subadviser of its relationship with the Fund.
After reviewing these and related factors, the Committee and the Board concluded, within the context of their overall conclusions, that the costs of services provided and the profitability to the Investment Manager and its affiliates from their relationships with the Fund supported the continuation of the Management Agreement and the Subadvisory Agreements.
Economies of scale
The Committee and the Board considered the potential existence of economies of scale in the provision by the Investment Manager of services to the Fund, to groups of related funds, and to the Investment Manager’s investment advisory clients as a whole, and whether those economies of scale were shared with the Fund through breakpoints in investment management fees or other means, such as expense limitation arrangements and additional investments by the Investment Manager in investment, trading, compliance and other resources. The Committee and the Board noted that the management fee schedules for the Fund contained breakpoints that would reduce the fee rate on assets above specified threshold levels.
The Committee and the Board noted that the breakpoints, if any, in the Subadvisory Agreements did not occur at the same levels as the breakpoints in the Management Agreement. The Committee and the Board noted that absent a shareholder vote, the Investment Manager would bear any increase in fees payable under the Subadvisory Agreements. The Committee and the Board also noted the potential challenges of seeking to tailor the Management Agreement breakpoints to those of a subadvisory agreement in this context, and the effect that capacity constraints on a subadviser’s ability to manage assets could potentially have on the ability of the Investment Manager to achieve economies of scale, as new subadvisers may need to be added as the Fund grows, increasing the Investment Manager’s cost of compensating and overseeing the Fund’s subadvisers.
In considering these matters, the Committee and the Board also considered the costs of the services provided and the profitability to the Investment Manager and its affiliates from their relationships with the Fund, as noted above. After reviewing these and related factors, the Committee and the Board concluded, within the context of their overall conclusions, that the extent to which any economies of scale were expected to be shared with the Fund supported the continuation of the Management Agreement and the Subadvisory Agreements.
Other benefits to the Investment Manager and Subadvisers
The Committee and the Board received and considered information regarding “fall-out” or ancillary benefits received by the Investment Manager and its affiliates as a result of their relationships with the Fund, such as the engagement of the Investment Manager’s affiliates to provide distribution, transfer agency and shareholder services to the Fund. In this regard, among other matters, the Committee and the Board considered that the Fund’s distributor retains a portion of the distribution fees from the Fund and receives a portion of the sales charges on sales or redemptions of certain classes of shares of the
Multi-Manager Alternative Strategies Fund | Annual Report 2018
| 91 |
Board Consideration and Approval of Management and Subadvisory Agreements (continued)
Fund. The Committee and the Board also considered the benefits of research made available to the Subadvisers by reason of brokerage commissions generated by the Fund’s securities transactions, and reviewed information about the Investment Manager’s practices with respect to considering brokerage and research services when allocating portfolio transactions. In this connection, the Board also noted that the amount of research made available to the Investment Manager by reason of brokerage commissions had been declining over time, and may decline further. The Committee and the Board recognized that the Investment Manager’s profitability would be somewhat lower without these benefits.
Conclusion
The Committee and the Board reviewed all of the above considerations in reaching their decisions to recommend or approve the continuation of the Management Agreement and the Subadvisory Agreements. In their deliberations, the Trustees did not identify any particular information that was all-important or controlling, and individual Trustees may have attributed different weights to the various factors. Based on their evaluation of all factors that they deemed to be material, including those factors described above, and assisted by the advice of independent legal counsel, the Board, including the Independent Trustees, voting separately, unanimously approved the continuation of the Management Agreement and the Subadvisory Agreements.
| 92 | Multi-Manager Alternative Strategies Fund | Annual Report 2018 |
Board Consideration and Approval of Management and Subadvisory Agreements (continued)
Board Consideration and Approval of Subadvisory Agreement
On March 7, 2018, the Board of Trustees (the Board) and the Trustees who are not interested persons (as defined in the Investment Company Act of 1940) (the Independent Trustees) of Columbia Funds Series Trust I (the Trust) unanimously approved, for an initial two-year term, the Subadvisory Agreement (the Subadvisory Agreement) between Columbia Management Investment Advisers, LLC (the Investment Manager) and AlphaSimplex Group, LLC (the Subadviser) with respect to Multi-Manager Alternative Strategies Fund (the Fund), a series of the Trust. As detailed below, the Board’s Advisory Fees and Expenses Committee (the Committee) and the Board met to review and discuss, both among themselves and with the management team of the Investment Manager, materials provided by the Investment Manager and others before determining to approve the Subadvisory Agreement.
In connection with their deliberations regarding the proposed Subadvisory Agreement, the Committee and the Board evaluated materials requested from the Investment Manager regarding the Fund and the Subadvisory Agreement, and discussed these materials, as well as other materials provided by the Investment Manager in connection with the Board’s most recent annual approval of the continuation of the management agreements with respect to other series of the Trust, with representatives of the Investment Manager at the Committee meeting held on March 6, 2018, and at the Board meeting held on March 7, 2018. The Board and the Committee also noted its considerations at meetings held in connection with the continuation of the Management Agreement (the Management Agreement) and the Subadvisory Agreements between AQR Capital Management, LLC, TCW Investment Management Company LLC and Water Island Capital, LLC with respect to the Fund.
The Committee and the Board also consulted with Fund counsel and the Independent Trustees’ independent legal counsel, who advised on various matters with respect to the Committee’s and the Board’s considerations and otherwise assisted the Committee and the Board in their deliberations. As part of these deliberations, the Committee and the Board considered the ability of the Investment Manager, subject to the approval of the Board, to modify or enter into new subadvisory agreements without a shareholder vote pursuant to an exemptive order of the Securities and Exchange Commission.
The Committee and the Board considered all information that they, their legal counsel or the Investment Manager believed reasonably necessary to evaluate and to determine whether to recommend for approval or approve the Subadvisory Agreement. The information and factors considered by the Committee and the Board in recommending for approval or approving the Subadvisory Agreement for the Fund included the following:
| • | The Investment Manager’s agreement to contractually limit or cap total operating expenses for the Fund through December 31, 2018 so that total operating expenses (excluding certain fees and expenses, such as transaction costs and certain other investment related expenses, interest, taxes, acquired fund fees and expenses, and infrequent and/or unusual expenses) would not exceed a specified annual rate, as a percentage of the Fund’s net assets; |
| • | The terms and conditions of the Subadvisory Agreement; |
| • | The subadvisory fees to be charged to the Investment Manager under the Subadvisory Agreement; |
| • | Descriptions of various functions performed by the Subadviser under the Subadvisory Agreement, including portfolio management and portfolio trading practices; |
| • | Information regarding the reputation, regulatory history and resources of the Subadviser, including information regarding senior management, portfolio managers and other personnel; |
| • | Information regarding the capabilities of the Subadviser with respect to compliance monitoring services, including an assessment of the Subadviser’s compliance systems by the Fund’s Chief Compliance Officer; and |
| • | The profitability to the Investment Manager and its affiliates from their relationships with the Fund. |
Multi-Manager Alternative Strategies Fund | Annual Report 2018
| 93 |
Board Consideration and Approval of Management and Subadvisory Agreements (continued)
Nature, extent and quality of services to be provided under the Subadvisory Agreement
The Committee and the Board considered the nature, extent and quality of services to be provided to the Fund by the Subadviser under the Subadvisory Agreement. The Committee and the Board considered, among other things, the Subadviser’s advisory and supervisory investment professionals (including personnel involved in fund management, reputation and other attributes), the portfolio management services provided by those investment professionals, and the quality of the Subadviser’s investment research capabilities.
The Committee and the Board also considered the professional experience and qualifications of the senior personnel of the Subadviser. The Board also noted that, based on information provided by the Investment Manager, the Board had approved the Subadviser’s code of ethics and compliance program, and that the Chief Compliance Officer of the Funds reports to the Trustees on the Subadviser’s compliance program.
The Committee and the Board considered the diligence and selection process undertaken by the Investment Manager to select the Subadviser, including the rationale for recommending the approval of the Subadvisory Agreement, and the process for monitoring the Subadviser’s ongoing performance of services for the Fund. As part of these deliberations, the Committee and the Board considered the ability of the Investment Manager, subject to the approval of the Board, to modify or enter into new subadvisory agreements without a shareholder vote pursuant to an exemptive order of the Securities and Exchange Commission.
After reviewing these and related factors, the Committee and the Board concluded, within the context of their overall conclusions, that the expected nature, extent and quality of the services to be provided to the Fund under the Subadvisory Agreement supported the approval of the Subadvisory Agreement.
Investment performance
The Committee and the Board reviewed information about the performance of the Fund over various time periods, including performance information relative to benchmarks.
The Committee and the Board also considered the Subadviser’s performance and reputation generally. The Board also considered the performance of the Subadviser’s related composite, including its absolute and risk-adjusted returns, noting that the Subadviser had delivered strong performance over the one-, three- and five-year periods for strategies similar to those proposed for its sleeve of the Fund. After reviewing these and related factors, the Committee and the Board concluded, within the context of their overall conclusions, that the performance of the Subadviser was sufficient, in light of other considerations, to warrant the approval of the Subadvisory Agreement.
Subadvisory fee rate and other expenses
The Committee and the Board considered the subadvisory fees to be charged to the Fund under the Subadvisory Agreement, as well as the total expenses expected to be incurred by the Fund. The Committee and the Board also considered the fees that the Subadviser charges to its other clients, to the extent publicly available, and noted that the Investment Manager pays the fees of the Subadviser. The Committee and the Board also took into account the fee waiver and expense limitation arrangements agreed to by the Investment Manager, as noted above.
After reviewing these and related factors, the Committee and the Board concluded, within the context of their overall conclusions, that the subadvisory fee rates and expenses of the Fund supported the approval of the Subadvisory Agreement.
Costs of services to be provided and profitability
The Committee and the Board also took note of the costs the Investment Manager and its affiliates were expected to incur in connection with the services provided and the expected profitability to the Investment Manager and its affiliates from their relationships with the Fund, and also noted that the Committee and the Board expected to consider the costs of services and the profitability of the Investment Manager and its affiliates in connection with the Committee’s and the Board’s next review and consideration of the continuation of the Subadvisory Agreement. The Committee and the Board also considered court cases in which adviser profitability was an issue in whole or in part, the performance of similarly managed funds, the expected expense ratio of the Fund, and the implementation of expense limitations with respect to the Fund. Because the
| 94 | Multi-Manager Alternative Strategies Fund | Annual Report 2018 |
Board Consideration and Approval of Management and Subadvisory Agreements (continued)
Subadvisory Agreement was negotiated at arms-length by the Investment Manager, which is responsible for payments to the Subadviser thereunder, the Committee and the Board did not consider the profitability to the Subadviser of its relationship with the Fund.
After reviewing these and related factors, the Committee and the Board concluded, within the context of their overall conclusions, that the anticipated costs of services to be provided and the expected profitability to the Investment Manager and its affiliates from their relationships with the Fund supported the approval of the Subadvisory Agreement.
Economies of scale
The Committee and the Board considered the potential existence of economies of scale in the provision by the Investment Manager of services to the Fund, to groups of related funds, and to the Investment Manager’s investment advisory clients as a whole, and whether those economies of scale were expected to be shared with the Fund through breakpoints in the proposed investment management fees or other means, such as expense limitation arrangements and additional investments by the Investment Manager in investment, trading, compliance and other resources. The Committee and the Board noted that the management fee schedules for the Fund contained breakpoints that would reduce the fee rate on assets above specified threshold levels.
The Committee and the Board noted that the two breakpoints in the Subadvisory Agreement occurred at the same levels as the first two breakpoints in the Management Agreement, but that the Management Agreement also included additional breakpoints. The Committee and the Board noted that absent a shareholder vote, the investment manager would bear any increase in fees payable under the Subadvisory Agreement. The Committee and the Board also noted the potential challenges of seeking to tailor the Management Agreement breakpoints to those of a subadvisory agreement in this context, and the effect that capacity constraints on a subadviser’s ability to manage assets could potentially have on the ability of the Investment Manager to achieve economies of scale, as new subadvisers may need to be added as the Fund grows, increasing the Investment Manager’s cost of compensating and overseeing the Fund’s subadvisers.
In considering these matters, the Committee and the Board also considered the costs of the services provided and the profitability to the Investment Manager and its affiliates from their relationships with the Fund, as discussed above. After reviewing these and related factors, the Committee and the Board concluded, within the context of their overall conclusions, that the extent to which any economies of scale were expected to be shared with the Fund supported the approval of the Subadvisory Agreement.
Other benefits to the Subadviser
The Committee and the Board also considered the benefits of research made available to the Investment Manager and the Subadviser by reason of brokerage commissions generated by the Fund’s securities transactions, and reviewed information about the Investment Manager’s practices with respect to allocating portfolio transactions for brokerage and research services. The Committee and the Board recognized that the Investment Manager’s profitability would be somewhat lower without these benefits.
Conclusion
The Committee and the Board reviewed all of the above considerations in reaching their decisions to recommend for approval or approve the proposed Subadvisory Agreement. In their deliberations, the Trustees did not identify any particular information that was all-important or controlling, and individual Trustees may have attributed different weights to the various factors. Based on their evaluation of all factors that they deemed to be material, including those factors described above, and assisted by the advice of independent legal counsel, the Board, including the Independent Trustees, voting separately, approved the Subadvisory Agreement.
Multi-Manager Alternative Strategies Fund | Annual Report 2018
| 95 |
The Fund mails one shareholder report to each shareholder address. If you would like more than one report, please call shareholder services at 800.345.6611 and additional reports will be sent to you.
Proxy voting policies and procedures
The policy of the Board of Trustees is to vote the proxies of the companies in which the Fund holds investments consistent with the procedures as stated in the Statement of Additional Information (SAI). You may obtain a copy of the SAI without charge by calling 800.345.6611; contacting your financial intermediary; visiting columbiathreadneedleus.com/investor/; or searching the website of the Securities and Exchange Commission (SEC) at sec.gov. Information regarding how the Fund voted proxies relating to portfolio securities is filed with the SEC by August 31st for the most recent 12-month period ending June 30th of that year, and is available without charge by visiting columbiathreadneedleus.com/investor/, or searching the website of the SEC at sec.gov.
Quarterly schedule of investments
The Fund files a complete schedule of portfolio holdings with the SEC for the first and third quarters of each fiscal year on Form N-Q or Form N-PORT. The Fund’s Form N-Q or Form N-PORT is available on the SEC’s website at sec.gov and may be reviewed and copied at the SEC’s Public Reference Room in Washington, D.C. Information on the operation of the Public Reference Room may be obtained by calling 800.SEC.0330. The Fund’s complete schedule of portfolio holdings, as filed on Form N-Q or Form N-PORT, can also be obtained without charge, upon request, by calling 800.345.6611.
Additional Fund information
For more information about the Fund, please visit columbiathreadneedleus.com/investor/ or call 800.345.6611. Customer Service Representatives are available to answer your questions Monday through Friday from 8 a.m. to 7 p.m. Eastern time.
Fund investment manager
Columbia Management Investment Advisers, LLC
225 Franklin Street
Boston, MA 02110
Fund distributor
Columbia Management Investment Distributors, Inc.
225 Franklin Street
Boston, MA 02110
Fund transfer agent
Columbia Management Investment Services Corp.
Through October 31, 2018:
P.O. Box 8081
Boston, MA 02266-8081
Effective November 1, 2018:
P.O. Box 219104
Kansas City, MO 64121-9104
You may obtain the current net asset value (NAV) of Fund shares at no cost by calling 800.345.6611 or by sending an e-mail to serviceinquiries@columbiathreadneedle.com.
| 96 | Multi-Manager Alternative Strategies Fund | Annual Report 2018 |
[THIS PAGE INTENTIONALLY LEFT BLANK]
Multi-Manager Alternative Strategies Fund
Through October 31, 2018:
P.O. Box 8081
Boston, MA 02266-8081
Effective November 1, 2018:
P.O. Box 219104
Kansas City, MO 64121-9104
Please read and consider the investment objectives, risks, charges and expenses for any fund carefully before investing. For a prospectus and summary prospectus, which contains this and other important information about the Fund, go to
columbiathreadneedleus.com/investor/. The Fund is distributed by Columbia Management Investment Distributors, Inc., member FINRA, and managed by Columbia Management Investment Advisers, LLC.
Columbia Threadneedle Investments (Columbia Threadneedle) is the global brand name of the Columbia and Threadneedle group of companies. All rights reserved.
© 2018 Columbia Management Investment Advisers, LLC.
columbiathreadneedleus .com/investor/

Annual Report
August 31, 2018
Columbia Global Energy and Natural Resources Fund
Not FDIC Insured • No bank guarantee • May lose value
Dear Shareholders,
Volatility exists in financial markets and this is not a comfortable fact of life. How investors deal with this reality, including how they react to short term spikes in volatility as well as to longer periods of increased or decreased volatility, may have a significant impact on their overall investing success.
Too often, investors change their investment strategy based on something that’s happening at a moment in time rather than thinking about how that change in strategy might affect their ability to achieve their longer-term financial goals. Emotion replaces logic and reasoning. Investors may sell in reaction to a market drop (fear or panic), locking in low returns which means they won’t be invested when the market returns, or they invest more at a market peak (greed or conviction), essentially when it is expensive to do so. In both cases, selling and buying at the exact wrong time.
We believe the best outcomes come from a consistent approach to investing. Here are five areas where advisors can help us overcome the tendency to react emotionally as we struggle to make the right choices with our investments:
Long-term focus
The further away long-term goals, aspirations and objectives are, the easier it is to stray away from the goals and priorities that we set out. Advisors help us stay focused on what we want to accomplish.
Discipline through up-and-down markets
Advisors help set rules to prevent us from making rash decisions that we may regret later. Knowing ahead of time what you should do in case of certain situations will help you get through volatile markets and not make emotional decisions.
Tax-awareness
Taxes are one of the biggest drags on investment returns and are critical attributes of investing. Yet few of us take the necessary steps to ease the corrosive effect of taxes. Advisors have tools and knowledge that may help us to manage portfolios more tax-efficiently and keep more of what we earn.
Emotional objectivity
Our emotions are very hard to manage and making investment decisions in an emotional state can lead to exceedingly bad outcomes. An objective advisor can help prevent some of the reactionary mistakes emotions often lead us to.
Education and guidance
The role of the advisor is to teach and guide us toward achieving our financial goals. In terms of working through emotions, guidance is by far the most important component.
By understanding our own behaviors and biases, we can prepare for future challenges. Your success is our priority. Talk to your advisor about how working with Columbia Threadneedle Investments may help you stay the course and position your portfolio for consistent, sustainable outcomes, regardless of market conditions.
Sincerely,
Christopher O. Petersen
President, Columbia Funds
Columbia Funds are distributed by Columbia Management Investment Distributors, Inc., member FINRA, and managed by Columbia Management Investment Advisers, LLC.
© 2018 Columbia Management Investment Advisers, LLC. All rights reserved.
Columbia Global Energy and Natural Resources Fund | Annual Report 2018
Columbia Global Energy and Natural Resources Fund | Annual Report 2018
Investment objective
Columbia Global Energy and Natural Resources Fund (the Fund) seeks long-term capital appreciation.
Portfolio management
Josh Kapp, CFA
Portfolio Manager
Managed Fund since 2011
Morningstar style boxTM
The Morningstar Style Box is based on a fund’s portfolio holdings. For equity funds, the vertical axis shows the market capitalization of the stocks owned, and the horizontal axis shows investment style (value, blend, or growth). Information shown is based on the most recent data provided by Morningstar.
© 2018 Morningstar, Inc. All rights reserved. The Morningstar information contained herein: (1) is proprietary to Morningstar and/or its content providers; (2) may not be copied or distributed; and (3) is not warranted to be accurate, complete or timely. Neither Morningstar nor its content providers are responsible for any damages or losses arising from any use of this information.
| Average annual total returns (%) (for the period ended August 31, 2018) |
| | | Inception | 1 Year | 5 Years | 10 Years |
| Class A | Excluding sales charges | 09/28/07 | 15.99 | 1.63 | -0.74 |
| | Including sales charges | | 9.33 | 0.43 | -1.32 |
| Advisor Class* | 11/08/12 | 16.28 | 1.89 | -0.48 |
| Class C | Excluding sales charges | 09/28/07 | 15.10 | 0.86 | -1.48 |
| | Including sales charges | | 14.10 | 0.86 | -1.48 |
| Institutional Class | 12/31/92 | 16.29 | 1.88 | -0.49 |
| Institutional 2 Class* | 11/08/12 | 16.42 | 2.06 | -0.39 |
| Institutional 3 Class* | 03/01/17 | 16.51 | 1.94 | -0.46 |
| Class R* | 09/27/10 | 15.71 | 1.39 | -0.99 |
| Blended Benchmark | | 14.83 | 3.05 | 1.40 |
| S&P North American Natural Resources Sector Index | | 16.91 | -0.04 | 0.36 |
Returns for Class A shares are shown with and without the maximum initial sales charge of 5.75%. Returns for Class C shares are shown with and without the 1.00% contingent deferred sales charge for the first year only. The Fund’s other share classes are not subject to sales charges and have limited eligibility. Effective November 1, 2017, Class R4, Class R5, Class Y and Class Z shares were renamed Advisor Class, Institutional 2 Class, Institutional 3 Class and Institutional Class shares, respectively. Please see the Fund’s prospectus for details. Performance for different share classes will vary based on differences in sales charges and fees associated with each share class. All results shown assume reinvestment of distributions during the period. Returns do not reflect the deduction of taxes that a shareholder may pay on Fund distributions or on the redemption of Fund shares. Performance results reflect the effect of any fee waivers or reimbursements of Fund expenses by Columbia Management Investment Advisers, LLC and/or any of its affiliates. Absent these fee waivers or expense reimbursement arrangements, performance results would have been lower.
The performance information shown represents past performance and is not a guarantee of future results. The investment return and principal value of your investment will fluctuate so that your shares, when redeemed, may be worth more or less than their original cost. Current performance may be lower or higher than the performance information shown. You may obtain performance information current to the most recent month-end by contacting your financial intermediary, visiting columbiathreadneedleus.com/investor/ or calling 800.345.6611.
| * | The returns shown for periods prior to the share class inception date (including returns for the Life of the Fund, if shown, which are since Fund inception) include the returns of the Fund’s oldest share class. These returns are adjusted to reflect any higher class-related operating expenses of the newer share classes, as applicable. Please visit columbiathreadneedleus.com/investor/investment-products/mutual-funds/appended-performance for more information. |
The Fund’s performance prior to August 2013 reflects returns achieved pursuant to different principal investment strategies. If the Fund’s current strategies had been in place for the prior periods, results shown may have been different.
The Blended Benchmark, a weighted custom composite, established by the Investment Manager, consists of a 60% weighting in the MSCI World Energy Sector Index (Net) and a 40% weighting in the MSCI World Materials Sector Index (Net). The MSCI World Energy Sector Index (Net) is a free float-adjusted market capitalization weighted index that represents the energy segment in global developed market equity performance. The MSCI World Materials Sector Index (Net) is a free float-adjusted market capitalization weighted index that represents the materials segment in global developed-market equity performance.
The S&P North American Natural Resources Sector Index is a modified market capitalization-weighted equity index designed as a benchmark for U.S. traded securities in the natural resources sector. The index includes companies involved in the following categories: extractive industries, energy companies, owners and operators of timber tracts, forestry services, producers of pulp and paper and owners of plantations.
Indices are not available for investment, are not professionally managed and do not reflect sales charges, fees, brokerage commissions, taxes (except the MSCI World Energy Sector Index (Net) and the MSCI World Materials Sector Index (Net), which reflect reinvested dividends net of withholding taxes) or other expenses of investing. Securities in the Fund may not match those in an index.
| 2 | Columbia Global Energy and Natural Resources Fund | Annual Report 2018 |
Fund at a Glance (continued)
Performance of a hypothetical $10,000 investment (August 31, 2008 — August 31, 2018)
The chart above shows the change in value of a hypothetical $10,000 investment in Class A shares of Columbia Global Energy and Natural Resources Fund during the stated time period, and does not reflect the deduction of taxes that a shareholder may pay on Fund distributions or on the redemption of Fund shares.
| Top 10 holdings (%) (at August 31, 2018) |
| Royal Dutch Shell PLC, Class A (United Kingdom) | 6.3 |
| Chevron Corp. (United States) | 6.3 |
| DowDuPont, Inc. (United States) | 5.4 |
| Exxon Mobil Corp. (United States) | 4.9 |
| BP PLC (United Kingdom) | 4.7 |
| Rio Tinto PLC (United Kingdom) | 4.4 |
| ConocoPhillips (United States) | 4.2 |
| Suncor Energy, Inc. (Canada) | 3.9 |
| Total SA (France) | 3.5 |
| BASF SE (Germany) | 2.5 |
Percentages indicated are based upon total investments (excluding Money Market Funds and derivatives, if any).
For further detail about these holdings, please refer to the section entitled “Portfolio of Investments.”
Fund holdings are as of the date given, are subject to change at any time, and are not recommendations to buy or sell any security.
| Equity sector breakdown (%) (at August 31, 2018) |
| Energy | 63.0 |
| Materials | 37.0 |
| Total | 100.0 |
Percentages indicated are based upon total equity investments. The Fund’s portfolio composition is subject to change.
| Country breakdown (%) (at August 31, 2018) |
| Australia | 1.0 |
| Canada | 8.3 |
| France | 5.6 |
| Germany | 3.5 |
| Japan | 2.5 |
| Luxembourg | 1.3 |
| Netherlands | 1.1 |
| Switzerland | 1.0 |
| United Kingdom | 17.2 |
| United States(a) | 58.5 |
| Total | 100.0 |
| (a) | Includes investments in Money Market Funds. |
Country breakdown is based primarily on issuer’s place of organization/incorporation. Percentages indicated are based upon total investments and exclude investments in derivatives, if any. The Fund’s portfolio composition is subject to change.
The Fund may use place of organization/incorporation or other factors in determining whether an issuer is domestic (U.S.) or foreign for purposes of its investment policies. At August 31, 2018, the Fund invested at least 40% of its net assets in foreign companies in accordance with its principal investment strategy.
Columbia Global Energy and Natural Resources Fund | Annual Report 2018
| 3 |
Fund at a Glance (continued)
Summary of investments in securities by industry (%)
(at August 31, 2018) |
| Chemicals | 21.6 |
| Containers & Packaging | 3.3 |
| Diversified Financial Services | 0.9 |
| Energy Equipment & Services | 6.0 |
| Metals & Mining | 11.1 |
| Oil, Gas & Consumable Fuels | 55.5 |
| Money Market Funds | 0.2 |
| Total | 98.6 |
Percentages indicated are based upon net assets. The Fund’s portfolio composition is subject to change.
| 4 | Columbia Global Energy and Natural Resources Fund | Annual Report 2018 |
Manager Discussion of Fund Performance
For the 12-month period that ended August 31, 2018, the Fund’s Class A shares returned 15.99% excluding sales charges. During the same time period, the Fund’s Blended Benchmark returned 14.83% and the S&P North American Natural Resources Sector Index returned 16.91%. An overweight in the energy sector, solid stock selection within energy and positive results from metals and mining stocks lifted the Fund’s return above that of its Blended Benchmark.
Market overview
Although the price of oil was volatile, the trajectory was upward for the period. The price of domestic oil started the period in the high $40s/barrel, peaked in the mid-$70s/barrel in late June and ended the 12-month period at approximately $70. Prices rose close to 50% during the year. Tightening supply/demand fundamentals, including global crude and refined product inventories declining to slightly below the five-year average, drove prices higher. Rising geopolitical tensions, including U.S. sanctions on Iran, and declining Venezuelan production, also contributed to the higher prices. Natural gas prices, by contrast, declined slightly for the year. Gas prices spiked during the winter to above $3.60/mmbtu but, on average, were down approximately 4% for the period, as rising production more than offset declining inventories, which dropped below their five-year average.
On the materials side of the portfolio, copper and iron ore prices declined, while aluminum pricing was flat. However, a price chart of those metals would show significant volatility throughout the year, driven primarily by tariff and trade rhetoric.
Contributors and detractors
On the energy side of the portfolio, an overweight aided performance as the price of oil rose. Solid stock selection also helped the Fund outperform its Blended Benchmark. The Fund started the fiscal year slightly underweight in energy; however, an improving environment for energy led us to raise exposure to the sector as the period commenced . Against that backdrop, we eliminated some of the Fund’s smaller holdings, in keeping with a general repositioning of the portfolio to increase exposure to higher conviction names, which has been underway for nearly a year. We also increased exposure to integrated oil holdings, which brought energy to an overweight in the Fund. One of the Fund’s top contributors for the period was ConocoPhillips, an exploration and production company whose free cash flow exceeded expectations. That allowed the company to raise its dividend and share repurchase, which was met with considerable investor enthusiasm. Continental Resources and WPX Energy were also strong contributors to Fund gains. Both companies delivered higher-than-expected cash flow on rising oil prices and better-than-expected operational performance.
Offsetting some of these successes, Cimarex Energy and Patterson-UTI underperformed for the period. Cimarex faced operational hurdles, which lowered expectations for growth. Patterson-UTI’s exposure to pressure pumping, which faced a deteriorating demand outlook, weighed on its shares. The pressure pumping business has proved to be more capital intensive than the market expected. The Fund had no exposure to Marathon Oil, which outperformed its peers and took a bite out of relative performance for the period.
On the materials side of the portfolio, metals and mining stocks aided overall results. An overweight in Steel Dynamics benefited relative return. An underweight in gold stocks also aided relative results, as global economic concerns and rising U.S. interest rates weighed on gold. Chemicals underperformed for the Fund. Overweights in DowDuPont and PPG detracted from results as their returns lagged the overall industry. Positions in Japanese chemical companies also detracted. An underweight in chemicals helped offset the impact of these disappointments.
At period’s end
Over the period, we refined the Fund portfolio construction process, eliminating small positions and sharpening our focus on names in which we have the highest conviction. In a market driven by uncertainty regarding global trade and the potential impact of the implementation of broad tariffs, we believe it is more important than ever to rely on fundamental analysis and valuations to identify opportunities within the energy and materials sectors. We believe that our process is key to putting those ideas to work in the best way for our shareholders.
Market risk may affect a single issuer, sector of the economy, industry or the market as a whole. Foreign investments subject the Fund to risks, including political, economic, market, social and others within a particular country, as well as to currency instabilities and less stringent financial and accounting standards generally applicable to U.S. issuers. Investing in derivatives is a specialized activity that involves special risks that subject the Fund to significant
Columbia Global Energy and Natural Resources Fund | Annual Report 2018
| 5 |
Manager Discussion of Fund Performance (continued)
loss potential, including when used as leverage, and may result in greater fluctuation in fund value. Issuers engaged in the energy and natural resources industry may be subject to legislative or regulatory changes, adverse market conditions and/or increased competition. The values of natural resources are affected by numerous factors including naturally occurring events, demand, inflation, interest rates, and local and international politics. As a non-diversified fund, fewer investments could have a greater effect on performance. See the Fund’s prospectus for more information on these and other risks.
The views expressed in this report reflect the current views of the respective parties. These views are not guarantees of future performance and involve certain risks, uncertainties and assumptions that are difficult to predict, so actual outcomes and results may differ significantly from the views expressed. These views are subject to change at any time based upon economic, market or other conditions and the respective parties disclaim any responsibility to update such views. These views may not be relied on as investment advice and, because investment decisions for a Columbia fund are based on numerous factors, may not be relied on as an indication of trading intent on behalf of any particular Columbia fund. References to specific securities should not be construed as a recommendation or investment advice.
| 6 | Columbia Global Energy and Natural Resources Fund | Annual Report 2018 |
Understanding Your Fund’s Expenses
(Unaudited)
As an investor, you incur two types of costs. There are shareholder transaction costs, which generally include sales charges on purchases and may include redemption fees. There are also ongoing costs, which generally include management fees, distribution and/or service fees, and other fund expenses. The following information is intended to help you understand your ongoing costs (in dollars) of investing in the Fund and to help you compare these costs with the ongoing costs of investing in other mutual funds.
Analyzing your Fund’s expenses
To illustrate these ongoing costs, we have provided examples and calculated the expenses paid by investors in each share class of the Fund during the period. The actual and hypothetical information in the table is based on an initial investment of $1,000 at the beginning of the period indicated and held for the entire period. Expense information is calculated two ways and each method provides you with different information. The amount listed in the “Actual” column is calculated using the Fund’s actual operating expenses and total return for the period. You may use the Actual information, together with the amount invested, to estimate the expenses that you paid over the period. Simply divide your account value by $1,000 (for example, an $8,600 account value divided by $1,000 = 8.6), then multiply the results by the expenses paid during the period under the “Actual” column. The amount listed in the “Hypothetical” column assumes a 5% annual rate of return before expenses (which is not the Fund’s actual return) and then applies the Fund’s actual expense ratio for the period to the hypothetical return. You should not use the hypothetical account values and expenses to estimate either your actual account balance at the end of the period or the expenses you paid during the period. See “Compare with other funds” below for details on how to use the hypothetical data.
Compare with other funds
Since all mutual funds are required to include the same hypothetical calculations about expenses in shareholder reports, you can use this information to compare the ongoing cost of investing in the Fund with other funds. To do so, compare the hypothetical example with the 5% hypothetical examples that appear in the shareholder reports of other funds. As you compare hypothetical examples of other funds, it is important to note that hypothetical examples are meant to highlight the ongoing costs of investing in a fund only and do not reflect any transaction costs, such as sales charges, or redemption or exchange fees. Therefore, the hypothetical calculations are useful in comparing ongoing costs only, and will not help you determine the relative total costs of owning different funds. If transaction costs were included in these calculations, your costs would be higher.
| March 1, 2018 — August 31, 2018 |
| | Account value at the
beginning of the
period ($) | Account value at the
end of the
period ($) | Expenses paid during
the period ($) | Fund’s annualized
expense ratio (%) |
| | Actual | Hypothetical | Actual | Hypothetical | Actual | Hypothetical | Actual |
| Class A | 1,000.00 | 1,000.00 | 1,060.40 | 1,018.70 | 6.70 | 6.56 | 1.29 |
| Advisor Class | 1,000.00 | 1,000.00 | 1,061.70 | 1,019.96 | 5.40 | 5.30 | 1.04 |
| Class C | 1,000.00 | 1,000.00 | 1,056.00 | 1,014.92 | 10.57 | 10.36 | 2.04 |
| Institutional Class | 1,000.00 | 1,000.00 | 1,061.80 | 1,019.96 | 5.40 | 5.30 | 1.04 |
| Institutional 2 Class | 1,000.00 | 1,000.00 | 1,062.50 | 1,020.62 | 4.73 | 4.63 | 0.91 |
| Institutional 3 Class | 1,000.00 | 1,000.00 | 1,062.80 | 1,020.92 | 4.42 | 4.33 | 0.85 |
| Class R | 1,000.00 | 1,000.00 | 1,059.20 | 1,017.44 | 7.99 | 7.83 | 1.54 |
Expenses paid during the period are equal to the annualized expense ratio for each class as indicated above, multiplied by the average account value over the period and then multiplied by the number of days in the Fund’s most recent fiscal half year and divided by 365.
Expenses do not include fees and expenses incurred indirectly by the Fund from its investment in underlying funds, including affiliated and non-affiliated pooled investment vehicles, such as mutual funds and exchange-traded funds.
Columbia Global Energy and Natural Resources Fund | Annual Report 2018
| 7 |
Portfolio of Investments
August 31, 2018
(Percentages represent value of investments compared to net assets)
Investments in securities
| Common Stocks 96.5% |
| Issuer | Shares | Value ($) |
| Australia 1.0% |
| BHP Billiton Ltd. | 101,204 | 2,431,161 |
| Canada 8.2% |
| Canadian Natural Resources Ltd. | 122,829 | 4,194,069 |
| First Quantum Minerals Ltd. | 137,031 | 1,718,925 |
| Suncor Energy, Inc. | 218,408 | 8,990,711 |
| TransCanada Corp. | 97,056 | 4,133,619 |
| Total | 19,037,324 |
| France 5.6% |
| Air Liquide SA | 19,209 | 2,419,208 |
| Arkema SA | 20,453 | 2,561,634 |
| Total SA | 127,196 | 7,953,515 |
| Total | 12,934,357 |
| Germany 3.4% |
| BASF SE | 63,144 | 5,840,830 |
| Covestro AG | 24,940 | 2,124,285 |
| Total | 7,965,115 |
| Japan 2.4% |
| Mitsubishi Chemical Holdings Corp. | 336,700 | 3,016,748 |
| Mitsui Chemicals, Inc. | 53,400 | 1,380,132 |
| Teijin Ltd. | 63,900 | 1,265,279 |
| Total | 5,662,159 |
| Luxembourg 1.3% |
| Tenaris SA, ADR | 89,050 | 2,986,737 |
| Netherlands 1.1% |
| Akzo Nobel NV | 13,317 | 1,244,655 |
| LyondellBasell Industries NV, Class A | 11,443 | 1,290,541 |
| Total | 2,535,196 |
| Switzerland 0.9% |
| Clariant AG, Registered Shares | 88,253 | 2,205,301 |
| United Kingdom 17.0% |
| BP PLC | 1,512,368 | 10,730,965 |
| Rio Tinto PLC | 212,381 | 10,074,741 |
| Royal Dutch Shell PLC, Class A | 446,317 | 14,474,374 |
| TechnipFMC PLC | 137,167 | 4,201,425 |
| Total | 39,481,505 |
| Common Stocks (continued) |
| Issuer | Shares | Value ($) |
| United States 55.6% |
| Alcoa Corp.(a) | 37,250 | 1,663,957 |
| Anadarko Petroleum Corp. | 61,420 | 3,955,448 |
| Andeavor | 31,040 | 4,742,602 |
| Avery Dennison Corp. | 23,100 | 2,429,658 |
| Baker Hughes, Inc. | 59,733 | 1,969,397 |
| Carrizo Oil & Gas, Inc.(a) | 43,030 | 1,042,187 |
| Celanese Corp., Class A | 28,844 | 3,369,844 |
| Chevron Corp. | 122,005 | 14,452,712 |
| Cimarex Energy Co. | 27,394 | 2,314,245 |
| ConocoPhillips | 131,720 | 9,672,200 |
| Continental Resources, Inc.(a) | 55,938 | 3,689,111 |
| Delek U.S. Holdings, Inc. | 35,660 | 1,943,470 |
| Diamondback Energy, Inc. | 30,360 | 3,675,989 |
| DowDuPont, Inc. | 175,018 | 12,274,012 |
| Eastman Chemical Co. | 32,906 | 3,192,869 |
| Exxon Mobil Corp. | 139,357 | 11,172,251 |
| FMC Corp. | 27,430 | 2,343,893 |
| Freeport-McMoRan, Inc. | 142,712 | 2,005,104 |
| Helmerich & Payne, Inc. | 40,550 | 2,658,863 |
| International Paper Co. | 19,799 | 1,012,521 |
| Marathon Petroleum Corp. | 24,940 | 2,052,313 |
| Noble Energy, Inc. | 94,171 | 2,798,762 |
| Nucor Corp. | 30,665 | 1,916,562 |
| Olympic Steel, Inc. | 58,330 | 1,285,593 |
| Owens-Illinois, Inc.(a) | 78,774 | 1,391,937 |
| Patterson-UTI Energy, Inc. | 135,810 | 2,326,425 |
| PDC Energy, Inc.(a) | 30,120 | 1,587,023 |
| PPG Industries, Inc. | 52,174 | 5,767,314 |
| Sealed Air Corp. | 58,270 | 2,337,210 |
| Steel Dynamics, Inc. | 102,953 | 4,708,041 |
| Valero Energy Corp. | 47,962 | 5,653,761 |
| WestRock Co. | 10,860 | 598,169 |
| Williams Companies, Inc. (The) | 139,958 | 4,141,357 |
The accompanying Notes to Financial Statements are an integral part of this statement.
| 8 | Columbia Global Energy and Natural Resources Fund | Annual Report 2018 |
Portfolio of Investments (continued)
August 31, 2018
| Common Stocks (continued) |
| Issuer | Shares | Value ($) |
| WPX Energy, Inc.(a) | 174,563 | 3,328,916 |
| Total | 129,473,716 |
Total Common Stocks
(Cost $183,169,605) | 224,712,571 |
|
| Exchange-Traded Funds 0.9% |
| | Shares | Value ($) |
| United States 0.9% |
| VanEck Vectors Gold Miners ETF | 115,832 | 2,148,683 |
Total Exchange-Traded Funds
(Cost $1,632,490) | 2,148,683 |
|
| Limited Partnerships 1.0% |
| Issuer | Shares | Value ($) |
| United States 1.0% |
| Enterprise Products Partners LP | 75,313 | 2,153,952 |
Total Limited Partnerships
(Cost $2,266,056) | 2,153,952 |
|
| Money Market Funds 0.2% |
| | Shares | Value ($) |
| Columbia Short-Term Cash Fund, 2.058%(b),(c) | 494,066 | 494,017 |
Total Money Market Funds
(Cost $494,017) | 494,017 |
Total Investments in Securities
(Cost $187,562,168) | 229,509,223 |
| Other Assets & Liabilities, Net | | 3,347,994 |
| Net Assets | $232,857,217 |
Notes to Portfolio of Investments
| (a) | Non-income producing investment. |
| (b) | The rate shown is the seven-day current annualized yield at August 31, 2018. |
| (c) | As defined in the Investment Company Act of 1940, an affiliated company is one in which the Fund owns 5% or more of the company’s outstanding voting securities, or a company which is under common ownership or control with the Fund. Holdings and transactions in these affiliated companies during the year ended August 31, 2018 are as follows: |
| Issuer | Beginning
shares | Shares
purchased | Shares
sold | Ending
shares | Realized gain
(loss) —
affiliated
issuers ($) | Net change in
unrealized
appreciation
(depreciation) —
affiliated
issuers ($) | Dividends —
affiliated
issuers ($) | Value —
affiliated
issuers
at end of
period ($) |
| Columbia Short-Term Cash Fund, 2.058% |
| | 950,586 | 40,191,587 | (40,648,107) | 494,066 | 250 | — | 31,148 | 494,017 |
Abbreviation Legend
| ADR | American Depositary Receipt |
Fair value measurements
The Fund categorizes its fair value measurements according to a three-level hierarchy that maximizes the use of observable inputs and minimizes the use of unobservable inputs by prioritizing that the most observable input be used when available. Observable inputs are those that market participants would use in pricing an investment based on market data obtained from sources independent of the reporting entity. Unobservable inputs are those that reflect the Fund’s assumptions about the information market participants would use in pricing an investment. An investment’s level within the fair value hierarchy is based on the lowest level of any input that is deemed significant to the asset’s or liability’s fair value measurement. The input levels are not necessarily an indication of the risk or liquidity associated with investments at that level. For example, certain U.S. government securities are generally high quality and liquid, however, they are reflected as Level 2 because the inputs used to determine fair value may not always be quoted prices in an active market.
Fair value inputs are summarized in the three broad levels listed below:
| ■ | Level 1 — Valuations based on quoted prices for investments in active markets that the Fund has the ability to access at the measurement date. Valuation adjustments are not applied to Level 1 investments. |
The accompanying Notes to Financial Statements are an integral part of this statement.
Columbia Global Energy and Natural Resources Fund | Annual Report 2018
| 9 |
Portfolio of Investments (continued)
August 31, 2018
Fair value measurements (continued)
| ■ | Level 2 — Valuations based on other significant observable inputs (including quoted prices for similar securities, interest rates, prepayment speeds, credit risks, etc.). |
| ■ | Level 3 — Valuations based on significant unobservable inputs (including the Fund’s own assumptions and judgment in determining the fair value of investments). |
Inputs that are used in determining fair value of an investment may include price information, credit data, volatility statistics, and other factors. These inputs can be either observable or unobservable. The availability of observable inputs can vary between investments, and is affected by various factors such as the type of investment, and the volume and level of activity for that investment or similar investments in the marketplace. The inputs will be considered by the Investment Manager, along with any other relevant factors in the calculation of an investment’s fair value. The Fund uses prices and inputs that are current as of the measurement date, which may include periods of market dislocations. During these periods, the availability of prices and inputs may be reduced for many investments. This condition could cause an investment to be reclassified between the various levels within the hierarchy.
Foreign equity securities actively traded in markets where there is a significant delay in the local close relative to the New York Stock Exchange are classified as Level 2. The values of these securities may include an adjustment to reflect the impact of significant market movements following the close of local trading, as described in Note 2 to the financial statements – Security valuation.
Certain investments that have been measured at fair value using the net asset value (NAV) per share (or its equivalent) are not categorized in the fair value hierarchy. The fair value amounts presented in the table are intended to reconcile the fair value hierarchy to the amounts presented in the Portfolio of Investments. The Columbia Short-Term Cash Fund seeks to provide shareholders with maximum current income consistent with liquidity and stability of principal. Columbia Short-Term Cash Fund prices its shares with a floating NAV and no longer seeks to maintain a stable NAV.
Investments falling into the Level 3 category are primarily supported by quoted prices from brokers and dealers participating in the market for those investments. However, these may be classified as Level 3 investments due to lack of market transparency and corroboration to support these quoted prices. Additionally, valuation models may be used as the pricing source for any remaining investments classified as Level 3. These models may rely on one or more significant unobservable inputs and/or significant assumptions by the Investment Manager. Inputs used in valuations may include, but are not limited to, financial statement analysis, capital account balances, discount rates and estimated cash flows, and comparable company data.
Under the direction of the Fund’s Board of Trustees (the Board), the Investment Manager’s Valuation Committee (the Committee) is responsible for overseeing the valuation procedures approved by the Board. The Committee consists of voting and non-voting members from various groups within the Investment Manager’s organization, including operations and accounting, trading and investments, compliance, risk management and legal.
The Committee meets at least monthly to review and approve valuation matters, which may include a description of specific valuation determinations, data regarding pricing information received from approved pricing vendors and brokers and the results of Board-approved valuation control policies and procedures (the Policies). The Policies address, among other things, instances when market quotations are or are not readily available, including recommendations of third party pricing vendors and a determination of appropriate pricing methodologies; events that require specific valuation determinations and assessment of fair value techniques; securities with a potential for stale pricing, including those that are illiquid, restricted, or in default; and the effectiveness of third party pricing vendors, including periodic reviews of vendors. The Committee meets more frequently, as needed, to discuss additional valuation matters, which may include the need to review back-testing results, review time-sensitive information or approve related valuation actions. The Committee reports to the Board, with members of the Committee meeting with the Board at each of its regularly scheduled meetings to discuss valuation matters and actions during the period, similar to those described earlier.
For investments categorized as Level 3, the Committee monitors information similar to that described above, which may include: (i) data specific to the issuer or comparable issuers, (ii) general market or specific sector news and (iii) quoted prices and specific or similar security transactions. The Committee considers this data and any changes from prior periods in order to assess the reasonableness of observable and unobservable inputs, any assumptions or internal models used to value those securities and changes in fair value. This data is also used to corroborate, when available, information received from approved pricing vendors and brokers. Various factors impact the frequency of monitoring this information (which may occur as often as daily). However, the Committee may determine that changes to inputs, assumptions and models are not required as a result of the monitoring procedures performed.
The following table is a summary of the inputs used to value the Fund’s investments at August 31, 2018:
| | Level 1
quoted prices
in active
markets for
identical
assets ($) | Level 2
other
significant
observable
inputs ($) | Level 3
significant
unobservable
inputs ($) | Investments
measured at
net asset
value ($) | Total ($) |
| Investments in Securities | | | | | |
| Common Stocks | | | | | |
| Australia | — | 2,431,161 | — | — | 2,431,161 |
| Canada | 19,037,324 | — | — | — | 19,037,324 |
| France | — | 12,934,357 | — | — | 12,934,357 |
| Germany | — | 7,965,115 | — | — | 7,965,115 |
| Japan | — | 5,662,159 | — | — | 5,662,159 |
| Luxembourg | 2,986,737 | — | — | — | 2,986,737 |
| Netherlands | 1,290,541 | 1,244,655 | — | — | 2,535,196 |
| Switzerland | — | 2,205,301 | — | — | 2,205,301 |
The accompanying Notes to Financial Statements are an integral part of this statement.
| 10 | Columbia Global Energy and Natural Resources Fund | Annual Report 2018 |
Portfolio of Investments (continued)
August 31, 2018
Fair value measurements (continued)
| | Level 1
quoted prices
in active
markets for
identical
assets ($) | Level 2
other
significant
observable
inputs ($) | Level 3
significant
unobservable
inputs ($) | Investments
measured at
net asset
value ($) | Total ($) |
| United Kingdom | 4,201,425 | 35,280,080 | — | — | 39,481,505 |
| United States | 129,473,716 | — | — | — | 129,473,716 |
| Total Common Stocks | 156,989,743 | 67,722,828 | — | — | 224,712,571 |
| Exchange-Traded Funds | 2,148,683 | — | — | — | 2,148,683 |
| Limited Partnerships | | | | | |
| United States | 2,153,952 | — | — | — | 2,153,952 |
| Total Limited Partnerships | 2,153,952 | — | — | — | 2,153,952 |
| Money Market Funds | — | — | — | 494,017 | 494,017 |
| Total Investments in Securities | 161,292,378 | 67,722,828 | — | 494,017 | 229,509,223 |
See the Portfolio of Investments for all investment classifications not indicated in the table.
The Fund’s assets assigned to the Level 2 input category are generally valued using the market approach, in which a security’s value is determined through reference to prices and information from market transactions for similar or identical assets. These assets include certain foreign securities for which a third party statistical pricing service may be employed for purposes of fair market valuation. The model utilized by such third party statistical pricing service takes into account a security’s correlation to available market data including, but not limited to, intraday index, ADR, and exchange-traded fund movements.
There were no transfers of financial assets between levels during the period.
The accompanying Notes to Financial Statements are an integral part of this statement.
Columbia Global Energy and Natural Resources Fund | Annual Report 2018
| 11 |
Statement of Assets and Liabilities
August 31, 2018
| Assets | |
| Investments in securities, at value | |
| Unaffiliated issuers (cost $187,068,151) | $229,015,206 |
| Affiliated issuers (cost $494,017) | 494,017 |
| Receivable for: | |
| Investments sold | 2,073,697 |
| Capital shares sold | 251,367 |
| Dividends | 1,136,880 |
| Foreign tax reclaims | 148,490 |
| Prepaid expenses | 1,551 |
| Trustees’ deferred compensation plan | 55,518 |
| Total assets | 233,176,726 |
| Liabilities | |
| Payable for: | |
| Capital shares purchased | 161,983 |
| Management services fees | 4,832 |
| Distribution and/or service fees | 1,084 |
| Transfer agent fees | 42,285 |
| Compensation of chief compliance officer | 16 |
| Audit fees | 37,225 |
| Other expenses | 16,566 |
| Trustees’ deferred compensation plan | 55,518 |
| Total liabilities | 319,509 |
| Net assets applicable to outstanding capital stock | $232,857,217 |
| Represented by | |
| Paid in capital | 214,713,042 |
| Undistributed net investment income | 1,265,833 |
| Accumulated net realized loss | (25,079,747) |
| Unrealized appreciation (depreciation) on: | |
| Investments - unaffiliated issuers | 41,947,055 |
| Foreign currency translations | 11,034 |
| Total - representing net assets applicable to outstanding capital stock | $232,857,217 |
The accompanying Notes to Financial Statements are an integral part of this statement.
| 12 | Columbia Global Energy and Natural Resources Fund | Annual Report 2018 |
Statement of Assets and Liabilities (continued)
August 31, 2018
| Class A | |
| Net assets | $80,674,971 |
| Shares outstanding | 4,030,393 |
| Net asset value per share | $20.02 |
| Maximum sales charge | 5.75% |
| Maximum offering price per share (calculated by dividing the net asset value per share by 1.0 minus the maximum sales charge for Class A shares) | $21.24 |
| Advisor Class | |
| Net assets | $11,360,434 |
| Shares outstanding | 550,337 |
| Net asset value per share | $20.64 |
| Class C | |
| Net assets | $12,065,413 |
| Shares outstanding | 639,592 |
| Net asset value per share | $18.86 |
| Institutional Class | |
| Net assets | $84,077,961 |
| Shares outstanding | 4,144,919 |
| Net asset value per share | $20.28 |
| Institutional 2 Class | |
| Net assets | $11,283,443 |
| Shares outstanding | 543,701 |
| Net asset value per share | $20.75 |
| Institutional 3 Class | |
| Net assets | $19,614,713 |
| Shares outstanding | 974,444 |
| Net asset value per share | $20.13 |
| Class R | |
| Net assets | $13,780,282 |
| Shares outstanding | 694,024 |
| Net asset value per share | $19.86 |
The accompanying Notes to Financial Statements are an integral part of this statement.
Columbia Global Energy and Natural Resources Fund | Annual Report 2018
| 13 |
Statement of Operations
Year Ended August 31, 2018
| Net investment income | |
| Income: | |
| Dividends — unaffiliated issuers | $7,273,071 |
| Dividends — affiliated issuers | 31,148 |
| Foreign taxes withheld | (376,811) |
| Total income | 6,927,408 |
| Expenses: | |
| Management services fees | 1,797,151 |
| Distribution and/or service fees | |
| Class A | 206,786 |
| Class C | 135,396 |
| Class R | 67,123 |
| Transfer agent fees | |
| Class A | 163,569 |
| Advisor Class | 19,667 |
| Class C | 26,771 |
| Institutional Class | 177,034 |
| Institutional 2 Class | 7,391 |
| Institutional 3 Class | 1,631 |
| Class K | 2 |
| Class R | 26,523 |
| Plan administration fees | |
| Class K | 7 |
| Compensation of board members | 18,029 |
| Custodian fees | 12,126 |
| Printing and postage fees | 44,743 |
| Registration fees | 108,422 |
| Audit fees | 42,744 |
| Legal fees | 5,634 |
| Compensation of chief compliance officer | 93 |
| Other | 25,292 |
| Total expenses | 2,886,134 |
| Expense reduction | (1,620) |
| Total net expenses | 2,884,514 |
| Net investment income | 4,042,894 |
| Realized and unrealized gain (loss) — net | |
| Net realized gain (loss) on: | |
| Investments — unaffiliated issuers | 11,746,516 |
| Investments — affiliated issuers | 250 |
| Foreign currency translations | 21,709 |
| Net realized gain | 11,768,475 |
| Net change in unrealized appreciation (depreciation) on: | |
| Investments — unaffiliated issuers | 19,081,704 |
| Foreign currency translations | 4,212 |
| Net change in unrealized appreciation (depreciation) | 19,085,916 |
| Net realized and unrealized gain | 30,854,391 |
| Net increase in net assets resulting from operations | $34,897,285 |
The accompanying Notes to Financial Statements are an integral part of this statement.
| 14 | Columbia Global Energy and Natural Resources Fund | Annual Report 2018 |
Statement of Changes in Net Assets
| | Year Ended
August 31, 2018 | Year Ended
August 31, 2017 |
| Operations | | |
| Net investment income | $4,042,894 | $4,354,146 |
| Net realized gain (loss) | 11,768,475 | (6,266,467) |
| Net change in unrealized appreciation (depreciation) | 19,085,916 | 17,034,247 |
| Net increase in net assets resulting from operations | 34,897,285 | 15,121,926 |
| Distributions to shareholders | | |
| Net investment income | | |
| Class A | (1,445,024) | (1,453,246) |
| Advisor Class | (156,587) | (121,661) |
| Class B | — | (5,638) |
| Class C | (151,980) | (187,945) |
| Class I | — | (289,335) |
| Institutional Class | (1,793,917) | (1,520,089) |
| Institutional 2 Class | (229,536) | (114,412) |
| Institutional 3 Class | (403,655) | — |
| Class K | (98) | (88) |
| Class R | (193,694) | (113,853) |
| Total distributions to shareholders | (4,374,491) | (3,806,267) |
| Decrease in net assets from capital stock activity | (20,534,140) | (34,920,402) |
| Total increase (decrease) in net assets | 9,988,654 | (23,604,743) |
| Net assets at beginning of year | 222,868,563 | 246,473,306 |
| Net assets at end of year | $232,857,217 | $222,868,563 |
| Undistributed net investment income | $1,265,833 | $1,451,625 |
The accompanying Notes to Financial Statements are an integral part of this statement.
Columbia Global Energy and Natural Resources Fund | Annual Report 2018
| 15 |
Statement of Changes in Net Assets (continued)
| | Year Ended | Year Ended |
| | August 31, 2018 | August 31, 2017 (a) |
| | Shares | Dollars ($) | Shares | Dollars ($) |
| Capital stock activity |
| Class A | | | | |
| Subscriptions | 661,572 | 13,031,482 | 831,117 | 14,602,433 |
| Distributions reinvested | 75,390 | 1,416,276 | 80,190 | 1,429,227 |
| Redemptions | (1,076,584) | (21,067,423) | (2,417,383) | (42,118,380) |
| Net decrease | (339,622) | (6,619,665) | (1,506,076) | (26,086,720) |
| Advisor Class | | | | |
| Subscriptions | 247,632 | 5,035,646 | 102,521 | 1,849,762 |
| Distributions reinvested | 7,344 | 141,815 | 6,057 | 110,783 |
| Redemptions | (112,516) | (2,281,118) | (157,940) | (2,865,286) |
| Net increase (decrease) | 142,460 | 2,896,343 | (49,362) | (904,741) |
| Class B | | | | |
| Distributions reinvested | — | — | 288 | 4,926 |
| Redemptions | — | — | (35,052) | (581,102) |
| Net decrease | — | — | (34,764) | (576,176) |
| Class C | | | | |
| Subscriptions | 102,273 | 1,912,046 | 86,394 | 1,430,560 |
| Distributions reinvested | 7,877 | 141,468 | 9,813 | 167,893 |
| Redemptions | (242,794) | (4,519,588) | (296,481) | (4,915,551) |
| Net decrease | (132,644) | (2,466,074) | (200,274) | (3,317,098) |
| Class I | | | | |
| Subscriptions | — | — | 19,262 | 353,299 |
| Distributions reinvested | — | — | 16,040 | 289,295 |
| Redemptions | — | — | (1,098,560) | (19,532,630) |
| Net decrease | — | — | (1,063,258) | (18,890,036) |
| Institutional Class | | | | |
| Subscriptions | 620,373 | 12,368,220 | 1,081,284 | 19,162,038 |
| Distributions reinvested | 91,583 | 1,737,180 | 81,673 | 1,468,582 |
| Redemptions | (1,496,768) | (29,448,966) | (1,670,089) | (29,571,451) |
| Net decrease | (784,812) | (15,343,566) | (507,132) | (8,940,831) |
| Institutional 2 Class | | | | |
| Subscriptions | 198,787 | 4,061,233 | 311,320 | 5,656,436 |
| Distributions reinvested | 11,842 | 229,492 | 6,236 | 114,379 |
| Redemptions | (217,629) | (4,491,709) | (145,170) | (2,621,842) |
| Net increase (decrease) | (7,000) | (200,984) | 172,386 | 3,148,973 |
| Institutional 3 Class | | | | |
| Subscriptions | 130,544 | 2,602,046 | 980,098 | 17,141,454 |
| Distributions reinvested | 21,478 | 403,598 | — | — |
| Redemptions | (149,392) | (3,000,245) | (8,284) | (145,003) |
| Net increase | 2,630 | 5,399 | 971,814 | 16,996,451 |
| Class K | | | | |
| Distributions reinvested | 3 | 59 | 3 | 56 |
| Redemptions | (276) | (5,362) | (42) | (750) |
| Net decrease | (273) | (5,303) | (39) | (694) |
| Class R | | | | |
| Subscriptions | 405,386 | 7,851,994 | 492,942 | 8,590,740 |
| Distributions reinvested | 10,352 | 193,694 | 6,396 | 113,853 |
| Redemptions | (354,008) | (6,845,978) | (289,032) | (5,054,123) |
| Net increase | 61,730 | 1,199,710 | 210,306 | 3,650,470 |
| Total net decrease | (1,057,531) | (20,534,140) | (2,006,399) | (34,920,402) |
| (a) | Institutional 3 Class shares are based on operations from March 1, 2017 (commencement of operations) through the stated period end. |
The accompanying Notes to Financial Statements are an integral part of this statement.
| 16 | Columbia Global Energy and Natural Resources Fund | Annual Report 2018 |
[THIS PAGE INTENTIONALLY LEFT BLANK]
Columbia Global Energy and Natural Resources Fund | Annual Report 2018
| 17 |
The following table is intended to help you understand the Fund’s financial performance. Certain information reflects financial results for a single share of a class held for the periods shown. Per share net investment income (loss) amounts are calculated based on average shares outstanding during the period. Total return assumes reinvestment of all dividends and distributions, if any. Total return does not reflect payment of sales charges, if any. Total return and portfolio turnover are not annualized for periods of less than one year. The portfolio turnover rate is calculated without regard to purchase and sales transactions of short-term instruments and certain derivatives, if any. If such transactions were included, the Fund’s portfolio turnover rate may be higher.
| | Net asset value,
beginning of
period | Net
investment
income | Net
realized
and
unrealized
gain (loss) | Total from
investment
operations | Distributions
from net
investment
income | Distributions
from net
realized
gains | Total
distributions to
shareholders |
| Class A |
| Year Ended 8/31/2018 | $17.57 | 0.31 | 2.48 | 2.79 | (0.34) | — | (0.34) |
| Year Ended 8/31/2017 | $16.77 | 0.30 | 0.77 | 1.07 | (0.27) | — | (0.27) |
| Year Ended 8/31/2016 | $15.89 | 0.32 | 0.56 | 0.88 | — | — | — |
| Year Ended 8/31/2015 | $24.98 | 0.29 | (7.95) | (7.66) | — | (1.43) | (1.43) |
| Year Ended 8/31/2014 | $21.07 | 0.26 | 4.10 | 4.36 | (0.14) | (0.31) | (0.45) |
| Advisor Class |
| Year Ended 8/31/2018 | $18.10 | 0.38 | 2.54 | 2.92 | (0.38) | — | (0.38) |
| Year Ended 8/31/2017 | $17.26 | 0.36 | 0.77 | 1.13 | (0.29) | — | (0.29) |
| Year Ended 8/31/2016 | $16.30 | 0.37 | 0.59 | 0.96 | — | — | — |
| Year Ended 8/31/2015 | $25.52 | 0.34 | (8.13) | (7.79) | — | (1.43) | (1.43) |
| Year Ended 8/31/2014 | $21.51 | 0.35 | 4.17 | 4.52 | (0.20) | (0.31) | (0.51) |
| Class C |
| Year Ended 8/31/2018 | $16.57 | 0.15 | 2.34 | 2.49 | (0.20) | — | (0.20) |
| Year Ended 8/31/2017 | $15.89 | 0.16 | 0.72 | 0.88 | (0.20) | — | (0.20) |
| Year Ended 8/31/2016 | $15.17 | 0.20 | 0.52 | 0.72 | — | — | — |
| Year Ended 8/31/2015 | $24.10 | 0.14 | (7.64) | (7.50) | — | (1.43) | (1.43) |
| Year Ended 8/31/2014 | $20.36 | 0.08 | 3.97 | 4.05 | — | (0.31) | (0.31) |
| Institutional Class |
| Year Ended 8/31/2018 | $17.79 | 0.36 | 2.51 | 2.87 | (0.38) | — | (0.38) |
| Year Ended 8/31/2017 | $16.97 | 0.35 | 0.76 | 1.11 | (0.29) | — | (0.29) |
| Year Ended 8/31/2016 | $16.03 | 0.37 | 0.57 | 0.94 | — | — | — |
| Year Ended 8/31/2015 | $25.12 | 0.33 | (7.99) | (7.66) | — | (1.43) | (1.43) |
| Year Ended 8/31/2014 | $21.19 | 0.32 | 4.12 | 4.44 | (0.20) | (0.31) | (0.51) |
| Institutional 2 Class |
| Year Ended 8/31/2018 | $18.20 | 0.40 | 2.56 | 2.96 | (0.41) | — | (0.41) |
| Year Ended 8/31/2017 | $17.33 | 0.40 | 0.77 | 1.17 | (0.30) | — | (0.30) |
| Year Ended 8/31/2016 | $16.35 | 0.41 | 0.57 | 0.98 | — | — | — |
| Year Ended 8/31/2015 | $25.54 | 0.39 | (8.15) | (7.76) | — | (1.43) | (1.43) |
| Year Ended 8/31/2014 | $21.53 | 0.37 | 4.19 | 4.56 | (0.24) | (0.31) | (0.55) |
| Institutional 3 Class |
| Year Ended 8/31/2018 | $17.66 | 0.40 | 2.48 | 2.88 | (0.41) | — | (0.41) |
| Year Ended 8/31/2017(d) | $18.04 | 0.23 | (0.61) (e) | (0.38) | — | — | — |
The accompanying Notes to Financial Statements are an integral part of this statement.
| 18 | Columbia Global Energy and Natural Resources Fund | Annual Report 2018 |
Financial Highlights (continued)
| | Net
asset
value,
end of
period | Total
return | Total gross
expense
ratio to
average
net assets(a) | Total net
expense
ratio to
average
net assets(a),(b) | Net investment
income
ratio to
average
net assets | Portfolio
turnover | Net
assets,
end of
period
(000’s) |
| Class A |
| Year Ended 8/31/2018 | $20.02 | 15.99% | 1.30% | 1.30% (c) | 1.59% | 37% | $80,675 |
| Year Ended 8/31/2017 | $17.57 | 6.34% | 1.34% | 1.34% (c) | 1.70% | 19% | $76,763 |
| Year Ended 8/31/2016 | $16.77 | 5.54% | 1.33% | 1.33% (c) | 2.06% | 45% | $98,566 |
| Year Ended 8/31/2015 | $15.89 | (31.16%) | 1.32% | 1.32% (c) | 1.48% | 51% | $86,133 |
| Year Ended 8/31/2014 | $24.98 | 21.00% | 1.30% | 1.30% (c) | 1.13% | 34% | $130,692 |
| Advisor Class |
| Year Ended 8/31/2018 | $20.64 | 16.28% | 1.05% | 1.05% (c) | 1.89% | 37% | $11,360 |
| Year Ended 8/31/2017 | $18.10 | 6.52% | 1.10% | 1.10% (c) | 1.98% | 19% | $7,383 |
| Year Ended 8/31/2016 | $17.26 | 5.89% | 1.09% | 1.09% (c) | 2.30% | 45% | $7,890 |
| Year Ended 8/31/2015 | $16.30 | (31.00%) | 1.07% | 1.07% (c) | 1.69% | 51% | $7,191 |
| Year Ended 8/31/2014 | $25.52 | 21.32% | 1.05% | 1.05% (c) | 1.49% | 34% | $12,899 |
| Class C |
| Year Ended 8/31/2018 | $18.86 | 15.10% | 2.05% | 2.05% (c) | 0.83% | 37% | $12,065 |
| Year Ended 8/31/2017 | $16.57 | 5.52% | 2.09% | 2.09% (c) | 0.96% | 19% | $12,796 |
| Year Ended 8/31/2016 | $15.89 | 4.75% | 2.09% | 2.09% (c) | 1.34% | 45% | $15,457 |
| Year Ended 8/31/2015 | $15.17 | (31.66%) | 2.07% | 2.07% (c) | 0.77% | 51% | $14,428 |
| Year Ended 8/31/2014 | $24.10 | 20.07% | 2.05% | 2.05% (c) | 0.38% | 34% | $16,745 |
| Institutional Class |
| Year Ended 8/31/2018 | $20.28 | 16.29% | 1.05% | 1.05% (c) | 1.83% | 37% | $84,078 |
| Year Ended 8/31/2017 | $17.79 | 6.51% | 1.10% | 1.10% (c) | 1.98% | 19% | $87,719 |
| Year Ended 8/31/2016 | $16.97 | 5.86% | 1.09% | 1.09% (c) | 2.35% | 45% | $92,245 |
| Year Ended 8/31/2015 | $16.03 | (30.97%) | 1.07% | 1.07% (c) | 1.68% | 51% | $98,857 |
| Year Ended 8/31/2014 | $25.12 | 21.29% | 1.05% | 1.05% (c) | 1.36% | 34% | $174,759 |
| Institutional 2 Class |
| Year Ended 8/31/2018 | $20.75 | 16.42% | 0.92% | 0.92% | 1.97% | 37% | $11,283 |
| Year Ended 8/31/2017 | $18.20 | 6.76% | 0.94% | 0.94% | 2.22% | 19% | $10,022 |
| Year Ended 8/31/2016 | $17.33 | 5.99% | 0.91% | 0.91% | 2.53% | 45% | $6,558 |
| Year Ended 8/31/2015 | $16.35 | (30.85%) | 0.89% | 0.89% | 1.97% | 51% | $4,978 |
| Year Ended 8/31/2014 | $25.54 | 21.53% | 0.87% | 0.87% | 1.58% | 34% | $4,578 |
| Institutional 3 Class |
| Year Ended 8/31/2018 | $20.13 | 16.51% | 0.87% | 0.87% | 2.04% | 37% | $19,615 |
| Year Ended 8/31/2017(d) | $17.66 | (2.11%) | 0.91% (f) | 0.91% (f) | 2.66% (f) | 19% | $17,163 |
The accompanying Notes to Financial Statements are an integral part of this statement.
Columbia Global Energy and Natural Resources Fund | Annual Report 2018
| 19 |
Financial Highlights (continued)
| | Net asset value,
beginning of
period | Net
investment
income | Net
realized
and
unrealized
gain (loss) | Total from
investment
operations | Distributions
from net
investment
income | Distributions
from net
realized
gains | Total
distributions to
shareholders |
| Class R |
| Year Ended 8/31/2018 | $17.43 | 0.26 | 2.46 | 2.72 | (0.29) | — | (0.29) |
| Year Ended 8/31/2017 | $16.66 | 0.27 | 0.75 | 1.02 | (0.25) | — | (0.25) |
| Year Ended 8/31/2016 | $15.83 | 0.29 | 0.54 | 0.83 | — | — | — |
| Year Ended 8/31/2015 | $24.94 | 0.25 | (7.93) | (7.68) | — | (1.43) | (1.43) |
| Year Ended 8/31/2014 | $21.03 | 0.21 | 4.10 | 4.31 | (0.09) | (0.31) | (0.40) |
| Notes to Financial Highlights |
| (a) | In addition to the fees and expenses that the Fund bears directly, the Fund indirectly bears a pro rata share of the fees and expenses of any other funds in which it invests. Such indirect expenses are not included in the Fund’s reported expense ratios. |
| (b) | Total net expenses include the impact of certain fee waivers/expense reimbursements made by the Investment Manager and certain of its affiliates, if applicable. |
| (c) | The benefits derived from expense reductions had an impact of less than 0.01%. |
| (d) | Institutional 3 Class shares commenced operations on March 1, 2017. Per share data and total return reflect activity from that date. |
| (e) | Calculation of the net gain (loss) per share (both realized and unrealized) does not correlate to the aggregate realized and unrealized gain (loss) presented in the Statement of Operations due to the timing of subscriptions and redemptions of Fund shares in relation to fluctuations in the market value of the portfolio. |
| (f) | Annualized. |
The accompanying Notes to Financial Statements are an integral part of this statement.
| 20 | Columbia Global Energy and Natural Resources Fund | Annual Report 2018 |
Financial Highlights (continued)
| | Net
asset
value,
end of
period | Total
return | Total gross
expense
ratio to
average
net assets(a) | Total net
expense
ratio to
average
net assets(a),(b) | Net investment
income
ratio to
average
net assets | Portfolio
turnover | Net
assets,
end of
period
(000’s) |
| Class R |
| Year Ended 8/31/2018 | $19.86 | 15.71% | 1.55% | 1.55% (c) | 1.35% | 37% | $13,780 |
| Year Ended 8/31/2017 | $17.43 | 6.07% | 1.60% | 1.60% (c) | 1.53% | 19% | $11,019 |
| Year Ended 8/31/2016 | $16.66 | 5.24% | 1.59% | 1.59% (c) | 1.84% | 45% | $7,031 |
| Year Ended 8/31/2015 | $15.83 | (31.29%) | 1.57% | 1.57% (c) | 1.30% | 51% | $3,045 |
| Year Ended 8/31/2014 | $24.94 | 20.73% | 1.55% | 1.55% (c) | 0.90% | 34% | $3,131 |
The accompanying Notes to Financial Statements are an integral part of this statement.
Columbia Global Energy and Natural Resources Fund | Annual Report 2018
| 21 |
Notes to Financial Statements
August 31, 2018
Note 1. Organization
Columbia Global Energy and Natural Resources Fund (the Fund), a series of Columbia Funds Series Trust I (the Trust), is a non-diversified fund. The Trust is registered under the Investment Company Act of 1940, as amended (the 1940 Act), as an open-end management investment company organized as a Massachusetts business trust.
Fund shares
The Trust may issue an unlimited number of shares (without par value). Although all share classes generally have identical voting, dividend and liquidation rights, each share class votes separately when required by the Trust’s organizational documents or by law. Different share classes pay different distribution amounts to the extent the expenses of such share classes differ, and distributions in liquidation will be proportional to the net asset value of each share class. Each share class has its own expense and sales charge structure. The Fund offers each of the share classes identified below.
Class A shares are subject to a maximum front-end sales charge of 5.75% based on the initial investment amount. Class A shares purchased without an initial sales charge in accounts aggregating $1 million to $50 million at the time of purchase are subject to a contingent deferred sales charge (CDSC) if the shares are sold within 18 months after purchase, charged as follows: 1.00% CDSC if redeemed within 12 months after purchase, and 0.50% CDSC if redeemed more than 12, but less than 18, months after purchase.
Advisor Class shares are not subject to sales charges and are generally available only to omnibus retirement plans and certain investors as described in the Fund’s prospectus. Prior to November 1, 2017, Advisor Class shares were known as Class R4 shares.
Class C shares are subject to a 1.00% CDSC on shares redeemed within 12 months after purchase. Effective July 1, 2018, Class C shares will automatically convert to Class A shares of the same Fund in the month of or the month following the 10-year anniversary of the Class C shares purchase date.
Institutional Class shares are not subject to sales charges and are generally available only to eligible investors, which are subject to different investment minimums as described in the Fund’s prospectus. Prior to November 1, 2017, Institutional Class shares were known as Class Z shares.
Institutional 2 Class shares are not subject to sales charges and are generally available only to investors purchasing through authorized investment professionals and omnibus retirement plans as described in the Fund’s prospectus. Prior to November 1, 2017, Institutional 2 Class shares were known as Class R5 shares.
Institutional 3 Class shares are not subject to sales charges and are available to institutional and certain other investors as described in the Fund’s prospectus. Prior to November 1, 2017, Institutional 3 Class shares were known as Class Y shares.
The Fund no longer accepts investments by existing investors in Class K shares. When available, Class K shares were not subject to sales charges and were made available only to existing investors in Class K shares. On March 9, 2018, Class K shares were redeemed or exchanged for Advisor Class shares of the Fund in a tax free transaction that had no impact on fees and expenses paid by the shareholders.
Class R shares are not subject to sales charges and are generally available only to certain retirement plans and other investors as described in the Fund’s prospectus.
Note 2. Summary of significant accounting policies
Basis of preparation
The Fund is an investment company that applies the accounting and reporting guidance in the Financial Accounting Standards Board (FASB) Accounting Standards Codification Topic 946, Financial Services - Investment Companies (ASC 946). The financial statements are prepared in accordance with U.S. generally accepted accounting principles (GAAP), which requires management to make certain estimates and assumptions that affect the reported amounts of assets and liabilities, the disclosure of contingent assets and liabilities at the date of the financial statements and the reported amounts of income and expenses during the reporting period. Actual results could differ from those estimates.
| 22 | Columbia Global Energy and Natural Resources Fund | Annual Report 2018 |
Notes to Financial Statements (continued)
August 31, 2018
The following is a summary of significant accounting policies followed by the Fund in the preparation of its financial statements.
Security valuation
All equity securities and exchange-traded funds are valued at the close of business of the New York Stock Exchange. Equity securities and exchange-traded funds are valued at the last quoted sales price on the principal exchange or market on which they trade, except for securities traded on the NASDAQ Stock Market, which are valued at the NASDAQ official close price. Unlisted securities or listed securities for which there were no sales during the day are valued at the mean of the latest quoted bid and ask prices on such exchanges or markets.
Foreign equity securities are valued based on the closing price on the foreign exchange in which such securities are primarily traded. If any foreign equity security closing prices are not readily available, the securities are valued at the mean of the latest quoted bid and ask prices on such exchanges or markets. Foreign currency exchange rates are generally determined at 4:00 p.m. Eastern (U.S.) time. Many securities markets and exchanges outside the U.S. close prior to the close of the New York Stock Exchange; therefore, the closing prices for securities in such markets or on such exchanges may not fully reflect events that occur after such close but before the close of the New York Stock Exchange. In those situations, foreign securities will be fair valued pursuant to a policy adopted by the Board of Trustees, including, if available, utilizing a third party pricing service to determine these fair values. The third party pricing service takes into account multiple factors, including, but not limited to, movements in the U.S. securities markets, certain depositary receipts, futures contracts and foreign exchange rates that have occurred subsequent to the close of the foreign exchange or market, to determine a good faith estimate that reasonably reflects the current market conditions as of the close of the New York Stock Exchange. The fair value of a security is likely to be different from the quoted or published price, if available.
Investments in open-end investment companies, including money market funds, are valued at their latest net asset value.
Investments for which market quotations are not readily available, or that have quotations which management believes are not reflective of market value or reliable, are valued at fair value as determined in good faith under procedures approved by and under the general supervision of the Board of Trustees. If a security or class of securities (such as foreign securities) is valued at fair value, such value is likely to be different from the quoted or published price for the security.
The determination of fair value often requires significant judgment. To determine fair value, management may use assumptions including but not limited to future cash flows and estimated risk premiums. Multiple inputs from various sources may be used to determine fair value.
GAAP requires disclosure regarding the inputs and valuation techniques used to measure fair value and any changes in valuation inputs or techniques. In addition, investments shall be disclosed by major category. This information is disclosed following the Fund’s Portfolio of Investments.
Foreign currency transactions and translations
The values of all assets and liabilities denominated in foreign currencies are generally translated into U.S. dollars at exchange rates determined at the close of regular trading on the New York Stock Exchange. Net realized and unrealized gains (losses) on foreign currency transactions and translations include gains (losses) arising from the fluctuation in exchange rates between trade and settlement dates on securities transactions, gains (losses) arising from the disposition of foreign currency and currency gains (losses) between the accrual and payment dates on dividends, interest income and foreign withholding taxes.
For financial statement purposes, the Fund does not distinguish that portion of gains (losses) on investments which is due to changes in foreign exchange rates from that which is due to changes in market prices of the investments. Such fluctuations are included with the net realized and unrealized gains (losses) on investments in the Statement of Operations.
Security transactions
Security transactions are accounted for on the trade date. Cost is determined and gains (losses) are based upon the specific identification method for both financial statement and federal income tax purposes.
Columbia Global Energy and Natural Resources Fund | Annual Report 2018
| 23 |
Notes to Financial Statements (continued)
August 31, 2018
Income recognition
Corporate actions and dividend income are generally recorded net of any non-reclaimable tax withholdings, on the ex-dividend date or upon receipt of ex-dividend notification in the case of certain foreign securities.
The Fund may receive distributions from holdings in equity securities, business development companies (BDCs), exchange-traded funds (ETFs), limited partnerships (LPs), other regulated investment companies (RICs), and real estate investment trusts (REITs), which report information on the tax character of their distributions annually. These distributions are allocated to dividend income, capital gain and return of capital based on actual information reported. Return of capital is recorded as a reduction of the cost basis of securities held. If the Fund no longer owns the applicable securities, return of capital is recorded as a realized gain. With respect to REITs, to the extent actual information has not yet been reported, estimates for return of capital are made by the Fund’s management. Management’s estimates are subsequently adjusted when the actual character of the distributions is disclosed by the REITs, which could result in a proportionate change in return of capital to shareholders.
Awards from class action litigation are recorded as a reduction of cost basis if the Fund still owns the applicable securities on the payment date. If the Fund no longer owns the applicable securities, the proceeds are recorded as realized gains.
Expenses
General expenses of the Trust are allocated to the Fund and other funds of the Trust based upon relative net assets or other expense allocation methodologies determined by the nature of the expense. Expenses directly attributable to the Fund are charged to the Fund. Expenses directly attributable to a specific class of shares are charged to that share class.
Determination of class net asset value
All income, expenses (other than class-specific expenses, which are charged to that share class, as shown in the Statement of Operations) and realized and unrealized gains (losses) are allocated to each class of the Fund on a daily basis, based on the relative net assets of each class, for purposes of determining the net asset value of each class.
Federal income tax status
The Fund intends to qualify each year as a regulated investment company under Subchapter M of the Internal Revenue Code, as amended, and will distribute substantially all of its investment company taxable income and net capital gain, if any, for its tax year, and as such will not be subject to federal income taxes. In addition, the Fund intends to distribute in each calendar year substantially all of its ordinary income, capital gain net income and certain other amounts, if any, such that the Fund should not be subject to federal excise tax. Therefore, no federal income or excise tax provision is recorded.
Foreign taxes
The Fund may be subject to foreign taxes on income, gains on investments or currency repatriation, a portion of which may be recoverable. The Fund will accrue such taxes and recoveries, as applicable, based upon its current interpretation of tax rules and regulations that exist in the markets in which it invests.
Realized gains in certain countries may be subject to foreign taxes at the Fund level, based on statutory rates. The Fund accrues for such foreign taxes on realized and unrealized gains at the appropriate rate for each jurisdiction, as applicable. The amount, if any, is disclosed as a liability on the Statement of Assets and Liabilities.
Distributions to shareholders
Distributions from net investment income, if any, are declared and paid each calendar quarter. Net realized capital gains, if any, are distributed at least annually. Income distributions and capital gain distributions are determined in accordance with federal income tax regulations, which may differ from GAAP.
| 24 | Columbia Global Energy and Natural Resources Fund | Annual Report 2018 |
Notes to Financial Statements (continued)
August 31, 2018
Guarantees and indemnifications
Under the Trust’s organizational documents and, in some cases, by contract, its officers and trustees are indemnified against certain liabilities arising out of the performance of their duties to the Trust or its funds. In addition, certain of the Fund’s contracts with its service providers contain general indemnification clauses. The Fund’s maximum exposure under these arrangements is unknown since the amount of any future claims that may be made against the Fund cannot be determined, and the Fund has no historical basis for predicting the likelihood of any such claims.
Recent accounting pronouncement
Accounting Standards Update 2017-08 Premium Amortization on Purchased Callable Debt Securities
In March 2017, the Financial Accounting Standards Board issued Accounting Standards Update (ASU) No. 2017-08 Premium Amortization on Purchased Callable Debt Securities. ASU No. 2017-08 updates the accounting standards to shorten the amortization period for certain purchased callable debt securities, held at a premium, to be amortized to the earliest call date. The update applies to securities with explicit, noncontingent call features that are callable at fixed prices and on preset dates. The standard is effective for annual periods beginning after December 15, 2018 and interim periods within those fiscal years. At this time, management is evaluating the implication of this guidance and the impact it will have on the financial statement amounts and footnote disclosures, if any.
Note 3. Fees and other transactions with affiliates
Management services fees
The Fund has entered into a Management Agreement with Columbia Management Investment Advisers, LLC (the Investment Manager), a wholly-owned subsidiary of Ameriprise Financial, Inc. (Ameriprise Financial). Under the Management Agreement, the Investment Manager provides the Fund with investment research and advice, as well as administrative and accounting services. The management services fee is an annual fee that is equal to a percentage of the Fund’s daily net assets that declines from 0.75% to 0.58% as the Fund’s net assets increase. The effective management services fee rate for the year ended August 31, 2018 was 0.75% of the Fund’s average daily net assets.
Compensation of board members
Members of the Board of Trustees who are not officers or employees of the Investment Manager or Ameriprise Financial are compensated for their services to the Fund as disclosed in the Statement of Operations. These members of the Board of Trustees may participate in a Deferred Compensation Plan (the Plan) which may be terminated at any time. Obligations of the Plan will be paid solely out of the Fund’s assets, and all amounts payable under the Plan constitute a general unsecured obligation of the Fund.
Compensation of Chief Compliance Officer
The Board of Trustees has appointed a Chief Compliance Officer to the Fund in accordance with federal securities regulations. As disclosed in the Statement of Operations, a portion of the Chief Compliance Officer’s total compensation is allocated to the Fund, along with other allocations to affiliated funds governed by the Board of Trustees, based on relative net assets.
Transfer agency fees
Under a Transfer and Dividend Disbursing Agent Agreement, Columbia Management Investment Services Corp. (the Transfer Agent), an affiliate of the Investment Manager and a wholly-owned subsidiary of Ameriprise Financial, is responsible for providing transfer agency services to the Fund. The Transfer Agent has contracted with DST Asset Manager Solutions, Inc. (DST) to serve as sub-transfer agent. The Transfer Agent pays the fees of DST for services as sub-transfer agent and DST is not entitled to reimbursement for such fees from the Fund (with the exception of out-of-pocket fees).
Columbia Global Energy and Natural Resources Fund | Annual Report 2018
| 25 |
Notes to Financial Statements (continued)
August 31, 2018
The Fund pays the Transfer Agent a monthly transfer agency fee based on the number or the average value of accounts, depending on the type of account. In addition, the Fund pays the Transfer Agent a fee for shareholder services based on the number of accounts or on a percentage of the average aggregate value of the Fund’s shares maintained in omnibus accounts up to the lesser of the amount charged by the financial intermediary or a cap established by the Board of Trustees from time to time.
The Transfer Agent also receives compensation from the Fund for various shareholder services and reimbursements for certain out-of-pocket fees. Total transfer agency fees for Class K, Institutional 2 Class and Institutional 3 Class shares are subject to an annual limitation of not more than 0.07%, 0.07% and 0.02%, respectively, of the average daily net assets attributable to each share class.
For the year ended August 31, 2018, the Fund’s effective transfer agency fee rates as a percentage of average daily net assets of each class were as follows:
| | Effective rate (%) |
| Class A | 0.20 |
| Advisor Class | 0.20 |
| Class C | 0.20 |
| Institutional Class | 0.20 |
| Institutional 2 Class | 0.06 |
| Institutional 3 Class | 0.01 |
| Class K | 0.04 (a) |
| Class R | 0.20 |
An annual minimum account balance fee of $20 may apply to certain accounts with a value below the applicable share class’s initial minimum investment requirements to reduce the impact of small accounts on transfer agency fees. These minimum account balance fees are remitted to the Fund and recorded as part of expense reductions in the Statement of Operations. For the year ended August 31, 2018, these minimum account balance fees reduced total expenses of the Fund by $1,620.
Plan administration fees
Under a Plan Administration Services Agreement with the Transfer Agent, the Fund paid an annual fee at a rate of 0.25% of the Fund’s average daily net assets attributable to Class K shares for the provision of various administrative, recordkeeping, communication and educational services. As a result of all Class K shares of the Fund being redeemed or exchanged for Advisor Class shares, March 9, 2018 was the last day the Fund paid a plan administration fee for Class K shares.
Distribution and service fees
The Fund has entered into an agreement with Columbia Management Investment Distributors, Inc. (the Distributor), an affiliate of the Investment Manager and a wholly-owned subsidiary of Ameriprise Financial, for distribution and shareholder services. The Board of Trustees has approved, and the Fund has adopted, distribution and shareholder service plans (the Plans) applicable to certain share classes, which set the distribution and service fees for the Fund. These fees are calculated daily and are intended to compensate the Distributor and/or eligible selling and/or servicing agents for selling shares of the Fund and providing services to investors.
Under the Plans, the Fund pays a monthly service fee to the Distributor at the maximum annual rate of 0.25% of the average daily net assets attributable to Class A and Class C shares of the Fund. Also under the Plans, the Fund pays a monthly distribution fee to the Distributor at the maximum annual rates of 0.75% and 0.50% of the average daily net assets attributable to Class C and Class R shares of the Fund, respectively.
| 26 | Columbia Global Energy and Natural Resources Fund | Annual Report 2018 |
Notes to Financial Statements (continued)
August 31, 2018
Sales charges (unaudited)
Sales charges, including front-end charges and CDSCs, received by the Distributor for distributing Fund shares for the year ended August 31, 2018, if any, are listed below:
| | Amount ($) |
| Class A | 59,850 |
| Class C | 331 |
Expenses waived/reimbursed by the Investment Manager and its affiliates
The Investment Manager and certain of its affiliates have contractually agreed to waive fees and/or reimburse expenses (excluding certain fees and expenses described below) for the period(s) disclosed below, unless sooner terminated at the sole discretion of the Board of Trustees, so that the Fund’s net operating expenses, after giving effect to fees waived/expenses reimbursed and any balance credits and/or overdraft charges from the Fund’s custodian, do not exceed the following annual rate(s) as a percentage of the class’ average daily net assets:
| | January 1, 2018
through
December 31, 2018 | Prior to
January 1, 2018 |
| Class A | 1.42% | 1.43% |
| Advisor Class | 1.17 | 1.18 |
| Class C | 2.17 | 2.18 |
| Institutional Class | 1.17 | 1.18 |
| Institutional 2 Class | 1.03 | 1.095 |
| Institutional 3 Class | 0.98 | 1.045 |
| Class R | 1.67 | 1.68 |
Under the agreement governing these fee waivers and/or expense reimbursement arrangements, the following fees and expenses are excluded from the waiver/reimbursement commitment, and therefore will be paid by the Fund, if applicable: taxes (including foreign transaction taxes), expenses associated with investments in affiliated and non-affiliated pooled investment vehicles (including mutual funds and exchange-traded funds), transaction costs and brokerage commissions, costs related to any securities lending program, dividend expenses associated with securities sold short, inverse floater program fees and expenses, transaction charges and interest on borrowed money, interest, infrequent and/or unusual expenses and any other expenses the exclusion of which is specifically approved by the Board of Trustees. This agreement may be modified or amended only with approval from the Investment Manager, certain of its affiliates and the Fund. Any fees waived and/or expenses reimbursed under the expense reimbursement arrangements described above are not recoverable by the Investment Manager or its affiliates in future periods.
Note 4. Federal tax information
The timing and character of income and capital gain distributions are determined in accordance with income tax regulations, which may differ from GAAP because of temporary or permanent book to tax differences.
At August 31, 2018, these differences were primarily due to differing treatment for deferral/reversal of wash sale losses, capital loss carryforwards, trustees’ deferred compensation, foreign currency transactions and investments in partnerships. To the extent these differences were permanent, reclassifications were made among the components of the Fund’s net assets in the Statement of Assets and Liabilities. Temporary differences do not require reclassifications.
In the Statement of Assets and Liabilities the following reclassifications were made:
Undistributed net
investment
income ($) | Accumulated
net realized
(loss) ($) | Paid in
capital ($) |
| 145,805 | (145,736) | (69) |
Columbia Global Energy and Natural Resources Fund | Annual Report 2018
| 27 |
Notes to Financial Statements (continued)
August 31, 2018
Net investment income (loss) and net realized gains (losses), as disclosed in the Statement of Operations, and net assets were not affected by this reclassification.
The tax character of distributions paid during the years indicated was as follows:
| Year Ended August 31, 2018 | Year Ended August 31, 2017 |
Ordinary
income ($) | Long-term
capital gains ($) | Total ($) | Ordinary
income ($) | Long-term
capital gains ($) | Total ($) |
| 4,374,491 | — | 4,374,491 | 3,806,267 | — | 3,806,267 |
Short-term capital gain distributions, if any, are considered ordinary income distributions for tax purposes.
At August 31, 2018, the components of distributable earnings on a tax basis were as follows:
Undistributed
ordinary income ($) | Undistributed
long-term
capital gains ($) | Capital loss
carryforwards ($) | Net unrealized
appreciation ($) |
| 937,327 | — | (23,665,485) | 40,916,817 |
At August 31, 2018, the cost of all investments for federal income tax purposes along with the aggregate gross unrealized appreciation and depreciation based on that cost was:
Federal
tax cost ($) | Gross unrealized
appreciation ($) | Gross unrealized
(depreciation) ($) | Net unrealized
appreciation ($) |
| 188,592,406 | 44,855,933 | (3,939,116) | 40,916,817 |
Tax cost of investments and unrealized appreciation/(depreciation) may also include timing differences that do not constitute adjustments to tax basis.
The following capital loss carryforwards, determined at August 31, 2018, may be available to reduce taxable income arising from future net realized gains on investments, if any, to the extent permitted by the Internal Revenue Code. Capital loss carryforwards with no expiration are required to be utilized prior to any capital losses which carry an expiration date. As a result of this ordering rule, capital loss carryforwards which carry an expiration date may be more likely to expire unused. In addition, for the year ended August 31, 2018, capital loss carryforwards utilized, expired unused and permanently lost, if any, were as follows:
| 2019 ($) | No expiration
short-term ($) | No expiration
long-term ($) | Total ($) | Utilized ($) | Expired ($) | Permanently
lost ($) |
| — | 1,097,362 | 22,568,123 | 23,665,485 | 10,215,325 | — | — |
Management of the Fund has concluded that there are no significant uncertain tax positions in the Fund that would require recognition in the financial statements. However, management’s conclusion may be subject to review and adjustment at a later date based on factors including, but not limited to, new tax laws, regulations, and administrative interpretations (including relevant court decisions). Generally, the Fund’s federal tax returns for the prior three fiscal years remain subject to examination by the Internal Revenue Service.
Note 5. Portfolio information
The cost of purchases and proceeds from sales of securities, excluding short-term investments and derivatives, if any, aggregated to $86,992,813 and $109,782,224, respectively, for the year ended August 31, 2018. The amount of purchase and sale activity impacts the portfolio turnover rate reported in the Financial Highlights.
Note 6. Affiliated money market fund
The Fund invests in Columbia Short-Term Cash Fund, an affiliated money market fund established for the exclusive use by the Fund and other affiliated funds (the Affiliated MMF). The income earned by the Fund from such investments is included as Dividends - affiliated issuers in the Statement of Operations. As an investing fund, the Fund indirectly bears its proportionate
| 28 | Columbia Global Energy and Natural Resources Fund | Annual Report 2018 |
Notes to Financial Statements (continued)
August 31, 2018
share of the expenses of the Affiliated MMF. The Affiliated MMF prices its shares with a floating net asset value. In addition, the Board of Trustees of the Affiliated MMF may impose a fee on redemptions (sometimes referred to as a liquidity fee) or temporarily suspend redemptions (sometimes referred to as imposing a redemption gate) in the event its liquidity falls below regulatory limits.
Note 7. Interfund lending
Pursuant to an exemptive order granted by the Securities and Exchange Commission, the Fund participates in a program (the Interfund Program) allowing each participating Columbia Fund (each, a Participating Fund) to lend money directly to and, except for closed-end funds and money market funds, borrow money directly from other Participating Funds for temporary purposes. The amounts eligible for borrowing and lending under the Interfund Program are subject to certain restrictions.
Interfund loans are subject to the risk that the borrowing fund could be unable to repay the loan when due, and a delay in repayment to the lending fund could result in lost opportunities and/or additional lending costs. The exemptive order is subject to conditions intended to mitigate conflicts of interest arising from the Investment Manager’s relationship with each Participating Fund.
The Fund did not borrow or lend money under the Interfund Program during the year ended August 31, 2018.
Note 8. Line of credit
The Fund has access to a revolving credit facility with a syndicate of banks led by Citibank, N.A., HSBC Bank USA, N.A. and JPMorgan Chase Bank, N.A. whereby the Fund may borrow for the temporary funding of shareholder redemptions or for other temporary or emergency purposes. The credit facility, which is a collective agreement between the Fund and certain other funds managed by the Investment Manager, severally and not jointly, permits collective borrowings up to $1 billion. Interest is charged to each participating fund based on its borrowings at a rate equal to the higher of (i) the overnight federal funds rate plus 1.00% or (ii) the one-month LIBOR rate plus 1.00%. Each borrowing under the credit facility matures no later than 60 days after the date of borrowing. The Fund also pays a commitment fee equal to its pro rata share of the amount of the credit facility at a rate of 0.15% per annum. The commitment fee is included in other expenses in the Statement of Operations. This agreement expires annually in December unless extended or renewed.
The Fund had no borrowings during the year ended August 31, 2018.
Note 9. Significant risks
Energy sector risk
The Fund may be more susceptible to the particular risks that may affect companies in the energy sector than if it were invested in a wider variety of companies in unrelated sectors. Companies in the energy sector are subject to certain risks, including legislative or regulatory changes, adverse market conditions and increased competition. Performance of such companies may be affected by factors including, among others, fluctuations in energy prices and supply and demand of energy fuels, energy conservation, the success of exploration projects, events occurring in nature and local and international politics. In addition, rising interest rates and high inflation may affect the demand for certain natural resources and, therefore, the performance of companies in the energy sector.
Foreign securities and emerging market countries risk
Investing in foreign securities may include certain risks and considerations not typically associated with investing in U.S. securities, such as fluctuating currency values and changing local and regional economic, political and social conditions, which may result in greater market volatility. In addition, certain foreign securities may not be as liquid as U.S. securities. Investing in emerging markets may accentuate these risks. These countries are also more likely to experience high levels of inflation, deflation or currency devaluation which could hurt their economies and securities markets. To the extent that the Fund concentrates its investment exposure to any one or a few specific countries, the Fund will be particularly susceptible to the various conditions, events or other factors impacting those countries and may, therefore, have a greater risk than that of a fund which is more geographically diversified.
Columbia Global Energy and Natural Resources Fund | Annual Report 2018
| 29 |
Notes to Financial Statements (continued)
August 31, 2018
Materials sector risk
The Fund may be more susceptible to the particular risks that may affect companies in the materials sector than if it were invested in a wider variety of companies in unrelated sectors. Companies in the materials sector are subject to certain risks, including that many materials companies are significantly affected by the level and volatility of commodity prices, exchange rates, import controls, worldwide competition, environmental policies and consumer demand. Performance of such companies may be affected by factors including, among others, that at times worldwide production of industrial materials has exceeded demand as a result of over-building or economic downturns, leading to poor investment returns or losses. Other risks may include liabilities for environmental damage and general civil liabilities, depletion of resources, and mandated expenditures for safety and pollution control. The materials sector may also be affected by economic cycles, technical progress, labor relations, and government regulations.
Non-diversification risk
A non-diversified fund is permitted to invest a greater percentage of its total assets in fewer issuers than a diversified fund. The Fund may, therefore, have a greater risk of loss from a few issuers than a similar fund that invests more broadly.
Shareholder concentration risk
At August 31, 2018, one unaffiliated shareholder of record owned 12.1% of the outstanding shares of the Fund in one or more accounts. The Fund has no knowledge about whether any portion of those shares was owned beneficially. Affiliated shareholders of record owned 33.4% of the outstanding shares of the Fund in one or more accounts. Subscription and redemption activity by concentrated accounts may have a significant effect on the operations of the Fund. In the case of a large redemption, the Fund may be forced to sell investments at inopportune times, including its liquid positions, which may result in Fund losses and the Fund holding a higher percentage of less liquid positions. Large redemptions could result in decreased economies of scale and increased operating expenses for non-redeeming Fund shareholders.
Note 10. Subsequent events
Management has evaluated the events and transactions that have occurred through the date the financial statements were issued and noted no items requiring adjustment of the financial statements or additional disclosure.
Note 11. Information regarding pending and settled legal proceedings
Ameriprise Financial and certain of its affiliates have historically been involved in a number of legal, arbitration and regulatory proceedings, including routine litigation, class actions, and governmental actions, concerning matters arising in connection with the conduct of their business activities. Ameriprise Financial believes that the Fund is not currently the subject of, and that neither Ameriprise Financial nor any of its affiliates are the subject of, any pending legal, arbitration or regulatory proceedings that are likely to have a material adverse effect on the Fund or the ability of Ameriprise Financial or its affiliates to perform under their contracts with the Fund. Ameriprise Financial is required to make quarterly (10-Q), annual (10-K) and, as necessary, 8-K filings with the Securities and Exchange Commission (SEC) on legal and regulatory matters that relate to Ameriprise Financial and its affiliates. Copies of these filings may be obtained by accessing the SEC website at www.sec.gov.
There can be no assurance that these matters, or the adverse publicity associated with them, will not result in increased Fund redemptions, reduced sale of Fund shares or other adverse consequences to the Fund. Further, although we believe proceedings are not likely to have a material adverse effect on the Fund or the ability of Ameriprise Financial or its affiliates to perform under their contracts with the Fund, these proceedings are subject to uncertainties and, as such, we are unable to estimate the possible loss or range of loss that may result. An adverse outcome in one or more of these proceedings could result in adverse judgments, settlements, fines, penalties or other relief that could have a material adverse effect on the consolidated financial condition or results of operations of Ameriprise Financial.
| 30 | Columbia Global Energy and Natural Resources Fund | Annual Report 2018 |
Report of Independent Registered Public Accounting Firm
To the Board of Trustees of Columbia Funds Series Trust I and Shareholders of Columbia Global Energy And Natural Resources Fund
Opinion on the Financial Statements
We have audited the accompanying statement of assets and liabilities, including the portfolio of investments, of Columbia Global Energy and Natural Resources Fund (one of the funds constituting Columbia Funds Series Trust I, hereafter referred to as the “Fund”) as of August 31, 2018, the related statement of operations for the year ended August 31, 2018, the statement of changes in net assets for each of the two years in the period ended August 31, 2018, including the related notes, and the financial highlights for each of the periods indicated therein (collectively referred to as the “financial statements”). In our opinion, the financial statements present fairly, in all material respects, the financial position of the Fund as of August 31, 2018, the results of its operations for the year then ended, the changes in its net assets for each of the two years in the period ended August 31, 2018 and the financial highlights for each of the periods indicated therein in conformity with accounting principles generally accepted in the United States of America.
Basis for Opinion
These financial statements are the responsibility of the Fund’s management. Our responsibility is to express an opinion on the Fund’s financial statements based on our audits. We are a public accounting firm registered with the Public Company Accounting Oversight Board (United States) (“PCAOB”) and are required to be independent with respect to the Fund in accordance with the U.S. federal securities laws and the applicable rules and regulations of the Securities and Exchange Commission and the PCAOB.
We conducted our audits of these financial statements in accordance with the standards of the PCAOB. Those standards require that we plan and perform the audit to obtain reasonable assurance about whether the financial statements are free of material misstatement, whether due to error or fraud.
Our audits included performing procedures to assess the risks of material misstatement of the financial statements, whether due to error or fraud, and performing procedures that respond to those risks. Such procedures included examining, on a test basis, evidence regarding the amounts and disclosures in the financial statements. Our audits also included evaluating the accounting principles used and significant estimates made by management, as well as evaluating the overall presentation of the financial statements. Our procedures included confirmation of securities owned as of August 31, 2018, by correspondence with the custodian, transfer agent, and brokers; when replies were not received from brokers, we performed other audit procedures. We believe that our audits provide a reasonable basis for our opinion.
/s/PricewaterhouseCoopers LLP
Minneapolis, Minnesota
October 22, 2018
We have served as the auditor of one or more investment companies within the Columbia Funds Complex since 1977.
Columbia Global Energy and Natural Resources Fund | Annual Report 2018
| 31 |
Federal Income Tax Information
(Unaudited)
The Fund hereby designates the following tax attributes for the fiscal year ended August 31, 2018. Shareholders will be notified in early 2019 of the amounts for use in preparing 2018 income tax returns.
Qualified
dividend
income | Dividends
received
deduction |
| 100.00% | 75.21% |
Qualified dividend income. For taxable, non-corporate shareholders, the percentage of ordinary income distributed during the fiscal year that represents qualified dividend income subject to reduced tax rates.
Dividends received deduction. The percentage of ordinary income distributed during the fiscal year that qualifies for the corporate dividends received deduction.
| 32 | Columbia Global Energy and Natural Resources Fund | Annual Report 2018 |
Shareholders elect the Board that oversees the Fund’s operations. The Board appoints officers who are responsible for day-to-day business decisions based on policies set by the Board. The following table provides basic biographical information about the Fund’s Trustees, including their principal occupations during the past five years, although specific titles for individuals may have varied over the period. The year set forth beneath Length of Service in the table below is the year in which the Trustee was first appointed or elected as Trustee to any Fund currently in the Columbia Funds Complex or a predecessor thereof. Under current Board policy, members serve terms of indefinite duration.
Independent trustees
| Name, address, year of birth | Position held with the Trust and length of service | Principal occupation(s) during the past five years and other relevant professional experience | Number of Funds in the Columbia Fund Complex overseen | Other directorships held by Trustee during the past five years |
Janet Langford Carrig
c/o Columbia Management
Investment Advisers, LLC
225 Franklin Street
Mail Drop BX32 05228
Boston, MA 02110
1957 | Trustee
1996 | Senior Vice President, General Counsel and Corporate Secretary, ConocoPhillips (independent energy company) since September 2007 | 69 | None |
Douglas A. Hacker
c/o Columbia Management
Investment Advisers, LLC
225 Franklin Street
Mail Drop BX32 05228
Boston, MA 02110
1955 | Trustee and Chairman of the Board
1996 | Independent business executive since May 2006; Executive Vice President — Strategy of United Airlines from December 2002 to May 2006; President of UAL Loyalty Services (airline marketing company) from September 2001 to December 2002; Executive Vice President and Chief Financial Officer of United Airlines from July 1999 to September 2001 | 69 | Spartan Nash Company, (food distributor); Nash Finch Company (food distributor) from 2005 to 2013; Aircastle Limited (aircraft leasing); SeaCube Container Leasing Ltd. (container leasing) from 2010 to 2013; and Travelport Worldwide Limited (travel information technology) |
Nancy T. Lukitsh
c/o Columbia Management
Investment Advisers, LLC
225 Franklin Street
Mail Drop BX32 05228
Boston, MA 02110
1956 | Trustee
2011 | Senior Vice President, Partner and Director of Marketing, Wellington Management Company, LLP (investment adviser) from 1997 to 2010; Chair, Wellington Management Portfolios (commingled non-U.S. investment pools) from 2007 to 2010; Director, Wellington Trust Company, NA and other Wellington affiliates from 1997 to 2010 | 69 | None |
David M. Moffett
c/o Columbia Management
Investment Advisers, LLC
225 Franklin Street
Mail Drop BX32 05228
Boston, MA 02110
1952 | Trustee
2011 | Retired. Consultant to Bridgewater and Associates | 69 | Director, CSX Corporation (transportation suppliers); Genworth Financial, Inc. (financial and insurance products and services); PayPal Holdings Inc. (payment and data processing services); Trustee, University of Oklahoma Foundation; former Director, eBay Inc. (online trading community), 2007-2015; and former Director, CIT Bank, CIT Group Inc. (commercial and consumer finance), 2010-2016 |
Columbia Global Energy and Natural Resources Fund | Annual Report 2018
| 33 |
TRUSTEES AND OFFICERS (continued)
Independent trustees (continued)
| Name, address, year of birth | Position held with the Trust and length of service | Principal occupation(s) during the past five years and other relevant professional experience | Number of Funds in the Columbia Fund Complex overseen | Other directorships held by Trustee during the past five years |
John J. Neuhauser
c/o Columbia Management
Investment Advisers, LLC
225 Franklin Street
Mail Drop BX32 05228
Boston, MA 02110
1943 | Trustee
1984 | President, Saint Michael’s College since August 2007; Director or Trustee of several non-profit organizations, including University of Vermont Medical Center; Academic Vice President and Dean of Faculties, Boston College from August 1999 to October 2005; University Professor, Boston College from November 2005 to August 2007 | 69 | Liberty All-Star Equity Fund and Liberty All- Star Growth Fund (closed-end funds) |
Patrick J. Simpson
c/o Columbia Management
Investment Advisers, LLC
225 Franklin Street
Mail Drop BX32 05228
Boston, MA 02110
1944 | Trustee
2000 | Of Counsel, Perkins Coie LLP (law firm) since 2015; Partner, Perkins Coie LLP from 1988 to 2014 | 69 | None |
Anne-Lee Verville
c/o Columbia Management
Investment Advisers, LLC
225 Franklin Street
Mail Drop BX32 05228
Boston, MA 02110
1945 | Trustee
1998 | Retired. General Manager, Global Education Industry from 1994 to 1997, President – Application Systems Division from 1991 to 1994, Chief Financial Officer – US Marketing & Services from 1988 to 1991, and Chief Information Officer from 1987 to 1988, IBM Corporation (computer and technology) | 69 | Enesco Group, Inc. (producer of giftware and home and garden decor products) from 2001 to 2006 |
Consultants to the Independent Trustees*
| Name, address, year of birth | Position held with the Trust and length of service | Principal occupation(s) during the past five years and other relevant professional experience | Number of Funds in the Columbia Funds complex overseen | Other directorships held by Trustee during the past five years |
J. Kevin Connaughton
c/o Columbia
Management Investment
Advisers, LLC,
225 Franklin Street
Mail Drop BX32 05228,
Boston, MA 02110
1964 | Independent Trustee Consultant
2016 | Independent Trustee Consultant, Columbia Funds since March 2016; Adjunct Professor of Finance, Bentley University since November 2017; Managing Director and General Manager of Mutual Fund Products, Columbia Management Investment Advisers, LLC from May 2010 to February 2015; President, Columbia Funds from 2009 to 2015; and senior officer of Columbia Funds and affiliated funds from 2003 to 2015 | 69 | Director, The Autism Project since March 2015; former Trustee, New Century Portfolios, March 2015-December 2017; formerly on Board of Governors, Gateway Healthcare, January 2016 – December 2017 |
Natalie A. Trunow
c/o Columbia
Management Investment
Advisers, LLC,
225 Franklin Street
Mail Drop BX32 05228,
Boston, MA 02110
1967 | Independent Trustee Consultant
2016 | Independent Trustee Consultant, Columbia Funds since September 2016; Chief Executive Officer, Millennial Portfolio Solutions LLC (asset management and consulting services) since January 2016; Director of Investments, Casey Family Programs from April 2016 to September 2016; Senior Vice President and Chief Investment Officer, Calvert Investments from August 2008 to January 2016; Section Head and Portfolio Manager, General Motors Asset Management from June 1997 to August 2008 | 69 | Director, Health Services for Children with Special Needs, Inc.; Director, Guidewell Financial Solutions |
| * | J. Kevin Connaughton was appointed consultant to the Independent Trustees effective March 1, 2016. Natalie A. Trunow was appointed consultant to the Independent Trustees effective September 1, 2016. Shareholders of the Funds are expected to be asked to elect each of Mr. Connaughton and Ms. Trunow as a Trustee at a future shareholder meeting. |
| 34 | Columbia Global Energy and Natural Resources Fund | Annual Report 2018 |
TRUSTEES AND OFFICERS (continued)
Interested trustee affiliated with Investment Manager*
| Name, address, year of birth | Position held with the Trust and length of service | Principal occupation(s) during the past five years and other relevant professional experience | Number of Funds in the Columbia Funds Complex overseen | Other directorships held by Trustee during the past five years |
William F. Truscott
c/o Columbia Management
Investment Advisers, LLC
225 Franklin Street
Boston, MA 02110
1960 | Trustee
2012 | Chairman of the Board and President, Columbia Management Investment Advisers, LLC since May 2010 and February 2012, respectively; Chief Executive Officer, Global Asset Management, Ameriprise Financial, Inc. since September 2012 (previously Chief Executive Officer, U.S. Asset Management & President, Annuities, May 2010-September 2012); Director and Chief Executive Officer, Columbia Management Investment Distributors, Inc. since May 2010 and February 2012, respectively; Chairman of the Board and Chief Executive Officer, RiverSource Distributors, Inc. since 2006; Director, Threadneedle Asset Management Holdings, SARL since 2014; President and Chief Executive Officer, Ameriprise Certificate Company, 2006-August 2012 | 193 | Chairman of the Board, Columbia Management Investment Advisers, LLC since May 2010; Director, Columbia Management Investment Distributors, Inc. since May 2010; former Director, Ameriprise Certificate Company, 2006 - January 2013 |
| * | Interested person (as defined under the 1940 Act) by reason of being an officer, director, security holder and/or employee of the Investment Manager or Ameriprise Financial. |
The Statement of Additional Information has additional information about the Fund’s Board members and is available,
without charge, upon request by calling 800.345.6611, contacting your financial intermediary or visiting
investor.columbiathreadneedleus.com.
Columbia Global Energy and Natural Resources Fund | Annual Report 2018
| 35 |
TRUSTEES AND OFFICERS (continued)
The Board has appointed officers who are responsible for day-to-day business decisions based on policies it has established. The officers serve at the pleasure of the Board. The following table provides basic information about the Officers of the Fund, including principal occupations during the past five years, although their specific titles may have varied over the period. In addition to Mr. Truscott, who is Senior Vice President, the Fund’s other officers are:
Fund officers
Name,
address and
year of birth | Position and year
first appointed to
position for any Fund
in the Columbia
Funds complex or a
predecessor thereof | Principal occupation(s) during past five years |
Christopher O. Petersen
5228 Ameriprise
Financial Center
Minneapolis, MN 55474
Born 1970 | President and Principal Executive Officer (2015) | Vice President and Lead Chief Counsel, Ameriprise Financial, Inc. since January 2015 (previously, Vice President and Chief Counsel, January 2010 - December 2014; officer of Columbia Funds and affiliated funds since 2007. |
Michael G. Clarke
225 Franklin Street
Boston, MA 02110
Born 1969 | Treasurer (2011), Chief Financial Officer (2009) and Chief Accounting Officer (2015) | Vice President — Mutual Fund Administration, Columbia Management Investment Advisers, LLC, since May 2010; senior officer of Columbia Funds and affiliated funds since 2002. |
Paul B. Goucher
100 Park Avenue
New York, NY 10017
Born 1968 | Senior Vice President (2011) and Assistant Secretary (2008) | Senior Vice President and Assistant General Counsel, Ameriprise Financial, Inc. since January 2017 (previously, Vice President and Lead Chief Counsel, November 2008 - January 2017 and January 2013 - January 2017, respectively); Vice President, Chief Legal Officer and Assistant Secretary, Columbia Management Investment Advisers, LLC since May 2010. |
Thomas P. McGuire
225 Franklin Street
Boston, MA 02110
Born 1972 | Senior Vice President and Chief Compliance Officer (2012) | Vice President — Asset Management Compliance, Ameriprise Financial, Inc., since May 2010; Chief Compliance Officer, Ameriprise Certificate Company since September 2010. |
Colin Moore
225 Franklin Street
Boston, MA 02110
Born 1958 | Senior Vice President (2010) | Executive Vice President and Global Chief Investment Officer, Ameriprise Financial, Inc., since July 2013; Executive Vice President and Global Chief Investment Officer, Columbia Management Investment Advisers, LLC since July 2013. |
Ryan C. Larrenaga
225 Franklin Street
Boston, MA 02110
Born 1970 | Senior Vice President (2017), Chief Legal Officer (2017) and Secretary (2015) | Vice President and Chief Counsel, Ameriprise Financial, Inc. since August 2018 (previously, Vice President and Group Counsel, August 2011 - August 2018); officer of Columbia Funds and affiliated funds since 2005. |
Michael E. DeFao
225 Franklin Street
Boston, MA 02110
Born 1968 | Vice President (2011) and Assistant Secretary (2010) | Vice President and Chief Counsel, Ameriprise Financial, Inc. since May 2010. |
Amy Johnson
5228 Ameriprise
Financial Center
Minneapolis, MN 55474
Born 1965 | Vice President (2006) | Managing Director and Global Head of Operations, Columbia Management Investment Advisers, LLC since April 2016 (previously Managing Director and Chief Operating Officer, 2010 - 2016). |
Lyn Kephart-Strong
5228 Ameriprise
Financial Center
Minneapolis, MN 55474
Born 1960 | Vice President (2015) | President, Columbia Management Investment Services Corp. since October 2014; Vice President & Resolution Officer, Ameriprise Trust Company since August 2009. |
| 36 | Columbia Global Energy and Natural Resources Fund | Annual Report 2018 |
Board Consideration and Approval of Management
Agreement
On June 12, 2018, the Board of Trustees (the Board) and the Trustees who are not interested persons (as defined in the Investment Company Act of 1940) (the Independent Trustees) of Columbia Funds Series Trust I (the Trust) unanimously approved the continuation of the Management Agreement (the Management Agreement) with Columbia Management Investment Advisers, LLC (the Investment Manager) with respect to Columbia Global Energy and Natural Resources Fund (the Fund), a series of the Trust. As detailed below, the Board’s Advisory Fees and Expenses Committee (the Committee) and the Board met on multiple occasions to review and discuss, among themselves, with the management team of the Investment Manager and with an independent fee consultant, materials provided by the Investment Manager, the independent fee consultant and others before determining to approve the continuation of the Management Agreement.
In connection with their deliberations regarding the continuation of the Management Agreement, the Committee and the Board evaluated materials requested from the Investment Manager regarding the Fund and the Management Agreement, and discussed these materials with representatives of the Investment Manager at Committee meetings held on March 6, 2018, April 26, 2018 and June 11, 2018 and at Board meetings held on March 7, 2018 and June 12, 2018. In addition, the Board and its various committees consider matters bearing on the Management Agreement at other meetings throughout the year and in prior years and meet regularly with senior management of the Trust and the Investment Manager. Through the Board’s Investment Oversight Committees, Trustees also meet with selected portfolio managers of the funds the Trustees oversee and with other investment personnel at various times throughout the year. The Committee and the Board also consulted with the independent fee consultant, Fund counsel and the Independent Trustees’ independent legal counsel, who advised on various matters with respect to the Committee’s and the Board’s considerations and otherwise assisted the Committee and the Board in their deliberations. On June 11, 2018, the Committee recommended that the Board approve the continuation of the Management Agreement. On June 12, 2018, the Board, including the Independent Trustees, voting separately, unanimously approved the continuation of the Management Agreement for the Fund.
The Committee and the Board considered all information that they, their legal counsel or the Investment Manager believed reasonably necessary to evaluate and to determine whether to recommend for approval or approve the continuation of the Management Agreement. The information and factors considered by the Committee and the Board in recommending for approval or approving the continuation of the Management Agreement for the Fund included the following:
| • | Information on the investment performance of the Fund relative to the performance of a group of mutual funds determined to be comparable to the Fund by an independent third-party data provider, as well as performance relative to benchmarks; |
| • | Information on the Fund’s management fees and total expenses, including information comparing the Fund’s expenses to those of a group of comparable mutual funds, as determined by the independent third-party data provider; |
| • | The Investment Manager’s agreement to contractually limit or cap total operating expenses for the Fund through December 31, 2019 so that total operating expenses (excluding certain fees and expenses, such as transaction costs and certain other investment related expenses, interest, taxes, acquired fund fees and expenses, and infrequent and/or unusual expenses) would not exceed a specified annual rate, as a percentage of the Fund’s net assets; |
| • | The terms and conditions of the Management Agreement; |
| • | The current and proposed terms and conditions of other agreements and arrangements with affiliates of the Investment Manager relating to the operations of the Fund, including agreements with respect to the provision of distribution, transfer agency and shareholder services to the Fund; |
| • | Descriptions of various functions performed by the Investment Manager under the Management Agreement, including portfolio management and portfolio trading practices; |
| • | Information regarding the management fees of similarly-managed portfolios of other clients of the Investment Manager, including institutional accounts and collective trusts; |
| • | Information regarding the reputation, regulatory history and resources of the Investment Manager, including information regarding senior management, portfolio managers and other personnel; |
Columbia Global Energy and Natural Resources Fund | Annual Report 2018
| 37 |
Board Consideration and Approval of Management
Agreement (continued)
| • | Information regarding the capabilities of the Investment Manager with respect to compliance monitoring services, including an assessment of the Investment Manager’s compliance system by the Fund’s Chief Compliance Officer; and |
| • | The profitability to the Investment Manager and its affiliates from their relationships with the Fund. |
Nature, extent and quality of services provided under the Management Agreement
The Committee and the Board considered the nature, extent and quality of services provided to the Fund by the Investment Manager and its affiliates under the Management Agreement and under separate agreements for the provision of transfer agency and shareholder services, and the resources dedicated to the Fund and the other Columbia Funds by the Investment Manager and its affiliates. The Committee and the Board considered, among other things, the Investment Manager’s ability to attract, motivate and retain highly qualified research, advisory and supervisory investment professionals (including compensation programs for personnel involved in fund management, reputation and other attributes), the portfolio management services provided by those investment professionals, and the quality of the Investment Manager’s investment research capabilities and trade execution services. The Committee and the Board also considered the potential benefits to shareholders of investing in a mutual fund that is part of a fund complex offering exposure to a variety of asset classes and investment disciplines and providing a variety of fund and shareholder services.
The Committee and the Board also considered the professional experience and qualifications of the senior personnel of the Investment Manager, which included consideration of the Investment Manager’s experience with similarly-structured funds. The Committee and the Board noted the compliance programs of and the compliance-related resources provided to the Fund by the Investment Manager and its affiliates and the resources dedicated by the Investment Manager and its affiliates to risk management, and considered the Investment Manager’s ability to provide administrative services to the Fund and coordinate the activities of the Fund’s other service providers. After reviewing these and related factors, the Committee and the Board concluded, within the context of their overall conclusions, that the nature, extent and quality of the services provided to the Fund under the Management Agreement supported the continuation of the Management Agreement.
Investment performance
The Committee and the Board reviewed information about the performance of the Fund over various time periods, including performance information relative to benchmarks, information that compared the performance of the Fund to the performance of a group of comparable mutual funds as determined by the independent third-party data provider, and information and analysis provided by the independent fee consultant. The Committee and the Board also reviewed a description of the third party’s methodology for identifying the Fund’s peer groups for purposes of performance and expense comparisons.
The Committee and the Board noted that, through December 31, 2017, the Fund’s performance was in the twenty-seventh, twenty-seventh and twenty-third percentile (where the best performance would be in the first percentile) of its category selected by the independent third-party data provider for the purposes of performance comparisons for the one-, three- and five-year periods, respectively.
The Committee and the Board also considered the Investment Manager’s performance and reputation generally, the Investment Manager’s historical responsiveness to Board concerns about performance, and the Investment Manager’s willingness to take steps intended to improve performance. After reviewing these and related factors, the Committee and the Board concluded, within the context of their overall conclusions, that the performance of the Fund and the Investment Manager was sufficient, in light of other considerations, to support the continuation of the Management Agreement.
Investment Management fee rates and other expenses
The Committee and the Board considered the management fees charged to the Fund under the Management Agreement as well as the total expenses incurred by the Fund. In assessing the reasonableness of the fees under the Management Agreement, the Committee and the Board considered, among other information, the Fund’s total expense ratio as a percentage of average daily net assets. The Committee and the Board considered data provided by the independent third-party data provider and the independent fee consultant. The Committee and the Board noted that, as of December 31, 2017, the Fund’s actual management fee and net total expense ratio were ranked in the third and second quintiles,
| 38 | Columbia Global Energy and Natural Resources Fund | Annual Report 2018 |
Board Consideration and Approval of Management
Agreement (continued)
respectively, (where the lowest fees and expenses would be in the first quintile) against the Fund’s expense universe as determined by the independent third-party data provider for purposes of expense comparison. The Committee and the Board also took into account the fee waiver and expense limitation arrangements agreed to by the Investment Manager, as noted above.
The Committee and the Board also received and considered information about the management fees charged by the Investment Manager to institutional accounts. In considering the fees charged to those accounts, the Committee and the Board took into account, among other things, the Investment Manager’s representations about the differences between managing mutual funds as compared to other types of accounts, including differences in the services provided, differences in the risk profile of such business for the Investment Manager and the additional resources required to manage mutual funds effectively. The Committee and the Board also received and considered information about the fees charged by the Investment Manager for sub-advisory services it provides to comparable unaffiliated funds. In evaluating the Fund’s management fees, the Committee and the Board also took into account the demands, complexity and quality of the investment management of the Fund.
After reviewing these and related factors, the Committee and the Board concluded, within the context of their overall conclusions, that the management fee rates and expenses of the Fund, in light of other considerations, supported the continuation of the Management Agreement.
Costs of services provided and profitability
The Committee and the Board also took note of the costs the Investment Manager and its affiliates incur in connection with the services provided and the profitability to the Investment Manager and its affiliates from their relationships with the Fund.
The Committee and the Board also considered the compensation directly or indirectly received by the Investment Manager’s affiliates in connection with their relationships with the Fund. The Committee and the Board reviewed information provided by management as to the profitability to the Investment Manager and its affiliates of their relationships with the Fund, information about the allocation of expenses used to calculate profitability, and comparisons of profitability levels realized in 2017 to profitability levels realized in 2016. When reviewing profitability, the Committee and the Board also considered court cases in which adviser profitability was an issue in whole or in part, the performance of similarly managed funds, the performance of the Fund, and the expense ratio of the Fund. In addition, the Committee and the Board considered information provided by the Investment Manager regarding the Investment Manager’s financial condition and comparing its profitability to that of other asset management firms that are, or are subsidiaries of, publicly traded companies. In this regard, the Committee and the Board also considered data provided by the independent fee consultant.
After reviewing these and related factors, the Committee and the Board concluded, within the context of their overall conclusions, that the costs of services provided and the profitability to the Investment Manager and its affiliates from their relationships with the Fund supported the continuation of the Management Agreement.
Economies of scale
The Committee and the Board considered the potential existence of economies of scale in the provision by the Investment Manager of services to the Fund, to groups of related funds, and to the Investment Manager’s investment advisory clients as a whole, and whether those economies of scale were shared with the Fund through breakpoints in investment management fees or other means, such as expense limitation arrangements and additional investments by the Investment Manager in investment, trading, compliance and other resources. The Committee and the Board noted that the management fee schedules for the Fund contained breakpoints that would reduce the fee rate on assets above specified threshold levels.
In considering these matters, the Committee and the Board also considered the costs of the services provided and the profitability to the Investment Manager and its affiliates from their relationships with the Fund, as noted above. After reviewing these and related factors, the Committee and the Board concluded, within the context of their overall conclusions, that the extent to which any economies of scale were expected to be shared with the Fund supported the continuation of the Management Agreement.
Columbia Global Energy and Natural Resources Fund | Annual Report 2018
| 39 |
Board Consideration and Approval of Management
Agreement (continued)
Other benefits to the Investment Manager
The Committee and the Board received and considered information regarding “fall-out” or ancillary benefits received by the Investment Manager and its affiliates as a result of their relationships with the Fund, such as the engagement of the Investment Manager’s affiliates to provide distribution, transfer agency and shareholder services to the Fund. In this regard, among other matters, the Committee and the Board considered that the Fund’s distributor retains a portion of the distribution fees from the Fund and receives a portion of the sales charges on sales or redemptions of certain classes of shares of the Fund. The Committee and the Board also considered the benefits of research made available to the Investment Manager by reason of brokerage commissions generated by the Fund’s securities transactions, and reviewed information about the Investment Manager’s practices with respect to considering brokerage and research services when allocating portfolio transactions. In this connection, the Board also noted that the amount of research made available to the Investment Manager by reason of brokerage commissions had been declining over time, and may decline further. The Committee and the Board recognized that the Investment Manager’s profitability would be somewhat lower without these benefits.
Conclusion
The Committee and the Board reviewed all of the above considerations in reaching their decisions to recommend or approve the continuation of the Management Agreement. In their deliberations, the Trustees did not identify any particular information that was all-important or controlling, and individual Trustees may have attributed different weights to the various factors. Based on their evaluation of all factors that they deemed to be material, including those factors described above, and assisted by the advice of independent legal counsel, the Board, including the Independent Trustees, voting separately, unanimously approved the continuation of the Management Agreement.
| 40 | Columbia Global Energy and Natural Resources Fund | Annual Report 2018 |
The Fund mails one shareholder report to each shareholder address. If you would like more than one report, please call shareholder services at 800.345.6611 and additional reports will be sent to you.
Proxy voting policies and procedures
The policy of the Board of Trustees is to vote the proxies of the companies in which the Fund holds investments consistent with the procedures as stated in the Statement of Additional Information (SAI). You may obtain a copy of the SAI without charge by calling 800.345.6611; contacting your financial intermediary; visiting columbiathreadneedleus.com/investor/; or searching the website of the Securities and Exchange Commission (SEC) at sec.gov. Information regarding how the Fund voted proxies relating to portfolio securities is filed with the SEC by August 31st for the most recent 12-month period ending June 30th of that year, and is available without charge by visiting columbiathreadneedleus.com/investor/, or searching the website of the SEC at sec.gov.
Quarterly schedule of investments
The Fund files a complete schedule of portfolio holdings with the SEC for the first and third quarters of each fiscal year on Form N-Q or Form N-PORT. The Fund’s Form N-Q or Form N-PORT is available on the SEC’s website at sec.gov and may be reviewed and copied at the SEC’s Public Reference Room in Washington, D.C. Information on the operation of the Public Reference Room may be obtained by calling 800.SEC.0330. The Fund’s complete schedule of portfolio holdings, as filed on Form N-Q or Form N-PORT, can also be obtained without charge, upon request, by calling 800.345.6611.
Additional Fund information
For more information about the Fund, please visit columbiathreadneedleus.com/investor/ or call 800.345.6611. Customer Service Representatives are available to answer your questions Monday through Friday from 8 a.m. to 7 p.m. Eastern time.
Fund investment manager
Columbia Management Investment Advisers, LLC
225 Franklin Street
Boston, MA 02110
Fund distributor
Columbia Management Investment Distributors, Inc.
225 Franklin Street
Boston, MA 02110
Fund transfer agent
Columbia Management Investment Services Corp.
Through October 31, 2018:
P.O. Box 8081
Boston, MA 02266-8081
Effective November 1, 2018:
P.O. Box 219104
Kansas City, MO 64121-9104
Columbia Global Energy and Natural Resources Fund | Annual Report 2018
| 41 |
Columbia Global Energy and Natural Resources Fund
Through October 31, 2018:
P.O. Box 8081
Boston, MA 02266-8081
Effective November 1, 2018:
P.O. Box 219104
Kansas City, MO 64121-9104
Please read and consider the investment objectives, risks, charges and expenses for any fund carefully before investing. For a prospectus and summary prospectus, which contains this and other important information about the Fund, go to
columbiathreadneedleus.com/investor/. The Fund is distributed by Columbia Management Investment Distributors, Inc., member FINRA, and managed by Columbia Management Investment Advisers, LLC.
Columbia Threadneedle Investments (Columbia Threadneedle) is the global brand name of the Columbia and Threadneedle group of companies. All rights reserved.
© 2018 Columbia Management Investment Advisers, LLC.
columbiathreadneedleus .com/investor/

Annual Report
August 31, 2018
Columbia Strategic Income Fund
Not FDIC Insured • No bank guarantee • May lose value
Dear Shareholders,
Volatility exists in financial markets and this is not a comfortable fact of life. How investors deal with this reality, including how they react to short term spikes in volatility as well as to longer periods of increased or decreased volatility, may have a significant impact on their overall investing success.
Too often, investors change their investment strategy based on something that’s happening at a moment in time rather than thinking about how that change in strategy might affect their ability to achieve their longer-term financial goals. Emotion replaces logic and reasoning. Investors may sell in reaction to a market drop (fear or panic), locking in low returns which means they won’t be invested when the market returns, or they invest more at a market peak (greed or conviction), essentially when it is expensive to do so. In both cases, selling and buying at the exact wrong time.
We believe the best outcomes come from a consistent approach to investing. Here are five areas where advisors can help us overcome the tendency to react emotionally as we struggle to make the right choices with our investments:
Long-term focus
The further away long-term goals, aspirations and objectives are, the easier it is to stray away from the goals and priorities that we set out. Advisors help us stay focused on what we want to accomplish.
Discipline through up-and-down markets
Advisors help set rules to prevent us from making rash decisions that we may regret later. Knowing ahead of time what you should do in case of certain situations will help you get through volatile markets and not make emotional decisions.
Tax-awareness
Taxes are one of the biggest drags on investment returns and are critical attributes of investing. Yet few of us take the necessary steps to ease the corrosive effect of taxes. Advisors have tools and knowledge that may help us to manage portfolios more tax-efficiently and keep more of what we earn.
Emotional objectivity
Our emotions are very hard to manage and making investment decisions in an emotional state can lead to exceedingly bad outcomes. An objective advisor can help prevent some of the reactionary mistakes emotions often lead us to.
Education and guidance
The role of the advisor is to teach and guide us toward achieving our financial goals. In terms of working through emotions, guidance is by far the most important component.
By understanding our own behaviors and biases, we can prepare for future challenges. Your success is our priority. Talk to your advisor about how working with Columbia Threadneedle Investments may help you stay the course and position your portfolio for consistent, sustainable outcomes, regardless of market conditions.
Sincerely,
Christopher O. Petersen
President, Columbia Funds
Columbia Funds are distributed by Columbia Management Investment Distributors, Inc., member FINRA, and managed by Columbia Management Investment Advisers, LLC.
© 2018 Columbia Management Investment Advisers, LLC. All rights reserved.
Columbia Strategic Income Fund | Annual Report 2018
Columbia Strategic Income Fund | Annual Report 2018
Investment objective
Columbia Strategic Income Fund (the Fund) seeks total return, consisting of current income and capital appreciation.
Portfolio management
Gene Tannuzzo, CFA
Co-Portfolio Manager
Managed Fund since 2010
Colin Lundgren, CFA
Co-Portfolio Manager
Managed Fund since 2010
Jason Callan
Co-Portfolio Manager
Managed Fund since November 2017
| Average annual total returns (%) (for the period ended August 31, 2018) |
| | | Inception | 1 Year | 5 Years | 10 Years |
| Class A | Excluding sales charges | 04/21/77 | 1.03 | 4.02 | 5.49 |
| | Including sales charges | | -3.72 | 3.02 | 4.97 |
| Advisor Class* | 11/08/12 | 1.30 | 4.28 | 5.64 |
| Class C | Excluding sales charges | 07/01/97 | 0.28 | 3.25 | 4.80 |
| | Including sales charges | | -0.69 | 3.25 | 4.80 |
| Institutional Class | 01/29/99 | 1.47 | 4.31 | 5.78 |
| Institutional 2 Class* | 03/07/11 | 1.35 | 4.37 | 5.78 |
| Institutional 3 Class* | 06/13/13 | 1.40 | 4.39 | 5.71 |
| Class R* | 09/27/10 | 0.77 | 3.74 | 5.28 |
| Class T* | Excluding sales charges | 09/27/10 | 1.19 | 4.03 | 5.51 |
| | Including sales charges | | -1.40 | 3.49 | 5.24 |
| Bloomberg Barclays U.S. Aggregate Bond Index | | -1.05 | 2.49 | 3.70 |
| ICE BofAML US Cash Pay High Yield Constrained Index | | 3.22 | 5.61 | 8.33 |
| FTSE Non-U.S. World Government Bond (All Maturities) Index - Unhedged | | -1.88 | 0.48 | 1.93 |
| JPMorgan Emerging Markets Bond Index - Global | | -4.63 | 4.81 | 6.31 |
Returns for Class A shares are shown with and without the maximum initial sales charge of 4.75%. Returns for Class C shares are shown with and without the 1.00% contingent deferred sales charge for the first year only. Returns for Class T shares are shown with and without the maximum initial sales charge of 2.50% per transaction. The Fund’s other share classes are not subject to sales charges and have limited eligibility. Effective November 1, 2017, Class R4, Class R5, Class Y and Class Z shares were renamed Advisor Class, Institutional 2 Class, Institutional 3 Class and Institutional Class shares, respectively. Please see the Fund’s prospectus for details. Performance for different share classes will vary based on differences in sales charges and fees associated with each share class. All results shown assume reinvestment of distributions during the period. Returns do not reflect the deduction of taxes that a shareholder may pay on Fund distributions or on the redemption of Fund shares. Performance results reflect the effect of any fee waivers or reimbursements of Fund expenses by Columbia Management Investment Advisers, LLC and/or any of its affiliates. Absent these fee waivers or expense reimbursement arrangements, performance results would have been lower.
The performance information shown represents past performance and is not a guarantee of future results. The investment return and principal value of your investment will fluctuate so that your shares, when redeemed, may be worth more or less than their original cost. Current performance may be lower or higher than the performance information shown. You may obtain performance information current to the most recent month-end by contacting your financial intermediary, visiting columbiathreadneedleus.com/investor/ or calling 800.345.6611.
| * | The returns shown for periods prior to the share class inception date (including returns for the Life of the Fund, if shown, which are since Fund inception) include the returns of the Fund’s oldest share class. These returns are adjusted to reflect any higher class-related operating expenses of the newer share classes, as applicable. Please visit columbiathreadneedleus.com/investor/investment-products/mutual-funds/appended-performance for more information. |
The Fund’s performance prior to August 29, 2014 reflects returns achieved pursuant to different principal investment strategies.
The Bloomberg Barclays U.S. Aggregate Bond Index is a market value-weighted index that tracks the daily price, coupon, pay-downs and total return performance of fixed-rate, publicly placed, dollar-denominated and non-convertible investment-grade debt issues with at least $250 million par amount outstanding and with at least one year to final maturity.
The ICE BofAML US Cash Pay High Yield Constrained Index tracks the performance of U.S. dollar-denominated below investment-grade corporate debt, currently in a coupon paying period, that is publicly issued in the U.S. domestic market.
| 2 | Columbia Strategic Income Fund | Annual Report 2018 |
Fund at a Glance (continued)
The FTSE Non-U.S. World Government Bond (All Maturities) Index — Unhedged is calculated on a market-weighted basis and includes all fixed-rate bonds with a remaining maturity of one year or longer and with amounts outstanding of at least the equivalent of U.S. $25 million, while excluding floating or variable rate bonds.
The JPMorgan Emerging Markets Bond Index — Global is based on U.S. dollar-denominated debt instruments issued by emerging market sovereign and quasi-sovereign entities, such as Brady bonds, Eurobonds and loans, and reflects reinvestment of all distributions and changes in market prices.
Indices are not available for investment, are not professionally managed and do not reflect sales charges, fees, brokerage commissions, taxes or other expenses of investing. Securities in the Fund may not match those in an index.
Performance of a hypothetical $10,000 investment (August 31, 2008 — August 31, 2018)
The chart above shows the change in value of a hypothetical $10,000 investment in Class A shares of Columbia Strategic Income Fund during the stated time period, and does not reflect the deduction of taxes that a shareholder may pay on Fund distributions or on the redemption of Fund shares.
| Portfolio breakdown (%) (at August 31, 2018) |
| Asset-Backed Securities — Non-Agency | 9.6 |
| Commercial Mortgage-Backed Securities - Non-Agency | 4.9 |
| Common Stocks | 0.0 (a) |
| Corporate Bonds & Notes | 39.4 |
| Foreign Government Obligations | 9.9 |
| Inflation-Indexed Bonds | 0.1 |
| Money Market Funds | 5.8 |
| Residential Mortgage-Backed Securities - Agency | 9.5 |
| Residential Mortgage-Backed Securities - Non-Agency | 15.2 |
| Senior Loans | 5.0 |
| Treasury Bills | 0.6 |
| Total | 100.0 |
Percentages indicated are based upon total investments and exclude investments in derivatives, if any. The Fund’s portfolio composition is subject to change.
| Quality breakdown (%) (at August 31, 2018) |
| AAA rating | 11.5 |
| AA rating | 8.5 |
| A rating | 6.4 |
| BBB rating | 21.0 |
| BB rating | 14.5 |
| B rating | 19.0 |
| CCC rating | 2.5 |
| Not rated | 16.6 |
| Total | 100.0 |
Percentages indicated are based upon total fixed income investments (excluding Money Market Funds and derivatives, if any).
Bond ratings apply to the underlying holdings of the Fund and not the Fund itself and are divided into categories ranging from highest to lowest credit quality, determined by using the middle rating of Moody’s, S&P and Fitch, after dropping the highest and lowest available ratings. When ratings are available from only two rating agencies, the lower rating is used. When a rating is available from only one rating agency, that rating is used. When a bond is not rated by any rating agency, it is designated as “Not rated.” Credit
Columbia Strategic Income Fund | Annual Report 2018
| 3 |
Fund at a Glance (continued)
quality ratings assigned by a rating agency are subjective opinions, not statements of fact, and are subject to change, including daily. The ratings assigned by credit rating agencies are but one of the considerations that the Investment Manager and/or Fund’s subadviser incorporates into its credit analysis process, along with such other issuer-specific factors as cash flows, capital structure and leverage ratios, ability to de-leverage (repay) through free cash flow, quality of management, market positioning and access to capital, as well as such security-specific factors as the terms of the security (e.g., interest rate and time to maturity) and the amount and type of any collateral.
| 4 | Columbia Strategic Income Fund | Annual Report 2018 |
Manager Discussion of Fund Performance
For the 12-month period that ended August 31, 2018, the Fund’s Class A shares returned 1.03% excluding sales charges. The Fund outperformed its benchmark, the Bloomberg Barclays U.S. Aggregate Bond Index, which returned -1.05% for the same time period. Sector allocation overall contributed most positively, though exposure to emerging market bonds detracted modestly from the Fund’s relative results.
Bond markets struggled amid rising interest rates
The 12-month period ended August 31, 2018 began with the widespread recognition by investors that the days of an accommodative Federal Reserve (Fed) were in the rearview mirror. The U.S. central bank began unwinding, or shrinking, its balance sheet with reduced asset purchases beginning in October 2017 in tandem with its interest rate hiking cycle, including a December 2017 increase, the fifth since the start of the current cycle. Then, as a result of tax cuts and a significant spending bill passed through Congress at the end of 2017, U.S. economic growth expectations increased markedly at the start of 2018. The bond market, however, struggled through the first eight months of 2018, as most sectors of the bond market failed to generate positive returns amid a broad rise in yields. Further, after an extended absence, broad market volatility in both the bond and equity markets was spurred by announcements about tariffs and the fear of trade wars between the U.S. and its major trade partners.
All told, the Fed increased the targeted federal funds rate three times by a total of 75 basis points during the period. (A basis point is 1/100th of a percentage point.) The Fed continued to tighten monetary policy, as inflation hit its target and new Fed Chair Jerome Powell, in the position since February 2018, took a more hawkish stance than his predecessors. The U.S. Treasury yield curve, or spectrum of maturities, flattened, as the Fed’s hiking cycle generated upward pressure on the short-term end of the curve.
Overweight exposure to U.S. credit spread sectors supported Fund results
Relative to the benchmark, overweight exposure to U.S. credit spread, or non-U.S. Treasury, sectors supported the Fund’s results most. The strongest performance was generated by structured credit sectors — specifically, non-agency mortgage-backed securities, commercial mortgage-backed securities and asset-backed securities. These sectors were supported during the period by strong consumer spending, which, in turn, benefited from low unemployment, modestly improving wages and still-low interest rates that promoted refinancing and debt reduction. At the end of the period, the consumer’s debt service ratio, which measures the ratio of household debt payments owed to total disposable income, was as low as it had been in nearly four decades. The Fund’s allocation to corporate credit also contributed positively to its relative results, though we believed the sector’s fundamentals were largely reflected in valuations. Moderately higher inflation, which the Fund invested in through Treasury inflation protected securities (TIPS), also added modest value. In general, the Fund also benefited from a flattening of the U.S. Treasury yield curve, as short-term interest rates, where the Fund had less exposure, rose more than longer term rates during the period.
Duration positioning detracted from the Fund’s absolute performance during the period, as yields rose throughout as a result of reduced accommodation from the Fed and heightened expectations around inflation. However, relative to the benchmark, the Fund maintained a shorter duration stance and such positioning therefore proved to be a positive contributor. Duration is a measure of the Fund’s sensitivity to changes in interest rates.
Emerging market bond allocation detracted from Fund performance
An allocation to emerging market bonds detracted from the Fund’s relative performance during the period. Rising U.S. Treasury yields, a stronger U.S. dollar and idiosyncratic events and/or conditions in select emerging market countries joined forces to create a difficult environment for emerging market debt.
Shifting market conditions drove portfolio changes
As corporate bond valuations reached their richest levels in a decade at the same time corporate leverage was at its highest in a decade toward the end of 2017, we focused on reducing the Fund’s corporate bond exposure and increasing exposure to the consumer via asset-backed securities and mortgage-backed securities. However, after spread widening among investment-grade corporate bonds, wherein yield differentials to U.S. Treasuries increased, during the first quarter of 2018, we believed the sector was closer to fair value and began adding to select industries and companies, consistent with our
Columbia Strategic Income Fund | Annual Report 2018
| 5 |
Manager Discussion of Fund Performance (continued)
theme of enhancing the overall credit quality of the Fund’s portfolio. Indeed, throughout the period, we decreased Fund exposure to lower rated credit, primarily by reducing the Fund’s exposure to high-yield corporate bonds and floating rate loans. Elsewhere, following the dramatic widening of emerging market bond spreads, we added to specific holdings late in the period. We eliminated the Fund’s exposure to TIPS by the end of the period.
From a duration perspective, the Fund made tactical shifts in positioning throughout the period, as rate volatility provided ample opportunities for active interest rate management. For example, we lengthened duration when yields rose and shortened duration when rates decreased. Still, at the end of the period, the Fund maintained a duration shorter than that of the benchmark in an effort to protect principal in what we believe will continue to be a rising interest rate environment in the months ahead.
Overall, the Fund’s portfolio turnover rate for the 12-month period was 152%. A significant portion of the turnover was the result of rolling-maturity mortgage securities, processing of prepayments and opportunistic changes our managers made at the margin in response to fluctuating valuations or market developments.
Derivatives usage
The Fund utilized government bond futures and swaps to manage duration and yield curve exposure, credit default swaps to tactically adjust credit exposure in the high-yield and emerging market debt sectors, currency forwards for hedging foreign currency risk and total return purposes, and mortgage TBAs to add exposure to agency mortgage-backed securities (MBS). TBAs, which stands for “to be announced,” are mortgage securities bought and sold for future settlement with an agreed upon price, coupon and face value, but without reference to the characteristics of the underlying pool of mortgages until 48 hours before delivery is taken. This feature gives TBA participants immediate exposure to agency MBS without having to value each individual security. On a stand-alone basis, the Fund’s derivatives usage overall had a net positive effect on Fund performance during the period.
Market risk may affect a single issuer, sector of the economy, industry or the market as a whole. Mortgage- and asset-backed securities are affected by interest rates, financial health of issuers/originators, creditworthiness of entities providing credit enhancements and the value of underlying assets. Fixed-income securities present issuer default risk. Non-investment-grade (high-yield or junk) securities present greater price volatility and more risk to principal and income than higher rated securities. A rise in interest rates may result in a price decline of fixed-income instruments held by the Fund, negatively impacting its performance and NAV. Falling rates may result in the Fund investing in lower yielding debt instruments, lowering the Fund’s income and yield. These risks may be heightened for longer maturity and duration securities. Floating rate loans typically present greater risk than other fixed-income investments as they are generally subject to legal or contractual resale restrictions, may trade less frequently and experience value impairments during liquidation. Prepayment and extension risk exists because the timing of payments on a loan, bond or other investment may accelerate when interest rates fall or decelerate when interest rates rise which may reduce investment opportunities and potential returns. Foreign investments subject the Fund to risks, including political, economic, market, social and others within a particular country, as well as to currency instabilities and less stringent financial and accounting standards generally applicable to U.S. issuers. Risks are enhanced for emerging market and sovereign debt issuers. Investing in derivatives is a specialized activity that involves special risks that subject the Fund to significant loss potential, including when used as leverage, and may result in greater fluctuation in Fund value. Liquidity risk is associated with the difficulty of selling underlying investments at a desirable time or price. See the Fund’s prospectus for more information on these and other risks.
The views expressed in this report reflect the current views of the respective parties. These views are not guarantees of future performance and involve certain risks, uncertainties and assumptions that are difficult to predict, so actual outcomes and results may differ significantly from the views expressed. These views are subject to change at any time based upon economic, market or other conditions and the respective parties disclaim any responsibility to update such views. These views may not be relied on as investment advice and, because investment decisions for a Columbia fund are based on numerous factors, may not be relied on as an indication of trading intent on behalf of any particular Columbia fund. References to specific securities should not be construed as a recommendation or investment advice.
| 6 | Columbia Strategic Income Fund | Annual Report 2018 |
Understanding Your Fund’s Expenses
(Unaudited)
As an investor, you incur two types of costs. There are shareholder transaction costs, which generally include sales charges on purchases and may include redemption fees. There are also ongoing costs, which generally include management fees, distribution and/or service fees, and other fund expenses. The following information is intended to help you understand your ongoing costs (in dollars) of investing in the Fund and to help you compare these costs with the ongoing costs of investing in other mutual funds.
Analyzing your Fund’s expenses
To illustrate these ongoing costs, we have provided examples and calculated the expenses paid by investors in each share class of the Fund during the period. The actual and hypothetical information in the table is based on an initial investment of $1,000 at the beginning of the period indicated and held for the entire period. Expense information is calculated two ways and each method provides you with different information. The amount listed in the “Actual” column is calculated using the Fund’s actual operating expenses and total return for the period. You may use the Actual information, together with the amount invested, to estimate the expenses that you paid over the period. Simply divide your account value by $1,000 (for example, an $8,600 account value divided by $1,000 = 8.6), then multiply the results by the expenses paid during the period under the “Actual” column. The amount listed in the “Hypothetical” column assumes a 5% annual rate of return before expenses (which is not the Fund’s actual return) and then applies the Fund’s actual expense ratio for the period to the hypothetical return. You should not use the hypothetical account values and expenses to estimate either your actual account balance at the end of the period or the expenses you paid during the period. See “Compare with other funds” below for details on how to use the hypothetical data.
Compare with other funds
Since all mutual funds are required to include the same hypothetical calculations about expenses in shareholder reports, you can use this information to compare the ongoing cost of investing in the Fund with other funds. To do so, compare the hypothetical example with the 5% hypothetical examples that appear in the shareholder reports of other funds. As you compare hypothetical examples of other funds, it is important to note that hypothetical examples are meant to highlight the ongoing costs of investing in a fund only and do not reflect any transaction costs, such as sales charges, or redemption or exchange fees. Therefore, the hypothetical calculations are useful in comparing ongoing costs only, and will not help you determine the relative total costs of owning different funds. If transaction costs were included in these calculations, your costs would be higher.
| March 1, 2018 — August 31, 2018 |
| | Account value at the
beginning of the
period ($) | Account value at the
end of the
period ($) | Expenses paid during
the period ($) | Fund’s annualized
expense ratio (%) |
| | Actual | Hypothetical | Actual | Hypothetical | Actual | Hypothetical | Actual |
| Class A | 1,000.00 | 1,000.00 | 1,001.20 | 1,020.42 | 4.79 | 4.84 | 0.95 |
| Advisor Class | 1,000.00 | 1,000.00 | 1,002.50 | 1,021.68 | 3.53 | 3.57 | 0.70 |
| Class C | 1,000.00 | 1,000.00 | 997.50 | 1,016.64 | 8.56 | 8.64 | 1.70 |
| Institutional Class | 1,000.00 | 1,000.00 | 1,004.30 | 1,021.68 | 3.54 | 3.57 | 0.70 |
| Institutional 2 Class | 1,000.00 | 1,000.00 | 1,002.80 | 1,021.88 | 3.33 | 3.36 | 0.66 |
| Institutional 3 Class | 1,000.00 | 1,000.00 | 1,003.00 | 1,022.13 | 3.08 | 3.11 | 0.61 |
| Class R | 1,000.00 | 1,000.00 | 1,000.00 | 1,019.16 | 6.05 | 6.11 | 1.20 |
| Class T | 1,000.00 | 1,000.00 | 1,001.30 | 1,020.47 | 4.74 | 4.79 | 0.94 |
Expenses paid during the period are equal to the annualized expense ratio for each class as indicated above, multiplied by the average account value over the period and then multiplied by the number of days in the Fund’s most recent fiscal half year and divided by 365.
Expenses do not include fees and expenses incurred indirectly by the Fund from its investment in underlying funds, including affiliated and non-affiliated pooled investment vehicles, such as mutual funds and exchange-traded funds.
Had Columbia Management Investment Advisers, LLC and/or certain of its affiliates not waived/reimbursed certain fees and expenses, account value at the end of the period would have been reduced.
Columbia Strategic Income Fund | Annual Report 2018
| 7 |
Portfolio of Investments
August 31, 2018
(Percentages represent value of investments compared to net assets)
Investments in securities
| Asset-Backed Securities — Non-Agency 10.1% |
| Issuer | Coupon
Rate | | Principal
Amount ($) | Value ($) |
| Apidos CLO XXVIII(a),(b) |
| Series 2017-28A Class A1B |
3-month USD LIBOR + 1.150%
01/20/2031 | 3.498% | | 20,750,000 | 20,775,149 |
| ARES XLIV CLO Ltd.(a),(b) |
| Series 2017-44A Class D |
3-month USD LIBOR + 6.550%
10/15/2029 | 8.889% | | 12,000,000 | 12,167,172 |
| ARES XLVII CLO Ltd.(a),(b) |
| Series 2018-47A Class B |
3-month USD LIBOR + 1.450%
04/15/2030 | 3.789% | | 11,200,000 | 11,199,440 |
| Ares XXXVII CLO Ltd.(a),(b) |
| Series 2015-4A Class A3R |
3-month USD LIBOR + 1.500%
10/15/2030 | 3.839% | | 25,000,000 | 24,985,550 |
| Atrium XIII(a),(b) |
| Series 2013A Class B |
3-month USD LIBOR + 1.500%
11/21/2030 | 3.847% | | 32,414,000 | 32,331,085 |
| Babson CLO Ltd.(a),(b) |
| Series 2015-2A Class B2R |
3-month USD LIBOR + 1.590%
10/20/2030 | 3.938% | | 38,425,000 | 38,432,608 |
| Carlyle Global Market Strategies CLO Ltd.(a),(b) |
| Series 2013-4A Class BRR |
3-month USD LIBOR + 1.420%
01/15/2031 | 3.759% | | 11,725,000 | 11,661,556 |
| CLUB Credit Trust(a) |
| Series 2018-NP1 Class C |
| 05/15/2024 | 4.740% | | 10,000,000 | 9,994,303 |
| Conn’s Receivables Funding LLC(a) |
| Series 2017-B Class A |
| 07/15/2020 | 2.730% | | 2,041,614 | 2,041,346 |
| Credit Suisse ABS Trust(a) |
| Series 2018-LD1 Class B |
| 07/25/2024 | 4.280% | | 10,560,000 | 10,559,156 |
| Dryden 33 Senior Loan Fund(a),(b) |
| Series 2014-33A Class ER |
3-month USD LIBOR + 7.540%
10/15/2028 | 9.879% | | 9,500,000 | 9,624,640 |
| Dryden XXVIII Senior Loan Fund(a),(b) |
| Series 2013-28A Class A2LR |
3-month USD LIBOR + 1.650%
08/15/2030 | 3.964% | | 23,650,000 | 23,660,122 |
| Madison Park Funding XI Ltd.(a),(b) |
| Series 2013-11A Class BR |
3-month USD LIBOR + 1.650%
07/23/2029 | 2.963% | | 34,000,000 | 34,004,114 |
| Asset-Backed Securities — Non-Agency (continued) |
| Issuer | Coupon
Rate | | Principal
Amount ($) | Value ($) |
| Marlette Funding Trust(a) |
| Series 2017-1A Class A |
| 03/15/2024 | 2.827% | | 3,768,390 | 3,767,904 |
| Morgan Stanley Resecuritization Pass-Through Trust(a),(c) |
| Series 2018-SC1 Class B |
| 09/18/2023 | 1.000% | | 9,665,000 | 9,206,299 |
| OHA Credit Partners XIV Ltd.(a),(b) |
| Series 2017-14A Class B |
3-month USD LIBOR + 1.500%
01/21/2030 | 3.862% | | 24,000,000 | 23,921,064 |
| OneMain Financial Issuance Trust(a) |
| Series 2018-1A Class A |
| 03/14/2029 | 3.300% | | 20,485,000 | 20,413,272 |
| OZLM XI Ltd.(a),(b) |
| Series 2015-11A Class A2R |
3-month USD LIBOR + 1.750%
10/30/2030 | 4.089% | | 14,700,000 | 14,724,917 |
| OZLM XXI(a),(b) |
| Series 2017-21A Class A2 |
3-month USD LIBOR + 1.450%
01/20/2031 | 3.203% | | 18,500,000 | 18,379,232 |
| Prosper Marketplace Issuance Trust(a) |
| Series 2018-1A Class B |
| 06/17/2024 | 3.900% | | 15,000,000 | 14,999,930 |
| Series 2018-1A Class C |
| 06/17/2024 | 4.870% | | 10,500,000 | 10,478,079 |
| Subordinated, Series 2017-2A Class C |
| 09/15/2023 | 5.370% | | 10,000,000 | 10,063,192 |
| RR 1 LLC(a),(b) |
| Series 2017-1A Class A2R |
3-month USD LIBOR + 1.700%
07/15/2029 | 2.979% | | 14,200,000 | 14,218,034 |
| Series 2017-1A Class DR |
3-month USD LIBOR + 6.500%
07/15/2029 | 8.839% | | 5,000,000 | 5,081,875 |
| SoFi Consumer Loan Program LLC(a) |
| Series 2016-2A Class A |
| 10/27/2025 | 3.090% | | 2,459,236 | 2,454,757 |
| Series 2016-3 Class A |
| 12/26/2025 | 3.050% | | 5,165,895 | 5,149,677 |
| SoFi Professional Loan Program LLC(a),(c),(d),(e),(f) |
| Series 2015-D Class RC |
| 10/26/2037 | 0.000% | | 25 | 10,750,000 |
| Series 2016-A Class RIO |
| 01/25/2038 | 0.000% | | 20 | 4,973,285 |
| Series 2016-A Class RPO |
| 01/25/2038 | 0.000% | | 20 | 9,066,846 |
The accompanying Notes to Financial Statements are an integral part of this statement.
| 8 | Columbia Strategic Income Fund | Annual Report 2018 |
Portfolio of Investments (continued)
August 31, 2018
| Asset-Backed Securities — Non-Agency (continued) |
| Issuer | Coupon
Rate | | Principal
Amount ($) | Value ($) |
| Series 2016-B Class RC |
| 04/25/2037 | 0.000% | | 5 | 1,700,000 |
| SoFi Professional Loan Program LLC(a) |
| Series 2017-1 Class A |
| 01/26/2026 | 3.280% | | 4,531,325 | 4,531,731 |
| Voya CLO Ltd.(a),(b) |
| Series 2017-4A Class B |
3-month USD LIBOR + 1.450%
10/15/2030 | 3.839% | | 14,400,000 | 14,307,797 |
Total Asset-Backed Securities — Non-Agency
(Cost $451,211,704) | 439,624,132 |
|
| Commercial Mortgage-Backed Securities - Non-Agency 5.1% |
| | | | |
| Ashford Hospitality Trust(a),(b) |
| Series 2018-KEYS Class C |
1-month USD LIBOR + 1.600%
05/15/2035 | 3.900% | | 13,300,000 | 13,308,467 |
| Banc of America Merrill Lynch Commercial Mortgage Securities Trust(a),(b) |
| Series 2013-DSNY Class F |
1-month USD LIBOR + 3.500%
09/15/2026 | 5.563% | | 11,687,195 | 11,686,684 |
| BHMS Mortgage Trust(a),(b) |
| Series 2018-ATLS Class D |
1-month USD LIBOR + 2.250%
07/15/2035 | 4.322% | | 10,000,000 | 10,037,664 |
| Braemar Hotels & Resorts Trust(a),(b) |
| Series 2018-PRME Class F |
1-month USD LIBOR + 2.900%
06/15/2035 | 4.861% | | 18,350,000 | 18,435,790 |
| BX Commercial Mortgage Trust(a),(b) |
| Series 2018-BIOA Class A |
1-month USD LIBOR + 0.671%
03/15/2037 | 2.733% | | 10,000,000 | 10,006,292 |
| CHT 2017-COSMO Mortgage Trust(a),(b) |
| Series 2017-CSMO Class B |
1-month USD LIBOR + 1.400%
11/15/2036 | 3.463% | | 19,670,000 | 19,756,314 |
| Series 2017-CSMO Class E |
1-month USD LIBOR + 3.000%
11/15/2036 | 5.063% | | 7,000,000 | 7,043,893 |
| Credit Suisse Mortgage Capital Certificates OA LLC(a) |
| Subordinated, Series 2014-USA Class E |
| 09/15/2037 | 4.373% | | 12,260,000 | 11,057,382 |
| Subordinated, Series 2014-USA Class F |
| 09/15/2037 | 4.373% | | 9,920,000 | 8,321,003 |
| Direxion Daily Retail Bull(a),(b) |
| Series 2018-RVP Class C |
1-month USD LIBOR + 2.050%
03/15/2033 | 3.827% | | 11,190,589 | 11,260,552 |
| Commercial Mortgage-Backed Securities - Non-Agency (continued) |
| Issuer | Coupon
Rate | | Principal
Amount ($) | Value ($) |
| Series 2018-RVP Class E |
3-month USD LIBOR + 4.500%
03/15/2033 | 6.563% | | 4,212,927 | 4,270,829 |
| Hilton U.S.A. Trust(a),(g) |
| Series 2016-HHV Class F |
| 11/05/2038 | 4.194% | | 28,590,000 | 25,912,069 |
| Hilton U.S.A. Trust(a) |
| Subordinated, Series 2016-SFP Class E |
| 11/05/2035 | 5.519% | | 9,700,000 | 9,898,170 |
| Independence Plaza Trust(a) |
| Series 2018-INDP Class C |
| 07/10/2035 | 4.158% | | 7,000,000 | 7,036,512 |
| Invitation Homes Trust(a),(b) |
| Series 2017-SFR2 Class E |
1-month USD LIBOR + 2.250%
12/17/2036 | 4.313% | | 10,500,000 | 10,586,271 |
| UBS Commercial Mortgage Trust(a),(b) |
| Series 2018-NYCH Class A |
1-month USD LIBOR + 0.850%
02/15/2032 | 2.913% | | 6,200,000 | 6,263,834 |
| Series 2018-NYCH Class C |
1-month USD LIBOR + 1.500%
02/15/2032 | 3.563% | | 10,941,000 | 11,060,907 |
| Series 2018-NYCH Class E |
1-month USD LIBOR + 2.900%
02/15/2032 | 4.963% | | 13,795,000 | 13,830,455 |
| Series 2018-NYCH Class F |
1-month USD LIBOR + 3.821%
02/15/2032 | 5.884% | | 13,283,000 | 13,371,837 |
Total Commercial Mortgage-Backed Securities - Non-Agency
(Cost $218,137,536) | 223,144,925 |
| Common Stocks 0.0% |
| Issuer | Shares | Value ($) |
| Consumer Discretionary —% |
| Auto Components —% |
| Aptiv PLC | 1,315 | 115,733 |
| Delphi Technologies PLC | 438 | 15,431 |
| Total | | 131,164 |
| Media —% |
| Cumulus Media, Inc., Class A(h) | 9,225 | 192,802 |
| Tribune Media Co. | 1,338 | 49,359 |
| tronc, Inc.(h) | 198 | 3,267 |
| Total | | 245,428 |
| Total Consumer Discretionary | 376,592 |
The accompanying Notes to Financial Statements are an integral part of this statement.
Columbia Strategic Income Fund | Annual Report 2018
| 9 |
Portfolio of Investments (continued)
August 31, 2018
| Common Stocks (continued) |
| Issuer | Shares | Value ($) |
| Energy —% |
| Energy Equipment & Services —% |
| Fieldwood Energy LLC(h) | 8,596 | 454,513 |
| Total Energy | 454,513 |
| Materials —% |
| Chemicals —% |
| LyondellBasell Industries NV, Class A | 3,806 | 429,241 |
| Metals & Mining —% |
| Aleris International, Inc.(c),(h) | 3,721 | 81,862 |
| Elah Holdings, Inc.(h) | 26 | 3,055 |
| Total | | 84,917 |
| Total Materials | 514,158 |
| Telecommunication Services —% |
| Diversified Telecommunication Services —% |
| Cincinnati Bell, Inc.(h) | 300 | 3,900 |
| Total Telecommunication Services | 3,900 |
| Utilities —% |
| Independent Power and Renewable Electricity Producers —% |
| Vistra Energy Corp(h) | 21,925 | 516,114 |
| Vistra Energy Corp.(h) | 21,925 | 15,622 |
| Total | | 531,736 |
| Total Utilities | 531,736 |
Total Common Stocks
(Cost $1,028,008) | 1,880,899 |
| Corporate Bonds & Notes(i) 41.6% |
| Issuer | Coupon
Rate | | Principal
Amount ($) | Value ($) |
| Aerospace & Defense 1.0% |
| Bombardier, Inc.(a) |
| 12/01/2021 | 8.750% | | 1,629,000 | 1,793,713 |
| 01/15/2023 | 6.125% | | 1,015,000 | 1,025,251 |
| 12/01/2024 | 7.500% | | 1,429,000 | 1,500,446 |
| 03/15/2025 | 7.500% | | 1,015,000 | 1,045,523 |
| Lockheed Martin Corp. |
| 09/15/2052 | 4.090% | | 10,880,000 | 10,409,179 |
| Northrop Grumman Corp. |
| 10/15/2047 | 4.030% | | 18,780,000 | 17,598,907 |
| Corporate Bonds & Notes(i) (continued) |
| Issuer | Coupon
Rate | | Principal
Amount ($) | Value ($) |
| TransDigm, Inc. |
| 07/15/2024 | 6.500% | | 4,172,000 | 4,257,618 |
| 05/15/2025 | 6.500% | | 2,799,000 | 2,854,224 |
| 06/15/2026 | 6.375% | | 3,352,000 | 3,387,776 |
| Total | 43,872,637 |
| Automotive 0.3% |
| Delphi Technologies PLC(a) |
| 10/01/2025 | 5.000% | | 1,724,000 | 1,631,232 |
| Ford Motor Co. |
| 12/08/2046 | 5.291% | | 4,160,000 | 3,701,930 |
| Ford Motor Credit Co. LLC |
| 11/02/2020 | 2.343% | | 8,310,000 | 8,058,132 |
| IHO Verwaltungs GmbH PIK(a) |
| 09/15/2026 | 4.750% | | 987,000 | 938,529 |
| Total | 14,329,823 |
| Banking 3.2% |
| Ally Financial, Inc. |
| 11/01/2031 | 8.000% | | 5,888,000 | 7,215,155 |
| Banco de Bogota SA(a) |
| Subordinated |
| 05/12/2026 | 6.250% | | 2,965,000 | 3,088,931 |
| Banco Mercantil del Norte SA(a),(j) |
| Subordinated |
| 10/04/2031 | 5.750% | | 4,400,000 | 4,179,608 |
| Bank of America Corp.(j) |
| 01/20/2028 | 3.824% | | 20,615,000 | 20,159,986 |
| BBVA Bancomer SA(a),(j) |
| Subordinated |
| 11/12/2029 | 5.350% | | 3,698,000 | 3,556,167 |
| Capital One Financial Corp. |
| 05/12/2020 | 2.500% | | 11,365,000 | 11,243,429 |
| Citigroup, Inc. |
| 05/01/2026 | 3.400% | | 6,995,000 | 6,712,206 |
| Goldman Sachs Group, Inc. (The)(j) |
| 05/01/2029 | 4.223% | | 16,310,000 | 16,156,294 |
| JPMorgan Chase & Co.(j) |
| 07/23/2029 | 4.203% | | 18,680,000 | 18,782,161 |
| Morgan Stanley(j) |
| 01/24/2029 | 3.772% | | 13,340,000 | 12,867,951 |
| Popular, Inc. |
| 07/01/2019 | 7.000% | | 714,000 | 728,546 |
| Wells Fargo & Co. |
| 01/30/2020 | 2.150% | | 8,470,000 | 8,375,136 |
| 10/23/2026 | 3.000% | | 17,435,000 | 16,293,513 |
The accompanying Notes to Financial Statements are an integral part of this statement.
| 10 | Columbia Strategic Income Fund | Annual Report 2018 |
Portfolio of Investments (continued)
August 31, 2018
| Corporate Bonds & Notes(i) (continued) |
| Issuer | Coupon
Rate | | Principal
Amount ($) | Value ($) |
| Wells Fargo & Co.(j) |
| 05/22/2028 | 3.584% | | 13,010,000 | 12,546,870 |
| Total | 141,905,953 |
| Brokerage/Asset Managers/Exchanges 0.1% |
| NFP Corp.(a) |
| 07/15/2025 | 6.875% | | 2,589,000 | 2,537,225 |
| VFH Parent LLC/Orchestra Co-Issuer, Inc.(a) |
| 06/15/2022 | 6.750% | | 383,000 | 395,648 |
| Total | 2,932,873 |
| Building Materials 0.4% |
| American Builders & Contractors Supply Co., Inc.(a) |
| 12/15/2023 | 5.750% | | 4,171,000 | 4,286,261 |
| 05/15/2026 | 5.875% | | 2,602,000 | 2,609,749 |
| Beacon Roofing Supply, Inc.(a) |
| 11/01/2025 | 4.875% | | 5,071,000 | 4,691,380 |
| Core & Main LP(a) |
| 08/15/2025 | 6.125% | | 2,082,000 | 2,008,867 |
| HD Supply, Inc.(a) |
| 04/15/2024 | 5.750% | | 1,082,000 | 1,137,838 |
| James Hardie International Finance DAC(a) |
| 01/15/2025 | 4.750% | | 653,000 | 633,410 |
| 01/15/2028 | 5.000% | | 918,000 | 867,823 |
| Total | 16,235,328 |
| Cable and Satellite 2.5% |
| Altice U.S. Finance I Corp.(a) |
| 07/15/2023 | 5.375% | | 4,057,000 | 4,102,641 |
| 05/15/2026 | 5.500% | | 3,640,000 | 3,586,929 |
| CCO Holdings LLC/Capital Corp.(a) |
| 05/01/2025 | 5.375% | | 1,568,000 | 1,562,234 |
| 02/15/2026 | 5.750% | | 3,586,000 | 3,597,360 |
| 05/01/2026 | 5.500% | | 80,000 | 78,989 |
| 05/01/2027 | 5.125% | | 5,385,000 | 5,151,156 |
| 05/01/2027 | 5.875% | | 766,000 | 759,920 |
| 02/01/2028 | 5.000% | | 1,510,000 | 1,414,935 |
| Cequel Communications Holdings I LLC/Capital Corp.(a) |
| 12/15/2021 | 5.125% | | 1,569,000 | 1,570,690 |
| 04/01/2028 | 7.500% | | 4,082,000 | 4,264,686 |
| Comcast Corp. |
| 08/15/2047 | 4.000% | | 7,413,000 | 6,738,032 |
| CSC Holdings LLC(a) |
| 01/15/2023 | 10.125% | | 828,000 | 909,740 |
| 10/15/2025 | 6.625% | | 2,277,000 | 2,382,154 |
| 10/15/2025 | 10.875% | | 2,105,000 | 2,463,865 |
| 04/15/2027 | 5.500% | | 832,000 | 810,721 |
| 02/01/2028 | 5.375% | | 6,168,000 | 5,902,671 |
| Corporate Bonds & Notes(i) (continued) |
| Issuer | Coupon
Rate | | Principal
Amount ($) | Value ($) |
| DISH DBS Corp. |
| 11/15/2024 | 5.875% | | 5,215,000 | 4,540,195 |
| 07/01/2026 | 7.750% | | 7,602,000 | 6,860,113 |
| Quebecor Media, Inc. |
| 01/15/2023 | 5.750% | | 4,930,000 | 5,117,468 |
| Radiate HoldCo LLC/Finance, Inc.(a) |
| 02/15/2023 | 6.875% | | 612,000 | 592,116 |
| 02/15/2025 | 6.625% | | 2,610,000 | 2,440,167 |
| Sirius XM Radio, Inc.(a) |
| 04/15/2025 | 5.375% | | 1,119,000 | 1,136,458 |
| 07/15/2026 | 5.375% | | 1,521,000 | 1,518,872 |
| 08/01/2027 | 5.000% | | 4,904,000 | 4,751,427 |
| Sky PLC(a) |
| 09/16/2024 | 3.750% | | 12,889,000 | 12,892,738 |
| Unitymedia GmbH(a) |
| 01/15/2025 | 6.125% | | 2,296,000 | 2,397,008 |
| Unitymedia Hessen GmbH & Co. KG NRW(a) |
| 01/15/2025 | 5.000% | | 4,876,000 | 4,957,614 |
| Virgin Media Secured Finance PLC(a) |
| 01/15/2026 | 5.250% | | 8,162,000 | 7,950,743 |
| 08/15/2026 | 5.500% | | 740,000 | 726,049 |
| Ziggo Bond Finance BV(a) |
| 01/15/2027 | 6.000% | | 3,685,000 | 3,336,941 |
| Ziggo BV(a) |
| 01/15/2027 | 5.500% | | 5,821,000 | 5,490,885 |
| Total | 110,005,517 |
| Chemicals 0.7% |
| Alpha 2 BV(a) |
| 06/01/2023 | 8.750% | | 2,125,000 | 2,144,597 |
| Angus Chemical Co.(a) |
| 02/15/2023 | 8.750% | | 1,488,000 | 1,547,520 |
| Atotech U.S.A., Inc.(a) |
| 02/01/2025 | 6.250% | | 2,066,000 | 2,048,720 |
| Axalta Coating Systems LLC(a) |
| 08/15/2024 | 4.875% | | 2,475,000 | 2,460,365 |
| Chemours Co. (The) |
| 05/15/2023 | 6.625% | | 797,000 | 836,127 |
| Elementia SAB de CV(a) |
| 01/15/2025 | 5.500% | | 2,000,000 | 1,906,048 |
| INEOS Group Holdings SA(a) |
| 08/01/2024 | 5.625% | | 947,000 | 934,513 |
| Koppers, Inc.(a) |
| 02/15/2025 | 6.000% | | 597,000 | 600,161 |
| LYB International Finance BV |
| 03/15/2044 | 4.875% | | 4,790,000 | 4,825,092 |
| Olin Corp. |
| 02/01/2030 | 5.000% | | 2,231,000 | 2,145,031 |
The accompanying Notes to Financial Statements are an integral part of this statement.
Columbia Strategic Income Fund | Annual Report 2018
| 11 |
Portfolio of Investments (continued)
August 31, 2018
| Corporate Bonds & Notes(i) (continued) |
| Issuer | Coupon
Rate | | Principal
Amount ($) | Value ($) |
| Platform Specialty Products Corp.(a) |
| 02/01/2022 | 6.500% | | 91,000 | 93,254 |
| 12/01/2025 | 5.875% | | 4,423,000 | 4,402,729 |
| PQ Corp.(a) |
| 11/15/2022 | 6.750% | | 5,633,000 | 5,890,997 |
| 12/15/2025 | 5.750% | | 1,545,000 | 1,525,688 |
| SPCM SA(a) |
| 09/15/2025 | 4.875% | | 1,262,000 | 1,205,274 |
| Total | 32,566,116 |
| Construction Machinery 0.1% |
| H&E Equipment Services, Inc. |
| 09/01/2025 | 5.625% | | 1,731,000 | 1,718,227 |
| Ritchie Bros. Auctioneers, Inc.(a) |
| 01/15/2025 | 5.375% | | 627,000 | 621,415 |
| United Rentals North America, Inc. |
| 10/15/2025 | 4.625% | | 463,000 | 452,594 |
| 09/15/2026 | 5.875% | | 3,761,000 | 3,875,312 |
| Total | 6,667,548 |
| Consumer Cyclical Services 0.2% |
| APX Group, Inc. |
| 12/01/2020 | 8.750% | | 2,672,000 | 2,669,296 |
| 12/01/2022 | 7.875% | | 3,345,000 | 3,412,509 |
| 09/01/2023 | 7.625% | | 1,055,000 | 952,414 |
| frontdoor, Inc.(a) |
| 08/15/2026 | 6.750% | | 715,000 | 731,805 |
| Interval Acquisition Corp. |
| 04/15/2023 | 5.625% | | 2,601,000 | 2,620,515 |
| Total | 10,386,539 |
| Consumer Products 0.4% |
| Mattel, Inc.(a) |
| 12/31/2025 | 6.750% | | 2,103,000 | 2,058,743 |
| Prestige Brands, Inc.(a) |
| 03/01/2024 | 6.375% | | 3,800,000 | 3,854,146 |
| Scotts Miracle-Gro Co. (The) |
| 10/15/2023 | 6.000% | | 1,598,000 | 1,629,295 |
| 12/15/2026 | 5.250% | | 553,000 | 527,156 |
| Spectrum Brands, Inc. |
| 07/15/2025 | 5.750% | | 4,869,000 | 4,934,293 |
| Valvoline, Inc. |
| 08/15/2025 | 4.375% | | 2,603,000 | 2,493,351 |
| Total | 15,496,984 |
| Diversified Manufacturing 0.3% |
| Apergy Corp.(a) |
| 05/01/2026 | 6.375% | | 2,495,000 | 2,551,669 |
| Corporate Bonds & Notes(i) (continued) |
| Issuer | Coupon
Rate | | Principal
Amount ($) | Value ($) |
| BWX Technologies, Inc.(a) |
| 07/15/2026 | 5.375% | | 629,000 | 635,554 |
| Gates Global LLC/Co.(a) |
| 07/15/2022 | 6.000% | | 1,407,000 | 1,422,433 |
| TriMas Corp.(a) |
| 10/15/2025 | 4.875% | | 1,265,000 | 1,212,821 |
| United Technologies Corp. |
| 11/16/2048 | 4.625% | | 2,850,000 | 2,885,465 |
| WESCO Distribution, Inc. |
| 06/15/2024 | 5.375% | | 852,000 | 844,997 |
| Zekelman Industries, Inc.(a) |
| 06/15/2023 | 9.875% | | 1,862,000 | 2,026,821 |
| Total | 11,579,760 |
| Electric 4.6% |
| AES Corp. |
| 03/15/2023 | 4.500% | | 549,000 | 551,525 |
| 05/15/2023 | 4.875% | | 1,340,000 | 1,361,303 |
| 05/15/2026 | 6.000% | | 1,179,000 | 1,246,387 |
| 09/01/2027 | 5.125% | | 1,783,000 | 1,809,340 |
| Calpine Corp. |
| 01/15/2025 | 5.750% | | 2,037,000 | 1,850,303 |
| Calpine Corp.(a) |
| 06/01/2026 | 5.250% | | 703,000 | 663,712 |
| CMS Energy Corp. |
| 03/01/2024 | 3.875% | | 7,500,000 | 7,552,665 |
| 02/15/2027 | 2.950% | | 5,675,000 | 5,252,320 |
| 03/31/2043 | 4.700% | | 6,629,000 | 6,871,562 |
| DTE Energy Co. |
| 06/01/2024 | 3.500% | | 6,660,000 | 6,558,741 |
| 10/01/2026 | 2.850% | | 27,095,000 | 25,108,341 |
| Duke Energy Carolinas LLC |
| 03/15/2046 | 3.875% | | 1,600,000 | 1,538,746 |
| Duke Energy Corp. |
| 10/15/2023 | 3.950% | | 9,115,000 | 9,236,922 |
| 04/15/2024 | 3.750% | | 949,000 | 952,995 |
| 08/15/2027 | 3.150% | | 8,276,000 | 7,787,277 |
| 09/01/2046 | 3.750% | | 9,273,000 | 8,347,805 |
| Emera U.S. Finance LP |
| 06/15/2046 | 4.750% | | 15,730,000 | 15,760,957 |
| Energuate Trust(a) |
| 05/03/2027 | 5.875% | | 5,000,000 | 4,755,380 |
| Indiana Michigan Power Co. |
| 07/01/2047 | 3.750% | | 7,010,000 | 6,522,385 |
| Light Servicos de Eletricidade SA/Energia SA(a) |
| 05/03/2023 | 7.250% | | 5,200,000 | 4,888,504 |
| NextEra Energy Operating Partners LP(a) |
| 09/15/2027 | 4.500% | | 4,436,000 | 4,215,411 |
The accompanying Notes to Financial Statements are an integral part of this statement.
| 12 | Columbia Strategic Income Fund | Annual Report 2018 |
Portfolio of Investments (continued)
August 31, 2018
| Corporate Bonds & Notes(i) (continued) |
| Issuer | Coupon
Rate | | Principal
Amount ($) | Value ($) |
| NRG Energy, Inc. |
| 01/15/2027 | 6.625% | | 3,130,000 | 3,285,348 |
| NRG Energy, Inc.(a) |
| 01/15/2028 | 5.750% | | 899,000 | 905,763 |
| NRG Yield Operating LLC |
| 08/15/2024 | 5.375% | | 4,509,000 | 4,531,689 |
| 09/15/2026 | 5.000% | | 3,374,000 | 3,231,617 |
| Pacific Gas & Electric Co. |
| 12/01/2027 | 3.300% | | 656,000 | 602,194 |
| 02/15/2044 | 4.750% | | 4,800,000 | 4,727,386 |
| 12/01/2047 | 3.950% | | 9,220,000 | 8,136,964 |
| Pattern Energy Group, Inc.(a) |
| 02/01/2024 | 5.875% | | 3,103,000 | 3,126,899 |
| PPL Capital Funding, Inc. |
| 03/15/2024 | 3.950% | | 7,750,000 | 7,814,263 |
| Progress Energy, Inc. |
| 04/01/2022 | 3.150% | | 8,094,000 | 7,988,462 |
| Southern Co. (The) |
| 07/01/2046 | 4.400% | | 14,715,000 | 14,218,899 |
| TerraForm Power Operating LLC(a) |
| 01/31/2028 | 5.000% | | 3,114,000 | 2,920,745 |
| Vistra Energy Corp. |
| 11/01/2024 | 7.625% | | 1,643,000 | 1,768,977 |
| Vistra Operations Co. LLC(a) |
| 09/01/2026 | 5.500% | | 887,000 | 900,997 |
| Xcel Energy, Inc. |
| 12/01/2026 | 3.350% | | 3,175,000 | 3,080,395 |
| 06/15/2028 | 4.000% | | 11,490,000 | 11,636,394 |
| Total | 201,709,573 |
| Finance Companies 1.4% |
| Avolon Holdings Funding Ltd.(a) |
| 01/15/2023 | 5.500% | | 2,394,000 | 2,461,123 |
| GE Capital International Funding Co. Unlimited Co. |
| 11/15/2020 | 2.342% | | 9,440,000 | 9,246,206 |
| 11/15/2035 | 4.418% | | 26,545,000 | 25,592,459 |
| iStar, Inc. |
| 04/01/2022 | 6.000% | | 2,394,000 | 2,418,833 |
| Navient Corp. |
| 01/25/2022 | 7.250% | | 1,039,000 | 1,099,286 |
| 06/15/2022 | 6.500% | | 1,411,000 | 1,458,044 |
| 01/25/2023 | 5.500% | | 1,000,000 | 990,874 |
| 03/25/2024 | 6.125% | | 2,849,000 | 2,837,211 |
| 10/25/2024 | 5.875% | | 1,278,000 | 1,240,611 |
| 06/15/2026 | 6.750% | | 1,822,000 | 1,789,656 |
| Park Aerospace Holdings Ltd.(a) |
| 08/15/2022 | 5.250% | | 263,000 | 268,043 |
| Provident Funding Associates LP/Finance Corp.(a) |
| 06/15/2025 | 6.375% | | 2,862,000 | 2,861,785 |
| Corporate Bonds & Notes(i) (continued) |
| Issuer | Coupon
Rate | | Principal
Amount ($) | Value ($) |
| Quicken Loans, Inc.(a) |
| 05/01/2025 | 5.750% | | 4,451,000 | 4,417,991 |
| 01/15/2028 | 5.250% | | 125,000 | 113,733 |
| Springleaf Finance Corp. |
| 03/15/2023 | 5.625% | | 1,173,000 | 1,172,231 |
| 03/15/2025 | 6.875% | | 2,004,000 | 2,005,569 |
| 03/15/2026 | 7.125% | | 2,091,000 | 2,083,012 |
| Total | 62,056,667 |
| Food and Beverage 2.8% |
| Anheuser-Busch InBev Finance, Inc. |
| 02/01/2046 | 4.900% | | 17,597,000 | 18,059,854 |
| Aramark Services, Inc. |
| 01/15/2024 | 5.125% | | 799,000 | 812,890 |
| B&G Foods, Inc. |
| 04/01/2025 | 5.250% | | 4,851,000 | 4,709,977 |
| Bacardi Ltd.(a) |
| 05/15/2048 | 5.300% | | 26,230,000 | 25,652,284 |
| Chobani LLC/Finance Corp., Inc.(a) |
| 04/15/2025 | 7.500% | | 1,448,000 | 1,219,899 |
| ConAgra Foods, Inc. |
| 09/15/2022 | 3.250% | | 3,130,000 | 3,081,798 |
| FAGE International SA/U.S.A. Dairy Industry, Inc.(a) |
| 08/15/2026 | 5.625% | | 3,678,000 | 3,238,041 |
| Kraft Heinz Foods Co. |
| 06/01/2046 | 4.375% | | 23,914,000 | 20,974,874 |
| Lamb Weston Holdings, Inc.(a) |
| 11/01/2024 | 4.625% | | 727,000 | 714,345 |
| 11/01/2026 | 4.875% | | 2,538,000 | 2,503,328 |
| MHP SA(a) |
| 04/03/2026 | 6.950% | | 4,800,000 | 4,467,197 |
| Molson Coors Brewing Co. |
| 07/15/2046 | 4.200% | | 20,662,000 | 18,487,986 |
| Mondelez International, Inc.(a) |
| 10/28/2019 | 1.625% | | 6,252,000 | 6,157,576 |
| Pinnacle Foods Finance LLC/Corp. |
| 01/15/2024 | 5.875% | | 1,000,000 | 1,050,293 |
| Post Holdings, Inc.(a) |
| 03/01/2025 | 5.500% | | 742,000 | 741,256 |
| 08/15/2026 | 5.000% | | 3,107,000 | 2,982,916 |
| 03/01/2027 | 5.750% | | 6,528,000 | 6,449,240 |
| 01/15/2028 | 5.625% | | 1,161,000 | 1,128,550 |
| Total | 122,432,304 |
| Gaming 0.9% |
| Boyd Gaming Corp. |
| 04/01/2026 | 6.375% | | 2,849,000 | 2,913,712 |
| 08/15/2026 | 6.000% | | 504,000 | 508,084 |
The accompanying Notes to Financial Statements are an integral part of this statement.
Columbia Strategic Income Fund | Annual Report 2018
| 13 |
Portfolio of Investments (continued)
August 31, 2018
| Corporate Bonds & Notes(i) (continued) |
| Issuer | Coupon
Rate | | Principal
Amount ($) | Value ($) |
| Caesars Resort Collection LLC/CRC Finco, Inc.(a) |
| 10/15/2025 | 5.250% | | 1,064,000 | 1,017,775 |
| Eldorado Resorts, Inc. |
| 04/01/2025 | 6.000% | | 4,115,000 | 4,189,564 |
| GLP Capital LP/Financing II, Inc. |
| 04/15/2026 | 5.375% | | 2,761,000 | 2,867,806 |
| 06/01/2028 | 5.750% | | 1,163,000 | 1,232,859 |
| International Game Technology PLC(a) |
| 02/15/2025 | 6.500% | | 3,062,000 | 3,223,080 |
| Jack Ohio Finance LLC/1 Corp.(a) |
| 11/15/2021 | 6.750% | | 2,230,000 | 2,309,769 |
| MGM Growth Properties Operating Partnership LP/Finance Co-Issuer, Inc. |
| 05/01/2024 | 5.625% | | 899,000 | 924,982 |
| 09/01/2026 | 4.500% | | 873,000 | 834,061 |
| 01/15/2028 | 4.500% | | 334,000 | 308,147 |
| MGM Resorts International |
| 12/15/2021 | 6.625% | | 2,043,000 | 2,169,899 |
| Penn National Gaming, Inc.(a) |
| 01/15/2027 | 5.625% | | 1,446,000 | 1,392,718 |
| Rivers Pittsburgh Borrower LP/Finance Corp.(a) |
| 08/15/2021 | 6.125% | | 2,940,000 | 2,939,441 |
| Scientific Games International, Inc. |
| 12/01/2022 | 10.000% | | 3,541,000 | 3,750,032 |
| Scientific Games International, Inc.(a) |
| 10/15/2025 | 5.000% | | 3,294,000 | 3,127,831 |
| Seminole Tribe of Florida, Inc.(a) |
| 10/01/2020 | 7.804% | | 740,000 | 740,000 |
| Stars Group Holdings BV/Co-Borrower LLC(a) |
| 07/15/2026 | 7.000% | | 1,210,000 | 1,259,065 |
| Tunica-Biloxi Gaming Authority(a) |
| 12/15/2020 | 3.780% | | 3,174,123 | 868,916 |
| Wynn Las Vegas LLC/Capital Corp.(a) |
| 03/01/2025 | 5.500% | | 2,587,000 | 2,558,000 |
| 05/15/2027 | 5.250% | | 310,000 | 291,238 |
| Total | 39,426,979 |
| Health Care 3.1% |
| Acadia Healthcare Co., Inc. |
| 07/01/2022 | 5.125% | | 524,000 | 527,054 |
| 03/01/2024 | 6.500% | | 2,077,000 | 2,156,341 |
| Amsurg Corp. |
| 07/15/2022 | 5.625% | | 635,000 | 651,072 |
| Becton Dickinson and Co. |
| 06/06/2027 | 3.700% | | 26,720,000 | 25,660,124 |
| Cardinal Health, Inc. |
| 06/15/2027 | 3.410% | | 18,160,000 | 16,770,469 |
| 06/15/2047 | 4.368% | | 2,780,000 | 2,436,089 |
| Corporate Bonds & Notes(i) (continued) |
| Issuer | Coupon
Rate | | Principal
Amount ($) | Value ($) |
| Change Healthcare Holdings LLC/Finance, Inc.(a) |
| 03/01/2025 | 5.750% | | 3,043,000 | 2,979,100 |
| Charles River Laboratories International, Inc.(a) |
| 04/01/2026 | 5.500% | | 759,000 | 771,095 |
| CHS/Community Health Systems, Inc. |
| 03/31/2023 | 6.250% | | 1,937,000 | 1,840,811 |
| CVS Health Corp. |
| 06/01/2026 | 2.875% | | 8,285,000 | 7,617,196 |
| 03/25/2048 | 5.050% | | 13,740,000 | 14,042,885 |
| DaVita, Inc. |
| 05/01/2025 | 5.000% | | 2,864,000 | 2,723,209 |
| Envision Healthcare Corp.(a) |
| 12/01/2024 | 6.250% | | 855,000 | 914,005 |
| Express Scripts Holding Co. |
| 07/15/2046 | 4.800% | | 17,308,000 | 16,765,515 |
| HCA, Inc. |
| 02/15/2020 | 6.500% | | 1,416,000 | 1,472,215 |
| 02/15/2022 | 7.500% | | 3,328,000 | 3,660,837 |
| 04/15/2025 | 5.250% | | 4,188,000 | 4,319,340 |
| 02/15/2027 | 4.500% | | 5,235,000 | 5,182,650 |
| Hologic, Inc.(a) |
| 10/15/2025 | 4.375% | | 2,189,000 | 2,107,504 |
| 02/01/2028 | 4.625% | | 1,661,000 | 1,558,716 |
| MPH Acquisition Holdings LLC(a) |
| 06/01/2024 | 7.125% | | 3,986,000 | 4,125,769 |
| Polaris Intermediate Corp. PIK(a) |
| 12/01/2022 | 8.500% | | 1,261,000 | 1,304,315 |
| Sotera Health Holdings LLC(a) |
| 05/15/2023 | 6.500% | | 2,466,000 | 2,527,287 |
| Teleflex, Inc. |
| 06/01/2026 | 4.875% | | 539,000 | 531,421 |
| 11/15/2027 | 4.625% | | 1,215,000 | 1,157,418 |
| Tenet Healthcare Corp. |
| 06/15/2023 | 6.750% | | 761,000 | 766,183 |
| 07/15/2024 | 4.625% | | 3,428,000 | 3,359,934 |
| 05/01/2025 | 5.125% | | 1,317,000 | 1,307,123 |
| 08/01/2025 | 7.000% | | 2,667,000 | 2,666,965 |
| Universal Health Services, Inc.(a) |
| 06/01/2026 | 5.000% | | 3,040,000 | 3,040,000 |
| Total | 134,942,642 |
| Healthcare Insurance 0.2% |
| Centene Corp. |
| 01/15/2025 | 4.750% | | 2,202,000 | 2,217,559 |
| Centene Corp.(a) |
| 06/01/2026 | 5.375% | | 2,336,000 | 2,415,457 |
| WellCare Health Plans, Inc. |
| 04/01/2025 | 5.250% | | 4,087,000 | 4,197,140 |
The accompanying Notes to Financial Statements are an integral part of this statement.
| 14 | Columbia Strategic Income Fund | Annual Report 2018 |
Portfolio of Investments (continued)
August 31, 2018
| Corporate Bonds & Notes(i) (continued) |
| Issuer | Coupon
Rate | | Principal
Amount ($) | Value ($) |
| WellCare Health Plans, Inc.(a) |
| 08/15/2026 | 5.375% | | 2,077,000 | 2,139,057 |
| Total | 10,969,213 |
| Home Construction 0.3% |
| Lennar Corp. |
| 11/15/2024 | 5.875% | | 1,191,000 | 1,233,957 |
| 06/01/2026 | 5.250% | | 2,550,000 | 2,527,532 |
| 06/15/2027 | 5.000% | | 971,000 | 939,442 |
| 11/29/2027 | 4.750% | | 3,083,000 | 2,946,346 |
| Meritage Homes Corp. |
| 04/01/2022 | 7.000% | | 673,000 | 725,857 |
| 06/01/2025 | 6.000% | | 760,000 | 768,582 |
| 06/06/2027 | 5.125% | | 2,223,000 | 2,066,696 |
| Taylor Morrison Communities, Inc./Holdings II(a) |
| 04/15/2023 | 5.875% | | 1,265,000 | 1,268,846 |
| 03/01/2024 | 5.625% | | 695,000 | 682,838 |
| Total | 13,160,096 |
| Independent Energy 1.6% |
| Callon Petroleum Co. |
| 10/01/2024 | 6.125% | | 876,000 | 897,270 |
| Callon Petroleum Co.(a) |
| 07/01/2026 | 6.375% | | 2,766,000 | 2,833,916 |
| Canadian Natural Resources Ltd. |
| 06/01/2047 | 4.950% | | 1,165,000 | 1,219,710 |
| Carrizo Oil & Gas, Inc. |
| 04/15/2023 | 6.250% | | 2,712,000 | 2,776,689 |
| Centennial Resource Production LLC(a) |
| 01/15/2026 | 5.375% | | 1,776,000 | 1,750,802 |
| Chaparral Energy, Inc.(a) |
| 07/15/2023 | 8.750% | | 1,242,000 | 1,234,101 |
| CrownRock LP/Finance, Inc.(a) |
| 10/15/2025 | 5.625% | | 3,815,000 | 3,708,333 |
| Diamondback Energy, Inc. |
| 11/01/2024 | 4.750% | | 533,000 | 537,378 |
| 05/31/2025 | 5.375% | | 2,656,000 | 2,723,388 |
| Endeavor Energy Resources LP/Finance, Inc.(a) |
| 01/30/2026 | 5.500% | | 358,000 | 356,849 |
| 01/30/2028 | 5.750% | | 3,765,000 | 3,755,979 |
| Extraction Oil & Gas, Inc.(a) |
| 05/15/2024 | 7.375% | | 1,272,000 | 1,294,121 |
| Gran Tierra Energy International Holdings Ltd.(a) |
| 02/15/2025 | 6.250% | | 1,550,000 | 1,492,622 |
| Halcon Resources Corp. |
| 02/15/2025 | 6.750% | | 4,324,000 | 4,021,225 |
| Indigo Natural Resources LLC(a) |
| 02/15/2026 | 6.875% | | 1,369,000 | 1,328,946 |
| Corporate Bonds & Notes(i) (continued) |
| Issuer | Coupon
Rate | | Principal
Amount ($) | Value ($) |
| Jagged Peak Energy LLC(a) |
| 05/01/2026 | 5.875% | | 2,143,000 | 2,113,407 |
| Laredo Petroleum, Inc. |
| 03/15/2023 | 6.250% | | 5,577,000 | 5,598,248 |
| Matador Resources Co.(a) |
| 09/15/2026 | 5.875% | | 1,692,000 | 1,721,948 |
| MEG Energy Corp.(a) |
| 01/15/2025 | 6.500% | | 565,000 | 562,133 |
| Noble Energy, Inc. |
| 11/15/2043 | 5.250% | | 2,725,000 | 2,741,405 |
| Parsley Energy LLC/Finance Corp.(a) |
| 06/01/2024 | 6.250% | | 1,271,000 | 1,326,608 |
| 08/15/2025 | 5.250% | | 2,621,000 | 2,611,661 |
| 10/15/2027 | 5.625% | | 4,423,000 | 4,472,577 |
| PDC Energy, Inc. |
| 09/15/2024 | 6.125% | | 2,717,000 | 2,708,001 |
| SM Energy Co. |
| 06/01/2025 | 5.625% | | 642,000 | 637,243 |
| 09/15/2026 | 6.750% | | 4,805,000 | 4,985,433 |
| 01/15/2027 | 6.625% | | 1,163,000 | 1,197,896 |
| Tullow Oil PLC(a) |
| 03/01/2025 | 7.000% | | 4,950,000 | 4,788,754 |
| Whiting Petroleum Corp. |
| 01/15/2026 | 6.625% | | 2,055,000 | 2,137,200 |
| WPX Energy, Inc. |
| 01/15/2022 | 6.000% | | 1,014,000 | 1,049,326 |
| 09/15/2024 | 5.250% | | 2,400,000 | 2,410,466 |
| 06/01/2026 | 5.750% | | 1,060,000 | 1,074,414 |
| Total | 72,068,049 |
| Integrated Energy 0.2% |
| Cenovus Energy, Inc. |
| 09/15/2043 | 5.200% | | 8,345,000 | 8,044,981 |
| Leisure 0.1% |
| Boyne U.S.A., Inc.(a) |
| 05/01/2025 | 7.250% | | 1,267,000 | 1,343,821 |
| Live Nation Entertainment, Inc.(a) |
| 11/01/2024 | 4.875% | | 1,163,000 | 1,146,878 |
| 03/15/2026 | 5.625% | | 724,000 | 727,692 |
| Viking Cruises Ltd.(a) |
| 09/15/2027 | 5.875% | | 2,047,000 | 2,008,238 |
| Total | 5,226,629 |
| Life Insurance 2.6% |
| Assicurazioni Generali SpA, Subordinated(a),(j) |
| 06/08/2048 | 5.000% | EUR | 17,300,000 | 20,028,402 |
| Brighthouse Financial, Inc. |
| 06/22/2047 | 4.700% | | 7,770,000 | 6,505,759 |
The accompanying Notes to Financial Statements are an integral part of this statement.
Columbia Strategic Income Fund | Annual Report 2018
| 15 |
Portfolio of Investments (continued)
August 31, 2018
| Corporate Bonds & Notes(i) (continued) |
| Issuer | Coupon
Rate | | Principal
Amount ($) | Value ($) |
| Five Corners Funding Trust(a) |
| 11/15/2023 | 4.419% | | 22,756,000 | 23,508,131 |
| Guardian Life Insurance Co. of America (The)(a) |
| Subordinated |
| 06/19/2064 | 4.875% | | 7,860,000 | 8,073,934 |
| Massachusetts Mutual Life Insurance Co.(a) |
| Subordinated |
| 04/01/2077 | 4.900% | | 6,700,000 | 6,817,317 |
| Northwestern Mutual Life Insurance Co. (The)(a) |
| Subordinated |
| 09/30/2047 | 3.850% | | 6,710,000 | 6,281,781 |
| Peachtree Corners Funding Trust(a) |
| 02/15/2025 | 3.976% | | 22,118,000 | 21,723,725 |
| Teachers Insurance & Annuity Association of America(a) |
| Subordinated |
| 09/15/2044 | 4.900% | | 9,550,000 | 10,322,480 |
| 05/15/2047 | 4.270% | | 2,961,000 | 2,938,994 |
| Voya Financial, Inc. |
| 06/15/2046 | 4.800% | | 5,875,000 | 5,916,742 |
| Total | 112,117,265 |
| Lodging 0.2% |
| Grupo Posadas SAB de CV(a) |
| 06/30/2022 | 7.875% | | 4,650,000 | 4,780,805 |
| Hilton Domestic Operating Co., Inc.(a) |
| 05/01/2026 | 5.125% | | 1,139,000 | 1,140,797 |
| Hilton Grand Vacations Borrower LLC/Inc. |
| 12/01/2024 | 6.125% | | 775,000 | 794,852 |
| Marriott Ownership Resorts, Inc.(a) |
| 09/15/2026 | 6.500% | | 419,000 | 427,181 |
| Total | 7,143,635 |
| Media and Entertainment 0.7% |
| 21st Century Fox America, Inc. |
| 09/15/2044 | 4.750% | | 8,832,000 | 9,373,304 |
| Discovery Communications LLC |
| 09/20/2047 | 5.200% | | 1,600,000 | 1,557,093 |
| Match Group, Inc. |
| 06/01/2024 | 6.375% | | 2,214,000 | 2,357,146 |
| Match Group, Inc.(a) |
| 12/15/2027 | 5.000% | | 1,348,000 | 1,327,036 |
| Netflix, Inc. |
| 02/15/2025 | 5.875% | | 1,129,000 | 1,168,310 |
| Netflix, Inc.(a) |
| 04/15/2028 | 4.875% | | 4,534,000 | 4,297,266 |
| 11/15/2028 | 5.875% | | 5,280,000 | 5,295,993 |
| Corporate Bonds & Notes(i) (continued) |
| Issuer | Coupon
Rate | | Principal
Amount ($) | Value ($) |
| Outfront Media Capital LLC/Corp. |
| 03/15/2025 | 5.875% | | 3,443,000 | 3,477,726 |
| Total | 28,853,874 |
| Metals and Mining 1.0% |
| Alcoa Nederland Holding BV(a) |
| 09/30/2024 | 6.750% | | 876,000 | 933,379 |
| 09/30/2026 | 7.000% | | 694,000 | 750,267 |
| Big River Steel LLC/Finance Corp.(a) |
| 09/01/2025 | 7.250% | | 1,664,000 | 1,745,664 |
| Constellium NV(a) |
| 05/15/2024 | 5.750% | | 2,602,000 | 2,591,040 |
| 03/01/2025 | 6.625% | | 1,472,000 | 1,498,499 |
| 02/15/2026 | 5.875% | | 832,000 | 815,599 |
| Freeport-McMoRan, Inc. |
| 03/15/2043 | 5.450% | | 9,763,000 | 8,725,915 |
| Geo Coal International Pte Ltd.(a) |
| 10/04/2022 | 8.000% | | 4,494,000 | 4,185,770 |
| Grinding Media, Inc./Moly-Cop AltaSteel Ltd.(a) |
| 12/15/2023 | 7.375% | | 1,415,000 | 1,486,596 |
| HudBay Minerals, Inc.(a) |
| 01/15/2023 | 7.250% | | 506,000 | 515,018 |
| 01/15/2025 | 7.625% | | 3,426,000 | 3,487,284 |
| Indo Energy Finance II BV(a) |
| 01/24/2023 | 6.375% | | 4,500,000 | 4,374,072 |
| Novelis Corp.(a) |
| 08/15/2024 | 6.250% | | 910,000 | 928,203 |
| 09/30/2026 | 5.875% | | 4,288,000 | 4,179,861 |
| Petra Diamonds U.S. Treasury PLC(a) |
| 05/01/2022 | 7.250% | | 812,000 | 779,626 |
| Teck Resources Ltd. |
| 07/15/2041 | 6.250% | | 8,415,000 | 8,874,257 |
| Total | 45,871,050 |
| Midstream 3.1% |
| Cheniere Corpus Christi Holdings LLC |
| 06/30/2027 | 5.125% | | 1,793,000 | 1,824,259 |
| DCP Midstream Operating LP |
| 04/01/2044 | 5.600% | | 3,420,000 | 3,287,465 |
| Delek Logistics Partners LP/Finance Corp. |
| 05/15/2025 | 6.750% | | 1,539,000 | 1,545,898 |
| Energy Transfer Equity LP |
| 03/15/2023 | 4.250% | | 1,499,000 | 1,503,464 |
| 06/01/2027 | 5.500% | | 7,214,000 | 7,580,868 |
| Energy Transfer Partners LP/Regency Finance Corp. |
| 09/01/2020 | 5.750% | | 1,682,000 | 1,746,999 |
The accompanying Notes to Financial Statements are an integral part of this statement.
| 16 | Columbia Strategic Income Fund | Annual Report 2018 |
Portfolio of Investments (continued)
August 31, 2018
| Corporate Bonds & Notes(i) (continued) |
| Issuer | Coupon
Rate | | Principal
Amount ($) | Value ($) |
| Enterprise Products Operating LLC |
| 02/15/2045 | 5.100% | | 6,635,000 | 7,033,657 |
| 05/15/2046 | 4.900% | | 3,310,000 | 3,444,883 |
| Holly Energy Partners LP/Finance Corp.(a) |
| 08/01/2024 | 6.000% | | 2,807,000 | 2,865,111 |
| Kinder Morgan Energy Partners LP |
| 03/01/2043 | 5.000% | | 19,748,000 | 19,157,318 |
| Kinder Morgan, Inc. |
| 02/15/2046 | 5.050% | | 3,555,000 | 3,490,896 |
| MPLX LP |
| 04/15/2048 | 4.700% | | 5,970,000 | 5,597,394 |
| NGPL PipeCo LLC(a) |
| 08/15/2022 | 4.375% | | 683,000 | 688,147 |
| 12/15/2037 | 7.768% | | 5,767,000 | 7,122,332 |
| NuStar Logistics LP |
| 04/28/2027 | 5.625% | | 2,219,000 | 2,209,649 |
| Plains All American Pipeline LP/Finance Corp. |
| 06/15/2044 | 4.700% | | 21,154,000 | 19,263,530 |
| Rockies Express Pipeline LLC(a) |
| 04/15/2040 | 6.875% | | 3,533,000 | 4,098,294 |
| Rockpoint Gas Storage Canada Ltd.(a) |
| 03/31/2023 | 7.000% | | 1,899,000 | 1,918,070 |
| Star Energy Geothermal Wayang Windu Ltd.(a) |
| 04/24/2033 | 6.750% | | 4,800,000 | 4,434,878 |
| Sunoco LP/Finance Corp.(a) |
| 01/15/2023 | 4.875% | | 732,000 | 722,031 |
| 02/15/2026 | 5.500% | | 2,023,000 | 1,937,087 |
| Tallgrass Energy Partners LP/Finance Corp.(a) |
| 09/15/2024 | 5.500% | | 731,000 | 750,936 |
| 01/15/2028 | 5.500% | | 2,304,000 | 2,327,697 |
| Targa Resources Partners LP/Finance Corp. |
| 02/01/2027 | 5.375% | | 4,611,000 | 4,619,484 |
| Targa Resources Partners LP/Finance Corp.(a) |
| 01/15/2028 | 5.000% | | 8,837,000 | 8,605,709 |
| TransMontaigne Partners LP/TLP Finance Corp. |
| 02/15/2026 | 6.125% | | 1,884,000 | 1,771,974 |
| Williams Partners LP |
| 09/15/2045 | 5.100% | | 13,674,000 | 13,731,923 |
| Total | 133,279,953 |
| Natural Gas 0.7% |
| NiSource Finance Corp. |
| 03/30/2048 | 3.950% | | 2,115,000 | 1,957,775 |
| NiSource, Inc. |
| 02/15/2043 | 5.250% | | 3,620,000 | 4,008,176 |
| 05/15/2047 | 4.375% | | 7,500,000 | 7,425,473 |
| Corporate Bonds & Notes(i) (continued) |
| Issuer | Coupon
Rate | | Principal
Amount ($) | Value ($) |
| Sempra Energy |
| 06/15/2024 | 3.550% | | 6,059,000 | 5,963,874 |
| 06/15/2027 | 3.250% | | 10,850,000 | 10,167,893 |
| Total | 29,523,191 |
| Oil Field Services 0.4% |
| Calfrac Holdings LP(a) |
| 06/15/2026 | 8.500% | | 1,154,000 | 1,099,870 |
| Diamond Offshore Drilling, Inc. |
| 08/15/2025 | 7.875% | | 1,028,000 | 1,056,610 |
| Nabors Industries, Inc. |
| 01/15/2023 | 5.500% | | 560,000 | 558,333 |
| Nabors Industries, Inc.(a) |
| 02/01/2025 | 5.750% | | 4,441,000 | 4,291,911 |
| Rowan Companies, Inc. |
| 01/15/2024 | 4.750% | | 1,109,000 | 947,870 |
| SESI LLC |
| 09/15/2024 | 7.750% | | 2,218,000 | 2,305,296 |
| Transocean Guardian Ltd.(a) |
| 01/15/2024 | 5.875% | | 1,847,000 | 1,860,853 |
| Transocean Pontus Ltd.(a) |
| 08/01/2025 | 6.125% | | 569,000 | 579,331 |
| U.S.A. Compression Partners LP/Finance Corp.(a) |
| 04/01/2026 | 6.875% | | 1,892,000 | 1,961,514 |
| Weatherford International LLC(a) |
| 03/01/2025 | 9.875% | | 355,000 | 333,366 |
| Weatherford International Ltd. |
| 06/15/2021 | 7.750% | | 1,526,000 | 1,495,808 |
| 02/15/2024 | 9.875% | | 985,000 | 944,118 |
| Total | 17,434,880 |
| Other Financial Institutions 0.0% |
| FTI Consulting, Inc. |
| 11/15/2022 | 6.000% | | 859,000 | 880,558 |
| Other Industry 0.1% |
| KAR Auction Services, Inc.(a) |
| 06/01/2025 | 5.125% | | 3,148,000 | 3,099,757 |
| WeWork Companies, Inc.(a) |
| 05/01/2025 | 7.875% | | 643,000 | 623,109 |
| Total | 3,722,866 |
| Other REIT 0.1% |
| CyrusOne LP/Finance Corp. |
| 03/15/2024 | 5.000% | | 1,043,000 | 1,059,315 |
| 03/15/2027 | 5.375% | | 3,003,000 | 3,041,354 |
| Total | 4,100,669 |
The accompanying Notes to Financial Statements are an integral part of this statement.
Columbia Strategic Income Fund | Annual Report 2018
| 17 |
Portfolio of Investments (continued)
August 31, 2018
| Corporate Bonds & Notes(i) (continued) |
| Issuer | Coupon
Rate | | Principal
Amount ($) | Value ($) |
| Packaging 0.7% |
| ARD Finance SA PIK |
| 09/15/2023 | 7.125% | | 1,208,000 | 1,225,563 |
| Ardagh Packaging Finance PLC/Holdings U.S.A., Inc.(a) |
| 05/15/2024 | 7.250% | | 2,355,000 | 2,480,225 |
| 02/15/2025 | 6.000% | | 5,086,000 | 4,998,562 |
| Berry Global, Inc. |
| 07/15/2023 | 5.125% | | 4,020,000 | 4,011,823 |
| Crown Americas LLC/Capital Corp. VI(a) |
| 02/01/2026 | 4.750% | | 1,116,000 | 1,072,171 |
| Flex Acquisition Co., Inc.(a) |
| 07/15/2026 | 7.875% | | 1,435,000 | 1,431,044 |
| Multi-Color Corp.(a) |
| 11/01/2025 | 4.875% | | 2,268,000 | 2,116,788 |
| Novolex (a) |
| 01/15/2025 | 6.875% | | 654,000 | 630,334 |
| Owens-Brockway Glass Container, Inc.(a) |
| 08/15/2023 | 5.875% | | 1,527,000 | 1,566,792 |
| Reynolds Group Issuer, Inc./LLC |
| 10/15/2020 | 5.750% | | 5,964,858 | 5,980,176 |
| Reynolds Group Issuer, Inc./LLC(a) |
| 07/15/2023 | 5.125% | | 2,299,000 | 2,298,802 |
| 07/15/2024 | 7.000% | | 3,073,000 | 3,122,343 |
| Total | 30,934,623 |
| Pharmaceuticals 0.9% |
| Allergan Funding SCS |
| 03/15/2035 | 4.550% | | 5,330,000 | 5,235,750 |
| Amgen, Inc. |
| 06/15/2051 | 4.663% | | 7,245,000 | 7,175,890 |
| Bausch Health Companies, Inc.(a) |
| 12/01/2021 | 5.625% | | 1,659,000 | 1,645,623 |
| 05/15/2023 | 5.875% | | 5,582,000 | 5,335,549 |
| 03/15/2024 | 7.000% | | 2,400,000 | 2,535,569 |
| 11/01/2025 | 5.500% | | 1,973,000 | 1,969,249 |
| Catalent Pharma Solutions, Inc.(a) |
| 01/15/2026 | 4.875% | | 1,749,000 | 1,672,703 |
| Celgene Corp. |
| 02/20/2048 | 4.550% | | 3,380,000 | 3,180,962 |
| Jaguar Holding Co. II/Pharmaceutical Product Development LLC(a) |
| 08/01/2023 | 6.375% | | 2,774,000 | 2,795,196 |
| Valeant Pharmaceuticals International, Inc.(a) |
| 07/15/2021 | 7.500% | | 3,553,000 | 3,624,806 |
| 04/01/2026 | 9.250% | | 3,605,000 | 3,830,886 |
| 01/31/2027 | 8.500% | | 649,000 | 666,848 |
| Total | 39,669,031 |
| Corporate Bonds & Notes(i) (continued) |
| Issuer | Coupon
Rate | | Principal
Amount ($) | Value ($) |
| Property & Casualty 0.5% |
| HUB International Ltd.(a) |
| 05/01/2026 | 7.000% | | 2,096,000 | 2,084,455 |
| Liberty Mutual Group, Inc.(a) |
| 06/15/2023 | 4.250% | | 6,949,000 | 7,076,966 |
| 08/01/2044 | 4.850% | | 3,460,000 | 3,546,915 |
| Loews Corp. |
| 04/01/2026 | 3.750% | | 11,415,000 | 11,421,187 |
| Total | 24,129,523 |
| Railroads 0.2% |
| CSX Corp. |
| 03/01/2048 | 4.300% | | 7,380,000 | 7,186,873 |
| Restaurants 0.3% |
| 1011778 BC ULC/New Red Finance, Inc.(a) |
| 10/15/2025 | 5.000% | | 5,277,000 | 5,118,152 |
| IRB Holding Corp.(a) |
| 02/15/2026 | 6.750% | | 782,000 | 746,769 |
| KFC Holding Co./Pizza Hut Holdings LLC/Taco Bell of America LLC(a) |
| 06/01/2027 | 4.750% | | 1,566,000 | 1,496,913 |
| McDonald’s Corp. |
| 12/09/2045 | 4.875% | | 5,840,000 | 6,142,483 |
| Total | 13,504,317 |
| Retailers 0.3% |
| Cencosud SA(a) |
| 02/12/2045 | 6.625% | | 1,750,000 | 1,752,039 |
| L Brands, Inc. |
| 11/01/2035 | 6.875% | | 1,657,000 | 1,380,806 |
| Party City Holdings, Inc.(a) |
| 08/01/2026 | 6.625% | | 717,000 | 722,202 |
| Penske Automotive Group, Inc. |
| 12/01/2024 | 5.375% | | 619,000 | 612,407 |
| 05/15/2026 | 5.500% | | 1,071,000 | 1,049,705 |
| Walmart, Inc. |
| 06/29/2048 | 4.050% | | 5,835,000 | 5,902,651 |
| Total | 11,419,810 |
| Supermarkets 0.4% |
| Kroger Co. (The) |
| 02/01/2047 | 4.450% | | 10,613,000 | 9,871,565 |
| 01/15/2048 | 4.650% | | 8,470,000 | 8,148,377 |
| Total | 18,019,942 |
| Supranational 0.1% |
| Banque Ouest Africaine de Developpement(a) |
| 07/27/2027 | 5.000% | | 2,400,000 | 2,322,115 |
The accompanying Notes to Financial Statements are an integral part of this statement.
| 18 | Columbia Strategic Income Fund | Annual Report 2018 |
Portfolio of Investments (continued)
August 31, 2018
| Corporate Bonds & Notes(i) (continued) |
| Issuer | Coupon
Rate | | Principal
Amount ($) | Value ($) |
| Technology 1.6% |
| Ascend Learning LLC(a) |
| 08/01/2025 | 6.875% | | 913,000 | 923,499 |
| Broadcom Corp./Cayman Finance Ltd. |
| 01/15/2027 | 3.875% | | 15,870,000 | 14,847,944 |
| Camelot Finance SA(a) |
| 10/15/2024 | 7.875% | | 2,758,000 | 2,757,374 |
| CDK Global, Inc. |
| 06/01/2027 | 4.875% | | 2,424,000 | 2,376,228 |
| Equinix, Inc. |
| 01/15/2026 | 5.875% | | 5,673,000 | 5,884,438 |
| 05/15/2027 | 5.375% | | 2,409,000 | 2,452,986 |
| First Data Corp.(a) |
| 12/01/2023 | 7.000% | | 6,969,000 | 7,263,970 |
| 01/15/2024 | 5.750% | | 3,385,000 | 3,454,000 |
| Gartner, Inc.(a) |
| 04/01/2025 | 5.125% | | 4,384,000 | 4,438,800 |
| Informatica LLC(a) |
| 07/15/2023 | 7.125% | | 1,524,000 | 1,551,464 |
| Iron Mountain, Inc.(a) |
| 09/15/2027 | 4.875% | | 2,396,000 | 2,224,614 |
| 03/15/2028 | 5.250% | | 1,651,000 | 1,565,022 |
| MSCI, Inc.(a) |
| 08/15/2025 | 5.750% | | 1,566,000 | 1,642,120 |
| NCR Corp. |
| 12/15/2023 | 6.375% | | 777,000 | 785,656 |
| PTC, Inc. |
| 05/15/2024 | 6.000% | | 2,399,000 | 2,518,960 |
| Qualitytech LP/QTS Finance Corp.(a) |
| 11/15/2025 | 4.750% | | 3,450,000 | 3,303,375 |
| Symantec Corp.(a) |
| 04/15/2025 | 5.000% | | 3,050,000 | 3,015,669 |
| Tempo Acquisition LLC/Finance Corp.(a) |
| 06/01/2025 | 6.750% | | 2,140,000 | 2,079,800 |
| VeriSign, Inc. |
| 05/01/2023 | 4.625% | | 1,734,000 | 1,759,150 |
| 04/01/2025 | 5.250% | | 2,495,000 | 2,539,803 |
| Verscend Escrow Corp.(a) |
| 08/15/2026 | 9.750% | | 1,125,000 | 1,152,514 |
| Total | 68,537,386 |
| Transportation Services 0.7% |
| ACI Airport SudAmerica SA(a) |
| 11/29/2032 | 6.875% | | 1,619,250 | 1,715,578 |
| Avis Budget Car Rental LLC/Finance, Inc. |
| 04/01/2023 | 5.500% | | 1,295,000 | 1,294,843 |
| Corporate Bonds & Notes(i) (continued) |
| Issuer | Coupon
Rate | | Principal
Amount ($) | Value ($) |
| Avis Budget Car Rental LLC/Finance, Inc.(a) |
| 03/15/2025 | 5.250% | | 2,671,000 | 2,504,065 |
| Concesionaria Mexiquense SA de CV(a) |
| (linked to Mexican Unidad de Inversion Index) |
| 12/15/2035 | 5.950% | MXN | 36,428,364 | 1,772,182 |
| ERAC U.S.A. Finance LLC(a) |
| 12/01/2026 | 3.300% | | 8,300,000 | 7,854,979 |
| FedEx Corp. |
| 04/01/2046 | 4.550% | | 11,750,000 | 11,529,358 |
| Hertz Corp. (The)(a) |
| 06/01/2022 | 7.625% | | 2,229,000 | 2,217,802 |
| Total | 28,888,807 |
| Wireless 1.4% |
| Altice France SA(a) |
| 05/15/2024 | 6.250% | | 2,566,000 | 2,540,235 |
| 05/01/2026 | 7.375% | | 8,688,000 | 8,537,020 |
| 02/01/2027 | 8.125% | | 1,705,000 | 1,730,439 |
| SBA Communications Corp. |
| 09/01/2024 | 4.875% | | 10,206,000 | 10,069,240 |
| Sprint Capital Corp. |
| 11/15/2028 | 6.875% | | 2,125,000 | 2,115,705 |
| Sprint Communications, Inc.(a) |
| 03/01/2020 | 7.000% | | 6,100,000 | 6,344,573 |
| Sprint Corp. |
| 09/15/2023 | 7.875% | | 1,366,000 | 1,468,570 |
| 06/15/2024 | 7.125% | | 2,168,000 | 2,250,102 |
| 02/15/2025 | 7.625% | | 6,199,000 | 6,580,914 |
| 03/01/2026 | 7.625% | | 2,280,000 | 2,393,341 |
| T-Mobile U.S.A., Inc. |
| 01/15/2026 | 6.500% | | 7,774,000 | 8,233,187 |
| 02/01/2026 | 4.500% | | 1,047,000 | 997,465 |
| 02/01/2028 | 4.750% | | 1,859,000 | 1,751,522 |
| Wind Tre SpA(a) |
| 01/20/2026 | 5.000% | | 4,740,000 | 4,263,564 |
| Total | 59,275,877 |
| Wirelines 1.2% |
| AT&T, Inc. |
| 06/15/2045 | 4.350% | | 18,935,000 | 16,230,268 |
| CenturyLink, Inc. |
| 03/15/2022 | 5.800% | | 4,385,000 | 4,483,035 |
| 04/01/2024 | 7.500% | | 5,796,000 | 6,191,403 |
| Frontier Communications Corp. |
| 01/15/2023 | 7.125% | | 2,965,000 | 2,021,045 |
| 09/15/2025 | 11.000% | | 1,001,000 | 766,872 |
| Liquid Telecommunications Financing PLC(a) |
| 07/13/2022 | 8.500% | | 4,850,000 | 4,990,383 |
The accompanying Notes to Financial Statements are an integral part of this statement.
Columbia Strategic Income Fund | Annual Report 2018
| 19 |
Portfolio of Investments (continued)
August 31, 2018
| Corporate Bonds & Notes(i) (continued) |
| Issuer | Coupon
Rate | | Principal
Amount ($) | Value ($) |
| Telecom Italia Capital SA |
| 09/30/2034 | 6.000% | | 4,273,000 | 4,215,438 |
| Verizon Communications, Inc. |
| 03/15/2055 | 4.672% | | 8,620,000 | 7,938,917 |
| Zayo Group LLC/Capital, Inc.(a) |
| 01/15/2027 | 5.750% | | 4,880,000 | 4,889,765 |
| Total | 51,727,126 |
Total Corporate Bonds & Notes
(Cost $1,835,021,121) | 1,814,559,582 |
|
| Foreign Government Obligations(i),(k) 10.5% |
| | | | |
| Argentina 0.9% |
| Argentine Republic Government International Bond |
| 04/22/2019 | 6.250% | | 5,850,000 | 5,710,653 |
| 04/22/2026 | 7.500% | | 11,643,000 | 9,607,908 |
| 01/26/2027 | 6.875% | | 4,378,000 | 3,415,904 |
| 01/11/2028 | 5.875% | | 6,800,000 | 4,934,644 |
| 07/06/2036 | 7.125% | | 3,000,000 | 2,183,265 |
| 04/22/2046 | 7.625% | | 1,100,000 | 806,190 |
| 01/11/2048 | 6.875% | | 5,100,000 | 3,560,958 |
| Argentine Republic Government International Bond(j) |
| 12/31/2033 | 8.280% | | 1,682,446 | 1,371,802 |
| Provincia de Buenos Aires(a) |
| 06/15/2027 | 7.875% | | 4,900,000 | 3,547,203 |
| Provincia de Cordoba(a) |
| 09/01/2024 | 7.450% | | 1,362,000 | 1,065,098 |
| 08/01/2027 | 7.125% | | 3,500,000 | 2,623,243 |
| Total | 38,826,868 |
| Belarus 0.2% |
| Republic of Belarus International Bond(a) |
| 02/28/2023 | 6.875% | | 2,200,000 | 2,243,974 |
| 06/29/2027 | 7.625% | | 4,100,000 | 4,283,450 |
| 02/28/2030 | 6.200% | | 4,400,000 | 4,147,827 |
| Total | 10,675,251 |
| Brazil 0.4% |
| Brazil Minas SPE via State of Minas Gerais(a) |
| 02/15/2028 | 5.333% | | 800,000 | 760,674 |
| Brazilian Government International Bond |
| 01/07/2041 | 5.625% | | 5,800,000 | 4,995,911 |
| Petrobras Global Finance BV(a) |
| 01/27/2025 | 5.299% | | 8,133,000 | 7,470,299 |
| 01/27/2028 | 5.999% | | 5,963,000 | 5,366,813 |
| Total | 18,593,697 |
| Canada 0.4% |
| City of Toronto |
| 06/07/2027 | 2.400% | CAD | 24,000,000 | 17,483,090 |
| Foreign Government Obligations(i),(k) (continued) |
| Issuer | Coupon
Rate | | Principal
Amount ($) | Value ($) |
| China 0.5% |
| State Grid Overseas Investment 2016 Ltd.(a) |
| 05/04/2027 | 3.500% | | 8,400,000 | 8,059,422 |
| Syngenta Finance NV(a) |
| 04/24/2028 | 5.182% | | 13,650,000 | 13,216,135 |
| Total | 21,275,557 |
| Colombia 0.1% |
| Ecopetrol SA |
| 06/26/2026 | 5.375% | | 3,000,000 | 3,096,696 |
| Croatia 0.2% |
| Croatia Government International Bond(a) |
| 01/26/2024 | 6.000% | | 6,500,000 | 7,045,213 |
| Dominican Republic 1.0% |
| Dominican Republic Bond(a) |
| 02/05/2027 | 11.250% | DOP | 400,000,000 | 8,378,695 |
| Dominican Republic International Bond(a) |
| 02/22/2019 | 12.000% | DOP | 31,000,000 | 634,052 |
| 01/08/2021 | 14.000% | DOP | 44,440,000 | 969,193 |
| 03/04/2022 | 10.375% | DOP | 397,000,000 | 8,127,109 |
| 02/10/2023 | 14.500% | DOP | 25,000,000 | 574,719 |
| 02/15/2023 | 8.900% | DOP | 42,000,000 | 843,815 |
| 01/27/2025 | 5.500% | | 3,508,000 | 3,527,943 |
| 01/25/2027 | 5.950% | | 3,875,000 | 3,948,199 |
| 04/20/2027 | 8.625% | | 2,900,000 | 3,310,196 |
| 07/19/2028 | 6.000% | | 3,500,000 | 3,559,906 |
| 04/30/2044 | 7.450% | | 3,900,000 | 4,186,116 |
| 01/27/2045 | 6.850% | | 4,881,000 | 4,928,438 |
| Total | 42,988,381 |
| Ecuador 0.2% |
| Ecuador Government International Bond(a) |
| 12/13/2026 | 9.650% | | 7,900,000 | 7,617,757 |
| Petroamazonas EP(a) |
| 11/06/2020 | 4.625% | | 1,200,000 | 1,104,000 |
| Total | 8,721,757 |
| Egypt 0.3% |
| Egypt Government International Bond(a) |
| 04/16/2026 | 4.750% | EUR | 2,100,000 | 2,280,909 |
| 01/31/2027 | 7.500% | | 3,900,000 | 3,904,559 |
| 02/21/2028 | 6.588% | | 2,850,000 | 2,675,452 |
| 01/31/2047 | 8.500% | | 1,700,000 | 1,662,420 |
| 02/21/2048 | 7.903% | | 2,800,000 | 2,592,072 |
| Total | 13,115,412 |
The accompanying Notes to Financial Statements are an integral part of this statement.
| 20 | Columbia Strategic Income Fund | Annual Report 2018 |
Portfolio of Investments (continued)
August 31, 2018
| Foreign Government Obligations(i),(k) (continued) |
| Issuer | Coupon
Rate | | Principal
Amount ($) | Value ($) |
| El Salvador 0.2% |
| El Salvador Government International Bond(a) |
| 01/18/2027 | 6.375% | | 7,350,000 | 6,962,986 |
| 02/28/2029 | 8.625% | | 1,500,000 | 1,611,691 |
| 06/15/2035 | 7.650% | | 490,000 | 478,713 |
| Total | 9,053,390 |
| Honduras 0.4% |
| Honduras Government International Bond(a) |
| 03/15/2024 | 7.500% | | 3,468,000 | 3,741,112 |
| 01/19/2027 | 6.250% | | 12,600,000 | 12,919,700 |
| Total | 16,660,812 |
| Indonesia 0.3% |
| Indonesia Government International Bond(a) |
| 04/25/2022 | 3.750% | | 1,200,000 | 1,195,628 |
| 01/17/2038 | 7.750% | | 1,850,000 | 2,447,693 |
| Perusahaan Listrik Negara PT(a) |
| 05/21/2028 | 5.450% | | 4,900,000 | 5,067,100 |
| 05/21/2048 | 6.150% | | 1,900,000 | 2,011,220 |
| PT Pertamina Persero(a) |
| 05/30/2044 | 6.450% | | 2,600,000 | 2,839,457 |
| Total | 13,561,098 |
| Ivory Coast 0.5% |
| Ivory Coast Government International Bond(a) |
| 07/23/2024 | 5.375% | | 700,000 | 658,061 |
| 03/03/2028 | 6.375% | | 9,200,000 | 8,533,322 |
| 03/22/2030 | 5.250% | EUR | 3,300,000 | 3,529,028 |
| 06/15/2033 | 6.125% | | 3,847,000 | 3,330,163 |
| 03/22/2048 | 6.625% | EUR | 3,900,000 | 4,103,435 |
| Ivory Coast Government International Bond(a),(j) |
| 12/31/2032 | 5.750% | | 863,950 | 777,762 |
| Total | 20,931,771 |
| Jamaica 0.1% |
| Jamaica Government International Bond |
| 04/28/2028 | 6.750% | | 1,950,000 | 2,120,432 |
| 03/15/2039 | 8.000% | | 700,000 | 809,272 |
| Total | 2,929,704 |
| Kazakhstan 0.4% |
| Kazakhstan Government International Bond(a) |
| 07/21/2045 | 6.500% | | 3,500,000 | 4,325,965 |
| KazMunayGas National Co. JSC(a) |
| 04/24/2025 | 4.750% | | 2,200,000 | 2,221,501 |
| 04/24/2030 | 5.375% | | 10,600,000 | 10,699,131 |
| Total | 17,246,597 |
| Foreign Government Obligations(i),(k) (continued) |
| Issuer | Coupon
Rate | | Principal
Amount ($) | Value ($) |
| Kenya 0.0% |
| Kenya Government International Bond(a) |
| 02/28/2048 | 8.250% | | 1,275,000 | 1,189,996 |
| Mexico 1.5% |
| Mexican Bonos |
| 06/11/2020 | 8.000% | MXN | 44,530,000 | 2,336,068 |
| 06/10/2021 | 6.500% | MXN | 50,000 | 2,528 |
| Mexico City Airport Trust(a) |
| 07/31/2047 | 5.500% | | 2,000,000 | 1,777,434 |
| 07/31/2047 | 5.500% | | 1,500,000 | 1,333,076 |
| Mexico Government International Bond |
| 05/29/2031 | 7.750% | MXN | 140,000,000 | 7,204,377 |
| 01/23/2046 | 4.600% | | 1,800,000 | 1,673,883 |
| Pemex Finance Ltd. |
| 11/15/2018 | 9.150% | | 155,312 | 157,349 |
| Petroleos Mexicanos(a) |
| 11/24/2021 | 7.650% | MXN | 18,600,000 | 918,160 |
| 09/12/2024 | 7.190% | MXN | 3,800,000 | 171,701 |
| Petroleos Mexicanos |
| 01/30/2023 | 3.500% | | 750,000 | 707,912 |
| 09/21/2023 | 4.625% | | 948,000 | 931,691 |
| 01/23/2026 | 4.500% | | 900,000 | 833,270 |
| 08/04/2026 | 6.875% | | 3,000,000 | 3,111,678 |
| 11/12/2026 | 7.470% | MXN | 23,700,000 | 1,048,555 |
| 03/13/2027 | 6.500% | | 34,302,000 | 34,668,894 |
| 06/15/2035 | 6.625% | | 870,000 | 840,847 |
| 06/02/2041 | 6.500% | | 2,500,000 | 2,289,440 |
| 01/23/2045 | 6.375% | | 4,000,000 | 3,575,296 |
| 09/21/2047 | 6.750% | | 2,000,000 | 1,847,774 |
| Total | 65,429,933 |
| Morocco 0.1% |
| OCP SA(a) |
| 04/25/2024 | 5.625% | | 5,000,000 | 5,156,225 |
| Nigeria 0.2% |
| Nigeria Government International Bond(a) |
| 11/28/2027 | 6.500% | | 1,263,000 | 1,174,876 |
| 02/16/2032 | 7.875% | | 9,800,000 | 9,569,857 |
| Total | 10,744,733 |
| Oman 0.3% |
| Oman Government International Bond(a) |
| 01/17/2028 | 5.625% | | 11,900,000 | 11,447,812 |
| Pakistan 0.1% |
| Pakistan Government International Bond(a) |
| 03/31/2036 | 7.875% | | 5,700,000 | 5,176,045 |
The accompanying Notes to Financial Statements are an integral part of this statement.
Columbia Strategic Income Fund | Annual Report 2018
| 21 |
Portfolio of Investments (continued)
August 31, 2018
| Foreign Government Obligations(i),(k) (continued) |
| Issuer | Coupon
Rate | | Principal
Amount ($) | Value ($) |
| Paraguay 0.2% |
| Paraguay Government International Bond(a) |
| 03/27/2027 | 4.700% | | 2,000,000 | 2,007,580 |
| 08/11/2044 | 6.100% | | 2,439,000 | 2,644,486 |
| 03/13/2048 | 5.600% | | 2,000,000 | 2,047,996 |
| Total | 6,700,062 |
| Peru 0.0% |
| Peruvian Government International Bond |
| 11/21/2033 | 8.750% | | 1,508,000 | 2,237,495 |
| Russian Federation 0.3% |
| Gazprom Neft OAO Via GPN Capital SA(a) |
| 09/19/2022 | 4.375% | | 7,800,000 | 7,576,428 |
| Gazprom OAO Via Gaz Capital SA(a) |
| 02/06/2028 | 4.950% | | 2,000,000 | 1,897,210 |
| 08/16/2037 | 7.288% | | 300,000 | 331,973 |
| Russian Foreign Bond - Eurobond(a) |
| 04/04/2042 | 5.625% | | 4,000,000 | 4,139,360 |
| Total | 13,944,971 |
| Senegal 0.2% |
| Senegal Government International Bond(a) |
| 07/30/2024 | 6.250% | | 1,405,000 | 1,405,354 |
| 05/23/2033 | 6.250% | | 6,800,000 | 6,111,466 |
| Total | 7,516,820 |
| South Africa 0.7% |
| Republic of South Africa Government Bond |
| 01/31/2037 | 8.500% | ZAR | 384,000,000 | 23,376,310 |
| Republic of South Africa Government International Bond |
| 06/22/2030 | 5.875% | | 1,800,000 | 1,762,515 |
| Transnet SOC Ltd.(a) |
| 07/26/2022 | 4.000% | | 5,300,000 | 4,983,336 |
| Total | 30,122,161 |
| Sri Lanka 0.1% |
| Sri Lanka Government International Bond(a) |
| 04/18/2023 | 5.750% | | 1,500,000 | 1,458,928 |
| 07/18/2026 | 6.825% | | 1,685,000 | 1,659,368 |
| 05/11/2027 | 6.200% | | 1,450,000 | 1,361,692 |
| Total | 4,479,988 |
| Trinidad and Tobago 0.1% |
| Petroleum Co. of Trinidad & Tobago Ltd.(a) |
| 08/14/2019 | 9.750% | | 4,000,000 | 3,801,192 |
| Turkey 0.3% |
| Turkey Government International Bond |
| 03/25/2027 | 6.000% | | 14,984,000 | 12,355,911 |
| Foreign Government Obligations(i),(k) (continued) |
| Issuer | Coupon
Rate | | Principal
Amount ($) | Value ($) |
| Ukraine 0.3% |
| Ukraine Government International Bond(a) |
| 09/01/2024 | 7.750% | | 1,200,000 | 1,152,161 |
| 09/25/2032 | 7.375% | | 11,900,000 | 10,071,755 |
| Ukraine Railways Via Shortline PLC(a) |
| 09/15/2021 | 9.875% | | 3,000,000 | 3,010,923 |
| Total | 14,234,839 |
Total Foreign Government Obligations
(Cost $489,827,122) | 456,743,477 |
|
| Inflation-Indexed Bonds(i) 0.2% |
| | | | |
| Brazil 0.0% |
| Brazil Notas do Tesouro Nacional |
| 08/15/2030 | 6.000% | BRL | 3,134,550 | 790,125 |
| Mexico 0.2% |
| Mexican Udibonos |
| 11/15/2040 | 4.000% | MXN | 109,285,092 | 5,933,236 |
Total Inflation-Indexed Bonds
(Cost $8,642,198) | 6,723,361 |
|
| Residential Mortgage-Backed Securities - Agency 10.0% |
| | | | |
| Federal Home Loan Mortgage Corp. |
| 01/01/2020 | 10.500% | | 208 | 208 |
| Federal Home Loan Mortgage Corp.(l) |
| CMO Series 304 Class C69 |
| 12/15/2042 | 4.000% | | 9,628,794 | 2,021,193 |
| CMO Series 4098 Class AI |
| 05/15/2039 | 3.500% | | 7,664,263 | 764,290 |
| CMO Series 4120 Class AI |
| 11/15/2039 | 3.500% | | 6,996,517 | 764,934 |
| CMO Series 4121 Class IA |
| 01/15/2041 | 3.500% | | 7,307,025 | 911,316 |
| CMO Series 4147 Class CI |
| 01/15/2041 | 3.500% | | 16,265,357 | 2,329,604 |
| CMO Series 4213 Class DI |
| 06/15/2038 | 3.500% | | 11,838,975 | 1,086,721 |
| Federal Home Loan Mortgage Corp.(b),(l) |
| CMO Series 318 Class S1 |
1-month USD LIBOR + 5.950%
11/15/2043 | 3.887% | | 8,431,647 | 1,491,892 |
| CMO Series 326 Class S2 |
1-month USD LIBOR + 5.950%
03/15/2044 | 3.887% | | 27,227,970 | 4,023,923 |
| CMO Series 4174 Class SB |
1-month USD LIBOR + 6.200%
05/15/2039 | 4.137% | | 9,577,858 | 958,063 |
The accompanying Notes to Financial Statements are an integral part of this statement.
| 22 | Columbia Strategic Income Fund | Annual Report 2018 |
Portfolio of Investments (continued)
August 31, 2018
| Residential Mortgage-Backed Securities - Agency (continued) |
| Issuer | Coupon
Rate | | Principal
Amount ($) | Value ($) |
| CMO STRIPS Series 326 Class S1 |
1-month USD LIBOR + 6.000%
03/15/2044 | 3.937% | | 2,959,562 | 447,063 |
| Federal Home Loan Mortgage Corp.(g),(l) |
| CMO Series 4515 Class SA |
| 08/15/2038 | 1.282% | | 15,874,138 | 708,049 |
| CMO Series 4620 Class AS |
| 11/15/2042 | 1.241% | | 32,608,992 | 1,389,052 |
| Federal National Mortgage Association(m) |
| 09/18/2033 | 3.000% | | 19,000,000 | 18,889,044 |
| 09/13/2048 | 3.500% | | 133,000,000 | 132,270,056 |
| 09/13/2048 | 5.000% | | 120,000,000 | 126,892,092 |
| Federal National Mortgage Association |
| 05/01/2041 | 4.000% | | 3,394,664 | 3,454,043 |
| Federal National Mortgage Association(g),(l) |
| CMO Series 2006-5 Class N1 |
| 08/25/2034 | 0.000% | | 9,590,982 | 1 |
| Federal National Mortgage Association(l) |
| CMO Series 2012-118 Class BI |
| 12/25/2039 | 3.500% | | 11,011,315 | 1,574,654 |
| CMO Series 2012-121 Class GI |
| 08/25/2039 | 3.500% | | 7,678,261 | 999,839 |
| CMO Series 2012-129 Class IC |
| 01/25/2041 | 3.500% | | 7,868,833 | 1,250,028 |
| CMO Series 2012-131 Class MI |
| 01/25/2040 | 3.500% | | 11,377,517 | 1,691,566 |
| CMO Series 2012-133 Class EI |
| 07/25/2031 | 3.500% | | 4,211,351 | 466,622 |
| CMO Series 2012-139 Class IL |
| 04/25/2040 | 3.500% | | 5,842,473 | 816,039 |
| CMO Series 2012-96 Class CI |
| 04/25/2039 | 3.500% | | 7,329,522 | 713,355 |
| CMO Series 2013-1 Class AI |
| 02/25/2043 | 3.500% | | 5,037,800 | 1,057,596 |
| CMO Series 2013-6 Class MI |
| 02/25/2040 | 3.500% | | 7,573,878 | 1,049,177 |
| Federal National Mortgage Association(b),(l) |
| CMO Series 2013-101 Class CS |
1-month USD LIBOR + 5.900%
10/25/2043 | 3.835% | | 17,520,201 | 3,015,624 |
| CMO Series 2014-93 Class ES |
1-month USD LIBOR + 6.150%
01/25/2045 | 4.085% | | 28,421,791 | 4,608,701 |
| CMO Series 2016-31 Class H5 |
1-month USD LIBOR + 6.000%
06/25/2046 | 3.935% | | 24,968,178 | 4,130,136 |
| Residential Mortgage-Backed Securities - Agency (continued) |
| Issuer | Coupon
Rate | | Principal
Amount ($) | Value ($) |
| CMO Series 2016-31 Class VS |
1-month USD LIBOR + 6.000%
06/25/2046 | 3.935% | | 21,070,424 | 3,684,320 |
| CMO Series 2016-42 Class SB |
1-month USD LIBOR + 6.000%
07/25/2046 | 3.935% | | 57,648,174 | 10,174,165 |
| CMO Series 2017-47 Class SE |
1-month USD LIBOR + 6.100%
06/25/2047 | 4.035% | | 19,182,856 | 3,412,237 |
| Government National Mortgage Association(m) |
| 09/20/2048 | 3.000% | | 32,000,000 | 31,302,499 |
| 09/20/2048 | 4.500% | | 30,000,000 | 31,180,875 |
| Government National Mortgage Association(l) |
| CMO Series 2014-190 Class AI |
| 12/20/2038 | 3.500% | | 17,864,580 | 2,170,012 |
| Government National Mortgage Association(b),(l) |
| CMO Series 2015-144 Class SA |
1-month USD LIBOR + 6.200%
10/20/2045 | 4.123% | | 11,594,590 | 2,205,943 |
| CMO Series 2016-108 Class SN |
1-month USD LIBOR + 6.080%
08/20/2046 | 4.003% | | 16,982,100 | 3,265,464 |
| CMO Series 2016-146 Class NS |
1-month USD LIBOR + 6.100%
10/20/2046 | 4.023% | | 8,597,579 | 1,594,547 |
| CMO Series 2016-20 Class SQ |
1-month USD LIBOR + 6.100%
02/20/2046 | 4.023% | | 28,381,816 | 4,290,519 |
| CMO Series 2016-91 Class NS |
1-month USD LIBOR + 6.080%
07/20/2046 | 4.003% | | 37,115,566 | 7,234,202 |
| CMO Series 2017-129 Class SA |
1-month USD LIBOR + 6.200%
08/20/2047 | 4.123% | | 25,594,960 | 4,350,918 |
| CMO Series 2017-130 Class SG |
1-month USD LIBOR + 6.200%
08/20/2047 | 4.123% | | 20,645,175 | 3,108,916 |
| CMO Series 2017-133 Class SM |
1-month USD LIBOR + 6.250%
09/20/2047 | 4.173% | | 30,770,128 | 4,609,159 |
| CMO Series 2018-67 Class SP |
1-month USD LIBOR + 6.200%
05/20/2048 | 4.123% | | 23,405,041 | 4,233,628 |
Total Residential Mortgage-Backed Securities - Agency
(Cost $453,922,767) | 436,592,285 |
|
| Residential Mortgage-Backed Securities - Non-Agency 16.1% |
| | | | |
| Ajax Mortgage Loan Trust(a) |
| CMO Series 2016-C Class A |
| 10/25/2057 | 4.000% | | 8,797,178 | 8,810,975 |
The accompanying Notes to Financial Statements are an integral part of this statement.
Columbia Strategic Income Fund | Annual Report 2018
| 23 |
Portfolio of Investments (continued)
August 31, 2018
| Residential Mortgage-Backed Securities - Non-Agency (continued) |
| Issuer | Coupon
Rate | | Principal
Amount ($) | Value ($) |
| Angel Oak Mortgage Trust I LLC(a) |
| CMO Series 2016-1 Class A1 |
| 07/25/2046 | 3.500% | | 4,898,303 | 4,866,105 |
| CMO Series 2016-1 Class A2 |
| 07/25/2046 | 5.000% | | 1,055,989 | 1,045,259 |
| Angel Oak Mortgage Trust I LLC(a),(g) |
| CMO Series 2018-2 Class A3 |
| 07/27/2048 | 3.878% | | 1,839,973 | 1,839,685 |
| Angel Oak Mortgage Trust LLC(a),(g) |
| CMO Series 2017-3 Class M1 |
| 11/25/2047 | 3.900% | | 7,444,000 | 7,417,842 |
| Arroyo Mortgage Trust(a) |
| CMO Series 2018-1 Class A3 |
| 04/25/2048 | 4.218% | | 20,477,944 | 20,485,115 |
| Banc of America Funding Trust(a),(c),(g) |
| CMO Series 2016-R1 Class M2 |
| 03/25/2040 | 3.500% | | 12,763,517 | 12,307,859 |
| Bayview Opportunity Master Fund IIIa Trust(a) |
| CMO Series 2017-RN7 Class A1 |
| 09/28/2032 | 3.105% | | 776,230 | 776,291 |
| Bayview Opportunity Master Fund IV Trust(a) |
| CMO Series 2018-RN2 Class A1 |
| 02/25/2033 | 3.598% | | 10,954,538 | 10,962,011 |
| Bayview Opportunity Master Fund IVa Trust(a) |
| CMO Series 2018-RN1 Class A1 |
| 01/28/2033 | 3.278% | | 2,178,098 | 2,175,268 |
| CMO Series 2018-RN3 Class A1 |
| 03/28/2033 | 3.672% | | 2,623,503 | 2,626,255 |
| CMO Series 2018-RN6 Class A1 |
| 07/25/2033 | 4.090% | | 16,298,659 | 16,301,922 |
| Bayview Opportunity Master Fund IVb Trust(a) |
| CMO Series 2017-NPL2 Class A1 |
| 10/28/2032 | 2.981% | | 14,636,997 | 14,635,313 |
| Bayview Opportunity Master Fund Trust IIb(a) |
| CMO Series 2018-RN5 Class A1 |
| 04/28/2033 | 3.820% | | 5,147,148 | 5,136,006 |
| BCAP LLC Trust(a) |
| CMO Series 2013-RR1 Class 10A1 |
| 10/26/2036 | 3.000% | | 99,008 | 98,869 |
| BCAP LLC Trust(a),(g) |
| CMO Series 2013-RR5 Class 4A1 |
| 09/26/2036 | 3.000% | | 1,597,633 | 1,560,106 |
| Bellemeade Re Ltd.(a),(b) |
| CMO Series 2018-2A Class M1C |
1-month USD LIBOR + 1.600%
08/25/2028 | 3.672% | | 10,400,000 | 10,467,329 |
| Residential Mortgage-Backed Securities - Non-Agency (continued) |
| Issuer | Coupon
Rate | | Principal
Amount ($) | Value ($) |
| CHL GMSR Issuer Trust(a),(b) |
| CMO Series 2018-GT1 Class A |
1-month USD LIBOR + 1.000%
05/25/2023 | 4.815% | | 13,500,000 | 13,607,395 |
| CIM Trust(a) |
| CMO Series 2017-6 Class A1 |
| 06/25/2057 | 3.015% | | 31,888,576 | 30,733,049 |
| CMO Series 2017-8 Class A1 |
| 12/25/2065 | 3.000% | | 12,502,661 | 12,321,834 |
| Citigroup Mortgage Loan Trust(a) |
| Subordinated, CMO Series 2014-C Class B1 |
| 02/25/2054 | 4.250% | | 5,250,000 | 5,189,149 |
| Citigroup Mortgage Loan Trust, Inc.(a),(g) |
| CMO Series 2009-4 Class 9A2 |
| 03/25/2036 | 4.239% | | 1,574,680 | 1,491,128 |
| CMO Series 2010-6 Class 2A2 |
| 09/25/2035 | 4.097% | | 1,143,314 | 1,170,540 |
| CMO Series 2013-11 Class 3A3 |
| 09/25/2034 | 4.254% | | 4,126,380 | 4,131,015 |
| CMO Series 2013-2 Class 1A1 |
| 11/25/2037 | 3.984% | | 63,407 | 63,315 |
| COLT LLC(a),(b) |
| CMO Series 15-1 Class A1V |
1-month USD LIBOR + 3.000%
12/26/2045 | 5.065% | | 234,679 | 234,812 |
| COLT LLC(a),(b),(c) |
| CMO Series 15-1 Class A2 |
1-month USD LIBOR + 3.750%
12/26/2045 | 3.945% | | 77,040 | 77,040 |
| COLT Mortgage Loan Trust(a) |
| CMO Series 2016-1 Class A2 |
| 05/25/2046 | 3.500% | | 3,689,243 | 3,685,159 |
| COLT Mortgage Loan Trust(a),(g) |
| CMO Series 2016-2 Class A2 |
| 09/25/2046 | 3.250% | | 2,049,598 | 2,046,925 |
| CMO Series 2017-2 Class M1 |
| 10/25/2047 | 3.510% | | 5,000,000 | 4,851,457 |
| Credit Suisse Mortgage Capital Certificates(a),(g) |
| CMO Series 2008-4R Class 3A4 |
| 01/26/2038 | 3.910% | | 2,103,814 | 2,078,693 |
| CMO Series 2011-5R Class 3A1 |
| 09/27/2047 | 3.584% | | 496,855 | 491,974 |
| Credit Suisse Mortgage Capital Certificates(a) |
| CMO Series 2010-9R Class 10A5 |
| 04/27/2037 | 4.000% | | 631,367 | 629,680 |
| CMO Series 2010-9R Class 1A5 |
| 08/27/2037 | 4.000% | | 6,417,008 | 6,464,571 |
| CMO Series 2014-2R Class 18A1 |
| 01/27/2037 | 3.000% | | 3,056,999 | 3,029,158 |
The accompanying Notes to Financial Statements are an integral part of this statement.
| 24 | Columbia Strategic Income Fund | Annual Report 2018 |
Portfolio of Investments (continued)
August 31, 2018
| Residential Mortgage-Backed Securities - Non-Agency (continued) |
| Issuer | Coupon
Rate | | Principal
Amount ($) | Value ($) |
| CMO Series 2014-2R Class 19A1 |
| 05/27/2036 | 3.000% | | 1,869,173 | 1,853,252 |
| Credit Suisse Mortgage Trust(a) |
| CMO Series 2018-RPL2 Class A1 |
| 08/25/2062 | 4.030% | | 5,325,290 | 5,319,366 |
| CTS Corp.(a),(c) |
| CMO Series 2015-6R Class 3A2 |
| 02/27/2036 | 3.750% | | 6,039,346 | 6,058,225 |
| Deutsche Mortgage Securities, Inc. Mortgage Loan Trust |
| CMO Series 2003-1 Class 1A7 |
| 04/25/2033 | 5.500% | | 629,258 | 617,274 |
| GCAT LLC(a) |
| CMO Series 2017-2 Class A1 |
| 04/25/2047 | 3.500% | | 6,487,997 | 6,491,127 |
| CMO Series 2018-1 Class A1 |
| 06/25/2048 | 3.844% | | 13,054,385 | 13,036,420 |
| CMO Series 2018-2 Class A1 |
| 06/26/2023 | 4.090% | | 23,911,013 | 23,911,009 |
| Grand Avenue Mortgage Loan Trust(a) |
| CMO Series 2017-RPL1 Class A1 |
| 08/25/2064 | 3.250% | | 19,301,244 | 18,968,334 |
| Homeward Opportunities Fund I Trust(a) |
| CMO Series 2018-1 Class M1 |
| 06/25/2048 | 4.548% | | 8,700,000 | 8,700,000 |
| Legacy Mortgage Asset Trust(a) |
| CMO Series 2017-GS1 Class A1 |
| 01/25/2057 | 3.500% | | 19,918,068 | 19,711,472 |
| Mill City Mortgage Trust(a),(g) |
| CMO Series 2015-1 Class M1 |
| 06/25/2056 | 3.739% | | 5,000,000 | 5,078,129 |
| CMO Series 2015-2 Class M2 |
| 09/25/2057 | 3.786% | | 10,000,000 | 10,120,744 |
| New Residential Mortgage LLC(a) |
| CMO Series 2018-FNT1 Class F |
| 05/25/2023 | 5.570% | | 27,539,443 | 27,523,588 |
| CMO Series 2018-FNT2 Class F |
| 07/25/2054 | 5.950% | | 11,541,225 | 11,577,285 |
| Subordinated, CMO Series 2018-FNT1 Class D |
| 05/25/2023 | 4.690% | | 11,474,768 | 11,465,371 |
| NRZ Excess Spread-Collateralized Notes(a) |
| Series 2018-PLS1 Class A |
| 01/25/2023 | 3.193% | | 1,706,904 | 1,701,640 |
| Series 2018-PLS1 Class C |
| 01/25/2023 | 3.981% | | 8,087,574 | 8,022,393 |
| Series 2018-PLS1 Class D |
| 01/25/2023 | 4.374% | | 16,175,149 | 16,047,994 |
| Subordinated, CMO Series 2018-PLS2 Class C |
| 02/25/2023 | 4.102% | | 10,906,805 | 10,856,995 |
| Residential Mortgage-Backed Securities - Non-Agency (continued) |
| Issuer | Coupon
Rate | | Principal
Amount ($) | Value ($) |
| Subordinated, CMO Series 2018-PLS2 Class D |
| 02/25/2023 | 4.593% | | 14,833,254 | 14,765,714 |
| Oak Hill Advisors Residential Loan Trust(a) |
| CMO Series 2017-NPL1 Class A1 |
| 06/25/2057 | 3.000% | | 7,849,532 | 7,838,125 |
| CMO Series 2017-NPL2 Class A1 |
| 07/25/2057 | 3.000% | | 34,657,453 | 34,156,656 |
| Oaktown Re Ltd.(a),(b) |
| CMO Series 2017-1A Class M1 |
1-month USD LIBOR + 2.250%
04/25/2027 | 4.315% | | 8,809,996 | 8,849,714 |
| PNMAC GMSR Issuer Trust(a),(b) |
| CMO Series 2018-GT1 Class A |
1-month USD LIBOR + 2.850%
02/25/2023 | 4.915% | | 35,000,000 | 35,292,575 |
| CMO Series 2018-GT2 Class A |
1-month USD LIBOR + 2.650%
08/25/2025 | 4.713% | | 25,000,000 | 25,111,865 |
| Preston Ridge Partners Mortgage LLC(a) |
| CMO Series 2017-2A Class A1 |
| 09/25/2022 | 3.470% | | 21,464,451 | 21,464,373 |
| Preston Ridge Partners Mortgage LLC(a),(g) |
| CMO Series 2017-3A Class A1 |
| 11/25/2022 | 3.470% | | 21,361,079 | 21,258,347 |
| Pretium Mortgage Credit Partners I(a) |
| CMO Series 2017-NPL2 Class A1 |
| 03/28/2057 | 3.250% | | 20,507,784 | 20,419,036 |
| Pretium Mortgage Credit Partners I LLC(a) |
| CMO Series 2017-NPL4 Class A1 |
| 08/27/2032 | 3.250% | | 18,263,786 | 18,108,217 |
| CMO Series 2018-NPL1 Class A1 |
| 01/27/2033 | 3.375% | | 21,620,275 | 21,425,678 |
| RBSSP Resecuritization Trust(a),(g) |
| CMO Series 2010-1 Class 3A2 |
| 08/26/2035 | 3.545% | | 8,132,599 | 8,290,201 |
| RCO Mortgage LLC(a),(g) |
| CMO Series 2017-1 Class A1 |
| 08/25/2022 | 3.375% | | 9,460,226 | 9,406,231 |
| RCO V Mortgage LLC(a) |
| CMO Series 2018-1 Class A1 |
| 05/25/2023 | 4.000% | | 11,116,733 | 11,124,969 |
| SGR Residential Mortgage Trust(a) |
| CMO Series 2016-1 Class A1 |
| 11/25/2046 | 3.750% | | 2,518,279 | 2,512,269 |
| Vericrest Opportunity Loan Transferee LXII LLC(a) |
| CMO Series 2017-NPL9 Class A1 |
| 09/25/2047 | 3.125% | | 7,121,903 | 7,046,213 |
The accompanying Notes to Financial Statements are an integral part of this statement.
Columbia Strategic Income Fund | Annual Report 2018
| 25 |
Portfolio of Investments (continued)
August 31, 2018
| Residential Mortgage-Backed Securities - Non-Agency (continued) |
| Issuer | Coupon
Rate | | Principal
Amount ($) | Value ($) |
| Verus Securitization Trust(a) |
| CMO Series 2018-1 Class A3 |
| 02/25/2048 | 3.205% | | 12,511,182 | 12,507,459 |
Total Residential Mortgage-Backed Securities - Non-Agency
(Cost $701,127,182) | 700,447,364 |
|
| Senior Loans 5.2% |
| Borrower | Coupon
Rate | | Principal
Amount ($) | Value ($) |
| Aerospace & Defense 0.1% |
| Doncasters US Finance LLC(b),(n) |
| Tranche B Term Loan |
3-month USD LIBOR + 3.500%
04/09/2020 | 5.834% | | 955,117 | 879,310 |
| Engility Corp.(b),(n) |
| Tranche B2 Term Loan |
3-month USD LIBOR + 2.750%
08/14/2023 | 4.826% | | 927,890 | 930,015 |
| Transdigm, Inc.(b),(n) |
| Tranche E Term Loan |
3-month USD LIBOR + 2.500%
05/30/2025 | 4.576% | | 600,984 | 599,385 |
| Tranche F Term Loan |
3-month USD LIBOR + 2.500%
06/09/2023 | 4.576% | | 977,547 | 975,259 |
| Wesco Aircraft Hardware Corp.(b),(c),(n) |
| Tranche B Term Loan |
3-month USD LIBOR + 2.500%
02/28/2021 | 4.580% | | 1,000,000 | 992,500 |
| Total | 4,376,469 |
| Airlines 0.0% |
| American Airlines, Inc.(b),(n) |
| Term Loan |
3-month USD LIBOR + 2.000%
10/10/2021 | 4.063% | | 979,798 | 979,190 |
| United AirLines, Inc.(b),(n) |
| Term Loan |
3-month USD LIBOR + 1.750%
04/01/2024 | 3.826% | | 1,000,000 | 997,920 |
| Total | 1,977,110 |
| Automotive 0.1% |
| Dayco Products LLC/Mark IV Industries, Inc.(b),(n) |
| Term Loan |
3-month USD LIBOR + 4.250%
05/19/2023 | 6.563% | | 759,092 | 758,621 |
| Senior Loans (continued) |
| Borrower | Coupon
Rate | | Principal
Amount ($) | Value ($) |
| DexKo Global Inc.(b),(n) |
| Tranche B 1st Lien Term Loan |
3-month USD LIBOR + 3.500%
07/24/2024 | 5.576% | | 995,006 | 996,250 |
| Horizon Global Corp.(b),(c),(n) |
| Term Loan |
3-month USD LIBOR + 6.000%
06/30/2021 | 8.076% | | 160,969 | 156,140 |
| Navistar, Inc.(b),(n) |
| Tranche B Term Loan |
3-month USD LIBOR + 3.500%
11/06/2024 | 5.580% | | 694,000 | 695,444 |
| Total | 2,606,455 |
| Brokerage/Asset Managers/Exchanges 0.1% |
| AlixPartners LLP(b),(n) |
| Term Loan |
3-month USD LIBOR + 2.750%
04/04/2024 | 4.826% | | 698,232 | 700,125 |
| Aretec Group, Inc.(b),(n) |
| 2nd Lien Term Loan PIK |
3-month USD LIBOR + 4.500%
05/23/2021 | 0.000% | | 291,811 | 292,540 |
| Tranche B1 Term Loan |
3-month USD LIBOR + 4.250%
11/23/2020 | 6.326% | | 593,727 | 594,469 |
| Greenhill & Co., Inc.(b),(n) |
| Term Loan |
3-month USD LIBOR + 3.750%
10/12/2022 | 5.840% | | 1,413,750 | 1,424,353 |
| Total | 3,011,487 |
| Building Materials 0.1% |
| Covia Holdings Corp.(b),(n) |
| Term Loan |
3-month USD LIBOR + 3.750%
06/01/2025 | 6.050% | | 500,000 | 493,540 |
| Pisces Midco, Inc./PlyGem Industries, Inc.(b),(n) |
| Term Loan |
3-month USD LIBOR + 3.750%
04/12/2025 | 6.087% | | 600,000 | 601,752 |
| QUIKRETE Holdings, Inc.(b),(n) |
| 1st Lien Term Loan |
3-month USD LIBOR + 2.750%
11/15/2023 | 4.826% | | 755,651 | 754,707 |
| SRS Distribution, Inc.(b),(n) |
| Term Loan |
3-month USD LIBOR + 3.250%
05/23/2025 | 5.441% | | 1,000,000 | 976,430 |
The accompanying Notes to Financial Statements are an integral part of this statement.
| 26 | Columbia Strategic Income Fund | Annual Report 2018 |
Portfolio of Investments (continued)
August 31, 2018
| Senior Loans (continued) |
| Borrower | Coupon
Rate | | Principal
Amount ($) | Value ($) |
| US Silica Co.(b),(n) |
| Term Loan |
3-month USD LIBOR + 4.000%
05/01/2025 | 6.125% | | 947,625 | 945,521 |
| Total | 3,771,950 |
| Cable and Satellite 0.1% |
| Charter Communications Operating, LLC/Safari LLC(b),(n) |
| Tranche B Term Loan |
3-month USD LIBOR + 2.000%
04/30/2025 | 4.080% | | 694,000 | 694,000 |
| Cogeco Communications (U.S.A.) II LP(b),(n) |
| Tranche B Term Loan |
3-month USD LIBOR + 2.375%
01/03/2025 | 4.451% | | 673,313 | 671,724 |
| CSC Holdings LLC(b),(n) |
| Term Loan |
3-month USD LIBOR + 2.500%
01/25/2026 | 4.564% | | 523,688 | 523,818 |
| Encompass Digital Media, Inc.(b),(n) |
| Tranche B 1st Lien Term Loan |
3-month USD LIBOR + 4.500%
06/06/2021 | 6.840% | | 1,176,928 | 1,156,332 |
| Telesat Canada(b),(n) |
| Tranche B4 Term Loan |
3-month USD LIBOR + 2.500%
11/17/2023 | 4.840% | | 964,455 | 965,063 |
| Virgin Media Bristol LLC(b),(n) |
| Tranche K Term Loan |
3-month USD LIBOR + 2.500%
01/15/2026 | 4.563% | | 1,175,000 | 1,174,201 |
| Total | 5,185,138 |
| Chemicals 0.4% |
| Alpha 3 BV/Atotech U.S.A., Inc.(b),(n) |
| Tranche B1 Term Loan |
3-month USD LIBOR + 3.000%
01/31/2024 | 5.334% | | 647,103 | 648,721 |
| Aruba Investments, Inc./ANGUS Chemical Co.(b),(n) |
| Tranche B1 Term Loan |
3-month USD LIBOR + 3.250%
02/02/2022 | 5.326% | | 982,279 | 983,506 |
| Axalta Coating Systems Dutch Holding BBV/U.S. Holdings, Inc.(b),(n) |
| Tranche B3 Term Loan |
3-month USD LIBOR + 1.750%
06/01/2024 | 4.084% | | 681,972 | 682,143 |
| Chemours Co. (The)(b),(n) |
| Tranche B2 Term Loan |
3-month USD LIBOR + 1.750%
04/03/2025 | 3.830% | | 761,364 | 759,141 |
| Senior Loans (continued) |
| Borrower | Coupon
Rate | | Principal
Amount ($) | Value ($) |
| ColourOz Investment 1 GmbH(b),(n) |
| Tranche C 1st Lien Term Loan |
3-month USD LIBOR + 3.000%
09/07/2021 | 5.341% | | 164,171 | 154,814 |
| ColourOz Investment 2 LLC(b),(n) |
| Tranche B2 1st Lien Term Loan |
3-month USD LIBOR + 3.000%
09/07/2021 | 5.341% | | 993,102 | 936,495 |
| HII Holding Corp/Houghton International(b),(c),(n) |
| 2nd Lien Term Loan |
3-month USD LIBOR + 8.250%
12/21/2020 | 10.576% | | 1,350,000 | 1,355,062 |
| Ineos US Finance LLC(b),(n) |
| Term Loan |
3-month USD LIBOR + 2.000%
04/01/2024 | 4.169% | | 768,625 | 767,341 |
| Invictus U.S. Newco LLC/SK Invictus Intermediate II SARL(b),(n) |
| 2nd Lien Term Loan |
3-month USD LIBOR + 6.750%
03/30/2026 | 8.826% | | 425,000 | 424,469 |
| Kraton Polymers LLC(b),(n) |
| Term Loan |
3-month USD LIBOR + 2.500%
03/08/2025 | 4.576% | | 594,953 | 596,934 |
| MacDermid, Inc./Platform Specialty Products Corp.(b),(n) |
| Tranche B6 Term Loan |
3-month USD LIBOR + 3.000%
06/07/2023 | 5.076% | | 853,986 | 856,275 |
| Nexeo Solutions, LLC(b),(n) |
| Tranche B1 Term Loan |
3-month USD LIBOR + 3.250%
06/09/2023 | 5.580% | | 896,658 | 900,863 |
| OCI Partners LP(b),(n) |
| Term Loan |
3-month USD LIBOR + 4.000%
03/13/2025 | 6.334% | | 997,500 | 1,010,817 |
| Polar US Borrower LLC(b),(n),(o) |
| Term Loan |
3-month USD LIBOR + 4.750%
10/01/2025 | 7.089% | | 700,000 | 686,000 |
| PolyOne Corp.(b),(n) |
| Tranche B4 Term Loan |
3-month USD LIBOR + 1.750%
11/11/2022 | 3.817% | | 631,142 | 630,877 |
| PQ Corp.(b),(n) |
| Tranche B1 Term Loan |
3-month USD LIBOR + 2.500%
02/08/2025 | 4.576% | | 701,139 | 701,517 |
The accompanying Notes to Financial Statements are an integral part of this statement.
Columbia Strategic Income Fund | Annual Report 2018
| 27 |
Portfolio of Investments (continued)
August 31, 2018
| Senior Loans (continued) |
| Borrower | Coupon
Rate | | Principal
Amount ($) | Value ($) |
| Ravago Holdings America, Inc.(b),(c),(n) |
| Term Loan |
3-month USD LIBOR + 2.750%
07/13/2023 | 4.830% | | 290,956 | 291,683 |
| Solenis Holdings LLC(b),(n) |
| 1st Lien Term Loan |
3-month USD LIBOR + 4.000%
12/26/2023 | 6.311% | | 725,000 | 728,161 |
| Trinseo Materials Operating SCA(b),(n) |
| Term Loan |
3-month USD LIBOR + 2.000%
09/06/2024 | 4.076% | | 542,125 | 541,854 |
| Tronox Finance LLC(b),(n) |
| 1st Lien Term Loan |
3-month USD LIBOR + 3.000%
09/23/2024 | 5.076% | | 468,576 | 470,000 |
3-month USD LIBOR + 3.000%
09/23/2024 | 5.076% | | 203,049 | 203,667 |
| Univar U.S.A., Inc.(b),(n) |
| Tranche B3 Term Loan |
3-month USD LIBOR + 2.250%
07/01/2024 | 4.326% | | 607,872 | 609,106 |
| Vantage Specialties, Inc.(b),(n) |
| 2nd Lien Term Loan |
3-month USD LIBOR + 8.250%
10/27/2025 | 10.592% | | 600,000 | 601,500 |
| Total | 15,540,946 |
| Construction Machinery 0.1% |
| Clarke Equipment Co./Doosan Bobcat Inc.(b),(n) |
| Term Loan |
3-month USD LIBOR + 2.000%
05/18/2024 | 4.334% | | 781,823 | 780,971 |
| Douglas Dynamics LLC(b),(n) |
| Term Loan |
3-month USD LIBOR + 3.000%
12/31/2021 | 5.080% | | 265,637 | 265,305 |
| DXP Enterprises, Inc.(b),(n) |
| Term Loan |
3-month USD LIBOR + 4.750%
08/29/2023 | 6.826% | | 794,000 | 797,970 |
| North American Lifting Holdings, Inc./TNT Crane & Rigging, Inc.(b),(n) |
| 1st Lien Term Loan |
3-month USD LIBOR + 4.500%
11/27/2020 | 6.834% | | 918,058 | 887,459 |
| Vertiv Group Corp.(b),(n) |
| Tranche B Term Loan |
3-month USD LIBOR + 4.000%
11/30/2023 | 6.313% | | 927,155 | 925,996 |
| Total | 3,657,701 |
| Senior Loans (continued) |
| Borrower | Coupon
Rate | | Principal
Amount ($) | Value ($) |
| Consumer Cyclical Services 0.1% |
| Cushman & Wakefield(b),(n),(o) |
| Term Loan |
3-month USD LIBOR + 3.250%
06/27/2019 | 0.000% | | 625,000 | 622,656 |
| Staples, Inc.(b),(n) |
| Term Loan |
3-month USD LIBOR + 4.000%
09/12/2024 | 6.343% | | 765,438 | 762,843 |
| Uber Technologies, Inc.(b),(n) |
| Term Loan |
3-month USD LIBOR + 3.500%
07/13/2023 | 5.567% | | 1,266,587 | 1,271,020 |
| USS Ultimate Holdings, Inc.(b),(n) |
| 1st Lien Term Loan |
3-month USD LIBOR + 3.750%
08/25/2024 | 5.826% | | 450,000 | 451,688 |
| Total | 3,108,207 |
| Consumer Products 0.1% |
| Serta Simmons Bedding LLC(b),(n) |
| 1st Lien Term Loan |
3-month USD LIBOR + 3.500%
11/08/2023 | 5.579% | | 1,674,500 | 1,433,087 |
| 2nd Lien Term Loan |
3-month USD LIBOR + 8.000%
11/08/2024 | 10.071% | | 2,868,477 | 1,979,249 |
| SIWF Holdings, Inc.(b),(n) |
| 1st Lien Term Loan |
3-month USD LIBOR + 4.250%
06/15/2025 | 6.314% | | 550,000 | 550,688 |
| Steinway Musical Instruments, Inc.(b),(n) |
| 1st Lien Term Loan |
3-month USD LIBOR + 3.750%
02/14/2025 | 5.814% | | 1,496,250 | 1,496,250 |
| Weight Watchers International, Inc.(b),(n) |
| Term Loan |
3-month USD LIBOR + 4.750%
11/29/2024 | 7.048% | | 596,875 | 603,220 |
| Total | 6,062,494 |
| Diversified Manufacturing 0.2% |
| Accudyne Industries Borrower SCA/LLC(b),(n) |
| Term Loan |
3-month USD LIBOR + 3.000%
08/18/2024 | 5.076% | | 924,697 | 927,009 |
| Allnex & Cy SCA(b),(c),(n) |
| Tranche B2 Term Loan |
3-month USD LIBOR + 3.250%
09/13/2023 | 5.567% | | 539,989 | 542,689 |
The accompanying Notes to Financial Statements are an integral part of this statement.
| 28 | Columbia Strategic Income Fund | Annual Report 2018 |
Portfolio of Investments (continued)
August 31, 2018
| Senior Loans (continued) |
| Borrower | Coupon
Rate | | Principal
Amount ($) | Value ($) |
| Allnex & Cy SCA(b),(n) |
| Tranche B3 Term Loan |
3-month USD LIBOR + 3.250%
09/13/2023 | 5.567% | | 406,849 | 408,883 |
| Apergy Corp.(b),(n) |
| Term Loan |
3-month USD LIBOR + 2.500%
05/09/2025 | 4.625% | | 575,000 | 576,438 |
| Apex Tool Group LLC(b),(n) |
| Term Loan |
3-month USD LIBOR + 3.750%
02/01/2022 | 5.826% | | 786,137 | 787,403 |
| Bright Bidco BV/Lumileds LLC(b),(n) |
| Tranche B Term Loan |
3-month USD LIBOR + 3.500%
06/30/2024 | 5.751% | | 1,212,773 | 1,200,900 |
| Brookfield WEC Holdings, Inc./Westinghouse Electric Co. LLC(b),(n) |
| 1st Lien Term Loan |
3-month USD LIBOR + 3.750%
08/01/2025 | 5.826% | | 225,000 | 226,181 |
| 2nd Lien Term Loan |
3-month USD LIBOR + 6.750%
08/03/2026 | 8.826% | | 1,000,000 | 1,013,750 |
| EWT Holdings III Corp(b),(n) |
| 1st Lien Term Loan |
3-month USD LIBOR + 3.000%
12/20/2024 | 5.076% | | 942,466 | 943,060 |
| Gardner Denver, Inc.(b),(n) |
| Tranche B1 Term Loan |
3-month USD LIBOR + 2.750%
07/30/2024 | 4.826% | | 657,272 | 659,040 |
| Gates Global LLC(b),(n) |
| Tranche B2 Term Loan |
3-month USD LIBOR + 2.750%
04/01/2024 | 5.084% | | 725,604 | 728,891 |
| LTI Holdings, Inc./Boyd Corp.(b),(n) |
| 1st Lien Term Loan |
3-month USD LIBOR + 4.750%
05/16/2024 | 6.826% | | 519,750 | 518,778 |
| Zekelman Industries, Inc.(b),(n) |
| Term Loan |
3-month USD LIBOR + 2.250%
06/14/2021 | 4.582% | | 980,075 | 979,467 |
| Total | 9,512,489 |
| Electric 0.2% |
| AES Corp. (The)(b),(n) |
| Term Loan |
3-month USD LIBOR + 1.750%
05/31/2022 | 4.067% | | 617,203 | 616,432 |
| Senior Loans (continued) |
| Borrower | Coupon
Rate | | Principal
Amount ($) | Value ($) |
| Astoria Energy LLC(b),(n) |
| Tranche B Term Loan |
3-month USD LIBOR + 4.000%
12/24/2021 | 6.080% | | 746,866 | 751,070 |
| Calpine Corp.(b),(n) |
| Term Loan |
3-month USD LIBOR + 2.500%
01/15/2024 | 4.840% | | 1,036,959 | 1,037,861 |
| Eastern Power LLC/Covert Midco LLC/TPF II LC LLC(b),(n),(o) |
| Term Loan |
3-month USD LIBOR + 3.750%
10/02/2023 | 5.826% | | 974,736 | 973,244 |
| Frontera Generation Holdings LLC(b),(n) |
| Term Loan |
3-month USD LIBOR + 4.250%
05/02/2025 | 6.331% | | 825,000 | 827,062 |
| MRP Generation Holdings, LLC(b),(c),(n) |
| Term Loan |
3-month USD LIBOR + 7.000%
10/18/2022 | 9.334% | | 992,271 | 967,464 |
| Nautilus Power, LLC(b),(n),(o) |
| Term Loan |
3-month USD LIBOR + 4.250%
05/16/2024 | 6.326% | | 1,248,464 | 1,250,812 |
| Vistra Operations Co. LLC(b),(n) |
| Term Loan |
3-month USD LIBOR + 2.000%
08/04/2023 | 4.076% | | 380,984 | 380,230 |
3-month USD LIBOR + 2.250%
12/14/2023 | 4.326% | | 1,280,500 | 1,280,065 |
| WG Partners Acquisition LLC(b),(n) |
| Tranche B Term Loan |
3-month USD LIBOR + 3.500%
11/15/2023 | 5.834% | | 654,168 | 654,168 |
| Total | 8,738,408 |
| Environmental 0.2% |
| Advanced Disposal Services, Inc.(b),(n) |
| Term Loan |
3-month USD LIBOR + 2.250%
11/10/2023 | 4.207% | | 1,065,363 | 1,066,961 |
| EnergySolutions LLC/Envirocare of Utah LLC(b),(n) |
| Term Loan |
3-month USD LIBOR + 3.750%
05/09/2025 | 6.084% | | 1,300,000 | 1,308,125 |
| NRC US Holding Co., LLC(b),(n) |
| Term Loan |
3-month USD LIBOR + 5.250%
06/11/2024 | 7.326% | | 1,000,000 | 995,000 |
The accompanying Notes to Financial Statements are an integral part of this statement.
Columbia Strategic Income Fund | Annual Report 2018
| 29 |
Portfolio of Investments (continued)
August 31, 2018
| Senior Loans (continued) |
| Borrower | Coupon
Rate | | Principal
Amount ($) | Value ($) |
| STI Infrastructure SARL(b),(n) |
| Term Loan |
3-month USD LIBOR + 5.500%
08/22/2020 | 7.834% | | 3,032,719 | 2,623,302 |
| Wrangler Buyer Corp./Waste Industries USA, Inc.(b),(n) |
| Term Loan |
3-month USD LIBOR + 2.750%
09/27/2024 | 4.826% | | 744,747 | 748,099 |
| Total | 6,741,487 |
| Finance Companies 0.0% |
| Avolon Borrower 1 LLC(b),(n) |
| Tranche B3 Term Loan |
3-month USD LIBOR + 2.000%
01/15/2025 | 4.077% | | 1,500,000 | 1,497,990 |
| FinCo I LLC/Fortress Investment Group(b),(n) |
| Term Loan |
3-month USD LIBOR + 2.000%
12/27/2022 | | | 771,800 | 774,054 |
| Total | 2,272,044 |
| Food and Beverage 0.1% |
| Dole Food Co., Inc.(b),(n) |
| Tranche B Term Loan |
3-month USD LIBOR + 2.750%
04/06/2024 | 4.829% | | 633,750 | 632,343 |
| H-Food Holdings LLC/Hearthside Food Solutions LLC(b),(n) |
| Term Loan |
3-month USD LIBOR + 3.000%
05/23/2025 | 5.065% | | 500,000 | 495,665 |
| Hostess Brands LLC(b),(n) |
| Tranche B Term Loan |
3-month USD LIBOR + 2.250%
08/03/2022 | 4.326% | | 392,052 | 390,582 |
| JBS U.S.A. Lux SA(b),(n) |
| Term Loan |
3-month USD LIBOR + 2.500%
10/30/2022 | 4.835% | | 882,500 | 881,644 |
| US Foods, Inc./US Foodservice, Inc.(b),(n) |
| Term Loan |
3-month USD LIBOR + 2.000%
06/27/2023 | 4.076% | | 711,303 | 710,002 |
| WEI Sales LLC/Wells Enterprises, Inc.(b),(n) |
| Term Loan |
3-month USD LIBOR + 2.750%
03/31/2025 | 4.826% | | 673,313 | 676,679 |
| Total | 3,786,915 |
| Senior Loans (continued) |
| Borrower | Coupon
Rate | | Principal
Amount ($) | Value ($) |
| Foreign Agencies 0.0% |
| Oxea Holding Vier GmbH(b),(n) |
| Tranche B2 Term Loan |
3-month USD LIBOR + 3.500%
10/14/2024 | 5.625% | | 612,813 | 615,497 |
| Gaming 0.3% |
| Affinity Gaming(b),(n) |
| 2nd Lien Term Loan |
3-month USD LIBOR + 8.250%
01/31/2025 | 10.326% | | 1,525,000 | 1,499,837 |
| Aristocrat Leisure Ltd.(b),(n) |
| Tranche B3 Term Loan |
3-month USD LIBOR + 1.750%
10/19/2024 | 4.098% | | 709,956 | 707,919 |
| Caesars Resort Collection LLC(b),(n) |
| Tranche B Term Loan |
3-month USD LIBOR + 2.750%
12/23/2024 | 4.826% | | 569,625 | 571,226 |
| CBAC Borrower LLC(b),(n) |
| Tranche B Term Loan |
3-month USD LIBOR + 4.000%
07/08/2024 | 6.076% | | 1,066,938 | 1,068,538 |
| CCM Merger, Inc./MotorCity Casino Hotel(b),(n) |
| Term Loan |
3-month USD LIBOR + 2.750%
08/06/2021 | 4.826% | | 244,166 | 245,082 |
| CityCenter Holdings LLC(b),(n) |
| Tranche B Term Loan |
3-month USD LIBOR + 2.250%
04/18/2024 | 4.326% | | 715,742 | 715,406 |
| Gateway Casinos & Entertainment Ltd.(b),(n) |
| Term Loan |
3-month USD LIBOR + 3.000%
12/01/2023 | 5.473% | | 550,000 | 552,233 |
| Golden Nugget, Inc./Landry’s, Inc.(b),(n) |
| Tranche B Term Loan |
3-month USD LIBOR + 2.750%
10/04/2023 | 4.822% | | 660,068 | 661,718 |
| Las Vegas Sands LLC(b),(n) |
| Term Loan |
3-month USD LIBOR + 1.750%
03/27/2025 | 3.826% | | 974,961 | 972,894 |
| Mohegan Tribal Gaming Authority(b),(n) |
| Tranche B Term Loan |
3-month USD LIBOR + 4.000%
10/13/2023 | 6.076% | | 1,007,704 | 928,983 |
| Penn National Gaming, Inc.(b),(n),(o) |
| Term Loan |
3-month USD LIBOR + 2.250%
08/14/2025 | | | 775,000 | 775,969 |
The accompanying Notes to Financial Statements are an integral part of this statement.
| 30 | Columbia Strategic Income Fund | Annual Report 2018 |
Portfolio of Investments (continued)
August 31, 2018
| Senior Loans (continued) |
| Borrower | Coupon
Rate | | Principal
Amount ($) | Value ($) |
| Penn National Gaming, Inc.(b),(n) |
| Tranche B Term Loan |
3-month USD LIBOR + 2.500%
01/19/2024 | 4.576% | | 293,750 | 294,117 |
| Scientific Games International, Inc.(b),(n) |
| Tranche B5 Term Loan |
3-month USD LIBOR + 2.750%
08/14/2024 | 4.826% | | 1,611,891 | 1,606,991 |
| Seminole Tribe of Florida(b),(n) |
| Tranche B Term Loan |
3-month USD LIBOR + 1.750%
07/08/2024 | 3.826% | | 570,688 | 572,559 |
| Stars Group Holdings BV(b),(n) |
| Term Loan |
3-month USD LIBOR + 3.500%
07/10/2025 | 5.831% | | 1,200,000 | 1,208,916 |
| Yonkers Racing Corp.(b),(n) |
| 1st Lien Term Loan |
3-month USD LIBOR + 3.250%
05/31/2024 | 5.330% | | 1,169,880 | 1,172,804 |
| Total | 13,555,192 |
| Health Care 0.3% |
| Air Methods Corp.(b),(n) |
| Term Loan |
3-month USD LIBOR + 3.500%
04/22/2024 | 5.834% | | 663,822 | 606,288 |
| Avantor, Inc.(b),(n) |
| Term Loan |
3-month USD LIBOR + 4.000%
11/21/2024 | 6.076% | | 621,875 | 628,759 |
| Change Healthcare Holdings, Inc.(b),(n) |
| Term Loan |
3-month USD LIBOR + 2.750%
03/01/2024 | 4.826% | | 1,246,313 | 1,246,662 |
| CHS/Community Health Systems, Inc.(b),(n) |
| Tranche H Term Loan |
3-month USD LIBOR + 3.250%
01/27/2021 | 0.000% | | 340,461 | 335,317 |
| Diplomat Pharmacy, Inc.(b),(n) |
| Tranche B Term Loan |
3-month USD LIBOR + 4.500%
12/20/2024 | 6.580% | | 810,000 | 810,000 |
| Envision Healthcare Corp.(b),(n) |
| Term Loan |
3-month USD LIBOR + 3.000%
12/01/2023 | 5.080% | | 846,902 | 845,844 |
| Gentiva Health Services, Inc.(b),(n) |
| 1st Lien Term Loan |
3-month USD LIBOR + 3.750%
07/02/2025 | 6.125% | | 781,900 | 786,787 |
| Senior Loans (continued) |
| Borrower | Coupon
Rate | | Principal
Amount ($) | Value ($) |
| HC Group Holdings III, Inc.(b),(n) |
| 1st Lien Term Loan |
3-month USD LIBOR + 3.750%
04/07/2022 | 5.826% | | 982,278 | 985,962 |
| HCA, Inc.(b),(n) |
| Tranche B10 Term Loan |
3-month USD LIBOR + 2.000%
03/13/2025 | 4.076% | | 746,875 | 750,609 |
| Iqvia, Inc./Quintiles IMS(b),(n) |
| Tranche B3 Term Loan |
3-month USD LIBOR + 1.750%
06/11/2025 | 4.084% | | 500,000 | 499,065 |
| MPH Acquisition Holdings LLC(b),(n) |
| Term Loan |
3-month USD LIBOR + 2.750%
06/07/2023 | 5.084% | | 378,674 | 378,307 |
| National Mentor Holdings, Inc.(b),(n) |
| Tranche B Term Loan |
3-month USD LIBOR + 3.000%
01/31/2021 | 5.334% | | 972,081 | 974,755 |
| Onex Carestream Finance LP(b),(n) |
| 1st Lien Term Loan |
3-month USD LIBOR + 4.000%
06/07/2019 | 6.076% | | 818,130 | 816,256 |
| Ortho-Clinical Diagnostics, Inc.(b),(n) |
| Term Loan |
3-month USD LIBOR + 3.250%
06/30/2025 | 5.316% | | 1,106,305 | 1,105,708 |
| Owens & Minor, Inc.(b),(n) |
| Tranche B Term Loan |
3-month USD LIBOR + 4.500%
05/02/2025 | 6.673% | | 1,025,000 | 995,531 |
| PharMerica Corp.(b),(n) |
| 1st Lien Term Loan |
3-month USD LIBOR + 3.500%
12/06/2024 | 5.567% | | 473,813 | 476,480 |
| Select Medical Corp.(b),(n) |
| Tranche B Term Loan |
3-month USD LIBOR + 2.750%
03/01/2021 | 4.821% | | 335,427 | 336,963 |
| Sterigenics-Nordion Holdings, LLC(b),(n) |
| Term Loan |
3-month USD LIBOR + 3.000%
05/15/2022 | 5.334% | | 1,102,802 | 1,103,904 |
| Team Health Holdings, Inc.(b),(n) |
| Term Loan |
3-month USD LIBOR + 2.750%
02/06/2024 | 4.826% | | 493,750 | 471,122 |
| Total | 14,154,319 |
The accompanying Notes to Financial Statements are an integral part of this statement.
Columbia Strategic Income Fund | Annual Report 2018
| 31 |
Portfolio of Investments (continued)
August 31, 2018
| Senior Loans (continued) |
| Borrower | Coupon
Rate | | Principal
Amount ($) | Value ($) |
| Independent Energy 0.0% |
| Chesapeake Energy Corp.(b),(n) |
| Tranche A Term Loan |
3-month USD LIBOR + 7.500%
08/23/2021 | 9.576% | | 2,040,142 | 2,127,215 |
| Leisure 0.2% |
| 24 Hour Fitness Worldwide, Inc.(b),(n) |
| Term Loan |
3-month USD LIBOR + 3.500%
05/30/2025 | 5.576% | | 950,000 | 957,125 |
| ClubCorp Holdings, Inc.(b),(n) |
| Tranche B 1st Lien Term Loan |
3-month USD LIBOR + 2.750%
09/18/2024 | 5.084% | | 865,792 | 855,619 |
| Crown Finance US, Inc./Cineworld Group PLC(b),(n) |
| Term Loan |
3-month USD LIBOR + 2.500%
02/28/2025 | 4.576% | | 1,197,000 | 1,192,810 |
| Formula One Management Ltd.(b),(n) |
| Tranche B3 Term Loan |
3-month USD LIBOR + 2.500%
02/01/2024 | 4.576% | | 1,098,574 | 1,089,786 |
| Life Time Fitness, Inc.(b),(n) |
| Term Loan |
3-month USD LIBOR + 2.750%
06/10/2022 | 5.062% | | 611,331 | 610,952 |
| Metro-Goldwyn-Mayer, Inc.(b),(n) |
| 1st Lien Term Loan |
3-month USD LIBOR + 2.500%
07/03/2025 | 4.580% | | 725,000 | 725,000 |
| 2nd Lien Term Loan |
3-month USD LIBOR + 4.500%
07/03/2026 | 6.580% | | 550,000 | 550,000 |
| NAI Entertainment Holdings LLC(b),(n) |
| Tranche B Term Loan |
3-month USD LIBOR + 2.500%
05/08/2025 | 4.580% | | 625,000 | 624,219 |
| UFC Holdings LLC(b),(n) |
| 1st Lien Term Loan |
3-month USD LIBOR + 3.250%
08/18/2023 | 5.330% | | 581,981 | 584,059 |
| William Morris Endeavor Entertainment, LLC/IMG Worldwide Holdings, LLC(b),(n) |
| Tranche B1 1st Lien Term Loan |
3-month USD LIBOR + 2.750%
05/18/2025 | 4.830% | | 735,072 | 730,940 |
| Total | 7,920,510 |
| Senior Loans (continued) |
| Borrower | Coupon
Rate | | Principal
Amount ($) | Value ($) |
| Lodging 0.0% |
| Hilton Worldwide Finance LLC(b),(n) |
| Tranche B2 Term Loan |
3-month USD LIBOR + 1.750%
10/25/2023 | 3.815% | | 973,074 | 975,915 |
| Marriott Ownership(b),(n),(o) |
| Term Loan |
3-month USD LIBOR + 2.250%
08/29/2025 | 0.000% | | 450,000 | 450,563 |
| RHP Hotel Properties LP(b),(n) |
| Tranche B Term Loan |
3-month USD LIBOR + 2.000%
05/11/2024 | 4.340% | | 592,500 | 591,463 |
| Total | 2,017,941 |
| Media and Entertainment 0.3% |
| A-L Parent LLC/Learfield Communications(b),(c),(n) |
| 1st Lien Term Loan |
3-month USD LIBOR + 3.250%
12/01/2023 | 5.330% | | 1,192,062 | 1,201,002 |
| Cengage Learning, Inc.(b),(n) |
| Term Loan |
3-month USD LIBOR + 4.250%
06/07/2023 | 6.327% | | 413,801 | 382,973 |
| Cumulus Media New Holdings, Inc.(b),(n) |
| Term Loan |
3-month USD LIBOR + 4.500%
05/13/2022 | 6.580% | | 718,126 | 705,379 |
| Emerald Expositions Holding, Inc.(b),(n) |
| Term Loan |
3-month USD LIBOR + 2.750%
05/22/2024 | 4.826% | | 692,086 | 694,682 |
| Entravision Communications Corp.(b),(n) |
| Tranche B Term Loan |
3-month USD LIBOR + 2.750%
11/29/2024 | 4.826% | | 666,188 | 657,307 |
| Getty Images, Inc.(b),(n) |
| Term Loan |
3-month USD LIBOR + 3.500%
10/18/2019 | 5.576% | | 890,000 | 866,531 |
| Hubbard Radio LLC(b),(n) |
| Term Loan |
3-month USD LIBOR + 3.000%
03/28/2025 | 5.080% | | 736,678 | 736,678 |
| iHeartCommunications, Inc.(n),(p) |
| Tranche D Term Loan |
| 01/30/2019 | | | 1,128,407 | 839,727 |
| Ion Media Networks, Inc.(b),(n) |
| Tranche B3 Term Loan |
3-month USD LIBOR + 2.750%
12/18/2020 | 4.830% | | 310,709 | 311,874 |
The accompanying Notes to Financial Statements are an integral part of this statement.
| 32 | Columbia Strategic Income Fund | Annual Report 2018 |
Portfolio of Investments (continued)
August 31, 2018
| Senior Loans (continued) |
| Borrower | Coupon
Rate | | Principal
Amount ($) | Value ($) |
| Lions Gate Capital Holdings LLC(b),(n) |
| Tranche B Term Loan |
3-month USD LIBOR + 2.250%
03/24/2025 | 4.315% | | 798,000 | 797,002 |
| Meredith Corp.(b),(n) |
| Term Loan |
3-month USD LIBOR + 3.000%
01/31/2025 | 5.076% | | 847,750 | 849,632 |
| Mission Broadcasting, Inc.(b),(n) |
| Tranche B2 Term Loan |
3-month USD LIBOR + 2.500%
01/17/2024 | 4.582% | | 54,138 | 54,318 |
| Nexstar Broadcasting, Inc.(b),(n) |
| Tranche B2 Term Loan |
3-month USD LIBOR + 2.500%
01/17/2024 | 4.582% | | 397,829 | 399,153 |
| Nielsen Finance LLC/VNU, Inc.(b),(n) |
| Tranche B4 Term Loan |
3-month USD LIBOR + 2.000%
10/04/2023 | 4.071% | | 712,358 | 708,105 |
| Radio One, Inc.(b),(c),(n) |
| Term Loan |
3-month USD LIBOR + 4.000%
04/18/2023 | 6.080% | | 1,431,875 | 1,353,122 |
| Tribune Media Co.(b),(n) |
| Tranche B Term Loan |
3-month USD LIBOR + 3.000%
12/27/2020 | 5.076% | | 60,422 | 60,460 |
| Tranche C Term Loan |
3-month USD LIBOR + 3.000%
01/26/2024 | 5.076% | | 836,734 | 838,308 |
| UFC Holdings LLC(b),(n) |
| 2nd Lien Term Loan |
3-month USD LIBOR + 7.500%
08/18/2024 | 9.576% | | 678,000 | 684,780 |
| Univision Communications, Inc.(b),(n) |
| 1st Lien Term Loan |
3-month USD LIBOR + 2.750%
03/15/2024 | 4.826% | | 1,022,085 | 980,180 |
| Total | 13,121,213 |
| Metals and Mining 0.0% |
| Noranda Aluminum Acquisition Corp.(n),(p) |
| Tranche B Term Loan |
| 02/28/2019 | 0.000% | | 130,400 | 326 |
| Midstream 0.0% |
| Energy Transfer Equity LP(b),(n) |
| Term Loan |
3-month USD LIBOR + 2.000%
02/02/2024 | 4.065% | | 170,841 | 170,814 |
| Senior Loans (continued) |
| Borrower | Coupon
Rate | | Principal
Amount ($) | Value ($) |
| Southcross Energy Partners LP(b),(n),(o) |
| Term Loan |
3-month USD LIBOR + 4.250%
08/04/2021 | 6.584% | | 500,000 | 437,190 |
| Total | 608,004 |
| Oil Field Services 0.1% |
| Fieldwood Energy LLC(b),(n) |
| 1st Lien Term Loan |
3-month USD LIBOR + 5.250%
04/11/2022 | 7.326% | | 275,952 | 277,161 |
| 2nd Lien Term Loan |
3-month USD LIBOR + 7.250%
04/11/2023 | 9.326% | | 372,536 | 360,737 |
| MRC Global, Inc.(b),(n) |
| Term Loan |
3-month USD LIBOR + 3.000%
09/20/2024 | 5.076% | | 1,065,875 | 1,072,537 |
| Traverse Midstream Partners LLC(b),(n) |
| Term Loan |
3-month USD LIBOR + 4.000%
09/27/2024 | 6.340% | | 725,000 | 727,719 |
| Total | 2,438,154 |
| Other Financial Institutions 0.0% |
| Lifescan Global Corp.(b),(n),(o) |
| Term Loan |
3-month USD LIBOR + 6.000%
06/19/2024 | 0.000% | | 1,325,000 | 1,285,250 |
| VICI Properties 1 LLC(b),(n) |
| Tranche B Term Loan |
3-month USD LIBOR + 2.000%
12/20/2024 | 4.067% | | 811,364 | 810,755 |
| Total | 2,096,005 |
| Other Industry 0.1% |
| Filtration Group Corp.(b),(n) |
| Term Loan |
3-month USD LIBOR + 3.000%
03/29/2025 | 5.076% | | 897,750 | 900,560 |
| Harland Clarke Holdings Corp.(b),(n) |
| Term Loan |
3-month USD LIBOR + 4.750%
11/03/2023 | 7.084% | | 1,282,086 | 1,205,161 |
| Hillman Group, Inc. (The)(b),(n) |
| Term Loan |
3-month USD LIBOR + 3.500%
05/30/2025 | 5.834% | | 675,000 | 672,259 |
The accompanying Notes to Financial Statements are an integral part of this statement.
Columbia Strategic Income Fund | Annual Report 2018
| 33 |
Portfolio of Investments (continued)
August 31, 2018
| Senior Loans (continued) |
| Borrower | Coupon
Rate | | Principal
Amount ($) | Value ($) |
| Interior Logic Group Holdings IV LLC(b),(n) |
| Term Loan |
3-month USD LIBOR + 4.000%
05/30/2025 | 6.342% | | 850,000 | 849,473 |
| Lightstone Holdco LLC(b),(n) |
| Tranche B Term Loan |
3-month USD LIBOR + 3.750%
01/30/2024 | 0.000% | | 1,828,599 | 1,818,322 |
| Tranche C Term Loan |
3-month USD LIBOR + 3.750%
01/30/2024 | 0.000% | | 98,213 | 97,661 |
| Titan Acquisition Ltd./Husky IMS International Ltd(b),(n) |
| Term Loan |
3-month USD LIBOR + 3.000%
03/28/2025 | 5.076% | | 647,125 | 612,459 |
| Total | 6,155,895 |
| Packaging 0.3% |
| Anchor Glass Container Corp.(b),(n) |
| 1st Lien Term Loan |
3-month USD LIBOR + 2.750%
12/07/2023 | 4.818% | | 1,329,817 | 1,173,152 |
| Berry Global, Inc.(b),(n) |
| Tranche R Term Loan |
3-month USD LIBOR + 2.000%
01/19/2024 | 4.186% | | 1,215,025 | 1,214,187 |
| BWAY Holding Co.(b),(n) |
| Term Loan |
3-month USD LIBOR + 3.250%
04/03/2024 | 5.581% | | 811,750 | 808,268 |
| Consolidated Container Co. LLC(b),(n) |
| 1st Lien Term Loan |
3-month USD LIBOR + 2.750%
05/22/2024 | 4.826% | | 446,631 | 446,966 |
| Flex Acquisition Co., Inc./Novolex(b),(n) |
| Term Loan |
3-month USD LIBOR + 3.000%
12/29/2023 | 5.337% | | 1,252,813 | 1,247,726 |
| Packaging Coordinators Midco, Inc.(b),(n) |
| Term Loan |
3-month USD LIBOR + 4.000%
06/30/2023 | 6.340% | | 441,000 | 441,551 |
| Plastipak Holdings, Inc.(b),(n) |
| Tranche B Term Loan |
3-month USD LIBOR + 2.500%
10/14/2024 | 4.580% | | 736,875 | 735,165 |
| Pregis Holding I Corp.(b),(n) |
| 1st Lien Term Loan |
3-month USD LIBOR + 3.500%
05/20/2021 | 5.834% | | 1,012,533 | 1,008,735 |
| Senior Loans (continued) |
| Borrower | Coupon
Rate | | Principal
Amount ($) | Value ($) |
| Printpack Holdings, Inc.(b),(c),(n) |
| Term Loan |
3-month USD LIBOR + 3.000%
07/26/2023 | 5.125% | | 758,348 | 756,452 |
| ProAmpac PG Borrower LLC(b),(n) |
| 1st Lien Term Loan |
3-month USD LIBOR + 3.500%
11/20/2023 | 5.735% | | 883,354 | 878,938 |
| 2nd Lien Term Loan |
3-month USD LIBOR + 8.500%
11/18/2024 | 10.810% | | 700,000 | 701,169 |
| Ranpak Corp.(b),(c),(n) |
| Tranche B1 Term Loan |
3-month USD LIBOR + 3.250%
10/01/2021 | 5.326% | | 804,123 | 804,123 |
| Reynolds Group Holdings, Inc.(b),(n) |
| Term Loan |
3-month USD LIBOR + 2.750%
02/05/2023 | 4.826% | | 506,221 | 507,669 |
| SIG Combibloc Holdings SCA(b),(n) |
| Term Loan |
3-month USD LIBOR + 2.750%
03/11/2022 | 4.826% | | 907,645 | 910,296 |
| Spectrum Holdings III Corp.(b),(c),(n) |
| 2nd Lien Term Loan |
3-month USD LIBOR + 7.000%
01/31/2026 | 9.076% | | 425,000 | 423,937 |
| Tricorbraun Holdings, Inc.(b),(n) |
| 1st Lien Term Loan |
3-month USD LIBOR + 3.750%
11/30/2023 | 6.084% | | 402,955 | 404,566 |
| Delayed Draw 1st Lien Term Loan |
3-month USD LIBOR + 3.750%
11/30/2023 | 6.080% | | 40,602 | 40,765 |
| Trident TPI Holdings, Inc.(b),(n) |
| Tranche B1 Term Loan |
3-month USD LIBOR + 3.250%
10/17/2024 | 5.326% | | 716,375 | 713,538 |
| Twist Beauty International Holdings S.A.(b),(n) |
| Tranche B2 Term Loan |
3-month USD LIBOR + 3.000%
04/22/2024 | 5.445% | | 597,250 | 590,531 |
| Total | 13,807,734 |
| Paper 0.0% |
| Caraustar Industries, Inc.(b),(n) |
| Term Loan |
3-month USD LIBOR + 5.500%
03/14/2022 | 7.834% | | 864,063 | 869,463 |
The accompanying Notes to Financial Statements are an integral part of this statement.
| 34 | Columbia Strategic Income Fund | Annual Report 2018 |
Portfolio of Investments (continued)
August 31, 2018
| Senior Loans (continued) |
| Borrower | Coupon
Rate | | Principal
Amount ($) | Value ($) |
| Pharmaceuticals 0.1% |
| Bausch Health Companies, Inc.(b),(n) |
| Term Loan |
3-month USD LIBOR + 3.000%
06/02/2025 | 5.081% | | 657,579 | 659,657 |
| Endo Finance Co. I SARL(b),(n) |
| Term Loan |
3-month USD LIBOR + 4.250%
04/29/2024 | 6.375% | | 717,750 | 721,339 |
| Grifols Worldwide Operations Ltd.(b),(n) |
| Tranche B Term Loan |
3-month USD LIBOR + 2.250%
01/31/2025 | 4.207% | | 734,375 | 737,217 |
| Jaguar Holding Co. I LLC/Pharmaceutical Product Development LLC(b),(n) |
| Term Loan |
3-month USD LIBOR + 2.500%
08/18/2022 | 4.576% | | 1,261,000 | 1,259,714 |
| Mallinckrodt International Finance SA(b),(n) |
| Term Loan |
3-month USD LIBOR + 3.000%
02/24/2025 | 5.517% | | 697,000 | 695,696 |
| RPI Finance Trust(b),(n) |
| Tranche B6 Term Loan |
3-month USD LIBOR + 2.000%
03/27/2023 | 4.334% | | 1,176,078 | 1,178,466 |
| Total | 5,252,089 |
| Property & Casualty 0.1% |
| Alliant Holdings Intermediate LLC(b),(n) |
| Term Loan |
3-month USD LIBOR + 3.000%
05/09/2025 | 5.067% | | 578,928 | 578,696 |
| Asurion LLC(b),(n) |
| Tranche B2 2nd Lien Term Loan |
3-month USD LIBOR + 6.500%
08/04/2025 | 8.576% | | 1,475,000 | 1,516,787 |
| Tranche B4 Term Loan |
3-month USD LIBOR + 3.000%
08/04/2022 | 5.076% | | 252,208 | 253,416 |
| Tranche B6 Term Loan |
3-month USD LIBOR + 3.000%
11/03/2023 | 5.076% | | 409,279 | 410,449 |
| Hub International Ltd.(b),(n) |
| Term Loan |
3-month USD LIBOR + 3.000%
04/25/2025 | 5.335% | | 650,000 | 649,149 |
| Senior Loans (continued) |
| Borrower | Coupon
Rate | | Principal
Amount ($) | Value ($) |
| USI, Inc.(b),(n) |
| Term Loan |
3-month USD LIBOR + 3.000%
05/16/2024 | 5.334% | | 769,187 | 766,941 |
| Total | 4,175,438 |
| Restaurants 0.1% |
| IRB Holding Corp./Arby’s/Buffalo Wild Wings(b),(n) |
| Tranche B Term Loan |
3-month USD LIBOR + 3.250%
02/05/2025 | 5.321% | | 448,875 | 450,801 |
| KFC Holding Co./Yum! Brands(b),(n) |
| Tranche B Term Loan |
3-month USD LIBOR + 1.750%
04/03/2025 | 3.827% | | 663,564 | 662,595 |
| New Red Finance, Inc./Burger King/Tim Hortons(b),(n) |
| Tranche B3 Term Loan |
3-month USD LIBOR + 2.250%
02/16/2024 | 4.326% | | 965,813 | 965,214 |
| P.F. Chang’s China Bistro, Inc.(b),(n) |
| Term Loan |
3-month USD LIBOR + 5.000%
09/01/2022 | 7.670% | | 1,017,313 | 1,015,614 |
| Total | 3,094,224 |
| Retailers 0.3% |
| Academy Ltd.(b),(n) |
| Term Loan |
3-month USD LIBOR + 4.000%
07/01/2022 | 6.082% | | 986,405 | 810,085 |
| AI Aqua Merger Sub, Inc.(b),(c),(n) |
| 1st Lien Term Loan |
3-month USD LIBOR + 3.250%
12/13/2023 | 5.326% | | 347,375 | 344,770 |
| AI Aqua Merger Sub, Inc.(b),(n) |
| Tranche B1 1st Lien Term Loan |
3-month USD LIBOR + 3.250%
12/13/2023 | 5.326% | | 641,375 | 638,168 |
| Bass Pro Group LLC(b),(n) |
| Term Loan |
3-month USD LIBOR + 5.000%
09/25/2024 | 7.076% | | 992,500 | 1,002,425 |
| Belk, Inc.(b),(n) |
| 1st Lien Term Loan |
3-month USD LIBOR + 4.750%
12/12/2022 | 6.813% | | 537,857 | 469,726 |
| BJ’s Wholesale Club, Inc.(b),(n) |
| Tranche B 1st Lien Term Loan |
3-month USD LIBOR + 3.500%
02/03/2024 | 5.067% | | 850,514 | 851,577 |
The accompanying Notes to Financial Statements are an integral part of this statement.
Columbia Strategic Income Fund | Annual Report 2018
| 35 |
Portfolio of Investments (continued)
August 31, 2018
| Senior Loans (continued) |
| Borrower | Coupon
Rate | | Principal
Amount ($) | Value ($) |
| Burlington Coat Factory Warehouse Corp.(b),(n) |
| Tranche B5 Term Loan |
3-month USD LIBOR + 2.500%
11/17/2024 | 4.570% | | 721,423 | 724,583 |
| David’s Bridal, Inc.(b),(n) |
| Term Loan |
3-month USD LIBOR + 4.000%
10/11/2019 | 6.320% | | 2,392,431 | 2,157,973 |
| Harbor Freight Tools U.S.A., Inc.(b),(n) |
| Term Loan |
3-month USD LIBOR + 2.500%
08/18/2023 | 4.576% | | 930,613 | 929,189 |
| Hudson’s Bay Co.(b),(n) |
| Term Loan |
3-month USD LIBOR + 3.250%
09/30/2022 | 5.315% | | 476,728 | 456,705 |
| J.Crew Group, Inc.(b),(n) |
| Term Loan |
3-month USD LIBOR + 3.220%
03/05/2021 | 5.450% | | 1,763,195 | 1,582,961 |
| JC Penney Corp., Inc.(b),(n) |
| Term Loan |
3-month USD LIBOR + 4.250%
06/23/2023 | 6.567% | | 760,000 | 695,674 |
| Neiman Marcus Group, Ltd. LLC(b),(n) |
| Term Loan |
3-month USD LIBOR + 3.250%
10/25/2020 | 5.330% | | 982,467 | 910,747 |
| PetSmart, Inc.(b),(n) |
| Tranche B2 Term Loan |
3-month USD LIBOR + 3.000%
03/11/2022 | 5.090% | | 728,074 | 626,144 |
| Total | 12,200,727 |
| Supermarkets 0.1% |
| Albertsons LLC(b),(n) |
| Tranche B4 Term Loan |
3-month USD LIBOR + 2.750%
08/25/2021 | 4.826% | | 974,477 | 972,450 |
| Tranche B6 Term Loan |
3-month USD LIBOR + 3.000%
06/22/2023 | 5.311% | | 654,473 | 651,581 |
| SUPERVALU, Inc.(b),(n) |
| Delayed Draw Term Loan |
3-month USD LIBOR + 3.500%
06/08/2024 | 5.576% | | 288,237 | 288,536 |
| Term Loan |
3-month USD LIBOR + 3.500%
06/08/2024 | 5.576% | | 480,394 | 480,894 |
| Total | 2,393,461 |
| Senior Loans (continued) |
| Borrower | Coupon
Rate | | Principal
Amount ($) | Value ($) |
| Technology 0.8% |
| Applied Systems, Inc.(b),(n) |
| 1st Lien Term Loan |
3-month USD LIBOR + 3.000%
09/19/2024 | 5.334% | | 639,500 | 641,630 |
| Ascend Learning LLC(b),(n) |
| Term Loan |
3-month USD LIBOR + 3.000%
07/12/2024 | 5.076% | | 293,780 | 293,046 |
| Avaya, Inc.(b),(n) |
| Tranche B Term Loan |
3-month USD LIBOR + 4.250%
12/15/2024 | 6.313% | | 1,016,125 | 1,022,354 |
| BMC Software Finance, Inc.(b),(n),(o) |
| Term Loan |
3-month USD LIBOR + 4.250%
09/10/2025 | 0.000% | | 1,000,000 | 1,000,300 |
| BMC Software Finance, Inc.(b),(n) |
| Tranche B2 Term Loan |
3-month USD LIBOR + 3.250%
09/10/2022 | 5.326% | | 1,215,812 | 1,216,578 |
| CDS US Intermediate Holdings, Inc.(b),(n) |
| 2nd Lien Term Loan |
3-month USD LIBOR + 8.250%
07/10/2023 | 10.326% | | 1,000,000 | 970,000 |
| Celestica, Inc.(b),(n) |
| Tranche B Term Loan |
3-month USD LIBOR + 2.000%
06/27/2025 | 4.065% | | 500,000 | 498,125 |
| Corel Corp./Inc.(b),(n) |
| Term Loan |
3-month USD LIBOR + 5.000%
06/04/2024 | 7.313% | | 1,000,000 | 1,005,000 |
| Dell International LLC/EMC Corp.(b),(n) |
| Tranche B Term Loan |
3-month USD LIBOR + 2.000%
09/07/2023 | 4.080% | | 901,708 | 901,330 |
| DigiCert, Inc.(b),(n) |
| 1st Lien Term Loan |
3-month USD LIBOR + 5.250%
10/31/2024 | 7.326% | | 673,312 | 675,420 |
| 2nd Lien Term Loan |
3-month USD LIBOR + 8.000%
10/31/2025 | 10.076% | | 525,000 | 522,375 |
| First Data Corp.(b),(n) |
| Term Loan |
3-month USD LIBOR + 2.000%
07/08/2022 | 4.066% | | 862,166 | 861,580 |
The accompanying Notes to Financial Statements are an integral part of this statement.
| 36 | Columbia Strategic Income Fund | Annual Report 2018 |
Portfolio of Investments (continued)
August 31, 2018
| Senior Loans (continued) |
| Borrower | Coupon
Rate | | Principal
Amount ($) | Value ($) |
| Go Daddy Operating Co., LLC/Finance Co., Inc.(b),(n) |
| Tranche B1 Term Loan |
3-month USD LIBOR + 2.250%
02/15/2024 | 4.326% | | 588,137 | 589,607 |
| Greeneden US Holdings I LLC/Genesys Telecommunications Laboratories, Inc.(b),(n) |
| Tranche B3 Term Loan |
3-month USD LIBOR + 3.500%
12/01/2023 | 5.576% | | 659,728 | 660,830 |
| Hyland Software, Inc.(b),(n) |
| Tranche 3 1st Lien Term Loan |
3-month USD LIBOR + 3.250%
07/01/2022 | 5.326% | | 695,955 | 699,608 |
| Infor US, Inc.(b),(n) |
| Tranche B6 Term Loan |
3-month USD LIBOR + 2.750%
02/01/2022 | 4.826% | | 887,358 | 887,828 |
| Informatica LLC(b),(n) |
| Tranche B1 Term Loan |
3-month USD LIBOR + 3.250%
08/05/2022 | 5.326% | | 831,683 | 835,426 |
| Information Resources, Inc.(b),(n) |
| 1st Lien Term Loan |
3-month USD LIBOR + 4.250%
01/18/2024 | 6.567% | | 955,155 | 959,529 |
| 2nd Lien Term Loan |
3-month USD LIBOR + 8.250%
01/20/2025 | 10.567% | | 375,000 | 377,344 |
| ION Trading Technologies SARL(b),(n),(o) |
| Term Loan |
3-month USD LIBOR + 4.000%
11/21/2024 | 0.000% | | 1,000,000 | 994,690 |
| Leidos Innovations Corp.(b),(n) |
| Tranche B Term Loan |
3-month USD LIBOR + 1.750%
08/22/2025 | 3.875% | | 793,650 | 796,627 |
| MA FinanceCo LLC/Micro Focus International PLC(b),(n) |
| Tranche B2 Term Loan |
3-month USD LIBOR + 2.250%
11/19/2021 | 4.326% | | 365,725 | 361,307 |
| Tranche B3 Term Loan |
3-month USD LIBOR + 2.500%
06/21/2024 | 4.576% | | 154,272 | 153,886 |
| MacDonald, Dettwiler and Associates Ltd./Maxar(b),(n) |
| Tranche B Term Loan |
3-month USD LIBOR + 2.750%
10/04/2024 | 4.830% | | 995,000 | 971,369 |
| McAfee LLC(b),(n) |
| Term Loan |
3-month USD LIBOR + 4.500%
09/30/2024 | 6.573% | | 1,042,125 | 1,050,462 |
| Senior Loans (continued) |
| Borrower | Coupon
Rate | | Principal
Amount ($) | Value ($) |
| McDermott International, Inc.(b),(n) |
| Term Loan |
3-month USD LIBOR + 5.000%
05/12/2025 | 7.076% | | 673,313 | 679,938 |
| Microchip Technology, Inc.(b),(n) |
| Term Loan |
3-month USD LIBOR + 2.000%
05/29/2025 | 4.080% | | 1,025,000 | 1,023,083 |
| Misys Ltd./Almonde/Tahoe(b),(n) |
| 1st Lien Term Loan |
3-month USD LIBOR + 3.500%
06/13/2024 | 5.576% | | 682,259 | 678,663 |
| Mitel US Holdings, Inc./Networks Corp.(b),(n) |
| Term Loan |
3-month USD LIBOR + 3.750%
09/25/2023 | 5.826% | | 537,912 | 537,686 |
| Oberthur Technologies Holding SAS(b),(n) |
| Tranche B1 Term Loan |
3-month USD LIBOR + 3.750%
01/10/2024 | 6.084% | | 835,600 | 838,525 |
| ON Semiconductor Corp.(b),(n) |
| Tranche B3 Term Loan |
3-month USD LIBOR + 1.750%
03/31/2023 | 3.826% | | 483,983 | 484,453 |
| Perspecta, Inc.(b),(n) |
| Tranche B Term Loan |
3-month USD LIBOR + 2.250%
05/30/2025 | 4.326% | | 825,000 | 825,676 |
| Plantronics, Inc.(b),(n) |
| Tranche B Term Loan |
3-month USD LIBOR + 2.500%
07/02/2025 | 4.576% | | 1,000,000 | 997,080 |
| Rackspace Hosting, Inc.(b),(n) |
| Tranche B 1st Lien Term Loan |
3-month USD LIBOR + 3.000%
11/03/2023 | 5.348% | | 444,386 | 441,333 |
| Riverbed Technology, Inc.(b),(n) |
| Term Loan |
3-month USD LIBOR + 3.250%
04/24/2022 | 5.330% | | 910,258 | 904,951 |
| Sabre GLBL, Inc.(b),(n) |
| Tranche B Term Loan |
3-month USD LIBOR + 2.000%
02/22/2024 | 4.076% | | 631,660 | 632,254 |
| SCS Holdings I, Inc.(b),(n) |
| Tranche B 1st Lien Term Loan |
3-month USD LIBOR + 4.250%
10/30/2022 | 6.326% | | 286,576 | 287,473 |
The accompanying Notes to Financial Statements are an integral part of this statement.
Columbia Strategic Income Fund | Annual Report 2018
| 37 |
Portfolio of Investments (continued)
August 31, 2018
| Senior Loans (continued) |
| Borrower | Coupon
Rate | | Principal
Amount ($) | Value ($) |
| Seattle SpinCo, Inc./Micro Focus International PLC(b),(n) |
| Term Loan |
3-month USD LIBOR + 2.500%
06/21/2024 | 4.576% | | 785,978 | 784,013 |
| Shutterfly, Inc.(b),(n) |
| Term Loan |
3-month USD LIBOR + 2.750%
08/17/2024 | 4.830% | | 475,000 | 476,187 |
| SS&C Technologies Holdings, Inc.(b),(n) |
| Tranche B3 Term Loan |
3-month USD LIBOR + 2.500%
04/16/2025 | 4.326% | | 641,674 | 641,994 |
| Tranche B4 Term Loan |
3-month USD LIBOR + 2.500%
04/16/2025 | 4.326% | | 249,611 | 249,736 |
| Syneos Health, Inc.(b),(n) |
| Tranche B Term Loan |
3-month USD LIBOR + 2.000%
08/01/2024 | 4.076% | | 915,625 | 915,195 |
| Tempo Acquisition, LLC(b),(n) |
| Term Loan |
3-month USD LIBOR + 3.000%
05/01/2024 | 5.076% | | 940,500 | 942,183 |
| TTM Technologies, Inc.(b),(n) |
| Tranche B Term Loan |
3-month USD LIBOR + 2.500%
09/28/2024 | 4.581% | | 714,805 | 715,105 |
| VeriFone Systems, Inc.(b),(n) |
| 1st Lien Term Loan |
3-month USD LIBOR + 4.000%
08/20/2025 | 6.322% | | 400,000 | 400,500 |
| Verint Systems, Inc.(b),(n) |
| Term Loan |
3-month USD LIBOR + 2.000%
06/28/2024 | 4.082% | | 586,250 | 586,004 |
| Veritas US, Inc.(b),(n) |
| Tranche B Term Loan |
3-month USD LIBOR + 4.500%
01/27/2023 | 6.640% | | 727,322 | 688,098 |
| Verscend Holding Corp.(b),(n),(o) |
| Term Loan |
3-month USD LIBOR + 4.500%
08/27/2025 | 0.000% | | 325,000 | 326,830 |
| West Corp.(b),(n) |
| Tranche B Term Loan |
3-month USD LIBOR + 4.000%
10/10/2024 | 6.076% | | 913,726 | 909,440 |
| Xperi Corp(b),(n) |
| Tranche B1 Term Loan |
3-month USD LIBOR + 2.500%
12/01/2023 | 4.576% | | 308,750 | 306,144 |
| Senior Loans (continued) |
| Borrower | Coupon
Rate | | Principal
Amount ($) | Value ($) |
| Zebra Technologies Corp./Diamond Holdings Ltd.(b),(n) |
| Tranche B Term Loan |
3-month USD LIBOR + 1.750%
10/27/2021 | 4.063% | | 359,367 | 361,013 |
| Total | 35,579,808 |
| Wireless 0.1% |
| Cellular South, Inc.(b),(n) |
| Tranche B Term Loan |
3-month USD LIBOR + 2.250%
05/17/2024 | 0.000% | | 500,000 | 498,750 |
| Numericable US LLC(b),(n) |
| Tranche B11 Term Loan |
3-month USD LIBOR + 2.750%
07/31/2025 | 4.825% | | 987,500 | 934,669 |
| Sprint Communications, Inc.(b),(n) |
| Term Loan |
3-month USD LIBOR + 2.500%
02/02/2024 | 4.625% | | 1,042,213 | 1,042,213 |
| Switch, Ltd.(b),(n) |
| Tranche B1 Term Loan |
3-month USD LIBOR + 2.250%
06/27/2024 | 4.326% | | 569,250 | 570,200 |
| Total | 3,045,832 |
| Wirelines 0.1% |
| CenturyLink, Inc.(b),(n) |
| Tranche B Term Loan |
3-month USD LIBOR + 2.750%
01/31/2025 | 4.826% | | 323,375 | 319,495 |
| Level 3 Financing, Inc.(b),(n) |
| Tranche B Term Loan |
3-month USD LIBOR + 2.250%
02/22/2024 | 4.317% | | 1,250,000 | 1,251,212 |
| Southwire Co. LLC(b),(n) |
| Term Loan |
3-month USD LIBOR + 2.000%
05/19/2025 | 4.060% | | 1,000,000 | 1,001,670 |
| Windstream Services LLC/Corp.(b),(n) |
| Tranche B6 Term Loan |
3-month USD LIBOR + 4.000%
03/29/2021 | 6.060% | | 602,976 | 560,768 |
| Total | 3,133,145 |
Total Senior Loans
(Cost $231,214,974) | 228,711,492 |
|
The accompanying Notes to Financial Statements are an integral part of this statement.
| 38 | Columbia Strategic Income Fund | Annual Report 2018 |
Portfolio of Investments (continued)
August 31, 2018
| Treasury Bills(i) 0.6% |
| Issuer | Effective
Yield | | Principal
Amount ($) | Value ($) |
| Egypt 0.4% |
| Egypt Treasury Bills |
| 12/11/2018 | 18.960% | EGP | 360,000,000 | 19,174,492 |
| Nigeria 0.2% |
| Nigeria Treasury Bills |
| 01/17/2019 | 12.640% | NGN | 1,750,000,000 | 4,612,820 |
| 03/14/2019 | 12.850% | NGN | 1,514,953,000 | 3,916,569 |
| Total | 8,529,389 |
Total Treasury Bills
(Cost $27,805,222) | 27,703,881 |
| Money Market Funds 6.1% |
| | Shares | Value ($) |
| Columbia Short-Term Cash Fund, 2.058%(q),(r) | 266,189,567 | 266,162,948 |
Total Money Market Funds
(Cost $266,181,111) | 266,162,948 |
Total Investments in Securities
(Cost: $4,684,118,945) | 4,602,294,346 |
| Other Assets & Liabilities, Net | | (239,400,137) |
| Net Assets | 4,362,894,209 |
At August 31, 2018, securities and/or cash totaling $31,400,880 were pledged as collateral.
Investments in derivatives
| Forward foreign currency exchange contracts |
Currency to
be sold | Currency to
be purchased | Counterparty | Settlement
date | Unrealized
appreciation ($) | Unrealized
depreciation ($) |
| 61,981,000 EUR | 72,167,143 USD | Credit Suisse | 10/11/2018 | 26,350 | — |
| 16,290,000 EUR | 18,906,973 USD | Credit Suisse | 10/11/2018 | — | (53,248) |
| 10,807,106 USD | 14,866,000 AUD | Credit Suisse | 10/11/2018 | — | (120,028) |
| 10,018,572 USD | 83,360,000 NOK | Credit Suisse | 10/11/2018 | — | (64,058) |
| 23,300,000 CAD | 18,046,655 USD | Goldman Sachs | 10/11/2018 | 179,734 | — |
| 9,730,175 USD | 81,000,000 NOK | JPMorgan | 10/11/2018 | — | (57,482) |
| 371,000,000 MXN | 19,618,886 USD | Morgan Stanley | 10/11/2018 | 311,899 | — |
| 9,907,110 USD | 82,500,000 NOK | Morgan Stanley | 10/11/2018 | — | (55,293) |
| 1,131,974 USD | 16,326,000 ZAR | TD Securities | 10/11/2018 | — | (26,531) |
| 377,600,000 ZAR | 26,506,616 USD | TD Securities | 10/11/2018 | 939,109 | — |
| Total | | | | 1,457,092 | (376,640) |
| Long futures contracts |
| Description | Number of
contracts | Expiration
date | Trading
currency | Notional
amount | Value/Unrealized
appreciation ($) | Value/Unrealized
depreciation ($) |
| Euro-BTP | 528 | 12/2018 | EUR | 65,111,117 | — | (326,553) |
| U.S. Treasury 10-Year Note | 4,100 | 12/2018 | USD | 495,143,634 | 1,112,276 | — |
| Total | | | | | 1,112,276 | (326,553) |
| Short futures contracts |
| Description | Number of
contracts | Expiration
date | Trading
currency | Notional
amount | Value/Unrealized
appreciation ($) | Value/Unrealized
depreciation ($) |
| Euro-Bobl | (6,098) | 12/2018 | EUR | (808,600,837) | — | (2,758,348) |
| Euro-Bund | (422) | 12/2018 | EUR | (68,044,073) | — | (546,698) |
| Long Gilt | (861) | 12/2018 | GBP | (107,412,479) | 342,034 | — |
| U.S. Treasury 2-Year Note | (1,914) | 12/2018 | USD | (406,219,455) | — | (122,584) |
| U.S. Treasury 5-Year Note | (2,234) | 12/2018 | USD | (253,642,663) | — | (371,096) |
| U.S. Ultra Bond | (1,031) | 12/2018 | USD | (164,772,770) | 400,415 | — |
| Total | | | | | 742,449 | (3,798,726) |
The accompanying Notes to Financial Statements are an integral part of this statement.
Columbia Strategic Income Fund | Annual Report 2018
| 39 |
Portfolio of Investments (continued)
August 31, 2018
| Call option contracts written |
| Description | Counterparty | Trading
currency | Notional
amount | Number of
contracts | Exercise
price/Rate | Expiration
date | Premium
received ($) | Value ($) |
| 3-Year OTC interest rate swap with Citi to receive 3-Month USD LIBOR BBA and pay exercise rate | Citi | USD | (350,000,000) | (350,000,000) | 2.75 | 2/20/2019 | (1,032,500) | (978,775) |
| 3-Year OTC interest rate swap with Morgan Stanley to receive 3-Month USD LIBOR BBA and pay exercise rate | Morgan Stanley | USD | (350,000,000) | (350,000,000) | 2.75 | 2/22/2019 | (1,085,000) | (994,105) |
| Total | | | | | | | (2,117,500) | (1,972,880) |
| Cleared interest rate swap contracts |
| Fund receives | Fund pays | Payment
frequency | Counterparty | Maturity
date | Notional
currency | Notional
amount | Value
($) | Upfront
payments
($) | Upfront
receipts
($) | Unrealized
appreciation
($) | Unrealized
depreciation
($) |
| Fixed rate of 2.740% | 3-Month USD LIBOR | Receives Semi annually, Pays Quarterly | Morgan Stanley | 02/16/2023 | USD | 337,700,000 | (1,988,431) | — | — | — | (1,988,431) |
| Fixed rate of 6.230% | 28-Day MXN TIIE-Banxico | Receives Monthly, Pays Monthly | Morgan Stanley | 01/09/2026 | MXN | 580,000,000 | (3,212,352) | — | — | — | (3,212,352) |
| Fixed rate of 5.985% | 28-Day MXN TIIE-Banxico | Receives Monthly, Pays Monthly | Morgan Stanley | 01/21/2026 | MXN | 211,000,000 | (1,338,700) | — | — | — | (1,338,700) |
| Total | | | | | | | (6,539,483) | — | — | — | (6,539,483) |
| Credit default swap contracts - buy protection |
Reference
entity | Counterparty | Maturity
date | Pay
fixed
rate
(%) | Payment
frequency | Notional
currency | Notional
amount | Value
($) | Periodic
payments
receivable
(payable)
($) | Upfront
payments
($) | Upfront
receipts
($) | Unrealized
appreciation
($) | Unrealized
depreciation
($) |
| Markit CMBX North America Index, Series 10 BBB- | Citi | 11/17/2059 | 3.000 | Monthly | USD | 24,000,000 | 1,661,578 | (14,001) | 1,542,882 | — | 104,695 | — |
| Markit CMBX North America Index, Series 10 BBB- | Citi | 11/17/2059 | 3.000 | Monthly | USD | 11,500,000 | 796,173 | (6,709) | 788,991 | — | 473 | — |
| Markit CMBX North America Index, Series 10 BBB- | Credit Suisse | 11/17/2059 | 3.000 | Monthly | USD | 24,000,000 | 1,661,578 | (14,001) | 1,805,141 | — | — | (157,564) |
| Markit CMBX North America Index, Series 10 BBB- | JPMorgan | 11/17/2059 | 3.000 | Monthly | USD | 9,625,000 | 666,362 | (5,615) | 614,267 | — | 46,480 | — |
| Markit CMBX North America Index, Series 11 BBB- | Morgan Stanley | 11/18/2054 | 3.000 | Monthly | USD | 23,000,000 | 1,768,125 | (13,416) | 1,697,439 | — | 57,270 | — |
| Total | | | | | | | | (53,742) | 6,448,720 | — | 208,918 | (157,564) |
| Cleared credit default swap contracts - buy protection |
Reference
entity | Counterparty | Maturity
date | Pay
fixed
rate
(%) | Payment
frequency | Notional
currency | Notional
amount | Value
($) | Upfront
payments
($) | Upfront
receipts
($) | Unrealized
appreciation
($) | Unrealized
depreciation
($) |
| Markit CDX North America High Yield Index, Series 30 | Morgan Stanley | 06/20/2023 | 5.000 | Quarterly | USD | 261,900,000 | (5,660,984) | — | — | — | (5,660,984) |
| Credit default swap contracts - sell protection |
Reference
entity | Counterparty | Maturity
date | Receive
fixed
rate
(%) | Payment
frequency | Implied
credit
spread
(%)* | Notional
currency | Notional
amount | Value
($) | Periodic
payments
receivable
(payable)
($) | Upfront
payments
($) | Upfront
receipts
($) | Unrealized
appreciation
($) | Unrealized
depreciation
($) |
| Markit CMBX North America Index, Series 7 BBB- | Credit Suisse | 01/17/2047 | 3.000 | Monthly | 4.516 | USD | 10,000,000 | (649,680) | 5,834 | — | (1,554,924) | 911,078 | — |
The accompanying Notes to Financial Statements are an integral part of this statement.
| 40 | Columbia Strategic Income Fund | Annual Report 2018 |
Portfolio of Investments (continued)
August 31, 2018
| * | Implied credit spreads, represented in absolute terms, utilized in determining the market value of credit default swap agreements on corporate or sovereign issues as of period end serve as an indicator of the current status of the payment/performance risk and represent the likelihood or risk of default for the credit derivative. The implied credit spread of a particular referenced entity reflects the cost of buying/selling protection and may include upfront payments required to be made to enter into the agreement. Wider credit spreads represent a deterioration of the referenced entity’s credit soundness and a greater likelihood or risk of default or other credit event occurring as defined under the terms of the agreement. |
Notes to Portfolio of Investments
| (a) | Represents privately placed and other securities and instruments exempt from SEC registration (collectively, private placements), such as Section 4(a)(2) and Rule 144A eligible securities, which are often sold only to qualified institutional buyers. The Fund may invest in private placements determined to be liquid as well as those determined to be illiquid. Private placements may be determined to be liquid under guidelines established by the Fund’s Board of Trustees. At August 31, 2018, the total value of these securities amounted to $2,344,680,160, which represents 53.74% of total net assets. |
| (b) | Variable rate security. The interest rate shown was the current rate as of August 31, 2018. |
| (c) | Valuation based on significant unobservable inputs. |
| (d) | Represents shares owned in the residual interest of an asset-backed securitization. |
| (e) | Represents fair value as determined in good faith under procedures approved by the Board of Trustees. At August 31, 2018, the total value of these securities amounted to $26,490,131, which represents 0.61% of total net assets. |
| (f) | Zero coupon bond. |
| (g) | Variable or floating rate security, the interest rate of which adjusts periodically based on changes in current interest rates and prepayments on the underlying pool of assets. The interest rate shown was the current rate as of August 31, 2018. |
| (h) | Non-income producing investment. |
| (i) | Principal amounts are denominated in United States Dollars unless otherwise noted. |
| (j) | Represents a variable rate security with a step coupon where the rate adjusts according to a schedule for a series of periods, typically lower for an initial period and then increasing to a higher coupon rate thereafter. The interest rate shown was the current rate as of August 31, 2018. |
| (k) | Principal and interest may not be guaranteed by the government. |
| (l) | Represents interest only securities which have the right to receive the monthly interest payments on an underlying pool of mortgage loans. |
| (m) | Represents a security purchased on a when-issued basis. |
| (n) | The stated interest rate represents the weighted average interest rate at August 31, 2018 of contracts within the senior loan facility. Interest rates on contracts are primarily determined either weekly, monthly or quarterly by reference to the indicated base lending rate and spread and the reset period. These base lending rates are primarily the London Interbank Offered Rate (“LIBOR”) and other short-term rates. Base lending rates may be subject to a floor or minimum rate. The interest rate for senior loans purchased on a when-issued or delayed delivery basis will be determined upon settlement, therefore no interest rate is disclosed. Senior loans often require prepayments from excess cash flows or permit the borrowers to repay at their election. The degree to which borrowers repay, cannot be predicted with accuracy. As a result, remaining maturities of senior loans may be less than the stated maturities. |
| (o) | Represents a security purchased on a forward commitment basis. |
| (p) | Represents securities that have defaulted on payment of interest. The Fund has stopped accruing interest on these securities. At August 31, 2018, the total value of these securities amounted to $840,053, which represents 0.02% of total net assets. |
| (q) | The rate shown is the seven-day current annualized yield at August 31, 2018. |
| (r) | As defined in the Investment Company Act of 1940, an affiliated company is one in which the Fund owns 5% or more of the company’s outstanding voting securities, or a company which is under common ownership or control with the Fund. Holdings and transactions in these affiliated companies during the year ended August 31, 2018 are as follows: |
| Issuer | Beginning
shares | Shares
purchased | Shares
sold | Ending
shares | Realized gain
(loss) —
affiliated
issuers ($) | Net change in
unrealized
appreciation
(depreciation) —
affiliated
issuers ($) | Dividends —
affiliated
issuers ($) | Value —
affiliated
issuers
at end of
period ($) |
| Columbia Short-Term Cash Fund, 2.058% |
| | 237,155,963 | 1,675,126,167 | (1,646,092,563) | 266,189,567 | (8,624) | (16,602) | 2,898,561 | 266,162,948 |
Abbreviation Legend
| CMO | Collateralized Mortgage Obligation |
| PIK | Payment In Kind |
| STRIPS | Separate Trading of Registered Interest and Principal Securities |
The accompanying Notes to Financial Statements are an integral part of this statement.
Columbia Strategic Income Fund | Annual Report 2018
| 41 |
Portfolio of Investments (continued)
August 31, 2018
Currency Legend
| AUD | Australian Dollar |
| BRL | Brazilian Real |
| CAD | Canada Dollar |
| DOP | Dominican Republic Peso |
| EGP | Egyptian Pound |
| EUR | Euro |
| GBP | British Pound |
| MXN | Mexican Peso |
| NGN | Nigerian Naira |
| NOK | Norwegian Krone |
| USD | US Dollar |
| ZAR | South African Rand |
Fair value measurements
The Fund categorizes its fair value measurements according to a three-level hierarchy that maximizes the use of observable inputs and minimizes the use of unobservable inputs by prioritizing that the most observable input be used when available. Observable inputs are those that market participants would use in pricing an investment based on market data obtained from sources independent of the reporting entity. Unobservable inputs are those that reflect the Fund’s assumptions about the information market participants would use in pricing an investment. An investment’s level within the fair value hierarchy is based on the lowest level of any input that is deemed significant to the asset’s or liability’s fair value measurement. The input levels are not necessarily an indication of the risk or liquidity associated with investments at that level. For example, certain U.S. government securities are generally high quality and liquid, however, they are reflected as Level 2 because the inputs used to determine fair value may not always be quoted prices in an active market.
Fair value inputs are summarized in the three broad levels listed below:
| ■ | Level 1 — Valuations based on quoted prices for investments in active markets that the Fund has the ability to access at the measurement date. Valuation adjustments are not applied to Level 1 investments. |
| ■ | Level 2 — Valuations based on other significant observable inputs (including quoted prices for similar securities, interest rates, prepayment speeds, credit risks, etc.). |
| ■ | Level 3 — Valuations based on significant unobservable inputs (including the Fund’s own assumptions and judgment in determining the fair value of investments). |
Inputs that are used in determining fair value of an investment may include price information, credit data, volatility statistics, and other factors. These inputs can be either observable or unobservable. The availability of observable inputs can vary between investments, and is affected by various factors such as the type of investment, and the volume and level of activity for that investment or similar investments in the marketplace. The inputs will be considered by the Investment Manager, along with any other relevant factors in the calculation of an investment’s fair value. The Fund uses prices and inputs that are current as of the measurement date, which may include periods of market dislocations. During these periods, the availability of prices and inputs may be reduced for many investments. This condition could cause an investment to be reclassified between the various levels within the hierarchy.
Certain investments that have been measured at fair value using the net asset value (NAV) per share (or its equivalent) are not categorized in the fair value hierarchy. The fair value amounts presented in the table are intended to reconcile the fair value hierarchy to the amounts presented in the Portfolio of Investments. The Columbia Short-Term Cash Fund seeks to provide shareholders with maximum current income consistent with liquidity and stability of principal. Columbia Short-Term Cash Fund prices its shares with a floating NAV and no longer seeks to maintain a stable NAV.
Investments falling into the Level 3 category are primarily supported by quoted prices from brokers and dealers participating in the market for those investments. However, these may be classified as Level 3 investments due to lack of market transparency and corroboration to support these quoted prices. Additionally, valuation models may be used as the pricing source for any remaining investments classified as Level 3. These models may rely on one or more significant unobservable inputs and/or significant assumptions by the Investment Manager. Inputs used in valuations may include, but are not limited to, financial statement analysis, capital account balances, discount rates and estimated cash flows, and comparable company data.
Under the direction of the Fund’s Board of Trustees (the Board), the Investment Manager’s Valuation Committee (the Committee) is responsible for overseeing the valuation procedures approved by the Board. The Committee consists of voting and non-voting members from various groups within the Investment Manager’s organization, including operations and accounting, trading and investments, compliance, risk management and legal.
The Committee meets at least monthly to review and approve valuation matters, which may include a description of specific valuation determinations, data regarding pricing information received from approved pricing vendors and brokers and the results of Board-approved valuation control policies and procedures (the Policies). The Policies address, among other things, instances when market quotations are or are not readily available, including recommendations of third party pricing vendors and a determination of appropriate pricing methodologies; events that require specific valuation determinations and assessment of fair value techniques; securities with a potential for stale pricing, including those that are illiquid, restricted, or in default; and the effectiveness of third party pricing vendors, including periodic reviews of vendors. The Committee meets more frequently, as needed, to discuss additional valuation matters, which may include the need to review back-testing results, review time-sensitive information or approve related valuation actions. The Committee reports to the Board, with members of the Committee meeting with the Board at each of its regularly scheduled meetings to discuss valuation matters and actions during the period, similar to those described earlier.
For investments categorized as Level 3, the Committee monitors information similar to that described above, which may include: (i) data specific to the issuer or comparable issuers, (ii) general market or specific sector news and (iii) quoted prices and specific or similar security transactions. The Committee considers this data and any changes from prior periods in order to assess the reasonableness of observable and unobservable inputs, any assumptions or internal models used to value those securities and changes in fair value. This data is also used to corroborate, when available, information received from approved pricing vendors and brokers. Various factors impact the frequency of monitoring this information (which may occur as often as daily). However, the Committee may determine that changes to inputs, assumptions and models are not required as a result of the monitoring procedures performed.
The accompanying Notes to Financial Statements are an integral part of this statement.
| 42 | Columbia Strategic Income Fund | Annual Report 2018 |
Portfolio of Investments (continued)
August 31, 2018
Fair value measurements (continued)
The following table is a summary of the inputs used to value the Fund’s investments at August 31, 2018:
| | Level 1
quoted prices
in active
markets for
identical
assets ($) | Level 2
other
significant
observable
inputs ($) | Level 3
significant
unobservable
inputs ($) | Investments
measured at
net asset
value ($) | Total ($) |
| Investments in Securities | | | | | |
| Asset-Backed Securities — Non-Agency | — | 403,927,702 | 35,696,430 | — | 439,624,132 |
| Commercial Mortgage-Backed Securities - Non-Agency | — | 223,144,925 | — | — | 223,144,925 |
| Common Stocks | | | | | |
| Consumer Discretionary | 376,592 | — | — | — | 376,592 |
| Energy | — | 454,513 | — | — | 454,513 |
| Materials | 432,296 | — | 81,862 | — | 514,158 |
| Telecommunication Services | 3,900 | — | — | — | 3,900 |
| Utilities | 516,114 | 15,622 | — | — | 531,736 |
| Total Common Stocks | 1,328,902 | 470,135 | 81,862 | — | 1,880,899 |
| Corporate Bonds & Notes | — | 1,814,559,582 | — | — | 1,814,559,582 |
| Foreign Government Obligations | — | 456,743,477 | — | — | 456,743,477 |
| Inflation-Indexed Bonds | — | 6,723,361 | — | — | 6,723,361 |
| Residential Mortgage-Backed Securities - Agency | — | 436,592,285 | — | — | 436,592,285 |
| Residential Mortgage-Backed Securities - Non-Agency | — | 682,004,240 | 18,443,124 | — | 700,447,364 |
| Senior Loans | — | 219,522,548 | 9,188,944 | — | 228,711,492 |
| Treasury Bills | — | 27,703,881 | — | — | 27,703,881 |
| Money Market Funds | — | — | — | 266,162,948 | 266,162,948 |
| Total Investments in Securities | 1,328,902 | 4,271,392,136 | 63,410,360 | 266,162,948 | 4,602,294,346 |
| Investments in Derivatives | | | | | |
| Asset | | | | | |
| Forward Foreign Currency Exchange Contracts | — | 1,457,092 | — | — | 1,457,092 |
| Futures Contracts | 1,854,725 | — | — | — | 1,854,725 |
| Swap Contracts | — | 1,119,996 | — | — | 1,119,996 |
| Liability | | | | | |
| Forward Foreign Currency Exchange Contracts | — | (376,640) | — | — | (376,640) |
| Futures Contracts | (4,125,279) | — | — | — | (4,125,279) |
| Options Contracts Written | — | (1,972,880) | — | — | (1,972,880) |
| Swap Contracts | — | (12,358,031) | — | — | (12,358,031) |
| Total | (941,652) | 4,259,261,673 | 63,410,360 | 266,162,948 | 4,587,893,329 |
See the Portfolio of Investments for all investment classifications not indicated in the table.
The Fund’s assets assigned to the Level 2 input category are generally valued using the market approach, in which a security’s value is determined through reference to prices and information from market transactions for similar or identical assets.
Forward foreign currency exchange contracts, futures contracts and swap contracts are valued at unrealized appreciation (depreciation).
There were no transfers of financial assets between Levels 1 and 2 during the period.
Financial assets were transferred from Level 2 to Level 3 due to utilizing a single market quotation from a broker dealer. As a result, management concluded that the market input(s) were generally unobservable.
Financial assets were transferred from Level 3 to Level 2 as observable market inputs were utilized and management determined that there was sufficient, reliable and observable market data to value these assets as of period end.
Transfers between levels are determined based on the fair value at the beginning of the period for security positions held throughout the period.
The accompanying Notes to Financial Statements are an integral part of this statement.
Columbia Strategic Income Fund | Annual Report 2018
| 43 |
Portfolio of Investments (continued)
August 31, 2018
Fair value measurements (continued)
The following table is a reconciliation of Level 3 assets for which significant observable and unobservable inputs were used to determine fair value:
| Investments in securities | Balance
as of
08/31/2017
($) | Increase
(decrease)
in accrued
discounts/
premiums
($) | Realized
gain (loss)
($) | Change
in unrealized
appreciation
(depreciation)(a)
($) | Purchases
($) | Sales
($) | Transfers
into
Level 3
($) | Transfers
out of
Level 3
($) | Balance
as of
08/31/2018
($) |
| Asset-Backed Securities — Non-Agency | 73,787,675 | 31,086 | 49 | (12,102,792) | 9,122,793 | (1,142,381) | - | (34,000,000) | 35,696,430 |
| Common Stocks | 59,865 | - | (231,616) | 184,200 | - | (40,357) | 109,770 | - | 81,862 |
| Corporate Bonds & Notes | 617,688 | 219 | (70,767) | 69,573 | - | (616,713) | - | - | - |
| Residential Mortgage-Backed Securities — Non-Agency | 191,455,658 | 119,931 | 26,524 | (180,598) | - | (101,643,589) | - | (71,334,802) | 18,443,124 |
| Senior Loans | 12,758,563 | (38,020) | 255,491 | (89,567) | 1,995,478 | (9,810,771) | 8,075,727 | (3,957,957) | 9,188,944 |
| Total | 278,679,449 | 113,216 | (20,319) | (12,119,184) | 11,118,271 | (113,253,811) | 8,185,497 | (109,292,759) | 63,410,360 |
(a) Change in unrealized appreciation (depreciation) relating to securities held at August 31, 2018 was $(12,095,263), which is comprised of Asset-Backed Securities — Non-Agency of $(12,107,450), Common Stocks of $(27,908), Residential Mortgage-Backed Securities — Non-Agency of $28,208 and Senior Loans of $11,887.
The Fund’s assets assigned to the Level 3 category are valued utilizing the valuation technique deemed the most appropriate in the circumstances. Certain common stocks, residential mortgage backed securities, asset backed securities and senior loans classified as Level 3 securities are valued using the market approach and utilize single market quotations from broker dealers which may have included, but were not limited to, observable transactions for identical or similar assets in the market and the distressed nature of the security. The appropriateness of fair values for these securities is monitored on an ongoing basis which may include results of back testing, manual price reviews and other control procedures. Significant increases (decreases) to any of these inputs would result in a significantly lower (higher) fair value measurement.
The accompanying Notes to Financial Statements are an integral part of this statement.
| 44 | Columbia Strategic Income Fund | Annual Report 2018 |
Statement of Assets and Liabilities
August 31, 2018
| Assets | |
| Investments in securities, at value | |
| Unaffiliated issuers (cost $4,417,937,834) | $4,336,131,398 |
| Affiliated issuers (cost $266,181,111) | 266,162,948 |
| Cash | 1,972,670 |
| Foreign currency (cost $33,778) | 33,948 |
| Cash collateral held at broker for: | |
| Swap contracts | 1,002,000 |
| Margin deposits on: | |
| Futures contracts | 14,943,022 |
| Swap contracts | 15,455,858 |
| Unrealized appreciation on forward foreign currency exchange contracts | 1,457,092 |
| Unrealized appreciation on swap contracts | 1,119,996 |
| Upfront payments on swap contracts | 6,448,720 |
| Receivable for: | |
| Investments sold | 10,886,833 |
| Investments sold on a delayed delivery basis | 28,433,323 |
| Capital shares sold | 5,584,229 |
| Dividends | 359,351 |
| Interest | 37,664,135 |
| Foreign tax reclaims | 316,459 |
| Variation margin for futures contracts | 545,094 |
| Variation margin for swap contracts | 357,017 |
| Prepaid expenses | 27,292 |
| Trustees’ deferred compensation plan | 276,092 |
| Total assets | 4,729,177,477 |
| Liabilities | |
| Option contracts written, at value (premiums received $2,117,500) | 1,972,880 |
| Unrealized depreciation on forward foreign currency exchange contracts | 376,640 |
| Unrealized depreciation on swap contracts | 157,564 |
| Upfront receipts on swap contracts | 1,554,924 |
| Payable for: | |
| Investments purchased | 5,855,303 |
| Investments purchased on a delayed delivery basis | 347,556,616 |
| Capital shares purchased | 6,195,002 |
| Variation margin for futures contracts | 1,315,260 |
| Variation margin for swap contracts | 264,731 |
| Management services fees | 67,090 |
| Distribution and/or service fees | 15,767 |
| Transfer agent fees | 385,824 |
| Compensation of board members | 60,236 |
| Compensation of chief compliance officer | 278 |
| Other expenses | 229,061 |
| Trustees’ deferred compensation plan | 276,092 |
| Total liabilities | 366,283,268 |
| Net assets applicable to outstanding capital stock | $4,362,894,209 |
| Represented by | |
| Paid in capital | 4,405,619,264 |
| Undistributed net investment income | 29,869,724 |
| Accumulated net realized gain | 21,601,915 |
| Unrealized appreciation (depreciation) on: | |
| Investments - unaffiliated issuers | (81,806,436) |
| Investments - affiliated issuers | (18,163) |
| Foreign currency translations | (88,578) |
| Forward foreign currency exchange contracts | 1,080,452 |
| Futures contracts | (2,270,554) |
| Options contracts written | 144,620 |
| Swap contracts | (11,238,035) |
| Total - representing net assets applicable to outstanding capital stock | $4,362,894,209 |
The accompanying Notes to Financial Statements are an integral part of this statement.
Columbia Strategic Income Fund | Annual Report 2018
| 45 |
Statement of Assets and Liabilities (continued)
August 31, 2018
| Class A | |
| Net assets | $1,059,907,235 |
| Shares outstanding | 179,880,144 |
| Net asset value per share | $5.89 |
| Maximum sales charge | 4.75% |
| Maximum offering price per share (calculated by dividing the net asset value per share by 1.0 minus the maximum sales charge for Class A shares) | $6.18 |
| Advisor Class | |
| Net assets | $143,983,237 |
| Shares outstanding | 24,870,075 |
| Net asset value per share | $5.79 |
| Class C | |
| Net assets | $306,302,796 |
| Shares outstanding | 51,979,327 |
| Net asset value per share | $5.89 |
| Institutional Class | |
| Net assets | $2,398,467,949 |
| Shares outstanding | 413,863,032 |
| Net asset value per share | $5.80 |
| Institutional 2 Class | |
| Net assets | $257,953,310 |
| Shares outstanding | 44,485,663 |
| Net asset value per share | $5.80 |
| Institutional 3 Class | |
| Net assets | $189,194,550 |
| Shares outstanding | 32,737,657 |
| Net asset value per share | $5.78 |
| Class R | |
| Net assets | $7,075,416 |
| Shares outstanding | 1,192,822 |
| Net asset value per share | $5.93 |
| Class T | |
| Net assets | $9,716 |
| Shares outstanding | 1,650 |
| Net asset value per share | $5.89 |
| Maximum sales charge | 2.50% |
| Maximum offering price per share (calculated by dividing the net asset value per share by 1.0 minus the maximum sales charge per transaction for Class T shares) | $6.04 |
The accompanying Notes to Financial Statements are an integral part of this statement.
| 46 | Columbia Strategic Income Fund | Annual Report 2018 |
Statement of Operations
Year Ended August 31, 2018
| Net investment income | |
| Income: | |
| Dividends — unaffiliated issuers | $15,003,662 |
| Dividends — affiliated issuers | 2,898,561 |
| Interest | 183,348,150 |
| Foreign taxes withheld | (185,686) |
| Total income | 201,064,687 |
| Expenses: | |
| Management services fees | 23,126,723 |
| Distribution and/or service fees | |
| Class A | 2,734,833 |
| Class C | 3,375,633 |
| Class R | 35,229 |
| Class T | 25 |
| Transfer agent fees | |
| Class A | 1,067,552 |
| Advisor Class | 120,622 |
| Class C | 329,216 |
| Institutional Class | 2,125,064 |
| Institutional 2 Class | 120,783 |
| Institutional 3 Class | 9,517 |
| Class K | 23 |
| Class R | 6,878 |
| Class T | 8 |
| Plan administration fees | |
| Class K | 113 |
| Compensation of board members | 81,506 |
| Custodian fees | 196,806 |
| Printing and postage fees | 293,894 |
| Registration fees | 381,660 |
| Audit fees | 66,389 |
| Legal fees | 97,066 |
| Interest on collateral | 37,741 |
| Compensation of chief compliance officer | 1,615 |
| Other | 180,617 |
| Total expenses | 34,389,513 |
| Fees waived by transfer agent | |
| Institutional 2 Class | (1,884) |
| Institutional 3 Class | (2,050) |
| Class K | (1) |
| Expense reduction | (3,500) |
| Total net expenses | 34,382,078 |
| Net investment income | 166,682,609 |
The accompanying Notes to Financial Statements are an integral part of this statement.
Columbia Strategic Income Fund | Annual Report 2018
| 47 |
Statement of Operations (continued)
Year Ended August 31, 2018
| Realized and unrealized gain (loss) — net | |
| Net realized gain (loss) on: | |
| Investments — unaffiliated issuers | $14,186,491 |
| Investments — affiliated issuers | (8,624) |
| Foreign currency translations | (525,502) |
| Forward foreign currency exchange contracts | 4,998,723 |
| Futures contracts | 1,567,123 |
| Options purchased | 13,131,409 |
| Options contracts written | 1,958,000 |
| Swap contracts | 198,565 |
| Net realized gain | 35,506,185 |
| Net change in unrealized appreciation (depreciation) on: | |
| Investments — unaffiliated issuers | (156,523,491) |
| Investments — affiliated issuers | (16,602) |
| Foreign currency translations | (439,472) |
| Forward foreign currency exchange contracts | 1,193,117 |
| Futures contracts | 1,332,077 |
| Options purchased | 852,009 |
| Options contracts written | 144,620 |
| Swap contracts | (3,021,495) |
| Net change in unrealized appreciation (depreciation) | (156,479,237) |
| Net realized and unrealized loss | (120,973,052) |
| Net increase in net assets resulting from operations | $45,709,557 |
The accompanying Notes to Financial Statements are an integral part of this statement.
| 48 | Columbia Strategic Income Fund | Annual Report 2018 |
Statement of Changes in Net Assets
| | Year Ended
August 31, 2018 | Year Ended
August 31, 2017 (a) | Year Ended
October 31, 2016 |
| Operations | | | |
| Net investment income | $166,682,609 | $113,851,078 | $101,325,009 |
| Net realized gain (loss) | 35,506,185 | 12,041,423 | (29,148,571) |
| Net change in unrealized appreciation (depreciation) | (156,479,237) | 17,552,054 | 105,145,354 |
| Net increase in net assets resulting from operations | 45,709,557 | 143,444,555 | 177,321,792 |
| Distributions to shareholders | | | |
| Net investment income | | | |
| Class A | (36,783,334) | (32,253,534) | (52,011,573) |
| Advisor Class | (4,542,419) | (1,784,601) | (1,079,659) |
| Class B | — | (44,993) | (176,258) |
| Class C | (8,829,242) | (5,585,037) | (6,559,934) |
| Institutional Class | (80,040,757) | (35,240,382) | (24,493,759) |
| Institutional 2 Class | (8,090,127) | (3,380,935) | (2,035,362) |
| Institutional 3 Class | (6,090,722) | (568,568) | (429,162) |
| Class K | (1,541) | (2,031) | (3,006) |
| Class R | (218,449) | (125,666) | (113,353) |
| Class T | (333) | (231) | (314) |
| Net realized gains | | | |
| Class A | (10,886,907) | — | — |
| Advisor Class | (1,096,130) | — | — |
| Class C | (3,422,323) | — | — |
| Institutional Class | (20,637,145) | — | — |
| Institutional 2 Class | (1,834,492) | — | — |
| Institutional 3 Class | (1,513,560) | — | — |
| Class K | (868) | — | — |
| Class R | (67,029) | — | — |
| Class T | (99) | — | — |
| Total distributions to shareholders | (184,055,477) | (78,985,978) | (86,902,380) |
| Increase in net assets from capital stock activity | 822,626,469 | 439,268,981 | 775,776,495 |
| Total increase in net assets | 684,280,549 | 503,727,558 | 866,195,907 |
| Net assets at beginning of year | 3,678,613,660 | 3,174,886,102 | 2,308,690,195 |
| Net assets at end of year | $4,362,894,209 | $3,678,613,660 | $3,174,886,102 |
| Undistributed net investment income | $29,869,724 | $13,434,696 | $1,044,653 |
| (a) | For the period from November 1, 2016 to August 31, 2017. During the period, the Fund’s fiscal year end was changed from October 31 to August 31. |
The accompanying Notes to Financial Statements are an integral part of this statement.
Columbia Strategic Income Fund | Annual Report 2018
| 49 |
Statement of Changes in Net Assets (continued)
| | Year Ended | Year Ended | Year Ended |
| | August 31, 2018 | August 31, 2017 (a) | October 31, 2016 |
| | Shares | Dollars ($) | Shares | Dollars ($) | Shares | Dollars ($) |
| Capital stock activity |
| Class A | | | | | | |
| Subscriptions | 44,188,454 | 265,433,665 | 65,505,955 | 391,489,911 | 116,785,483 | 675,723,346 |
| Distributions reinvested | 7,388,374 | 44,254,936 | 5,073,556 | 30,238,572 | 8,440,437 | 48,688,323 |
| Redemptions | (52,463,421) | (314,442,008) | (186,149,836) | (1,106,962,799) | (81,299,032) | (469,359,257) |
| Net increase (decrease) | (886,593) | (4,753,407) | (115,570,325) | (685,234,316) | 43,926,888 | 255,052,412 |
| Advisor Class | | | | | | |
| Subscriptions | 15,537,079 | 91,567,323 | 10,344,320 | 61,170,118 | 8,100,635 | 46,580,937 |
| Distributions reinvested | 951,595 | 5,592,213 | 302,635 | 1,783,215 | 188,910 | 1,079,316 |
| Redemptions | (8,305,133) | (48,991,987) | (3,057,053) | (17,968,120) | (2,462,481) | (14,059,309) |
| Net increase | 8,183,541 | 48,167,549 | 7,589,902 | 44,985,213 | 5,827,064 | 33,600,944 |
| Class B | | | | | | |
| Subscriptions | — | — | 14,935 | 89,225 | 70,969 | 409,109 |
| Distributions reinvested | — | — | 6,156 | 36,484 | 23,834 | 136,589 |
| Redemptions | — | — | (847,190) | (5,076,450) | (826,574) | (4,769,547) |
| Net decrease | — | — | (826,099) | (4,950,741) | (731,771) | (4,223,849) |
| Class C | | | | | | |
| Subscriptions | 13,698,047 | 82,517,615 | 14,114,450 | 84,502,366 | 22,508,267 | 130,730,626 |
| Distributions reinvested | 1,903,299 | 11,407,704 | 838,077 | 5,007,074 | 958,696 | 5,531,198 |
| Redemptions | (18,608,161) | (111,201,437) | (12,920,506) | (77,450,379) | (8,471,609) | (49,119,840) |
| Net increase (decrease) | (3,006,815) | (17,276,118) | 2,032,021 | 12,059,061 | 14,995,354 | 87,141,984 |
| Institutional Class | | | | | | |
| Subscriptions | 225,430,309 | 1,330,678,843 | 253,036,382 | 1,487,603,132 | 118,272,882 | 675,059,092 |
| Distributions reinvested | 15,128,358 | 89,046,746 | 4,957,658 | 29,267,700 | 2,860,008 | 16,316,983 |
| Redemptions | (140,624,281) | (828,503,098) | (98,930,646) | (583,649,834) | (67,032,087) | (377,844,889) |
| Net increase | 99,934,386 | 591,222,491 | 159,063,394 | 933,220,998 | 54,100,803 | 313,531,186 |
| Institutional 2 Class | | | | | | |
| Subscriptions | 28,917,724 | 170,670,100 | 14,271,742 | 84,108,174 | 17,074,109 | 97,770,835 |
| Distributions reinvested | 1,686,660 | 9,917,976 | 573,232 | 3,378,777 | 352,567 | 2,029,968 |
| Redemptions | (12,031,893) | (70,620,557) | (6,471,882) | (38,071,185) | (2,029,791) | (11,675,518) |
| Net increase | 18,572,491 | 109,967,519 | 8,373,092 | 49,415,766 | 15,396,885 | 88,125,285 |
| Institutional 3 Class | | | | | | |
| Subscriptions | 25,895,863 | 152,998,263 | 15,316,189 | 91,323,531 | 1,311,521 | 7,448,398 |
| Distributions reinvested | 645,851 | 3,784,883 | 64,287 | 377,991 | 75,667 | 428,016 |
| Redemptions | (10,563,193) | (62,268,549) | (434,951) | (2,565,657) | (1,454,095) | (8,338,628) |
| Net increase (decrease) | 15,978,521 | 94,514,597 | 14,945,525 | 89,135,865 | (66,907) | (462,214) |
| Class K | | | | | | |
| Distributions reinvested | 359 | 2,162 | 304 | 1,789 | 471 | 2,673 |
| Redemptions | (14,711) | (86,354) | — | — | (12,999) | (73,447) |
| Net increase (decrease) | (14,352) | (84,192) | 304 | 1,789 | (12,528) | (70,774) |
| Class R | | | | | | |
| Subscriptions | 728,790 | 4,392,048 | 679,723 | 4,098,076 | 657,958 | 3,849,456 |
| Distributions reinvested | 36,709 | 221,196 | 15,120 | 90,990 | 13,642 | 79,332 |
| Redemptions | (624,078) | (3,745,214) | (589,584) | (3,553,720) | (144,203) | (847,267) |
| Net increase | 141,421 | 868,030 | 105,259 | 635,346 | 527,397 | 3,081,521 |
| Total net increase | 138,902,600 | 822,626,469 | 75,713,073 | 439,268,981 | 133,963,185 | 775,776,495 |
| (a) | For the period from November 1, 2016 to August 31, 2017. During the period, the Fund’s fiscal year end was changed from October 31 to August 31. |
The accompanying Notes to Financial Statements are an integral part of this statement.
| 50 | Columbia Strategic Income Fund | Annual Report 2018 |
[THIS PAGE INTENTIONALLY LEFT BLANK]
Columbia Strategic Income Fund | Annual Report 2018
| 51 |
The following table is intended to help you understand the Fund’s financial performance. Certain information reflects financial results for a single share of a class held for the periods shown. Per share net investment income (loss) amounts are calculated based on average shares outstanding during the period. Total return assumes reinvestment of all dividends and distributions, if any. Total return does not reflect payment of sales charges, if any. Total return and portfolio turnover are not annualized for periods of less than one year. The portfolio turnover rate is calculated without regard to purchase and sales transactions of short-term instruments and certain derivatives, if any. If such transactions were included, the Fund’s portfolio turnover rate may be higher.
| | Net asset value,
beginning of
period | Net
investment
income | Net
realized
and
unrealized
gain (loss) | Total from
investment
operations | Distributions
from net
investment
income | Distributions
from net
realized
gains | Total
distributions to
shareholders |
| Class A |
| Year Ended 8/31/2018 | $6.09 | 0.24 | (0.18) | 0.06 | (0.20) | (0.06) | (0.26) |
| Year Ended 8/31/2017(e) | $5.97 | 0.20 | 0.06 | 0.26 | (0.14) | — | (0.14) |
| Year Ended 10/31/2016 | $5.79 | 0.22 | 0.15 | 0.37 | (0.19) | — | (0.19) |
| Year Ended 10/31/2015 | $6.13 | 0.23 | (0.22) | 0.01 | (0.25) | (0.10) | (0.35) |
| Year Ended 10/31/2014 | $6.27 | 0.25 | 0.03 | 0.28 | (0.25) | (0.17) | (0.42) |
| Year Ended 10/31/2013 | $6.41 | 0.26 | (0.13) | 0.13 | (0.25) | (0.02) | (0.27) |
| Advisor Class |
| Year Ended 8/31/2018 | $5.99 | 0.25 | (0.17) | 0.08 | (0.22) | (0.06) | (0.28) |
| Year Ended 8/31/2017(e) | $5.88 | 0.21 | 0.05 | 0.26 | (0.15) | — | (0.15) |
| Year Ended 10/31/2016 | $5.70 | 0.23 | 0.16 | 0.39 | (0.21) | — | (0.21) |
| Year Ended 10/31/2015 | $6.04 | 0.24 | (0.21) | 0.03 | (0.27) | (0.10) | (0.37) |
| Year Ended 10/31/2014 | $6.18 | 0.26 | 0.03 | 0.29 | (0.26) | (0.17) | (0.43) |
| Year Ended 10/31/2013(h) | $6.34 | 0.27 | (0.15) | 0.12 | (0.26) | (0.02) | (0.28) |
| Class C |
| Year Ended 8/31/2018 | $6.09 | 0.19 | (0.17) | 0.02 | (0.16) | (0.06) | (0.22) |
| Year Ended 8/31/2017(e) | $5.97 | 0.17 | 0.05 | 0.22 | (0.10) | — | (0.10) |
| Year Ended 10/31/2016 | $5.79 | 0.18 | 0.15 | 0.33 | (0.15) | — | (0.15) |
| Year Ended 10/31/2015 | $6.13 | 0.19 | (0.22) | (0.03) | (0.21) | (0.10) | (0.31) |
| Year Ended 10/31/2014 | $6.27 | 0.22 | 0.02 | 0.24 | (0.21) | (0.17) | (0.38) |
| Year Ended 10/31/2013 | $6.41 | 0.22 | (0.13) | 0.09 | (0.21) | (0.02) | (0.23) |
| Institutional Class |
| Year Ended 8/31/2018 | $5.99 | 0.25 | (0.16) | 0.09 | (0.22) | (0.06) | (0.28) |
| Year Ended 8/31/2017(e) | $5.88 | 0.22 | 0.04 | 0.26 | (0.15) | — | (0.15) |
| Year Ended 10/31/2016 | $5.70 | 0.23 | 0.16 | 0.39 | (0.21) | — | (0.21) |
| Year Ended 10/31/2015 | $6.04 | 0.24 | (0.21) | 0.03 | (0.27) | (0.10) | (0.37) |
| Year Ended 10/31/2014 | $6.18 | 0.27 | 0.02 | 0.29 | (0.26) | (0.17) | (0.43) |
| Year Ended 10/31/2013 | $6.33 | 0.27 | (0.14) | 0.13 | (0.26) | (0.02) | (0.28) |
| Institutional 2 Class |
| Year Ended 8/31/2018 | $6.00 | 0.25 | (0.17) | 0.08 | (0.22) | (0.06) | (0.28) |
| Year Ended 8/31/2017(e) | $5.88 | 0.22 | 0.06 | 0.28 | (0.16) | — | (0.16) |
| Year Ended 10/31/2016 | $5.71 | 0.24 | 0.14 | 0.38 | (0.21) | — | (0.21) |
| Year Ended 10/31/2015 | $6.04 | 0.25 | (0.21) | 0.04 | (0.27) | (0.10) | (0.37) |
| Year Ended 10/31/2014 | $6.19 | 0.27 | 0.02 | 0.29 | (0.27) | (0.17) | (0.44) |
| Year Ended 10/31/2013 | $6.33 | 0.29 | (0.14) | 0.15 | (0.27) | (0.02) | (0.29) |
The accompanying Notes to Financial Statements are an integral part of this statement.
| 52 | Columbia Strategic Income Fund | Annual Report 2018 |
Financial Highlights (continued)
| | Net
asset
value,
end of
period | Total
Return | Total gross
expense
ratio to
average
net assets(a) | Total net
expense
ratio to
average
net assets(a),(b) | Net investment
income
ratio to
average
net assets | Portfolio
turnover | Net
assets,
end of
period
(000’s) |
| Class A |
| Year Ended 8/31/2018 | $5.89 | 1.03% | 0.94% (c) | 0.94% (c),(d) | 3.94% | 152% | $1,059,907 |
| Year Ended 8/31/2017(e) | $6.09 | 4.42% | 0.95% (f),(g) | 0.95% (d),(f),(g) | 4.00% (f) | 110% | $1,100,585 |
| Year Ended 10/31/2016 | $5.97 | 6.57% | 1.03% | 1.02% (d) | 3.81% | 168% | $1,770,085 |
| Year Ended 10/31/2015 | $5.79 | 0.25% | 1.06% | 1.03% (d) | 3.94% | 169% | $1,461,248 |
| Year Ended 10/31/2014 | $6.13 | 4.64% | 1.04% | 1.04% (d) | 4.14% | 124% | $1,313,683 |
| Year Ended 10/31/2013 | $6.27 | 2.01% | 1.03% | 1.03% (d) | 4.10% | 113% | $1,303,812 |
| Advisor Class |
| Year Ended 8/31/2018 | $5.79 | 1.30% | 0.69% (c) | 0.69% (c),(d) | 4.21% | 152% | $143,983 |
| Year Ended 8/31/2017(e) | $5.99 | 4.53% | 0.71% (f),(g) | 0.71% (d),(f),(g) | 4.38% (f) | 110% | $99,896 |
| Year Ended 10/31/2016 | $5.88 | 6.95% | 0.77% | 0.77% (d) | 4.02% | 168% | $53,447 |
| Year Ended 10/31/2015 | $5.70 | 0.52% | 0.82% | 0.78% (d) | 4.20% | 169% | $18,630 |
| Year Ended 10/31/2014 | $6.04 | 4.98% | 0.79% | 0.79% (d) | 4.36% | 124% | $5,683 |
| Year Ended 10/31/2013(h) | $6.18 | 1.97% | 0.80% (f) | 0.79% (d),(f) | 4.54% (f) | 113% | $3,389 |
| Class C |
| Year Ended 8/31/2018 | $5.89 | 0.28% | 1.69% (c) | 1.69% (c),(d) | 3.19% | 152% | $306,303 |
| Year Ended 8/31/2017(e) | $6.09 | 3.78% | 1.71% (f),(g) | 1.71% (d),(f),(g) | 3.33% (f) | 110% | $334,829 |
| Year Ended 10/31/2016 | $5.97 | 5.78% | 1.78% | 1.77% (d) | 3.05% | 168% | $316,346 |
| Year Ended 10/31/2015 | $5.79 | (0.49%) | 1.81% | 1.78% (d) | 3.19% | 169% | $219,782 |
| Year Ended 10/31/2014 | $6.13 | 4.00% | 1.79% | 1.66% (d) | 3.52% | 124% | $186,746 |
| Year Ended 10/31/2013 | $6.27 | 1.40% | 1.78% | 1.63% (d) | 3.50% | 113% | $221,063 |
| Institutional Class |
| Year Ended 8/31/2018 | $5.80 | 1.47% | 0.69% (c) | 0.69% (c),(d) | 4.20% | 152% | $2,398,468 |
| Year Ended 8/31/2017(e) | $5.99 | 4.53% | 0.71% (f),(g) | 0.71% (d),(f),(g) | 4.42% (f) | 110% | $1,881,221 |
| Year Ended 10/31/2016 | $5.88 | 6.95% | 0.78% | 0.77% (d) | 4.05% | 168% | $910,452 |
| Year Ended 10/31/2015 | $5.70 | 0.51% | 0.81% | 0.78% (d) | 4.19% | 169% | $574,482 |
| Year Ended 10/31/2014 | $6.04 | 4.97% | 0.79% | 0.79% (d) | 4.39% | 124% | $663,669 |
| Year Ended 10/31/2013 | $6.18 | 2.13% | 0.78% | 0.78% (d) | 4.34% | 113% | $755,920 |
| Institutional 2 Class |
| Year Ended 8/31/2018 | $5.80 | 1.35% | 0.65% (c) | 0.65% (c) | 4.26% | 152% | $257,953 |
| Year Ended 8/31/2017(e) | $6.00 | 4.77% | 0.66% (f),(g) | 0.65% (f),(g) | 4.41% (f) | 110% | $155,372 |
| Year Ended 10/31/2016 | $5.88 | 6.87% | 0.67% | 0.67% | 4.11% | 168% | $103,204 |
| Year Ended 10/31/2015 | $5.71 | 0.80% | 0.68% | 0.68% | 4.32% | 169% | $12,231 |
| Year Ended 10/31/2014 | $6.04 | 4.92% | 0.67% | 0.67% | 4.47% | 124% | $4,193 |
| Year Ended 10/31/2013 | $6.19 | 2.39% | 0.69% | 0.69% | 4.73% | 113% | $1,563 |
The accompanying Notes to Financial Statements are an integral part of this statement.
Columbia Strategic Income Fund | Annual Report 2018
| 53 |
Financial Highlights (continued)
| | Net asset value,
beginning of
period | Net
investment
income | Net
realized
and
unrealized
gain (loss) | Total from
investment
operations | Distributions
from net
investment
income | Distributions
from net
realized
gains | Total
distributions to
shareholders |
| Institutional 3 Class |
| Year Ended 8/31/2018 | $5.98 | 0.25 | (0.17) | 0.08 | (0.22) | (0.06) | (0.28) |
| Year Ended 8/31/2017(e) | $5.87 | 0.22 | 0.05 | 0.27 | (0.16) | — | (0.16) |
| Year Ended 10/31/2016 | $5.69 | 0.24 | 0.15 | 0.39 | (0.21) | — | (0.21) |
| Year Ended 10/31/2015 | $6.03 | 0.25 | (0.21) | 0.04 | (0.28) | (0.10) | (0.38) |
| Year Ended 10/31/2014 | $6.17 | 0.27 | 0.03 | 0.30 | (0.27) | (0.17) | (0.44) |
| Year Ended 10/31/2013(i) | $6.18 | 0.11 | (0.02) | 0.09 | (0.10) | — | (0.10) |
| Class R |
| Year Ended 8/31/2018 | $6.13 | 0.22 | (0.17) | 0.05 | (0.19) | (0.06) | (0.25) |
| Year Ended 8/31/2017(e) | $6.01 | 0.19 | 0.06 | 0.25 | (0.13) | — | (0.13) |
| Year Ended 10/31/2016 | $5.82 | 0.21 | 0.16 | 0.37 | (0.18) | — | (0.18) |
| Year Ended 10/31/2015 | $6.16 | 0.22 | (0.22) | 0.00 (j) | (0.24) | (0.10) | (0.34) |
| Year Ended 10/31/2014 | $6.30 | 0.24 | 0.02 | 0.26 | (0.23) | (0.17) | (0.40) |
| Year Ended 10/31/2013 | $6.44 | 0.25 | (0.14) | 0.11 | (0.23) | (0.02) | (0.25) |
| Class T |
| Year Ended 8/31/2018 | $6.08 | 0.24 | (0.17) | 0.07 | (0.20) | (0.06) | (0.26) |
| Year Ended 8/31/2017(e) | $5.97 | 0.20 | 0.05 | 0.25 | (0.14) | — | (0.14) |
| Year Ended 10/31/2016 | $5.78 | 0.22 | 0.16 | 0.38 | (0.19) | — | (0.19) |
| Year Ended 10/31/2015 | $6.12 | 0.23 | (0.22) | 0.01 | (0.25) | (0.10) | (0.35) |
| Year Ended 10/31/2014 | $6.26 | 0.25 | 0.03 | 0.28 | (0.25) | (0.17) | (0.42) |
| Year Ended 10/31/2013 | $6.41 | 0.27 | (0.15) | 0.12 | (0.25) | (0.02) | (0.27) |
| Notes to Financial Highlights |
| (a) | In addition to the fees and expenses that the Fund bears directly, the Fund indirectly bears a pro rata share of the fees and expenses of any other funds in which it invests. Such indirect expenses are not included in the Fund’s reported expense ratios. |
| (b) | Total net expenses include the impact of certain fee waivers/expense reimbursements made by the Investment Manager and certain of its affiliates, if applicable. |
| (c) | Ratios include interest on collateral expense which is less than 0.01%. |
| (d) | The benefits derived from expense reductions had an impact of less than 0.01%. |
| (e) | For the period from November 1, 2016 to August 31, 2017. During the period, the Fund’s fiscal year end was changed from October 31 to August 31. |
| (f) | Annualized. |
| (g) | Expenses have been reduced due to a reimbursement of expenses overbilled by a third party. If the reimbursement had been excluded, the expense ratios would have been higher by the percentages shown for each class in the table below. All fee waivers and expense reimbursements by the Investment Manager and its affiliates were applied before giving effect to this third party reimbursement. |
| Year Ended | Class A | Advisor
Class | Class C | Institutional
Class | Institutional 2
Class | Institutional 3
Class | Class R | Class T |
| 08/31/2017 | 0.01 % | 0.01 % | 0.01 % | 0.01 % | 0.01 % | 0.01 % | 0.01 % | 0.01 % |
| (h) | Advisor Class shares commenced operations on November 8, 2012. Per share data and total return reflect activity from that date. |
| (i) | Institutional 3 Class shares commenced operations on June 13, 2013. Per share data and total return reflect activity from that date. |
| (j) | Rounds to zero. |
The accompanying Notes to Financial Statements are an integral part of this statement.
| 54 | Columbia Strategic Income Fund | Annual Report 2018 |
Financial Highlights (continued)
| | Net
asset
value,
end of
period | Total
Return | Total gross
expense
ratio to
average
net assets(a) | Total net
expense
ratio to
average
net assets(a),(b) | Net investment
income
ratio to
average
net assets | Portfolio
turnover | Net
assets,
end of
period
(000’s) |
| Institutional 3 Class |
| Year Ended 8/31/2018 | $5.78 | 1.40% | 0.60% (c) | 0.60% (c) | 4.31% | 152% | $189,195 |
| Year Ended 8/31/2017(e) | $5.98 | 4.65% | 0.64% (f),(g) | 0.63% (f),(g) | 4.75% (f) | 110% | $100,173 |
| Year Ended 10/31/2016 | $5.87 | 7.13% | 0.62% | 0.62% | 4.24% | 168% | $10,642 |
| Year Ended 10/31/2015 | $5.69 | 0.68% | 0.64% | 0.64% | 4.35% | 169% | $10,704 |
| Year Ended 10/31/2014 | $6.03 | 5.15% | 0.63% | 0.63% | 4.50% | 124% | $1,582 |
| Year Ended 10/31/2013(i) | $6.17 | 1.57% | 0.64% (f) | 0.64% (f) | 4.94% (f) | 113% | $19 |
| Class R |
| Year Ended 8/31/2018 | $5.93 | 0.77% | 1.19% (c) | 1.19% (c),(d) | 3.70% | 152% | $7,075 |
| Year Ended 8/31/2017(e) | $6.13 | 4.18% | 1.21% (f),(g) | 1.21% (d),(f),(g) | 3.83% (f) | 110% | $6,443 |
| Year Ended 10/31/2016 | $6.01 | 6.45% | 1.28% | 1.27% (d) | 3.54% | 168% | $5,687 |
| Year Ended 10/31/2015 | $5.82 | 0.00% (j) | 1.31% | 1.28% (d) | 3.69% | 169% | $2,439 |
| Year Ended 10/31/2014 | $6.16 | 4.35% | 1.29% | 1.29% (d) | 3.88% | 124% | $1,629 |
| Year Ended 10/31/2013 | $6.30 | 1.74% | 1.29% | 1.29% (d) | 3.92% | 113% | $1,220 |
| Class T |
| Year Ended 8/31/2018 | $5.89 | 1.19% | 0.94% (c) | 0.94% (c),(d) | 3.95% | 152% | $10 |
| Year Ended 8/31/2017(e) | $6.08 | 4.26% | 0.95% (f),(g) | 0.95% (d),(f),(g) | 4.09% (f) | 110% | $10 |
| Year Ended 10/31/2016 | $5.97 | 6.76% | 1.04% | 1.03% (d) | 3.81% | 168% | $10 |
| Year Ended 10/31/2015 | $5.78 | 0.25% | 1.07% | 1.03% (d) | 3.94% | 169% | $10 |
| Year Ended 10/31/2014 | $6.12 | 4.67% | 1.04% | 1.04% (d) | 4.08% | 124% | $10 |
| Year Ended 10/31/2013 | $6.26 | 1.91% | 0.97% | 0.97% (d) | 4.21% | 113% | $3 |
The accompanying Notes to Financial Statements are an integral part of this statement.
Columbia Strategic Income Fund | Annual Report 2018
| 55 |
Notes to Financial Statements
August 31, 2018
Note 1. Organization
Columbia Strategic Income Fund (the Fund), a series of Columbia Funds Series Trust I (the Trust), is a diversified fund. The Trust is registered under the Investment Company Act of 1940, as amended (the 1940 Act), as an open-end management investment company organized as a Massachusetts business trust.
Fund shares
The Trust may issue an unlimited number of shares (without par value). Although all share classes generally have identical voting, dividend and liquidation rights, each share class votes separately when required by the Trust’s organizational documents or by law. Different share classes pay different distribution amounts to the extent the expenses of such share classes differ, and distributions in liquidation will be proportional to the net asset value of each share class. Each share class has its own expense and sales charge structure. The Fund offers each of the share classes identified below.
Class A shares are subject to a maximum front-end sales charge of 4.75% based on the initial investment amount. Class A shares purchased without an initial sales charge in accounts aggregating $1 million to $50 million at the time of purchase are subject to a contingent deferred sales charge (CDSC) if the shares are sold within 18 months after purchase, charged as follows: 1.00% CDSC if redeemed within 12 months after purchase, and 0.50% CDSC if redeemed more than 12, but less than 18, months after purchase.
Advisor Class shares are not subject to sales charges and are generally available only to omnibus retirement plans and certain investors as described in the Fund’s prospectus. Prior to November 1, 2017, Advisor Class shares were known as Class R4 shares.
Class C shares are subject to a 1.00% CDSC on shares redeemed within 12 months after purchase. Effective July 1, 2018, Class C shares will automatically convert to Class A shares of the same Fund in the month of or the month following the 10-year anniversary of the Class C shares purchase date.
Institutional Class shares are not subject to sales charges and are generally available only to eligible investors, which are subject to different investment minimums as described in the Fund’s prospectus. Prior to November 1, 2017, Institutional Class shares were known as Class Z shares.
Institutional 2 Class shares are not subject to sales charges and are generally available only to investors purchasing through authorized investment professionals and omnibus retirement plans as described in the Fund’s prospectus. Prior to November 1, 2017, Institutional 2 Class shares were known as Class R5 shares.
Institutional 3 Class shares are not subject to sales charges and are available to institutional and certain other investors as described in the Fund’s prospectus. Prior to November 1, 2017, Institutional 3 Class shares were known as Class Y shares.
The Fund no longer accepts investments by existing investors in Class K shares. When available, Class K shares were not subject to sales charges and were made available only to existing investors in Class K shares. On March 9, 2018, Class K shares were redeemed or exchanged for Advisor Class shares of the Fund in a tax free transaction that had no impact on fees and expenses paid by the shareholders.
Class R shares are not subject to sales charges and are generally available only to certain retirement plans and other investors as described in the Fund’s prospectus.
Class T shares are subject to a maximum front-end sales charge of 2.50% per transaction and must be purchased through financial intermediaries that, by written agreement with Columbia Management Investment Distributors, Inc., are specifically authorized to sell Class T shares.
| 56 | Columbia Strategic Income Fund | Annual Report 2018 |
Notes to Financial Statements (continued)
August 31, 2018
Note 2. Summary of significant accounting policies
Basis of preparation
The Fund is an investment company that applies the accounting and reporting guidance in the Financial Accounting Standards Board (FASB) Accounting Standards Codification Topic 946, Financial Services - Investment Companies (ASC 946). The financial statements are prepared in accordance with U.S. generally accepted accounting principles (GAAP), which requires management to make certain estimates and assumptions that affect the reported amounts of assets and liabilities, the disclosure of contingent assets and liabilities at the date of the financial statements and the reported amounts of income and expenses during the reporting period. Actual results could differ from those estimates.
The following is a summary of significant accounting policies followed by the Fund in the preparation of its financial statements.
Security valuation
All equity securities are valued at the close of business of the New York Stock Exchange. Equity securities are valued at the last quoted sales price on the principal exchange or market on which they trade, except for securities traded on the NASDAQ Stock Market, which are valued at the NASDAQ official close price. Unlisted securities or listed securities for which there were no sales during the day are valued at the mean of the latest quoted bid and ask prices on such exchanges or markets.
Debt securities generally are valued by pricing services approved by the Board of Trustees based upon market transactions for normal, institutional-size trading units of similar securities. The services may use various pricing techniques that take into account, as applicable, factors such as yield, quality, coupon rate, maturity, type of issue, trading characteristics and other data, as well as approved independent broker-dealer quotes. Debt securities for which quotations are not readily available or not believed to be reflective of market value may also be valued based upon a bid quote from an approved independent broker-dealer. Debt securities maturing in 60 days or less are valued primarily at amortized cost value, unless this method results in a valuation that management believes does not approximate market value.
Asset- and mortgage-backed securities are generally valued by pricing services, which utilize pricing models that incorporate the securities’ cash flow and loan performance data. These models also take into account available market data, including trades, market quotations, and benchmark yield curves for identical or similar securities. Factors used to identify similar securities may include, but are not limited to, issuer, collateral type, vintage, prepayment speeds, collateral performance, credit ratings, credit enhancement and expected life. Asset-backed securities for which quotations are readily available may also be valued based upon an over-the-counter or exchange bid quote from an approved independent broker-dealer.
Senior loan securities for which reliable market quotations are readily available are generally valued by pricing services at the average of the bids received.
Foreign equity securities are valued based on the closing price on the foreign exchange in which such securities are primarily traded. If any foreign equity security closing prices are not readily available, the securities are valued at the mean of the latest quoted bid and ask prices on such exchanges or markets. Foreign currency exchange rates are generally determined at 4:00 p.m. Eastern (U.S.) time. Many securities markets and exchanges outside the U.S. close prior to the close of the New York Stock Exchange; therefore, the closing prices for securities in such markets or on such exchanges may not fully reflect events that occur after such close but before the close of the New York Stock Exchange. In those situations, foreign securities will be fair valued pursuant to a policy adopted by the Board of Trustees, including, if available, utilizing a third party pricing service to determine these fair values. The third party pricing service takes into account multiple factors, including, but not limited to, movements in the U.S. securities markets, certain depositary receipts, futures contracts and foreign exchange rates that have occurred subsequent to the close of the foreign exchange or market, to determine a good faith estimate that reasonably reflects the current market conditions as of the close of the New York Stock Exchange. The fair value of a security is likely to be different from the quoted or published price, if available.
Investments in open-end investment companies, including money market funds, are valued at their latest net asset value.
Forward foreign currency exchange contracts are marked-to-market based upon foreign currency exchange rates provided by a pricing service.
Columbia Strategic Income Fund | Annual Report 2018
| 57 |
Notes to Financial Statements (continued)
August 31, 2018
Futures and options on futures contracts are valued based upon the settlement price at the close of regular trading on their principal exchanges or, in the absence of transactions, at the mean of the latest quoted bid and ask prices.
Option contracts are valued at the mean of the latest quoted bid and ask prices on their primary exchanges. Option contracts, including over-the-counter option contracts, with no readily available market quotations are valued using quotes obtained from independent brokers as of the close of the New York Stock Exchange.
Swap transactions are valued through an independent pricing service or broker, or if neither is available, through an internal model based upon observable inputs.
Investments for which market quotations are not readily available, or that have quotations which management believes are not reflective of market value or reliable, are valued at fair value as determined in good faith under procedures approved by and under the general supervision of the Board of Trustees. If a security or class of securities (such as foreign securities) is valued at fair value, such value is likely to be different from the quoted or published price for the security.
The determination of fair value often requires significant judgment. To determine fair value, management may use assumptions including but not limited to future cash flows and estimated risk premiums. Multiple inputs from various sources may be used to determine fair value.
GAAP requires disclosure regarding the inputs and valuation techniques used to measure fair value and any changes in valuation inputs or techniques. In addition, investments shall be disclosed by major category. This information is disclosed following the Fund’s Portfolio of Investments.
Foreign currency transactions and translations
The values of all assets and liabilities denominated in foreign currencies are generally translated into U.S. dollars at exchange rates determined at the close of regular trading on the New York Stock Exchange. Net realized and unrealized gains (losses) on foreign currency transactions and translations include gains (losses) arising from the fluctuation in exchange rates between trade and settlement dates on securities transactions, gains (losses) arising from the disposition of foreign currency and currency gains (losses) between the accrual and payment dates on dividends, interest income and foreign withholding taxes.
For financial statement purposes, the Fund does not distinguish that portion of gains (losses) on investments which is due to changes in foreign exchange rates from that which is due to changes in market prices of the investments. Such fluctuations are included with the net realized and unrealized gains (losses) on investments in the Statement of Operations.
Derivative instruments
The Fund invests in certain derivative instruments, as detailed below, to meet its investment objectives. Derivatives are instruments whose values depend on, or are derived from, in whole or in part, the value of one or more securities, currencies, commodities, indices, or other assets or instruments. Derivatives may be used to increase investment flexibility (including to maintain cash reserves while maintaining desired exposure to certain assets), for risk management (hedging) purposes, to facilitate trading, to reduce transaction costs and to pursue higher investment returns. The Fund may also use derivative instruments to mitigate certain investment risks, such as foreign currency exchange rate risk, interest rate risk and credit risk. Derivatives may involve various risks, including the potential inability of the counterparty to fulfill its obligations under the terms of the contract, the potential for an illiquid secondary market (making it difficult for the Fund to sell or terminate, including at favorable prices) and the potential for market movements which may expose the Fund to gains or losses in excess of the amount shown in the Statement of Assets and Liabilities. The notional amounts of derivative instruments, if applicable, are not recorded in the financial statements.
A derivative instrument may suffer a marked-to-market loss if the value of the contract decreases due to an unfavorable change in the market rates or values of the underlying instrument. Losses can also occur if the counterparty does not perform its obligations under the contract. The Fund’s risk of loss from counterparty credit risk on over-the-counter derivatives is generally limited to the aggregate unrealized gain netted against any collateral held by the Fund and the amount of any variation margin held by the counterparty, plus any replacement costs or related amounts. With exchange-traded or centrally cleared derivatives, there is reduced counterparty credit risk to the Fund since the clearinghouse or central counterparty
| 58 | Columbia Strategic Income Fund | Annual Report 2018 |
Notes to Financial Statements (continued)
August 31, 2018
(CCP) provides some protection in the case of clearing member default. The clearinghouse or CCP stands between the buyer and the seller of the contract; therefore, additional counterparty credit risk is failure of the clearinghouse or CCP. However, credit risk still exists in exchange-traded or centrally cleared derivatives with respect to initial and variation margin that is held in a broker’s customer account. While brokers are required to segregate customer margin from their own assets, in the event that a broker becomes insolvent or goes into bankruptcy and at that time there is a shortfall in the aggregate amount of margin held by the broker for all its clients, U.S. bankruptcy laws will typically allocate that shortfall on a pro-rata basis across all the broker’s customers (including the Fund), potentially resulting in losses to the Fund.
In order to better define its contractual rights and to secure rights that will help the Fund mitigate its counterparty risk, the Fund may enter into an International Swaps and Derivatives Association, Inc. Master Agreement (ISDA Master Agreement) or similar agreement with its derivatives contract counterparties. An ISDA Master Agreement is an agreement between the Fund and a counterparty that governs over-the-counter derivatives and typically contains, among other things, collateral posting terms and netting provisions in the event of a default and/or termination event. Under an ISDA Master Agreement, the Fund may, under certain circumstances, offset with the counterparty certain derivative instrument’s payables and/or receivables with collateral held and/or posted and create one single net payment. The provisions of the ISDA Master Agreement typically permit a single net payment in the event of default (close-out netting), including the bankruptcy or insolvency of the counterparty. Note, however, that bankruptcy or insolvency laws of a particular jurisdiction may impose restrictions on or prohibitions against the right of offset or netting in bankruptcy, insolvency or other events.
Collateral (margin) requirements differ by type of derivative. Margin requirements are established by the clearinghouse or CCP for exchange-traded and centrally cleared derivatives. Brokers can ask for margin in excess of the minimum in certain circumstances. Collateral terms are contract specific for over-the-counter derivatives. For over-the-counter derivatives traded under an ISDA Master Agreement, the collateral requirements are typically calculated by netting the marked-to-market amount for each transaction under such agreement and comparing that amount to the value of any variation margin currently pledged by the Fund and/or the counterparty. Generally, the amount of collateral due from or to a party has to exceed a minimum transfer amount threshold (e.g., $250,000) before a transfer has to be made. To the extent amounts due to the Fund from its counterparties are not fully collateralized, contractually or otherwise, the Fund bears the risk of loss from counterparty nonperformance. The Fund may also pay interest expense on cash collateral received from the broker. Any interest expense paid by the Fund is shown on the Statement of Operations. The Fund attempts to mitigate counterparty risk by only entering into agreements with counterparties that it believes have the financial resources to honor their obligations and by monitoring the financial stability of those counterparties.
Certain ISDA Master Agreements allow counterparties of over-the-counter derivatives transactions to terminate derivatives contracts prior to maturity in the event the Fund’s net asset value declines by a stated percentage over a specified time period or if the Fund fails to meet certain terms of the ISDA Master Agreement, which would cause the Fund to accelerate payment of any net liability owed to the counterparty. The Fund also has termination rights if the counterparty fails to meet certain terms of the ISDA Master Agreement. In determining whether to exercise such termination rights, the Fund would consider, in addition to counterparty credit risk, whether termination would result in a net liability owed from the counterparty.
For financial reporting purposes, the Fund does not offset derivative assets and derivative liabilities that are subject to netting arrangements in the Statement of Assets and Liabilities.
Forward foreign currency exchange contracts
Forward foreign currency exchange contracts are over-the-counter agreements between two parties to buy and sell a currency at a set price on a future date. The Fund utilized forward foreign currency exchange contracts to hedge the currency exposure associated with some or all of the Fund’s securities. These instruments may be used for other purposes in future periods.
The values of forward foreign currency exchange contracts fluctuate daily with changes in foreign currency exchange rates. Changes in the value of these contracts are recorded as unrealized appreciation or depreciation until the contract is exercised or has expired. The Fund will realize a gain or loss when the forward foreign currency exchange contract is closed or expires.
Columbia Strategic Income Fund | Annual Report 2018
| 59 |
Notes to Financial Statements (continued)
August 31, 2018
The use of forward foreign currency exchange contracts does not eliminate fluctuations in the prices of the Fund’s portfolio securities. The risks of forward foreign currency exchange contracts include movement in the values of the foreign currencies relative to the U.S. dollar (or other foreign currencies) and the possibility that counterparties will not complete their contractual obligations, which may be in excess of the amount reflected, if any, in the Statement of Assets and Liabilities.
Futures contracts
Futures contracts are exchange-traded and represent commitments for the future purchase or sale of an asset at a specified price on a specified date. The Fund bought and sold futures contracts to manage the duration and yield curve exposure of the Fund versus the benchmark. These instruments may be used for other purposes in future periods. Upon entering into futures contracts, the Fund bears risks that it may not achieve the anticipated benefits of the futures contracts and may realize a loss. Additional risks include counterparty credit risk, the possibility of an illiquid market, and that a change in the value of the contract or option may not correlate with changes in the value of the underlying asset.
Upon entering into a futures contract, the Fund deposits cash or securities with the broker, known as a futures commission merchant (FCM), in an amount sufficient to meet the initial margin requirement. The initial margin deposit must be maintained at an established level over the life of the contract. Cash deposited as initial margin is recorded in the Statement of Assets and Liabilities as margin deposits. Securities deposited as initial margin are designated in the Portfolio of Investments. Subsequent payments (variation margin) are made or received by the Fund each day. The variation margin payments are equal to the daily change in the contract value and are recorded as variation margin receivable or payable and are offset in unrealized gains or losses. The Fund recognizes a realized gain or loss when the contract is closed or expires. Futures contracts involve, to varying degrees, risk of loss in excess of the variation margin disclosed in the Statement of Assets and Liabilities.
Options contracts
Options are contracts which entitle the holder to purchase or sell securities or other identified assets at a specified price, or in the case of index option contracts, to receive or pay the difference between the index value and the strike price of the index option contract. Option contracts can be either exchange-traded or over-the-counter. The Fund wrote option contracts to manage duration and yield curve exposure. These instruments may be used for other purposes in future periods. Completion of transactions for option contracts traded in the over-the-counter market depends upon the performance of the other party. Cash collateral may be collected or posted by the Fund to secure certain over-the-counter option contract trades. Cash collateral held or posted by the Fund for such option contract trades must be returned to the broker or the Fund upon closure, exercise or expiration of the contract.
Options contracts purchased are recorded as investments. When the Fund writes an options contract, the premium received is recorded as an asset and an amount equivalent to the premium is recorded as a liability in the Statement of Assets and Liabilities and is subsequently adjusted to reflect the current fair value of the option written. Changes in the fair value of the written option are recorded as unrealized appreciation or depreciation until the contract is exercised or has expired. The Fund will realize a gain or loss when the option contract is closed or expires. When option contracts are exercised, the proceeds on sales for a written call or purchased put option contract, or the purchase cost for a written put or purchased call option contract, is adjusted by the amount of premium received or paid.
For over-the-counter options purchased, the Fund bears the risk of loss of the amount of the premiums paid plus the positive change in market values net of any collateral held by the Fund should the counterparty fail to perform under the contracts. Option contracts written by the Fund do not typically give rise to significant counterparty credit risk, as options written generally obligate the Fund and not the counterparty to perform. The risk in writing a call option contract is that the Fund gives up the opportunity for profit if the market price of the security increases above the strike price and the option contract is exercised. The risk in writing a put option contract is that the Fund may incur a loss if the market price of the security decreases below the strike price and the option contract is exercised. Exercise of a written option could result in the Fund purchasing or selling a security or foreign currency when it otherwise would not, or at a price different from the current market value. In purchasing and writing options, the Fund bears the risk of an unfavorable change in the value of the underlying instrument or the risk that the Fund may not be able to enter into a closing transaction due to an illiquid market.
| 60 | Columbia Strategic Income Fund | Annual Report 2018 |
Notes to Financial Statements (continued)
August 31, 2018
Interest rate swaption contracts
Interest rate swaption contracts entered into by the Fund typically represent an option that gives the purchaser the right, but not the obligation, to enter into an interest rate swap contract on a future date. Each interest rate swaption agreement will specify if the buyer is entitled to receive the fixed or floating rate if the interest rate is exercised. Changes in the value of a purchased interest rate swaption contracts are reported as unrealized appreciation or depreciation on options in the Statement of Assets and Liabilities. Gain or loss is recognized in the Statement of Operations when the interest rate swaption contract is closed or expires.
When the Fund writes an interest rate swaption contract, the premium received is recorded as an asset and an amount equivalent to the premium is recorded as a liability in the Statement of Assets and Liabilities and is subsequently adjusted to reflect the current fair value of the interest rate swaption contract written. Premiums received from writing interest rate swaption contracts that expire unexercised are recorded by the Fund on the expiration date as realized gains from options written in the Statement of Operations. The difference between the premium and the amount paid on effecting a closing purchase transaction, including brokerage commissions, is also recorded as realized gain, or if the premium is less than the amount paid for the closing purchase, as realized loss. These amounts are reflected as net realized gain (loss) on options written in the Statement of Operations.
Swap contracts
Swap contracts are negotiated in the over-the-counter market and may be entered into as a bilateral contract or centrally cleared (centrally cleared swap contract). In a centrally cleared swap contract, immediately following execution of the swap contract with a broker, the swap contract is novated to a central counterparty (the CCP) and the CCP becomes the Fund’s counterparty to the centrally cleared swap contract. The Fund is required to deposit initial margin with the futures commission merchant (FCM), which pledges it through to the CCP in the form of cash or securities in an amount that varies depending on the size and risk profile of the particular swap contract. Securities deposited as initial margin are designated in the Portfolio of Investments and cash deposited is recorded in the Statement of Assets and Liabilities as margin deposits. Unlike a bilateral swap contract, for centrally cleared swap contracts, the Fund has minimal credit exposure to the FCM because the CCP stands between the Fund and the relevant buyer/seller on the other side of the contract. Swap contracts are marked-to-market daily and changes in value are recorded as unrealized appreciation (depreciation). The daily change in valuation of centrally cleared swap contracts, if any, is recorded as a receivable or payable for variation margin in the Statement of Assets and Liabilities.
Entering into these contracts involves, to varying degrees, elements of interest, liquidity and counterparty credit risk in excess of the amounts recognized in the Statement of Assets and Liabilities. Such risks involve the possibility that there may be unfavorable changes in interest rates, market conditions or other conditions, that it may be difficult to initiate a swap transaction or liquidate a position at an advantageous time or price which may result in significant losses, and that the FCM or CCP may not fulfill its obligation under the contract.
Credit default swap contracts
The Fund entered into credit default swap contracts to increase or decrease its credit exposure to an index. These instruments may be used for other purposes in future periods. Credit default swap contracts are agreements in which one party pays fixed periodic payments to a counterparty in consideration for an agreement from the counterparty to make a specific payment should a specified credit event(s) take place. Although specified credit events are contract specific, credit events are generally defined as bankruptcy, failure to pay, restructuring, obligation acceleration, obligation default, or repudiation/moratorium.
As the purchaser of a credit default swap contract, the Fund purchases protection by paying a periodic interest rate on the notional amount to the counterparty. The interest amount is accrued daily as a component of unrealized appreciation (depreciation) and is recorded as a realized loss upon payment. If a credit event as specified in the contract occurs, the Fund may have the option either to deliver the reference obligation to the seller in exchange for a cash payment of its par amount, or to receive a net cash settlement equal to the par amount less an agreed-upon value of the reference obligation as of the date of the credit event. The difference between the value of the obligation or cash delivered and the notional amount received will be recorded as a realized gain (loss).
Columbia Strategic Income Fund | Annual Report 2018
| 61 |
Notes to Financial Statements (continued)
August 31, 2018
As the seller of a credit default swap contract, the Fund sells protection to a buyer and will generally receive a periodic interest rate on a notional amount. The interest amount is accrued daily as a component of unrealized appreciation (depreciation) and is recorded as a realized gain upon receipt of the payment. If a credit event as specified in the contract with the counterparty occurs, the Fund may either be required to accept the reference obligation from the buyer in exchange for a cash payment of its notional amount, or to pay the buyer a net cash settlement equal to the notional amount less an agreed-upon value of the reference obligation (recovery value) as of the date of the credit event. The difference between the value of the obligation or cash received and the notional amount paid will be recorded as a realized gain (loss). The maximum potential amount of undiscounted future payments the Fund could be required to make as the seller of protection under a credit default swap contract is equal to the notional amount of the reference obligation. These potential amounts may be partially offset by any recovery values of the respective reference obligations or upfront receipts upon entering into the agreement. The notional amounts and market values of all credit default swap contracts in which the Fund is the seller of protection, if any, are disclosed in the Credit Default Swap Contracts Outstanding schedule following the Portfolio of Investments.
As a protection seller, the Fund bears the risk of loss from the credit events specified in the contract with the counterparty. For credit default swap contracts on credit indices, quoted market prices and resulting market values serve as an indicator of the current status of the payment/performance risk. Increasing market values, in absolute terms when compared to the notional amount of the swap, represent a deterioration of the reference entity’s credit soundness and a greater likelihood or risk of default or other credit event occurring as defined under the terms of the contract.
Any upfront payments or receipts by the Fund upon entering into a credit default swap contract is recorded as an asset or liability, respectively, and amortized daily as a component of realized gain (loss) in the Statement of Operations. Credit default swap contracts are valued daily, and the change in value is recorded as unrealized appreciation (depreciation) until the termination of the swap, at which time a realized gain (loss) is recorded.
Credit default swap contracts can involve greater risks than if a fund had invested in the reference obligation directly since, in addition to general market risks, credit default swaps are subject to counterparty credit risk, leverage risk, hedging risk, correlation risk and liquidity risk.
Interest rate swap contracts
The Fund entered into interest rate swap transactions which may include inflation rate swap contracts to manage duration and yield curve exposure. These instruments may be used for other purposes in future periods. An interest rate swap is an agreement between two parties where there are two flows and payments are made between the two counterparties and the payments are dependent upon changes in an interest rate, inflation rate or inflation index calculated on a nominal amount. Interest rate swaps are agreements between two parties that involve the exchange of one type of interest rate for another type of interest rate cash flow on specified dates in the future, based on a predetermined, specified notional amount. Certain interest rate swaps are considered forward-starting, whereby the accrual for the exchange of cash flows does not begin until a specified date in the future. The net cash flow for a standard interest rate swap transaction is generally the difference between a floating market interest rate versus a fixed interest rate.
Interest rate swaps are valued daily and unrealized appreciation (depreciation) is recorded. Certain interest rate swaps may accrue periodic interest on a daily basis as a component of unrealized appreciation (depreciation); the Fund will realize a gain or loss upon the payment or receipt of accrued interest. The Fund will realize a gain or a loss when the interest rate swap is terminated.
Effects of derivative transactions in the financial statements
The following tables are intended to provide additional information about the effect of derivatives on the financial statements of the Fund, including: the fair value of derivatives by risk category and the location of those fair values in the Statement of Assets and Liabilities; and the impact of derivative transactions over the period in the Statement of Operations, including realized and unrealized gains (losses). The derivative instrument schedules following the Portfolio of Investments present additional information regarding derivative instruments outstanding at the end of the period, if any.
| 62 | Columbia Strategic Income Fund | Annual Report 2018 |
Notes to Financial Statements (continued)
August 31, 2018
The following table is a summary of the fair value of derivative instruments (not considered to be hedging instruments for accounting disclosure purposes) at August 31, 2018:
| | Asset derivatives | |
Risk exposure
category | Statement
of assets and liabilities
location | Fair value ($) |
| Credit risk | Net assets — unrealized appreciation on swap contracts | 1,119,996* |
| Credit risk | Upfront payments on swap contracts | 6,448,720 |
| Foreign exchange risk | Unrealized appreciation on forward foreign currency exchange contracts | 1,457,092 |
| Interest rate risk | Net assets — unrealized appreciation on futures contracts | 1,854,725* |
| Total | | 10,880,533 |
| | Liability derivatives | |
Risk exposure
category | Statement
of assets and liabilities
location | Fair value ($) |
| Credit risk | Net assets — unrealized depreciation on swap contracts | 5,818,548* |
| Credit risk | Upfront receipts on swap contracts | 1,554,924 |
| Foreign exchange risk | Unrealized depreciation on forward foreign currency exchange contracts | 376,640 |
| Interest rate risk | Net assets — unrealized depreciation on futures contracts | 4,125,279* |
| Interest rate risk | Options contracts written, at value | 1,972,880 |
| Interest rate risk | Net assets — unrealized depreciation on swap contracts | 6,539,483* |
| Total | | 20,387,754 |
| * | Includes cumulative appreciation (depreciation) as reported in the tables following the Portfolio of Investments. Only the current day’s variation margin is reported in receivables or payables in the Statement of Assets and Liabilities. |
The following table indicates the effect of derivative instruments (not considered to be hedging instruments for accounting disclosure purposes) in the Statement of Operations for the year ended August 31, 2018:
| Amount of realized gain (loss) on derivatives recognized in income |
| Risk exposure category | Forward
foreign
currency
exchange
contracts
($) | Futures
contracts
($) | Options
contracts
written
($) | Options
contracts
purchased
($) | Swap
contracts
($) | Total
($) |
| Credit risk | — | — | — | — | (5,343,906) | (5,343,906) |
| Foreign exchange risk | 4,998,723 | — | — | — | — | 4,998,723 |
| Interest rate risk | — | 1,567,123 | 1,958,000 | 13,131,409 | 5,542,471 | 22,199,003 |
| Total | 4,998,723 | 1,567,123 | 1,958,000 | 13,131,409 | 198,565 | 21,853,820 |
| |
| Change in unrealized appreciation (depreciation) on derivatives recognized in income |
| Risk exposure category | Forward
foreign
currency
exchange
contracts
($) | Futures
contracts
($) | Options
contracts
written
($) | Options
contracts
purchased
($) | Swap
contracts
($) | Total
($) |
| Credit risk | — | — | — | — | 1,503,382 | 1,503,382 |
| Foreign exchange risk | 1,193,117 | — | — | — | — | 1,193,117 |
| Interest rate risk | — | 1,332,077 | 144,620 | 852,009 | (4,524,877) | (2,196,171) |
| Total | 1,193,117 | 1,332,077 | 144,620 | 852,009 | (3,021,495) | 500,328 |
Columbia Strategic Income Fund | Annual Report 2018
| 63 |
Notes to Financial Statements (continued)
August 31, 2018
The following table is a summary of the average outstanding volume by derivative instrument for the year ended August 31, 2018:
| Derivative instrument | Average notional
amounts ($)* |
| Futures contracts — long | 596,970,066 |
| Futures contracts — short | 1,270,379,690 |
| Credit default swap contracts — buy protection | 271,481,250 |
| Credit default swap contracts — sell protection | 65,150,000 |
| Derivative instrument | Average
value ($)* |
| Options contracts — purchased | 6,781,768 |
| Options contracts — written | (1,092,288) |
| Derivative instrument | Average unrealized
appreciation ($)* | Average unrealized
depreciation ($)* |
| Forward foreign currency exchange contracts | 2,566,436 | (1,523,394) |
| Interest rate swap contracts | 7,709,184 | (7,697,457) |
| * | Based on the ending quarterly outstanding amounts for the year ended August 31, 2018. |
Investments in senior loans
The Fund may invest in senior loan assignments. When the Fund purchases an assignment of a senior loan, the Fund typically has direct rights against the borrower; provided, however, that the Fund’s rights may be more limited than the lender from which it acquired the assignment and the Fund may be able to enforce its rights only through an administrative agent. Although certain senior loan assignments are secured by collateral, the Fund could experience delays or limitations in realizing such collateral or have its interest subordinated to other indebtedness of the obligor. In the event that the administrator or collateral agent of a loan becomes insolvent or enters into receivership or bankruptcy, the Fund may incur costs and delays in realizing payment or may suffer a loss of principal and/or interest. The risk of loss is greater for unsecured or subordinated loans. In addition, senior loan assignments are vulnerable to market, economic or other conditions or events that may reduce the demand for senior loan assignments and certain senior loan assignments which were liquid when purchased, may become illiquid.
The Fund may enter into senior loan assignments where all or a portion of the loan may be unfunded. The Fund is obligated to fund these commitments at the borrower’s discretion. These commitments, if any, are generally traded and priced in the same manner as other senior loan securities and are disclosed as unfunded senior loan commitments in the Fund’s Portfolio of Investments with a corresponding payable for investments purchased. The Fund designates cash or liquid securities to cover these commitments.
Asset- and mortgage-backed securities
The Fund may invest in asset-backed and mortgage-backed securities. The maturity dates shown represent the original maturity of the underlying obligation. Actual maturity may vary based upon prepayment activity on these obligations. All, or a portion, of the obligation may be prepaid at any time because the underlying asset may be prepaid. As a result, decreasing market interest rates could result in an increased level of prepayment. An increased prepayment rate will have the effect of shortening the maturity of the security. Unless otherwise noted, the coupon rates presented are fixed rates.
Delayed delivery securities
The Fund may trade securities on other than normal settlement terms, including securities purchased or sold on a “when-issued” or "forward commitment" basis. This may increase risk to the Fund since the other party to the transaction may fail to deliver, which could cause the Fund to subsequently invest at less advantageous prices. The Fund designates cash or liquid securities in an amount equal to the delayed delivery commitment.
| 64 | Columbia Strategic Income Fund | Annual Report 2018 |
Notes to Financial Statements (continued)
August 31, 2018
To be announced securities
The Fund may trade securities on a To Be Announced (TBA) basis. As with other delayed-delivery transactions, a seller agrees to issue a TBA security at a future date. However, the seller does not specify the particular securities to be delivered. Instead, the Fund agrees to accept any security that meets specified terms.
In some cases, Master Securities Forward Transaction Agreements (MSFTAs) may be used to govern transactions of certain forward-settling agency mortgage-backed securities, such as delayed-delivery and TBAs, between the Fund and counterparty. The MSFTA maintains provisions for, among other things, initiation and confirmation, payment and transfer, events of default, termination, and maintenance of collateral relating to such transactions.
Mortgage dollar roll transactions
The Fund may enter into mortgage “dollar rolls” in which the Fund sells securities for delivery in the current month and simultaneously contracts with the same counterparty to repurchase similar but not identical securities (same type, coupon and maturity) on a specified future date. During the roll period, the Fund loses the right to receive principal and interest paid on the securities sold. However, the Fund will benefit because it receives negotiated amounts in the form of reductions of the purchase price for the future purchase plus the interest earned on the cash proceeds of the securities sold until the settlement date of the forward purchase. The Fund records the incremental difference between the forward purchase and sale of each forward roll as a realized gain or loss. Unless any realized gains exceed the income, capital appreciation, and gain or loss due to mortgage prepayments that would have been realized on the securities sold as part of the mortgage dollar roll, the use of this technique will diminish the investment performance of the Fund compared to what the performance would have been without the use of mortgage dollar rolls. All cash proceeds will be invested in instruments that are permissible investments for the Fund. The Fund identifies cash or liquid securities in an amount equal to the forward purchase price.
For financial reporting and tax purposes, the Fund treats “to be announced” mortgage dollar rolls as two separate transactions, one involving the purchase of a security and a separate transaction involving a sale. These transactions may increase the Fund’s portfolio turnover rate. The Fund does not currently enter into mortgage dollar rolls that are accounted for as financing transactions.
Mortgage dollar rolls involve the risk that the market value of the securities the Fund is obligated to repurchase may decline below the repurchase price, or that the counterparty may default on its obligations.
Treasury inflation protected securities
The Fund may invest in treasury inflation protected securities (TIPS). The principal amount of TIPS is adjusted periodically and is increased for inflation or decreased for deflation based on a monthly published index. These adjustments are recorded as interest income in the Statement of Operations. Coupon payments are based on the adjusted principal at the time the interest is paid.
Interest only and principal only securities
The Fund may invest in Interest Only (IO) or Principal Only (PO) securities. IOs are stripped securities entitled to receive all of the security’s interest, but none of its principal. IOs are particularly sensitive to changes in interest rates and therefore subject to greater fluctuations in price than typical interest bearing debt securities. IOs are also subject to credit risk because the Fund may not receive all or part of the interest payments if the issuer, obligor, guarantor or counterparty defaults on its obligation. Payments received for IOs are included in interest income on the Statement of Operations. Because no principal will be received at the maturity of an IO, adjustments are made to the cost of the security on a monthly basis until maturity. These adjustments are included in interest income on the Statement of Operations. POs are stripped securities entitled to receive the principal from the underlying obligation, but not the interest. POs are particularly sensitive to changes in interest rates and therefore are subject to fluctuations in price. POs are also subject to credit risk because the Fund may not receive all or part of its principal if the issuer, obligor, guarantor or counterparty defaults on its obligation. The Fund may also invest in IO or PO stripped mortgage-backed securities. Payments received for POs are treated as reductions to the cost and par value of the securities.
Columbia Strategic Income Fund | Annual Report 2018
| 65 |
Notes to Financial Statements (continued)
August 31, 2018
Offsetting of assets and liabilities
The following table presents the Fund’s gross and net amount of assets and liabilities available for offset under netting arrangements as well as any related collateral received or pledged by the Fund as of August 31, 2018:
| | Citi ($) | Credit
Suisse ($) | Goldman
Sachs ($) | JPMorgan ($) | Morgan
Stanley ($) (a) | Morgan
Stanley ($) (a) | TD
Securities ($) | Total ($) |
| Assets | | | | | | | | |
| Centrally cleared interest rate swap contracts (b) | - | - | - | - | - | 357,017 | - | 357,017 |
| Forward foreign currency exchange contracts | - | 26,350 | 179,734 | - | 311,899 | - | 939,109 | 1,457,092 |
| OTC credit default swap contracts (c) | 2,437,041 | 1,647,577 | - | 660,747 | 1,754,709 | - | - | 6,500,074 |
| Total assets | 2,437,041 | 1,673,927 | 179,734 | 660,747 | 2,066,608 | 357,017 | 939,109 | 8,314,183 |
| Liabilities | | | | | | | | |
| Centrally cleared credit default swap contracts (b) | - | - | - | - | - | 264,731 | - | 264,731 |
| Forward foreign currency exchange contracts | - | 237,334 | - | 57,482 | 55,293 | - | 26,531 | 376,640 |
| Options contracts written | 978,775 | - | - | - | 994,105 | - | - | 1,972,880 |
| OTC credit default swap contracts (c) | - | 643,846 | - | - | - | - | - | 643,846 |
| Total liabilities | 978,775 | 881,180 | - | 57,482 | 1,049,398 | 264,731 | 26,531 | 3,258,097 |
| Total financial and derivative net assets | 1,458,266 | 792,747 | 179,734 | 603,265 | 1,017,210 | 92,286 | 912,578 | 5,056,086 |
| Total collateral received (pledged) (d) | 1,304,000 | 792,747 | - | 603,265 | 770,000 | - | - | 3,470,012 |
| Net amount (e) | 154,266 | - | 179,734 | - | 247,210 | 92,286 | 912,578 | 1,586,074 |
| (a) | Exposure can only be netted across transactions governed under the same master agreement with the same legal entity. |
| (b) | Centrally cleared swaps are included within payable/receivable for variation margin on the Statement of Assets and Liabilities. |
| (c) | Over-the-Counter (OTC) swap contracts are presented at market value plus periodic payments receivable (payable), which is comprised of unrealized appreciation, unrealized depreciation, upfront payments and upfront receipts. |
| (d) | In some instances, the actual collateral received and/or pledged may be more than the amount shown due to overcollateralization. |
| (e) | Represents the net amount due from/(to) counterparties in the event of default. |
Security transactions
Security transactions are accounted for on the trade date. Cost is determined and gains (losses) are based upon the specific identification method for both financial statement and federal income tax purposes.
The trade date for senior loans purchased in the primary market is the date on which the loan is allocated. The trade date for senior loans purchased in the secondary market is the date on which the transaction is entered into.
Income recognition
Interest income is recorded on an accrual basis. Market premiums and discounts, including original issue discounts, are amortized and accreted, respectively, over the expected life of the security on all debt securities, unless otherwise noted. The Fund classifies gains and losses realized on prepayments received on mortgage-backed securities as adjustments to interest income.
The Fund may place a debt security on non-accrual status and reduce related interest income when it becomes probable that the interest will not be collected and the amount of uncollectible interest can be reasonably estimated. A defaulted debt security is removed from non-accrual status when the issuer resumes interest payments or when collectibility of interest is reasonably assured.
Corporate actions and dividend income are generally recorded net of any non-reclaimable tax withholdings, on the ex-dividend date or upon receipt of ex-dividend notification in the case of certain foreign securities.
| 66 | Columbia Strategic Income Fund | Annual Report 2018 |
Notes to Financial Statements (continued)
August 31, 2018
The Fund may receive distributions from holdings in equity securities, business development companies (BDCs), exchange-traded funds (ETFs), limited partnerships (LPs), other regulated investment companies (RICs), and real estate investment trusts (REITs), which report information on the tax character of their distributions annually. These distributions are allocated to dividend income, capital gain and return of capital based on actual information reported. Return of capital is recorded as a reduction of the cost basis of securities held. If the Fund no longer owns the applicable securities, return of capital is recorded as a realized gain. With respect to REITs, to the extent actual information has not yet been reported, estimates for return of capital are made by the Fund’s management. Management’s estimates are subsequently adjusted when the actual character of the distributions is disclosed by the REITs, which could result in a proportionate change in return of capital to shareholders.
Awards from class action litigation are recorded as a reduction of cost basis if the Fund still owns the applicable securities on the payment date. If the Fund no longer owns the applicable securities, the proceeds are recorded as realized gains.
The value of additional securities received as an income payment through a payment in kind, if any, is recorded as interest income and increases the cost basis of such securities.
The Fund may receive other income from senior loans, including amendment fees, consent fees and commitment fees. These fees are recorded as income when received by the Fund. These amounts are included in Interest Income in the Statement of Operations.
Expenses
General expenses of the Trust are allocated to the Fund and other funds of the Trust based upon relative net assets or other expense allocation methodologies determined by the nature of the expense. Expenses directly attributable to the Fund are charged to the Fund. Expenses directly attributable to a specific class of shares are charged to that share class.
Determination of class net asset value
All income, expenses (other than class-specific expenses, which are charged to that share class, as shown in the Statement of Operations) and realized and unrealized gains (losses) are allocated to each class of the Fund on a daily basis, based on the relative net assets of each class, for purposes of determining the net asset value of each class.
Federal income tax status
The Fund intends to qualify each year as a regulated investment company under Subchapter M of the Internal Revenue Code, as amended, and will distribute substantially all of its investment company taxable income and net capital gain, if any, for its tax year, and as such will not be subject to federal income taxes. In addition, the Fund intends to distribute in each calendar year substantially all of its ordinary income, capital gain net income and certain other amounts, if any, such that the Fund should not be subject to federal excise tax. Therefore, no federal income or excise tax provision is recorded.
Foreign taxes
The Fund may be subject to foreign taxes on income, gains on investments or currency repatriation, a portion of which may be recoverable. The Fund will accrue such taxes and recoveries, as applicable, based upon its current interpretation of tax rules and regulations that exist in the markets in which it invests.
Realized gains in certain countries may be subject to foreign taxes at the Fund level, based on statutory rates. The Fund accrues for such foreign taxes on realized and unrealized gains at the appropriate rate for each jurisdiction, as applicable. The amount, if any, is disclosed as a liability on the Statement of Assets and Liabilities.
Distributions to shareholders
Distributions from net investment income, if any, are declared and paid monthly. Net realized capital gains, if any, are distributed at least annually. Income distributions and capital gain distributions are determined in accordance with federal income tax regulations, which may differ from GAAP.
Columbia Strategic Income Fund | Annual Report 2018
| 67 |
Notes to Financial Statements (continued)
August 31, 2018
Guarantees and indemnifications
Under the Trust’s organizational documents and, in some cases, by contract, its officers and trustees are indemnified against certain liabilities arising out of the performance of their duties to the Trust or its funds. In addition, certain of the Fund’s contracts with its service providers contain general indemnification clauses. The Fund’s maximum exposure under these arrangements is unknown since the amount of any future claims that may be made against the Fund cannot be determined, and the Fund has no historical basis for predicting the likelihood of any such claims.
Recent accounting pronouncement
Accounting Standards Update 2017-08 Premium Amortization on Purchased Callable Debt Securities
In March 2017, the Financial Accounting Standards Board issued Accounting Standards Update (ASU) No. 2017-08 Premium Amortization on Purchased Callable Debt Securities. ASU No. 2017-08 updates the accounting standards to shorten the amortization period for certain purchased callable debt securities, held at a premium, to be amortized to the earliest call date. The update applies to securities with explicit, noncontingent call features that are callable at fixed prices and on preset dates. The standard is effective for annual periods beginning after December 15, 2018 and interim periods within those fiscal years. At this time, management is evaluating the implication of this guidance and the impact it will have on the financial statement amounts and footnote disclosures, if any.
Note 3. Fees and other transactions with affiliates
Management services fees
The Fund has entered into a Management Agreement with Columbia Management Investment Advisers, LLC (the Investment Manager), a wholly-owned subsidiary of Ameriprise Financial, Inc. (Ameriprise Financial). Under the Management Agreement, the Investment Manager provides the Fund with investment research and advice, as well as administrative and accounting services. The management services fee is an annual fee that is equal to a percentage of the Fund’s daily net assets that declines from 0.600% to 0.393% as the Fund’s net assets increase. The effective management services fee rate for the year ended August 31, 2018 was 0.563% of the Fund’s average daily net assets.
Compensation of board members
Members of the Board of Trustees who are not officers or employees of the Investment Manager or Ameriprise Financial are compensated for their services to the Fund as disclosed in the Statement of Operations. These members of the Board of Trustees may participate in a Deferred Compensation Plan (the Plan) which may be terminated at any time. Obligations of the Plan will be paid solely out of the Fund’s assets, and all amounts payable under the Plan constitute a general unsecured obligation of the Fund.
Compensation of Chief Compliance Officer
The Board of Trustees has appointed a Chief Compliance Officer to the Fund in accordance with federal securities regulations. As disclosed in the Statement of Operations, a portion of the Chief Compliance Officer’s total compensation is allocated to the Fund, along with other allocations to affiliated funds governed by the Board of Trustees, based on relative net assets.
Transactions with affiliates
For the year ended August 31, 2018, the Fund engaged in purchase and/or sale transactions with affiliates and/or accounts that have a common investment manager (or affiliated investment managers), common directors/trustees, and/or common officers. Those purchase and sale transactions complied with provisions of Rule 17a-7 under the 1940 Act and were $0 and $2,701,500, respectively. The sale transactions resulted in a net realized loss of $55,324.
| 68 | Columbia Strategic Income Fund | Annual Report 2018 |
Notes to Financial Statements (continued)
August 31, 2018
Transfer agency fees
Under a Transfer and Dividend Disbursing Agent Agreement, Columbia Management Investment Services Corp. (the Transfer Agent), an affiliate of the Investment Manager and a wholly-owned subsidiary of Ameriprise Financial, is responsible for providing transfer agency services to the Fund. The Transfer Agent has contracted with DST Asset Manager Solutions, Inc. (DST) to serve as sub-transfer agent. The Transfer Agent pays the fees of DST for services as sub-transfer agent and DST is not entitled to reimbursement for such fees from the Fund (with the exception of out-of-pocket fees).
The Fund pays the Transfer Agent a monthly transfer agency fee based on the number or the average value of accounts, depending on the type of account. In addition, the Fund pays the Transfer Agent a fee for shareholder services based on the number of accounts or on a percentage of the average aggregate value of the Fund’s shares maintained in omnibus accounts up to the lesser of the amount charged by the financial intermediary or a cap established by the Board of Trustees from time to time.
The Transfer Agent also receives compensation from the Fund for various shareholder services and reimbursements for certain out-of-pocket fees. Total transfer agency fees for Class K, Institutional 2 Class and Institutional 3 Class shares are subject to an annual limitation of not more than 0.07%, 0.07% and 0.02%, respectively, of the average daily net assets attributable to each share class. In addition, prior to March 1, 2018, Class K and Institutional 2 Class shares were subject to a contractual transfer agency fee annual limitation of not more than 0.05% and Institutional 3 Class shares were subject to a contractual transfer agency fee annual limitation of not more than 0.00% of the average daily net assets attributable to each share class.
For the year ended August 31, 2018, the Fund’s effective transfer agency fee rates as a percentage of average daily net assets of each class were as follows:
| | Effective rate (%) |
| Class A | 0.10 |
| Advisor Class | 0.10 |
| Class C | 0.10 |
| Institutional Class | 0.10 |
| Institutional 2 Class | 0.06 |
| Institutional 3 Class | 0.00 |
| Class K | 0.03 (a) |
| Class R | 0.10 |
| Class T | 0.08 |
An annual minimum account balance fee of $20 may apply to certain accounts with a value below the applicable share class’s initial minimum investment requirements to reduce the impact of small accounts on transfer agency fees. These minimum account balance fees are remitted to the Fund and recorded as part of expense reductions in the Statement of Operations. For the year ended August 31, 2018, these minimum account balance fees reduced total expenses of the Fund by $3,500.
Plan administration fees
Under a Plan Administration Services Agreement with the Transfer Agent, the Fund paid an annual fee at a rate of 0.25% of the Fund’s average daily net assets attributable to Class K shares for the provision of various administrative, recordkeeping, communication and educational services. As a result of all Class K shares of the Fund being redeemed or exchanged for Advisor Class shares, March 9, 2018 was the last day the Fund paid a plan administration fee for Class K shares.
Distribution and service fees
The Fund has entered into an agreement with Columbia Management Investment Distributors, Inc. (the Distributor), an affiliate of the Investment Manager and a wholly-owned subsidiary of Ameriprise Financial, for distribution and shareholder services. The Board of Trustees has approved, and the Fund has adopted, distribution and shareholder service plans (the
Columbia Strategic Income Fund | Annual Report 2018
| 69 |
Notes to Financial Statements (continued)
August 31, 2018
Plans) applicable to certain share classes, which set the distribution and service fees for the Fund. These fees are calculated daily and are intended to compensate the Distributor and/or eligible selling and/or servicing agents for selling shares of the Fund and providing services to investors.
Under the Plans, the Fund pays a monthly service fee to the Distributor at the maximum annual rate of 0.25% of the average daily net assets attributable to Class A, Class C and Class T shares of the Fund. Also under the Plans, the Fund pays a monthly distribution fee to the Distributor at the maximum annual rates of 0.75%, 0.50% and 0.25% of the average daily net assets attributable to Class C, Class R and Class T shares of the Fund, respectively.
Although the Fund may pay a distribution fee up to 0.25% of the Fund’s average daily net assets attributable to Class T shares and a service fee of up to 0.25% of the Fund’s average daily net assets attributable to Class T shares, the aggregate fee shall not exceed 0.25% of the Fund’s average daily net assets attributable to Class T shares.
Sales charges (unaudited)
Sales charges, including front-end charges and CDSCs, received by the Distributor for distributing Fund shares for the year ended August 31, 2018, if any, are listed below:
| | Amount ($) |
| Class A | 2,072,908 |
| Class C | 44,300 |
Expenses waived/reimbursed by the Investment Manager and its affiliates
The Investment Manager and certain of its affiliates have contractually agreed to waive fees and/or reimburse expenses (excluding certain fees and expenses described below) for the period(s) disclosed below, unless sooner terminated at the sole discretion of the Board of Trustees, so that the Fund’s net operating expenses, after giving effect to fees waived/expenses reimbursed and any balance credits and/or overdraft charges from the Fund’s custodian, do not exceed the following annual rate(s) as a percentage of the class’ average daily net assets:
| | March 1, 2018
through
December 31, 2018 | Prior to
March 1, 2018 |
| Class A | 1.05% | 1.06% |
| Advisor Class | 0.80 | 0.81 |
| Class C | 1.80 | 1.81 |
| Institutional Class | 0.80 | 0.81 |
| Institutional 2 Class | 0.75 | 0.795 |
| Institutional 3 Class | 0.71 | 0.745 |
| Class R | 1.30 | 1.31 |
| Class T | 1.05 | 1.06 |
Under the agreement governing these fee waivers and/or expense reimbursement arrangements, the following fees and expenses are excluded from the waiver/reimbursement commitment, and therefore will be paid by the Fund, if applicable: taxes (including foreign transaction taxes), expenses associated with investments in affiliated and non-affiliated pooled investment vehicles (including mutual funds and exchange-traded funds), transaction costs and brokerage commissions, costs related to any securities lending program, dividend expenses associated with securities sold short, inverse floater program fees and expenses, transaction charges and interest on borrowed money, interest, infrequent and/or unusual expenses and any other expenses the exclusion of which is specifically approved by the Board of Trustees. This agreement may be modified or amended only with approval from the Investment Manager, certain of its affiliates and the Fund. Reflected in the contractual cap commitment, prior to March 1, 2018, is the Transfer Agent’s contractual agreement to limit total transfer agency fees to an annual rate of not more than 0.05% for Institutional 2 Class and 0.00% for Institutional 3 Class of the average daily net assets attributable to each share class, unless sooner terminated at the sole discretion of the Board of Trustees. Any fees waived and/or expenses reimbursed under the expense reimbursement arrangements described above are not recoverable by the Investment Manager or its affiliates in future periods.
| 70 | Columbia Strategic Income Fund | Annual Report 2018 |
Notes to Financial Statements (continued)
August 31, 2018
Note 4. Federal tax information
The timing and character of income and capital gain distributions are determined in accordance with income tax regulations, which may differ from GAAP because of temporary or permanent book to tax differences.
At August 31, 2018, these differences were primarily due to differing treatment for deferral/reversal of wash sale losses, derivative investments, tax straddles, swap investments, post-October capital losses, trustees’ deferred compensation, principal and/or interest from fixed income securities, investments in partnerships and foreign currency transactions. To the extent these differences were permanent, reclassifications were made among the components of the Fund’s net assets in the Statement of Assets and Liabilities. Temporary differences do not require reclassifications.
In the Statement of Assets and Liabilities the following reclassifications were made:
Undistributed net
investment
income ($) | Accumulated
net realized
gain ($) | Paid in
capital ($) |
| (5,650,657) | 5,650,657 | — |
Net investment income (loss) and net realized gains (losses), as disclosed in the Statement of Operations, and net assets were not affected by this reclassification.
The tax character of distributions paid during the years indicated was as follows:
| Year Ended August 31, 2018 | Year Ended August 31, 2017 | Year Ended October 31, 2016 |
Ordinary
income ($) | Long-term
capital gains ($) | Total ($) | Ordinary
income ($) | Long-term
capital gains ($) | Total ($) | Ordinary
income ($) | Long-term
capital gains ($) | Total ($) |
| 166,123,050 | 17,932,427 | 184,055,477 | 78,985,978 | — | 78,985,978 | 86,902,380 | — | 86,902,380 |
Short-term capital gain distributions, if any, are considered ordinary income distributions for tax purposes.
At August 31, 2018, the components of distributable earnings on a tax basis were as follows:
Undistributed
ordinary income ($) | Undistributed
long-term
capital gains ($) | Capital loss
carryforwards ($) | Net unrealized
(depreciation) ($) |
| 43,033,502 | — | — | (77,087,061) |
At August 31, 2018, the cost of all investments for federal income tax purposes along with the aggregate gross unrealized appreciation and depreciation based on that cost was:
Federal
tax cost ($) | Gross unrealized
appreciation ($) | Gross unrealized
(depreciation) ($) | Net unrealized
(depreciation) ($) |
| 4,667,097,887 | 53,328,003 | (130,415,064) | (77,087,061) |
Tax cost of investments and unrealized appreciation/(depreciation) may also include timing differences that do not constitute adjustments to tax basis.
Under current tax rules, regulated investment companies can elect to treat certain late-year ordinary losses incurred and post-October capital losses (capital losses realized after October 31) as arising on the first day of the following taxable year. As of August 31, 2018, the Fund will elect to treat the following late-year ordinary losses and post-October capital losses as arising on September 1, 2018.
Late year
ordinary losses ($) | Post-October
capital losses ($) |
| — | 8,243,644 |
Columbia Strategic Income Fund | Annual Report 2018
| 71 |
Notes to Financial Statements (continued)
August 31, 2018
Management of the Fund has concluded that there are no significant uncertain tax positions in the Fund that would require recognition in the financial statements. However, management’s conclusion may be subject to review and adjustment at a later date based on factors including, but not limited to, new tax laws, regulations, and administrative interpretations (including relevant court decisions). Generally, the Fund’s federal tax returns for the prior three fiscal years remain subject to examination by the Internal Revenue Service.
Note 5. Portfolio information
The cost of purchases and proceeds from sales of securities, excluding short-term investments and derivatives, if any, aggregated to $7,089,723,928 and $6,103,618,462, respectively, for the year ended August 31, 2018, of which $4,087,491,788 and $3,913,727,783, respectively, were U.S. government securities. The amount of purchase and sale activity impacts the portfolio turnover rate reported in the Financial Highlights.
Note 6. Affiliated money market fund
The Fund invests in Columbia Short-Term Cash Fund, an affiliated money market fund established for the exclusive use by the Fund and other affiliated funds (the Affiliated MMF). The income earned by the Fund from such investments is included as Dividends - affiliated issuers in the Statement of Operations. As an investing fund, the Fund indirectly bears its proportionate share of the expenses of the Affiliated MMF. The Affiliated MMF prices its shares with a floating net asset value. In addition, the Board of Trustees of the Affiliated MMF may impose a fee on redemptions (sometimes referred to as a liquidity fee) or temporarily suspend redemptions (sometimes referred to as imposing a redemption gate) in the event its liquidity falls below regulatory limits.
Note 7. Interfund lending
Pursuant to an exemptive order granted by the Securities and Exchange Commission, the Fund participates in a program (the Interfund Program) allowing each participating Columbia Fund (each, a Participating Fund) to lend money directly to and, except for closed-end funds and money market funds, borrow money directly from other Participating Funds for temporary purposes. The amounts eligible for borrowing and lending under the Interfund Program are subject to certain restrictions.
Interfund loans are subject to the risk that the borrowing fund could be unable to repay the loan when due, and a delay in repayment to the lending fund could result in lost opportunities and/or additional lending costs. The exemptive order is subject to conditions intended to mitigate conflicts of interest arising from the Investment Manager’s relationship with each Participating Fund.
The Fund did not borrow or lend money under the Interfund Program during the year ended August 31, 2018.
Note 8. Line of credit
The Fund has access to a revolving credit facility with a syndicate of banks led by Citibank, N.A., HSBC Bank USA, N.A. and JPMorgan Chase Bank, N.A. whereby the Fund may borrow for the temporary funding of shareholder redemptions or for other temporary or emergency purposes. The credit facility, which is a collective agreement between the Fund and certain other funds managed by the Investment Manager, severally and not jointly, permits collective borrowings up to $1 billion. Interest is charged to each participating fund based on its borrowings at a rate equal to the higher of (i) the overnight federal funds rate plus 1.00% or (ii) the one-month LIBOR rate plus 1.00%. Each borrowing under the credit facility matures no later than 60 days after the date of borrowing. The Fund also pays a commitment fee equal to its pro rata share of the amount of the credit facility at a rate of 0.15% per annum. The commitment fee is included in other expenses in the Statement of Operations. This agreement expires annually in December unless extended or renewed.
The Fund had no borrowings during the year ended August 31, 2018.
| 72 | Columbia Strategic Income Fund | Annual Report 2018 |
Notes to Financial Statements (continued)
August 31, 2018
Note 9. Significant risks
Credit risk
Credit risk is the risk that the value of debt securities in the Fund’s portfolio may decline because the issuer may default and fail to pay interest or repay principal when due. Rating agencies assign credit ratings to debt securities to indicate their credit risk. Lower rated or unrated debt securities held by the Fund may present increased credit risk as compared to higher-rated debt securities.
Derivatives risk
Losses involving derivative instruments may be substantial, because a relatively small price movement in the underlying security(ies), commodity, currency or index or other instrument or asset may result in a substantial loss for the Fund. In addition to the potential for increased losses, the use of derivative instruments may lead to increased volatility within the Fund. Derivatives will typically increase the Fund’s exposure to principal risks to which it is otherwise exposed, and may expose the Fund to additional risks, including correlation risk, counterparty risk, hedging risk, leverage risk and liquidity risk.
Foreign securities and emerging market countries risk
Investing in foreign securities may include certain risks and considerations not typically associated with investing in U.S. securities, such as fluctuating currency values and changing local and regional economic, political and social conditions, which may result in greater market volatility. In addition, certain foreign securities may not be as liquid as U.S. securities. Investing in emerging markets may accentuate these risks. These countries are also more likely to experience high levels of inflation, deflation or currency devaluation which could hurt their economies and securities markets. To the extent that the Fund concentrates its investment exposure to any one or a few specific countries, the Fund will be particularly susceptible to the various conditions, events or other factors impacting those countries and may, therefore, have a greater risk than that of a fund which is more geographically diversified.
High-yield investments risk
Securities and other debt instruments held by the Fund that are rated below investment grade (commonly called "high-yield" or "junk" bonds) and unrated debt instruments of comparable quality expose the Fund to a greater risk of loss of principal and income than a fund that invests solely or primarily in investment grade securities. In addition, these investments have greater price fluctuations, are less liquid and are more likely to experience a default than higher-rated debt instruments. High-yield debt instruments are considered to be predominantly speculative with respect to the issuer’s capacity to pay interest and repay principal.
Interest rate risk
Interest rate risk is the risk of losses attributable to changes in interest rates. In general, if prevailing interest rates rise, the values of debt securities tend to fall, and if interest rates fall, the values of debt securities tend to rise. Actions by governments and central banking authorities can result in increases in interest rates. Increasing interest rates may negatively affect the value of debt securities held by the Fund, resulting in a negative impact on the Fund’s performance and net asset value per share. In general, the longer the maturity or duration of a debt security, the greater its sensitivity to changes in interest rates.
Liquidity risk
Liquidity risk is the risk associated with a lack of marketability of investments which may make it difficult to sell the investment at a desirable time or price. Changing regulatory, market or other conditions or environments (for example, the interest rate or credit environments) may adversely affect the liquidity of the Fund’s investments. The Fund may have to accept a lower selling price for the holding, sell other investments, or forego another, more appealing investment opportunity. Generally, the less liquid the market at the time the Fund sells a portfolio investment, the greater the risk of loss or decline of value to the Fund. A less liquid market can lead to an increase in Fund redemptions, which may negatively impact Fund performance and net asset value per share, including, for example, if the Fund is forced to sell securities in a down market.
Columbia Strategic Income Fund | Annual Report 2018
| 73 |
Notes to Financial Statements (continued)
August 31, 2018
Mortgage- and other asset-backed securities risk
The value of any mortgage-backed and other asset-backed securities held by the Fund may be affected by, among other things, changes or perceived changes in: interest rates; factors concerning the interests in and structure of the issuer or the originator of the mortgages or other assets; the creditworthiness of the entities that provide any supporting letters of credit, surety bonds or other credit enhancements; or the market’s assessment of the quality of underlying assets. Payment of principal and interest on some mortgage-backed securities (but not the market value of the securities themselves) may be guaranteed by the full faith and credit of a particular U.S. Government agency, authority, enterprise or instrumentality, and some, but not all, are also insured or guaranteed by the U.S. Government. Mortgage-backed securities issued by non-governmental issuers (such as commercial banks, savings and loan institutions, private mortgage insurance companies, mortgage bankers and other secondary market issuers) may entail greater risk than obligations guaranteed by the U.S. Government. Mortgage- and other asset-backed securities are subject to prepayment risk, which is the possibility that the underlying mortgage or other asset may be refinanced or prepaid prior to maturity during periods of declining or low interest rates, causing the Fund to have to reinvest the money received in securities that have lower yields. Rising or high interest rates tend to extend the duration of mortgage- and other asset-backed securities, making their prices more volatile and more sensitive to changes in interest rates.
Shareholder concentration risk
At August 31, 2018, one unaffiliated shareholder of record owned 10.8% of the outstanding shares of the Fund in one or more accounts. The Fund has no knowledge about whether any portion of those shares was owned beneficially. Affiliated shareholders of record owned 31.9% of the outstanding shares of the Fund in one or more accounts. Subscription and redemption activity by concentrated accounts may have a significant effect on the operations of the Fund. In the case of a large redemption, the Fund may be forced to sell investments at inopportune times, including its liquid positions, which may result in Fund losses and the Fund holding a higher percentage of less liquid positions. Large redemptions could result in decreased economies of scale and increased operating expenses for non-redeeming Fund shareholders.
Note 10. Subsequent events
Management has evaluated the events and transactions that have occurred through the date the financial statements were issued and noted no items requiring adjustment of the financial statements or additional disclosure.
Note 11. Information regarding pending and settled legal proceedings
Ameriprise Financial and certain of its affiliates have historically been involved in a number of legal, arbitration and regulatory proceedings, including routine litigation, class actions, and governmental actions, concerning matters arising in connection with the conduct of their business activities. Ameriprise Financial believes that the Fund is not currently the subject of, and that neither Ameriprise Financial nor any of its affiliates are the subject of, any pending legal, arbitration or regulatory proceedings that are likely to have a material adverse effect on the Fund or the ability of Ameriprise Financial or its affiliates to perform under their contracts with the Fund. Ameriprise Financial is required to make quarterly (10-Q), annual (10-K) and, as necessary, 8-K filings with the Securities and Exchange Commission (SEC) on legal and regulatory matters that relate to Ameriprise Financial and its affiliates. Copies of these filings may be obtained by accessing the SEC website at www.sec.gov.
There can be no assurance that these matters, or the adverse publicity associated with them, will not result in increased Fund redemptions, reduced sale of Fund shares or other adverse consequences to the Fund. Further, although we believe proceedings are not likely to have a material adverse effect on the Fund or the ability of Ameriprise Financial or its affiliates to perform under their contracts with the Fund, these proceedings are subject to uncertainties and, as such, we are unable to estimate the possible loss or range of loss that may result. An adverse outcome in one or more of these proceedings could result in adverse judgments, settlements, fines, penalties or other relief that could have a material adverse effect on the consolidated financial condition or results of operations of Ameriprise Financial.
| 74 | Columbia Strategic Income Fund | Annual Report 2018 |
Report of Independent Registered Public Accounting Firm
To the Board of Trustees of Columbia Funds Series Trust I and Shareholders of Columbia Strategic Income Fund
Opinion on the Financial Statements
We have audited the accompanying statement of assets and liabilities, including the portfolio of investments, of Columbia Strategic Income Fund (one of the funds constituting Columbia Funds Series Trust I, hereafter referred to as the “Fund”) as of August 31, 2018, the related statement of operations for the year ended August 31, 2018, the statement of changes in net assets for each of the two years in the period ended August 31, 2018, including the related notes, and the financial highlights for each of the periods indicated therein (collectively referred to as the “financial statements”). In our opinion, the financial statements present fairly, in all material respects, the financial position of the Fund as of August 31, 2018, the results of its operations for the year then ended, the changes in its net assets for each of the two years in the period ended August 31, 2018 and the financial highlights for each of the periods indicated therein in conformity with accounting principles generally accepted in the United States of America.
Basis for Opinion
These financial statements are the responsibility of the Fund’s management. Our responsibility is to express an opinion on the Fund’s financial statements based on our audits. We are a public accounting firm registered with the Public Company Accounting Oversight Board (United States) (“PCAOB”) and are required to be independent with respect to the Fund in accordance with the U.S. federal securities laws and the applicable rules and regulations of the Securities and Exchange Commission and the PCAOB.
We conducted our audits of these financial statements in accordance with the standards of the PCAOB. Those standards require that we plan and perform the audit to obtain reasonable assurance about whether the financial statements are free of material misstatement, whether due to error or fraud.
Our audits included performing procedures to assess the risks of material misstatement of the financial statements, whether due to error or fraud, and performing procedures that respond to those risks. Such procedures included examining, on a test basis, evidence regarding the amounts and disclosures in the financial statements. Our audits also included evaluating the accounting principles used and significant estimates made by management, as well as evaluating the overall presentation of the financial statements. Our procedures included confirmation of securities owned as of August 31, 2018, by correspondence with the custodian, transfer agent, agent banks, and brokers; when replies were not received from brokers, we performed other audit procedures. We believe that our audits provide a reasonable basis for our opinion.
/s/PricewaterhouseCoopers LLP
Minneapolis, Minnesota
October 22, 2018
We have served as the auditor of one or more investment companies within the Columbia Funds Complex since 1977.
Columbia Strategic Income Fund | Annual Report 2018
| 75 |
Federal Income Tax Information
(Unaudited)
The Fund hereby designates the following tax attributes for the fiscal year ended August 31, 2018. Shareholders will be notified in early 2019 of the amounts for use in preparing 2018 income tax returns.
Capital
gain
dividend | |
| $11,255,689 | |
Capital gain dividend. The Fund designates as a capital gain dividend the amount reflected above, or if subsequently determined to be different, the net capital gain of such fiscal period.
| 76 | Columbia Strategic Income Fund |���Annual Report 2018 |
Shareholders elect the Board that oversees the Fund’s operations. The Board appoints officers who are responsible for day-to-day business decisions based on policies set by the Board. The following table provides basic biographical information about the Fund’s Trustees, including their principal occupations during the past five years, although specific titles for individuals may have varied over the period. The year set forth beneath Length of Service in the table below is the year in which the Trustee was first appointed or elected as Trustee to any Fund currently in the Columbia Funds Complex or a predecessor thereof. Under current Board policy, members serve terms of indefinite duration.
Independent trustees
| Name, address, year of birth | Position held with the Trust and length of service | Principal occupation(s) during the past five years and other relevant professional experience | Number of Funds in the Columbia Fund Complex overseen | Other directorships held by Trustee during the past five years |
Janet Langford Carrig
c/o Columbia Management
Investment Advisers, LLC
225 Franklin Street
Mail Drop BX32 05228
Boston, MA 02110
1957 | Trustee
1996 | Senior Vice President, General Counsel and Corporate Secretary, ConocoPhillips (independent energy company) since September 2007 | 69 | None |
Douglas A. Hacker
c/o Columbia Management
Investment Advisers, LLC
225 Franklin Street
Mail Drop BX32 05228
Boston, MA 02110
1955 | Trustee and Chairman of the Board
1996 | Independent business executive since May 2006; Executive Vice President — Strategy of United Airlines from December 2002 to May 2006; President of UAL Loyalty Services (airline marketing company) from September 2001 to December 2002; Executive Vice President and Chief Financial Officer of United Airlines from July 1999 to September 2001 | 69 | Spartan Nash Company, (food distributor); Nash Finch Company (food distributor) from 2005 to 2013; Aircastle Limited (aircraft leasing); SeaCube Container Leasing Ltd. (container leasing) from 2010 to 2013; and Travelport Worldwide Limited (travel information technology) |
Nancy T. Lukitsh
c/o Columbia Management
Investment Advisers, LLC
225 Franklin Street
Mail Drop BX32 05228
Boston, MA 02110
1956 | Trustee
2011 | Senior Vice President, Partner and Director of Marketing, Wellington Management Company, LLP (investment adviser) from 1997 to 2010; Chair, Wellington Management Portfolios (commingled non-U.S. investment pools) from 2007 to 2010; Director, Wellington Trust Company, NA and other Wellington affiliates from 1997 to 2010 | 69 | None |
David M. Moffett
c/o Columbia Management
Investment Advisers, LLC
225 Franklin Street
Mail Drop BX32 05228
Boston, MA 02110
1952 | Trustee
2011 | Retired. Consultant to Bridgewater and Associates | 69 | Director, CSX Corporation (transportation suppliers); Genworth Financial, Inc. (financial and insurance products and services); PayPal Holdings Inc. (payment and data processing services); Trustee, University of Oklahoma Foundation; former Director, eBay Inc. (online trading community), 2007-2015; and former Director, CIT Bank, CIT Group Inc. (commercial and consumer finance), 2010-2016 |
Columbia Strategic Income Fund | Annual Report 2018
| 77 |
TRUSTEES AND OFFICERS (continued)
Independent trustees (continued)
| Name, address, year of birth | Position held with the Trust and length of service | Principal occupation(s) during the past five years and other relevant professional experience | Number of Funds in the Columbia Fund Complex overseen | Other directorships held by Trustee during the past five years |
John J. Neuhauser
c/o Columbia Management
Investment Advisers, LLC
225 Franklin Street
Mail Drop BX32 05228
Boston, MA 02110
1943 | Trustee
1984 | President, Saint Michael’s College since August 2007; Director or Trustee of several non-profit organizations, including University of Vermont Medical Center; Academic Vice President and Dean of Faculties, Boston College from August 1999 to October 2005; University Professor, Boston College from November 2005 to August 2007 | 69 | Liberty All-Star Equity Fund and Liberty All- Star Growth Fund (closed-end funds) |
Patrick J. Simpson
c/o Columbia Management
Investment Advisers, LLC
225 Franklin Street
Mail Drop BX32 05228
Boston, MA 02110
1944 | Trustee
2000 | Of Counsel, Perkins Coie LLP (law firm) since 2015; Partner, Perkins Coie LLP from 1988 to 2014 | 69 | None |
Anne-Lee Verville
c/o Columbia Management
Investment Advisers, LLC
225 Franklin Street
Mail Drop BX32 05228
Boston, MA 02110
1945 | Trustee
1998 | Retired. General Manager, Global Education Industry from 1994 to 1997, President – Application Systems Division from 1991 to 1994, Chief Financial Officer – US Marketing & Services from 1988 to 1991, and Chief Information Officer from 1987 to 1988, IBM Corporation (computer and technology) | 69 | Enesco Group, Inc. (producer of giftware and home and garden decor products) from 2001 to 2006 |
Consultants to the Independent Trustees*
| Name, address, year of birth | Position held with the Trust and length of service | Principal occupation(s) during the past five years and other relevant professional experience | Number of Funds in the Columbia Funds complex overseen | Other directorships held by Trustee during the past five years |
J. Kevin Connaughton
c/o Columbia
Management Investment
Advisers, LLC,
225 Franklin Street
Mail Drop BX32 05228,
Boston, MA 02110
1964 | Independent Trustee Consultant
2016 | Independent Trustee Consultant, Columbia Funds since March 2016; Adjunct Professor of Finance, Bentley University since November 2017; Managing Director and General Manager of Mutual Fund Products, Columbia Management Investment Advisers, LLC from May 2010 to February 2015; President, Columbia Funds from 2009 to 2015; and senior officer of Columbia Funds and affiliated funds from 2003 to 2015 | 69 | Director, The Autism Project since March 2015; former Trustee, New Century Portfolios, March 2015-December 2017; formerly on Board of Governors, Gateway Healthcare, January 2016 – December 2017 |
Natalie A. Trunow
c/o Columbia
Management Investment
Advisers, LLC,
225 Franklin Street
Mail Drop BX32 05228,
Boston, MA 02110
1967 | Independent Trustee Consultant
2016 | Independent Trustee Consultant, Columbia Funds since September 2016; Chief Executive Officer, Millennial Portfolio Solutions LLC (asset management and consulting services) since January 2016; Director of Investments, Casey Family Programs from April 2016 to September 2016; Senior Vice President and Chief Investment Officer, Calvert Investments from August 2008 to January 2016; Section Head and Portfolio Manager, General Motors Asset Management from June 1997 to August 2008 | 69 | Director, Health Services for Children with Special Needs, Inc.; Director, Guidewell Financial Solutions |
| * | J. Kevin Connaughton was appointed consultant to the Independent Trustees effective March 1, 2016. Natalie A. Trunow was appointed consultant to the Independent Trustees effective September 1, 2016. Shareholders of the Funds are expected to be asked to elect each of Mr. Connaughton and Ms. Trunow as a Trustee at a future shareholder meeting. |
| 78 | Columbia Strategic Income Fund | Annual Report 2018 |
TRUSTEES AND OFFICERS (continued)
Interested trustee affiliated with Investment Manager*
| Name, address, year of birth | Position held with the Trust and length of service | Principal occupation(s) during the past five years and other relevant professional experience | Number of Funds in the Columbia Funds Complex overseen | Other directorships held by Trustee during the past five years |
William F. Truscott
c/o Columbia Management
Investment Advisers, LLC
225 Franklin Street
Boston, MA 02110
1960 | Trustee
2012 | Chairman of the Board and President, Columbia Management Investment Advisers, LLC since May 2010 and February 2012, respectively; Chief Executive Officer, Global Asset Management, Ameriprise Financial, Inc. since September 2012 (previously Chief Executive Officer, U.S. Asset Management & President, Annuities, May 2010-September 2012); Director and Chief Executive Officer, Columbia Management Investment Distributors, Inc. since May 2010 and February 2012, respectively; Chairman of the Board and Chief Executive Officer, RiverSource Distributors, Inc. since 2006; Director, Threadneedle Asset Management Holdings, SARL since 2014; President and Chief Executive Officer, Ameriprise Certificate Company, 2006-August 2012 | 193 | Chairman of the Board, Columbia Management Investment Advisers, LLC since May 2010; Director, Columbia Management Investment Distributors, Inc. since May 2010; former Director, Ameriprise Certificate Company, 2006 - January 2013 |
| * | Interested person (as defined under the 1940 Act) by reason of being an officer, director, security holder and/or employee of the Investment Manager or Ameriprise Financial. |
The Statement of Additional Information has additional information about the Fund’s Board members and is available, without charge, upon request by calling 800.345.6611, visiting columbiathreadneedleus.com/investor/ or contacting your financial intermediary.
Columbia Strategic Income Fund | Annual Report 2018
| 79 |
TRUSTEES AND OFFICERS (continued)
The Board has appointed officers who are responsible for day-to-day business decisions based on policies it has established. The officers serve at the pleasure of the Board. The following table provides basic information about the Officers of the Fund, including principal occupations during the past five years, although their specific titles may have varied over the period. In addition to Mr. Truscott, who is Senior Vice President, the Fund’s other officers are:
Fund officers
Name,
address and
year of birth | Position and year
first appointed to
position for any Fund
in the Columbia
Funds complex or a
predecessor thereof | Principal occupation(s) during past five years |
Christopher O. Petersen
5228 Ameriprise
Financial Center
Minneapolis, MN 55474
Born 1970 | President and Principal Executive Officer (2015) | Vice President and Lead Chief Counsel, Ameriprise Financial, Inc. since January 2015 (previously, Vice President and Chief Counsel, January 2010 - December 2014; officer of Columbia Funds and affiliated funds since 2007. |
Michael G. Clarke
225 Franklin Street
Boston, MA 02110
Born 1969 | Treasurer (2011), Chief Financial Officer (2009) and Chief Accounting Officer (2015) | Vice President — Mutual Fund Administration, Columbia Management Investment Advisers, LLC, since May 2010; senior officer of Columbia Funds and affiliated funds since 2002. |
Paul B. Goucher
100 Park Avenue
New York, NY 10017
Born 1968 | Senior Vice President (2011) and Assistant Secretary (2008) | Senior Vice President and Assistant General Counsel, Ameriprise Financial, Inc. since January 2017 (previously, Vice President and Lead Chief Counsel, November 2008 - January 2017 and January 2013 - January 2017, respectively); Vice President, Chief Legal Officer and Assistant Secretary, Columbia Management Investment Advisers, LLC since May 2010. |
Thomas P. McGuire
225 Franklin Street
Boston, MA 02110
Born 1972 | Senior Vice President and Chief Compliance Officer (2012) | Vice President — Asset Management Compliance, Ameriprise Financial, Inc., since May 2010; Chief Compliance Officer, Ameriprise Certificate Company since September 2010. |
Colin Moore
225 Franklin Street
Boston, MA 02110
Born 1958 | Senior Vice President (2010) | Executive Vice President and Global Chief Investment Officer, Ameriprise Financial, Inc., since July 2013; Executive Vice President and Global Chief Investment Officer, Columbia Management Investment Advisers, LLC since July 2013. |
Ryan C. Larrenaga
225 Franklin Street
Boston, MA 02110
Born 1970 | Senior Vice President (2017), Chief Legal Officer (2017) and Secretary (2015) | Vice President and Chief Counsel, Ameriprise Financial, Inc. since August 2018 (previously, Vice President and Group Counsel, August 2011 - August 2018); officer of Columbia Funds and affiliated funds since 2005. |
Michael E. DeFao
225 Franklin Street
Boston, MA 02110
Born 1968 | Vice President (2011) and Assistant Secretary (2010) | Vice President and Chief Counsel, Ameriprise Financial, Inc. since May 2010. |
Amy Johnson
5228 Ameriprise
Financial Center
Minneapolis, MN 55474
Born 1965 | Vice President (2006) | Managing Director and Global Head of Operations, Columbia Management Investment Advisers, LLC since April 2016 (previously Managing Director and Chief Operating Officer, 2010 - 2016). |
Lyn Kephart-Strong
5228 Ameriprise
Financial Center
Minneapolis, MN 55474
Born 1960 | Vice President (2015) | President, Columbia Management Investment Services Corp. since October 2014; Vice President & Resolution Officer, Ameriprise Trust Company since August 2009. |
| 80 | Columbia Strategic Income Fund | Annual Report 2018 |
Board Consideration and Approval of Management
Agreement
On June 12, 2018, the Board of Trustees (the Board) and the Trustees who are not interested persons (as defined in the Investment Company Act of 1940) (the Independent Trustees) of Columbia Funds Series Trust I (the Trust) unanimously approved the continuation of the Management Agreement (the Management Agreement) with Columbia Management Investment Advisers, LLC (the Investment Manager) with respect to Columbia Strategic Income Fund (the Fund), a series of the Trust. As detailed below, the Board’s Advisory Fees and Expenses Committee (the Committee) and the Board met on multiple occasions to review and discuss, among themselves, with the management team of the Investment Manager and with an independent fee consultant, materials provided by the Investment Manager, the independent fee consultant and others before determining to approve the continuation of the Management Agreement.
In connection with their deliberations regarding the continuation of the Management Agreement, the Committee and the Board evaluated materials requested from the Investment Manager regarding the Fund and the Management Agreement, and discussed these materials with representatives of the Investment Manager at Committee meetings held on March 6, 2018, April 26, 2018 and June 11, 2018 and at Board meetings held on March 7, 2018 and June 12, 2018. In addition, the Board and its various committees consider matters bearing on the Management Agreement at other meetings throughout the year and in prior years and meet regularly with senior management of the Trust and the Investment Manager. Through the Board’s Investment Oversight Committees, Trustees also meet with selected portfolio managers of the funds the Trustees oversee and with other investment personnel at various times throughout the year. The Committee and the Board also consulted with the independent fee consultant, Fund counsel and the Independent Trustees’ independent legal counsel, who advised on various matters with respect to the Committee’s and the Board’s considerations and otherwise assisted the Committee and the Board in their deliberations. On June 11, 2018, the Committee recommended that the Board approve the continuation of the Management Agreement. On June 12, 2018, the Board, including the Independent Trustees, voting separately, unanimously approved the continuation of the Management Agreement for the Fund.
The Committee and the Board considered all information that they, their legal counsel or the Investment Manager believed reasonably necessary to evaluate and to determine whether to recommend for approval or approve the continuation of the Management Agreement. The information and factors considered by the Committee and the Board in recommending for approval or approving the continuation of the Management Agreement for the Fund included the following:
| • | Information on the investment performance of the Fund relative to the performance of a group of mutual funds determined to be comparable to the Fund by an independent third-party data provider, as well as performance relative to benchmarks; |
| • | Information on the Fund’s management fees and total expenses, including information comparing the Fund’s expenses to those of a group of comparable mutual funds, as determined by the independent third-party data provider; |
| • | The Investment Manager’s agreement to contractually limit or cap total operating expenses for the Fund through December 31, 2019 so that total operating expenses (excluding certain fees and expenses, such as transaction costs and certain other investment related expenses, interest, taxes, acquired fund fees and expenses, and infrequent and/or unusual expenses) would not exceed a specified annual rate, as a percentage of the Fund’s net assets; |
| • | The terms and conditions of the Management Agreement; |
| • | The current and proposed terms and conditions of other agreements and arrangements with affiliates of the Investment Manager relating to the operations of the Fund, including agreements with respect to the provision of distribution, transfer agency and shareholder services to the Fund; |
| • | Descriptions of various functions performed by the Investment Manager under the Management Agreement, including portfolio management and portfolio trading practices; |
| • | Information regarding the management fees of similarly-managed portfolios of other clients of the Investment Manager, including institutional accounts and collective trusts; |
| • | Information regarding the reputation, regulatory history and resources of the Investment Manager, including information regarding senior management, portfolio managers and other personnel; |
Columbia Strategic Income Fund | Annual Report 2018
| 81 |
Board Consideration and Approval of Management
Agreement (continued)
| • | Information regarding the capabilities of the Investment Manager with respect to compliance monitoring services, including an assessment of the Investment Manager’s compliance system by the Fund’s Chief Compliance Officer; and |
| • | The profitability to the Investment Manager and its affiliates from their relationships with the Fund. |
Nature, extent and quality of services provided under the Management Agreement
The Committee and the Board considered the nature, extent and quality of services provided to the Fund by the Investment Manager and its affiliates under the Management Agreement and under separate agreements for the provision of transfer agency and shareholder services, and the resources dedicated to the Fund and the other Columbia Funds by the Investment Manager and its affiliates. The Committee and the Board considered, among other things, the Investment Manager’s ability to attract, motivate and retain highly qualified research, advisory and supervisory investment professionals (including compensation programs for personnel involved in fund management, reputation and other attributes), the portfolio management services provided by those investment professionals, and the quality of the Investment Manager’s investment research capabilities and trade execution services. The Committee and the Board also considered the potential benefits to shareholders of investing in a mutual fund that is part of a fund complex offering exposure to a variety of asset classes and investment disciplines and providing a variety of fund and shareholder services.
The Committee and the Board also considered the professional experience and qualifications of the senior personnel of the Investment Manager, which included consideration of the Investment Manager’s experience with similarly-structured funds. The Committee and the Board noted the compliance programs of and the compliance-related resources provided to the Fund by the Investment Manager and its affiliates and the resources dedicated by the Investment Manager and its affiliates to risk management, and considered the Investment Manager’s ability to provide administrative services to the Fund and coordinate the activities of the Fund’s other service providers. After reviewing these and related factors, the Committee and the Board concluded, within the context of their overall conclusions, that the nature, extent and quality of the services provided to the Fund under the Management Agreement supported the continuation of the Management Agreement.
Investment performance
The Committee and the Board reviewed information about the performance of the Fund over various time periods, including performance information relative to benchmarks, information that compared the performance of the Fund to the performance of a group of comparable mutual funds as determined by the independent third-party data provider, and information and analysis provided by the independent fee consultant. The Committee and the Board also reviewed a description of the third party’s methodology for identifying the Fund’s peer groups for purposes of performance and expense comparisons. Although the Fund’s performance lagged that of a relevant peer group for certain (although not necessarily all) periods, the Committee and the Board concluded that other factors relevant to performance were sufficient, in light of other considerations, to support continuation of the Management Agreement. Those factors included one or more of the following: (i) that the Fund’s performance, although lagging in certain recent periods, was stronger over the longer term; (ii) that the underperformance was attributable, to a significant extent, to investment decisions that were reasonable and consistent with the Fund’s investment strategy and policies and that the Fund was performing within a reasonable range of expectations, given those investment decisions, market conditions and the Fund’s investment strategy; (iii) that the Fund’s performance was competitive when compared to other relevant performance benchmarks or peer groups; and (iv) that the Investment Manager had taken or was taking steps designed to help improve the Fund’s investment performance, including, but not limited to, replacing portfolio managers, enhancing the resources supporting the portfolio managers, or modifying investment strategies.
The Committee and the Board noted that, through December 31, 2017, the Fund’s performance was in the fifty-sixth, twenty-fifth and forty-second percentile (where the best performance would be in the first percentile) of its category selected by the independent third-party data provider for the purposes of performance comparisons for the one-, three- and five-year periods, respectively.
The Committee and the Board also considered the Investment Manager’s performance and reputation generally, the Investment Manager’s historical responsiveness to Board concerns about performance, and the Investment Manager’s willingness to take steps intended to improve performance. After reviewing these and related factors, the Committee and the Board concluded, within the context of their overall conclusions, that the performance of the Fund and the Investment Manager was sufficient, in light of other considerations, to support the continuation of the Management Agreement.
| 82 | Columbia Strategic Income Fund | Annual Report 2018 |
Board Consideration and Approval of Management
Agreement (continued)
Investment management fee rates and other expenses
The Committee and the Board considered the management fees charged to the Fund under the Management Agreement as well as the total expenses incurred by the Fund. In assessing the reasonableness of the fees under the Management Agreement, the Committee and the Board considered, among other information, the Fund’s total expense ratio as a percentage of average daily net assets. The Committee and the Board considered data provided by the independent third-party data provider and the independent fee consultant. The Committee and the Board noted that, as of December 31, 2017, the Fund’s actual management fee and net total expense ratio were ranked in the third and second quintiles, respectively, (where the lowest fees and expenses would be in the first quintile) against the Fund’s expense universe as determined by the independent third-party data provider for purposes of expense comparison. The Committee and the Board also took into account the fee waiver and expense limitation arrangements agreed to by the Investment Manager, as noted above.
The Committee and the Board also received and considered information about the management fees charged by the Investment Manager to institutional accounts. In considering the fees charged to those accounts, the Committee and the Board took into account, among other things, the Investment Manager’s representations about the differences between managing mutual funds as compared to other types of accounts, including differences in the services provided, differences in the risk profile of such business for the Investment Manager and the additional resources required to manage mutual funds effectively. The Committee and the Board also received and considered information about the fees charged by the Investment Manager for sub-advisory services it provides to comparable unaffiliated funds. In evaluating the Fund’s management fees, the Committee and the Board also took into account the demands, complexity and quality of the investment management of the Fund.
After reviewing these and related factors, the Committee and the Board concluded, within the context of their overall conclusions, that the management fee rates and expenses of the Fund, in light of other considerations, supported the continuation of the Management Agreement.
Costs of services provided and profitability
The Committee and the Board also took note of the costs the Investment Manager and its affiliates incur in connection with the services provided and the profitability to the Investment Manager and its affiliates from their relationships with the Fund.
The Committee and the Board also considered the compensation directly or indirectly received by the Investment Manager’s affiliates in connection with their relationships with the Fund. The Committee and the Board reviewed information provided by management as to the profitability to the Investment Manager and its affiliates of their relationships with the Fund, information about the allocation of expenses used to calculate profitability, and comparisons of profitability levels realized in 2017 to profitability levels realized in 2016. When reviewing profitability, the Committee and the Board also considered court cases in which adviser profitability was an issue in whole or in part, the performance of similarly managed funds, the performance of the Fund, and the expense ratio of the Fund. In addition, the Committee and the Board considered information provided by the Investment Manager regarding the Investment Manager’s financial condition and comparing its profitability to that of other asset management firms that are, or are subsidiaries of, publicly traded companies. In this regard, the Committee and the Board also considered data provided by the independent fee consultant.
After reviewing these and related factors, the Committee and the Board concluded, within the context of their overall conclusions, that the costs of services provided and the profitability to the Investment Manager and its affiliates from their relationships with the Fund supported the continuation of the Management Agreement.
Economies of scale
The Committee and the Board considered the potential existence of economies of scale in the provision by the Investment Manager of services to the Fund, to groups of related funds, and to the Investment Manager’s investment advisory clients as a whole, and whether those economies of scale were shared with the Fund through breakpoints in investment management fees or other means, such as expense limitation arrangements and additional investments by the Investment Manager in investment, trading, compliance and other resources. The Committee and the Board noted that the management fee schedules for the Fund contained breakpoints that would reduce the fee rate on assets above specified threshold levels.
Columbia Strategic Income Fund | Annual Report 2018
| 83 |
Board Consideration and Approval of Management
Agreement (continued)
In considering these matters, the Committee and the Board also considered the costs of the services provided and the profitability to the Investment Manager and its affiliates from their relationships with the Fund, as noted above. After reviewing these and related factors, the Committee and the Board concluded, within the context of their overall conclusions, that the extent to which any economies of scale were expected to be shared with the Fund supported the continuation of the Management Agreement.
Other benefits to the Investment Manager
The Committee and the Board received and considered information regarding “fall-out” or ancillary benefits received by the Investment Manager and its affiliates as a result of their relationships with the Fund, such as the engagement of the Investment Manager’s affiliates to provide distribution, transfer agency and shareholder services to the Fund. In this regard, among other matters, the Committee and the Board considered that the Fund’s distributor retains a portion of the distribution fees from the Fund and receives a portion of the sales charges on sales or redemptions of certain classes of shares of the Fund. The Committee and the Board also considered the benefits of research made available to the Investment Manager by reason of brokerage commissions generated by the Fund’s securities transactions, and reviewed information about the Investment Manager’s practices with respect to considering brokerage and research services when allocating portfolio transactions. In this connection, the Board also noted that the amount of research made available to the Investment Manager by reason of brokerage commissions had been declining over time, and may decline further. The Committee and the Board recognized that the Investment Manager’s profitability would be somewhat lower without these benefits.
Conclusion
The Committee and the Board reviewed all of the above considerations in reaching their decisions to recommend or approve the continuation of the Management Agreement. In their deliberations, the Trustees did not identify any particular information that was all-important or controlling, and individual Trustees may have attributed different weights to the various factors. Based on their evaluation of all factors that they deemed to be material, including those factors described above, and assisted by the advice of independent legal counsel, the Board, including the Independent Trustees, voting separately, unanimously approved the continuation of the Management Agreement.
| 84 | Columbia Strategic Income Fund | Annual Report 2018 |
The Fund mails one shareholder report to each shareholder address. If you would like more than one report, please call shareholder services at 800.345.6611 and additional reports will be sent to you.
Proxy voting policies and procedures
The policy of the Board of Trustees is to vote the proxies of the companies in which the Fund holds investments consistent with the procedures as stated in the Statement of Additional Information (SAI). You may obtain a copy of the SAI without charge by calling 800.345.6611; contacting your financial intermediary; visiting columbiathreadneedleus.com/investor/; or searching the website of the Securities and Exchange Commission (SEC) at sec.gov. Information regarding how the Fund voted proxies relating to portfolio securities is filed with the SEC by August 31st for the most recent 12-month period ending June 30th of that year, and is available without charge by visiting columbiathreadneedleus.com/investor/, or searching the website of the SEC at sec.gov.
Quarterly schedule of investments
The Fund files a complete schedule of portfolio holdings with the SEC for the first and third quarters of each fiscal year on Form N-Q or Form N-PORT. The Fund’s Form N-Q or Form N-PORT is available on the SEC’s website at sec.gov and may be reviewed and copied at the SEC’s Public Reference Room in Washington, D.C. Information on the operation of the Public Reference Room may be obtained by calling 800.SEC.0330. The Fund’s complete schedule of portfolio holdings, as filed on Form N-Q or Form N-PORT, can also be obtained without charge, upon request, by calling 800.345.6611.
Additional Fund information
For more information about the Fund, please visit columbiathreadneedleus.com/investor/ or call 800.345.6611. Customer Service Representatives are available to answer your questions Monday through Friday from 8 a.m. to 7 p.m. Eastern time.
Fund investment manager
Columbia Management Investment Advisers, LLC
225 Franklin Street
Boston, MA 02110
Fund distributor
Columbia Management Investment Distributors, Inc.
225 Franklin Street
Boston, MA 02110
Fund transfer agent
Columbia Management Investment Services Corp.
Through October 31, 2018:
P.O. Box 8081
Boston, MA 02266-8081
Effective November 1, 2018:
P.O. Box 219104
Kansas City, MO 64121-9104
Columbia Strategic Income Fund | Annual Report 2018
| 85 |
Columbia Strategic Income Fund
Through October 31, 2018:
P.O. Box 8081
Boston, MA 02266-8081
Effective November 1, 2018:
P.O. Box 219104
Kansas City, MO 64121-9104
Please read and consider the investment objectives, risks, charges and expenses for any fund carefully before investing. For a prospectus and summary prospectus, which contains this and other important information about the Fund, go to
columbiathreadneedleus.com/investor/. The Fund is distributed by Columbia Management Investment Distributors, Inc., member FINRA, and managed by Columbia Management Investment Advisers, LLC.
Columbia Threadneedle Investments (Columbia Threadneedle) is the global brand name of the Columbia and Threadneedle group of companies. All rights reserved.
© 2018 Columbia Management Investment Advisers, LLC.
columbiathreadneedleus .com/investor/

Annual Report
August 31, 2018
Multi-Manager International Equity Strategies Fund
Not FDIC Insured • No bank guarantee • May lose value
Dear Shareholders,
Volatility exists in financial markets and this is not a comfortable fact of life. How investors deal with this reality, including how they react to short term spikes in volatility as well as to longer periods of increased or decreased volatility, may have a significant impact on their overall investing success.
Too often, investors change their investment strategy based on something that’s happening at a moment in time rather than thinking about how that change in strategy might affect their ability to achieve their longer-term financial goals. Emotion replaces logic and reasoning. Investors may sell in reaction to a market drop (fear or panic), locking in low returns which means they won’t be invested when the market returns, or they invest more at a market peak (greed or conviction), essentially when it is expensive to do so. In both cases, selling and buying at the exact wrong time.
We believe the best outcomes come from a consistent approach to investing. Here are five areas where advisors can help us overcome the tendency to react emotionally as we struggle to make the right choices with our investments:
Long-term focus
The further away long-term goals, aspirations and objectives are, the easier it is to stray away from the goals and priorities that we set out. Advisors help us stay focused on what we want to accomplish.
Discipline through up-and-down markets
Advisors help set rules to prevent us from making rash decisions that we may regret later. Knowing ahead of time what you should do in case of certain situations will help you get through volatile markets and not make emotional decisions.
Tax-awareness
Taxes are one of the biggest drags on investment returns and are critical attributes of investing. Yet few of us take the necessary steps to ease the corrosive effect of taxes. Advisors have tools and knowledge that may help us to manage portfolios more tax-efficiently and keep more of what we earn.
Emotional objectivity
Our emotions are very hard to manage and making investment decisions in an emotional state can lead to exceedingly bad outcomes. An objective advisor can help prevent some of the reactionary mistakes emotions often lead us to.
Education and guidance
The role of the advisor is to teach and guide us toward achieving our financial goals. In terms of working through emotions, guidance is by far the most important component.
By understanding our own behaviors and biases, we can prepare for future challenges. Your success is our priority. Talk to your advisor about how working with Columbia Threadneedle Investments may help you stay the course and position your portfolio for consistent, sustainable outcomes, regardless of market conditions.
Sincerely,
Christopher O. Petersen
President, Columbia Funds
Multi-Manager International Equity Strategies Fund | Annual Report 2018
Multi-Manager International Equity Strategies Fund | Annual Report 2018
Investment objective
Multi-Manager International Equity Strategies Fund (the Fund) seeks long-term capital appreciation.
Portfolio management
Arrowstreet Capital
Peter Rathjens, Ph.D.
John Capeci, Ph.D.
Tuomo Vuolteenaho, Ph.D.
Manolis Liodakis, Ph.D., M.B
Baillie Gifford Overseas Limited
Jonathan Bates
Donald Farquharson, CFA
Angus Franklin
Andrew Stobart
Andrew Strathdee, Ph.D.
Jenny Tabberer
Tom Walsh, CFA
Causeway Capital Management LLC
Sarah Ketterer, M.B.A.
Harry Hartford
James Doyle, M.B.A.
Conor Muldoon, CFA, M.B.A
Alessandro Valentini, CFA, M.B.A.
Jonathan Eng, M.B.A.
Foster Corwith, CFA, M.B.A.
Ellen Lee, M.B.A.
Morningstar style boxTM
The Morningstar Style Box is based on a fund’s portfolio holdings. For equity funds, the vertical axis shows the market capitalization of the stocks owned, and the horizontal axis shows investment style (value, blend, or growth). Information shown is based on the most recent data provided by Morningstar.
© 2018 Morningstar, Inc. All rights reserved. The Morningstar information contained herein: (1) is proprietary to Morningstar and/or its content providers; (2) may not be copied or distributed; and (3) is not warranted to be accurate, complete or timely. Neither Morningstar nor its content providers are responsible for any damages or losses arising from any use of this information.
| Top 10 holdings (%) (at August 31, 2018) |
| SAP SE (Germany) | 2.1 |
| Roche Holding AG, Genusschein Shares (Switzerland) | 1.6 |
| Taiwan Semiconductor Manufacturing Co., Ltd., ADR (Taiwan) | 1.4 |
| Linde AG (Germany) | 1.4 |
| Prudential PLC (United Kingdom) | 1.3 |
| Volkswagen AG (Germany) | 1.3 |
| Novartis AG, Registered Shares (Switzerland) | 1.2 |
| UniCredit SpA (Italy) | 1.1 |
| British American Tobacco PLC (United Kingdom) | 1.1 |
| Samsung Electronics Co., Ltd. GDR (South Korea) | 1.1 |
Percentages indicated are based upon total investments (excluding Money Market Funds and derivatives, if any).
For further detail about these holdings, please refer to the section entitled “Portfolio of Investments.”
Fund holdings are as of the date given, are subject to change at any time, and are not recommendations to buy or sell any security.
| Equity sector breakdown (%) (at August 31, 2018) |
| Consumer Discretionary | 11.2 |
| Consumer Staples | 6.7 |
| Energy | 6.2 |
| Financials | 19.8 |
| Health Care | 11.0 |
| Industrials | 17.1 |
| Information Technology | 14.0 |
| Materials | 8.1 |
| Real Estate | 0.1 |
| Telecommunication Services | 3.9 |
| Utilities | 1.9 |
| Total | 100.0 |
Percentages indicated are based upon total equity investments. The Fund’s portfolio composition is subject to change.
| 2 | Multi-Manager International Equity Strategies Fund | Annual Report 2018 |
Fund at a Glance (continued)
| Country breakdown (%) (at August 31, 2018) |
| Argentina | 1.0 |
| Australia | 3.1 |
| Austria | 0.0 (a) |
| Brazil | 0.6 |
| Cambodia | 0.0 (a) |
| Canada | 4.7 |
| Cayman Islands | 0.0 (a) |
| China | 2.5 |
| Denmark | 1.7 |
| Finland | 1.3 |
| France | 5.2 |
| Germany | 10.6 |
| Hong Kong | 2.0 |
| Ireland | 1.9 |
| Israel | 0.4 |
| Italy | 2.4 |
| Japan | 16.0 |
| Jersey | 0.3 |
| Luxembourg | 0.4 |
| Netherlands | 4.5 |
| Norway | 0.2 |
| Country breakdown (%) (at August 31, 2018) |
| Panama | 0.3 |
| Peru | 0.4 |
| Portugal | 0.1 |
| Russian Federation | 0.3 |
| Singapore | 0.6 |
| South Africa | 1.4 |
| South Korea | 3.1 |
| Spain | 2.5 |
| Sweden | 1.9 |
| Switzerland | 8.2 |
| Taiwan | 1.7 |
| Thailand | 0.0 (a) |
| Turkey | 0.1 |
| United Kingdom | 19.0 |
| United States(b) | 1.6 |
| Total | 100.0 |
| (a) | Rounds to zero. |
| (b) | Includes investments in Money Market Funds. |
Country breakdown is based primarily on issuer’s place of organization/incorporation. Percentages indicated are based upon total investments and exclude investments in derivatives, if any. The Fund’s portfolio composition is subject to change.
Multi-Manager International Equity Strategies Fund | Annual Report 2018
| 3 |
Understanding Your Fund’s Expenses
(Unaudited)
As an investor, you incur two types of costs. There are shareholder transaction costs, which may include redemption fees. There are also ongoing costs, which generally include management fees, distribution and/or service fees, and other fund expenses. The following information is intended to help you understand your ongoing costs (in dollars) of investing in the Fund and to help you compare these costs with the ongoing costs of investing in other mutual funds.
Analyzing your Fund’s expenses
To illustrate these ongoing costs, we have provided examples and calculated the expenses paid by investors in each share class of the Fund during the period. The actual and hypothetical information in the table is based on an initial investment of $1,000 at the beginning of the period indicated and held for the entire period. Expense information is calculated two ways and each method provides you with different information. The amount listed in the “Actual” column is calculated using the Fund’s actual operating expenses and total return for the period. You may use the Actual information, together with the amount invested, to estimate the expenses that you paid over the period. Simply divide your account value by $1,000 (for example, an $8,600 account value divided by $1,000 = 8.6), then multiply the results by the expenses paid during the period under the “Actual” column. The amount listed in the “Hypothetical” column assumes a 5% annual rate of return before expenses (which is not the Fund’s actual return) and then applies the Fund’s actual expense ratio for the period to the hypothetical return. You should not use the hypothetical account values and expenses to estimate either your actual account balance at the end of the period or the expenses you paid during the period. See “Compare with other funds” below for details on how to use the hypothetical data.
Compare with other funds
Since all mutual funds are required to include the same hypothetical calculations about expenses in shareholder reports, you can use this information to compare the ongoing cost of investing in the Fund with other funds. To do so, compare the hypothetical example with the 5% hypothetical examples that appear in the shareholder reports of other funds. As you compare hypothetical examples of other funds, it is important to note that hypothetical examples are meant to highlight the ongoing costs of investing in a fund only and do not reflect any transaction costs, such as redemption or exchange fees. Therefore, the hypothetical calculations are useful in comparing ongoing costs only, and will not help you determine the relative total costs of owning different funds. If transaction costs were included in these calculations, your costs would be higher.
| March 1, 2018 — August 31, 2018 |
| | Account value at the
beginning of the
period ($) | Account value at the
end of the
period ($) | Expenses paid during
the period ($) | Fund’s annualized
expense ratio (%) |
| | Actual | Hypothetical | Actual | Hypothetical | Actual | Hypothetical | Actual |
| Institutional Class | 1,000.00 | 1,000.00 | 967.00 (a) | 1,019.91 | 3.03 (a) | 5.35 | 1.05 (a) |
| (a) | Based on operations from May 17, 2018 (commencement of operations) through the stated period end. |
Expenses paid during the period are equal to the annualized expense ratio for each class as indicated above, multiplied by the average account value over the period and then multiplied by the number of days in the Fund’s most recent fiscal half year and divided by 365.
Expenses do not include fees and expenses incurred indirectly by the Fund from its investment in underlying funds, including affiliated and non-affiliated pooled investment vehicles, such as mutual funds and exchange-traded funds.
The Fund is offered only through certain wrap fee programs sponsored and/or managed by Ameriprise Financial, Inc. or its affiliates. Participants in wrap fee programs pay other fees that are not included in the above table. Please refer to the wrap program documents for information about the fees charged.
| 4 | Multi-Manager International Equity Strategies Fund | Annual Report 2018 |
Portfolio of Investments
August 31, 2018
(Percentages represent value of investments compared to net assets)
Investments in securities
| Common Stocks 96.6% |
| Issuer | Shares | Value ($) |
| Argentina 1.0% |
| MercadoLibre, Inc. | 57,844 | 19,806,364 |
| Australia 3.1% |
| Accent Group Ltd. | 288,789 | 341,363 |
| Afterpay Touch Group Ltd.(a) | 15,445 | 200,859 |
| Altium Ltd. | 5,488 | 110,865 |
| Aristocrat Leisure Ltd. | 16,664 | 379,058 |
| ASX Ltd. | 18,336 | 893,091 |
| Aurizon Holdings Ltd. | 413,814 | 1,252,703 |
| Beach Energy Ltd. | 154,206 | 215,547 |
| BHP Billiton Ltd. | 88,489 | 2,125,717 |
| BHP Billiton Ltd., ADR | 55,500 | 2,666,220 |
| Blackmores Ltd. | 3,980 | 470,761 |
| BlueScope Steel Ltd. | 66,381 | 826,237 |
| Brambles Ltd. | 115,735 | 914,067 |
| Caltex Australia Ltd. | 15,419 | 335,059 |
| carsales.com Ltd. | 84,825 | 946,802 |
| Cleanaway Waste Management Ltd. | 495,121 | 685,561 |
| Coca-Cola Amatil Ltd. | 42,304 | 286,322 |
| Cochlear Ltd. | 53,769 | 8,360,909 |
| Computershare Ltd. | 18,239 | 252,344 |
| Crown Resorts Ltd. | 113,389 | 1,159,561 |
| CSL Ltd. | 61,247 | 10,040,621 |
| CSL Ltd. ADR | 2,600 | 213,629 |
| Harvey Norman Holdings Ltd. | 196,586 | 509,195 |
| IDP Education Ltd. | 22,107 | 172,754 |
| Insurance Australia Group Ltd. | 188,023 | 1,044,946 |
| James Hardie Industries PLC | 327,504 | 4,986,497 |
| Medibank Pvt Ltd. | 544,569 | 1,191,599 |
| Metcash Ltd. | 184,101 | 366,574 |
| NEXTDC Ltd.(a) | 37,343 | 190,912 |
| nib holdings Ltd. | 49,846 | 234,171 |
| Nine Entertainment Co. Holdings Ltd. | 102,527 | 178,143 |
| Oil Search Ltd. | 119,157 | 769,142 |
| Perpetual Ltd. | 34,774 | 1,098,174 |
| Pinnacle Investment Management Group Ltd. | 23,333 | 123,625 |
| Platinum Asset Management Ltd. | 103,105 | 402,195 |
| Common Stocks (continued) |
| Issuer | Shares | Value ($) |
| QBE Insurance Group Ltd. | 17,683 | 140,322 |
| REA Group Ltd. | 17,908 | 1,177,563 |
| Reliance Worldwide Corp., Ltd. | 129,447 | 495,431 |
| Sandfire Resources NL | 68,089 | 347,196 |
| Seek Ltd. | 212,137 | 3,430,742 |
| South32 Ltd. | 197,950 | 495,099 |
| Steadfast Group Ltd. | 163,339 | 348,341 |
| Suncorp Group Ltd. | 59,801 | 666,881 |
| Super Retail Group Ltd. | 97,788 | 657,905 |
| Treasury Wine Estates Ltd. | 87,798 | 1,234,143 |
| Wesfarmers Ltd. | 103,907 | 3,855,366 |
| Western Areas Ltd. | 51,894 | 97,450 |
| WiseTech Global Ltd. | 21,275 | 327,474 |
| Woodside Petroleum Ltd. | 49,951 | 1,325,208 |
| Woolworths Group Ltd. | 187,250 | 3,822,078 |
| Total | 62,366,422 |
| Austria 0.0% |
| Erste Group Bank AG | 14,556 | 579,021 |
| FACC AG | 5,767 | 145,261 |
| Total | 724,282 |
| Brazil 0.6% |
| Itaú Unibanco Holding SA, ADR | 439,903 | 4,583,789 |
| Kroton Educacional SA | 1,485,300 | 3,726,834 |
| Petroleo Brasileiro SA, ADR | 316,690 | 3,442,420 |
| Total | 11,753,043 |
| Cambodia 0.0% |
| NagaCorp Ltd. | 836,000 | 877,266 |
| Canada 4.7% |
| Canadian Imperial Bank of Commerce | 23,450 | 2,197,651 |
| Canadian National Railway Co. | 45,767 | 4,069,144 |
| Canadian Pacific Railway Ltd. | 64,539 | 13,574,950 |
| Canadian Tire Corp., Ltd., Class A | 6,200 | 775,689 |
| Constellation Software, Inc. | 16,041 | 12,231,601 |
| EnCana Corp. | 1,104,450 | 14,624,441 |
| Fairfax Financial Holdings Ltd. | 27,555 | 15,128,012 |
| Gildan Activewear, Inc. | 341,341 | 10,059,751 |
The accompanying Notes to Financial Statements are an integral part of this statement.
Multi-Manager International Equity Strategies Fund | Annual Report 2018
| 5 |
Portfolio of Investments (continued)
August 31, 2018
| Common Stocks (continued) |
| Issuer | Shares | Value ($) |
| Manulife Financial Corp. | 888,929 | 16,266,379 |
| Restaurant Brands International Inc | 33,680 | 1,931,761 |
| Ritchie Bros. Auctioneers, Inc. | 130,926 | 4,989,590 |
| Total | 95,848,969 |
| Cayman Islands 0.0% |
| Microport Scientific Corp. | 246,000 | 310,862 |
| China 2.5% |
| Alibaba Group Holding Ltd., ADR(a) | 55,700 | 9,748,057 |
| Baidu, Inc., ADR(a) | 69,676 | 15,780,220 |
| China Mobile Ltd. | 2,186,500 | 20,565,163 |
| China Petroleum & Chemical Corp. ADR | 7,200 | 715,032 |
| Ctrip.com International Ltd., ADR(a) | 129,474 | 5,068,907 |
| Total | 51,877,379 |
| Denmark 1.6% |
| AP Moller - Maersk A/S, Class B | 610 | 941,472 |
| Danske Bank A/S | 100,565 | 2,958,761 |
| DSV A/S | 141,273 | 13,238,157 |
| Novo Nordisk A/S, ADR | 85,600 | 4,208,952 |
| Novozymes AS, Class B | 133,649 | 7,325,285 |
| Pandora A/S | 80,111 | 4,786,302 |
| William Demant Holding AS(a) | 5,358 | 217,918 |
| Total | 33,676,847 |
| Finland 1.3% |
| Fortum OYJ | 92,824 | 2,348,851 |
| Kesko OYJ, Class B | 3,808 | 221,891 |
| KONE OYJ, Class B | 205,554 | 11,097,137 |
| Neste OYJ | 11,253 | 977,031 |
| Nokia OYJ | 331,372 | 1,845,503 |
| Nokia OYJ, ADR | 121,870 | 676,378 |
| Sampo OYJ, Class A | 115,139 | 5,889,849 |
| UPM-Kymmene OYJ | 73,749 | 2,842,058 |
| Total | 25,898,698 |
| France 5.1% |
| Aeroports de Paris | 10,897 | 2,394,397 |
| Beneteau SA | 18,318 | 292,574 |
| BNP Paribas SA | 318,639 | 18,707,529 |
| Carrefour SA | 194,754 | 3,474,553 |
| Cie de Saint-Gobain | 99,575 | 4,284,035 |
| Common Stocks (continued) |
| Issuer | Shares | Value ($) |
| Cie Generale des Etablissements Michelin CSA | 11,871 | 1,404,796 |
| Danone SA | 88,537 | 6,969,815 |
| Dassault Systemes | 21,475 | 3,479,824 |
| Edenred | 375,605 | 14,313,338 |
| Engie SA | 420,864 | 6,169,980 |
| Essilor International Cie Generale d’Optique SA | 57,432 | 8,286,359 |
| Faurecia SA | 4,798 | 293,946 |
| Gaztransport Et Technigaz SA | 4,763 | 325,638 |
| Hermes International | 1,261 | 819,968 |
| Kering SA | 4,231 | 2,298,410 |
| Legrand SA | 118,359 | 8,916,300 |
| LVMH Moet Hennessy Louis Vuitton SE | 14,948 | 5,237,366 |
| Renault SA | 16,193 | 1,394,665 |
| Rexel SA | 16,496 | 259,452 |
| Sanofi | 18,110 | 1,549,051 |
| Sanofi, ADR | 34,600 | 1,482,610 |
| Sartorius Stedim Biotech | 9,902 | 1,255,117 |
| Schneider Electric SE | 46,829 | 3,818,019 |
| Societe BIC SA | 8,489 | 785,825 |
| Total SA | 63,294 | 3,957,748 |
| Ubisoft Entertainment SA(a) | 3,033 | 326,214 |
| Veolia Environnement SA | 49,471 | 1,042,810 |
| Vivendi SA | 49,639 | 1,287,773 |
| Total | 104,828,112 |
| Germany 9.2% |
| Adidas AG | 10,909 | 2,721,197 |
| Adidas AG ADR | 1,700 | 211,735 |
| BASF SE | 230,143 | 21,288,265 |
| BASF SE, ADR | 21,408 | 495,060 |
| Bayer AG, Registered Shares | 37,354 | 3,485,169 |
| Beiersdorf AG | 27,578 | 3,210,719 |
| Brenntag AG | 85,471 | 5,152,991 |
| Commerzbank AG | 156,470 | 1,479,316 |
| Continental AG | 36,893 | 6,768,262 |
| Covestro AG | 39,028 | 3,324,242 |
| Deutsche Boerse AG | 139,022 | 19,203,004 |
| Deutsche Post AG | 176,400 | 6,431,395 |
| Evonik Industries AG | 18,855 | 702,758 |
| Fresenius Medical Care AG & Co. KGaA | 31,008 | 3,140,708 |
The accompanying Notes to Financial Statements are an integral part of this statement.
| 6 | Multi-Manager International Equity Strategies Fund | Annual Report 2018 |
Portfolio of Investments (continued)
August 31, 2018
| Common Stocks (continued) |
| Issuer | Shares | Value ($) |
| Hugo Boss AG | 13,063 | 1,043,509 |
| Hypoport AG(a) | 536 | 117,215 |
| Linde AG | 120,053 | 27,340,767 |
| Merck KGaA | 29,562 | 3,104,739 |
| MTU Aero Engines AG | 36,246 | 7,947,503 |
| Muenchener Rueckversicherungs-Gesellschaft AG in Muenchen, Registered Shares | 25,666 | 5,535,318 |
| SAP SE | 352,069 | 42,345,771 |
| SAP SE, ADR | 30,714 | 3,677,694 |
| Scout24 AG(b) | 118,886 | 6,149,143 |
| Siemens AG, Registered Shares | 55,335 | 7,192,486 |
| Symrise AG | 6,689 | 624,712 |
| TUI AG | 64,325 | 1,186,057 |
| Wacker Chemie AG | 11,984 | 1,728,371 |
| Wirecard AG | 7,998 | 1,775,968 |
| Total | 187,384,074 |
| Hong Kong 1.9% |
| AIA Group Ltd. | 1,611,800 | 13,916,699 |
| China Merchants Port Holdings Co., Ltd. | 2,148,000 | 4,388,215 |
| CNOOC Ltd. ADR | 8,014 | 1,424,168 |
| Hang Seng Bank Ltd. | 326,500 | 8,857,645 |
| Hong Kong Exchanges and Clearing Ltd. | 349,000 | 9,943,646 |
| Link REIT (The) | 86,000 | 857,191 |
| Vitasoy International Holdings Ltd. | 52,000 | 167,013 |
| WH Group Ltd. | 245,500 | 185,409 |
| Total | 39,739,986 |
| Ireland 1.9% |
| CRH PLC | 277,324 | 9,178,974 |
| Kingspan Group PLC | 216,767 | 10,532,490 |
| Ryanair Holdings PLC, ADR(a) | 123,784 | 12,609,876 |
| Shire PLC, ADR | 33,000 | 5,783,910 |
| Total | 38,105,250 |
| Israel 0.4% |
| Check Point Software Technologies Ltd.(a) | 40,208 | 4,671,768 |
| Israel Chemicals Ltd. | 192,878 | 1,127,016 |
| NiCE Ltd.(a) | 7,471 | 862,573 |
| Nice Ltd., ADR(a) | 19,600 | 2,265,564 |
| Total | 8,926,921 |
| Common Stocks (continued) |
| Issuer | Shares | Value ($) |
| Italy 2.4% |
| Assicurazioni Generali SpA | 190,638 | 3,174,305 |
| Enel SpA | 1,246,646 | 6,164,409 |
| ENI SpA | 101,251 | 1,878,083 |
| Eni SpA ADR | 79,083 | 2,937,933 |
| Intesa Sanpaolo SpA | 1,112,805 | 2,748,067 |
| Leonardo-Finmeccanica SpA | 17,109 | 191,642 |
| Luxottica Group SpA | 56,683 | 3,758,198 |
| Snam SpA | 497,586 | 2,042,298 |
| Telecom Italia SpA(a) | 542,465 | 345,687 |
| Terna Rete Elettrica Nazionale SpA | 223,824 | 1,175,871 |
| UniCredit SpA | 1,569,458 | 22,651,618 |
| UnipolSai SpA | 427,782 | 955,855 |
| Total | 48,023,966 |
| Japan 15.9% |
| Air Water, Inc. | 41,600 | 745,631 |
| Asahi Group Holdings Ltd. | 2,000 | 90,315 |
| Asahi Kasei Corp. | 26,700 | 391,249 |
| Astellas Pharma, Inc. | 222,100 | 3,765,398 |
| Bandai Namco Holdings, Inc. | 8,500 | 329,421 |
| Brother Industries Ltd. | 51,700 | 1,060,591 |
| Canon, Inc. | 137,300 | 4,405,493 |
| Canon, Inc., ADR | 16,052 | 515,109 |
| Central Japan Railway Co. | 18,300 | 3,674,220 |
| Chugai Pharmaceutical Co., Ltd. | 38,000 | 2,201,257 |
| Concordia Financial Group Ltd. | 152,300 | 730,826 |
| Dai-ichi Life Holdings, Inc. | 177,800 | 3,387,588 |
| Daiichi Sankyo Co., Ltd. | 18,700 | 729,893 |
| Daiwabo Holdings Co., Ltd. | 6,900 | 411,474 |
| Denso Corp. | 162,900 | 7,848,770 |
| Don Quijote Holdings Co., Ltd. | 14,100 | 684,333 |
| DTS Corp. | 11,500 | 471,317 |
| East Japan Railway Co. | 200,100 | 18,093,547 |
| Eisai Co., Ltd. | 13,000 | 1,177,240 |
| FANUC Corp. | 47,500 | 9,314,025 |
| Fuji Soft, Inc. | 4,000 | 196,846 |
| FUJIFILM Holdings Corp. | 93,600 | 3,953,507 |
| Hamamatsu Photonics KK | 27,600 | 1,109,575 |
| Hankyu Hanshin Holdings, Inc. | 10,900 | 388,737 |
The accompanying Notes to Financial Statements are an integral part of this statement.
Multi-Manager International Equity Strategies Fund | Annual Report 2018
| 7 |
Portfolio of Investments (continued)
August 31, 2018
| Common Stocks (continued) |
| Issuer | Shares | Value ($) |
| Hino Motors Ltd. | 77,500 | 815,987 |
| Hitachi Capital Corp. | 48,700 | 1,354,873 |
| Hitachi Ltd. | 706,000 | 4,608,467 |
| Honda Motor Co., Ltd. ADR | 70,353 | 2,084,559 |
| Hoya Corp. | 42,400 | 2,477,431 |
| Hoya Corp. ADR | 16,200 | 949,077 |
| Idemitsu Kosan Co., Ltd. | 5,300 | 267,508 |
| Inpex Corp. | 109,100 | 1,192,833 |
| Isetan Mitsukoshi Holdings Ltd. | 69,900 | 790,209 |
| Japan Airlines Co., Ltd. | 374,500 | 13,496,083 |
| Japan Exchange Group, Inc. | 785,200 | 13,835,553 |
| Jeol Ltd. | 14,000 | 145,357 |
| JFE Holdings, Inc. | 98,000 | 2,142,194 |
| JSR Corp. | 66,000 | 1,280,274 |
| JXTG Holdings, Inc. | 680,500 | 4,791,310 |
| Kansai Electric Power Co., Inc. (The) | 27,700 | 396,281 |
| KDDI Corp. | 727,100 | 19,224,407 |
| Keio Corp. | 23,500 | 1,164,625 |
| Keisei Electric Railway Co., Ltd. | 34,100 | 1,143,682 |
| Keyence Corp. | 4,600 | 2,604,098 |
| Kikkoman Corp. | 19,500 | 976,802 |
| Komatsu Ltd. | 60,900 | 1,726,679 |
| Konica Minolta, Inc. | 269,900 | 2,744,810 |
| Kose Corp. | 1,200 | 221,260 |
| Kyocera Corp. | 42,500 | 2,678,518 |
| LAC Co., Ltd. | 7,300 | 126,350 |
| Mani, Inc. | 2,100 | 91,693 |
| Mazda Motor Corp. | 204,800 | 2,370,459 |
| Mitsubishi Chemical Holdings Corp. | 164,900 | 1,477,463 |
| Mitsubishi Corp. | 117,800 | 3,359,311 |
| Mitsubishi Gas Chemical Co., Inc. | 6,800 | 141,358 |
| Mitsui & Co., Ltd. | 249,100 | 4,149,705 |
| MS&AD Insurance Group Holdings, Inc. | 106,500 | 3,272,610 |
| NEC Corp. | 46,300 | 1,278,287 |
| Nidec Corp. | 85,200 | 12,333,661 |
| Nippon Telegraph & Telephone Corp. | 57,100 | 2,540,436 |
| Nippon Telegraph & Telephone Corp., ADR | 3,200 | 142,128 |
| Nissan Chemical Industries Ltd. | 16,300 | 777,050 |
| Nitto Denko Corp. | 13,500 | 1,047,816 |
| Common Stocks (continued) |
| Issuer | Shares | Value ($) |
| Noritake Co., Ltd. | 1,800 | 108,116 |
| NS Solutions Corp. | 14,000 | 452,302 |
| NTT Data Corp. | 111,900 | 1,435,881 |
| NTT DoCoMo, Inc. | 86,700 | 2,246,893 |
| Oji Holdings Corp. | 34,000 | 232,706 |
| Omron Corp. | 8,900 | 398,523 |
| Ono Pharmaceutical Co., Ltd. | 41,100 | 1,079,850 |
| Oracle Corp. Japan | 1,500 | 125,716 |
| ORIX Corp. | 41,500 | 667,391 |
| OSG Corp. | 6,400 | 146,758 |
| Otsuka Holdings Co., Ltd. | 31,600 | 1,482,514 |
| Panasonic Corp. | 262,900 | 3,131,806 |
| Pigeon Corp. | 2,400 | 115,910 |
| Poletowin Pitcrew Holdings, Inc. | 21,100 | 483,113 |
| Recruit Holdings Co., Ltd. | 49,900 | 1,520,998 |
| Resona Holdings, Inc. | 231,300 | 1,311,986 |
| Ricoh Co., Ltd. | 27,900 | 292,427 |
| Sega Sammy Holdings, Inc. | 6,800 | 109,610 |
| Seiko Epson Corp. | 46,300 | 791,297 |
| Seiko Holdings Corp. | 13,800 | 385,874 |
| Seven & I Holdings Co., Ltd. | 52,100 | 2,118,604 |
| Shimano, Inc. | 63,900 | 9,859,759 |
| Shin-Etsu Chemical Co., Ltd. | 46,900 | 4,393,038 |
| Shinko Electric Industries Co., Ltd. | 96,900 | 912,336 |
| Shinsei Bank Ltd. | 105,400 | 1,619,965 |
| Shionogi & Co., Ltd. | 46,400 | 2,696,670 |
| Shiseido Co., Ltd. | 11,800 | 830,724 |
| Shizuoka Bank Ltd. (The) | 128,600 | 1,137,121 |
| Showa Shell Sekiyu KK | 19,800 | 399,391 |
| SMC Corp. | 28,600 | 9,528,420 |
| Sompo Holdings, Inc. | 298,400 | 12,733,480 |
| Sony Corp. | 150,100 | 8,535,083 |
| Sony Financial Holdings, Inc. | 78,900 | 1,571,155 |
| Sumitomo Chemical Co., Ltd. | 367,000 | 2,083,024 |
| Sumitomo Corp. | 208,700 | 3,384,288 |
| Sumitomo Mitsui Financial Group, Inc. | 221,800 | 8,719,725 |
| Sumitomo Mitsui Trust Holdings, Inc. | 207,600 | 8,329,927 |
| Sundrug Co., Ltd. | 2,900 | 104,064 |
| Takeda Pharmaceutical Co., Ltd. | 510,000 | 21,247,213 |
The accompanying Notes to Financial Statements are an integral part of this statement.
| 8 | Multi-Manager International Equity Strategies Fund | Annual Report 2018 |
Portfolio of Investments (continued)
August 31, 2018
| Common Stocks (continued) |
| Issuer | Shares | Value ($) |
| Takeda Pharmaceutical Co., Ltd. ADR | 97,800 | 2,042,064 |
| Terumo Corp. | 15,200 | 837,948 |
| Tohoku Electric Power Co., Inc. | 38,900 | 486,894 |
| Tokio Marine Holdings, Inc. | 117,600 | 5,541,527 |
| Tokio Marine Holdings, Inc., ADR | 6,668 | 315,196 |
| Tokyo Electric Power Co. Holdings, Inc.(a) | 112,100 | 518,180 |
| Tokyo Gas Co., Ltd. | 88,600 | 2,097,806 |
| Tokyu Corp. | 91,900 | 1,514,193 |
| Toyota Tsusho Corp. | 282,600 | 9,627,539 |
| Trend Micro, Inc. | 4,600 | 289,238 |
| Unicharm Corp. | 65,000 | 2,123,085 |
| Welcia Holdings Co., Ltd. | 1,500 | 69,221 |
| West Japan Railway Co. | 3,100 | 207,866 |
| Yokogawa Electric Corp. | 19,200 | 393,667 |
| Total | 324,685,648 |
| Jersey 0.3% |
| boohoo Group PLC(a) | 2,456,548 | 5,637,082 |
| Ferguson PLC | 3,348 | 268,287 |
| Total | 5,905,369 |
| Luxembourg 0.4% |
| Spotify Technology SA(a) | 43,710 | 8,283,919 |
| Netherlands 4.5% |
| Aegon NV | 647,383 | 3,881,990 |
| Aegon NV, Registered Shares | 110,907 | 659,897 |
| AerCap Holdings NV(a) | 26,935 | 1,534,487 |
| Akzo Nobel NV | 197,761 | 18,483,452 |
| ASR Nederland NV | 11,394 | 543,572 |
| Fiat Chrysler Automobiles NV(a) | 49,639 | 838,925 |
| Heineken Holding NV | 108,327 | 10,323,300 |
| ING Groep NV | 630,016 | 8,548,792 |
| Koninklijke Ahold Delhaize NV, ADR | 9,600 | 232,848 |
| Koninklijke DSM NV | 26,471 | 2,777,035 |
| Koninklijke Philips NV | 75,900 | 3,387,417 |
| Koninklijke Philips NV | 122,979 | 5,494,365 |
| NN Group NV | 79,908 | 3,425,376 |
| Randstad Holding NV | 33,266 | 2,083,585 |
| RELX NV | 334,646 | 7,411,441 |
| RELX NV, ADR | 5,821 | 129,459 |
| Common Stocks (continued) |
| Issuer | Shares | Value ($) |
| STMicroelectronics NV | 30,845 | 633,540 |
| STMicroelectronics NV, Registered Shares | 46,945 | 971,292 |
| Unilever NV-CVA | 300,127 | 17,260,110 |
| Wolters Kluwer NV | 53,080 | 3,364,048 |
| Wolters Kluwer NV ADR | 2,100 | 133,098 |
| Total | 92,118,029 |
| Norway 0.2% |
| Aker BP ASA | 32,180 | 1,139,672 |
| Equinor ASA ADR | 87,809 | 2,262,838 |
| Odfjell Drilling Ltd.(a) | 28,310 | 126,255 |
| Orkla | 41,115 | 338,288 |
| Statoil ASA | 40,305 | 1,033,801 |
| Total | 4,900,854 |
| Panama 0.4% |
| Copa Holdings SA, Class A | 89,019 | 7,116,179 |
| Peru 0.4% |
| Credicorp Ltd. | 37,772 | 8,235,051 |
| Portugal 0.1% |
| Altri SGPS SA | 12,105 | 111,845 |
| Galp Energia SGPS SA | 90,323 | 1,831,597 |
| Total | 1,943,442 |
| Russian Federation 0.3% |
| Gazprom PJSC ADR | 43,500 | 191,835 |
| Magnit PJSC GDR(b) | 303,799 | 4,487,111 |
| Novatek PJSC GDR(b) | 5,744 | 959,248 |
| Novolipetsk Steel PJSC, GDR | 817 | 19,804 |
| Rosneft Oil Co. PJSC GDR(b) | 184,409 | 1,175,054 |
| Sberbank of Russia PJSC, ADR | 18,800 | 204,074 |
| Total | 7,037,126 |
| Singapore 0.6% |
| Singapore Exchange | 70,400 | 380,465 |
| United Overseas Bank Ltd. | 558,400 | 11,005,227 |
| Total | 11,385,692 |
| South Africa 1.4% |
| Discovery Ltd. | 621,778 | 7,413,523 |
| Naspers Ltd., Class N | 94,115 | 20,915,818 |
| Total | 28,329,341 |
The accompanying Notes to Financial Statements are an integral part of this statement.
Multi-Manager International Equity Strategies Fund | Annual Report 2018
| 9 |
Portfolio of Investments (continued)
August 31, 2018
| Common Stocks (continued) |
| Issuer | Shares | Value ($) |
| South Korea 3.1% |
| KB Financial Group, Inc., ADR | 6,682 | 306,102 |
| NAVER Corp. | 9,144 | 6,174,166 |
| Samsung Electronics Co., Ltd. | 336,882 | 14,644,481 |
| Samsung Electronics Co., Ltd. GDR | 20,841 | 22,258,188 |
| SK Innovation Co., Ltd. | 11,078 | 1,920,510 |
| SK Telecom Co., Ltd. | 75,642 | 17,810,172 |
| Total | 63,113,619 |
| Spain 2.5% |
| Amadeus IT Group SA ADR | 4,044 | 373,807 |
| Amadeus IT Group SA, Class A | 49,850 | 4,624,442 |
| Bankinter SA | 756,680 | 6,731,416 |
| CaixaBank SA | 1,574,907 | 7,058,191 |
| Enagas SA | 41,530 | 1,154,532 |
| Gas Natural SDG SA | 26,371 | 708,012 |
| Grifols SA | 206,757 | 6,079,027 |
| Iberdrola SA | 299,403 | 2,231,851 |
| Industria de Diseno Textil SA | 312,934 | 9,462,353 |
| International Consolidated Airlines Group SA | 157,165 | 1,412,003 |
| Prosegur Cia de Seguridad SA, Registered Shares | 48,591 | 293,008 |
| Red Electrica Corp. SA | 73,795 | 1,550,402 |
| Repsol SA | 207,272 | 3,985,389 |
| Telefonica SA | 539,643 | 4,376,591 |
| Total | 50,041,024 |
| Sweden 1.9% |
| Atlas Copco AB, Class B | 432,772 | 11,442,597 |
| Boliden AB | 10,729 | 280,862 |
| Elekta AB, Class B | 77,198 | 1,009,171 |
| Epiroc AB, Class B(a) | 770,637 | 7,370,017 |
| Hexagon AB, ADR | 9,400 | 558,783 |
| Industrivarden AB, Class A | 71,903 | 1,578,774 |
| Investment AB Oresund(a) | 4,294 | 68,928 |
| Investor AB, Class A | 4,429 | 200,016 |
| Kinnevik AB, Class B | 27,260 | 895,437 |
| Lundin Petroleum AB | 46,734 | 1,623,526 |
| Resurs Holding AB(b) | 149,692 | 1,093,413 |
| Svenska Handelsbanken AB, Class A | 825,090 | 10,001,064 |
| Swedish Match AB | 32,965 | 1,762,310 |
| Common Stocks (continued) |
| Issuer | Shares | Value ($) |
| Swedish Orphan Biovitrum AB(a) | 27,138 | 864,722 |
| Total | 38,749,620 |
| Switzerland 8.1% |
| ABB Ltd. | 862,692 | 20,337,903 |
| Barry Callebaut AG | 1,339 | 2,387,198 |
| Cie Financiere Richemont SA, Class A, Registered Shares | 228,464 | 20,200,531 |
| Coca-Cola HBC AG | 47,613 | 1,628,381 |
| Credit Suisse Group AG, Registered Shares | 540,410 | 8,092,908 |
| Givaudan SA | 3,273 | 7,962,583 |
| Idorsia Ltd.(a) | 17,839 | 450,921 |
| Logitech International SA | 30,266 | 1,493,862 |
| Nestlé SA, Registered Shares | 203,630 | 17,097,147 |
| Novartis AG, ADR | 74,975 | 6,223,675 |
| Novartis AG, Registered Shares | 286,652 | 23,772,079 |
| Panalpina Welttransport Holding | 23,852 | 3,573,186 |
| Roche Holding AG, ADR | 99,575 | 3,087,323 |
| Roche Holding AG, Genusschein Shares | 127,248 | 31,613,431 |
| SGS SA, Registered Shares | 2,868 | 7,554,299 |
| Straumann Holding AG, Registered Shares | 959 | 764,331 |
| Swatch Group AG (The) | 9,246 | 3,945,469 |
| Vifor Pharma AG | 4,940 | 910,530 |
| Wizz Air Holdings PLC(a),(b) | 28,081 | 1,154,422 |
| Zurich Insurance Group AG | 11,951 | 3,639,861 |
| Total | 165,890,040 |
| Taiwan 1.7% |
| Hon Hai Precision Industry Co., Ltd. | 2,484,000 | 6,525,564 |
| Taiwan Semiconductor Manufacturing Co., Ltd., ADR | 656,851 | 28,638,703 |
| Total | 35,164,267 |
| Thailand 0.0% |
| PTT PCL | 98,100 | 157,504 |
| Turkey 0.1% |
| Akbank TAS | 1,646,547 | 1,444,383 |
| United Kingdom 18.8% |
| 3i Group PLC | 250,628 | 2,912,643 |
| Aggreko PLC | 18,448 | 200,567 |
| Anglo American PLC | 45,799 | 915,342 |
| Ashtead Group PLC | 123,006 | 3,766,709 |
The accompanying Notes to Financial Statements are an integral part of this statement.
| 10 | Multi-Manager International Equity Strategies Fund | Annual Report 2018 |
Portfolio of Investments (continued)
August 31, 2018
| Common Stocks (continued) |
| Issuer | Shares | Value ($) |
| ASOS PLC(a) | 62,932 | 4,988,303 |
| Associated British Foods PLC | 56,610 | 1,679,944 |
| AstraZeneca PLC | 216,888 | 16,294,641 |
| AstraZeneca PLC, ADR | 15,715 | 602,513 |
| Atlassian Corp. PLC, Class A(a) | 31,476 | 2,833,155 |
| Aviva PLC | 2,012,108 | 12,651,699 |
| BAE Systems PLC | 55,699 | 437,599 |
| BAE Systems PLC, ADR | 4,800 | 153,000 |
| Barclays Bank PLC | 8,444,335 | 19,235,038 |
| BHP Billiton PLC | 242,918 | 5,176,837 |
| BHP Billiton PLC, ADR | 32,500 | 1,391,650 |
| BP PLC | 2,992,326 | 21,231,965 |
| BP PLC, ADR | 215,807 | 9,253,804 |
| British American Tobacco PLC | 466,681 | 22,516,142 |
| Burberry Group PLC | 231,109 | 6,699,532 |
| Cairn Energy PLC(a) | 43,519 | 134,844 |
| Carnival PLC | 177,736 | 10,671,022 |
| Cranswick PLC | 9,032 | 378,218 |
| Dechra Pharmaceuticals PLC | 42,084 | 1,702,266 |
| Diageo PLC | 208,976 | 7,300,127 |
| Diageo PLC, ADR | 56,607 | 7,891,582 |
| Evraz PLC | 38,845 | 250,544 |
| Experian PLC | 530,348 | 13,201,340 |
| Experian PLC ADR | 14,000 | 347,830 |
| Galiform PLC | 703,505 | 4,493,716 |
| Genus PLC | 6,943 | 256,536 |
| GlaxoSmithKline PLC | 417,739 | 8,450,780 |
| GlaxoSmithKline PLC, ADR | 127,500 | 5,163,750 |
| Halma PLC | 56,548 | 1,049,823 |
| Hargreaves Lansdown PLC | 318,528 | 9,085,025 |
| Imperial Brands PLC, ADR | 6,300 | 224,469 |
| Indivior PLC(a) | 99,085 | 347,481 |
| Jardine Lloyd Thompson Group | 13,068 | 244,643 |
| Johnson Matthey PLC | 104,488 | 4,735,804 |
| JPJ Group PLC(a) | 25,783 | 276,102 |
| Just Eat PLC(a) | 1,113,217 | 11,063,804 |
| Kingfisher PLC | 150,836 | 534,833 |
| Lloyds Banking Group PLC | 10,443,921 | 8,029,234 |
| Micro Focus International PLC | 459,252 | 7,769,935 |
| Common Stocks (continued) |
| Issuer | Shares | Value ($) |
| Ophir Energy PLC(a) | 153,448 | 81,565 |
| Pearson PLC, ADR | 2,171 | 25,683 |
| Pets at Home Group PLC | 347,760 | 524,794 |
| Prudential PLC | 1,198,736 | 26,963,661 |
| PZ Cussons PLC | 24,173 | 75,214 |
| RELX PLC | 17,682 | 391,998 |
| RELX PLC, ADR | 23,302 | 519,635 |
| Rightmove PLC | 169,540 | 1,081,527 |
| Rio Tinto PLC | 318,943 | 15,129,735 |
| Rio Tinto PLC, ADR | 43,807 | 2,104,050 |
| Rolls-Royce Holdings PLC | 1,357,054 | 17,681,497 |
| Royal Dutch Shell PLC, ADR, Class A | 77,499 | 5,055,260 |
| Royal Dutch Shell PLC, ADR, Class B | 76,755 | 5,171,752 |
| Royal Dutch Shell PLC, Class A | 27,472 | 890,936 |
| Royal Dutch Shell PLC, Class A | 115,346 | 3,747,521 |
| Royal Dutch Shell PLC, Class B | 604,156 | 19,898,674 |
| Scapa Group PLC | 26,219 | 145,416 |
| Scottish & Southern Energy PLC | 849,941 | 13,806,884 |
| Shire PLC | 112,073 | 6,536,188 |
| Smith & Nephew PLC | 170,873 | 3,007,247 |
| Smith & Nephew PLC ADR | 6,200 | 222,146 |
| Sports Direct International PLC(a) | 50,475 | 249,778 |
| St. James’s Place PLC | 394,382 | 5,785,321 |
| Superdry PLC | 28,123 | 434,604 |
| Tate & Lyle PLC | 74,543 | 647,883 |
| Unilever PLC ADR | 14,278 | 811,990 |
| Victrex PLC | 16,260 | 667,823 |
| Vodafone Group PLC | 5,337,829 | 11,383,777 |
| Whitbread PLC | 76,957 | 4,585,471 |
| Total | 384,172,821 |
| United States 0.2% |
| Aveva Group PLC | 16,918 | 622,907 |
| PriceSmart, Inc. | 47,643 | 4,137,795 |
| Total | 4,760,702 |
Total Common Stocks
(Cost $2,024,935,878) | 1,973,583,071 |
|
The accompanying Notes to Financial Statements are an integral part of this statement.
Multi-Manager International Equity Strategies Fund | Annual Report 2018
| 11 |
Portfolio of Investments (continued)
August 31, 2018
| Exchange-Traded Funds 0.1% |
| | Shares | Value ($) |
| United States 0.1% |
| iShares MSCI EAFE ETF | 46,972 | 3,163,094 |
Total Exchange-Traded Funds
(Cost $3,304,845) | 3,163,094 |
| Participation Notes 0.1% |
| Issuer | | | Shares | Value ($) |
| United Kingdom 0.1% |
| HSBC Bank PLC(a) |
| (linked to common shares of Alinma Bank) |
| 01/19/2021 | | | 362,967 | 2,101,217 |
Total Participation Notes
(Cost $2,094,662) | 2,101,217 |
| Preferred Stocks 1.5% |
| Issuer | | Shares | Value ($) |
| Germany 1.4% |
| Henkel AG & Co. KGaA | | 18,353 | 2,342,292 |
| Volkswagen AG | | 159,895 | 26,139,638 |
| Total | 28,481,930 |
| Preferred Stocks (continued) |
| Issuer | | Shares | Value ($) |
| Spain 0.1% |
| Grifols SA | | 87,695 | 1,862,793 |
Total Preferred Stocks
(Cost $35,844,830) | 30,344,723 |
| Money Market Funds 1.3% |
| | Shares | Value ($) |
| Columbia Short-Term Cash Fund, 2.058%(c),(d) | 25,677,255 | 25,674,687 |
Total Money Market Funds
(Cost $25,674,687) | 25,674,687 |
Total Investments in Securities
(Cost $2,091,854,902) | 2,034,866,792 |
| Other Assets & Liabilities, Net | | 8,407,319 |
| Net Assets | $2,043,274,111 |
Notes to Portfolio of Investments
| (a) | Non-income producing investment. |
| (b) | Represents privately placed and other securities and instruments exempt from SEC registration (collectively, private placements), such as Section 4(a)(2) and Rule 144A eligible securities, which are often sold only to qualified institutional buyers. The Fund may invest in private placements determined to be liquid as well as those determined to be illiquid. Private placements may be determined to be liquid under guidelines established by the Fund’s Board of Trustees. At August 31, 2018, the total value of these securities amounted to $15,018,391, which represents 0.74% of total net assets. |
| (c) | The rate shown is the seven-day current annualized yield at August 31, 2018. |
| (d) | As defined in the Investment Company Act of 1940, an affiliated company is one in which the Fund owns 5% or more of the company’s outstanding voting securities, or a company which is under common ownership or control with the Fund. Holdings and transactions in these affiliated companies during the year ended August 31, 2018 are as follows: |
| Issuer | Beginning
shares | Shares
purchased | Shares
sold | Ending
shares | Realized gain
(loss) —
affiliated
issuers ($) | Net change in
unrealized
appreciation
(depreciation) —
affiliated
issuers ($) | Dividends —
affiliated
issuers ($) | Value —
affiliated
issuers
at end of
period ($) |
| Columbia Short-Term Cash Fund, 2.058% |
| | 20,000 | 1,799,895,178 | (1,774,237,923) | 25,677,255 | 62,756 | — | 593,217 | 25,674,687 |
Abbreviation Legend
| ADR | American Depositary Receipt |
| GDR | Global Depositary Receipt |
Fair value measurements
The Fund categorizes its fair value measurements according to a three-level hierarchy that maximizes the use of observable inputs and minimizes the use of unobservable inputs by prioritizing that the most observable input be used when available. Observable inputs are those that market participants would use in pricing an investment based on market data obtained from sources independent of the reporting entity. Unobservable inputs are those that reflect the Fund’s assumptions about the information market participants would use in
The accompanying Notes to Financial Statements are an integral part of this statement.
| 12 | Multi-Manager International Equity Strategies Fund | Annual Report 2018 |
Portfolio of Investments (continued)
August 31, 2018
Fair value measurements (continued)
pricing an investment. An investment’s level within the fair value hierarchy is based on the lowest level of any input that is deemed significant to the asset’s or liability’s fair value measurement. The input levels are not necessarily an indication of the risk or liquidity associated with investments at that level. For example, certain U.S. government securities are generally high quality and liquid, however, they are reflected as Level 2 because the inputs used to determine fair value may not always be quoted prices in an active market.
Fair value inputs are summarized in the three broad levels listed below:
| ■ | Level 1 — Valuations based on quoted prices for investments in active markets that the Fund has the ability to access at the measurement date. Valuation adjustments are not applied to Level 1 investments. |
| ■ | Level 2 — Valuations based on other significant observable inputs (including quoted prices for similar securities, interest rates, prepayment speeds, credit risks, etc.). |
| ■ | Level 3 — Valuations based on significant unobservable inputs (including the Fund’s own assumptions and judgment in determining the fair value of investments). |
Inputs that are used in determining fair value of an investment may include price information, credit data, volatility statistics, and other factors. These inputs can be either observable or unobservable. The availability of observable inputs can vary between investments, and is affected by various factors such as the type of investment, and the volume and level of activity for that investment or similar investments in the marketplace. The inputs will be considered by the Investment Manager, along with any other relevant factors in the calculation of an investment’s fair value. The Fund uses prices and inputs that are current as of the measurement date, which may include periods of market dislocations. During these periods, the availability of prices and inputs may be reduced for many investments. This condition could cause an investment to be reclassified between the various levels within the hierarchy.
Foreign equity securities actively traded in markets where there is a significant delay in the local close relative to the New York Stock Exchange are classified as Level 2. The values of these securities may include an adjustment to reflect the impact of significant market movements following the close of local trading, as described in Note 2 to the financial statements – Security valuation.
Certain investments that have been measured at fair value using the net asset value (NAV) per share (or its equivalent) are not categorized in the fair value hierarchy. The fair value amounts presented in the table are intended to reconcile the fair value hierarchy to the amounts presented in the Portfolio of Investments. The Columbia Short-Term Cash Fund seeks to provide shareholders with maximum current income consistent with liquidity and stability of principal. Columbia Short-Term Cash Fund prices its shares with a floating NAV and no longer seeks to maintain a stable NAV.
Investments falling into the Level 3 category are primarily supported by quoted prices from brokers and dealers participating in the market for those investments. However, these may be classified as Level 3 investments due to lack of market transparency and corroboration to support these quoted prices. Additionally, valuation models may be used as the pricing source for any remaining investments classified as Level 3. These models may rely on one or more significant unobservable inputs and/or significant assumptions by the Investment Manager. Inputs used in valuations may include, but are not limited to, financial statement analysis, capital account balances, discount rates and estimated cash flows, and comparable company data.
Under the direction of the Fund’s Board of Trustees (the Board), the Investment Manager’s Valuation Committee (the Committee) is responsible for overseeing the valuation procedures approved by the Board. The Committee consists of voting and non-voting members from various groups within the Investment Manager’s organization, including operations and accounting, trading and investments, compliance, risk management and legal.
The Committee meets at least monthly to review and approve valuation matters, which may include a description of specific valuation determinations, data regarding pricing information received from approved pricing vendors and brokers and the results of Board-approved valuation control policies and procedures (the Policies). The Policies address, among other things, instances when market quotations are or are not readily available, including recommendations of third party pricing vendors and a determination of appropriate pricing methodologies; events that require specific valuation determinations and assessment of fair value techniques; securities with a potential for stale pricing, including those that are illiquid, restricted, or in default; and the effectiveness of third party pricing vendors, including periodic reviews of vendors. The Committee meets more frequently, as needed, to discuss additional valuation matters, which may include the need to review back-testing results, review time-sensitive information or approve related valuation actions. The Committee reports to the Board, with members of the Committee meeting with the Board at each of its regularly scheduled meetings to discuss valuation matters and actions during the period, similar to those described earlier.
For investments categorized as Level 3, the Committee monitors information similar to that described above, which may include: (i) data specific to the issuer or comparable issuers, (ii) general market or specific sector news and (iii) quoted prices and specific or similar security transactions. The Committee considers this data and any changes from prior periods in order to assess the reasonableness of observable and unobservable inputs, any assumptions or internal models used to value those securities and changes in fair value. This data is also used to corroborate, when available, information received from approved pricing vendors and brokers. Various factors impact the frequency of monitoring this information (which may occur as often as daily). However, the Committee may determine that changes to inputs, assumptions and models are not required as a result of the monitoring procedures performed.
The following table is a summary of the inputs used to value the Fund’s investments at August 31, 2018:
| | Level 1
quoted prices
in active
markets for
identical
assets ($) | Level 2
other
significant
observable
inputs ($) | Level 3
significant
unobservable
inputs ($) | Investments
measured at
net asset
value ($) | Total ($) |
| Investments in Securities | | | | | |
| Common Stocks | | | | | |
| Argentina | 19,806,364 | — | — | — | 19,806,364 |
| Australia | 2,879,849 | 59,486,573 | — | — | 62,366,422 |
| Austria | — | 724,282 | — | — | 724,282 |
| Brazil | 11,753,043 | — | — | — | 11,753,043 |
| Cambodia | — | 877,266 | — | — | 877,266 |
| Canada | 95,848,969 | — | — | — | 95,848,969 |
| Cayman Islands | — | 310,862 | — | — | 310,862 |
| China | 31,312,216 | 20,565,163 | — | — | 51,877,379 |
The accompanying Notes to Financial Statements are an integral part of this statement.
Multi-Manager International Equity Strategies Fund | Annual Report 2018
| 13 |
Portfolio of Investments (continued)
August 31, 2018
Fair value measurements (continued)
| | Level 1
quoted prices
in active
markets for
identical
assets ($) | Level 2
other
significant
observable
inputs ($) | Level 3
significant
unobservable
inputs ($) | Investments
measured at
net asset
value ($) | Total ($) |
| Denmark | 4,208,952 | 29,467,895 | — | — | 33,676,847 |
| Finland | 676,378 | 25,222,320 | — | — | 25,898,698 |
| France | 1,482,610 | 103,345,502 | — | — | 104,828,112 |
| Germany | 4,384,489 | 182,999,585 | — | — | 187,384,074 |
| Hong Kong | 1,424,168 | 38,315,818 | — | — | 39,739,986 |
| Ireland | 18,393,786 | 19,711,464 | — | — | 38,105,250 |
| Israel | 6,937,332 | 1,989,589 | — | — | 8,926,921 |
| Italy | 2,937,933 | 45,086,033 | — | — | 48,023,966 |
| Japan | 6,048,133 | 318,637,515 | — | — | 324,685,648 |
| Jersey | — | 5,905,369 | — | — | 5,905,369 |
| Luxembourg | 8,283,919 | — | — | — | 8,283,919 |
| Netherlands | 7,048,498 | 85,069,531 | — | — | 92,118,029 |
| Norway | 2,262,838 | 2,638,016 | — | — | 4,900,854 |
| Panama | 7,116,179 | — | — | — | 7,116,179 |
| Peru | 8,235,051 | — | — | — | 8,235,051 |
| Portugal | — | 1,943,442 | — | — | 1,943,442 |
| Russian Federation | — | 7,037,126 | — | — | 7,037,126 |
| Singapore | — | 11,385,692 | — | — | 11,385,692 |
| South Africa | — | 28,329,341 | — | — | 28,329,341 |
| South Korea | 306,102 | 62,807,517 | — | — | 63,113,619 |
| Spain | 373,807 | 49,667,217 | — | — | 50,041,024 |
| Sweden | 558,783 | 38,190,837 | — | — | 38,749,620 |
| Switzerland | 9,310,998 | 156,579,042 | — | — | 165,890,040 |
| Taiwan | 28,638,703 | 6,525,564 | — | — | 35,164,267 |
| Thailand | — | 157,504 | — | — | 157,504 |
| Turkey | — | 1,444,383 | — | — | 1,444,383 |
| United Kingdom | 41,772,269 | 342,400,552 | — | — | 384,172,821 |
| United States | 4,137,795 | 622,907 | — | — | 4,760,702 |
| Total Common Stocks | 326,139,164 | 1,647,443,907 | — | — | 1,973,583,071 |
| Exchange-Traded Funds | 3,163,094 | — | — | — | 3,163,094 |
| Participation Notes | — | 2,101,217 | — | — | 2,101,217 |
| Preferred Stocks | | | | | |
| Germany | — | 28,481,930 | — | — | 28,481,930 |
| Spain | — | 1,862,793 | — | — | 1,862,793 |
| Total Preferred Stocks | — | 30,344,723 | — | — | 30,344,723 |
| Money Market Funds | — | — | — | 25,674,687 | 25,674,687 |
| Total Investments in Securities | 329,302,258 | 1,679,889,847 | — | 25,674,687 | 2,034,866,792 |
See the Portfolio of Investments for all investment classifications not indicated in the table.
The Fund’s assets assigned to the Level 2 input category are generally valued using the market approach, in which a security’s value is determined through reference to prices and information from market transactions for similar or identical assets. These assets include certain foreign securities for which a third party statistical pricing service may be employed for purposes of fair market valuation. The model utilized by such third party statistical pricing service takes into account a security’s correlation to available market data including, but not limited to, intraday index, ADR, and exchange-traded fund movements.
There were no transfers of financial assets between levels during the period.
The accompanying Notes to Financial Statements are an integral part of this statement.
| 14 | Multi-Manager International Equity Strategies Fund | Annual Report 2018 |
Statement of Assets and Liabilities
August 31, 2018
| Assets | |
| Investments in securities, at value | |
| Unaffiliated issuers (cost $2,066,180,215) | $2,009,192,105 |
| Affiliated issuers (cost $25,674,687) | 25,674,687 |
| Cash | 138,866 |
| Foreign currency (cost $6,406,159) | 6,387,564 |
| Receivable for: | |
| Investments sold | 12,546,651 |
| Capital shares sold | 2,853,360 |
| Dividends | 5,543,298 |
| Foreign tax reclaims | 341,924 |
| Prepaid expenses | 12,880 |
| Trustees’ deferred compensation plan | 811 |
| Total assets | 2,062,692,146 |
| Liabilities | |
| Payable for: | |
| Investments purchased | 15,657,601 |
| Capital shares purchased | 3,091,218 |
| Management services fees | 44,756 |
| Transfer agent fees | 261,375 |
| Compensation of chief compliance officer | 40 |
| Other expenses | 362,234 |
| Trustees’ deferred compensation plan | 811 |
| Total liabilities | 19,418,035 |
| Net assets applicable to outstanding capital stock | $2,043,274,111 |
| Represented by | |
| Paid in capital | 2,105,102,700 |
| Undistributed net investment income | 8,207,568 |
| Accumulated net realized loss | (13,059,906) |
| Unrealized appreciation (depreciation) on: | |
| Investments - unaffiliated issuers | (56,988,110) |
| Foreign currency translations | 11,859 |
| Total - representing net assets applicable to outstanding capital stock | $2,043,274,111 |
| Institutional Class | |
| Net assets | $2,043,274,111 |
| Shares outstanding | 211,234,011 |
| Net asset value per share | $9.67 |
The accompanying Notes to Financial Statements are an integral part of this statement.
Multi-Manager International Equity Strategies Fund | Annual Report 2018
| 15 |
Statement of Operations
For the period from May 17, 2018 (commencement of operations) through August 31, 2018
| Net investment income | |
| Income: | |
| Dividends — unaffiliated issuers | $14,610,037 |
| Dividends — affiliated issuers | 593,217 |
| Foreign taxes withheld | (1,270,016) |
| Total income | 13,933,238 |
| Expenses: | |
| Management services fees | 4,352,066 |
| Transfer agent fees | |
| Institutional Class | 1,056,726 |
| Compensation of board members | 10,701 |
| Custodian fees | 115,106 |
| Printing and postage fees | 113,337 |
| Registration fees | 273,196 |
| Audit fees | 14,725 |
| Legal fees | 12,139 |
| Compensation of chief compliance officer | 100 |
| Other | 34,875 |
| Total expenses | 5,982,971 |
| Net investment income | 7,950,267 |
| Realized and unrealized gain (loss) — net | |
| Net realized gain (loss) on: | |
| Investments — unaffiliated issuers | (13,094,320) |
| Investments — affiliated issuers | 62,756 |
| Foreign currency translations | 228,959 |
| Net realized loss | (12,802,605) |
| Net change in unrealized appreciation (depreciation) on: | |
| Investments — unaffiliated issuers | (56,988,110) |
| Foreign currency translations | 11,859 |
| Net change in unrealized appreciation (depreciation) | (56,976,251) |
| Net realized and unrealized loss | (69,778,856) |
| Net decrease in net assets resulting from operations | $(61,828,589) |
The accompanying Notes to Financial Statements are an integral part of this statement.
| 16 | Multi-Manager International Equity Strategies Fund | Annual Report 2018 |
Statement of Changes in Net Assets
| | Year Ended
August 31, 2018 (a) |
| Operations | |
| Net investment income | $7,950,267 |
| Net realized loss | (12,802,605) |
| Net change in unrealized appreciation (depreciation) | (56,976,251) |
| Net decrease in net assets resulting from operations | (61,828,589) |
| Increase in net assets from capital stock activity | 2,105,082,700 |
| Total increase in net assets | 2,043,254,111 |
| Net assets at beginning of period | 20,000 |
| Net assets at end of period | $2,043,274,111 |
| Undistributed net investment income | $8,207,568 |
| | Year Ended |
| | August 31, 2018 (a) |
| | Shares | Dollars ($) |
| Capital stock activity |
| Institutional Class | | |
| Subscriptions | 219,285,195 | 2,183,577,392 |
| Redemptions | (8,053,184) | (78,494,692) |
| Net increase | 211,232,011 | 2,105,082,700 |
| Total net increase | 211,232,011 | 2,105,082,700 |
| (a) | Based on operations from May 17, 2018 (fund commencement of operations) through the stated period end. |
The accompanying Notes to Financial Statements are an integral part of this statement.
Multi-Manager International Equity Strategies Fund | Annual Report 2018
| 17 |
The following table is intended to help you understand the Fund’s financial performance. Certain information reflects financial results for a single share of a class held for the periods shown. Per share net investment income (loss) amounts are calculated based on average shares outstanding during the period. Total return assumes reinvestment of all dividends and distributions, if any. Total return does not reflect payment of sales charges, if any. Total return and portfolio turnover are not annualized for periods of less than one year. The portfolio turnover rate is calculated without regard to purchase and sales transactions of short-term instruments and certain derivatives, if any. If such transactions were included, the Fund’s portfolio turnover rate may be higher.
| Institutional Class | Year Ended August 31,
2018 (a) |
| Per share data | |
| Net asset value, beginning of period | $10.00 |
| Income (loss) from investment operations: | |
| Net investment income | 0.04 |
| Net realized and unrealized loss | (0.37) |
| Total from investment operations | (0.33) |
| Net asset value, end of period | $9.67 |
| Total return | (3.30%) |
| Ratios to average net assets | |
| Total gross expenses(b) | 1.05% (c) |
| Total net expenses(b),(d) | 1.05% (c) |
| Net investment income | 1.51% (c) |
| Supplemental data | |
| Net assets, end of period (in thousands) | $2,043,274 |
| Portfolio turnover | 17% |
| Notes to Financial Highlights |
| (a) | The Fund commenced operations on May 17, 2018. Per share data and total return reflect activity from that date. |
| (b) | In addition to the fees and expenses that the Fund bears directly, the Fund indirectly bears a pro rata share of the fees and expenses of any other funds in which it invests. Such indirect expenses are not included in the Fund’s reported expense ratios. |
| (c) | Annualized. |
| (d) | Total net expenses include the impact of certain fee waivers/expense reimbursements made by the Investment Manager and certain of its affiliates, if applicable. |
The accompanying Notes to Financial Statements are an integral part of this statement.
| 18 | Multi-Manager International Equity Strategies Fund | Annual Report 2018 |
Notes to Financial Statements
August 31, 2018
Note 1. Organization
Multi-Manager International Equity Strategies Fund (the Fund), a series of Columbia Funds Series Trust I (the Trust), is a diversified fund. The Trust is registered under the Investment Company Act of 1940, as amended (the 1940 Act), as an open-end management investment company organized as a Massachusetts business trust.
On May 9, 2018, Columbia Management Investment Advisers, LLC (the Investment Manager), a wholly-owned subsidiary of Ameriprise Financial, Inc. (Ameriprise Financial), invested $20,000 in the Fund (2,000 shares for Institutional Class), which represented the initial capital for Institutional Class at $10 per share. Shares of the Fund were first offered to the public on May 17, 2018.
These financial statements cover the period from May 17, 2018 (commencement of operations) through August 31, 2018. All references to the year ended August 31, 2018 refer to the period from May 17, 2018 through August 31, 2018.
Fund shares
The Trust may issue an unlimited number of shares (without par value). The Fund is offered only through certain wrap fee programs sponsored and/or managed by Ameriprise Financial, Inc. (Ameriprise Financial) or its affiliates. The Fund offers each of the share classes identified below.
Institutional Class shares are not subject to any front-end sales charge or contingent deferred sales charge.
Note 2. Summary of significant accounting policies
Basis of preparation
The Fund is an investment company that applies the accounting and reporting guidance in the Financial Accounting Standards Board (FASB) Accounting Standards Codification Topic 946, Financial Services - Investment Companies (ASC 946). The financial statements are prepared in accordance with U.S. generally accepted accounting principles (GAAP), which requires management to make certain estimates and assumptions that affect the reported amounts of assets and liabilities, the disclosure of contingent assets and liabilities at the date of the financial statements and the reported amounts of income and expenses during the reporting period. Actual results could differ from those estimates.
The following is a summary of significant accounting policies followed by the Fund in the preparation of its financial statements.
Security valuation
All equity securities and exchange-traded funds are valued at the close of business of the New York Stock Exchange. Equity securities and exchange-traded funds are valued at the last quoted sales price on the principal exchange or market on which they trade, except for securities traded on the NASDAQ Stock Market, which are valued at the NASDAQ official close price. Unlisted securities or listed securities for which there were no sales during the day are valued at the mean of the latest quoted bid and ask prices on such exchanges or markets.
Foreign equity securities are valued based on the closing price on the foreign exchange in which such securities are primarily traded. If any foreign equity security closing prices are not readily available, the securities are valued at the mean of the latest quoted bid and ask prices on such exchanges or markets. Foreign currency exchange rates are generally determined at 4:00 p.m. Eastern (U.S.) time. Many securities markets and exchanges outside the U.S. close prior to the close of the New York Stock Exchange; therefore, the closing prices for securities in such markets or on such exchanges may not fully reflect events that occur after such close but before the close of the New York Stock Exchange. In those situations, foreign securities will be fair valued pursuant to a policy adopted by the Board of Trustees, including, if available, utilizing a third party pricing service to determine these fair values. The third party pricing service takes into account multiple factors, including, but not limited to, movements in the U.S. securities markets, certain depositary receipts, futures contracts and foreign exchange rates that have occurred subsequent to the close of the foreign exchange or market, to determine a good faith estimate that reasonably reflects the current market conditions as of the close of the New York Stock Exchange. The fair value of a security is likely to be different from the quoted or published price, if available.
Multi-Manager International Equity Strategies Fund | Annual Report 2018
| 19 |
Notes to Financial Statements (continued)
August 31, 2018
Participation Notes are valued at the market price of the underlying equity security. Counterparty risk is regularly reviewed and considered for valuation.
Investments in open-end investment companies, including money market funds, are valued at their latest net asset value.
Investments for which market quotations are not readily available, or that have quotations which management believes are not reflective of market value or reliable, are valued at fair value as determined in good faith under procedures approved by and under the general supervision of the Board of Trustees. If a security or class of securities (such as foreign securities) is valued at fair value, such value is likely to be different from the quoted or published price for the security.
The determination of fair value often requires significant judgment. To determine fair value, management may use assumptions including but not limited to future cash flows and estimated risk premiums. Multiple inputs from various sources may be used to determine fair value.
GAAP requires disclosure regarding the inputs and valuation techniques used to measure fair value and any changes in valuation inputs or techniques. In addition, investments shall be disclosed by major category. This information is disclosed following the Fund’s Portfolio of Investments.
Foreign currency transactions and translations
The values of all assets and liabilities denominated in foreign currencies are generally translated into U.S. dollars at exchange rates determined at the close of regular trading on the New York Stock Exchange. Net realized and unrealized gains (losses) on foreign currency transactions and translations include gains (losses) arising from the fluctuation in exchange rates between trade and settlement dates on securities transactions, gains (losses) arising from the disposition of foreign currency and currency gains (losses) between the accrual and payment dates on dividends, interest income and foreign withholding taxes.
For financial statement purposes, the Fund does not distinguish that portion of gains (losses) on investments which is due to changes in foreign exchange rates from that which is due to changes in market prices of the investments. Such fluctuations are included with the net realized and unrealized gains (losses) on investments in the Statement of Operations.
Participation notes
The Fund invests in Participation Notes (P-Notes), which are a type of equity-linked note. P-Notes are issued by a bank or broker-dealer that entitles the Fund to a return measured by the change in value of a single equity security, basket of equity securities or an index of equity securities (each, an Underlying Equity). P-Notes are typically used when a direct investment in the Underlying Equity is restricted due to country-specific regulations. Investment in a P-Note is not the same as investment in the constituent shares of the company (or other issuer type) to which the Underlying Equity is economically tied. A P-Note represents only an obligation of the company or other issuer type to provide the Fund the economic performance equivalent to holding shares of the Underlying Equity. The holder of a P-Note is entitled to receive from the bank or broker-dealer any dividends or other distributions paid on the Underlying Equity. Income received from P-Notes is recorded as dividend income in the Statement of Operations. A P-Note does not provide any beneficial or equitable entitlement or interest in the relevant Underlying Equity. In other words, shares of the Underlying Equity are not in any way owned by the Fund. Risks associated with P-Notes include the possible failure of a counterparty (i.e., the issuing bank or broker-dealer) to perform in accordance with the terms of the agreement, inability to transfer or liquidate the notes, potential delays or an inability to redeem the notes before maturity under certain market conditions, and limited legal recourse against the issuer of the underlying common stock.
Security transactions
Security transactions are accounted for on the trade date. Cost is determined and gains (losses) are based upon the specific identification method for both financial statement and federal income tax purposes.
Income recognition
Corporate actions and dividend income are generally recorded net of any non-reclaimable tax withholdings, on the ex-dividend date or upon receipt of ex-dividend notification in the case of certain foreign securities.
| 20 | Multi-Manager International Equity Strategies Fund | Annual Report 2018 |
Notes to Financial Statements (continued)
August 31, 2018
The Fund may receive distributions from holdings in equity securities, business development companies (BDCs), exchange-traded funds (ETFs), limited partnerships (LPs), other regulated investment companies (RICs), and real estate investment trusts (REITs), which report information on the tax character of their distributions annually. These distributions are allocated to dividend income, capital gain and return of capital based on actual information reported. Return of capital is recorded as a reduction of the cost basis of securities held. If the Fund no longer owns the applicable securities, return of capital is recorded as a realized gain. With respect to REITs, to the extent actual information has not yet been reported, estimates for return of capital are made by the Fund’s management. Management’s estimates are subsequently adjusted when the actual character of the distributions is disclosed by the REITs, which could result in a proportionate change in return of capital to shareholders.
Awards from class action litigation are recorded as a reduction of cost basis if the Fund still owns the applicable securities on the payment date. If the Fund no longer owns the applicable securities, the proceeds are recorded as realized gains.
Expenses
General expenses of the Trust are allocated to the Fund and other funds of the Trust based upon relative net assets or other expense allocation methodologies determined by the nature of the expense. Expenses directly attributable to the Fund are charged to the Fund. Expenses directly attributable to a specific class of shares are charged to that share class.
Determination of class net asset value
All income, expenses (other than class-specific expenses, which are charged to that share class, as shown in the Statement of Operations) and realized and unrealized gains (losses) are allocated to each class of the Fund on a daily basis, based on the relative net assets of each class, for purposes of determining the net asset value of each class.
Federal income tax status
The Fund intends to qualify each year as a regulated investment company under Subchapter M of the Internal Revenue Code, as amended, and will distribute substantially all of its investment company taxable income and net capital gain, if any, for its tax year, and as such will not be subject to federal income taxes. In addition, the Fund intends to distribute in each calendar year substantially all of its ordinary income, capital gain net income and certain other amounts, if any, such that the Fund should not be subject to federal excise tax. Therefore, no federal income or excise tax provision is recorded.
Foreign taxes
The Fund may be subject to foreign taxes on income, gains on investments or currency repatriation, a portion of which may be recoverable. The Fund will accrue such taxes and recoveries, as applicable, based upon its current interpretation of tax rules and regulations that exist in the markets in which it invests.
Realized gains in certain countries may be subject to foreign taxes at the Fund level, based on statutory rates. The Fund accrues for such foreign taxes on realized and unrealized gains at the appropriate rate for each jurisdiction, as applicable. The amount, if any, is disclosed as a liability on the Statement of Assets and Liabilities.
Distributions to shareholders
Distributions from net investment income, if any, are declared and paid annually. Net realized capital gains, if any, are distributed at least annually. Income distributions and capital gain distributions are determined in accordance with federal income tax regulations, which may differ from GAAP.
Guarantees and indemnifications
Under the Trust’s organizational documents and, in some cases, by contract, its officers and trustees are indemnified against certain liabilities arising out of the performance of their duties to the Trust or its funds. In addition, certain of the Fund’s contracts with its service providers contain general indemnification clauses. The Fund’s maximum exposure under these arrangements is unknown since the amount of any future claims that may be made against the Fund cannot be determined, and the Fund has no historical basis for predicting the likelihood of any such claims.
Multi-Manager International Equity Strategies Fund | Annual Report 2018
| 21 |
Notes to Financial Statements (continued)
August 31, 2018
Recent accounting pronouncement
Accounting Standards Update 2017-08 Premium Amortization on Purchased Callable Debt Securities
In March 2017, the Financial Accounting Standards Board issued Accounting Standards Update (ASU) No. 2017-08 Premium Amortization on Purchased Callable Debt Securities. ASU No. 2017-08 updates the accounting standards to shorten the amortization period for certain purchased callable debt securities, held at a premium, to be amortized to the earliest call date. The update applies to securities with explicit, noncontingent call features that are callable at fixed prices and on preset dates. The standard is effective for annual periods beginning after December 15, 2018 and interim periods within those fiscal years. At this time, management is evaluating the implication of this guidance and the impact it will have on the financial statement amounts and footnote disclosures, if any.
Note 3. Fees and other transactions with affiliates
Management services fees
The Fund has entered into a Management Agreement with Columbia Management Investment Advisers, LLC (the Investment Manager), a wholly-owned subsidiary of Ameriprise Financial, Inc. (Ameriprise Financial). Under the Management Agreement, the Investment Manager provides the Fund with investment research and advice, as well as administrative and accounting services. The Investment Manager is responsible for the ultimate oversight of investments made by the Fund. The Fund’s subadvisers (see Subadvisory agreement below) have the primary responsibility for the day-to-day portfolio management of their portion of the Fund. The management services fee is an annual fee that is equal to a percentage of the Fund’s daily net assets that declines from 0.87% to 0.67% as the Fund’s net assets increase. The annualized effective management services fee rate for the year ended August 31, 2018 was 0.80% of the Fund’s average daily net assets.
Subadvisory agreement
The Investment Manager has entered into Subadvisory Agreements with Arrowstreet Capital, Limited Partnership (Arrowstreet), Baillie Gifford Overseas Limited (Baillie Gifford) and Causeway Capital Management LLC (Causeway) to subadvise a portion of the Fund. The Investment Manager compensates Arrowstreet, Baillie Gifford and Causeway to manage the investments of a portion of the Fund’s assets.
Other expenses
Other expenses include offering costs which were incurred prior to the shares of the Fund being offered. Offering costs include, among other things, state registration filing fees and printing costs. The Fund amortizes offering costs over a period of 12 months from the commencement of operations.
Compensation of board members
Members of the Board of Trustees who are not officers or employees of the Investment Manager or Ameriprise Financial are compensated for their services to the Fund as disclosed in the Statement of Operations. These members of the Board of Trustees may participate in a Deferred Compensation Plan (the Plan) which may be terminated at any time. Obligations of the Plan will be paid solely out of the Fund’s assets, and all amounts payable under the Plan constitute a general unsecured obligation of the Fund.
Compensation of Chief Compliance Officer
The Board of Trustees has appointed a Chief Compliance Officer to the Fund in accordance with federal securities regulations. As disclosed in the Statement of Operations, a portion of the Chief Compliance Officer’s total compensation is allocated to the Fund, along with other allocations to affiliated funds governed by the Board of Trustees, based on relative net assets.
| 22 | Multi-Manager International Equity Strategies Fund | Annual Report 2018 |
Notes to Financial Statements (continued)
August 31, 2018
Transfer agency fees
Under a Transfer and Dividend Disbursing Agent Agreement, Columbia Management Investment Services Corp. (the Transfer Agent), an affiliate of the Investment Manager and a wholly-owned subsidiary of Ameriprise Financial, is responsible for providing transfer agency services to the Fund. The Transfer Agent has contracted with DST Asset Manager Solutions, Inc. (DST) to serve as sub-transfer agent. The Transfer Agent pays the fees of DST for services as sub-transfer agent and DST is not entitled to reimbursement for such fees from the Fund (with the exception of out-of-pocket fees).
The Fund pays the Transfer Agent a monthly transfer agency fee based on the number or the average value of accounts, depending on the type of account. In addition, the Fund pays the Transfer Agent a fee for shareholder services based on the number of accounts or on a percentage of the average aggregate value of the Fund’s shares maintained in omnibus accounts up to the lesser of the amount charged by the financial intermediary or a cap established by the Board of Trustees from time to time.
The Transfer Agent also receives compensation from the Fund for various shareholder services and reimbursements for certain out-of-pocket fees.
For the year ended August 31, 2018, the Fund’s annualized effective transfer agency fee rates as a percentage of average daily net assets of each class were as follows:
| | Effective rate (%) |
| Institutional Class | 0.19 |
Distribution and service fees
The Fund has an agreement with Columbia Management Investment Distributors, Inc. (the Distributor), an affiliate of the Investment Manager and a wholly-owned subsidiary of Ameriprise Financial, for distribution and shareholder services. The Fund does not pay the Distributor a fee for the distribution services it provides to the Fund.
Expenses waived/reimbursed by the Investment Manager and its affiliates
The Investment Manager and certain of its affiliates have contractually agreed to waive fees and/or reimburse expenses (excluding certain fees and expenses described below) for the period(s) disclosed below, unless sooner terminated at the sole discretion of the Board of Trustees, so that the Fund’s net operating expenses, after giving effect to fees waived/expenses reimbursed and any balance credits and/or overdraft charges from the Fund’s custodian, do not exceed the following annual rate(s) as a percentage of the class’ average daily net assets:
| | Fee rate(s) contractual
through
December 31, 2019 |
| Institutional Class | 1.07% |
Under the agreement governing these fee waivers and/or expense reimbursement arrangements, the following fees and expenses are excluded from the waiver/reimbursement commitment, and therefore will be paid by the Fund, if applicable: taxes (including foreign transaction taxes), expenses associated with investments in affiliated and non-affiliated pooled investment vehicles (including mutual funds and exchange-traded funds), transaction costs and brokerage commissions, costs related to any securities lending program, dividend expenses associated with securities sold short, inverse floater program fees and expenses, transaction charges and interest on borrowed money, interest, infrequent and/or unusual expenses and any other expenses the exclusion of which is specifically approved by the Board of Trustees. This agreement may be modified or amended only with approval from the Investment Manager, certain of its affiliates and the Fund. Any fees waived and/or expenses reimbursed under the expense reimbursement arrangements described above are not recoverable by the Investment Manager or its affiliates in future periods.
Note 4. Federal tax information
The timing and character of income and capital gain distributions are determined in accordance with income tax regulations, which may differ from GAAP because of temporary or permanent book to tax differences.
Multi-Manager International Equity Strategies Fund | Annual Report 2018
| 23 |
Notes to Financial Statements (continued)
August 31, 2018
At August 31, 2018, these differences were primarily due to differing treatment for deferral/reversal of wash sale losses, passive foreign investment company (PFIC) holdings, capital loss carryforwards, trustees’ deferred compensation and foreign currency transactions. To the extent these differences were permanent, reclassifications were made among the components of the Fund’s net assets in the Statement of Assets and Liabilities. Temporary differences do not require reclassifications.
In the Statement of Assets and Liabilities the following reclassifications were made:
Undistributed net
investment
income ($) | Accumulated
net realized
(loss) ($) | Paid in
capital ($) |
| 257,301 | (257,301) | — |
Net investment income (loss) and net realized gains (losses), as disclosed in the Statement of Operations, and net assets were not affected by this reclassification.
For the years ended August 31, 2018 there were no distributions.
At August 31, 2018, the components of distributable earnings on a tax basis were as follows:
Undistributed
ordinary income ($) | Undistributed
long-term
capital gains ($) | Capital loss
carryforwards ($) | Net unrealized
(depreciation) ($) |
| 8,702,773 | — | (10,494,779) | (60,040,460) |
At August 31, 2018, the cost of all investments for federal income tax purposes along with the aggregate gross unrealized appreciation and depreciation based on that cost was:
Federal
tax cost ($) | Gross unrealized
appreciation ($) | Gross unrealized
(depreciation) ($) | Net unrealized
(depreciation) ($) |
| 2,094,907,252 | 54,924,867 | (114,965,327) | (60,040,460) |
Tax cost of investments and unrealized appreciation/(depreciation) may also include timing differences that do not constitute adjustments to tax basis.
The following capital loss carryforwards, determined at August 31, 2018, may be available to reduce taxable income arising from future net realized gains on investments, if any, to the extent permitted by the Internal Revenue Code. Capital loss carryforwards with no expiration are required to be utilized prior to any capital losses which carry an expiration date. As a result of this ordering rule, capital loss carryforwards which carry an expiration date may be more likely to expire unused. In addition, for the year ended August 31, 2018, capital loss carryforwards utilized, expired unused and permanently lost, if any, were as follows:
| 2019 ($) | No expiration
short-term ($) | No expiration
long-term ($) | Total ($) | Utilized ($) | Expired ($) | Permanently
lost ($) |
| — | 10,494,779 | — | 10,494,779 | — | — | — |
Management of the Fund has concluded that there are no significant uncertain tax positions in the Fund that would require recognition in the financial statements. However, management’s conclusion may be subject to review and adjustment at a later date based on factors including, but not limited to, new tax laws, regulations, and administrative interpretations (including relevant court decisions). Generally, the Fund’s federal tax returns for the prior three fiscal years remain subject to examination by the Internal Revenue Service.
Note 5. Portfolio information
The cost of purchases and proceeds from sales of securities, excluding short-term investments and derivatives, if any, aggregated to $2,399,250,806 and $319,976,271, respectively, for the year ended August 31, 2018. The amount of purchase and sale activity impacts the portfolio turnover rate reported in the Financial Highlights.
| 24 | Multi-Manager International Equity Strategies Fund | Annual Report 2018 |
Notes to Financial Statements (continued)
August 31, 2018
Note 6. Affiliated money market fund
The Fund invests in Columbia Short-Term Cash Fund, an affiliated money market fund established for the exclusive use by the Fund and other affiliated funds (the Affiliated MMF). The income earned by the Fund from such investments is included as Dividends - affiliated issuers in the Statement of Operations. As an investing fund, the Fund indirectly bears its proportionate share of the expenses of the Affiliated MMF. The Affiliated MMF prices its shares with a floating net asset value. In addition, the Board of Trustees of the Affiliated MMF may impose a fee on redemptions (sometimes referred to as a liquidity fee) or temporarily suspend redemptions (sometimes referred to as imposing a redemption gate) in the event its liquidity falls below regulatory limits.
Note 7. Interfund lending
Pursuant to an exemptive order granted by the Securities and Exchange Commission, the Fund participates in a program (the Interfund Program) allowing each participating Columbia Fund (each, a Participating Fund) to lend money directly to and, except for closed-end funds and money market funds, borrow money directly from other Participating Funds for temporary purposes. The amounts eligible for borrowing and lending under the Interfund Program are subject to certain restrictions.
Interfund loans are subject to the risk that the borrowing fund could be unable to repay the loan when due, and a delay in repayment to the lending fund could result in lost opportunities and/or additional lending costs. The exemptive order is subject to conditions intended to mitigate conflicts of interest arising from the Investment Manager’s relationship with each Participating Fund.
The Fund did not borrow or lend money under the Interfund Program during the year ended August 31, 2018.
Note 8. Line of credit
The Fund has access to a revolving credit facility with a syndicate of banks led by Citibank, N.A., HSBC Bank USA, N.A. and JPMorgan Chase Bank, N.A. whereby the Fund may borrow for the temporary funding of shareholder redemptions or for other temporary or emergency purposes. The credit facility, which is a collective agreement between the Fund and certain other funds managed by the Investment Manager, severally and not jointly, permits collective borrowings up to $1 billion. Interest is charged to each participating fund based on its borrowings at a rate equal to the higher of (i) the overnight federal funds rate plus 1.00% or (ii) the one-month LIBOR rate plus 1.00%. Each borrowing under the credit facility matures no later than 60 days after the date of borrowing. The Fund also pays a commitment fee equal to its pro rata share of the amount of the credit facility at a rate of 0.15% per annum. The commitment fee is included in other expenses in the Statement of Operations. This agreement expires annually in December unless extended or renewed.
The Fund had no borrowings during the year ended August 31, 2018.
Note 9. Significant risks
Foreign securities and emerging market countries risk
Investing in foreign securities may include certain risks and considerations not typically associated with investing in U.S. securities, such as fluctuating currency values and changing local and regional economic, political and social conditions, which may result in greater market volatility. In addition, certain foreign securities may not be as liquid as U.S. securities. Investing in emerging markets may accentuate these risks. These countries are also more likely to experience high levels of inflation, deflation or currency devaluation which could hurt their economies and securities markets. To the extent that the Fund concentrates its investment exposure to any one or a few specific countries, the Fund will be particularly susceptible to the various conditions, events or other factors impacting those countries and may, therefore, have a greater risk than that of a fund which is more geographically diversified.
Multi-Manager International Equity Strategies Fund | Annual Report 2018
| 25 |
Notes to Financial Statements (continued)
August 31, 2018
Geographic concentration risk
The Fund may be particularly susceptible to economic, political, regulatory or other events or conditions affecting issuers and countries within the specific geographic regions in which the Fund invests. Currency devaluations could occur in countries that have not yet experienced currency devaluation to date, or could continue to occur in countries that have already experienced such devaluations. The Fund’s NAV may be more volatile than the NAV of a more geographically diversified fund.
Shareholder concentration risk
At August 31, 2018, affiliated shareholders of record owned 100.0% of the outstanding shares of the Fund in one or more accounts. Subscription and redemption activity by concentrated accounts may have a significant effect on the operations of the Fund. In the case of a large redemption, the Fund may be forced to sell investments at inopportune times, including its liquid positions, which may result in Fund losses and the Fund holding a higher percentage of less liquid positions. Large redemptions could result in decreased economies of scale and increased operating expenses for non-redeeming Fund shareholders.
Note 10. Subsequent events
Management has evaluated the events and transactions that have occurred through the date the financial statements were issued and noted no items requiring adjustment of the financial statements or additional disclosure.
Note 11. Information regarding pending and settled legal proceedings
Ameriprise Financial and certain of its affiliates have historically been involved in a number of legal, arbitration and regulatory proceedings, including routine litigation, class actions, and governmental actions, concerning matters arising in connection with the conduct of their business activities. Ameriprise Financial believes that the Fund is not currently the subject of, and that neither Ameriprise Financial nor any of its affiliates are the subject of, any pending legal, arbitration or regulatory proceedings that are likely to have a material adverse effect on the Fund or the ability of Ameriprise Financial or its affiliates to perform under their contracts with the Fund. Ameriprise Financial is required to make quarterly (10-Q), annual (10-K) and, as necessary, 8-K filings with the Securities and Exchange Commission (SEC) on legal and regulatory matters that relate to Ameriprise Financial and its affiliates. Copies of these filings may be obtained by accessing the SEC website at www.sec.gov.
There can be no assurance that these matters, or the adverse publicity associated with them, will not result in increased Fund redemptions, reduced sale of Fund shares or other adverse consequences to the Fund. Further, although we believe proceedings are not likely to have a material adverse effect on the Fund or the ability of Ameriprise Financial or its affiliates to perform under their contracts with the Fund, these proceedings are subject to uncertainties and, as such, we are unable to estimate the possible loss or range of loss that may result. An adverse outcome in one or more of these proceedings could result in adverse judgments, settlements, fines, penalties or other relief that could have a material adverse effect on the consolidated financial condition or results of operations of Ameriprise Financial.
| 26 | Multi-Manager International Equity Strategies Fund | Annual Report 2018 |
Report of Independent Registered Public Accounting Firm
To the Board of Trustees of Columbia Funds Series Trust I and Shareholders of Multi-Manager International Equity Strategies Fund
Opinion on the Financial Statements
We have audited the accompanying statement of assets and liabilities, including the portfolio of investments, of Multi-Manager International Equity Strategies Fund (one of the funds constituting Columbia Funds Series Trust I, hereafter referred to as the “Fund”) as of August 31, 2018, and the related statements of operations and changes in net assets, including the related notes, and the financial highlights for the period May 17, 2018 (commencement of operations) through August 31, 2018 (collectively referred to as the “financial statements”). In our opinion, the financial statements present fairly, in all material respects, the financial position of the Fund as of August 31, 2018, and the results of its operations, changes in its net assets, and the financial highlights for the period May 17, 2018 (commencement of operations) through August 31, 2018 in conformity with accounting principles generally accepted in the United States of America
Basis for Opinion
These financial statements are the responsibility of the Fund’s management. Our responsibility is to express an opinion on the Fund’s financial statements based on our audit. We are a public accounting firm registered with the Public Company Accounting Oversight Board (United States) (“PCAOB”) and are required to be independent with respect to the Fund in accordance with the U.S. federal securities laws and the applicable rules and regulations of the Securities and Exchange Commission and the PCAOB.
We conducted our audit of these financial statements in accordance with the standards of the PCAOB. Those standards require that we plan and perform the audit to obtain reasonable assurance about whether the financial statements are free of material misstatement, whether due to error or fraud.
Our audit included performing procedures to assess the risks of material misstatement of the financial statements, whether due to error or fraud, and performing procedures that respond to those risks. Such procedures included examining, on a test basis, evidence regarding the amounts and disclosures in the financial statements. Our audits also included evaluating the accounting principles used and significant estimates made by management, as well as evaluating the overall presentation of the financial statements. Our procedures included confirmation of securities owned as of August 31, 2018, by correspondence with the custodian, transfer agent, and brokers; when replies were not received from brokers, we performed other audit procedures. We believe that our audit provides a reasonable basis for our opinion.
/s/PricewaterhouseCoopers LLP
Minneapolis, Minnesota
October 24, 2018
We have served as the auditor of one or more investment companies within the Columbia Funds Complex since 1977.
Multi-Manager International Equity Strategies Fund | Annual Report 2018
| 27 |
Federal Income Tax Information
(Unaudited)
The Fund hereby designates the following tax attributes for the fiscal year ended August 31, 2018. Shareholders will be notified in early 2019 of the amounts for use in preparing 2018 income tax returns.
Foreign
taxes paid
to foreign
countries | Foreign
taxes paid
per share
to foreign
countries | Foreign
source
income | Foreign
source
income per
share |
| $1,248,481 | $0.01 | $14,425,181 | $0.07 |
Foreign taxes. The Fund makes the election to pass through to shareholders the foreign taxes paid. Eligible shareholders may claim a foreign tax credit. These taxes, and the corresponding foreign source income, are provided.
| 28 | Multi-Manager International Equity Strategies Fund | Annual Report 2018 |
Shareholders elect the Board that oversees the Fund’s operations. The Board appoints officers who are responsible for day-to-day business decisions based on policies set by the Board. The following table provides basic biographical information about the Fund’s Trustees, including their principal occupations during the past five years, although specific titles for individuals may have varied over the period. The year set forth beneath Length of Service in the table below is the year in which the Trustee was first appointed or elected as Trustee to any Fund currently in the Columbia Funds Complex or a predecessor thereof. Under current Board policy, members serve terms of indefinite duration.
Independent trustees
| Name, address, year of birth | Position held with the Trust and length of service | Principal occupation(s) during the past five years and other relevant professional experience | Number of Funds in the Columbia Fund Complex overseen | Other directorships held by Trustee during the past five years |
Janet Langford Carrig
c/o Columbia Management
Investment Advisers, LLC
225 Franklin Street
Mail Drop BX32 05228
Boston, MA 02110
1957 | Trustee
1996 | Senior Vice President, General Counsel and Corporate Secretary, ConocoPhillips (independent energy company) since September 2007 | 69 | None |
Douglas A. Hacker
c/o Columbia Management
Investment Advisers, LLC
225 Franklin Street
Mail Drop BX32 05228
Boston, MA 02110
1955 | Trustee and Chairman of the Board
1996 | Independent business executive since May 2006; Executive Vice President — Strategy of United Airlines from December 2002 to May 2006; President of UAL Loyalty Services (airline marketing company) from September 2001 to December 2002; Executive Vice President and Chief Financial Officer of United Airlines from July 1999 to September 2001 | 69 | Spartan Nash Company, (food distributor); Nash Finch Company (food distributor) from 2005 to 2013; Aircastle Limited (aircraft leasing); SeaCube Container Leasing Ltd. (container leasing) from 2010 to 2013; and Travelport Worldwide Limited (travel information technology) |
Nancy T. Lukitsh
c/o Columbia Management
Investment Advisers, LLC
225 Franklin Street
Mail Drop BX32 05228
Boston, MA 02110
1956 | Trustee
2011 | Senior Vice President, Partner and Director of Marketing, Wellington Management Company, LLP (investment adviser) from 1997 to 2010; Chair, Wellington Management Portfolios (commingled non-U.S. investment pools) from 2007 to 2010; Director, Wellington Trust Company, NA and other Wellington affiliates from 1997 to 2010 | 69 | None |
David M. Moffett
c/o Columbia Management
Investment Advisers, LLC
225 Franklin Street
Mail Drop BX32 05228
Boston, MA 02110
1952 | Trustee
2011 | Retired. Consultant to Bridgewater and Associates | 69 | Director, CSX Corporation (transportation suppliers); Genworth Financial, Inc. (financial and insurance products and services); PayPal Holdings Inc. (payment and data processing services); Trustee, University of Oklahoma Foundation; former Director, eBay Inc. (online trading community), 2007-2015; and former Director, CIT Bank, CIT Group Inc. (commercial and consumer finance), 2010-2016 |
Multi-Manager International Equity Strategies Fund | Annual Report 2018
| 29 |
TRUSTEES AND OFFICERS (continued)
Independent trustees (continued)
| Name, address, year of birth | Position held with the Trust and length of service | Principal occupation(s) during the past five years and other relevant professional experience | Number of Funds in the Columbia Fund Complex overseen | Other directorships held by Trustee during the past five years |
John J. Neuhauser
c/o Columbia Management
Investment Advisers, LLC
225 Franklin Street
Mail Drop BX32 05228
Boston, MA 02110
1943 | Trustee
1984 | President, Saint Michael’s College since August 2007; Director or Trustee of several non-profit organizations, including University of Vermont Medical Center; Academic Vice President and Dean of Faculties, Boston College from August 1999 to October 2005; University Professor, Boston College from November 2005 to August 2007 | 69 | Liberty All-Star Equity Fund and Liberty All- Star Growth Fund (closed-end funds) |
Patrick J. Simpson
c/o Columbia Management
Investment Advisers, LLC
225 Franklin Street
Mail Drop BX32 05228
Boston, MA 02110
1944 | Trustee
2000 | Of Counsel, Perkins Coie LLP (law firm) since 2015; Partner, Perkins Coie LLP from 1988 to 2014 | 69 | None |
Anne-Lee Verville
c/o Columbia Management
Investment Advisers, LLC
225 Franklin Street
Mail Drop BX32 05228
Boston, MA 02110
1945 | Trustee
1998 | Retired. General Manager, Global Education Industry from 1994 to 1997, President – Application Systems Division from 1991 to 1994, Chief Financial Officer – US Marketing & Services from 1988 to 1991, and Chief Information Officer from 1987 to 1988, IBM Corporation (computer and technology) | 69 | Enesco Group, Inc. (producer of giftware and home and garden decor products) from 2001 to 2006 |
Consultants to the Independent Trustees*
| Name, address, year of birth | Position held with the Trust and length of service | Principal occupation(s) during the past five years and other relevant professional experience | Number of Funds in the Columbia Funds complex overseen | Other directorships held by Trustee during the past five years |
J. Kevin Connaughton
c/o Columbia
Management Investment
Advisers, LLC,
225 Franklin Street
Mail Drop BX32 05228,
Boston, MA 02110
1964 | Independent Trustee Consultant
2016 | Independent Trustee Consultant, Columbia Funds since March 2016; Adjunct Professor of Finance, Bentley University since November 2017; Managing Director and General Manager of Mutual Fund Products, Columbia Management Investment Advisers, LLC from May 2010 to February 2015; President, Columbia Funds from 2009 to 2015; and senior officer of Columbia Funds and affiliated funds from 2003 to 2015 | 69 | Director, The Autism Project since March 2015; former Trustee, New Century Portfolios, March 2015-December 2017; formerly on Board of Governors, Gateway Healthcare, January 2016 – December 2017 |
Natalie A. Trunow
c/o Columbia
Management Investment
Advisers, LLC,
225 Franklin Street
Mail Drop BX32 05228,
Boston, MA 02110
1967 | Independent Trustee Consultant
2016 | Independent Trustee Consultant, Columbia Funds since September 2016; Chief Executive Officer, Millennial Portfolio Solutions LLC (asset management and consulting services) since January 2016; Director of Investments, Casey Family Programs from April 2016 to September 2016; Senior Vice President and Chief Investment Officer, Calvert Investments from August 2008 to January 2016; Section Head and Portfolio Manager, General Motors Asset Management from June 1997 to August 2008 | 69 | Director, Health Services for Children with Special Needs, Inc.; Director, Guidewell Financial Solutions |
| * | J. Kevin Connaughton was appointed consultant to the Independent Trustees effective March 1, 2016. Natalie A. Trunow was appointed consultant to the Independent Trustees effective September 1, 2016. Shareholders of the Funds are expected to be asked to elect each of Mr. Connaughton and Ms. Trunow as a Trustee at a future shareholder meeting. |
| 30 | Multi-Manager International Equity Strategies Fund | Annual Report 2018 |
TRUSTEES AND OFFICERS (continued)
Interested trustee affiliated with Investment Manager*
| Name, address, year of birth | Position held with the Trust and length of service | Principal occupation(s) during the past five years and other relevant professional experience | Number of Funds in the Columbia Funds Complex overseen | Other directorships held by Trustee during the past five years |
William F. Truscott
c/o Columbia Management
Investment Advisers, LLC
225 Franklin Street
Boston, MA 02110
1960 | Trustee
2012 | Chairman of the Board and President, Columbia Management Investment Advisers, LLC since May 2010 and February 2012, respectively; Chief Executive Officer, Global Asset Management, Ameriprise Financial, Inc. since September 2012 (previously Chief Executive Officer, U.S. Asset Management & President, Annuities, May 2010-September 2012); Director and Chief Executive Officer, Columbia Management Investment Distributors, Inc. since May 2010 and February 2012, respectively; Chairman of the Board and Chief Executive Officer, RiverSource Distributors, Inc. since 2006; Director, Threadneedle Asset Management Holdings, SARL since 2014; President and Chief Executive Officer, Ameriprise Certificate Company, 2006-August 2012 | 193 | Chairman of the Board, Columbia Management Investment Advisers, LLC since May 2010; Director, Columbia Management Investment Distributors, Inc. since May 2010; former Director, Ameriprise Certificate Company, 2006 - January 2013 |
| * | Interested person (as defined under the 1940 Act) by reason of being an officer, director, security holder and/or employee of the Investment Manager or Ameriprise Financial. |
The Statement of Additional Information has additional information about the Fund’s Board members and is available,
without charge, upon request by calling 800.345.6611, contacting your financial intermediary or visiting
investor.columbiathreadneedleus.com.
Multi-Manager International Equity Strategies Fund | Annual Report 2018
| 31 |
TRUSTEES AND OFFICERS (continued)
The Board has appointed officers who are responsible for day-to-day business decisions based on policies it has established. The officers serve at the pleasure of the Board. The following table provides basic information about the Officers of the Fund, including principal occupations during the past five years, although their specific titles may have varied over the period. In addition to Mr. Truscott, who is Senior Vice President, the Fund’s other officers are:
Name,
address and
year of birth | Position and year
first appointed to
position for any Fund
in the Columbia
Funds complex or a
predecessor thereof | Principal occupation(s) during past five years |
Christopher O. Petersen
5228 Ameriprise
Financial Center
Minneapolis, MN 55474
Born 1970 | President and Principal Executive Officer (2015) | Vice President and Lead Chief Counsel, Ameriprise Financial, Inc. since January 2015 (previously, Vice President and Chief Counsel, January 2010 - December 2014; officer of Columbia Funds and affiliated funds since 2007. |
Michael G. Clarke
225 Franklin Street
Boston, MA 02110
Born 1969 | Treasurer (2011), Chief Financial Officer (2009) and Chief Accounting Officer (2015) | Vice President — Mutual Fund Administration, Columbia Management Investment Advisers, LLC, since May 2010; senior officer of Columbia Funds and affiliated funds since 2002. |
Paul B. Goucher
100 Park Avenue
New York, NY 10017
Born 1968 | Senior Vice President (2011) and Assistant Secretary (2008) | Senior Vice President and Assistant General Counsel, Ameriprise Financial, Inc. since January 2017 (previously, Vice President and Lead Chief Counsel, November 2008 - January 2017 and January 2013 - January 2017, respectively); Vice President, Chief Legal Officer and Assistant Secretary, Columbia Management Investment Advisers, LLC since May 2010. |
Thomas P. McGuire
225 Franklin Street
Boston, MA 02110
Born 1972 | Senior Vice President and Chief Compliance Officer (2012) | Vice President — Asset Management Compliance, Ameriprise Financial, Inc., since May 2010; Chief Compliance Officer, Ameriprise Certificate Company since September 2010. |
Colin Moore
225 Franklin Street
Boston, MA 02110
Born 1958 | Senior Vice President (2010) | Executive Vice President and Global Chief Investment Officer, Ameriprise Financial, Inc., since July 2013; Executive Vice President and Global Chief Investment Officer, Columbia Management Investment Advisers, LLC since July 2013. |
Ryan C. Larrenaga
225 Franklin Street
Boston, MA 02110
Born 1970 | Senior Vice President (2017), Chief Legal Officer (2017) and Secretary (2015) | Vice President and Chief Counsel, Ameriprise Financial, Inc. since August 2018 (previously, Vice President and Group Counsel, August 2011 - August 2018); officer of Columbia Funds and affiliated funds since 2005. |
Michael E. DeFao
225 Franklin Street
Boston, MA 02110
Born 1968 | Vice President (2011) and Assistant Secretary (2010) | Vice President and Chief Counsel, Ameriprise Financial, Inc. since May 2010. |
Amy Johnson
5228 Ameriprise
Financial Center
Minneapolis, MN 55474
Born 1965 | Vice President (2006) | Managing Director and Global Head of Operations, Columbia Management Investment Advisers, LLC since April 2016 (previously Managing Director and Chief Operating Officer, 2010 - 2016). |
Lyn Kephart-Strong
5228 Ameriprise
Financial Center
Minneapolis, MN 55474
Born 1960 | Vice President (2015) | President, Columbia Management Investment Services Corp. since October 2014; Vice President & Resolution Officer, Ameriprise Trust Company since August 2009. |
| 32 | Multi-Manager International Equity Strategies Fund | Annual Report 2018 |
Board Consideration and Approval of Management and Subadvisory Agreements
On March 7, 2018, the Board of Trustees (the Board) and the Trustees who are not interested persons (as defined in the Investment Company Act of 1940) (the Independent Trustees) of Columbia Funds Series Trust I (the Trust) unanimously approved, for an initial two-year term, and, on June 12, 2018, in connection with the Board’s review of the management agreements for the other series of the Trust, approved the continuation of, the Management Agreement (the Management Agreement) with Columbia Management Investment Advisers, LLC (the Investment Manager) and the Subadvisory Agreements (the Subadvisory Agreements) between the Investment Manager and Threadneedle International Limited (Threadneedle), Arrowstreet Capital, Limited Partnership (Arrowstreet), Baillie Gifford Overseas Limited (Baillie Gifford) and Causeway Capital Management LLC (Causeway) with respect to Multi-Manager International Equity Strategies Fund (the Fund), a series of the Trust. As detailed below, the Board’s Advisory Fees and Expenses Committee (the Committee) and the Board met to review and discuss, both among themselves and with the management team of the Investment Manager, materials provided by the Investment Manager and others before determining to approve the Management Agreement and the Subadvisory Agreements (collectively, the Agreements).
In connection with their deliberations regarding the proposed Management Agreement and Subadvisory Agreements, the Committee and the Board evaluated materials requested from the Investment Manager regarding the Fund and the Agreements, and discussed these materials, as well as other materials provided by the Investment Manager in connection with the Board’s most recent and current consideration of the annual approval of the continuation of the management agreements with respect to other series of the Trust, with representatives of the Investment Manager at the Committee meetings held on March 6, 2018 and June 11, 2018 and at Board meetings held on December 13, 2017, March 7, 2018 and June 12, 2018. The Committee and the Board also considered the Investment Manager’s representation regarding the substantial similarity of the resources available to the Investment Manager and Threadneedle, an affiliate of the Investment Manager.
The Committee and the Board also consulted with Fund counsel and the Independent Trustees’ independent legal counsel, who advised on various matters with respect to the Committee’s and the Board’s considerations and otherwise assisted the Committee and the Board in their deliberations.
The Committee and the Board considered all information that they, their legal counsel or the Investment Manager believed reasonably necessary to evaluate and to determine whether to recommend for approval or approve the Management Agreement and the Subadvisory Agreements. The information and factors considered by the Committee and the Board in recommending for approval or approving the Management Agreement and the Subadvisory Agreements for the Fund included the following:
| • | The Investment Manager’s agreement to contractually limit or cap total operating expenses for the Fund through December 31, 2019 so that total operating expenses (excluding certain fees and expenses, such as transaction costs and certain other investment related expenses, interest, taxes, acquired fund fees and expenses, and infrequent and/or unusual expenses) would not exceed a specified annual rate, as a percentage of the Fund’s net assets; |
| • | The terms and conditions of the Agreements; |
| • | The subadvisory fees payable by the Investment Manager under the Subadvisory Agreements; |
| • | Information on the Fund’s proposed management fees and anticipated total expenses, including information comparing the Fund’s anticipated expenses to those of a group of comparable mutual funds, as determined by the Investment Manager; |
| • | The current and proposed terms and conditions of other agreements and arrangements with affiliates of the Investment Manager relating to the operations of the Fund, including agreements with respect to the provision of distribution and transfer agency services to the Fund; |
| • | Descriptions of various functions performed by the Investment Manager and the Subadvisers under the Agreements, including portfolio management and portfolio trading practices; |
| • | Information regarding the management fees of similarly managed portfolios of other clients of the Investment Manager; |
Multi-Manager International Equity Strategies Fund | Annual Report 2018
| 33 |
Board Consideration and Approval of Management and Subadvisory Agreements (continued)
| • | Information regarding the reputation, regulatory history and resources of the Investment Manager and Subadvisers, including information regarding senior management, portfolio managers and other personnel; |
| • | Information regarding the capabilities of the Investment Manager and the Subadvisers with respect to compliance monitoring services, including an assessment of the Investment Manager’s and the Subadvisers’ compliance systems by the Fund’s Chief Compliance Officer; and |
| • | The profitability to the Investment Manager and its affiliates from their relationships with the Fund. |
Nature, extent and quality of services to be provided under the agreements
The Committee and the Board considered the nature, extent and quality of services to be provided to the Fund by the Investment Manager, the Subadvisers and the Investment Manager’s affiliates under the Agreements and under separate agreements for the provision of distribution and transfer agency services, and the resources to be dedicated to the Fund and the other Columbia Funds by the Investment Manager, the Subadvisers and the Investment Manager’s affiliates. The Committee and the Board considered, among other things, the Investment Manager’s ability to attract, motivate and retain highly qualified research, advisory and supervisory investment professionals (including compensation programs for personnel involved in fund management, reputation and other attributes), the portfolio management services provided by those investment professionals, and the Investment Manager’s and the Subadvisers’ investment research capabilities and trade execution services. The Committee and the Board also considered the potential benefits to shareholders of investing in a mutual fund that is part of a fund complex offering exposure to a variety of asset classes and investment disciplines and providing a variety of fund and shareholder services.
The Committee and the Board also considered the professional experience and qualifications of the senior personnel of the Investment Manager and the Subadvisers, which included consideration of the Investment Manager’s and the Subadvisers’ experience with similarly-structured funds. The Committee and the Board noted the compliance programs of and the compliance-related resources provided to the Fund by the Investment Manager and its affiliates, and considered the Investment Manager’s ability to provide administrative services to the Fund and coordinate the activities of the Fund’s other service providers. The Board also noted that, based on information provided by the Investment Manager, the Board had approved each Subadviser’s code of ethics and compliance program, and that the Chief Compliance Officer of the Funds reports to the Trustees on each Subadviser’s compliance program.
The Committee and the Board considered the diligence and selection process undertaken by the Investment Manager to select the Subadvisers, including the Investment Manager’s rationale for recommending the approval of the Subadvisory Agreements, and the process for monitoring the Subadvisers’ ongoing performance of services for the Fund. As part of these deliberations, the Committee and the Board considered the ability of the Investment Manager, subject to the approval of the Board, to modify or enter into new subadvisory agreements without a shareholder vote pursuant to an exemptive order of the Securities and Exchange Commission. The Committee and the Board also considered the scope of services provided to the Fund by the Investment Manager that would be distinct from and in addition to those that may or would be provided by the Subadvisers, including cash flow management, treasury services, risk oversight, investment oversight and Subadviser selection, oversight and transition management.
After reviewing these and related factors, the Committee and the Board concluded, within the context of their overall conclusions, that the expected nature, extent and quality of the services to be provided to the Fund under the Agreements supported the approval of the Agreements.
Investment performance
Because the Fund had not yet commenced operations as of March 2018, and had only recently commenced operations as of May 2018, the Committee and the Board did not have meaningful investment performance to compare to the returns of a group of comparable mutual funds. However, the Committee and the Board expected to consider, in connection with their next review and consideration of the continuation of the Agreements, the investment performance of the Fund in relation to the annualized return for various time periods of both a group of comparable funds, as determined by the independent third-party data provider, and a benchmark.
| 34 | Multi-Manager International Equity Strategies Fund | Annual Report 2018 |
Board Consideration and Approval of Management and Subadvisory Agreements (continued)
The Committee and the Board also considered the Investment Manager’s and Subadvisers’ performance and reputation generally, the Investment Manager’s historical responsiveness to Board concerns about performance, and the Investment Manager’s willingness to take steps intended to improve performance. The Board also considered the investment performance of Arrowstreet’s, Baillie Gifford’s and Causeway’s related composites, including their absolute and risk-adjusted returns, noting that Arrowstreet, Baillie Gifford and Causeway had delivered strong performance results over the one-, three- and five-year periods for strategies similar to those proposed for their respective sleeves of the Fund. After reviewing these and related factors, the Committee and the Board concluded, within the context of their overall conclusions, that the performance of the Investment Manager and the Subadvisers were sufficient, in light of other considerations, to warrant the approval of the Agreements.
Investment management fee rates and other expenses
The Committee and the Board considered the management fees to be charged to the Fund under the Management Agreement and the Subadvisory Agreements, as well as the total expenses expected to be incurred by the Fund. In assessing the reasonableness of the proposed fees under the Agreements, the Committee and the Board considered, among other information, the Fund’s proposed management fee and its expected total expense ratio as a percentage of average daily net assets. The Committee and the Board also considered, for each Subadviser for which such information was publicly available, the fees such Subadviser charges to certain of its other clients, and noted that the Investment Manager pays the fees of the Subadvisers. The Committee and the Board noted that Threadneedle was not currently expected to manage any assets under its respective Subadvisory Agreement, but that the Investment Manager could, in the future, allocate investments to be managed by the Subadviser. The Committee and the Board also took into account the proposed fee waiver and expense limitation arrangements that the Investment Manager and the Subadvisers would observe during the Fund’s first year, and the management fees and total expense ratios of comparable funds identified by the Investment Manager for purposes of expense comparison.
After reviewing these and related factors, the Committee and the Board concluded, within the context of their overall conclusions, that the management fee rates and expenses of the Fund supported the approval of the Agreements.
Costs of services to be provided and profitability
The Committee and the Board also took note of the costs the Investment Manager and its affiliates were expected to incur in connection with the services provided and the expected profitability to the Investment Manager and its affiliates from their relationships with the Fund, and also noted that the Committee and the Board expected to consider the costs of services and the profitability of the Investment Manager and its affiliates in connection with the Committee’s and the Board’s next review and consideration of the continuation of the Agreements. The Committee and the Board also considered court cases in which adviser profitability was an issue in whole or in part, the performance of similarly managed funds, the expected expense ratio of the Fund, and the implementation of expense limitations with respect to the Fund. In addition, the Committee and the Board considered information provided by the Investment Manager regarding the Investment Manager’s financial condition. Because the Subadvisory Agreements were negotiated at arms-length by the Investment Manager, which is responsible for payments to the Subadvisers thereunder, the Committee and the Board did not consider the profitability to each Subadviser of its relationship with the Fund.
After reviewing these and related factors, the Committee and the Board concluded, within the context of their overall conclusions, that the anticipated costs of services to be provided and the expected profitability to the Investment Manager and its affiliates from their relationships with the Fund supported the approval of the Agreements.
Economies of scale
The Committee and the Board considered the potential existence of economies of scale in the provision by the Investment Manager of services to the Fund, to groups of related funds, and to the Investment Manager’s investment advisory clients as a whole, and whether those economies of scale were expected to be shared with the Fund through breakpoints in the proposed investment management fees or other means, such as expense limitation arrangements and additional investments by the Investment Manager in investment, trading, compliance and other resources. The Committee and the Board noted that the management fee schedules for the Fund contained breakpoints that would reduce the fee rate on assets above specified threshold levels.
Multi-Manager International Equity Strategies Fund | Annual Report 2018
| 35 |
Board Consideration and Approval of Management and Subadvisory Agreements (continued)
The Committee and the Board noted that the breakpoints in the Subadvisory Agreements did not occur at the same levels as the breakpoints in the Management Agreement. The Committee and the Board noted that absent a shareholder vote, the Investment Manager would bear any increase in fees payable under the Subadvisory Agreements. The Committee and the Board also noted the potential challenges of seeking to tailor the Management Agreement breakpoints to those of a subadvisory agreement in this context, and the effect that capacity constraints on a subadviser’s ability to manage assets could potentially have on the ability of the Investment Manager to achieve economies of scale, as new subadvisers may need to be added as the Fund grows, increased the Investment Manager’s cost of compensating and overseeing the Fund’s subadvisers.
In considering these matters, the Committee and the Board also considered the costs of the services provided and the profitability to the Investment Manager and its affiliates from their relationships with the Fund, as noted above.
After reviewing these and related factors, the Committee and the Board concluded, within the context of their overall conclusions, that the extent to which any economies of scale were expected to be shared with the Fund supported the approval of the Agreements.
Other benefits to the Investment Manager and Subadvisers
The Committee and the Board received and considered information regarding “fall-out” or ancillary benefits to be received by the Investment Manager and its affiliates as a result of their relationships with the Fund, such as the engagement of the Investment Manager’s affiliates to provide distribution and transfer agency services to the Fund. The Committee and the Board also considered the benefits of research made available to the Investment Manager and the Subadvisers by reason of brokerage commissions to be generated by the Fund’s securities transactions, and reviewed information about the Investment Manager’s practices with respect to allocating portfolio transactions for brokerage and research services. The Committee and the Board recognized that the Investment Manager’s profitability would be somewhat lower without these benefits.
Conclusion
The Committee and the Board reviewed all of the above considerations in reaching their decisions to recommend for approval or approve the proposed Agreements. In their deliberations, the Trustees did not identify any particular information that was all-important or controlling, and individual Trustees may have attributed different weights to the various factors. Based on their evaluation of all factors that they deemed to be material, including those factors described above, and assisted by the advice of independent legal counsel, the Board, including the Independent Trustees, voting separately, approved the Agreements.
| 36 | Multi-Manager International Equity Strategies Fund | Annual Report 2018 |
The Fund mails one shareholder report to each shareholder address. If you would like more than one report, please call shareholder services at 800.345.6611 and additional reports will be sent to you.
Proxy voting policies and procedures
The policy of the Board of Trustees is to vote the proxies of the companies in which the Fund holds investments consistent with the procedures as stated in the Statement of Additional Information (SAI). You may obtain a copy of the SAI without charge by calling 800.345.6611; contacting your financial intermediary; visiting columbiathreadneedleus.com/investor/; or searching the website of the Securities and Exchange Commission (SEC) at sec.gov. Information regarding how the Fund voted proxies relating to portfolio securities is filed with the SEC by August 31st for the most recent 12-month period ending June 30th of that year, and is available without charge by visiting columbiathreadneedleus.com/investor/, or searching the website of the SEC at sec.gov.
Quarterly schedule of investments
The Fund files a complete schedule of portfolio holdings with the SEC for the first and third quarters of each fiscal year on Form N-Q or Form N-PORT. The Fund’s Form N-Q or Form N-PORT is available on the SEC’s website at sec.gov and may be reviewed and copied at the SEC’s Public Reference Room in Washington, D.C. Information on the operation of the Public Reference Room may be obtained by calling 800.SEC.0330. The Fund’s complete schedule of portfolio holdings, as filed on Form N-Q or Form N-PORT, can also be obtained without charge, upon request, by calling 800.345.6611.
Additional Fund information
For more information about the Fund, please visit columbiathreadneedleus.com/investor/ or call 800.345.6611. Customer Service Representatives are available to answer your questions Monday through Friday from 8 a.m. to 7 p.m. Eastern time.
Fund investment manager
Columbia Management Investment Advisers, LLC
225 Franklin Street
Boston, MA 02110
Fund distributor
Columbia Management Investment Distributors, Inc.
225 Franklin Street
Boston, MA 02110
Fund transfer agent
Columbia Management Investment Services Corp.
Through October 31, 2018:
P.O. Box 8081
Boston, MA 02266-8081
Effective November 1, 2018:
P.O. Box 219104
Kansas City, MO 64121-9104
Multi-Manager International Equity Strategies Fund | Annual Report 2018
| 37 |
Multi-Manager International Equity Strategies Fund
Through October 31, 2018:
P.O. Box 8081
Boston, MA 02266-8081
Effective November 1, 2018:
P.O. Box 219104
Kansas City, MO 64121-9104
Please read and consider the investment objectives, risks, charges and expenses for any fund carefully before investing. For a prospectus and summary prospectus, which contains this and other important information about the Fund, go to
columbiathreadneedleus.com/investor/. The Fund is distributed by Columbia Management Investment Distributors, Inc., member FINRA, and managed by Columbia Management Investment Advisers, LLC.
Columbia Threadneedle Investments (Columbia Threadneedle) is the global brand name of the Columbia and Threadneedle group of companies. All rights reserved.
© 2018 Columbia Management Investment Advisers, LLC.
columbiathreadneedleus .com/investor/
Item 2. Code of Ethics.
| | (a) | The registrant has adopted a code of ethics that applies to the registrant’s principal executive officer, principal financial officer, principal accounting officer or controller, or persons performing similar functions, regardless of whether these individuals are employed by the registrant or a third party. |
| | (b) | During the period covered by this report, there were not any amendments to a provision of the code of ethics adopted in 2(a) above. |
| | (c) | During the period covered by this report, there were no waivers, including any implicit waivers, from a provision of the code of ethics described in 2(a) above that relates to one or more of the items set forth in paragraph (b) of this item’s instructions. |
Item 3. Audit Committee Financial Expert.
The registrant’s Board of Trustees has determined that Douglas A. Hacker, David M. Moffett and Anne-Lee Verville, each of whom are members of the registrant’s Board of Trustees and Audit Committee, each qualify as an audit committee financial expert. Mr. Hacker, Mr. Moffett and Ms. Verville are each independent trustees, as defined in paragraph (a)(2) of this item’s instructions.
Item 4. Principal Accountant Fees and Services.
Fee information below is disclosed for the fifteen series of the registrant whose reports to shareholders are included in this annual filing.
(a) Audit Fees. Aggregate Audit Fees billed by the principal accountant for professional services rendered during the fiscal years ended August 31, 2018 and August 31, 2017 are approximately as follows:
| | |
| 2018 | | 2017 |
| $511,800 | | $459,700 |
Audit Fees include amounts related to the audit of the registrant’s annual financial statements or services that are normally provided by the accountant in connection with statutory and regulatory filings or engagements for those fiscal years.
(b) Audit-Related Fees. Aggregate Audit-Related Fees billed to the registrant by the principal accountant for professional services rendered during the fiscal years ended August 31, 2018 and August 31, 2017 are approximately as follows:
Audit-Related Fees include amounts for assurance and related services by the principal accountant that are reasonably related to the performance of the audit of the registrant’s financial statements and are not reported in Audit Fees above. In fiscal years 2017, Audit-Related Fees consist of agreed-upon procedures performed for semi-annual shareholder reports.
During the fiscal years ended August 31, 2018 and August 31, 2017, there were no Audit-Related Fees billed by the registrant’s principal accountant to the registrant’s investment adviser (not including any sub-adviser whose role is primarily portfolio management and is subcontracted with or overseen by another investment adviser) and any entity controlling, controlled by, or under common control with the adviser that provides ongoing services to the registrant for an engagement that related directly to the operations and financial reporting of the registrant.
(c) Tax Fees. Aggregate Tax Fees billed by the principal accountant to the registrant for professional services rendered during the fiscal years ended August 31, 2018 and August 31, 2017 are approximately as follows:
| | |
| 2018 | | 2017 |
| $121,300 | | $111,700 |
Tax Fees include amounts for the review of annual tax returns, the review of required shareholder distribution calculations and typically include amounts for professional services by the principal accountant for tax compliance, tax advice and tax planning. Fiscal years 2018 and 2017 include Tax Fees for foreign tax filings.
During the fiscal years ended August 31, 2018 and August 31, 2017, there were no Tax Fees billed by the registrant’s principal accountant to the registrant’s investment adviser (not including any sub-adviser whose role is primarily portfolio management and is subcontracted with or overseen by another investment adviser) and any entity controlling, controlled by, or under common control with the adviser that provides ongoing services to the registrant for an engagement that related directly to the operations and financial reporting of the registrant.
(d) All Other Fees. Aggregate All Other Fees billed by the principal accountant to the registrant for professional services rendered during the fiscal years ended August 31, 2018 and August 31, 2017 are approximately as follows:
All Other Fees include amounts for products and services provided by the principal accountant, other than the services reported in paragraphs (a) through (c) above.
Aggregate All Other Fees billed by the registrant’s principal accountant to the registrant’s investment adviser (not including any sub-adviser whose role is primarily portfolio
management and is subcontracted with or overseen by another investment adviser) and any entity controlling, controlled by, or under common control with the adviser that provides ongoing services to the registrant for an engagement that related directly to the operations and financial reporting of the registrant during the fiscal years ended August 31, 2018 and August 31, 2017 are approximately as follows:
| | |
| 2018 | | 2017 |
| $242,500 | | $242,500 |
In fiscal years 2018 and 2017, All Other Fees primarily consists of fees billed for internal control examinations of the registrant’s transfer agent and investment adviser.
(e)(1) Audit Committee Pre-Approval Policies and Procedures
The registrant’s Audit Committee is required to pre-approve the engagement of the registrant’s independent auditors to provide audit and non-audit services to the registrant and non-audit services to its investment adviser (excluding any sub-adviser whose role is primarily portfolio management and is sub-contracted or overseen by another investment adviser (the “Adviser”) or any entity controlling, controlled by or under common control with the Adviser that provides ongoing services to the Fund (a “Control Affiliate”) if the engagement relates directly to the operations and financial reporting of the registrant.
The Audit Committee has adopted a Policy for Engagement of Independent Auditors for Audit and Non-Audit Services (the “Policy”). The Policy sets forth the understanding of the Audit Committee regarding the engagement of the registrant’s independent accountants to provide (i) audit and permissible audit-related, tax and other services to the registrant (“Fund Services”); (ii) non-audit services to the registrant’s Adviser and any Control Affiliates, that relates directly to the operations and financial reporting of a Fund (“Fund-related Adviser Services”); and (iii) certain other audit and non-audit services to the registrant’s Adviser and its Control Affiliates. A service will require specific pre-approval by the Audit Committee if it is to be provided by the Fund’s independent auditor; provided, however, that pre-approval of non-audit services to the Fund, the Adviser or Control Affiliates may be waived if certain de minimis requirements set forth in the SEC’s rules are met.
Under the Policy, the Audit Committee may delegate pre-approval authority to any pre-designated member or members who are independent board members. The member(s) to whom such authority is delegated must report, for informational purposes only, any pre-approval decisions to the Audit Committee at its next regular meeting. The Audit Committee’s responsibilities with respect to the pre-approval of services performed by the independent auditor may not be delegated to management.
On an annual basis, at a regularly scheduled Audit Committee meeting, the Fund’s Treasurer or other Fund officer shall submit to the Audit Committee a schedule of the types of Fund Services and Fund-related Adviser Services that are subject to specific pre-approval. This schedule will provide a description of each type of service that is subject to specific pre-approval, along with total projected fees for each service. The pre-
approval will generally cover a one-year period. The Audit Committee will review and approve the types of services and the projected fees for the next one-year period and may add to, or subtract from, the list of pre-approved services from time to time, based on subsequent determinations. This specific approval acknowledges that the Audit Committee is in agreement with the specific types of services that the independent auditor will be permitted to perform and the projected fees for each service.
The Fund’s Treasurer or other Fund officer shall report to the Audit Committee at each of its regular meetings regarding all Fund Services or Fund-related Adviser Services provided since the last such report was rendered, including a description of the services, by category, with forecasted fees for the annual reporting period, proposed changes requiring specific pre-approval and a description of services provided by the independent auditor, by category, with actual fees during the current reporting period.
*****
(e)(2) 100% of the services performed for items (b) through (d) above during 2018 and 2017 were pre-approved by the registrant’s Audit Committee.
(f) Not applicable.
(g) The aggregate non-audit fees billed by the registrant’s accountant for services rendered to the registrant, and rendered to the registrant’s investment adviser (not including any sub-adviser whose role is primarily portfolio management and is subcontracted with or overseen by another investment adviser), and any entity controlling, controlled by, or under common control with the adviser that provides ongoing services to the registrant during the fiscal years ended August 31, 2018 and August 31, 2017 are approximately as follows:
| | |
| 2018 | | 2017 |
| $363,848 | | $359,800 |
(h) The registrant’s Audit Committee of the Board of Directors has considered whether the provision of non-audit services that were rendered to the registrant’s adviser (not including any sub-adviser whose role is primarily portfolio management and is subcontracted with or overseen by another investment adviser), and any entity controlling, controlled by, or under common control with the investment adviser that provides ongoing services to the registrant that were not pre-approved pursuant to paragraph (c)(7)(ii) of Rule 2-01 of Regulation S-X, is compatible with maintaining the principal accountant’s independence.
Item 5. Audit Committee of Listed Registrants.
Not applicable.
Item 6. Investments
| | (a) | The registrant’s “Schedule I – Investments in securities of unaffiliated issuers” (as set forth in 17 CFR 210.12-12) is included in Item 1 of this Form N-CSR. |
Item 7. Disclosure of Proxy Voting Policies and Procedures for Closed-End Management Investment Companies.
Not applicable.
Item 8. Portfolio Managers of Closed-End Management Investment Companies.
Not applicable.
Item 9. Purchases of Equity Securities by Closed-End Management Investment Company and Affiliated Purchasers.
Not applicable.
Item 10. Submission of Matters to a Vote of Security Holders.
There were no material changes to the procedures by which shareholders may recommend nominees to the registrant’s board of directors.
Item 11. Controls and Procedures.
| | (a) | The registrant’s principal executive officer and principal financial officer, based on their evaluation of the registrant’s disclosure controls and procedures as of a date within 90 days of the filing of this report, have concluded that such controls and procedures are adequately designed to ensure that material information required to be disclosed by the registrant in Form N-CSR is accumulated and communicated to the registrant’s management, including the principal executive officer and principal financial officer, or persons performing similar functions, as appropriate to allow timely decisions regarding required disclosure. |
| | (b) | There was no change in the registrant’s internal control over financial reporting that occurred during the registrant’s second fiscal quarter of the period covered by this report that has materially affected, or is reasonably likely to materially affect, the registrant’s internal control over financial reporting. |
Item 12. Disclosure of Securities Lending Activities for Closed-End Management Investment Companies
Not applicable.
Item 13. Exhibits.
(a)(1) Code of ethics required to be disclosed under Item 2 of Form N-CSR attached hereto as Exhibit 99.CODE ETH.
(a)(2) Certifications pursuant to Rule 30a-2(a) under the Investment Company Act of 1940 (17 CFR 270.30a-2(a)) attached hereto as Exhibit 99.CERT.
(a)(3) Not applicable.
(b) Certification pursuant to Rule 30a-2(b) under the Investment Company Act of 1940 (17 CFR 270.30a-2(b)) attached hereto as Exhibit 99.906CERT.
SIGNATURES
Pursuant to the requirements of the Securities Exchange Act of 1934 and the Investment Company Act of 1940, the registrant has duly caused this report to be signed on its behalf by the undersigned, thereunto duly authorized.
(registrant) Columbia Funds Series Trust I
By (Signature and Title) /s/ Christopher O. Petersen
Christopher O. Petersen, President and Principal Executive Officer
Date October 24, 2018
Pursuant to the requirements of the Securities Exchange Act of 1934 and the Investment Company Act of 1940, this report has been signed below by the following persons on behalf of the registrant and in the capacities and on the dates indicated.
By (Signature and Title) /s/ Christopher O. Petersen
Christopher O. Petersen, President and Principal Executive Officer
Date October 24, 2018
By (Signature and Title) /s/ Michael G. Clarke
Michael G. Clarke, Treasurer and Chief Financial Officer
Date October 24, 2018