UNITED STATES
SECURITIES AND EXCHANGE COMMISSION
Washington, D.C. 20549
FORMN-CSR
CERTIFIED SHAREHOLDER REPORT OF REGISTERED
MANAGEMENT INVESTMENT COMPANIES
Investment Company Act file number811-04367
Columbia Funds Series Trust I
(Exact name of registrant as specified in charter)
225 Franklin Street
Boston, Massachusetts 02110
(Address of principal executive offices) (Zip code)
Christopher O. Petersen, Esq.
c/o Columbia Management Investment Advisers, LLC
225 Franklin Street
Boston, Massachusetts 02110
Ryan C. Larrenaga, Esq.
c/o Columbia Management Investment Advisers, LLC
225 Franklin Street
Boston, MA 02110
(Name and address of agent for service)
Registrant’s telephone number, including area code: (800) 345-6611
Date of fiscal year end: April 30
Date of reporting period: April 30, 2019
FormN-CSR is to be used by management investment companies to file reports with the Commission not later than 10 days after the transmission to stockholders of any report that is required to be transmitted to stockholders under Rule30e-1 under the Investment Company Act of 1940 (17 CFR270.30e-1). The Commission may use the information provided on FormN-CSR in its regulatory, disclosure review, inspection, and policymaking roles.
A registrant is required to disclose the information specified by FormN-CSR, and the Commission will make this information public. A registrant is not required to respond to the collection of information contained in FormN-CSR unless the Form displays a currently valid Office of Management and Budget (“OMB”) control number. Please direct comments concerning the accuracy of the information collection burden estimate and any suggestions for reducing the burden to Secretary, Securities and Exchange Commission, 100 F Street, NE, Washington, DC 20549. The OMB has reviewed this collection of information under the clearance requirements of 44 U.S.C. § 3507.
Item 1. Reports to Stockholders.

Annual Report
April 30, 2019
Beginning on January 1, 2021, as permitted by regulations adopted by the Securities and Exchange Commission, paper copies of the Fund’s annual and semiannual shareholder reports like this one will no longer be sent by mail, unless you specifically request paper copies of the reports. Instead, the reports will be made available on the Fund’s website (columbiathreadneedleus.com/investor/), and each time a report is posted you will be notified by mail and provided with a website address to access the report.
If you have already elected to receive shareholder reports electronically, you will not be affected by this change and you need not take any action. You may elect to receive shareholder reports and other communications from the Fund electronically at any time by contacting your financial intermediary (such as a broker-dealer or bank) or, for Fund shares held directly with the Fund, by calling 800.345.6611 or by enrolling in “eDelivery” by logging into your account at columbiathreadneedleus.com/investor/.
You may elect to receive all future reports in paper free of charge. If you invest through a financial intermediary, you can contact your financial intermediary to request that you continue receiving paper copies of your shareholder reports. If you invest directly with the Fund, you can call 800.345.6611 to let the Fund know you wish to continue receiving paper copies of your shareholder reports. Your election to receive paper reports will apply to all Columbia Funds held in your account if you invest through a financial intermediary or all Columbia Funds held with the fund complex if you invest directly with the Fund.
Not FDIC Insured • No bank guarantee • May lose value
Columbia Bond Fund | Annual Report 2019
Investment objective
Columbia Bond Fund (the Fund) seeks current income, consistent with minimal fluctuation of principal.
Portfolio management
Jason Callan
Lead Portfolio Manager
Managed Fund since 2016
Gene Tannuzzo, CFA
Portfolio Manager
Managed Fund since November 2017
| Average annual total returns (%) (for the period ended April 30, 2019) |
| | | Inception | 1 Year | 5 Years | 10 Years |
| Class A | Excluding sales charges | 03/31/08 | 4.98 | 2.46 | 3.72 |
| | Including sales charges | | 0.02 | 1.47 | 3.21 |
| Advisor Class* | 11/08/12 | 5.24 | 2.71 | 3.96 |
| Class C | Excluding sales charges | 03/31/08 | 4.20 | 1.70 | 2.99 |
| | Including sales charges | | 3.20 | 1.70 | 2.99 |
| Institutional Class | 01/09/86 | 5.24 | 2.71 | 3.96 |
| Institutional 2 Class* | 11/08/12 | 5.24 | 2.80 | 4.02 |
| Institutional 3 Class* | 07/15/09 | 5.41 | 2.90 | 4.11 |
| Class R* | 11/16/11 | 4.71 | 2.20 | 3.40 |
| Class V* | Excluding sales charges | 03/07/11 | 4.96 | 2.53 | 3.80 |
| | Including sales charges | | 0.00 | 1.54 | 3.30 |
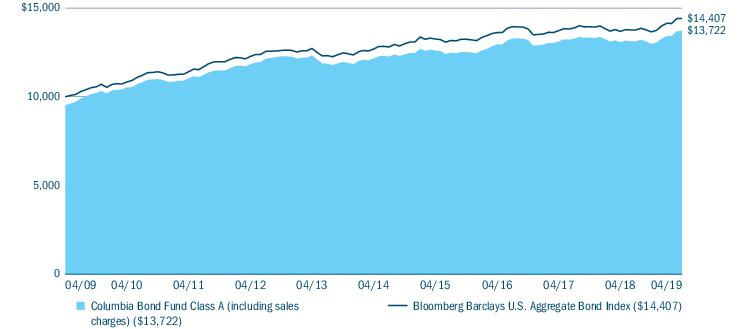
| Bloomberg Barclays U.S. Aggregate Bond Index | | 5.29 | 2.57 | 3.72 |
Returns for Class A and Class V shares are shown with and without the maximum initial sales charge of 4.75%. Returns for Class C shares are shown with and without the 1.00% contingent deferred sales charges for the first year only. The Fund’s other share classes are not subject to sales charges and have limited eligibility. Please see the Fund’s prospectus for details. Performance for different share classes will vary based on differences in sales charges and fees associated with each share class. All results shown assume reinvestment of distributions during the period. Returns do not reflect the deduction of taxes that a shareholder may pay on Fund distributions or on the redemption of Fund shares. Performance results reflect the effect of any fee waivers or reimbursements of Fund expenses by Columbia Management Investment Advisers, LLC and/or any of its affiliates. Absent these fee waivers or expense reimbursement arrangements, performance results would have been lower.
The performance information shown represents past performance and is not a guarantee of future results. The investment return and principal value of your investment will fluctuate so that your shares, when redeemed, may be worth more or less than their original cost. Current performance may be lower or higher than the performance information shown. You may obtain performance information current to the most recent month-end by contacting your financial intermediary, visiting columbiathreadneedleus.com/investor/ or calling 800.345.6611.
| * | The returns shown for periods prior to the share class inception date (including returns for the Life of the Fund, if shown, which are since Fund inception) include the returns of the Fund’s oldest share class. These returns are adjusted to reflect any higher class-related operating expenses of the newer share classes, as applicable. Please visit columbiathreadneedleus.com/investor/investment-products/mutual-funds/appended-performance for more information. |
The Bloomberg Barclays U.S. Aggregate Bond Index is a broad-based benchmark that measures the investment-grade, U.S. dollar-denominated, fixed-rate taxable bond market, including Treasuries, government-related and corporate securities, mortgage-backed securities (agency fixed-rate and hybrid adjustable-rate mortgage passthroughs), asset-backed securities, and commercial mortgage-backed securities.
Indices are not available for investment, are not professionally managed and do not reflect sales charges, fees, brokerage commissions, taxes or other expenses of investing. Securities in the Fund may not match those in an index.
Columbia Bond Fund | Annual Report 2019
| 3 |
Fund at a Glance (continued)
Performance of a hypothetical $10,000 investment (April 30, 2009 — April 30, 2019)
The chart above shows the change in value of a hypothetical $10,000 investment in Class A shares of Columbia Bond Fund during the stated time period, and does not reflect the deduction of taxes that a shareholder may pay on Fund distributions or on the redemption of Fund shares.
| Portfolio breakdown (%) (at April 30, 2019) |
| Asset-Backed Securities — Non-Agency | 17.2 |
| Commercial Mortgage-Backed Securities - Agency | 1.3 |
| Commercial Mortgage-Backed Securities - Non-Agency | 9.3 |
| Common Stocks | 0.0(a) |
| Corporate Bonds & Notes | 18.1 |
| Foreign Government Obligations | 0.4 |
| Money Market Funds | 3.6 |
| Municipal Bonds | 0.3 |
| Options Purchased Calls | 0.0(a) |
| Residential Mortgage-Backed Securities - Agency | 28.8 |
| Residential Mortgage-Backed Securities - Non-Agency | 20.4 |
| U.S. Treasury Obligations | 0.6 |
| Total | 100.0 |
Percentages indicated are based upon total investments including options purchased and excluding all other investments in derivatives, if any. The Fund’s portfolio composition is subject to change.
| Quality breakdown (%) (at April 30, 2019) |
| AAA rating | 47.9 |
| AA rating | 6.3 |
| A rating | 9.6 |
| BBB rating | 16.7 |
| Not rated | 19.5 |
| Total | 100.0 |
Percentages indicated are based upon total fixed income investments.
Bond ratings apply to the underlying holdings of the Fund and not the Fund itself and are divided into categories ranging from highest to lowest credit quality, determined by using the middle rating of Moody’s, S&P and Fitch, after dropping the highest and lowest available ratings. When ratings are available from only two rating agencies, the lower rating is used. When a rating is available from only one rating agency, that rating is used. When a bond is not rated by any rating agency, it is designated as “Not rated.” Credit quality ratings assigned by a rating agency are subjective opinions, not statements of fact, and are subject to change, including daily. The ratings assigned by credit rating agencies are but one of the considerations that the Investment Manager and/or Fund’s subadviser incorporates into its credit analysis process, along with such other issuer-specific factors as cash flows, capital structure and leverage ratios, ability to de-leverage (repay) through free cash flow, quality of management, market positioning and access to capital, as well as such security-specific factors as the terms of the security (e.g., interest rate and time to maturity) and the amount and type of any collateral.
| 4 | Columbia Bond Fund | Annual Report 2019 |
Manager Discussion of Fund Performance
For the 12-month period that ended April 30, 2019, the Fund’s Class A shares returned 4.98% excluding sales charges. The Fund’s benchmark, the Bloomberg Barclays U.S. Aggregate Bond Index, returned 5.29% for the same period. The Fund’s relative performance was aided by allocation across segments of the bond market and to a lesser degree by overall security selection, while positioning with respect to interest rates detracted slightly.
Risk sentiment driven by shifting Federal Reserve posture
As the period opened, credit sentiment was bolstered by positive economic growth, strong corporate profits and the supportive tax legislation passed at the end of 2017. The outlook was clouded to some degree by the Trump administration’s escalating anti-free trade rhetoric, which led to bouts of market volatility. In addition to keeping a wary eye on trade disputes, fixed-income investors focused on the trajectory of efforts by the U.S. Federal Reserve (the Fed) to “normalize” interest rates. With inflation hovering near its 2% target and the vast majority of companies reporting above-expectation second quarter earnings, the Fed began to foreshadow a more hawkish stance as the period progressed. At its June 13 meeting, the Fed increased the target range for its benchmark overnight lending rate by 25 basis points to between 1.75% and 2.00%. Promising economic data would subsequently lead the markets to anticipate two additional rate hikes before the end of 2018. Indeed, at its September meeting, the Fed implemented another quarter-point hike in the federal funds rate to the 2.00% to 2.25% range while signaling the likelihood of a December increase. Entering the fourth quarter of 2018, stress began to rise in the credit markets and spreads started to widen.
In mid-December, the Fed met expectations and raised its short-term rate target to the 2.25% to 2.50% range, while noting the potential for two additional hikes in 2019. In combination with the ongoing Brexit debacle and signs of slowing global growth, fears that the Fed would overshoot on rates led to a spike in volatility for risk assets. Over the last three months of 2018, the 10-year Treasury yield declined from 3.05% to 2.69% as investors sought a safe haven. Energy-related issues were battered as crude oil prices plunged over the fourth quarter on concerns around a weaker demand outlook and higher-than-expected supply driven in part by a loosening of U.S. sanctions on Iran.
Risk-oriented assets rebounded sharply in January of 2019 as the Fed pivoted to a more dovish tone, announcing an early end to its balance sheet reduction program and indicating it was leaning toward putting rate increases on pause. Weak economic data out of the eurozone and China led to renewed accommodation from the European Central Bank and the People’s Bank of China, to go alone with the Fed’s actions. Modest progress on trade matters, a firming in oil prices and positive corporate earnings reports also helped boost credit sentiment. While the overall pace of gains moderated and there was some interim volatility, credit sensitive assets continued to outperform through the end of April 2019.
Yields finished lower along the length of the U.S. Treasury curve over the 12-month period ended April 30, 2019, with yields on intermediate maturities experiencing the biggest declines. To illustrate, the two-year Treasury yield fell 22 basis points from 2.49% to 2.27%, the five-year declined 51 basis points from 2.79% to 2.28%, the 10-year declined 44 basis points from 2.95% to 2.51%, the 20-year declined 26 basis points from 3.01% to 2.75%, and the 30-year yield declined 18 basis points from 3.11% to 2.93%.
Contributors and detractors
Positive contributions to the Fund’s performance were led by sector allocation, with security selection contributing to a lesser degree. With respect to sector allocation, the Fund’s weighting toward securitized assets driven by a positive view on consumer fundamentals led contributions. Within securitized assets, an off-benchmark allocation to non-agency mortgage-backed securities added most notably to performance, while exposures to commercial mortgage-backed securities and asset-backed securities were beneficial as well. Exposure to foreign government-related or “quasi-sovereign” issuers also benefited performance, highlighted by a position in a Mexican energy company.
In terms of security selection, positive contributions were led by our preference within agency mortgage-backed securities for collateralized mortgage obligations structured to protect against prepayment risk, as prices for these issues benefited from declining interest rates. Selection was also positive within asset-backed securities where a tilt toward receivables backed by unsecured consumer loans aided performance, as well as within commercial mortgage-backed securities. These contributions were partially offset by a focus within investment grade corporates on longer maturity, lower rated issues in the BBB quality range, as the segment was more impacted by late-2018’s rout in credit markets than the rest of the investment-grade sector.
Columbia Bond Fund | Annual Report 2019
| 5 |
Manager Discussion of Fund Performance (continued)
The Fund’s positioning during the period with respect to overall portfolio duration (and corresponding sensitivity to interest rates) had a slight negative impact on performance.
We invested in highly-liquid, widely-traded Treasury futures and interest rate swap contracts to help manage portfolio duration. These enabled us to efficiently implement our yield curve opinions and offset unintended yield curve impacts from other investments in the portfolio. We also used indexed exposure to credit default swaps to manage the Fund’s overall level of credit risk. On a standalone basis, the Fund’s use of derivatives did not materially impact performance.
At period’s end
At the close of the reporting period we had a cautious view on whether economic activity would be sustained at its current level over the next few quarters. In our view, it seemed likely that U.S. growth would ease as the effects of tax cuts and fiscal stimulus roll off. In terms of support from overseas, while we saw signs of some firming in China growth, European economies remained under stress. The Fund was positioned with a modest overweight to duration on our view that upward pressure on interest rates would likely to be restrained against this backdrop.
With respect to corporate credit, the Fund’s positioning was biased toward higher quality given the extended duration of the current recovery and relatively full valuations. We continued to view the consumer as in an earlier stage of the credit cycle relative to corporations, supported by historically low unemployment, wage gains and strength in housing. In this vein, the Fund was emphasizing segments such as non-agency mortgage-backed securities and asset-backed securities, along with commercial mortgage-backed securities.
Marketrisk may affect a single issuer, sector of the economy, industry or the market as a whole.Mortgage- and asset-backedsecuritiesare affected by interest rates, financial health of issuers/originators, creditworthiness of entities providing credit enhancements and the value of underlying assets. Fixed-income securities presentissuer default risk. A rise ininterest rates may result in a price decline of fixed-income instruments held by the Fund, negatively impacting its performance and NAV. Falling rates may result in the Fund investing in lower yielding debt instruments, lowering the Fund’s income and yield. These risks may be heightened for longer maturity and duration securities.Non-investment-grade (high-yield or junk) securities present greater price volatility and more risk to principal and income than higher rated securities.Prepayment and extension risk exists because the timing of payments on a loan, bond or other investment may accelerate when interest rates fall or decelerate when interest rates rise which may reduce investment opportunities and potential returns. Investing inderivativesis a specialized activity that involves special risks that subject the Fund to significant loss potential, including when used as leverage, and may result in greater fluctuation in Fund value. See the Fund’s prospectus for more information on these and other risks.
The views expressed in this report reflect the current views of the respective parties. These views are not guarantees of future performance and involve certain risks, uncertainties and assumptions that are difficult to predict, so actual outcomes and results may differ significantly from the views expressed. These views are subject to change at any time based upon economic, market or other conditions and the respective parties disclaim any responsibility to update such views. These views may not be relied on as investment advice and, because investment decisions for a Columbia fund are based on numerous factors, may not be relied on as an indication of trading intent on behalf of any particular Columbia fund. References to specific securities should not be construed as a recommendation or investment advice.
| 6 | Columbia Bond Fund | Annual Report 2019 |
Understanding Your Fund’s Expenses
(Unaudited)
As an investor, you incur two types of costs. There are shareholder transaction costs, which generally include sales charges on purchases and may include redemption fees. There are also ongoing fund costs, which generally include management fees, distribution and/or service fees, and other fund expenses. The following information is intended to help you understand your ongoing costs (in dollars) of investing in the Fund and to help you compare these costs with the ongoing costs of investing in other mutual funds.
Analyzing your Fund’s expenses
To illustrate these ongoing costs, we have provided examples and calculated the expenses paid by investors in each share class of the Fund during the period. The actual and hypothetical information in the table is based on an initial investment of $1,000 at the beginning of the period indicated and held for the entire period. Expense information is calculated two ways and each method provides you with different information. The amount listed in the “Actual” column is calculated using the Fund’s actual operating expenses and total return for the period. You may use the Actual information, together with the amount invested, to estimate the expenses that you paid over the period. Simply divide your account value by $1,000 (for example, an $8,600 account value divided by $1,000 = 8.6), then multiply the results by the expenses paid during the period under the “Actual” column. The amount listed in the “Hypothetical” column assumes a 5% annual rate of return before expenses (which is not the Fund’s actual return) and then applies the Fund’s actual expense ratio for the period to the hypothetical return. You should not use the hypothetical account values and expenses to estimate either your actual account balance at the end of the period or the expenses you paid during the period. See “Compare with other funds” below for details on how to use the hypothetical data.
Compare with other funds
Since all mutual funds are required to include the same hypothetical calculations about expenses in shareholder reports, you can use this information to compare the ongoing cost of investing in the Fund with other funds. To do so, compare the hypothetical example with the 5% hypothetical examples that appear in the shareholder reports of other funds. As you compare hypothetical examples of other funds, it is important to note that hypothetical examples are meant to highlight the ongoing costs of investing in a fund only and do not reflect any transaction costs, such as sales charges, or redemption or exchange fees. Therefore, the hypothetical calculations are useful in comparing ongoing costs only, and will not help you determine the relative total costs of owning different funds. If transaction costs were included in these calculations, your costs would be higher.
| November 1, 2018 — April 30, 2019 |
| | Account value at the
beginning of the
period ($) | Account value at the
end of the
period ($) | Expenses paid during
the period ($) | Fund’s annualized
expense ratio (%) |
| | Actual | Hypothetical | Actual | Hypothetical | Actual | Hypothetical | Actual |
| Class A | 1,000.00 | 1,000.00 | 1,057.70 | 1,020.73 | 4.18 | 4.11 | 0.82 |
| Advisor Class | 1,000.00 | 1,000.00 | 1,059.10 | 1,021.97 | 2.91 | 2.86 | 0.57 |
| Class C | 1,000.00 | 1,000.00 | 1,053.80 | 1,017.01 | 7.99 | 7.85 | 1.57 |
| Institutional Class | 1,000.00 | 1,000.00 | 1,059.00 | 1,021.97 | 2.91 | 2.86 | 0.57 |
| Institutional 2 Class | 1,000.00 | 1,000.00 | 1,058.50 | 1,022.56 | 2.30 | 2.26 | 0.45 |
| Institutional 3 Class | 1,000.00 | 1,000.00 | 1,059.80 | 1,022.81 | 2.04 | 2.01 | 0.40 |
| Class R | 1,000.00 | 1,000.00 | 1,056.40 | 1,019.49 | 5.46 | 5.36 | 1.07 |
| Class V | 1,000.00 | 1,000.00 | 1,057.00 | 1,021.22 | 3.67 | 3.61 | 0.72 |
Expenses paid during the period are equal to the annualized expense ratio for each class as indicated above, multiplied by the average account value over the period and then multiplied by the number of days in the Fund’s most recent fiscal half year and divided by 365.
Expenses do not include fees and expenses incurred indirectly by the Fund from its investment in underlying funds, including affiliated and non-affiliated pooled investment vehicles, such as mutual funds and exchange-traded funds.
Had Columbia Management Investment Advisers, LLC and/or certain of its affiliates not waived/reimbursed certain fees and expenses, account value at the end of the period would have been reduced.
Columbia Bond Fund | Annual Report 2019
| 7 |
Portfolio of Investments
April 30, 2019
(Percentages represent value of investments compared to net assets)
Investments in securities
| Asset-Backed Securities — Non-Agency 20.1% |
| Issuer | Coupon
Rate | | Principal
Amount ($) | Value ($) |
| American Credit Acceptance Receivables Trust(a) |
| Subordinated Series 2018-3 Class B |
| 06/13/2022 | 3.490% | | 2,500,000 | 2,505,755 |
| Avant Loans Funding Trust(a) |
| Series 2018-A Class A |
| 06/15/2021 | 3.090% | | 707,395 | 706,984 |
| Series 2018-B Class A |
| 01/18/2022 | 3.420% | | 1,854,125 | 1,855,923 |
| Series 2019-A Class A |
| 07/15/2022 | 3.480% | | 2,446,879 | 2,451,631 |
| Bain Capital Credit CLO(a),(b) |
| Series 2018-1A Class B |
3-month USD LIBOR + 1.400%
04/23/2031 | 3.992% | | 2,000,000 | 1,968,200 |
| Carlyle Group LP(a),(b) |
| Series 2017-5A Class A2 |
3-month USD LIBOR + 1.400%
01/20/2030 | 3.992% | | 2,000,000 | 1,968,704 |
| Cent CLO Ltd.(a),(b) |
| Series 2018-C17A Class A2R |
3-month USD LIBOR + 1.600%
04/30/2031 | 4.183% | | 1,800,000 | 1,782,904 |
| CLUB Credit Trust(a) |
| Series 2017-P2 Class A |
| 01/15/2024 | 2.610% | | 935,060 | 931,732 |
| Series 2018-P3 Class A |
| 01/15/2026 | 3.820% | | 1,379,035 | 1,387,387 |
| Conn’s Receivables Funding LLC(a) |
| Series 2018-A Class A |
| 01/15/2023 | 3.250% | | 543,149 | 544,042 |
| Consumer Lending Receivables Trust(a) |
| Series 2019-A Class A |
| 04/15/2026 | 3.520% | | 2,064,651 | 2,067,595 |
| Consumer Loan Underlying Bond Credit Trust(a) |
| Series 2018-P1 Class A |
| 07/15/2025 | 3.390% | | 2,056,074 | 2,058,145 |
| Series 2018-P2 Class A |
| 10/15/2025 | 3.470% | | 2,705,244 | 2,709,792 |
| Credit Suisse ABS Trust(a) |
| Series 2018-LD1 Class A |
| 07/25/2024 | 3.420% | | 556,502 | 556,474 |
| Drive Auto Receivables Trust |
| Series 2018-4 Class C |
| 11/15/2024 | 3.660% | | 900,000 | 906,355 |
| Asset-Backed Securities — Non-Agency (continued) |
| Issuer | Coupon
Rate | | Principal
Amount ($) | Value ($) |
| Dryden 57 CLO Ltd.(a),(b) |
| Series 2018-57A Class B |
3-month USD LIBOR + 1.350%
Floor 1.350%
05/15/2031 | 4.034% | | 1,250,000 | 1,225,960 |
| DT Auto Owner Trust(a) |
| Subordinated, Series 2018-3A Class C |
| 07/15/2024 | 3.790% | | 2,000,000 | 2,020,871 |
| Subordinated, Series 2018-3A Class D |
| 07/15/2024 | 4.190% | | 1,000,000 | 1,018,771 |
| Madison Park Funding XXVII Ltd.(a),(b) |
| Series 2018-27A Class A2 |
3-month USD LIBOR + 1.350%
04/20/2030 | 3.992% | | 3,700,000 | 3,630,632 |
| Madison Park Funding XXXII Ltd.(a),(b) |
| Series 2018-32A Class C |
3-month USD LIBOR + 2.900%
Floor 2.900%
01/22/2031 | 5.492% | | 1,150,000 | 1,158,614 |
| Marlette Funding Trust(a) |
| Series 2018-1A Class A |
| 03/15/2028 | 2.610% | | 1,002,183 | 1,000,394 |
| Series 2018-1A Class B |
| 03/15/2028 | 3.190% | | 2,100,000 | 2,094,049 |
| Series 2018-2A Class B |
| 07/17/2028 | 3.610% | | 4,000,000 | 4,009,888 |
| Subordinated Series 2017-3A Class B |
| 12/15/2024 | 3.010% | | 2,000,000 | 1,997,663 |
| Subordinated, Series 2017-2A Class B |
| 07/15/2024 | 3.190% | | 1,391,336 | 1,391,607 |
| Octagon Investment Partners 35 Ltd.(a),(b) |
| Series 2018-1A Class A2 |
3-month USD LIBOR + 1.400%
Floor 1.400%
01/20/2031 | 3.992% | | 1,820,000 | 1,786,761 |
| Octagon Investment Partners XV Ltd.(a),(b) |
| Series 2013-1A Class A1AR |
3-month USD LIBOR + 1.210%
07/19/2030 | 3.802% | | 2,500,000 | 2,495,658 |
| Octagon Investment Partners XXII Ltd.(a),(b) |
| Series 2014-1A Class BRR |
3-month USD LIBOR + 1.450%
Floor 1.450%
01/22/2030 | 4.042% | | 4,000,000 | 3,927,808 |
| Ocwen Master Advance Receivables Trust(a),(c) |
| Series 2018-T1 Class AT1 |
| 08/15/2049 | 3.301% | | 900,000 | 900,108 |
The accompanying Notes to Financial Statements are an integral part of this statement.
| 8 | Columbia Bond Fund | Annual Report 2019 |
Portfolio of Investments (continued)
April 30, 2019
| Asset-Backed Securities — Non-Agency (continued) |
| Issuer | Coupon
Rate | | Principal
Amount ($) | Value ($) |
| OneMain Financial Issuance Trust(a) |
| Series 2018-1A Class A |
| 03/14/2029 | 3.300% | | 2,140,000 | 2,152,494 |
| OZLM XXI(a),(b) |
| Series 2017-21A Class A1 |
3-month USD LIBOR + 1.150%
01/20/2031 | 3.742% | | 2,500,000 | 2,496,415 |
| Prosper Marketplace Issuance Trust(a) |
| Series 2018-1A Class A |
| 06/17/2024 | 3.110% | | 984,143 | 984,437 |
| Series 2018-1A Class B |
| 06/17/2024 | 3.900% | | 1,900,000 | 1,907,190 |
| Series 2019-1A Class A |
| 04/15/2025 | 3.540% | | 887,022 | 888,735 |
| RR 3 Ltd.(a),(b) |
| Series 2014-14A Class A1R2 |
3-month USD LIBOR + 1.090%
Floor 1.090%
01/15/2030 | 3.687% | | 4,500,000 | 4,459,414 |
| SoFi Consumer Loan Program LLC(a) |
| Series 2016-5 Class A |
| 09/25/2028 | 3.060% | | 1,312,921 | 1,315,562 |
| SoFi Consumer Loan Program Trust(a) |
| Series 2018-1 Class A1 |
| 02/25/2027 | 2.550% | | 577,140 | 575,445 |
| Series 2018-2 Class A1 |
| 04/26/2027 | 2.930% | | 1,131,667 | 1,131,563 |
| Series 2018-3 Class B |
| 08/25/2027 | 4.020% | | 1,800,000 | 1,838,141 |
| Stewart Park CLO Ltd.(a),(b) |
| Series 2017-1A Class A2R |
3-month USD LIBOR + 1.250%
Floor 1.250%
01/15/2030 | 3.847% | | 3,000,000 | 2,929,593 |
| USAA Auto Owner Trust |
| Series 2017-1 Class A3 |
| 05/17/2021 | 1.700% | | 412,016 | 410,427 |
| Voya Ltd.(a),(b) |
| Series 2012-4A Class A1R |
3-month USD LIBOR + 1.450%
10/15/2028 | 4.047% | | 1,500,000 | 1,501,568 |
Total Asset-Backed Securities — Non-Agency
(Cost $75,843,773) | 75,651,391 |
|
| Commercial Mortgage-Backed Securities - Agency 1.6% |
| | | | |
| Federal Home Loan Mortgage Corp. Multifamily Structured Pass-Through Certificates(d) |
| Series 2017-K070 Class A2 |
| 11/25/2027 | 3.303% | | 1,000,000 | 1,026,459 |
| Commercial Mortgage-Backed Securities - Agency (continued) |
| Issuer | Coupon
Rate | | Principal
Amount ($) | Value ($) |
| Federal National Mortgage Association(d) |
| Series 2017-M15 Class ATS2 |
| 11/25/2027 | 3.196% | | 4,750,000 | 4,768,658 |
Total Commercial Mortgage-Backed Securities - Agency
(Cost $5,826,107) | 5,795,117 |
|
| Commercial Mortgage-Backed Securities - Non-Agency 10.8% |
| | | | |
| American Homes 4 Rent Trust(a) |
| Series 2014-SFR2 Class A |
| 10/17/2036 | 3.786% | | 2,521,943 | 2,588,119 |
| Series 2014-SFR3 Class A |
| 12/17/2036 | 3.678% | | 2,869,683 | 2,924,301 |
| Series 2015-SFR2 Class A |
| 10/17/2045 | 3.732% | | 1,663,099 | 1,702,069 |
| BBCMS Trust(a),(b) |
| Subordinated Series 2018-BXH Class D |
1-month USD LIBOR + 2.000%
Floor 2.000%
10/15/2037 | 4.473% | | 2,000,000 | 1,998,765 |
| BHMS Mortgage Trust(a),(b) |
| Series 2018-ATLS Class A |
1-month USD LIBOR + 1.250%
Floor 1.250%
07/15/2035 | 3.723% | | 3,000,000 | 2,998,083 |
| CHT 2017-COSMO Mortgage Trust(a),(b) |
| Series 2017-CSMO Class C |
1-month USD LIBOR + 1.500%
Floor 1.350%
11/15/2036 | 3.973% | | 1,600,000 | 1,600,046 |
| Hilton USA Trust(a),(d) |
| Subordinated Series 2016-HHV Class C |
| 11/05/2038 | 4.333% | | 1,700,000 | 1,736,362 |
| Independence Plaza Trust(a) |
| Series 2018-INDP Class B |
| 07/10/2035 | 3.911% | | 4,000,000 | 4,095,716 |
| Invitation Homes Trust(a),(b) |
| Series 2018-SFR2 Class A |
1-month USD LIBOR + 0.900%
Floor 0.800%
06/17/2037 | 3.373% | | 2,673,761 | 2,668,457 |
| Series 2018-SFR4 Class A |
1-month USD LIBOR + 1.100%
Floor 1.000%
01/17/2038 | 3.574% | | 1,986,324 | 1,998,060 |
| JPMBB Commercial Mortgage Securities Trust |
| Series 2013-C14 Class A4 |
| 08/15/2046 | 4.133% | | 1,305,000 | 1,369,483 |
| JPMorgan Chase Commercial Mortgage Securities Trust |
| Series 2012-C6 Class A3 |
| 05/15/2045 | 3.507% | | 1,123,562 | 1,146,055 |
The accompanying Notes to Financial Statements are an integral part of this statement.
Columbia Bond Fund | Annual Report 2019
| 9 |
Portfolio of Investments (continued)
April 30, 2019
| Commercial Mortgage-Backed Securities - Non-Agency (continued) |
| Issuer | Coupon
Rate | | Principal
Amount ($) | Value ($) |
| Morgan Stanley Bank of America Merrill Lynch Trust |
| Series 2013-C12 Class A4 |
| 10/15/2046 | 4.259% | | 2,608,000 | 2,758,723 |
| Progress Residential Trust(a) |
| Series 2017-SFR1 Class A |
| 08/17/2034 | 2.768% | | 717,695 | 710,683 |
| Series 2018-SF3 Class A |
| 10/17/2035 | 3.880% | | 1,020,000 | 1,045,448 |
| Series 2018-SFR1 Class A |
| 03/17/2035 | 3.255% | | 1,685,000 | 1,691,257 |
| Series 2018-SFR2 Class A |
| 08/17/2035 | 3.712% | | 1,350,000 | 1,379,539 |
| Series 2019-SFR1 Class E |
| 08/17/2035 | 4.466% | | 1,100,000 | 1,111,719 |
| RETL(a),(b) |
| Subordinated Series 2019-RVP Class C |
1-month USD LIBOR + 2.100%
Floor 2.100%
03/15/2036 | 4.584% | | 1,400,000 | 1,405,245 |
| UBS Commercial Mortgage Trust(a),(b) |
| Series 2018-NYCH Class A |
1-month USD LIBOR + 0.850%
Floor 0.850%
02/15/2032 | 3.323% | | 2,000,000 | 1,998,232 |
| Series 2018-NYCH Class B |
1-month USD LIBOR + 1.250%
Floor 1.250%
02/15/2032 | 3.723% | | 900,000 | 899,998 |
| Wells Fargo Commercial Mortgage Trust(a),(b) |
| Subordinated Series 2017-SMP Class C |
1-month USD LIBOR + 1.200%
Floor 1.200%
12/15/2034 | 3.673% | | 800,000 | 799,647 |
Total Commercial Mortgage-Backed Securities - Non-Agency
(Cost $40,412,061) | 40,626,007 |
| Common Stocks 0.0% |
| Issuer | Shares | Value ($) |
| Consumer Staples 0.0% |
| Beverages 0.0% |
| Crimson Wine Group Ltd.(e) | 3 | 22 |
| Total Consumer Staples | 22 |
| Common Stocks (continued) |
| Issuer | Shares | Value ($) |
| Financials 0.0% |
| Diversified Financial Services 0.0% |
| Jefferies Financial Group, Inc. | 39 | 802 |
| Total Financials | 802 |
Total Common Stocks
(Cost $—) | 824 |
| Corporate Bonds & Notes 21.2% |
| Issuer | Coupon
Rate | | Principal
Amount ($) | Value ($) |
| Aerospace & Defense 0.6% |
| Northrop Grumman Corp. |
| 01/15/2025 | 2.930% | | 1,090,000 | 1,078,716 |
| 01/15/2028 | 3.250% | | 1,015,000 | 997,658 |
| Total | 2,076,374 |
| Automotive 0.3% |
| Ford Motor Co. |
| 01/15/2043 | 4.750% | | 175,000 | 148,659 |
| Ford Motor Credit Co. LLC |
| 11/02/2020 | 2.343% | | 860,000 | 847,099 |
| Total | 995,758 |
| Banking 2.9% |
| Bank of America Corp.(f) |
| 01/20/2028 | 3.824% | | 2,690,000 | 2,737,492 |
| Capital One Financial Corp. |
| 05/12/2020 | 2.500% | | 1,150,000 | 1,146,198 |
| JPMorgan Chase & Co.(f) |
| 02/01/2028 | 3.782% | | 3,265,000 | 3,320,077 |
| Morgan Stanley(f) |
| 01/23/2030 | 4.431% | | 625,000 | 661,566 |
| Wells Fargo & Co. |
| 01/30/2020 | 2.150% | | 855,000 | 851,565 |
| 10/23/2026 | 3.000% | | 2,320,000 | 2,257,499 |
| Total | 10,974,397 |
| Cable and Satellite 0.3% |
| Charter Communications Operating LLC/Capital |
| 05/01/2047 | 5.375% | | 500,000 | 500,525 |
| Comcast Corp. |
| 08/15/2047 | 4.000% | | 720,000 | 704,070 |
| Total | 1,204,595 |
| Chemicals 0.1% |
| LYB International Finance BV |
| 07/15/2043 | 5.250% | | 270,000 | 281,169 |
The accompanying Notes to Financial Statements are an integral part of this statement.
| 10 | Columbia Bond Fund | Annual Report 2019 |
Portfolio of Investments (continued)
April 30, 2019
| Corporate Bonds & Notes (continued) |
| Issuer | Coupon
Rate | | Principal
Amount ($) | Value ($) |
| Electric 2.5% |
| CMS Energy Corp. |
| 03/01/2024 | 3.875% | | 660,000 | 676,675 |
| 11/15/2025 | 3.600% | | 50,000 | 50,476 |
| 02/15/2027 | 2.950% | | 15,000 | 14,353 |
| DTE Energy Co. |
| 10/01/2026 | 2.850% | | 2,915,000 | 2,787,853 |
| Duke Energy Corp. |
| 08/15/2027 | 3.150% | | 585,000 | 576,427 |
| Duke Energy Progress LLC |
| 08/15/2045 | 4.200% | | 68,000 | 70,914 |
| 09/15/2047 | 3.600% | | 260,000 | 246,555 |
| Emera U.S. Finance LP |
| 06/15/2046 | 4.750% | | 1,720,000 | 1,758,824 |
| Indiana Michigan Power Co. |
| 07/01/2047 | 3.750% | | 206,000 | 194,557 |
| Southern Co. (The) |
| 07/01/2026 | 3.250% | | 612,000 | 603,532 |
| 07/01/2036 | 4.250% | | 350,000 | 348,097 |
| 07/01/2046 | 4.400% | | 1,184,000 | 1,190,777 |
| WEC Energy Group, Inc. |
| 06/15/2025 | 3.550% | | 150,000 | 153,266 |
| Xcel Energy, Inc. |
| 06/01/2025 | 3.300% | | 665,000 | 669,631 |
| Total | 9,341,937 |
| Finance Companies 1.3% |
| GE Capital International Funding Co. Unlimited Co. |
| 11/15/2020 | 2.342% | | 2,885,000 | 2,854,165 |
| 11/15/2035 | 4.418% | | 2,095,000 | 1,954,273 |
| Total | 4,808,438 |
| Food and Beverage 2.3% |
| Anheuser-Busch InBev Worldwide, Inc.(a) |
| 02/01/2046 | 4.900% | | 2,212,000 | 2,240,285 |
| Anheuser-Busch InBev Worldwide, Inc. |
| 01/23/2059 | 5.800% | | 370,000 | 421,083 |
| Bacardi Ltd.(a) |
| 05/15/2048 | 5.300% | | 2,050,000 | 1,982,444 |
| Conagra Brands, Inc. |
| 11/01/2048 | 5.400% | | 680,000 | 707,905 |
| Kraft Heinz Foods Co. (The) |
| 06/01/2046 | 4.375% | | 2,708,000 | 2,401,555 |
| Molson Coors Brewing Co. |
| 07/15/2046 | 4.200% | | 477,000 | 427,571 |
| Corporate Bonds & Notes (continued) |
| Issuer | Coupon
Rate | | Principal
Amount ($) | Value ($) |
| Tyson Foods, Inc.(b) |
3-month USD LIBOR + 0.450%
Floor 0.450%
08/21/2020 | 3.091% | | 460,000 | 459,613 |
| Total | 8,640,456 |
| Health Care 2.0% |
| Becton Dickinson and Co.(b) |
3-month USD LIBOR + 1.030%
06/06/2022 | 3.638% | | 963,000 | 969,101 |
| Becton Dickinson and Co. |
| 06/06/2027 | 3.700% | | 1,430,000 | 1,423,824 |
| 05/15/2044 | 4.875% | | 575,000 | 575,426 |
| Cardinal Health, Inc. |
| 09/15/2045 | 4.900% | | 200,000 | 189,004 |
| 06/15/2047 | 4.368% | | 1,045,000 | 915,720 |
| CVS Health Corp. |
| 03/25/2048 | 5.050% | | 1,945,000 | 1,921,625 |
| Halfmoon Parent, Inc.(a) |
| 12/15/2048 | 4.900% | | 1,305,000 | 1,317,134 |
| New York and Presbyterian Hospital (The) |
| 08/01/2036 | 3.563% | | 245,000 | 234,061 |
| Total | 7,545,895 |
| Healthcare Insurance 0.1% |
| UnitedHealth Group, Inc. |
| 10/15/2047 | 3.750% | | 590,000 | 561,371 |
| Independent Energy 0.3% |
| Canadian Natural Resources Ltd. |
| 06/30/2033 | 6.450% | | 110,000 | 132,085 |
| Hess Corp. |
| 02/15/2041 | 5.600% | | 180,000 | 188,658 |
| Noble Energy, Inc. |
| 04/01/2027 | 8.000% | | 809,000 | 961,770 |
| Total | 1,282,513 |
| Life Insurance 0.7% |
| Brighthouse Financial, Inc. |
| 06/22/2047 | 4.700% | | 5,000 | 4,095 |
| Massachusetts Mutual Life Insurance Co.(a) |
| Subordinated |
| 04/15/2065 | 4.500% | | 300,000 | 299,531 |
| Teachers Insurance & Annuity Association of America(a) |
| Subordinated |
| 09/15/2044 | 4.900% | | 110,000 | 123,394 |
| 05/15/2047 | 4.270% | | 745,000 | 768,719 |
The accompanying Notes to Financial Statements are an integral part of this statement.
Columbia Bond Fund | Annual Report 2019
| 11 |
Portfolio of Investments (continued)
April 30, 2019
| Corporate Bonds & Notes (continued) |
| Issuer | Coupon
Rate | | Principal
Amount ($) | Value ($) |
| Voya Financial, Inc. |
| 06/15/2026 | 3.650% | | 650,000 | 647,742 |
| 06/15/2046 | 4.800% | | 784,000 | 815,006 |
| Total | 2,658,487 |
| Media and Entertainment 0.0% |
| Discovery Communications LLC |
| 09/20/2047 | 5.200% | | 132,000 | 131,134 |
| Midstream 1.4% |
| Kinder Morgan, Inc. |
| 02/15/2046 | 5.050% | | 1,535,000 | 1,574,806 |
| Plains All American Pipeline LP/Finance Corp. |
| 06/15/2044 | 4.700% | | 1,695,000 | 1,596,254 |
| Southern Natural Gas Co. LLC |
| 03/01/2032 | 8.000% | | 195,000 | 261,193 |
| Western Gas Partners LP |
| 08/15/2048 | 5.500% | | 280,000 | 292,996 |
| Williams Companies, Inc. (The) |
| 09/15/2045 | 5.100% | | 1,470,000 | 1,506,723 |
| Total | 5,231,972 |
| Natural Gas 0.7% |
| NiSource, Inc. |
| 02/15/2023 | 3.850% | | 685,000 | 699,027 |
| 02/15/2043 | 5.250% | | 55,000 | 61,189 |
| 02/15/2044 | 4.800% | | 50,000 | 52,839 |
| 05/15/2047 | 4.375% | | 991,000 | 1,012,606 |
| Sempra Energy |
| 11/15/2025 | 3.750% | | 565,000 | 567,319 |
| 06/15/2027 | 3.250% | | 92,000 | 88,797 |
| Total | 2,481,777 |
| Other Industry 0.2% |
| Massachusetts Institute of Technology |
| 07/01/2116 | 3.885% | | 300,000 | 285,725 |
| President and Fellows of Harvard College |
| 10/01/2037 | 3.619% | | 315,000 | 318,955 |
| Total | 604,680 |
| Pharmaceuticals 1.7% |
| AbbVie, Inc. |
| 05/14/2025 | 3.600% | | 185,000 | 185,858 |
| 11/14/2048 | 4.875% | | 950,000 | 938,600 |
| Allergan Funding SCS |
| 06/15/2044 | 4.850% | | 655,000 | 644,799 |
| Amgen, Inc. |
| 05/22/2019 | 2.200% | | 2,911,000 | 2,909,992 |
| 05/01/2045 | 4.400% | | 325,000 | 319,773 |
| 06/15/2048 | 4.563% | | 277,000 | 277,720 |
| Corporate Bonds & Notes (continued) |
| Issuer | Coupon
Rate | | Principal
Amount ($) | Value ($) |
| Celgene Corp. |
| 02/20/2048 | 4.550% | | 160,000 | 162,989 |
| Gilead Sciences, Inc. |
| 09/20/2019 | 1.850% | | 445,000 | 443,522 |
| Johnson & Johnson |
| 12/05/2033 | 4.375% | | 427,000 | 475,226 |
| Total | 6,358,479 |
| Railroads 0.5% |
| Canadian National Railway Co. |
| 02/03/2020 | 2.400% | | 955,000 | 952,290 |
| CSX Corp. |
| 05/30/2042 | 4.750% | | 168,000 | 181,062 |
| 11/01/2066 | 4.250% | | 638,000 | 590,757 |
| Total | 1,724,109 |
| Retailers 0.1% |
| Lowe’s Companies, Inc. |
| 04/05/2049 | 4.550% | | 356,000 | 361,537 |
| Supermarkets 0.4% |
| Kroger Co. (The) |
| 04/15/2042 | 5.000% | | 172,000 | 169,493 |
| 02/01/2047 | 4.450% | | 200,000 | 183,824 |
| 01/15/2048 | 4.650% | | 1,358,000 | 1,286,167 |
| Total | 1,639,484 |
| Technology 0.7% |
| Broadcom Corp./Cayman Finance Ltd. |
| 01/15/2027 | 3.875% | | 1,330,000 | 1,269,430 |
| Cisco Systems, Inc.(b) |
3-month USD LIBOR + 0.340%
09/20/2019 | 2.973% | | 1,430,000 | 1,431,848 |
| Total | 2,701,278 |
| Tobacco 0.3% |
| BAT Capital Corp. |
| 08/14/2020 | 2.297% | | 1,150,000 | 1,140,877 |
| Transportation Services 0.6% |
| ERAC U.S.A. Finance LLC(a) |
| 12/01/2026 | 3.300% | | 480,000 | 468,466 |
| 11/01/2046 | 4.200% | | 330,000 | 315,285 |
| FedEx Corp. |
| 04/01/2046 | 4.550% | | 1,550,000 | 1,494,157 |
| Total | 2,277,908 |
| Wireless 0.1% |
| America Movil SAB de CV |
| 03/30/2020 | 5.000% | | 440,000 | 448,642 |
The accompanying Notes to Financial Statements are an integral part of this statement.
| 12 | Columbia Bond Fund | Annual Report 2019 |
Portfolio of Investments (continued)
April 30, 2019
| Corporate Bonds & Notes (continued) |
| Issuer | Coupon
Rate | | Principal
Amount ($) | Value ($) |
| Wirelines 1.1% |
| AT&T, Inc. |
| 03/01/2029 | 4.350% | | 1,929,000 | 1,994,007 |
| 03/01/2037 | 5.250% | | 940,000 | 1,008,668 |
| Verizon Communications, Inc. |
| 08/10/2033 | 4.500% | | 1,000,000 | 1,072,755 |
| Total | 4,075,430 |
Total Corporate Bonds & Notes
(Cost $79,142,622) | 79,548,697 |
|
| Foreign Government Obligations(g) 0.5% |
| | | | |
| Mexico 0.4% |
| Mexico Government International Bond |
| 03/08/2044 | 4.750% | | 250,000 | 246,388 |
| Petroleos Mexicanos |
| 09/21/2023 | 4.625% | | 639,000 | 635,337 |
| 06/15/2035 | 6.625% | | 435,000 | 420,415 |
| Total | 1,302,140 |
| Peru 0.1% |
| Peruvian Government International Bond |
| 03/14/2037 | 6.550% | | 385,000 | 515,490 |
Total Foreign Government Obligations
(Cost $1,847,721) | 1,817,630 |
|
| Municipal Bonds 0.3% |
| Issue Description | Coupon
Rate | | Principal
Amount ($) | Value ($) |
| Local General Obligation 0.0% |
| City of Chicago |
| Unlimited Tax General Obligation Bonds |
| Series 2015B |
| 01/01/2033 | 7.375% | | 100,000 | 110,031 |
| Water & Sewer 0.3% |
| City of Chicago Waterworks |
| Revenue Bonds |
| Build America Bonds |
| Series 2010 |
| 11/01/2040 | 6.742% | | 865,000 | 1,143,591 |
Total Municipal Bonds
(Cost $964,373) | 1,253,622 |
|
| Residential Mortgage-Backed Securities - Agency 33.6% |
| Issuer | Coupon
Rate | | Principal
Amount ($) | Value ($) |
| Federal Home Loan Mortgage Corp. |
03/01/2021-
05/01/2041 | 5.000% | | 355,412 | 378,579 |
09/01/2025-
10/01/2029 | 7.500% | | 21,414 | 23,545 |
11/01/2025-
12/01/2035 | 7.000% | | 213,790 | 247,952 |
| 06/01/2026 | 8.000% | | 250 | 272 |
| 06/01/2043 | 4.000% | | 3,698,598 | 3,854,112 |
01/01/2046-
08/01/2046 | 3.500% | | 3,494,979 | 3,554,703 |
| Federal Home Loan Mortgage Corp.(h) |
| 05/13/2049 | 4.000% | | 7,500,000 | 7,702,132 |
| Federal National Mortgage Association |
08/01/2029-
09/01/2045 | 3.000% | | 8,733,206 | 8,730,899 |
| 10/01/2029 | 7.500% | | 9,269 | 10,788 |
12/01/2029-
02/01/2030 | 8.000% | | 62,467 | 69,939 |
| 07/01/2038 | 6.000% | | 1,320,575 | 1,477,643 |
| 01/01/2040 | 5.500% | | 1,949,528 | 2,099,145 |
| 09/01/2040 | 5.000% | | 1,442,483 | 1,551,535 |
05/01/2043-
11/01/2046 | 3.500% | | 16,803,996 | 17,050,545 |
11/01/2045-
02/01/2048 | 4.000% | | 4,737,191 | 4,901,349 |
| Federal National Mortgage Association(h) |
| 05/16/2034 | 2.500% | | 4,100,000 | 4,056,914 |
05/16/2034-
06/13/2049 | 3.000% | | 7,478,000 | 7,426,893 |
| 05/16/2034 | 3.500% | | 4,000,000 | 4,084,545 |
| 05/13/2049 | 4.000% | | 13,500,000 | 13,853,848 |
| 05/13/2049 | 4.500% | | 4,800,000 | 4,994,531 |
| 05/13/2049 | 5.000% | | 7,000,000 | 7,377,754 |
| Federal National Mortgage Association(i) |
| 08/01/2040 | 4.500% | | 3,514,611 | 3,724,761 |
| Federal National Mortgage Association(b),(j) |
| CMO Series 2016-53 Class KS |
-1.0 x 1-month USD LIBOR + 6.000%
Cap 6.000%
08/25/2046 | 3.523% | | 1,553,237 | 305,336 |
| CMO Series 2016-57 Class SA |
-1.0 x 1-month USD LIBOR + 6.000%
Cap 6.000%
08/25/2046 | 3.523% | | 4,206,735 | 776,744 |
| CMO Series 2017-109 Class SA |
-1.0 x 1-month USD LIBOR + 6.150%
Cap 6.150%
01/25/2048 | 3.673% | | 1,741,395 | 362,509 |
| CMO Series 2017-20 Class SA |
-1.0 x 1-month USD LIBOR + 6.100%
Cap 6.100%
04/25/2047 | 3.623% | | 1,891,862 | 341,269 |
The accompanying Notes to Financial Statements are an integral part of this statement.
Columbia Bond Fund | Annual Report 2019
| 13 |
Portfolio of Investments (continued)
April 30, 2019
| Residential Mortgage-Backed Securities - Agency (continued) |
| Issuer | Coupon
Rate | | Principal
Amount ($) | Value ($) |
| CMO Series 2018-66 Class SM |
-1.0 x 1-month USD LIBOR + 6.200%
Cap 6.200%
09/25/2048 | 3.723% | | 2,361,458 | 474,897 |
| CMO Series 2018-74 Class SA |
-1.0 x 1-month USD LIBOR + 6.150%
Cap 6.150%
10/25/2048 | 3.673% | | 3,020,915 | 592,933 |
| Government National Mortgage Association(b) |
07/20/2021-
07/20/2022 | 3.750% | | 10,634 | 10,682 |
04/20/2022-
04/20/2028 | 3.625% | | 26,512 | 26,804 |
| Government National Mortgage Association |
11/15/2022-
08/15/2029 | 7.000% | | 64,813 | 68,673 |
05/15/2023-
12/15/2031 | 6.500% | | 65,483 | 71,362 |
06/15/2025-
01/15/2030 | 8.000% | | 108,971 | 120,337 |
04/15/2026-
03/15/2030 | 7.500% | | 88,631 | 89,951 |
| 03/20/2028 | 6.000% | | 27,864 | 30,686 |
| 06/15/2030 | 9.000% | | 13,168 | 13,803 |
| Government National Mortgage Association(h) |
| 05/21/2049 | 3.500% | | 11,740,000 | 11,933,527 |
| 05/21/2049 | 4.500% | | 4,000,000 | 4,147,422 |
| Government National Mortgage Association(b),(j) |
| CMO Series 2017-112 Class KS |
-1.0 x 1-month USD LIBOR + 6.200%
Cap 6.200%
07/20/2047 | 3.719% | | 1,901,665 | 322,690 |
| CMO Series 2017-112 Class SJ |
-1.0 x 1-month USD LIBOR + 5.660%
Cap 5.660%
07/20/2047 | 3.179% | | 8,530,404 | 1,285,370 |
| CMO Series 2017-130 Class HS |
-1.0 x 1-month USD LIBOR + 6.200%
Cap 6.200%
08/20/2047 | 3.719% | | 1,844,578 | 356,299 |
| CMO Series 2017-149 Class BS |
-1.0 x 1-month USD LIBOR + 6.200%
Cap 6.200%
10/20/2047 | 3.719% | | 2,735,564 | 538,921 |
| CMO Series 2017-163 Class SA |
-1.0 x 1-month USD LIBOR + 6.200%
Cap 6.200%
11/20/2047 | 3.719% | | 1,622,513 | 284,045 |
| CMO Series 2017-37 Class SB |
-1.0 x 1-month USD LIBOR + 6.150%
Cap 6.150%
03/20/2047 | 3.669% | | 1,856,639 | 298,355 |
| Residential Mortgage-Backed Securities - Agency (continued) |
| Issuer | Coupon
Rate | | Principal
Amount ($) | Value ($) |
| CMO Series 2018-103 Class SA |
-1.0 x 1-month USD LIBOR + 6.200%
Cap 6.200%
08/20/2048 | 3.719% | | 2,189,548 | 389,778 |
| CMO Series 2018-112 Class LS |
-1.0 x 1-month USD LIBOR + 6.200%
Cap 6.200%
08/20/2048 | 3.719% | | 2,160,217 | 427,015 |
| CMO Series 2018-121 Class SA |
-1.0 x 1-month USD LIBOR + 6.200%
Cap 6.200%
09/20/2048 | 3.719% | | 1,619,391 | 290,859 |
| CMO Series 2018-125 Class SK |
-1.0 x 1-month USD LIBOR + 6.250%
Cap 6.250%
09/20/2048 | 3.769% | | 2,446,085 | 431,784 |
| CMO Series 2018-134 Class KS |
-1.0 x 1-month USD LIBOR + 6.200%
Cap 6.200%
10/20/2048 | 3.719% | | 2,123,871 | 367,114 |
| CMO Series 2018-134 Class SK |
-1.0 x 1-month USD LIBOR + 6.200%
Cap 6.200%
10/20/2048 | 3.719% | | 1,815,086 | 262,494 |
| CMO Series 2018-148 Class SB |
-1.0 x 1-month USD LIBOR + 6.200%
Cap 6.200%
01/20/2048 | 3.719% | | 4,702,759 | 827,624 |
| CMO Series 2018-151 Class SA |
-1.0 x 1-month USD LIBOR + 6.150%
Cap 6.150%
11/20/2048 | 3.669% | | 4,090,023 | 734,301 |
| CMO Series 2018-155 Class SL |
-1.0 x 1-month USD LIBOR + 6.150%
Cap 6.150%
11/20/2048 | 3.669% | | 2,478,621 | 362,867 |
| CMO Series 2018-89 Class MS |
-1.0 x 1-month USD LIBOR + 6.200%
Cap 6.200%
06/20/2048 | 3.719% | | 2,114,606 | 401,096 |
| CMO Series 2018-91 Class DS |
-1.0 x 1-month USD LIBOR + 6.200%
Cap 6.200%
07/20/2048 | 3.719% | | 2,842,623 | 444,375 |
| CMO Series 2019-20 Class JS |
-1.0 x 1-month USD LIBOR + 6.000%
Cap 6.000%
02/20/2049 | 3.519% | | 3,256,016 | 626,787 |
The accompanying Notes to Financial Statements are an integral part of this statement.
| 14 | Columbia Bond Fund | Annual Report 2019 |
Portfolio of Investments (continued)
April 30, 2019
| Residential Mortgage-Backed Securities - Agency (continued) |
| Issuer | Coupon
Rate | | Principal
Amount ($) | Value ($) |
| CMO Series 2019-4 Class SJ |
-1.0 x 1-month USD LIBOR + 6.050%
Cap 6.050%
01/20/2049 | 3.569% | | 4,265,647 | 720,824 |
| CMO Series 2019-5 Class SH |
-1.0 x 1-month USD LIBOR + 6.150%
Cap 6.150%
01/20/2049 | 3.669% | | 2,547,869 | 461,146 |
Total Residential Mortgage-Backed Securities - Agency
(Cost $125,648,046) | 126,373,063 |
|
| Residential Mortgage-Backed Securities - Non-Agency 23.9% |
| | | | |
| Ajax Mortgage Loan Trust(a) |
| Series 2017-B Class A |
| 09/25/2056 | 3.163% | | 1,662,589 | 1,643,446 |
| American Mortgage Trust(c),(d),(k) |
| CMO Series 2093-3 Class 3A |
| 07/27/2023 | 8.188% | | 1,857 | 1,126 |
| Angel Oak Mortgage Trust I LLC(a),(d) |
| CMO Series 2018-1 Class A1 |
| 04/27/2048 | 3.258% | | 2,432,773 | 2,437,633 |
| CMO Series 2019-1 Class A1 |
| 11/25/2048 | 3.920% | | 2,526,337 | 2,553,392 |
| Angel Oak Mortgage Trust I LLC(a),(c),(d) |
| CMO Series 2018-3 Class M1 |
| 09/25/2048 | 4.421% | | 960,000 | 985,152 |
| Angel Oak Mortgage Trust LLC(a),(d) |
| CMO Series 2017-3 Class A2 |
| 11/25/2047 | 2.883% | | 2,052,384 | 2,045,468 |
| Arroyo Mortgage Trust(a) |
| CMO Series 2018-1 Class A2 |
| 04/25/2048 | 4.016% | | 494,062 | 504,795 |
| Bayview Opportunity Master Fund IVa Trust(a) |
| CMO Series 2016-SPL1 Class A |
| 04/28/2055 | 4.000% | | 1,906,906 | 1,932,628 |
| CMO Series 2018-RN6 Class A1 |
| 07/25/2033 | 4.090% | | 1,026,509 | 1,030,079 |
| Bayview Opportunity Master Fund IVb Trust(a) |
| CMO Series 2017-SPL3 Class A |
| 11/28/2053 | 4.000% | | 3,065,512 | 3,120,696 |
| Bayview Opportunity Master Fund Trust IVb(a) |
| CMO Series 2019-RN1 Class A1 |
| 02/28/2034 | 4.090% | | 1,329,953 | 1,340,496 |
| Bellemeade Re Ltd.(a),(b) |
| CMO Series 2018-2A Class M1A |
1-month USD LIBOR + 0.950%
08/25/2028 | 3.427% | | 2,429,619 | 2,428,676 |
| Residential Mortgage-Backed Securities - Non-Agency (continued) |
| Issuer | Coupon
Rate | | Principal
Amount ($) | Value ($) |
| CMO Series 2019-1A Class M1A |
1-month USD LIBOR + 1.300%
Floor 1.300%
03/25/2029 | 3.784% | | 2,995,000 | 2,996,782 |
| CIM Trust(a),(d) |
| CMO Series 2018-R4 Class A1 |
| 12/26/2057 | 4.070% | | 1,761,711 | 1,769,630 |
| CIM Trust(a),(b) |
| CMO Series 2018-R6 Class A1 |
1-month USD LIBOR + 1.076%
Floor 1.080%
09/25/2058 | 3.562% | | 2,042,321 | 2,029,346 |
| Citigroup Mortgage Loan Trust, Inc.(a),(d) |
| CMO Series 2015-A Class A4 |
| 06/25/2058 | 4.250% | | 251,012 | 257,258 |
| CMO Series 2018-RP2 Class A1 |
| 02/25/2058 | 3.500% | | 861,833 | 848,975 |
| COLT 2019-1 Mortgage Loan Trust(a),(d) |
| CMO Series 2019-1 Class A3 |
| 03/25/2049 | 4.012% | | 956,883 | 963,399 |
| COLT Mortgage Loan Trust(a),(d) |
| CMO Series 2017-1 Class A1 |
| 05/27/2047 | 2.614% | | 571,888 | 560,637 |
| CMO Series 2017-2 Class A3A |
| 10/25/2047 | 2.773% | | 554,506 | 552,676 |
| COLT Mortgage Loan Trust(a) |
| CMO Series 2018-1 Class A1 |
| 02/25/2048 | 2.930% | | 1,388,011 | 1,384,768 |
| CMO Series 2018-3 Class A1 |
| 10/26/2048 | 3.692% | | 817,802 | 826,509 |
| Deephaven Residential Mortgage Trust(a) |
| CMO Series 2018-1A Class A3 |
| 12/25/2057 | 3.202% | | 2,016,777 | 2,006,579 |
| Deephaven Residential Mortgage Trust(a),(d) |
| CMO Series 2019-1A Class A3 |
| 01/25/2059 | 3.948% | | 1,448,130 | 1,455,740 |
| Eagle RE Ltd.(a),(b) |
| CMO Series 2019-1 Class M1A |
1-month USD LIBOR + 1.250%
04/25/2029 | 3.734% | | 2,500,000 | 2,501,714 |
| Grand Avenue Mortgage Loan Trust(a) |
| CMO Series 2017-RPL1 Class A1 |
| 08/25/2064 | 3.250% | | 3,729,034 | 3,654,349 |
| Homeward Opportunities Fund I Trust(a),(d) |
| CMO Series 2019-1 Class A1 |
| 01/25/2059 | 3.454% | | 1,682,792 | 1,689,256 |
| Legacy Mortgage Asset Trust(a) |
| CMO Series 2019-GS1 Class A1 |
| 01/25/2059 | 4.000% | | 1,065,524 | 1,065,413 |
The accompanying Notes to Financial Statements are an integral part of this statement.
Columbia Bond Fund | Annual Report 2019
| 15 |
Portfolio of Investments (continued)
April 30, 2019
| Residential Mortgage-Backed Securities - Non-Agency (continued) |
| Issuer | Coupon
Rate | | Principal
Amount ($) | Value ($) |
| MFA Trust(a),(d) |
| CMO Series 2017-RPL1 Class A1 |
| 02/25/2057 | 2.588% | | 583,664 | 575,018 |
| Mill City Mortgage Loan Trust(a) |
| CMO Series 2016-1 Class A1 |
| 04/25/2057 | 2.500% | | 573,043 | 565,664 |
| New Residential Mortgage LLC(a) |
| CMO Series 2018-FNT2 Class A |
| 07/25/2054 | 3.790% | | 1,610,847 | 1,623,926 |
| CMO Series 2018-FNT2 Class E |
| 07/25/2054 | 5.120% | | 724,881 | 727,913 |
| Subordinated, CMO Series 2018-FNT1 Class D |
| 05/25/2023 | 4.690% | | 1,539,974 | 1,541,692 |
| New Residential Mortgage Loan Trust(a) |
| CMO Series 2018-RPL1 Class A1 |
| 12/25/2057 | 3.500% | | 903,328 | 907,263 |
| New Residential Mortgage Loan Trust(a),(d) |
| CMO Series 2019-RPL1 Class A1 |
| 02/26/2024 | 4.335% | | 1,877,737 | 1,887,534 |
| NRZ Excess Spread-Collateralized Notes(a) |
| Series 2018-PLS1 Class A |
| 01/25/2023 | 3.193% | | 716,553 | 713,735 |
| Oaktown Re II Ltd.(a),(b) |
| CMO Series 2018-1A Class M1 |
1-month USD LIBOR + 1.550%
07/25/2028 | 4.027% | | 2,000,000 | 1,986,546 |
| Preston Ridge Partners Mortgage LLC(a),(d) |
| CMO Series 2018-1A Class A1 |
| 04/25/2023 | 3.750% | | 1,655,982 | 1,655,902 |
| CMO Series 2019-1A Class A1 |
| 01/25/2024 | 4.500% | | 1,457,489 | 1,463,746 |
| Preston Ridge Partners Mortgage LLC(a) |
| CMO Series 2018-2A Class A1 |
| 08/25/2023 | 4.000% | | 886,059 | 885,883 |
| Radnor Re Ltd.(a),(b) |
| CMO Series 2019-1 Class M1A |
1-month USD LIBOR + 1.250%
Floor 1.250%
02/25/2029 | 3.727% | | 4,000,000 | 3,997,482 |
| RCO V Mortgage LLC(a),(d) |
| CMO Series 2018-2 Class A1 |
| 10/25/2023 | 4.458% | | 1,788,851 | 1,785,992 |
| Residential Mortgage Loan Trust(a),(d) |
| CMO Series 2019-1 Class A3 |
| 10/25/2058 | 4.242% | | 1,023,177 | 1,028,749 |
| Starwood Mortgage Residential Trust(a),(d) |
| CMO Series 2018-IMC1 Class A3 |
| 03/25/2048 | 3.977% | | 1,960,530 | 1,984,577 |
| Residential Mortgage-Backed Securities - Non-Agency (continued) |
| Issuer | Coupon
Rate | | Principal
Amount ($) | Value ($) |
| CMO Series 2019-IMC1 Class A2 |
| 04/25/2049 | 3.651% | | 789,941 | 792,970 |
| Towd Point Mortgage Trust(a) |
| CMO Series 2016-2 Class A1 |
| 08/25/2055 | 3.000% | | 947,216 | 942,641 |
| Vendee Mortgage Trust(d),(j) |
| CMO Series 1998-1 Class 2IO |
| 03/15/2028 | 0.226% | | 1,276,904 | 7,000 |
| CMO Series 1998-3 Class IO |
| 03/15/2029 | 0.053% | | 1,650,470 | 1,524 |
| Vericrest Opportunity Loan Transferee LXX LLC(a),(d) |
| CMO Series 2018-NPL6 Class A1A |
| 09/25/2048 | 4.115% | | 1,481,509 | 1,485,205 |
| Vericrest Opportunity Loan Transferee LXXI LLC(a) |
| CMO Series 2018-NPL7 Class A1A |
| 09/25/2048 | 3.967% | | 1,001,395 | 1,004,341 |
| Vericrest Opportunity Loan Transferee LXXII LLC(a) |
| CMO Series 2018-NPL8 Class A1A |
| 10/26/2048 | 4.213% | | 6,265,094 | 6,308,020 |
| Vericrest Opportunity Loan Transferee LXXIII LLC(a),(d) |
| CMO Series 2018-NPL9 Class A1A |
| 10/25/2048 | 4.458% | | 920,054 | 926,573 |
| Vericrest Opportunity Loan Transferee LXXV LLC(a) |
| CMO Series 2019-NPL1 Class A1A |
| 01/25/2049 | 4.336% | | 936,283 | 941,234 |
| Verus Securitization Trust(a),(d) |
| CMO Series 2017-2A Class A1 |
| 07/25/2047 | 2.485% | | 335,089 | 332,241 |
| CMO Series 2018-2 Class A3 |
| 06/01/2058 | 3.830% | | 2,292,517 | 2,315,206 |
| CMO Series 2018-INV1 Class A1 |
| 03/25/2058 | 3.633% | | 2,113,244 | 2,139,201 |
| Verus Securitization Trust(a) |
| CMO Series 2018-1 Class A1 |
| 02/25/2048 | 2.929% | | 2,357,790 | 2,349,693 |
| CMO Series 2018-1 Class A2 |
| 02/25/2048 | 3.031% | | 2,193,293 | 2,185,735 |
Total Residential Mortgage-Backed Securities - Non-Agency
(Cost $89,513,040) | 89,649,824 |
|
| U.S. Treasury Obligations 0.7% |
| | | | |
| U.S. Treasury |
| 08/15/2048 | 3.000% | | 530,000 | 536,326 |
| U.S. Treasury(l) |
| STRIPS |
| 02/15/2040 | 0.000% | | 3,461,000 | 1,932,212 |
Total U.S. Treasury Obligations
(Cost $1,827,824) | 2,468,538 |
The accompanying Notes to Financial Statements are an integral part of this statement.
| 16 | Columbia Bond Fund | Annual Report 2019 |
Portfolio of Investments (continued)
April 30, 2019
| Options Purchased Calls 0.0% |
| | | | | Value ($) |
| (Cost $52,500) | 71,343 |
| Money Market Funds 4.2% |
| | Shares | Value ($) |
| Columbia Short-Term Cash Fund, 2.519%(m),(n) | 15,901,930 | 15,900,340 |
Total Money Market Funds
(Cost $15,900,340) | 15,900,340 |
Total Investments in Securities
(Cost: $436,978,407) | 439,156,396 |
| Other Assets & Liabilities, Net | | (63,453,299) |
| Net Assets | 375,703,097 |
At April 30, 2019, securities and/or cash totaling $1,461,831 were pledged as collateral.
Investments in derivatives
| Long futures contracts |
| Description | Number of
contracts | Expiration
date | Trading
currency | Notional
amount | Value/Unrealized
appreciation ($) | Value/Unrealized
depreciation ($) |
| U.S. Treasury 10-Year Note | 377 | 06/2019 | USD | 46,624,297 | 493,017 | — |
| U.S. Treasury 2-Year Note | 263 | 06/2019 | USD | 56,021,055 | 26,289 | — |
| U.S. Treasury 5-Year Note | 378 | 06/2019 | USD | 43,712,156 | 362,459 | — |
| U.S. Ultra Treasury Bond | 90 | 06/2019 | USD | 14,785,313 | 143,999 | — |
| Total | | | | | 1,025,764 | — |
| Short futures contracts |
| Description | Number of
contracts | Expiration
date | Trading
currency | Notional
amount | Value/Unrealized
appreciation ($) | Value/Unrealized
depreciation ($) |
| Euro-Bund | (113) | 06/2019 | EUR | (18,680,030) | — | (293,680) |
| U.S. Long Bond | (93) | 06/2019 | USD | (13,714,594) | — | (150,673) |
| Total | | | | | — | (444,353) |
| Call option contracts purchased |
| Description | Counterparty | Trading
currency | Notional
amount | Number of
contracts | Exercise
price/Rate | Expiration
date | Cost ($) | Value ($) |
| 10-Year OTC interest rate swap with Citi to receive 3-Month USD LIBOR BBA and pay exercise rate | Citi | USD | 10,000,000 | 10,000,000 | 2.50 | 06/19/2019 | 52,500 | 71,343 |
| Call option contracts written |
| Description | Counterparty | Trading
currency | Notional
amount | Number of
contracts | Exercise
price/Rate | Expiration
date | Premium
received ($) | Value ($) |
| 3-Year OTC interest rate swap with Citi to receive 3-Month USD LIBOR BBA and pay exercise rate | Citi | USD | (30,000,000) | (30,000,000) | 2.25 | 7/24/2019 | (68,250) | (79,077) |
The accompanying Notes to Financial Statements are an integral part of this statement.
Columbia Bond Fund | Annual Report 2019
| 17 |
Portfolio of Investments (continued)
April 30, 2019
Notes to Portfolio of Investments
| (a) | Represents privately placed and other securities and instruments exempt from Securities and Exchange Commission registration (collectively, private placements), such as Section 4(a)(2) and Rule 144A eligible securities, which are often sold only to qualified institutional buyers. The Fund may invest in private placements determined to be liquid as well as those determined to be illiquid. Private placements may be determined to be liquid under guidelines established by the Fund’s Board of Trustees. At April 30, 2019, the total value of these securities amounted to $206,841,787, which represents 55.05% of total net assets. |
| (b) | Variable rate security. The interest rate shown was the current rate as of April 30, 2019. |
| (c) | Valuation based on significant unobservable inputs. |
| (d) | Variable or floating rate security, the interest rate of which adjusts periodically based on changes in current interest rates and prepayments on the underlying pool of assets. The interest rate shown was the current rate as of April 30, 2019. |
| (e) | Non-income producing investment. |
| (f) | Represents a variable rate security with a step coupon where the rate adjusts according to a schedule for a series of periods, typically lower for an initial period and then increasing to a higher coupon rate thereafter. The interest rate shown was the current rate as of April 30, 2019. |
| (g) | Principal and interest may not be guaranteed by the government. |
| (h) | Represents a security purchased on a when-issued basis. |
| (i) | This security or a portion of this security has been pledged as collateral in connection with derivative contracts. |
| (j) | Represents interest only securities which have the right to receive the monthly interest payments on an underlying pool of mortgage loans. |
| (k) | Represents fair value as determined in good faith under procedures approved by the Board of Trustees. At April 30, 2019, the total value of these securities amounted to $1,126, which represents less than 0.01% of total net assets. |
| (l) | Zero coupon bond. |
| (m) | The rate shown is the seven-day current annualized yield at April 30, 2019. |
| (n) | As defined in the Investment Company Act of 1940, an affiliated company is one in which the Fund owns 5% or more of the company’s outstanding voting securities, or a company which is under common ownership or control with the Fund. Holdings and transactions in these affiliated companies during the year ended April 30, 2019 are as follows: |
| Issuer | Beginning
shares | Shares
purchased | Shares
sold | Ending
shares | Realized gain
(loss) —
affiliated
issuers ($) | Net change in
unrealized
appreciation
(depreciation) —
affiliated
issuers ($) | Dividends —
affiliated
issuers ($) | Value —
affiliated
issuers
at end of
period ($) |
| Columbia Short-Term Cash Fund, 2.519% |
| | 10,597,693 | 178,505,218 | (173,200,981) | 15,901,930 | 518 | — | 284,317 | 15,900,340 |
Abbreviation Legend
| CMO | Collateralized Mortgage Obligation |
| STRIPS | Separate Trading of Registered Interest and Principal Securities |
Currency Legend
Fair value measurements
The Fund categorizes its fair value measurements according to a three-level hierarchy that maximizes the use of observable inputs and minimizes the use of unobservable inputs by prioritizing that the most observable input be used when available. Observable inputs are those that market participants would use in pricing an investment based on market data obtained from sources independent of the reporting entity. Unobservable inputs are those that reflect the Fund’s assumptions about the information market participants would use in pricing an investment. An investment’s level within the fair value hierarchy is based on the lowest level of any input that is deemed significant to the asset’s or liability’s fair value measurement. The input levels are not necessarily an indication of the risk or liquidity associated with investments at that level. For example, certain U.S. government securities are generally high quality and liquid, however, they are reflected as Level 2 because the inputs used to determine fair value may not always be quoted prices in an active market.
Fair value inputs are summarized in the three broad levels listed below:
| ■ | Level 1 — Valuations based on quoted prices for investments in active markets that the Fund has the ability to access at the measurement date. Valuation adjustments are not applied to Level 1 investments. |
| ■ | Level 2 — Valuations based on other significant observable inputs (including quoted prices for similar securities, interest rates, prepayment speeds, credit risks, etc.). |
| ■ | Level 3 — Valuations based on significant unobservable inputs (including the Fund’s own assumptions and judgment in determining the fair value of investments). |
The accompanying Notes to Financial Statements are an integral part of this statement.
| 18 | Columbia Bond Fund | Annual Report 2019 |
Portfolio of Investments (continued)
April 30, 2019
Fair value measurements (continued)
Inputs that are used in determining fair value of an investment may include price information, credit data, volatility statistics, and other factors. These inputs can be either observable or unobservable. The availability of observable inputs can vary between investments, and is affected by various factors such as the type of investment, and the volume and level of activity for that investment or similar investments in the marketplace. The inputs will be considered by the Investment Manager, along with any other relevant factors in the calculation of an investment’s fair value. The Fund uses prices and inputs that are current as of the measurement date, which may include periods of market dislocations. During these periods, the availability of prices and inputs may be reduced for many investments. This condition could cause an investment to be reclassified between the various levels within the hierarchy.
Certain investments that have been measured at fair value using the net asset value (NAV) per share (or its equivalent) are not categorized in the fair value hierarchy. The fair value amounts presented in the table are intended to reconcile the fair value hierarchy to the amounts presented in the Portfolio of Investments. The Columbia Short-Term Cash Fund seeks to provide shareholders with maximum current income consistent with liquidity and stability of principal. Columbia Short-Term Cash Fund prices its shares with a floating NAV and no longer seeks to maintain a stable NAV.
Investments falling into the Level 3 category are primarily supported by quoted prices from brokers and dealers participating in the market for those investments. However, these may be classified as Level 3 investments due to lack of market transparency and corroboration to support these quoted prices. Additionally, valuation models may be used as the pricing source for any remaining investments classified as Level 3. These models may rely on one or more significant unobservable inputs and/or significant assumptions by the Investment Manager. Inputs used in valuations may include, but are not limited to, financial statement analysis, capital account balances, discount rates and estimated cash flows, and comparable company data.
Under the direction of the Fund’s Board of Trustees (the Board), the Investment Manager’s Valuation Committee (the Committee) is responsible for overseeing the valuation procedures approved by the Board. The Committee consists of voting and non-voting members from various groups within the Investment Manager’s organization, including operations and accounting, trading and investments, compliance, risk management and legal.
The Committee meets at least monthly to review and approve valuation matters, which may include a description of specific valuation determinations, data regarding pricing information received from approved pricing vendors and brokers and the results of Board-approved valuation control policies and procedures (the Policies). The Policies address, among other things, instances when market quotations are or are not readily available, including recommendations of third party pricing vendors and a determination of appropriate pricing methodologies; events that require specific valuation determinations and assessment of fair value techniques; securities with a potential for stale pricing, including those that are illiquid, restricted, or in default; and the effectiveness of third party pricing vendors, including periodic reviews of vendors. The Committee meets more frequently, as needed, to discuss additional valuation matters, which may include the need to review back-testing results, review time-sensitive information or approve related valuation actions. The Committee reports to the Board, with members of the Committee meeting with the Board at each of its regularly scheduled meetings to discuss valuation matters and actions during the period, similar to those described earlier.
For investments categorized as Level 3, the Committee monitors information similar to that described above, which may include: (i) data specific to the issuer or comparable issuers, (ii) general market or specific sector news and (iii) quoted prices and specific or similar security transactions. The Committee considers this data and any changes from prior periods in order to assess the reasonableness of observable and unobservable inputs, any assumptions or internal models used to value those securities and changes in fair value. This data is also used to corroborate, when available, information received from approved pricing vendors and brokers. Various factors impact the frequency of monitoring this information (which may occur as often as daily). However, the Committee may determine that changes to inputs, assumptions and models are not required as a result of the monitoring procedures performed.
The following table is a summary of the inputs used to value the Fund’s investments at April 30, 2019:
| | Level 1
quoted prices
in active
markets for
identical
assets ($) | Level 2
other
significant
observable
inputs ($) | Level 3
significant
unobservable
inputs ($) | Investments
measured at
net asset
value ($) | Total ($) |
| Investments in Securities | | | | | |
| Asset-Backed Securities — Non-Agency | — | 74,751,283 | 900,108 | — | 75,651,391 |
| Commercial Mortgage-Backed Securities - Agency | — | 5,795,117 | — | — | 5,795,117 |
| Commercial Mortgage-Backed Securities - Non-Agency | — | 40,626,007 | — | — | 40,626,007 |
| Common Stocks | | | | | |
| Consumer Staples | — | 22 | — | — | 22 |
| Financials | 802 | — | — | — | 802 |
| Total Common Stocks | 802 | 22 | — | — | 824 |
| Corporate Bonds & Notes | — | 79,548,697 | — | — | 79,548,697 |
| Foreign Government Obligations | — | 1,817,630 | — | — | 1,817,630 |
| Municipal Bonds | — | 1,253,622 | — | — | 1,253,622 |
| Residential Mortgage-Backed Securities - Agency | — | 126,373,063 | — | — | 126,373,063 |
| Residential Mortgage-Backed Securities - Non-Agency | — | 88,663,546 | 986,278 | — | 89,649,824 |
| U.S. Treasury Obligations | 536,326 | 1,932,212 | — | — | 2,468,538 |
| Options Purchased Calls | — | 71,343 | — | — | 71,343 |
| Money Market Funds | — | — | — | 15,900,340 | 15,900,340 |
| Total Investments in Securities | 537,128 | 420,832,542 | 1,886,386 | 15,900,340 | 439,156,396 |
| Investments in Derivatives | | | | | |
| Asset | | | | | |
| Futures Contracts | 1,025,764 | — | — | — | 1,025,764 |
The accompanying Notes to Financial Statements are an integral part of this statement.
Columbia Bond Fund | Annual Report 2019
| 19 |
Portfolio of Investments (continued)
April 30, 2019
Fair value measurements (continued)
| | Level 1
quoted prices
in active
markets for
identical
assets ($) | Level 2
other
significant
observable
inputs ($) | Level 3
significant
unobservable
inputs ($) | Investments
measured at
net asset
value ($) | Total ($) |
| Liability | | | | | |
| Futures Contracts | (444,353) | — | — | — | (444,353) |
| Options Contracts Written | — | (79,077) | — | — | (79,077) |
| Total | 1,118,539 | 420,753,465 | 1,886,386 | 15,900,340 | 439,658,730 |
See the Portfolio of Investments for all investment classifications not indicated in the table.
The Fund’s assets assigned to the Level 2 input category are generally valued using the market approach, in which a security’s value is determined through reference to prices and information from market transactions for similar or identical assets.
Futures contracts are valued at unrealized appreciation (depreciation).
Financial assets were transferred from Level 1 to Level 2 as the market for these assets was deemed not to be active and fair values were consequently obtained using observable market inputs rather than quoted prices for identical assets as of period end.
Financial assets were transferred from Level 3 to Level 2 as observable market inputs were utilized and management determined that there was sufficient, reliable and observable market data to value these assets as of period end.
Transfers between levels are determined based on the fair value at the beginning of the period for security positions held throughout the period.
The following table(s) show(s) transfers between levels of the fair value hierarchy:
| Transfers In | Transfers Out |
| Level 1 ($) | Level 2 ($) | Level 1 ($) | Level 2 ($) |
| — | 28 | 28 | — |
The following table is a reconciliation of Level 3 assets for which significant observable and unobservable inputs were used to determine fair value:
| | Balance
as of
04/30/2018
($) | Increase
(decrease)
in accrued
discounts/
premiums
($) | Realized
gain (loss)
($) | Change
in unrealized
appreciation
(depreciation)(a)
($) | Purchases
($) | Sales
($) | Transfers
into
Level 3
($) | Transfers
out of
Level 3
($) | Balance
as of
04/30/2019
($) |
| Asset-Backed Securities — Non-Agency | 1,799,100 | — | — | 108 | 900,000 | — | — | (1,799,100) | 900,108 |
| Residential Mortgage-Backed Securities — Non-Agency | 4,792,672 | 330 | — | 25,237 | 959,990 | (1,029) | — | (4,790,922) | 986,278 |
| Total | 6,591,772 | 330 | — | 25,345 | 1,859,990 | (1,029) | — | (6,590,022) | 1,886,386 |
(a) Change in unrealized appreciation (depreciation) relating to securities held at April 30, 2019 was $25,345, which is comprised of Asset-Backed Securities — Non-Agency of $108 and Residential Mortgage-Backed Securities — Non-Agency of $25,237.
The Fund’s assets assigned to the Level 3 category are valued utilizing the valuation technique deemed the most appropriate in the circumstances. Certain residential mortgage backed and asset backed securities classified as Level 3 securities are valued using the market approach and utilize single market quotations from broker dealers which may have included, but not limited to, the distressed nature of the security and observable transactions for similar assets in the market. Significant increases (decreases) to any of these inputs would result in a significantly higher (lower) fair value measurement.
The accompanying Notes to Financial Statements are an integral part of this statement.
| 20 | Columbia Bond Fund | Annual Report 2019 |
Statement of Assets and Liabilities
April 30, 2019
| Assets | |
| Investments in securities, at value | |
| Unaffiliated issuers (cost $421,025,567) | $423,184,713 |
| Affiliated issuers (cost $15,900,340) | 15,900,340 |
| Options purchased (cost $52,500) | 71,343 |
| Receivable for: | |
| Investments sold | 1,101,567 |
| Investments sold on a delayed delivery basis | 2,968,664 |
| Capital shares sold | 1,243,123 |
| Dividends | 21,595 |
| Interest | 1,696,341 |
| Foreign tax reclaims | 14,774 |
| Variation margin for futures contracts | 260,566 |
| Expense reimbursement due from Investment Manager | 1,748 |
| Prepaid expenses | 504 |
| Trustees’ deferred compensation plan | 197,187 |
| Total assets | 446,662,465 |
| Liabilities | |
| Option contracts written, at value (premiums received $68,250) | 79,077 |
| Due to custodian | 702 |
| Payable for: | |
| Investments purchased | 297,465 |
| Investments purchased on a delayed delivery basis | 68,645,292 |
| Capital shares purchased | 526,278 |
| Distributions to shareholders | 1,010,076 |
| Variation margin for futures contracts | 47,322 |
| Management services fees | 5,129 |
| Distribution and/or service fees | 493 |
| Transfer agent fees | 15,132 |
| Compensation of board members | 62,262 |
| Compensation of chief compliance officer | 13 |
| Other expenses | 72,940 |
| Trustees’ deferred compensation plan | 197,187 |
| Total liabilities | 70,959,368 |
| Net assets applicable to outstanding capital stock | $375,703,097 |
| Represented by | |
| Paid in capital | 375,819,919 |
| Total distributable earnings (loss) (Note 2) | (116,822) |
| Total - representing net assets applicable to outstanding capital stock | $375,703,097 |
The accompanying Notes to Financial Statements are an integral part of this statement.
Columbia Bond Fund | Annual Report 2019
| 21 |
Statement of Assets and Liabilities (continued)
April 30, 2019
| Class A | |
| Net assets | $49,695,590 |
| Shares outstanding | 5,874,729 |
| Net asset value per share | $8.46 |
| Maximum sales charge | 4.75% |
| Maximum offering price per share (calculated by dividing the net asset value per share by 1.0 minus the maximum sales charge for Class A shares) | $8.88 |
| Advisor Class | |
| Net assets | $738,083 |
| Shares outstanding | 87,338 |
| Net asset value per share | $8.45 |
| Class C | |
| Net assets | $4,057,676 |
| Shares outstanding | 480,288 |
| Net asset value per share | $8.45 |
| Institutional Class | |
| Net assets | $51,185,313 |
| Shares outstanding | 6,051,480 |
| Net asset value per share | $8.46 |
| Institutional 2 Class | |
| Net assets | $3,687,288 |
| Shares outstanding | 437,204 |
| Net asset value per share | $8.43 |
| Institutional 3 Class | |
| Net assets | $257,417,440 |
| Shares outstanding | 30,373,207 |
| Net asset value per share | $8.48 |
| Class R | |
| Net assets | $679,812 |
| Shares outstanding | 80,377 |
| Net asset value per share | $8.46 |
| Class V | |
| Net assets | $8,241,895 |
| Shares outstanding | 976,044 |
| Net asset value per share | $8.44 |
| Maximum sales charge | 4.75% |
| Maximum offering price per share (calculated by dividing the net asset value per share by 1.0 minus the maximum sales charge for Class V shares) | $8.86 |
The accompanying Notes to Financial Statements are an integral part of this statement.
| 22 | Columbia Bond Fund | Annual Report 2019 |
Statement of Operations
Year Ended April 30, 2019
| Net investment income | |
| Income: | |
| Dividends — unaffiliated issuers | $18 |
| Dividends — affiliated issuers | 284,317 |
| Interest | 13,392,936 |
| Total income | 13,677,271 |
| Expenses: | |
| Management services fees | 1,921,248 |
| Distribution and/or service fees | |
| Class A | 123,756 |
| Class C | 47,243 |
| Class R | 3,080 |
| Class T | 14 |
| Class V | 12,734 |
| Transfer agent fees | |
| Class A | 89,435 |
| Advisor Class | 1,166 |
| Class C | 8,533 |
| Institutional Class | 94,613 |
| Institutional 2 Class | 1,282 |
| Institutional 3 Class | 19,195 |
| Class R | 1,113 |
| Class T | 10 |
| Class V | 15,335 |
| Compensation of board members | 20,902 |
| Custodian fees | 41,329 |
| Printing and postage fees | 26,676 |
| Registration fees | 123,974 |
| Audit fees | 49,050 |
| Legal fees | 8,548 |
| Compensation of chief compliance officer | 149 |
| Other | 20,907 |
| Total expenses | 2,630,292 |
| Fees waived or expenses reimbursed by Investment Manager and its affiliates | (637,917) |
| Expense reduction | (1,262) |
| Total net expenses | 1,991,113 |
| Net investment income | 11,686,158 |
| Realized and unrealized gain (loss) — net | |
| Net realized gain (loss) on: | |
| Investments — unaffiliated issuers | (1,814,833) |
| Investments — affiliated issuers | 518 |
| Foreign currency translations | 1,010 |
| Futures contracts | 326,010 |
| Options contracts written | (43,875) |
| Net realized loss | (1,531,170) |
| Net change in unrealized appreciation (depreciation) on: | |
| Investments — unaffiliated issuers | 8,454,793 |
| Futures contracts | 538,616 |
| Options purchased | 18,843 |
| Options contracts written | (10,827) |
| Net change in unrealized appreciation (depreciation) | 9,001,425 |
| Net realized and unrealized gain | 7,470,255 |
| Net increase in net assets resulting from operations | $19,156,413 |
The accompanying Notes to Financial Statements are an integral part of this statement.
Columbia Bond Fund | Annual Report 2019
| 23 |
Statement of Changes in Net Assets
| | Year Ended
April 30, 2019 | Year Ended
April 30, 2018 |
| Operations | | |
| Net investment income | $11,686,158 | $9,362,414 |
| Net realized gain (loss) | (1,531,170) | 1,941,651 |
| Net change in unrealized appreciation (depreciation) | 9,001,425 | (10,733,316) |
| Net increase in net assets resulting from operations | 19,156,413 | 570,749 |
| Distributions to shareholders | | |
| Net investment income and net realized gains | | |
| Class A | (1,340,588) | |
| Advisor Class | (19,447) | |
| Class C | (91,062) | |
| Institutional Class | (1,545,968) | |
| Institutional 2 Class | (62,439) | |
| Institutional 3 Class | (8,285,299) | |
| Class R | (15,353) | |
| Class T | (149) | |
| Class V | (238,350) | |
| Net investment income | | |
| Class A | | (942,650) |
| Advisor Class | | (10,833) |
| Class B | | (57) |
| Class C | | (76,260) |
| Institutional Class | | (2,541,221) |
| Institutional 2 Class | | (16,537) |
| Institutional 3 Class | | (5,347,730) |
| Class R | | (10,836) |
| Class T | | (173) |
| Class V | | (183,614) |
| Net realized gains | | |
| Class A | | (75,008) |
| Advisor Class | | (853) |
| Class C | | (10,560) |
| Institutional Class | | (90,275) |
| Institutional 2 Class | | (1,071) |
| Institutional 3 Class | | (433,349) |
| Class R | | (989) |
| Class T | | (14) |
| Class V | | (13,938) |
| Total distributions to shareholders (Note 2) | (11,598,655) | (9,755,968) |
| Decrease in net assets from capital stock activity | (40,986,785) | (54,398,897) |
| Total decrease in net assets | (33,429,027) | (63,584,116) |
| Net assets at beginning of year | 409,132,124 | 472,716,240 |
| Net assets at end of year | $375,703,097 | $409,132,124 |
| Excess of distributions over net investment income | $(222,397) | $(331,222) |
The accompanying Notes to Financial Statements are an integral part of this statement.
| 24 | Columbia Bond Fund | Annual Report 2019 |
Statement of Changes in Net Assets (continued)
| | Year Ended | Year Ended |
| | April 30, 2019 | April 30, 2018 |
| | Shares | Dollars ($) | Shares | Dollars ($) |
| Capital stock activity |
| Class A | | | | |
| Subscriptions | 1,032,115 | 8,545,104 | 1,350,192 | 11,470,191 |
| Distributions reinvested | 119,481 | 990,693 | 85,634 | 725,098 |
| Redemptions | (1,415,970) | (11,685,508) | (1,441,277) | (12,209,797) |
| Net decrease | (264,374) | (2,149,711) | (5,451) | (14,508) |
| Advisor Class | | | | |
| Subscriptions | 37,216 | 308,849 | 27,203 | 231,020 |
| Distributions reinvested | 2,314 | 19,166 | 1,354 | 11,459 |
| Redemptions | (12,265) | (101,649) | (29,409) | (248,447) |
| Net increase (decrease) | 27,265 | 226,366 | (852) | (5,968) |
| Class B | | | | |
| Subscriptions | — | — | 4 | 23 |
| Distributions reinvested | — | — | 2 | 21 |
| Redemptions | — | — | (15,629) | (134,084) |
| Net decrease | — | — | (15,623) | (134,040) |
| Class C | | | | |
| Subscriptions | 259,041 | 2,138,136 | 86,917 | 738,369 |
| Distributions reinvested | 9,638 | 79,782 | 9,354 | 79,126 |
| Redemptions | (513,962) | (4,252,640) | (489,094) | (4,148,309) |
| Net decrease | (245,283) | (2,034,722) | (392,823) | (3,330,814) |
| Institutional Class | | | | |
| Subscriptions | 567,628 | 4,698,580 | 911,392 | 7,780,317 |
| Distributions reinvested | 156,931 | 1,300,959 | 139,701 | 1,184,004 |
| Redemptions | (1,502,294) | (12,396,994) | (37,800,189) | (323,756,482) |
| Net decrease | (777,735) | (6,397,455) | (36,749,096) | (314,792,161) |
| Institutional 2 Class | | | | |
| Subscriptions | 359,306 | 2,964,758 | 29,375 | 246,181 |
| Distributions reinvested | 7,485 | 62,142 | 2,060 | 17,385 |
| Redemptions | (34,201) | (281,160) | (13,880) | (117,045) |
| Net increase | 332,590 | 2,745,740 | 17,555 | 146,521 |
| Institutional 3 Class | | | | |
| Subscriptions | 1,375,268 | 11,439,833 | 34,266,000 | 294,261,409 |
| Distributions reinvested | 7,072 | 58,748 | 3,709 | 31,371 |
| Redemptions | (5,339,004) | (44,116,064) | (3,447,893) | (29,201,714) |
| Net increase (decrease) | (3,956,664) | (32,617,483) | 30,821,816 | 265,091,066 |
| Class R | | | | |
| Subscriptions | 16,960 | 140,236 | 8,977 | 76,045 |
| Distributions reinvested | 1,851 | 15,353 | 1,380 | 11,705 |
| Redemptions | (4,836) | (40,041) | (52,854) | (448,562) |
| Net increase (decrease) | 13,975 | 115,548 | (42,497) | (360,812) |
| Class T | | | | |
| Redemptions | (1,138) | (9,355) | (1) | (10) |
| Net decrease | (1,138) | (9,355) | (1) | (10) |
| Class V | | | | |
| Subscriptions | 3,637 | 29,963 | 15,486 | 131,303 |
| Distributions reinvested | 21,018 | 173,913 | 16,881 | 142,768 |
| Redemptions | (129,292) | (1,069,589) | (150,794) | (1,272,242) |
| Net decrease | (104,637) | (865,713) | (118,427) | (998,171) |
| Total net decrease | (4,976,001) | (40,986,785) | (6,485,399) | (54,398,897) |
The accompanying Notes to Financial Statements are an integral part of this statement.
Columbia Bond Fund | Annual Report 2019
| 25 |
The following table is intended to help you understand the Fund’s financial performance. Certain information reflects financial results for a single share of a class held for the periods shown. Per share net investment income (loss) amounts are calculated based on average shares outstanding during the period. Total return assumes reinvestment of all dividends and distributions, if any. Total return does not reflect payment of sales charges, if any. Total return and portfolio turnover are not annualized for periods of less than one year. The portfolio turnover rate is calculated without regard to purchase and sales transactions of short-term instruments and certain derivatives, if any. If such transactions were included, the Fund’s portfolio turnover rate may be higher.
| | Net asset value,
beginning of
period | Net
investment
income | Net
realized
and
unrealized
gain (loss) | Total from
investment
operations | Distributions
from net
investment
income | Distributions
from net
realized
gains | Total
distributions to
shareholders |
| Class A |
| Year Ended 4/30/2019 | $8.28 | 0.23 | 0.17 | 0.40 | (0.22) | — | (0.22) |
| Year Ended 4/30/2018 | $8.47 | 0.16 | (0.19) | (0.03) | (0.15) | (0.01) | (0.16) |
| Year Ended 4/30/2017 | $8.72 | 0.16 | (0.05) | 0.11 | (0.15) | (0.21) | (0.36) |
| Year Ended 4/30/2016 | $8.91 | 0.16 | 0.07 | 0.23 | (0.21) | (0.21) | (0.42) |
| Year Ended 4/30/2015 | $8.86 | 0.17 | 0.15 | 0.32 | (0.16) | (0.11) | (0.27) |
| Advisor Class |
| Year Ended 4/30/2019 | $8.27 | 0.25 | 0.18 | 0.43 | (0.25) | — | (0.25) |
| Year Ended 4/30/2018 | $8.46 | 0.18 | (0.18) | 0.00(e) | (0.18) | (0.01) | (0.19) |
| Year Ended 4/30/2017 | $8.72 | 0.18 | (0.06) | 0.12 | (0.17) | (0.21) | (0.38) |
| Year Ended 4/30/2016 | $8.91 | 0.18 | 0.07 | 0.25 | (0.23) | (0.21) | (0.44) |
| Year Ended 4/30/2015 | $8.85 | 0.19 | 0.16 | 0.35 | (0.18) | (0.11) | (0.29) |
| Class C |
| Year Ended 4/30/2019 | $8.27 | 0.16 | 0.18 | 0.34 | (0.16) | — | (0.16) |
| Year Ended 4/30/2018 | $8.46 | 0.09 | (0.18) | (0.09) | (0.09) | (0.01) | (0.10) |
| Year Ended 4/30/2017 | $8.71 | 0.10 | (0.05) | 0.05 | (0.09) | (0.21) | (0.30) |
| Year Ended 4/30/2016 | $8.90 | 0.09 | 0.07 | 0.16 | (0.14) | (0.21) | (0.35) |
| Year Ended 4/30/2015 | $8.85 | 0.10 | 0.16 | 0.26 | (0.10) | (0.11) | (0.21) |
| Institutional Class |
| Year Ended 4/30/2019 | $8.28 | 0.25 | 0.18 | 0.43 | (0.25) | — | (0.25) |
| Year Ended 4/30/2018 | $8.47 | 0.15 | (0.15) | 0.00(e) | (0.18) | (0.01) | (0.19) |
| Year Ended 4/30/2017 | $8.72 | 0.18 | (0.05) | 0.13 | (0.17) | (0.21) | (0.38) |
| Year Ended 4/30/2016 | $8.91 | 0.18 | 0.07 | 0.25 | (0.23) | (0.21) | (0.44) |
| Year Ended 4/30/2015 | $8.86 | 0.19 | 0.15 | 0.34 | (0.18) | (0.11) | (0.29) |
| Institutional 2 Class |
| Year Ended 4/30/2019 | $8.26 | 0.26 | 0.16 | 0.42 | (0.25) | — | (0.25) |
| Year Ended 4/30/2018 | $8.44 | 0.19 | (0.18) | 0.01 | (0.18) | (0.01) | (0.19) |
| Year Ended 4/30/2017 | $8.70 | 0.17 | (0.04) | 0.13 | (0.18) | (0.21) | (0.39) |
| Year Ended 4/30/2016 | $8.89 | 0.19 | 0.07 | 0.26 | (0.24) | (0.21) | (0.45) |
| Year Ended 4/30/2015 | $8.84 | 0.20 | 0.15 | 0.35 | (0.19) | (0.11) | (0.30) |
The accompanying Notes to Financial Statements are an integral part of this statement.
| 26 | Columbia Bond Fund | Annual Report 2019 |
Financial Highlights (continued)
| | Net
asset
value,
end of
period | Total
return | Total gross
expense
ratio to
average
net assets(a) | Total net
expense
ratio to
average
net assets(a),(b) | Net investment
income
ratio to
average
net assets | Portfolio
turnover | Net
assets,
end of
period
(000’s) |
| Class A |
| Year Ended 4/30/2019 | $8.46 | 4.98% | 1.01% | 0.83%(c) | 2.73% | 236% | $49,696 |
| Year Ended 4/30/2018 | $8.28 | (0.33%) | 1.00% | 0.86%(c) | 1.84% | 257% | $50,845 |
| Year Ended 4/30/2017 | $8.47 | 1.34% | 0.98%(d) | 0.82%(c),(d) | 1.86% | 375% | $52,029 |
| Year Ended 4/30/2016 | $8.72 | 2.74% | 1.02% | 0.86%(c) | 1.83% | 428% | $55,058 |
| Year Ended 4/30/2015 | $8.91 | 3.63% | 1.01% | 0.90%(c) | 1.85% | 350% | $52,256 |
| Advisor Class |
| Year Ended 4/30/2019 | $8.45 | 5.24% | 0.76% | 0.58%(c) | 3.03% | 236% | $738 |
| Year Ended 4/30/2018 | $8.27 | (0.08%) | 0.75% | 0.61%(c) | 2.09% | 257% | $497 |
| Year Ended 4/30/2017 | $8.46 | 1.48% | 0.73%(d) | 0.57%(c),(d) | 2.10% | 375% | $516 |
| Year Ended 4/30/2016 | $8.72 | 3.01% | 0.77% | 0.61%(c) | 2.07% | 428% | $390 |
| Year Ended 4/30/2015 | $8.91 | 4.00% | 0.76% | 0.64%(c) | 2.12% | 350% | $26 |
| Class C |
| Year Ended 4/30/2019 | $8.45 | 4.20% | 1.76% | 1.59%(c) | 1.96% | 236% | $4,058 |
| Year Ended 4/30/2018 | $8.27 | (1.08%) | 1.75% | 1.61%(c) | 1.04% | 257% | $6,001 |
| Year Ended 4/30/2017 | $8.46 | 0.59% | 1.73%(d) | 1.57%(c),(d) | 1.11% | 375% | $9,461 |
| Year Ended 4/30/2016 | $8.71 | 1.98% | 1.77% | 1.61%(c) | 1.08% | 428% | $10,870 |
| Year Ended 4/30/2015 | $8.90 | 2.91% | 1.76% | 1.60%(c) | 1.15% | 350% | $9,406 |
| Institutional Class |
| Year Ended 4/30/2019 | $8.46 | 5.24% | 0.76% | 0.58%(c) | 2.97% | 236% | $51,185 |
| Year Ended 4/30/2018 | $8.28 | (0.08%) | 0.74% | 0.61%(c) | 1.74% | 257% | $56,556 |
| Year Ended 4/30/2017 | $8.47 | 1.60% | 0.73%(d) | 0.58%(c),(d) | 2.11% | 375% | $369,017 |
| Year Ended 4/30/2016 | $8.72 | 3.00% | 0.77% | 0.61%(c) | 2.08% | 428% | $440,059 |
| Year Ended 4/30/2015 | $8.91 | 3.88% | 0.75% | 0.65%(c) | 2.10% | 350% | $550,803 |
| Institutional 2 Class |
| Year Ended 4/30/2019 | $8.43 | 5.24% | 0.64% | 0.47% | 3.20% | 236% | $3,687 |
| Year Ended 4/30/2018 | $8.26 | 0.13% | 0.64% | 0.51% | 2.20% | 257% | $864 |
| Year Ended 4/30/2017 | $8.44 | 1.58% | 0.63%(d) | 0.49%(d) | 1.99% | 375% | $735 |
| Year Ended 4/30/2016 | $8.70 | 3.11% | 0.60% | 0.50% | 2.14% | 428% | $52 |
| Year Ended 4/30/2015 | $8.89 | 4.04% | 0.56% | 0.50% | 2.25% | 350% | $413 |
The accompanying Notes to Financial Statements are an integral part of this statement.
Columbia Bond Fund | Annual Report 2019
| 27 |
Financial Highlights (continued)
| | Net asset value,
beginning of
period | Net
investment
income | Net
realized
and
unrealized
gain (loss) | Total from
investment
operations | Distributions
from net
investment
income | Distributions
from net
realized
gains | Total
distributions to
shareholders |
| Institutional 3 Class |
| Year Ended 4/30/2019 | $8.30 | 0.26 | 0.18 | 0.44 | (0.26) | — | (0.26) |
| Year Ended 4/30/2018 | $8.48 | 0.21 | (0.19) | 0.02 | (0.19) | (0.01) | (0.20) |
| Year Ended 4/30/2017 | $8.74 | 0.19 | (0.05) | 0.14 | (0.19) | (0.21) | (0.40) |
| Year Ended 4/30/2016 | $8.92 | 0.19 | 0.09 | 0.28 | (0.25) | (0.21) | (0.46) |
| Year Ended 4/30/2015 | $8.87 | 0.20 | 0.15 | 0.35 | (0.19) | (0.11) | (0.30) |
| Class R |
| Year Ended 4/30/2019 | $8.28 | 0.21 | 0.17 | 0.38 | (0.20) | — | (0.20) |
| Year Ended 4/30/2018 | $8.47 | 0.13 | (0.18) | (0.05) | (0.13) | (0.01) | (0.14) |
| Year Ended 4/30/2017 | $8.72 | 0.14 | (0.05) | 0.09 | (0.13) | (0.21) | (0.34) |
| Year Ended 4/30/2016 | $8.91 | 0.14 | 0.07 | 0.21 | (0.19) | (0.21) | (0.40) |
| Year Ended 4/30/2015 | $8.86 | 0.14 | 0.16 | 0.30 | (0.14) | (0.11) | (0.25) |
| Class V |
| Year Ended 4/30/2019 | $8.27 | 0.23 | 0.17 | 0.40 | (0.23) | — | (0.23) |
| Year Ended 4/30/2018 | $8.46 | 0.16 | (0.18) | (0.02) | (0.16) | (0.01) | (0.17) |
| Year Ended 4/30/2017 | $8.71 | 0.17 | (0.05) | 0.12 | (0.16) | (0.21) | (0.37) |
| Year Ended 4/30/2016 | $8.90 | 0.17 | 0.07 | 0.24 | (0.22) | (0.21) | (0.43) |
| Year Ended 4/30/2015 | $8.85 | 0.17 | 0.16 | 0.33 | (0.17) | (0.11) | (0.28) |
| Notes to Financial Highlights |
| (a) | In addition to the fees and expenses that the Fund bears directly, the Fund indirectly bears a pro rata share of the fees and expenses of any other funds in which it invests. Such indirect expenses are not included in the Fund’s reported expense ratios. |
| (b) | Total net expenses include the impact of certain fee waivers/expense reimbursements made by the Investment Manager and certain of its affiliates, if applicable. |
| (c) | The benefits derived from expense reductions had an impact of less than 0.01%. |
| (d) | Expenses have been reduced due to a reimbursement of expenses overbilled by a third party. If the reimbursement had been excluded, the expense ratios would have been higher by the percentages shown for each class in the table below. All fee waivers and expense reimbursements by the Investment Manager and its affiliates were applied before giving effect to this third party reimbursement. |
| Year Ended | Class A | Advisor
Class | Class C | Institutional
Class | Institutional 2
Class | Institutional 3
Class | Class R | Class V |
| 04/30/2017 | 0.04% | 0.04% | 0.04% | 0.03% | 0.02% | 0.03% | 0.03% | 0.03% |
The accompanying Notes to Financial Statements are an integral part of this statement.
| 28 | Columbia Bond Fund | Annual Report 2019 |
Financial Highlights (continued)
| | Net
asset
value,
end of
period | Total
return | Total gross
expense
ratio to
average
net assets(a) | Total net
expense
ratio to
average
net assets(a),(b) | Net investment
income
ratio to
average
net assets | Portfolio
turnover | Net
assets,
end of
period
(000’s) |
| Institutional 3 Class |
| Year Ended 4/30/2019 | $8.48 | 5.41% | 0.58% | 0.42% | 3.14% | 236% | $257,417 |
| Year Ended 4/30/2018 | $8.30 | 0.19% | 0.59% | 0.46% | 2.46% | 257% | $284,876 |
| Year Ended 4/30/2017 | $8.48 | 1.63% | 0.54%(d) | 0.42%(d) | 2.26% | 375% | $29,756 |
| Year Ended 4/30/2016 | $8.74 | 3.28% | 0.56% | 0.45% | 2.24% | 428% | $31,981 |
| Year Ended 4/30/2015 | $8.92 | 4.05% | 0.54% | 0.48% | 2.27% | 350% | $27,155 |
| Class R |
| Year Ended 4/30/2019 | $8.46 | 4.71% | 1.26% | 1.08%(c) | 2.51% | 236% | $680 |
| Year Ended 4/30/2018 | $8.28 | (0.58%) | 1.25% | 1.11%(c) | 1.54% | 257% | $550 |
| Year Ended 4/30/2017 | $8.47 | 1.09% | 1.23%(d) | 1.08%(c),(d) | 1.62% | 375% | $922 |
| Year Ended 4/30/2016 | $8.72 | 2.49% | 1.27% | 1.11%(c) | 1.57% | 428% | $1,750 |
| Year Ended 4/30/2015 | $8.91 | 3.37% | 1.26% | 1.15%(c) | 1.59% | 350% | $2,009 |
| Class V |
| Year Ended 4/30/2019 | $8.44 | 4.96% | 0.91% | 0.73%(c) | 2.83% | 236% | $8,242 |
| Year Ended 4/30/2018 | $8.27 | (0.23%) | 0.90% | 0.76%(c) | 1.92% | 257% | $8,934 |
| Year Ended 4/30/2017 | $8.46 | 1.44% | 0.88%(d) | 0.73%(c),(d) | 1.95% | 375% | $10,139 |
| Year Ended 4/30/2016 | $8.71 | 2.85% | 0.92% | 0.76%(c) | 1.93% | 428% | $10,887 |
| Year Ended 4/30/2015 | $8.90 | 3.73% | 0.91% | 0.80%(c) | 1.95% | 350% | $11,885 |
The accompanying Notes to Financial Statements are an integral part of this statement.
Columbia Bond Fund | Annual Report 2019
| 29 |
Notes to Financial Statements
April 30, 2019
Note 1. Organization
Columbia Bond Fund (the Fund), a series of Columbia Funds Series Trust I (the Trust), is a diversified fund. The Trust is registered under the Investment Company Act of 1940, as amended (the 1940 Act), as an open-end management investment company organized as a Massachusetts business trust.
Fund shares
The Trust may issue an unlimited number of shares (without par value). Although all share classes generally have identical voting, dividend and liquidation rights, each share class votes separately when required by the Trust’s organizational documents or by law. Different share classes pay different distribution amounts to the extent the expenses of such share classes differ, and distributions in liquidation will be proportional to the net asset value of each share class. Each share class has its own expense and sales charge structure. The Fund offers each of the share classes identified below.
Class A shares are subject to a maximum front-end sales charge of 4.75% based on the initial investment amount. Class A shares purchased without an initial sales charge in accounts aggregating $1 million to $50 million at the time of purchase are subject to a contingent deferred sales charge (CDSC) if the shares are sold within 18 months after purchase, charged as follows: 1.00% CDSC if redeemed within 12 months after purchase, and 0.50% CDSC if redeemed more than 12, but less than 18, months after purchase.
Advisor Class shares are not subject to sales charges and are generally available only to omnibus retirement plans and certain investors as described in the Fund’s prospectus.
Class C shares are subject to a 1.00% CDSC on shares redeemed within 12 months after purchase. Effective July 1, 2018, Class C shares automatically convert to Class A shares of the same Fund in the month of or the month following the 10-year anniversary of the Class C shares purchase date.
Institutional Class shares are not subject to sales charges and are generally available only to eligible investors, which are subject to different investment minimums as described in the Fund’s prospectus.
Institutional 2 Class shares are not subject to sales charges and are generally available only to investors purchasing through authorized investment professionals and omnibus retirement plans as described in the Fund’s prospectus.
Institutional 3 Class shares are not subject to sales charges and are available to institutional and certain other investors as described in the Fund’s prospectus.
Class R shares are not subject to sales charges and are generally available only to certain retirement plans and other investors as described in the Fund’s prospectus.
Class T shares were subject to a maximum front-end sales charge of 2.50% per transaction and were required to be purchased through financial intermediaries that, by written agreement with Columbia Management Investment Distributors, Inc., were specifically authorized to sell Class T shares. Effective at the close of business on December 14, 2018, Class T shares merged, in a tax-free transaction, into Class A shares of the Fund and are no longer offered for sale.
Class V shares are subject to a maximum front-end sales charge of 4.75% based on the investment amount. Class V shares purchased without an initial sales charge in accounts aggregating $1 million to $50 million at the time of purchase are subject to a CDSC if the shares are sold within 18 months after purchase, charged as follows: 1.00% CDSC if redeemed within 12 months after purchase, and 0.50% CDSC if redeemed more than 12, but less than 18, months after purchase. Class V shares are available only to investors who received (and who have continuously held) Class V shares in connection with previous fund reorganizations.
| 30 | Columbia Bond Fund | Annual Report 2019 |
Notes to Financial Statements (continued)
April 30, 2019
Note 2. Summary of significant accounting policies
Basis of preparation
The Fund is an investment company that applies the accounting and reporting guidance in the Financial Accounting Standards Board (FASB) Accounting Standards Codification Topic 946,Financial Services - Investment Companies (ASC 946). The financial statements are prepared in accordance with U.S. generally accepted accounting principles (GAAP), which requires management to make certain estimates and assumptions that affect the reported amounts of assets and liabilities, the disclosure of contingent assets and liabilities at the date of the financial statements and the reported amounts of income and expenses during the reporting period. Actual results could differ from those estimates.
The following is a summary of significant accounting policies followed by the Fund in the preparation of its financial statements.
Security valuation
All equity securities are valued at the close of business of the New York Stock Exchange. Equity securities are valued at the last quoted sales price on the principal exchange or market on which they trade, except for securities traded on the NASDAQ Stock Market, which are valued at the NASDAQ official close price. Unlisted securities or listed securities for which there were no sales during the day are valued at the mean of the latest quoted bid and ask prices on such exchanges or markets.
Debt securities generally are valued by pricing services approved by the Board of Trustees based upon market transactions for normal, institutional-size trading units of similar securities. The services may use various pricing techniques that take into account, as applicable, factors such as yield, quality, coupon rate, maturity, type of issue, trading characteristics and other data, as well as approved independent broker-dealer quotes. Debt securities for which quotations are not readily available or not believed to be reflective of market value may also be valued based upon a bid quote from an approved independent broker-dealer. Debt securities maturing in 60 days or less are valued primarily at amortized cost value, unless this method results in a valuation that management believes does not approximate market value.
Asset- and mortgage-backed securities are generally valued by pricing services, which utilize pricing models that incorporate the securities’ cash flow and loan performance data. These models also take into account available market data, including trades, market quotations, and benchmark yield curves for identical or similar securities. Factors used to identify similar securities may include, but are not limited to, issuer, collateral type, vintage, prepayment speeds, collateral performance, credit ratings, credit enhancement and expected life. Asset-backed securities for which quotations are readily available may also be valued based upon an over-the-counter or exchange bid quote from an approved independent broker-dealer.
Investments in open-end investment companies, including money market funds, are valued at their latest net asset value.
Futures and options on futures contracts are valued based upon the settlement price at the close of regular trading on their principal exchanges or, in the absence of transactions, at the mean of the latest quoted bid and ask prices.
Option contracts are valued at the mean of the latest quoted bid and ask prices on their primary exchanges. Option contracts, including over-the-counter option contracts, with no readily available market quotations are valued using quotes obtained from independent brokers as of the close of the New York Stock Exchange.
Investments for which market quotations are not readily available, or that have quotations which management believes are not reflective of market value or reliable, are valued at fair value as determined in good faith under procedures approved by and under the general supervision of the Board of Trustees. If a security or class of securities (such as foreign securities) is valued at fair value, such value is likely to be different from the quoted or published price for the security.
The determination of fair value often requires significant judgment. To determine fair value, management may use assumptions including but not limited to future cash flows and estimated risk premiums. Multiple inputs from various sources may be used to determine fair value.
Columbia Bond Fund | Annual Report 2019
| 31 |
Notes to Financial Statements (continued)
April 30, 2019
GAAP requires disclosure regarding the inputs and valuation techniques used to measure fair value and any changes in valuation inputs or techniques. In addition, investments shall be disclosed by major category. This information is disclosed following the Fund’s Portfolio of Investments.
Foreign currency transactions and translations
The values of all assets and liabilities denominated in foreign currencies are generally translated into U.S. dollars at exchange rates determined at the close of regular trading on the New York Stock Exchange. Net realized and unrealized gains (losses) on foreign currency transactions and translations include gains (losses) arising from the fluctuation in exchange rates between trade and settlement dates on securities transactions, gains (losses) arising from the disposition of foreign currency and currency gains (losses) between the accrual and payment dates on dividends, interest income and foreign withholding taxes.
For financial statement purposes, the Fund does not distinguish that portion of gains (losses) on investments which is due to changes in foreign exchange rates from that which is due to changes in market prices of the investments. Such fluctuations are included with the net realized and unrealized gains (losses) on investments in the Statement of Operations.
Derivative instruments
The Fund invests in certain derivative instruments, as detailed below, to meet its investment objectives. Derivatives are instruments whose values depend on, or are derived from, in whole or in part, the value of one or more securities, currencies, commodities, indices, or other assets or instruments. Derivatives may be used to increase investment flexibility (including to maintain cash reserves while maintaining desired exposure to certain assets), for risk management (hedging) purposes, to facilitate trading, to reduce transaction costs and to pursue higher investment returns. The Fund may also use derivative instruments to mitigate certain investment risks, such as foreign currency exchange rate risk, interest rate risk and credit risk. Derivatives may involve various risks, including the potential inability of the counterparty to fulfill its obligations under the terms of the contract, the potential for an illiquid secondary market (making it difficult for the Fund to sell or terminate, including at favorable prices) and the potential for market movements which may expose the Fund to gains or losses in excess of the amount shown in the Statement of Assets and Liabilities. The notional amounts of derivative instruments, if applicable, are not recorded in the financial statements.
A derivative instrument may suffer a marked-to-market loss if the value of the contract decreases due to an unfavorable change in the market rates or values of the underlying instrument. Losses can also occur if the counterparty does not perform its obligations under the contract. The Fund’s risk of loss from counterparty credit risk on over-the-counter derivatives is generally limited to the aggregate unrealized gain netted against any collateral held by the Fund and the amount of any variation margin held by the counterparty, plus any replacement costs or related amounts. With exchange-traded or centrally cleared derivatives, there is reduced counterparty credit risk to the Fund since the clearinghouse or central counterparty (CCP) provides some protection in the case of clearing member default. The clearinghouse or CCP stands between the buyer and the seller of the contract; therefore, additional counterparty credit risk is failure of the clearinghouse or CCP. However, credit risk still exists in exchange-traded or centrally cleared derivatives with respect to initial and variation margin that is held in a broker’s customer account. While brokers are required to segregate customer margin from their own assets, in the event that a broker becomes insolvent or goes into bankruptcy and at that time there is a shortfall in the aggregate amount of margin held by the broker for all its clients, U.S. bankruptcy laws will typically allocate that shortfall on a pro-rata basis across all the broker’s customers (including the Fund), potentially resulting in losses to the Fund.
In order to better define its contractual rights and to secure rights that will help the Fund mitigate its counterparty risk, the Fund may enter into an International Swaps and Derivatives Association, Inc. Master Agreement (ISDA Master Agreement) or similar agreement with its derivatives contract counterparties. An ISDA Master Agreement is an agreement between the Fund and a counterparty that governs over-the-counter derivatives and typically contains, among other things, collateral posting terms and netting provisions in the event of a default and/or termination event. Under an ISDA Master Agreement, the Fund may, under certain circumstances, offset with the counterparty certain derivative instrument’s payables and/or receivables with collateral held and/or posted and create one single net payment. The provisions of the ISDA Master Agreement typically permit a single net payment in the event of default (close-out netting), including the bankruptcy or insolvency of the counterparty. Note, however, that bankruptcy or insolvency laws of a particular jurisdiction may impose restrictions on or prohibitions against the right of offset or netting in bankruptcy, insolvency or other events.
| 32 | Columbia Bond Fund | Annual Report 2019 |
Notes to Financial Statements (continued)
April 30, 2019
Collateral (margin) requirements differ by type of derivative. Margin requirements are established by the clearinghouse or CCP for exchange-traded and centrally cleared derivatives. Brokers can ask for margin in excess of the minimum in certain circumstances. Collateral terms are contract specific for over-the-counter derivatives. For over-the-counter derivatives traded under an ISDA Master Agreement, the collateral requirements are typically calculated by netting the marked-to-market amount for each transaction under such agreement and comparing that amount to the value of any variation margin currently pledged by the Fund and/or the counterparty. Generally, the amount of collateral due from or to a party has to exceed a minimum transfer amount threshold (e.g., $250,000) before a transfer has to be made. To the extent amounts due to the Fund from its counterparties are not fully collateralized, contractually or otherwise, the Fund bears the risk of loss from counterparty nonperformance. The Fund may also pay interest expense on cash collateral received from the broker. Any interest expense paid by the Fund is shown on the Statement of Operations. The Fund attempts to mitigate counterparty risk by only entering into agreements with counterparties that it believes have the financial resources to honor their obligations and by monitoring the financial stability of those counterparties.
Certain ISDA Master Agreements allow counterparties of over-the-counter derivatives transactions to terminate derivatives contracts prior to maturity in the event the Fund’s net asset value declines by a stated percentage over a specified time period or if the Fund fails to meet certain terms of the ISDA Master Agreement, which would cause the Fund to accelerate payment of any net liability owed to the counterparty. The Fund also has termination rights if the counterparty fails to meet certain terms of the ISDA Master Agreement. In determining whether to exercise such termination rights, the Fund would consider, in addition to counterparty credit risk, whether termination would result in a net liability owed from the counterparty.
For financial reporting purposes, the Fund does not offset derivative assets and derivative liabilities that are subject to netting arrangements in the Statement of Assets and Liabilities.
Futures contracts
Futures contracts are exchange-traded and represent commitments for the future purchase or sale of an asset at a specified price on a specified date. The Fund bought and sold futures contracts to manage the duration and yield curve exposure of the Fund versus the benchmark and to manage exposure to movements in interest rates. These instruments may be used for other purposes in future periods. Upon entering into futures contracts, the Fund bears risks that it may not achieve the anticipated benefits of the futures contracts and may realize a loss. Additional risks include counterparty credit risk, the possibility of an illiquid market, and that a change in the value of the contract or option may not correlate with changes in the value of the underlying asset.
Upon entering into a futures contract, the Fund deposits cash or securities with the broker, known as a futures commission merchant (FCM), in an amount sufficient to meet the initial margin requirement. The initial margin deposit must be maintained at an established level over the life of the contract. Cash deposited as initial margin is recorded in the Statement of Assets and Liabilities as margin deposits. Securities deposited as initial margin are designated in the Portfolio of Investments. Subsequent payments (variation margin) are made or received by the Fund each day. The variation margin payments are equal to the daily change in the contract value and are recorded as variation margin receivable or payable and are offset in unrealized gains or losses. The Fund recognizes a realized gain or loss when the contract is closed or expires. Futures contracts involve, to varying degrees, risk of loss in excess of the variation margin disclosed in the Statement of Assets and Liabilities.
Options contracts
Options are contracts which entitle the holder to purchase or sell securities or other identified assets at a specified price, or in the case of index option contracts, to receive or pay the difference between the index value and the strike price of the index option contract. Option contracts can be either exchange-traded or over-the-counter. The Fund purchased and wrote option contracts to manage exposure to fluctuations in interest rates and to manage convexity risk. These instruments may be used for other purposes in future periods. Completion of transactions for option contracts traded in the over-the-counter market depends upon the performance of the other party. Cash collateral may be collected or posted by the Fund to secure certain over-the-counter option contract trades. Cash collateral held or posted by the Fund for such option contract trades must be returned to the broker or the Fund upon closure, exercise or expiration of the contract.
Columbia Bond Fund | Annual Report 2019
| 33 |
Notes to Financial Statements (continued)
April 30, 2019
Options contracts purchased are recorded as investments. When the Fund writes an options contract, the premium received is recorded as an asset and an amount equivalent to the premium is recorded as a liability in the Statement of Assets and Liabilities and is subsequently adjusted to reflect the current fair value of the option written. Changes in the fair value of the written option are recorded as unrealized appreciation or depreciation until the contract is exercised or has expired. The Fund will realize a gain or loss when the option contract is closed or expires. When option contracts are exercised, the proceeds on sales for a written call or purchased put option contract, or the purchase cost for a written put or purchased call option contract, is adjusted by the amount of premium received or paid.
For over-the-counter options purchased, the Fund bears the risk of loss of the amount of the premiums paid plus the positive change in market values net of any collateral held by the Fund should the counterparty fail to perform under the contracts. Option contracts written by the Fund do not typically give rise to significant counterparty credit risk, as options written generally obligate the Fund and not the counterparty to perform. The risk in writing a call option contract is that the Fund gives up the opportunity for profit if the market price of the security increases above the strike price and the option contract is exercised. The risk in writing a put option contract is that the Fund may incur a loss if the market price of the security decreases below the strike price and the option contract is exercised. Exercise of a written option could result in the Fund purchasing or selling a security or foreign currency when it otherwise would not, or at a price different from the current market value. In purchasing and writing options, the Fund bears the risk of an unfavorable change in the value of the underlying instrument or the risk that the Fund may not be able to enter into a closing transaction due to an illiquid market.
Interest rate swaption contracts
Interest rate swaption contracts entered into by the Fund typically represent an option that gives the purchaser the right, but not the obligation, to enter into an interest rate swap contract on a future date. Each interest rate swaption agreement will specify if the buyer is entitled to receive the fixed or floating rate if the interest rate is exercised. Changes in the value of a purchased interest rate swaption contracts are reported as unrealized appreciation or depreciation on options in the Statement of Assets and Liabilities. Gain or loss is recognized in the Statement of Operations when the interest rate swaption contract is closed or expires.
When the Fund writes an interest rate swaption contract, the premium received is recorded as an asset and an amount equivalent to the premium is recorded as a liability in the Statement of Assets and Liabilities and is subsequently adjusted to reflect the current fair value of the interest rate swaption contract written. Premiums received from writing interest rate swaption contracts that expire unexercised are recorded by the Fund on the expiration date as realized gains from options written in the Statement of Operations. The difference between the premium and the amount paid on effecting a closing purchase transaction, including brokerage commissions, is also recorded as realized gain, or if the premium is less than the amount paid for the closing purchase, as realized loss. These amounts are reflected as net realized gain (loss) on options written in the Statement of Operations.
Effects of derivative transactions in the financial statements
The following tables are intended to provide additional information about the effect of derivatives on the financial statements of the Fund, including: the fair value of derivatives by risk category and the location of those fair values in the Statement of Assets and Liabilities; and the impact of derivative transactions over the period in the Statement of Operations, including realized and unrealized gains (losses). The derivative instrument schedules following the Portfolio of Investments present additional information regarding derivative instruments outstanding at the end of the period, if any.
The following table is a summary of the fair value of derivative instruments (not considered to be hedging instruments for accounting disclosure purposes) at April 30, 2019:
| | Asset derivatives | |
Risk exposure
category | Statement
of assets and liabilities
location | Fair value ($) |
| Interest rate risk | Component of total distributable earnings (loss) — unrealized appreciation on futures contracts | 1,025,764* |
| Interest rate risk | Investments, at value — Options purchased | 71,343 |
| Total | | 1,097,107 |
| 34 | Columbia Bond Fund | Annual Report 2019 |
Notes to Financial Statements (continued)
April 30, 2019
| | Liability derivatives | |
Risk exposure
category | Statement
of assets and liabilities
location | Fair value ($) |
| Interest rate risk | Component of total distributable earnings (loss) — unrealized depreciation on futures contracts | 444,353* |
| Interest rate risk | Options contracts written, at value | 79,077 |
| Total | | 523,430 |
| * | Includes cumulative appreciation (depreciation) as reported in the tables following the Portfolio of Investments. Only the current day’s variation margin is reported in receivables or payables in the Statement of Assets and Liabilities. |
The following table indicates the effect of derivative instruments (not considered to be hedging instruments for accounting disclosure purposes) in the Statement of Operations for the year ended April 30, 2019:
| Amount of realized gain (loss) on derivatives recognized in income |
| Risk exposure category | Futures
contracts
($) | Options
contracts
written
($) | Total
($) |
| Interest rate risk | 326,010 | (43,875) | 282,135 |
| Change in unrealized appreciation (depreciation) on derivatives recognized in income |
| Risk exposure category | Futures
contracts
($) | Options
contracts
written
($) | Options
contracts
purchased
($) | Total
($) |
| Interest rate risk | 538,616 | (10,827) | 18,843 | 546,632 |
The following table is a summary of the average outstanding volume by derivative instrument for the year ended April 30, 2019:
| Derivative instrument | Average notional
amounts ($)* |
| Futures contracts — long | 107,977,923 |
| Futures contracts — short | 32,213,792 |
| Derivative instrument | Average
value ($)* |
| Options contracts — purchased | 34,628 |
| Options contracts — written | (162,710) |
| * | Based on the ending quarterly outstanding amounts for the year ended April 30, 2019. |
Asset- and mortgage-backed securities
The Fund may invest in asset-backed and mortgage-backed securities. The maturity dates shown represent the original maturity of the underlying obligation. Actual maturity may vary based upon prepayment activity on these obligations. All, or a portion, of the obligation may be prepaid at any time because the underlying asset may be prepaid. As a result, decreasing market interest rates could result in an increased level of prepayment. An increased prepayment rate will have the effect of shortening the maturity of the security. Unless otherwise noted, the coupon rates presented are fixed rates.
Delayed delivery securities
The Fund may trade securities on other than normal settlement terms, including securities purchased or sold on a “when-issued” or "forward commitment" basis. This may increase risk to the Fund since the other party to the transaction may fail to deliver, which could cause the Fund to subsequently invest at less advantageous prices. The Fund designates cash or liquid securities in an amount equal to the delayed delivery commitment.
Columbia Bond Fund | Annual Report 2019
| 35 |
Notes to Financial Statements (continued)
April 30, 2019
To be announced securities
The Fund may trade securities on a To Be Announced (TBA) basis. As with other delayed-delivery transactions, a seller agrees to issue a TBA security at a future date. However, the seller does not specify the particular securities to be delivered. Instead, the Fund agrees to accept any security that meets specified terms.
In some cases, Master Securities Forward Transaction Agreements (MSFTAs) may be used to govern transactions of certain forward-settling agency mortgage-backed securities, such as delayed-delivery and TBAs, between the Fund and counterparty. The MSFTA maintains provisions for, among other things, initiation and confirmation, payment and transfer, events of default, termination, and maintenance of collateral relating to such transactions.
Mortgage dollar roll transactions
The Fund may enter into mortgage “dollar rolls” in which the Fund sells securities for delivery in the current month and simultaneously contracts with the same counterparty to repurchase similar but not identical securities (same type, coupon and maturity) on a specified future date. During the roll period, the Fund loses the right to receive principal and interest paid on the securities sold. However, the Fund will benefit because it receives negotiated amounts in the form of reductions of the purchase price for the future purchase plus the interest earned on the cash proceeds of the securities sold until the settlement date of the forward purchase. The Fund records the incremental difference between the forward purchase and sale of each forward roll as a realized gain or loss. Unless any realized gains exceed the income, capital appreciation, and gain or loss due to mortgage prepayments that would have been realized on the securities sold as part of the mortgage dollar roll, the use of this technique will diminish the investment performance of the Fund compared to what the performance would have been without the use of mortgage dollar rolls. All cash proceeds will be invested in instruments that are permissible investments for the Fund. The Fund identifies cash or liquid securities in an amount equal to the forward purchase price.
For financial reporting and tax purposes, the Fund treats “to be announced” mortgage dollar rolls as two separate transactions, one involving the purchase of a security and a separate transaction involving a sale. These transactions may increase the Fund’s portfolio turnover rate. The Fund does not currently enter into mortgage dollar rolls that are accounted for as financing transactions.
Mortgage dollar rolls involve the risk that the market value of the securities the Fund is obligated to repurchase may decline below the repurchase price, or that the counterparty may default on its obligations.
Interest only and principal only securities
The Fund may invest in Interest Only (IO) or Principal Only (PO) securities. IOs are stripped securities entitled to receive all of the security’s interest, but none of its principal. IOs are particularly sensitive to changes in interest rates and therefore subject to greater fluctuations in price than typical interest bearing debt securities. IOs are also subject to credit risk because the Fund may not receive all or part of the interest payments if the issuer, obligor, guarantor or counterparty defaults on its obligation. Payments received for IOs are included in interest income on the Statement of Operations. Because no principal will be received at the maturity of an IO, adjustments are made to the cost of the security on a monthly basis until maturity. These adjustments are included in interest income on the Statement of Operations. POs are stripped securities entitled to receive the principal from the underlying obligation, but not the interest. POs are particularly sensitive to changes in interest rates and therefore are subject to fluctuations in price. POs are also subject to credit risk because the Fund may not receive all or part of its principal if the issuer, obligor, guarantor or counterparty defaults on its obligation. The Fund may also invest in IO or PO stripped mortgage-backed securities. Payments received for POs are treated as reductions to the cost and par value of the securities.
| 36 | Columbia Bond Fund | Annual Report 2019 |
Notes to Financial Statements (continued)
April 30, 2019
Offsetting of assets and liabilities
The following table presents the Fund’s gross and net amount of assets and liabilities available for offset under netting arrangements as well as any related collateral received or pledged by the Fund as of April 30, 2019:
| | Citi ($) |
| Assets | |
| Options purchased calls | 71,343 |
| Liabilities | |
| Options contracts written | 79,077 |
| Total financial and derivative net assets | (7,734) |
| Total collateral received (pledged)(a) | - |
| Net amount(b) | (7,734) |
| (a) | In some instances, the actual collateral received and/or pledged may be more than the amount shown due to overcollateralization. |
| (b) | Represents the net amount due from/(to) counterparties in the event of default. |
Security transactions
Security transactions are accounted for on the trade date. Cost is determined and gains (losses) are based upon the specific identification method for both financial statement and federal income tax purposes.
Income recognition
Interest income is recorded on an accrual basis. Market premiums and discounts, including original issue discounts, are amortized and accreted, respectively, over the expected life of the security on all debt securities, unless otherwise noted. The Fund classifies gains and losses realized on prepayments received on mortgage-backed securities as adjustments to interest income.
The Fund may place a debt security on non-accrual status and reduce related interest income when it becomes probable that the interest will not be collected and the amount of uncollectible interest can be reasonably estimated. A defaulted debt security is removed from non-accrual status when the issuer resumes interest payments or when collectibility of interest is reasonably assured.
Corporate actions and dividend income are recorded on the ex-dividend date.
The Fund may receive distributions from holdings in equity securities, business development companies (BDCs), exchange-traded funds (ETFs), limited partnerships (LPs), other regulated investment companies (RICs), and real estate investment trusts (REITs), which report information on the tax character of their distributions annually. These distributions are allocated to dividend income, capital gain and return of capital based on actual information reported. Return of capital is recorded as a reduction of the cost basis of securities held. If the Fund no longer owns the applicable securities, return of capital is recorded as a realized gain. With respect to REITs, to the extent actual information has not yet been reported, estimates for return of capital are made by the Fund’s management. Management’s estimates are subsequently adjusted when the actual character of the distributions is disclosed by the REITs, which could result in a proportionate change in return of capital to shareholders.
Awards from class action litigation are recorded as a reduction of cost basis if the Fund still owns the applicable securities on the payment date. If the Fund no longer owns the applicable securities, the proceeds are recorded as realized gains.
Expenses
General expenses of the Trust are allocated to the Fund and other funds of the Trust based upon relative net assets or other expense allocation methodologies determined by the nature of the expense. Expenses directly attributable to the Fund are charged to the Fund. Expenses directly attributable to a specific class of shares are charged to that share class.
Columbia Bond Fund | Annual Report 2019
| 37 |
Notes to Financial Statements (continued)
April 30, 2019
Determination of class net asset value
All income, expenses (other than class-specific expenses, which are charged to that share class, as shown in the Statement of Operations) and realized and unrealized gains (losses) are allocated to each class of the Fund on a daily basis, based on the relative net assets of each class, for purposes of determining the net asset value of each class.
Federal income tax status
The Fund intends to qualify each year as a regulated investment company under Subchapter M of the Internal Revenue Code, as amended, and will distribute substantially all of its investment company taxable income and net capital gain, if any, for its tax year, and as such will not be subject to federal income taxes. In addition, the Fund intends to distribute in each calendar year substantially all of its ordinary income, capital gain net income and certain other amounts, if any, such that the Fund should not be subject to federal excise tax. Therefore, no federal income or excise tax provision is recorded.
Foreign taxes
The Fund may be subject to foreign taxes on income, gains on investments or currency repatriation, a portion of which may be recoverable. The Fund will accrue such taxes and recoveries, as applicable, based upon its current interpretation of tax rules and regulations that exist in the markets in which it invests.
Realized gains in certain countries may be subject to foreign taxes at the Fund level, based on statutory rates. The Fund accrues for such foreign taxes on realized and unrealized gains at the appropriate rate for each jurisdiction, as applicable. The amount, if any, is disclosed as a liability on the Statement of Assets and Liabilities.
Distributions to shareholders
Distributions from net investment income, if any, are declared daily and paid monthly. Net realized capital gains, if any, are distributed at least annually. Income distributions and capital gain distributions are determined in accordance with federal income tax regulations, which may differ from GAAP.
Guarantees and indemnifications
Under the Trust’s organizational documents and, in some cases, by contract, its officers and trustees are indemnified against certain liabilities arising out of the performance of their duties to the Trust or its funds. In addition, certain of the Fund’s contracts with its service providers contain general indemnification clauses. The Fund’s maximum exposure under these arrangements is unknown since the amount of any future claims that may be made against the Fund cannot be determined, and the Fund has no historical basis for predicting the likelihood of any such claims.
Recent accounting pronouncements
Accounting Standards Update 2017-08 Premium Amortization on Purchased Callable Debt Securities
In March 2017, the Financial Accounting Standards Board issued Accounting Standards Update (ASU) No. 2017-08 Premium Amortization on Purchased Callable Debt Securities. ASU No. 2017-08 updates the accounting standards to shorten the amortization period for certain purchased callable debt securities, held at a premium, to be amortized to the earliest call date. The update applies to securities with explicit, noncontingent call features that are callable at fixed prices and on preset dates. The standard is effective for annual periods beginning after December 15, 2018 and interim periods within those fiscal years. Management does not expect the implementation of this guidance to have a material impact on the financial statement amounts and footnote disclosures.
Accounting Standards Update 2018-13 Disclosure Framework - Changes to the Disclosure Requirements for Fair Value Measurement
In August 2018, the Financial Accounting Standards Board issued Accounting Standards Update (ASU) No. 2018-13 Disclosure Framework - Changes to the Disclosure Requirements for Fair Value Measurement. ASU No. 2018-13, in addition to other modifications and additions, removes the requirement to disclose the amount and reasons for transfers between
| 38 | Columbia Bond Fund | Annual Report 2019 |
Notes to Financial Statements (continued)
April 30, 2019
Level 1 and Level 2 of the fair value hierarchy and the policy for the timing of transfers between levels. The standard is effective for annual periods beginning after December 15, 2019 and interim periods within those fiscal years. At this time, management is evaluating the implication of this guidance and the impact it will have on the financial statement disclosures, if any.
Disclosure Update and Simplification
In September 2018, the Securities and Exchange Commission (SEC) released Final Rule 33-10532, Disclosure Update and Simplification, which amends certain financial statement disclosure requirements that the SEC determined to be redundant, outdated, or superseded in light of other SEC disclosure requirements, GAAP, or changes in the information environment. As a result of the amendments, management implemented disclosure changes which included removing the components of distributable earnings presented on the Statement of Assets and Liabilities and combining income and gain distributions paid to shareholders as presented on the Statement of Changes in Net Assets. Any values presented to meet prior year requirements were left unchanged. The amendments had no effect on the Fund’s net assets or results of operation.
Note 3. Fees and other transactions with affiliates
Management services fees
The Fund has entered into a Management Agreement with Columbia Management Investment Advisers, LLC (the Investment Manager), a wholly-owned subsidiary of Ameriprise Financial, Inc. (Ameriprise Financial). Under the Management Agreement, the Investment Manager provides the Fund with investment research and advice, as well as administrative and accounting services. The management services fee is an annual fee that is equal to a percentage of the Fund’s daily net assets that declines from 0.50% to 0.34% as the Fund’s net assets increase. The effective management services fee rate for the year ended April 30, 2019 was 0.50% of the Fund’s average daily net assets.
Compensation of board members
Members of the Board of Trustees who are not officers or employees of the Investment Manager or Ameriprise Financial are compensated for their services to the Fund as disclosed in the Statement of Operations. These members of the Board of Trustees may participate in a Deferred Compensation Plan (the Deferred Plan) which may be terminated at any time. Obligations of the Deferred Plan will be paid solely out of the Fund’s assets, and all amounts payable under the Deferred Plan constitute a general unsecured obligation of the Fund.
Compensation of Chief Compliance Officer
The Board of Trustees has appointed a Chief Compliance Officer to the Fund in accordance with federal securities regulations. As disclosed in the Statement of Operations, a portion of the Chief Compliance Officer’s total compensation is allocated to the Fund, along with other allocations to affiliated registered investment companies managed by the Investment Manager and its affiliates, based on relative net assets.
Transfer agency fees
Under a Transfer and Dividend Disbursing Agent Agreement, Columbia Management Investment Services Corp. (the Transfer Agent), an affiliate of the Investment Manager and a wholly-owned subsidiary of Ameriprise Financial, is responsible for providing transfer agency services to the Fund. The Transfer Agent has contracted with DST Asset Manager Solutions, Inc. (DST) to serve as sub-transfer agent. The Transfer Agent pays the fees of DST for services as sub-transfer agent and DST is not entitled to reimbursement for such fees from the Fund (with the exception of out-of-pocket fees).
The Fund pays the Transfer Agent a monthly transfer agency fee based on the number or the average value of accounts, depending on the type of account. In addition, the Fund pays the Transfer Agent a fee for shareholder services based on the number of accounts or on a percentage of the average aggregate value of the Fund’s shares maintained in omnibus accounts up to the lesser of the amount charged by the financial intermediary or a cap established by the Board of Trustees from time to time.
Columbia Bond Fund | Annual Report 2019
| 39 |
Notes to Financial Statements (continued)
April 30, 2019
The Transfer Agent also receives compensation from the Fund for various shareholder services and reimbursements for certain out-of-pocket fees. Total transfer agency fees for Institutional 2 Class and Institutional 3 Class shares are subject to an annual limitation of not more than 0.07% and 0.02%, respectively, of the average daily net assets attributable to each share class.
For the year ended April 30, 2019, the Fund’s effective transfer agency fee rates as a percentage of average daily net assets of each class were as follows:
| | Effective rate (%) |
| Class A | 0.18 |
| Advisor Class | 0.18 |
| Class C | 0.18 |
| Institutional Class | 0.18 |
| Institutional 2 Class | 0.07 |
| Institutional 3 Class | 0.01 |
| Class R | 0.18 |
| Class T | 0.10(a) |
| Class V | 0.18 |
An annual minimum account balance fee of $20 may apply to certain accounts with a value below the applicable share class’s initial minimum investment requirements to reduce the impact of small accounts on transfer agency fees. These minimum account balance fees are remitted to the Fund and recorded as part of expense reductions in the Statement of Operations. For the year ended April 30, 2019, these minimum account balance fees reduced total expenses of the Fund by $1,262.
Distribution and service fees
The Fund has entered into an agreement with Columbia Management Investment Distributors, Inc. (the Distributor), an affiliate of the Investment Manager and a wholly-owned subsidiary of Ameriprise Financial, for distribution and shareholder services. The Board of Trustees has approved, and the Fund has adopted, distribution and shareholder service plans (the Plans) applicable to certain share classes, which set the distribution and service fees for the Fund. These fees are calculated daily and are intended to compensate the Distributor and/or eligible selling and/or servicing agents for selling shares of the Fund and providing services to investors.
Under the Plans, the Fund pays a monthly service fee to the Distributor at the maximum annual rate of 0.25% of the average daily net assets attributable to Class A, Class C and Class T shares of the Fund. Also under the Plans, the Fund pays a monthly distribution fee to the Distributor at the maximum annual rates of 0.75%, 0.50% and 0.25% of the average daily net assets attributable to Class C, Class R and Class T shares of the Fund, respectively. As a result of all Class T shares of the Fund being redeemed or converted to Class A shares, December 14, 2018 was the last day the Fund paid a distribution and shareholder services fee for Class T shares.
Although the Fund may have paid a distribution fee up to 0.25% of the Fund’s average daily net assets attributable to Class T shares and a service fee of up to 0.25% of the Fund’s average daily net assets attributable to Class T shares, the aggregate fee shall not exceed 0.25% of the Fund’s average daily net assets attributable to Class T shares.
Shareholder services fees
The Fund has adopted a shareholder services plan that permits it to pay for certain services provided to Class V shareholders by their selling and/or servicing agents. The Fund may pay shareholder servicing fees up to an aggregate annual rate of 0.40% of the Fund’s average daily net assets attributable to Class V shares (comprised of up to 0.20% for shareholder liaison services and up to 0.20% for administrative support services). These fees are currently limited to an aggregate annual rate of not more than 0.15% of the Fund’s average daily net assets attributable to Class V shares.
| 40 | Columbia Bond Fund | Annual Report 2019 |
Notes to Financial Statements (continued)
April 30, 2019
Sales charges (unaudited)
Sales charges, including front-end charges and CDSCs, received by the Distributor for distributing Fund shares for the year ended April 30, 2019, if any, are listed below:
| | Amount ($) |
| Class A | 45,525 |
| Class C | 335 |
| Class V | 64 |
Expenses waived/reimbursed by the Investment Manager and its affiliates
The Investment Manager and certain of its affiliates have contractually agreed to waive fees and/or reimburse expenses (excluding certain fees and expenses described below) for the period(s) disclosed below, unless sooner terminated at the sole discretion of the Board of Trustees, so that the Fund’s net operating expenses, after giving effect to fees waived/expenses reimbursed and any balance credits and/or overdraft charges from the Fund’s custodian, do not exceed the following annual rate(s) as a percentage of the class’ average daily net assets:
| | September 1, 2018
through
August 31, 2019 | Prior to
September 1, 2018 |
| Class A | 0.82% | 0.86% |
| Advisor Class | 0.57 | 0.61 |
| Class C | 1.57 | 1.61 |
| Institutional Class | 0.57 | 0.61 |
| Institutional 2 Class | 0.46 | 0.51 |
| Institutional 3 Class | 0.40 | 0.46 |
| Class R | 1.07 | 1.11 |
| Class V | 0.72 | 0.76 |
Under the agreement governing these fee waivers and/or expense reimbursement arrangements, the following fees and expenses are excluded from the waiver/reimbursement commitment, and therefore will be paid by the Fund, if applicable: taxes (including foreign transaction taxes), expenses associated with investments in affiliated and non-affiliated pooled investment vehicles (including mutual funds and exchange-traded funds), transaction costs and brokerage commissions, costs related to any securities lending program, dividend expenses associated with securities sold short, inverse floater program fees and expenses, transaction charges and interest on borrowed money, interest, infrequent and/or unusual expenses and any other expenses the exclusion of which is specifically approved by the Board of Trustees. This agreement may be modified or amended only with approval from the Investment Manager, certain of its affiliates and the Fund. Any fees waived and/or expenses reimbursed under the expense reimbursement arrangements described above are not recoverable by the Investment Manager or its affiliates in future periods.
Note 4. Federal tax information
The timing and character of income and capital gain distributions are determined in accordance with income tax regulations, which may differ from GAAP because of temporary or permanent book to tax differences.
At April 30, 2019, these differences were primarily due to differing treatment for deferral/reversal of wash sale losses, derivative investments, tax straddles, capital loss carryforwards, trustees’ deferred compensation, distributions, principal and/or interest from fixed income securities and foreign currency transactions. To the extent these differences were permanent, reclassifications were made among the components of the Fund’s net assets. Temporary differences do not require reclassifications.
The following reclassifications were made:
Columbia Bond Fund | Annual Report 2019
| 41 |
Notes to Financial Statements (continued)
April 30, 2019
Excess of distributions
over net investment
income ($) | Accumulated
net realized
(loss) ($) | Paid in
capital ($) |
| 21,322 | (21,322) | — |
Net investment income (loss) and net realized gains (losses), as disclosed in the Statement of Operations, and net assets were not affected by this reclassification.
The tax character of distributions paid during the years indicated was as follows:
| Year Ended April 30, 2019 | Year Ended April 30, 2018 |
Ordinary
income ($) | Long-term
capital gains ($) | Total ($) | Ordinary
income ($) | Long-term
capital gains ($) | Total ($) |
| 11,598,655 | — | 11,598,655 | 9,279,750 | 476,218 | 9,755,968 |
Short-term capital gain distributions, if any, are considered ordinary income distributions for tax purposes.
At April 30, 2019, the components of distributable earnings on a tax basis were as follows:
Undistributed
ordinary income ($) | Undistributed
long-term
capital gains ($) | Capital loss
carryforwards ($) | Net unrealized
appreciation ($) |
| 1,047,550 | — | (1,157,981) | 1,263,556 |
At April 30, 2019, the cost of all investments for federal income tax purposes along with the aggregate gross unrealized appreciation and depreciation based on that cost was:
Federal
tax cost ($) | Gross unrealized
appreciation ($) | Gross unrealized
(depreciation) ($) | Net unrealized
appreciation ($) |
| 438,395,174 | 4,016,544 | (2,752,988) | 1,263,556 |
Tax cost of investments and unrealized appreciation/(depreciation) may also include timing differences that do not constitute adjustments to tax basis.
The following capital loss carryforwards, determined at April 30, 2019, may be available to reduce taxable income arising from future net realized gains on investments, if any, to the extent permitted by the Internal Revenue Code. Capital loss carryforwards with no expiration are required to be utilized prior to any capital losses which carry an expiration date. As a result of this ordering rule, capital loss carryforwards which carry an expiration date may be more likely to expire unused. In addition, for the year ended April 30, 2019, capital loss carryforwards utilized and expired unused, if any, were as follows:
No expiration
short-term ($) | No expiration
long-term ($) | Total ($) | Utilized ($) | Expired ($) |
| — | 1,157,981 | 1,157,981 | — | — |
Management of the Fund has concluded that there are no significant uncertain tax positions in the Fund that would require recognition in the financial statements. However, management’s conclusion may be subject to review and adjustment at a later date based on factors including, but not limited to, new tax laws, regulations, and administrative interpretations (including relevant court decisions). Generally, the Fund’s federal tax returns for the prior three fiscal years remain subject to examination by the Internal Revenue Service.
Note 5. Portfolio information
The cost of purchases and proceeds from sales of securities, excluding short-term investments and derivatives, if any, aggregated to $1,038,531,938 and $1,082,400,120, respectively, for the year ended April 30, 2019, of which $837,267,798 and $860,983,537, respectively, were U.S. government securities. The amount of purchase and sale activity impacts the portfolio turnover rate reported in the Financial Highlights.
| 42 | Columbia Bond Fund | Annual Report 2019 |
Notes to Financial Statements (continued)
April 30, 2019
Note 6. Affiliated money market fund
The Fund invests in Columbia Short-Term Cash Fund, an affiliated money market fund established for the exclusive use by the Fund and other affiliated funds (the Affiliated MMF). The income earned by the Fund from such investments is included as Dividends - affiliated issuers in the Statement of Operations. As an investing fund, the Fund indirectly bears its proportionate share of the expenses of the Affiliated MMF. The Affiliated MMF prices its shares with a floating net asset value. In addition, the Board of Trustees of the Affiliated MMF may impose a fee on redemptions (sometimes referred to as a liquidity fee) or temporarily suspend redemptions (sometimes referred to as imposing a redemption gate) in the event its liquidity falls below regulatory limits.
Note 7. Interfund lending
Pursuant to an exemptive order granted by the Securities and Exchange Commission, the Fund participates in a program (the Interfund Program) allowing each participating Columbia Fund (each, a Participating Fund) to lend money directly to and, except for closed-end funds and money market funds, borrow money directly from other Participating Funds for temporary purposes. The amounts eligible for borrowing and lending under the Interfund Program are subject to certain restrictions.
Interfund loans are subject to the risk that the borrowing fund could be unable to repay the loan when due, and a delay in repayment to the lending fund could result in lost opportunities and/or additional lending costs. The exemptive order is subject to conditions intended to mitigate conflicts of interest arising from the Investment Manager’s relationship with each Participating Fund.
The Fund did not borrow or lend money under the Interfund Program during the year ended April 30, 2019.
Note 8. Line of credit
The Fund has access to a revolving credit facility with a syndicate of banks led by Citibank, N.A., HSBC Bank USA, N.A. and JPMorgan Chase Bank, N.A. whereby the Fund may borrow for the temporary funding of shareholder redemptions or for other temporary or emergency purposes. The credit facility, which is a collective agreement between the Fund and certain other funds managed by the Investment Manager or an affiliated investment manager, severally and not jointly, permits collective borrowings up to $1 billion. Interest is charged to each participating fund based on its borrowings at a rate equal to the higher of (i) the federal funds effective rate, (ii) the one-month LIBOR rate and (iii) the overnight bank funding rate, plus in each case, 1.00%. Each borrowing under the credit facility matures no later than 60 days after the date of borrowing. The Fund also pays a commitment fee equal to its pro rata share of the unused amount of the credit facility at a rate of 0.15% per annum. The commitment fee is included in other expenses in the Statement of Operations. This agreement expires annually in December unless extended or renewed.
The Fund had no borrowings during the year ended April 30, 2019.
Note 9. Significant risks
Credit risk
Credit risk is the risk that the value of debt securities in the Fund’s portfolio may decline because the issuer may default and fail to pay interest or repay principal when due. Rating agencies assign credit ratings to debt securities to indicate their credit risk. Lower rated or unrated debt securities held by the Fund may present increased credit risk as compared to higher-rated debt securities.
Interest rate risk
Interest rate risk is the risk of losses attributable to changes in interest rates. In general, if prevailing interest rates rise, the values of debt securities tend to fall, and if interest rates fall, the values of debt securities tend to rise. Actions by governments and central banking authorities can result in increases in interest rates. Increasing interest rates may negatively affect the value of debt securities held by the Fund, resulting in a negative impact on the Fund’s performance and net asset value per share. In general, the longer the maturity or duration of a debt security, the greater its sensitivity to changes in interest rates.
Columbia Bond Fund | Annual Report 2019
| 43 |
Notes to Financial Statements (continued)
April 30, 2019
Liquidity risk
Liquidity risk is the risk associated with a lack of marketability of investments which may make it difficult to sell the investment at a desirable time or price. Changing regulatory, market or other conditions or environments (for example, the interest rate or credit environments) may adversely affect the liquidity of the Fund’s investments. The Fund may have to accept a lower selling price for the holding, sell other investments, or forego another, more appealing investment opportunity. Generally, the less liquid the market at the time the Fund sells a portfolio investment, the greater the risk of loss or decline of value to the Fund. A less liquid market can lead to an increase in Fund redemptions, which may negatively impact Fund performance and net asset value per share, including, for example, if the Fund is forced to sell securities in a down market.
Mortgage- and other asset-backed securities risk
The value of any mortgage-backed and other asset-backed securities held by the Fund may be affected by, among other things, changes or perceived changes in: interest rates; factors concerning the interests in and structure of the issuer or the originator of the mortgages or other assets; the creditworthiness of the entities that provide any supporting letters of credit, surety bonds or other credit enhancements; or the market’s assessment of the quality of underlying assets. Payment of principal and interest on some mortgage-backed securities (but not the market value of the securities themselves) may be guaranteed by the full faith and credit of a particular U.S. Government agency, authority, enterprise or instrumentality, and some, but not all, are also insured or guaranteed by the U.S. Government. Mortgage-backed securities issued by non-governmental issuers (such as commercial banks, savings and loan institutions, private mortgage insurance companies, mortgage bankers and other secondary market issuers) may entail greater risk than obligations guaranteed by the U.S. Government. Mortgage- and other asset-backed securities are subject to prepayment risk, which is the possibility that the underlying mortgage or other asset may be refinanced or prepaid prior to maturity during periods of declining or low interest rates, causing the Fund to have to reinvest the money received in securities that have lower yields. Rising or high interest rates tend to extend the duration of mortgage- and other asset-backed securities, making their prices more volatile and more sensitive to changes in interest rates.
Shareholder concentration risk
At April 30, 2019, one unaffiliated shareholder of record owned 73.4% of the outstanding shares of the Fund in one or more accounts. The Fund has no knowledge about whether any portion of those shares was owned beneficially. Subscription and redemption activity by concentrated accounts may have a significant effect on the operations of the Fund. In the case of a large redemption, the Fund may be forced to sell investments at inopportune times, including its liquid positions, which may result in Fund losses and the Fund holding a higher percentage of less liquid positions. Large redemptions could result in decreased economies of scale and increased operating expenses for non-redeeming Fund shareholders.
Note 10. Subsequent events
Management has evaluated the events and transactions that have occurred through the date the financial statements were issued and noted no items requiring adjustment of the financial statements or additional disclosure.
Note 11. Information regarding pending and settled legal proceedings
Ameriprise Financial and certain of its affiliates have historically been involved in a number of legal, arbitration and regulatory proceedings, including routine litigation, class actions, and governmental actions, concerning matters arising in connection with the conduct of their business activities. Ameriprise Financial believes that the Fund is not currently the subject of, and that neither Ameriprise Financial nor any of its affiliates are the subject of, any pending legal, arbitration or regulatory proceedings that are likely to have a material adverse effect on the Fund or the ability of Ameriprise Financial or its affiliates to perform under their contracts with the Fund. Ameriprise Financial is required to make quarterly (10-Q), annual (10-K) and, as necessary, 8-K filings with the Securities and Exchange Commission (SEC) on legal and regulatory matters that relate to Ameriprise Financial and its affiliates. Copies of these filings may be obtained by accessing the SEC website at www.sec.gov.
There can be no assurance that these matters, or the adverse publicity associated with them, will not result in increased Fund redemptions, reduced sale of Fund shares or other adverse consequences to the Fund. Further, although we believe proceedings are not likely to have a material adverse effect on the Fund or the ability of Ameriprise Financial or its affiliates to perform under their contracts with the Fund, these proceedings are subject to uncertainties and, as such, we are unable to
| 44 | Columbia Bond Fund | Annual Report 2019 |
Notes to Financial Statements (continued)
April 30, 2019
estimate the possible loss or range of loss that may result. An adverse outcome in one or more of these proceedings could result in adverse judgments, settlements, fines, penalties or other relief that could have a material adverse effect on the consolidated financial condition or results of operations of Ameriprise Financial.
Columbia Bond Fund | Annual Report 2019
| 45 |
Report of Independent Registered Public Accounting Firm
To the Board of Trustees of Columbia Funds Series Trust I and Shareholders of Columbia Bond Fund
Opinion on the Financial Statements
We have audited the accompanying statement of assets and liabilities, including the portfolio of investments, of Columbia Bond Fund (one of the funds constituting Columbia Funds Series Trust I, referred to hereafter as the "Fund") as of April 30, 2019, the related statement of operations for the year ended April 30, 2019, the statement of changes in net assets for each of the two years in the period ended April 30, 2019, including the related notes, and the financial highlights for each of the five years in the period ended April 30, 2019 (collectively referred to as the “financial statements”). In our opinion, the financial statements present fairly, in all material respects, the financial position of the Fund as of April 30, 2019, the results of its operations for the year then ended, the changes in its net assets for each of the two years in the period ended April 30, 2019 and the financial highlights for each of the five years in the period ended April 30, 2019 in conformity with accounting principles generally accepted in the United States of America.
Basis for Opinion
These financial statements are the responsibility of the Fund’s management. Our responsibility is to express an opinion on the Fund’s financial statements based on our audits. We are a public accounting firm registered with the Public Company Accounting Oversight Board (United States) (PCAOB) and are required to be independent with respect to the Fund in accordance with the U.S. federal securities laws and the applicable rules and regulations of the Securities and Exchange Commission and the PCAOB.
We conducted our audits of these financial statements in accordance with the standards of the PCAOB. Those standards require that we plan and perform the audit to obtain reasonable assurance about whether the financial statements are free of material misstatement, whether due to error or fraud.
Our audits included performing procedures to assess the risks of material misstatement of the financial statements, whether due to error or fraud, and performing procedures that respond to those risks. Such procedures included examining, on a test basis, evidence regarding the amounts and disclosures in the financial statements. Our audits also included evaluating the accounting principles used and significant estimates made by management, as well as evaluating the overall presentation of the financial statements. Our procedures included confirmation of securities owned as of April 30, 2019 by correspondence with the custodian, transfer agent and brokers; when replies were not received from brokers, we performed other auditing procedures. We believe that our audits provide a reasonable basis for our opinion.
/s/PricewaterhouseCoopers LLP
Minneapolis, Minnesota
June 21, 2019
We have served as the auditor of one or more investment companies within the Columbia Funds Complex since 1977.
| 46 | Columbia Bond Fund | Annual Report 2019 |
The Board oversees the Fund’s operations and appoints officers who are responsible for day-to-day business decisions based on policies set by the Board. The following table provides basic biographical information about the Fund’s Trustees as of the printing of this report, including their principal occupations during the past five years, although specific titles for individuals may have varied over the period. The year set forth beneath Length of Service in the table below is the year in which the Trustee was first appointed or elected as Trustee to any Fund currently in the Columbia Funds Complex or a predecessor thereof. Under current Board policy, members serve terms of indefinite duration.
Independent trustees
| Name, address, year of birth | Position held with the Trust and length of service | Principal occupation(s) during the past five years and other relevant professional experience | Number of Funds in the Columbia Fund Complex overseen | Other directorships held by Trustee during the past five years |
Janet Langford Carrig
c/o Columbia Management
Investment Advisers, LLC
225 Franklin Street
Mail Drop BX32 05228
Boston, MA 02110
1957 | Trustee
1996 | Senior Vice President, General Counsel and Corporate Secretary, ConocoPhillips (independent energy company) from September 2007 to October 2018 | 69 | None |
Douglas A. Hacker
c/o Columbia Management
Investment Advisers, LLC
225 Franklin Street
Mail Drop BX32 05228
Boston, MA 02110
1955 | Trustee and Chairman of the Board
1996 | Independent business executive since May 2006; Executive Vice President — Strategy of United Airlines from December 2002 to May 2006; President of UAL Loyalty Services (airline marketing company) from September 2001 to December 2002; Executive Vice President and Chief Financial Officer of United Airlines from July 1999 to September 2001 | 69 | Spartan Nash Company, (food distributor); Nash Finch Company (food distributor) from 2005 to 2013; Aircastle Limited (aircraft leasing); SeaCube Container Leasing Ltd. (container leasing) from 2010 to 2013; and Travelport Worldwide Limited (travel information technology) |
Nancy T. Lukitsh
c/o Columbia Management
Investment Advisers, LLC
225 Franklin Street
Mail Drop BX32 05228
Boston, MA 02110
1956 | Trustee
2011 | Senior Vice President, Partner and Director of Marketing, Wellington Management Company, LLP (investment adviser) from 1997 to 2010; Chair, Wellington Management Portfolios (commingled non-U.S. investment pools) from 2007 to 2010; Director, Wellington Trust Company, NA and other Wellington affiliates from 1997 to 2010 | 69 | None |
David M. Moffett
c/o Columbia Management
Investment Advisers, LLC
225 Franklin Street
Mail Drop BX32 05228
Boston, MA 02110
1952 | Trustee
2011 | Retired. Consultant to Bridgewater and Associates | 69 | Director, CSX Corporation (transportation suppliers); Genworth Financial, Inc. (financial and insurance products and services); PayPal Holdings Inc. (payment and data processing services); Trustee, University of Oklahoma Foundation; former Director, eBay Inc. (online trading community), 2007-2015; and former Director, CIT Bank, CIT Group Inc. (commercial and consumer finance), 2010-2016 |
Columbia Bond Fund | Annual Report 2019
| 47 |
TRUSTEES AND OFFICERS (continued)
Independent trustees (continued)
| Name, address, year of birth | Position held with the Trust and length of service | Principal occupation(s) during the past five years and other relevant professional experience | Number of Funds in the Columbia Fund Complex overseen | Other directorships held by Trustee during the past five years |
John J. Neuhauser
c/o Columbia Management
Investment Advisers, LLC
225 Franklin Street
Mail Drop BX32 05228
Boston, MA 02110
1943 | Trustee
1984 | President, Saint Michael’s College from August 2007 to June 2018; Director or Trustee of several non-profit organizations, including University of Vermont Medical Center; Academic Vice President and Dean of Faculties, Boston College from August 1999 to October 2005; University Professor, Boston College from November 2005 to August 2007 | 69 | Liberty All-Star Equity Fund and Liberty All- Star Growth Fund (closed-end funds) |
Patrick J. Simpson
c/o Columbia Management
Investment Advisers, LLC
225 Franklin Street
Mail Drop BX32 05228
Boston, MA 02110
1944 | Trustee
2000 | Of Counsel, Perkins Coie LLP (law firm) since 2015; Partner, Perkins Coie LLP from 1988 to 2014 | 69 | M Fund, Inc. (M Funds mutual fund family) |
Anne-Lee Verville
c/o Columbia Management
Investment Advisers, LLC
225 Franklin Street
Mail Drop BX32 05228
Boston, MA 02110
1945 | Trustee
1998 | Retired. General Manager, Global Education Industry from 1994 to 1997, President – Application Systems Division from 1991 to 1994, Chief Financial Officer – US Marketing & Services from 1988 to 1991, and Chief Information Officer from 1987 to 1988, IBM Corporation (computer and technology) | 69 | Enesco Group, Inc. (producer of giftware and home and garden decor products) from 2001 to 2006 |
Consultants to the Independent Trustees*
| Name, address, year of birth | Position held with the Trust and length of service | Principal occupation(s) during the past five years and other relevant professional experience | Number of Funds in the Columbia Funds complex overseen | Other directorships held by Trustee during the past five years |
J. Kevin Connaughton
c/o Columbia
Management Investment
Advisers, LLC,
225 Franklin Street
Mail Drop BX32 05228,
Boston, MA 02110
1964 | Independent Trustee Consultant
2016 | Independent Trustee Consultant, Columbia Funds since March 2016; Adjunct Professor of Finance, Bentley University since November 2017; Managing Director and General Manager of Mutual Fund Products, Columbia Management Investment Advisers, LLC from May 2010 to February 2015; President, Columbia Funds from 2009 to 2015; and senior officer of Columbia Funds and affiliated funds from 2003 to 2015 | 69 | Director, The Autism Project since March 2015; former Trustee, New Century Portfolios, March 2015-December 2017; formerly on Board of Governors, Gateway Healthcare, January 2016 – December 2017 |
| 48 | Columbia Bond Fund | Annual Report 2019 |
TRUSTEES AND OFFICERS (continued)
Consultants to the Independent Trustees* (continued)
| Name, address, year of birth | Position held with the Trust and length of service | Principal occupation(s) during the past five years and other relevant professional experience | Number of Funds in the Columbia Funds complex overseen | Other directorships held by Trustee during the past five years |
Olive Darragh
c/o Columbia
Management Investment
Advisers, LLC,
225 Franklin Street,
Mail Drop BX32 05228,
Boston, MA 02110
1962 | Independent Trustee Consultant 2019 | Independent Trustee Consultant, Columbia Funds since June 2019; Managing Director of Darragh Inc. (a strategy and talent management consulting firm) since 2010; Founder and CEO, Zolio (an investment management talent identification platform) since 2004; Partner, Tudor Investments from 2004 to 2010; Senior Partner, McKinsey & Company from 2001 to 2004 | 69 | Director, University of Edinburgh Business School; former Director, Boston Public Library Foundation |
Natalie A. Trunow
c/o Columbia
Management Investment
Advisers, LLC,
225 Franklin Street
Mail Drop BX32 05228,
Boston, MA 02110
1967 | Independent Trustee Consultant
2016 | Independent Trustee Consultant, Columbia Funds since September 2016; Chief Executive Officer, Millennial Portfolio Solutions LLC (asset management and consulting services) since January 2016; Director of Investments, Casey Family Programs from April 2016 to September 2016; Senior Vice President and Chief Investment Officer, Calvert Investments from August 2008 to January 2016; Section Head and Portfolio Manager, General Motors Asset Management from June 1997 to August 2008 | 69 | Director, Health Services for Children with Special Needs, Inc.; Director, Guidewell Financial Solutions |
| * | J. Kevin Connaughton was appointed consultant to the Independent Trustees effective March 1, 2016. Olive Darragh was appointed consultant to the Independent Trustees effective June 10, 2019. Natalie A. Trunow was appointed consultant to the Independent Trustees effective September 1, 2016. Shareholders of the Funds are expected to be asked to elect each of Mr. Connaughton, Ms. Darragh and Ms. Trunow as a Trustee at a future shareholder meeting. |
Interested trustee affiliated with Investment Manager*
| Name, address, year of birth | Position held with the Trust and length of service | Principal occupation(s) during the past five years and other relevant professional experience | Number of Funds in the Columbia Funds Complex overseen | Other directorships held by Trustee during the past five years |
William F. Truscott
c/o Columbia Management
Investment Advisers, LLC
225 Franklin Street
Boston, MA 02110
1960 | Trustee
2012 | Chairman of the Board and President, Columbia Management Investment Advisers, LLC since May 2010 and February 2012, respectively; Chief Executive Officer, Global Asset Management, Ameriprise Financial, Inc. since September 2012 (previously Chief Executive Officer, U.S. Asset Management & President, Annuities, May 2010-September 2012); Director and Chief Executive Officer, Columbia Management Investment Distributors, Inc. since May 2010 and February 2012, respectively; Chairman of the Board and Chief Executive Officer, RiverSource Distributors, Inc. since 2006; Director, Threadneedle Asset Management Holdings, SARL since 2014; President and Chief Executive Officer, Ameriprise Certificate Company, 2006-August 2012 | 188 | Chairman of the Board, Columbia Management Investment Advisers, LLC since May 2010; Director, Columbia Management Investment Distributors, Inc. since May 2010; former Director, Ameriprise Certificate Company, 2006 - January 2013 |
| * | Interested person (as defined under the 1940 Act) by reason of being an officer, director, security holder and/or employee of the Investment Manager or Ameriprise Financial. |
The Statement of Additional Information has additional information about the Fund’s Board members and is available, without charge, upon request by calling 800.345.6611, visiting columbiathreadneedleus.com/investor/ or contacting your financial intermediary.
Columbia Bond Fund | Annual Report 2019
| 49 |
TRUSTEES AND OFFICERS (continued)
The Board has appointed officers who are responsible for day-to-day business decisions based on policies it has established. The officers serve at the pleasure of the Board. The following table provides basic information about the Officers of the Fund, including principal occupations during the past five years, although their specific titles may have varied over the period. In addition to Mr. Truscott, who is Senior Vice President, the Fund’s other officers are:
Fund officers
Name,
address and
year of birth | Position and year
first appointed to
position for any Fund
in the Columbia
Funds complex or a
predecessor thereof | Principal occupation(s) during past five years |
Christopher O. Petersen
5228 Ameriprise
Financial Center
Minneapolis, MN 55474
Born 1970 | President and Principal Executive Officer (2015) | Vice President and Lead Chief Counsel, Ameriprise Financial, Inc. since January 2015 (previously Vice President and Chief Counsel, January 2010 - December 2014; officer of Columbia Funds and affiliated funds since 2007. |
Michael G. Clarke
225 Franklin Street
Boston, MA 02110
Born 1969 | Chief Financial Officer (Principal Financial Officer) (2009) and Senior Vice President (2019) | Vice President, Head of North American Operations, and Co-Head of Global Operations, Columbia Management Investment Advisers, LLC, since June 2019 (previously Vice President – Accounting and Tax, May 2010 - May 2019); senior officer of Columbia Funds and affiliated funds since 2002 (previously Treasurer and Chief Accounting Officer, January 2009 - January 2019 and December 2015 - January 2019, respectively). |
Joseph Beranek
5890 Ameriprise
Financial Center
Minneapolis, MN 55474
Born 1965 | Treasurer and Chief Accounting Officer (Principal Accounting Officer) (2019) | Vice President — Mutual Fund Accounting and Financial Reporting, Columbia Management Investment Advisers, LLC, since December 2018 and March 2017, respectively (previously Vice President — Pricing and Corporate Actions, May 2010 - March 2017). |
Paul B. Goucher
485 Lexington Avenue
New York, NY 10017
Born 1968 | Senior Vice President (2011) and Assistant Secretary (2008) | Senior Vice President and Assistant General Counsel, Ameriprise Financial, Inc. since January 2017 (previously Vice President and Lead Chief Counsel, November 2008 - January 2017 and January 2013 - January 2017, respectively); Vice President, Chief Legal Officer and Assistant Secretary, Columbia Management Investment Advisers, LLC since March 2015 (previously Vice President and Assistant Secretary, May 2010 – March 2015). |
Thomas P. McGuire
225 Franklin Street
Boston, MA 02110
Born 1972 | Senior Vice President and Chief Compliance Officer (2012) | Vice President — Asset Management Compliance, Ameriprise Financial, Inc., since May 2010; Chief Compliance Officer, Ameriprise Certificate Company since September 2010. |
Colin Moore
225 Franklin Street
Boston, MA 02110
Born 1958 | Senior Vice President (2010) | Executive Vice President and Global Chief Investment Officer, Ameriprise Financial, Inc., since July 2013; Executive Vice President and Global Chief Investment Officer, Columbia Management Investment Advisers, LLC since July 2013. |
Ryan C. Larrenaga
225 Franklin Street
Boston, MA 02110
Born 1970 | Senior Vice President (2017), Chief Legal Officer (2017), and Secretary (2015) | Vice President and Chief Counsel, Ameriprise Financial, Inc. since August 2018 (previously Vice President and Group Counsel, August 2011 - August 2018); officer of Columbia Funds and affiliated funds since 2005. |
Michael E. DeFao
225 Franklin Street
Boston, MA 02110
Born 1968 | Vice President (2011) and Assistant Secretary (2010) | Vice President and Chief Counsel, Ameriprise Financial, Inc. since May 2010. |
Lyn Kephart-Strong
5228 Ameriprise
Financial Center
Minneapolis, MN 55474
Born 1960 | Vice President (2015) | President, Columbia Management Investment Services Corp. since October 2014; Vice President & Resolution Officer, Ameriprise Trust Company since August 2009. |
| 50 | Columbia Bond Fund | Annual Report 2019 |
The Fund mails one shareholder report to each shareholder address, unless such shareholder elected to receive shareholder reports from the Fund electronically. If you would like more than one report, please call shareholder services at 800.345.6611 and additional reports will be sent to you.
Proxy voting policies and procedures
The policy of the Board of Trustees is to vote the proxies of the companies in which the Fund holds investments consistent with the procedures as stated in the Statement of Additional Information (SAI). You may obtain a copy of the SAI without charge by calling 800.345.6611; contacting your financial intermediary; visiting columbiathreadneedleus.com/investor/; or searching the website of the Securities and Exchange Commission (SEC) at sec.gov. Information regarding how the Fund voted proxies relating to portfolio securities is filed with the SEC by August 31st for the most recent 12-month period ending June 30th of that year, and is available without charge by visiting columbiathreadneedleus.com/investor/, or searching the website of the SEC at sec.gov.
Quarterly schedule of investments
The Fund files a complete schedule of portfolio holdings with the SEC for the first and third quarters of each fiscal year on Form N-Q or Form N-PORT (available for filings after March 31, 2019). The Fund’s Form N-Q or Form N-PORT is available on the SEC’s website at sec.gov. The Fund’s complete schedule of portfolio holdings, as filed on Form N-Q or Form N-PORT, can also be obtained without charge, upon request, by calling 800.345.6611.
Additional Fund information
For more information about the Fund, please visit columbiathreadneedleus.com/investor/ or call 800.345.6611. Customer Service Representatives are available to answer your questions Monday through Friday from 8 a.m. to 7 p.m. Eastern time.
Fund investment manager
Columbia Management Investment Advisers, LLC
225 Franklin Street
Boston, MA 02110
Fund distributor
Columbia Management Investment Distributors, Inc.
225 Franklin Street
Boston, MA 02110
Fund transfer agent
Columbia Management Investment Services Corp.
P.O. Box 219104
Kansas City, MO 64121-9104
Columbia Bond Fund | Annual Report 2019
| 51 |
Columbia Bond Fund
P.O. Box 219104
Kansas City, MO 64121-9104
Please read and consider the investment objectives, risks, charges and expenses for any fund carefully before investing. For a prospectus and summary prospectus, which contains this and other important information about the Fund, go to
columbiathreadneedleus.com/investor/. The Fund is distributed by Columbia Management Investment Distributors, Inc., member FINRA, and managed by Columbia Management Investment Advisers, LLC.
Columbia Threadneedle Investments (Columbia Threadneedle) is the global brand name of the Columbia and Threadneedle group of companies. All rights reserved.
© 2019 Columbia Management Investment Advisers, LLC.
columbiathreadneedleus.com/investor/

Annual Report
April 30, 2019
Columbia Small Cap Value Fund I
Beginning on January 1, 2021, as permitted by regulations adopted by the Securities and Exchange Commission, paper copies of the Fund’s annual and semiannual shareholder reports like this one will no longer be sent by mail, unless you specifically request paper copies of the reports. Instead, the reports will be made available on the Fund’s website (columbiathreadneedleus.com/investor/), and each time a report is posted you will be notified by mail and provided with a website address to access the report.
If you have already elected to receive shareholder reports electronically, you will not be affected by this change and you need not take any action. You may elect to receive shareholder reports and other communications from the Fund electronically at any time by contacting your financial intermediary (such as a broker-dealer or bank) or, for Fund shares held directly with the Fund, by calling 800.345.6611 or by enrolling in “eDelivery” by logging into your account at columbiathreadneedleus.com/investor/.
You may elect to receive all future reports in paper free of charge. If you invest through a financial intermediary, you can contact your financial intermediary to request that you continue receiving paper copies of your shareholder reports. If you invest directly with the Fund, you can call 800.345.6611 to let the Fund know you wish to continue receiving paper copies of your shareholder reports. Your election to receive paper reports will apply to all Columbia Funds held in your account if you invest through a financial intermediary or all Columbia Funds held with the fund complex if you invest directly with the Fund.
Not FDIC Insured • No bank guarantee • May lose value
Columbia Small Cap Value Fund I | Annual Report 2019
Investment objective
Columbia Small Cap Value Fund I (the Fund) seeks long-term capital appreciation.
Portfolio management
Jeremy Javidi, CFA
Portfolio Manager
Managed Fund since 2005
Morningstar style boxTM
The Morningstar Style Box is based on a fund’s portfolio holdings. For equity funds, the vertical axis shows the market capitalization of the stocks owned, and the horizontal axis shows investment style (value, blend, or growth). Information shown is based on the most recent data provided by Morningstar.
© 2019 Morningstar, Inc. All rights reserved. The Morningstar information contained herein: (1) is proprietary to Morningstar and/or its content providers; (2) may not be copied or distributed; and (3) is not warranted to be accurate, complete or timely. Neither Morningstar nor its content providers are responsible for any damages or losses arising from any use of this information.
| Average annual total returns (%) (for the period ended April 30, 2019) |
| | | Inception | 1 Year | 5 Years | 10 Years |
| Class A | Excluding sales charges | 07/25/86 | -2.38 | 6.41 | 11.79 |
| | Including sales charges | | -7.99 | 5.16 | 11.13 |
| Advisor Class* | 11/08/12 | -2.14 | 6.68 | 11.98 |
| Class C | Excluding sales charges | 01/15/96 | -3.15 | 5.61 | 10.95 |
| | Including sales charges | | -4.01 | 5.61 | 10.95 |
| Institutional Class | 07/31/95 | -2.16 | 6.68 | 12.07 |
| Institutional 2 Class* | 11/08/12 | -2.01 | 6.83 | 12.08 |
| Institutional 3 Class* | 07/15/09 | -1.97 | 6.88 | 12.27 |
| Class R* | 09/27/10 | -2.67 | 6.14 | 11.52 |
| Russell 2000 Value Index | | 2.19 | 6.94 | 12.87 |
Returns for Class A shares are shown with and without the maximum initial sales charge of 5.75%. Returns for Class C shares are shown with and without the 1.00% contingent deferred sales charges for the first year only. The Fund’s other share classes are not subject to sales charges and have limited eligibility. Please see the Fund’s prospectus for details. Performance for different share classes will vary based on differences in sales charges and fees associated with each share class. All results shown assume reinvestment of distributions during the period. Returns do not reflect the deduction of taxes that a shareholder may pay on Fund distributions or on the redemption of Fund shares. Performance results reflect the effect of any fee waivers or reimbursements of Fund expenses by Columbia Management Investment Advisers, LLC and/or any of its affiliates. Absent these fee waivers or expense reimbursement arrangements, performance results would have been lower.
The performance information shown represents past performance and is not a guarantee of future results. The investment return and principal value of your investment will fluctuate so that your shares, when redeemed, may be worth more or less than their original cost. Current performance may be lower or higher than the performance information shown. You may obtain performance information current to the most recent month-end by contacting your financial intermediary, visiting columbiathreadneedleus.com/investor/ or calling 800.345.6611.
| * | The returns shown for periods prior to the share class inception date (including returns for the Life of the Fund, if shown, which are since Fund inception) include the returns of the Fund’s oldest share class. These returns are adjusted to reflect any higher class-related operating expenses of the newer share classes, as applicable. Please visit columbiathreadneedleus.com/investor/investment-products/mutual-funds/appended-performance for more information. |
The Russell 2000 Value Index, an unmanaged index, tracks the performance of those Russell 2000 Index companies with lower price-to-book ratios and lower forecasted growth values.
Indices are not available for investment, are not professionally managed and do not reflect sales charges, fees, brokerage commissions, taxes or other expenses of investing. Securities in the Fund may not match those in an index.
Columbia Small Cap Value Fund I | Annual Report 2019
| 3 |
Fund at a Glance (continued)
Performance of a hypothetical $10,000 investment (April 30, 2009 — April 30, 2019)
The chart above shows the change in value of a hypothetical $10,000 investment in Class A shares of Columbia Small Cap Value Fund I during the stated time period, and does not reflect the deduction of taxes that a shareholder may pay on Fund distributions or on the redemption of Fund shares.
| Top 10 holdings (%) (at April 30, 2019) |
| Radian Group, Inc. | 1.8 |
| MGIC Investment Corp. | 1.8 |
| Iberiabank Corp. | 1.5 |
| First BanCorp | 1.2 |
| RLJ Lodging Trust | 1.2 |
| BankUnited, Inc. | 1.2 |
| UMB Financial Corp. | 1.1 |
| First Citizens BancShares Inc., Class A | 1.1 |
| Investors Bancorp, Inc. | 1.1 |
| Louisiana-Pacific Corp. | 1.1 |
Percentages indicated are based upon total investments excluding Money Market Funds and investments in derivatives, if any.
For further detail about these holdings, please refer to the section entitled “Portfolio of Investments.”
Fund holdings are as of the date given, are subject to change at any time, and are not recommendations to buy or sell any security.
| Portfolio breakdown (%) (at April 30, 2019) |
| Common Stocks | 98.8 |
| Exchange-Traded Funds | 0.3 |
| Money Market Funds | 0.9 |
| Total | 100.0 |
Percentages indicated are based upon total investments excluding investments in derivatives, if any. The Fund’s portfolio composition is subject to change.
| Equity sector breakdown (%) (at April 30, 2019) |
| Communication Services | 1.4 |
| Consumer Discretionary | 10.8 |
| Consumer Staples | 2.3 |
| Energy | 5.5 |
| Financials | 36.9 |
| Health Care | 4.2 |
| Industrials | 12.3 |
| Information Technology | 11.1 |
| Materials | 7.4 |
| Real Estate | 7.7 |
| Utilities | 0.4 |
| Total | 100.0 |
Percentages indicated are based upon total equity investments. The Fund’s portfolio composition is subject to change.
| 4 | Columbia Small Cap Value Fund I | Annual Report 2019 |
Manager Discussion of Fund Performance
For the 12-month period that ended April 30, 2019, the Fund’s Class A shares returned -2.38% excluding sales charges. The Fund’s benchmark, the Russell 2000 Value Index, returned 2.19% over the same period. Sector allocation and stock selection in the materials, real estate and utilities sectors weighed on performance relative to the benchmark.
Year-end sell-off dampened equity returns
Optimism prevailed early in the 12-month period ended April 30, 2019 as positive global economic conditions, broad corporate tax cuts and moves to reduce regulation in a number of industries buoyed confidence. During the period, the pace of U.S. economic growth averaged approximately 3.0% (annualized), as the labor markets added more than 200,000 jobs per month, on average, and manufacturing activity remained solid. Unemployment fell to a 50-year low of 3.6% in April 2019. The recent decline reflected a drop in the labor force participation rate — the number of able-bodied adults seeking employment.
The picture outside the United States, however, was not as rosy. European economies transitioned to a slower pace of growth in 2018, struggling with rising interest rates, trade tensions and uncertainty surrounding the U.K.’s departure from the European Union. At the same time, China’s economic conditions weakened and emerging markets came under pressure, driven by trade and tariff concerns and a rising U.S. dollar. The Federal Reserve (the Fed) raised the target range of its key short-term interest rate, the federal funds rate four times in 2018. However, the Fed backed away from additional hikes as 2019 commenced and announced that it would be patient moving forward.
As global uncertainties rose late in 2018, investors backed away from stocks and other risky assets. However, stock markets rebounded early in 2019 as a patient Fed and hopes for progress on the trade front inspired confidence. The S&P 500 Index, a broad measure of U.S. stock returns, gained 13.49% for the 12-month period. Investment-grade bonds, as measured by the Bloomberg Barclays U.S. Aggregate Bond Index, returned 5.29%. Small-cap stocks lagged large- and mid-cap stocks and value stocks lagged growth stocks for the period, as measured by their respective Russell indexes.
Contributors and detractors
Stock selection in the health care and financials sectors aided performance relative to the benchmark. In the health care sector, we continue to see value in the recently approved drugs novel to biotechnology companies in the portfolio. We believe that strong sales growth has the potential to translate into strong free cash flow generation for these companies, a trait that we desire in the Fund’s holdings. For the period, cancer-focused Tesaro was the Fund’s top individual contributor. The Fund invested in Tesaro at an attractive valuation relative to our estimate of the company’s earnings potential. Tesaro was recently acquired by GlaxoSmithKline at a significant premium. The Fund took profits and sold the stock. In the financials sector, an overweight position in mortgage insurer Radian also made a strong contribution to Fund results, as the company continued to generate solid returns.
In the materials sector, an overweight relative to the benchmark combined with disappointing stock selection weighed on results. A position in Ferroglobe was the Fund’s biggest individual detractor as rising inventories, falling prices and declining volumes hurt 2018 earnings. However, we liked the company’s longer term prospects and continued to hold the stock. In the energy sector, Laredo Petroleum delivered disappointing results. In a relatively weak environment overall for energy stocks, the company’s production problems were a further drag on its performance. The Fund’s overweight in Laredo amplified the impact of its losses.
At period’s end
At year end, the Fund was overweight, relative to the benchmark, in both the materials and energy sectors, which we believe have the potential to benefit from the solid pace of U.S. economic growth. An overweight in financials reflects our belief that the sector remained undervalued relative to its earnings potential.
We continue to helm Columbia Small Cap Value Fund I with the same high-quality focused philosophy we have had since we took it over in June 2002. We believe that the market continues to present us with high quality value opportunities.
Marketrisk may affect a single issuer, sector of the economy, industry or the market as a whole.Foreigninvestments subject the Fund to risks, including political, economic, market, social and others within a particular country, as well as to currency instabilities and less stringent financial and accounting standards generally applicable to U.S. issuers. Investments insmall-cap companies may be subject to greater volatility and price fluctuations because they
Columbia Small Cap Value Fund I | Annual Report 2019
| 5 |
Manager Discussion of Fund Performance (continued)
may be thinly traded and less liquid. Value securities may be unprofitable if the market fails to recognize their intrinsic worth or the portfolio manager misgauged that worth. The Fund may invest significantly in issuers within a particularsector, which may be negatively affected by market, economic or other conditions, making the Fund more vulnerable to unfavorable developments in the sector. See the Fund’s prospectus for more information on these and other risks.
The views expressed in this report reflect the current views of the respective parties. These views are not guarantees of future performance and involve certain risks, uncertainties and assumptions that are difficult to predict, so actual outcomes and results may differ significantly from the views expressed. These views are subject to change at any time based upon economic, market or other conditions and the respective parties disclaim any responsibility to update such views. These views may not be relied on as investment advice and, because investment decisions for a Columbia fund are based on numerous factors, may not be relied on as an indication of trading intent on behalf of any particular Columbia fund. References to specific securities should not be construed as a recommendation or investment advice.
| 6 | Columbia Small Cap Value Fund I | Annual Report 2019 |
Understanding Your Fund’s Expenses
(Unaudited)
As an investor, you incur two types of costs. There are shareholder transaction costs, which generally include sales charges on purchases and may include redemption fees. There are also ongoing fund costs, which generally include management fees, distribution and/or service fees, and other fund expenses. The following information is intended to help you understand your ongoing costs (in dollars) of investing in the Fund and to help you compare these costs with the ongoing costs of investing in other mutual funds.
Analyzing your Fund’s expenses
To illustrate these ongoing costs, we have provided examples and calculated the expenses paid by investors in each share class of the Fund during the period. The actual and hypothetical information in the table is based on an initial investment of $1,000 at the beginning of the period indicated and held for the entire period. Expense information is calculated two ways and each method provides you with different information. The amount listed in the “Actual” column is calculated using the Fund’s actual operating expenses and total return for the period. You may use the Actual information, together with the amount invested, to estimate the expenses that you paid over the period. Simply divide your account value by $1,000 (for example, an $8,600 account value divided by $1,000 = 8.6), then multiply the results by the expenses paid during the period under the “Actual” column. The amount listed in the “Hypothetical” column assumes a 5% annual rate of return before expenses (which is not the Fund’s actual return) and then applies the Fund’s actual expense ratio for the period to the hypothetical return. You should not use the hypothetical account values and expenses to estimate either your actual account balance at the end of the period or the expenses you paid during the period. See “Compare with other funds” below for details on how to use the hypothetical data.
Compare with other funds
Since all mutual funds are required to include the same hypothetical calculations about expenses in shareholder reports, you can use this information to compare the ongoing cost of investing in the Fund with other funds. To do so, compare the hypothetical example with the 5% hypothetical examples that appear in the shareholder reports of other funds. As you compare hypothetical examples of other funds, it is important to note that hypothetical examples are meant to highlight the ongoing costs of investing in a fund only and do not reflect any transaction costs, such as sales charges, or redemption or exchange fees. Therefore, the hypothetical calculations are useful in comparing ongoing costs only, and will not help you determine the relative total costs of owning different funds. If transaction costs were included in these calculations, your costs would be higher.
| November 1, 2018 — April 30, 2019 |
| | Account value at the
beginning of the
period ($) | Account value at the
end of the
period ($) | Expenses paid during
the period ($) | Fund’s annualized
expense ratio (%) |
| | Actual | Hypothetical | Actual | Hypothetical | Actual | Hypothetical | Actual |
| Class A | 1,000.00 | 1,000.00 | 1,027.40 | 1,018.25 | 6.64 | 6.61 | 1.32 |
| Advisor Class | 1,000.00 | 1,000.00 | 1,028.70 | 1,019.49 | 5.38 | 5.36 | 1.07 |
| Class C | 1,000.00 | 1,000.00 | 1,023.60 | 1,014.53 | 10.39 | 10.34 | 2.07 |
| Institutional Class | 1,000.00 | 1,000.00 | 1,028.60 | 1,019.49 | 5.38 | 5.36 | 1.07 |
| Institutional 2 Class | 1,000.00 | 1,000.00 | 1,029.50 | 1,020.13 | 4.73 | 4.71 | 0.94 |
| Institutional 3 Class | 1,000.00 | 1,000.00 | 1,029.60 | 1,020.38 | 4.48 | 4.46 | 0.89 |
| Class R | 1,000.00 | 1,000.00 | 1,025.90 | 1,017.01 | 7.89 | 7.85 | 1.57 |
Expenses paid during the period are equal to the annualized expense ratio for each class as indicated above, multiplied by the average account value over the period and then multiplied by the number of days in the Fund’s most recent fiscal half year and divided by 365.
Expenses do not include fees and expenses incurred indirectly by the Fund from its investment in underlying funds, including affiliated and non-affiliated pooled investment vehicles, such as mutual funds and exchange-traded funds.
Had Columbia Management Investment Advisers, LLC and/or certain of its affiliates not waived/reimbursed certain fees and expenses, account value at the end of the period would have been reduced.
Columbia Small Cap Value Fund I | Annual Report 2019
| 7 |
Portfolio of Investments
April 30, 2019
(Percentages represent value of investments compared to net assets)
Investments in securities
| Common Stocks 98.8% |
| Issuer | Shares | Value ($) |
| Communication Services 1.4% |
| Entertainment 0.4% |
| AMC Entertainment Holdings, Inc., Class A | 70,359 | 1,066,642 |
| Lions Gate Entertainment Corp., Class B | 109,430 | 1,488,248 |
| Total | | 2,554,890 |
| Media 0.6% |
| Criteo SA, ADR(a) | 69,795 | 1,380,545 |
| Liberty Latin America Ltd., Class C(a) | 111,754 | 2,328,954 |
| Total | | 3,709,499 |
| Wireless Telecommunication Services 0.4% |
| Shenandoah Telecommunications Co. | 50,616 | 2,091,959 |
| Total Communication Services | 8,356,348 |
| Consumer Discretionary 10.7% |
| Auto Components 1.6% |
| Cooper Tire & Rubber Co. | 124,696 | 3,723,422 |
| Gentherm, Inc.(a) | 85,216 | 3,609,750 |
| Modine Manufacturing Co.(a) | 177,867 | 2,630,653 |
| Total | | 9,963,825 |
| Automobiles 0.8% |
| Thor Industries, Inc. | 78,120 | 5,145,764 |
| Distributors 0.2% |
| Educational Development Corp. | 135,541 | 1,219,869 |
| Diversified Consumer Services 0.3% |
| Carriage Services, Inc. | 118,570 | 2,080,904 |
| Hotels, Restaurants & Leisure 0.2% |
| PlayAGS, Inc.(a) | 38,940 | 939,233 |
| Household Durables 2.8% |
| Cavco Industries, Inc.(a) | 14,797 | 1,846,222 |
| Ethan Allen Interiors, Inc. | 164,870 | 3,643,627 |
| Hamilton Beach Brands Holding Co. | 87,865 | 1,590,356 |
| Hooker Furniture Corp. | 75,000 | 2,235,750 |
| Legacy Housing Corp.(a) | 185,414 | 2,249,072 |
| Lifetime Brands, Inc. | 136,367 | 1,290,032 |
| TRI Pointe Group, Inc.(a) | 330,149 | 4,308,444 |
| Total | | 17,163,503 |
| Common Stocks (continued) |
| Issuer | Shares | Value ($) |
| Leisure Products 1.0% |
| Acushnet Holdings Corp. | 46,603 | 1,174,862 |
| American Outdoor Brands Corp.(a) | 225,010 | 2,216,348 |
| Malibu Boats, Inc., Class A(a) | 63,542 | 2,644,618 |
| Total | | 6,035,828 |
| Multiline Retail 0.4% |
| Hudson’s Bay Co. | 405,226 | 2,253,440 |
| Specialty Retail 2.3% |
| Aaron’s, Inc. | 80,931 | 4,507,047 |
| Children’s Place, Inc. (The) | 31,640 | 3,569,625 |
| Designer Brands, Inc. | 94,840 | 2,110,190 |
| Signet Jewelers Ltd. | 171,480 | 3,974,907 |
| Total | | 14,161,769 |
| Textiles, Apparel & Luxury Goods 1.1% |
| Skechers U.S.A., Inc., Class A(a) | 125,080 | 3,960,033 |
| Steven Madden Ltd. | 69,387 | 2,522,217 |
| Total | | 6,482,250 |
| Total Consumer Discretionary | 65,446,385 |
| Consumer Staples 2.3% |
| Food & Staples Retailing 0.9% |
| Andersons, Inc. (The) | 68,325 | 2,234,227 |
| SpartanNash Co. | 110,023 | 1,779,072 |
| Weis Markets, Inc. | 33,081 | 1,391,056 |
| Total | | 5,404,355 |
| Food Products 1.0% |
| Fresh Del Monte Produce, Inc. | 127,710 | 3,768,722 |
| Hain Celestial Group, Inc. (The)(a) | 101,670 | 2,218,440 |
| Total | | 5,987,162 |
| Personal Products 0.4% |
| Inter Parfums, Inc. | 37,502 | 2,718,520 |
| Total Consumer Staples | 14,110,037 |
The accompanying Notes to Financial Statements are an integral part of this statement.
| 8 | Columbia Small Cap Value Fund I | Annual Report 2019 |
Portfolio of Investments (continued)
April 30, 2019
| Common Stocks (continued) |
| Issuer | Shares | Value ($) |
| Energy 5.4% |
| Energy Equipment & Services 1.6% |
| Dawson Geophysical Co.(a) | 599,684 | 1,679,115 |
| Frank’s International NV(a) | 317,560 | 1,854,551 |
| Natural Gas Services Group, Inc.(a) | 132,699 | 2,132,473 |
| ProPetro Holding Corp.(a) | 185,770 | 4,111,090 |
| Total | | 9,777,229 |
| Oil, Gas & Consumable Fuels 3.8% |
| Callon Petroleum Co.(a) | 430,231 | 3,231,035 |
| Carrizo Oil & Gas, Inc.(a) | 246,155 | 3,155,707 |
| Delek U.S. Holdings, Inc. | 141,153 | 5,231,130 |
| Jagged Peak Energy, Inc.(a) | 287,092 | 3,034,562 |
| Pacific Ethanol, Inc.(a) | 531,157 | 578,961 |
| Range Resources Corp. | 219,590 | 1,985,094 |
| SM Energy Co. | 193,490 | 3,082,296 |
| Whiting Petroleum Corp.(a) | 114,400 | 3,133,416 |
| Total | | 23,432,201 |
| Total Energy | 33,209,430 |
| Financials 36.4% |
| Banks 21.4% |
| BancFirst Corp. | 89,374 | 5,040,694 |
| BankUnited, Inc. | 192,126 | 7,027,969 |
| Banner Corp. | 85,751 | 4,546,518 |
| Boston Private Financial Holdings, Inc. | 342,267 | 3,918,957 |
| Bridge Bancorp, Inc. | 81,627 | 2,529,621 |
| Brookline Bancorp, Inc. | 263,763 | 3,969,633 |
| Capital City Bank Group, Inc. | 167,209 | 3,835,775 |
| CenterState Bank Corp. | 176,189 | 4,348,345 |
| Columbia Banking System, Inc. | 119,233 | 4,476,007 |
| Community Trust Bancorp, Inc. | 72,937 | 3,081,588 |
| Fidelity Southern Corp. | 146,781 | 4,272,795 |
| First BanCorp | 629,590 | 7,114,367 |
| First Citizens BancShares Inc., Class A | 14,827 | 6,646,203 |
| First Financial Corp. | 93,220 | 3,837,867 |
| First of Long Island Corp. (The) | 160,190 | 3,727,621 |
| Heritage Financial Corp. | 79,553 | 2,408,069 |
| Hilltop Holdings, Inc. | 234,240 | 4,926,067 |
| Iberiabank Corp. | 117,100 | 9,309,450 |
| Common Stocks (continued) |
| Issuer | Shares | Value ($) |
| Investors Bancorp, Inc. | 562,612 | 6,610,691 |
| National Bank Holdings Corp., Class A | 102,710 | 3,927,630 |
| Northrim BanCorp, Inc. | 120,520 | 4,277,255 |
| OFG Bancorp | 254,710 | 5,140,048 |
| Popular, Inc. | 78,733 | 4,543,681 |
| Sierra Bancorp | 69,542 | 1,840,081 |
| Texas Capital Bancshares, Inc.(a) | 73,310 | 4,745,356 |
| Towne Bank | 179,889 | 4,691,505 |
| UMB Financial Corp. | 99,860 | 6,976,220 |
| Union Bankshares Corp. | 107,374 | 3,919,151 |
| Total | | 131,689,164 |
| Capital Markets 1.4% |
| GAIN Capital Holdings, Inc. | 470,210 | 2,478,007 |
| INTL FCStone, Inc.(a) | 85,475 | 3,466,866 |
| Moelis & Co., ADR, Class A | 58,622 | 2,400,571 |
| Total | | 8,345,444 |
| Consumer Finance 1.7% |
| Enova International, Inc.(a) | 76,752 | 2,105,307 |
| Ezcorp, Inc., Class A(a) | 253,870 | 2,759,567 |
| FirstCash, Inc. | 54,968 | 5,369,274 |
| Total | | 10,234,148 |
| Insurance 5.2% |
| American Equity Investment Life Holding Co. | 174,821 | 5,141,486 |
| Crawford & Co., Class A | 200,014 | 1,800,126 |
| Employers Holdings, Inc. | 101,654 | 4,362,990 |
| FBL Financial Group, Inc., Class A | 64,416 | 4,024,067 |
| Global Indemnity Ltd | 90,893 | 2,799,504 |
| Heritage Insurance Holdings, Inc. | 187,861 | 2,562,424 |
| Horace Mann Educators Corp. | 82,641 | 3,188,290 |
| National Western Life Group, Inc., Class A | 13,104 | 3,495,099 |
| Protective Insurance Corp., Class B | 120,806 | 1,963,097 |
| United Fire Group, Inc. | 66,870 | 2,916,201 |
| Total | | 32,253,284 |
| Thrifts & Mortgage Finance 6.7% |
| HomeStreet, Inc.(a) | 191,548 | 5,390,161 |
| MGIC Investment Corp.(a) | 733,270 | 10,735,073 |
| Provident Financial Holdings, Inc. | 170,420 | 3,451,005 |
| Radian Group, Inc. | 459,810 | 10,768,750 |
The accompanying Notes to Financial Statements are an integral part of this statement.
Columbia Small Cap Value Fund I | Annual Report 2019
| 9 |
Portfolio of Investments (continued)
April 30, 2019
| Common Stocks (continued) |
| Issuer | Shares | Value ($) |
| Washington Federal, Inc. | 141,763 | 4,698,026 |
| Western New England Bancorp, Inc. | 375,979 | 3,631,957 |
| WSFS Financial Corp. | 64,822 | 2,799,014 |
| Total | | 41,473,986 |
| Total Financials | 223,996,026 |
| Health Care 4.1% |
| Biotechnology 1.8% |
| Atara Biotherapeutics, Inc.(a) | 65,500 | 2,200,800 |
| Coherus Biosciences, Inc.(a) | 156,036 | 2,484,093 |
| Dynavax Technologies Corp.(a) | 374,979 | 2,493,610 |
| Immunomedics, Inc.(a) | 162,560 | 2,604,211 |
| Puma Biotechnology, Inc.(a) | 48,299 | 1,551,364 |
| Total | | 11,334,078 |
| Health Care Equipment & Supplies 0.6% |
| Quotient Ltd.(a) | 213,863 | 1,792,172 |
| Sientra, Inc.(a) | 217,009 | 1,827,216 |
| Total | | 3,619,388 |
| Pharmaceuticals 1.7% |
| Aerie Pharmaceuticals, Inc.(a) | 69,630 | 2,656,385 |
| BioDelivery Sciences International, Inc.(a) | 307,139 | 1,483,481 |
| Supernus Pharmaceuticals, Inc.(a) | 88,530 | 3,251,707 |
| TherapeuticsMD, Inc.(a) | 677,200 | 2,911,960 |
| Total | | 10,303,533 |
| Total Health Care | 25,256,999 |
| Industrials 12.2% |
| Aerospace & Defense 0.8% |
| Aerojet Rocketdyne Holdings, Inc.(a) | 134,840 | 4,565,682 |
| Airlines 0.1% |
| Spirit Airlines, Inc.(a) | 13,720 | 746,094 |
| Building Products 1.5% |
| Apogee Enterprises, Inc. | 76,770 | 3,093,831 |
| Resideo Technologies, Inc.(a) | 95,245 | 2,162,062 |
| Universal Forest Products, Inc. | 106,182 | 3,923,425 |
| Total | | 9,179,318 |
| Commercial Services & Supplies 0.8% |
| Herman Miller, Inc. | 125,160 | 4,858,711 |
| Common Stocks (continued) |
| Issuer | Shares | Value ($) |
| Electrical Equipment 0.7% |
| Encore Wire Corp. | 74,986 | 4,445,920 |
| Machinery 4.5% |
| EnPro Industries, Inc. | 42,319 | 3,145,148 |
| Gorman-Rupp Co. | 88,275 | 2,939,558 |
| ITT, Inc. | 51,760 | 3,134,068 |
| Kennametal, Inc. | 110,740 | 4,507,118 |
| LB Foster Co., Class A(a) | 122,211 | 2,626,314 |
| Lydall, Inc.(a) | 96,144 | 2,366,104 |
| Mueller Industries, Inc. | 125,102 | 3,649,225 |
| Standex International Corp. | 38,384 | 2,536,031 |
| Wabash National Corp. | 158,840 | 2,395,307 |
| Total | | 27,298,873 |
| Professional Services 0.6% |
| Korn/Ferry International | 79,805 | 3,752,431 |
| Road & Rail 2.1% |
| Heartland Express, Inc. | 149,400 | 2,940,192 |
| Marten Transport Ltd. | 211,260 | 4,178,723 |
| Schneider National, Inc., Class B | 127,820 | 2,671,438 |
| Werner Enterprises, Inc. | 92,539 | 3,100,056 |
| Total | | 12,890,409 |
| Trading Companies & Distributors 1.1% |
| Houston Wire & Cable Co.(a) | 299,716 | 1,855,242 |
| Textainer Group Holdings Ltd.(a) | 343,957 | 3,298,548 |
| Transcat, Inc.(a) | 79,343 | 1,828,856 |
| Total | | 6,982,646 |
| Total Industrials | 74,720,084 |
| Information Technology 11.0% |
| Communications Equipment 2.5% |
| Acacia Communications, Inc.(a) | 75,377 | 4,362,821 |
| Casa Systems, Inc.(a) | 151,534 | 1,453,211 |
| Digi International, Inc.(a) | 151,781 | 1,953,421 |
| Lumentum Holdings, Inc.(a) | 79,850 | 4,948,305 |
| Netscout Systems, Inc.(a) | 80,418 | 2,364,289 |
| Total | | 15,082,047 |
The accompanying Notes to Financial Statements are an integral part of this statement.
| 10 | Columbia Small Cap Value Fund I | Annual Report 2019 |
Portfolio of Investments (continued)
April 30, 2019
| Common Stocks (continued) |
| Issuer | Shares | Value ($) |
| Electronic Equipment, Instruments & Components 1.9% |
| AVX Corp. | 338,098 | 5,514,379 |
| MTS Systems Corp. | 49,037 | 2,696,054 |
| OSI Systems, Inc.(a) | 36,510 | 3,290,646 |
| Total | | 11,501,079 |
| IT Services 1.6% |
| Carbonite, Inc.(a) | 108,910 | 2,671,562 |
| Consolidated Water Co., Ltd. | 103,777 | 1,313,817 |
| Mantech International Corp., Class A | 58,487 | 3,625,609 |
| TTEC Holdings, Inc. | 66,927 | 2,440,159 |
| Total | | 10,051,147 |
| Semiconductors & Semiconductor Equipment 4.0% |
| Advanced Energy Industries, Inc.(a) | 52,550 | 3,035,288 |
| Aquantia Corp.(a) | 152,730 | 1,452,462 |
| Cirrus Logic, Inc.(a) | 123,160 | 5,859,953 |
| Cohu, Inc. | 187,570 | 2,781,663 |
| MACOM Technology Solutions Holdings, Inc.(a) | 301,521 | 4,188,127 |
| MKS Instruments, Inc. | 59,500 | 5,415,095 |
| Photronics, Inc.(a) | 212,665 | 1,986,291 |
| Total | | 24,718,879 |
| Software 1.0% |
| MicroStrategy, Inc., Class A(a) | 28,390 | 4,249,983 |
| Monotype Imaging Holdings, Inc. | 121,780 | 2,099,487 |
| Total | | 6,349,470 |
| Total Information Technology | 67,702,622 |
| Materials 7.3% |
| Chemicals 1.6% |
| Flotek Industries, Inc.(a) | 512,090 | 1,828,161 |
| Livent Corp.(a) | 439,607 | 4,738,964 |
| Tronox Holdings PLC, Class A | 205,865 | 2,910,931 |
| Total | | 9,478,056 |
| Containers & Packaging 0.3% |
| Greif, Inc., Class A | 47,879 | 1,892,178 |
| Metals & Mining 4.2% |
| Allegheny Technologies, Inc.(a) | 196,547 | 4,897,951 |
| Ampco-Pittsburgh Corp.(a) | 273,120 | 879,446 |
| Capstone Mining Corp.(a) | 4,891,838 | 2,409,952 |
| Centerra Gold, Inc.(a) | 507,850 | 2,585,308 |
| Common Stocks (continued) |
| Issuer | Shares | Value ($) |
| Century Aluminum Co.(a) | 287,714 | 2,419,675 |
| Commercial Metals Co. | 207,220 | 3,582,834 |
| Ferroglobe PLC | 497,240 | 1,069,066 |
| Olympic Steel, Inc. | 164,918 | 2,674,970 |
| Schnitzer Steel Industries, Inc., Class A | 137,440 | 3,260,077 |
| Universal Stainless & Alloy Products, Inc.(a) | 158,293 | 2,277,836 |
| Total | | 26,057,115 |
| Paper & Forest Products 1.2% |
| Clearwater Paper Corp.(a) | 48,159 | 971,367 |
| Louisiana-Pacific Corp. | 262,318 | 6,571,066 |
| Total | | 7,542,433 |
| Total Materials | 44,969,782 |
| Real Estate 7.6% |
| Equity Real Estate Investment Trusts (REITS) 7.3% |
| Chesapeake Lodging Trust | 179,534 | 5,116,719 |
| CoreCivic, Inc. | 198,830 | 4,137,652 |
| Farmland Partners, Inc. | 487,156 | 3,195,743 |
| Highwoods Properties, Inc. | 105,720 | 4,712,998 |
| Mack-Cali Realty Corp. | 270,890 | 6,306,319 |
| PotlatchDeltic Corp. | 124,478 | 4,812,319 |
| RLJ Lodging Trust | 381,780 | 7,028,570 |
| SITE Centers Corp. | 211,965 | 2,806,417 |
| Sunstone Hotel Investors, Inc. | 453,075 | 6,524,280 |
| Total | | 44,641,017 |
| Real Estate Management & Development 0.3% |
| St. Joe Co. (The)(a) | 128,690 | 2,192,878 |
| Total Real Estate | 46,833,895 |
| Utilities 0.4% |
| Gas Utilities 0.4% |
| Southwest Gas Holdings, Inc. | 32,735 | 2,723,225 |
| Total Utilities | 2,723,225 |
Total Common Stocks
(Cost $451,882,684) | 607,324,833 |
|
| Exchange-Traded Funds 0.3% |
| | Shares | Value ($) |
| iShares Russell 2000 Value ETF | 14,740 | 1,832,624 |
Total Exchange-Traded Funds
(Cost $1,778,695) | 1,832,624 |
|
The accompanying Notes to Financial Statements are an integral part of this statement.
Columbia Small Cap Value Fund I | Annual Report 2019
| 11 |
Portfolio of Investments (continued)
April 30, 2019
| Money Market Funds 0.9% |
| | Shares | Value ($) |
| Columbia Short-Term Cash Fund, 2.519%(b),(c) | 5,605,364 | 5,604,804 |
Total Money Market Funds
(Cost $5,604,804) | 5,604,804 |
Total Investments in Securities
(Cost: $459,266,183) | 614,762,261 |
| Other Assets & Liabilities, Net | | (74,342) |
| Net Assets | 614,687,919 |
Notes to Portfolio of Investments
| (a) | Non-income producing investment. |
| (b) | The rate shown is the seven-day current annualized yield at April 30, 2019. |
| (c) | As defined in the Investment Company Act of 1940, an affiliated company is one in which the Fund owns 5% or more of the company’s outstanding voting securities, or a company which is under common ownership or control with the Fund. Holdings and transactions in these affiliated companies during the year ended April 30, 2019 are as follows: |
| Issuer | Beginning
shares | Shares
purchased | Shares
sold | Ending
shares | Realized gain
(loss) —
affiliated
issuers ($) | Net change in
unrealized
appreciation
(depreciation) —
affiliated
issuers ($) | Dividends —
affiliated
issuers ($) | Value —
affiliated
issuers
at end of
period ($) |
| Columbia Short-Term Cash Fund, 2.519% |
| | 949,669 | 191,361,396 | (186,705,701) | 5,605,364 | (1,226) | — | 124,893 | 5,604,804 |
Abbreviation Legend
| ADR | American Depositary Receipt |
Fair value measurements
The Fund categorizes its fair value measurements according to a three-level hierarchy that maximizes the use of observable inputs and minimizes the use of unobservable inputs by prioritizing that the most observable input be used when available. Observable inputs are those that market participants would use in pricing an investment based on market data obtained from sources independent of the reporting entity. Unobservable inputs are those that reflect the Fund’s assumptions about the information market participants would use in pricing an investment. An investment’s level within the fair value hierarchy is based on the lowest level of any input that is deemed significant to the asset’s or liability’s fair value measurement. The input levels are not necessarily an indication of the risk or liquidity associated with investments at that level. For example, certain U.S. government securities are generally high quality and liquid, however, they are reflected as Level 2 because the inputs used to determine fair value may not always be quoted prices in an active market.
Fair value inputs are summarized in the three broad levels listed below:
| ■ | Level 1 — Valuations based on quoted prices for investments in active markets that the Fund has the ability to access at the measurement date. Valuation adjustments are not applied to Level 1 investments. |
| ■ | Level 2 — Valuations based on other significant observable inputs (including quoted prices for similar securities, interest rates, prepayment speeds, credit risks, etc.). |
| ■ | Level 3 — Valuations based on significant unobservable inputs (including the Fund’s own assumptions and judgment in determining the fair value of investments). |
Inputs that are used in determining fair value of an investment may include price information, credit data, volatility statistics, and other factors. These inputs can be either observable or unobservable. The availability of observable inputs can vary between investments, and is affected by various factors such as the type of investment, and the volume and level of activity for that investment or similar investments in the marketplace. The inputs will be considered by the Investment Manager, along with any other relevant factors in the calculation of an investment’s fair value. The Fund uses prices and inputs that are current as of the measurement date, which may include periods of market dislocations. During these periods, the availability of prices and inputs may be reduced for many investments. This condition could cause an investment to be reclassified between the various levels within the hierarchy.
Certain investments that have been measured at fair value using the net asset value (NAV) per share (or its equivalent) are not categorized in the fair value hierarchy. The fair value amounts presented in the table are intended to reconcile the fair value hierarchy to the amounts presented in the Portfolio of Investments. The Columbia Short-Term Cash Fund seeks to provide shareholders with maximum current income consistent with liquidity and stability of principal. Columbia Short-Term Cash Fund prices its shares with a floating NAV and no longer seeks to maintain a stable NAV.
Investments falling into the Level 3 category are primarily supported by quoted prices from brokers and dealers participating in the market for those investments. However, these may be classified as Level 3 investments due to lack of market transparency and corroboration to support these quoted prices. Additionally, valuation models may be used as the pricing source for any remaining investments classified as Level 3. These models may rely on one or more significant unobservable inputs and/or significant assumptions by the Investment Manager. Inputs used in valuations may include, but are not limited to, financial statement analysis, capital account balances, discount rates and estimated cash flows, and comparable company data.
The accompanying Notes to Financial Statements are an integral part of this statement.
| 12 | Columbia Small Cap Value Fund I | Annual Report 2019 |
Portfolio of Investments (continued)
April 30, 2019
Fair value measurements (continued)
Under the direction of the Fund’s Board of Trustees (the Board), the Investment Manager’s Valuation Committee (the Committee) is responsible for overseeing the valuation procedures approved by the Board. The Committee consists of voting and non-voting members from various groups within the Investment Manager’s organization, including operations and accounting, trading and investments, compliance, risk management and legal.
The Committee meets at least monthly to review and approve valuation matters, which may include a description of specific valuation determinations, data regarding pricing information received from approved pricing vendors and brokers and the results of Board-approved valuation control policies and procedures (the Policies). The Policies address, among other things, instances when market quotations are or are not readily available, including recommendations of third party pricing vendors and a determination of appropriate pricing methodologies; events that require specific valuation determinations and assessment of fair value techniques; securities with a potential for stale pricing, including those that are illiquid, restricted, or in default; and the effectiveness of third party pricing vendors, including periodic reviews of vendors. The Committee meets more frequently, as needed, to discuss additional valuation matters, which may include the need to review back-testing results, review time-sensitive information or approve related valuation actions. The Committee reports to the Board, with members of the Committee meeting with the Board at each of its regularly scheduled meetings to discuss valuation matters and actions during the period, similar to those described earlier.
For investments categorized as Level 3, the Committee monitors information similar to that described above, which may include: (i) data specific to the issuer or comparable issuers, (ii) general market or specific sector news and (iii) quoted prices and specific or similar security transactions. The Committee considers this data and any changes from prior periods in order to assess the reasonableness of observable and unobservable inputs, any assumptions or internal models used to value those securities and changes in fair value. This data is also used to corroborate, when available, information received from approved pricing vendors and brokers. Various factors impact the frequency of monitoring this information (which may occur as often as daily). However, the Committee may determine that changes to inputs, assumptions and models are not required as a result of the monitoring procedures performed.
The following table is a summary of the inputs used to value the Fund’s investments at April 30, 2019:
| | Level 1
quoted prices
in active
markets for
identical
assets ($) | Level 2
other
significant
observable
inputs ($) | Level 3
significant
unobservable
inputs ($) | Investments
measured at
net asset
value ($) | Total ($) |
| Investments in Securities | | | | | |
| Common Stocks | | | | | |
| Communication Services | 8,356,348 | — | — | — | 8,356,348 |
| Consumer Discretionary | 65,446,385 | — | — | — | 65,446,385 |
| Consumer Staples | 14,110,037 | — | — | — | 14,110,037 |
| Energy | 33,209,430 | — | — | — | 33,209,430 |
| Financials | 223,996,026 | — | — | — | 223,996,026 |
| Health Care | 25,256,999 | — | — | — | 25,256,999 |
| Industrials | 74,720,084 | — | — | — | 74,720,084 |
| Information Technology | 67,702,622 | — | — | — | 67,702,622 |
| Materials | 44,969,782 | — | — | — | 44,969,782 |
| Real Estate | 46,833,895 | — | — | — | 46,833,895 |
| Utilities | 2,723,225 | — | — | — | 2,723,225 |
| Total Common Stocks | 607,324,833 | — | — | — | 607,324,833 |
| Exchange-Traded Funds | 1,832,624 | — | — | — | 1,832,624 |
| Money Market Funds | — | — | — | 5,604,804 | 5,604,804 |
| Total Investments in Securities | 609,157,457 | — | — | 5,604,804 | 614,762,261 |
See the Portfolio of Investments for all investment classifications not indicated in the table.
There were no transfers of financial assets between levels during the period.
The accompanying Notes to Financial Statements are an integral part of this statement.
Columbia Small Cap Value Fund I | Annual Report 2019
| 13 |
Statement of Assets and Liabilities
April 30, 2019
| Assets | |
| Investments in securities, at value | |
| Unaffiliated issuers (cost $453,661,379) | $609,157,457 |
| Affiliated issuers (cost $5,604,804) | 5,604,804 |
| Receivable for: | |
| Investments sold | 1,929,074 |
| Capital shares sold | 509,994 |
| Dividends | 62,862 |
| Expense reimbursement due from Investment Manager | 822 |
| Prepaid expenses | 852 |
| Trustees’ deferred compensation plan | 156,307 |
| Total assets | 617,422,172 |
| Liabilities | |
| Payable for: | |
| Investments purchased | 1,509,849 |
| Capital shares purchased | 883,271 |
| Management services fees | 14,613 |
| Distribution and/or service fees | 1,875 |
| Transfer agent fees | 95,100 |
| Compensation of chief compliance officer | 23 |
| Other expenses | 73,215 |
| Trustees’ deferred compensation plan | 156,307 |
| Total liabilities | 2,734,253 |
| Net assets applicable to outstanding capital stock | $614,687,919 |
| Represented by | |
| Paid in capital | 458,010,570 |
| Total distributable earnings (loss) (Note 2) | 156,677,349 |
| Total - representing net assets applicable to outstanding capital stock | $614,687,919 |
The accompanying Notes to Financial Statements are an integral part of this statement.
| 14 | Columbia Small Cap Value Fund I | Annual Report 2019 |
Statement of Assets and Liabilities (continued)
April 30, 2019
| Class A | |
| Net assets | $234,765,372 |
| Shares outstanding | 6,411,373 |
| Net asset value per share | $36.62 |
| Maximum sales charge | 5.75% |
| Maximum offering price per share (calculated by dividing the net asset value per share by 1.0 minus the maximum sales charge for Class A shares) | $38.85 |
| Advisor Class | |
| Net assets | $29,063,722 |
| Shares outstanding | 686,006 |
| Net asset value per share | $42.37 |
| Class C | |
| Net assets | $7,969,266 |
| Shares outstanding | 335,958 |
| Net asset value per share | $23.72 |
| Institutional Class | |
| Net assets | $192,878,473 |
| Shares outstanding | 4,696,570 |
| Net asset value per share | $41.07 |
| Institutional 2 Class | |
| Net assets | $39,831,238 |
| Shares outstanding | 939,500 |
| Net asset value per share | $42.40 |
| Institutional 3 Class | |
| Net assets | $108,132,289 |
| Shares outstanding | 2,618,160 |
| Net asset value per share | $41.30 |
| Class R | |
| Net assets | $2,047,559 |
| Shares outstanding | 56,091 |
| Net asset value per share | $36.50 |
The accompanying Notes to Financial Statements are an integral part of this statement.
Columbia Small Cap Value Fund I | Annual Report 2019
| 15 |
Statement of Operations
Year Ended April 30, 2019
| Net investment income | |
| Income: | |
| Dividends — unaffiliated issuers | $9,752,245 |
| Dividends — affiliated issuers | 124,893 |
| Foreign taxes withheld | (24,221) |
| Total income | 9,852,917 |
| Expenses: | |
| Management services fees | 5,505,921 |
| Distribution and/or service fees | |
| Class A | 627,269 |
| Class C | 123,954 |
| Class R | 17,391 |
| Transfer agent fees | |
| Class A | 489,802 |
| Advisor Class | 36,721 |
| Class C | 24,026 |
| Institutional Class | 403,906 |
| Institutional 2 Class | 18,516 |
| Institutional 3 Class | 9,232 |
| Class R | 6,753 |
| Compensation of board members | 22,677 |
| Custodian fees | 22,870 |
| Printing and postage fees | 87,288 |
| Registration fees | 116,988 |
| Audit fees | 39,801 |
| Legal fees | 14,263 |
| Line of credit interest | 2,953 |
| Interest on interfund lending | 1,144 |
| Compensation of chief compliance officer | 256 |
| Other | 30,858 |
| Total expenses | 7,602,589 |
| Fees waived or expenses reimbursed by Investment Manager and its affiliates | (218,379) |
| Expense reduction | (2,555) |
| Total net expenses | 7,381,655 |
| Net investment income | 2,471,262 |
| Realized and unrealized gain (loss) — net | |
| Net realized gain (loss) on: | |
| Investments — unaffiliated issuers | 38,890,907 |
| Investments — affiliated issuers | (1,226) |
| Foreign currency translations | 1,041 |
| Net realized gain | 38,890,722 |
| Net change in unrealized appreciation (depreciation) on: | |
| Investments — unaffiliated issuers | (60,499,073) |
| Foreign currency translations | 303 |
| Net change in unrealized appreciation (depreciation) | (60,498,770) |
| Net realized and unrealized loss | (21,608,048) |
| Net decrease in net assets resulting from operations | $(19,136,786) |
The accompanying Notes to Financial Statements are an integral part of this statement.
| 16 | Columbia Small Cap Value Fund I | Annual Report 2019 |
Statement of Changes in Net Assets
| | Year Ended
April 30, 2019 | Year Ended
April 30, 2018 |
| Operations | | |
| Net investment income | $2,471,262 | $399,910 |
| Net realized gain | 38,890,722 | 51,274,722 |
| Net change in unrealized appreciation (depreciation) | (60,498,770) | 4,585,883 |
| Net increase (decrease) in net assets resulting from operations | (19,136,786) | 56,260,515 |
| Distributions to shareholders | | |
| Net investment income and net realized gains | | |
| Class A | (19,415,100) | |
| Advisor Class | (1,180,383) | |
| Class C | (1,506,175) | |
| Institutional Class | (14,795,757) | |
| Institutional 2 Class | (2,192,866) | |
| Institutional 3 Class | (8,699,677) | |
| Class R | (278,699) | |
| Net investment income | | |
| Class A | | (18,184) |
| Advisor Class | | (13,885) |
| Institutional Class | | (304,253) |
| Institutional 2 Class | | (43,338) |
| Institutional 3 Class | | (297,861) |
| Net realized gains | | |
| Class A | | (28,669,109) |
| Advisor Class | | (657,999) |
| Class B | | (2,295) |
| Class C | | (3,898,260) |
| Institutional Class | | (22,546,874) |
| Institutional 2 Class | | (1,434,065) |
| Institutional 3 Class | | (9,015,214) |
| Class R | | (428,212) |
| Total distributions to shareholders (Note 2) | (48,068,657) | (67,329,549) |
| Increase in net assets from capital stock activity | 54,455,854 | 45,988,516 |
| Total increase (decrease) in net assets | (12,749,589) | 34,919,482 |
| Net assets at beginning of year | 627,437,508 | 592,518,026 |
| Net assets at end of year | $614,687,919 | $627,437,508 |
| Excess of distributions over net investment income | $(156,307) | $(139,530) |
The accompanying Notes to Financial Statements are an integral part of this statement.
Columbia Small Cap Value Fund I | Annual Report 2019
| 17 |
Statement of Changes in Net Assets (continued)
| | Year Ended | Year Ended |
| | April 30, 2019 | April 30, 2018 |
| | Shares | Dollars ($) | Shares | Dollars ($) |
| Capital stock activity |
| Class A | | | | |
| Subscriptions | 1,279,329 | 51,219,296 | 920,218 | 38,379,646 |
| Distributions reinvested | 488,010 | 17,950,488 | 669,214 | 26,619,925 |
| Redemptions | (1,455,196) | (55,354,711) | (1,384,027) | (57,190,812) |
| Net increase | 312,143 | 13,815,073 | 205,405 | 7,808,759 |
| Advisor Class | | | | |
| Subscriptions | 672,537 | 29,104,436 | 189,924 | 9,051,506 |
| Distributions reinvested | 23,240 | 970,428 | 14,407 | 659,916 |
| Redemptions | (261,782) | (11,427,093) | (53,162) | (2,469,831) |
| Net increase | 433,995 | 18,647,771 | 151,169 | 7,241,591 |
| Class B | | | | |
| Distributions reinvested | — | — | 87 | 2,035 |
| Redemptions | — | — | (4,982) | (125,117) |
| Net decrease | — | — | (4,895) | (123,082) |
| Class C | | | | |
| Subscriptions | 151,128 | 3,988,634 | 100,638 | 2,864,612 |
| Distributions reinvested | 55,702 | 1,414,728 | 137,152 | 3,756,727 |
| Redemptions | (698,262) | (19,192,184) | (304,603) | (8,725,399) |
| Net decrease | (491,432) | (13,788,822) | (66,813) | (2,104,060) |
| Institutional Class | | | | |
| Subscriptions | 2,137,963 | 93,589,450 | 1,537,671 | 70,110,949 |
| Distributions reinvested | 245,349 | 10,050,739 | 319,427 | 14,050,529 |
| Redemptions | (2,325,109) | (98,657,549) | (2,454,402) | (107,882,281) |
| Net increase (decrease) | 58,203 | 4,982,640 | (597,304) | (23,720,803) |
| Institutional 2 Class | | | | |
| Subscriptions | 1,148,447 | 51,783,896 | 404,771 | 19,476,501 |
| Distributions reinvested | 51,634 | 2,192,711 | 32,215 | 1,477,164 |
| Redemptions | (598,525) | (25,678,225) | (293,881) | (13,543,669) |
| Net increase | 601,556 | 28,298,382 | 143,105 | 7,409,996 |
| Institutional 3 Class | | | | |
| Subscriptions | 671,198 | 29,102,129 | 1,269,676 | 54,863,783 |
| Distributions reinvested | 155,750 | 6,401,143 | 171,483 | 7,611,681 |
| Redemptions | (745,352) | (31,611,699) | (305,177) | (13,828,311) |
| Net increase | 81,596 | 3,891,573 | 1,135,982 | 48,647,153 |
| Class R | | | | |
| Subscriptions | 14,034 | 510,430 | 35,543 | 1,464,682 |
| Distributions reinvested | 7,567 | 278,699 | 10,767 | 428,212 |
| Redemptions | (58,848) | (2,179,892) | (25,801) | (1,063,932) |
| Net increase (decrease) | (37,247) | (1,390,763) | 20,509 | 828,962 |
| Total net increase | 958,814 | 54,455,854 | 987,158 | 45,988,516 |
The accompanying Notes to Financial Statements are an integral part of this statement.
| 18 | Columbia Small Cap Value Fund I | Annual Report 2019 |
[THIS PAGE INTENTIONALLY LEFT BLANK]
Columbia Small Cap Value Fund I | Annual Report 2019
| 19 |
The following table is intended to help you understand the Fund’s financial performance. Certain information reflects financial results for a single share of a class held for the periods shown. Per share net investment income (loss) amounts are calculated based on average shares outstanding during the period. Total return assumes reinvestment of all dividends and distributions, if any. Total return does not reflect payment of sales charges, if any. Total return and portfolio turnover are not annualized for periods of less than one year. The portfolio turnover rate is calculated without regard to purchase and sales transactions of short-term instruments and certain derivatives, if any. If such transactions were included, the Fund’s portfolio turnover rate may be higher.
| | Net asset value,
beginning of
period | Net
investment
income
(loss) | Net
realized
and
unrealized
gain (loss) | Total from
investment
operations | Distributions
from net
investment
income | Distributions
from net
realized
gains | Total
distributions to
shareholders |
| Class A |
| Year Ended 4/30/2019 | $40.70 | 0.08 | (1.08) | (1.00) | (0.13) | (2.95) | (3.08) |
| Year Ended 4/30/2018 | $41.62 | (0.03) | 3.95 | 3.92 | (0.01) | (4.83) | (4.84) |
| Year Ended 4/30/2017 | $37.50 | 0.05 | 8.85 | 8.90 | (0.06) | (4.72) | (4.78) |
| Year Ended 4/30/2016 | $43.03 | 0.11 | (1.13) | (1.02) | (0.12) | (4.39) | (4.51) |
| Year Ended 4/30/2015 | $48.23 | 0.13 | 1.32 | 1.45 | (0.18) | (6.47) | (6.65) |
| Advisor Class |
| Year Ended 4/30/2019 | $46.56 | 0.21 | (1.25) | (1.04) | (0.20) | (2.95) | (3.15) |
| Year Ended 4/30/2018 | $46.89 | 0.10 | 4.48 | 4.58 | (0.08) | (4.83) | (4.91) |
| Year Ended 4/30/2017 | $41.66 | 0.15 | 9.94 | 10.09 | (0.14) | (4.72) | (4.86) |
| Year Ended 4/30/2016 | $47.24 | 0.24 | (1.24) | (1.00) | (0.19) | (4.39) | (4.58) |
| Year Ended 4/30/2015 | $52.31 | 0.27 | 1.43 | 1.70 | (0.30) | (6.47) | (6.77) |
| Class C |
| Year Ended 4/30/2019 | $27.55 | (0.16) | (0.72) | (0.88) | — | (2.95) | (2.95) |
| Year Ended 4/30/2018 | $29.86 | (0.24) | 2.76 | 2.52 | — | (4.83) | (4.83) |
| Year Ended 4/30/2017 | $28.24 | (0.19) | 6.44 | 6.25 | — | (4.63) | (4.63) |
| Year Ended 4/30/2016 | $33.63 | (0.13) | (0.87) | (1.00) | — | (4.39) | (4.39) |
| Year Ended 4/30/2015 | $39.24 | (0.17) | 1.03 | 0.86 | — | (6.47) | (6.47) |
| Institutional Class |
| Year Ended 4/30/2019 | $45.24 | 0.20 | (1.22) | (1.02) | (0.20) | (2.95) | (3.15) |
| Year Ended 4/30/2018 | $45.70 | 0.08 | 4.37 | 4.45 | (0.08) | (4.83) | (4.91) |
| Year Ended 4/30/2017 | $40.71 | 0.14 | 9.71 | 9.85 | (0.14) | (4.72) | (4.86) |
| Year Ended 4/30/2016 | $46.28 | 0.23 | (1.22) | (0.99) | (0.19) | (4.39) | (4.58) |
| Year Ended 4/30/2015 | $51.37 | 0.27 | 1.41 | 1.68 | (0.30) | (6.47) | (6.77) |
| Institutional 2 Class |
| Year Ended 4/30/2019 | $46.57 | 0.27 | (1.25) | (0.98) | (0.24) | (2.95) | (3.19) |
| Year Ended 4/30/2018 | $46.88 | 0.17 | 4.46 | 4.63 | (0.11) | (4.83) | (4.94) |
| Year Ended 4/30/2017 | $41.64 | 0.23 | 9.92 | 10.15 | (0.19) | (4.72) | (4.91) |
| Year Ended 4/30/2016 | $47.21 | 0.31 | (1.25) | (0.94) | (0.24) | (4.39) | (4.63) |
| Year Ended 4/30/2015 | $52.27 | 0.33 | 1.46 | 1.79 | (0.38) | (6.47) | (6.85) |
| Institutional 3 Class |
| Year Ended 4/30/2019 | $45.45 | 0.28 | (1.22) | (0.94) | (0.26) | (2.95) | (3.21) |
| Year Ended 4/30/2018 | $45.86 | 0.17 | 4.37 | 4.54 | (0.12) | (4.83) | (4.95) |
| Year Ended 4/30/2017 | $40.83 | 0.09 | 9.87 | 9.96 | (0.21) | (4.72) | (4.93) |
| Year Ended 4/30/2016 | $46.37 | 0.29 | (1.18) | (0.89) | (0.26) | (4.39) | (4.65) |
| Year Ended 4/30/2015 | $51.46 | 0.36 | 1.42 | 1.78 | (0.40) | (6.47) | (6.87) |
The accompanying Notes to Financial Statements are an integral part of this statement.
| 20 | Columbia Small Cap Value Fund I | Annual Report 2019 |
Financial Highlights (continued)
| | Net
asset
value,
end of
period | Total
return | Total gross
expense
ratio to
average
net assets(a) | Total net
expense
ratio to
average
net assets(a),(b) | Net investment
income (loss)
ratio to
average
net assets | Portfolio
turnover | Net
assets,
end of
period
(000’s) |
| Class A |
| Year Ended 4/30/2019 | $36.62 | (2.38%) | 1.36%(c),(d) | 1.32%(c),(d),(e) | 0.21% | 62% | $234,765 |
| Year Ended 4/30/2018 | $40.70 | 10.03% | 1.35%(d) | 1.33%(d),(e) | (0.07%) | 51% | $248,266 |
| Year Ended 4/30/2017 | $41.62 | 26.02% | 1.38%(d) | 1.37%(d),(e) | 0.12% | 50% | $245,315 |
| Year Ended 4/30/2016 | $37.50 | (2.60%) | 1.36% | 1.36%(e) | 0.29% | 65% | $239,419 |
| Year Ended 4/30/2015 | $43.03 | 3.48% | 1.33% | 1.33%(e) | 0.29% | 42% | $306,663 |
| Advisor Class |
| Year Ended 4/30/2019 | $42.37 | (2.14%) | 1.12%(c),(d) | 1.07%(c),(d),(e) | 0.48% | 62% | $29,064 |
| Year Ended 4/30/2018 | $46.56 | 10.34% | 1.10%(d) | 1.08%(d),(e) | 0.20% | 51% | $11,734 |
| Year Ended 4/30/2017 | $46.89 | 26.30% | 1.13%(d) | 1.12%(d),(e) | 0.34% | 50% | $4,729 |
| Year Ended 4/30/2016 | $41.66 | (2.31%) | 1.11% | 1.11%(e) | 0.56% | 65% | $4,007 |
| Year Ended 4/30/2015 | $47.24 | 3.71% | 1.08% | 1.08%(e) | 0.53% | 42% | $9,840 |
| Class C |
| Year Ended 4/30/2019 | $23.72 | (3.15%) | 2.10%(c),(d) | 2.07%(c),(d),(e) | (0.59%) | 62% | $7,969 |
| Year Ended 4/30/2018 | $27.55 | 9.24% | 2.10%(d) | 2.08%(d),(e) | (0.83%) | 51% | $22,792 |
| Year Ended 4/30/2017 | $29.86 | 25.05% | 2.12%(d) | 2.12%(d),(e) | (0.65%) | 50% | $26,703 |
| Year Ended 4/30/2016 | $28.24 | (3.32%) | 2.12% | 2.11%(e) | (0.45%) | 65% | $26,846 |
| Year Ended 4/30/2015 | $33.63 | 2.72% | 2.08% | 2.08%(e) | (0.47%) | 42% | $32,642 |
| Institutional Class |
| Year Ended 4/30/2019 | $41.07 | (2.16%) | 1.11%(c),(d) | 1.07%(c),(d),(e) | 0.47% | 62% | $192,878 |
| Year Ended 4/30/2018 | $45.24 | 10.32% | 1.10%(d) | 1.08%(d),(e) | 0.17% | 51% | $209,822 |
| Year Ended 4/30/2017 | $45.70 | 26.33% | 1.13%(d) | 1.12%(d),(e) | 0.34% | 50% | $239,246 |
| Year Ended 4/30/2016 | $40.71 | (2.34%) | 1.11% | 1.11%(e) | 0.54% | 65% | $237,720 |
| Year Ended 4/30/2015 | $46.28 | 3.75% | 1.08% | 1.08%(e) | 0.54% | 42% | $654,100 |
| Institutional 2 Class |
| Year Ended 4/30/2019 | $42.40 | (2.01%) | 0.97%(c),(d) | 0.94%(c),(d) | 0.61% | 62% | $39,831 |
| Year Ended 4/30/2018 | $46.57 | 10.45% | 0.97%(d) | 0.96%(d) | 0.35% | 51% | $15,739 |
| Year Ended 4/30/2017 | $46.88 | 26.50% | 0.97%(d) | 0.97%(d) | 0.52% | 50% | $9,135 |
| Year Ended 4/30/2016 | $41.64 | (2.19%) | 0.96% | 0.96% | 0.74% | 65% | $7,115 |
| Year Ended 4/30/2015 | $47.21 | 3.90% | 0.93% | 0.93% | 0.67% | 42% | $4,150 |
| Institutional 3 Class |
| Year Ended 4/30/2019 | $41.30 | (1.97%) | 0.92%(c),(d) | 0.89%(c),(d) | 0.64% | 62% | $108,132 |
| Year Ended 4/30/2018 | $45.45 | 10.50% | 0.93%(d) | 0.91%(d) | 0.37% | 51% | $115,296 |
| Year Ended 4/30/2017 | $45.86 | 26.57% | 0.92%(d) | 0.92%(d) | 0.22% | 50% | $64,230 |
| Year Ended 4/30/2016 | $40.83 | (2.13%) | 0.91% | 0.91% | 0.70% | 65% | $10,022 |
| Year Ended 4/30/2015 | $46.37 | 3.95% | 0.88% | 0.88% | 0.74% | 42% | $9,261 |
The accompanying Notes to Financial Statements are an integral part of this statement.
Columbia Small Cap Value Fund I | Annual Report 2019
| 21 |
Financial Highlights (continued)
| | Net asset value,
beginning of
period | Net
investment
income
(loss) | Net
realized
and
unrealized
gain (loss) | Total from
investment
operations | Distributions
from net
investment
income | Distributions
from net
realized
gains | Total
distributions to
shareholders |
| Class R |
| Year Ended 4/30/2019 | $40.61 | (0.01) | (1.09) | (1.10) | (0.06) | (2.95) | (3.01) |
| Year Ended 4/30/2018 | $41.63 | (0.13) | 3.94 | 3.81 | — | (4.83) | (4.83) |
| Year Ended 4/30/2017 | $37.54 | (0.06) | 8.87 | 8.81 | — | (4.72) | (4.72) |
| Year Ended 4/30/2016 | $43.09 | 0.02 | (1.13) | (1.11) | (0.05) | (4.39) | (4.44) |
| Year Ended 4/30/2015 | $48.28 | 0.01 | 1.32 | 1.33 | (0.05) | (6.47) | (6.52) |
| Notes to Financial Highlights |
| (a) | In addition to the fees and expenses that the Fund bears directly, the Fund indirectly bears a pro rata share of the fees and expenses of any other funds in which it invests. Such indirect expenses are not included in the Fund’s reported expense ratios. |
| (b) | Total net expenses include the impact of certain fee waivers/expense reimbursements made by the Investment Manager and certain of its affiliates, if applicable. |
| (c) | Ratios include interfund lending expense which is less than 0.01%. |
| (d) | Ratios include line of credit interest expense which is less than 0.01%. |
| (e) | The benefits derived from expense reductions had an impact of less than 0.01%. |
The accompanying Notes to Financial Statements are an integral part of this statement.
| 22 | Columbia Small Cap Value Fund I | Annual Report 2019 |
Financial Highlights (continued)
| | Net
asset
value,
end of
period | Total
return | Total gross
expense
ratio to
average
net assets(a) | Total net
expense
ratio to
average
net assets(a),(b) | Net investment
income (loss)
ratio to
average
net assets | Portfolio
turnover | Net
assets,
end of
period
(000’s) |
| Class R |
| Year Ended 4/30/2019 | $36.50 | (2.67%) | 1.60%(c),(d) | 1.57%(c),(d),(e) | (0.03%) | 62% | $2,048 |
| Year Ended 4/30/2018 | $40.61 | 9.77% | 1.60%(d) | 1.58%(d),(e) | (0.31%) | 51% | $3,790 |
| Year Ended 4/30/2017 | $41.63 | 25.71% | 1.63%(d) | 1.62%(d),(e) | (0.15%) | 50% | $3,032 |
| Year Ended 4/30/2016 | $37.54 | (2.83%) | 1.61% | 1.61%(e) | 0.06% | 65% | $2,760 |
| Year Ended 4/30/2015 | $43.09 | 3.22% | 1.58% | 1.58%(e) | 0.01% | 42% | $3,671 |
The accompanying Notes to Financial Statements are an integral part of this statement.
Columbia Small Cap Value Fund I | Annual Report 2019
| 23 |
Notes to Financial Statements
April 30, 2019
Note 1. Organization
Columbia Small Cap Value Fund I (the Fund), a series of Columbia Funds Series Trust I (the Trust), is a diversified fund. The Trust is registered under the Investment Company Act of 1940, as amended (the 1940 Act), as an open-end management investment company organized as a Massachusetts business trust.
Fund shares
The Trust may issue an unlimited number of shares (without par value). Although all share classes generally have identical voting, dividend and liquidation rights, each share class votes separately when required by the Trust’s organizational documents or by law. Different share classes pay different distribution amounts to the extent the expenses of such share classes differ, and distributions in liquidation will be proportional to the net asset value of each share class. Each share class has its own expense and sales charge structure. The Fund offers each of the share classes identified below.
Class A shares are subject to a maximum front-end sales charge of 5.75% based on the initial investment amount. Class A shares purchased without an initial sales charge in accounts aggregating $1 million to $50 million at the time of purchase are subject to a contingent deferred sales charge (CDSC) if the shares are sold within 18 months after purchase, charged as follows: 1.00% CDSC if redeemed within 12 months after purchase, and 0.50% CDSC if redeemed more than 12, but less than 18, months after purchase.
Advisor Class shares are not subject to sales charges and are generally available only to omnibus retirement plans and certain investors as described in the Fund’s prospectus.
Class C shares are subject to a 1.00% CDSC on shares redeemed within 12 months after purchase. Effective July 1, 2018, Class C shares automatically convert to Class A shares of the same Fund in the month of or the month following the 10-year anniversary of the Class C shares purchase date.
Institutional Class shares are not subject to sales charges and are generally available only to eligible investors, which are subject to different investment minimums as described in the Fund’s prospectus.
Institutional 2 Class shares are not subject to sales charges and are generally available only to investors purchasing through authorized investment professionals and omnibus retirement plans as described in the Fund’s prospectus.
Institutional 3 Class shares are not subject to sales charges and are available to institutional and certain other investors as described in the Fund’s prospectus.
Class R shares are not subject to sales charges and are generally available only to certain retirement plans and other investors as described in the Fund’s prospectus.
Note 2. Summary of significant accounting policies
Basis of preparation
The Fund is an investment company that applies the accounting and reporting guidance in the Financial Accounting Standards Board (FASB) Accounting Standards Codification Topic 946,Financial Services - Investment Companies (ASC 946). The financial statements are prepared in accordance with U.S. generally accepted accounting principles (GAAP), which requires management to make certain estimates and assumptions that affect the reported amounts of assets and liabilities, the disclosure of contingent assets and liabilities at the date of the financial statements and the reported amounts of income and expenses during the reporting period. Actual results could differ from those estimates.
The following is a summary of significant accounting policies followed by the Fund in the preparation of its financial statements.
| 24 | Columbia Small Cap Value Fund I | Annual Report 2019 |
Notes to Financial Statements (continued)
April 30, 2019
Security valuation
All equity securities and exchange-traded funds are valued at the close of business of the New York Stock Exchange. Equity securities and exchange-traded funds are valued at the last quoted sales price on the principal exchange or market on which they trade, except for securities traded on the NASDAQ Stock Market, which are valued at the NASDAQ official close price. Unlisted securities or listed securities for which there were no sales during the day are valued at the mean of the latest quoted bid and ask prices on such exchanges or markets.
Foreign equity securities are valued based on the closing price on the foreign exchange in which such securities are primarily traded. If any foreign equity security closing prices are not readily available, the securities are valued at the mean of the latest quoted bid and ask prices on such exchanges or markets. Foreign currency exchange rates are generally determined at 4:00 p.m. Eastern (U.S.) time. Many securities markets and exchanges outside the U.S. close prior to the close of the New York Stock Exchange; therefore, the closing prices for securities in such markets or on such exchanges may not fully reflect events that occur after such close but before the close of the New York Stock Exchange. In those situations, foreign securities will be fair valued pursuant to a policy adopted by the Board of Trustees, including, if available, utilizing a third party pricing service to determine these fair values. The third party pricing service takes into account multiple factors, including, but not limited to, movements in the U.S. securities markets, certain depositary receipts, futures contracts and foreign exchange rates that have occurred subsequent to the close of the foreign exchange or market, to determine a good faith estimate that reasonably reflects the current market conditions as of the close of the New York Stock Exchange. The fair value of a security is likely to be different from the quoted or published price, if available.
Investments in open-end investment companies, including money market funds, are valued at their latest net asset value.
Investments for which market quotations are not readily available, or that have quotations which management believes are not reflective of market value or reliable, are valued at fair value as determined in good faith under procedures approved by and under the general supervision of the Board of Trustees. If a security or class of securities (such as foreign securities) is valued at fair value, such value is likely to be different from the quoted or published price for the security.
The determination of fair value often requires significant judgment. To determine fair value, management may use assumptions including but not limited to future cash flows and estimated risk premiums. Multiple inputs from various sources may be used to determine fair value.
GAAP requires disclosure regarding the inputs and valuation techniques used to measure fair value and any changes in valuation inputs or techniques. In addition, investments shall be disclosed by major category. This information is disclosed following the Fund’s Portfolio of Investments.
Foreign currency transactions and translations
The values of all assets and liabilities denominated in foreign currencies are generally translated into U.S. dollars at exchange rates determined at the close of regular trading on the New York Stock Exchange. Net realized and unrealized gains (losses) on foreign currency transactions and translations include gains (losses) arising from the fluctuation in exchange rates between trade and settlement dates on securities transactions, gains (losses) arising from the disposition of foreign currency and currency gains (losses) between the accrual and payment dates on dividends, interest income and foreign withholding taxes.
For financial statement purposes, the Fund does not distinguish that portion of gains (losses) on investments which is due to changes in foreign exchange rates from that which is due to changes in market prices of the investments. Such fluctuations are included with the net realized and unrealized gains (losses) on investments in the Statement of Operations.
Security transactions
Security transactions are accounted for on the trade date. Cost is determined and gains (losses) are based upon the specific identification method for both financial statement and federal income tax purposes.
Columbia Small Cap Value Fund I | Annual Report 2019
| 25 |
Notes to Financial Statements (continued)
April 30, 2019
Income recognition
Corporate actions and dividend income are generally recorded net of any non-reclaimable tax withholdings, on the ex-dividend date or upon receipt of ex-dividend notification in the case of certain foreign securities.
The Fund may receive distributions from holdings in equity securities, business development companies (BDCs), exchange-traded funds (ETFs), limited partnerships (LPs), other regulated investment companies (RICs), and real estate investment trusts (REITs), which report information on the tax character of their distributions annually. These distributions are allocated to dividend income, capital gain and return of capital based on actual information reported. Return of capital is recorded as a reduction of the cost basis of securities held. If the Fund no longer owns the applicable securities, return of capital is recorded as a realized gain. With respect to REITs, to the extent actual information has not yet been reported, estimates for return of capital are made by the Fund’s management. Management’s estimates are subsequently adjusted when the actual character of the distributions is disclosed by the REITs, which could result in a proportionate change in return of capital to shareholders.
Awards from class action litigation are recorded as a reduction of cost basis if the Fund still owns the applicable securities on the payment date. If the Fund no longer owns the applicable securities, the proceeds are recorded as realized gains.
Expenses
General expenses of the Trust are allocated to the Fund and other funds of the Trust based upon relative net assets or other expense allocation methodologies determined by the nature of the expense. Expenses directly attributable to the Fund are charged to the Fund. Expenses directly attributable to a specific class of shares are charged to that share class.
Determination of class net asset value
All income, expenses (other than class-specific expenses, which are charged to that share class, as shown in the Statement of Operations) and realized and unrealized gains (losses) are allocated to each class of the Fund on a daily basis, based on the relative net assets of each class, for purposes of determining the net asset value of each class.
Federal income tax status
The Fund intends to qualify each year as a regulated investment company under Subchapter M of the Internal Revenue Code, as amended, and will distribute substantially all of its investment company taxable income and net capital gain, if any, for its tax year, and as such will not be subject to federal income taxes. In addition, the Fund intends to distribute in each calendar year substantially all of its ordinary income, capital gain net income and certain other amounts, if any, such that the Fund should not be subject to federal excise tax. Therefore, no federal income or excise tax provision is recorded.
Foreign taxes
The Fund may be subject to foreign taxes on income, gains on investments or currency repatriation, a portion of which may be recoverable. The Fund will accrue such taxes and recoveries, as applicable, based upon its current interpretation of tax rules and regulations that exist in the markets in which it invests.
Realized gains in certain countries may be subject to foreign taxes at the Fund level, based on statutory rates. The Fund accrues for such foreign taxes on realized and unrealized gains at the appropriate rate for each jurisdiction, as applicable. The amount, if any, is disclosed as a liability on the Statement of Assets and Liabilities.
Distributions to shareholders
Distributions from net investment income, if any, are declared and paid semi-annually. Net realized capital gains, if any, are distributed at least annually. Income distributions and capital gain distributions are determined in accordance with federal income tax regulations, which may differ from GAAP.
| 26 | Columbia Small Cap Value Fund I | Annual Report 2019 |
Notes to Financial Statements (continued)
April 30, 2019
Guarantees and indemnifications
Under the Trust’s organizational documents and, in some cases, by contract, its officers and trustees are indemnified against certain liabilities arising out of the performance of their duties to the Trust or its funds. In addition, certain of the Fund’s contracts with its service providers contain general indemnification clauses. The Fund’s maximum exposure under these arrangements is unknown since the amount of any future claims that may be made against the Fund cannot be determined, and the Fund has no historical basis for predicting the likelihood of any such claims.
Recent accounting pronouncements
Accounting Standards Update 2017-08 Premium Amortization on Purchased Callable Debt Securities
In March 2017, the Financial Accounting Standards Board issued Accounting Standards Update (ASU) No. 2017-08 Premium Amortization on Purchased Callable Debt Securities. ASU No. 2017-08 updates the accounting standards to shorten the amortization period for certain purchased callable debt securities, held at a premium, to be amortized to the earliest call date. The update applies to securities with explicit, noncontingent call features that are callable at fixed prices and on preset dates. The standard is effective for annual periods beginning after December 15, 2018 and interim periods within those fiscal years. Management does not expect the implementation of this guidance to have a material impact on the financial statement amounts and footnote disclosures.
Accounting Standards Update 2018-13 Disclosure Framework - Changes to the Disclosure Requirements for Fair Value Measurement
In August 2018, the Financial Accounting Standards Board issued Accounting Standards Update (ASU) No. 2018-13 Disclosure Framework - Changes to the Disclosure Requirements for Fair Value Measurement. ASU No. 2018-13, in addition to other modifications and additions, removes the requirement to disclose the amount and reasons for transfers between Level 1 and Level 2 of the fair value hierarchy and the policy for the timing of transfers between levels. The standard is effective for annual periods beginning after December 15, 2019 and interim periods within those fiscal years. At this time, management is evaluating the implication of this guidance and the impact it will have on the financial statement disclosures, if any.
Disclosure Update and Simplification
In September 2018, the Securities and Exchange Commission (SEC) released Final Rule 33-10532, Disclosure Update and Simplification, which amends certain financial statement disclosure requirements that the SEC determined to be redundant, outdated, or superseded in light of other SEC disclosure requirements, GAAP, or changes in the information environment. As a result of the amendments, management implemented disclosure changes which included removing the components of distributable earnings presented on the Statement of Assets and Liabilities and combining income and gain distributions paid to shareholders as presented on the Statement of Changes in Net Assets. Any values presented to meet prior year requirements were left unchanged. The amendments had no effect on the Fund’s net assets or results of operation.
Note 3. Fees and other transactions with affiliates
Management services fees
The Fund has entered into a Management Agreement with Columbia Management Investment Advisers, LLC (the Investment Manager), a wholly-owned subsidiary of Ameriprise Financial, Inc. (Ameriprise Financial). Under the Management Agreement, the Investment Manager provides the Fund with investment research and advice, as well as administrative and accounting services. The management services fee is an annual fee that is equal to a percentage of the Fund’s daily net assets that declines from 0.87% to 0.75% as the Fund’s net assets increase. The effective management services fee rate for the year ended April 30, 2019 was 0.86% of the Fund’s average daily net assets.
Columbia Small Cap Value Fund I | Annual Report 2019
| 27 |
Notes to Financial Statements (continued)
April 30, 2019
Compensation of board members
Members of the Board of Trustees who are not officers or employees of the Investment Manager or Ameriprise Financial are compensated for their services to the Fund as disclosed in the Statement of Operations. These members of the Board of Trustees may participate in a Deferred Compensation Plan (the Deferred Plan) which may be terminated at any time. Obligations of the Deferred Plan will be paid solely out of the Fund’s assets, and all amounts payable under the Deferred Plan constitute a general unsecured obligation of the Fund.
Compensation of Chief Compliance Officer
The Board of Trustees has appointed a Chief Compliance Officer to the Fund in accordance with federal securities regulations. As disclosed in the Statement of Operations, a portion of the Chief Compliance Officer’s total compensation is allocated to the Fund, along with other allocations to affiliated registered investment companies managed by the Investment Manager and its affiliates, based on relative net assets.
Transfer agency fees
Under a Transfer and Dividend Disbursing Agent Agreement, Columbia Management Investment Services Corp. (the Transfer Agent), an affiliate of the Investment Manager and a wholly-owned subsidiary of Ameriprise Financial, is responsible for providing transfer agency services to the Fund. The Transfer Agent has contracted with DST Asset Manager Solutions, Inc. (DST) to serve as sub-transfer agent. The Transfer Agent pays the fees of DST for services as sub-transfer agent and DST is not entitled to reimbursement for such fees from the Fund (with the exception of out-of-pocket fees).
The Fund pays the Transfer Agent a monthly transfer agency fee based on the number or the average value of accounts, depending on the type of account. In addition, the Fund pays the Transfer Agent a fee for shareholder services based on the number of accounts or on a percentage of the average aggregate value of the Fund’s shares maintained in omnibus accounts up to the lesser of the amount charged by the financial intermediary or a cap established by the Board of Trustees from time to time.
The Transfer Agent also receives compensation from the Fund for various shareholder services and reimbursements for certain out-of-pocket fees. Total transfer agency fees for Institutional 2 Class and Institutional 3 Class shares are subject to an annual limitation of not more than 0.07% and 0.02%, respectively, of the average daily net assets attributable to each share class.
For the year ended April 30, 2019, the Fund’s effective transfer agency fee rates as a percentage of average daily net assets of each class were as follows:
| | Effective rate (%) |
| Class A | 0.20 |
| Advisor Class | 0.20 |
| Class C | 0.19 |
| Institutional Class | 0.20 |
| Institutional 2 Class | 0.06 |
| Institutional 3 Class | 0.01 |
| Class R | 0.19 |
An annual minimum account balance fee of $20 may apply to certain accounts with a value below the applicable share class’s initial minimum investment requirements to reduce the impact of small accounts on transfer agency fees. These minimum account balance fees are remitted to the Fund and recorded as part of expense reductions in the Statement of Operations. For the year ended April 30, 2019, these minimum account balance fees reduced total expenses of the Fund by $2,555.
Distribution and service fees
The Fund has entered into an agreement with Columbia Management Investment Distributors, Inc. (the Distributor), an affiliate of the Investment Manager and a wholly-owned subsidiary of Ameriprise Financial, for distribution and shareholder services. The Board of Trustees has approved, and the Fund has adopted, distribution and shareholder service plans (the
| 28 | Columbia Small Cap Value Fund I | Annual Report 2019 |
Notes to Financial Statements (continued)
April 30, 2019
Plans) applicable to certain share classes, which set the distribution and service fees for the Fund. These fees are calculated daily and are intended to compensate the Distributor and/or eligible selling and/or servicing agents for selling shares of the Fund and providing services to investors.
Under the Plans, the Fund pays a monthly service fee to the Distributor at the maximum annual rate of 0.25% of the average daily net assets attributable to Class A and Class C shares of the Fund. Also under the Plans, the Fund pays a monthly distribution fee to the Distributor at the maximum annual rates of 0.75% and 0.50% of the average daily net assets attributable to Class C and Class R shares of the Fund, respectively.
Sales charges (unaudited)
Sales charges, including front-end charges and CDSCs, received by the Distributor for distributing Fund shares for the year ended April 30, 2019, if any, are listed below:
| | Amount ($) |
| Class A | 251,501 |
| Class C | 2,008 |
Expenses waived/reimbursed by the Investment Manager and its affiliates
The Investment Manager and certain of its affiliates have contractually agreed to waive fees and/or reimburse expenses (excluding certain fees and expenses described below) for the period(s) disclosed below, unless sooner terminated at the sole discretion of the Board of Trustees, so that the Fund’s net operating expenses, after giving effect to fees waived/expenses reimbursed and any balance credits and/or overdraft charges from the Fund’s custodian, do not exceed the following annual rate(s) as a percentage of the class’ average daily net assets:
| | September 1, 2018
through
August 31, 2019 | Prior to
September 1, 2018 |
| Class A | 1.32% | 1.32% |
| Advisor Class | 1.07 | 1.07 |
| Class C | 2.07 | 2.07 |
| Institutional Class | 1.07 | 1.07 |
| Institutional 2 Class | 0.94 | 0.95 |
| Institutional 3 Class | 0.89 | 0.90 |
| Class R | 1.57 | 1.57 |
Under the agreement governing these fee waivers and/or expense reimbursement arrangements, the following fees and expenses are excluded from the waiver/reimbursement commitment, and therefore will be paid by the Fund, if applicable: taxes (including foreign transaction taxes), expenses associated with investments in affiliated and non-affiliated pooled investment vehicles (including mutual funds and exchange-traded funds), transaction costs and brokerage commissions, costs related to any securities lending program, dividend expenses associated with securities sold short, inverse floater program fees and expenses, transaction charges and interest on borrowed money, interest, infrequent and/or unusual expenses and any other expenses the exclusion of which is specifically approved by the Board of Trustees. This agreement may be modified or amended only with approval from the Investment Manager, certain of its affiliates and the Fund. Any fees waived and/or expenses reimbursed under the expense reimbursement arrangements described above are not recoverable by the Investment Manager or its affiliates in future periods.
Note 4. Federal tax information
The timing and character of income and capital gain distributions are determined in accordance with income tax regulations, which may differ from GAAP because of temporary or permanent book to tax differences.
Columbia Small Cap Value Fund I | Annual Report 2019
| 29 |
Notes to Financial Statements (continued)
April 30, 2019
At April 30, 2019, these differences were primarily due to differing treatment for deferral/reversal of wash sale losses, post-October capital losses, trustees’ deferred compensation, foreign currency transactions, distribution reclassifications and earnings and profits distributed to shareholders on the redemption of shares. To the extent these differences were permanent, reclassifications were made among the components of the Fund’s net assets. Temporary differences do not require reclassifications.
The following reclassifications were made:
Excess of distributions
over net investment
income ($) | Accumulated
net realized
gain ($) | Paid in
capital ($) |
| 285,542 | (4,400,904) | 4,115,362 |
Net investment income (loss) and net realized gains (losses), as disclosed in the Statement of Operations, and net assets were not affected by this reclassification.
The tax character of distributions paid during the years indicated was as follows:
| Year Ended April 30, 2019 | Year Ended April 30, 2018 |
Ordinary
income ($) | Long-term
capital gains ($) | Total ($) | Ordinary
income ($) | Long-term
capital gains ($) | Total ($) |
| 2,489,080 | 45,579,577 | 48,068,657 | 938,077 | 66,391,472 | 67,329,549 |
Short-term capital gain distributions, if any, are considered ordinary income distributions for tax purposes.
At April 30, 2019, the components of distributable earnings on a tax basis were as follows:
Undistributed
ordinary income ($) | Undistributed
long-term
capital gains ($) | Capital loss
carryforwards ($) | Net unrealized
appreciation ($) |
| — | 15,811,673 | — | 151,916,435 |
At April 30, 2019, the cost of all investments for federal income tax purposes along with the aggregate gross unrealized appreciation and depreciation based on that cost was:
Federal
tax cost ($) | Gross unrealized
appreciation ($) | Gross unrealized
(depreciation) ($) | Net unrealized
appreciation ($) |
| 462,845,826 | 167,740,472 | (15,824,037) | 151,916,435 |
Tax cost of investments and unrealized appreciation/(depreciation) may also include timing differences that do not constitute adjustments to tax basis.
Under current tax rules, regulated investment companies can elect to treat certain late-year ordinary losses incurred and post-October capital losses (capital losses realized after October 31) as arising on the first day of the following taxable year. As of April 30, 2019, the Fund will elect to treat the following late-year ordinary losses and post-October capital losses as arising on May 1, 2019.
Late year
ordinary losses ($) | Post-October
capital losses ($) |
| — | 10,894,452 |
Management of the Fund has concluded that there are no significant uncertain tax positions in the Fund that would require recognition in the financial statements. However, management’s conclusion may be subject to review and adjustment at a later date based on factors including, but not limited to, new tax laws, regulations, and administrative interpretations (including relevant court decisions). Generally, the Fund’s federal tax returns for the prior three fiscal years remain subject to examination by the Internal Revenue Service.
| 30 | Columbia Small Cap Value Fund I | Annual Report 2019 |
Notes to Financial Statements (continued)
April 30, 2019
Note 5. Portfolio information
The cost of purchases and proceeds from sales of securities, excluding short-term investments and derivatives, if any, aggregated to $401,044,719 and $394,846,952, respectively, for the year ended April 30, 2019. The amount of purchase and sale activity impacts the portfolio turnover rate reported in the Financial Highlights.
Note 6. Affiliated money market fund
The Fund invests in Columbia Short-Term Cash Fund, an affiliated money market fund established for the exclusive use by the Fund and other affiliated funds (the Affiliated MMF). The income earned by the Fund from such investments is included as Dividends - affiliated issuers in the Statement of Operations. As an investing fund, the Fund indirectly bears its proportionate share of the expenses of the Affiliated MMF. The Affiliated MMF prices its shares with a floating net asset value. In addition, the Board of Trustees of the Affiliated MMF may impose a fee on redemptions (sometimes referred to as a liquidity fee) or temporarily suspend redemptions (sometimes referred to as imposing a redemption gate) in the event its liquidity falls below regulatory limits.
Note 7. Interfund lending
Pursuant to an exemptive order granted by the Securities and Exchange Commission, the Fund participates in a program (the Interfund Program) allowing each participating Columbia Fund (each, a Participating Fund) to lend money directly to and, except for closed-end funds and money market funds, borrow money directly from other Participating Funds for temporary purposes. The amounts eligible for borrowing and lending under the Interfund Program are subject to certain restrictions.
Interfund loans are subject to the risk that the borrowing fund could be unable to repay the loan when due, and a delay in repayment to the lending fund could result in lost opportunities and/or additional lending costs. The exemptive order is subject to conditions intended to mitigate conflicts of interest arising from the Investment Manager’s relationship with each Participating Fund.
The Fund’s activity in the Interfund Program during the year ended April 30, 2019 was as follows:
| Borrower or lender | Average loan
balance ($) | Weighted average
interest rate (%) | Days
outstanding |
| Borrower | 2,250,000 | 3.04 | 6 |
Interest expense incurred by the Fund is recorded as Interfund lending in the Statement of Operations. The Fund had no outstanding interfund loans at April 30, 2019.
Note 8. Line of credit
The Fund has access to a revolving credit facility with a syndicate of banks led by Citibank, N.A., HSBC Bank USA, N.A. and JPMorgan Chase Bank, N.A. whereby the Fund may borrow for the temporary funding of shareholder redemptions or for other temporary or emergency purposes. The credit facility, which is a collective agreement between the Fund and certain other funds managed by the Investment Manager or an affiliated investment manager, severally and not jointly, permits collective borrowings up to $1 billion. Interest is charged to each participating fund based on its borrowings at a rate equal to the higher of (i) the federal funds effective rate, (ii) the one-month LIBOR rate and (iii) the overnight bank funding rate, plus in each case, 1.00%. Each borrowing under the credit facility matures no later than 60 days after the date of borrowing. The Fund also pays a commitment fee equal to its pro rata share of the unused amount of the credit facility at a rate of 0.15% per annum. The commitment fee is included in other expenses in the Statement of Operations. This agreement expires annually in December unless extended or renewed.
For the year ended April 30, 2019, the Fund’s borrowing activity was as follows:
Average loan
balance ($) | Weighted average
interest rate (%) | Days
outstanding |
| 3,377,778 | 3.50 | 9 |
Columbia Small Cap Value Fund I | Annual Report 2019
| 31 |
Notes to Financial Statements (continued)
April 30, 2019
Interest expense incurred by the Fund is recorded as a line of credit interest expense in the Statement of Operations. The Fund had no outstanding borrowings at April 30, 2019.
Note 9. Significant risks
Financial sector risk
The Fund may be more susceptible to the particular risks that may affect companies in the financial services sector than if it were invested in a wider variety of companies in unrelated sectors. Companies in the financial services sector are subject to certain risks, including the risk of regulatory change, decreased liquidity in credit markets and unstable interest rates. Such companies may have concentrated portfolios, such as a high level of loans to real estate developers, which makes them vulnerable to economic conditions that affect that industry. Performance of such companies may be affected by competitive pressures and exposure to investments or agreements that, under certain circumstances, may lead to losses (e.g., subprime loans). Companies in the financial services sector are subject to extensive governmental regulation that may limit the amount and types of loans and other financial commitments they can make, and interest rates and fees that they may charge. In addition, profitability of such companies is largely dependent upon the availability and the cost of capital.
Shareholder concentration risk
At April 30, 2019, one unaffiliated shareholder of record owned 18.7% of the outstanding shares of the Fund in one or more accounts. The Fund has no knowledge about whether any portion of those shares was owned beneficially. Affiliated shareholders of record owned 18.5% of the outstanding shares of the Fund in one or more accounts. Subscription and redemption activity by concentrated accounts may have a significant effect on the operations of the Fund. In the case of a large redemption, the Fund may be forced to sell investments at inopportune times, including its liquid positions, which may result in Fund losses and the Fund holding a higher percentage of less liquid positions. Large redemptions could result in decreased economies of scale and increased operating expenses for non-redeeming Fund shareholders.
Note 10. Subsequent events
Management has evaluated the events and transactions that have occurred through the date the financial statements were issued and noted no items requiring adjustment of the financial statements or additional disclosure.
Note 11. Information regarding pending and settled legal proceedings
Ameriprise Financial and certain of its affiliates have historically been involved in a number of legal, arbitration and regulatory proceedings, including routine litigation, class actions, and governmental actions, concerning matters arising in connection with the conduct of their business activities. Ameriprise Financial believes that the Fund is not currently the subject of, and that neither Ameriprise Financial nor any of its affiliates are the subject of, any pending legal, arbitration or regulatory proceedings that are likely to have a material adverse effect on the Fund or the ability of Ameriprise Financial or its affiliates to perform under their contracts with the Fund. Ameriprise Financial is required to make quarterly (10-Q), annual (10-K) and, as necessary, 8-K filings with the Securities and Exchange Commission (SEC) on legal and regulatory matters that relate to Ameriprise Financial and its affiliates. Copies of these filings may be obtained by accessing the SEC website at www.sec.gov.
There can be no assurance that these matters, or the adverse publicity associated with them, will not result in increased Fund redemptions, reduced sale of Fund shares or other adverse consequences to the Fund. Further, although we believe proceedings are not likely to have a material adverse effect on the Fund or the ability of Ameriprise Financial or its affiliates to perform under their contracts with the Fund, these proceedings are subject to uncertainties and, as such, we are unable to estimate the possible loss or range of loss that may result. An adverse outcome in one or more of these proceedings could result in adverse judgments, settlements, fines, penalties or other relief that could have a material adverse effect on the consolidated financial condition or results of operations of Ameriprise Financial.
| 32 | Columbia Small Cap Value Fund I | Annual Report 2019 |
Report of Independent Registered Public Accounting Firm
To the Board of Trustees of Columbia Funds Series Trust I and Shareholders of Columbia Small Cap Value Fund I
Opinion on the Financial Statements
We have audited the accompanying statement of assets and liabilities, including the portfolio of investments, of Columbia Small Cap Value Fund I (one of the funds constituting Columbia Funds Series Trust I, referred to hereafter as the "Fund") as of April 30, 2019, the related statement of operations for the year ended April 30, 2019, the statement of changes in net assets for each of the two years in the period ended April 30, 2019, including the related notes, and the financial highlights for each of the five years in the period ended April 30, 2019 (collectively referred to as the “financial statements”). In our opinion, the financial statements present fairly, in all material respects, the financial position of the Fund as of April 30, 2019, the results of its operations for the year then ended, the changes in its net assets for each of the two years in the period ended April 30, 2019 and the financial highlights for each of the five years in the period ended April 30, 2019 in conformity with accounting principles generally accepted in the United States of America.
Basis for Opinion
These financial statements are the responsibility of the Fund’s management. Our responsibility is to express an opinion on the Fund’s financial statements based on our audits. We are a public accounting firm registered with the Public Company Accounting Oversight Board (United States) (PCAOB) and are required to be independent with respect to the Fund in accordance with the U.S. federal securities laws and the applicable rules and regulations of the Securities and Exchange Commission and the PCAOB.
We conducted our audits of these financial statements in accordance with the standards of the PCAOB. Those standards require that we plan and perform the audit to obtain reasonable assurance about whether the financial statements are free of material misstatement, whether due to error or fraud.
Our audits included performing procedures to assess the risks of material misstatement of the financial statements, whether due to error or fraud, and performing procedures that respond to those risks. Such procedures included examining, on a test basis, evidence regarding the amounts and disclosures in the financial statements. Our audits also included evaluating the accounting principles used and significant estimates made by management, as well as evaluating the overall presentation of the financial statements. Our procedures included confirmation of securities owned as of April 30, 2019 by correspondence with the custodian, transfer agent and brokers; when replies were not received from brokers, we performed other auditing procedures. We believe that our audits provide a reasonable basis for our opinion.
/s/PricewaterhouseCoopers LLP
Minneapolis, Minnesota
June 21, 2019
We have served as the auditor of one or more investment companies within the Columbia Funds Complex since 1977.
Columbia Small Cap Value Fund I | Annual Report 2019
| 33 |
Federal Income Tax Information
(Unaudited)
The Fund hereby designates the following tax attributes for the fiscal year ended April 30, 2019. Shareholders will be notified in early 2020 of the amounts for use in preparing 2019 income tax returns.
Qualified
dividend
income | Dividends
received
deduction | Capital
gain
dividend |
| 100.00% | 100.00% | $53,928,709 |
Qualified dividend income. For taxable, non-corporate shareholders, the percentage of ordinary income distributed during the fiscal year that represents qualified dividend income subject to reduced tax rates.
Dividends received deduction. The percentage of ordinary income distributed during the fiscal year that qualifies for the corporate dividends received deduction.
Capital gain dividend. The Fund designates as a capital gain dividend the amount reflected above, or if subsequently determined to be different, the net capital gain of such fiscal period.
| 34 | Columbia Small Cap Value Fund I | Annual Report 2019 |
The Board oversees the Fund’s operations and appoints officers who are responsible for day-to-day business decisions based on policies set by the Board. The following table provides basic biographical information about the Fund’s Trustees as of the printing of this report, including their principal occupations during the past five years, although specific titles for individuals may have varied over the period. The year set forth beneath Length of Service in the table below is the year in which the Trustee was first appointed or elected as Trustee to any Fund currently in the Columbia Funds Complex or a predecessor thereof. Under current Board policy, members serve terms of indefinite duration.
Independent trustees
| Name, address, year of birth | Position held with the Trust and length of service | Principal occupation(s) during the past five years and other relevant professional experience | Number of Funds in the Columbia Fund Complex overseen | Other directorships held by Trustee during the past five years |
Janet Langford Carrig
c/o Columbia Management
Investment Advisers, LLC
225 Franklin Street
Mail Drop BX32 05228
Boston, MA 02110
1957 | Trustee
1996 | Senior Vice President, General Counsel and Corporate Secretary, ConocoPhillips (independent energy company) from September 2007 to October 2018 | 69 | None |
Douglas A. Hacker
c/o Columbia Management
Investment Advisers, LLC
225 Franklin Street
Mail Drop BX32 05228
Boston, MA 02110
1955 | Trustee and Chairman of the Board
1996 | Independent business executive since May 2006; Executive Vice President — Strategy of United Airlines from December 2002 to May 2006; President of UAL Loyalty Services (airline marketing company) from September 2001 to December 2002; Executive Vice President and Chief Financial Officer of United Airlines from July 1999 to September 2001 | 69 | Spartan Nash Company, (food distributor); Nash Finch Company (food distributor) from 2005 to 2013; Aircastle Limited (aircraft leasing); SeaCube Container Leasing Ltd. (container leasing) from 2010 to 2013; and Travelport Worldwide Limited (travel information technology) |
Nancy T. Lukitsh
c/o Columbia Management
Investment Advisers, LLC
225 Franklin Street
Mail Drop BX32 05228
Boston, MA 02110
1956 | Trustee
2011 | Senior Vice President, Partner and Director of Marketing, Wellington Management Company, LLP (investment adviser) from 1997 to 2010; Chair, Wellington Management Portfolios (commingled non-U.S. investment pools) from 2007 to 2010; Director, Wellington Trust Company, NA and other Wellington affiliates from 1997 to 2010 | 69 | None |
David M. Moffett
c/o Columbia Management
Investment Advisers, LLC
225 Franklin Street
Mail Drop BX32 05228
Boston, MA 02110
1952 | Trustee
2011 | Retired. Consultant to Bridgewater and Associates | 69 | Director, CSX Corporation (transportation suppliers); Genworth Financial, Inc. (financial and insurance products and services); PayPal Holdings Inc. (payment and data processing services); Trustee, University of Oklahoma Foundation; former Director, eBay Inc. (online trading community), 2007-2015; and former Director, CIT Bank, CIT Group Inc. (commercial and consumer finance), 2010-2016 |
Columbia Small Cap Value Fund I | Annual Report 2019
| 35 |
TRUSTEES AND OFFICERS (continued)
Independent trustees (continued)
| Name, address, year of birth | Position held with the Trust and length of service | Principal occupation(s) during the past five years and other relevant professional experience | Number of Funds in the Columbia Fund Complex overseen | Other directorships held by Trustee during the past five years |
John J. Neuhauser
c/o Columbia Management
Investment Advisers, LLC
225 Franklin Street
Mail Drop BX32 05228
Boston, MA 02110
1943 | Trustee
1984 | President, Saint Michael’s College from August 2007 to June 2018; Director or Trustee of several non-profit organizations, including University of Vermont Medical Center; Academic Vice President and Dean of Faculties, Boston College from August 1999 to October 2005; University Professor, Boston College from November 2005 to August 2007 | 69 | Liberty All-Star Equity Fund and Liberty All- Star Growth Fund (closed-end funds) |
Patrick J. Simpson
c/o Columbia Management
Investment Advisers, LLC
225 Franklin Street
Mail Drop BX32 05228
Boston, MA 02110
1944 | Trustee
2000 | Of Counsel, Perkins Coie LLP (law firm) since 2015; Partner, Perkins Coie LLP from 1988 to 2014 | 69 | M Fund, Inc. (M Funds mutual fund family) |
Anne-Lee Verville
c/o Columbia Management
Investment Advisers, LLC
225 Franklin Street
Mail Drop BX32 05228
Boston, MA 02110
1945 | Trustee
1998 | Retired. General Manager, Global Education Industry from 1994 to 1997, President – Application Systems Division from 1991 to 1994, Chief Financial Officer – US Marketing & Services from 1988 to 1991, and Chief Information Officer from 1987 to 1988, IBM Corporation (computer and technology) | 69 | Enesco Group, Inc. (producer of giftware and home and garden decor products) from 2001 to 2006 |
Consultants to the Independent Trustees*
| Name, address, year of birth | Position held with the Trust and length of service | Principal occupation(s) during the past five years and other relevant professional experience | Number of Funds in the Columbia Funds complex overseen | Other directorships held by Trustee during the past five years |
J. Kevin Connaughton
c/o Columbia
Management Investment
Advisers, LLC,
225 Franklin Street
Mail Drop BX32 05228,
Boston, MA 02110
1964 | Independent Trustee Consultant
2016 | Independent Trustee Consultant, Columbia Funds since March 2016; Adjunct Professor of Finance, Bentley University since November 2017; Managing Director and General Manager of Mutual Fund Products, Columbia Management Investment Advisers, LLC from May 2010 to February 2015; President, Columbia Funds from 2009 to 2015; and senior officer of Columbia Funds and affiliated funds from 2003 to 2015 | 69 | Director, The Autism Project since March 2015; former Trustee, New Century Portfolios, March 2015-December 2017; formerly on Board of Governors, Gateway Healthcare, January 2016 – December 2017 |
| 36 | Columbia Small Cap Value Fund I | Annual Report 2019 |
TRUSTEES AND OFFICERS (continued)
Consultants to the Independent Trustees* (continued)
| Name, address, year of birth | Position held with the Trust and length of service | Principal occupation(s) during the past five years and other relevant professional experience | Number of Funds in the Columbia Funds complex overseen | Other directorships held by Trustee during the past five years |
Olive Darragh
c/o Columbia
Management Investment
Advisers, LLC,
225 Franklin Street,
Mail Drop BX32 05228,
Boston, MA 02110
1962 | Independent Trustee Consultant 2019 | Independent Trustee Consultant, Columbia Funds since June 2019; Managing Director of Darragh Inc. (a strategy and talent management consulting firm) since 2010; Founder and CEO, Zolio (an investment management talent identification platform) since 2004; Partner, Tudor Investments from 2004 to 2010; Senior Partner, McKinsey & Company from 2001 to 2004 | 69 | Director, University of Edinburgh Business School; former Director, Boston Public Library Foundation |
Natalie A. Trunow
c/o Columbia
Management Investment
Advisers, LLC,
225 Franklin Street
Mail Drop BX32 05228,
Boston, MA 02110
1967 | Independent Trustee Consultant
2016 | Independent Trustee Consultant, Columbia Funds since September 2016; Chief Executive Officer, Millennial Portfolio Solutions LLC (asset management and consulting services) since January 2016; Director of Investments, Casey Family Programs from April 2016 to September 2016; Senior Vice President and Chief Investment Officer, Calvert Investments from August 2008 to January 2016; Section Head and Portfolio Manager, General Motors Asset Management from June 1997 to August 2008 | 69 | Director, Health Services for Children with Special Needs, Inc.; Director, Guidewell Financial Solutions |
| * | J. Kevin Connaughton was appointed consultant to the Independent Trustees effective March 1, 2016. Olive Darragh was appointed consultant to the Independent Trustees effective June 10, 2019. Natalie A. Trunow was appointed consultant to the Independent Trustees effective September 1, 2016. Shareholders of the Funds are expected to be asked to elect each of Mr. Connaughton, Ms. Darragh and Ms. Trunow as a Trustee at a future shareholder meeting. |
Interested trustee affiliated with Investment Manager*
| Name, address, year of birth | Position held with the Trust and length of service | Principal occupation(s) during the past five years and other relevant professional experience | Number of Funds in the Columbia Funds Complex overseen | Other directorships held by Trustee during the past five years |
William F. Truscott
c/o Columbia Management
Investment Advisers, LLC
225 Franklin Street
Boston, MA 02110
1960 | Trustee
2012 | Chairman of the Board and President, Columbia Management Investment Advisers, LLC since May 2010 and February 2012, respectively; Chief Executive Officer, Global Asset Management, Ameriprise Financial, Inc. since September 2012 (previously Chief Executive Officer, U.S. Asset Management & President, Annuities, May 2010-September 2012); Director and Chief Executive Officer, Columbia Management Investment Distributors, Inc. since May 2010 and February 2012, respectively; Chairman of the Board and Chief Executive Officer, RiverSource Distributors, Inc. since 2006; Director, Threadneedle Asset Management Holdings, SARL since 2014; President and Chief Executive Officer, Ameriprise Certificate Company, 2006-August 2012 | 188 | Chairman of the Board, Columbia Management Investment Advisers, LLC since May 2010; Director, Columbia Management Investment Distributors, Inc. since May 2010; former Director, Ameriprise Certificate Company, 2006 - January 2013 |
| * | Interested person (as defined under the 1940 Act) by reason of being an officer, director, security holder and/or employee of the Investment Manager or Ameriprise Financial. |
The Statement of Additional Information has additional information about the Fund’s Board members and is available, without charge, upon request by calling 800.345.6611, visiting columbiathreadneedleus.com/investor/ or contacting your financial intermediary.
Columbia Small Cap Value Fund I | Annual Report 2019
| 37 |
TRUSTEES AND OFFICERS (continued)
The Board has appointed officers who are responsible for day-to-day business decisions based on policies it has established. The officers serve at the pleasure of the Board. The following table provides basic information about the Officers of the Fund, including principal occupations during the past five years, although their specific titles may have varied over the period. In addition to Mr. Truscott, who is Senior Vice President, the Fund’s other officers are:
Fund officers
Name,
address and
year of birth | Position and year
first appointed to
position for any Fund
in the Columbia
Funds complex or a
predecessor thereof | Principal occupation(s) during past five years |
Christopher O. Petersen
5228 Ameriprise
Financial Center
Minneapolis, MN 55474
Born 1970 | President and Principal Executive Officer (2015) | Vice President and Lead Chief Counsel, Ameriprise Financial, Inc. since January 2015 (previously Vice President and Chief Counsel, January 2010 - December 2014; officer of Columbia Funds and affiliated funds since 2007. |
Michael G. Clarke
225 Franklin Street
Boston, MA 02110
Born 1969 | Chief Financial Officer (Principal Financial Officer) (2009) and Senior Vice President (2019) | Vice President, Head of North American Operations, and Co-Head of Global Operations, Columbia Management Investment Advisers, LLC, since June 2019 (previously Vice President – Accounting and Tax, May 2010 - May 2019); senior officer of Columbia Funds and affiliated funds since 2002 (previously Treasurer and Chief Accounting Officer, January 2009 - January 2019 and December 2015 - January 2019, respectively). |
Joseph Beranek
5890 Ameriprise
Financial Center
Minneapolis, MN 55474
Born 1965 | Treasurer and Chief Accounting Officer (Principal Accounting Officer) (2019) | Vice President — Mutual Fund Accounting and Financial Reporting, Columbia Management Investment Advisers, LLC, since December 2018 and March 2017, respectively (previously Vice President — Pricing and Corporate Actions, May 2010 - March 2017). |
Paul B. Goucher
485 Lexington Avenue
New York, NY 10017
Born 1968 | Senior Vice President (2011) and Assistant Secretary (2008) | Senior Vice President and Assistant General Counsel, Ameriprise Financial, Inc. since January 2017 (previously Vice President and Lead Chief Counsel, November 2008 - January 2017 and January 2013 - January 2017, respectively); Vice President, Chief Legal Officer and Assistant Secretary, Columbia Management Investment Advisers, LLC since March 2015 (previously Vice President and Assistant Secretary, May 2010 – March 2015). |
Thomas P. McGuire
225 Franklin Street
Boston, MA 02110
Born 1972 | Senior Vice President and Chief Compliance Officer (2012) | Vice President — Asset Management Compliance, Ameriprise Financial, Inc., since May 2010; Chief Compliance Officer, Ameriprise Certificate Company since September 2010. |
Colin Moore
225 Franklin Street
Boston, MA 02110
Born 1958 | Senior Vice President (2010) | Executive Vice President and Global Chief Investment Officer, Ameriprise Financial, Inc., since July 2013; Executive Vice President and Global Chief Investment Officer, Columbia Management Investment Advisers, LLC since July 2013. |
Ryan C. Larrenaga
225 Franklin Street
Boston, MA 02110
Born 1970 | Senior Vice President (2017), Chief Legal Officer (2017), and Secretary (2015) | Vice President and Chief Counsel, Ameriprise Financial, Inc. since August 2018 (previously Vice President and Group Counsel, August 2011 - August 2018); officer of Columbia Funds and affiliated funds since 2005. |
Michael E. DeFao
225 Franklin Street
Boston, MA 02110
Born 1968 | Vice President (2011) and Assistant Secretary (2010) | Vice President and Chief Counsel, Ameriprise Financial, Inc. since May 2010. |
Lyn Kephart-Strong
5228 Ameriprise
Financial Center
Minneapolis, MN 55474
Born 1960 | Vice President (2015) | President, Columbia Management Investment Services Corp. since October 2014; Vice President & Resolution Officer, Ameriprise Trust Company since August 2009. |
| 38 | Columbia Small Cap Value Fund I | Annual Report 2019 |
The Fund mails one shareholder report to each shareholder address, unless such shareholder elected to receive shareholder reports from the Fund electronically. If you would like more than one report, please call shareholder services at 800.345.6611 and additional reports will be sent to you.
Proxy voting policies and procedures
The policy of the Board of Trustees is to vote the proxies of the companies in which the Fund holds investments consistent with the procedures as stated in the Statement of Additional Information (SAI). You may obtain a copy of the SAI without charge by calling 800.345.6611; contacting your financial intermediary; visiting columbiathreadneedleus.com/investor/; or searching the website of the Securities and Exchange Commission (SEC) at sec.gov. Information regarding how the Fund voted proxies relating to portfolio securities is filed with the SEC by August 31st for the most recent 12-month period ending June 30th of that year, and is available without charge by visiting columbiathreadneedleus.com/investor/, or searching the website of the SEC at sec.gov.
Quarterly schedule of investments
The Fund files a complete schedule of portfolio holdings with the SEC for the first and third quarters of each fiscal year on Form N-Q or Form N-PORT (available for filings after March 31, 2019). The Fund’s Form N-Q or Form N-PORT is available on the SEC’s website at sec.gov. The Fund’s complete schedule of portfolio holdings, as filed on Form N-Q or Form N-PORT, can also be obtained without charge, upon request, by calling 800.345.6611.
Additional Fund information
For more information about the Fund, please visit columbiathreadneedleus.com/investor/ or call 800.345.6611. Customer Service Representatives are available to answer your questions Monday through Friday from 8 a.m. to 7 p.m. Eastern time.
Fund investment manager
Columbia Management Investment Advisers, LLC
225 Franklin Street
Boston, MA 02110
Fund distributor
Columbia Management Investment Distributors, Inc.
225 Franklin Street
Boston, MA 02110
Fund transfer agent
Columbia Management Investment Services Corp.
P.O. Box 219104
Kansas City, MO 64121-9104
Columbia Small Cap Value Fund I | Annual Report 2019
| 39 |
Columbia Small Cap Value Fund I
P.O. Box 219104
Kansas City, MO 64121-9104
Please read and consider the investment objectives, risks, charges and expenses for any fund carefully before investing. For a prospectus and summary prospectus, which contains this and other important information about the Fund, go to
columbiathreadneedleus.com/investor/. The Fund is distributed by Columbia Management Investment Distributors, Inc., member FINRA, and managed by Columbia Management Investment Advisers, LLC.
Columbia Threadneedle Investments (Columbia Threadneedle) is the global brand name of the Columbia and Threadneedle group of companies. All rights reserved.
© 2019 Columbia Management Investment Advisers, LLC.
columbiathreadneedleus.com/investor/

Annual Report
April 30, 2019
Columbia U.S. Treasury Index Fund
Beginning on January 1, 2021, as permitted by regulations adopted by the Securities and Exchange Commission, paper copies of the Fund’s annual and semiannual shareholder reports like this one will no longer be sent by mail, unless you specifically request paper copies of the reports. Instead, the reports will be made available on the Fund’s website (columbiathreadneedleus.com/investor/), and each time a report is posted you will be notified by mail and provided with a website address to access the report.
If you have already elected to receive shareholder reports electronically, you will not be affected by this change and you need not take any action. You may elect to receive shareholder reports and other communications from the Fund electronically at any time by contacting your financial intermediary (such as a broker-dealer or bank) or, for Fund shares held directly with the Fund, by calling 800.345.6611 or by enrolling in “eDelivery” by logging into your account at columbiathreadneedleus.com/investor/.
You may elect to receive all future reports in paper free of charge. If you invest through a financial intermediary, you can contact your financial intermediary to request that you continue receiving paper copies of your shareholder reports. If you invest directly with the Fund, you can call 800.345.6611 to let the Fund know you wish to continue receiving paper copies of your shareholder reports. Your election to receive paper reports will apply to all Columbia Funds held in your account if you invest through a financial intermediary or all Columbia Funds held with the fund complex if you invest directly with the Fund.
Not FDIC Insured • No bank guarantee • May lose value
Columbia U.S. Treasury Index Fund | Annual Report 2019
Investment objective
Columbia U.S. Treasury Index Fund (the Fund) seeks total return that corresponds to the total return of the FTSE USBIG Treasury Index, before fees and expenses.
Portfolio management
Alan Erickson, CFA
Portfolio Manager
Managed Fund since 2017
| Average annual total returns (%) (for the period ended April 30, 2019) |
| | | Inception | 1 Year | 5 Years | 10 Years |
| Class A | 11/25/02 | 4.32 | 1.60 | 2.16 |
| Class C | Excluding sales charges | 11/25/02 | 3.59 | 0.91 | 1.50 |
| | Including sales charges | | 2.59 | 0.91 | 1.50 |
| Institutional Class | 06/04/91 | 4.57 | 1.79 | 2.38 |
| Institutional 2 Class* | 11/08/12 | 4.48 | 1.76 | 2.37 |
| Institutional 3 Class* | 03/01/17 | 4.56 | 1.77 | 2.37 |
| FTSE USBIG Treasury Index | | 4.73 | 1.97 | 2.55 |
Returns for Class C shares are shown with and without the 1.00% contingent deferred sales charge for the first year only. The Fund’s other share classes are not subject to sales charges and have limited eligibility. Please see the Fund’s prospectus for details. Performance for different share classes will vary based on differences in sales charges and fees associated with each share class. All results shown assume reinvestment of distributions during the period. Returns do not reflect the deduction of taxes that a shareholder may pay on Fund distributions or on the redemption of Fund shares. Performance results reflect the effect of any fee waivers or reimbursements of Fund expenses by Columbia Management Investment Advisers, LLC and/or any of its affiliates. Absent these fee waivers or expense reimbursement arrangements, performance results would have been lower.
The performance information shown represents past performance and is not a guarantee of future results. The investment return and principal value of your investment will fluctuate so that your shares, when redeemed, may be worth more or less than their original cost. Current performance may be lower or higher than the performance information shown. You may obtain performance information current to the most recent month-end by contacting your financial intermediary, visiting columbiathreadneedleus.com/investor/ or calling 800.345.6611.
| * | The returns shown for periods prior to the share class inception date (including returns for the Life of the Fund, if shown, which are since Fund inception) include the returns of the Fund’s oldest share class. These returns are adjusted to reflect any higher class-related operating expenses of the newer share classes, as applicable. Please visit columbiathreadneedleus.com/investor/investment-products/mutual-funds/appended-performance for more information. |
The FTSE USBIG Treasury Index tracks the performance of US Dollar-denominated bonds issued in the US investment-grade bond market. The index includes fixed-rate U.S. Treasury bonds with USD 5 billion public amount outstanding and greater than one year to maturity. The index excludes Federal Reserve purchases, inflation-indexed securities and STRIPS.
Indices are not available for investment, are not professionally managed and do not reflect sales charges, fees, brokerage commissions, taxes or other expenses of investing. Securities in the Fund may not match those in an index.
Columbia U.S. Treasury Index Fund | Annual Report 2019
| 3 |
Fund at a Glance (continued)
Performance of a hypothetical $10,000 investment (April 30, 2009 — April 30, 2019)
The chart above shows the change in value of a hypothetical $10,000 investment in Class A shares of Columbia U.S. Treasury Index Fund during the stated time period, and does not reflect the deduction of taxes that a shareholder may pay on Fund distributions or on the redemption of Fund shares.
| Portfolio breakdown (%) (at April 30, 2019) |
| Money Market Funds | 0.4 |
| U.S. Treasury Obligations | 99.6 |
| Total | 100.0 |
Percentages indicated are based upon total investments excluding investments in derivatives, if any. The Fund’s portfolio composition is subject to change.
| Quality breakdown (%) (at April 30, 2019) |
| AAA rating | 100.0 |
| Total | 100.0 |
Percentages indicated are based upon total fixed income investments.
Bond ratings apply to the underlying holdings of the Fund and not the Fund itself and are divided into categories ranging from highest to lowest credit quality, determined by using the middle rating of Moody’s, S&P and Fitch, after dropping the highest and lowest available ratings. When ratings are available from only two rating agencies, the lower rating is used. When a rating is available from only one rating agency, that rating is used. When a bond is not rated by any rating agency, it is designated as “Not rated.” Credit quality ratings assigned by a rating agency are subjective opinions, not statements of fact, and are subject to change, including daily. The ratings assigned by credit rating agencies are but one of the considerations that the Investment Manager and/or Fund’s subadviser incorporates into its credit analysis process, along with such other issuer-specific factors as cash flows, capital structure and leverage ratios, ability to de-leverage (repay) through free cash flow, quality of management, market positioning and access to capital, as well as such security-specific factors as the terms of the security (e.g., interest rate and time to maturity) and the amount and type of any collateral.
| 4 | Columbia U.S. Treasury Index Fund | Annual Report 2019 |
Manager Discussion of Fund Performance
At April 30, 2019, approximately 78.4% of the Fund’s shares were owned in the aggregate by affiliated funds-of-funds managed by Columbia Management Investment Advisers, LLC (the Investment Manager). As a result of asset allocation decisions by the Investment Manager, it is possible that the Fund may experience relatively large purchases or redemptions from affiliated funds-of-funds. The Investment Manager seeks to minimize the impact of these transactions by structuring them over a reasonable period of time. The Fund may experience increased expenses as it buys and sells securities as a result of purchases or redemptions by affiliated funds-of-funds.
For the 12-month period that ended April 30, 2018, the Fund’s Class A shares returned 4.32%. The FTSE USBIG Treasury Index returned 4.73% over the same time period. During the period, investor sentiment shifted from fearing that the U.S. Federal Reserve (Fed) would overshoot on tightening its interest rate stance to adopting a more stable outlook on growth and inflation.
After headwinds, a gradual shift
Early in the period, U.S. Treasury securities remained more or less in a trading range. However, December of 2018 saw the 10-year Treasury yield decline from 3.01% to 2.69% on a flight-to-quality trade as fears arose that the Fed would overshoot in its efforts to normalize interest rates and increase the likelihood of a recession. In response to financial market volatility as well as deteriorating economic data outside the United States, the Fed abruptly reversed course regarding rates entering 2019 and stated that it will exercise patience before making any adjustments to its benchmark federal funds rate going forward. At period end, the market was actually pricing in a potential easing of the federal funds rate before the end of 2019, presumably on the basis of investor sensitivity to higher rates, and concern that inflation is undershooting the Fed’s 2% target. The front end of the Treasury curve was slightly inverted at period end, traditionally an indicator of recession risk.
After a difficult start to the Fund’s fiscal year, U.S. Treasuries posted strong returns in late 2018 and were also in positive territory over the first four months of 2019. Yields of Treasury securities with maturities of one year or less moved higher, reflecting recent Fed tightening, but longer term rates moved lower, particularly those of five- and 10-year Treasuries.
At period’s end
At the end of the reporting period, we believed uncertainties regarding global trade tensions and geopolitical developments continued to represent a headwind for investor sentiment. The Fed’s challenge was to balance these risks with the reality of a healthy domestic economy, including historic lows in unemployment and a vibrant stock market. The Fed was also grappling with how to conduct monetary policy in a low interest rate world. The Fed continued to be a cautious and conservative institution, and we believed radical policy changes were not likely. Recent FOMC meeting minutes have indicated that the Fed intends to utilize a “patient approach” before taking any policy action. As noted, investors’ more dovish view of Fed policy over the coming months has prompted the market to price in a short-term rate reduction by the end of 2019. However, as we witnessed in the fourth quarter of 2018, it is certainly possible that any deterioration in financial conditions and global developments could create the environment for another abrupt policy shift by the Fed, including a pre-emptive rate cut.
Marketrisk may affect a single issuer, sector of the economy, industry or the market as a whole. TheU.S. government may be unable or unwilling to honor its financial obligations. Securities issued or guaranteed by federal agencies and U.S. government-sponsored instrumentalities may or may not be backed by the full faith and credit of the U.S. government. A rise in interest rates may result in a price decline of fixed-income instruments held by the Fund, negatively impacting its performance and NAV. Falling rates may result in the Fund investing in lower yielding debt instruments, lowering the Fund’s income and yield. These risks may be heightened for longer maturity and duration securities. The Fund’s net value will generally decline when the performance of its targetedindexdeclines. See the Fund’s prospectus for more information on these and other risks.
The views expressed in this report reflect the current views of the respective parties. These views are not guarantees of future performance and involve certain risks, uncertainties and assumptions that are difficult to predict, so actual outcomes and results may differ significantly from the views expressed. These views are subject to change at any time based upon economic, market or other conditions and the respective parties disclaim any responsibility to update such views. These views may not be relied on as investment advice and, because investment decisions for a Columbia fund are based on numerous factors, may not be relied on as an indication of trading intent on behalf of any particular Columbia fund. References to specific securities should not be construed as a recommendation or investment advice.
Columbia U.S. Treasury Index Fund | Annual Report 2019
| 5 |
Understanding Your Fund’s Expenses
(Unaudited)
As an investor, you incur two types of costs. There are shareholder transaction costs, which generally include sales charges on purchases and may include redemption fees. There are also ongoing fund costs, which generally include management fees, distribution and/or service fees, and other fund expenses. The following information is intended to help you understand your ongoing costs (in dollars) of investing in the Fund and to help you compare these costs with the ongoing costs of investing in other mutual funds.
Analyzing your Fund’s expenses
To illustrate these ongoing costs, we have provided examples and calculated the expenses paid by investors in each share class of the Fund during the period. The actual and hypothetical information in the table is based on an initial investment of $1,000 at the beginning of the period indicated and held for the entire period. Expense information is calculated two ways and each method provides you with different information. The amount listed in the “Actual” column is calculated using the Fund’s actual operating expenses and total return for the period. You may use the Actual information, together with the amount invested, to estimate the expenses that you paid over the period. Simply divide your account value by $1,000 (for example, an $8,600 account value divided by $1,000 = 8.6), then multiply the results by the expenses paid during the period under the “Actual” column. The amount listed in the “Hypothetical” column assumes a 5% annual rate of return before expenses (which is not the Fund’s actual return) and then applies the Fund’s actual expense ratio for the period to the hypothetical return. You should not use the hypothetical account values and expenses to estimate either your actual account balance at the end of the period or the expenses you paid during the period. See “Compare with other funds” below for details on how to use the hypothetical data.
Compare with other funds
Since all mutual funds are required to include the same hypothetical calculations about expenses in shareholder reports, you can use this information to compare the ongoing cost of investing in the Fund with other funds. To do so, compare the hypothetical example with the 5% hypothetical examples that appear in the shareholder reports of other funds. As you compare hypothetical examples of other funds, it is important to note that hypothetical examples are meant to highlight the ongoing costs of investing in a fund only and do not reflect any transaction costs, such as sales charges, or redemption or exchange fees. Therefore, the hypothetical calculations are useful in comparing ongoing costs only, and will not help you determine the relative total costs of owning different funds. If transaction costs were included in these calculations, your costs would be higher.
| November 1, 2018 — April 30, 2019 |
| | Account value at the
beginning of the
period ($) | Account value at the
end of the
period ($) | Expenses paid during
the period ($) | Fund’s annualized
expense ratio (%) |
| | Actual | Hypothetical | Actual | Hypothetical | Actual | Hypothetical | Actual |
| Class A | 1,000.00 | 1,000.00 | 1,047.10 | 1,023.06 | 1.78 | 1.76 | 0.35 |
| Class C | 1,000.00 | 1,000.00 | 1,043.50 | 1,019.59 | 5.32 | 5.26 | 1.05 |
| Institutional Class | 1,000.00 | 1,000.00 | 1,048.90 | 1,023.80 | 1.02 | 1.00 | 0.20 |
| Institutional 2 Class | 1,000.00 | 1,000.00 | 1,048.00 | 1,023.80 | 1.02 | 1.00 | 0.20 |
| Institutional 3 Class | 1,000.00 | 1,000.00 | 1,047.70 | 1,023.80 | 1.02 | 1.00 | 0.20 |
Expenses paid during the period are equal to the annualized expense ratio for each class as indicated above, multiplied by the average account value over the period and then multiplied by the number of days in the Fund’s most recent fiscal half year and divided by 365.
Expenses do not include fees and expenses incurred indirectly by the Fund from its investment in underlying funds, including affiliated and non-affiliated pooled investment vehicles, such as mutual funds and exchange-traded funds.
Had Columbia Management Investment Advisers, LLC and/or certain of its affiliates not waived/reimbursed certain fees and expenses, account value at the end of the period would have been reduced.
| 6 | Columbia U.S. Treasury Index Fund | Annual Report 2019 |
Portfolio of Investments
April 30, 2019
(Percentages represent value of investments compared to net assets)
Investments in securities
| U.S. Treasury Obligations 98.9% |
| Issuer | Coupon
Rate | | Principal
Amount ($) | Value ($) |
| U.S. Treasury |
| 05/31/2020 | 1.500% | | 5,312,000 | 5,261,900 |
| 05/31/2020 | 2.500% | | 7,104,000 | 7,113,168 |
| 06/15/2020 | 1.500% | | 6,274,000 | 6,214,002 |
| 06/30/2020 | 2.500% | | 6,676,000 | 6,685,783 |
| 07/15/2020 | 1.500% | | 5,731,000 | 5,672,667 |
| 07/31/2020 | 1.625% | | 4,545,000 | 4,503,934 |
| 07/31/2020 | 2.625% | | 8,012,000 | 8,038,066 |
| 08/15/2020 | 2.625% | | 5,175,000 | 5,193,160 |
| 08/15/2020 | 8.750% | | 8,400,000 | 9,076,065 |
| 09/15/2020 | 1.375% | | 6,088,000 | 6,009,609 |
| 09/30/2020 | 1.375% | | 4,149,000 | 4,093,830 |
| 09/30/2020 | 2.000% | | 1,935,000 | 1,925,907 |
| 10/15/2020 | 1.625% | | 8,216,000 | 8,133,834 |
| 10/31/2020 | 1.375% | | 856,000 | 844,130 |
| 10/31/2020 | 1.750% | | 2,285,000 | 2,265,869 |
| 11/30/2020 | 1.625% | | 1,245,000 | 1,231,645 |
| 11/30/2020 | 2.750% | | 3,538,000 | 3,561,673 |
| 12/15/2020 | 1.875% | | 5,625,000 | 5,586,417 |
| 12/31/2020 | 1.750% | | 1,375,000 | 1,362,448 |
| 12/31/2020 | 2.500% | | 9,835,000 | 9,865,072 |
| 01/31/2021 | 1.375% | | 20,838,000 | 20,505,354 |
| 02/15/2021 | 2.250% | | 13,029,000 | 13,018,317 |
| 02/28/2021 | 1.125% | | 13,387,000 | 13,107,991 |
| 02/28/2021 | 2.500% | | 3,752,000 | 3,765,878 |
| 03/15/2021 | 2.375% | | 12,223,000 | 12,241,396 |
| 03/31/2021 | 1.250% | | 8,594,000 | 8,429,724 |
| 03/31/2021 | 2.250% | | 1,500,000 | 1,499,063 |
| 04/15/2021 | 2.375% | | 6,460,000 | 6,471,492 |
| 04/30/2021 | 1.375% | | 9,699,000 | 9,529,071 |
| 05/15/2021 | 2.625% | | 1,186,000 | 1,194,163 |
| 05/15/2021 | 3.125% | | 2,205,000 | 2,241,840 |
| 05/31/2021 | 1.375% | | 3,598,000 | 3,532,571 |
| 06/15/2021 | 2.625% | | 10,137,000 | 10,213,935 |
| 06/30/2021 | 1.125% | | 5,343,000 | 5,217,028 |
| 07/15/2021 | 2.625% | | 3,854,000 | 3,883,807 |
| 07/31/2021 | 1.125% | | 3,600,000 | 3,511,004 |
| 07/31/2021 | 2.250% | | 2,300,000 | 2,299,324 |
| 08/31/2021 | 1.125% | | 1,215,000 | 1,183,971 |
| 08/31/2021 | 2.000% | | 2,650,000 | 2,634,278 |
| 09/15/2021 | 2.750% | | 640,000 | 647,458 |
| 10/15/2021 | 2.875% | | 2,993,000 | 3,037,149 |
| 10/31/2021 | 1.250% | | 1,302,000 | 1,270,399 |
| 11/15/2021 | 2.875% | | 1,626,000 | 1,650,858 |
| 11/30/2021 | 1.750% | | 2,431,000 | 2,400,761 |
| 11/30/2021 | 1.875% | | 1,232,000 | 1,220,511 |
| 12/15/2021 | 2.625% | | 5,501,000 | 5,555,210 |
| 01/15/2022 | 2.500% | | 1,907,000 | 1,919,388 |
| 01/31/2022 | 1.500% | | 3,651,000 | 3,579,143 |
| 01/31/2022 | 1.875% | | 2,200,000 | 2,178,211 |
| 02/15/2022 | 2.000% | | 3,000,000 | 2,980,616 |
| 02/28/2022 | 1.750% | | 8,119,000 | 8,009,440 |
| 03/31/2022 | 1.750% | | 7,893,000 | 7,784,658 |
| 04/30/2022 | 1.750% | | 3,320,000 | 3,272,570 |
| 05/31/2022 | 1.875% | | 5,857,000 | 5,792,980 |
| U.S. Treasury Obligations (continued) |
| Issuer | Coupon
Rate | | Principal
Amount ($) | Value ($) |
| 06/30/2022 | 1.750% | | 14,618,000 | 14,403,578 |
| 06/30/2022 | 2.125% | | 6,412,000 | 6,389,523 |
| 07/31/2022 | 1.875% | | 2,811,000 | 2,778,456 |
| 07/31/2022 | 2.000% | | 2,630,000 | 2,609,799 |
| 08/15/2022 | 1.625% | | 3,725,000 | 3,651,667 |
| 08/31/2022 | 1.875% | | 5,303,000 | 5,240,044 |
| 09/30/2022 | 1.750% | | 4,941,000 | 4,860,134 |
| 09/30/2022 | 1.875% | | 6,120,000 | 6,046,535 |
| 10/31/2022 | 1.875% | | 2,532,000 | 2,500,094 |
| 10/31/2022 | 2.000% | | 4,646,000 | 4,606,838 |
| 11/30/2022 | 2.000% | | 7,409,000 | 7,344,852 |
| 12/31/2022 | 2.125% | | 6,523,000 | 6,494,527 |
| 01/31/2023 | 1.750% | | 3,340,000 | 3,279,688 |
| 01/31/2023 | 2.375% | | 8,219,000 | 8,253,119 |
| 02/28/2023 | 1.500% | | 12,587,000 | 12,237,509 |
| 03/31/2023 | 1.500% | | 9,898,000 | 9,616,319 |
| 03/31/2023 | 2.500% | | 4,278,000 | 4,316,360 |
| 04/30/2023 | 2.750% | | 904,000 | 920,655 |
| 05/15/2023 | 1.750% | | 10,140,000 | 9,937,783 |
| 05/31/2023 | 1.625% | | 8,775,000 | 8,555,981 |
| 05/31/2023 | 2.750% | | 3,539,000 | 3,605,281 |
| 06/30/2023 | 1.375% | | 7,958,000 | 7,677,457 |
| 06/30/2023 | 2.625% | | 6,836,000 | 6,932,883 |
| 07/31/2023 | 1.250% | | 3,432,000 | 3,291,069 |
| 08/15/2023 | 2.500% | | 3,323,000 | 3,354,135 |
| 08/31/2023 | 1.375% | | 692,000 | 666,530 |
| 08/31/2023 | 2.750% | | 1,832,000 | 1,868,037 |
| 09/30/2023 | 1.375% | | 4,418,000 | 4,251,631 |
| 09/30/2023 | 2.875% | | 1,967,000 | 2,016,291 |
| 10/31/2023 | 1.625% | | 889,000 | 864,366 |
| 10/31/2023 | 2.875% | | 3,399,000 | 3,485,509 |
| 11/15/2023 | 2.750% | | 3,757,000 | 3,832,875 |
| 11/30/2023 | 2.125% | | 3,030,000 | 3,010,185 |
| 11/30/2023 | 2.875% | | 4,657,000 | 4,779,543 |
| 12/31/2023 | 2.250% | | 2,569,000 | 2,565,427 |
| 12/31/2023 | 2.625% | | 5,549,000 | 5,633,003 |
| 01/31/2024 | 2.500% | | 4,312,000 | 4,354,217 |
| 02/15/2024 | 2.750% | | 3,580,000 | 3,655,145 |
| 02/29/2024 | 2.125% | | 4,896,000 | 4,859,956 |
| 02/29/2024 | 2.375% | | 5,696,000 | 5,722,693 |
| 03/31/2024 | 2.125% | | 5,818,000 | 5,775,292 |
| 05/15/2024 | 2.500% | | 3,886,000 | 3,924,613 |
| 07/31/2024 | 2.125% | | 10,143,000 | 10,055,234 |
| 08/15/2024 | 2.375% | | 8,476,000 | 8,504,998 |
| 11/15/2024 | 2.250% | | 12,973,000 | 12,922,973 |
| 11/30/2024 | 2.125% | | 346,000 | 342,441 |
| 12/31/2024 | 2.250% | | 5,757,000 | 5,734,157 |
| 02/15/2025 | 2.000% | | 7,074,000 | 6,944,330 |
| 02/28/2025 | 2.750% | | 839,000 | 857,782 |
| 03/31/2025 | 2.625% | | 2,277,000 | 2,312,011 |
| 04/30/2025 | 2.875% | | 6,649,000 | 6,843,425 |
| 05/15/2025 | 2.125% | | 4,157,000 | 4,102,456 |
| 05/31/2025 | 2.875% | | 3,918,000 | 4,032,247 |
| 06/30/2025 | 2.750% | | 3,280,000 | 3,352,669 |
| 07/31/2025 | 2.875% | | 2,468,000 | 2,540,739 |
The accompanying Notes to Financial Statements are an integral part of this statement.
Columbia U.S. Treasury Index Fund | Annual Report 2019
| 7 |
Portfolio of Investments (continued)
April 30, 2019
| U.S. Treasury Obligations (continued) |
| Issuer | Coupon
Rate | | Principal
Amount ($) | Value ($) |
| 08/15/2025 | 2.000% | | 7,278,000 | 7,120,114 |
| 08/31/2025 | 2.750% | | 4,848,000 | 4,955,138 |
| 10/31/2025 | 3.000% | | 3,111,000 | 3,226,313 |
| 11/15/2025 | 2.250% | | 7,923,000 | 7,859,443 |
| 11/30/2025 | 2.875% | �� | 6,613,000 | 6,810,005 |
| 01/31/2026 | 2.625% | | 3,116,000 | 3,161,535 |
| 02/15/2026 | 1.625% | | 7,916,000 | 7,536,002 |
| 02/15/2026 | 6.000% | | 3,073,000 | 3,761,271 |
| 02/28/2026 | 2.500% | | 4,259,000 | 4,288,322 |
| 08/15/2026 | 1.500% | | 6,156,000 | 5,780,446 |
| 11/15/2026 | 2.000% | | 10,471,000 | 10,164,624 |
| 02/15/2027 | 2.250% | | 4,315,000 | 4,257,809 |
| 05/15/2027 | 2.375% | | 7,925,000 | 7,885,051 |
| 08/15/2027 | 2.250% | | 7,202,000 | 7,088,740 |
| 11/15/2027 | 2.250% | | 8,740,000 | 8,592,145 |
| 02/15/2028 | 2.750% | | 8,150,000 | 8,324,578 |
| 05/15/2028 | 2.875% | | 7,901,000 | 8,149,255 |
| 08/15/2028 | 2.875% | | 7,563,000 | 7,801,111 |
| 11/15/2028 | 3.125% | | 4,152,000 | 4,370,877 |
| 11/15/2028 | 5.250% | | 2,293,000 | 2,824,401 |
| 02/15/2029 | 5.250% | | 6,335,000 | 7,833,629 |
| 05/15/2030 | 6.250% | | 1,377,000 | 1,866,942 |
| 02/15/2031 | 5.375% | | 1,250,000 | 1,607,479 |
| 02/15/2036 | 4.500% | | 3,420,000 | 4,265,779 |
| 05/15/2038 | 4.500% | | 2,360,000 | 2,984,650 |
| 02/15/2039 | 3.500% | | 7,077,000 | 7,882,023 |
| 11/15/2039 | 4.375% | | 2,197,000 | 2,745,013 |
| 02/15/2040 | 4.625% | | 555,000 | 716,031 |
| 05/15/2040 | 4.375% | | 2,173,000 | 2,716,290 |
| 02/15/2041 | 4.750% | | 1,113,000 | 1,462,034 |
| 05/15/2041 | 4.375% | | 852,000 | 1,066,861 |
| 08/15/2041 | 3.750% | | 2,049,000 | 2,352,121 |
| 02/15/2042 | 3.125% | | 568,000 | 591,867 |
| 11/15/2042 | 2.750% | | 5,800,000 | 5,652,622 |
| 02/15/2043 | 3.125% | | 5,575,000 | 5,791,132 |
| 05/15/2043 | 2.875% | | 4,744,000 | 4,719,798 |
| 08/15/2043 | 3.625% | | 2,570,000 | 2,893,374 |
| U.S. Treasury Obligations (continued) |
| Issuer | Coupon
Rate | | Principal
Amount ($) | Value ($) |
| 11/15/2043 | 3.750% | | 5,367,000 | 6,163,748 |
| 02/15/2044 | 3.625% | | 5,112,000 | 5,758,441 |
| 05/15/2044 | 3.375% | | 3,305,000 | 3,576,103 |
| 08/15/2044 | 3.125% | | 3,062,000 | 3,175,175 |
| 11/15/2044 | 3.000% | | 4,402,000 | 4,466,907 |
| 02/15/2045 | 2.500% | | 2,894,000 | 2,671,329 |
| 05/15/2045 | 3.000% | | 4,084,000 | 4,145,566 |
| 08/15/2045 | 2.875% | | 3,940,000 | 3,904,809 |
| 11/15/2045 | 3.000% | | 3,579,000 | 3,632,429 |
| 02/15/2046 | 2.500% | | 4,812,000 | 4,425,770 |
| 05/15/2046 | 2.500% | | 3,175,000 | 2,917,418 |
| 08/15/2046 | 2.250% | | 4,052,000 | 3,529,405 |
| 11/15/2046 | 2.875% | | 4,526,000 | 4,481,722 |
| 02/15/2047 | 3.000% | | 4,515,000 | 4,580,741 |
| 05/15/2047 | 3.000% | | 4,533,000 | 4,594,170 |
| 08/15/2047 | 2.750% | | 6,977,000 | 6,722,463 |
| 11/15/2047 | 2.750% | | 4,171,000 | 4,017,464 |
| 02/15/2048 | 3.000% | | 4,880,000 | 4,937,192 |
| 05/15/2048 | 3.125% | | 4,976,000 | 5,157,269 |
| 08/15/2048 | 3.000% | | 9,817,000 | 9,934,174 |
| 11/15/2048 | 3.375% | | 2,295,000 | 2,496,737 |
Total U.S. Treasury Obligations
(Cost $827,506,812) | 833,527,656 |
| Money Market Funds 0.4% |
| | Shares | Value ($) |
| Columbia Short-Term Cash Fund, 2.519%(a),(b) | 3,611,713 | 3,611,352 |
Total Money Market Funds
(Cost $3,611,352) | 3,611,352 |
Total Investments in Securities
(Cost: $831,118,164) | 837,139,008 |
| Other Assets & Liabilities, Net | | 5,651,301 |
| Net Assets | 842,790,309 |
Notes to Portfolio of Investments
| (a) | The rate shown is the seven-day current annualized yield at April 30, 2019. |
| (b) | As defined in the Investment Company Act of 1940, an affiliated company is one in which the Fund owns 5% or more of the company’s outstanding voting securities, or a company which is under common ownership or control with the Fund. Holdings and transactions in these affiliated companies during the year ended April 30, 2019 are as follows: |
| Issuer | Beginning
shares | Shares
purchased | Shares
sold | Ending
shares | Realized gain
(loss) —
affiliated
issuers ($) | Net change in
unrealized
appreciation
(depreciation) —
affiliated
issuers ($) | Dividends —
affiliated
issuers ($) | Value —
affiliated
issuers
at end of
period ($) |
| Columbia Short-Term Cash Fund, 2.519% |
| | 2,439,997 | 121,316,465 | (120,144,749) | 3,611,713 | (105) | 170 | 90,203 | 3,611,352 |
The accompanying Notes to Financial Statements are an integral part of this statement.
| 8 | Columbia U.S. Treasury Index Fund | Annual Report 2019 |
Portfolio of Investments (continued)
April 30, 2019
Fair value measurements
The Fund categorizes its fair value measurements according to a three-level hierarchy that maximizes the use of observable inputs and minimizes the use of unobservable inputs by prioritizing that the most observable input be used when available. Observable inputs are those that market participants would use in pricing an investment based on market data obtained from sources independent of the reporting entity. Unobservable inputs are those that reflect the Fund’s assumptions about the information market participants would use in pricing an investment. An investment’s level within the fair value hierarchy is based on the lowest level of any input that is deemed significant to the asset’s or liability’s fair value measurement. The input levels are not necessarily an indication of the risk or liquidity associated with investments at that level. For example, certain U.S. government securities are generally high quality and liquid, however, they are reflected as Level 2 because the inputs used to determine fair value may not always be quoted prices in an active market.
Fair value inputs are summarized in the three broad levels listed below:
| ■ | Level 1 — Valuations based on quoted prices for investments in active markets that the Fund has the ability to access at the measurement date. Valuation adjustments are not applied to Level 1 investments. |
| ■ | Level 2 — Valuations based on other significant observable inputs (including quoted prices for similar securities, interest rates, prepayment speeds, credit risks, etc.). |
| ■ | Level 3 — Valuations based on significant unobservable inputs (including the Fund’s own assumptions and judgment in determining the fair value of investments). |
Inputs that are used in determining fair value of an investment may include price information, credit data, volatility statistics, and other factors. These inputs can be either observable or unobservable. The availability of observable inputs can vary between investments, and is affected by various factors such as the type of investment, and the volume and level of activity for that investment or similar investments in the marketplace. The inputs will be considered by the Investment Manager, along with any other relevant factors in the calculation of an investment’s fair value. The Fund uses prices and inputs that are current as of the measurement date, which may include periods of market dislocations. During these periods, the availability of prices and inputs may be reduced for many investments. This condition could cause an investment to be reclassified between the various levels within the hierarchy.
Certain investments that have been measured at fair value using the net asset value (NAV) per share (or its equivalent) are not categorized in the fair value hierarchy. The fair value amounts presented in the table are intended to reconcile the fair value hierarchy to the amounts presented in the Portfolio of Investments. The Columbia Short-Term Cash Fund seeks to provide shareholders with maximum current income consistent with liquidity and stability of principal. Columbia Short-Term Cash Fund prices its shares with a floating NAV and no longer seeks to maintain a stable NAV.
Investments falling into the Level 3 category are primarily supported by quoted prices from brokers and dealers participating in the market for those investments. However, these may be classified as Level 3 investments due to lack of market transparency and corroboration to support these quoted prices. Additionally, valuation models may be used as the pricing source for any remaining investments classified as Level 3. These models may rely on one or more significant unobservable inputs and/or significant assumptions by the Investment Manager. Inputs used in valuations may include, but are not limited to, financial statement analysis, capital account balances, discount rates and estimated cash flows, and comparable company data.
Under the direction of the Fund’s Board of Trustees (the Board), the Investment Manager’s Valuation Committee (the Committee) is responsible for overseeing the valuation procedures approved by the Board. The Committee consists of voting and non-voting members from various groups within the Investment Manager’s organization, including operations and accounting, trading and investments, compliance, risk management and legal.
The Committee meets at least monthly to review and approve valuation matters, which may include a description of specific valuation determinations, data regarding pricing information received from approved pricing vendors and brokers and the results of Board-approved valuation control policies and procedures (the Policies). The Policies address, among other things, instances when market quotations are or are not readily available, including recommendations of third party pricing vendors and a determination of appropriate pricing methodologies; events that require specific valuation determinations and assessment of fair value techniques; securities with a potential for stale pricing, including those that are illiquid, restricted, or in default; and the effectiveness of third party pricing vendors, including periodic reviews of vendors. The Committee meets more frequently, as needed, to discuss additional valuation matters, which may include the need to review back-testing results, review time-sensitive information or approve related valuation actions. The Committee reports to the Board, with members of the Committee meeting with the Board at each of its regularly scheduled meetings to discuss valuation matters and actions during the period, similar to those described earlier.
For investments categorized as Level 3, the Committee monitors information similar to that described above, which may include: (i) data specific to the issuer or comparable issuers, (ii) general market or specific sector news and (iii) quoted prices and specific or similar security transactions. The Committee considers this data and any changes from prior periods in order to assess the reasonableness of observable and unobservable inputs, any assumptions or internal models used to value those securities and changes in fair value. This data is also used to corroborate, when available, information received from approved pricing vendors and brokers. Various factors impact the frequency of monitoring this information (which may occur as often as daily). However, the Committee may determine that changes to inputs, assumptions and models are not required as a result of the monitoring procedures performed.
The following table is a summary of the inputs used to value the Fund’s investments at April 30, 2019:
| | Level 1
quoted prices
in active
markets for
identical
assets ($) | Level 2
other
significant
observable
inputs ($) | Level 3
significant
unobservable
inputs ($) | Investments
measured at
net asset
value ($) | Total ($) |
| Investments in Securities | | | | | |
| U.S. Treasury Obligations | 833,527,656 | — | — | — | 833,527,656 |
| Money Market Funds | — | — | — | 3,611,352 | 3,611,352 |
| Total Investments in Securities | 833,527,656 | — | — | 3,611,352 | 837,139,008 |
See the Portfolio of Investments for all investment classifications not indicated in the table.
There were no transfers of financial assets between levels during the period.
The accompanying Notes to Financial Statements are an integral part of this statement.
Columbia U.S. Treasury Index Fund | Annual Report 2019
| 9 |
Statement of Assets and Liabilities
April 30, 2019
| Assets | |
| Investments in securities, at value | |
| Unaffiliated issuers (cost $827,506,812) | $833,527,656 |
| Affiliated issuers (cost $3,611,352) | 3,611,352 |
| Receivable for: | |
| Investments sold | 11,639,674 |
| Capital shares sold | 1,595,398 |
| Dividends | 8,543 |
| Interest | 5,443,110 |
| Expense reimbursement due from Investment Manager | 4,715 |
| Trustees’ deferred compensation plan | 80,549 |
| Other assets | 777 |
| Total assets | 855,911,774 |
| Liabilities | |
| Payable for: | |
| Investments purchased | 11,253,029 |
| Capital shares purchased | 264,084 |
| Distributions to shareholders | 1,513,685 |
| Management services fees | 9,204 |
| Distribution and/or service fees | 207 |
| Other expenses | 707 |
| Trustees’ deferred compensation plan | 80,549 |
| Total liabilities | 13,121,465 |
| Net assets applicable to outstanding capital stock | $842,790,309 |
| Represented by | |
| Paid in capital | 849,917,022 |
| Total distributable earnings (loss) (Note 2) | (7,126,713) |
| Total - representing net assets applicable to outstanding capital stock | $842,790,309 |
| Class A | |
| Net assets | $35,707,280 |
| Shares outstanding | 3,245,172 |
| Net asset value per share | $11.00 |
| Class C | |
| Net assets | $2,800,856 |
| Shares outstanding | 254,597 |
| Net asset value per share | $11.00 |
| Institutional Class | |
| Net assets | $323,226,269 |
| Shares outstanding | 29,367,117 |
| Net asset value per share | $11.01 |
| Institutional 2 Class | |
| Net assets | $35,855,471 |
| Shares outstanding | 3,264,323 |
| Net asset value per share | $10.98 |
| Institutional 3 Class | |
| Net assets | $445,200,433 |
| Shares outstanding | 40,214,990 |
| Net asset value per share | $11.07 |
The accompanying Notes to Financial Statements are an integral part of this statement.
| 10 | Columbia U.S. Treasury Index Fund | Annual Report 2019 |
Statement of Operations
Year Ended April 30, 2019
| Net investment income | |
| Income: | |
| Dividends — affiliated issuers | $90,203 |
| Interest | 18,849,030 |
| Interfund lending | 1,364 |
| Total income | 18,940,597 |
| Expenses: | |
| Management services fees | 3,308,567 |
| Distribution and/or service fees | |
| Class A | 98,428 |
| Class C | 28,498 |
| Class T | 910 |
| Compensation of board members | 25,330 |
| Other | 6,004 |
| Total expenses | 3,467,737 |
| Fees waived or expenses reimbursed by Investment Manager and its affiliates | (1,685,617) |
| Fees waived by distributor | |
| Class A | (39,371) |
| Class C | (4,275) |
| Expense reduction | (740) |
| Total net expenses | 1,737,734 |
| Net investment income | 17,202,863 |
| Realized and unrealized gain (loss) — net | |
| Net realized gain (loss) on: | |
| Investments — unaffiliated issuers | (8,785,652) |
| Investments — affiliated issuers | (105) |
| Net realized loss | (8,785,757) |
| Net change in unrealized appreciation (depreciation) on: | |
| Investments — unaffiliated issuers | 27,147,628 |
| Investments — affiliated issuers | 170 |
| Net change in unrealized appreciation (depreciation) | 27,147,798 |
| Net realized and unrealized gain | 18,362,041 |
| Net increase in net assets resulting from operations | $35,564,904 |
The accompanying Notes to Financial Statements are an integral part of this statement.
Columbia U.S. Treasury Index Fund | Annual Report 2019
| 11 |
Statement of Changes in Net Assets
| | Year Ended
April 30, 2019 | Year Ended
April 30, 2018 |
| Operations | | |
| Net investment income | $17,202,863 | $11,945,454 |
| Net realized loss | (8,785,757) | (1,673,962) |
| Net change in unrealized appreciation (depreciation) | 27,147,798 | (19,230,056) |
| Net increase (decrease) in net assets resulting from operations | 35,564,904 | (8,958,564) |
| Distributions to shareholders | | |
| Net investment income and net realized gains | | |
| Class A | (759,024) | |
| Class C | (34,843) | |
| Institutional Class | (7,244,366) | |
| Institutional 2 Class | (687,286) | |
| Institutional 3 Class | (8,454,064) | |
| Class T | (6,496) | |
| Net investment income | | |
| Class A | | (720,758) |
| Class B | | (18) |
| Class C | | (41,678) |
| Institutional Class | | (6,320,441) |
| Institutional 2 Class | | (458,453) |
| Institutional 3 Class | | (4,314,937) |
| Class T | | (14,159) |
| Total distributions to shareholders (Note 2) | (17,186,079) | (11,870,444) |
| Increase (decrease) in net assets from capital stock activity | (50,812,235) | 181,178,272 |
| Total increase (decrease) in net assets | (32,433,410) | 160,349,264 |
| Net assets at beginning of year | 875,223,719 | 714,874,455 |
| Net assets at end of year | $842,790,309 | $875,223,719 |
| Excess of distributions over net investment income | $(150,984) | $(167,768) |
The accompanying Notes to Financial Statements are an integral part of this statement.
| 12 | Columbia U.S. Treasury Index Fund | Annual Report 2019 |
Statement of Changes in Net Assets (continued)
| | Year Ended | Year Ended |
| | April 30, 2019 | April 30, 2018 |
| | Shares | Dollars ($) | Shares | Dollars ($) |
| Capital stock activity |
| Class A | | | | |
| Subscriptions | 1,958,468 | 21,152,533 | 1,596,036 | 17,578,648 |
| Distributions reinvested | 32,738 | 354,246 | 29,486 | 324,150 |
| Redemptions | (2,939,783) | (31,699,541) | (1,799,809) | (19,759,588) |
| Net decrease | (948,577) | (10,192,762) | (174,287) | (1,856,790) |
| Class B | | | | |
| Redemptions | — | — | (1,043) | (11,579) |
| Net decrease | — | — | (1,043) | (11,579) |
| Class C | | | | |
| Subscriptions | 151,384 | 1,642,311 | 54,103 | 600,168 |
| Distributions reinvested | 3,109 | 33,668 | 3,667 | 40,316 |
| Redemptions | (285,372) | (3,086,609) | (299,567) | (3,305,094) |
| Net decrease | (130,879) | (1,410,630) | (241,797) | (2,664,610) |
| Institutional Class | | | | |
| Subscriptions | 14,378,476 | 154,460,051 | 8,157,172 | 90,001,075 |
| Distributions reinvested | 617,402 | 6,681,607 | 506,632 | 5,564,004 |
| Redemptions | (22,177,109) | (237,912,275) | (6,514,138) | (71,988,194) |
| Net increase (decrease) | (7,181,231) | (76,770,617) | 2,149,666 | 23,576,885 |
| Institutional 2 Class | | | | |
| Subscriptions | 1,549,123 | 16,720,324 | 1,267,931 | 13,894,932 |
| Distributions reinvested | 6,784 | 73,411 | 5,577 | 61,149 |
| Redemptions | (1,154,144) | (12,445,281) | (660,841) | (7,215,644) |
| Net increase | 401,763 | 4,348,454 | 612,667 | 6,740,437 |
| Institutional 3 Class | | | | |
| Subscriptions | 21,457,014 | 233,068,581 | 18,967,087 | 206,143,368 |
| Distributions reinvested | 776,067 | 8,453,857 | 391,100 | 4,314,719 |
| Redemptions | (19,174,006) | (207,667,463) | (4,877,119) | (53,811,468) |
| Net increase | 3,059,075 | 33,854,975 | 14,481,068 | 156,646,619 |
| Class T | | | | |
| Subscriptions | — | — | 6 | 63 |
| Distributions reinvested | 558 | 5,991 | 1,273 | 14,020 |
| Redemptions | (60,153) | (647,646) | (114,693) | (1,266,773) |
| Net decrease | (59,595) | (641,655) | (113,414) | (1,252,690) |
| Total net increase (decrease) | (4,859,444) | (50,812,235) | 16,712,860 | 181,178,272 |
The accompanying Notes to Financial Statements are an integral part of this statement.
Columbia U.S. Treasury Index Fund | Annual Report 2019
| 13 |
The following table is intended to help you understand the Fund’s financial performance. Certain information reflects financial results for a single share of a class held for the periods shown. Per share net investment income (loss) amounts are calculated based on average shares outstanding during the period. Total return assumes reinvestment of all dividends and distributions, if any. Total return does not reflect payment of sales charges, if any. Total return and portfolio turnover are not annualized for periods of less than one year. The portfolio turnover rate is calculated without regard to purchase and sales transactions of short-term instruments and certain derivatives, if any. If such transactions were included, the Fund’s portfolio turnover rate may be higher.
| | Net asset value,
beginning of
period | Net
investment
income | Net
realized
and
unrealized
gain (loss) | Total from
investment
operations | Distributions
from net
investment
income | Distributions
from net
realized
gains | Total
distributions to
shareholders |
| Class A |
| Year Ended 4/30/2019 | $10.75 | 0.21 | 0.25 | 0.46 | (0.21) | — | (0.21) |
| Year Ended 4/30/2018 | $11.06 | 0.16 | (0.31) | (0.15) | (0.16) | — | (0.16) |
| Year Ended 4/30/2017 | $11.34 | 0.14 | (0.25) | (0.11) | (0.14) | (0.03) | (0.17) |
| Year Ended 4/30/2016 | $11.28 | 0.14 | 0.12 | 0.26 | (0.14) | (0.06) | (0.20) |
| Year Ended 4/30/2015 | $11.03 | 0.15 | 0.26 | 0.41 | (0.15) | (0.01) | (0.16) |
| Class C |
| Year Ended 4/30/2019 | $10.75 | 0.13 | 0.25 | 0.38 | (0.13) | — | (0.13) |
| Year Ended 4/30/2018 | $11.06 | 0.09 | (0.31) | (0.22) | (0.09) | — | (0.09) |
| Year Ended 4/30/2017 | $11.34 | 0.06 | (0.24) | (0.18) | (0.07) | (0.03) | (0.10) |
| Year Ended 4/30/2016 | $11.28 | 0.07 | 0.12 | 0.19 | (0.07) | (0.06) | (0.13) |
| Year Ended 4/30/2015 | $11.02 | 0.07 | 0.27 | 0.34 | (0.07) | (0.01) | (0.08) |
| Institutional Class |
| Year Ended 4/30/2019 | $10.75 | 0.22 | 0.27 | 0.49 | (0.23) | — | (0.23) |
| Year Ended 4/30/2018 | $11.06 | 0.18 | (0.31) | (0.13) | (0.18) | — | (0.18) |
| Year Ended 4/30/2017 | $11.34 | 0.16 | (0.25) | (0.09) | (0.16) | (0.03) | (0.19) |
| Year Ended 4/30/2016 | $11.28 | 0.16 | 0.12 | 0.28 | (0.16) | (0.06) | (0.22) |
| Year Ended 4/30/2015 | $11.02 | 0.17 | 0.27 | 0.44 | (0.17) | (0.01) | (0.18) |
| Institutional 2 Class |
| Year Ended 4/30/2019 | $10.73 | 0.23 | 0.25 | 0.48 | (0.23) | — | (0.23) |
| Year Ended 4/30/2018 | $11.04 | 0.18 | (0.31) | (0.13) | (0.18) | — | (0.18) |
| Year Ended 4/30/2017 | $11.32 | 0.16 | (0.25) | (0.09) | (0.16) | (0.03) | (0.19) |
| Year Ended 4/30/2016 | $11.26 | 0.16 | 0.12 | 0.28 | (0.16) | (0.06) | (0.22) |
| Year Ended 4/30/2015 | $11.01 | 0.17 | 0.26 | 0.43 | (0.17) | (0.01) | (0.18) |
| Institutional 3 Class |
| Year Ended 4/30/2019 | $10.81 | 0.23 | 0.26 | 0.49 | (0.23) | — | (0.23) |
| Year Ended 4/30/2018 | $11.13 | 0.18 | (0.32) | (0.14) | (0.18) | — | (0.18) |
| Year Ended 4/30/2017(d) | $11.02 | 0.03 | 0.11(e) | 0.14 | (0.03) | — | (0.03) |
| Notes to Financial Highlights |
| (a) | In addition to the fees and expenses that the Fund bears directly, the Fund indirectly bears a pro rata share of the fees and expenses of any other funds in which it invests. Such indirect expenses are not included in the Fund’s reported expense ratios. |
| (b) | Total net expenses include the impact of certain fee waivers/expense reimbursements made by the Investment Manager and certain of its affiliates, if applicable. |
| (c) | The benefits derived from expense reductions had an impact of less than 0.01%. |
| (d) | Institutional 3 Class shares commenced operations on March 1, 2017. Per share data and total return reflect activity from that date. |
| (e) | Calculation of the net gain (loss) per share (both realized and unrealized) does not correlate to the aggregate realized and unrealized gain (loss) presented in the Statement of Operations due to the timing of subscriptions and redemptions of Fund shares in relation to fluctuations in the market value of the portfolio. |
| (f) | Annualized. |
The accompanying Notes to Financial Statements are an integral part of this statement.
| 14 | Columbia U.S. Treasury Index Fund | Annual Report 2019 |
Financial Highlights (continued)
| | Net
asset
value,
end of
period | Total
return | Total gross
expense
ratio to
average
net assets(a) | Total net
expense
ratio to
average
net assets(a),(b) | Net investment
income
ratio to
average
net assets | Portfolio
turnover | Net
assets,
end of
period
(000’s) |
| Class A |
| Year Ended 4/30/2019 | $11.00 | 4.32% | 0.65% | 0.35%(c) | 1.93% | 50% | $35,707 |
| Year Ended 4/30/2018 | $10.75 | (1.35%) | 0.65% | 0.35%(c) | 1.49% | 27% | $45,074 |
| Year Ended 4/30/2017 | $11.06 | (0.94%) | 0.65% | 0.35%(c) | 1.27% | 50% | $48,312 |
| Year Ended 4/30/2016 | $11.34 | 2.38% | 0.66% | 0.35%(c) | 1.30% | 91% | $41,893 |
| Year Ended 4/30/2015 | $11.28 | 3.70% | 0.66% | 0.38%(c) | 1.33% | 65% | $31,946 |
| Class C |
| Year Ended 4/30/2019 | $11.00 | 3.59% | 1.40% | 1.05%(c) | 1.23% | 50% | $2,801 |
| Year Ended 4/30/2018 | $10.75 | (2.03%) | 1.41% | 1.05%(c) | 0.78% | 27% | $4,143 |
| Year Ended 4/30/2017 | $11.06 | (1.63%) | 1.40% | 1.05%(c) | 0.56% | 50% | $6,938 |
| Year Ended 4/30/2016 | $11.34 | 1.67% | 1.41% | 1.05%(c) | 0.59% | 91% | $9,892 |
| Year Ended 4/30/2015 | $11.28 | 3.11% | 1.41% | 1.05%(c) | 0.66% | 65% | $7,124 |
| Institutional Class |
| Year Ended 4/30/2019 | $11.01 | 4.57% | 0.40% | 0.20%(c) | 2.08% | 50% | $323,226 |
| Year Ended 4/30/2018 | $10.75 | (1.20%) | 0.40% | 0.20%(c) | 1.64% | 27% | $392,889 |
| Year Ended 4/30/2017 | $11.06 | (0.79%) | 0.40% | 0.20%(c) | 1.42% | 50% | $380,519 |
| Year Ended 4/30/2016 | $11.34 | 2.54% | 0.41% | 0.20%(c) | 1.44% | 91% | $274,641 |
| Year Ended 4/30/2015 | $11.28 | 3.98% | 0.41% | 0.20%(c) | 1.51% | 65% | $247,434 |
| Institutional 2 Class |
| Year Ended 4/30/2019 | $10.98 | 4.48% | 0.40% | 0.20% | 2.10% | 50% | $35,855 |
| Year Ended 4/30/2018 | $10.73 | (1.20%) | 0.40% | 0.20% | 1.65% | 27% | $30,710 |
| Year Ended 4/30/2017 | $11.04 | (0.80%) | 0.41% | 0.20% | 1.45% | 50% | $24,839 |
| Year Ended 4/30/2016 | $11.32 | 2.54% | 0.41% | 0.20% | 1.45% | 91% | $3,906 |
| Year Ended 4/30/2015 | $11.26 | 3.89% | 0.41% | 0.20% | 1.50% | 65% | $2,600 |
| Institutional 3 Class |
| Year Ended 4/30/2019 | $11.07 | 4.56% | 0.40% | 0.20% | 2.10% | 50% | $445,200 |
| Year Ended 4/30/2018 | $10.81 | (1.27%) | 0.40% | 0.20% | 1.66% | 27% | $401,768 |
| Year Ended 4/30/2017(d) | $11.13 | 1.24% | 0.40%(f) | 0.20%(f) | 1.52%(f) | 50% | $252,341 |
The accompanying Notes to Financial Statements are an integral part of this statement.
Columbia U.S. Treasury Index Fund | Annual Report 2019
| 15 |
Notes to Financial Statements
April 30, 2019
Note 1. Organization
Columbia U.S. Treasury Index Fund (the Fund), a series of Columbia Funds Series Trust I (the Trust), is a diversified fund. The Trust is registered under the Investment Company Act of 1940, as amended (the 1940 Act), as an open-end management investment company organized as a Massachusetts business trust.
Fund shares
The Trust may issue an unlimited number of shares (without par value). Although all share classes generally have identical voting, dividend and liquidation rights, each share class votes separately when required by the Trust’s organizational documents or by law. Different share classes pay different distribution amounts to the extent the expenses of such share classes differ, and distributions in liquidation will be proportional to the net asset value of each share class. Each share class has its own expense and sales charge structure. The Fund offers each of the share classes identified below.
Class A shares are not subject to any front-end sales charge or contingent deferred sales charge (CDSC).
Class C shares are subject to a 1.00% CDSC on shares redeemed within 12 months after purchase. Effective July 1, 2018, Class C shares automatically convert to Class A shares of the same Fund in the month of or the month following the 10-year anniversary of the Class C shares purchase date.
Institutional Class shares are not subject to sales charges and are generally available only to eligible investors, which are subject to different investment minimums as described in the Fund’s prospectus.
Institutional 2 Class shares are not subject to sales charges and are generally available only to investors purchasing through authorized investment professionals and omnibus retirement plans as described in the Fund’s prospectus.
Institutional 3 Class shares are not subject to sales charges and are available to institutional and certain other investors as described in the Fund’s prospectus.
Class T shares were subject to a maximum front-end sales charge of 2.50% per transaction and were required to be purchased through financial intermediaries that, by written agreement with Columbia Management Investment Distributors, Inc., were specifically authorized to sell Class T shares. Effective at the close of business on December 14, 2018, Class T shares merged, in a tax-free transaction, into Class A shares of the Fund and are no longer offered for sale.
Note 2. Summary of significant accounting policies
Basis of preparation
The Fund is an investment company that applies the accounting and reporting guidance in the Financial Accounting Standards Board (FASB) Accounting Standards Codification Topic 946,Financial Services - Investment Companies (ASC 946). The financial statements are prepared in accordance with U.S. generally accepted accounting principles (GAAP), which requires management to make certain estimates and assumptions that affect the reported amounts of assets and liabilities, the disclosure of contingent assets and liabilities at the date of the financial statements and the reported amounts of income and expenses during the reporting period. Actual results could differ from those estimates.
The following is a summary of significant accounting policies followed by the Fund in the preparation of its financial statements.
Security valuation
Debt securities generally are valued by pricing services approved by the Board of Trustees based upon market transactions for normal, institutional-size trading units of similar securities. The services may use various pricing techniques that take into account, as applicable, factors such as yield, quality, coupon rate, maturity, type of issue, trading characteristics and other data, as well as approved independent broker-dealer quotes. Debt securities for which quotations are not readily available or not believed to be reflective of market value may also be valued based upon a bid quote from an approved independent broker-dealer. Debt securities maturing in 60 days or less are valued primarily at amortized cost value, unless this method results in a valuation that management believes does not approximate market value.
| 16 | Columbia U.S. Treasury Index Fund | Annual Report 2019 |
Notes to Financial Statements (continued)
April 30, 2019
Investments in open-end investment companies, including money market funds, are valued at their latest net asset value.
Investments for which market quotations are not readily available, or that have quotations which management believes are not reflective of market value or reliable, are valued at fair value as determined in good faith under procedures approved by and under the general supervision of the Board of Trustees. If a security or class of securities (such as foreign securities) is valued at fair value, such value is likely to be different from the quoted or published price for the security.
The determination of fair value often requires significant judgment. To determine fair value, management may use assumptions including but not limited to future cash flows and estimated risk premiums. Multiple inputs from various sources may be used to determine fair value.
GAAP requires disclosure regarding the inputs and valuation techniques used to measure fair value and any changes in valuation inputs or techniques. In addition, investments shall be disclosed by major category. This information is disclosed following the Fund’s Portfolio of Investments.
Security transactions
Security transactions are accounted for on the trade date. Cost is determined and gains (losses) are based upon the specific identification method for both financial statement and federal income tax purposes.
Income recognition
Interest income is recorded on an accrual basis. Market premiums and discounts, including original issue discounts, are amortized and accreted, respectively, over the expected life of the security on all debt securities, unless otherwise noted.
The Fund may place a debt security on non-accrual status and reduce related interest income when it becomes probable that the interest will not be collected and the amount of uncollectible interest can be reasonably estimated. A defaulted debt security is removed from non-accrual status when the issuer resumes interest payments or when collectibility of interest is reasonably assured.
Dividend income is recorded on the ex-dividend date.
Expenses
General expenses of the Trust are allocated to the Fund and other funds of the Trust based upon relative net assets or other expense allocation methodologies determined by the nature of the expense. Expenses directly attributable to the Fund are charged to the Fund. Expenses directly attributable to a specific class of shares are charged to that share class.
Determination of class net asset value
All income, expenses (other than class-specific expenses, which are charged to that share class, as shown in the Statement of Operations) and realized and unrealized gains (losses) are allocated to each class of the Fund on a daily basis, based on the relative net assets of each class, for purposes of determining the net asset value of each class.
Federal income tax status
The Fund intends to qualify each year as a regulated investment company under Subchapter M of the Internal Revenue Code, as amended, and will distribute substantially all of its investment company taxable income and net capital gain, if any, for its tax year, and as such will not be subject to federal income taxes. In addition, the Fund intends to distribute in each calendar year substantially all of its ordinary income, capital gain net income and certain other amounts, if any, such that the Fund should not be subject to federal excise tax. Therefore, no federal income or excise tax provision is recorded.
Distributions to shareholders
Distributions from net investment income, if any, are declared daily and paid monthly. Net realized capital gains, if any, are distributed at least annually. Income distributions and capital gain distributions are determined in accordance with federal income tax regulations, which may differ from GAAP.
Columbia U.S. Treasury Index Fund | Annual Report 2019
| 17 |
Notes to Financial Statements (continued)
April 30, 2019
Guarantees and indemnifications
Under the Trust’s organizational documents and, in some cases, by contract, its officers and trustees are indemnified against certain liabilities arising out of the performance of their duties to the Trust or its funds. In addition, certain of the Fund’s contracts with its service providers contain general indemnification clauses. The Fund’s maximum exposure under these arrangements is unknown since the amount of any future claims that may be made against the Fund cannot be determined, and the Fund has no historical basis for predicting the likelihood of any such claims.
Recent accounting pronouncements
Accounting Standards Update 2017-08 Premium Amortization on Purchased Callable Debt Securities
In March 2017, the Financial Accounting Standards Board issued Accounting Standards Update (ASU) No. 2017-08 Premium Amortization on Purchased Callable Debt Securities. ASU No. 2017-08 updates the accounting standards to shorten the amortization period for certain purchased callable debt securities, held at a premium, to be amortized to the earliest call date. The update applies to securities with explicit, noncontingent call features that are callable at fixed prices and on preset dates. The standard is effective for annual periods beginning after December 15, 2018 and interim periods within those fiscal years. Management does not expect the implementation of this guidance to have a material impact on the financial statement amounts and footnote disclosures.
Accounting Standards Update 2018-13 Disclosure Framework - Changes to the Disclosure Requirements for Fair Value Measurement
In August 2018, the Financial Accounting Standards Board issued Accounting Standards Update (ASU) No. 2018-13 Disclosure Framework - Changes to the Disclosure Requirements for Fair Value Measurement. ASU No. 2018-13, in addition to other modifications and additions, removes the requirement to disclose the amount and reasons for transfers between Level 1 and Level 2 of the fair value hierarchy and the policy for the timing of transfers between levels. The standard is effective for annual periods beginning after December 15, 2019 and interim periods within those fiscal years. At this time, management is evaluating the implication of this guidance and the impact it will have on the financial statement disclosures, if any.
Disclosure Update and Simplification
In September 2018, the Securities and Exchange Commission (SEC) released Final Rule 33-10532, Disclosure Update and Simplification, which amends certain financial statement disclosure requirements that the SEC determined to be redundant, outdated, or superseded in light of other SEC disclosure requirements, GAAP, or changes in the information environment. As a result of the amendments, management implemented disclosure changes which included removing the components of distributable earnings presented on the Statement of Assets and Liabilities and combining income and gain distributions paid to shareholders as presented on the Statement of Changes in Net Assets. Any values presented to meet prior year requirements were left unchanged. The amendments had no effect on the Fund’s net assets or results of operation.
Note 3. Fees and other transactions with affiliates
Management services fees
The Fund has entered into a Management Agreement with Columbia Management Investment Advisers, LLC (the Investment Manager), a wholly-owned subsidiary of Ameriprise Financial, Inc. (Ameriprise Financial). Under the Management Agreement, the Investment Manager provides the Fund with investment research and advice, as well as administrative and accounting services. The management services fee is an annual fee that is equal to 0.40% of the Fund’s daily net assets.
The Investment Manager, from the management services fee it receives from the Fund, pays all operating expenses of the Fund, with the exception of brokerage fees and commissions, taxes, interest, fees and expenses of Board of Trustees who are not officers, directors or employees of the Investment Manager or its affiliates, distribution and/or shareholder servicing and any extraordinary non-recurring expenses that may arise, including litigation fees.
| 18 | Columbia U.S. Treasury Index Fund | Annual Report 2019 |
Notes to Financial Statements (continued)
April 30, 2019
Compensation of board members
Members of the Board of Trustees who are not officers or employees of the Investment Manager or Ameriprise Financial are compensated for their services to the Fund as disclosed in the Statement of Operations. These members of the Board of Trustees may participate in a Deferred Compensation Plan (the Deferred Plan) which may be terminated at any time. Obligations of the Deferred Plan will be paid solely out of the Fund’s assets, and all amounts payable under the Deferred Plan constitute a general unsecured obligation of the Fund.
Compensation of Chief Compliance Officer
The Board of Trustees has appointed a Chief Compliance Officer to the Fund in accordance with federal securities regulations. A portion of the Chief Compliance Officer’s total compensation is allocated to the Fund, along with other allocations to affiliated registered investment companies managed by the Investment Manager and its affiliates, based on relative net assets. The expenses of the Chief Compliance Officer allocated to the Fund are payable by the Investment Manager.
Transfer agency fees
Under a Transfer and Dividend Disbursing Agent Agreement, Columbia Management Investment Services Corp. (the Transfer Agent), an affiliate of the Investment Manager and a wholly-owned subsidiary of Ameriprise Financial, is responsible for providing transfer agency services to the Fund. The Transfer Agent has contracted with DST Asset Manager Solutions, Inc. (DST) to serve as sub-transfer agent.
The transfer agency fees are payable by the Investment Manager. The Transfer Agent pays the fees of DST for services as sub-transfer agent and DST is not entitled to reimbursement for such fees from the Fund. The Transfer Agent also receives compensation from the Investment Manager for various shareholder services and reimbursements for certain out-of-pocket expenses.
An annual minimum account balance fee of $20 may apply to certain accounts with a value below the applicable share class’s initial minimum investment requirements to reduce the impact of small accounts on transfer agency fees. These minimum account balance fees are remitted to the Fund and recorded as part of expense reductions in the Statement of Operations. For the year ended April 30, 2019, these minimum account balance fees reduced total expenses of the Fund by $740.
Distribution and service fees
The Fund has entered into an agreement with Columbia Management Investment Distributors, Inc. (the Distributor), an affiliate of the Investment Manager and a wholly-owned subsidiary of Ameriprise Financial, for distribution and shareholder services. The Board of Trustees has approved, and the Fund has adopted, distribution and shareholder service plans (the Plans) applicable to certain share classes, which set the distribution and service fees for the Fund. These fees are calculated daily and are intended to compensate the Distributor and/or eligible selling and/or servicing agents for selling shares of the Fund and providing services to investors.
Under the Plans, the Fund pays a monthly service fee to the Distributor at the maximum annual rate of 0.25% of the average daily net assets attributable to Class A, Class C and Class T shares of the Fund. Also under the Plans, the Fund pays a monthly distribution fee to the Distributor at the maximum annual rates of 0.75% and 0.25% of the average daily net assets attributable to Class C and Class T shares of the Fund, respectively. As a result of all Class T shares of the Fund being redeemed or converted to Class A shares, December 14, 2018 was the last day the Fund paid a distribution and shareholder services fee for Class T shares.
Although the Fund may have paid a distribution fee up to 0.25% of the Fund’s average daily net assets attributable to Class T shares and a service fee of up to 0.25% of the Fund’s average daily net assets attributable to Class T shares, the aggregate fee shall not exceed 0.25% of the Fund’s average daily net assets attributable to Class T shares.
The Distributor has voluntarily agreed to waive a portion of the service fee for Class A and Class C shares so that the service fee does not exceed 0.15% annually of the average daily net assets attributable to each such share class. This arrangement may be modified or terminated by the Distributor at any time.
Columbia U.S. Treasury Index Fund | Annual Report 2019
| 19 |
Notes to Financial Statements (continued)
April 30, 2019
The Distributor has voluntarily agreed to waive a portion of the distribution fee for Class C shares so that the distribution fee does not exceed 0.70% annually of the average daily net assets attributable to Class C shares. This arrangement may be modified or terminated by the Distributor at any time.
Sales charges (unaudited)
Sales charges, including front-end charges and CDSCs, received by the Distributor for distributing Fund shares for the year ended April 30, 2019, if any, are listed below:
Expenses waived/reimbursed by the Investment Manager and its affiliates
The Investment Manager and certain of its affiliates have contractually agreed to waive fees and/or reimburse expenses (excluding certain fees and expenses described below) for the period(s) disclosed below, unless sooner terminated at the sole discretion of the Board of Trustees, so that the Fund’s net operating expenses, after giving effect to fees waived/expenses reimbursed and any balance credits and/or overdraft charges from the Fund’s custodian, do not exceed the following annual rate(s) as a percentage of the class’ average daily net assets:
| | Fee rate(s) contractual
through
August 31, 2019 |
| Class A | 0.45% |
| Class C | 1.20 |
| Institutional Class | 0.20 |
| Institutional 2 Class | 0.20 |
| Institutional 3 Class | 0.20 |
Under the agreement governing these fee waivers and/or expense reimbursement arrangements, the following fees and expenses are excluded from the waiver/reimbursement commitment, and therefore will be paid by the Fund, if applicable: taxes (including foreign transaction taxes), expenses associated with investments in affiliated and non-affiliated pooled investment vehicles (including mutual funds and exchange-traded funds), transaction costs and brokerage commissions, costs related to any securities lending program, dividend expenses associated with securities sold short, inverse floater program fees and expenses, transaction charges and interest on borrowed money, interest, infrequent and/or unusual expenses and any other expenses the exclusion of which is specifically approved by the Board of Trustees. This agreement may be modified or amended only with approval from the Investment Manager, certain of its affiliates and the Fund. Any fees waived and/or expenses reimbursed under the expense reimbursement arrangements described above are not recoverable by the Investment Manager or its affiliates in future periods. Class A and Class C distribution and service fees waived by the Distributor, as discussed above, are in addition to the waiver/reimbursement commitment under the agreement.
Note 4. Federal tax information
The timing and character of income and capital gain distributions are determined in accordance with income tax regulations, which may differ from GAAP because of temporary or permanent book to tax differences.
At April 30, 2019, these differences were primarily due to differing treatment for deferral/reversal of wash sale losses, capital loss carryforwards, trustees’ deferred compensation, distributions and principal and/or interest from fixed income securities. To the extent these differences were permanent, reclassifications were made among the components of the Fund’s net assets. Temporary differences do not require reclassifications.
The Fund did not have any permanent differences; therefore, no reclassifications were made.
| 20 | Columbia U.S. Treasury Index Fund | Annual Report 2019 |
Notes to Financial Statements (continued)
April 30, 2019
The tax character of distributions paid during the years indicated was as follows:
| Year Ended April 30, 2019 | Year Ended April 30, 2018 |
Ordinary
income ($) | Long-term
capital gains ($) | Total ($) | Ordinary
income ($) | Long-term
capital gains ($) | Total ($) |
| 17,186,079 | — | 17,186,079 | 11,870,444 | — | 11,870,444 |
Short-term capital gain distributions, if any, are considered ordinary income distributions for tax purposes.
At April 30, 2019, the components of distributable earnings on a tax basis were as follows:
Undistributed
ordinary income ($) | Undistributed
long-term
capital gains ($) | Capital loss
carryforwards ($) | Net unrealized
appreciation ($) |
| 1,315,230 | — | (11,832,529) | 4,856,800 |
At April 30, 2019, the cost of all investments for federal income tax purposes along with the aggregate gross unrealized appreciation and depreciation based on that cost was:
Federal
tax cost ($) | Gross unrealized
appreciation ($) | Gross unrealized
(depreciation) ($) | Net unrealized
appreciation ($) |
| 832,282,208 | 7,955,513 | (3,098,713) | 4,856,800 |
Tax cost of investments and unrealized appreciation/(depreciation) may also include timing differences that do not constitute adjustments to tax basis.
The following capital loss carryforwards, determined at April 30, 2019, may be available to reduce taxable income arising from future net realized gains on investments, if any, to the extent permitted by the Internal Revenue Code. Capital loss carryforwards with no expiration are required to be utilized prior to any capital losses which carry an expiration date. As a result of this ordering rule, capital loss carryforwards which carry an expiration date may be more likely to expire unused. In addition, for the year ended April 30, 2019, capital loss carryforwards utilized and expired unused, if any, were as follows:
No expiration
short-term ($) | No expiration
long-term ($) | Total ($) | Utilized ($) | Expired ($) |
| 3,903,007 | 7,929,522 | 11,832,529 | — | — |
Management of the Fund has concluded that there are no significant uncertain tax positions in the Fund that would require recognition in the financial statements. However, management’s conclusion may be subject to review and adjustment at a later date based on factors including, but not limited to, new tax laws, regulations, and administrative interpretations (including relevant court decisions). Generally, the Fund’s federal tax returns for the prior three fiscal years remain subject to examination by the Internal Revenue Service.
Note 5. Portfolio information
The cost of purchases and proceeds from sales of securities, excluding short-term investments and derivatives, if any, aggregated to $414,996,740 and $468,184,473, respectively, for the year ended April 30, 2019, of which $414,996,740 and $468,184,182, respectively, were U.S. government securities. The amount of purchase and sale activity impacts the portfolio turnover rate reported in the Financial Highlights.
Note 6. Affiliated money market fund
The Fund invests in Columbia Short-Term Cash Fund, an affiliated money market fund established for the exclusive use by the Fund and other affiliated funds (the Affiliated MMF). The income earned by the Fund from such investments is included as Dividends - affiliated issuers in the Statement of Operations. As an investing fund, the Fund indirectly bears its proportionate share of the expenses of the Affiliated MMF. The Affiliated MMF prices its shares with a floating net asset value. In addition,
Columbia U.S. Treasury Index Fund | Annual Report 2019
| 21 |
Notes to Financial Statements (continued)
April 30, 2019
the Board of Trustees of the Affiliated MMF may impose a fee on redemptions (sometimes referred to as a liquidity fee) or temporarily suspend redemptions (sometimes referred to as imposing a redemption gate) in the event its liquidity falls below regulatory limits.
Note 7. Interfund lending
Pursuant to an exemptive order granted by the Securities and Exchange Commission, the Fund participates in a program (the Interfund Program) allowing each participating Columbia Fund (each, a Participating Fund) to lend money directly to and, except for closed-end funds and money market funds, borrow money directly from other Participating Funds for temporary purposes. The amounts eligible for borrowing and lending under the Interfund Program are subject to certain restrictions.
Interfund loans are subject to the risk that the borrowing fund could be unable to repay the loan when due, and a delay in repayment to the lending fund could result in lost opportunities and/or additional lending costs. The exemptive order is subject to conditions intended to mitigate conflicts of interest arising from the Investment Manager’s relationship with each Participating Fund.
The Fund’s activity in the Interfund Program during the year ended April 30, 2019 was as follows:
| Borrower or lender | Average loan
balance ($) | Weighted average
interest rate (%) | Days
outstanding |
| Lender | 6,000,000 | 2.73 | 3 |
Interest income earned by the Fund is recorded as Interfund lending in the Statement of Operations. The Fund had no outstanding interfund loans at April 30, 2019.
Note 8. Line of credit
The Fund has access to a revolving credit facility with a syndicate of banks led by Citibank, N.A., HSBC Bank USA, N.A. and JPMorgan Chase Bank, N.A. whereby the Fund may borrow for the temporary funding of shareholder redemptions or for other temporary or emergency purposes. The credit facility, which is a collective agreement between the Fund and certain other funds managed by the Investment Manager or an affiliated investment manager, severally and not jointly, permits collective borrowings up to $1 billion. Interest is charged to each participating fund based on its borrowings at a rate equal to the higher of (i) the federal funds effective rate, (ii) the one-month LIBOR rate and (iii) the overnight bank funding rate, plus in each case, 1.00%. Each borrowing under the credit facility matures no later than 60 days after the date of borrowing. The Fund also pays a commitment fee equal to its pro rata share of the unused amount of the credit facility at a rate of 0.15% per annum. The commitment fee is included in other expenses in the Statement of Operations. This agreement expires annually in December unless extended or renewed.
The Fund had no borrowings during the year ended April 30, 2019.
Note 9. Significant risks
Credit risk
Credit risk is the risk that the value of debt securities in the Fund’s portfolio may decline because the issuer may default and fail to pay interest or repay principal when due. Rating agencies assign credit ratings to debt securities to indicate their credit risk. Lower rated or unrated debt securities held by the Fund may present increased credit risk as compared to higher-rated debt securities.
Interest rate risk
Interest rate risk is the risk of losses attributable to changes in interest rates. In general, if prevailing interest rates rise, the values of debt securities tend to fall, and if interest rates fall, the values of debt securities tend to rise. Actions by governments and central banking authorities can result in increases in interest rates. Increasing interest rates may negatively affect the value of debt securities held by the Fund, resulting in a negative impact on the Fund’s performance and net asset value per share. In general, the longer the maturity or duration of a debt security, the greater its sensitivity to changes in interest rates.
| 22 | Columbia U.S. Treasury Index Fund | Annual Report 2019 |
Notes to Financial Statements (continued)
April 30, 2019
Shareholder concentration risk
At April 30, 2019, affiliated shareholders of record owned 81.2% of the outstanding shares of the Fund in one or more accounts. Subscription and redemption activity by concentrated accounts may have a significant effect on the operations of the Fund. In the case of a large redemption, the Fund may be forced to sell investments at inopportune times, including its liquid positions, which may result in Fund losses and the Fund holding a higher percentage of less liquid positions. Large redemptions could result in decreased economies of scale and increased operating expenses for non-redeeming Fund shareholders.
Note 10. Subsequent events
Management has evaluated the events and transactions that have occurred through the date the financial statements were issued and noted no items requiring adjustment of the financial statements or additional disclosure.
Note 11. Information regarding pending and settled legal proceedings
Ameriprise Financial and certain of its affiliates have historically been involved in a number of legal, arbitration and regulatory proceedings, including routine litigation, class actions, and governmental actions, concerning matters arising in connection with the conduct of their business activities. Ameriprise Financial believes that the Fund is not currently the subject of, and that neither Ameriprise Financial nor any of its affiliates are the subject of, any pending legal, arbitration or regulatory proceedings that are likely to have a material adverse effect on the Fund or the ability of Ameriprise Financial or its affiliates to perform under their contracts with the Fund. Ameriprise Financial is required to make quarterly (10-Q), annual (10-K) and, as necessary, 8-K filings with the Securities and Exchange Commission (SEC) on legal and regulatory matters that relate to Ameriprise Financial and its affiliates. Copies of these filings may be obtained by accessing the SEC website at www.sec.gov.
There can be no assurance that these matters, or the adverse publicity associated with them, will not result in increased Fund redemptions, reduced sale of Fund shares or other adverse consequences to the Fund. Further, although we believe proceedings are not likely to have a material adverse effect on the Fund or the ability of Ameriprise Financial or its affiliates to perform under their contracts with the Fund, these proceedings are subject to uncertainties and, as such, we are unable to estimate the possible loss or range of loss that may result. An adverse outcome in one or more of these proceedings could result in adverse judgments, settlements, fines, penalties or other relief that could have a material adverse effect on the consolidated financial condition or results of operations of Ameriprise Financial.
Columbia U.S. Treasury Index Fund | Annual Report 2019
| 23 |
Report of Independent Registered Public Accounting Firm
To the Board of Trustees of Columbia Funds Series Trust I and Shareholders of Columbia U.S. Treasury Index Fund
Opinion on the Financial Statements
We have audited the accompanying statement of assets and liabilities, including the portfolio of investments, of Columbia U.S. Treasury Index Fund (one of the funds constituting Columbia Funds Series Trust I, referred to hereafter as the "Fund") as of April 30, 2019, the related statement of operations for the year ended April 30, 2019, the statement of changes in net assets for each of the two years in the period ended April 30, 2019, including the related notes, and the financial highlights for each of the periods indicated therein (collectively referred to as the “financial statements”). In our opinion, the financial statements present fairly, in all material respects, the financial position of the Fund as of April 30, 2019, the results of its operations for the year then ended, the changes in its net assets for each of the two years in the period ended April 30, 2019 and the financial highlights for each of the periods indicated therein in conformity with accounting principles generally accepted in the United States of America.
Basis for Opinion
These financial statements are the responsibility of the Fund’s management. Our responsibility is to express an opinion on the Fund’s financial statements based on our audits. We are a public accounting firm registered with the Public Company Accounting Oversight Board (United States) (PCAOB) and are required to be independent with respect to the Fund in accordance with the U.S. federal securities laws and the applicable rules and regulations of the Securities and Exchange Commission and the PCAOB.
We conducted our audits of these financial statements in accordance with the standards of the PCAOB. Those standards require that we plan and perform the audit to obtain reasonable assurance about whether the financial statements are free of material misstatement, whether due to error or fraud.
Our audits included performing procedures to assess the risks of material misstatement of the financial statements, whether due to error or fraud, and performing procedures that respond to those risks. Such procedures included examining, on a test basis, evidence regarding the amounts and disclosures in the financial statements. Our audits also included evaluating the accounting principles used and significant estimates made by management, as well as evaluating the overall presentation of the financial statements. Our procedures included confirmation of securities owned as of April 30, 2019 by correspondence with the custodian, transfer agent and brokers; when replies were not received from brokers, we performed other auditing procedures. We believe that our audits provide a reasonable basis for our opinion.
/s/PricewaterhouseCoopers LLP
Minneapolis, Minnesota
June 21, 2019
We have served as the auditor of one or more investment companies within the Columbia Funds Complex since 1977.
| 24 | Columbia U.S. Treasury Index Fund | Annual Report 2019 |
The Board oversees the Fund’s operations and appoints officers who are responsible for day-to-day business decisions based on policies set by the Board. The following table provides basic biographical information about the Fund’s Trustees as of the printing of this report, including their principal occupations during the past five years, although specific titles for individuals may have varied over the period. The year set forth beneath Length of Service in the table below is the year in which the Trustee was first appointed or elected as Trustee to any Fund currently in the Columbia Funds Complex or a predecessor thereof. Under current Board policy, members serve terms of indefinite duration.
Independent trustees
| Name, address, year of birth | Position held with the Trust and length of service | Principal occupation(s) during the past five years and other relevant professional experience | Number of Funds in the Columbia Fund Complex overseen | Other directorships held by Trustee during the past five years |
Janet Langford Carrig
c/o Columbia Management
Investment Advisers, LLC
225 Franklin Street
Mail Drop BX32 05228
Boston, MA 02110
1957 | Trustee
1996 | Senior Vice President, General Counsel and Corporate Secretary, ConocoPhillips (independent energy company) from September 2007 to October 2018 | 69 | None |
Douglas A. Hacker
c/o Columbia Management
Investment Advisers, LLC
225 Franklin Street
Mail Drop BX32 05228
Boston, MA 02110
1955 | Trustee and Chairman of the Board
1996 | Independent business executive since May 2006; Executive Vice President — Strategy of United Airlines from December 2002 to May 2006; President of UAL Loyalty Services (airline marketing company) from September 2001 to December 2002; Executive Vice President and Chief Financial Officer of United Airlines from July 1999 to September 2001 | 69 | Spartan Nash Company, (food distributor); Nash Finch Company (food distributor) from 2005 to 2013; Aircastle Limited (aircraft leasing); SeaCube Container Leasing Ltd. (container leasing) from 2010 to 2013; and Travelport Worldwide Limited (travel information technology) |
Nancy T. Lukitsh
c/o Columbia Management
Investment Advisers, LLC
225 Franklin Street
Mail Drop BX32 05228
Boston, MA 02110
1956 | Trustee
2011 | Senior Vice President, Partner and Director of Marketing, Wellington Management Company, LLP (investment adviser) from 1997 to 2010; Chair, Wellington Management Portfolios (commingled non-U.S. investment pools) from 2007 to 2010; Director, Wellington Trust Company, NA and other Wellington affiliates from 1997 to 2010 | 69 | None |
David M. Moffett
c/o Columbia Management
Investment Advisers, LLC
225 Franklin Street
Mail Drop BX32 05228
Boston, MA 02110
1952 | Trustee
2011 | Retired. Consultant to Bridgewater and Associates | 69 | Director, CSX Corporation (transportation suppliers); Genworth Financial, Inc. (financial and insurance products and services); PayPal Holdings Inc. (payment and data processing services); Trustee, University of Oklahoma Foundation; former Director, eBay Inc. (online trading community), 2007-2015; and former Director, CIT Bank, CIT Group Inc. (commercial and consumer finance), 2010-2016 |
Columbia U.S. Treasury Index Fund | Annual Report 2019
| 25 |
TRUSTEES AND OFFICERS (continued)
Independent trustees (continued)
| Name, address, year of birth | Position held with the Trust and length of service | Principal occupation(s) during the past five years and other relevant professional experience | Number of Funds in the Columbia Fund Complex overseen | Other directorships held by Trustee during the past five years |
John J. Neuhauser
c/o Columbia Management
Investment Advisers, LLC
225 Franklin Street
Mail Drop BX32 05228
Boston, MA 02110
1943 | Trustee
1984 | President, Saint Michael’s College from August 2007 to June 2018; Director or Trustee of several non-profit organizations, including University of Vermont Medical Center; Academic Vice President and Dean of Faculties, Boston College from August 1999 to October 2005; University Professor, Boston College from November 2005 to August 2007 | 69 | Liberty All-Star Equity Fund and Liberty All- Star Growth Fund (closed-end funds) |
Patrick J. Simpson
c/o Columbia Management
Investment Advisers, LLC
225 Franklin Street
Mail Drop BX32 05228
Boston, MA 02110
1944 | Trustee
2000 | Of Counsel, Perkins Coie LLP (law firm) since 2015; Partner, Perkins Coie LLP from 1988 to 2014 | 69 | M Fund, Inc. (M Funds mutual fund family) |
Anne-Lee Verville
c/o Columbia Management
Investment Advisers, LLC
225 Franklin Street
Mail Drop BX32 05228
Boston, MA 02110
1945 | Trustee
1998 | Retired. General Manager, Global Education Industry from 1994 to 1997, President – Application Systems Division from 1991 to 1994, Chief Financial Officer – US Marketing & Services from 1988 to 1991, and Chief Information Officer from 1987 to 1988, IBM Corporation (computer and technology) | 69 | Enesco Group, Inc. (producer of giftware and home and garden decor products) from 2001 to 2006 |
Consultants to the Independent Trustees*
| Name, address, year of birth | Position held with the Trust and length of service | Principal occupation(s) during the past five years and other relevant professional experience | Number of Funds in the Columbia Funds complex overseen | Other directorships held by Trustee during the past five years |
J. Kevin Connaughton
c/o Columbia
Management Investment
Advisers, LLC,
225 Franklin Street
Mail Drop BX32 05228,
Boston, MA 02110
1964 | Independent Trustee Consultant
2016 | Independent Trustee Consultant, Columbia Funds since March 2016; Adjunct Professor of Finance, Bentley University since November 2017; Managing Director and General Manager of Mutual Fund Products, Columbia Management Investment Advisers, LLC from May 2010 to February 2015; President, Columbia Funds from 2009 to 2015; and senior officer of Columbia Funds and affiliated funds from 2003 to 2015 | 69 | Director, The Autism Project since March 2015; former Trustee, New Century Portfolios, March 2015-December 2017; formerly on Board of Governors, Gateway Healthcare, January 2016 – December 2017 |
| 26 | Columbia U.S. Treasury Index Fund | Annual Report 2019 |
TRUSTEES AND OFFICERS (continued)
Consultants to the Independent Trustees* (continued)
| Name, address, year of birth | Position held with the Trust and length of service | Principal occupation(s) during the past five years and other relevant professional experience | Number of Funds in the Columbia Funds complex overseen | Other directorships held by Trustee during the past five years |
Olive Darragh
c/o Columbia
Management Investment
Advisers, LLC,
225 Franklin Street,
Mail Drop BX32 05228,
Boston, MA 02110
1962 | Independent Trustee Consultant 2019 | Independent Trustee Consultant, Columbia Funds since June 2019; Managing Director of Darragh Inc. (a strategy and talent management consulting firm) since 2010; Founder and CEO, Zolio (an investment management talent identification platform) since 2004; Partner, Tudor Investments from 2004 to 2010; Senior Partner, McKinsey & Company from 2001 to 2004 | 69 | Director, University of Edinburgh Business School; former Director, Boston Public Library Foundation |
Natalie A. Trunow
c/o Columbia
Management Investment
Advisers, LLC,
225 Franklin Street
Mail Drop BX32 05228,
Boston, MA 02110
1967 | Independent Trustee Consultant
2016 | Independent Trustee Consultant, Columbia Funds since September 2016; Chief Executive Officer, Millennial Portfolio Solutions LLC (asset management and consulting services) since January 2016; Director of Investments, Casey Family Programs from April 2016 to September 2016; Senior Vice President and Chief Investment Officer, Calvert Investments from August 2008 to January 2016; Section Head and Portfolio Manager, General Motors Asset Management from June 1997 to August 2008 | 69 | Director, Health Services for Children with Special Needs, Inc.; Director, Guidewell Financial Solutions |
| * | J. Kevin Connaughton was appointed consultant to the Independent Trustees effective March 1, 2016. Olive Darragh was appointed consultant to the Independent Trustees effective June 10, 2019. Natalie A. Trunow was appointed consultant to the Independent Trustees effective September 1, 2016. Shareholders of the Funds are expected to be asked to elect each of Mr. Connaughton, Ms. Darragh and Ms. Trunow as a Trustee at a future shareholder meeting. |
Interested trustee affiliated with Investment Manager*
| Name, address, year of birth | Position held with the Trust and length of service | Principal occupation(s) during the past five years and other relevant professional experience | Number of Funds in the Columbia Funds Complex overseen | Other directorships held by Trustee during the past five years |
William F. Truscott
c/o Columbia Management
Investment Advisers, LLC
225 Franklin Street
Boston, MA 02110
1960 | Trustee
2012 | Chairman of the Board and President, Columbia Management Investment Advisers, LLC since May 2010 and February 2012, respectively; Chief Executive Officer, Global Asset Management, Ameriprise Financial, Inc. since September 2012 (previously Chief Executive Officer, U.S. Asset Management & President, Annuities, May 2010-September 2012); Director and Chief Executive Officer, Columbia Management Investment Distributors, Inc. since May 2010 and February 2012, respectively; Chairman of the Board and Chief Executive Officer, RiverSource Distributors, Inc. since 2006; Director, Threadneedle Asset Management Holdings, SARL since 2014; President and Chief Executive Officer, Ameriprise Certificate Company, 2006-August 2012 | 188 | Chairman of the Board, Columbia Management Investment Advisers, LLC since May 2010; Director, Columbia Management Investment Distributors, Inc. since May 2010; former Director, Ameriprise Certificate Company, 2006 - January 2013 |
| * | Interested person (as defined under the 1940 Act) by reason of being an officer, director, security holder and/or employee of the Investment Manager or Ameriprise Financial. |
The Statement of Additional Information has additional information about the Fund’s Board members and is available, without charge, upon request by calling 800.345.6611, visiting columbiathreadneedleus.com/investor/ or contacting your financial intermediary.
Columbia U.S. Treasury Index Fund | Annual Report 2019
| 27 |
TRUSTEES AND OFFICERS (continued)
The Board has appointed officers who are responsible for day-to-day business decisions based on policies it has established. The officers serve at the pleasure of the Board. The following table provides basic information about the Officers of the Fund, including principal occupations during the past five years, although their specific titles may have varied over the period. In addition to Mr. Truscott, who is Senior Vice President, the Fund’s other officers are:
Fund officers
Name,
address and
year of birth | Position and year
first appointed to
position for any Fund
in the Columbia
Funds complex or a
predecessor thereof | Principal occupation(s) during past five years |
Christopher O. Petersen
5228 Ameriprise
Financial Center
Minneapolis, MN 55474
Born 1970 | President and Principal Executive Officer (2015) | Vice President and Lead Chief Counsel, Ameriprise Financial, Inc. since January 2015 (previously Vice President and Chief Counsel, January 2010 - December 2014; officer of Columbia Funds and affiliated funds since 2007. |
Michael G. Clarke
225 Franklin Street
Boston, MA 02110
Born 1969 | Chief Financial Officer (Principal Financial Officer) (2009) and Senior Vice President (2019) | Vice President, Head of North American Operations, and Co-Head of Global Operations, Columbia Management Investment Advisers, LLC, since June 2019 (previously Vice President – Accounting and Tax, May 2010 - May 2019); senior officer of Columbia Funds and affiliated funds since 2002 (previously Treasurer and Chief Accounting Officer, January 2009 - January 2019 and December 2015 - January 2019, respectively). |
Joseph Beranek
5890 Ameriprise
Financial Center
Minneapolis, MN 55474
Born 1965 | Treasurer and Chief Accounting Officer (Principal Accounting Officer) (2019) | Vice President — Mutual Fund Accounting and Financial Reporting, Columbia Management Investment Advisers, LLC, since December 2018 and March 2017, respectively (previously Vice President — Pricing and Corporate Actions, May 2010 - March 2017). |
Paul B. Goucher
485 Lexington Avenue
New York, NY 10017
Born 1968 | Senior Vice President (2011) and Assistant Secretary (2008) | Senior Vice President and Assistant General Counsel, Ameriprise Financial, Inc. since January 2017 (previously Vice President and Lead Chief Counsel, November 2008 - January 2017 and January 2013 - January 2017, respectively); Vice President, Chief Legal Officer and Assistant Secretary, Columbia Management Investment Advisers, LLC since March 2015 (previously Vice President and Assistant Secretary, May 2010 – March 2015). |
Thomas P. McGuire
225 Franklin Street
Boston, MA 02110
Born 1972 | Senior Vice President and Chief Compliance Officer (2012) | Vice President — Asset Management Compliance, Ameriprise Financial, Inc., since May 2010; Chief Compliance Officer, Ameriprise Certificate Company since September 2010. |
Colin Moore
225 Franklin Street
Boston, MA 02110
Born 1958 | Senior Vice President (2010) | Executive Vice President and Global Chief Investment Officer, Ameriprise Financial, Inc., since July 2013; Executive Vice President and Global Chief Investment Officer, Columbia Management Investment Advisers, LLC since July 2013. |
Ryan C. Larrenaga
225 Franklin Street
Boston, MA 02110
Born 1970 | Senior Vice President (2017), Chief Legal Officer (2017), and Secretary (2015) | Vice President and Chief Counsel, Ameriprise Financial, Inc. since August 2018 (previously Vice President and Group Counsel, August 2011 - August 2018); officer of Columbia Funds and affiliated funds since 2005. |
Michael E. DeFao
225 Franklin Street
Boston, MA 02110
Born 1968 | Vice President (2011) and Assistant Secretary (2010) | Vice President and Chief Counsel, Ameriprise Financial, Inc. since May 2010. |
Lyn Kephart-Strong
5228 Ameriprise
Financial Center
Minneapolis, MN 55474
Born 1960 | Vice President (2015) | President, Columbia Management Investment Services Corp. since October 2014; Vice President & Resolution Officer, Ameriprise Trust Company since August 2009. |
| 28 | Columbia U.S. Treasury Index Fund | Annual Report 2019 |
The Fund mails one shareholder report to each shareholder address, unless such shareholder elected to receive shareholder reports from the Fund electronically. If you would like more than one report, please call shareholder services at 800.345.6611 and additional reports will be sent to you.
Proxy voting policies and procedures
The policy of the Board of Trustees is to vote the proxies of the companies in which the Fund holds investments consistent with the procedures as stated in the Statement of Additional Information (SAI). You may obtain a copy of the SAI without charge by calling 800.345.6611; contacting your financial intermediary; visiting columbiathreadneedleus.com/investor/; or searching the website of the Securities and Exchange Commission (SEC) at sec.gov. Information regarding how the Fund voted proxies relating to portfolio securities is filed with the SEC by August 31st for the most recent 12-month period ending June 30th of that year, and is available without charge by visiting columbiathreadneedleus.com/investor/, or searching the website of the SEC at sec.gov.
Quarterly schedule of investments
The Fund files a complete schedule of portfolio holdings with the SEC for the first and third quarters of each fiscal year on Form N-Q or Form N-PORT (available for filings after March 31, 2019). The Fund’s Form N-Q or Form N-PORT is available on the SEC’s website at sec.gov. The Fund’s complete schedule of portfolio holdings, as filed on Form N-Q or Form N-PORT, can also be obtained without charge, upon request, by calling 800.345.6611.
Additional Fund information
For more information about the Fund, please visit columbiathreadneedleus.com/investor/ or call 800.345.6611. Customer Service Representatives are available to answer your questions Monday through Friday from 8 a.m. to 7 p.m. Eastern time.
Fund investment manager
Columbia Management Investment Advisers, LLC
225 Franklin Street
Boston, MA 02110
Fund distributor
Columbia Management Investment Distributors, Inc.
225 Franklin Street
Boston, MA 02110
Fund transfer agent
Columbia Management Investment Services Corp.
P.O. Box 219104
Kansas City, MO 64121-9104
Columbia U.S. Treasury Index Fund | Annual Report 2019
| 29 |
[THIS PAGE INTENTIONALLY LEFT BLANK]
[THIS PAGE INTENTIONALLY LEFT BLANK]
Columbia U.S. Treasury Index Fund
P.O. Box 219104
Kansas City, MO 64121-9104
Please read and consider the investment objectives, risks, charges and expenses for any fund carefully before investing. For a prospectus and summary prospectus, which contains this and other important information about the Fund, go to
columbiathreadneedleus.com/investor/. The Fund is distributed by Columbia Management Investment Distributors, Inc., member FINRA, and managed by Columbia Management Investment Advisers, LLC.
Columbia Threadneedle Investments (Columbia Threadneedle) is the global brand name of the Columbia and Threadneedle group of companies. All rights reserved.
© 2019 Columbia Management Investment Advisers, LLC.
columbiathreadneedleus.com/investor/

Annual Report
April 30, 2019
Columbia Corporate Income Fund
Beginning on January 1, 2021, as permitted by regulations adopted by the Securities and Exchange Commission, paper copies of the Fund’s annual and semiannual shareholder reports like this one will no longer be sent by mail, unless you specifically request paper copies of the reports. Instead, the reports will be made available on the Fund’s website (columbiathreadneedleus.com/investor/), and each time a report is posted you will be notified by mail and provided with a website address to access the report.
If you have already elected to receive shareholder reports electronically, you will not be affected by this change and you need not take any action. You may elect to receive shareholder reports and other communications from the Fund electronically at any time by contacting your financial intermediary (such as a broker-dealer or bank) or, for Fund shares held directly with the Fund, by calling 800.345.6611 or by enrolling in “eDelivery” by logging into your account at columbiathreadneedleus.com/investor/.
You may elect to receive all future reports in paper free of charge. If you invest through a financial intermediary, you can contact your financial intermediary to request that you continue receiving paper copies of your shareholder reports. If you invest directly with the Fund, you can call 800.345.6611 to let the Fund know you wish to continue receiving paper copies of your shareholder reports. Your election to receive paper reports will apply to all Columbia Funds held in your account if you invest through a financial intermediary or all Columbia Funds held with the fund complex if you invest directly with the Fund.
Not FDIC Insured • No bank guarantee • May lose value
Columbia Corporate Income Fund | Annual Report 2019
Investment objective
Columbia Corporate Income Fund (the Fund) seeks total return, consisting primarily of current income and secondarily of capital appreciation.
Portfolio management
Tom Murphy, CFA
Lead Portfolio Manager
Managed Fund since 2011
Timothy Doubek, CFA
Portfolio Manager
Managed Fund since 2011
| Average annual total returns (%) (for the period ended April 30, 2019) |
| | | Inception | 1 Year | 5 Years | 10 Years |
| Class A | Excluding sales charges | 07/31/00 | 5.93 | 2.75 | 6.76 |
| | Including sales charges | | 0.92 | 1.75 | 6.25 |
| Advisor Class* | 11/08/12 | 6.20 | 3.00 | 7.04 |
| Class C | Excluding sales charges | 07/15/02 | 5.29 | 2.14 | 6.13 |
| | Including sales charges | | 4.29 | 2.14 | 6.13 |
| Institutional Class | 03/05/86 | 6.19 | 3.00 | 7.03 |
| Institutional 2 Class* | 11/08/12 | 6.29 | 3.12 | 7.12 |
| Institutional 3 Class* | 11/08/12 | 6.34 | 3.17 | 7.16 |
| Blended Benchmark | | 6.55 | 3.79 | 6.92 |
| Bloomberg Barclays U.S. Corporate Bond Index | | 6.50 | 3.58 | 6.35 |
Returns for Class A shares are shown with and without the maximum initial sales charge of 4.75%. Returns for Class C shares are shown with and without the 1.00% contingent deferred sales charge for the first year only. The Fund’s other share classes are not subject to sales charges and have limited eligibility. Please see the Fund’s prospectus for details. Performance for different share classes will vary based on differences in sales charges and fees associated with each share class. All results shown assume reinvestment of distributions during the period. Returns do not reflect the deduction of taxes that a shareholder may pay on Fund distributions or on the redemption of Fund shares. Performance results reflect the effect of any fee waivers or reimbursements of Fund expenses by Columbia Management Investment Advisers, LLC and/or any of its affiliates. Absent these fee waivers or expense reimbursement arrangements, performance results would have been lower.
The performance information shown represents past performance and is not a guarantee of future results. The investment return and principal value of your investment will fluctuate so that your shares, when redeemed, may be worth more or less than their original cost. Current performance may be lower or higher than the performance information shown. You may obtain performance information current to the most recent month-end by contacting your financial intermediary, visiting columbiathreadneedleus.com/investor/ or calling 800.345.6611.
| * | The returns shown for periods prior to the share class inception date (including returns for the Life of the Fund, if shown, which are since Fund inception) include the returns of the Fund’s oldest share class. These returns are adjusted to reflect any higher class-related operating expenses of the newer share classes, as applicable. Please visit columbiathreadneedleus.com/investor/investment-products/mutual-funds/appended-performance for more information. |
The Blended Benchmark is a weighted custom benchmark, established by the Investment Manager, consisting of an 85% weighting in the Bloomberg Barclays U.S. Corporate Bond Index and a 15% weighting in the ICE Bank of America Merrill Lynch (ICE BofAML) U.S. Cash Pay High Yield Constrained Index tracks the performance of U.S. dollar-denominated below investment grade corporate debt, currently in a coupon paying period that is publicly issued in the U.S. domestic market.
The Bloomberg Barclays U.S. Corporate Bond Index measures the investment-grade, fixed-rate, taxable, corporate bond market.
Indices are not available for investment, are not professionally managed and do not reflect sales charges, fees, brokerage commissions, taxes or other expenses of investing. Securities in the Fund may not match those in an index.
Columbia Corporate Income Fund | Annual Report 2019
| 3 |
Fund at a Glance (continued)
Performance of a hypothetical $10,000 investment (April 30, 2009 — April 30, 2019)
The chart above shows the change in value of a hypothetical $10,000 investment in Class A shares of Columbia Corporate Income Fund during the stated time period, and does not reflect the deduction of taxes that a shareholder may pay on Fund distributions or on the redemption of Fund shares.
| Portfolio breakdown (%) (at April 30, 2019) |
| Common Stocks | 0.0(a) |
| Corporate Bonds & Notes | 91.1 |
| Money Market Funds | 3.2 |
| Senior Loans | 0.3 |
| U.S. Treasury Obligations | 5.4 |
| Total | 100.0 |
Percentages indicated are based upon total investments excluding investments in derivatives, if any. The Fund’s portfolio composition is subject to change.
| Quality breakdown (%) (at April 30, 2019) |
| AAA rating | 5.5 |
| AA rating | 1.5 |
| A rating | 17.8 |
| BBB rating | 64.4 |
| BB rating | 3.9 |
| B rating | 5.5 |
| CCC rating | 1.3 |
| Not rated | 0.1 |
| Total | 100.0 |
Percentages indicated are based upon total fixed income investments.
Bond ratings apply to the underlying holdings of the Fund and not the Fund itself and are divided into categories ranging from highest to lowest credit quality, determined by using the middle rating of Moody’s, S&P and Fitch, after dropping the highest and lowest available ratings. When ratings are available from only two rating agencies, the lower rating is used. When a rating is available from only one rating agency, that rating is used. When a bond is not rated by any rating agency, it is designated as “Not rated.” Credit quality ratings assigned by a rating agency are subjective opinions, not statements of fact, and are subject to change, including daily. The ratings assigned by credit rating agencies are but one of the considerations that the Investment Manager and/or Fund’s subadviser incorporates into its credit analysis process, along with such other issuer-specific factors as cash flows, capital structure and leverage ratios, ability to de-leverage (repay) through free cash flow, quality of management, market positioning and access to capital, as well as such security-specific factors as the terms of the security (e.g., interest rate and time to maturity) and the amount and type of any collateral.
| 4 | Columbia Corporate Income Fund | Annual Report 2019 |
Manager Discussion of Fund Performance
For the 12-month period that ended April 30, 2019, the Fund’s Class A shares returned 5.93% excluding sales charges. During the same 12-month period, the Fund’s Blended Benchmark returned 6.55%, while the Bloomberg Barclays U.S. Corporate Index returned 6.50%. Positive contributions to performance relative to the benchmark were led by the Fund’s overweight stance with respect to credit risk and issuer selection, while positioning with respect to interest rates and industry allocation decisions detracted.
Risk sentiment driven by shifting Federal Reserve posture
As the period opened, credit sentiment was bolstered by positive economic growth, strong corporate profits and the supportive tax legislation passed at the end of 2017. The outlook was clouded to some degree by the Trump administration’s escalating anti-free trade rhetoric, which led to bouts of market volatility. In addition to keeping a wary eye on trade disputes, fixed income investors focused on the trajectory of efforts by the U.S. Federal Reserve (the Fed) to “normalize” interest rates. With inflation hovering near its 2% target and the vast majority of companies reporting above-expectation second quarter earnings, the Fed began to foreshadow a more hawkish stance as the period progressed. At its June 13 meeting, the Fed increased the target range for its benchmark overnight lending rate by 25 basis points to between 1.75% and 2.00%. Promising economic data would subsequently lead the markets to anticipate two additional rate hikes before the end of 2018. Indeed, at its September meeting, the Fed implemented another quarter-point hike in the fed funds rate to the 2.00%-2.25% range while signaling the likelihood of a December increase. Entering the fourth quarter of 2018, stress began to rise in the credit markets and spreads started to widen.
In mid-December, the Fed met expectations and raised its short-term rate target to the 2.25%-2.50% range, while noting the potential for two additional hikes in 2019. In combination with the ongoing Brexit debacle and signs of slowing global growth, fears that the Fed would overshoot on rates led to a spike in volatility for risk assets. Over the last three months of 2018, the 10-year Treasury yield declined from 3.05% to 2.69% as investors sought a safe haven. Energy-related issues were battered as crude oil prices plunged over the fourth quarter on concerns around a weaker demand outlook and higher-than-expected supply driven in part by a loosening of U.S. sanctions on Iran.
Risk-oriented assets rebounded sharply in January of 2019 as the Fed pivoted to a more dovish tone, announcing an early end to its balance sheet reduction program and indicating it was leaning toward putting rate increases on pause. Weak economic data out of the eurozone and China led to renewed accommodation from the European Central Bank and the People’s Bank of China, to go along with the Fed’s actions. Modest progress on trade matters, a firming in oil prices and positive corporate earnings reports also helped boost credit sentiment. While the overall pace of gains moderated and there was some interim volatility, credit sensitive assets continued to outperform through the end of April 2019.
Yields finished lower along the length of the U.S. Treasury curve over the 12-month period ended April 30, 2019, with yields on intermediate maturities experiencing the biggest declines. To illustrate, the two-year Treasury yield fell 22 basis points from 2.49% to 2.27%, the five-year declined 49 basis points from 2.79% to 2.28%, the 10-year declined 46 basis points from 2.95% to 2.51%, the 20-year declined 26 basis points from 3.01% to 2.75%, and the 30-year yield declined 18 basis points from 3.11% to 2.93%.
Contributors and detractors
Positive contributions to performance relative to the benchmark were led by the Fund’s overweight stance with respect to credit risk, as both investment grade and high yield corporate spreads tightened over the 12 months. This was partially offset by industry weighting within corporate credit, primarily due to an overweight to utilities, specifically electric utilities.
Issuer selection contributed meaningfully to the Fund’s performance, with positive contributions led by energy names including Duke Energy, DTE Energy and CMS Energy. Partially offsetting these favorable selections were overweight positions in laggards CVS Health Corp and Pacific Gas & Electric.
The Fund’s stance with respect to overall portfolio duration (and corresponding interest rate sensitivity) and yield curve positioning detracted modestly, as the Fund was consistently short duration as Treasury yields declined along the curve beyond two years.
Columbia Corporate Income Fund | Annual Report 2019
| 5 |
Manager Discussion of Fund Performance (continued)
At period’s end
Despite the recent outperformance of the BBB-rated segment, we continued to find value in a number of issues in the BBB credit quality range where management teams have been taking proactive actions to reduce leverage, such as cutting dividends and selling assets. With that said, many of the companies we follow are part of the share buyback and increased dividend phenomenon. In addition, we have seen cases where expectations for post-acquisition deleveraging have not been met. Given the advanced stage of the economic cycle, we expect management teams of the companies we hold to shepherd cash in order to be positioned to weather any headwinds resulting from a deterioration in either the macro environment or conditions for their respective industries.
While the Fund continued to be overweight credit risk, this tilt has been slightly reduced since the beginning of 2019. We continued to favor non-cyclical industries in this environment, most notably food & beverage and electric utilities. The portfolio’s food & beverage overweight increased late in the period as the Fund purchased the new issue of Mars, a high-quality, infrequent issuer, and increased positions in Anheuser-Busch InBev and Conagra. The electric utility overweight was reduced over the same period primarily in order to fund purchases elsewhere.
On balance, we remain constructive on U.S. corporate credit, as we believe the asset class is supported by positive supply and demand factors and attractive yields relative to those offered globally. We view the most immediate risks within the market to be issuer-specific and are focused on investing in management teams that we believe are demonstrating good stewardship of their balance sheets.
Market risk may affect a single issuer, sector of the economy, industry or the market as a whole. Fixed-income securities presentissuer default risk. A rise ininterest rates may result in a price decline of fixed-income instruments held by the Fund, negatively impacting its performance and NAV. Falling rates may result in the Fund investing in lower yielding debt instruments, lowering the Fund’s income and yield. These risks may be heightened for longer maturity and duration securities.Non-investment-grade (high-yield or junk) securities present greater price volatility and more risk to principal and income than higher rated securities.Prepayment and extension risk exists because the timing of payments on a loan, bond or other investment may accelerate when interest rates fall or decelerate wheninterest rates rise which may reduce investment opportunities and potential returns. Investing inderivatives is a specialized activity that involves special risks that subject the Fund to significant loss potential, including when used as leverage, and may result in greater fluctuation in fund value.Liquidity risk is associated with the difficulty of selling underlying investments at a desirable time or price.See the Fund’s prospectus for more information on these and other risks.
The views expressed in this report reflect the current views of the respective parties. These views are not guarantees of future performance and involve certain risks, uncertainties and assumptions that are difficult to predict, so actual outcomes and results may differ significantly from the views expressed. These views are subject to change at any time based upon economic, market or other conditions and the respective parties disclaim any responsibility to update such views. These views may not be relied on as investment advice and, because investment decisions for a Columbia fund are based on numerous factors, may not be relied on as an indication of trading intent on behalf of any particular Columbia fund. References to specific securities should not be construed as a recommendation or investment advice.
| 6 | Columbia Corporate Income Fund | Annual Report 2019 |
Understanding Your Fund’s Expenses
(Unaudited)
As an investor, you incur two types of costs. There are shareholder transaction costs, which generally include sales charges on purchases and may include redemption fees. There are also ongoing fund costs, which generally include management fees, distribution and/or service fees, and other fund expenses. The following information is intended to help you understand your ongoing costs (in dollars) of investing in the Fund and to help you compare these costs with the ongoing costs of investing in other mutual funds.
Analyzing your Fund’s expenses
To illustrate these ongoing costs, we have provided examples and calculated the expenses paid by investors in each share class of the Fund during the period. The actual and hypothetical information in the table is based on an initial investment of $1,000 at the beginning of the period indicated and held for the entire period. Expense information is calculated two ways and each method provides you with different information. The amount listed in the “Actual” column is calculated using the Fund’s actual operating expenses and total return for the period. You may use the Actual information, together with the amount invested, to estimate the expenses that you paid over the period. Simply divide your account value by $1,000 (for example, an $8,600 account value divided by $1,000 = 8.6), then multiply the results by the expenses paid during the period under the “Actual” column. The amount listed in the “Hypothetical” column assumes a 5% annual rate of return before expenses (which is not the Fund’s actual return) and then applies the Fund’s actual expense ratio for the period to the hypothetical return. You should not use the hypothetical account values and expenses to estimate either your actual account balance at the end of the period or the expenses you paid during the period. See “Compare with other funds” below for details on how to use the hypothetical data.
Compare with other funds
Since all mutual funds are required to include the same hypothetical calculations about expenses in shareholder reports, you can use this information to compare the ongoing cost of investing in the Fund with other funds. To do so, compare the hypothetical example with the 5% hypothetical examples that appear in the shareholder reports of other funds. As you compare hypothetical examples of other funds, it is important to note that hypothetical examples are meant to highlight the ongoing costs of investing in a fund only and do not reflect any transaction costs, such as sales charges, or redemption or exchange fees. Therefore, the hypothetical calculations are useful in comparing ongoing costs only, and will not help you determine the relative total costs of owning different funds. If transaction costs were included in these calculations, your costs would be higher.
| November 1, 2018 — April 30, 2019 |
| | Account value at the
beginning of the
period ($) | Account value at the
end of the
period ($) | Expenses paid during
the period ($) | Fund’s annualized
expense ratio (%) |
| | Actual | Hypothetical | Actual | Hypothetical | Actual | Hypothetical | Actual |
| Class A | 1,000.00 | 1,000.00 | 1,065.30 | 1,020.23 | 4.71 | 4.61 | 0.92 |
| Advisor Class | 1,000.00 | 1,000.00 | 1,067.80 | 1,021.47 | 3.44 | 3.36 | 0.67 |
| Class C | 1,000.00 | 1,000.00 | 1,063.30 | 1,017.26 | 7.78 | 7.60 | 1.52 |
| Institutional Class | 1,000.00 | 1,000.00 | 1,066.70 | 1,021.47 | 3.43 | 3.36 | 0.67 |
| Institutional 2 Class | 1,000.00 | 1,000.00 | 1,068.30 | 1,021.92 | 2.97 | 2.91 | 0.58 |
| Institutional 3 Class | 1,000.00 | 1,000.00 | 1,068.50 | 1,022.17 | 2.72 | 2.66 | 0.53 |
Expenses paid during the period are equal to the annualized expense ratio for each class as indicated above, multiplied by the average account value over the period and then multiplied by the number of days in the Fund’s most recent fiscal half year and divided by 365.
Expenses do not include fees and expenses incurred indirectly by the Fund from its investment in underlying funds, including affiliated and non-affiliated pooled investment vehicles, such as mutual funds and exchange-traded funds.
Had Columbia Management Investment Advisers, LLC and/or certain of its affiliates not waived/reimbursed certain fees and expenses, account value at the end of the period would have been reduced.
Columbia Corporate Income Fund | Annual Report 2019
| 7 |
Portfolio of Investments
April 30, 2019
(Percentages represent value of investments compared to net assets)
Investments in securities
| Common Stocks 0.0% |
| Issuer | Shares | Value ($) |
| Financials 0.0% |
| Insurance 0.0% |
| Mr. Cooper Group, Inc.(a) | 1,782 | 15,325 |
| WMI Holdings Corp. Escrow(a),(b),(c),(d) | 1,075 | — |
| Total | | 15,325 |
| Total Financials | 15,325 |
Total Common Stocks
(Cost $1,077,470) | 15,325 |
| Corporate Bonds & Notes 89.3% |
| Issuer | Coupon
Rate | | Principal
Amount ($) | Value ($) |
| Aerospace & Defense 2.1% |
| Arconic, Inc. |
| 04/15/2021 | 5.400% | | 408,000 | 420,635 |
| Bombardier, Inc.(e) |
| 12/01/2024 | 7.500% | | 337,000 | 342,526 |
| 03/15/2025 | 7.500% | | 108,000 | 108,379 |
| Northrop Grumman Corp. |
| 01/15/2028 | 3.250% | | 20,490,000 | 20,139,908 |
| TransDigm, Inc.(e) |
| 03/15/2026 | 6.250% | | 951,000 | 990,382 |
| 03/15/2027 | 7.500% | | 319,000 | 328,927 |
| TransDigm, Inc. |
| 06/15/2026 | 6.375% | | 1,120,000 | 1,121,860 |
| Total | 23,452,617 |
| Automotive 0.5% |
| Delphi Technologies PLC(e) |
| 10/01/2025 | 5.000% | | 155,000 | 142,231 |
| Ford Motor Co. |
| 01/15/2043 | 4.750% | | 2,145,000 | 1,822,137 |
| 12/08/2046 | 5.291% | | 2,796,000 | 2,539,914 |
| IHO Verwaltungs GmbH PIK(e) |
| 09/15/2023 | 4.500% | | 204,000 | 206,123 |
| Panther BF Aggregator 2 LP/Finance Co., Inc.(e) |
| 05/15/2026 | 6.250% | | 179,000 | 187,071 |
| 05/15/2027 | 8.500% | | 173,000 | 178,738 |
| Total | 5,076,214 |
| Banking 14.3% |
| Ally Financial, Inc. |
| 11/01/2031 | 8.000% | | 138,000 | 176,997 |
| Corporate Bonds & Notes (continued) |
| Issuer | Coupon
Rate | | Principal
Amount ($) | Value ($) |
| American Express Co. |
| 08/01/2022 | 2.500% | | 9,590,000 | 9,483,954 |
| 02/27/2023 | 3.400% | | 4,365,000 | 4,439,144 |
| Bank of America Corp.(f) |
| 01/20/2028 | 3.824% | | 14,325,000 | 14,577,908 |
| 12/20/2028 | 3.419% | | 5,770,000 | 5,668,067 |
| Bank of Montreal |
| 03/26/2022 | 2.900% | | 11,500,000 | 11,525,495 |
| Capital One Financial Corp. |
| 01/31/2028 | 3.800% | | 11,255,000 | 11,127,638 |
| Capital One NA |
| 08/08/2022 | 2.650% | | 4,812,000 | 4,764,568 |
| Citigroup, Inc.(f) |
| 03/20/2030 | 3.980% | | 12,285,000 | 12,519,005 |
| Goldman Sachs Group, Inc. (The)(f) |
| 05/01/2029 | 4.223% | | 22,873,000 | 23,405,026 |
| JPMorgan Chase & Co.(f),(g) |
| 05/06/2030 | 3.702% | | 27,780,000 | 27,836,505 |
| Morgan Stanley |
| 07/27/2026 | 3.125% | | 1,855,000 | 1,810,697 |
| Morgan Stanley(f) |
| 01/23/2030 | 4.431% | | 9,004,000 | 9,530,788 |
| Washington Mutual Bank(b),(d),(h) |
| Subordinated |
| 01/15/2015 | 0.000% | | 6,350,000 | 9,525 |
| Wells Fargo & Co. |
| 10/23/2026 | 3.000% | | 21,195,000 | 20,624,007 |
| Total | 157,499,324 |
| Brokerage/Asset Managers/Exchanges 0.0% |
| NFP Corp.(e) |
| 07/15/2025 | 6.875% | | 553,000 | 545,311 |
| Building Materials 0.2% |
| American Builders & Contractors Supply Co., Inc.(e) |
| 12/15/2023 | 5.750% | | 545,000 | 565,918 |
| 05/15/2026 | 5.875% | | 499,000 | 515,917 |
| Beacon Roofing Supply, Inc.(e) |
| 11/01/2025 | 4.875% | | 494,000 | 475,225 |
| Core & Main LP(e) |
| 08/15/2025 | 6.125% | | 434,000 | 432,159 |
| James Hardie International Finance DAC(e) |
| 01/15/2028 | 5.000% | | 204,000 | 198,931 |
| Total | 2,188,150 |
The accompanying Notes to Financial Statements are an integral part of this statement.
| 8 | Columbia Corporate Income Fund | Annual Report 2019 |
Portfolio of Investments (continued)
April 30, 2019
| Corporate Bonds & Notes (continued) |
| Issuer | Coupon
Rate | | Principal
Amount ($) | Value ($) |
| Cable and Satellite 3.1% |
| CCO Holdings LLC/Capital Corp.(e) |
| 04/01/2024 | 5.875% | | 319,000 | 332,982 |
| 05/01/2025 | 5.375% | | 211,000 | 218,388 |
| 02/15/2026 | 5.750% | | 481,000 | 502,626 |
| 05/01/2027 | 5.125% | | 465,000 | 472,184 |
| Charter Communications Operating LLC/Capital |
| 05/01/2047 | 5.375% | | 5,800,000 | 5,806,090 |
| CSC Holdings LLC(e) |
| 12/15/2021 | 5.125% | | 182,000 | 182,270 |
| 07/15/2023 | 5.375% | | 576,000 | 589,761 |
| 10/15/2025 | 10.875% | | 260,000 | 298,933 |
| 05/15/2026 | 5.500% | | 710,000 | 730,014 |
| 04/15/2027 | 5.500% | | 229,000 | 236,051 |
| 02/01/2028 | 5.375% | | 231,000 | 235,580 |
| 04/01/2028 | 7.500% | | 536,000 | 584,271 |
| 02/01/2029 | 6.500% | | 37,000 | 39,729 |
| DISH DBS Corp. |
| 11/15/2024 | 5.875% | | 531,000 | 458,160 |
| 07/01/2026 | 7.750% | | 659,000 | 589,864 |
| Intelsat Jackson Holdings SA(e) |
| 10/15/2024 | 8.500% | | 337,000 | 333,632 |
| Radiate HoldCo LLC/Finance, Inc.(e) |
| 02/15/2025 | 6.625% | | 445,000 | 437,416 |
| Sirius XM Radio, Inc.(e) |
| 07/15/2026 | 5.375% | | 562,000 | 578,192 |
| Sky PLC(e) |
| 11/26/2022 | 3.125% | | 3,710,000 | 3,744,258 |
| 09/16/2024 | 3.750% | | 11,122,000 | 11,503,329 |
| Time Warner Cable LLC |
| 09/15/2042 | 4.500% | | 2,940,000 | 2,613,363 |
| Unitymedia GmbH(e) |
| 01/15/2025 | 6.125% | | 260,000 | 269,674 |
| Unitymedia Hessen GmbH & Co. KG NRW(e) |
| 01/15/2025 | 5.000% | | 794,000 | 812,972 |
| Viasat, Inc.(e) |
| 04/15/2027 | 5.625% | | 103,000 | 105,615 |
| Virgin Media Finance PLC(e) |
| 01/15/2025 | 5.750% | | 590,000 | 603,113 |
| Virgin Media Secured Finance PLC(e) |
| 01/15/2026 | 5.250% | | 530,000 | 538,732 |
| Ziggo Bond Finance BV(e) |
| 01/15/2027 | 6.000% | | 610,000 | 599,472 |
| Ziggo BV(e) |
| 01/15/2027 | 5.500% | | 376,000 | 375,930 |
| Total | 33,792,601 |
| Corporate Bonds & Notes (continued) |
| Issuer | Coupon
Rate | | Principal
Amount ($) | Value ($) |
| Chemicals 0.8% |
| Alpha 2 BV(e) |
| 06/01/2023 | 8.750% | | 222,000 | 220,565 |
| Angus Chemical Co.(e) |
| 02/15/2023 | 8.750% | | 437,000 | 439,721 |
| Atotech U.S.A., Inc.(e) |
| 02/01/2025 | 6.250% | | 397,000 | 402,956 |
| Axalta Coating Systems LLC(e) |
| 08/15/2024 | 4.875% | | 203,000 | 204,229 |
| Chemours Co. (The) |
| 05/15/2023 | 6.625% | | 295,000 | 305,440 |
| DowDuPont, Inc. |
| 11/15/2048 | 5.419% | | 2,755,000 | 3,179,171 |
| INEOS Group Holdings SA(e) |
| 08/01/2024 | 5.625% | | 349,000 | 352,616 |
| LYB International Finance BV |
| 03/15/2044 | 4.875% | | 955,000 | 952,608 |
| Platform Specialty Products Corp.(e) |
| 12/01/2025 | 5.875% | | 774,000 | 793,578 |
| PQ Corp.(e) |
| 11/15/2022 | 6.750% | | 1,045,000 | 1,084,065 |
| 12/15/2025 | 5.750% | | 359,000 | 358,274 |
| SPCM SA(e) |
| 09/15/2025 | 4.875% | | 169,000 | 164,863 |
| Starfruit Finco BV/US Holdco LLC(e) |
| 10/01/2026 | 8.000% | | 614,000 | 630,289 |
| Total | 9,088,375 |
| Construction Machinery 0.1% |
| H&E Equipment Services, Inc. |
| 09/01/2025 | 5.625% | | 336,000 | 342,630 |
| Ritchie Bros. Auctioneers, Inc.(e) |
| 01/15/2025 | 5.375% | | 326,000 | 334,541 |
| United Rentals North America, Inc. |
| 09/15/2026 | 5.875% | | 454,000 | 474,415 |
| 12/15/2026 | 6.500% | | 170,000 | 181,960 |
| 05/15/2027 | 5.500% | | 345,000 | 355,339 |
| United Rentals North America, Inc.(g) |
| 01/15/2030 | 5.250% | | 6,000 | 6,030 |
| Total | 1,694,915 |
| Consumer Cyclical Services 0.1% |
| APX Group, Inc. |
| 12/01/2020 | 8.750% | | 231,000 | 227,698 |
| 12/01/2022 | 7.875% | | 410,000 | 410,767 |
| 09/01/2023 | 7.625% | | 167,000 | 147,102 |
The accompanying Notes to Financial Statements are an integral part of this statement.
Columbia Corporate Income Fund | Annual Report 2019
| 9 |
Portfolio of Investments (continued)
April 30, 2019
| Corporate Bonds & Notes (continued) |
| Issuer | Coupon
Rate | | Principal
Amount ($) | Value ($) |
| APX Group, Inc.(e),(g) |
| 11/01/2024 | 8.500% | | 196,000 | 194,595 |
| frontdoor, Inc.(e) |
| 08/15/2026 | 6.750% | | 144,000 | 151,201 |
| Total | 1,131,363 |
| Consumer Products 0.2% |
| Energizer Holdings, Inc.(e) |
| 07/15/2026 | 6.375% | | 140,000 | 144,598 |
| 01/15/2027 | 7.750% | | 159,000 | 172,054 |
| Mattel, Inc.(e) |
| 12/31/2025 | 6.750% | | 223,000 | 223,336 |
| Prestige Brands, Inc.(e) |
| 03/01/2024 | 6.375% | | 428,000 | 441,630 |
| Resideo Funding, Inc.(e) |
| 11/01/2026 | 6.125% | | 165,000 | 171,272 |
| Scotts Miracle-Gro Co. (The) |
| 10/15/2023 | 6.000% | | 266,000 | 276,819 |
| Spectrum Brands, Inc. |
| 11/15/2022 | 6.625% | | 193,000 | 197,622 |
| 07/15/2025 | 5.750% | | 581,000 | 595,556 |
| Valvoline, Inc. |
| 07/15/2024 | 5.500% | | 166,000 | 170,961 |
| Total | 2,393,848 |
| Diversified Manufacturing 1.6% |
| CFX Escrow Corp.(e) |
| 02/15/2024 | 6.000% | | 76,000 | 78,967 |
| 02/15/2026 | 6.375% | | 91,000 | 96,461 |
| Gates Global LLC/Co.(e) |
| 07/15/2022 | 6.000% | | 268,000 | 268,750 |
| Stevens Holding Co., Inc.(e) |
| 10/01/2026 | 6.125% | | 86,000 | 90,530 |
| United Technologies Corp. |
| 11/01/2026 | 2.650% | | 4,040,000 | 3,870,793 |
| 11/16/2028 | 4.125% | | 11,635,000 | 12,133,467 |
| Welbilt, Inc. |
| 02/15/2024 | 9.500% | | 68,000 | 73,539 |
| WESCO Distribution, Inc. |
| 12/15/2021 | 5.375% | | 775,000 | 783,944 |
| Zekelman Industries, Inc.(e) |
| 06/15/2023 | 9.875% | | 394,000 | 415,800 |
| Total | 17,812,251 |
| Electric 19.6% |
| AES Corp. (The) |
| 03/15/2023 | 4.500% | | 320,000 | 324,703 |
| 05/15/2026 | 6.000% | | 216,000 | 229,065 |
| Corporate Bonds & Notes (continued) |
| Issuer | Coupon
Rate | | Principal
Amount ($) | Value ($) |
| Calpine Corp. |
| 01/15/2025 | 5.750% | | 230,000 | 227,669 |
| Calpine Corp.(e) |
| 06/01/2026 | 5.250% | | 309,000 | 309,764 |
| Clearway Energy Operating LLC |
| 08/15/2024 | 5.375% | | 655,000 | 665,513 |
| 09/15/2026 | 5.000% | | 121,000 | 118,440 |
| CMS Energy Corp. |
| 03/01/2024 | 3.875% | | 8,145,000 | 8,350,783 |
| 11/15/2025 | 3.600% | | 10,564,000 | 10,664,474 |
| 02/15/2027 | 2.950% | | 12,221,000 | 11,693,615 |
| Consolidated Edison Co. of New York, Inc. |
| 06/15/2046 | 3.850% | | 900,000 | 874,639 |
| DTE Energy Co. |
| 06/01/2024 | 3.500% | | 5,917,000 | 5,998,347 |
| 10/01/2026 | 2.850% | | 25,086,000 | 23,991,799 |
| Duke Energy Corp. |
| 10/15/2023 | 3.950% | | 6,183,000 | 6,423,982 |
| 09/01/2026 | 2.650% | | 3,820,000 | 3,652,955 |
| 08/15/2027 | 3.150% | | 9,660,000 | 9,518,442 |
| Edison International |
| 09/15/2022 | 2.400% | | 5,838,000 | 5,557,286 |
| Emera U.S. Finance LP |
| 06/15/2026 | 3.550% | | 13,000,000 | 12,847,718 |
| 06/15/2046 | 4.750% | | 7,383,000 | 7,549,649 |
| Eversource Energy |
| 01/15/2025 | 3.150% | | 2,695,000 | 2,694,412 |
| Indiana Michigan Power Co. |
| 07/01/2047 | 3.750% | | 5,595,000 | 5,284,215 |
| Mississippi Power Co. |
| 03/30/2028 | 3.950% | | 14,219,000 | 14,447,457 |
| NextEra Energy Operating Partners LP(e) |
| 09/15/2027 | 4.500% | | 425,000 | 418,843 |
| NRG Energy, Inc. |
| 01/15/2027 | 6.625% | | 569,000 | 607,611 |
| Pattern Energy Group, Inc.(e) |
| 02/01/2024 | 5.875% | | 282,000 | 290,374 |
| Progress Energy, Inc. |
| 04/01/2022 | 3.150% | | 20,570,000 | 20,664,437 |
| Sierra Pacific Power Co. |
| 05/01/2026 | 2.600% | | 4,900,000 | 4,695,611 |
| Southern California Edison Co. |
| 10/01/2043 | 4.650% | | 295,000 | 297,877 |
| Southern Co. (The) |
| 07/01/2026 | 3.250% | | 6,718,000 | 6,625,043 |
| 07/01/2046 | 4.400% | | 2,460,000 | 2,474,081 |
| TerraForm Power Operating LLC(e) |
| 01/31/2028 | 5.000% | | 466,000 | 459,989 |
The accompanying Notes to Financial Statements are an integral part of this statement.
| 10 | Columbia Corporate Income Fund | Annual Report 2019 |
Portfolio of Investments (continued)
April 30, 2019
| Corporate Bonds & Notes (continued) |
| Issuer | Coupon
Rate | | Principal
Amount ($) | Value ($) |
| Vistra Energy Corp. |
| 11/01/2024 | 7.625% | | 244,000 | 257,420 |
| Vistra Operations Co. LLC(e) |
| 09/01/2026 | 5.500% | | 159,000 | 163,790 |
| 02/15/2027 | 5.625% | | 408,000 | 419,309 |
| WEC Energy Group, Inc. |
| 06/15/2025 | 3.550% | | 14,637,000 | 14,955,721 |
| Xcel Energy, Inc. |
| 06/01/2025 | 3.300% | | 4,430,000 | 4,460,851 |
| 12/01/2026 | 3.350% | | 28,015,000 | 28,055,678 |
| Total | 216,271,562 |
| Environmental 0.0% |
| GFL Environmental, Inc.(e) |
| 03/01/2023 | 5.375% | | 80,000 | 77,790 |
| 05/01/2027 | 8.500% | | 177,000 | 184,275 |
| Hulk Finance Corp.(e) |
| 06/01/2026 | 7.000% | | 57,000 | 55,330 |
| Total | 317,395 |
| Finance Companies 2.7% |
| Avolon Holdings Funding Ltd.(e) |
| 01/15/2023 | 5.500% | | 437,000 | 457,533 |
| 10/01/2023 | 5.125% | | 322,000 | 334,016 |
| 05/15/2024 | 5.250% | | 100,000 | 104,503 |
| GE Capital International Funding Co. Unlimited Co. |
| 11/15/2020 | 2.342% | | 12,001,000 | 11,872,733 |
| 11/15/2035 | 4.418% | | 14,920,000 | 13,917,779 |
| iStar, Inc. |
| 04/01/2022 | 6.000% | | 422,000 | 431,887 |
| Navient Corp. |
| 07/26/2021 | 6.625% | | 258,000 | 271,161 |
| 06/15/2022 | 6.500% | | 162,000 | 170,613 |
| 01/25/2023 | 5.500% | | 481,000 | 490,165 |
| 10/25/2024 | 5.875% | | 111,000 | 111,591 |
| Provident Funding Associates LP/Finance Corp.(e) |
| 06/15/2025 | 6.375% | | 576,000 | 534,097 |
| Quicken Loans, Inc.(e) |
| 05/01/2025 | 5.750% | | 526,000 | 533,806 |
| 01/15/2028 | 5.250% | | 150,000 | 145,510 |
| Springleaf Finance Corp. |
| 03/15/2023 | 5.625% | | 339,000 | 352,760 |
| 03/15/2024 | 6.125% | | 415,000 | 438,239 |
| 03/15/2025 | 6.875% | | 173,000 | 185,514 |
| Total | 30,351,907 |
| Food and Beverage 5.4% |
| Anheuser-Busch InBev Worldwide, Inc.(e) |
| 02/01/2046 | 4.900% | | 18,026,000 | 18,256,499 |
| Corporate Bonds & Notes (continued) |
| Issuer | Coupon
Rate | | Principal
Amount ($) | Value ($) |
| Anheuser-Busch InBev Worldwide, Inc. |
| 01/23/2059 | 5.800% | | 1,355,000 | 1,542,075 |
| B&G Foods, Inc. |
| 04/01/2025 | 5.250% | | 298,000 | 293,633 |
| Bacardi Ltd.(e) |
| 05/15/2048 | 5.300% | | 14,015,000 | 13,553,150 |
| Conagra Brands, Inc. |
| 11/01/2048 | 5.400% | | 2,790,000 | 2,904,490 |
| Darling Ingredients, Inc.(e) |
| 04/15/2027 | 5.250% | | 43,000 | 43,819 |
| FAGE International SA/U.S.A. Dairy Industry, Inc.(e) |
| 08/15/2026 | 5.625% | | 319,000 | 268,645 |
| JM Smucker Co. (The) |
| 12/06/2019 | 2.200% | | 4,135,000 | 4,118,692 |
| Kraft Heinz Foods Co. (The) |
| 06/01/2046 | 4.375% | | 12,498,000 | 11,083,689 |
| Mars, Inc.(e) |
| 04/01/2059 | 4.200% | | 3,615,000 | 3,632,677 |
| Post Holdings, Inc.(e) |
| 03/01/2025 | 5.500% | | 101,000 | 103,335 |
| 08/15/2026 | 5.000% | | 488,000 | 485,889 |
| 03/01/2027 | 5.750% | | 587,000 | 601,957 |
| 01/15/2028 | 5.625% | | 209,000 | 211,194 |
| Sysco Corp. |
| 07/15/2021 | 2.500% | | 2,055,000 | 2,043,757 |
| Total | 59,143,501 |
| Gaming 0.5% |
| Boyd Gaming Corp. |
| 05/15/2023 | 6.875% | | 297,000 | 307,802 |
| 04/01/2026 | 6.375% | | 127,000 | 133,632 |
| 08/15/2026 | 6.000% | | 210,000 | 218,165 |
| Caesars Resort Collection LLC/CRC Finco, Inc.(e) |
| 10/15/2025 | 5.250% | | 165,000 | 161,262 |
| Eldorado Resorts, Inc. |
| 04/01/2025 | 6.000% | | 498,000 | 514,955 |
| 09/15/2026 | 6.000% | | 210,000 | 218,467 |
| International Game Technology PLC(e) |
| 02/15/2022 | 6.250% | | 542,000 | 567,834 |
| 02/15/2025 | 6.500% | | 357,000 | 380,172 |
| MGM Growth Properties Operating Partnership LP/Finance Co-Issuer, Inc. |
| 05/01/2024 | 5.625% | | 104,000 | 109,365 |
| 09/01/2026 | 4.500% | | 122,000 | 120,764 |
| MGM Growth Properties Operating Partnership LP/Finance Co-Issuer, Inc.(e) |
| 02/01/2027 | 5.750% | | 207,000 | 217,634 |
| MGM Resorts International |
| 03/15/2023 | 6.000% | | 281,000 | 299,928 |
The accompanying Notes to Financial Statements are an integral part of this statement.
Columbia Corporate Income Fund | Annual Report 2019
| 11 |
Portfolio of Investments (continued)
April 30, 2019
| Corporate Bonds & Notes (continued) |
| Issuer | Coupon
Rate | | Principal
Amount ($) | Value ($) |
| Penn National Gaming, Inc.(e) |
| 01/15/2027 | 5.625% | | 221,000 | 218,268 |
| Rivers Pittsburgh Borrower LP/Finance Corp.(e) |
| 08/15/2021 | 6.125% | | 117,000 | 118,637 |
| Scientific Games International, Inc. |
| 12/01/2022 | 10.000% | | 285,000 | 300,632 |
| Scientific Games International, Inc.(e) |
| 10/15/2025 | 5.000% | | 597,000 | 594,479 |
| 03/15/2026 | 8.250% | | 453,000 | 468,521 |
| Stars Group Holdings BV/Co-Borrower LLC(e) |
| 07/15/2026 | 7.000% | | 156,000 | 163,529 |
| Wynn Las Vegas LLC/Capital Corp.(e) |
| 03/01/2025 | 5.500% | | 173,000 | 174,879 |
| Total | 5,288,925 |
| Health Care 4.6% |
| Acadia Healthcare Co., Inc. |
| 02/15/2023 | 5.625% | | 26,000 | 26,261 |
| 03/01/2024 | 6.500% | | 360,000 | 371,721 |
| Avantor, Inc.(e) |
| 10/01/2025 | 9.000% | | 306,000 | 332,793 |
| Becton Dickinson and Co. |
| 06/06/2024 | 3.363% | | 8,225,000 | 8,244,806 |
| 06/06/2027 | 3.700% | | 5,020,000 | 4,998,319 |
| Cardinal Health, Inc. |
| 06/15/2047 | 4.368% | | 6,690,000 | 5,862,360 |
| Change Healthcare Holdings LLC/Finance, Inc.(e) |
| 03/01/2025 | 5.750% | | 381,000 | 377,853 |
| CHS/Community Health Systems, Inc. |
| 03/31/2023 | 6.250% | | 235,000 | 228,797 |
| CVS Health Corp. |
| 03/25/2025 | 4.100% | | 2,315,000 | 2,357,830 |
| 03/25/2048 | 5.050% | | 12,720,000 | 12,567,131 |
| DaVita, Inc. |
| 07/15/2024 | 5.125% | | 382,000 | 382,117 |
| Express Scripts Holding Co. |
| 11/30/2020 | 2.600% | | 4,425,000 | 4,402,592 |
| Halfmoon Parent, Inc.(e) |
| 12/15/2048 | 4.900% | | 5,525,000 | 5,576,371 |
| HCA, Inc. |
| 02/01/2025 | 5.375% | | 429,000 | 451,414 |
| 02/15/2026 | 5.875% | | 335,000 | 360,894 |
| 09/01/2028 | 5.625% | | 428,000 | 455,769 |
| 02/01/2029 | 5.875% | | 184,000 | 197,791 |
| McKesson Corp. |
| 05/30/2029 | 4.750% | | 670,000 | 701,359 |
| MPH Acquisition Holdings LLC(e) |
| 06/01/2024 | 7.125% | | 465,000 | 467,022 |
| Corporate Bonds & Notes (continued) |
| Issuer | Coupon
Rate | | Principal
Amount ($) | Value ($) |
| Polaris Intermediate Corp. PIK(e) |
| 12/01/2022 | 8.500% | | 52,000 | 51,931 |
| Sotera Health Holdings LLC(e) |
| 05/15/2023 | 6.500% | | 474,000 | 478,965 |
| Tenet Healthcare Corp. |
| 06/01/2020 | 4.750% | | 638,000 | 645,975 |
| 04/01/2022 | 8.125% | | 129,000 | 137,755 |
| 06/15/2023 | 6.750% | | 109,000 | 111,180 |
| 07/15/2024 | 4.625% | | 362,000 | 362,939 |
| 08/01/2025 | 7.000% | | 189,000 | 191,336 |
| Tenet Healthcare Corp.(e) |
| 02/01/2027 | 6.250% | | 345,000 | 359,609 |
| Total | 50,702,890 |
| Healthcare Insurance 0.2% |
| Aetna, Inc. |
| 08/15/2047 | 3.875% | | 862,000 | 731,749 |
| Centene Corp. |
| 02/15/2024 | 6.125% | | 278,000 | 291,170 |
| Centene Corp.(e) |
| 06/01/2026 | 5.375% | | 618,000 | 643,797 |
| WellCare Health Plans, Inc. |
| 04/01/2025 | 5.250% | | 286,000 | 295,353 |
| WellCare Health Plans, Inc.(e) |
| 08/15/2026 | 5.375% | | 281,000 | 293,892 |
| Total | 2,255,961 |
| Home Construction 0.2% |
| Lennar Corp. |
| 12/15/2021 | 6.250% | | 271,000 | 285,991 |
| 04/30/2024 | 4.500% | | 562,000 | 572,673 |
| 11/15/2024 | 5.875% | | 195,000 | 210,117 |
| Meritage Homes Corp. |
| 06/01/2025 | 6.000% | | 509,000 | 540,939 |
| Shea Homes LP/Funding Corp.(e) |
| 04/01/2023 | 5.875% | | 41,000 | 40,993 |
| Taylor Morrison Communities, Inc./Holdings II(e) |
| 04/15/2021 | 5.250% | | 355,000 | 355,887 |
| Total | 2,006,600 |
| Independent Energy 1.5% |
| California Resources Corp.(e) |
| 12/15/2022 | 8.000% | | 129,000 | 98,231 |
| Callon Petroleum Co. |
| 07/01/2026 | 6.375% | | 645,000 | 660,642 |
| Canadian Natural Resources Ltd. |
| 06/01/2027 | 3.850% | | 1,705,000 | 1,723,061 |
The accompanying Notes to Financial Statements are an integral part of this statement.
| 12 | Columbia Corporate Income Fund | Annual Report 2019 |
Portfolio of Investments (continued)
April 30, 2019
| Corporate Bonds & Notes (continued) |
| Issuer | Coupon
Rate | | Principal
Amount ($) | Value ($) |
| Carrizo Oil & Gas, Inc. |
| 04/15/2023 | 6.250% | | 574,000 | 558,514 |
| Centennial Resource Production LLC(e) |
| 01/15/2026 | 5.375% | | 454,000 | 446,432 |
| 04/01/2027 | 6.875% | | 140,000 | 145,313 |
| Chesapeake Energy Corp. |
| 10/01/2026 | 7.500% | | 233,000 | 228,615 |
| CrownRock LP/Finance, Inc.(e) |
| 10/15/2025 | 5.625% | | 680,000 | 673,305 |
| Endeavor Energy Resources LP/Finance, Inc.(e) |
| 01/30/2028 | 5.750% | | 140,000 | 149,967 |
| Extraction Oil & Gas, Inc.(e) |
| 05/15/2024 | 7.375% | | 178,000 | 164,221 |
| 02/01/2026 | 5.625% | | 90,000 | 73,957 |
| Halcon Resources Corp. |
| 02/15/2025 | 6.750% | | 344,000 | 220,838 |
| Hess Corp. |
| 04/01/2047 | 5.800% | | 1,870,000 | 2,024,591 |
| Indigo Natural Resources LLC(e) |
| 02/15/2026 | 6.875% | | 190,000 | 176,424 |
| Jagged Peak Energy LLC |
| 05/01/2026 | 5.875% | | 411,000 | 414,418 |
| Matador Resources Co. |
| 09/15/2026 | 5.875% | | 406,000 | 409,897 |
| MEG Energy Corp.(e) |
| 01/15/2025 | 6.500% | | 100,000 | 100,929 |
| Noble Energy, Inc. |
| 11/15/2043 | 5.250% | | 2,148,000 | 2,254,650 |
| Parsley Energy LLC/Finance Corp.(e) |
| 06/01/2024 | 6.250% | | 163,000 | 169,530 |
| 01/15/2025 | 5.375% | | 195,000 | 198,346 |
| 08/15/2025 | 5.250% | | 352,000 | 356,806 |
| 10/15/2027 | 5.625% | | 369,000 | 380,259 |
| PDC Energy, Inc. |
| 09/15/2024 | 6.125% | | 302,000 | 306,559 |
| QEP Resources, Inc. |
| 03/01/2026 | 5.625% | | 208,000 | 195,015 |
| SM Energy Co. |
| 06/01/2025 | 5.625% | | 85,000 | 80,102 |
| 09/15/2026 | 6.750% | | 450,000 | 432,117 |
| Woodside Finance Ltd.(e) |
| 03/04/2029 | 4.500% | | 3,075,000 | 3,147,484 |
| WPX Energy, Inc. |
| 01/15/2022 | 6.000% | | 140,000 | 146,233 |
| 09/15/2024 | 5.250% | | 737,000 | 760,944 |
| 06/01/2026 | 5.750% | | 241,000 | 249,690 |
| Total | 16,947,090 |
| Corporate Bonds & Notes (continued) |
| Issuer | Coupon
Rate | | Principal
Amount ($) | Value ($) |
| Leisure 0.0% |
| Live Nation Entertainment, Inc.(e) |
| 11/01/2024 | 4.875% | | 171,000 | 174,573 |
| Viking Cruises Ltd.(e) |
| 09/15/2027 | 5.875% | | 311,000 | 310,533 |
| Total | 485,106 |
| Life Insurance 5.8% |
| American International Group, Inc. |
| 07/10/2025 | 3.750% | | 3,970,000 | 4,012,860 |
| Brighthouse Financial, Inc. |
| 06/22/2047 | 4.700% | | 325,000 | 266,182 |
| Five Corners Funding Trust(e) |
| 11/15/2023 | 4.419% | | 23,065,000 | 24,335,235 |
| Guardian Life Insurance Co. of America (The)(e) |
| Subordinated |
| 06/19/2064 | 4.875% | | 5,735,000 | 6,108,538 |
| Massachusetts Mutual Life Insurance Co.(e) |
| Subordinated |
| 04/01/2077 | 4.900% | | 4,607,000 | 4,910,878 |
| New York Life Insurance Co.(e) |
| Subordinated |
| 05/15/2069 | 4.450% | | 2,145,000 | 2,189,940 |
| Peachtree Corners Funding Trust(e) |
| 02/15/2025 | 3.976% | | 16,462,000 | 16,753,558 |
| Teachers Insurance & Annuity Association of America(e) |
| Subordinated |
| 09/15/2044 | 4.900% | | 2,270,000 | 2,546,409 |
| Voya Financial, Inc. |
| 06/15/2046 | 4.800% | | 2,365,000 | 2,458,531 |
| Total | 63,582,131 |
| Media and Entertainment 1.5% |
| Clear Channel Worldwide Holdings, Inc.(e) |
| 02/15/2024 | 9.250% | | 628,000 | 675,867 |
| Discovery Communications LLC |
| 09/20/2047 | 5.200% | | 2,530,000 | 2,513,396 |
| Fox Corp.(e) |
| 01/25/2039 | 5.476% | | 3,264,000 | 3,636,374 |
| Match Group, Inc. |
| 06/01/2024 | 6.375% | | 280,000 | 294,097 |
| Netflix, Inc. |
| 11/15/2028 | 5.875% | | 726,000 | 765,797 |
| Netflix, Inc.(e) |
| 05/15/2029 | 6.375% | | 556,000 | 607,406 |
| 11/15/2029 | 5.375% | | 346,000 | 350,759 |
The accompanying Notes to Financial Statements are an integral part of this statement.
Columbia Corporate Income Fund | Annual Report 2019
| 13 |
Portfolio of Investments (continued)
April 30, 2019
| Corporate Bonds & Notes (continued) |
| Issuer | Coupon
Rate | | Principal
Amount ($) | Value ($) |
| Outfront Media Capital LLC/Corp. |
| 03/15/2025 | 5.875% | | 343,000 | 356,042 |
| Walt Disney Co. (The)(e) |
| 09/15/2044 | 4.750% | | 4,328,000 | 4,962,965 |
| Warner Media LLC |
| 12/15/2043 | 5.350% | | 2,270,000 | 2,445,262 |
| Total | 16,607,965 |
| Metals and Mining 0.4% |
| Big River Steel LLC/Finance Corp.(e) |
| 09/01/2025 | 7.250% | | 558,000 | 592,305 |
| Constellium NV(e) |
| 03/01/2025 | 6.625% | | 491,000 | 510,799 |
| 02/15/2026 | 5.875% | | 531,000 | 540,292 |
| Freeport-McMoRan, Inc. |
| 11/14/2024 | 4.550% | | 426,000 | 423,021 |
| 03/15/2043 | 5.450% | | 608,000 | 548,683 |
| HudBay Minerals, Inc.(e) |
| 01/15/2023 | 7.250% | | 162,000 | 168,480 |
| 01/15/2025 | 7.625% | | 530,000 | 552,959 |
| Novelis Corp.(e) |
| 08/15/2024 | 6.250% | | 128,000 | 133,476 |
| 09/30/2026 | 5.875% | | 656,000 | 666,867 |
| Teck Resources Ltd.(e) |
| 06/01/2024 | 8.500% | | 214,000 | 229,025 |
| Total | 4,365,907 |
| Midstream 5.5% |
| Antero Midstream Partners LP/Finance Corp.(e) |
| 03/01/2027 | 5.750% | | 262,000 | 267,357 |
| Cheniere Corpus Christi Holdings LLC |
| 06/30/2027 | 5.125% | | 266,000 | 277,253 |
| Cheniere Energy Partners LP(e) |
| 10/01/2026 | 5.625% | | 419,000 | 432,899 |
| DCP Midstream Operating LP |
| 07/15/2025 | 5.375% | | 211,000 | 221,671 |
| 04/01/2044 | 5.600% | | 230,000 | 218,656 |
| Delek Logistics Partners LP/Finance Corp. |
| 05/15/2025 | 6.750% | | 226,000 | 226,957 |
| Energy Transfer Operating LP |
| 03/15/2023 | 4.250% | | 260,000 | 266,738 |
| Enterprise Products Operating LLC |
| 02/15/2045 | 5.100% | | 3,249,000 | 3,549,779 |
| 02/15/2048 | 4.250% | | 1,979,000 | 1,939,006 |
| Holly Energy Partners LP/Finance Corp.(e) |
| 08/01/2024 | 6.000% | | 708,000 | 739,042 |
| Kinder Morgan Energy Partners LP |
| 03/01/2043 | 5.000% | | 9,076,000 | 9,104,426 |
| Corporate Bonds & Notes (continued) |
| Issuer | Coupon
Rate | | Principal
Amount ($) | Value ($) |
| Kinder Morgan, Inc. |
| 02/15/2046 | 5.050% | | 5,159,000 | 5,292,783 |
| MPLX LP |
| 04/15/2048 | 4.700% | | 4,750,000 | 4,583,460 |
| NGPL PipeCo LLC(e) |
| 08/15/2027 | 4.875% | | 127,000 | 131,075 |
| 12/15/2037 | 7.768% | | 109,000 | 133,818 |
| NuStar Logistics LP |
| 04/28/2027 | 5.625% | | 247,000 | 247,349 |
| Plains All American Pipeline LP/Finance Corp. |
| 06/15/2044 | 4.700% | | 12,630,000 | 11,894,214 |
| Rockpoint Gas Storage Canada Ltd.(e) |
| 03/31/2023 | 7.000% | | 432,000 | 431,318 |
| Sunoco Logistics Partners Operations LP |
| 10/01/2047 | 5.400% | | 2,260,000 | 2,277,913 |
| Sunoco LP/Finance Corp. |
| 01/15/2023 | 4.875% | | 116,000 | 117,879 |
| Tallgrass Energy Partners LP/Finance Corp.(e) |
| 09/15/2024 | 5.500% | | 62,000 | 64,119 |
| 01/15/2028 | 5.500% | | 291,000 | 296,411 |
| Targa Resources Partners LP/Finance Corp. |
| 11/15/2023 | 4.250% | | 262,000 | 262,039 |
| 02/01/2027 | 5.375% | | 601,000 | 613,020 |
| 01/15/2028 | 5.000% | | 912,000 | 895,438 |
| Targa Resources Partners LP/Finance Corp.(e) |
| 01/15/2029 | 6.875% | | 173,000 | 187,294 |
| TransMontaigne Partners LP/TLP Finance Corp. |
| 02/15/2026 | 6.125% | | 606,000 | 584,837 |
| Western Gas Partners LP |
| 08/15/2048 | 5.500% | | 2,529,000 | 2,646,379 |
| Williams Companies, Inc. (The) |
| 09/15/2045 | 5.100% | | 12,559,000 | 12,872,749 |
| Total | 60,775,879 |
| Natural Gas 2.1% |
| NiSource, Inc. |
| 02/15/2043 | 5.250% | | 1,270,000 | 1,412,902 |
| 05/15/2047 | 4.375% | | 9,120,000 | 9,318,834 |
| Sempra Energy |
| 06/15/2024 | 3.550% | | 4,015,000 | 4,065,866 |
| 06/15/2027 | 3.250% | | 7,000,000 | 6,756,330 |
| 02/01/2028 | 3.400% | | 1,795,000 | 1,741,687 |
| Total | 23,295,619 |
| Oil Field Services 0.2% |
| Apergy Corp. |
| 05/01/2026 | 6.375% | | 479,000 | 494,897 |
The accompanying Notes to Financial Statements are an integral part of this statement.
| 14 | Columbia Corporate Income Fund | Annual Report 2019 |
Portfolio of Investments (continued)
April 30, 2019
| Corporate Bonds & Notes (continued) |
| Issuer | Coupon
Rate | | Principal
Amount ($) | Value ($) |
| Calfrac Holdings LP(e) |
| 06/15/2026 | 8.500% | | 212,000 | 178,080 |
| Diamond Offshore Drilling, Inc. |
| 08/15/2025 | 7.875% | | 124,000 | 121,278 |
| Nabors Industries, Inc. |
| 02/01/2025 | 5.750% | | 626,000 | 569,687 |
| SESI LLC |
| 09/15/2024 | 7.750% | | 277,000 | 204,193 |
| Transocean Guardian Ltd.(e) |
| 01/15/2024 | 5.875% | | 119,070 | 122,047 |
| Transocean Pontus Ltd.(e) |
| 08/01/2025 | 6.125% | | 96,390 | 99,046 |
| Transocean Poseidon Ltd.(e) |
| 02/01/2027 | 6.875% | | 104,000 | 110,745 |
| Weatherford International Ltd. |
| 06/15/2023 | 8.250% | | 243,000 | 171,205 |
| Total | 2,071,178 |
| Other Financial Institutions 0.0% |
| Icahn Enterprises LP/Finance Corp. |
| 02/01/2022 | 6.250% | | 142,000 | 146,066 |
| Other Industry 0.1% |
| KAR Auction Services, Inc.(e) |
| 06/01/2025 | 5.125% | | 399,000 | 400,559 |
| WeWork Companies, Inc.(e) |
| 05/01/2025 | 7.875% | | 195,000 | 192,713 |
| Total | 593,272 |
| Other REIT 0.1% |
| CyrusOne LP/Finance Corp. |
| 03/15/2027 | 5.375% | | 571,000 | 592,413 |
| Packaging 0.3% |
| ARD Finance SA PIK |
| 09/15/2023 | 7.125% | | 200,000 | 200,273 |
| Ardagh Packaging Finance PLC/Holdings U.S.A., Inc.(e) |
| 05/15/2023 | 4.625% | | 213,000 | 215,432 |
| 02/15/2025 | 6.000% | | 718,000 | 724,696 |
| Berry Global, Inc. |
| 07/15/2023 | 5.125% | | 480,000 | 488,462 |
| BWAY Holding Co.(e) |
| 04/15/2024 | 5.500% | | 337,000 | 334,451 |
| Flex Acquisition Co., Inc.(e) |
| 07/15/2026 | 7.875% | | 275,000 | 258,101 |
| Novolex(e) |
| 01/15/2025 | 6.875% | | 97,000 | 90,958 |
| Corporate Bonds & Notes (continued) |
| Issuer | Coupon
Rate | | Principal
Amount ($) | Value ($) |
| Reynolds Group Issuer, Inc./LLC |
| 10/15/2020 | 5.750% | | 719,078 | 721,013 |
| Reynolds Group Issuer, Inc./LLC(e) |
| 07/15/2024 | 7.000% | | 374,000 | 386,520 |
| Total | 3,419,906 |
| Pharmaceuticals 3.1% |
| AbbVie, Inc. |
| 05/14/2025 | 3.600% | | 985,000 | 989,570 |
| 11/14/2048 | 4.875% | | 8,550,000 | 8,447,400 |
| Amgen, Inc. |
| 06/15/2051 | 4.663% | | 7,980,000 | 8,060,391 |
| Bausch Health Companies, Inc.(e) |
| 05/15/2023 | 5.875% | | 633,000 | 637,783 |
| 03/15/2024 | 7.000% | | 66,000 | 69,578 |
| 04/15/2025 | 6.125% | | 438,000 | 443,030 |
| 11/01/2025 | 5.500% | | 207,000 | 212,430 |
| 04/01/2026 | 9.250% | | 405,000 | 450,673 |
| 01/31/2027 | 8.500% | | 144,000 | 157,096 |
| Celgene Corp. |
| 02/20/2048 | 4.550% | | 1,965,000 | 2,001,704 |
| Gilead Sciences, Inc. |
| 03/01/2047 | 4.150% | | 3,230,000 | 3,099,437 |
| Jaguar Holding Co. II/Pharmaceutical Product Development LLC(e) |
| 08/01/2023 | 6.375% | | 550,000 | 560,968 |
| Mylan NV |
| 06/15/2046 | 5.250% | | 585,000 | 534,385 |
| Par Pharmaceutical, Inc.(e) |
| 04/01/2027 | 7.500% | | 219,000 | 227,448 |
| Shire Acquisitions Investments Ireland DAC |
| 09/23/2019 | 1.900% | | 8,295,000 | 8,262,077 |
| Total | 34,153,970 |
| Property & Casualty 0.7% |
| Acrisure LLC/Finance, Inc.(e) |
| 02/15/2024 | 8.125% | | 82,000 | 85,621 |
| Alliant Holdings Intermediate LLC/Co-Issuer(e) |
| 08/01/2023 | 8.250% | | 178,000 | 182,895 |
| HUB International Ltd.(e) |
| 05/01/2026 | 7.000% | | 404,000 | 407,292 |
| Liberty Mutual Insurance Co.(e) |
| Subordinated |
| 10/15/2026 | 7.875% | | 5,565,000 | 6,808,171 |
| Total | 7,483,979 |
The accompanying Notes to Financial Statements are an integral part of this statement.
Columbia Corporate Income Fund | Annual Report 2019
| 15 |
Portfolio of Investments (continued)
April 30, 2019
| Corporate Bonds & Notes (continued) |
| Issuer | Coupon
Rate | | Principal
Amount ($) | Value ($) |
| Railroads 1.1% |
| CSX Corp. |
| 03/15/2029 | 4.250% | | 874,000 | 931,811 |
| 03/01/2048 | 4.300% | | 2,075,000 | 2,118,645 |
| 11/15/2048 | 4.750% | | 2,684,000 | 2,920,646 |
| Union Pacific Corp. |
| 09/10/2058 | 4.800% | | 5,575,000 | 6,049,633 |
| Total | 12,020,735 |
| Restaurants 0.1% |
| 1011778 BC ULC/New Red Finance, Inc.(e) |
| 05/15/2024 | 4.250% | | 306,000 | 301,759 |
| IRB Holding Corp.(e) |
| 02/15/2026 | 6.750% | | 363,000 | 360,294 |
| Total | 662,053 |
| Retailers 0.5% |
| L Brands, Inc. |
| 11/01/2035 | 6.875% | | 196,000 | 174,578 |
| Lowe’s Companies, Inc. |
| 04/05/2049 | 4.550% | | 4,816,000 | 4,890,908 |
| Party City Holdings, Inc.(e) |
| 08/15/2023 | 6.125% | | 88,000 | 89,305 |
| Penske Automotive Group, Inc. |
| 08/15/2020 | 3.750% | | 360,000 | 361,182 |
| PetSmart, Inc.(e) |
| 06/01/2025 | 5.875% | | 192,000 | 174,019 |
| Total | 5,689,992 |
| Supermarkets 0.8% |
| Albertsons Companies LLC/Safeway, Inc.(e) |
| 03/15/2026 | 7.500% | | 147,000 | 156,561 |
| Albertsons Companies LLC/Safeway, Inc./New Albertsons LP |
| 03/15/2025 | 5.750% | | 132,000 | 131,090 |
| Kroger Co. (The) |
| 02/01/2047 | 4.450% | | 3,387,000 | 3,113,056 |
| 01/15/2048 | 4.650% | | 5,498,000 | 5,207,178 |
| 01/15/2049 | 5.400% | | 645,000 | 674,455 |
| Total | 9,282,340 |
| Technology 2.4% |
| Ascend Learning LLC(e) |
| 08/01/2025 | 6.875% | | 280,000 | 284,839 |
| 08/01/2025 | 6.875% | | 205,000 | 208,531 |
| Broadcom Corp./Cayman Finance Ltd. |
| 01/15/2027 | 3.875% | | 11,742,000 | 11,207,258 |
| 01/15/2028 | 3.500% | | 1,940,000 | 1,789,051 |
| Corporate Bonds & Notes (continued) |
| Issuer | Coupon
Rate | | Principal
Amount ($) | Value ($) |
| Camelot Finance SA(e) |
| 10/15/2024 | 7.875% | | 831,000 | 875,450 |
| CDK Global, Inc. |
| 06/01/2027 | 4.875% | | 411,000 | 415,135 |
| CommScope Finance LLC(e) |
| 03/01/2024 | 5.500% | | 176,000 | 183,542 |
| 03/01/2026 | 6.000% | | 265,000 | 280,740 |
| 03/01/2027 | 8.250% | | 106,000 | 114,745 |
| CommScope Technologies LLC(e) |
| 06/15/2025 | 6.000% | | 386,000 | 392,445 |
| 03/15/2027 | 5.000% | | 166,000 | 156,581 |
| Dun & Bradstreet Corp. (The)(e) |
| 08/15/2026 | 6.875% | | 160,000 | 166,423 |
| Ensemble S Merger Sub, Inc.(e) |
| 09/30/2023 | 9.000% | | 87,000 | 90,487 |
| Equinix, Inc. |
| 01/01/2022 | 5.375% | | 470,000 | 482,499 |
| 01/15/2026 | 5.875% | | 446,000 | 471,174 |
| 05/15/2027 | 5.375% | | 370,000 | 391,484 |
| First Data Corp.(e) |
| 08/15/2023 | 5.375% | | 218,000 | 222,898 |
| 01/15/2024 | 5.750% | | 895,000 | 922,896 |
| Gartner, Inc.(e) |
| 04/01/2025 | 5.125% | | 389,000 | 398,899 |
| Informatica LLC(e) |
| 07/15/2023 | 7.125% | | 331,000 | 338,408 |
| International Business Machines Corp. |
| 02/19/2046 | 4.700% | | 1,595,000 | 1,731,573 |
| Iron Mountain, Inc. |
| 08/15/2024 | 5.750% | | 308,000 | 310,125 |
| NCR Corp. |
| 07/15/2022 | 5.000% | | 243,000 | 244,467 |
| 12/15/2023 | 6.375% | | 509,000 | 522,849 |
| PTC, Inc. |
| 05/15/2024 | 6.000% | | 281,000 | 294,266 |
| QUALCOMM, Inc. |
| 05/20/2047 | 4.300% | | 1,075,000 | 1,087,124 |
| Qualitytech LP/QTS Finance Corp.(e) |
| 11/15/2025 | 4.750% | | 613,000 | 598,072 |
| Refinitiv US Holdings, Inc.(e) |
| 11/15/2026 | 8.250% | | 461,000 | 467,823 |
| Sensata Technologies UK Financing Co. PLC(e) |
| 02/15/2026 | 6.250% | | 200,000 | 212,924 |
| Symantec Corp.(e) |
| 04/15/2025 | 5.000% | | 545,000 | 555,072 |
| Tempo Acquisition LLC/Finance Corp.(e) |
| 06/01/2025 | 6.750% | | 217,000 | 221,848 |
The accompanying Notes to Financial Statements are an integral part of this statement.
| 16 | Columbia Corporate Income Fund | Annual Report 2019 |
Portfolio of Investments (continued)
April 30, 2019
| Corporate Bonds & Notes (continued) |
| Issuer | Coupon
Rate | | Principal
Amount ($) | Value ($) |
| Verscend Escrow Corp.(e) |
| 08/15/2026 | 9.750% | | 332,000 | 352,886 |
| Total | 25,992,514 |
| Tobacco 0.3% |
| Altria Group, Inc. |
| 02/14/2039 | 5.800% | | 2,265,000 | 2,426,988 |
| BAT Capital Corp. |
| 08/15/2047 | 4.540% | | 1,430,000 | 1,276,670 |
| Total | 3,703,658 |
| Transportation Services 2.0% |
| Avis Budget Car Rental LLC/Finance, Inc.(e) |
| 03/15/2025 | 5.250% | | 421,000 | 417,795 |
| ERAC U.S.A. Finance LLC(e) |
| 11/01/2046 | 4.200% | | 4,610,000 | 4,404,435 |
| FedEx Corp. |
| 04/01/2046 | 4.550% | | 12,675,000 | 12,218,345 |
| Hertz Corp. (The)(e) |
| 06/01/2022 | 7.625% | | 544,000 | 561,946 |
| United Parcel Service, Inc. |
| 03/15/2049 | 4.250% | | 3,786,000 | 3,892,962 |
| XPO Logistics, Inc.(e) |
| 06/15/2022 | 6.500% | | 180,000 | 183,787 |
| Total | 21,679,270 |
| Wireless 1.1% |
| Altice France SA(e) |
| 05/01/2026 | 7.375% | | 889,000 | 902,166 |
| 02/01/2027 | 8.125% | | 303,000 | 316,028 |
| Altice Luxembourg SA(e) |
| 05/15/2022 | 7.750% | | 191,000 | 194,523 |
| American Tower Corp. |
| 07/15/2027 | 3.550% | | 3,105,000 | 3,060,018 |
| Rogers Communications, Inc. |
| 05/01/2049 | 4.350% | | 2,310,000 | 2,328,307 |
| SBA Communications Corp. |
| 09/01/2024 | 4.875% | | 855,000 | 869,496 |
| Sprint Communications, Inc. |
| 11/15/2022 | 6.000% | | 448,000 | 450,708 |
| Sprint Corp. |
| 09/15/2021 | 7.250% | | 275,000 | 288,143 |
| 06/15/2024 | 7.125% | | 316,000 | 317,172 |
| 03/01/2026 | 7.625% | | 742,000 | 742,156 |
| T-Mobile U.S.A., Inc. |
| 01/15/2026 | 6.500% | | 792,000 | 847,009 |
| 02/01/2026 | 4.500% | | 515,000 | 518,131 |
| 02/01/2028 | 4.750% | | 324,000 | 327,163 |
| Corporate Bonds & Notes (continued) |
| Issuer | Coupon
Rate | | Principal
Amount ($) | Value ($) |
| Wind Tre SpA(e) |
| 01/20/2026 | 5.000% | | 550,000 | 506,374 |
| Total | 11,667,394 |
| Wirelines 3.5% |
| AT&T, Inc. |
| 03/01/2029 | 4.350% | | 10,811,000 | 11,175,331 |
| 06/15/2045 | 4.350% | | 10,257,000 | 9,709,481 |
| CenturyLink, Inc. |
| 03/15/2022 | 5.800% | | 370,000 | 380,705 |
| 12/01/2023 | 6.750% | | 472,000 | 501,673 |
| 04/01/2025 | 5.625% | | 155,000 | 152,592 |
| Frontier Communications Corp. |
| 09/15/2022 | 10.500% | | 74,000 | 53,927 |
| 01/15/2023 | 7.125% | | 108,000 | 67,362 |
| 01/15/2025 | 6.875% | | 212,000 | 112,723 |
| 09/15/2025 | 11.000% | | 164,000 | 106,322 |
| Frontier Communications Corp.(e) |
| 04/01/2026 | 8.500% | | 168,000 | 158,558 |
| Level 3 Financing, Inc. |
| 08/15/2022 | 5.375% | | 422,000 | 423,807 |
| Telecom Italia Capital SA |
| 09/30/2034 | 6.000% | | 181,000 | 167,594 |
| Telefonica Emisiones SAU |
| 03/08/2027 | 4.103% | | 2,870,000 | 2,934,386 |
| Verizon Communications, Inc. |
| 09/21/2028 | 4.329% | | 11,015,000 | 11,779,452 |
| Zayo Group LLC/Capital, Inc.(e) |
| 01/15/2027 | 5.750% | | 781,000 | 792,349 |
| Total | 38,516,262 |
Total Corporate Bonds & Notes
(Cost $970,644,155) | 984,748,409 |
|
| Senior Loans 0.3% |
| Borrower | Coupon
Rate | | Principal
Amount ($) | Value ($) |
| Chemicals 0.0% |
| Starfruit Finco BV/US Holdco LLC/AzkoNobel(i),(j) |
| Term Loan |
3-month USD LIBOR + 3.250%
10/01/2025 | 5.729% | | 284,000 | 282,759 |
| Finance Companies 0.0% |
| Ellie Mae, Inc.(i),(j),(k) |
| 1st Lien Term Loan |
3-month USD LIBOR + 4.000%
04/17/2026 | | | 257,000 | 258,126 |
The accompanying Notes to Financial Statements are an integral part of this statement.
Columbia Corporate Income Fund | Annual Report 2019
| 17 |
Portfolio of Investments (continued)
April 30, 2019
| Senior Loans (continued) |
| Borrower | Coupon
Rate | | Principal
Amount ($) | Value ($) |
| Food and Beverage 0.1% |
| 8th Avenue Food & Provisions, Inc.(i),(j),(k) |
| 1st Lien Term Loan |
3-month USD LIBOR + 3.750%
10/01/2025 | 6.229% | | 248,629 | 249,375 |
| 8th Avenue Food & Provisions, Inc.(i),(j) |
| 2nd Lien Term Loan |
3-month USD LIBOR + 7.750%
10/01/2026 | 10.229% | | 78,084 | 77,986 |
| Total | 327,361 |
| Health Care 0.0% |
| Avantor, Inc.(i),(j),(k) |
| Tranche B1 Term Loan |
3-month USD LIBOR + 3.750%
Floor 1.000%
11/21/2024 | 6.233% | | 48,139 | 48,345 |
| Metals and Mining 0.0% |
| Big River Steel LLC(i),(j) |
| Term Loan |
3-month USD LIBOR + 5.000%
Floor 1.000%
08/23/2023 | 7.601% | | 54,687 | 55,029 |
| Packaging 0.0% |
| Reynolds Group Holdings, Inc.(i),(j) |
| Term Loan |
3-month USD LIBOR + 2.750%
Floor 1.000%
02/05/2023 | 5.233% | | 132,661 | 132,831 |
| Pharmaceuticals 0.0% |
| Bausch Health Companies, Inc.(i),(j) |
| Term Loan |
3-month USD LIBOR + 3.000%
06/02/2025 | 5.474% | | 106,375 | 106,796 |
| Property & Casualty 0.0% |
| HUB International Ltd.(i),(j) |
| Term Loan |
3-month USD LIBOR + 2.750%
04/25/2025 | 5.336% | | 123,070 | 121,716 |
| Technology 0.2% |
| Ascend Learning LLC(i),(j),(k) |
| Term Loan |
3-month USD LIBOR + 3.000%
Floor 1.000%
07/12/2024 | | | 182,946 | 182,031 |
| Senior Loans (continued) |
| Borrower | Coupon
Rate | | Principal
Amount ($) | Value ($) |
| CommScope, Inc.(i),(j) |
| Tranche B Term Loan |
3-month USD LIBOR + 3.250%
04/06/2026 | 5.733% | | 99,000 | 99,773 |
| Dun & Bradstreet Corp. (The)(i),(j) |
| Term Loan |
3-month USD LIBOR + 5.000%
02/06/2026 | 7.479% | | 230,000 | 231,583 |
| Greeneden US Holdings I LLC/Genesys Telecommunications Laboratories, Inc.(i),(j) |
| Tranche B3 Term Loan |
3-month USD LIBOR + 3.250%
12/01/2023 | 5.733% | | 120,694 | 120,845 |
| Misys Ltd./Almonde/Tahoe/Finastra USA(i),(j) |
| 1st Lien Term Loan |
3-month USD LIBOR + 3.500%
Floor 1.000%
06/13/2024 | 6.101% | | 137,403 | 136,143 |
| Qlik Technologies, Inc.(i),(j),(k) |
| Term Loan |
3-month USD LIBOR + 3.500%
Floor 1.000%
04/26/2024 | 6.252% | | 63,904 | 63,465 |
3-month USD LIBOR + 4.250%
04/26/2024 | 6.883% | | 192,199 | 193,041 |
| Refinitiv US Holdings, Inc.(e),(i),(j) |
| Term Loan |
3-month USD LIBOR + 3.750%
10/01/2025 | 6.233% | | 868,231 | 858,463 |
| Tempo Acquisition LLC(i),(j),(k) |
| Term Loan |
3-month USD LIBOR + 3.000%
05/01/2024 | 5.483% | | 171,563 | 171,600 |
| Ultimate Software Group, Inc. (The)(i),(j),(k) |
| Tranche B Term Loan |
3-month USD LIBOR + 3.750%
04/08/2026 | | | 142,000 | 142,923 |
| Total | 2,199,867 |
Total Senior Loans
(Cost $3,517,499) | 3,532,830 |
|
| U.S. Treasury Obligations 5.2% |
| Issuer | Coupon
Rate | | Principal
Amount ($) | Value ($) |
| U.S. Treasury |
| 02/15/2020 | 1.375% | | 33,000,000 | 32,735,025 |
| 02/15/2022 | 2.500% | | 25,000,000 | 25,173,834 |
Total U.S. Treasury Obligations
(Cost $57,727,765) | 57,908,859 |
The accompanying Notes to Financial Statements are an integral part of this statement.
| 18 | Columbia Corporate Income Fund | Annual Report 2019 |
Portfolio of Investments (continued)
April 30, 2019
| Money Market Funds 3.1% |
| | Shares | Value ($) |
| Columbia Short-Term Cash Fund, 2.519%(l),(m) | 34,288,802 | 34,285,373 |
Total Money Market Funds
(Cost $34,285,373) | 34,285,373 |
Total Investments in Securities
(Cost: $1,067,252,262) | 1,080,490,796 |
| Other Assets & Liabilities, Net | | 22,812,209 |
| Net Assets | 1,103,303,005 |
At April 30, 2019, securities and/or cash totaling $2,457,194 were pledged as collateral.
Investments in derivatives
| Long futures contracts |
| Description | Number of
contracts | Expiration
date | Trading
currency | Notional
amount | Value/Unrealized
appreciation ($) | Value/Unrealized
depreciation ($) |
| U.S. Long Bond | 733 | 06/2019 | USD | 108,094,594 | 1,456,174 | — |
| U.S. Treasury 2-Year Note | 394 | 06/2019 | USD | 83,925,078 | 279,400 | — |
| U.S. Treasury 5-Year Note | 891 | 06/2019 | USD | 103,035,797 | 798,681 | — |
| Total | | | | | 2,534,255 | — |
| Short futures contracts |
| Description | Number of
contracts | Expiration
date | Trading
currency | Notional
amount | Value/Unrealized
appreciation ($) | Value/Unrealized
depreciation ($) |
| U.S. Treasury 10-Year Note | (637) | 06/2019 | USD | (78,778,984) | — | (674,316) |
| U.S. Treasury Ultra 10-Year Note | (688) | 06/2019 | USD | (90,665,500) | — | (1,038,548) |
| U.S. Ultra Treasury Bond | (618) | 06/2019 | USD | (101,525,813) | — | (1,552,736) |
| Total | | | | | — | (3,265,600) |
Notes to Portfolio of Investments
| (a) | Non-income producing investment. |
| (b) | Represents fair value as determined in good faith under procedures approved by the Board of Trustees. At April 30, 2019, the total value of these securities amounted to $9,525, which represents less than 0.01% of total net assets. |
| (c) | Negligible market value. |
| (d) | Valuation based on significant unobservable inputs. |
| (e) | Represents privately placed and other securities and instruments exempt from Securities and Exchange Commission registration (collectively, private placements), such as Section 4(a)(2) and Rule 144A eligible securities, which are often sold only to qualified institutional buyers. The Fund may invest in private placements determined to be liquid as well as those determined to be illiquid. Private placements may be determined to be liquid under guidelines established by the Fund’s Board of Trustees. At April 30, 2019, the total value of these securities amounted to $201,370,254, which represents 18.25% of total net assets. |
| (f) | Represents a variable rate security with a step coupon where the rate adjusts according to a schedule for a series of periods, typically lower for an initial period and then increasing to a higher coupon rate thereafter. The interest rate shown was the current rate as of April 30, 2019. |
| (g) | Represents a security purchased on a when-issued basis. |
| (h) | Represents securities that have defaulted on payment of interest. The Fund has stopped accruing interest on these securities. At April 30, 2019, the total value of these securities amounted to $9,525, which represents less than 0.01% of total net assets. |
| (i) | The stated interest rate represents the weighted average interest rate at April 30, 2019 of contracts within the senior loan facility. Interest rates on contracts are primarily determined either weekly, monthly or quarterly by reference to the indicated base lending rate and spread and the reset period. These base lending rates are primarily the London Interbank Offered Rate (“LIBOR”) and other short-term rates. Base lending rates may be subject to a floor or minimum rate. The interest rate for senior loans purchased on a when-issued or delayed delivery basis will be determined upon settlement, therefore no interest rate is disclosed. Senior loans often require prepayments from excess cash flows or permit the borrowers to repay at their election. The degree to which borrowers repay, cannot be predicted with accuracy. As a result, remaining maturities of senior loans may be less than the stated maturities. |
| (j) | Variable rate security. The interest rate shown was the current rate as of April 30, 2019. |
| (k) | Represents a security purchased on a forward commitment basis. |
The accompanying Notes to Financial Statements are an integral part of this statement.
Columbia Corporate Income Fund | Annual Report 2019
| 19 |
Portfolio of Investments (continued)
April 30, 2019
Notes to Portfolio of Investments (continued)
| (l) | The rate shown is the seven-day current annualized yield at April 30, 2019. |
| (m) | As defined in the Investment Company Act of 1940, an affiliated company is one in which the Fund owns 5% or more of the company’s outstanding voting securities, or a company which is under common ownership or control with the Fund. Holdings and transactions in these affiliated companies during the year ended April 30, 2019 are as follows: |
| Issuer | Beginning
shares | Shares
purchased | Shares
sold | Ending
shares | Realized gain
(loss) —
affiliated
issuers ($) | Net change in
unrealized
appreciation
(depreciation) —
affiliated
issuers ($) | Dividends —
affiliated
issuers ($) | Value —
affiliated
issuers
at end of
period ($) |
| Columbia Short-Term Cash Fund, 2.519% |
| | 70,389,494 | 725,331,926 | (761,432,618) | 34,288,802 | (2,534) | 2,413 | 1,478,699 | 34,285,373 |
Abbreviation Legend
Currency Legend
Fair value measurements
The Fund categorizes its fair value measurements according to a three-level hierarchy that maximizes the use of observable inputs and minimizes the use of unobservable inputs by prioritizing that the most observable input be used when available. Observable inputs are those that market participants would use in pricing an investment based on market data obtained from sources independent of the reporting entity. Unobservable inputs are those that reflect the Fund’s assumptions about the information market participants would use in pricing an investment. An investment’s level within the fair value hierarchy is based on the lowest level of any input that is deemed significant to the asset’s or liability’s fair value measurement. The input levels are not necessarily an indication of the risk or liquidity associated with investments at that level. For example, certain U.S. government securities are generally high quality and liquid, however, they are reflected as Level 2 because the inputs used to determine fair value may not always be quoted prices in an active market.
Fair value inputs are summarized in the three broad levels listed below:
| ■ | Level 1 — Valuations based on quoted prices for investments in active markets that the Fund has the ability to access at the measurement date. Valuation adjustments are not applied to Level 1 investments. |
| ■ | Level 2 — Valuations based on other significant observable inputs (including quoted prices for similar securities, interest rates, prepayment speeds, credit risks, etc.). |
| ■ | Level 3 — Valuations based on significant unobservable inputs (including the Fund’s own assumptions and judgment in determining the fair value of investments). |
Inputs that are used in determining fair value of an investment may include price information, credit data, volatility statistics, and other factors. These inputs can be either observable or unobservable. The availability of observable inputs can vary between investments, and is affected by various factors such as the type of investment, and the volume and level of activity for that investment or similar investments in the marketplace. The inputs will be considered by the Investment Manager, along with any other relevant factors in the calculation of an investment’s fair value. The Fund uses prices and inputs that are current as of the measurement date, which may include periods of market dislocations. During these periods, the availability of prices and inputs may be reduced for many investments. This condition could cause an investment to be reclassified between the various levels within the hierarchy.
Certain investments that have been measured at fair value using the net asset value (NAV) per share (or its equivalent) are not categorized in the fair value hierarchy. The fair value amounts presented in the table are intended to reconcile the fair value hierarchy to the amounts presented in the Portfolio of Investments. The Columbia Short-Term Cash Fund seeks to provide shareholders with maximum current income consistent with liquidity and stability of principal. Columbia Short-Term Cash Fund prices its shares with a floating NAV and no longer seeks to maintain a stable NAV.
Investments falling into the Level 3 category are primarily supported by quoted prices from brokers and dealers participating in the market for those investments. However, these may be classified as Level 3 investments due to lack of market transparency and corroboration to support these quoted prices. Additionally, valuation models may be used as the pricing source for any remaining investments classified as Level 3. These models may rely on one or more significant unobservable inputs and/or significant assumptions by the Investment Manager. Inputs used in valuations may include, but are not limited to, financial statement analysis, capital account balances, discount rates and estimated cash flows, and comparable company data.
Under the direction of the Fund’s Board of Trustees (the Board), the Investment Manager’s Valuation Committee (the Committee) is responsible for overseeing the valuation procedures approved by the Board. The Committee consists of voting and non-voting members from various groups within the Investment Manager’s organization, including operations and accounting, trading and investments, compliance, risk management and legal.
The Committee meets at least monthly to review and approve valuation matters, which may include a description of specific valuation determinations, data regarding pricing information received from approved pricing vendors and brokers and the results of Board-approved valuation control policies and procedures (the Policies). The Policies address, among other things, instances when market quotations are or are not readily available, including recommendations of third party pricing vendors and a determination of appropriate pricing methodologies; events that require specific valuation determinations and assessment of fair value techniques; securities with a potential for stale pricing, including those that are illiquid, restricted, or in default; and the effectiveness of third party pricing vendors, including periodic reviews of vendors. The Committee meets more frequently, as needed, to discuss additional valuation matters, which may include the need to review back-testing results, review time-sensitive information or approve related valuation actions. The Committee reports to the Board, with members of the Committee meeting with the Board at each of its regularly scheduled meetings to discuss valuation matters and actions during the period, similar to those described earlier.
The accompanying Notes to Financial Statements are an integral part of this statement.
| 20 | Columbia Corporate Income Fund | Annual Report 2019 |
Portfolio of Investments (continued)
April 30, 2019
Fair value measurements (continued)
For investments categorized as Level 3, the Committee monitors information similar to that described above, which may include: (i) data specific to the issuer or comparable issuers, (ii) general market or specific sector news and (iii) quoted prices and specific or similar security transactions. The Committee considers this data and any changes from prior periods in order to assess the reasonableness of observable and unobservable inputs, any assumptions or internal models used to value those securities and changes in fair value. This data is also used to corroborate, when available, information received from approved pricing vendors and brokers. Various factors impact the frequency of monitoring this information (which may occur as often as daily). However, the Committee may determine that changes to inputs, assumptions and models are not required as a result of the monitoring procedures performed.
The following table is a summary of the inputs used to value the Fund’s investments at April 30, 2019:
| | Level 1
quoted prices
in active
markets for
identical
assets ($) | Level 2
other
significant
observable
inputs ($) | Level 3
significant
unobservable
inputs ($) | Investments
measured at
net asset
value ($) | Total ($) |
| Investments in Securities | | | | | |
| Common Stocks | | | | | |
| Financials | 15,325 | — | — | — | 15,325 |
| Corporate Bonds & Notes | — | 984,738,884 | 9,525 | — | 984,748,409 |
| Senior Loans | — | 3,532,830 | — | — | 3,532,830 |
| U.S. Treasury Obligations | 57,908,859 | — | — | — | 57,908,859 |
| Money Market Funds | — | — | — | 34,285,373 | 34,285,373 |
| Total Investments in Securities | 57,924,184 | 988,271,714 | 9,525 | 34,285,373 | 1,080,490,796 |
| Investments in Derivatives | | | | | |
| Asset | | | | | |
| Futures Contracts | 2,534,255 | — | — | — | 2,534,255 |
| Liability | | | | | |
| Futures Contracts | (3,265,600) | — | — | — | (3,265,600) |
| Total | 57,192,839 | 988,271,714 | 9,525 | 34,285,373 | 1,079,759,451 |
See the Portfolio of Investments for all investment classifications not indicated in the table.
The Fund’s assets assigned to the Level 2 input category are generally valued using the market approach, in which a security’s value is determined through reference to prices and information from market transactions for similar or identical assets.
Derivative instruments are valued at unrealized appreciation (depreciation).
There were no transfers of financial assets between levels during the period.
The Fund does not hold any significant investments (greater than one percent of net assets) categorized as Level 3.
The Fund’s assets assigned to the Level 3 category are valued utilizing the valuation technique deemed the most appropriate in the circumstances. Certain corporate bonds classified as Level 3 are valued using an income approach. To determine fair value for these securities, management considered estimates of future distributions from the liquidation of company assets or potential actions related to the respective company’s bankruptcy filing. Significant increases (decreases) to any of these inputs would result in a significantly higher (lower) fair value measurement. Generally, a change in the bankruptcy filings would result in a directionally similar change to estimates of future distributions.
The accompanying Notes to Financial Statements are an integral part of this statement.
Columbia Corporate Income Fund | Annual Report 2019
| 21 |
Statement of Assets and Liabilities
April 30, 2019
| Assets | |
| Investments in securities, at value | |
| Unaffiliated issuers (cost $1,032,966,889) | $1,046,205,423 |
| Affiliated issuers (cost $34,285,373) | 34,285,373 |
| Cash | 5,883 |
| Margin deposits on: | |
| Futures contracts | 2,457,194 |
| Receivable for: | |
| Investments sold | 41,319,869 |
| Investments sold on a delayed delivery basis | 43,914 |
| Capital shares sold | 3,205,132 |
| Dividends | 91,881 |
| Interest | 11,293,122 |
| Foreign tax reclaims | 98,663 |
| Variation margin for futures contracts | 545,734 |
| Expense reimbursement due from Investment Manager | 545 |
| Prepaid expenses | 1,823 |
| Trustees’ deferred compensation plan | 142,389 |
| Total assets | 1,139,696,945 |
| Liabilities | |
| Payable for: | |
| Investments purchased | 2,123,961 |
| Investments purchased on a delayed delivery basis | 29,060,240 |
| Capital shares purchased | 842,211 |
| Distributions to shareholders | 3,209,215 |
| Variation margin for futures contracts | 829,053 |
| Management services fees | 14,928 |
| Distribution and/or service fees | 528 |
| Transfer agent fees | 98,937 |
| Compensation of chief compliance officer | 65 |
| Other expenses | 72,413 |
| Trustees’ deferred compensation plan | 142,389 |
| Total liabilities | 36,393,940 |
| Net assets applicable to outstanding capital stock | $1,103,303,005 |
| Represented by | |
| Paid in capital | 1,116,620,846 |
| Total distributable earnings (loss) (Note 2) | (13,317,841) |
| Total - representing net assets applicable to outstanding capital stock | $1,103,303,005 |
The accompanying Notes to Financial Statements are an integral part of this statement.
| 22 | Columbia Corporate Income Fund | Annual Report 2019 |
Statement of Assets and Liabilities (continued)
April 30, 2019
| Class A | |
| Net assets | $60,084,807 |
| Shares outstanding | 5,918,193 |
| Net asset value per share | $10.15 |
| Maximum sales charge | 4.75% |
| Maximum offering price per share (calculated by dividing the net asset value per share by 1.0 minus the maximum sales charge for Class A shares) | $10.66 |
| Advisor Class | |
| Net assets | $8,288,972 |
| Shares outstanding | 817,577 |
| Net asset value per share | $10.14 |
| Class C | |
| Net assets | $5,044,918 |
| Shares outstanding | 497,059 |
| Net asset value per share | $10.15 |
| Institutional Class | |
| Net assets | $579,311,898 |
| Shares outstanding | 57,068,121 |
| Net asset value per share | $10.15 |
| Institutional 2 Class | |
| Net assets | $8,051,868 |
| Shares outstanding | 794,240 |
| Net asset value per share | $10.14 |
| Institutional 3 Class | |
| Net assets | $442,520,542 |
| Shares outstanding | 43,604,378 |
| Net asset value per share | $10.15 |
The accompanying Notes to Financial Statements are an integral part of this statement.
Columbia Corporate Income Fund | Annual Report 2019
| 23 |
Statement of Operations
Year Ended April 30, 2019
| Net investment income | |
| Income: | |
| Dividends — affiliated issuers | $1,478,699 |
| Interest | 50,571,451 |
| Total income | 52,050,150 |
| Expenses: | |
| Management services fees | 6,468,272 |
| Distribution and/or service fees | |
| Class A | 150,171 |
| Class C | 57,017 |
| Class T | 505 |
| Transfer agent fees | |
| Class A | 94,503 |
| Advisor Class | 13,176 |
| Class C | 8,927 |
| Institutional Class | 1,085,029 |
| Institutional 2 Class | 2,879 |
| Institutional 3 Class | 38,788 |
| Class T | 303 |
| Compensation of board members | 33,232 |
| Custodian fees | 17,497 |
| Printing and postage fees | 70,674 |
| Registration fees | 103,337 |
| Audit fees | 39,550 |
| Legal fees | 29,582 |
| Compensation of chief compliance officer | 554 |
| Other | 45,675 |
| Total expenses | 8,259,671 |
| Fees waived or expenses reimbursed by Investment Manager and its affiliates | (141,151) |
| Fees waived by distributor | |
| Class C | (8,553) |
| Fees waived by transfer agent | |
| Institutional 2 Class | (138) |
| Expense reduction | (1,120) |
| Total net expenses | 8,108,709 |
| Net investment income | 43,941,441 |
| Realized and unrealized gain (loss) — net | |
| Net realized gain (loss) on: | |
| Investments — unaffiliated issuers | (20,433,722) |
| Investments — affiliated issuers | (2,534) |
| Futures contracts | (4,026,267) |
| Net realized loss | (24,462,523) |
| Net change in unrealized appreciation (depreciation) on: | |
| Investments — unaffiliated issuers | 47,814,432 |
| Investments — affiliated issuers | 2,413 |
| Futures contracts | (173,353) |
| Net change in unrealized appreciation (depreciation) | 47,643,492 |
| Net realized and unrealized gain | 23,180,969 |
| Net increase in net assets resulting from operations | $67,122,410 |
The accompanying Notes to Financial Statements are an integral part of this statement.
| 24 | Columbia Corporate Income Fund | Annual Report 2019 |
Statement of Changes in Net Assets
| | Year Ended
April 30, 2019 | Year Ended
April 30, 2018 |
| Operations | | |
| Net investment income | $43,941,441 | $37,015,992 |
| Net realized gain (loss) | (24,462,523) | 13,794,705 |
| Net change in unrealized appreciation (depreciation) | 47,643,492 | (46,564,018) |
| Net increase in net assets resulting from operations | 67,122,410 | 4,246,679 |
| Distributions to shareholders | | |
| Net investment income and net realized gains | | |
| Class A | (1,843,723) | |
| Advisor Class | (277,969) | |
| Class C | (139,644) | |
| Institutional Class | (22,951,875) | |
| Institutional 2 Class | (157,050) | |
| Institutional 3 Class | (18,565,279) | |
| Class T | (6,006) | |
| Net investment income | | |
| Class A | | (1,786,467) |
| Advisor Class | | (339,982) |
| Class B | | (153) |
| Class C | | (174,113) |
| Institutional Class | | (18,361,849) |
| Institutional 2 Class | | (53,659) |
| Institutional 3 Class | | (16,090,918) |
| Class T | | (11,678) |
| Total distributions to shareholders (Note 2) | (43,941,546) | (36,818,819) |
| Increase (decrease) in net assets from capital stock activity | (384,589,788) | 259,941,438 |
| Total increase (decrease) in net assets | (361,408,924) | 227,369,298 |
| Net assets at beginning of year | 1,464,711,929 | 1,237,342,631 |
| Net assets at end of year | $1,103,303,005 | $1,464,711,929 |
| Excess of distributions over net investment income | $(496,575) | $(497,291) |
The accompanying Notes to Financial Statements are an integral part of this statement.
Columbia Corporate Income Fund | Annual Report 2019
| 25 |
Statement of Changes in Net Assets (continued)
| | Year Ended | Year Ended |
| | April 30, 2019 | April 30, 2018 |
| | Shares | Dollars ($) | Shares | Dollars ($) |
| Capital stock activity |
| Class A | | | | |
| Subscriptions | 725,166 | 7,155,220 | 1,314,435 | 13,401,483 |
| Distributions reinvested | 165,358 | 1,629,433 | 154,930 | 1,575,651 |
| Redemptions | (1,376,578) | (13,520,206) | (3,155,903) | (32,210,159) |
| Net decrease | (486,054) | (4,735,553) | (1,686,538) | (17,233,025) |
| Advisor Class | | | | |
| Subscriptions | 138,268 | 1,361,369 | 383,689 | 3,917,082 |
| Distributions reinvested | 22,854 | 224,884 | 30,317 | 308,553 |
| Redemptions | (256,501) | (2,519,682) | (742,496) | (7,542,377) |
| Net decrease | (95,379) | (933,429) | (328,490) | (3,316,742) |
| Class B | | | | |
| Distributions reinvested | — | — | 7 | 70 |
| Redemptions | — | — | (5,626) | (57,200) |
| Net decrease | — | — | (5,619) | (57,130) |
| Class C | | | | |
| Subscriptions | 72,839 | 714,438 | 66,232 | 674,141 |
| Distributions reinvested | 12,911 | 127,157 | 15,638 | 158,965 |
| Redemptions | (383,972) | (3,780,285) | (329,534) | (3,347,445) |
| Net decrease | (298,222) | (2,938,690) | (247,664) | (2,514,339) |
| Institutional Class | | | | |
| Subscriptions | 20,168,555 | 197,721,197 | 36,690,440 | 372,560,422 |
| Distributions reinvested | 1,539,097 | 15,146,951 | 987,118 | 10,014,707 |
| Redemptions | (41,566,768) | (407,550,905) | (18,801,452) | (191,212,986) |
| Net increase (decrease) | (19,859,116) | (194,682,757) | 18,876,106 | 191,362,143 |
| Institutional 2 Class | | | | |
| Subscriptions | 898,426 | 8,708,681 | 46,008 | 463,904 |
| Distributions reinvested | 15,837 | 156,628 | 5,256 | 53,363 |
| Redemptions | (300,619) | (2,971,816) | (76,320) | (774,435) |
| Net increase (decrease) | 613,644 | 5,893,493 | (25,056) | (257,168) |
| Institutional 3 Class | | | | |
| Subscriptions | 6,427,485 | 63,279,559 | 12,517,308 | 125,062,262 |
| Distributions reinvested | 1,884,066 | 18,539,642 | 1,581,157 | 16,063,573 |
| Redemptions | (27,712,292) | (268,667,599) | (4,797,907) | (48,869,106) |
| Net increase (decrease) | (19,400,741) | (186,848,398) | 9,300,558 | 92,256,729 |
| Class T | | | | |
| Subscriptions | — | — | 2 | 22 |
| Distributions reinvested | 558 | 5,464 | 1,122 | 11,423 |
| Redemptions | (36,060) | (349,918) | (30,483) | (310,475) |
| Net decrease | (35,502) | (344,454) | (29,359) | (299,030) |
| Total net increase (decrease) | (39,561,370) | (384,589,788) | 25,853,938 | 259,941,438 |
The accompanying Notes to Financial Statements are an integral part of this statement.
| 26 | Columbia Corporate Income Fund | Annual Report 2019 |
[THIS PAGE INTENTIONALLY LEFT BLANK]
Columbia Corporate Income Fund | Annual Report 2019
| 27 |
The following table is intended to help you understand the Fund’s financial performance. Certain information reflects financial results for a single share of a class held for the periods shown. Per share net investment income (loss) amounts are calculated based on average shares outstanding during the period. Total return assumes reinvestment of all dividends and distributions, if any. Total return does not reflect payment of sales charges, if any. Total return and portfolio turnover are not annualized for periods of less than one year. The portfolio turnover rate is calculated without regard to purchase and sales transactions of short-term instruments and certain derivatives, if any. If such transactions were included, the Fund’s portfolio turnover rate may be higher.
| | Net asset value,
beginning of
period | Net
investment
income | Net
realized
and
unrealized
gain (loss) | Total from
investment
operations | Distributions
from net
investment
income | Total
distributions to
shareholders |
| Class A |
| Year Ended 4/30/2019 | $9.88 | 0.30 | 0.27 | 0.57 | (0.30) | (0.30) |
| Year Ended 4/30/2018 | $10.11 | 0.26 | (0.23) | 0.03 | (0.26) | (0.26) |
| Year Ended 4/30/2017 | $10.00 | 0.26 | 0.11 | 0.37 | (0.26) | (0.26) |
| Year Ended 4/30/2016 | $10.18 | 0.31 | (0.18) | 0.13 | (0.31) | (0.31) |
| Year Ended 4/30/2015 | $10.20 | 0.28 | (0.02) | 0.26 | (0.28) | (0.28) |
| Advisor Class |
| Year Ended 4/30/2019 | $9.87 | 0.33 | 0.27 | 0.60 | (0.33) | (0.33) |
| Year Ended 4/30/2018 | $10.10 | 0.28 | (0.23) | 0.05 | (0.28) | (0.28) |
| Year Ended 4/30/2017 | $9.99 | 0.28 | 0.11 | 0.39 | (0.28) | (0.28) |
| Year Ended 4/30/2016 | $10.16 | 0.33 | (0.17) | 0.16 | (0.33) | (0.33) |
| Year Ended 4/30/2015 | $10.19 | 0.31 | (0.03) | 0.28 | (0.31) | (0.31) |
| Class C |
| Year Ended 4/30/2019 | $9.88 | 0.24 | 0.27 | 0.51 | (0.24) | (0.24) |
| Year Ended 4/30/2018 | $10.11 | 0.20 | (0.23) | (0.03) | (0.20) | (0.20) |
| Year Ended 4/30/2017 | $10.00 | 0.20 | 0.11 | 0.31 | (0.20) | (0.20) |
| Year Ended 4/30/2016 | $10.18 | 0.25 | (0.18) | 0.07 | (0.25) | (0.25) |
| Year Ended 4/30/2015 | $10.20 | 0.22 | (0.02) | 0.20 | (0.22) | (0.22) |
| Institutional Class |
| Year Ended 4/30/2019 | $9.88 | 0.33 | 0.27 | 0.60 | (0.33) | (0.33) |
| Year Ended 4/30/2018 | $10.11 | 0.28 | (0.23) | 0.05 | (0.28) | (0.28) |
| Year Ended 4/30/2017 | $10.00 | 0.28 | 0.11 | 0.39 | (0.28) | (0.28) |
| Year Ended 4/30/2016 | $10.18 | 0.33 | (0.18) | 0.15 | (0.33) | (0.33) |
| Year Ended 4/30/2015 | $10.20 | 0.31 | (0.02) | 0.29 | (0.31) | (0.31) |
| Institutional 2 Class |
| Year Ended 4/30/2019 | $9.87 | 0.35 | 0.26 | 0.61 | (0.34) | (0.34) |
| Year Ended 4/30/2018 | $10.09 | 0.29 | (0.22) | 0.07 | (0.29) | (0.29) |
| Year Ended 4/30/2017 | $9.98 | 0.29 | 0.11 | 0.40 | (0.29) | (0.29) |
| Year Ended 4/30/2016 | $10.16 | 0.34 | (0.18) | 0.16 | (0.34) | (0.34) |
| Year Ended 4/30/2015 | $10.19 | 0.32 | (0.03) | 0.29 | (0.32) | (0.32) |
The accompanying Notes to Financial Statements are an integral part of this statement.
| 28 | Columbia Corporate Income Fund | Annual Report 2019 |
Financial Highlights (continued)
| | Net
asset
value,
end of
period | Total
return | Total gross
expense
ratio to
average
net assets(a) | Total net
expense
ratio to
average
net assets(a),(b) | Net investment
income
ratio to
average
net assets | Portfolio
turnover | Net
assets,
end of
period
(000’s) |
| Class A |
| Year Ended 4/30/2019 | $10.15 | 5.93% | 0.93% | 0.91%(c) | 3.07% | 65% | $60,085 |
| Year Ended 4/30/2018 | $9.88 | 0.22% | 0.95% | 0.92%(c) | 2.52% | 78% | $63,283 |
| Year Ended 4/30/2017 | $10.11 | 3.72% | 0.98%(d) | 0.91%(c),(d) | 2.56% | 76% | $81,802 |
| Year Ended 4/30/2016 | $10.00 | 1.38% | 1.00% | 0.93%(c) | 3.15% | 50% | $98,149 |
| Year Ended 4/30/2015 | $10.18 | 2.59% | 0.97% | 0.96%(c) | 2.75% | 78% | $129,902 |
| Advisor Class |
| Year Ended 4/30/2019 | $10.14 | 6.20% | 0.68% | 0.66%(c) | 3.32% | 65% | $8,289 |
| Year Ended 4/30/2018 | $9.87 | 0.46% | 0.70% | 0.67%(c) | 2.75% | 78% | $9,009 |
| Year Ended 4/30/2017 | $10.10 | 3.98% | 0.73%(d) | 0.66%(c),(d) | 2.81% | 76% | $12,534 |
| Year Ended 4/30/2016 | $9.99 | 1.73% | 0.75% | 0.68%(c) | 3.42% | 50% | $15,459 |
| Year Ended 4/30/2015 | $10.16 | 2.74% | 0.72% | 0.71%(c) | 3.01% | 78% | $18,384 |
| Class C |
| Year Ended 4/30/2019 | $10.15 | 5.29% | 1.68% | 1.51%(c) | 2.45% | 65% | $5,045 |
| Year Ended 4/30/2018 | $9.88 | (0.38%) | 1.70% | 1.52%(c) | 1.92% | 78% | $7,856 |
| Year Ended 4/30/2017 | $10.11 | 3.10% | 1.73%(d) | 1.51%(c),(d) | 1.96% | 76% | $10,543 |
| Year Ended 4/30/2016 | $10.00 | 0.78% | 1.75% | 1.53%(c) | 2.55% | 50% | $11,740 |
| Year Ended 4/30/2015 | $10.18 | 1.98% | 1.72% | 1.56%(c) | 2.15% | 78% | $15,359 |
| Institutional Class |
| Year Ended 4/30/2019 | $10.15 | 6.19% | 0.68% | 0.66%(c) | 3.31% | 65% | $579,312 |
| Year Ended 4/30/2018 | $9.88 | 0.47% | 0.69% | 0.66%(c) | 2.78% | 78% | $760,048 |
| Year Ended 4/30/2017 | $10.11 | 3.98% | 0.73%(d) | 0.66%(c),(d) | 2.81% | 76% | $586,861 |
| Year Ended 4/30/2016 | $10.00 | 1.64% | 0.75% | 0.68%(c) | 3.40% | 50% | $481,013 |
| Year Ended 4/30/2015 | $10.18 | 2.84% | 0.72% | 0.71%(c) | 3.01% | 78% | $596,908 |
| Institutional 2 Class |
| Year Ended 4/30/2019 | $10.14 | 6.29% | 0.59% | 0.58% | 3.52% | 65% | $8,052 |
| Year Ended 4/30/2018 | $9.87 | 0.67% | 0.59% | 0.57% | 2.86% | 78% | $1,782 |
| Year Ended 4/30/2017 | $10.09 | 4.09% | 0.57%(d) | 0.55%(d) | 2.92% | 76% | $2,076 |
| Year Ended 4/30/2016 | $9.98 | 1.76% | 0.57% | 0.56% | 3.53% | 50% | $1,459 |
| Year Ended 4/30/2015 | $10.16 | 2.89% | 0.57% | 0.57% | 3.14% | 78% | $1,790 |
The accompanying Notes to Financial Statements are an integral part of this statement.
Columbia Corporate Income Fund | Annual Report 2019
| 29 |
Financial Highlights (continued)
| | Net asset value,
beginning of
period | Net
investment
income | Net
realized
and
unrealized
gain (loss) | Total from
investment
operations | Distributions
from net
investment
income | Total
distributions to
shareholders |
| Institutional 3 Class |
| Year Ended 4/30/2019 | $9.88 | 0.34 | 0.27 | 0.61 | (0.34) | (0.34) |
| Year Ended 4/30/2018 | $10.11 | 0.30 | (0.23) | 0.07 | (0.30) | (0.30) |
| Year Ended 4/30/2017 | $10.00 | 0.29 | 0.12 | 0.41 | (0.30) | (0.30) |
| Year Ended 4/30/2016 | $10.18 | 0.35 | (0.18) | 0.17 | (0.35) | (0.35) |
| Year Ended 4/30/2015 | $10.20 | 0.33 | (0.02) | 0.31 | (0.33) | (0.33) |
| Notes to Financial Highlights |
| (a) | In addition to the fees and expenses that the Fund bears directly, the Fund indirectly bears a pro rata share of the fees and expenses of any other funds in which it invests. Such indirect expenses are not included in the Fund’s reported expense ratios. |
| (b) | Total net expenses include the impact of certain fee waivers/expense reimbursements made by the Investment Manager and certain of its affiliates, if applicable. |
| (c) | The benefits derived from expense reductions had an impact of less than 0.01%. |
| (d) | Expenses have been reduced due to a reimbursement of expenses overbilled by a third party. If the reimbursement had been excluded, the expense ratios would have been higher by the percentages shown for each class in the table below. All fee waivers and expense reimbursements by the Investment Manager and its affiliates were applied before giving effect to this third party reimbursement. |
| Year Ended | Class A | Advisor
Class | Class C | Institutional
Class | Institutional 2
Class | Institutional 3
Class |
| 04/30/2017 | 0.01% | 0.01% | 0.01% | 0.01% | 0.01% | 0.01% |
The accompanying Notes to Financial Statements are an integral part of this statement.
| 30 | Columbia Corporate Income Fund | Annual Report 2019 |
Financial Highlights (continued)
| | Net
asset
value,
end of
period | Total
return | Total gross
expense
ratio to
average
net assets(a) | Total net
expense
ratio to
average
net assets(a),(b) | Net investment
income
ratio to
average
net assets | Portfolio
turnover | Net
assets,
end of
period
(000’s) |
| Institutional 3 Class |
| Year Ended 4/30/2019 | $10.15 | 6.34% | 0.53% | 0.52% | 3.44% | 65% | $442,521 |
| Year Ended 4/30/2018 | $9.88 | 0.62% | 0.53% | 0.51% | 2.93% | 78% | $622,383 |
| Year Ended 4/30/2017 | $10.11 | 4.14% | 0.54%(d) | 0.51%(d) | 2.91% | 76% | $542,814 |
| Year Ended 4/30/2016 | $10.00 | 1.81% | 0.52% | 0.51% | 3.60% | 50% | $18,312 |
| Year Ended 4/30/2015 | $10.18 | 3.04% | 0.52% | 0.52% | 3.24% | 78% | $12,581 |
The accompanying Notes to Financial Statements are an integral part of this statement.
Columbia Corporate Income Fund | Annual Report 2019
| 31 |
Notes to Financial Statements
April 30, 2019
Note 1. Organization
Columbia Corporate Income Fund (the Fund), a series of Columbia Funds Series Trust I (the Trust), is a diversified fund. The Trust is registered under the Investment Company Act of 1940, as amended (the 1940 Act), as an open-end management investment company organized as a Massachusetts business trust.
Fund shares
The Trust may issue an unlimited number of shares (without par value). Although all share classes generally have identical voting, dividend and liquidation rights, each share class votes separately when required by the Trust’s organizational documents or by law. Different share classes pay different distribution amounts to the extent the expenses of such share classes differ, and distributions in liquidation will be proportional to the net asset value of each share class. Each share class has its own expense and sales charge structure. The Fund offers each of the share classes identified below.
Class A shares are subject to a maximum front-end sales charge of 4.75% based on the initial investment amount. Class A shares purchased without an initial sales charge in accounts aggregating $1 million to $50 million at the time of purchase are subject to a contingent deferred sales charge (CDSC) if the shares are sold within 18 months after purchase, charged as follows: 1.00% CDSC if redeemed within 12 months after purchase, and 0.50% CDSC if redeemed more than 12, but less than 18, months after purchase.
Advisor Class shares are not subject to sales charges and are generally available only to omnibus retirement plans and certain investors as described in the Fund’s prospectus.
Class C shares are subject to a 1.00% CDSC on shares redeemed within 12 months after purchase. Effective July 1, 2018, Class C shares automatically convert to Class A shares of the same Fund in the month of or the month following the 10-year anniversary of the Class C shares purchase date.
Institutional Class shares are not subject to sales charges and are generally available only to eligible investors, which are subject to different investment minimums as described in the Fund’s prospectus.
Institutional 2 Class shares are not subject to sales charges and are generally available only to investors purchasing through authorized investment professionals and omnibus retirement plans as described in the Fund’s prospectus.
Institutional 3 Class shares are not subject to sales charges and are available to institutional and certain other investors as described in the Fund’s prospectus.
Class T shares were subject to a maximum front-end sales charge of 2.50% per transaction and were required to be purchased through financial intermediaries that, by written agreement with Columbia Management Investment Distributors, Inc., were specifically authorized to sell Class T shares. Effective at the close of business on December 14, 2018, Class T shares merged, in a tax-free transaction, into Class A shares of the Fund and are no longer offered for sale.
Note 2. Summary of significant accounting policies
Basis of preparation
The Fund is an investment company that applies the accounting and reporting guidance in the Financial Accounting Standards Board (FASB) Accounting Standards Codification Topic 946,Financial Services - Investment Companies (ASC 946). The financial statements are prepared in accordance with U.S. generally accepted accounting principles (GAAP), which requires management to make certain estimates and assumptions that affect the reported amounts of assets and liabilities, the disclosure of contingent assets and liabilities at the date of the financial statements and the reported amounts of income and expenses during the reporting period. Actual results could differ from those estimates. The Fund received a reimbursement for expenses overbilled by a third party. Such reimbursement is included as an offset to other expenses on the Statement of Operations. All fee waivers and expense reimbursements by Columbia Management Investment Advisers, LLC and its affiliates were applied before giving effect to the third party reimbursement.
The following is a summary of significant accounting policies followed by the Fund in the preparation of its financial statements.
| 32 | Columbia Corporate Income Fund | Annual Report 2019 |
Notes to Financial Statements (continued)
April 30, 2019
Security valuation
All equity securities are valued at the close of business of the New York Stock Exchange. Equity securities are valued at the last quoted sales price on the principal exchange or market on which they trade, except for securities traded on the NASDAQ Stock Market, which are valued at the NASDAQ official close price. Unlisted securities or listed securities for which there were no sales during the day are valued at the mean of the latest quoted bid and ask prices on such exchanges or markets.
Debt securities generally are valued by pricing services approved by the Board of Trustees based upon market transactions for normal, institutional-size trading units of similar securities. The services may use various pricing techniques that take into account, as applicable, factors such as yield, quality, coupon rate, maturity, type of issue, trading characteristics and other data, as well as approved independent broker-dealer quotes. Debt securities for which quotations are not readily available or not believed to be reflective of market value may also be valued based upon a bid quote from an approved independent broker-dealer. Debt securities maturing in 60 days or less are valued primarily at amortized cost value, unless this method results in a valuation that management believes does not approximate market value.
Senior loan securities for which reliable market quotations are readily available are generally valued by pricing services at the average of the bids received.
Investments in open-end investment companies, including money market funds, are valued at their latest net asset value.
Futures and options on futures contracts are valued based upon the settlement price at the close of regular trading on their principal exchanges or, in the absence of transactions, at the mean of the latest quoted bid and ask prices.
Investments for which market quotations are not readily available, or that have quotations which management believes are not reflective of market value or reliable, are valued at fair value as determined in good faith under procedures approved by and under the general supervision of the Board of Trustees. If a security or class of securities (such as foreign securities) is valued at fair value, such value is likely to be different from the quoted or published price for the security.
The determination of fair value often requires significant judgment. To determine fair value, management may use assumptions including but not limited to future cash flows and estimated risk premiums. Multiple inputs from various sources may be used to determine fair value.
GAAP requires disclosure regarding the inputs and valuation techniques used to measure fair value and any changes in valuation inputs or techniques. In addition, investments shall be disclosed by major category. This information is disclosed following the Fund’s Portfolio of Investments.
Derivative instruments
The Fund invests in certain derivative instruments, as detailed below, to meet its investment objectives. Derivatives are instruments whose values depend on, or are derived from, in whole or in part, the value of one or more securities, currencies, commodities, indices, or other assets or instruments. Derivatives may be used to increase investment flexibility (including to maintain cash reserves while maintaining desired exposure to certain assets), for risk management (hedging) purposes, to facilitate trading, to reduce transaction costs and to pursue higher investment returns. The Fund may also use derivative instruments to mitigate certain investment risks, such as foreign currency exchange rate risk, interest rate risk and credit risk. Derivatives may involve various risks, including the potential inability of the counterparty to fulfill its obligations under the terms of the contract, the potential for an illiquid secondary market (making it difficult for the Fund to sell or terminate, including at favorable prices) and the potential for market movements which may expose the Fund to gains or losses in excess of the amount shown in the Statement of Assets and Liabilities. The notional amounts of derivative instruments, if applicable, are not recorded in the financial statements.
A derivative instrument may suffer a marked-to-market loss if the value of the contract decreases due to an unfavorable change in the market rates or values of the underlying instrument. Losses can also occur if the counterparty does not perform its obligations under the contract. The Fund’s risk of loss from counterparty credit risk on over-the-counter derivatives is generally limited to the aggregate unrealized gain netted against any collateral held by the Fund and the amount of any variation margin held by the counterparty, plus any replacement costs or related amounts. With exchange-traded or centrally cleared derivatives, there is reduced counterparty credit risk to the Fund since the clearinghouse or central counterparty
Columbia Corporate Income Fund | Annual Report 2019
| 33 |
Notes to Financial Statements (continued)
April 30, 2019
(CCP) provides some protection in the case of clearing member default. The clearinghouse or CCP stands between the buyer and the seller of the contract; therefore, additional counterparty credit risk is failure of the clearinghouse or CCP. However, credit risk still exists in exchange-traded or centrally cleared derivatives with respect to initial and variation margin that is held in a broker’s customer account. While brokers are required to segregate customer margin from their own assets, in the event that a broker becomes insolvent or goes into bankruptcy and at that time there is a shortfall in the aggregate amount of margin held by the broker for all its clients, U.S. bankruptcy laws will typically allocate that shortfall on a pro-rata basis across all the broker’s customers (including the Fund), potentially resulting in losses to the Fund.
In order to better define its contractual rights and to secure rights that will help the Fund mitigate its counterparty risk, the Fund may enter into an International Swaps and Derivatives Association, Inc. Master Agreement (ISDA Master Agreement) or similar agreement with its derivatives contract counterparties. An ISDA Master Agreement is an agreement between the Fund and a counterparty that governs over-the-counter derivatives and typically contains, among other things, collateral posting terms and netting provisions in the event of a default and/or termination event. Under an ISDA Master Agreement, the Fund may, under certain circumstances, offset with the counterparty certain derivative instrument’s payables and/or receivables with collateral held and/or posted and create one single net payment. The provisions of the ISDA Master Agreement typically permit a single net payment in the event of default (close-out netting), including the bankruptcy or insolvency of the counterparty. Note, however, that bankruptcy or insolvency laws of a particular jurisdiction may impose restrictions on or prohibitions against the right of offset or netting in bankruptcy, insolvency or other events.
Collateral (margin) requirements differ by type of derivative. Margin requirements are established by the clearinghouse or CCP for exchange-traded and centrally cleared derivatives. Brokers can ask for margin in excess of the minimum in certain circumstances. Collateral terms are contract specific for over-the-counter derivatives. For over-the-counter derivatives traded under an ISDA Master Agreement, the collateral requirements are typically calculated by netting the marked-to-market amount for each transaction under such agreement and comparing that amount to the value of any variation margin currently pledged by the Fund and/or the counterparty. Generally, the amount of collateral due from or to a party has to exceed a minimum transfer amount threshold (e.g., $250,000) before a transfer has to be made. To the extent amounts due to the Fund from its counterparties are not fully collateralized, contractually or otherwise, the Fund bears the risk of loss from counterparty nonperformance. The Fund may also pay interest expense on cash collateral received from the broker. Any interest expense paid by the Fund is shown on the Statement of Operations. The Fund attempts to mitigate counterparty risk by only entering into agreements with counterparties that it believes have the financial resources to honor their obligations and by monitoring the financial stability of those counterparties.
Certain ISDA Master Agreements allow counterparties of over-the-counter derivatives transactions to terminate derivatives contracts prior to maturity in the event the Fund’s net asset value declines by a stated percentage over a specified time period or if the Fund fails to meet certain terms of the ISDA Master Agreement, which would cause the Fund to accelerate payment of any net liability owed to the counterparty. The Fund also has termination rights if the counterparty fails to meet certain terms of the ISDA Master Agreement. In determining whether to exercise such termination rights, the Fund would consider, in addition to counterparty credit risk, whether termination would result in a net liability owed from the counterparty.
For financial reporting purposes, the Fund does not offset derivative assets and derivative liabilities that are subject to netting arrangements in the Statement of Assets and Liabilities.
Futures contracts
Futures contracts are exchange-traded and represent commitments for the future purchase or sale of an asset at a specified price on a specified date. The Fund bought and sold futures contracts to manage the duration and yield curve exposure of the Fund versus the benchmark and to manage exposure to movements in interest rates. These instruments may be used for other purposes in future periods. Upon entering into futures contracts, the Fund bears risks that it may not achieve the anticipated benefits of the futures contracts and may realize a loss. Additional risks include counterparty credit risk, the possibility of an illiquid market, and that a change in the value of the contract or option may not correlate with changes in the value of the underlying asset.
Upon entering into a futures contract, the Fund deposits cash or securities with the broker, known as a futures commission merchant (FCM), in an amount sufficient to meet the initial margin requirement. The initial margin deposit must be maintained at an established level over the life of the contract. Cash deposited as initial margin is recorded in the Statement of Assets
| 34 | Columbia Corporate Income Fund | Annual Report 2019 |
Notes to Financial Statements (continued)
April 30, 2019
and Liabilities as margin deposits. Securities deposited as initial margin are designated in the Portfolio of Investments. Subsequent payments (variation margin) are made or received by the Fund each day. The variation margin payments are equal to the daily change in the contract value and are recorded as variation margin receivable or payable and are offset in unrealized gains or losses. The Fund recognizes a realized gain or loss when the contract is closed or expires. Futures contracts involve, to varying degrees, risk of loss in excess of the variation margin disclosed in the Statement of Assets and Liabilities.
Effects of derivative transactions in the financial statements
The following tables are intended to provide additional information about the effect of derivatives on the financial statements of the Fund, including: the fair value of derivatives by risk category and the location of those fair values in the Statement of Assets and Liabilities; and the impact of derivative transactions over the period in the Statement of Operations, including realized and unrealized gains (losses). The derivative instrument schedules following the Portfolio of Investments present additional information regarding derivative instruments outstanding at the end of the period, if any.
The following table is a summary of the fair value of derivative instruments (not considered to be hedging instruments for accounting disclosure purposes) at April 30, 2019:
| | Asset derivatives | |
Risk exposure
category | Statement
of assets and liabilities
location | Fair value ($) |
| Interest rate risk | Component of total distributable earnings (loss) — unrealized appreciation on futures contracts | 2,534,255* |
| * | Includes cumulative appreciation (depreciation) as reported in the tables following the Portfolio of Investments. Only the current day’s variation margin is reported in receivables or payables in the Statement of Assets and Liabilities. |
| | Liability derivatives | |
Risk exposure
category | Statement
of assets and liabilities
location | Fair value ($) |
| Interest rate risk | Component of total distributable earnings (loss) — unrealized depreciation on futures contracts | 3,265,600* |
| * | Includes cumulative appreciation (depreciation) as reported in the tables following the Portfolio of Investments. Only the current day’s variation margin is reported in receivables or payables in the Statement of Assets and Liabilities. |
The following table indicates the effect of derivative instruments (not considered to be hedging instruments for accounting disclosure purposes) in the Statement of Operations for the year ended April 30, 2019:
| Amount of realized gain (loss) on derivatives recognized in income |
| Risk exposure category | | | | | | Futures
contracts
($) |
| Interest rate risk | | | | | | (4,026,267) |
| Total | | | | | | (4,026,267) |
| |
| Change in unrealized appreciation (depreciation) on derivatives recognized in income |
| Risk exposure category | | | | | | Futures
contracts
($) |
| Interest rate risk | | | | | | (173,353) |
The following table is a summary of the average outstanding volume by derivative instrument for the year ended April 30, 2019:
| Derivative instrument | Average notional
amounts ($)* |
| Futures contracts — long | 270,491,664 |
| Futures contracts — short | 237,535,936 |
Columbia Corporate Income Fund | Annual Report 2019
| 35 |
Notes to Financial Statements (continued)
April 30, 2019
| * | Based on the ending quarterly outstanding amounts for the year ended April 30, 2019. |
Investments in senior loans
The Fund may invest in senior loan assignments. When the Fund purchases an assignment of a senior loan, the Fund typically has direct rights against the borrower; provided, however, that the Fund’s rights may be more limited than the lender from which it acquired the assignment and the Fund may be able to enforce its rights only through an administrative agent. Although certain senior loan assignments are secured by collateral, the Fund could experience delays or limitations in realizing such collateral or have its interest subordinated to other indebtedness of the obligor. In the event that the administrator or collateral agent of a loan becomes insolvent or enters into receivership or bankruptcy, the Fund may incur costs and delays in realizing payment or may suffer a loss of principal and/or interest. The risk of loss is greater for unsecured or subordinated loans. In addition, senior loan assignments are vulnerable to market, economic or other conditions or events that may reduce the demand for senior loan assignments and certain senior loan assignments which were liquid when purchased, may become illiquid.
The Fund may enter into senior loan assignments where all or a portion of the loan may be unfunded. The Fund is obligated to fund these commitments at the borrower’s discretion. These commitments, if any, are generally traded and priced in the same manner as other senior loan securities and are disclosed as unfunded senior loan commitments in the Fund’s Portfolio of Investments with a corresponding payable for investments purchased. The Fund designates cash or liquid securities to cover these commitments.
Delayed delivery securities
The Fund may trade securities on other than normal settlement terms, including securities purchased or sold on a “when-issued” or "forward commitment" basis. This may increase risk to the Fund since the other party to the transaction may fail to deliver, which could cause the Fund to subsequently invest at less advantageous prices. The Fund designates cash or liquid securities in an amount equal to the delayed delivery commitment.
Security transactions
Security transactions are accounted for on the trade date. Cost is determined and gains (losses) are based upon the specific identification method for both financial statement and federal income tax purposes.
The trade date for senior loans purchased in the primary market is the date on which the loan is allocated. The trade date for senior loans purchased in the secondary market is the date on which the transaction is entered into.
Income recognition
Interest income is recorded on an accrual basis. Market premiums and discounts, including original issue discounts, are amortized and accreted, respectively, over the expected life of the security on all debt securities, unless otherwise noted. The Fund classifies gains and losses realized on prepayments received on mortgage-backed securities as adjustments to interest income.
The Fund may place a debt security on non-accrual status and reduce related interest income when it becomes probable that the interest will not be collected and the amount of uncollectible interest can be reasonably estimated. A defaulted debt security is removed from non-accrual status when the issuer resumes interest payments or when collectibility of interest is reasonably assured.
Dividend income is recorded on the ex-dividend date.
Corporate actions and dividend income are recorded on the ex-dividend date.
The value of additional securities received as an income payment through a payment in kind, if any, is recorded as interest income and increases the cost basis of such securities.
| 36 | Columbia Corporate Income Fund | Annual Report 2019 |
Notes to Financial Statements (continued)
April 30, 2019
The Fund may receive other income from senior loans, including amendment fees, consent fees and commitment fees. These fees are recorded as income when received by the Fund. These amounts are included in Interest Income in the Statement of Operations.
Expenses
General expenses of the Trust are allocated to the Fund and other funds of the Trust based upon relative net assets or other expense allocation methodologies determined by the nature of the expense. Expenses directly attributable to the Fund are charged to the Fund. Expenses directly attributable to a specific class of shares are charged to that share class.
Determination of class net asset value
All income, expenses (other than class-specific expenses, which are charged to that share class, as shown in the Statement of Operations) and realized and unrealized gains (losses) are allocated to each class of the Fund on a daily basis, based on the relative net assets of each class, for purposes of determining the net asset value of each class.
Federal income tax status
The Fund intends to qualify each year as a regulated investment company under Subchapter M of the Internal Revenue Code, as amended, and will distribute substantially all of its investment company taxable income and net capital gain, if any, for its tax year, and as such will not be subject to federal income taxes. In addition, the Fund intends to distribute in each calendar year substantially all of its ordinary income, capital gain net income and certain other amounts, if any, such that the Fund should not be subject to federal excise tax. Therefore, no federal income or excise tax provision is recorded.
Foreign taxes
The Fund may be subject to foreign taxes on income, gains on investments or currency repatriation, a portion of which may be recoverable. The Fund will accrue such taxes and recoveries, as applicable, based upon its current interpretation of tax rules and regulations that exist in the markets in which it invests.
Realized gains in certain countries may be subject to foreign taxes at the Fund level, based on statutory rates. The Fund accrues for such foreign taxes on realized and unrealized gains at the appropriate rate for each jurisdiction, as applicable. The amount, if any, is disclosed as a liability on the Statement of Assets and Liabilities.
Distributions to shareholders
Distributions from net investment income, if any, are declared daily and paid monthly. Net realized capital gains, if any, are distributed at least annually. Income distributions and capital gain distributions are determined in accordance with federal income tax regulations, which may differ from GAAP.
Guarantees and indemnifications
Under the Trust’s organizational documents and, in some cases, by contract, its officers and trustees are indemnified against certain liabilities arising out of the performance of their duties to the Trust or its funds. In addition, certain of the Fund’s contracts with its service providers contain general indemnification clauses. The Fund’s maximum exposure under these arrangements is unknown since the amount of any future claims that may be made against the Fund cannot be determined, and the Fund has no historical basis for predicting the likelihood of any such claims.
Recent accounting pronouncements
Accounting Standards Update 2017-08 Premium Amortization on Purchased Callable Debt Securities
In March 2017, the Financial Accounting Standards Board issued Accounting Standards Update (ASU) No. 2017-08 Premium Amortization on Purchased Callable Debt Securities. ASU No. 2017-08 updates the accounting standards to shorten the amortization period for certain purchased callable debt securities, held at a premium, to be amortized to the earliest call date. The update applies to securities with explicit, noncontingent call features that are callable at fixed prices and on preset dates. The standard is effective for annual periods beginning after December 15, 2018 and interim periods within those fiscal years. Management does not expect the implementation of this guidance to have a material impact on the financial statement amounts and footnote disclosures.
Columbia Corporate Income Fund | Annual Report 2019
| 37 |
Notes to Financial Statements (continued)
April 30, 2019
Accounting Standards Update 2018-13 Disclosure Framework - Changes to the Disclosure Requirements for Fair Value Measurement
In August 2018, the Financial Accounting Standards Board issued Accounting Standards Update (ASU) No. 2018-13 Disclosure Framework - Changes to the Disclosure Requirements for Fair Value Measurement. ASU No. 2018-13, in addition to other modifications and additions, removes the requirement to disclose the amount and reasons for transfers between Level 1 and Level 2 of the fair value hierarchy and the policy for the timing of transfers between levels. The standard is effective for annual periods beginning after December 15, 2019 and interim periods within those fiscal years. At this time, management is evaluating the implication of this guidance and the impact it will have on the financial statement disclosures, if any.
Disclosure Update and Simplification
In September 2018, the Securities and Exchange Commission (SEC) released Final Rule 33-10532, Disclosure Update and Simplification, which amends certain financial statement disclosure requirements that the SEC determined to be redundant, outdated, or superseded in light of other SEC disclosure requirements, GAAP, or changes in the information environment. As a result of the amendments, management implemented disclosure changes which included removing the components of distributable earnings presented on the Statement of Assets and Liabilities and combining income and gain distributions paid to shareholders as presented on the Statement of Changes in Net Assets. Any values presented to meet prior year requirements were left unchanged. The amendments had no effect on the Fund’s net assets or results of operation.
Note 3. Fees and other transactions with affiliates
Management services fees
The Fund has entered into a Management Agreement with Columbia Management Investment Advisers, LLC (the Investment Manager), a wholly-owned subsidiary of Ameriprise Financial, Inc. (Ameriprise Financial). Under the Management Agreement, the Investment Manager provides the Fund with investment research and advice, as well as administrative and accounting services. The management services fee is an annual fee that is equal to a percentage of the Fund’s daily net assets that declines from 0.50% to 0.34% as the Fund’s net assets increase. The effective management services fee rate for the year ended April 30, 2019 was 0.49% of the Fund’s average daily net assets.
Compensation of board members
Members of the Board of Trustees who are not officers or employees of the Investment Manager or Ameriprise Financial are compensated for their services to the Fund as disclosed in the Statement of Operations. These members of the Board of Trustees may participate in a Deferred Compensation Plan (the Deferred Plan) which may be terminated at any time. Obligations of the Deferred Plan will be paid solely out of the Fund’s assets, and all amounts payable under the Deferred Plan constitute a general unsecured obligation of the Fund.
Compensation of Chief Compliance Officer
The Board of Trustees has appointed a Chief Compliance Officer to the Fund in accordance with federal securities regulations. As disclosed in the Statement of Operations, a portion of the Chief Compliance Officer’s total compensation is allocated to the Fund, along with other allocations to affiliated registered investment companies managed by the Investment Manager and its affiliates, based on relative net assets.
Transfer agency fees
Under a Transfer and Dividend Disbursing Agent Agreement, Columbia Management Investment Services Corp. (the Transfer Agent), an affiliate of the Investment Manager and a wholly-owned subsidiary of Ameriprise Financial, is responsible for providing transfer agency services to the Fund. The Transfer Agent has contracted with DST Asset Manager Solutions, Inc. (DST) to serve as sub-transfer agent. The Transfer Agent pays the fees of DST for services as sub-transfer agent and DST is not entitled to reimbursement for such fees from the Fund (with the exception of out-of-pocket fees).
| 38 | Columbia Corporate Income Fund | Annual Report 2019 |
Notes to Financial Statements (continued)
April 30, 2019
The Fund pays the Transfer Agent a monthly transfer agency fee based on the number or the average value of accounts, depending on the type of account. In addition, the Fund pays the Transfer Agent a fee for shareholder services based on the number of accounts or on a percentage of the average aggregate value of the Fund’s shares maintained in omnibus accounts up to the lesser of the amount charged by the financial intermediary or a cap established by the Board of Trustees from time to time.
The Transfer Agent also receives compensation from the Fund for various shareholder services and reimbursements for certain out-of-pocket fees. Total transfer agency fees for Institutional 2 Class and Institutional 3 Class shares are subject to an annual limitation of not more than 0.07% and 0.02%, respectively, of the average daily net assets attributable to each share class. In addition, effective September 1, 2018 through August 31, 2019, Institutional 2 Class shares are subject to a contractual transfer agency fee annual limitation of not more than 0.06% of the average daily net assets attributable to Institutional 2 Class shares.
For the year ended April 30, 2019, the Fund’s effective transfer agency fee rates as a percentage of average daily net assets of each class were as follows:
| | Effective rate (%) |
| Class A | 0.16 |
| Advisor Class | 0.16 |
| Class C | 0.16 |
| Institutional Class | 0.16 |
| Institutional 2 Class | 0.06 |
| Institutional 3 Class | 0.01 |
| Class T | 0.09(a) |
An annual minimum account balance fee of $20 may apply to certain accounts with a value below the applicable share class’s initial minimum investment requirements to reduce the impact of small accounts on transfer agency fees. These minimum account balance fees are remitted to the Fund and recorded as part of expense reductions in the Statement of Operations. For the year ended April 30, 2019, these minimum account balance fees reduced total expenses of the Fund by $1,120.
Distribution and service fees
The Fund has entered into an agreement with Columbia Management Investment Distributors, Inc. (the Distributor), an affiliate of the Investment Manager and a wholly-owned subsidiary of Ameriprise Financial, for distribution and shareholder services. The Board of Trustees has approved, and the Fund has adopted, distribution and shareholder service plans (the Plans) applicable to certain share classes, which set the distribution and service fees for the Fund. These fees are calculated daily and are intended to compensate the Distributor and/or eligible selling and/or servicing agents for selling shares of the Fund and providing services to investors.
Under the Plans, the Fund pays a monthly service fee to the Distributor at the maximum annual rate of 0.25% of the average daily net assets attributable to Class A, Class C and Class T shares of the Fund. Also under the Plans, the Fund pays a monthly distribution fee to the Distributor at the maximum annual rates of 0.75% and 0.25% of the average daily net assets attributable to Class C and Class T shares of the Fund, respectively. As a result of all Class T shares of the Fund being redeemed or converted to Class A shares, December 14, 2018 was the last day the Fund paid a distribution and shareholder services fee for Class T shares.
Although the Fund may have paid a distribution fee up to 0.25% of the Fund’s average daily net assets attributable to Class T shares and a service fee of up to 0.25% of the Fund’s average daily net assets attributable to Class T shares, the aggregate fee shall not exceed 0.25% of the Fund’s average daily net assets attributable to Class T shares.
The Distributor has voluntarily agreed to waive a portion of the distribution fee for Class C shares so that the distribution fee does not exceed 0.60% annually of the average daily net assets attributable to Class C shares. This arrangement may be modified or terminated by the Distributor at any time.
Columbia Corporate Income Fund | Annual Report 2019
| 39 |
Notes to Financial Statements (continued)
April 30, 2019
Sales charges (unaudited)
Sales charges, including front-end charges and CDSCs, received by the Distributor for distributing Fund shares for the year ended April 30, 2019, if any, are listed below:
| | Amount ($) |
| Class A | 26,523 |
| Class C | 60 |
Expenses waived/reimbursed by the Investment Manager and its affiliates
The Investment Manager and certain of its affiliates have contractually agreed to waive fees and/or reimburse expenses (excluding certain fees and expenses described below) for the period(s) disclosed below, unless sooner terminated at the sole discretion of the Board of Trustees, so that the Fund’s net operating expenses, after giving effect to fees waived/expenses reimbursed and any balance credits and/or overdraft charges from the Fund’s custodian, do not exceed the following annual rate(s) as a percentage of the class’ average daily net assets:
| | September 1, 2018
through
August 31, 2019 | Prior to
September 1, 2018 |
| Class A | 0.92% | 0.92% |
| Advisor Class | 0.67 | 0.67 |
| Class C | 1.67 | 1.67 |
| Institutional Class | 0.67 | 0.67 |
| Institutional 2 Class | 0.58 | 0.57 |
| Institutional 3 Class | 0.53 | 0.51 |
Under the agreement governing these fee waivers and/or expense reimbursement arrangements, the following fees and expenses are excluded from the waiver/reimbursement commitment, and therefore will be paid by the Fund, if applicable: taxes (including foreign transaction taxes), expenses associated with investments in affiliated and non-affiliated pooled investment vehicles (including mutual funds and exchange-traded funds), transaction costs and brokerage commissions, costs related to any securities lending program, dividend expenses associated with securities sold short, inverse floater program fees and expenses, transaction charges and interest on borrowed money, interest, infrequent and/or unusual expenses and any other expenses the exclusion of which is specifically approved by the Board of Trustees. This agreement may be modified or amended only with approval from the Investment Manager, certain of its affiliates and the Fund. In addition to the contractual agreement, the Investment Manager and certain of its affiliates have voluntarily agreed to waive fees and/or reimburse Fund expenses (excluding certain fees and expenses described above) so that Fund level expenses (expenses directly attributable to the Fund and not to a specific share class) are waived proportionately across all share classes, but the Fund’s net operating expenses shall not exceed the contractual annual rates listed in the table above. This arrangement may be revised or discontinued at any time. Reflected in the contractual cap commitment, effective September 1, 2018 through August 31, 2019, is the Transfer Agent’s contractual agreement to limit total transfer agency fees to an annual rate of not more than 0.06% for Institutional 2 Class of the average daily net assets attributable to Institutional 2 Class, unless sooner terminated at the sole discretion of the Board of Trustees. Any fees waived and/or expenses reimbursed under the expense reimbursement arrangements described above are not recoverable by the Investment Manager or its affiliates in future periods. Class C distribution fees waived by the Distributor, as discussed above, are in addition to the waiver/reimbursement commitment under the agreement.
Note 4. Federal tax information
The timing and character of income and capital gain distributions are determined in accordance with income tax regulations, which may differ from GAAP because of temporary or permanent book to tax differences.
At April 30, 2019, these differences were primarily due to differing treatment for deferral/reversal of wash sale losses, derivative investments, tax straddles, capital loss carryforwards, trustees’ deferred compensation, distributions and principal and/or interest from fixed income securities. To the extent these differences were permanent, reclassifications were made among the components of the Fund’s net assets. Temporary differences do not require reclassifications.
| 40 | Columbia Corporate Income Fund | Annual Report 2019 |
Notes to Financial Statements (continued)
April 30, 2019
The following reclassifications were made:
Excess of distributions
over net investment
income ($) | Accumulated
net realized
(loss) ($) | Paid in
capital ($) |
| 821 | (821) | — |
Net investment income (loss) and net realized gains (losses), as disclosed in the Statement of Operations, and net assets were not affected by this reclassification.
The tax character of distributions paid during the years indicated was as follows:
| Year Ended April 30, 2019 | Year Ended April 30, 2018 |
Ordinary
income ($) | Long-term
capital gains ($) | Total ($) | Ordinary
income ($) | Long-term
capital gains ($) | Total ($) |
| 43,941,546 | — | 43,941,546 | 36,818,819 | — | 36,818,819 |
Short-term capital gain distributions, if any, are considered ordinary income distributions for tax purposes.
At April 30, 2019, the components of distributable earnings on a tax basis were as follows:
Undistributed
ordinary income ($) | Undistributed
long-term
capital gains ($) | Capital loss
carryforwards ($) | Net unrealized
appreciation ($) |
| 3,380,860 | — | (23,049,693) | 9,702,597 |
At April 30, 2019, the cost of all investments for federal income tax purposes along with the aggregate gross unrealized appreciation and depreciation based on that cost was:
Federal
tax cost ($) | Gross unrealized
appreciation ($) | Gross unrealized
(depreciation) ($) | Net unrealized
appreciation ($) |
| 1,070,056,854 | 22,367,491 | (12,664,894) | 9,702,597 |
Tax cost of investments and unrealized appreciation/(depreciation) may also include timing differences that do not constitute adjustments to tax basis.
The following capital loss carryforwards, determined at April 30, 2019, may be available to reduce taxable income arising from future net realized gains on investments, if any, to the extent permitted by the Internal Revenue Code. Capital loss carryforwards with no expiration are required to be utilized prior to any capital losses which carry an expiration date. As a result of this ordering rule, capital loss carryforwards which carry an expiration date may be more likely to expire unused. In addition, for the year ended April 30, 2019, capital loss carryforwards utilized and expired unused, if any, were as follows:
No expiration
short-term ($) | No expiration
long-term ($) | Total ($) | Utilized ($) | Expired ($) |
| 10,191,022 | 12,858,671 | 23,049,693 | — | — |
Management of the Fund has concluded that there are no significant uncertain tax positions in the Fund that would require recognition in the financial statements. However, management’s conclusion may be subject to review and adjustment at a later date based on factors including, but not limited to, new tax laws, regulations, and administrative interpretations (including relevant court decisions). Generally, the Fund’s federal tax returns for the prior three fiscal years remain subject to examination by the Internal Revenue Service.
Note 5. Portfolio information
The cost of purchases and proceeds from sales of securities, excluding short-term investments and derivatives, if any, aggregated to $794,326,390 and $1,148,123,724, respectively, for the year ended April 30, 2019, of which $78,100,195 and $26,465,595, respectively, were U.S. government securities. The amount of purchase and sale activity impacts the portfolio turnover rate reported in the Financial Highlights.
Columbia Corporate Income Fund | Annual Report 2019
| 41 |
Notes to Financial Statements (continued)
April 30, 2019
Note 6. Affiliated money market fund
The Fund invests in Columbia Short-Term Cash Fund, an affiliated money market fund established for the exclusive use by the Fund and other affiliated funds (the Affiliated MMF). The income earned by the Fund from such investments is included as Dividends - affiliated issuers in the Statement of Operations. As an investing fund, the Fund indirectly bears its proportionate share of the expenses of the Affiliated MMF. The Affiliated MMF prices its shares with a floating net asset value. In addition, the Board of Trustees of the Affiliated MMF may impose a fee on redemptions (sometimes referred to as a liquidity fee) or temporarily suspend redemptions (sometimes referred to as imposing a redemption gate) in the event its liquidity falls below regulatory limits.
Note 7. Interfund lending
Pursuant to an exemptive order granted by the Securities and Exchange Commission, the Fund participates in a program (the Interfund Program) allowing each participating Columbia Fund (each, a Participating Fund) to lend money directly to and, except for closed-end funds and money market funds, borrow money directly from other Participating Funds for temporary purposes. The amounts eligible for borrowing and lending under the Interfund Program are subject to certain restrictions.
Interfund loans are subject to the risk that the borrowing fund could be unable to repay the loan when due, and a delay in repayment to the lending fund could result in lost opportunities and/or additional lending costs. The exemptive order is subject to conditions intended to mitigate conflicts of interest arising from the Investment Manager’s relationship with each Participating Fund.
The Fund did not borrow or lend money under the Interfund Program during the year ended April 30, 2019.
Note 8. Line of credit
The Fund has access to a revolving credit facility with a syndicate of banks led by Citibank, N.A., HSBC Bank USA, N.A. and JPMorgan Chase Bank, N.A. whereby the Fund may borrow for the temporary funding of shareholder redemptions or for other temporary or emergency purposes. The credit facility, which is a collective agreement between the Fund and certain other funds managed by the Investment Manager or an affiliated investment manager, severally and not jointly, permits collective borrowings up to $1 billion. Interest is charged to each participating fund based on its borrowings at a rate equal to the higher of (i) the federal funds effective rate, (ii) the one-month LIBOR rate and (iii) the overnight bank funding rate, plus in each case, 1.00%. Each borrowing under the credit facility matures no later than 60 days after the date of borrowing. The Fund also pays a commitment fee equal to its pro rata share of the unused amount of the credit facility at a rate of 0.15% per annum. The commitment fee is included in other expenses in the Statement of Operations. This agreement expires annually in December unless extended or renewed.
The Fund had no borrowings during the year ended April 30, 2019.
Note 9. Significant risks
Credit risk
Credit risk is the risk that the value of debt securities in the Fund’s portfolio may decline because the issuer may default and fail to pay interest or repay principal when due. Rating agencies assign credit ratings to debt securities to indicate their credit risk. Lower rated or unrated debt securities held by the Fund may present increased credit risk as compared to higher-rated debt securities.
Interest rate risk
Interest rate risk is the risk of losses attributable to changes in interest rates. In general, if prevailing interest rates rise, the values of debt securities tend to fall, and if interest rates fall, the values of debt securities tend to rise. Actions by governments and central banking authorities can result in increases in interest rates. Increasing interest rates may negatively affect the value of debt securities held by the Fund, resulting in a negative impact on the Fund’s performance and net asset value per share. In general, the longer the maturity or duration of a debt security, the greater its sensitivity to changes in interest rates.
| 42 | Columbia Corporate Income Fund | Annual Report 2019 |
Notes to Financial Statements (continued)
April 30, 2019
Liquidity risk
Liquidity risk is the risk associated with a lack of marketability of investments which may make it difficult to sell the investment at a desirable time or price. Changing regulatory, market or other conditions or environments (for example, the interest rate or credit environments) may adversely affect the liquidity of the Fund’s investments. The Fund may have to accept a lower selling price for the holding, sell other investments, or forego another, more appealing investment opportunity. Generally, the less liquid the market at the time the Fund sells a portfolio investment, the greater the risk of loss or decline of value to the Fund. A less liquid market can lead to an increase in Fund redemptions, which may negatively impact Fund performance and net asset value per share, including, for example, if the Fund is forced to sell securities in a down market.
Shareholder concentration risk
At April 30, 2019, one unaffiliated shareholder of record owned 12.0% of the outstanding shares of the Fund in one or more accounts. The Fund has no knowledge about whether any portion of those shares was owned beneficially. Affiliated shareholders of record owned 68.6% of the outstanding shares of the Fund in one or more accounts. Subscription and redemption activity by concentrated accounts may have a significant effect on the operations of the Fund. In the case of a large redemption, the Fund may be forced to sell investments at inopportune times, including its liquid positions, which may result in Fund losses and the Fund holding a higher percentage of less liquid positions. Large redemptions could result in decreased economies of scale and increased operating expenses for non-redeeming Fund shareholders.
Note 10. Subsequent events
Management has evaluated the events and transactions that have occurred through the date the financial statements were issued and noted no items requiring adjustment of the financial statements or additional disclosure.
Note 11. Information regarding pending and settled legal proceedings
Ameriprise Financial and certain of its affiliates have historically been involved in a number of legal, arbitration and regulatory proceedings, including routine litigation, class actions, and governmental actions, concerning matters arising in connection with the conduct of their business activities. Ameriprise Financial believes that the Fund is not currently the subject of, and that neither Ameriprise Financial nor any of its affiliates are the subject of, any pending legal, arbitration or regulatory proceedings that are likely to have a material adverse effect on the Fund or the ability of Ameriprise Financial or its affiliates to perform under their contracts with the Fund. Ameriprise Financial is required to make quarterly (10-Q), annual (10-K) and, as necessary, 8-K filings with the Securities and Exchange Commission (SEC) on legal and regulatory matters that relate to Ameriprise Financial and its affiliates. Copies of these filings may be obtained by accessing the SEC website at www.sec.gov.
There can be no assurance that these matters, or the adverse publicity associated with them, will not result in increased Fund redemptions, reduced sale of Fund shares or other adverse consequences to the Fund. Further, although we believe proceedings are not likely to have a material adverse effect on the Fund or the ability of Ameriprise Financial or its affiliates to perform under their contracts with the Fund, these proceedings are subject to uncertainties and, as such, we are unable to estimate the possible loss or range of loss that may result. An adverse outcome in one or more of these proceedings could result in adverse judgments, settlements, fines, penalties or other relief that could have a material adverse effect on the consolidated financial condition or results of operations of Ameriprise Financial.
Columbia Corporate Income Fund | Annual Report 2019
| 43 |
Report of Independent Registered Public Accounting Firm
To the Board of Trustees of Columbia Funds Series Trust I and Shareholders of Columbia Corporate Income Fund
Opinion on the Financial Statements
We have audited the accompanying statement of assets and liabilities, including the portfolio of investments, of Columbia Corporate Income Fund (one of the funds constituting Columbia Funds Series Trust I, referred to hereafter as the "Fund") as of April 30, 2019, the related statement of operations for the year ended April 30, 2019, the statement of changes in net assets for each of the two years in the period ended April 30, 2019, including the related notes, and the financial highlights for each of the five years in the period ended April 30, 2019 (collectively referred to as the “financial statements”). In our opinion, the financial statements present fairly, in all material respects, the financial position of the Fund as of April 30, 2019, the results of its operations for the year then ended, the changes in its net assets for each of the two years in the period ended April 30, 2019 and the financial highlights for each of the five years in the period ended April 30, 2019 in conformity with accounting principles generally accepted in the United States of America.
Basis for Opinion
These financial statements are the responsibility of the Fund’s management. Our responsibility is to express an opinion on the Fund’s financial statements based on our audits. We are a public accounting firm registered with the Public Company Accounting Oversight Board (United States) (PCAOB) and are required to be independent with respect to the Fund in accordance with the U.S. federal securities laws and the applicable rules and regulations of the Securities and Exchange Commission and the PCAOB.
We conducted our audits of these financial statements in accordance with the standards of the PCAOB. Those standards require that we plan and perform the audit to obtain reasonable assurance about whether the financial statements are free of material misstatement, whether due to error or fraud.
Our audits included performing procedures to assess the risks of material misstatement of the financial statements, whether due to error or fraud, and performing procedures that respond to those risks. Such procedures included examining, on a test basis, evidence regarding the amounts and disclosures in the financial statements. Our audits also included evaluating the accounting principles used and significant estimates made by management, as well as evaluating the overall presentation of the financial statements. Our procedures included confirmation of securities owned as of April 30, 2019 by correspondence with the custodian, transfer agent, brokers and agent banks; when replies were not received from brokers, we performed other auditing procedures. We believe that our audits provide a reasonable basis for our opinion.
/s/PricewaterhouseCoopers LLP
Minneapolis, Minnesota
June 21, 2019
We have served as the auditor of one or more investment companies within the Columbia Funds Complex since 1977.
| 44 | Columbia Corporate Income Fund | Annual Report 2019 |
The Board oversees the Fund’s operations and appoints officers who are responsible for day-to-day business decisions based on policies set by the Board. The following table provides basic biographical information about the Fund’s Trustees as of the printing of this report, including their principal occupations during the past five years, although specific titles for individuals may have varied over the period. The year set forth beneath Length of Service in the table below is the year in which the Trustee was first appointed or elected as Trustee to any Fund currently in the Columbia Funds Complex or a predecessor thereof. Under current Board policy, members serve terms of indefinite duration.
Independent trustees
| Name, address, year of birth | Position held with the Trust and length of service | Principal occupation(s) during the past five years and other relevant professional experience | Number of Funds in the Columbia Fund Complex overseen | Other directorships held by Trustee during the past five years |
Janet Langford Carrig
c/o Columbia Management
Investment Advisers, LLC
225 Franklin Street
Mail Drop BX32 05228
Boston, MA 02110
1957 | Trustee
1996 | Senior Vice President, General Counsel and Corporate Secretary, ConocoPhillips (independent energy company) from September 2007 to October 2018 | 69 | None |
Douglas A. Hacker
c/o Columbia Management
Investment Advisers, LLC
225 Franklin Street
Mail Drop BX32 05228
Boston, MA 02110
1955 | Trustee and Chairman of the Board
1996 | Independent business executive since May 2006; Executive Vice President — Strategy of United Airlines from December 2002 to May 2006; President of UAL Loyalty Services (airline marketing company) from September 2001 to December 2002; Executive Vice President and Chief Financial Officer of United Airlines from July 1999 to September 2001 | 69 | Spartan Nash Company, (food distributor); Nash Finch Company (food distributor) from 2005 to 2013; Aircastle Limited (aircraft leasing); SeaCube Container Leasing Ltd. (container leasing) from 2010 to 2013; and Travelport Worldwide Limited (travel information technology) |
Nancy T. Lukitsh
c/o Columbia Management
Investment Advisers, LLC
225 Franklin Street
Mail Drop BX32 05228
Boston, MA 02110
1956 | Trustee
2011 | Senior Vice President, Partner and Director of Marketing, Wellington Management Company, LLP (investment adviser) from 1997 to 2010; Chair, Wellington Management Portfolios (commingled non-U.S. investment pools) from 2007 to 2010; Director, Wellington Trust Company, NA and other Wellington affiliates from 1997 to 2010 | 69 | None |
David M. Moffett
c/o Columbia Management
Investment Advisers, LLC
225 Franklin Street
Mail Drop BX32 05228
Boston, MA 02110
1952 | Trustee
2011 | Retired. Consultant to Bridgewater and Associates | 69 | Director, CSX Corporation (transportation suppliers); Genworth Financial, Inc. (financial and insurance products and services); PayPal Holdings Inc. (payment and data processing services); Trustee, University of Oklahoma Foundation; former Director, eBay Inc. (online trading community), 2007-2015; and former Director, CIT Bank, CIT Group Inc. (commercial and consumer finance), 2010-2016 |
Columbia Corporate Income Fund | Annual Report 2019
| 45 |
TRUSTEES AND OFFICERS (continued)
Independent trustees (continued)
| Name, address, year of birth | Position held with the Trust and length of service | Principal occupation(s) during the past five years and other relevant professional experience | Number of Funds in the Columbia Fund Complex overseen | Other directorships held by Trustee during the past five years |
John J. Neuhauser
c/o Columbia Management
Investment Advisers, LLC
225 Franklin Street
Mail Drop BX32 05228
Boston, MA 02110
1943 | Trustee
1984 | President, Saint Michael’s College from August 2007 to June 2018; Director or Trustee of several non-profit organizations, including University of Vermont Medical Center; Academic Vice President and Dean of Faculties, Boston College from August 1999 to October 2005; University Professor, Boston College from November 2005 to August 2007 | 69 | Liberty All-Star Equity Fund and Liberty All- Star Growth Fund (closed-end funds) |
Patrick J. Simpson
c/o Columbia Management
Investment Advisers, LLC
225 Franklin Street
Mail Drop BX32 05228
Boston, MA 02110
1944 | Trustee
2000 | Of Counsel, Perkins Coie LLP (law firm) since 2015; Partner, Perkins Coie LLP from 1988 to 2014 | 69 | M Fund, Inc. (M Funds mutual fund family) |
Anne-Lee Verville
c/o Columbia Management
Investment Advisers, LLC
225 Franklin Street
Mail Drop BX32 05228
Boston, MA 02110
1945 | Trustee
1998 | Retired. General Manager, Global Education Industry from 1994 to 1997, President – Application Systems Division from 1991 to 1994, Chief Financial Officer – US Marketing & Services from 1988 to 1991, and Chief Information Officer from 1987 to 1988, IBM Corporation (computer and technology) | 69 | Enesco Group, Inc. (producer of giftware and home and garden decor products) from 2001 to 2006 |
Consultants to the Independent Trustees*
| Name, address, year of birth | Position held with the Trust and length of service | Principal occupation(s) during the past five years and other relevant professional experience | Number of Funds in the Columbia Funds complex overseen | Other directorships held by Trustee during the past five years |
J. Kevin Connaughton
c/o Columbia
Management Investment
Advisers, LLC,
225 Franklin Street
Mail Drop BX32 05228,
Boston, MA 02110
1964 | Independent Trustee Consultant
2016 | Independent Trustee Consultant, Columbia Funds since March 2016; Adjunct Professor of Finance, Bentley University since November 2017; Managing Director and General Manager of Mutual Fund Products, Columbia Management Investment Advisers, LLC from May 2010 to February 2015; President, Columbia Funds from 2009 to 2015; and senior officer of Columbia Funds and affiliated funds from 2003 to 2015 | 69 | Director, The Autism Project since March 2015; former Trustee, New Century Portfolios, March 2015-December 2017; formerly on Board of Governors, Gateway Healthcare, January 2016 – December 2017 |
| 46 | Columbia Corporate Income Fund | Annual Report 2019 |
TRUSTEES AND OFFICERS (continued)
Consultants to the Independent Trustees* (continued)
| Name, address, year of birth | Position held with the Trust and length of service | Principal occupation(s) during the past five years and other relevant professional experience | Number of Funds in the Columbia Funds complex overseen | Other directorships held by Trustee during the past five years |
Olive Darragh
c/o Columbia
Management Investment
Advisers, LLC,
225 Franklin Street,
Mail Drop BX32 05228,
Boston, MA 02110
1962 | Independent Trustee Consultant 2019 | Independent Trustee Consultant, Columbia Funds since June 2019; Managing Director of Darragh Inc. (a strategy and talent management consulting firm) since 2010; Founder and CEO, Zolio (an investment management talent identification platform) since 2004; Partner, Tudor Investments from 2004 to 2010; Senior Partner, McKinsey & Company from 2001 to 2004 | 69 | Director, University of Edinburgh Business School; former Director, Boston Public Library Foundation |
Natalie A. Trunow
c/o Columbia
Management Investment
Advisers, LLC,
225 Franklin Street
Mail Drop BX32 05228,
Boston, MA 02110
1967 | Independent Trustee Consultant
2016 | Independent Trustee Consultant, Columbia Funds since September 2016; Chief Executive Officer, Millennial Portfolio Solutions LLC (asset management and consulting services) since January 2016; Director of Investments, Casey Family Programs from April 2016 to September 2016; Senior Vice President and Chief Investment Officer, Calvert Investments from August 2008 to January 2016; Section Head and Portfolio Manager, General Motors Asset Management from June 1997 to August 2008 | 69 | Director, Health Services for Children with Special Needs, Inc.; Director, Guidewell Financial Solutions |
| * | J. Kevin Connaughton was appointed consultant to the Independent Trustees effective March 1, 2016. Olive Darragh was appointed consultant to the Independent Trustees effective June 10, 2019. Natalie A. Trunow was appointed consultant to the Independent Trustees effective September 1, 2016. Shareholders of the Funds are expected to be asked to elect each of Mr. Connaughton, Ms. Darragh and Ms. Trunow as a Trustee at a future shareholder meeting. |
Interested trustee affiliated with Investment Manager*
| Name, address, year of birth | Position held with the Trust and length of service | Principal occupation(s) during the past five years and other relevant professional experience | Number of Funds in the Columbia Funds Complex overseen | Other directorships held by Trustee during the past five years |
William F. Truscott
c/o Columbia Management
Investment Advisers, LLC
225 Franklin Street
Boston, MA 02110
1960 | Trustee
2012 | Chairman of the Board and President, Columbia Management Investment Advisers, LLC since May 2010 and February 2012, respectively; Chief Executive Officer, Global Asset Management, Ameriprise Financial, Inc. since September 2012 (previously Chief Executive Officer, U.S. Asset Management & President, Annuities, May 2010-September 2012); Director and Chief Executive Officer, Columbia Management Investment Distributors, Inc. since May 2010 and February 2012, respectively; Chairman of the Board and Chief Executive Officer, RiverSource Distributors, Inc. since 2006; Director, Threadneedle Asset Management Holdings, SARL since 2014; President and Chief Executive Officer, Ameriprise Certificate Company, 2006-August 2012 | 188 | Chairman of the Board, Columbia Management Investment Advisers, LLC since May 2010; Director, Columbia Management Investment Distributors, Inc. since May 2010; former Director, Ameriprise Certificate Company, 2006 - January 2013 |
| * | Interested person (as defined under the 1940 Act) by reason of being an officer, director, security holder and/or employee of the Investment Manager or Ameriprise Financial. |
The Statement of Additional Information has additional information about the Fund’s Board members and is available, without charge, upon request by calling 800.345.6611, visiting columbiathreadneedleus.com/investor/ or contacting your financial intermediary.
Columbia Corporate Income Fund | Annual Report 2019
| 47 |
TRUSTEES AND OFFICERS (continued)
The Board has appointed officers who are responsible for day-to-day business decisions based on policies it has established. The officers serve at the pleasure of the Board. The following table provides basic information about the Officers of the Fund, including principal occupations during the past five years, although their specific titles may have varied over the period. In addition to Mr. Truscott, who is Senior Vice President, the Fund’s other officers are:
Fund officers
Name,
address and
year of birth | Position and year
first appointed to
position for any Fund
in the Columbia
Funds complex or a
predecessor thereof | Principal occupation(s) during past five years |
Christopher O. Petersen
5228 Ameriprise
Financial Center
Minneapolis, MN 55474
Born 1970 | President and Principal Executive Officer (2015) | Vice President and Lead Chief Counsel, Ameriprise Financial, Inc. since January 2015 (previously Vice President and Chief Counsel, January 2010 - December 2014; officer of Columbia Funds and affiliated funds since 2007. |
Michael G. Clarke
225 Franklin Street
Boston, MA 02110
Born 1969 | Chief Financial Officer (Principal Financial Officer) (2009) and Senior Vice President (2019) | Vice President, Head of North American Operations, and Co-Head of Global Operations, Columbia Management Investment Advisers, LLC, since June 2019 (previously Vice President – Accounting and Tax, May 2010 - May 2019); senior officer of Columbia Funds and affiliated funds since 2002 (previously Treasurer and Chief Accounting Officer, January 2009 - January 2019 and December 2015 - January 2019, respectively). |
Joseph Beranek
5890 Ameriprise
Financial Center
Minneapolis, MN 55474
Born 1965 | Treasurer and Chief Accounting Officer (Principal Accounting Officer) (2019) | Vice President — Mutual Fund Accounting and Financial Reporting, Columbia Management Investment Advisers, LLC, since December 2018 and March 2017, respectively (previously Vice President — Pricing and Corporate Actions, May 2010 - March 2017). |
Paul B. Goucher
485 Lexington Avenue
New York, NY 10017
Born 1968 | Senior Vice President (2011) and Assistant Secretary (2008) | Senior Vice President and Assistant General Counsel, Ameriprise Financial, Inc. since January 2017 (previously Vice President and Lead Chief Counsel, November 2008 - January 2017 and January 2013 - January 2017, respectively); Vice President, Chief Legal Officer and Assistant Secretary, Columbia Management Investment Advisers, LLC since March 2015 (previously Vice President and Assistant Secretary, May 2010 – March 2015). |
Thomas P. McGuire
225 Franklin Street
Boston, MA 02110
Born 1972 | Senior Vice President and Chief Compliance Officer (2012) | Vice President — Asset Management Compliance, Ameriprise Financial, Inc., since May 2010; Chief Compliance Officer, Ameriprise Certificate Company since September 2010. |
Colin Moore
225 Franklin Street
Boston, MA 02110
Born 1958 | Senior Vice President (2010) | Executive Vice President and Global Chief Investment Officer, Ameriprise Financial, Inc., since July 2013; Executive Vice President and Global Chief Investment Officer, Columbia Management Investment Advisers, LLC since July 2013. |
Ryan C. Larrenaga
225 Franklin Street
Boston, MA 02110
Born 1970 | Senior Vice President (2017), Chief Legal Officer (2017), and Secretary (2015) | Vice President and Chief Counsel, Ameriprise Financial, Inc. since August 2018 (previously Vice President and Group Counsel, August 2011 - August 2018); officer of Columbia Funds and affiliated funds since 2005. |
Michael E. DeFao
225 Franklin Street
Boston, MA 02110
Born 1968 | Vice President (2011) and Assistant Secretary (2010) | Vice President and Chief Counsel, Ameriprise Financial, Inc. since May 2010. |
Lyn Kephart-Strong
5228 Ameriprise
Financial Center
Minneapolis, MN 55474
Born 1960 | Vice President (2015) | President, Columbia Management Investment Services Corp. since October 2014; Vice President & Resolution Officer, Ameriprise Trust Company since August 2009. |
| 48 | Columbia Corporate Income Fund | Annual Report 2019 |
The Fund mails one shareholder report to each shareholder address, unless such shareholder elected to receive shareholder reports from the Fund electronically. If you would like more than one report, please call shareholder services at 800.345.6611 and additional reports will be sent to you.
Proxy voting policies and procedures
The policy of the Board of Trustees is to vote the proxies of the companies in which the Fund holds investments consistent with the procedures as stated in the Statement of Additional Information (SAI). You may obtain a copy of the SAI without charge by calling 800.345.6611; contacting your financial intermediary; visiting columbiathreadneedleus.com/investor/; or searching the website of the Securities and Exchange Commission (SEC) at sec.gov. Information regarding how the Fund voted proxies relating to portfolio securities is filed with the SEC by August 31st for the most recent 12-month period ending June 30th of that year, and is available without charge by visiting columbiathreadneedleus.com/investor/, or searching the website of the SEC at sec.gov.
Quarterly schedule of investments
The Fund files a complete schedule of portfolio holdings with the SEC for the first and third quarters of each fiscal year on Form N-Q or Form N-PORT (available for filings after March 31, 2019). The Fund’s Form N-Q or Form N-PORT is available on the SEC’s website at sec.gov. The Fund’s complete schedule of portfolio holdings, as filed on Form N-Q or Form N-PORT, can also be obtained without charge, upon request, by calling 800.345.6611.
Additional Fund information
For more information about the Fund, please visit columbiathreadneedleus.com/investor/ or call 800.345.6611. Customer Service Representatives are available to answer your questions Monday through Friday from 8 a.m. to 7 p.m. Eastern time.
Fund investment manager
Columbia Management Investment Advisers, LLC
225 Franklin Street
Boston, MA 02110
Fund distributor
Columbia Management Investment Distributors, Inc.
225 Franklin Street
Boston, MA 02110
Fund transfer agent
Columbia Management Investment Services Corp.
P.O. Box 219104
Kansas City, MO 64121-9104
Columbia Corporate Income Fund | Annual Report 2019
| 49 |
[THIS PAGE INTENTIONALLY LEFT BLANK]
[THIS PAGE INTENTIONALLY LEFT BLANK]
Columbia Corporate Income Fund
P.O. Box 219104
Kansas City, MO 64121-9104
Please read and consider the investment objectives, risks, charges and expenses for any fund carefully before investing. For a prospectus and summary prospectus, which contains this and other important information about the Fund, go to
columbiathreadneedleus.com/investor/. The Fund is distributed by Columbia Management Investment Distributors, Inc., member FINRA, and managed by Columbia Management Investment Advisers, LLC.
Columbia Threadneedle Investments (Columbia Threadneedle) is the global brand name of the Columbia and Threadneedle group of companies. All rights reserved.
© 2019 Columbia Management Investment Advisers, LLC.
columbiathreadneedleus.com/investor/

Annual Report
April 30, 2019
Multi-Manager Directional Alternative Strategies Fund
Beginning on January 1, 2021, as permitted by regulations adopted by the Securities and Exchange Commission, paper copies of the Fund’s annual and semiannual shareholder reports like this one will no longer be sent by mail, unless you specifically request paper copies of the reports. Instead, the reports will be made available on the Fund’s website (columbiathreadneedleus.com/investor/), and each time a report is posted you will be notified by mail and provided with a website address to access the report.
If you have already elected to receive shareholder reports electronically, you will not be affected by this change and you need not take any action. You may elect to receive shareholder reports and other communications from the Fund electronically at any time by contacting your financial intermediary (such as a broker-dealer or bank) or, for Fund shares held directly with the Fund, by calling 800.345.6611 or by enrolling in “eDelivery” by logging into your account at columbiathreadneedleus.com/investor/.
You may elect to receive all future reports in paper free of charge. If you invest through a financial intermediary, you can contact your financial intermediary to request that you continue receiving paper copies of your shareholder reports. If you invest directly with the Fund, you can call 800.345.6611 to let the Fund know you wish to continue receiving paper copies of your shareholder reports. Your election to receive paper reports will apply to all Columbia Funds held in your account if you invest through a financial intermediary or all Columbia Funds held with the fund complex if you invest directly with the Fund.
Not FDIC Insured • No bank guarantee • May lose value
| 3 |
| 6 |
| 11 |
| 12 |
| 32 |
| 33 |
| 34 |
| 36 |
| 38 |
| 52 |
| 53 |
| 54 |
| 58 |
| 62 |
Multi-Manager Directional Alternative Strategies Fund | Annual Report 2019
Investment objective
Multi-Manager Directional Alternative Strategies Fund (the Fund) seeks capital appreciation.
Portfolio management
Boston Partners Global Investors, Inc
Joseph Feeney, Jr., CFA
Eric Connerly, CFA
AQR Capital Management, LLC
Michele Aghassi, Ph.D.
Andrea Frazzini, Ph.D., M.S.
Jacques Friedman, M.S.
Wells Capital Management Incorporated
Harindra de Silva, CFA
Dennis Bein, CFA
David Krider, CFA
| Average annual total returns (%) (for the period ended April 30, 2019) |
| | | Inception | 1 Year | Life |
| Class A | 10/17/16 | -5.55 | 3.03 |
| Institutional Class* | 01/03/17 | -5.65 | 3.11 |
| HFRX Equity Hedge Index | | -3.97 | 2.98 |
| Wilshire Liquid Alternative Equity Hedge Index | | 0.64 | 3.08 |
| MSCI World Index (Net) | | 6.48 | 12.72 |
All results shown assume reinvestment of distributions during the period. Returns do not reflect the deduction of taxes that a shareholder may pay on Fund distributions or on the redemption of Fund shares. Performance results reflect the effect of any fee waivers or reimbursements of Fund expenses by Columbia Management Investment Advisers, LLC and/or any of its affiliates. Absent these fee waivers or expense reimbursement arrangements, performance results would have been lower.
The performance information shown represents past performance and is not a guarantee of future results. The investment return and principal value of your investment will fluctuate so that your shares, when redeemed, may be worth more or less than their original cost. Current performance may be lower or higher than the performance information shown. You may obtain performance information current to the most recent month-end by contacting your financial intermediary, visiting columbiathreadneedleus.com/investor/ or calling 800.345.6611.
| * | The returns shown for periods prior to the share class inception date (including returns for the Life of the Fund, if shown, which are since Fund inception) include the returns of the Fund’s oldest share class. These returns are adjusted to reflect any higher class-related operating expenses of the newer share classes, as applicable. Please visit columbiathreadneedleus.com/investor/investment-products/mutual-funds/appended-performance for more information. |
The HFRX Equity Hedge Index strategies maintain positions both long and short in primarily equity and equity derivative securities. Equity Hedge managers would typically maintain at least 50%, and may in some cases be substantially entirely invested in equities, both long and short. Hedge Fund Research, Inc. (HFR) utilizes a UCITSIII compliant methodology to construct the HFRX Hedge Fund Indices. The methodology is based on defined and predetermined rules and objective criteria to select and rebalance components to maximize representation of the Hedge Fund Universe. HFRX Indices utilize state-of-the-art quantitative techniques and analysis; multi-level screening, cluster analysis, Monte-Carlo simulations and optimization techniques ensure that each Index is a pure representation of its corresponding investment focus.
The Wilshire Liquid Alternative Equity Hedge Index measures the performance of the equity hedge strategy component of the Wilshire Liquid Alternative Index℠. Equity hedge investment strategies predominantly invest in long and short equities. The Wilshire Liquid Alternative Equity Hedge Index (WLIQAEH) is designed to provide a broad measure of the liquid alternative equity hedge market.
The MSCI World Index (Net) is a free float-adjusted market capitalization weighted index that is designed to measure the equity market performance of developed markets.
Indices are not available for investment, are not professionally managed and do not reflect sales charges, fees, brokerage commissions, taxes (except the MSCI World Index (Net), which reflect reinvested dividends net of withholding taxes) or other expenses of investing. Securities in the Fund may not match those in an index.
Multi-Manager Directional Alternative Strategies Fund | Annual Report 2019
| 3 |
Fund at a Glance (continued)
Performance of a hypothetical $10,000 investment (October 17, 2016 — April 30, 2019)
The chart above shows the change in value of a hypothetical $10,000 investment in Class A shares of Multi-Manager Directional Alternative Strategies Fund during the stated time period, and does not reflect the deduction of taxes that a shareholder may pay on Fund distributions or on the redemption of Fund shares.
| Portfolio breakdown — long positions (%) (at April 30, 2019) |
| Common Stocks | 130.6 |
| Preferred Stocks | 0.2 |
| Short-Term Investments Segregated in Connection with Open Derivatives Contracts(a) | 27.3 |
| Total | 158.1 |
| (a) | Includes investments in Money Market Funds (amounting to $40.4 million) which have been segregated to cover obligations relating to the Fund’s investment in derivatives which provide exposure to multiple markets. For a description of the Fund’s investments in derivatives, see Investments in derivatives following the Portfolio of Investments and Note 2 to the Notes to Financial Statements. |
Percentages indicated are based upon total investments net of investments sold short and excluding investments in derivatives, if any. The Fund’s portfolio composition is subject to change.
| Portfolio breakdown — short positions (%) (at April 30, 2019) |
| Common Stocks | (58.0) |
| Preferred Stocks | (0.1) |
| Total | (58.1) |
Percentages indicated are based upon total investments net of investments sold short and excluding investments in derivatives, if any. The Fund’s portfolio composition is subject to change.
| Equity sector breakdown — long positions (%) (at April 30, 2019) |
| Communication Services | 6.0 |
| Consumer Discretionary | 13.3 |
| Consumer Staples | 7.0 |
| Energy | 5.7 |
| Financials | 13.6 |
| Health Care | 11.9 |
| Industrials | 13.7 |
| Information Technology | 18.1 |
| Materials | 4.5 |
| Real Estate | 3.5 |
| Utilities | 2.7 |
| Total | 100.0 |
Percentages indicated are based upon total long equity investments. The Fund’s portfolio composition is subject to change.
| 4 | Multi-Manager Directional Alternative Strategies Fund | Annual Report 2019 |
Fund at a Glance (continued)
| Equity sector breakdown — short positions (%) (at April 30, 2019) |
| Communication Services | (5.1) |
| Consumer Discretionary | (18.7) |
| Consumer Staples | (3.4) |
| Energy | (11.9) |
| Financials | (13.6) |
| Health Care | (10.5) |
| Industrials | (13.0) |
| Information Technology | (9.2) |
| Materials | (13.3) |
| Real Estate | (0.9) |
| Utilities | (0.4) |
| Total | (100.0) |
Percentages indicated are based upon total short equity investments. The Fund’s portfolio composition is subject to change.
| Market exposure through derivatives investments (% of notional exposure) (at April 30, 2019)(a) |
| | Long | Short | Net |
| Equity Derivative Contracts | 273.5 | (193.5) | 80.0 |
| Foreign Currency Derivative Contracts | 29.1 | (9.1) | 20.0 |
| Total Notional Market Value of Derivative Contracts | 302.6 | (202.6) | 100.0 |
(a) The Fund has market exposure (long and/or short) to equity asset classes and foreign currency through its investments in derivatives. The notional exposure of a financial instrument is the nominal or face amount that is used to calculate payments made on that instrument and/or changes in value for the instrument. The notional exposure is a hypothetical underlying quantity upon which payment obligations are computed. Notional exposures provide a gauge for how the Fund may behave given changes in individual markets. For a description of the Fund’s investments in derivatives, see Investments in derivatives following the Portfolio of Investments, and Note 2 to the Notes to Financial Statements.
Multi-Manager Directional Alternative Strategies Fund | Annual Report 2019
| 5 |
Manager Discussion of Fund Performance
During the 12-month period ended April 30, 2019, the Fund was managed by three independent money management firms and each invested a portion of the portfolio’s assets. Effective November 1, 2018, Analytic Investors, LLC, one of the Fund’s subadvisers, transferred substantially all of its assets and liabilities to its affiliate, Wells Capital Management Incorporated (WellsCap), a subsidiary of Wells Fargo and Company, and at a meeting of the Fund’s Board of Trustees on October 24, 2018, the Board approved a new subadvisory agreement between Columbia Management Investment Advisers, LLC, the Investment Manager, and WellsCap. As of April 30, 2019, AQR Capital Management, LLC (AQR), Boston Partners Global Investors, Inc doing business as Boston Partners (Boston Partners) and WellsCap managed approximately 29%, 39% and 32% of the Fund’s assets, respectively.
For the 12-month period ended April 30, 2019, the Fund’s Class A shares returned -5.55%. The Fund underperformed the HFRX Equity Hedge Index, which returned -3.97%, and the Wilshire Liquid Alternative Equity Hedge Index, which returned 0.64% for the same period. The Fund also underperformed the MSCI World Index (Net), which returned 6.48% during the 12-month period. The Fund’s relative performance can be attributed to the performance of the Fund’s subadvisers, who employ a variety of alternative investment strategies, involving strategies, techniques and practices designed to seek capital appreciation through participation in the broad equity and other markets while hedging overall market exposure relative to traditional long-only equity strategies. Generally, the Fund seeks to provide higher risk-adjusted returns with lower volatility compared to equity markets.
Global equity markets climbed despite increased volatility and geopolitical risk
Global equity markets posted positive returns for the 12-month period ended April 30, 2019, despite the MSCI World Index (Net) suffering a double-digit decline in the fourth quarter of 2018.
Strong U.S. economic data and robust corporate profit growth fueled healthy U.S. and global equity market returns through the first half of the 12-month period ended April 30, 2019, despite several headwinds, such as tighter U.S. Federal Reserve (Fed) policy, a strong U.S. dollar and expensive valuations. The third quarter of 2018 ended with U.S. equities trading near record highs. Consumer spending figures were strong, and consumer confidence, as measured by the Conference Board Consumer Confidence Index, hit an 18-year high. In addition, the U.S. unemployment rate as of August 2018 was 3.9%, a low not seen since December 2000. Fed officials raised short-term interest rates for a third time in 2018 in September and reaffirmed at that time its outlook for further gradual hikes well into 2019.
Starting in October 2018, global equity markets were weighed down by concerns around slowing global economic growth, potentially peak corporate earnings, trade tariff skirmishes, political uncertainty and a steadfast Fed. The Fed’s decision to raise interest rates at its December 2018 meeting, criticism of the Fed by the U.S. Administration and a partial U.S. federal government shutdown added to unease in the global equity markets — and heightened market volatility — toward the end of calendar year 2018.
In the first quarter of 2019, virtually all asset classes delivered strong gains, as a dramatic shift in policy guidance by the Fed had a powerful impact on markets. Global equities kicked off the new year with impressive gains, despite still-unresolved concerns. Economic data largely remained downbeat, particularly in Europe and China, and there were signs the U.S. economy had decelerated as well. Only 20,000 new U.S. jobs were added in February 2019, and consumer spending growth pulled back. Ongoing uncertainty over Brexit (the U.K.’s departure from the European Union) also cast a shadow over the European outlook. The Fed changed its tone as economic growth slowed and corporate earnings growth disappointed. Reassurance the Fed would be careful not to hike the U.S. economy into recession seemed to trump these negatives, helping riskier assets post one of their best performing quarters in recent history.
Stock selection strategies overall dampened relative results
AQR: Our portion of the Fund underperformed the HFRX Equity Hedge Index during the period. It also underperformed the MSCI World Index (Net), against which our portion of the Fund is measured, during the period due primarily to global stock selection, which detracted significantly. From a theme perspective within the global stock selection component of our portion of the Fund’s strategy, investor sentiment was the weakest performing theme, while quality was the best performing. Passive market exposure within our portion of the Fund contributed positively due to positive performance in global equity markets, and our tactical market exposure also buoyed relative results, albeit more modestly.
| 6 | Multi-Manager Directional Alternative Strategies Fund | Annual Report 2019 |
Manager Discussion of Fund Performance (continued)
From a sector perspective, it is important to note that our process implements a market neutral model that does not think in benchmark-relative terms, along with a static passive exposure via futures. It targets a portfolio beta of zero but has a perennial long dollar bias associated with low beta signals in its stability theme. We equilibrate the portfolio beta by running more Fund assets long than short. While net sector exposures in a long-only portfolio are zero sum and can imply a view-based forecast, this is not the case within our process. That said, industrials, information technology and consumer discretionary were the sectors that detracted most. Conversely, the financials and energy sectors were the strongest positive contributors.
The biggest individual detractors from our portion of the Fund’s results during the period were U.K.-based pharmaceuticals company Indivior, U.K.-based postal and delivery services provider Royal Mail and Australia-based enterprise software developer Atlassian. The top individual contributors to our portion of the Fund’s results during the period were U.S.-based information technology giant Apple, Luxembourg-based steel pipe products manufacturer Tenaris and U.S.-based consumer staples company The Kraft Heinz Company. It is important to keep in mind that our process is a systematic one in which securities are held based on their characteristics against hundreds of individual factors used by our investment model. Decisions to add or remove positions are based on relative attractiveness across all factors and themes as well as optimization indications of marginal risk and trading costs. We do not make security level weight decisions based on data points of individual stocks in isolation. We attempt to diversify away more idiosyncratic risk by holding hundreds of securities with position-sized constraints.
Similarly with countries, our process is a market neutral model that takes essentially no relative country or currency views. Still, within the global stock selection component, the U.S., Japan and the U.K. were the biggest detractors from results during the period. Conversely, Switzerland, Spain and Italy were the largest positive contributors to returns.
Boston Partners: Our portion of the Fund underperformed the HFRX Equity Hedge Index as well as the S&P 500 Index, the benchmark against which our portion of the Fund is measured, during the period. The period witnessed a rather tortuous assault against the very underpinnings of our long/short research investment strategy in that investors shifted abruptly from aggressive price momentum leadership to a defensive posture favoring “bond proxies,” which carry high earnings multiples and low earnings and cash flow growth, factors not favored in our methodology. Consequently, the period saw the most expensive stocks substantially outperforming less expensive stocks. Through the lens of our “three circles” methodology, top-ranking value, momentum and quality stocks significantly underperformed the broad U.S. equity market during the period.
Our portion of the Fund’s short positions rose in price overall, thus detracting from results. The rise in price of lower quality stocks, (i.e. those companies with weak profitability and poor capital efficiency), and more expensive stocks was a headwind during the period. The Fund’s short positions rose in price, given that we generally short expensive stocks that tend to reside in growth sectors. More specifically, short positions in the information technology and consumer services market segments were the leading detractors during the period. Conversely, short positions in the energy and consumer durables market segments contributed positively to our portion of the Fund’s results. On the long side of the portfolio, the market segments that contributed most positively to our portion of the Fund’s results were information technology, consumer services and financials.
The biggest individual detractors from our portion of the Fund’s absolute returns during the period were short positions in MercadoLibre, an internet services company; Liveramp Holdings, a computer equipment and services company; and Wayfair, a soft goods retailer. The top individual contributors to our portion of the Fund’s absolute returns during the period were long positions in electronics manufacturer Samsung Electronics, software giant Microsoft and media and television broadcasting services provider Comcast.
WellsCap: Our portion of the Fund outperformed the HFRX Equity Hedge Index during the period but underperformed the MSCI World Index (Net), against which our portion of the Fund is measured. Stocks our model forecasted to do well underperformed stocks the model forecasted to do poorly, primarily the result of its emphasizing certain valuation and technical characteristics that were out of favor during the period.
From a sector perspective, having an underweight position in health care detracted from results, as the sector outperformed the MSCI World Index (Net) during the period. In addition, having an overweight to consumer discretionary hurt, as the sector underperformed the MSCI World Index (Net) during the period. Stock selection within consumer discretionary, information
Multi-Manager Directional Alternative Strategies Fund | Annual Report 2019
| 7 |
Manager Discussion of Fund Performance (continued)
technology and industrials dampened relative results as well. Conversely, having underweighted allocations to energy, financials and industrials helped relative returns, as each of these sectors underperformed the MSCI World Index (Net) during the period. Stock selection within the consumer staples sector also added value.
The biggest individual detractors from our portion of the Fund’s results were long positions in German chemicals manufacturer Covestro, U.K. apparels and accessories retailer Capri Holdings, Japanese fashion online shopping site operator ZOZO and U.S. clothing and accessories designer Tapestry. The top individual contributors to our portion of the Fund’s results during the period were long positions in U.S. network security solutions provider Fortinet and Canadian athletic clothing designer and retailer Lululemon Athletica and short positions in German industrial components manufacturer thyssenkrupp and U.S.-based globally diversified technology and financial services conglomerate General Electric.
Geographically, having an underweight position in the U.S., which outperformed the MSCI World Index (Net) during the period, and having an overweight allocation to Japan, which underperformed the MSCI World Index (Net) during the period, detracted from the Fund’s relative results. Stock selection within the U.S. and Switzerland also hurt. Conversely, having underweights to the U.K. and Germany helped, as each of these countries lagged the MSCI World Index (Net) during the period. Stock selection within the Netherlands also proved especially effective.
Portfolio changes
AQR: Our strategy’s systematic investment process utilizes a model that ranks securities preferences along hundreds of factors on a daily basis. The securities most desired for inclusion in that model view are ones that display characteristics that rank well on the suite of factors as a whole, rather than upon a single metric, narrative or catalyst. The strategy rebalances periodically, attempting to stay close to the model while adhering to prospectus constraints and minimizing turnover, trading costs and other undesired effects.
The majority of themes in our investment model evaluate companies on an industry-neutral basis. Our model does not take industry or sector views by construction, and sector overweights and underweights are driven by our momentum signals. With that, during the period, our portion of the Fund’s exposure to utilities, health care and consumer staples increased, and its exposures to consumer discretionary, financials and materials decreased. The strategy does not take active country allocation risk and no meaningful shifts in country weightings were made during the period relative to the MSCI World Index (Net).
At the end of the period, our portion of the Fund was most overweight utilities relative to the MSCI World Index (Net). Conversely, our portion of the Fund was most underweight relative to the MSCI World Index (Net) in financials, consumer discretionary and communication services. Since our portion of the Fund does not take active country allocation risk, country positioning at the end of the period was rather neutrally-weighted relative to the MSCI World Index (Net).
Boston Partners: Within consumer non-durables, we added consumer goods manufacturer Unilever and automotive parts manufacturer Gentex to our portion of the Fund during the period. Given that 60% of Unilever’s revenues come from emerging markets, we believe it is better protected than its peers from brand erosion, given scale and distribution in rural emerging markets. In our view, Gentex has a differentiated portfolio, as many of its products, such as automatic dimming rearview mirrors, are sold as add-on products on higher-priced automobile models.
We sold our portion of the Fund’s position in Omnicom Group, a media company within the consumer services market segment, as it was nearing our price target and due to negative momentum as its consumer-packaged goods client base is being pressured and encroached upon from Facebook, Google and Amazon.com in the advertising space. Within energy, we sold our portion of the Fund’s position in crude oil refining company Marathon Petroleum after it rose above our target price.
Overall, our portion of the Fund’s net equity exposure declined from 54% net long to 46% net long during the period. This decrease was primarily a result of adding short exposure in the information technology, financials and capital goods market segments, as we had been finding more stocks with the “failure characteristics” we seek compared to the beginning of the period. The long side of the portfolio continued to seek to take advantage of what we believe to be compelling value opportunities. During the period, our portion of the Fund’s positioning on the long side of the portfolio decreased in the
| 8 | Multi-Manager Directional Alternative Strategies Fund | Annual Report 2019 |
Manager Discussion of Fund Performance (continued)
financials sector and increased in the consumer services and health care market segments, areas where we had observed what we considered to be high quality businesses with improving business momentum trading at attractive valuations relative to peers and the companies’ own history.
At the end of the period, our portion of the Fund’s largest long exposures were in financials and information technology. Within financials, there was a tilt toward the largest U.S. banks and large-cap insurance companies exhibiting what we view as attractive valuations, strong balance sheets and accelerating capital return. These companies, in our opinion, are also benefiting from widening net interest margins from rising interest rates and regulatory relief. Within information technology, we were finding opportunities mostly from mature large-cap technology companies where valuations were inexpensive, in our view, and free cash flow is recurring. There was a tilt toward large-cap companies successfully transitioning to cloud-subscription models and toward electronics distributors and semiconductor companies transitioning away from personal computer/consumer electronics toward autos, industrial and health care end-markets. Our portion of the Fund’s largest short exposures at the end of the period similarly included information technology and financials. Within information technology, we believed we were finding opportunities to take short positions in small-to-mid-cap software and equipment companies. Within financials, we found what we saw as opportunities in regional banks trading at extreme valuations with declining net interest margins.
WellsCap: During the period, our portion of the Fund increased its relative exposures to communication services and real estate, while decreasing its relative weights to energy and industrials. From a country perspective, our portion of the Fund increased exposure to Canada and the Netherlands and decreased exposure to the U.S. and Spain during the period.
At the end of the period, our portion of the Fund was most overweight information technology and consumer discretionary and most underweight financial and materials relative to the MSCI World Index (Net). Our portion of the Fund was rather neutrally weighted to industrials and health care compared to the MSCI World Index (Net) at the end of the period. Geographically, our portion of the Fund was most overweight relative to the MSCI World Index (Net) in Canada and Japan; was most underweight the U.K. and the U.S.; and was rather neutrally allocated to Sweden and Italy at the end of the period.
Derivative positions
AQR: Our portion of the Fund utilized equity swaps, equity index futures and currency forwards during the period. We used equity derivative instruments as a substitute for investing in conventional securities and for investment purposes to increase economic exposure to a particular security or index in a cost-effective manner. Typically, our portion of the Fund invests in common stocks and swaps on individual common stocks. Additionally, our portion of Fund uses both equity index futures and currency forwards to gain passive equity market exposure. Our portion of the Fund’s passive market exposure and tactical market exposure components are implemented entirely using derivatives. The global stock selection component is implemented using both physical equities and equity swaps. During the period, as mentioned earlier, the global stock selection component detracted from our portion of the Fund’s results, while the passive market exposure and tactical market exposure components contributed positively.
Boston Partners: Our portion of the Fund utilized several total return swaps during the period, though they represented a rather small portion of the portfolio and thus had a minimal effect on performance. Derivatives were used to gain short exposure when 1) exchanges forbid cash short sales; 2) taxes or other market features made cash long purchases or sales expensive; and 3) additional return was sought when implied volatilities were sufficiently high and stocks held long were near their target price.
WellsCap: Our portion of the Fund did not invest in derivatives during the period.
Market risk may affect a single issuer, sector of the economy, industry or the market as a whole. The Fund is managed bymultiple advisers independently of one another, which may result in contradicting trades (i.e., with no net benefit to the Fund), while increasing transaction costs. As anon-diversified fund, fewer investments could have a greater effect on performance. Alternative investments cover a broad range of strategies and structures designed to be low or non-correlated to traditional equity and fixed-income markets with along-term expectation of illiquidity.Alternative investments involve substantial risks and are more volatile than traditional investments, making them more suitable for investors with an above-average tolerance for risk. Investing inderivatives is a specialized activity that involves special risks that subject the Fund to significant loss potential, including when used as leverage, and may result in greater fluctuation in fund value.Short positions (where the underlying asset is not owned) can create unlimited risk. The Fund’s use ofleverage allows for investment exposure in excess of net assets, thereby magnifying volatility of returns and risk of loss.Foreign investments subject the Fund to risks,
Multi-Manager Directional Alternative Strategies Fund | Annual Report 2019
| 9 |
Manager Discussion of Fund Performance (continued)
including political, economic, market, social and others within a particular country, as well as to currency instabilities and less stringent financial and accounting standards generally applicable to U.S. issuers. Risks are enhanced foremerging market issuers. A rise ininterest rates may result in a price decline of fixed-income instruments held by the Fund, negatively impacting its performance and NAV. Falling rates may result in the Fund investing in lower yielding debt instruments, lowering the Fund’s income and yield. These risks may be heightened for longer maturity and duration securities. Fixed-income securities presentissuer default risk.Non-investment-grade (high-yield or junk) securities present greater price volatility and more risk to principal and income than higher rated securities.See the Fund’s prospectus for more information on these and other risks.
The views expressed in this report reflect the current views of the respective parties. These views are not guarantees of future performance and involve certain risks, uncertainties and assumptions that are difficult to predict, so actual outcomes and results may differ significantly from the views expressed. These views are subject to change at any time based upon economic, market or other conditions and the respective parties disclaim any responsibility to update such views. These views may not be relied on as investment advice and, because investment decisions for a Columbia fund are based on numerous factors, may not be relied on as an indication of trading intent on behalf of any particular Columbia fund. References to specific securities should not be construed as a recommendation or investment advice.
| 10 | Multi-Manager Directional Alternative Strategies Fund | Annual Report 2019 |
Understanding Your Fund’s Expenses
(Unaudited)
As an investor, you incur two types of costs. There are shareholder transaction costs, which may include redemption fees. There are also ongoing fund costs, which generally include management fees, distribution and/or service fees, and other fund expenses. The following information is intended to help you understand your ongoing costs (in dollars) of investing in the Fund and to help you compare these costs with the ongoing costs of investing in other mutual funds.
Analyzing your Fund’s expenses
To illustrate these ongoing costs, we have provided examples and calculated the expenses paid by investors in each share class of the Fund during the period. The actual and hypothetical information in the table is based on an initial investment of $1,000 at the beginning of the period indicated and held for the entire period. Expense information is calculated two ways and each method provides you with different information. The amount listed in the “Actual” column is calculated using the Fund’s actual operating expenses and total return for the period. You may use the Actual information, together with the amount invested, to estimate the expenses that you paid over the period. Simply divide your account value by $1,000 (for example, an $8,600 account value divided by $1,000 = 8.6), then multiply the results by the expenses paid during the period under the “Actual” column. The amount listed in the “Hypothetical” column assumes a 5% annual rate of return before expenses (which is not the Fund’s actual return) and then applies the Fund’s actual expense ratio for the period to the hypothetical return. You should not use the hypothetical account values and expenses to estimate either your actual account balance at the end of the period or the expenses you paid during the period. See “Compare with other funds” below for details on how to use the hypothetical data.
Compare with other funds
Since all mutual funds are required to include the same hypothetical calculations about expenses in shareholder reports, you can use this information to compare the ongoing cost of investing in the Fund with other funds. To do so, compare the hypothetical example with the 5% hypothetical examples that appear in the shareholder reports of other funds. As you compare hypothetical examples of other funds, it is important to note that hypothetical examples are meant to highlight the ongoing costs of investing in a fund only and do not reflect any transaction costs, such as redemption or exchange fees. Therefore, the hypothetical calculations are useful in comparing ongoing costs only, and will not help you determine the relative total costs of owning different funds. If transaction costs were included in these calculations, your costs would be higher.
| November 1, 2018 — April 30, 2019 |
| | Account value at the
beginning of the
period ($) | Account value at the
end of the
period ($) | Expenses paid during
the period ($) | Fund’s annualized
expense ratio (%) |
| | Actual | Hypothetical | Actual | Hypothetical | Actual | Hypothetical | Actual |
| Class A | 1,000.00 | 1,000.00 | 1,008.60 | 1,013.64 | 11.21 | 11.23 | 2.25 |
| Institutional Class | 1,000.00 | 1,000.00 | 1,005.70 | 1,014.88 | 9.95 | 9.99 | 2.00 |
Expenses paid during the period are equal to the annualized expense ratio for each class as indicated above, multiplied by the average account value over the period and then multiplied by the number of days in the Fund’s most recent fiscal half year and divided by 365.
Expenses do not include fees and expenses incurred indirectly by the Fund from its investment in underlying funds, including affiliated and non-affiliated pooled investment vehicles, such as mutual funds and exchange-traded funds.
Had Columbia Management Investment Advisers, LLC and/or certain of its affiliates not waived/reimbursed certain fees and expenses, account value at the end of the period would have been reduced.
The Fund is offered only through certain wrap fee programs sponsored and/or managed by Ameriprise Financial, Inc. or its affiliates. Participants in wrap fee programs pay other fees that are not included in the above table. Please refer to the wrap program documents for information about the fees charged.
Multi-Manager Directional Alternative Strategies Fund | Annual Report 2019
| 11 |
Portfolio of Investments
April 30, 2019
(Percentages represent value of investments compared to net assets)
Investments in securities
| Common Stocks 76.4% |
| Issuer | Shares | Value ($) |
| Communication Services 4.6% |
| Diversified Telecommunication Services 0.3% |
| Proximus SADP | 979 | 27,396 |
| Verizon Communications, Inc.(a) | 12,530 | 716,591 |
| Total | | 743,987 |
| Entertainment 0.4% |
| Modern Times Group | 1,308 | 16,899 |
| Viacom, Inc., Class B(a) | 32,012 | 925,467 |
| Walt Disney Co. (The) | 5 | 685 |
| Total | | 943,051 |
| Interactive Media & Services 1.7% |
| Alphabet, Inc., Class A(a),(b) | 2,047 | 2,454,271 |
| Alphabet, Inc., Class C(b) | 238 | 282,858 |
| Auto Trader Group PLC | 75,530 | 556,869 |
| Baidu, Inc., ADR(b) | 1,661 | 276,108 |
| Kakaku.com, Inc. | 5,500 | 113,314 |
| TripAdvisor, Inc.(a),(b) | 13,819 | 735,586 |
| Total | | 4,419,006 |
| Media 2.2% |
| Altice U.S.A., Inc., Class A | 11,735 | 276,477 |
| Comcast Corp., Class A(a) | 42,700 | 1,858,731 |
| Discovery, Inc., Class A(a),(b) | 11,161 | 344,875 |
| Eutelsat | 14,848 | 267,955 |
| Fox Corp., Class A(b) | 16,363 | 637,993 |
| Fox Corp., Class B(b) | 318 | 12,243 |
| Interpublic Group of Companies, Inc. (The) | 11,411 | 262,453 |
| Liberty Global PLC, Class C(b) | 14,511 | 379,463 |
| Nexstar Media Group, Inc., Class A | 4,458 | 521,809 |
| ProSiebenSat.1 Media AG | 9,687 | 152,489 |
| Quebecor, Inc., Class B | 996 | 24,839 |
| Tribune Media Co. | 16,821 | 777,130 |
| Total | | 5,516,457 |
| Total Communication Services | 11,622,501 |
| Common Stocks (continued) |
| Issuer | Shares | Value ($) |
| Consumer Discretionary 10.1% |
| Auto Components 0.4% |
| Gentex Corp. | 19,156 | 441,163 |
| Lear Corp. | 2,938 | 420,134 |
| Linamar Corp | 3,183 | 120,743 |
| Magna International, Inc. | 2,038 | 113,439 |
| Total | | 1,095,479 |
| Automobiles 0.1% |
| Fiat Chrysler Automobiles NV | 23,936 | 368,712 |
| Hotels, Restaurants & Leisure 2.4% |
| Autogrill SpA | 8,108 | 78,799 |
| Crown Resorts Ltd. | 14,933 | 139,982 |
| Darden Restaurants, Inc.(a) | 11,608 | 1,365,101 |
| Domino’s Pizza, Inc.(a) | 4,918 | 1,330,712 |
| Genting Singapore Ltd. | 349,400 | 253,356 |
| GVC Holdings PLC | 39,533 | 336,525 |
| Kindred Group PLC | 12,779 | 111,596 |
| Las Vegas Sands Corp. | 12,527 | 839,935 |
| Melco Resorts & Entertainment Ltd., ADR | 23,060 | 578,806 |
| Wyndham Destinations, Inc. | 14,037 | 611,452 |
| Wyndham Hotels & Resorts, Inc. | 7,294 | 406,422 |
| Total | | 6,052,686 |
| Household Durables 0.7% |
| Persimmon PLC | 28,655 | 835,507 |
| Sony Corp. | 16,900 | 851,221 |
| Total | | 1,686,728 |
| Internet & Direct Marketing Retail 2.2% |
| Booking Holdings, Inc.(a),(b) | 912 | 1,691,751 |
| eBay, Inc.(a) | 73,343 | 2,842,041 |
| Expedia Group, Inc. | 2,654 | 344,595 |
| ZOZO, Inc. | 40,400 | 717,644 |
| Total | | 5,596,031 |
The accompanying Notes to Financial Statements are an integral part of this statement.
| 12 | Multi-Manager Directional Alternative Strategies Fund | Annual Report 2019 |
Portfolio of Investments (continued)
April 30, 2019
| Common Stocks (continued) |
| Issuer | Shares | Value ($) |
| Leisure Products 0.5% |
| Bandai Namco Holdings, Inc. | 24,100 | 1,155,375 |
| BRP, Inc. | 4,274 | 132,843 |
| Sankyo Co., Ltd. | 800 | 31,594 |
| Total | | 1,319,812 |
| Multiline Retail 0.5% |
| Canadian Tire Corp., Ltd., Class A | 118 | 12,988 |
| Kohl’s Corp.(a) | 12,288 | 873,677 |
| Nordstrom, Inc.(a) | 214 | 8,778 |
| Target Corp. | 4,104 | 317,732 |
| Total | | 1,213,175 |
| Specialty Retail 1.0% |
| Best Buy Co., Inc.(a) | 13,495 | 1,004,163 |
| Burlington Stores, Inc.(a),(b) | 774 | 130,736 |
| Hennes & Mauritz | 1,270 | 22,160 |
| Lowe’s Companies, Inc. | 5,327 | 602,697 |
| Ulta Beauty, Inc.(a),(b) | 1,830 | 638,633 |
| Total | | 2,398,389 |
| Textiles, Apparel & Luxury Goods 2.3% |
| Adidas AG | 2,546 | 654,217 |
| Gildan Activewear, Inc. | 832 | 30,679 |
| lululemon athletica, Inc.(a),(b) | 6,199 | 1,093,194 |
| Nike, Inc., Class B(a) | 16,818 | 1,477,125 |
| Pandora A/S | 9,317 | 390,804 |
| Ralph Lauren Corp.(a) | 7,278 | 957,639 |
| Swatch Group AG (The), Registered Shares | 4,855 | 284,929 |
| Tapestry, Inc.(a) | 26,885 | 867,579 |
| Total | | 5,756,166 |
| Total Consumer Discretionary | 25,487,178 |
| Consumer Staples 5.4% |
| Beverages 1.7% |
| AmBev SA, ADR | 80,118 | 377,356 |
| Carlsberg A/S, Class B | 101 | 13,046 |
| Coca-Cola Amatil Ltd. | 6,698 | 41,548 |
| Coca-Cola European Partners PLC(a) | 52,764 | 2,827,623 |
| Heineken Holding NV | 2,591 | 263,145 |
| Common Stocks (continued) |
| Issuer | Shares | Value ($) |
| Molson Coors Brewing Co., Class B | 4,117 | 264,270 |
| PepsiCo, Inc. | 3,478 | 445,358 |
| Total | | 4,232,346 |
| Food & Staples Retailing 1.1% |
| Axfood AB | 2,341 | 42,971 |
| Empire Co., Ltd., Class A | 59,880 | 1,331,958 |
| Kesko OYJ, Class B | 738 | 38,324 |
| Koninklijke Ahold Delhaize NV | 17,519 | 421,674 |
| Loblaw Companies Ltd. | 9,600 | 470,290 |
| Metro AG | 881 | 14,921 |
| Walgreens Boots Alliance, Inc.(a) | 7,358 | 394,168 |
| Total | | 2,714,306 |
| Food Products 1.3% |
| Lamb Weston Holdings, Inc.(a) | 20,653 | 1,446,743 |
| Leroy Seafood Group ASA | 19,361 | 139,898 |
| Mondelez International, Inc., Class A | 13,324 | 677,525 |
| Nestlé SA, Registered Shares | 1,101 | 105,945 |
| Nomad Foods Ltd.(b) | 34,770 | 723,216 |
| SalMar ASA | 4,101 | 186,335 |
| Total | | 3,279,662 |
| Household Products 0.0% |
| Essity AB, Class B | 462 | 13,699 |
| Personal Products 0.2% |
| Unilever NV | 7,535 | 455,943 |
| Tobacco 1.1% |
| Altria Group, Inc. | 20,773 | 1,128,597 |
| Imperial Brands PLC | 23,362 | 742,104 |
| Philip Morris International, Inc. | 5,000 | 432,800 |
| Swedish Match AB | 12,203 | 595,014 |
| Total | | 2,898,515 |
| Total Consumer Staples | 13,594,471 |
| Energy 4.3% |
| Energy Equipment & Services 0.3% |
| Apergy Corp.(b) | 8,957 | 355,503 |
| Cactus, Inc., Class A(b) | 9,684 | 351,529 |
| Saipem SpA(b) | 18,224 | 92,328 |
| Total | | 799,360 |
The accompanying Notes to Financial Statements are an integral part of this statement.
Multi-Manager Directional Alternative Strategies Fund | Annual Report 2019
| 13 |
Portfolio of Investments (continued)
April 30, 2019
| Common Stocks (continued) |
| Issuer | Shares | Value ($) |
| Oil, Gas & Consumable Fuels 4.0% |
| Canadian Natural Resources Ltd. | 22,972 | 688,700 |
| Chevron Corp. | 2,578 | 309,515 |
| Cimarex Energy Co. | 6,219 | 426,996 |
| ConocoPhillips Co. | 9,419 | 594,527 |
| Diamondback Energy, Inc. | 2,997 | 318,851 |
| Enerplus Corp. | 49,682 | 454,655 |
| ENI SpA | 53,235 | 908,642 |
| Equinor ASA | 16,842 | 375,690 |
| Husky Energy, Inc. | 3,249 | 35,262 |
| JXTG Holdings, Inc. | 281,500 | 1,369,552 |
| Kosmos Energy Ltd. | 52,472 | 351,038 |
| Marathon Oil Corp. | 34,752 | 592,174 |
| Neste OYJ | 16,377 | 540,767 |
| Noble Energy, Inc. | 22,419 | 606,658 |
| Pioneer Natural Resources Co.(a) | 4,010 | 667,505 |
| Plains GP Holdings LP, Class A(a),(b) | 21,556 | 508,722 |
| Royal Dutch Shell PLC, Class B | 5,141 | 165,217 |
| Snam SpA | 6,879 | 35,005 |
| Total SA, ADR | 14,108 | 785,392 |
| Tullow Oil PLC | 49,677 | 145,947 |
| Valero Energy Corp. | 2,804 | 254,211 |
| Total | | 10,135,026 |
| Total Energy | 10,934,386 |
| Financials 10.4% |
| Banks 4.3% |
| Banca Popolare dell’Emilia Romagna SC | 21,896 | 105,209 |
| Bank of America Corp.(a) | 44,331 | 1,355,642 |
| Bank of Ireland Group PLC(b) | 39,094 | 249,494 |
| BB&T Corp. | 8,536 | 437,043 |
| Citigroup, Inc.(a) | 22,278 | 1,575,055 |
| Citizens Financial Group, Inc. | 4,865 | 176,113 |
| DNB ASA(b) | 15,302 | 293,804 |
| East West Bancorp, Inc. | 7,427 | 382,342 |
| Fifth Third Bancorp | 14,286 | 411,722 |
| Huntington Bancshares, Inc. | 52,189 | 726,471 |
| JPMorgan Chase & Co.(a) | 11,667 | 1,353,955 |
| KeyCorp | 45,783 | 803,492 |
| National Bank of Canada | 348 | 16,578 |
| Common Stocks (continued) |
| Issuer | Shares | Value ($) |
| PNC Financial Services Group, Inc. (The) | 3,098 | 424,209 |
| Regions Financial Corp. | 35,072 | 544,668 |
| Sumitomo Mitsui Financial Group, Inc. | 5,700 | 207,174 |
| SunTrust Banks, Inc. | 7,255 | 475,057 |
| United Overseas Bank Ltd. | 14,600 | 298,986 |
| Wells Fargo & Co.(a) | 20,220 | 978,850 |
| Total | | 10,815,864 |
| Capital Markets 0.9% |
| E*TRADE Financial Corp. | 11,489 | 582,033 |
| GAM Holding AG(b) | 3,805 | 15,758 |
| Goldman Sachs Group, Inc. (The) | 1,635 | 336,679 |
| Moody’s Corp. | 1,660 | 326,389 |
| Morgan Stanley | 8,790 | 424,117 |
| S&P Global, Inc. | 1,372 | 302,746 |
| TD Ameritrade Holding Corp. | 5,050 | 265,529 |
| Total | | 2,253,251 |
| Consumer Finance 1.0% |
| American Express Co. | 3,233 | 379,005 |
| Capital One Financial Corp. | 2,756 | 255,839 |
| Discover Financial Services | 13,238 | 1,078,765 |
| Navient Corp. | 7,687 | 103,851 |
| SLM Corp. | 32,807 | 333,319 |
| Synchrony Financial | 12,909 | 447,555 |
| Total | | 2,598,334 |
| Diversified Financial Services 0.4% |
| Berkshire Hathaway, Inc., Class B(b) | 4,739 | 1,026,989 |
| Insurance 3.8% |
| Aegon NV | 23,016 | 120,194 |
| Ageas | 819 | 43,174 |
| Alleghany Corp.(b) | 1,059 | 695,636 |
| Allianz SE, Registered Shares | 2,088 | 503,041 |
| Allstate Corp. (The) | 9,347 | 925,914 |
| American International Group, Inc. | 17,499 | 832,427 |
| Aon PLC | 4,256 | 766,676 |
| ASR Nederland NV | 6,492 | 288,345 |
| Assicurazioni Generali SpA | 1,040 | 20,180 |
| Athene Holding Ltd., Class A(a),(b) | 2,086 | 94,204 |
| Chubb Ltd. | 5,175 | 751,410 |
The accompanying Notes to Financial Statements are an integral part of this statement.
| 14 | Multi-Manager Directional Alternative Strategies Fund | Annual Report 2019 |
Portfolio of Investments (continued)
April 30, 2019
| Common Stocks (continued) |
| Issuer | Shares | Value ($) |
| Everest Re Group Ltd. | 2,350 | 553,425 |
| Marsh & McLennan Companies, Inc. | 5,001 | 471,544 |
| MS&AD Insurance Group Holdings, Inc. | 1,100 | 34,192 |
| Muenchener Rueckversicherungs-Gesellschaft AG in Muenchen, Registered Shares(b) | 214 | 53,525 |
| NN Group NV | 2,278 | 99,185 |
| Power Corp. of Canada | 53,800 | 1,234,464 |
| Power Financial Corp. | 16,300 | 388,489 |
| SCOR SE | 9,939 | 405,326 |
| Swiss Life Holding AG, Registered Shares(b) | 36 | 16,927 |
| T&D Holdings, Inc. | 48,300 | 523,142 |
| Talanx AG | 1,416 | 56,571 |
| Travelers Companies, Inc. (The) | 3,066 | 440,737 |
| Unipol Gruppo SpA | 34,355 | 174,784 |
| UnipolSai SpA | 5,311 | 14,547 |
| Zurich Insurance Group AG | 90 | 28,697 |
| Total | | 9,536,756 |
| Total Financials | 26,231,194 |
| Health Care 9.1% |
| Biotechnology 1.7% |
| AbbVie, Inc. | 5,294 | 420,291 |
| Amgen, Inc.(a) | 8,295 | 1,487,459 |
| Biogen, Inc.(b) | 1,865 | 427,533 |
| Gilead Sciences, Inc.(a) | 26,791 | 1,742,487 |
| Swedish Orphan Biovitrum AB(b) | 12,341 | 225,182 |
| United Therapeutics Corp.(a),(b) | 74 | 7,590 |
| Total | | 4,310,542 |
| Health Care Equipment & Supplies 1.8% |
| Baxter International, Inc.(a) | 5,132 | 391,572 |
| Carl Zeiss Meditec AG | 444 | 43,599 |
| DiaSorin SpA | 1,340 | 130,906 |
| Getinge AB, Series CPO | 2,237 | 31,518 |
| GN Store Nord | 7,471 | 382,400 |
| Hoya Corp. | 6,500 | 459,080 |
| IDEXX Laboratories, Inc.(a),(b) | 5,076 | 1,177,632 |
| Koninklijke Philips NV | 919 | 39,132 |
| Medtronic PLC(a) | 19,383 | 1,721,404 |
| Sonova Holding AG | 379 | 76,436 |
| Total | | 4,453,679 |
| Common Stocks (continued) |
| Issuer | Shares | Value ($) |
| Health Care Providers & Services 1.8% |
| AmerisourceBergen Corp. | 3,893 | 291,041 |
| Anthem, Inc. | 2,415 | 635,217 |
| Cigna Corp.(a) | 5,241 | 832,480 |
| CVS Health Corp. | 10,149 | 551,903 |
| Humana, Inc. | 1,322 | 337,652 |
| Laboratory Corp. of America Holdings(b) | 1,791 | 286,417 |
| McKesson Corp. | 3,836 | 457,443 |
| Molina Healthcare, Inc.(b) | 1,710 | 221,667 |
| Quest Diagnostics, Inc. | 3,086 | 297,429 |
| UnitedHealth Group, Inc. | 2,725 | 635,116 |
| Total | | 4,546,365 |
| Life Sciences Tools & Services 0.4% |
| ICON PLC(b) | 2,276 | 310,856 |
| IQVIA Holdings, Inc.(b) | 4,888 | 678,943 |
| Total | | 989,799 |
| Pharmaceuticals 3.4% |
| Bausch Health Companies, Inc.(b) | 790 | 18,245 |
| Eli Lilly & Co.(a) | 13,437 | 1,572,666 |
| H Lundbeck A/S | 16,632 | 699,632 |
| Jazz Pharmaceuticals PLC(b) | 2,562 | 332,471 |
| Johnson & Johnson(a) | 11,703 | 1,652,464 |
| Merck & Co., Inc. | 6,233 | 490,599 |
| Novartis AG, ADR | 2,940 | 241,756 |
| Novo Nordisk A/S, Class B | 8,581 | 419,620 |
| Orion Oyj, Class B | 782 | 25,988 |
| Pfizer, Inc. | 10,933 | 443,989 |
| Roche Holding AG, Genusschein Shares | 10,668 | 2,812,135 |
| UCB SA | 220 | 17,450 |
| Total | | 8,727,015 |
| Total Health Care | 23,027,400 |
| Industrials 10.5% |
| Aerospace & Defense 0.9% |
| Boeing Co. (The) | 2,468 | 932,139 |
| Curtiss-Wright Corp. | 1,537 | 175,126 |
| Leonardo-Finmeccanica SpA | 3,235 | 37,354 |
| United Technologies Corp. | 7,533 | 1,074,281 |
| Total | | 2,218,900 |
The accompanying Notes to Financial Statements are an integral part of this statement.
Multi-Manager Directional Alternative Strategies Fund | Annual Report 2019
| 15 |
Portfolio of Investments (continued)
April 30, 2019
| Common Stocks (continued) |
| Issuer | Shares | Value ($) |
| Air Freight & Logistics 0.4% |
| bpost SA | 7,144 | 85,816 |
| United Parcel Service, Inc., Class B | 7,631 | 810,565 |
| Total | | 896,381 |
| Airlines 1.7% |
| Air Canada(b) | 53,210 | 1,277,326 |
| Deutsche Lufthansa AG, Registered Shares | 50,104 | 1,209,352 |
| Southwest Airlines Co. | 9,816 | 532,322 |
| United Continental Holdings, Inc.(a),(b) | 13,057 | 1,160,245 |
| Total | | 4,179,245 |
| Building Products 0.3% |
| Owens Corning | 9,538 | 489,013 |
| Rockwool International A/S, Class B | 619 | 165,345 |
| Total | | 654,358 |
| Commercial Services & Supplies 0.5% |
| KAR Auction Services, Inc. | 23,420 | 1,322,762 |
| Securitas AB | 1,224 | 21,403 |
| Total | | 1,344,165 |
| Construction & Engineering 0.0% |
| Hochtief AG | 592 | 88,310 |
| Skanska AB, Class B | 721 | 12,556 |
| WSP Global, Inc. | 528 | 28,511 |
| Total | | 129,377 |
| Electrical Equipment 1.0% |
| AMETEK, Inc. | 12,746 | 1,123,815 |
| Eaton Corp. PLC | 9,582 | 793,581 |
| Emerson Electric Co. | 6,628 | 470,522 |
| Signify NV | 8,818 | 264,367 |
| Total | | 2,652,285 |
| Industrial Conglomerates 0.1% |
| Rheinmetall AG | 2,679 | 307,388 |
| Machinery 1.3% |
| Caterpillar, Inc. | 3,140 | 437,779 |
| Dover Corp. | 7,950 | 779,418 |
| Ingersoll-Rand PLC | 3,510 | 430,361 |
| ITT, Inc. | 13,155 | 796,535 |
| KION Group AG | 242 | 16,568 |
| Common Stocks (continued) |
| Issuer | Shares | Value ($) |
| Parker-Hannifin Corp. | 2,125 | 384,795 |
| Pentair PLC | 7,953 | 310,088 |
| Yangzijiang Shipbuilding Holdings Ltd. | 47,200 | 54,572 |
| Total | | 3,210,116 |
| Marine 0.0% |
| AP Moller - Maersk A/S, Class B | 90 | 117,254 |
| Professional Services 0.8% |
| Adecco Group AG, Registered Shares | 3,642 | 209,166 |
| DKSH Holding AG | 218 | 13,382 |
| ManpowerGroup, Inc. | 2,775 | 266,511 |
| Robert Half International, Inc.(a) | 18,318 | 1,137,365 |
| Teleperformance SA(b) | 2,079 | 399,439 |
| Wolters Kluwer NV | 385 | 26,850 |
| Total | | 2,052,713 |
| Road & Rail 2.4% |
| Aurizon Holdings Ltd. | 450,733 | 1,512,438 |
| Central Japan Railway Co. | 3,300 | 709,630 |
| ComfortDelGro Corp., Ltd. | 617,500 | 1,223,073 |
| DSV A/S | 787 | 72,714 |
| Kansas City Southern | 5,589 | 688,230 |
| Kyushu Railway Co. | 9,300 | 303,033 |
| Nippon Express Co., Ltd. | 1,800 | 98,988 |
| Old Dominion Freight Line, Inc.(a) | 3,629 | 541,737 |
| Union Pacific Corp. | 5,423 | 960,088 |
| Total | | 6,109,931 |
| Trading Companies & Distributors 1.1% |
| Air Lease Corp. | 5,012 | 193,263 |
| Finning International, Inc. | 944 | 16,946 |
| HD Supply Holdings, Inc.(b) | 12,113 | 553,443 |
| Marubeni Corp. | 271,300 | 1,944,025 |
| Total | | 2,707,677 |
| Total Industrials | 26,579,790 |
| Information Technology 13.8% |
| Communications Equipment 2.1% |
| Cisco Systems, Inc.(a) | 48,757 | 2,727,954 |
| F5 Networks, Inc.(a),(b) | 6,329 | 993,020 |
| Juniper Networks, Inc.(a) | 33,034 | 917,354 |
| Motorola Solutions, Inc.(a) | 4,009 | 580,944 |
The accompanying Notes to Financial Statements are an integral part of this statement.
| 16 | Multi-Manager Directional Alternative Strategies Fund | Annual Report 2019 |
Portfolio of Investments (continued)
April 30, 2019
| Common Stocks (continued) |
| Issuer | Shares | Value ($) |
| Nokia OYJ | 20,824 | 109,284 |
| Telefonaktiebolaget LM Ericsson, Class B | 14,769 | 146,098 |
| Total | | 5,474,654 |
| Electronic Equipment, Instruments & Components 2.0% |
| Adyen NV(b) | 1,063 | 865,105 |
| Arrow Electronics, Inc.(a),(b) | 11,169 | 943,892 |
| Avnet, Inc. | 12,136 | 589,931 |
| CDW Corp.(a) | 15,962 | 1,685,587 |
| Fingerprint Cards AB, Class B(b) | 44,016 | 64,733 |
| Flex Ltd.(a),(b) | 57,505 | 634,855 |
| Jabil, Inc. | 6,513 | 196,758 |
| Total | | 4,980,861 |
| IT Services 3.3% |
| Alliance Data Systems Corp. | 889 | 142,329 |
| Amdocs Ltd. | 4,840 | 266,587 |
| AtoS | 3,129 | 322,101 |
| Capgemini SE | 6,235 | 755,963 |
| CGI, Inc.(b) | 8,000 | 575,830 |
| DXC Technology Co.(a) | 28,409 | 1,867,608 |
| Leidos Holdings, Inc.(a) | 10,616 | 780,064 |
| Paychex, Inc.(a) | 2,186 | 184,302 |
| Science Applications International Corp. | 4,743 | 355,488 |
| VeriSign, Inc.(a),(b) | 5,990 | 1,182,725 |
| Western Union Co. (The)(a) | 71,359 | 1,387,219 |
| Wirecard AG | 3,323 | 498,310 |
| Total | | 8,318,526 |
| Semiconductors & Semiconductor Equipment 1.4% |
| Broadcom, Inc. | 1,548 | 492,883 |
| Dialog Semiconductor PLC(b) | 5,366 | 207,639 |
| KLA-Tencor Corp.(a) | 14,249 | 1,816,462 |
| Marvell Technology Group Ltd. | 25,200 | 630,504 |
| Qorvo, Inc.(b) | 2,431 | 183,808 |
| STMicroelectronics NV | 5,647 | 103,746 |
| Teladoc Health, Inc. | 1,656 | 112,482 |
| Total | | 3,547,524 |
| Common Stocks (continued) |
| Issuer | Shares | Value ($) |
| Software 3.6% |
| Cadence Design Systems, Inc.(a),(b) | 735 | 50,994 |
| CDK Global, Inc. | 15,399 | 928,868 |
| Citrix Systems, Inc.(a) | 13,321 | 1,344,888 |
| Constellation Software, Inc. | 1,700 | 1,499,977 |
| Fortinet, Inc.(a),(b) | 10,276 | 959,984 |
| Microsoft Corp.(a) | 10,478 | 1,368,427 |
| Open Text Corp. | 17,900 | 688,102 |
| Oracle Corp.(a) | 13,144 | 727,257 |
| SAP SE | 150 | 19,277 |
| Software AG | 4,147 | 157,957 |
| Temenos AG(b) | 2,563 | 426,098 |
| Trend Micro, Inc. | 19,100 | 954,845 |
| Total | | 9,126,674 |
| Technology Hardware, Storage & Peripherals 1.4% |
| Hewlett Packard Enterprise Co. | 39,703 | 627,704 |
| HP, Inc. | 32,753 | 653,422 |
| Konica Minolta, Inc. | 48,000 | 481,999 |
| NetApp, Inc.(a) | 12,972 | 945,010 |
| Xerox Corp.(a) | 22,724 | 758,073 |
| Total | | 3,466,208 |
| Total Information Technology | 34,914,447 |
| Materials 3.4% |
| Chemicals 1.4% |
| Covestro AG | 6,747 | 368,913 |
| DowDuPont, Inc. | 8,754 | 336,591 |
| Evonik Industries AG | 1,657 | 49,362 |
| FMC Corp. | 6,258 | 494,757 |
| Methanex Corp. | 4,895 | 268,335 |
| Mosaic Co. (The) | 26,914 | 702,725 |
| Nutrien Ltd. | 14,692 | 796,013 |
| Showa Denko KK | 6,500 | 221,910 |
| Solvay SA | 284 | 34,131 |
| Trinseo SA | 4,275 | 192,161 |
| Total | | 3,464,898 |
The accompanying Notes to Financial Statements are an integral part of this statement.
Multi-Manager Directional Alternative Strategies Fund | Annual Report 2019
| 17 |
Portfolio of Investments (continued)
April 30, 2019
| Common Stocks (continued) |
| Issuer | Shares | Value ($) |
| Construction Materials 0.2% |
| Cemex SAB de CV, ADR(b) | 6,051 | 27,835 |
| CRH PLC | 11,591 | 386,935 |
| HeidelbergCement AG | 1,453 | 117,337 |
| Total | | 532,107 |
| Containers & Packaging 0.6% |
| Avery Dennison Corp. | 2,628 | 290,788 |
| Graphic Packaging Holding Co. | 62,309 | 864,849 |
| WestRock Co. | 10,544 | 404,679 |
| Total | | 1,560,316 |
| Metals & Mining 1.1% |
| Barrick Gold Corp. | 37,761 | 480,320 |
| Boliden AB | 8,062 | 239,924 |
| Rio Tinto Ltd. | 27,647 | 1,863,474 |
| Salzgitter AG | 2,455 | 80,871 |
| Teck Resources Ltd., Class B | 2,303 | 54,459 |
| Total | | 2,719,048 |
| Paper & Forest Products 0.1% |
| Holmen AB, Class B | 2,324 | 48,874 |
| UPM-Kymmene OYJ | 3,706 | 104,374 |
| West Fraser Timber Co., Ltd. | 5,029 | 258,901 |
| Total | | 412,149 |
| Total Materials | 8,688,518 |
| Real Estate 2.7% |
| Equity Real Estate Investment Trusts (REITS) 2.6% |
| Brookfield Property REIT, Inc.(a) | 29,375 | 611,881 |
| H&R Real Estate Investment Trust | 28,100 | 480,114 |
| HCP, Inc.(a) | 57,363 | 1,708,270 |
| Link REIT (The) | 59,500 | 695,195 |
| Retail Properties of America, Inc., Class A | 15,213 | 186,968 |
| RioCan Real Estate Investment Trust | 74,100 | 1,424,809 |
| SL Green Realty Corp. | 4,501 | 397,618 |
| Smart Real Estate Investment Trust | 37,100 | 938,231 |
| Total | | 6,443,086 |
| Common Stocks (continued) |
| Issuer | Shares | Value ($) |
| Real Estate Management & Development 0.1% |
| Hang Lung Group Ltd. | 31,920 | 95,199 |
| Kerry Properties Ltd. | 46,500 | 199,037 |
| Total | | 294,236 |
| Total Real Estate | 6,737,322 |
| Utilities 2.1% |
| Electric Utilities 0.8% |
| Chubu Electric Power Co., Inc. | 47,300 | 687,815 |
| Enel SpA | 117,279 | 741,755 |
| Kansai Electric Power Co., Inc. (The) | 17,600 | 212,929 |
| Ørsted A/S | 3,506 | 268,416 |
| Red Electrica Corp. SA | 4,717 | 97,797 |
| Total | | 2,008,712 |
| Gas Utilities 0.2% |
| Italgas SpA | 21,241 | 132,461 |
| Osaka Gas Co., Ltd. | 22,800 | 421,775 |
| Total | | 554,236 |
| Independent Power and Renewable Electricity Producers 0.7% |
| AES Corp. (The)(a) | 83,778 | 1,434,279 |
| Vistra Energy Corp | 5,886 | 160,394 |
| Total | | 1,594,673 |
| Multi-Utilities 0.4% |
| A2A SpA | 185,077 | 309,298 |
| Atco Ltd., Class I | 2,805 | 96,208 |
| E.ON SE | 53,965 | 579,124 |
| Hera | 8,322 | 29,626 |
| Total | | 1,014,256 |
| Total Utilities | 5,171,877 |
Total Common Stocks
(Cost $172,296,011) | 192,989,084 |
| Preferred Stocks 0.1% |
| Issuer | | Shares | Value ($) |
| Consumer Discretionary 0.1% |
| Auto Components 0.0% |
| Schaeffler AG | | 1,912 | 16,320 |
The accompanying Notes to Financial Statements are an integral part of this statement.
| 18 | Multi-Manager Directional Alternative Strategies Fund | Annual Report 2019 |
Portfolio of Investments (continued)
April 30, 2019
| Preferred Stocks (continued) |
| Issuer | | Shares | Value ($) |
| Automobiles 0.1% |
| BMW AG | | 2,471 | 182,363 |
| Porsche Automobil Holding SE | | 584 | 40,506 |
| Total | | | 222,869 |
| Total Consumer Discretionary | 239,189 |
Total Preferred Stocks
(Cost $267,993) | 239,189 |
| Money Market Funds 16.0% |
| | Shares | Value ($) |
| Columbia Short-Term Cash Fund, 2.519%(c),(d) | 40,419,610 | 40,415,568 |
Total Money Market Funds
(Cost $40,415,568) | 40,415,568 |
Total Investments
(Cost $212,979,572) | 233,643,841 |
|
| Investments in securities sold short |
| |
| Common Stocks (33.9)% |
| Issuer | Shares | Value ($) |
| Communication Services (1.7)% |
| Diversified Telecommunication Services (0.4)% |
| Cogent Communications Group | (8,297) | (458,243) |
| Elisa OYJ | (1,914) | (81,211) |
| Singapore Telecommunications Ltd. | (25,200) | (58,788) |
| Sunrise Communications Group AG(b) | (530) | (35,188) |
| Telecom Italia SpA(b) | (236,552) | (132,287) |
| Telenor ASA | (617) | (12,387) |
| United Internet AG, Registered Shares | (7,027) | (281,605) |
| Total | | (1,059,709) |
| Entertainment (0.5)% |
| Lions Gate Entertainment Corp. | (14,786) | (215,728) |
| Netflix, Inc.(b) | (1,794) | (664,749) |
| Sea Ltd., ADR(b) | (14,703) | (365,957) |
| Total | | (1,246,434) |
| Interactive Media & Services (0.2)% |
| Adevinta ASA, Class A(b) | (4,741) | (47,820) |
| Scout24 AG(e) | (353) | (18,173) |
| TripAdvisor, Inc.(b) | (2,755) | (146,649) |
| Zillow Group, Inc., Class C(b) | (7,360) | (245,824) |
| Total | | (458,466) |
|
| Common Stocks (continued) |
| Issuer | Shares | Value ($) |
| Media (0.4)% |
| Altice Europe NV, Class A(b) | (44,711) | (141,417) |
| Axel Springer SE | (4,349) | (246,331) |
| Charter Communications, Inc., Class A(b) | (162) | (60,133) |
| Meredith Corp. | (5,254) | (309,986) |
| Nordic Entertainment Group AB, Class B(b) | (149) | (3,797) |
| Pearson PLC | (20,776) | (224,917) |
| Schibsted ASA, Class A | (5,209) | (136,693) |
| Telenet Group Holding NV | (229) | (12,154) |
| Total | | (1,135,428) |
| Wireless Telecommunication Services (0.2)% |
| 1&1 Drillisch AG | (4,635) | (172,802) |
| Millicom International Cellular SA, SDR | (2,760) | (161,438) |
| Tele2 AB, Class B | (13,122) | (175,304) |
| Total | | (509,544) |
| Total Communication Services | (4,409,581) |
| Consumer Discretionary (6.4)% |
| Auto Components (0.8)% |
| Brembo SpA | (11,059) | (145,124) |
| Dorman Products, Inc.(b) | (4,618) | (404,860) |
| Pirelli & C SpA(b),(e) | (36,340) | (265,260) |
| Valeo SA | (30,218) | (1,097,101) |
| Total | | (1,912,345) |
| Automobiles (0.7)% |
| Aston Martin Lagonda Global Holdings PLC(b),(e) | (17,144) | (222,082) |
| Daimler AG, Registered Shares(b) | (4,551) | (297,791) |
| Ferrari NV | (4,618) | (625,431) |
| Tesla, Inc.(b) | (2,841) | (678,118) |
| Total | | (1,823,422) |
| Distributors (0.1)% |
| LKQ Corp.(b) | (7,691) | (231,499) |
| Hotels, Restaurants & Leisure (1.8)% |
| Choice Hotels International, Inc. | (5,308) | (440,776) |
| Cracker Barrel Old Country Store, Inc. | (1,608) | (271,334) |
| Domino’s Pizza, Inc. | (673) | (182,100) |
| Dunkin’ Brands Group, Inc. | (2,843) | (212,173) |
| MGM Resorts International | (38,331) | (1,020,755) |
| Norwegian Cruise Line Holdings Ltd.(b) | (5,435) | (306,480) |
The accompanying Notes to Financial Statements are an integral part of this statement.
Multi-Manager Directional Alternative Strategies Fund | Annual Report 2019
| 19 |
Portfolio of Investments (continued)
April 30, 2019
|
| Common Stocks (continued) |
| Issuer | Shares | Value ($) |
| Restaurant Brands International, Inc. | (298) | (19,450) |
| Shake Shack, Inc., Class A(b) | (4,806) | (294,608) |
| Stars Group, Inc. (The)(b) | (12,595) | (237,666) |
| Texas Roadhouse, Inc. | (3,448) | (186,226) |
| Vail Resorts, Inc. | (1,356) | (310,321) |
| Wynn Resorts Ltd. | (7,768) | (1,122,088) |
| Total | | (4,603,977) |
| Household Durables (0.3)% |
| Husqvarna AB | (17,585) | (160,558) |
| Leggett & Platt, Inc. | (13,431) | (528,644) |
| Whirlpool Corp. | (1,025) | (142,291) |
| Total | | (831,493) |
| Internet & Direct Marketing Retail (1.2)% |
| Delivery Hero SE(b),(e) | (32,400) | (1,493,205) |
| MercadoLibre, Inc.(b) | (1,011) | (489,465) |
| Stitch Fix, Inc., Class A(b) | (8,584) | (228,764) |
| Wayfair, Inc., Class A(b) | (2,162) | (350,568) |
| Zalando SE(b) | (9,720) | (457,228) |
| Total | | (3,019,230) |
| Leisure Products (0.1)% |
| Mattel, Inc.(b) | (18,631) | (227,112) |
| Multiline Retail (0.5)% |
| Dollar Tree, Inc.(b) | (11,198) | (1,246,113) |
| Specialty Retail (0.7)% |
| Carvana Co.(b) | (10,026) | (717,460) |
| Fielmann AG | (1,055) | (74,902) |
| Monro Muffler Brake, Inc. | (7,096) | (594,858) |
| Tiffany & Co. | (2,096) | (225,991) |
| Total | | (1,613,211) |
| Textiles, Apparel & Luxury Goods (0.2)% |
| Cie Financiere Richemont SA, Class A, Registered Shares | (1,374) | (100,459) |
| Under Armour, Inc., Class A(b) | (20,028) | (462,447) |
| Total | | (562,906) |
| Total Consumer Discretionary | (16,071,308) |
|
| Common Stocks (continued) |
| Issuer | Shares | Value ($) |
| Consumer Staples (1.2)% |
| Beverages (0.3)% |
| Anheuser-Busch InBev SA/NV | (179) | (15,913) |
| Davide Campari-Milano SpA | (8,352) | (84,168) |
| MGP Ingredients, Inc. | (2,859) | (251,220) |
| National Beverage Corp. | (3,388) | (189,728) |
| Treasury Wine Estates Ltd. | (21,937) | (266,089) |
| Total | | (807,118) |
| Food & Staples Retailing (0.1)% |
| Casey’s General Stores, Inc. | (1,662) | (219,966) |
| Food Products (0.6)% |
| B&G Foods, Inc. | (4,747) | (123,422) |
| Calbee, Inc. | (7,700) | (213,216) |
| Cal-Maine Foods, Inc. | (5,394) | (221,747) |
| Campbell Soup Co. | (4,998) | (193,373) |
| General Mills, Inc. | (2,910) | (149,778) |
| Hain Celestial Group, Inc. (The)(b) | (13,919) | (303,712) |
| Kikkoman Corp. | (4,100) | (190,917) |
| Wilmar International Ltd. | (5,200) | (13,907) |
| Yamazaki Baking Co., Ltd. | (11,900) | (177,277) |
| Total | | (1,587,349) |
| Household Products (0.1)% |
| Kimberly-Clark de Mexico SAB de SV, Class A(b) | (94,900) | (163,892) |
| Tobacco (0.1)% |
| British American Tobacco PLC | (3,999) | (155,920) |
| Total Consumer Staples | (2,934,245) |
| Energy (4.1)% |
| Energy Equipment & Services (1.2)% |
| Drilling Co. of 1972 A/S (The)(b) | (766) | (58,805) |
| Halliburton Co. | (40,063) | (1,134,985) |
| Helmerich & Payne, Inc. | (8,240) | (482,205) |
| SBM Offshore NV | (7,564) | (140,152) |
| Subsea 7 SA | (8,324) | (105,745) |
| TechnipFMC PLC | (11,878) | (292,080) |
| Tenaris SA | (40,225) | (558,541) |
| US Silica Holdings, Inc. | (18,838) | (298,017) |
| Total | | (3,070,530) |
The accompanying Notes to Financial Statements are an integral part of this statement.
| 20 | Multi-Manager Directional Alternative Strategies Fund | Annual Report 2019 |
Portfolio of Investments (continued)
April 30, 2019
|
| Common Stocks (continued) |
| Issuer | Shares | Value ($) |
| Oil, Gas & Consumable Fuels (2.9)% |
| Antero Midstream Corp. | (11,932) | (145,690) |
| Apache Corp. | (9,021) | (296,881) |
| ARC Resources Ltd. | (46,227) | (293,642) |
| Cameco Corp. | (16,623) | (183,390) |
| Cenovus Energy, Inc. | (21,855) | (216,641) |
| Cheniere Energy, Inc.(b) | (13,873) | (892,728) |
| Chesapeake Energy Corp.(b) | (71,085) | (206,857) |
| Delek U.S. Holdings, Inc. | (4,730) | (175,294) |
| Devon Energy Corporation | (8,005) | (257,281) |
| Diamondback Energy, Inc. | (3,981) | (423,539) |
| Enbridge, Inc. | (6,027) | (222,644) |
| Keyera Corp. | (18,479) | (427,043) |
| Koninklijke Vopak NV | (4,838) | (215,696) |
| Matador Resources Co.(b) | (14,293) | (281,429) |
| Murphy Oil Corp. | (10,231) | (278,692) |
| Noble Energy, Inc. | (36,346) | (983,523) |
| Oil Search Ltd. | (35,066) | (192,037) |
| Peyto Exploration & Development Corp. | (10,103) | (45,624) |
| PrairieSky Royalty, Ltd. | (25,302) | (364,695) |
| Targa Resources Corp. | (593) | (23,809) |
| TransCanada Corp. | (6,769) | (323,287) |
| TransCanada Corp. | (4,937) | (235,629) |
| Vermilion Energy, Inc. | (520) | (13,278) |
| Whitecap Resources, Inc. | (3,642) | (14,653) |
| Whiting Petroleum Corp.(b) | (4,039) | (110,628) |
| Williams Companies, Inc. (The) | (11,716) | (331,914) |
| Total | | (7,156,524) |
| Total Energy | (10,227,054) |
| Financials (4.6)% |
| Banks (2.5)% |
| Aozora Bank Ltd. | (5,600) | (136,828) |
| Banco Bilbao Vizcaya Argentaria SA | (25,248) | (153,428) |
| Banco BPM SpA(b) | (69,992) | (166,426) |
| Bank of Hawaii Corp. | (1,603) | (132,055) |
| Bankinter SA | (23,449) | (187,206) |
| Canadian Western Bank | (9,002) | (201,851) |
| Commonwealth Bank of Australia | (3,344) | (175,745) |
| Community Bank System, Inc. | (7,154) | (475,455) |
|
| Common Stocks (continued) |
| Issuer | Shares | Value ($) |
| Cullen/Frost Bankers, Inc. | (1,286) | (130,773) |
| CVB Financial Corp. | (14,507) | (314,802) |
| First Financial Bankshares, Inc. | (15,551) | (956,698) |
| First Republic Bank | (2,919) | (308,305) |
| Glacier Bancorp, Inc. | (9,010) | (383,736) |
| ICICI Bank Ltd., ADR | (9,274) | (106,187) |
| Independent Bank Corp. | (2,497) | (200,334) |
| Intesa Sanpaolo SpA | (94,666) | (248,137) |
| Nordea Bank Abp | (9,214) | (72,490) |
| Prosperity Bancshares, Inc. | (3,488) | (256,856) |
| Svenska Handelsbanken AB, Class A | (8,759) | (95,675) |
| Trustmark Corp. | (10,081) | (362,513) |
| UMB Financial Corp. | (1,895) | (132,385) |
| UniCredit SpA | (897) | (12,405) |
| Unione di Banche Italiane SpA | (75,260) | (234,664) |
| United Bankshares, Inc. | (7,645) | (299,990) |
| Westamerica Bancorporation | (9,486) | (609,191) |
| Total | | (6,354,135) |
| Capital Markets (1.4)% |
| China International Capital Corp., Ltd., Class H(e) | (57,200) | (123,030) |
| Cohen & Steers, Inc. | (3,297) | (165,345) |
| Credit Suisse Group AG, Registered Shares(b) | (38,871) | (518,814) |
| Deutsche Bank AG | (70,963) | (586,514) |
| Factset Research Systems, Inc. | (843) | (232,558) |
| Focus Financial Partners, Inc., Class A(b) | (6,913) | (259,237) |
| Julius Baer Group Ltd.(b) | (2,751) | (132,616) |
| KKR & Co., Inc., Class A | (10,563) | (258,265) |
| London Stock Exchange Group PLC | (2,883) | (188,498) |
| MarketAxess Holdings, Inc. | (1,817) | (505,726) |
| Nomura Holdings, Inc. | (74,400) | (281,695) |
| WisdomTree Investments, Inc. | (31,785) | (228,852) |
| Total | | (3,481,150) |
| Consumer Finance (0.0)% |
| LendingClub Corp.(b) | (40,064) | (127,404) |
The accompanying Notes to Financial Statements are an integral part of this statement.
Multi-Manager Directional Alternative Strategies Fund | Annual Report 2019
| 21 |
Portfolio of Investments (continued)
April 30, 2019
|
| Common Stocks (continued) |
| Issuer | Shares | Value ($) |
| Diversified Financial Services (0.2)% |
| Element Fleet Management Corp. | (12,334) | (76,506) |
| FGL Holdings | (29,509) | (251,712) |
| Voya Financial, Inc. | (4,469) | (245,303) |
| Total | | (573,521) |
| Insurance (0.4)% |
| American Equity Investment Life Holding Co. | (4,781) | (140,609) |
| CNO Financial Group, Inc. | (11,733) | (194,181) |
| Gjensidige Forsikring ASA | (4,152) | (80,634) |
| Hiscox, Ltd. | (10,759) | (234,858) |
| RLI Corp. | (3,455) | (280,995) |
| Tryg A/S | (1,863) | (56,929) |
| Total | | (988,206) |
| Thrifts & Mortgage Finance (0.1)% |
| New York Community Bancorp, Inc. | (11,031) | (128,291) |
| Total Financials | (11,652,707) |
| Health Care (3.5)% |
| Biotechnology (1.8)% |
| Alkermes PLC(b) | (9,684) | (293,619) |
| Alnylam Pharmaceuticals, Inc.(b) | (9,279) | (828,986) |
| BeiGene Ltd. ADR(b) | (4,614) | (573,197) |
| BioMarin Pharmaceutical, Inc.(b) | (10,748) | (919,276) |
| Genmab A/S(b) | (5,109) | (848,136) |
| Idorsia Ltd.(b) | (3,843) | (75,959) |
| Moderna, Inc.(b) | (8,881) | (231,172) |
| Seattle Genetics, Inc.(b) | (12,075) | (818,443) |
| Total | | (4,588,788) |
| Health Care Equipment & Supplies (0.5)% |
| Align Technology, Inc.(b) | (629) | (204,224) |
| Dentsply Sirona, Inc. | (4,892) | (250,128) |
| Glaukos Corp.(b) | (2,697) | (194,535) |
| Insulet Corp.(b) | (2,986) | (257,542) |
| Nevro Corp.(b) | (5,769) | (356,005) |
| Straumann Holding AG, Registered Shares | (50) | (40,365) |
| Total | | (1,302,799) |
|
| Common Stocks (continued) |
| Issuer | Shares | Value ($) |
| Health Care Providers & Services (0.1)% |
| Covetrus, Inc.(b) | (5,074) | (166,782) |
| Select Medical Holdings Corp.(b) | (10,994) | (157,984) |
| Total | | (324,766) |
| Health Care Technology (0.4)% |
| Cerner Corp.(b) | (3,860) | (256,497) |
| Inovalon Holdings, Inc.(b) | (17,526) | (237,127) |
| Tabula Rasa HealthCare, Inc.(b) | (3,611) | (192,322) |
| Teladoc Health, Inc.(b) | (3,412) | (194,074) |
| Total | | (880,020) |
| Life Sciences Tools & Services (0.1)% |
| Lonza Group AG, Registered Shares(b) | (826) | (255,108) |
| QIAGEN NV(b) | (618) | (23,865) |
| Total | | (278,973) |
| Pharmaceuticals (0.6)% |
| Nektar Therapeutics(b) | (13,726) | (439,507) |
| Takeda Pharmaceutical Co., Ltd. | (19,800) | (730,654) |
| Vifor Pharma AG | (1,660) | (217,000) |
| Total | | (1,387,161) |
| Total Health Care | (8,762,507) |
| Industrials (4.4)% |
| Aerospace & Defense (0.8)% |
| Bombardier, Inc., Class B(b) | (17,759) | (30,356) |
| Elbit Systems Ltd. | (3,432) | (477,701) |
| Rolls-Royce Holdings PLC(b) | (10,847) | (129,366) |
| Rolls-Royce Holdings PLC(b),(f),(g) | (770,137) | (1,004) |
| Saab AB, Class B | (19,401) | (638,679) |
| TransDigm Group, Inc.(b) | (248) | (119,665) |
| Triumph Group, Inc. | (25,067) | (594,840) |
| Total | | (1,991,611) |
| Airlines (0.2)% |
| American Airlines Group, Inc. | (14,144) | (483,442) |
| Building Products (0.5)% |
| AAON, Inc. | (8,129) | (408,157) |
| ASSA ABLOY AB, Class B | (1,345) | (28,753) |
| dormakaba Holding AG(b) | (29) | (21,886) |
The accompanying Notes to Financial Statements are an integral part of this statement.
| 22 | Multi-Manager Directional Alternative Strategies Fund | Annual Report 2019 |
Portfolio of Investments (continued)
April 30, 2019
|
| Common Stocks (continued) |
| Issuer | Shares | Value ($) |
| Geberit AG, Registered Shares | (1,188) | (498,192) |
| Trex Company, Inc.(b) | (6,127) | (424,417) |
| Total | | (1,381,405) |
| Commercial Services & Supplies (0.2)% |
| Bilfinger SE | (818) | (30,184) |
| Cimpress NV(b) | (1,027) | (92,841) |
| Healthcare Services Group, Inc. | (6,221) | (210,581) |
| ISS A/S | (1,086) | (33,773) |
| Ritchie Bros. Auctioneers, Inc. | (3,384) | (117,759) |
| Total | | (485,138) |
| Construction & Engineering (0.2)% |
| Boskalis Westminster | (1,796) | (49,131) |
| MasTec, Inc.(b) | (10,467) | (530,154) |
| SNC-Lavalin Group, Inc. | (739) | (18,424) |
| Total | | (597,709) |
| Electrical Equipment (0.6)% |
| Melrose Industries PLC | (375,806) | (990,883) |
| OSRAM Licht AG | (8,300) | (283,840) |
| Prysmian SpA | (9,827) | (189,468) |
| Total | | (1,464,191) |
| Machinery (1.0)% |
| Epiroc AB, Class A(b) | (1,669) | (17,253) |
| FANUC Corp. | (1,900) | (356,964) |
| GEA Group AG | (7,384) | (206,385) |
| MISUMI Group, Inc. | (42,100) | (1,099,277) |
| OC Oerlikon Corp. AG, Registered Shares | (1,014) | (13,235) |
| Wabtec Corp. | (4,982) | (369,017) |
| Weir Group PLC (The) | (18,459) | (399,451) |
| Total | | (2,461,582) |
| Marine (0.2)% |
| AP Moller - Maersk A/S, Class B | (384) | (500,285) |
| DFDS A/S | (1,001) | (47,491) |
| Total | | (547,776) |
| Professional Services (0.2)% |
| CoStar Group, Inc.(b) | (818) | (405,933) |
| Stantec, Inc. | (2,407) | (60,278) |
| Total | | (466,211) |
|
| Common Stocks (continued) |
| Issuer | Shares | Value ($) |
| Road & Rail (0.2)% |
| DSV A/S | (326) | (30,120) |
| Hertz Global Holdings, Inc.(b) | (32,763) | (595,632) |
| Total | | (625,752) |
| Transportation Infrastructure (0.3)% |
| Fraport AG Frankfurt Airport Services Worldwide | (617) | (51,099) |
| Transurban Group | (63,458) | (600,912) |
| Total | | (652,011) |
| Total Industrials | (11,156,828) |
| Information Technology (3.1)% |
| Communications Equipment (0.1)% |
| Plantronics, Inc. | (4,221) | (217,297) |
| Electronic Equipment, Instruments & Components (0.5)% |
| Knowles Corp.(b) | (27,091) | (511,478) |
| National Instruments Corp. | (7,847) | (369,594) |
| Venture Corp Ltd. | (1,100) | (13,795) |
| Yaskawa Electric Corp. | (11,700) | (435,565) |
| Total | | (1,330,432) |
| IT Services (0.4)% |
| GTT Communications, Inc.(b) | (3,867) | (162,221) |
| LiveRamp Holdings, Inc.(b) | (3,537) | (206,313) |
| MongoDB, Inc.(b) | (1,700) | (239,564) |
| Shopify, Inc., Class A(b) | (1,277) | (310,988) |
| Shopify, Inc., Class A(b) | (74) | (17,993) |
| Total | | (937,079) |
| Semiconductors & Semiconductor Equipment (0.7)% |
| ams AG | (6,281) | (264,999) |
| Cree, Inc.(b) | (6,748) | (445,975) |
| Power Integrations, Inc. | (2,903) | (229,395) |
| STMicroelectronics NV | (18,149) | (333,328) |
| Universal Display Corp. | (2,992) | (477,523) |
| Total | | (1,751,220) |
| Software (1.3)% |
| 2U, Inc.(b) | (5,200) | (314,600) |
| ACI Worldwide, Inc.(b) | (5,796) | (205,874) |
| Avalara, Inc.(b) | (4,862) | (286,226) |
| Blackbaud, Inc. | (3,023) | (239,693) |
| Blackberry Ltd.(b) | (28,700) | (263,285) |
The accompanying Notes to Financial Statements are an integral part of this statement.
Multi-Manager Directional Alternative Strategies Fund | Annual Report 2019
| 23 |
Portfolio of Investments (continued)
April 30, 2019
|
| Common Stocks (continued) |
| Issuer | Shares | Value ($) |
| Guidewire Software, Inc.(b) | (3,392) | (361,248) |
| HubSpot, Inc.(b) | (1,461) | (269,540) |
| Instructure, Inc.(b) | (6,721) | (289,541) |
| Manhattan Associates, Inc.(b) | (6,980) | (470,801) |
| Proofpoint, Inc.(b) | (2,408) | (302,011) |
| Zendesk, Inc.(b) | (3,169) | (278,175) |
| Total | | (3,280,994) |
| Technology Hardware, Storage & Peripherals (0.1)% |
| Pure Storage, Inc., Class A(b) | (16,682) | (381,351) |
| Total Information Technology | (7,898,373) |
| Materials (4.5)% |
| Chemicals (1.5)% |
| Balchem Corp. | (1,396) | (141,708) |
| Christian Hansen Holding A/S | (1,079) | (110,067) |
| Eastman Chemical Co. | (1,227) | (96,786) |
| EMS-Chemie Holding AG, Registered Shares | (35) | (21,193) |
| GCP Applied Technologies(b) | (11,262) | (324,233) |
| Givaudan SA, Registered Shares | (5) | (12,950) |
| HB Fuller Co. | (4,891) | (239,512) |
| International Flavors & Fragrances, Inc. | (2,594) | (357,427) |
| Novozymes A/S, Class B | (563) | (26,237) |
| OCI NV(b) | (706) | (20,469) |
| Quaker Chemical Corp. | (2,432) | (544,330) |
| RPM International, Inc. | (6,069) | (368,085) |
| Sika AG | (4,428) | (677,922) |
| Tokai Carbon Co., Ltd. | (15,400) | (178,203) |
| Umicore SA | (4,596) | (177,843) |
| Yara International ASA | (13,120) | (591,715) |
| Total | | (3,888,680) |
| Construction Materials (0.3)% |
| James Hardie Industries PLC | (19,718) | (268,269) |
| Martin Marietta Materials, Inc. | (1,756) | (389,657) |
| Total | | (657,926) |
|
| Common Stocks (continued) |
| Issuer | Shares | Value ($) |
| Containers & Packaging (0.4)% |
| Ball Corp. | (2,666) | (159,800) |
| BillerudKorsnas AB | (2,368) | (32,190) |
| Greif, Inc., Class A | (9,542) | (377,100) |
| Huhtamaki OYJ | (3,612) | (137,782) |
| Sonoco Products Co. | (4,837) | (305,021) |
| Total | | (1,011,893) |
| Metals & Mining (2.2)% |
| Agnico Eagle Mines Ltd. | (19,911) | (824,559) |
| Barrick Gold Corp. | (89,580) | (1,138,723) |
| Compass Minerals International, Inc. | (5,405) | (310,193) |
| First Quantum Minerals Ltd. | (56,290) | (594,539) |
| Fortescue Metals Group Ltd. | (46,468) | (234,813) |
| Franco-Nevada Corp. | (752) | (53,881) |
| Freeport-McMoRan Copper & Gold, Inc. | (71,857) | (884,560) |
| Gerdau SA, ADR | (84,366) | (302,030) |
| Kinross Gold Corp.(b) | (70,200) | (223,223) |
| Nucor Corp. | (4,364) | (249,054) |
| Outokumpu OYJ | (41,293) | (157,422) |
| Thyssenkrupp AG | (34,188) | (480,658) |
| Wheaton Precious Metals Corp. | (10,342) | (223,715) |
| Yamana Gold, Inc. | (6,184) | (13,571) |
| Total | | (5,690,941) |
| Paper & Forest Products (0.1)% |
| Stora Enso OYJ, Class R | (10,768) | (133,636) |
| Svenska Cellulosa AB SCA, Class B | (2,404) | (20,987) |
| Total | | (154,623) |
| Total Materials | (11,404,063) |
| Real Estate (0.3)% |
| Equity Real Estate Investment Trusts (REITS) (0.2)% |
| Iron Mountain, Inc. | (5,282) | (171,559) |
| Public Storage | (1,782) | (394,143) |
| Total | | (565,702) |
| Real Estate Management & Development (0.1)% |
| Redfin Corp.(b) | (10,967) | (226,798) |
| Total Real Estate | (792,500) |
The accompanying Notes to Financial Statements are an integral part of this statement.
| 24 | Multi-Manager Directional Alternative Strategies Fund | Annual Report 2019 |
Portfolio of Investments (continued)
April 30, 2019
|
| Common Stocks (continued) |
| Issuer | Shares | Value ($) |
| Utilities (0.1)% |
| Gas Utilities (0.1)% |
| AltaGas, Ltd. | (18,128) | (240,994) |
| Multi-Utilities (0.0)% |
| RWE AG(b) | (3,468) | (88,569) |
| Total Utilities | (329,563) |
Total Common Stocks
(Proceeds $81,752,641) | (85,638,729) |
| Preferred Stocks (0.1)% |
| Issuer | | Shares | Value ($) |
| Health Care (0.1)% |
| Health Care Equipment & Supplies (0.1)% |
| Sartorius AG | | (1,125) | (205,926) |
| Total Health Care | (205,926) |
Total Preferred Stocks
(Proceeds $113,983) | (205,926) |
Total Investments in Securities Sold Short
(Proceeds $81,866,624) | (85,844,655) |
| Total Investments in Securities, Net of Securities Sold Short | 147,799,186 |
| Other Assets & Liabilities, Net | | 104,727,875 |
| Net Assets | 252,527,061 |
At April 30, 2019, securities and/or cash totaling $166,837,475 were pledged as collateral.
Investments in derivatives
| Forward foreign currency exchange contracts |
Currency to
be sold | Currency to
be purchased | Counterparty | Settlement
date | Unrealized
appreciation ($) | Unrealized
depreciation ($) |
| 15,000 AUD | 10,662 USD | Citi | 06/19/2019 | 76 | — |
| 163,800 CAD | 123,380 USD | Citi | 06/19/2019 | 959 | — |
| 34,700 CAD | 25,778 USD | Citi | 06/19/2019 | — | (158) |
| 42,000 CHF | 42,038 USD | Citi | 06/19/2019 | 621 | — |
| 1,500 CHF | 1,478 USD | Citi | 06/19/2019 | — | (1) |
| 280,000 DKK | 42,537 USD | Citi | 06/19/2019 | 279 | — |
| 390,500 DKK | 58,796 USD | Citi | 06/19/2019 | — | (139) |
| 1,156,507 EUR | 1,321,944 USD | Citi | 06/19/2019 | 19,278 | — |
| 268,500 EUR | 302,180 USD | Citi | 06/19/2019 | — | (252) |
| 8,000 GBP | 10,460 USD | Citi | 06/19/2019 | — | — |
| 11,500 ILS | 3,198 USD | Citi | 06/19/2019 | — | (9) |
| 4,949,500 JPY | 44,694 USD | Citi | 06/19/2019 | 82 | — |
| 1,175,790 NOK | 137,652 USD | Citi | 06/19/2019 | 1,100 | — |
| 304,710 NOK | 35,149 USD | Citi | 06/19/2019 | — | (239) |
| 3,279,500 SEK | 354,371 USD | Citi | 06/19/2019 | 7,684 | — |
| 9,000 SEK | 949 USD | Citi | 06/19/2019 | — | (2) |
| 7,000 SGD | 5,178 USD | Citi | 06/19/2019 | 27 | — |
| 4,500 SGD | 3,311 USD | Citi | 06/19/2019 | — | — |
| 11,980 USD | 17,000 AUD | Citi | 06/19/2019 | 19 | — |
| 446,836 USD | 626,000 AUD | Citi | 06/19/2019 | — | (5,017) |
| 134,884 USD | 180,730 CAD | Citi | 06/19/2019 | 192 | — |
| 543,110 USD | 717,766 CAD | Citi | 06/19/2019 | — | (6,659) |
The accompanying Notes to Financial Statements are an integral part of this statement.
Multi-Manager Directional Alternative Strategies Fund | Annual Report 2019
| 25 |
Portfolio of Investments (continued)
April 30, 2019
| Forward foreign currency exchange contracts (continued) |
Currency to
be sold | Currency to
be purchased | Counterparty | Settlement
date | Unrealized
appreciation ($) | Unrealized
depreciation ($) |
| 630,480 USD | 625,488 CHF | Citi | 06/19/2019 | — | (13,680) |
| 214,347 USD | 1,397,500 DKK | Citi | 06/19/2019 | — | (3,436) |
| 109,842 USD | 98,000 EUR | Citi | 06/19/2019 | 543 | — |
| 2,493,689 USD | 2,183,493 EUR | Citi | 06/19/2019 | — | (34,247) |
| 51,174 USD | 39,224 GBP | Citi | 06/19/2019 | 108 | — |
| 1,068,885 USD | 809,779 GBP | Citi | 06/19/2019 | — | (10,159) |
| 269,453 USD | 2,107,500 HKD | Citi | 06/19/2019 | — | (609) |
| 19,087 USD | 68,613 ILS | Citi | 06/19/2019 | 45 | — |
| 19,231 USD | 68,889 ILS | Citi | 06/19/2019 | — | (22) |
| 1,607,622 USD | 176,768,500 JPY | Citi | 06/19/2019 | — | (14,327) |
| 17,219 USD | 149,225 NOK | Citi | 06/19/2019 | 111 | — |
| 98,737 USD | 843,275 NOK | Citi | 06/19/2019 | — | (802) |
| 15,377 USD | 22,500 NZD | Citi | 06/19/2019 | — | (336) |
| 843 USD | 8,000 SEK | Citi | 06/19/2019 | 3 | — |
| 274,666 USD | 2,535,000 SEK | Citi | 06/19/2019 | — | (6,683) |
| 91,976 USD | 124,000 SGD | Citi | 06/19/2019 | — | (732) |
| 15,000 AUD | 10,662 USD | JPMorgan | 06/19/2019 | 76 | — |
| 164,200 CAD | 123,680 USD | JPMorgan | 06/19/2019 | 958 | — |
| 34,300 CAD | 25,479 USD | JPMorgan | 06/19/2019 | — | (157) |
| 42,000 CHF | 42,038 USD | JPMorgan | 06/19/2019 | 621 | — |
| 1,500 CHF | 1,478 USD | JPMorgan | 06/19/2019 | — | (1) |
| 280,000 DKK | 42,537 USD | JPMorgan | 06/19/2019 | 279 | — |
| 390,500 DKK | 58,795 USD | JPMorgan | 06/19/2019 | — | (139) |
| 1,156,493 EUR | 1,321,980 USD | JPMorgan | 06/19/2019 | 19,330 | — |
| 268,500 EUR | 302,180 USD | JPMorgan | 06/19/2019 | — | (253) |
| 8,000 GBP | 10,460 USD | JPMorgan | 06/19/2019 | — | — |
| 11,500 ILS | 3,198 USD | JPMorgan | 06/19/2019 | — | (9) |
| 4,949,500 JPY | 44,694 USD | JPMorgan | 06/19/2019 | 82 | — |
| 1,149,380 NOK | 134,583 USD | JPMorgan | 06/19/2019 | 1,099 | — |
| 331,120 NOK | 38,206 USD | JPMorgan | 06/19/2019 | — | (249) |
| 3,279,500 SEK | 354,360 USD | JPMorgan | 06/19/2019 | 7,674 | — |
| 9,000 SEK | 949 USD | JPMorgan | 06/19/2019 | — | (2) |
| 7,000 SGD | 5,178 USD | JPMorgan | 06/19/2019 | 27 | — |
| 4,500 SGD | 3,311 USD | JPMorgan | 06/19/2019 | — | — |
| 11,980 USD | 17,000 AUD | JPMorgan | 06/19/2019 | 19 | — |
| 446,834 USD | 626,000 AUD | JPMorgan | 06/19/2019 | — | (5,014) |
| 118,999 USD | 159,470 CAD | JPMorgan | 06/19/2019 | 187 | — |
| 559,014 USD | 739,034 CAD | JPMorgan | 06/19/2019 | — | (6,667) |
| 630,617 USD | 625,512 CHF | JPMorgan | 06/19/2019 | — | (13,793) |
| 214,323 USD | 1,397,500 DKK | JPMorgan | 06/19/2019 | — | (3,412) |
| 109,842 USD | 98,000 EUR | JPMorgan | 06/19/2019 | 543 | — |
| 2,493,667 USD | 2,183,507 EUR | JPMorgan | 06/19/2019 | — | (34,209) |
| 85,350 USD | 65,373 GBP | JPMorgan | 06/19/2019 | 120 | — |
| 1,034,748 USD | 783,624 GBP | JPMorgan | 06/19/2019 | — | (10,218) |
| 269,452 USD | 2,107,500 HKD | JPMorgan | 06/19/2019 | — | (608) |
| 19,088 USD | 68,612 ILS | JPMorgan | 06/19/2019 | 43 | — |
| 19,230 USD | 68,886 ILS | JPMorgan | 06/19/2019 | — | (22) |
| 1,607,597 USD | 176,768,500 JPY | JPMorgan | 06/19/2019 | — | (14,301) |
| 17,218 USD | 149,225 NOK | JPMorgan | 06/19/2019 | 112 | — |
| 98,743 USD | 843,275 NOK | JPMorgan | 06/19/2019 | — | (808) |
| 15,377 USD | 22,500 NZD | JPMorgan | 06/19/2019 | — | (336) |
| 843 USD | 8,000 SEK | JPMorgan | 06/19/2019 | 3 | — |
| 274,694 USD | 2,535,000 SEK | JPMorgan | 06/19/2019 | — | (6,711) |
| 91,976 USD | 124,000 SGD | JPMorgan | 06/19/2019 | — | (732) |
| Total | | | | 62,300 | (195,150) |
The accompanying Notes to Financial Statements are an integral part of this statement.
| 26 | Multi-Manager Directional Alternative Strategies Fund | Annual Report 2019 |
Portfolio of Investments (continued)
April 30, 2019
| Long futures contracts |
| Description | Number of
contracts | Expiration
date | Trading
currency | Notional
amount | Value/Unrealized
appreciation ($) | Value/Unrealized
depreciation ($) |
| Amsterdam Index | 5 | 05/2019 | EUR | 568,230 | 13,104 | — |
| CAC40 Index | 24 | 05/2019 | EUR | 1,331,160 | 24,698 | — |
| DAX Index | 3 | 06/2019 | EUR | 926,325 | 63,607 | — |
| FTSE 100 Index | 24 | 06/2019 | GBP | 1,769,160 | 96,836 | — |
| FTSE/MIB Index | 3 | 06/2019 | EUR | 321,855 | 24,952 | — |
| Hang Seng Index | 3 | 05/2019 | HKD | 4,420,200 | 913 | — |
| IBEX 35 Index | 4 | 05/2019 | EUR | 382,412 | 5,135 | — |
| MSCI Singapore IX ETS | 4 | 05/2019 | SGD | 151,420 | 1,314 | — |
| OMXS30 Index | 27 | 05/2019 | SEK | 4,506,300 | 14,541 | — |
| S&P 500 E-mini | 160 | 06/2019 | USD | 23,588,000 | 1,413,194 | — |
| S&P/TSX 60 Index | 9 | 06/2019 | CAD | 1,788,120 | 50,216 | — |
| SPI 200 Index | 9 | 06/2019 | AUD | 1,418,400 | 19,888 | — |
| TOPIX Index | 21 | 06/2019 | JPY | 339,150,000 | 13,747 | — |
| Total | | | | | 1,742,145 | — |
| Total return swap contracts |
| Fund receives | Fund pays | Payment
frequency | Counterparty | Maturity
date | Notional
currency | Notional
amount | Value
($) | Periodic
payments
receivable
(payable)
($) | Upfront
payments | Upfront
receipts | Unrealized
appreciation
($) | Unrealized
depreciation
($) |
| Total return on a portfolio of long and short positions† | AUD BBSW 1-month, HKD HIBOR 1-month, or JPY LIBOR 1-month based on the local currencies of the positions within the swap | Monthly | JPMorgan | 01/14/2021 | USD | 51,746,576 | 40,167 | — | — | — | 40,167 | — |
| 1-Month USD LIBOR minus 3.500% | Total return on PT Unilever Indonesia Tbk | Monthly | Macquarie | 09/17/2019 | USD | 191,497 | 17,118 | (76) | — | — | 17,042 | — |
| 1-Month USD LIBOR minus 6.652% | Total return on AU Optronics Corp. | Monthly | Macquarie | 09/17/2019 | USD | 351,758 | 8,067 | (571) | — | — | 7,496 | — |
| 1-Month HKD HIBOR minus 0.912% | Total return on Bank of East Asia Ltd. (The) | Monthly | Macquarie | 09/17/2019 | HKD | 1,630,976 | 6,804 | 98 | — | — | 6,902 | — |
| 1-Month USD LIBOR minus 4.044% | Total return on Celltrion, Inc. | Monthly | Macquarie | 09/17/2019 | USD | 366,994 | 2,508 | (223) | — | — | 2,285 | — |
| 1-Month USD LIBOR minus 5.635% | Total return on Eclat Textile Co., Ltd. | Monthly | Macquarie | 09/17/2019 | USD | 250,717 | (6,603) | (308) | — | — | — | (6,911) |
| Total return on Royal Dutch Shell PLC | 1-Month GBP LIBOR plus 0.500% | Monthly | Macquarie | 09/17/2019 | GBP | 906,200 | (8,619) | (559) | — | — | — | (9,178) |
| 1-Month HKD HIBOR minus 0.500% | Total return on China Resources Beer Holdings Co., Ltd. | Monthly | Macquarie | 09/17/2019 | HKD | 1,934,800 | (9,590) | 155 | — | — | — | (9,435) |
The accompanying Notes to Financial Statements are an integral part of this statement.
Multi-Manager Directional Alternative Strategies Fund | Annual Report 2019
| 27 |
Portfolio of Investments (continued)
April 30, 2019
| Total return swap contracts (continued) |
| Fund receives | Fund pays | Payment
frequency | Counterparty | Maturity
date | Notional
currency | Notional
amount | Value
($) | Periodic
payments
receivable
(payable)
($) | Upfront
payments | Upfront
receipts | Unrealized
appreciation
($) | Unrealized
depreciation
($) |
| 1-Month HKD HIBOR minus 7.000% | Total return on Semiconductor Manufacturing International Corp. | Monthly | Macquarie | 09/17/2019 | HKD | 3,033,874 | (22,381) | (721) | — | — | — | (23,102) |
| Total return on Samsung Electronics Co., Ltd. | 1-Month USD LIBOR plus 0.800% | Monthly | Macquarie | 09/17/2019 | USD | 910,679 | (49,986) | 12,681 | — | — | — | (37,305) |
| 1-Month USD LIBOR minus 0.500% | Total return on AmorePacific Corp. | Monthly | Macquarie | 09/18/2019 | USD | 112,969 | 8,849 | 87 | — | — | 8,936 | — |
| 1-Month USD LIBOR minus 9.000% | Total return on SillaJen, Inc. | Monthly | Macquarie | 09/18/2019 | USD | 143,487 | 2,189 | (364) | — | — | 1,825 | — |
| 1-Month USD LIBOR minus 0.500% | Total return on AmorePacific Corp. | Monthly | Macquarie | 09/19/2019 | USD | 251,023 | 27,365 | 193 | — | — | 27,558 | — |
| Total return on a portfolio of long and short positions† | FEDEF 1-day, EONIA 1-day, or SONIA 1-day based on the local currencies of the positions within the swap | Monthly | Morgan Stanley International | 10/30/2019 | USD | 167,578,072 | 470,434 | — | — | — | 470,434 | — |
| Total | | | | | | | 486,322 | 10,392 | — | — | 582,645 | (85,931) |
| † | By investing in the total return swap contract, the Fund gains exposure to the underlying investments that make up the custom basket/index without having to own the underlying investments directly. The components of the custom basket/index are available on Multi-Manager Directional Alternative Strategies Fund’s page of columbiathreadneedleus.com website. |
| Total return swap contracts on futures |
| Reference instrument* | Counterparty | Expiration
date | Trading
currency | Notional amount
long(short) | Upfront
payments ($) | Upfront
receipts ($) | Value/Unrealized
appreciation
($) | Value/Unrealized
depreciation
($) |
| Swiss Market Index Jun 19 | Morgan Stanley International | 06/2019 | CHF | 1,261,780 | — | — | 25,357 | — |
| * | If the notional amount of the swap contract is long and the swap contract’s value is positive (negative), the Fund will receive (pay) the total return. If the notional amount of the swap contract is short and the swap contract’s value is positive (negative), the Fund will pay (receive) the total return. Receipts and payments occur upon termination of the contract. |
Notes to Portfolio of Investments
| (a) | This security or a portion of this security has been pledged as collateral in connection with investments sold short. |
| (b) | Non-income producing investment. |
| (c) | The rate shown is the seven-day current annualized yield at April 30, 2019. |
The accompanying Notes to Financial Statements are an integral part of this statement.
| 28 | Multi-Manager Directional Alternative Strategies Fund | Annual Report 2019 |
Portfolio of Investments (continued)
April 30, 2019
Notes to Portfolio of Investments (continued)
| (d) | As defined in the Investment Company Act of 1940, an affiliated company is one in which the Fund owns 5% or more of the company’s outstanding voting securities, or a company which is under common ownership or control with the Fund. Holdings and transactions in these affiliated companies during the year ended April 30, 2019 are as follows: |
| Issuer | Beginning
shares | Shares
purchased | Shares
sold | Ending
shares | Realized gain
(loss) —
affiliated
issuers ($) | Net change in
unrealized
appreciation
(depreciation) —
affiliated
issuers ($) | Dividends —
affiliated
issuers ($) | Value —
affiliated
issuers
at end of
period ($) |
| Columbia Short-Term Cash Fund, 2.519% |
| | 50,848,193 | 152,052,252 | (162,480,835) | 40,419,610 | 138 | 223 | 1,109,304 | 40,415,568 |
| (e) | Represents privately placed and other securities and instruments exempt from SEC registration (collectively, private placements), such as Section 4(a)(2) and Rule 144A eligible securities, which are often sold only to qualified institutional buyers. The Fund may invest in private placements determined to be liquid as well as those determined to be illiquid. Private placements may be determined to be liquid under guidelines established by the Fund’s Board of Trustees. At April 30, 2019, the total value of these securities amounted to $2,121,750, which represents 0.84% of total net assets. |
| (f) | Represents fair value as determined in good faith under procedures approved by the Board of Trustees. At April 30, 2019, the total value of these securities amounted to $1,004, which represents less than 0.01% of total net assets. |
| (g) | Valuation based on significant unobservable inputs. |
Abbreviation Legend
| ADR | American Depositary Receipt |
| SDR | Swedish Depositary Receipt |
Currency Legend
| AUD | Australian Dollar |
| CAD | Canada Dollar |
| CHF | Swiss Franc |
| DKK | Danish Krone |
| EUR | Euro |
| GBP | British Pound |
| HKD | Hong Kong Dollar |
| ILS | New Israeli Sheqel |
| JPY | Japanese Yen |
| NOK | Norwegian Krone |
| NZD | New Zealand Dollar |
| SEK | Swedish Krona |
| SGD | Singapore Dollar |
| USD | US Dollar |
Fair value measurements
The Fund categorizes its fair value measurements according to a three-level hierarchy that maximizes the use of observable inputs and minimizes the use of unobservable inputs by prioritizing that the most observable input be used when available. Observable inputs are those that market participants would use in pricing an investment based on market data obtained from sources independent of the reporting entity. Unobservable inputs are those that reflect the Fund’s assumptions about the information market participants would use in pricing an investment. An investment’s level within the fair value hierarchy is based on the lowest level of any input that is deemed significant to the asset’s or liability’s fair value measurement. The input levels are not necessarily an indication of the risk or liquidity associated with investments at that level. For example, certain U.S. government securities are generally high quality and liquid, however, they are reflected as Level 2 because the inputs used to determine fair value may not always be quoted prices in an active market.
Fair value inputs are summarized in the three broad levels listed below:
| ■ | Level 1 — Valuations based on quoted prices for investments in active markets that the Fund has the ability to access at the measurement date. Valuation adjustments are not applied to Level 1 investments. |
| ■ | Level 2 — Valuations based on other significant observable inputs (including quoted prices for similar securities, interest rates, prepayment speeds, credit risks, etc.). |
| ■ | Level 3 — Valuations based on significant unobservable inputs (including the Fund’s own assumptions and judgment in determining the fair value of investments). |
The accompanying Notes to Financial Statements are an integral part of this statement.
Multi-Manager Directional Alternative Strategies Fund | Annual Report 2019
| 29 |
Portfolio of Investments (continued)
April 30, 2019
Fair value measurements (continued)
Inputs that are used in determining fair value of an investment may include price information, credit data, volatility statistics, and other factors. These inputs can be either observable or unobservable. The availability of observable inputs can vary between investments, and is affected by various factors such as the type of investment, and the volume and level of activity for that investment or similar investments in the marketplace. The inputs will be considered by the Investment Manager, along with any other relevant factors in the calculation of an investment’s fair value. The Fund uses prices and inputs that are current as of the measurement date, which may include periods of market dislocations. During these periods, the availability of prices and inputs may be reduced for many investments. This condition could cause an investment to be reclassified between the various levels within the hierarchy.
Foreign equity securities actively traded in markets where there is a significant delay in the local close relative to the New York Stock Exchange are classified as Level 2. The values of these securities may include an adjustment to reflect the impact of significant market movements following the close of local trading, as described in Note 2 to the financial statements – Security valuation.
Certain investments that have been measured at fair value using the net asset value (NAV) per share (or its equivalent) are not categorized in the fair value hierarchy. The fair value amounts presented in the table are intended to reconcile the fair value hierarchy to the amounts presented in the Portfolio of Investments. The Columbia Short-Term Cash Fund seeks to provide shareholders with maximum current income consistent with liquidity and stability of principal. Columbia Short-Term Cash Fund prices its shares with a floating NAV and no longer seeks to maintain a stable NAV.
Investments falling into the Level 3 category are primarily supported by quoted prices from brokers and dealers participating in the market for those investments. However, these may be classified as Level 3 investments due to lack of market transparency and corroboration to support these quoted prices. Additionally, valuation models may be used as the pricing source for any remaining investments classified as Level 3. These models may rely on one or more significant unobservable inputs and/or significant assumptions by the Investment Manager. Inputs used in valuations may include, but are not limited to, financial statement analysis, capital account balances, discount rates and estimated cash flows, and comparable company data.
Under the direction of the Fund’s Board of Trustees (the Board), the Investment Manager’s Valuation Committee (the Committee) is responsible for overseeing the valuation procedures approved by the Board. The Committee consists of voting and non-voting members from various groups within the Investment Manager’s organization, including operations and accounting, trading and investments, compliance, risk management and legal.
The Committee meets at least monthly to review and approve valuation matters, which may include a description of specific valuation determinations, data regarding pricing information received from approved pricing vendors and brokers and the results of Board-approved valuation control policies and procedures (the Policies). The Policies address, among other things, instances when market quotations are or are not readily available, including recommendations of third party pricing vendors and a determination of appropriate pricing methodologies; events that require specific valuation determinations and assessment of fair value techniques; securities with a potential for stale pricing, including those that are illiquid, restricted, or in default; and the effectiveness of third party pricing vendors, including periodic reviews of vendors. The Committee meets more frequently, as needed, to discuss additional valuation matters, which may include the need to review back-testing results, review time-sensitive information or approve related valuation actions. The Committee reports to the Board, with members of the Committee meeting with the Board at each of its regularly scheduled meetings to discuss valuation matters and actions during the period, similar to those described earlier.
For investments categorized as Level 3, the Committee monitors information similar to that described above, which may include: (i) data specific to the issuer or comparable issuers, (ii) general market or specific sector news and (iii) quoted prices and specific or similar security transactions. The Committee considers this data and any changes from prior periods in order to assess the reasonableness of observable and unobservable inputs, any assumptions or internal models used to value those securities and changes in fair value. This data is also used to corroborate, when available, information received from approved pricing vendors and brokers. Various factors impact the frequency of monitoring this information (which may occur as often as daily). However, the Committee may determine that changes to inputs, assumptions and models are not required as a result of the monitoring procedures performed.
The following table is a summary of the inputs used to value the Fund’s investments at April 30, 2019:
| | Level 1
quoted prices
in active
markets for
identical
assets ($) | Level 2
other
significant
observable
inputs ($) | Level 3
significant
unobservable
inputs ($) | Investments
measured at
net asset
value ($) | Total ($) |
| Investments in Securities | | | | | |
| Common Stocks | | | | | |
| Communication Services | 10,487,579 | 1,134,922 | — | — | 11,622,501 |
| Consumer Discretionary | 19,254,757 | 6,232,421 | — | — | 25,487,178 |
| Consumer Staples | 10,975,847 | 2,618,624 | — | — | 13,594,471 |
| Energy | 7,301,238 | 3,633,148 | — | — | 10,934,386 |
| Financials | 22,678,939 | 3,552,255 | — | — | 26,231,194 |
| Health Care | 17,664,322 | 5,363,078 | — | — | 23,027,400 |
| Industrials | 17,686,767 | 8,893,023 | — | — | 26,579,790 |
| Information Technology | 29,688,810 | 5,225,637 | — | — | 34,914,447 |
| Materials | 5,172,413 | 3,516,105 | — | — | 8,688,518 |
| Real Estate | 5,747,891 | 989,431 | — | — | 6,737,322 |
| Utilities | 1,690,881 | 3,480,996 | — | — | 5,171,877 |
| Total Common Stocks | 148,349,444 | 44,639,640 | — | — | 192,989,084 |
| Preferred Stocks | | | | | |
| Consumer Discretionary | — | 239,189 | — | — | 239,189 |
| Money Market Funds | — | — | — | 40,415,568 | 40,415,568 |
| Total Investments in Securities | 148,349,444 | 44,878,829 | — | 40,415,568 | 233,643,841 |
The accompanying Notes to Financial Statements are an integral part of this statement.
| 30 | Multi-Manager Directional Alternative Strategies Fund | Annual Report 2019 |
Portfolio of Investments (continued)
April 30, 2019
Fair value measurements (continued)
| | Level 1
quoted prices
in active
markets for
identical
assets ($) | Level 2
other
significant
observable
inputs ($) | Level 3
significant
unobservable
inputs ($) | Investments
measured at
net asset
value ($) | Total ($) |
| Investments in Securities Sold Short | | | | | |
| Common Stocks | | | | | |
| Communication Services | (2,467,269) | (1,942,312) | — | — | (4,409,581) |
| Consumer Discretionary | (11,132,167) | (4,939,141) | — | — | (16,071,308) |
| Consumer Staples | (1,816,838) | (1,117,407) | — | — | (2,934,245) |
| Energy | (8,956,078) | (1,270,976) | — | — | (10,227,054) |
| Financials | (7,966,115) | (3,686,592) | — | — | (11,652,707) |
| Health Care | (6,571,420) | (2,191,087) | — | — | (8,762,507) |
| Industrials | (4,461,496) | (6,694,328) | (1,004) | — | (11,156,828) |
| Information Technology | (6,850,686) | (1,047,687) | — | — | (7,898,373) |
| Materials | (8,121,707) | (3,282,356) | — | — | (11,404,063) |
| Real Estate | (792,500) | — | — | — | (792,500) |
| Utilities | (240,994) | (88,569) | — | — | (329,563) |
| Total Common Stocks | (59,377,270) | (26,260,455) | (1,004) | — | (85,638,729) |
| Preferred Stocks | | | | | |
| Health Care | — | (205,926) | — | — | (205,926) |
| Total Investments in Securities Sold Short | (59,377,270) | (26,466,381) | (1,004) | — | (85,844,655) |
| Total Investments in Securities, Net of Securities Sold Short | 88,972,174 | 18,412,448 | (1,004) | 40,415,568 | 147,799,186 |
| Investments in Derivatives | | | | | |
| Asset | | | | | |
| Forward Foreign Currency Exchange Contracts | — | 62,300 | — | — | 62,300 |
| Futures Contracts | 1,742,145 | — | — | — | 1,742,145 |
| Swap Contracts | — | 608,002 | — | — | 608,002 |
| Liability | | | | | |
| Forward Foreign Currency Exchange Contracts | — | (195,150) | — | — | (195,150) |
| Swap Contracts | — | (85,931) | — | — | (85,931) |
| Total | 90,714,319 | 18,801,669 | (1,004) | 40,415,568 | 149,930,552 |
See the Portfolio of Investments for all investment classifications not indicated in the table.
The Fund’s assets assigned to the Level 2 input category are generally valued using the market approach, in which a security’s value is determined through reference to prices and information from market transactions for similar or identical assets. These assets include certain foreign securities for which a third party statistical pricing service may be employed for purposes of fair market valuation. The model utilized by such third party statistical pricing service takes into account a security’s correlation to available market data including, but not limited to, intraday index, ADR, and exchange-traded fund movements.
Derivative instruments are valued at unrealized appreciation (depreciation).
There were no transfers of financial assets between levels during the period.
The Fund does not hold any significant investments (greater than one percent of net assets) categorized as Level 3.
The Fund’s assets assigned to the Level 3 category are valued utilizing the valuation technique deemed the most appropriate in the circumstances. Certain common stocks classified as Level 3 are valued using an income approach. To determine fair value for these securities, management considered estimates of future distributions from the company assets or potential actions related to the respective company’s restructuring. Significant increases (decreases) to any of these inputs would result in a significantly higher (lower) fair value measurement.
The accompanying Notes to Financial Statements are an integral part of this statement.
Multi-Manager Directional Alternative Strategies Fund | Annual Report 2019
| 31 |
Statement of Assets and Liabilities
April 30, 2019
| Assets | |
| Investments in securities, at value | |
| Unaffiliated issuers (cost $172,564,004) | $193,228,273 |
| Affiliated issuers (cost $40,415,568) | 40,415,568 |
| Cash | 250,000 |
| Foreign currency (cost $197,966) | 198,308 |
| Cash collateral held at broker for: | |
| Forward foreign currency exchange contracts | 240,000 |
| Swap contracts | 10,860,000 |
| Securities sold short | 87,465,612 |
| Other(a) | 3,240,000 |
| Margin deposits on: | |
| Futures contracts | 1,749,965 |
| Unrealized appreciation on forward foreign currency exchange contracts | 62,300 |
| Unrealized appreciation on swap contracts | 608,002 |
| Receivable for: | |
| Investments sold | 1,374,705 |
| Capital shares sold | 66,852 |
| Dividends | 333,141 |
| Foreign tax reclaims | 235,826 |
| Variation margin for futures contracts | 57,277 |
| Expense reimbursement due from Investment Manager | 376 |
| Prepaid expenses | 362 |
| Trustees’ deferred compensation plan | 17,797 |
| Total assets | 340,404,364 |
| Liabilities | |
| Securities sold short, at value (proceeds $81,866,624) | 85,844,655 |
| Unrealized depreciation on forward foreign currency exchange contracts | 195,150 |
| Unrealized depreciation on swap contracts | 85,931 |
| Cash collateral due to broker for: | |
| Swap contracts | 40,000 |
| Payable for: | |
| Investments purchased | 980,869 |
| Capital shares purchased | 471,667 |
| Dividends and interest on securities sold short | 16,518 |
| Variation margin for futures contracts | 23,416 |
| Management services fees | 11,046 |
| Distribution and/or service fees | 4 |
| Transfer agent fees | 46,456 |
| Compensation of chief compliance officer | 10 |
| Other expenses | 143,784 |
| Trustees’ deferred compensation plan | 17,797 |
| Total liabilities | 87,877,303 |
| Net assets applicable to outstanding capital stock | $252,527,061 |
| Represented by | |
| Paid in capital | 242,523,808 |
| Total distributable earnings (loss) (Note 2) | 10,003,253 |
| Total - representing net assets applicable to outstanding capital stock | $252,527,061 |
| Class A | |
| Net assets | $551,279 |
| Shares outstanding | 80,660 |
| Net asset value per share | $6.83 |
| Institutional Class | |
| Net assets | $251,975,782 |
| Shares outstanding | 37,186,871 |
| Net asset value per share | $6.78 |
| (a) | Includes collateral related to forward foreign currency exchange contracts and swap contracts. |
The accompanying Notes to Financial Statements are an integral part of this statement.
| 32 | Multi-Manager Directional Alternative Strategies Fund | Annual Report 2019 |
Statement of Operations
Year Ended April 30, 2019
| Net investment income | |
| Income: | |
| Dividends — unaffiliated issuers | $4,562,137 |
| Dividends — affiliated issuers | 1,109,304 |
| Foreign taxes withheld | (204,741) |
| Total income | 5,466,700 |
| Expenses: | |
| Management services fees | 4,348,923 |
| Distribution and/or service fees | |
| Class A | 1,629 |
| Transfer agent fees | |
| Class A | 1,430 |
| Institutional Class | 604,449 |
| Compensation of board members | 17,918 |
| Custodian fees | 161,141 |
| Printing and postage fees | 63,859 |
| Registration fees | 55,209 |
| Audit fees | 72,674 |
| Legal fees | 4,094 |
| Interest on collateral | 4,605 |
| Dividends and interest on securities sold short | 518,590 |
| Interest on interfund lending | 68 |
| Compensation of chief compliance officer | 94 |
| Other | 22,649 |
| Total expenses | 5,877,332 |
| Fees waived or expenses reimbursed by Investment Manager and its affiliates | (122,083) |
| Total net expenses | 5,755,249 |
| Net investment loss | (288,549) |
| Realized and unrealized gain (loss) — net | |
| Net realized gain (loss) on: | |
| Investments — unaffiliated issuers | 7,615,507 |
| Investments — affiliated issuers | 138 |
| Foreign currency translations | (232,032) |
| Forward foreign currency exchange contracts | (1,123,225) |
| Futures contracts | 430,288 |
| Securities sold short | (2,709,552) |
| Swap contracts | (14,200,172) |
| Net realized loss | (10,219,048) |
| Net change in unrealized appreciation (depreciation) on: | |
| Investments — unaffiliated issuers | (8,449,819) |
| Investments — affiliated issuers | 223 |
| Foreign currency translations | (498,750) |
| Forward foreign currency exchange contracts | 195,554 |
| Futures contracts | 2,310,249 |
| Securities sold short | (2,827,238) |
| Swap contracts | 2,645,410 |
| Net change in unrealized appreciation (depreciation) | (6,624,371) |
| Net realized and unrealized loss | (16,843,419) |
| Net decrease in net assets resulting from operations | $(17,131,968) |
The accompanying Notes to Financial Statements are an integral part of this statement.
Multi-Manager Directional Alternative Strategies Fund | Annual Report 2019
| 33 |
Statement of Changes in Net Assets
| | Year Ended
April 30, 2019 | Year Ended
April 30, 2018 |
| Operations | | |
| Net investment loss | $(288,549) | $(7,801,885) |
| Net realized gain (loss) | (10,219,048) | 122,171,889 |
| Net change in unrealized appreciation (depreciation) | (6,624,371) | (16,972,005) |
| Net increase (decrease) in net assets resulting from operations | (17,131,968) | 97,397,999 |
| Distributions to shareholders | | |
| Net investment income and net realized gains | | |
| Class A | (189,050) | |
| Institutional Class | (83,603,094) | |
| Net investment income | | |
| Class A | | (11,114) |
| Institutional Class | | (16,920,019) |
| Net realized gains | | |
| Class A | | (35,856) |
| Institutional Class | | (41,542,556) |
| Total distributions to shareholders (Note 2) | (83,792,144) | (58,509,545) |
| Increase (decrease) in net assets from capital stock activity | 61,979,998 | (799,308,117) |
| Total decrease in net assets | (38,944,114) | (760,419,663) |
| Net assets at beginning of year | 291,471,175 | 1,051,890,838 |
| Net assets at end of year | $252,527,061 | $291,471,175 |
| Undistributed (excess of distributions over) net investment income | $(4,448,821) | $3,694,808 |
| | Year Ended | Year Ended |
| | April 30, 2019 | April 30, 2018 |
| | Shares | Dollars ($) | Shares | Dollars ($) |
| Capital stock activity |
| Class A | | | | |
| Subscriptions | — | — | 11,118 | 119,634 |
| Distributions reinvested | 29,324 | 188,262 | 4,170 | 46,285 |
| Redemptions | (22,791) | (209,098) | (123,701) | (1,343,721) |
| Net increase (decrease) | 6,533 | (20,836) | (108,413) | (1,177,802) |
| Institutional Class | | | | |
| Subscriptions | 4,880,707 | 44,234,851 | 13,102,353 | 145,580,451 |
| Distributions reinvested | 13,082,815 | 83,599,187 | 5,285,933 | 58,462,427 |
| Redemptions | (7,630,906) | (65,833,204) | (90,567,409) | (1,002,173,193) |
| Net increase (decrease) | 10,332,616 | 62,000,834 | (72,179,123) | (798,130,315) |
| Total net increase (decrease) | 10,339,149 | 61,979,998 | (72,287,536) | (799,308,117) |
The accompanying Notes to Financial Statements are an integral part of this statement.
| 34 | Multi-Manager Directional Alternative Strategies Fund | Annual Report 2019 |
[THIS PAGE INTENTIONALLY LEFT BLANK]
Multi-Manager Directional Alternative Strategies Fund | Annual Report 2019
| 35 |
The following table is intended to help you understand the Fund’s financial performance. Certain information reflects financial results for a single share of a class held for the periods shown. Per share net investment income (loss) amounts are calculated based on average shares outstanding during the period. Total return assumes reinvestment of all dividends and distributions, if any. Total return does not reflect payment of sales charges, if any. Total return and portfolio turnover are not annualized for periods of less than one year. The portfolio turnover rate is calculated without regard to purchase and sales transactions of short-term instruments and certain derivatives, if any. If such transactions were included, the Fund’s portfolio turnover rate may be higher.
| | Net asset value,
beginning of
period | Net
investment
income
(loss) | Net
realized
and
unrealized
gain (loss) | Total from
investment
operations | Distributions
from net
investment
income | Distributions
from net
realized
gains | Total
distributions to
shareholders |
| Class A |
| Year Ended 4/30/2019 | $10.86 | (0.03) | (0.78) | (0.81) | (0.05) | (3.17) | (3.22) |
| Year Ended 4/30/2018 | $10.62 | (0.11) | 0.91 | 0.80 | (0.13) | (0.43) | (0.56) |
| Year Ended 4/30/2017(f) | $10.00 | (0.07) | 0.70 | 0.63 | (0.01) | — | (0.01) |
| Institutional Class |
| Year Ended 4/30/2019 | $10.82 | (0.01) | (0.80) | (0.81) | (0.06) | (3.17) | (3.23) |
| Year Ended 4/30/2018 | $10.60 | (0.09) | 0.92 | 0.83 | (0.18) | (0.43) | (0.61) |
| Year Ended 4/30/2017(h) | $10.25 | (0.01) | 0.36 | 0.35 | — | — | — |
| Notes to Financial Highlights |
| (a) | In addition to the fees and expenses that the Fund bears directly, the Fund indirectly bears a pro rata share of the fees and expenses of any other funds in which it invests. Such indirect expenses are not included in the Fund’s reported expense ratios. |
| (b) | Total net expenses include the impact of certain fee waivers/expense reimbursements made by the Investment Manager and certain of its affiliates, if applicable. |
| (c) | Ratios include dividends and interest on securities sold short. If dividends and interest on securities sold short had been excluded, expenses would have been lower by: |
| Class | 4/30/2019 | 4/30/2018 | 4/30/2017 |
| Class A | 0.20% | 0.47% | 0.54% |
| Institutional Class | 0.19% | 0.40% | 0.46% |
| (d) | Ratios include interest on collateral expense which is less than 0.01%. |
| (e) | Ratios include interfund lending expense which is less than 0.01%. |
| (f) | Class A shares commenced operations on October 17, 2016. Per share data and total return reflect activity from that date. |
| (g) | Annualized. |
| (h) | Institutional Class shares commenced operations on January 3, 2017. Per share data and total return reflect activity from that date. |
The accompanying Notes to Financial Statements are an integral part of this statement.
| 36 | Multi-Manager Directional Alternative Strategies Fund | Annual Report 2019 |
Financial Highlights (continued)
| | Net
asset
value,
end of
period | Total
return | Total gross
expense
ratio to
average
net assets(a) | Total net
expense
ratio to
average
net assets(a),(b) | Net investment
income (loss)
ratio to
average
net assets | Portfolio
turnover | Net
assets,
end of
period
(000’s) |
| Class A |
| Year Ended 4/30/2019 | $6.83 | (5.55%) | 2.42%(c),(d),(e) | 2.38%(c),(d),(e) | (0.38%) | 48% | $551 |
| Year Ended 4/30/2018 | $10.86 | 7.46% | 2.61%(c) | 2.61%(c) | (0.98%) | 158% | $805 |
| Year Ended 4/30/2017(f) | $10.62 | 6.27% | 2.82%(c),(g) | 2.81%(c),(g) | (1.32%)(g) | 100% | $1,939 |
| Institutional Class |
| Year Ended 4/30/2019 | $6.78 | (5.65%) | 2.16%(c),(d),(e) | 2.12%(c),(d),(e) | (0.11%) | 48% | $251,976 |
| Year Ended 4/30/2018 | $10.82 | 7.67% | 2.36%(c) | 2.36%(c) | (0.83%) | 158% | $290,666 |
| Year Ended 4/30/2017(h) | $10.60 | 3.41% | 2.49%(c),(g) | 2.29%(c),(g) | (0.05%)(g) | 100% | $1,049,952 |
The accompanying Notes to Financial Statements are an integral part of this statement.
Multi-Manager Directional Alternative Strategies Fund | Annual Report 2019
| 37 |
Notes to Financial Statements
April 30, 2019
Note 1. Organization
Multi-Manager Directional Alternative Strategies Fund (the Fund), a series of Columbia Funds Series Trust I (the Trust), is a non-diversified fund. The Trust is registered under the Investment Company Act of 1940, as amended (the 1940 Act), as an open-end management investment company organized as a Massachusetts business trust.
Fund shares
The Trust may issue an unlimited number of shares (without par value). The Fund is offered only through certain wrap fee programs sponsored and/or managed by Ameriprise Financial, Inc. (Ameriprise Financial) or its affiliates. The Fund offers each of the share classes identified below.
Class A shares are not subject to any front-end sales charge or contingent deferred sales charge.
Institutional Class shares are not subject to any front-end sales charge or contingent deferred sales charge.
Note 2. Summary of significant accounting policies
Basis of preparation
The Fund is an investment company that applies the accounting and reporting guidance in the Financial Accounting Standards Board (FASB) Accounting Standards Codification Topic 946,Financial Services - Investment Companies (ASC 946). The financial statements are prepared in accordance with U.S. generally accepted accounting principles (GAAP), which requires management to make certain estimates and assumptions that affect the reported amounts of assets and liabilities, the disclosure of contingent assets and liabilities at the date of the financial statements and the reported amounts of income and expenses during the reporting period. Actual results could differ from those estimates.
The following is a summary of significant accounting policies followed by the Fund in the preparation of its financial statements.
Security valuation
All equity securities are valued at the close of business of the New York Stock Exchange. Equity securities are valued at the last quoted sales price on the principal exchange or market on which they trade, except for securities traded on the NASDAQ Stock Market, which are valued at the NASDAQ official close price. Unlisted securities or listed securities for which there were no sales during the day are valued at the mean of the latest quoted bid and ask prices on such exchanges or markets.
Foreign equity securities are valued based on the closing price on the foreign exchange in which such securities are primarily traded. If any foreign equity security closing prices are not readily available, the securities are valued at the mean of the latest quoted bid and ask prices on such exchanges or markets. Foreign currency exchange rates are generally determined at 4:00 p.m. Eastern (U.S.) time. Many securities markets and exchanges outside the U.S. close prior to the close of the New York Stock Exchange; therefore, the closing prices for securities in such markets or on such exchanges may not fully reflect events that occur after such close but before the close of the New York Stock Exchange. In those situations, foreign securities will be fair valued pursuant to a policy adopted by the Board of Trustees, including, if available, utilizing a third party pricing service to determine these fair values. The third party pricing service takes into account multiple factors, including, but not limited to, movements in the U.S. securities markets, certain depositary receipts, futures contracts and foreign exchange rates that have occurred subsequent to the close of the foreign exchange or market, to determine a good faith estimate that reasonably reflects the current market conditions as of the close of the New York Stock Exchange. The fair value of a security is likely to be different from the quoted or published price, if available.
Investments in open-end investment companies, including money market funds, are valued at their latest net asset value.
Forward foreign currency exchange contracts are marked-to-market based upon foreign currency exchange rates provided by a pricing service.
Futures and options on futures contracts are valued based upon the settlement price at the close of regular trading on their principal exchanges or, in the absence of transactions, at the mean of the latest quoted bid and ask prices.
| 38 | Multi-Manager Directional Alternative Strategies Fund | Annual Report 2019 |
Notes to Financial Statements (continued)
April 30, 2019
Swap transactions are valued through an independent pricing service or broker, or if neither is available, through an internal model based upon observable inputs.
Investments for which market quotations are not readily available, or that have quotations which management believes are not reflective of market value or reliable, are valued at fair value as determined in good faith under procedures approved by and under the general supervision of the Board of Trustees. If a security or class of securities (such as foreign securities) is valued at fair value, such value is likely to be different from the quoted or published price for the security.
The determination of fair value often requires significant judgment. To determine fair value, management may use assumptions including but not limited to future cash flows and estimated risk premiums. Multiple inputs from various sources may be used to determine fair value.
GAAP requires disclosure regarding the inputs and valuation techniques used to measure fair value and any changes in valuation inputs or techniques. In addition, investments shall be disclosed by major category. This information is disclosed following the Fund’s Portfolio of Investments.
Foreign currency transactions and translations
The values of all assets and liabilities denominated in foreign currencies are generally translated into U.S. dollars at exchange rates determined at the close of regular trading on the New York Stock Exchange. Net realized and unrealized gains (losses) on foreign currency transactions and translations include gains (losses) arising from the fluctuation in exchange rates between trade and settlement dates on securities transactions, gains (losses) arising from the disposition of foreign currency and currency gains (losses) between the accrual and payment dates on dividends, interest income and foreign withholding taxes.
For financial statement purposes, the Fund does not distinguish that portion of gains (losses) on investments which is due to changes in foreign exchange rates from that which is due to changes in market prices of the investments. Such fluctuations are included with the net realized and unrealized gains (losses) on investments in the Statement of Operations.
Derivative instruments
The Fund invests in certain derivative instruments, as detailed below, to meet its investment objectives. Derivatives are instruments whose values depend on, or are derived from, in whole or in part, the value of one or more securities, currencies, commodities, indices, or other assets or instruments. Derivatives may be used to increase investment flexibility (including to maintain cash reserves while maintaining desired exposure to certain assets), for risk management (hedging) purposes, to facilitate trading, to reduce transaction costs and to pursue higher investment returns. The Fund may also use derivative instruments to mitigate certain investment risks, such as foreign currency exchange rate risk, interest rate risk and credit risk. Derivatives may involve various risks, including the potential inability of the counterparty to fulfill its obligations under the terms of the contract, the potential for an illiquid secondary market (making it difficult for the Fund to sell or terminate, including at favorable prices) and the potential for market movements which may expose the Fund to gains or losses in excess of the amount shown in the Statement of Assets and Liabilities. The notional amounts of derivative instruments, if applicable, are not recorded in the financial statements.
A derivative instrument may suffer a marked-to-market loss if the value of the contract decreases due to an unfavorable change in the market rates or values of the underlying instrument. Losses can also occur if the counterparty does not perform its obligations under the contract. The Fund’s risk of loss from counterparty credit risk on over-the-counter derivatives is generally limited to the aggregate unrealized gain netted against any collateral held by the Fund and the amount of any variation margin held by the counterparty, plus any replacement costs or related amounts. With exchange-traded or centrally cleared derivatives, there is reduced counterparty credit risk to the Fund since the clearinghouse or central counterparty (CCP) provides some protection in the case of clearing member default. The clearinghouse or CCP stands between the buyer and the seller of the contract; therefore, additional counterparty credit risk is failure of the clearinghouse or CCP. However, credit risk still exists in exchange-traded or centrally cleared derivatives with respect to initial and variation margin that is held in a broker’s customer account. While brokers are required to segregate customer margin from their own assets, in the event that a broker becomes insolvent or goes into bankruptcy and at that time there is a shortfall in the aggregate amount of margin held by the broker for all its clients, U.S. bankruptcy laws will typically allocate that shortfall on a pro-rata basis across all the broker’s customers (including the Fund), potentially resulting in losses to the Fund.
Multi-Manager Directional Alternative Strategies Fund | Annual Report 2019
| 39 |
Notes to Financial Statements (continued)
April 30, 2019
In order to better define its contractual rights and to secure rights that will help the Fund mitigate its counterparty risk, the Fund may enter into an International Swaps and Derivatives Association, Inc. Master Agreement (ISDA Master Agreement) or similar agreement with its derivatives contract counterparties. An ISDA Master Agreement is an agreement between the Fund and a counterparty that governs over-the-counter derivatives and typically contains, among other things, collateral posting terms and netting provisions in the event of a default and/or termination event. Under an ISDA Master Agreement, the Fund may, under certain circumstances, offset with the counterparty certain derivative instrument’s payables and/or receivables with collateral held and/or posted and create one single net payment. The provisions of the ISDA Master Agreement typically permit a single net payment in the event of default (close-out netting), including the bankruptcy or insolvency of the counterparty. Note, however, that bankruptcy or insolvency laws of a particular jurisdiction may impose restrictions on or prohibitions against the right of offset or netting in bankruptcy, insolvency or other events.
Collateral (margin) requirements differ by type of derivative. Margin requirements are established by the clearinghouse or CCP for exchange-traded and centrally cleared derivatives. Brokers can ask for margin in excess of the minimum in certain circumstances. Collateral terms are contract specific for over-the-counter derivatives. For over-the-counter derivatives traded under an ISDA Master Agreement, the collateral requirements are typically calculated by netting the marked-to-market amount for each transaction under such agreement and comparing that amount to the value of any variation margin currently pledged by the Fund and/or the counterparty. Generally, the amount of collateral due from or to a party has to exceed a minimum transfer amount threshold (e.g., $250,000) before a transfer has to be made. To the extent amounts due to the Fund from its counterparties are not fully collateralized, contractually or otherwise, the Fund bears the risk of loss from counterparty nonperformance. The Fund may also pay interest expense on cash collateral received from the broker. Any interest expense paid by the Fund is shown on the Statement of Operations. The Fund attempts to mitigate counterparty risk by only entering into agreements with counterparties that it believes have the financial resources to honor their obligations and by monitoring the financial stability of those counterparties.
Certain ISDA Master Agreements allow counterparties of over-the-counter derivatives transactions to terminate derivatives contracts prior to maturity in the event the Fund’s net asset value declines by a stated percentage over a specified time period or if the Fund fails to meet certain terms of the ISDA Master Agreement, which would cause the Fund to accelerate payment of any net liability owed to the counterparty. The Fund also has termination rights if the counterparty fails to meet certain terms of the ISDA Master Agreement. In determining whether to exercise such termination rights, the Fund would consider, in addition to counterparty credit risk, whether termination would result in a net liability owed from the counterparty.
For financial reporting purposes, the Fund does not offset derivative assets and derivative liabilities that are subject to netting arrangements in the Statement of Assets and Liabilities.
Forward foreign currency exchange contracts
Forward foreign currency exchange contracts are over-the-counter agreements between two parties to buy and sell a currency at a set price on a future date. The Fund utilized forward foreign currency exchange contracts to hedge the currency exposure associated with some or all of the Fund’s securities, to shift U.S. dollar exposure to achieve a representative weighted mix of major currencies in its benchmark and to recover an underweight country exposure in its portfolio. These instruments may be used for other purposes in future periods.
The values of forward foreign currency exchange contracts fluctuate daily with changes in foreign currency exchange rates. Changes in the value of these contracts are recorded as unrealized appreciation or depreciation until the contract is exercised or has expired. The Fund will realize a gain or loss when the forward foreign currency exchange contract is closed or expires. Non-deliverable forward foreign currency exchange contracts are settled with the counterparty in U.S. Dollars without delivery of foreign currency.
The use of forward foreign currency exchange contracts does not eliminate fluctuations in the prices of the Fund’s portfolio securities. The risks of forward foreign currency exchange contracts include movement in the values of the foreign currencies relative to the U.S. dollar (or other foreign currencies) and the possibility that counterparties will not complete their contractual obligations, which may be in excess of the amount reflected, if any, in the Statement of Assets and Liabilities.
| 40 | Multi-Manager Directional Alternative Strategies Fund | Annual Report 2019 |
Notes to Financial Statements (continued)
April 30, 2019
Futures contracts
Futures contracts are exchange-traded and represent commitments for the future purchase or sale of an asset at a specified price on a specified date. The Fund bought and sold futures contracts to manage exposure to the securities market. These instruments may be used for other purposes in future periods. Upon entering into futures contracts, the Fund bears risks that it may not achieve the anticipated benefits of the futures contracts and may realize a loss. Additional risks include counterparty credit risk, the possibility of an illiquid market, and that a change in the value of the contract or option may not correlate with changes in the value of the underlying asset.
Upon entering into a futures contract, the Fund deposits cash or securities with the broker, known as a futures commission merchant (FCM), in an amount sufficient to meet the initial margin requirement. The initial margin deposit must be maintained at an established level over the life of the contract. Cash deposited as initial margin is recorded in the Statement of Assets and Liabilities as margin deposits. Securities deposited as initial margin are designated in the Portfolio of Investments. Subsequent payments (variation margin) are made or received by the Fund each day. The variation margin payments are equal to the daily change in the contract value and are recorded as variation margin receivable or payable and are offset in unrealized gains or losses. The Fund recognizes a realized gain or loss when the contract is closed or expires. Futures contracts involve, to varying degrees, risk of loss in excess of the variation margin disclosed in the Statement of Assets and Liabilities.
Swap contracts
Swap contracts are negotiated in the over-the-counter market and may be entered into as a bilateral contract or centrally cleared (centrally cleared swap contract). In a centrally cleared swap contract, immediately following execution of the swap contract with a broker, the swap contract is novated to a central counterparty (the CCP) and the CCP becomes the Fund’s counterparty to the centrally cleared swap contract. The Fund is required to deposit initial margin with the futures commission merchant (FCM), which pledges it through to the CCP in the form of cash or securities in an amount that varies depending on the size and risk profile of the particular swap contract. Securities deposited as initial margin are designated in the Portfolio of Investments and cash deposited is recorded in the Statement of Assets and Liabilities as margin deposits. Unlike a bilateral swap contract, for centrally cleared swap contracts, the Fund has minimal credit exposure to the FCM because the CCP stands between the Fund and the relevant buyer/seller on the other side of the contract. Swap contracts are marked-to-market daily and changes in value are recorded as unrealized appreciation (depreciation). The daily change in valuation of centrally cleared swap contracts, if any, is recorded as a receivable or payable for variation margin in the Statement of Assets and Liabilities.
Entering into these contracts involves, to varying degrees, elements of interest, liquidity and counterparty credit risk in excess of the amounts recognized in the Statement of Assets and Liabilities. Such risks involve the possibility that there may be unfavorable changes in interest rates, market conditions or other conditions, that it may be difficult to initiate a swap transaction or liquidate a position at an advantageous time or price which may result in significant losses, and that the FCM or CCP may not fulfill its obligation under the contract.
Total return basket swap contracts
The Fund entered into total return basket swap transactions. These instruments allow the Fund to manage exposure to a custom basket of securities and foreign markets (both long and short exposures) without owning or taking physical custody of such securities. Under the terms of the contract, payments made by the Fund or the counterparty are based on the total return of the reference assets within the basket in return for a specified interest rate. The contract allows the Investment Manager of the Fund to alter the composition of the custom basket by trading in and out of the notional reference security positions at its discretion.
The total return basket swap is valued daily, and the change in value is recorded as unrealized appreciation (depreciation). The swap resets monthly at which time the Fund settles in cash with the counterparty. Payments received (or made) by the Fund are recorded as realized gains (losses). Total return basket swaps are subject to the risk associated with the investment in the reference securities within the basket. The risk in the case of short swaps transactions is unlimited based on the potential for unlimited increases in the market value of the reference securities in the basket. The risk may be offset if the Fund holds any of the reference securities. The risk in the case of long swap transactions is limited to the current notional amount of the swap.
Multi-Manager Directional Alternative Strategies Fund | Annual Report 2019
| 41 |
Notes to Financial Statements (continued)
April 30, 2019
Total return swap contracts
The Fund entered into total return swap contracts to manage long or short exposure to the total return on a specified reference security in return for periodic payments based on a fixed or variable interest rate. These instruments may be used for other purposes in future periods. Total return swap contracts may be used to obtain exposure to an underlying reference security, instrument, or other asset or index or market without owning, taking physical custody of, or short selling any such security, instrument or asset in a market.
Total return swap contracts are valued daily, and the change in value is recorded as unrealized appreciation (depreciation) until the termination of the swap, at which time the Fund will realize a gain (loss). Periodic payments received (or made) by the Fund over the term of the contract are recorded as realized gains (losses). Total return swap contracts are subject to the risk associated with the investment in the underlying reference security, instrument or asset. The risk in the case of short total return swap contracts is unlimited based on the potential for unlimited increases in the market value of the underlying reference security, instrument or asset. This risk may be offset if the Fund holds any of the underlying reference security, instrument or asset. The risk in the case of long total return swap contracts is limited to the current notional amount of the total return swap contract.
Effects of derivative transactions in the financial statements
The following tables are intended to provide additional information about the effect of derivatives on the financial statements of the Fund, including: the fair value of derivatives by risk category and the location of those fair values in the Statement of Assets and Liabilities; and the impact of derivative transactions over the period in the Statement of Operations, including realized and unrealized gains (losses). The derivative instrument schedules following the Portfolio of Investments present additional information regarding derivative instruments outstanding at the end of the period, if any.
The following table is a summary of the fair value of derivative instruments (not considered to be hedging instruments for accounting disclosure purposes) at April 30, 2019:
| | Asset derivatives | |
Risk exposure
category | Statement
of assets and liabilities
location | Fair value ($) |
| Equity risk | Component of total distributable earnings (loss) — unrealized appreciation on futures contracts | 1,742,145* |
| Equity risk | Component of total distributable earnings (loss) — unrealized appreciation on swap contracts | 608,002* |
| Foreign exchange risk | Unrealized appreciation on forward foreign currency exchange contracts | 62,300 |
| Total | | 2,412,447 |
| | Liability derivatives | |
Risk exposure
category | Statement
of assets and liabilities
location | Fair value ($) |
| Equity risk | Component of total distributable earnings (loss) — unrealized depreciation on swap contracts | 85,931* |
| Foreign exchange risk | Unrealized depreciation on forward foreign currency exchange contracts | 195,150 |
| Total | | 281,081 |
| * | Includes cumulative appreciation (depreciation) as reported in the tables following the Portfolio of Investments. Only the current day’s variation margin is reported in receivables or payables in the Statement of Assets and Liabilities. |
| 42 | Multi-Manager Directional Alternative Strategies Fund | Annual Report 2019 |
Notes to Financial Statements (continued)
April 30, 2019
The following table indicates the effect of derivative instruments (not considered to be hedging instruments for accounting disclosure purposes) in the Statement of Operations for the year ended April 30, 2019:
| Amount of realized gain (loss) on derivatives recognized in income |
| Risk exposure category | Forward
foreign
currency
exchange
contracts
($) | Futures
contracts
($) | Swap
contracts
($) | Total
($) |
| Equity risk | — | 430,288 | (14,200,172) | (13,769,884) |
| Foreign exchange risk | (1,123,225) | — | — | (1,123,225) |
| Total | (1,123,225) | 430,288 | (14,200,172) | (14,893,109) |
| |
| Change in unrealized appreciation (depreciation) on derivatives recognized in income |
| Risk exposure category | Forward
foreign
currency
exchange
contracts
($) | Futures
contracts
($) | Swap
contracts
($) | Total
($) |
| Equity risk | — | 2,310,249 | 2,645,410 | 4,955,659 |
| Foreign exchange risk | 195,554 | — | — | 195,554 |
| Total | 195,554 | 2,310,249 | 2,645,410 | 5,151,213 |
The following table is a summary of the average outstanding volume by derivative instrument for the year ended April 30, 2019:
| Derivative instrument | Average notional
amounts ($) |
| Futures contracts — long | 35,591,794* |
| Futures contracts — short | 24,813** |
| Derivative instrument | Average unrealized
appreciation ($)* | Average unrealized
depreciation ($)* |
| Forward foreign currency exchange contracts | 108,830 | (224,564) |
| Total return swap contracts | 503,142 | (147,971) |
| * | Based on the ending quarterly outstanding amounts for the year ended April 30, 2019. |
| ** | Based on the ending daily outstanding amounts for the year ended April 30, 2019. |
Short sales
The Fund may sell a security it does not own in anticipation of a decline in the fair value of the security. When the Fund sells a security short, it must borrow the security sold short and deliver it to the broker-dealer through which it made the short sale. The Fund is required to maintain a margin account with the broker and to pledge assets to the broker as collateral for the borrowed security. Securities pledged as collateral are designated in the Portfolio of Investments. In addition, cash collateral is recorded as cash collateral held at broker in the Statement of Assets and Liabilities. The Fund can purchase the same security at the current market price and deliver it to the broker to close out the short sale. The Fund is obligated to pay the broker a fee for borrowing the security. The fee is included in "Dividends and interest on securities sold short" in the Statement of Operations and a short position is reported as a liability at fair value in the Statement of Assets and Liabilities. The Fund must also pay the broker for any dividends accrued (recognized on ex-date) on the borrowed security. This amount is recorded as an expense in the Statement of Operations. The Fund will record a gain if the security declines in value, and will realize a loss if the security appreciates. Such gain, limited to the price at which the Fund sold the security short, or such loss, potentially unlimited in size because the short position loses value as the market price of the security sold short increases, will be recognized upon the termination of a short sale.
Multi-Manager Directional Alternative Strategies Fund | Annual Report 2019
| 43 |
Notes to Financial Statements (continued)
April 30, 2019
Offsetting of assets and liabilities
The following table presents the Fund’s gross and net amount of assets and liabilities available for offset under netting arrangements as well as any related collateral received or pledged by the Fund as of April 30, 2019:
| | Citi ($) | JPMorgan ($)(a) | JPMorgan ($)(a) | Macquarie ($) | Morgan
Stanley ($) | Morgan
Stanley
International ($) | Total ($) |
| Assets | | | | | | | |
| Forward foreign currency exchange contracts | 31,127 | - | 31,173 | - | - | - | 62,300 |
| OTC total return swap contracts(b) | - | - | 40,167 | 72,044 | - | 470,434 | 582,645 |
| OTC total return swap contracts on futures(b) | - | - | - | - | - | 25,357 | 25,357 |
| Total assets | 31,127 | - | 71,340 | 72,044 | - | 495,791 | 670,302 |
| Liabilities | | | | | | | |
| Forward foreign currency exchange contracts | 97,509 | - | 97,641 | - | - | - | 195,150 |
| OTC total return swap contracts(b) | - | - | - | 85,931 | - | - | 85,931 |
| Securities loaned | - | 29,004,688 | - | - | 56,839,967 | - | 85,844,655 |
| Total liabilities | 97,509 | 29,004,688 | 97,641 | 85,931 | 56,839,967 | - | 86,125,736 |
| Total financial and derivative net assets | (66,382) | (29,004,688) | (26,301) | (13,887) | (56,839,967) | 495,791 | (85,455,434) |
| Total collateral received (pledged)(c) | (66,382) | (29,004,688) | (26,301) | (13,887) | (56,839,967) | - | (85,951,225) |
| Net amount(d) | - | - | - | - | - | 495,791 | 495,791 |
| (a) | Exposure can only be netted across transactions governed under the same master agreement with the same legal entity. |
| (b) | Over-the-Counter (OTC) swap contracts are presented at market value plus periodic payments receivable (payable), which is comprised of unrealized appreciation, unrealized depreciation, upfront payments and upfront receipts. |
| (c) | In some instances, the actual collateral received and/or pledged may be more than the amount shown due to overcollateralization. |
| (d) | Represents the net amount due from/(to) counterparties in the event of default. |
Security transactions
Security transactions are accounted for on the trade date. Cost is determined and gains (losses) are based upon the specific identification method for both financial statement and federal income tax purposes.
Income recognition
Corporate actions and dividend income are generally recorded net of any non-reclaimable tax withholdings, on the ex-dividend date or upon receipt of ex-dividend notification in the case of certain foreign securities.
The Fund may receive distributions from holdings in equity securities, business development companies (BDCs), exchange-traded funds (ETFs), limited partnerships (LPs), other regulated investment companies (RICs), and real estate investment trusts (REITs), which report information on the tax character of their distributions annually. These distributions are allocated to dividend income, capital gain and return of capital based on actual information reported. Return of capital is recorded as a reduction of the cost basis of securities held. If the Fund no longer owns the applicable securities, return of capital is recorded as a realized gain. With respect to REITs, to the extent actual information has not yet been reported, estimates for return of capital are made by the Fund’s management. Management’s estimates are subsequently adjusted when the actual character of the distributions is disclosed by the REITs, which could result in a proportionate change in return of capital to shareholders.
Awards from class action litigation are recorded as a reduction of cost basis if the Fund still owns the applicable securities on the payment date. If the Fund no longer owns the applicable securities, the proceeds are recorded as realized gains.
| 44 | Multi-Manager Directional Alternative Strategies Fund | Annual Report 2019 |
Notes to Financial Statements (continued)
April 30, 2019
Expenses
General expenses of the Trust are allocated to the Fund and other funds of the Trust based upon relative net assets or other expense allocation methodologies determined by the nature of the expense. Expenses directly attributable to the Fund are charged to the Fund. Expenses directly attributable to a specific class of shares are charged to that share class.
Determination of class net asset value
All income, expenses (other than class-specific expenses, which are charged to that share class, as shown in the Statement of Operations) and realized and unrealized gains (losses) are allocated to each class of the Fund on a daily basis, based on the relative net assets of each class, for purposes of determining the net asset value of each class.
Federal income tax status
The Fund intends to qualify each year as a regulated investment company under Subchapter M of the Internal Revenue Code, as amended, and will distribute substantially all of its investment company taxable income and net capital gain, if any, for its tax year, and as such will not be subject to federal income taxes. In addition, the Fund intends to distribute in each calendar year substantially all of its ordinary income, capital gain net income and certain other amounts, if any, such that the Fund should not be subject to federal excise tax. Therefore, no federal income or excise tax provision is recorded.
Foreign taxes
The Fund may be subject to foreign taxes on income, gains on investments or currency repatriation, a portion of which may be recoverable. The Fund will accrue such taxes and recoveries, as applicable, based upon its current interpretation of tax rules and regulations that exist in the markets in which it invests.
Realized gains in certain countries may be subject to foreign taxes at the Fund level, based on statutory rates. The Fund accrues for such foreign taxes on realized and unrealized gains at the appropriate rate for each jurisdiction, as applicable. The amount, if any, is disclosed as a liability on the Statement of Assets and Liabilities.
Distributions to shareholders
Distributions from net investment income, if any, are declared and paid annually. Net realized capital gains, if any, are distributed at least annually. Income distributions and capital gain distributions are determined in accordance with federal income tax regulations, which may differ from GAAP.
Guarantees and indemnifications
Under the Trust’s organizational documents and, in some cases, by contract, its officers and trustees are indemnified against certain liabilities arising out of the performance of their duties to the Trust or its funds. In addition, certain of the Fund’s contracts with its service providers contain general indemnification clauses. The Fund’s maximum exposure under these arrangements is unknown since the amount of any future claims that may be made against the Fund cannot be determined, and the Fund has no historical basis for predicting the likelihood of any such claims.
Recent accounting pronouncements
Accounting Standards Update 2017-08 Premium Amortization on Purchased Callable Debt Securities
In March 2017, the Financial Accounting Standards Board issued Accounting Standards Update (ASU) No. 2017-08 Premium Amortization on Purchased Callable Debt Securities. ASU No. 2017-08 updates the accounting standards to shorten the amortization period for certain purchased callable debt securities, held at a premium, to be amortized to the earliest call date. The update applies to securities with explicit, noncontingent call features that are callable at fixed prices and on preset dates. The standard is effective for annual periods beginning after December 15, 2018 and interim periods within those fiscal years. Management does not expect the implementation of this guidance to have a material impact on the financial statement amounts and footnote disclosures.
Accounting Standards Update 2018-13 Disclosure Framework - Changes to the Disclosure Requirements for Fair Value Measurement
Multi-Manager Directional Alternative Strategies Fund | Annual Report 2019
| 45 |
Notes to Financial Statements (continued)
April 30, 2019
In August 2018, the Financial Accounting Standards Board issued Accounting Standards Update (ASU) No. 2018-13 Disclosure Framework - Changes to the Disclosure Requirements for Fair Value Measurement. ASU No. 2018-13, in addition to other modifications and additions, removes the requirement to disclose the amount and reasons for transfers between Level 1 and Level 2 of the fair value hierarchy and the policy for the timing of transfers between levels. The standard is effective for annual periods beginning after December 15, 2019 and interim periods within those fiscal years. At this time, management is evaluating the implication of this guidance and the impact it will have on the financial statement disclosures, if any.
Disclosure Update and Simplification
In September 2018, the Securities and Exchange Commission (SEC) released Final Rule 33-10532, Disclosure Update and Simplification, which amends certain financial statement disclosure requirements that the SEC determined to be redundant, outdated, or superseded in light of other SEC disclosure requirements, GAAP, or changes in the information environment. As a result of the amendments, management implemented disclosure changes which included removing the components of distributable earnings presented on the Statement of Assets and Liabilities and combining income and gain distributions paid to shareholders as presented on the Statement of Changes in Net Assets. Any values presented to meet prior year requirements were left unchanged. The amendments had no effect on the Fund’s net assets or results of operation.
Note 3. Fees and other transactions with affiliates
Management services fees
The Fund has entered into a Management Agreement with Columbia Management Investment Advisers, LLC (the Investment Manager), a wholly-owned subsidiary of Ameriprise Financial, Inc. (Ameriprise Financial). Under the Management Agreement, the Investment Manager provides the Fund with investment research and advice, as well as administrative and accounting services. The Investment Manager is responsible for the ultimate oversight of investments made by the Fund. The Fund’s subadvisers (see Subadvisory agreement below) have the primary responsibility for the day-to-day portfolio management of their portion of the Fund. The management services fee is equal to 1.60% of the Fund’s daily net assets.
Subadvisory agreements
The Investment Manager has entered into Subadvisory Agreements with Boston Partners Global Investors, Inc, AQR Capital Management, LLC and Wells Capital Management Incorporated, each of which subadvises a portion of the assets of the Fund. Prior to November 1, 2018, Analytic Investors, LLC, an affiliate of Wells Capital Management Incorporated served as subadviser to the Fund under a separate subadvisory agreement. New investments in the Fund, net of any redemptions, are allocated in accordance with the Investment Manager’s determination, subject to the oversight of the Fund’s Board of Trustees. Each subadviser’s proportionate share of investments in the Fund will vary due to market fluctuations. The Investment Manager compensates each subadviser to manage the investment of the Fund’s assets.
Compensation of board members
Members of the Board of Trustees who are not officers or employees of the Investment Manager or Ameriprise Financial are compensated for their services to the Fund as disclosed in the Statement of Operations. These members of the Board of Trustees may participate in a Deferred Compensation Plan (the Deferred Plan) which may be terminated at any time. Obligations of the Deferred Plan will be paid solely out of the Fund’s assets, and all amounts payable under the Deferred Plan constitute a general unsecured obligation of the Fund.
Compensation of Chief Compliance Officer
The Board of Trustees has appointed a Chief Compliance Officer to the Fund in accordance with federal securities regulations. As disclosed in the Statement of Operations, a portion of the Chief Compliance Officer’s total compensation is allocated to the Fund, along with other allocations to affiliated registered investment companies managed by the Investment Manager and its affiliates, based on relative net assets.
| 46 | Multi-Manager Directional Alternative Strategies Fund | Annual Report 2019 |
Notes to Financial Statements (continued)
April 30, 2019
Transfer agency fees
Under a Transfer and Dividend Disbursing Agent Agreement, Columbia Management Investment Services Corp. (the Transfer Agent), an affiliate of the Investment Manager and a wholly-owned subsidiary of Ameriprise Financial, is responsible for providing transfer agency services to the Fund. The Transfer Agent has contracted with DST Asset Manager Solutions, Inc. (DST) to serve as sub-transfer agent. The Transfer Agent pays the fees of DST for services as sub-transfer agent and DST is not entitled to reimbursement for such fees from the Fund (with the exception of out-of-pocket fees).
The Fund pays the Transfer Agent a monthly transfer agency fee based on the number or the average value of accounts, depending on the type of account. In addition, the Fund pays the Transfer Agent a fee for shareholder services based on the number of accounts or on a percentage of the average aggregate value of the Fund’s shares maintained in omnibus accounts up to the lesser of the amount charged by the financial intermediary or a cap established by the Board of Trustees from time to time.
The Transfer Agent also receives compensation from the Fund for various shareholder services and reimbursements for certain out-of-pocket fees.
For the year ended April 30, 2019, the Fund’s effective transfer agency fee rates as a percentage of average daily net assets of each class were as follows:
| | Effective rate (%) |
| Class A | 0.22 |
| Institutional Class | 0.22 |
Distribution and service fees
The Fund has entered into an agreement with Columbia Management Investment Distributors, Inc. (the Distributor), an affiliate of the Investment Manager and a wholly-owned subsidiary of Ameriprise Financial, for distribution and shareholder services. The Board of Trustees has approved, and the Fund has adopted, distribution and shareholder service plans (the Plans) applicable to certain share classes, which set the distribution and service fees for the Fund. These fees are calculated daily and are intended to compensate the Distributor and/or eligible selling and/or servicing agents for selling shares of the Fund and providing services to investors.
The Fund may pay distribution fee of up to 0.25% of the Fund’s average daily net assets attributable to Class A shares and a service fee of up to 0.25% of the Fund’s average daily net assets attributable to Class A shares, provided that the aggregate fee shall not exceed 0.25% of the Fund’s average daily net assets attributable to Class A shares.
Expenses waived/reimbursed by the Investment Manager and its affiliates
The Investment Manager and certain of its affiliates have contractually agreed to waive fees and/or reimburse expenses (excluding certain fees and expenses described below) for the period(s) disclosed below, unless sooner terminated at the sole discretion of the Board of Trustees, so that the Fund’s net operating expenses, after giving effect to fees waived/expenses reimbursed and any balance credits and/or overdraft charges from the Fund’s custodian, do not exceed the following annual rate(s) as a percentage of the class’ average daily net assets:
| | September 1, 2018
through
August 31, 2019 | Prior to
September 1, 2018 |
| Class A | 2.16% | 2.20% |
| Institutional Class | 1.91 | 1.95 |
Under the agreement governing these fee waivers and/or expense reimbursement arrangements, the following fees and expenses are excluded from the waiver/reimbursement commitment, and therefore will be paid by the Fund, if applicable: taxes (including foreign transaction taxes), expenses associated with investments in affiliated and non-affiliated pooled investment vehicles (including mutual funds and exchange-traded funds), transaction costs and brokerage commissions, costs related to any securities lending program, dividend expenses associated with securities sold short, inverse floater program fees and expenses, transaction charges and interest on borrowed money, interest, infrequent and/or
Multi-Manager Directional Alternative Strategies Fund | Annual Report 2019
| 47 |
Notes to Financial Statements (continued)
April 30, 2019
unusual expenses and any other expenses the exclusion of which is specifically approved by the Board of Trustees. This agreement may be modified or amended only with approval from the Investment Manager, certain of its affiliates and the Fund. Any fees waived and/or expenses reimbursed under the expense reimbursement arrangements described above are not recoverable by the Investment Manager or its affiliates in future periods.
Note 4. Federal tax information
The timing and character of income and capital gain distributions are determined in accordance with income tax regulations, which may differ from GAAP because of temporary or permanent book to tax differences.
At April 30, 2019, these differences were primarily due to differing treatment for deferral/reversal of wash sale losses, passive foreign investment company (PFIC) holdings, re-characterization of distributions for investments, derivative investments, tax straddles, swap investments, post-October capital losses, late-year ordinary losses, trustees’ deferred compensation, foreign currency transactions, distribution reclassifications, non-deductible expenses, net operating loss reclassification and investments in partnerships. To the extent these differences were permanent, reclassifications were made among the components of the Fund’s net assets. Temporary differences do not require reclassifications.
The following reclassifications were made:
Excess of distributions
over net investment
income ($) | Accumulated
net realized
(loss) ($) | Paid in
capital ($) |
| (6,388,829) | 15,368,888 | (8,980,059) |
Net investment income (loss) and net realized gains (losses), as disclosed in the Statement of Operations, and net assets were not affected by this reclassification.
The tax character of distributions paid during the years indicated was as follows:
| Year Ended April 30, 2019 | Year Ended April 30, 2018 |
Ordinary
income ($) | Long-term
capital gains ($) | Total ($) | Ordinary
income ($) | Long-term
capital gains ($) | Total ($) |
| 1,440,388 | 82,351,756 | 83,792,144 | 44,442,224 | 14,067,321 | 58,509,545 |
Short-term capital gain distributions, if any, are considered ordinary income distributions for tax purposes.
At April 30, 2019, the components of distributable earnings on a tax basis were as follows:
Undistributed
ordinary income ($) | Undistributed
long-term
capital gains ($) | Capital loss
carryforwards ($) | Net unrealized
appreciation ($) |
| — | — | — | 14,579,411 |
At April 30, 2019, the cost of all investments for federal income tax purposes along with the aggregate gross unrealized appreciation and depreciation based on that cost was:
Federal
tax cost ($) | Gross unrealized
appreciation ($) | Gross unrealized
(depreciation) ($) | Net unrealized
appreciation ($) |
| 135,351,141 | 28,263,602 | (13,684,191) | 14,579,411 |
Tax cost of investments and unrealized appreciation/(depreciation) may also include timing differences that do not constitute adjustments to tax basis.
Under current tax rules, regulated investment companies can elect to treat certain late-year ordinary losses incurred and post-October capital losses (capital losses realized after October 31) as arising on the first day of the following taxable year. As of April 30, 2019, the Fund will elect to treat the following late-year ordinary losses and post-October capital losses as arising on May 1, 2019.
| 48 | Multi-Manager Directional Alternative Strategies Fund | Annual Report 2019 |
Notes to Financial Statements (continued)
April 30, 2019
Late year
ordinary losses ($) | Post-October
capital losses ($) |
| 3,871,219 | 452,604 |
Management of the Fund has concluded that there are no significant uncertain tax positions in the Fund that would require recognition in the financial statements. However, management’s conclusion may be subject to review and adjustment at a later date based on factors including, but not limited to, new tax laws, regulations, and administrative interpretations (including relevant court decisions). Generally, the Fund’s federal tax returns for the prior three fiscal years remain subject to examination by the Internal Revenue Service.
Note 5. Portfolio information
The cost of purchases and proceeds from sales of securities, excluding short-term investments and derivatives, if any, aggregated to $138,542,105 and $148,951,935, respectively, for the year ended April 30, 2019. The amount of purchase and sale activity impacts the portfolio turnover rate reported in the Financial Highlights.
Note 6. Affiliated money market fund
The Fund invests in Columbia Short-Term Cash Fund, an affiliated money market fund established for the exclusive use by the Fund and other affiliated funds (the Affiliated MMF). The income earned by the Fund from such investments is included as Dividends - affiliated issuers in the Statement of Operations. As an investing fund, the Fund indirectly bears its proportionate share of the expenses of the Affiliated MMF. The Affiliated MMF prices its shares with a floating net asset value. In addition, the Board of Trustees of the Affiliated MMF may impose a fee on redemptions (sometimes referred to as a liquidity fee) or temporarily suspend redemptions (sometimes referred to as imposing a redemption gate) in the event its liquidity falls below regulatory limits.
Note 7. Interfund lending
Pursuant to an exemptive order granted by the Securities and Exchange Commission, the Fund participates in a program (the Interfund Program) allowing each participating Columbia Fund (each, a Participating Fund) to lend money directly to and, except for closed-end funds and money market funds, borrow money directly from other Participating Funds for temporary purposes. The amounts eligible for borrowing and lending under the Interfund Program are subject to certain restrictions.
Interfund loans are subject to the risk that the borrowing fund could be unable to repay the loan when due, and a delay in repayment to the lending fund could result in lost opportunities and/or additional lending costs. The exemptive order is subject to conditions intended to mitigate conflicts of interest arising from the Investment Manager’s relationship with each Participating Fund.
The Fund’s activity in the Interfund Program during the year ended April 30, 2019 was as follows:
| Borrower or lender | Average loan
balance ($) | Weighted average
interest rate (%) | Days
outstanding |
| Borrower | 500,000 | 2.46 | 2 |
Interest expense incurred by the Fund is recorded as Interfund lending in the Statement of Operations. The Fund had no outstanding interfund loans at April 30, 2019.
Note 8. Line of credit
The Fund has access to a revolving credit facility with a syndicate of banks led by Citibank, N.A., HSBC Bank USA, N.A. and JPMorgan Chase Bank, N.A. whereby the Fund may borrow for the temporary funding of shareholder redemptions or for other temporary or emergency purposes. The credit facility, which is a collective agreement between the Fund and certain other funds managed by the Investment Manager or an affiliated investment manager, severally and not jointly, permits collective borrowings up to $1 billion. Interest is charged to each participating fund based on its borrowings at a rate equal to the higher of (i) the federal funds effective rate, (ii) the one-month LIBOR rate and (iii) the overnight bank funding rate, plus in each case, 1.00%. Each borrowing under the credit facility matures no later than 60 days after the date of borrowing. The
Multi-Manager Directional Alternative Strategies Fund | Annual Report 2019
| 49 |
Notes to Financial Statements (continued)
April 30, 2019
Fund also pays a commitment fee equal to its pro rata share of the unused amount of the credit facility at a rate of 0.15% per annum. The commitment fee is included in other expenses in the Statement of Operations. This agreement expires annually in December unless extended or renewed.
The Fund had no borrowings during the year ended April 30, 2019.
Note 9. Significant risks
Derivatives risk
Losses involving derivative instruments may be substantial, because a relatively small price movement in the underlying security(ies), commodity, currency or index or other instrument or asset may result in a substantial loss for the Fund. In addition to the potential for increased losses, the use of derivative instruments may lead to increased volatility within the Fund. Derivatives will typically increase the Fund’s exposure to principal risks to which it is otherwise exposed, and may expose the Fund to additional risks, including correlation risk, counterparty risk, hedging risk, leverage risk and liquidity risk.
Foreign securities and emerging market countries risk
Investing in foreign securities may include certain risks and considerations not typically associated with investing in U.S. securities, such as fluctuating currency values and changing local and regional economic, political and social conditions, which may result in greater market volatility. In addition, certain foreign securities may not be as liquid as U.S. securities. Investing in emerging markets may accentuate these risks. These countries are also more likely to experience high levels of inflation, deflation or currency devaluation which could hurt their economies and securities markets. To the extent that the Fund concentrates its investment exposure to any one or a few specific countries, the Fund will be particularly susceptible to the various conditions, events or other factors impacting those countries and may, therefore, have a greater risk than that of a fund which is more geographically diversified.
Non-diversification risk
A non-diversified fund is permitted to invest a greater percentage of its total assets in fewer issuers than a diversified fund. The Fund may, therefore, have a greater risk of loss from a few issuers than a similar fund that invests more broadly.
Shareholder concentration risk
At April 30, 2019, affiliated shareholders of record owned 100.0% of the outstanding shares of the Fund in one or more accounts. Subscription and redemption activity by concentrated accounts may have a significant effect on the operations of the Fund. In the case of a large redemption, the Fund may be forced to sell investments at inopportune times, including its liquid positions, which may result in Fund losses and the Fund holding a higher percentage of less liquid positions. Large redemptions could result in decreased economies of scale and increased operating expenses for non-redeeming Fund shareholders.
Short selling risk
Leverage occurs when the Fund increases its assets available for investment using borrowings, short sales, derivatives, or similar instruments or techniques. Because short sales involve borrowing securities and then selling them, the Fund’s short sales effectively leverage the Fund’s assets. The Fund’s assets that are used as collateral to secure the Fund’s obligations to return the securities sold short may decrease in value while the short positions are outstanding, which may force the Fund to use its other assets to increase the collateral. Leverage can create an interest expense that may lower the Fund’s overall returns. Leverage presents the opportunity for increased net income and capital gains, but may also exaggerate the Fund’s volatility and risk of loss. There can be no guarantee that a leveraging strategy will be successful.
Note 10. Subsequent events
Management has evaluated the events and transactions that have occurred through the date the financial statements were issued and noted no items requiring adjustment of the financial statements or additional disclosure.
| 50 | Multi-Manager Directional Alternative Strategies Fund | Annual Report 2019 |
Notes to Financial Statements (continued)
April 30, 2019
Note 11. Information regarding pending and settled legal proceedings
Ameriprise Financial and certain of its affiliates have historically been involved in a number of legal, arbitration and regulatory proceedings, including routine litigation, class actions, and governmental actions, concerning matters arising in connection with the conduct of their business activities. Ameriprise Financial believes that the Fund is not currently the subject of, and that neither Ameriprise Financial nor any of its affiliates are the subject of, any pending legal, arbitration or regulatory proceedings that are likely to have a material adverse effect on the Fund or the ability of Ameriprise Financial or its affiliates to perform under their contracts with the Fund. Ameriprise Financial is required to make quarterly (10-Q), annual (10-K) and, as necessary, 8-K filings with the Securities and Exchange Commission (SEC) on legal and regulatory matters that relate to Ameriprise Financial and its affiliates. Copies of these filings may be obtained by accessing the SEC website at www.sec.gov.
There can be no assurance that these matters, or the adverse publicity associated with them, will not result in increased Fund redemptions, reduced sale of Fund shares or other adverse consequences to the Fund. Further, although we believe proceedings are not likely to have a material adverse effect on the Fund or the ability of Ameriprise Financial or its affiliates to perform under their contracts with the Fund, these proceedings are subject to uncertainties and, as such, we are unable to estimate the possible loss or range of loss that may result. An adverse outcome in one or more of these proceedings could result in adverse judgments, settlements, fines, penalties or other relief that could have a material adverse effect on the consolidated financial condition or results of operations of Ameriprise Financial.
Multi-Manager Directional Alternative Strategies Fund | Annual Report 2019
| 51 |
Report of Independent Registered Public Accounting Firm
To the Board of Trustees of Columbia Funds Series Trust I and Shareholders of Multi-Manager Directional Alternative Strategies Fund
Opinion on the Financial Statements
We have audited the accompanying statement of assets and liabilities, including the portfolio of investments, of Multi-Manager Directional Alternative Strategies Fund (one of the funds constituting Columbia Funds Series Trust I, referred to hereafter as the "Fund") as of April 30, 2019, the related statement of operations for the year ended April 30, 2019, the statement of changes in net assets for each of the two years in the period ended April 30, 2019, including the related notes, and the financial highlights for each of the periods indicated therein (collectively referred to as the “financial statements”). In our opinion, the financial statements present fairly, in all material respects, the financial position of the Fund as of April 30, 2019, the results of its operations for the year then ended, the changes in its net assets for each of the two years in the period ended April 30, 2019 and the financial highlights for each of the periods indicated therein in conformity with accounting principles generally accepted in the United States of America.
Basis for Opinion
These financial statements are the responsibility of the Fund’s management. Our responsibility is to express an opinion on the Fund’s financial statements based on our audits. We are a public accounting firm registered with the Public Company Accounting Oversight Board (United States) (PCAOB) and are required to be independent with respect to the Fund in accordance with the U.S. federal securities laws and the applicable rules and regulations of the Securities and Exchange Commission and the PCAOB.
We conducted our audits of these financial statements in accordance with the standards of the PCAOB. Those standards require that we plan and perform the audit to obtain reasonable assurance about whether the financial statements are free of material misstatement, whether due to error or fraud.
Our audits included performing procedures to assess the risks of material misstatement of the financial statements, whether due to error or fraud, and performing procedures that respond to those risks. Such procedures included examining, on a test basis, evidence regarding the amounts and disclosures in the financial statements. Our audits also included evaluating the accounting principles used and significant estimates made by management, as well as evaluating the overall presentation of the financial statements. Our procedures included confirmation of securities owned as of April 30, 2019 by correspondence with the custodian, transfer agent and brokers; when replies were not received from brokers, we performed other auditing procedures. We believe that our audits provide a reasonable basis for our opinion.
/s/PricewaterhouseCoopers LLP
Minneapolis, Minnesota
June 21, 2019
We have served as the auditor of one or more investment companies within the Columbia Funds Complex since 1977.
| 52 | Multi-Manager Directional Alternative Strategies Fund | Annual Report 2019 |
Federal Income Tax Information
(Unaudited)
The Fund hereby designates the following tax attributes for the fiscal year ended April 30, 2019. Shareholders will be notified in early 2020 of the amounts for use in preparing 2019 income tax returns.
Qualified
dividend
income | Dividends
received
deduction | Capital
gain
dividend |
| 45.80% | 27.28% | $4,172,602 |
Qualified dividend income. For taxable, non-corporate shareholders, the percentage of ordinary income distributed during the fiscal year that represents qualified dividend income subject to reduced tax rates.
Dividends received deduction. The percentage of ordinary income distributed during the fiscal year that qualifies for the corporate dividends received deduction.
Capital gain dividend. The Fund designates as a capital gain dividend the amount reflected above, or if subsequently determined to be different, the net capital gain of such fiscal period.
Multi-Manager Directional Alternative Strategies Fund | Annual Report 2019
| 53 |
The Board oversees the Fund’s operations and appoints officers who are responsible for day-to-day business decisions based on policies set by the Board. The following table provides basic biographical information about the Fund’s Trustees as of the printing of this report, including their principal occupations during the past five years, although specific titles for individuals may have varied over the period. The year set forth beneath Length of Service in the table below is the year in which the Trustee was first appointed or elected as Trustee to any Fund currently in the Columbia Funds Complex or a predecessor thereof. Under current Board policy, members serve terms of indefinite duration.
Independent trustees
| Name, address, year of birth | Position held with the Trust and length of service | Principal occupation(s) during the past five years and other relevant professional experience | Number of Funds in the Columbia Fund Complex overseen | Other directorships held by Trustee during the past five years |
Janet Langford Carrig
c/o Columbia Management
Investment Advisers, LLC
225 Franklin Street
Mail Drop BX32 05228
Boston, MA 02110
1957 | Trustee
1996 | Senior Vice President, General Counsel and Corporate Secretary, ConocoPhillips (independent energy company) from September 2007 to October 2018 | 69 | None |
Douglas A. Hacker
c/o Columbia Management
Investment Advisers, LLC
225 Franklin Street
Mail Drop BX32 05228
Boston, MA 02110
1955 | Trustee and Chairman of the Board
1996 | Independent business executive since May 2006; Executive Vice President — Strategy of United Airlines from December 2002 to May 2006; President of UAL Loyalty Services (airline marketing company) from September 2001 to December 2002; Executive Vice President and Chief Financial Officer of United Airlines from July 1999 to September 2001 | 69 | Spartan Nash Company, (food distributor); Nash Finch Company (food distributor) from 2005 to 2013; Aircastle Limited (aircraft leasing); SeaCube Container Leasing Ltd. (container leasing) from 2010 to 2013; and Travelport Worldwide Limited (travel information technology) |
Nancy T. Lukitsh
c/o Columbia Management
Investment Advisers, LLC
225 Franklin Street
Mail Drop BX32 05228
Boston, MA 02110
1956 | Trustee
2011 | Senior Vice President, Partner and Director of Marketing, Wellington Management Company, LLP (investment adviser) from 1997 to 2010; Chair, Wellington Management Portfolios (commingled non-U.S. investment pools) from 2007 to 2010; Director, Wellington Trust Company, NA and other Wellington affiliates from 1997 to 2010 | 69 | None |
David M. Moffett
c/o Columbia Management
Investment Advisers, LLC
225 Franklin Street
Mail Drop BX32 05228
Boston, MA 02110
1952 | Trustee
2011 | Retired. Consultant to Bridgewater and Associates | 69 | Director, CSX Corporation (transportation suppliers); Genworth Financial, Inc. (financial and insurance products and services); PayPal Holdings Inc. (payment and data processing services); Trustee, University of Oklahoma Foundation; former Director, eBay Inc. (online trading community), 2007-2015; and former Director, CIT Bank, CIT Group Inc. (commercial and consumer finance), 2010-2016 |
| 54 | Multi-Manager Directional Alternative Strategies Fund | Annual Report 2019 |
TRUSTEES AND OFFICERS (continued)
Independent trustees (continued)
| Name, address, year of birth | Position held with the Trust and length of service | Principal occupation(s) during the past five years and other relevant professional experience | Number of Funds in the Columbia Fund Complex overseen | Other directorships held by Trustee during the past five years |
John J. Neuhauser
c/o Columbia Management
Investment Advisers, LLC
225 Franklin Street
Mail Drop BX32 05228
Boston, MA 02110
1943 | Trustee
1984 | President, Saint Michael’s College from August 2007 to June 2018; Director or Trustee of several non-profit organizations, including University of Vermont Medical Center; Academic Vice President and Dean of Faculties, Boston College from August 1999 to October 2005; University Professor, Boston College from November 2005 to August 2007 | 69 | Liberty All-Star Equity Fund and Liberty All- Star Growth Fund (closed-end funds) |
Patrick J. Simpson
c/o Columbia Management
Investment Advisers, LLC
225 Franklin Street
Mail Drop BX32 05228
Boston, MA 02110
1944 | Trustee
2000 | Of Counsel, Perkins Coie LLP (law firm) since 2015; Partner, Perkins Coie LLP from 1988 to 2014 | 69 | M Fund, Inc. (M Funds mutual fund family) |
Anne-Lee Verville
c/o Columbia Management
Investment Advisers, LLC
225 Franklin Street
Mail Drop BX32 05228
Boston, MA 02110
1945 | Trustee
1998 | Retired. General Manager, Global Education Industry from 1994 to 1997, President – Application Systems Division from 1991 to 1994, Chief Financial Officer – US Marketing & Services from 1988 to 1991, and Chief Information Officer from 1987 to 1988, IBM Corporation (computer and technology) | 69 | Enesco Group, Inc. (producer of giftware and home and garden decor products) from 2001 to 2006 |
Consultants to the Independent Trustees*
| Name, address, year of birth | Position held with the Trust and length of service | Principal occupation(s) during the past five years and other relevant professional experience | Number of Funds in the Columbia Funds complex overseen | Other directorships held by Trustee during the past five years |
J. Kevin Connaughton
c/o Columbia
Management Investment
Advisers, LLC,
225 Franklin Street
Mail Drop BX32 05228,
Boston, MA 02110
1964 | Independent Trustee Consultant
2016 | Independent Trustee Consultant, Columbia Funds since March 2016; Adjunct Professor of Finance, Bentley University since November 2017; Managing Director and General Manager of Mutual Fund Products, Columbia Management Investment Advisers, LLC from May 2010 to February 2015; President, Columbia Funds from 2009 to 2015; and senior officer of Columbia Funds and affiliated funds from 2003 to 2015 | 69 | Director, The Autism Project since March 2015; former Trustee, New Century Portfolios, March 2015-December 2017; formerly on Board of Governors, Gateway Healthcare, January 2016 – December 2017 |
Multi-Manager Directional Alternative Strategies Fund | Annual Report 2019
| 55 |
TRUSTEES AND OFFICERS (continued)
Consultants to the Independent Trustees* (continued)
| Name, address, year of birth | Position held with the Trust and length of service | Principal occupation(s) during the past five years and other relevant professional experience | Number of Funds in the Columbia Funds complex overseen | Other directorships held by Trustee during the past five years |
Olive Darragh
c/o Columbia
Management Investment
Advisers, LLC,
225 Franklin Street,
Mail Drop BX32 05228,
Boston, MA 02110
1962 | Independent Trustee Consultant 2019 | Independent Trustee Consultant, Columbia Funds since June 2019; Managing Director of Darragh Inc. (a strategy and talent management consulting firm) since 2010; Founder and CEO, Zolio (an investment management talent identification platform) since 2004; Partner, Tudor Investments from 2004 to 2010; Senior Partner, McKinsey & Company from 2001 to 2004 | 69 | Director, University of Edinburgh Business School; former Director, Boston Public Library Foundation |
Natalie A. Trunow
c/o Columbia
Management Investment
Advisers, LLC,
225 Franklin Street
Mail Drop BX32 05228,
Boston, MA 02110
1967 | Independent Trustee Consultant
2016 | Independent Trustee Consultant, Columbia Funds since September 2016; Chief Executive Officer, Millennial Portfolio Solutions LLC (asset management and consulting services) since January 2016; Director of Investments, Casey Family Programs from April 2016 to September 2016; Senior Vice President and Chief Investment Officer, Calvert Investments from August 2008 to January 2016; Section Head and Portfolio Manager, General Motors Asset Management from June 1997 to August 2008 | 69 | Director, Health Services for Children with Special Needs, Inc.; Director, Guidewell Financial Solutions |
| * | J. Kevin Connaughton was appointed consultant to the Independent Trustees effective March 1, 2016. Olive Darragh was appointed consultant to the Independent Trustees effective June 10, 2019. Natalie A. Trunow was appointed consultant to the Independent Trustees effective September 1, 2016. Shareholders of the Funds are expected to be asked to elect each of Mr. Connaughton, Ms. Darragh and Ms. Trunow as a Trustee at a future shareholder meeting. |
Interested trustee affiliated with Investment Manager*
| Name, address, year of birth | Position held with the Trust and length of service | Principal occupation(s) during the past five years and other relevant professional experience | Number of Funds in the Columbia Funds Complex overseen | Other directorships held by Trustee during the past five years |
William F. Truscott
c/o Columbia Management
Investment Advisers, LLC
225 Franklin Street
Boston, MA 02110
1960 | Trustee
2012 | Chairman of the Board and President, Columbia Management Investment Advisers, LLC since May 2010 and February 2012, respectively; Chief Executive Officer, Global Asset Management, Ameriprise Financial, Inc. since September 2012 (previously Chief Executive Officer, U.S. Asset Management & President, Annuities, May 2010-September 2012); Director and Chief Executive Officer, Columbia Management Investment Distributors, Inc. since May 2010 and February 2012, respectively; Chairman of the Board and Chief Executive Officer, RiverSource Distributors, Inc. since 2006; Director, Threadneedle Asset Management Holdings, SARL since 2014; President and Chief Executive Officer, Ameriprise Certificate Company, 2006-August 2012 | 188 | Chairman of the Board, Columbia Management Investment Advisers, LLC since May 2010; Director, Columbia Management Investment Distributors, Inc. since May 2010; former Director, Ameriprise Certificate Company, 2006 - January 2013 |
| * | Interested person (as defined under the 1940 Act) by reason of being an officer, director, security holder and/or employee of the Investment Manager or Ameriprise Financial. |
The Statement of Additional Information has additional information about the Fund’s Board members and is available, without charge, upon request by calling 800.345.6611, visiting columbiathreadneedleus.com/investor/ or contacting your financial intermediary.
| 56 | Multi-Manager Directional Alternative Strategies Fund | Annual Report 2019 |
TRUSTEES AND OFFICERS (continued)
The Board has appointed officers who are responsible for day-to-day business decisions based on policies it has established. The officers serve at the pleasure of the Board. The following table provides basic information about the Officers of the Fund, including principal occupations during the past five years, although their specific titles may have varied over the period. In addition to Mr. Truscott, who is Senior Vice President, the Fund’s other officers are:
Fund officers
Name,
address and
year of birth | Position and year
first appointed to
position for any Fund
in the Columbia
Funds complex or a
predecessor thereof | Principal occupation(s) during past five years |
Christopher O. Petersen
5228 Ameriprise
Financial Center
Minneapolis, MN 55474
Born 1970 | President and Principal Executive Officer (2015) | Vice President and Lead Chief Counsel, Ameriprise Financial, Inc. since January 2015 (previously Vice President and Chief Counsel, January 2010 - December 2014; officer of Columbia Funds and affiliated funds since 2007. |
Michael G. Clarke
225 Franklin Street
Boston, MA 02110
Born 1969 | Chief Financial Officer (Principal Financial Officer) (2009) and Senior Vice President (2019) | Vice President, Head of North American Operations, and Co-Head of Global Operations, Columbia Management Investment Advisers, LLC, since June 2019 (previously Vice President – Accounting and Tax, May 2010 - May 2019); senior officer of Columbia Funds and affiliated funds since 2002 (previously Treasurer and Chief Accounting Officer, January 2009 - January 2019 and December 2015 - January 2019, respectively). |
Joseph Beranek
5890 Ameriprise
Financial Center
Minneapolis, MN 55474
Born 1965 | Treasurer and Chief Accounting Officer (Principal Accounting Officer) (2019) | Vice President — Mutual Fund Accounting and Financial Reporting, Columbia Management Investment Advisers, LLC, since December 2018 and March 2017, respectively (previously Vice President — Pricing and Corporate Actions, May 2010 - March 2017). |
Paul B. Goucher
485 Lexington Avenue
New York, NY 10017
Born 1968 | Senior Vice President (2011) and Assistant Secretary (2008) | Senior Vice President and Assistant General Counsel, Ameriprise Financial, Inc. since January 2017 (previously Vice President and Lead Chief Counsel, November 2008 - January 2017 and January 2013 - January 2017, respectively); Vice President, Chief Legal Officer and Assistant Secretary, Columbia Management Investment Advisers, LLC since March 2015 (previously Vice President and Assistant Secretary, May 2010 – March 2015). |
Thomas P. McGuire
225 Franklin Street
Boston, MA 02110
Born 1972 | Senior Vice President and Chief Compliance Officer (2012) | Vice President — Asset Management Compliance, Ameriprise Financial, Inc., since May 2010; Chief Compliance Officer, Ameriprise Certificate Company since September 2010. |
Colin Moore
225 Franklin Street
Boston, MA 02110
Born 1958 | Senior Vice President (2010) | Executive Vice President and Global Chief Investment Officer, Ameriprise Financial, Inc., since July 2013; Executive Vice President and Global Chief Investment Officer, Columbia Management Investment Advisers, LLC since July 2013. |
Ryan C. Larrenaga
225 Franklin Street
Boston, MA 02110
Born 1970 | Senior Vice President (2017), Chief Legal Officer (2017), and Secretary (2015) | Vice President and Chief Counsel, Ameriprise Financial, Inc. since August 2018 (previously Vice President and Group Counsel, August 2011 - August 2018); officer of Columbia Funds and affiliated funds since 2005. |
Michael E. DeFao
225 Franklin Street
Boston, MA 02110
Born 1968 | Vice President (2011) and Assistant Secretary (2010) | Vice President and Chief Counsel, Ameriprise Financial, Inc. since May 2010. |
Lyn Kephart-Strong
5228 Ameriprise
Financial Center
Minneapolis, MN 55474
Born 1960 | Vice President (2015) | President, Columbia Management Investment Services Corp. since October 2014; Vice President & Resolution Officer, Ameriprise Trust Company since August 2009. |
Multi-Manager Directional Alternative Strategies Fund | Annual Report 2019
| 57 |
Board Consideration and Approval of Subadvisory
Agreement
On December 13, 2018, the Board of Trustees (the Board) and the Trustees who are not interested persons (as defined in the Investment Company Act of 1940) (the Independent Trustees) of Columbia Funds Series Trust I (the Trust) unanimously approved an amended Subadvisory Agreement (the Amended Subadvisory Agreement) between Columbia Management Investment Advisers, LLC (the Investment Manager) and AQR Capital Management, LLC (the Subadviser) with respect to Multi-Manager Directional Alternative Strategies Fund (the Fund), a series of the Trust. As detailed below, the Board’s Advisory Fees and Expenses Committee (the Committee) and the Board met to review and discuss, among themselves and with the management team of the Investment Manager and others, materials provided by the Investment Manager before determining to approve the Amended Subadvisory Agreement.
In connection with their deliberations regarding the Amended Subadvisory Agreement, the Committee and the Board evaluated materials provided by the Investment Manager regarding the Fund and the Amended Subadvisory Agreement and discussed these materials, as well as other materials provided by the Investment Manager in connection with the Board’s most recent annual approval of the continuation of the Fund’s Management Agreement (the Management Agreement) and existing subadvisory agreement (the Existing Subadvisory Agreement) with the Subadviser with respect to the Fund, with representatives of the Investment Manager at a Committee meeting held on December 12, 2018 and at a Board meeting held on December 13, 2018 and noted that they had considered the continuance of the Existing Subadvisory Agreement at the June 2018 meeting. The Committee and the Board also consulted with Fund counsel and the Independent Trustees’ independent legal counsel, who advised on various matters with respect to the Committee’s and the Board’s considerations and otherwise assisted the Committee and the Board in their deliberations.
In addition, the Committee and the Board considered that the Subadviser manages sleeves of two other funds in the Columbia fund complex and had recently begun managing the assets of an affiliated fund overseen by a separate board pursuant to a separate subadvisory agreement. The Committee and the Board considered representations from management that the Investment Manager and the Subadviser wished to more closely conform the terms of the Fund’s Existing Subadvisory Agreement to the terms of a more recently negotiated separate subadvisory agreement and also considered that the subadvisory fee rate would not change and management’s representation that it did not view the changes to the Existing Subadvisory Agreement to be material.
The Committee and the Board considered all information that they, their legal counsel or the Investment Manager believed reasonably necessary to evaluate and to determine whether to recommend for approval or approve the Amended Subadvisory Agreement. The information and factors considered by the Committee and the Board in recommending for approval or approving the Amended Subadvisory Agreement for the Fund included the following:
| • | Information on the investment performance of the Fund relative to the performance of a group of mutual funds determined to be comparable to the Fund by the Investment Manager, as well as performance relative to benchmarks; |
| • | Information on the Fund’s management fees and total expenses, including information comparing the Fund’s expenses to those of a group of comparable mutual funds, as determined by the Investment Manager; |
| • | The Investment Manager’s agreement to contractually limit or cap total operating expenses for the Fund through July 31, 2019 so that total operating expenses (excluding certain fees and expenses, such as transaction costs and certain other investment related expenses, interest, taxes, acquired fund fees and expenses, and infrequent and/or unusual expenses) would not exceed a specified annual rate, as a percentage of the Fund’s net assets; |
| • | The terms and conditions of the Amended Subadvisory Agreement; |
| • | The subadvisory fees payable by the Investment Manager under the Amended Subadvisory Agreement; |
| • | Descriptions of various functions performed by the Subadviser under the Amended Subadvisory Agreement, including portfolio management and portfolio trading practices; |
| • | Information regarding the reputation, regulatory history and resources of the Subadviser, including information regarding senior management, portfolio managers and other personnel; |
| • | Information regarding the capabilities of the Subadviser with respect to compliance monitoring services, including an assessment of the Subadviser’s compliance system by the Fund’s Chief Compliance Officer; and |
| 58 | Multi-Manager Directional Alternative Strategies Fund | Annual Report 2019 |
Board Consideration and Approval of Subadvisory
Agreement (continued)
| • | The profitability to the Investment Manager and its affiliates from their relationships with the Fund. |
Nature, extent and quality of services provided under the amended Subadvisory Agreement
The Committee and the Board considered the nature, extent and quality of services provided to the Fund by the Subadviser under the Amended Subadvisory Agreement and the resources dedicated to the Fund and the other Columbia Funds by the Subadviser. The Committee and the Board considered, among other things, the Subadviser’s advisory and supervisory investment professionals (including personnel involved in fund management, reputation and other attributes), the portfolio management services provided by those investment professionals, and the quality of the Subadviser’s investment research capabilities.
The Committee and the Board also considered the professional experience and qualifications of the senior personnel of the Subadviser, which included consideration of the Subadviser’s experience with funds using an investment strategy similar to that used by the Subadviser for the Fund. The Board also noted that, based on information provided by the Investment Manager, the Board had approved the Subadviser’s code of ethics and compliance program, and that the Chief Compliance Officer of the Funds reports to the Trustees on the Subadviser’s compliance program.
The Committee and the Board considered the diligence and selection process undertaken by the Investment Manager to select the Subadviser, including the Investment Manager’s rationale for recommending the approval of the Amended Subadvisory Agreement, and the process for monitoring the Subadviser’s ongoing performance of services for the Fund. As part of these deliberations, the Committee and the Board considered the ability of the Investment Manager, subject to the approval of the Board, to modify or enter into new subadvisory agreements without a shareholder vote pursuant to an exemptive order of the Securities and Exchange Commission.
After reviewing these and related factors, the Committee and the Board concluded, within the context of their overall conclusions, that the nature, extent and quality of the services provided to the Fund under the Amended Subadvisory Agreement supported the approval of the Amended Subadvisory Agreement.
Investment performance
The Committee and the Board reviewed information about the performance of the Fund over various time periods, including performance information relative to benchmarks, information that compared the performance of the Fund to the performance of a group of comparable mutual funds as determined by the Investment Manager and information and analysis provided by the independent fee consultant. The Committee and the Board also reviewed a description of the Investment Manager’s methodology for identifying the Fund’s peer groups for purposes of performance and expense comparisons.
The Committee and the Board noted that, through December 31, 2017, the Fund’s performance was in the eighth percentile (where the best performance would be in the first percentile) of its category selected by the Investment Manager for the purposes of performance comparisons for the one-year period.
The Committee and the Board also considered the Subadviser’s performance and reputation generally and the Investment Manager’s evaluation of the Subadviser’s contribution to the Fund’s broader investment mandate. After reviewing these and related factors, the Committee and the Board concluded, within the context of their overall conclusions, that the performance of the Fund and the Subadviser were sufficient, in light of other considerations, to support the approval of the Amended Subadvisory Agreement.
Subadvisory fee rate and other expenses
The Committee and the Board considered the subadvisory fees charged to the Fund under the Amended Subadvisory Agreement, as well as the total expenses incurred by the Fund. The Committee and the Board also considered the fees that the Subadviser charges to its other clients, and noted that the Investment Manager pays the fees of the Subadviser. The Committee and the Board also took into account the fee waiver and expense limitation arrangements agreed to by the Investment Manager, as noted above.
Multi-Manager Directional Alternative Strategies Fund | Annual Report 2019
| 59 |
Board Consideration and Approval of Subadvisory
Agreement (continued)
After reviewing these and related factors, the Committee and the Board concluded, within the context of their overall conclusions, that the subadvisory fee rates and expenses of the Fund, in light of other considerations, supported the approval of the Amended Subadvisory Agreement.
Costs of services provided and profitability
The Committee and the Board also took note of the costs the Investment Manager and its affiliates incur in connection with the services provided and the profitability to the Investment Manager and its affiliates from their relationships with the Fund.
The Committee and the Board also considered the compensation directly or indirectly received by the Investment Manager’s affiliates in connection with their relationships with the Fund. The Committee and the Board reviewed information provided by management as to the profitability to the Investment Manager and its affiliates of their relationships with the Fund, including with respect to funds for which unaffiliated subadvisers provide services, information about the allocation of expenses used to calculate profitability, and comparisons of profitability levels realized in 2017 to profitability levels realized in 2016. When reviewing profitability, the Committee and the Board also considered court cases in which adviser profitability was an issue in whole or in part, the performance of similarly managed funds, the performance of the Fund, and the expense ratio of the Fund. In addition, the Committee and the Board considered information provided by the Investment Manager regarding the Investment Manager’s financial condition and comparing its profitability to that of other asset management firms that are, or are subsidiaries of, publicly traded companies. In this regard, the Committee and the Board also considered data provided by the independent fee consultant. Because the Amended Subadvisory Agreement was negotiated at arms-length by the Investment Manager, which is responsible for payments to the Subadviser thereunder, the Committee and the Board did not consider the profitability to the Subadviser from its relationship with the Fund.
After reviewing these and related factors, the Committee and the Board concluded, within the context of their overall conclusions, that the costs of services provided and the profitability to the Investment Manager and its affiliates from their relationships with the Fund supported the approval of the Amended Subadvisory Agreement.
Economies of scale
The Committee and the Board considered the potential existence of economies of scale in the provision by the Investment Manager of services to the Fund, to groups of related funds, and to the Investment Manager’s investment advisory clients as a whole, and whether those economies of scale were shared with the Fund through breakpoints in investment management fees or other means, such as expense limitation arrangements and additional investments by the Investment Manager in investment, trading, compliance and other resources. The Committee and the Board noted that the management fee schedules for the Fund contained breakpoints that would reduce the fee rate on assets above specified threshold levels.
The Committee and the Board noted that the breakpoint in the Amended Subadvisory Agreement did not occur at the same levels as the breakpoints in the Management Agreement. The Committee and the Board noted that absent a shareholder vote, the Investment Manager would bear any increase in fees payable under the Amended Subadvisory Agreement. The Committee and the Board also noted the potential challenges of seeking to tailor the Management Agreement breakpoints to those of a subadvisory agreement in this context, and the effect that capacity constraints on a subadviser’s ability to manage assets could potentially have on the ability of the Investment Manager to achieve economies of scale, as new subadvisers may need to be added as the Fund grows, increasing the Investment Manager’s cost of compensating and overseeing the Fund’s subadvisers.
In considering these matters, the Committee and the Board also considered the costs of the services provided and the profitability to the Investment Manager and its affiliates from their relationships with the Fund, as noted above. After reviewing these and related factors, the Committee and the Board concluded, within the context of their overall conclusions, that the extent to which any economies of scale were expected to be shared with the Fund supported the approval of the Amended Subadvisory Agreement.
| 60 | Multi-Manager Directional Alternative Strategies Fund | Annual Report 2019 |
Board Consideration and Approval of Subadvisory
Agreement (continued)
Conclusion
The Committee and the Board reviewed all of the above considerations in reaching their decisions to recommend or approve the Amended Subadvisory Agreement. In their deliberations, the Trustees did not identify any particular information that was all-important or controlling, and individual Trustees may have attributed different weights to the various factors. Based on their evaluation of all factors that they deemed to be material, including those factors described above, and assisted by the advice of independent legal counsel, the Board, including the Independent Trustees, voting separately, unanimously approved the Amended Subadvisory Agreement.
Multi-Manager Directional Alternative Strategies Fund | Annual Report 2019
| 61 |
The Fund mails one shareholder report to each shareholder address, unless such shareholder elected to receive shareholder reports from the Fund electronically. If you would like more than one report, please call shareholder services at 800.345.6611 and additional reports will be sent to you.
Proxy voting policies and procedures
The policy of the Board of Trustees is to vote the proxies of the companies in which the Fund holds investments consistent with the procedures as stated in the Statement of Additional Information (SAI). You may obtain a copy of the SAI without charge by calling 800.345.6611; contacting your financial intermediary; visiting columbiathreadneedleus.com/investor/; or searching the website of the Securities and Exchange Commission (SEC) at sec.gov. Information regarding how the Fund voted proxies relating to portfolio securities is filed with the SEC by August 31st for the most recent 12-month period ending June 30th of that year, and is available without charge by visiting columbiathreadneedleus.com/investor/, or searching the website of the SEC at sec.gov.
Quarterly schedule of investments
The Fund files a complete schedule of portfolio holdings with the SEC for the first and third quarters of each fiscal year on Form N-Q or Form N-PORT (available for filings after March 31, 2019). The Fund’s Form N-Q or Form N-PORT is available on the SEC’s website at sec.gov. The Fund’s complete schedule of portfolio holdings, as filed on Form N-Q or Form N-PORT, can also be obtained without charge, upon request, by calling 800.345.6611.
Additional Fund information
For more information about the Fund, please visit columbiathreadneedleus.com/investor/ or call 800.345.6611. Customer Service Representatives are available to answer your questions Monday through Friday from 8 a.m. to 7 p.m. Eastern time.
You may obtain the current net asset value (NAV) of Fund shares at no cost by calling 800.345.6611 or by sending an e-mail to serviceinquiries@columbiathreadneedle.com.
Fund investment manager
Columbia Management Investment Advisers, LLC
225 Franklin Street
Boston, MA 02110
Fund distributor
Columbia Management Investment Distributors, Inc.
225 Franklin Street
Boston, MA 02110
Fund transfer agent
Columbia Management Investment Services Corp.
P.O. Box 219104
Kansas City, MO 64121-9104
| 62 | Multi-Manager Directional Alternative Strategies Fund | Annual Report 2019 |
[THIS PAGE INTENTIONALLY LEFT BLANK]
Multi-Manager Directional Alternative Strategies Fund
P.O. Box 219104
Kansas City, MO 64121-9104
Please read and consider the investment objectives, risks, charges and expenses for any fund carefully before investing. For a prospectus and summary prospectus, which contains this and other important information about the Fund, go to
columbiathreadneedleus.com/investor/. The Fund is distributed by Columbia Management Investment Distributors, Inc., member FINRA, and managed by Columbia Management Investment Advisers, LLC.
Columbia Threadneedle Investments (Columbia Threadneedle) is the global brand name of the Columbia and Threadneedle group of companies. All rights reserved.
© 2019 Columbia Management Investment Advisers, LLC.
columbiathreadneedleus.com/investor/

Annual Report
April 30, 2019
Columbia Total Return Bond Fund
Beginning on January 1, 2021, as permitted by regulations adopted by the Securities and Exchange Commission, paper copies of the Fund’s annual and semiannual shareholder reports like this one will no longer be sent by mail, unless you specifically request paper copies of the reports. Instead, the reports will be made available on the Fund’s website (columbiathreadneedleus.com/investor/), and each time a report is posted you will be notified by mail and provided with a website address to access the report.
If you have already elected to receive shareholder reports electronically, you will not be affected by this change and you need not take any action. You may elect to receive shareholder reports and other communications from the Fund electronically at any time by contacting your financial intermediary (such as a broker-dealer or bank) or, for Fund shares held directly with the Fund, by calling 800.345.6611 or by enrolling in “eDelivery” by logging into your account at columbiathreadneedleus.com/investor/.
You may elect to receive all future reports in paper free of charge. If you invest through a financial intermediary, you can contact your financial intermediary to request that you continue receiving paper copies of your shareholder reports. If you invest directly with the Fund, you can call 800.345.6611 to let the Fund know you wish to continue receiving paper copies of your shareholder reports. Your election to receive paper reports will apply to all Columbia Funds held in your account if you invest through a financial intermediary or all Columbia Funds held with the fund complex if you invest directly with the Fund.
Not FDIC Insured • No bank guarantee • May lose value
Columbia Total Return Bond Fund | Annual Report 2019
Investment objective
Columbia Total Return Bond Fund (the Fund) seeks total return, consisting of current income and capital appreciation.
Portfolio management
Jason Callan
Lead Portfolio Manager
Managed Fund since 2016
Gene Tannuzzo, CFA
Portfolio Manager
Managed Fund since November 2017
| Average annual total returns (%) (for the period ended April 30, 2019) |
| | | Inception | 1 Year | 5 Years | 10 Years |
| Class A | Excluding sales charges | 07/31/00 | 5.45 | 2.79 | 5.07 |
| | Including sales charges | | 2.32 | 2.18 | 4.75 |
| Advisor Class* | 11/08/12 | 5.72 | 3.05 | 5.33 |
| Class C | Excluding sales charges | 02/01/02 | 4.66 | 2.05 | 4.38 |
| | Including sales charges | | 3.66 | 2.05 | 4.38 |
| Institutional Class | 12/05/78 | 5.60 | 3.05 | 5.33 |
| Institutional 2 Class* | 11/08/12 | 5.81 | 3.12 | 5.38 |
| Institutional 3 Class* | 11/08/12 | 5.73 | 3.15 | 5.41 |
| Class R | 01/23/06 | 5.19 | 2.54 | 4.81 |
| Bloomberg Barclays U.S. Aggregate Bond Index | | 5.29 | 2.57 | 3.72 |
Returns for Class A shares are shown with and without the maximum initial sales charge of 3.00%. Returns for Class C shares are shown with and without the 1.00% contingent deferred sales charge for the first year only. The Fund’s other share classes are not subject to sales charges and have limited eligibility. Please see the Fund’s prospectus for details. Performance for different share classes will vary based on differences in sales charges and fees associated with each share class. All results shown assume reinvestment of distributions during the period. Returns do not reflect the deduction of taxes that a shareholder may pay on Fund distributions or on the redemption of Fund shares. Performance results reflect the effect of any fee waivers or reimbursements of Fund expenses by Columbia Management Investment Advisers, LLC and/or any of its affiliates. Absent these fee waivers or expense reimbursement arrangements, performance results would have been lower.
The performance information shown represents past performance and is not a guarantee of future results. The investment return and principal value of your investment will fluctuate so that your shares, when redeemed, may be worth more or less than their original cost. Current performance may be lower or higher than the performance information shown. You may obtain performance information current to the most recent month-end by contacting your financial intermediary, visiting columbiathreadneedleus.com/investor/ or calling 800.345.6611.
| * | The returns shown for periods prior to the share class inception date (including returns for the Life of the Fund, if shown, which are since Fund inception) include the returns of the Fund’s oldest share class. These returns are adjusted to reflect any higher class-related operating expenses of the newer share classes, as applicable. Please visit columbiathreadneedleus.com/investor/investment-products/mutual-funds/appended-performance for more information. |
The Bloomberg Barclays U.S. Aggregate Bond Index, is a broad-based benchmark that measures the investment-grade, U.S. dollar-denominated, fixed-rate taxable bond market, including Treasuries, government-related and corporate securities, mortgage-backed securities (agency fixed-rate and hybrid adjustable-rate mortgage passthroughs), asset-backed securities, and commercial mortgage-backed securities.
Indices are not available for investment, are not professionally managed and do not reflect sales charges, fees, brokerage commissions, taxes or other expenses of investing. Securities in the Fund may not match those in an index.
Columbia Total Return Bond Fund | Annual Report 2019
| 3 |
Fund at a Glance (continued)
Performance of a hypothetical $10,000 investment (April 30, 2009 — April 30, 2019)
The chart above shows the change in value of a hypothetical $10,000 investment in Class A shares of Columbia Total Return Bond Fund during the stated time period, and does not reflect the deduction of taxes that a shareholder may pay on Fund distributions or on the redemption of Fund shares.
| Portfolio breakdown (%) (at April 30, 2019) |
| Asset-Backed Securities — Non-Agency | 14.6 |
| Commercial Mortgage-Backed Securities - Agency | 1.5 |
| Commercial Mortgage-Backed Securities - Non-Agency | 7.4 |
| Common Stocks | 0.0(a) |
| Corporate Bonds & Notes | 20.3 |
| Foreign Government Obligations | 2.5 |
| Money Market Funds | 3.6 |
| Municipal Bonds | 0.1 |
| Options Purchased Calls | 0.0(a) |
| Options Purchased Puts | 0.0(a) |
| Residential Mortgage-Backed Securities - Agency | 28.1 |
| Residential Mortgage-Backed Securities - Non-Agency | 21.3 |
| Senior Loans | 0.1 |
| U.S. Treasury Obligations | 0.5 |
| Total | 100.0 |
Percentages indicated are based upon total investments including options purchased and excluding all other investments in derivatives, if any. The Fund’s portfolio composition is subject to change.
| Quality breakdown (%) (at April 30, 2019) |
| AAA rating | 39.8 |
| AA rating | 7.4 |
| A rating | 4.7 |
| BBB rating | 17.2 |
| BB rating | 3.7 |
| B rating | 4.1 |
| CCC rating | 0.7 |
| Not rated | 22.4 |
| Total | 100.0 |
Percentages indicated are based upon total fixed income investments.
Bond ratings apply to the underlying holdings of the Fund and not the Fund itself and are divided into categories ranging from highest to lowest credit quality, determined by using the middle rating of Moody’s, S&P and Fitch, after dropping the highest and lowest available ratings. When ratings are available from only two rating agencies, the lower rating is used. When a rating is available from only one rating agency, that rating is used. When a bond is not rated by any rating agency, it is designated as “Not rated.” Credit quality ratings assigned by a rating agency are subjective opinions, not statements of fact, and are subject to change, including daily. The ratings assigned by credit rating agencies are but one of the considerations that the Investment Manager and/or Fund’s subadviser incorporates into its credit analysis process, along with such other issuer-specific factors as cash flows, capital structure and leverage ratios, ability to de-leverage (repay) through free cash flow, quality of management, market positioning and access to capital, as well as such security-specific factors as the terms of the security (e.g., interest rate and time to maturity) and the amount and type of any collateral.
| 4 | Columbia Total Return Bond Fund | Annual Report 2019 |
Fund at a Glance (continued)
| Market exposure through derivatives investments (% of notional exposure) (at April 30, 2019)(a) |
| | Long | Short | Net |
| Fixed Income Derivative Contracts | 1,760.4 | (1,860.4) | (100.0) |
| Total Notional Market Value of Derivative Contracts | 1,760.4 | (1,860.4) | (100.0) |
(a) The Fund has market exposure (long and/or short) to fixed income through its investments in derivatives. The notional exposure of a financial instrument is the nominal or face amount that is used to calculate payments made on that instrument and/or changes in value for the instrument. The notional exposure is a hypothetical underlying quantity upon which payment obligations are computed. Notional exposures provide a gauge for how the Fund may behave given changes in individual markets. For a description of the Fund’s investments in derivatives, see Investments in derivatives following the Portfolio of Investments, and Note 2 to the Notes to Financial Statements.
Columbia Total Return Bond Fund | Annual Report 2019
| 5 |
Manager Discussion of Fund Performance
For the 12-month period that ended April 30, 2019, the Fund’s Class A shares returned 5.45% excluding sales charges. The Fund’s benchmark, the Bloomberg Barclays U.S. Aggregate Bond Index, returned 5.29% for the same period. The Fund’s relative performance was aided by allocation across segments of the bond market, security selection and positioning with respect to interest rates.
Risk sentiment driven by shifting Federal Reserve posture
As the period opened, credit sentiment was bolstered by positive economic growth, strong corporate profits and the supportive tax legislation passed at the end of 2017. The outlook was clouded to some degree by the Trump administration’s escalating anti-free trade rhetoric, which led to bouts of market volatility. In addition to keeping a wary eye on trade disputes, fixed income investors focused on the trajectory of efforts by the U.S. Federal Reserve (the Fed) to “normalize” interest rates. With inflation hovering near its 2% target and the vast majority of companies reporting above-expectation second quarter earnings, the Fed began to foreshadow a more hawkish stance as the period progressed. At its June 13 meeting, the Fed increased the target range for its benchmark overnight lending rate by 25 basis points to between 1.75% and 2.00%. Promising economic data would subsequently lead the markets to anticipate two additional rate hikes before the end of 2018. Indeed, at its September meeting, the Fed implemented another quarter-point hike in the federal funds rate to the 2.00% to 2.25% range while signaling the likelihood of a December increase. Entering the fourth quarter of 2018, stress began to rise in the credit markets and spreads started to widen.
In mid-December, the Fed met expectations and raised its short-term rate target to the 2.25% to 2.50% range, while noting the potential for two additional hikes in 2019. In combination with the ongoing Brexit debacle and signs of slowing global growth, fears that the Fed would overshoot on rates led to a spike in volatility for risk assets. Over the last three months of 2018, the 10-year Treasury yield declined from 3.05% to 2.69% as investors sought a safe haven. Energy-related issues were battered as crude oil prices plunged over the fourth quarter on concerns around a weaker demand outlook and higher-than-expected supply driven in part by a loosening of U.S. sanctions on Iran.
Risk-oriented assets rebounded sharply in January of 2019 as the Fed pivoted to a more dovish tone, announcing an early end to its balance sheet reduction program and indicating it was leaning toward putting rate increases on pause. Weak economic data out of the eurozone and China led to renewed accommodation from the European Central Bank and the People’s Bank of China, to go along with the Fed’s actions. Modest progress on trade matters, a firming in oil prices and positive corporate earnings reports also helped boost credit sentiment. While the overall pace of gains moderated and there was some interim volatility, credit sensitive assets continued to outperform through the end of April 2019.
Yields finished lower along the length of the U.S. Treasury curve over the 12-month period ended April 30, 2019, with yields on intermediate maturities experiencing the biggest declines. To illustrate, the two-year Treasury yield fell 22 basis points from 2.49% to 2.27%, the five-year declined 51 basis points from 2.79% to 2.28%, the 10-year declined 44 basis points from 2.95% to 2.51%, the 20-year declined 26 basis points from 3.01% to 2.75%, and the 30-year yield declined 18 basis points from 3.11% to 2.93%.
Contributors and detractors
Positive contributions to the Fund’s performance were more or less balanced across sector allocation, security selection and positioning with respect to interest rates. With respect to sector allocation, the Fund’s weighting toward securitized assets driven by a positive view on consumer fundamentals led contributions. Within securitized assets, an off-benchmark allocation to non-agency mortgage-backed securities added most notably to performance, while exposures to commercial mortgage-backed securities and asset-backed securities were beneficial as well. Exposure to foreign government-related or “quasi-sovereign” issuers also benefited performance, highlighted by a position in a Mexican energy company. On the downside, an allocation to emerging market bonds detracted as the Argentinian financial crisis weighed on the segment.
In terms of security selection, positive contributions were led by our preference within agency mortgage-backed securities for collateralized mortgage obligations structured to protect against prepayment risk, as prices for these issues benefited from declining interest rates. Selection was also positive within asset-backed securities where a tilt toward receivables backed by unsecured consumer loans aided performance, as well as within commercial mortgage-backed securities. These
| 6 | Columbia Total Return Bond Fund | Annual Report 2019 |
Manager Discussion of Fund Performance (continued)
contributions were partially offset by a focus within investment grade corporates on longer-maturity, lower-rated issues in the BBB quality range, as the segment was more impacted by late-2018’s rout in credit markets than the rest of the investment grade sector.
Finally, the Fund’s above-benchmark positioning during the period with respect to overall portfolio duration (and corresponding sensitivity to interest rates) had a positive impact on performance as Treasury yields declined.
We invested in highly-liquid, widely-traded Treasury futures and interest rate swap contracts to help manage portfolio duration. These enable us to efficiently implement our yield curve opinions and offset unintended yield curve impacts from other investments in the portfolio. We also used indexed exposure to credit default swaps to manage the Fund’s overall level of credit risk. On a standalone basis, the Fund’s use of derivatives did not materially impact performance.
At period’s end
At the close of the reporting period, we had a cautious view on whether economic activity would be sustained at its current level over the next few quarters. In our view, it seemed likely that U.S. growth would ease as the effects of tax cuts and fiscal stimulus roll off. In terms of support from overseas, while we saw signs of some firming in China growth, European economies remained under stress. The Fund was positioned with a modest overweight to duration on our view that upward pressure on interest rates was likely to be restrained against this backdrop.
With respect to corporate credit, the Fund’s positioning was biased toward higher quality given the extended duration of the current recovery and relatively full valuations. We continued to view the consumer as in an earlier stage of the credit cycle relative to corporations, supported by historically low unemployment, wage gains and strength in housing. In this vein, the Fund was emphasizing segments such as non-agency mortgage-backed securities and asset-backed securities, along with commercial mortgage-backed securities.
Marketrisk may affect a single issuer, sector of the economy, industry or the market as a whole. Fixed-income securities presentissuer default risk. A rise ininterest rates may result in a price decline of fixed-income instruments held by the Fund, negatively impacting its performance and NAV. Falling rates may result in the Fund investing in lower yielding debt instruments, lowering the Fund’s income and yield. These risks may be heightened for longer maturity and duration securities.Prepayment and extensionrisk exists because the timing of payments on a loan, bond or other investment may accelerate when interest rates fall or decelerate wheninterest rates rise which may reduce investment opportunities and potential returns.Non-investment-grade (high-yield or junk) securities present greater price volatility and more risk to principal and income than higher rated securities. Investing inderivatives is a specialized activity that involves special risks that subject the Fund to significant loss potential, including when used as leverage, and may result in greater fluctuation in fund value. Market or other (e.g., interest rate) environments may adversely affect theliquidity of fund investments, negatively impacting their price. Generally, the less liquid the market at the time the Fund sells a holding, the greater the risk of loss or decline of value to the Fund.See the Fund’s prospectus for more information on these and other risks.
The views expressed in this report reflect the current views of the respective parties. These views are not guarantees of future performance and involve certain risks, uncertainties and assumptions that are difficult to predict, so actual outcomes and results may differ significantly from the views expressed. These views are subject to change at any time based upon economic, market or other conditions and the respective parties disclaim any responsibility to update such views. These views may not be relied on as investment advice and, because investment decisions for a Columbia fund are based on numerous factors, may not be relied on as an indication of trading intent on behalf of any particular Columbia fund. References to specific securities should not be construed as a recommendation or investment advice.
Columbia Total Return Bond Fund | Annual Report 2019
| 7 |
Understanding Your Fund’s Expenses
(Unaudited)
As an investor, you incur two types of costs. There are shareholder transaction costs, which generally include sales charges on purchases and may include redemption fees. There are also ongoing fund costs, which generally include management fees, distribution and/or service fees, and other fund expenses. The following information is intended to help you understand your ongoing costs (in dollars) of investing in the Fund and to help you compare these costs with the ongoing costs of investing in other mutual funds.
Analyzing your Fund’s expenses
To illustrate these ongoing costs, we have provided examples and calculated the expenses paid by investors in each share class of the Fund during the period. The actual and hypothetical information in the table is based on an initial investment of $1,000 at the beginning of the period indicated and held for the entire period. Expense information is calculated two ways and each method provides you with different information. The amount listed in the “Actual” column is calculated using the Fund’s actual operating expenses and total return for the period. You may use the Actual information, together with the amount invested, to estimate the expenses that you paid over the period. Simply divide your account value by $1,000 (for example, an $8,600 account value divided by $1,000 = 8.6), then multiply the results by the expenses paid during the period under the “Actual” column. The amount listed in the “Hypothetical” column assumes a 5% annual rate of return before expenses (which is not the Fund’s actual return) and then applies the Fund’s actual expense ratio for the period to the hypothetical return. You should not use the hypothetical account values and expenses to estimate either your actual account balance at the end of the period or the expenses you paid during the period. See “Compare with other funds” below for details on how to use the hypothetical data.
Compare with other funds
Since all mutual funds are required to include the same hypothetical calculations about expenses in shareholder reports, you can use this information to compare the ongoing cost of investing in the Fund with other funds. To do so, compare the hypothetical example with the 5% hypothetical examples that appear in the shareholder reports of other funds. As you compare hypothetical examples of other funds, it is important to note that hypothetical examples are meant to highlight the ongoing costs of investing in a fund only and do not reflect any transaction costs, such as sales charges, or redemption or exchange fees. Therefore, the hypothetical calculations are useful in comparing ongoing costs only, and will not help you determine the relative total costs of owning different funds. If transaction costs were included in these calculations, your costs would be higher.
| November 1, 2018 — April 30, 2019 |
| | Account value at the
beginning of the
period ($) | Account value at the
end of the
period ($) | Expenses paid during
the period ($) | Fund’s annualized
expense ratio (%) |
| | Actual | Hypothetical | Actual | Hypothetical | Actual | Hypothetical | Actual |
| Class A | 1,000.00 | 1,000.00 | 1,057.90 | 1,020.53 | 4.39 | 4.31 | 0.86 |
| Advisor Class | 1,000.00 | 1,000.00 | 1,059.30 | 1,021.77 | 3.11 | 3.06 | 0.61 |
| Class C | 1,000.00 | 1,000.00 | 1,054.00 | 1,016.81 | 8.20 | 8.05 | 1.61 |
| Institutional Class | 1,000.00 | 1,000.00 | 1,058.00 | 1,021.77 | 3.11 | 3.06 | 0.61 |
| Institutional 2 Class | 1,000.00 | 1,000.00 | 1,059.80 | 1,022.22 | 2.66 | 2.61 | 0.52 |
| Institutional 3 Class | 1,000.00 | 1,000.00 | 1,058.70 | 1,022.41 | 2.45 | 2.41 | 0.48 |
| Class R | 1,000.00 | 1,000.00 | 1,056.70 | 1,019.29 | 5.66 | 5.56 | 1.11 |
Expenses paid during the period are equal to the annualized expense ratio for each class as indicated above, multiplied by the average account value over the period and then multiplied by the number of days in the Fund’s most recent fiscal half year and divided by 365.
Expenses do not include fees and expenses incurred indirectly by the Fund from its investment in underlying funds, including affiliated and non-affiliated pooled investment vehicles, such as mutual funds and exchange-traded funds.
Had Columbia Management Investment Advisers, LLC and/or certain of its affiliates not waived/reimbursed certain fees and expenses, account value at the end of the period would have been reduced.
| 8 | Columbia Total Return Bond Fund | Annual Report 2019 |
Portfolio of Investments
April 30, 2019
(Percentages represent value of investments compared to net assets)
Investments in securities
| Asset-Backed Securities — Non-Agency 17.6% |
| Issuer | Coupon
Rate | | Principal
Amount ($) | Value ($) |
| American Credit Acceptance Receivables Trust(a) |
| Subordinated, Series 2018-3 Class C |
| 10/15/2024 | 3.750% | | 2,600,000 | 2,615,323 |
| ARES XLVI CLO Ltd.(a),(b) |
| Series 2017-46A Class B1 |
3-month USD LIBOR + 1.350%
01/15/2030 | 3.947% | | 7,780,000 | 7,634,265 |
| Avant Loans Funding Trust(a) |
| Series 2018-A Class A |
| 06/15/2021 | 3.090% | | 3,536,976 | 3,534,920 |
| Series 2018-B Class A |
| 01/18/2022 | 3.420% | | 9,579,644 | 9,588,934 |
| Series 2019-A Class A |
| 07/15/2022 | 3.480% | | 11,745,020 | 11,767,830 |
| Subordinated, Series 2018-B Class B |
| 07/15/2022 | 4.110% | | 8,400,000 | 8,462,323 |
| Carlyle Group LP(a),(b) |
| Series 2017-5A Class A2 |
3-month USD LIBOR + 1.400%
01/20/2030 | 3.992% | | 11,810,000 | 11,625,197 |
| Cent CLO Ltd.(a),(b) |
| Series 2018-C17A Class A2R |
3-month USD LIBOR + 1.600%
04/30/2031 | 4.183% | | 9,300,000 | 9,211,669 |
| CLUB Credit Trust(a) |
| Series 2017-P2 Class A |
| 01/15/2024 | 2.610% | | 4,541,720 | 4,525,553 |
| Series 2018-NP1 Class B |
| 05/15/2024 | 3.670% | | 2,734,398 | 2,734,991 |
| Series 2018-P3 Class A |
| 01/15/2026 | 3.820% | | 7,594,981 | 7,640,979 |
| Subordinated, Series 2017-P2 Class B |
| 01/15/2024 | 3.560% | | 5,250,000 | 5,253,537 |
| Conn’s Receivables Funding LLC(a) |
| Series 2018-A Class A |
| 01/15/2023 | 3.250% | | 2,833,180 | 2,837,842 |
| Subordinated, Series 2017-B Class B |
| 04/15/2021 | 4.520% | | 3,774,695 | 3,783,577 |
| Consumer Lending Receivables Trust(a) |
| Series 2019-A Class A |
| 04/15/2026 | 3.520% | | 11,041,397 | 11,057,141 |
| Series 2019-A Class B |
| 04/15/2026 | 4.010% | | 3,000,000 | 3,018,668 |
| Consumer Loan Underlying Bond Credit Trust(a) |
| Series 2017-NP2 Class B |
| 01/16/2024 | 3.500% | | 594,852 | 594,968 |
| Asset-Backed Securities — Non-Agency (continued) |
| Issuer | Coupon
Rate | | Principal
Amount ($) | Value ($) |
| Series 2018-P1 Class A |
| 07/15/2025 | 3.390% | | 10,821,443 | 10,832,343 |
| Series 2018-P2 Class A |
| 10/15/2025 | 3.470% | | 4,894,379 | 4,902,606 |
| Credit Suisse ABS Trust(a) |
| Series 2018-LD1 Class A |
| 07/25/2024 | 3.420% | | 3,339,010 | 3,338,846 |
| Drive Auto Receivables Trust |
| Series 2018-4 Class C |
| 11/15/2024 | 3.660% | | 4,800,000 | 4,833,894 |
| Dryden 57 CLO Ltd.(a),(b) |
| Series 2018-57A Class B |
3-month USD LIBOR + 1.350%
Floor 1.350%
05/15/2031 | 4.034% | | 7,000,000 | 6,865,376 |
| DT Auto Owner Trust(a) |
| Subordinated, Series 2018-3A Class C |
| 07/15/2024 | 3.790% | | 3,200,000 | 3,233,394 |
| Subordinated, Series 2018-3A Class D |
| 07/15/2024 | 4.190% | | 9,900,000 | 10,085,836 |
| Goldentree Loan Opportunities XI Ltd.(a),(b) |
| Series 2015-11A Class BR2 |
3-month USD LIBOR + 1.350%
01/18/2031 | 3.951% | | 5,000,000 | 4,908,880 |
| Hertz Vehicle Financing II LP(a) |
| Subordinated, Series 2016-3A Class D |
| 07/25/2020 | 5.410% | | 3,775,000 | 3,777,170 |
| Madison Park Funding XXVII Ltd.(a),(b) |
| Series 2018-27A Class A2 |
3-month USD LIBOR + 1.350%
04/20/2030 | 3.992% | | 21,000,000 | 20,606,292 |
| Madison Park Funding XXXII Ltd.(a),(b) |
| Series 2018-32A Class C |
3-month USD LIBOR + 2.900%
Floor 2.900%
01/22/2031 | 5.492% | | 6,000,000 | 6,044,940 |
| Marlette Funding Trust(a) |
| Series 2018-1A Class B |
| 03/15/2028 | 3.190% | | 8,000,000 | 7,977,331 |
| Series 2019-1A Class B |
| 04/16/2029 | 3.940% | | 4,800,000 | 4,863,695 |
| Morgan Stanley Resecuritization Pass-Through Trust(a),(c) |
| Series 2018-SC1 Class B |
| 09/18/2023 | 1.000% | | 4,700,000 | 4,559,000 |
The accompanying Notes to Financial Statements are an integral part of this statement.
Columbia Total Return Bond Fund | Annual Report 2019
| 9 |
Portfolio of Investments (continued)
April 30, 2019
| Asset-Backed Securities — Non-Agency (continued) |
| Issuer | Coupon
Rate | | Principal
Amount ($) | Value ($) |
| Octagon Investment Partners 35 Ltd.(a),(b) |
| Series 2018-1A Class A2 |
3-month USD LIBOR + 1.400%
Floor 1.400%
01/20/2031 | 3.992% | | 9,350,000 | 9,179,241 |
| Octagon Investment Partners XXII Ltd.(a),(b) |
| Series 2014-1A Class BRR |
3-month USD LIBOR + 1.450%
Floor 1.450%
01/22/2030 | 4.042% | | 22,000,000 | 21,602,944 |
| Ocwen Master Advance Receivables Trust(a),(c) |
| Series 2018-T1 Class AT1 |
| 08/15/2049 | 3.301% | | 4,600,000 | 4,600,552 |
| OneMain Financial Issuance Trust(a) |
| Series 2015-1A Class A |
| 03/18/2026 | 3.190% | | 116,079 | 116,072 |
| Series 2018-1A Class A |
| 03/14/2029 | 3.300% | | 11,100,000 | 11,164,805 |
| OZLM Funding IV Ltd.(a),(b) |
| Series 2013-4A Class D2R |
3-month USD LIBOR + 7.250%
10/22/2030 | 9.842% | | 1,000,000 | 992,598 |
| OZLM XXI(a),(b) |
| Series 2017-21A Class A1 |
3-month USD LIBOR + 1.150%
01/20/2031 | 3.742% | | 12,900,000 | 12,881,501 |
| Series 2017-21A Class A2 |
3-month USD LIBOR + 1.450%
01/20/2031 | 4.042% | | 11,475,000 | 11,334,294 |
| Prosper Marketplace Issuance Trust(a) |
| Series 2018-1A Class A |
| 06/17/2024 | 3.110% | | 2,077,636 | 2,078,256 |
| Series 2018-1A Class B |
| 06/17/2024 | 3.900% | | 10,000,000 | 10,037,842 |
| Series 2018-1A Class C |
| 06/17/2024 | 4.870% | | 5,500,000 | 5,565,949 |
| Series 2019-1A Class A |
| 04/15/2025 | 3.540% | | 4,523,814 | 4,532,549 |
| Subordinated, Series 2017-1A Class C |
| 06/15/2023 | 5.800% | | 2,900,000 | 2,928,288 |
| Subordinated, Series 2017-2A Class C |
| 09/15/2023 | 5.370% | | 4,000,000 | 4,024,025 |
| RR 3 Ltd.(a),(b) |
| Series 2014-14A Class A2R2 |
3-month USD LIBOR + 1.400%
Floor 1.400%
01/15/2030 | 3.997% | | 14,625,000 | 14,400,389 |
| SoFi Consumer Loan Program Trust(a) |
| Series 2018-1 Class A1 |
| 02/25/2027 | 2.550% | | 3,016,869 | 3,008,010 |
| Asset-Backed Securities — Non-Agency (continued) |
| Issuer | Coupon
Rate | | Principal
Amount ($) | Value ($) |
| Series 2018-1 Class A2 |
| 02/25/2027 | 3.140% | | 5,200,000 | 5,210,392 |
| Series 2018-2 Class A1 |
| 04/26/2027 | 2.930% | | 2,074,723 | 2,074,531 |
| SoFi Professional Loan Program LLC(a),(c),(d),(e),(f) |
| Series 2015-D Class RC |
| 10/26/2037 | 0.000% | | 2 | 648,310 |
| Series 2016-A Class RIO |
| 01/25/2038 | 0.000% | | 3 | 719,866 |
| Series 2016-A Class RPO |
| 01/25/2038 | 0.000% | | 4 | 1,580,615 |
| Series 2016-B Class RC |
| 04/25/2037 | 0.000% | | 1 | 264,773 |
| SoFi Professional Loan Program LLC(a),(c),(d),(f) |
| Series 2017-A Class R |
| 03/26/2040 | 0.000% | | 12,500 | 641,250 |
| Stewart Park CLO Ltd.(a),(b) |
| Series 2017-1A Class A2R |
3-month USD LIBOR + 1.250%
Floor 1.250%
01/15/2030 | 3.847% | | 4,000,000 | 3,906,124 |
| Series 2017-1A Class BR |
3-month USD LIBOR + 1.370%
Floor 1.370%
01/15/2030 | 3.967% | | 5,828,571 | 5,727,370 |
| Voya Ltd.(a),(b) |
| Series 2012-4A Class A1R |
3-month USD LIBOR + 1.450%
10/15/2028 | 4.047% | | 10,000,000 | 10,010,450 |
Total Asset-Backed Securities — Non-Agency
(Cost $355,495,110) | 351,948,316 |
|
| Commercial Mortgage-Backed Securities - Agency 1.9% |
| | | | |
| Federal Home Loan Mortgage Corp. Multifamily Structured Pass-Through Certificates(g) |
| Series 2017-K070 Class A2 |
| 11/25/2027 | 3.303% | | 6,745,000 | 6,923,465 |
| Federal National Mortgage Association(g) |
| Series 2017-M15 Class ATS2 |
| 11/25/2027 | 3.196% | | 22,600,000 | 22,688,775 |
| FRESB Mortgage Trust(g) |
| Series 2018-SB45 Class A10F |
| 11/25/2027 | 3.160% | | 7,556,865 | 7,568,282 |
Total Commercial Mortgage-Backed Securities - Agency
(Cost $37,345,867) | 37,180,522 |
|
| Commercial Mortgage-Backed Securities - Non-Agency 8.8% |
| | | | |
| American Homes 4 Rent Trust(a) |
| Series 2014-SFR3 Class A |
| 12/17/2036 | 3.678% | | 1,476,364 | 1,504,464 |
The accompanying Notes to Financial Statements are an integral part of this statement.
| 10 | Columbia Total Return Bond Fund | Annual Report 2019 |
Portfolio of Investments (continued)
April 30, 2019
| Commercial Mortgage-Backed Securities - Non-Agency (continued) |
| Issuer | Coupon
Rate | | Principal
Amount ($) | Value ($) |
| Series 2015-SFR2 Class A |
| 10/17/2045 | 3.732% | | 12,050,425 | 12,332,792 |
| BBCMS Trust(a),(b) |
| Subordinated, Series 2018-BXH Class E |
1-month USD LIBOR + 2.250%
Floor 2.250%
10/15/2037 | 4.723% | | 4,790,000 | 4,789,960 |
| BHMS Mortgage Trust(a),(b) |
| Series 2018-ATLS Class C |
1-month USD LIBOR + 1.900%
Floor 1.900%
07/15/2035 | 4.373% | | 7,700,000 | 7,693,005 |
| Braemar Hotels & Resorts Trust(a),(b) |
| Series 2018-PRME Class D |
1-month USD LIBOR + 1.800%
Floor 1.925%
06/15/2035 | 4.284% | | 3,100,000 | 3,057,338 |
| Series 2018-PRME Class E |
1-month USD LIBOR + 2.400%
Floor 2.400%
06/15/2035 | 4.873% | | 3,000,000 | 3,007,604 |
| BX Trust(a),(b) |
| Series 2018-GW Class F |
1-month USD LIBOR + 2.420%
Floor 2.420%
05/15/2035 | 4.893% | | 4,400,000 | 4,426,219 |
| CALI Mortgage Trust(a),(g) |
| Series 2019-101C Class E |
| 03/10/2039 | 4.469% | | 6,800,000 | 6,868,200 |
| CHT 2017-COSMO Mortgage Trust(a),(b) |
| Series 2017-CSMO Class C |
1-month USD LIBOR + 1.500%
Floor 1.350%
11/15/2036 | 3.973% | | 5,000,000 | 5,000,145 |
| Series 2017-CSMO Class E |
1-month USD LIBOR + 3.000%
Floor 3.000%
11/15/2036 | 5.473% | | 11,500,000 | 11,528,630 |
| Citigroup Commercial Mortgage Trust |
| Series 2015-GC29 Class A3 |
| 04/10/2048 | 2.935% | | 2,215,000 | 2,197,472 |
| COMM Mortgage Trust |
| Series 2013-CR8 Class A4 |
| 06/10/2046 | 3.334% | | 1,653,381 | 1,681,354 |
| Cosmopolitan Hotel Mortgage Trust(a),(b) |
| Subordinated, Series 2017-CSMO Class F |
1-month USD LIBOR + 3.741%
Floor 3.800%
11/15/2036 | 6.214% | | 1,896,000 | 1,901,916 |
| Commercial Mortgage-Backed Securities - Non-Agency (continued) |
| Issuer | Coupon
Rate | | Principal
Amount ($) | Value ($) |
| Credit Suisse Mortgage Capital Certificates OA LLC(a) |
| Subordinated, Series 2014-USA Class D |
| 09/15/2037 | 4.373% | | 1,800,000 | 1,730,784 |
| Subordinated, Series 2014-USA Class E |
| 09/15/2037 | 4.373% | | 2,285,000 | 2,104,140 |
| Subordinated, Series 2014-USA Class F |
| 09/15/2037 | 4.373% | | 5,800,000 | 5,067,706 |
| Hilton U.S.A. Trust(a),(g) |
| Series 2016-HHV Class F |
| 11/05/2038 | 4.333% | | 2,500,000 | 2,369,211 |
| Hilton U.S.A. Trust(a) |
| Series 2016-SFP Class A |
| 11/05/2035 | 2.828% | | 3,000,000 | 2,984,123 |
| Subordinated, Series 2016-SFP Class E |
| 11/05/2035 | 5.519% | | 4,700,000 | 4,787,496 |
| Independence Plaza Trust(a) |
| Series 2018-INDP Class B |
| 07/10/2035 | 3.911% | | 4,500,000 | 4,607,681 |
| Invitation Homes Trust(a),(b) |
| Series 2018-SFR2 Class A |
1-month USD LIBOR + 0.900%
Floor 0.800%
06/17/2037 | 3.373% | | 14,518,055 | 14,489,251 |
| Series 2018-SFR4 Class A |
1-month USD LIBOR + 1.100%
Floor 1.000%
01/17/2038 | 3.574% | | 11,917,944 | 11,988,360 |
| JPMBB Commercial Mortgage Securities Trust |
| Series 2013-C14 Class A4 |
| 08/15/2046 | 4.133% | | 4,300,000 | 4,512,472 |
| Series 2014-C26 Class A3 |
| 01/15/2048 | 3.231% | | 765,000 | 774,765 |
| Morgan Stanley Bank of America Merrill Lynch Trust |
| Series 2013-C12 Class A4 |
| 10/15/2046 | 4.259% | | 2,340,000 | 2,475,235 |
| Progress Residential Trust(a) |
| Series 2017-SFR1 Class A |
| 08/17/2034 | 2.768% | | 4,405,846 | 4,362,805 |
| Series 2018-SF3 Class A |
| 10/17/2035 | 3.880% | | 5,325,000 | 5,457,854 |
| Series 2018-SFR1 Class A |
| 03/17/2035 | 3.255% | | 9,040,000 | 9,073,568 |
| Series 2018-SFR2 Class A |
| 08/17/2035 | 3.712% | | 6,755,000 | 6,902,805 |
| Series 2019-SFR1 Class E |
| 08/17/2035 | 4.466% | | 5,265,000 | 5,321,092 |
The accompanying Notes to Financial Statements are an integral part of this statement.
Columbia Total Return Bond Fund | Annual Report 2019
| 11 |
Portfolio of Investments (continued)
April 30, 2019
| Commercial Mortgage-Backed Securities - Non-Agency (continued) |
| Issuer | Coupon
Rate | | Principal
Amount ($) | Value ($) |
| RETL(a),(b) |
| Subordinated Series 2019-RVP Class C |
1-month USD LIBOR + 2.100%
Floor 2.100%
03/15/2036 | 4.584% | | 7,200,000 | 7,226,977 |
| UBS Commercial Mortgage Trust(a),(b) |
| Series 2018-NYCH Class B |
1-month USD LIBOR + 1.250%
Floor 1.250%
02/15/2032 | 3.723% | | 4,800,000 | 4,799,988 |
| Series 2018-NYCH Class E |
1-month USD LIBOR + 2.900%
Floor 3.200%
02/15/2032 | 5.373% | | 7,587,000 | 7,639,721 |
| UBS-Barclays Commercial Mortgage Trust |
| Series 2012-C4 Class A5 |
| 12/10/2045 | 2.850% | | 2,550,000 | 2,558,082 |
Total Commercial Mortgage-Backed Securities - Non-Agency
(Cost $175,799,584) | 177,223,215 |
| Common Stocks 0.0% |
| Issuer | Shares | Value ($) |
| Financials 0.0% |
| Insurance 0.0% |
| Mr. Cooper Group, Inc.(h) | 4,518 | 38,855 |
| WMI Holdings Corp. Escrow(c),(e),(h),(i) | 2,725 | — |
| Total | | 38,855 |
| Total Financials | 38,855 |
| Industrials 0.0% |
| Airlines 0.0% |
| United Continental Holdings, Inc.(h) | 1,493 | 132,668 |
| Total Industrials | 132,668 |
Total Common Stocks
(Cost $1,511,077) | 171,523 |
| Corporate Bonds & Notes 24.5% |
| Issuer | Coupon
Rate | | Principal
Amount ($) | Value ($) |
| Aerospace & Defense 0.6% |
| Bombardier, Inc.(a) |
| 12/01/2024 | 7.500% | | 164,000 | 166,689 |
| 03/15/2025 | 7.500% | | 52,000 | 52,182 |
| 04/15/2027 | 7.875% | | 18,000 | 18,128 |
| Northrop Grumman Corp. |
| 01/15/2025 | 2.930% | | 5,840,000 | 5,779,544 |
| 01/15/2028 | 3.250% | | 5,435,000 | 5,342,138 |
| Corporate Bonds & Notes (continued) |
| Issuer | Coupon
Rate | | Principal
Amount ($) | Value ($) |
| TransDigm, Inc.(a) |
| 03/15/2026 | 6.250% | | 484,000 | 504,043 |
| 03/15/2027 | 7.500% | | 161,000 | 166,010 |
| TransDigm, Inc. |
| 06/15/2026 | 6.375% | | 689,000 | 690,145 |
| Total | 12,718,879 |
| Automotive 0.4% |
| Delphi Technologies PLC(a) |
| 10/01/2025 | 5.000% | | 74,000 | 67,904 |
| Ford Motor Co. |
| 02/01/2029 | 6.375% | | 1,857,000 | 1,973,508 |
| 01/15/2043 | 4.750% | | 415,000 | 352,535 |
| 12/08/2046 | 5.291% | | 5,000 | 4,542 |
| Ford Motor Credit Co. LLC |
| 11/02/2020 | 2.343% | | 4,580,000 | 4,511,295 |
| Panther BF Aggregator 2 LP/Finance Co., Inc.(a) |
| 05/15/2026 | 6.250% | | 95,000 | 99,283 |
| 05/15/2027 | 8.500% | | 93,000 | 96,085 |
| Total | 7,105,152 |
| Banking 1.9% |
| Ally Financial, Inc. |
| 11/01/2031 | 8.000% | | 74,000 | 94,911 |
| Bank of America Corp.(j) |
| 01/20/2028 | 3.824% | | 6,000,000 | 6,105,930 |
| Bank of New York Mellon Corp. (The) |
| 05/15/2019 | 5.450% | | 3,325,000 | 3,328,405 |
| BBVA Bancomer SA(a),(j) |
| Subordinated |
| 11/12/2029 | 5.350% | | 1,405,000 | 1,370,666 |
| Capital One Financial Corp. |
| 05/12/2020 | 2.500% | | 5,505,000 | 5,486,801 |
| Goldman Sachs Group, Inc. (The)(j) |
| 05/01/2029 | 4.223% | | 7,055,000 | 7,219,099 |
| JPMorgan Chase & Co.(j) |
| 02/01/2028 | 3.782% | | 365,000 | 371,157 |
| JPMorgan Chase & Co.(j),(k) |
| 05/06/2030 | 3.702% | | 2,505,000 | 2,510,095 |
| Morgan Stanley(j) |
| 01/23/2030 | 4.431% | | 3,234,000 | 3,423,209 |
| Washington Mutual Bank(c),(e),(l) |
| Subordinated |
| 01/15/2015 | 0.000% | | 27,379,000 | 41,069 |
| Wells Fargo & Co. |
| 01/30/2020 | 2.150% | | 4,555,000 | 4,536,698 |
| 10/23/2026 | 3.000% | | 3,855,000 | 3,751,146 |
| Total | 38,239,186 |
The accompanying Notes to Financial Statements are an integral part of this statement.
| 12 | Columbia Total Return Bond Fund | Annual Report 2019 |
Portfolio of Investments (continued)
April 30, 2019
| Corporate Bonds & Notes (continued) |
| Issuer | Coupon
Rate | | Principal
Amount ($) | Value ($) |
| Brokerage/Asset Managers/Exchanges 0.0% |
| NFP Corp.(a) |
| 07/15/2025 | 6.875% | | 217,000 | 213,983 |
| Building Materials 0.2% |
| American Builders & Contractors Supply Co., Inc.(a) |
| 12/15/2023 | 5.750% | | 348,000 | 361,357 |
| 05/15/2026 | 5.875% | | 344,000 | 355,662 |
| Beacon Roofing Supply, Inc.(a) |
| 11/01/2025 | 4.875% | | 347,000 | 333,812 |
| Cemex SAB de CV(a) |
| 04/16/2026 | 7.750% | | 2,465,000 | 2,692,377 |
| Core & Main LP(a) |
| 08/15/2025 | 6.125% | | 170,000 | 169,279 |
| James Hardie International Finance DAC(a) |
| 01/15/2025 | 4.750% | | 275,000 | 275,452 |
| Total | 4,187,939 |
| Cable and Satellite 0.3% |
| CCO Holdings LLC/Capital Corp.(a) |
| 05/01/2027 | 5.875% | | 834,000 | 868,947 |
| Charter Communications Operating LLC/Capital |
| 05/01/2047 | 5.375% | | 425,000 | 425,446 |
| CSC Holdings LLC(a) |
| 10/15/2025 | 6.625% | | 295,000 | 313,482 |
| 05/15/2026 | 5.500% | | 480,000 | 493,531 |
| 02/01/2028 | 5.375% | | 329,000 | 335,523 |
| 04/01/2028 | 7.500% | | 359,000 | 391,331 |
| DISH DBS Corp. |
| 07/01/2026 | 7.750% | | 634,000 | 567,487 |
| Intelsat Jackson Holdings SA(a) |
| 10/15/2024 | 8.500% | | 173,000 | 171,271 |
| Radiate HoldCo LLC/Finance, Inc.(a) |
| 02/15/2023 | 6.875% | | 91,000 | 91,251 |
| 02/15/2025 | 6.625% | | 164,000 | 161,205 |
| Sirius XM Radio, Inc.(a) |
| 04/15/2025 | 5.375% | | 295,000 | 304,052 |
| Unitymedia Hessen GmbH & Co. KG NRW(a) |
| 01/15/2025 | 5.000% | | 180,000 | 184,301 |
| Viasat, Inc.(a) |
| 04/15/2027 | 5.625% | | 55,000 | 56,397 |
| Virgin Media Finance PLC(a) |
| 01/15/2025 | 5.750% | | 123,000 | 125,734 |
| Virgin Media Secured Finance PLC(a) |
| 01/15/2026 | 5.250% | | 370,000 | 376,096 |
| 08/15/2026 | 5.500% | | 17,000 | 17,425 |
| Ziggo Bond Finance BV(a) |
| 01/15/2027 | 6.000% | | 335,000 | 329,218 |
| Corporate Bonds & Notes (continued) |
| Issuer | Coupon
Rate | | Principal
Amount ($) | Value ($) |
| Ziggo BV(a) |
| 01/15/2027 | 5.500% | | 247,000 | 246,954 |
| Total | 5,459,651 |
| Chemicals 0.3% |
| Alpha 2 BV(a) |
| 06/01/2023 | 8.750% | | 186,000 | 184,798 |
| Angus Chemical Co.(a) |
| 02/15/2023 | 8.750% | | 165,000 | 166,027 |
| Atotech U.S.A., Inc.(a) |
| 02/01/2025 | 6.250% | | 185,000 | 187,776 |
| Axalta Coating Systems LLC(a) |
| 08/15/2024 | 4.875% | | 183,000 | 184,108 |
| Chemours Co. (The) |
| 05/15/2023 | 6.625% | | 108,000 | 111,822 |
| INEOS Group Holdings SA(a) |
| 08/01/2024 | 5.625% | | 216,000 | 218,238 |
| LYB International Finance BV |
| 07/15/2043 | 5.250% | | 1,445,000 | 1,504,775 |
| Phosagro OAO Via Phosagro Bond Funding DAC(a) |
| 11/03/2021 | 3.950% | | 611,000 | 610,826 |
| Platform Specialty Products Corp.(a) |
| 12/01/2025 | 5.875% | | 345,000 | 353,727 |
| PQ Corp.(a) |
| 11/15/2022 | 6.750% | | 331,000 | 343,374 |
| 12/15/2025 | 5.750% | | 236,000 | 235,523 |
| Sasol Financing International Ltd. |
| 11/14/2022 | 4.500% | | 971,000 | 988,521 |
| Sasol Financing USA LLC |
| 03/27/2024 | 5.875% | | 971,000 | 1,031,990 |
| SPCM SA(a) |
| 09/15/2025 | 4.875% | | 82,000 | 79,992 |
| Starfruit Finco BV/US Holdco LLC(a) |
| 10/01/2026 | 8.000% | | 324,000 | 332,595 |
| Total | 6,534,092 |
| Construction Machinery 0.0% |
| H&E Equipment Services, Inc. |
| 09/01/2025 | 5.625% | | 106,000 | 108,092 |
| Ritchie Bros. Auctioneers, Inc.(a) |
| 01/15/2025 | 5.375% | | 126,000 | 129,301 |
| United Rentals North America, Inc. |
| 09/15/2026 | 5.875% | | 356,000 | 372,009 |
| 12/15/2026 | 6.500% | | 110,000 | 117,738 |
| 05/15/2027 | 5.500% | | 70,000 | 72,098 |
| Total | 799,238 |
The accompanying Notes to Financial Statements are an integral part of this statement.
Columbia Total Return Bond Fund | Annual Report 2019
| 13 |
Portfolio of Investments (continued)
April 30, 2019
| Corporate Bonds & Notes (continued) |
| Issuer | Coupon
Rate | | Principal
Amount ($) | Value ($) |
| Consumer Cyclical Services 0.0% |
| APX Group, Inc. |
| 12/01/2022 | 7.875% | | 191,000 | 191,357 |
| 09/01/2023 | 7.625% | | 155,000 | 136,532 |
| APX Group, Inc.(a),(k) |
| 11/01/2024 | 8.500% | | 94,000 | 93,327 |
| frontdoor, Inc.(a) |
| 08/15/2026 | 6.750% | | 62,000 | 65,100 |
| Total | 486,316 |
| Consumer Products 0.1% |
| Energizer Holdings, Inc.(a) |
| 07/15/2026 | 6.375% | | 87,000 | 89,857 |
| 01/15/2027 | 7.750% | | 81,000 | 87,650 |
| Mattel, Inc.(a) |
| 12/31/2025 | 6.750% | | 120,000 | 120,181 |
| Prestige Brands, Inc.(a) |
| 03/01/2024 | 6.375% | | 280,000 | 288,917 |
| Resideo Funding, Inc.(a) |
| 11/01/2026 | 6.125% | | 83,000 | 86,155 |
| Scotts Miracle-Gro Co. (The) |
| 10/15/2023 | 6.000% | | 267,000 | 277,860 |
| 12/15/2026 | 5.250% | | 45,000 | 44,594 |
| Spectrum Brands, Inc. |
| 07/15/2025 | 5.750% | | 308,000 | 315,717 |
| Valvoline, Inc. |
| 07/15/2024 | 5.500% | | 113,000 | 116,377 |
| Total | 1,427,308 |
| Diversified Manufacturing 0.0% |
| CFX Escrow Corp.(a) |
| 02/15/2024 | 6.000% | | 38,000 | 39,484 |
| 02/15/2026 | 6.375% | | 46,000 | 48,760 |
| Gates Global LLC/Co.(a) |
| 07/15/2022 | 6.000% | | 133,000 | 133,372 |
| SPX FLOW, Inc.(a) |
| 08/15/2024 | 5.625% | | 116,000 | 118,870 |
| Stevens Holding Co., Inc.(a) |
| 10/01/2026 | 6.125% | | 39,000 | 41,054 |
| WESCO Distribution, Inc. |
| 06/15/2024 | 5.375% | | 160,000 | 164,504 |
| Zekelman Industries, Inc.(a) |
| 06/15/2023 | 9.875% | | 188,000 | 198,402 |
| Total | 744,446 |
| Corporate Bonds & Notes (continued) |
| Issuer | Coupon
Rate | | Principal
Amount ($) | Value ($) |
| Electric 3.7% |
| AES Corp. (The) |
| 03/15/2023 | 4.500% | | 342,000 | 347,027 |
| 09/01/2027 | 5.125% | | 117,000 | 121,973 |
| Appalachian Power Co. |
| 05/15/2044 | 4.400% | | 4,635,000 | 4,754,407 |
| Calpine Corp. |
| 01/15/2025 | 5.750% | | 60,000 | 59,392 |
| Calpine Corp.(a) |
| 06/01/2026 | 5.250% | | 195,000 | 195,482 |
| Clearway Energy Operating LLC |
| 08/15/2024 | 5.375% | | 324,000 | 329,200 |
| Clearway Energy Operating LLC(a) |
| 10/15/2025 | 5.750% | | 123,000 | 125,885 |
| CMS Energy Corp. |
| 03/01/2024 | 3.875% | | 2,005,000 | 2,055,656 |
| 11/15/2025 | 3.600% | | 260,000 | 262,473 |
| 02/15/2027 | 2.950% | | 285,000 | 272,701 |
| 03/31/2043 | 4.700% | | 380,000 | 396,498 |
| Consolidated Edison Co. of New York, Inc. |
| 06/15/2047 | 3.875% | | 4,570,000 | 4,459,744 |
| DTE Energy Co. |
| 10/01/2026 | 2.850% | | 7,942,000 | 7,595,586 |
| Duke Energy Corp. |
| 08/15/2027 | 3.150% | | 2,825,000 | 2,783,602 |
| 09/01/2046 | 3.750% | | 3,345,000 | 3,102,193 |
| Duke Energy Progress LLC |
| 03/30/2044 | 4.375% | | 1,635,000 | 1,736,198 |
| 08/15/2045 | 4.200% | | 1,505,000 | 1,569,483 |
| 09/15/2047 | 3.600% | | 1,385,000 | 1,313,379 |
| Emera U.S. Finance LP |
| 06/15/2046 | 4.750% | | 9,190,000 | 9,397,437 |
| Energuate Trust(a) |
| 05/03/2027 | 5.875% | | 1,810,000 | 1,803,797 |
| Indiana Michigan Power Co. |
| 07/01/2047 | 3.750% | | 993,000 | 937,842 |
| Light Servicos de Eletricidade SA/Energia SA(a) |
| 05/03/2023 | 7.250% | | 3,857,000 | 3,914,782 |
| NextEra Energy Operating Partners LP(a) |
| 09/15/2027 | 4.500% | | 240,000 | 236,523 |
| NRG Energy, Inc. |
| 01/15/2027 | 6.625% | | 295,000 | 315,018 |
| Pattern Energy Group, Inc.(a) |
| 02/01/2024 | 5.875% | | 227,000 | 233,741 |
| Southern Co. (The) |
| 07/01/2026 | 3.250% | | 6,293,000 | 6,205,924 |
| 07/01/2036 | 4.250% | | 1,275,000 | 1,268,069 |
| 07/01/2046 | 4.400% | | 5,338,000 | 5,368,555 |
The accompanying Notes to Financial Statements are an integral part of this statement.
| 14 | Columbia Total Return Bond Fund | Annual Report 2019 |
Portfolio of Investments (continued)
April 30, 2019
| Corporate Bonds & Notes (continued) |
| Issuer | Coupon
Rate | | Principal
Amount ($) | Value ($) |
| TerraForm Power Operating LLC(a) |
| 01/31/2028 | 5.000% | | 152,000 | 150,039 |
| Vistra Energy Corp. |
| 11/01/2024 | 7.625% | | 83,000 | 87,565 |
| Vistra Operations Co. LLC(a) |
| 09/01/2026 | 5.500% | | 68,000 | 70,049 |
| 02/15/2027 | 5.625% | | 209,000 | 214,793 |
| WEC Energy Group, Inc. |
| 06/15/2025 | 3.550% | | 700,000 | 715,243 |
| Xcel Energy, Inc. |
| 06/01/2025 | 3.300% | | 3,165,000 | 3,187,041 |
| 12/01/2026 | 3.350% | | 4,750,000 | 4,756,897 |
| 06/15/2028 | 4.000% | | 4,510,000 | 4,705,896 |
| Total | 75,050,090 |
| Environmental 0.0% |
| GFL Environmental, Inc.(a) |
| 03/01/2023 | 5.375% | | 40,000 | 38,895 |
| 05/01/2027 | 8.500% | | 85,000 | 88,494 |
| Hulk Finance Corp.(a) |
| 06/01/2026 | 7.000% | | 28,000 | 27,179 |
| Total | 154,568 |
| Finance Companies 1.2% |
| Avolon Holdings Funding Ltd.(a) |
| 01/15/2023 | 5.500% | | 184,000 | 192,645 |
| 10/01/2023 | 5.125% | | 171,000 | 177,381 |
| 05/15/2024 | 5.250% | | 52,000 | 54,342 |
| GE Capital International Funding Co. Unlimited Co. |
| 11/15/2020 | 2.342% | | 10,000,000 | 9,893,120 |
| 11/15/2035 | 4.418% | | 11,580,000 | 10,802,137 |
| iStar, Inc. |
| 04/01/2022 | 6.000% | | 169,000 | 172,959 |
| Navient Corp. |
| 06/15/2022 | 6.500% | | 602,000 | 634,005 |
| Park Aerospace Holdings Ltd.(a) |
| 08/15/2022 | 5.250% | | 20,000 | 20,822 |
| Provident Funding Associates LP/Finance Corp.(a) |
| 06/15/2025 | 6.375% | | 292,000 | 270,758 |
| Quicken Loans, Inc.(a) |
| 05/01/2025 | 5.750% | | 308,000 | 312,571 |
| Springleaf Finance Corp. |
| 03/15/2023 | 5.625% | | 73,000 | 75,963 |
| 03/15/2024 | 6.125% | | 223,000 | 235,487 |
| 03/15/2025 | 6.875% | | 205,000 | 219,829 |
| Total | 23,062,019 |
| Corporate Bonds & Notes (continued) |
| Issuer | Coupon
Rate | | Principal
Amount ($) | Value ($) |
| Food and Beverage 2.4% |
| Anheuser-Busch InBev Worldwide, Inc.(a) |
| 02/01/2046 | 4.900% | | 11,768,000 | 11,918,477 |
| Anheuser-Busch InBev Worldwide, Inc. |
| 01/23/2059 | 5.800% | | 2,035,000 | 2,315,958 |
| B&G Foods, Inc. |
| 04/01/2025 | 5.250% | | 226,000 | 222,688 |
| Bacardi Ltd.(a) |
| 05/15/2048 | 5.300% | | 10,630,000 | 10,279,699 |
| Conagra Brands, Inc. |
| 11/01/2048 | 5.400% | | 3,655,000 | 3,804,987 |
| Darling Ingredients, Inc.(a) |
| 04/15/2027 | 5.250% | | 22,000 | 22,419 |
| FAGE International SA/U.S.A. Dairy Industry, Inc.(a) |
| 08/15/2026 | 5.625% | | 143,000 | 120,427 |
| Grupo Bimbo SAB de CV(a) |
| 06/27/2024 | 3.875% | | 971,000 | 986,621 |
| Kraft Heinz Foods Co. (The) |
| 06/01/2046 | 4.375% | | 14,178,000 | 12,573,575 |
| MHP SE(a) |
| 05/10/2024 | 7.750% | | 1,515,000 | 1,535,793 |
| Molson Coors Brewing Co. |
| 07/15/2046 | 4.200% | | 2,548,000 | 2,283,964 |
| Post Holdings, Inc.(a) |
| 03/01/2027 | 5.750% | | 540,000 | 553,759 |
| 01/15/2028 | 5.625% | | 92,000 | 92,966 |
| Tyson Foods, Inc.(b) |
3-month USD LIBOR + 0.450%
Floor 0.450%
08/21/2020 | 3.091% | | 2,200,000 | 2,198,150 |
| Total | 48,909,483 |
| Gaming 0.2% |
| Boyd Gaming Corp. |
| 05/15/2023 | 6.875% | | 198,000 | 205,201 |
| 04/01/2026 | 6.375% | | 11,000 | 11,574 |
| 08/15/2026 | 6.000% | | 162,000 | 168,299 |
| Caesars Resort Collection LLC/CRC Finco, Inc.(a) |
| 10/15/2025 | 5.250% | | 85,000 | 83,074 |
| Eldorado Resorts, Inc. |
| 04/01/2025 | 6.000% | | 187,000 | 193,367 |
| 09/15/2026 | 6.000% | | 100,000 | 104,032 |
| International Game Technology PLC(a) |
| 02/15/2022 | 6.250% | | 515,000 | 539,547 |
| 02/15/2025 | 6.500% | | 119,000 | 126,724 |
| 01/15/2027 | 6.250% | | 58,000 | 60,892 |
| Jack Ohio Finance LLC/1 Corp.(a) |
| 11/15/2021 | 6.750% | | 159,000 | 164,169 |
The accompanying Notes to Financial Statements are an integral part of this statement.
Columbia Total Return Bond Fund | Annual Report 2019
| 15 |
Portfolio of Investments (continued)
April 30, 2019
| Corporate Bonds & Notes (continued) |
| Issuer | Coupon
Rate | | Principal
Amount ($) | Value ($) |
| MGM Growth Properties Operating Partnership LP/Finance Co-Issuer, Inc. |
| 09/01/2026 | 4.500% | | 238,000 | 235,588 |
| MGM Growth Properties Operating Partnership LP/Finance Co-Issuer, Inc.(a) |
| 02/01/2027 | 5.750% | | 106,000 | 111,446 |
| MGM Resorts International |
| 03/15/2023 | 6.000% | | 506,000 | 540,083 |
| Penn National Gaming, Inc.(a) |
| 01/15/2027 | 5.625% | | 131,000 | 129,381 |
| Rivers Pittsburgh Borrower LP/Finance Corp.(a) |
| 08/15/2021 | 6.125% | | 185,000 | 187,589 |
| Scientific Games International, Inc. |
| 12/01/2022 | 10.000% | | 139,000 | 146,624 |
| Scientific Games International, Inc.(a) |
| 10/15/2025 | 5.000% | | 282,000 | 280,809 |
| 03/15/2026 | 8.250% | | 244,000 | 252,360 |
| Stars Group Holdings BV/Co-Borrower LLC(a) |
| 07/15/2026 | 7.000% | | 101,000 | 105,874 |
| Wynn Las Vegas LLC/Capital Corp.(a) |
| 03/01/2025 | 5.500% | | 89,000 | 89,967 |
| Total | 3,736,600 |
| Health Care 2.5% |
| Acadia Healthcare Co., Inc. |
| 03/01/2024 | 6.500% | | 209,000 | 215,805 |
| Avantor, Inc.(a) |
| 10/01/2025 | 9.000% | | 184,000 | 200,111 |
| Becton Dickinson and Co.(b) |
3-month USD LIBOR + 1.030%
06/06/2022 | 3.638% | | 4,916,000 | 4,947,148 |
| Becton Dickinson and Co. |
| 06/06/2027 | 3.700% | | 8,200,000 | 8,164,584 |
| 05/15/2044 | 4.875% | | 2,430,000 | 2,431,801 |
| Cardinal Health, Inc. |
| 09/15/2045 | 4.900% | | 1,210,000 | 1,143,473 |
| 06/15/2047 | 4.368% | | 5,300,000 | 4,644,321 |
| Change Healthcare Holdings LLC/Finance, Inc.(a) |
| 03/01/2025 | 5.750% | | 203,000 | 201,323 |
| Charles River Laboratories International, Inc.(a) |
| 04/01/2026 | 5.500% | | 99,000 | 104,172 |
| CHS/Community Health Systems, Inc. |
| 03/31/2023 | 6.250% | | 131,000 | 127,542 |
| CVS Health Corp. |
| 03/25/2048 | 5.050% | | 10,415,000 | 10,289,833 |
| DaVita, Inc. |
| 07/15/2024 | 5.125% | | 43,000 | 43,013 |
| 05/01/2025 | 5.000% | | 111,000 | 108,768 |
| Halfmoon Parent, Inc.(a) |
| 12/15/2048 | 4.900% | | 6,995,000 | 7,060,039 |
| Corporate Bonds & Notes (continued) |
| Issuer | Coupon
Rate | | Principal
Amount ($) | Value ($) |
| HCA, Inc. |
| 02/01/2025 | 5.375% | | 102,000 | 107,329 |
| 09/01/2028 | 5.625% | | 513,000 | 546,284 |
| 02/01/2029 | 5.875% | | 94,000 | 101,045 |
| Memorial Sloan-Kettering Cancer Center |
| 07/01/2052 | 4.125% | | 6,945,000 | 7,279,034 |
| MPH Acquisition Holdings LLC(a) |
| 06/01/2024 | 7.125% | | 301,000 | 302,309 |
| Polaris Intermediate Corp. PIK(a) |
| 12/01/2022 | 8.500% | | 27,000 | 26,964 |
| Sotera Health Holdings LLC(a) |
| 05/15/2023 | 6.500% | | 308,000 | 311,226 |
| Tenet Healthcare Corp. |
| 04/01/2022 | 8.125% | | 62,000 | 66,208 |
| 07/15/2024 | 4.625% | | 235,000 | 235,610 |
| 05/01/2025 | 5.125% | | 122,000 | 123,065 |
| 08/01/2025 | 7.000% | | 171,000 | 173,113 |
| Tenet Healthcare Corp.(a) |
| 02/01/2027 | 6.250% | | 177,000 | 184,495 |
| Total | 49,138,615 |
| Healthcare Insurance 0.1% |
| Centene Corp. |
| 01/15/2025 | 4.750% | | 152,000 | 154,074 |
| Centene Corp.(a) |
| 06/01/2026 | 5.375% | | 332,000 | 345,859 |
| UnitedHealth Group, Inc. |
| 10/15/2047 | 3.750% | | 1,480,000 | 1,408,184 |
| WellCare Health Plans, Inc. |
| 04/01/2025 | 5.250% | | 219,000 | 226,162 |
| WellCare Health Plans, Inc.(a) |
| 08/15/2026 | 5.375% | | 158,000 | 165,249 |
| Total | 2,299,528 |
| Home Construction 0.1% |
| Lennar Corp. |
| 11/15/2024 | 5.875% | | 173,000 | 186,411 |
| 06/01/2026 | 5.250% | | 50,000 | 52,071 |
| Meritage Homes Corp. |
| 04/01/2022 | 7.000% | | 213,000 | 228,975 |
| 06/01/2025 | 6.000% | | 181,000 | 192,357 |
| Shea Homes LP/Funding Corp.(a) |
| 04/01/2023 | 5.875% | | 19,000 | 18,997 |
| Taylor Morrison Communities, Inc./Holdings II(a) |
| 04/15/2023 | 5.875% | | 174,000 | 179,238 |
| TRI Pointe Group, Inc./Homes |
| 06/15/2024 | 5.875% | | 9,000 | 9,133 |
| Total | 867,182 |
The accompanying Notes to Financial Statements are an integral part of this statement.
| 16 | Columbia Total Return Bond Fund | Annual Report 2019 |
Portfolio of Investments (continued)
April 30, 2019
| Corporate Bonds & Notes (continued) |
| Issuer | Coupon
Rate | | Principal
Amount ($) | Value ($) |
| Independent Energy 0.4% |
| California Resources Corp.(a) |
| 12/15/2022 | 8.000% | | 61,000 | 46,450 |
| Callon Petroleum Co. |
| 10/01/2024 | 6.125% | | 71,000 | 72,977 |
| 07/01/2026 | 6.375% | | 443,000 | 453,743 |
| Canadian Natural Resources Ltd. |
| 06/01/2027 | 3.850% | | 1,825,000 | 1,844,332 |
| 06/30/2033 | 6.450% | | 855,000 | 1,026,660 |
| Carrizo Oil & Gas, Inc. |
| 04/15/2023 | 6.250% | | 294,000 | 286,068 |
| Centennial Resource Production LLC(a) |
| 01/15/2026 | 5.375% | | 50,000 | 49,166 |
| 04/01/2027 | 6.875% | | 123,000 | 127,668 |
| Chesapeake Energy Corp. |
| 10/01/2026 | 7.500% | | 192,000 | 188,387 |
| CrownRock LP/Finance, Inc.(a) |
| 10/15/2025 | 5.625% | | 433,000 | 428,737 |
| Endeavor Energy Resources LP/Finance, Inc.(a) |
| 01/30/2028 | 5.750% | | 67,000 | 71,770 |
| Extraction Oil & Gas, Inc.(a) |
| 02/01/2026 | 5.625% | | 80,000 | 65,740 |
| Halcon Resources Corp. |
| 02/15/2025 | 6.750% | | 166,000 | 106,567 |
| Hess Corp. |
| 02/15/2041 | 5.600% | | 945,000 | 990,454 |
| 04/01/2047 | 5.800% | | 3,000 | 3,248 |
| Indigo Natural Resources LLC(a) |
| 02/15/2026 | 6.875% | | 96,000 | 89,140 |
| Jagged Peak Energy LLC |
| 05/01/2026 | 5.875% | | 281,000 | 283,337 |
| Laredo Petroleum, Inc. |
| 03/15/2023 | 6.250% | | 59,000 | 54,511 |
| Matador Resources Co. |
| 09/15/2026 | 5.875% | | 185,000 | 186,776 |
| MEG Energy Corp.(a) |
| 01/15/2025 | 6.500% | | 45,000 | 45,418 |
| Parsley Energy LLC/Finance Corp.(a) |
| 08/15/2025 | 5.250% | | 408,000 | 413,571 |
| 10/15/2027 | 5.625% | | 70,000 | 72,136 |
| PDC Energy, Inc. |
| 09/15/2024 | 6.125% | | 184,000 | 186,778 |
| QEP Resources, Inc. |
| 03/01/2026 | 5.625% | | 100,000 | 93,757 |
| SM Energy Co. |
| 09/15/2026 | 6.750% | | 242,000 | 232,383 |
| 01/15/2027 | 6.625% | | 50,000 | 47,467 |
| Corporate Bonds & Notes (continued) |
| Issuer | Coupon
Rate | | Principal
Amount ($) | Value ($) |
| WPX Energy, Inc. |
| 01/15/2022 | 6.000% | | 29,000 | 30,291 |
| 09/15/2024 | 5.250% | | 157,000 | 162,101 |
| 06/01/2026 | 5.750% | | 158,000 | 163,697 |
| Total | 7,823,330 |
| Integrated Energy 0.1% |
| Lukoil International Finance BV(a) |
| 04/24/2023 | 4.563% | | 971,000 | 998,230 |
| Leisure 0.0% |
| Boyne U.S.A., Inc.(a) |
| 05/01/2025 | 7.250% | | 166,000 | 179,483 |
| Live Nation Entertainment, Inc.(a) |
| 11/01/2024 | 4.875% | | 108,000 | 110,257 |
| 03/15/2026 | 5.625% | | 92,000 | 95,911 |
| Viking Cruises Ltd.(a) |
| 09/15/2027 | 5.875% | | 153,000 | 152,770 |
| Total | 538,421 |
| Life Insurance 0.8% |
| Brighthouse Financial, Inc. |
| 06/22/2047 | 4.700% | | 3,380,000 | 2,768,291 |
| Massachusetts Mutual Life Insurance Co.(a) |
| Subordinated |
| 04/15/2065 | 4.500% | | 1,095,000 | 1,093,287 |
| Peachtree Corners Funding Trust(a) |
| 02/15/2025 | 3.976% | | 3,050,000 | 3,104,019 |
| Teachers Insurance & Annuity Association of America(a) |
| Subordinated |
| 09/15/2044 | 4.900% | | 205,000 | 229,962 |
| 05/15/2047 | 4.270% | | 5,145,000 | 5,308,801 |
| Voya Financial, Inc. |
| 06/15/2026 | 3.650% | | 1,592,000 | 1,586,471 |
| 06/15/2046 | 4.800% | | 2,558,000 | 2,659,164 |
| Total | 16,749,995 |
| Lodging 0.0% |
| Marriott Ownership Resorts, Inc.(a) |
| 09/15/2026 | 6.500% | | 32,000 | 33,613 |
| Media and Entertainment 0.1% |
| Clear Channel Worldwide Holdings, Inc.(a) |
| 02/15/2024 | 9.250% | | 328,000 | 353,000 |
| Discovery Communications LLC |
| 09/20/2047 | 5.200% | | 846,000 | 840,448 |
| Match Group, Inc. |
| 06/01/2024 | 6.375% | | 334,000 | 350,816 |
The accompanying Notes to Financial Statements are an integral part of this statement.
Columbia Total Return Bond Fund | Annual Report 2019
| 17 |
Portfolio of Investments (continued)
April 30, 2019
| Corporate Bonds & Notes (continued) |
| Issuer | Coupon
Rate | | Principal
Amount ($) | Value ($) |
| Netflix, Inc. |
| 04/15/2028 | 4.875% | | 439,000 | 436,743 |
| 11/15/2028 | 5.875% | | 333,000 | 351,254 |
| Netflix, Inc.(a) |
| 05/15/2029 | 6.375% | | 8,000 | 8,740 |
| 11/15/2029 | 5.375% | | 167,000 | 169,297 |
| Outfront Media Capital LLC/Corp. |
| 03/15/2025 | 5.875% | | 174,000 | 180,616 |
| Total | 2,690,914 |
| Metals and Mining 0.1% |
| Big River Steel LLC/Finance Corp.(a) |
| 09/01/2025 | 7.250% | | 304,000 | 322,689 |
| Constellium NV(a) |
| 05/15/2024 | 5.750% | | 61,000 | 62,456 |
| 02/15/2026 | 5.875% | | 384,000 | 390,720 |
| Freeport-McMoRan, Inc. |
| 11/14/2024 | 4.550% | | 351,000 | 348,545 |
| 03/15/2043 | 5.450% | | 318,000 | 286,976 |
| HudBay Minerals, Inc.(a) |
| 01/15/2025 | 7.625% | | 447,000 | 466,363 |
| Novelis Corp.(a) |
| 08/15/2024 | 6.250% | | 52,000 | 54,225 |
| 09/30/2026 | 5.875% | | 366,000 | 372,063 |
| Total | 2,304,037 |
| Midstream 1.8% |
| Antero Midstream Partners LP/Finance Corp.(a) |
| 03/01/2027 | 5.750% | | 141,000 | 143,883 |
| Cheniere Energy Partners LP(a) |
| 10/01/2026 | 5.625% | | 181,000 | 187,004 |
| DCP Midstream Operating LP |
| 07/15/2025 | 5.375% | | 168,000 | 176,496 |
| 04/01/2044 | 5.600% | | 128,000 | 121,687 |
| Delek Logistics Partners LP/Finance Corp. |
| 05/15/2025 | 6.750% | | 143,000 | 143,606 |
| Enterprise Products Operating LLC |
| 02/15/2045 | 5.100% | | 1,837,000 | 2,007,062 |
| Holly Energy Partners LP/Finance Corp.(a) |
| 08/01/2024 | 6.000% | | 360,000 | 375,784 |
| Kinder Morgan, Inc. |
| 02/15/2046 | 5.050% | | 8,580,000 | 8,802,497 |
| MPLX LP |
| 04/15/2048 | 4.700% | | 2,850,000 | 2,750,076 |
| NGPL PipeCo LLC(a) |
| 08/15/2022 | 4.375% | | 66,000 | 67,586 |
| 08/15/2027 | 4.875% | | 80,000 | 82,567 |
| 12/15/2037 | 7.768% | | 98,000 | 120,314 |
| Corporate Bonds & Notes (continued) |
| Issuer | Coupon
Rate | | Principal
Amount ($) | Value ($) |
| NuStar Logistics LP |
| 04/28/2027 | 5.625% | | 159,000 | 159,225 |
| Plains All American Pipeline LP/Finance Corp. |
| 06/15/2044 | 4.700% | | 9,605,000 | 9,045,441 |
| Rockpoint Gas Storage Canada Ltd.(a) |
| 03/31/2023 | 7.000% | | 239,000 | 238,623 |
| Sunoco LP/Finance Corp. |
| 01/15/2023 | 4.875% | | 104,000 | 105,684 |
| 02/15/2026 | 5.500% | | 157,000 | 159,935 |
| Tallgrass Energy Partners LP/Finance Corp.(a) |
| 01/15/2028 | 5.500% | | 167,000 | 170,106 |
| Targa Resources Partners LP/Finance Corp. |
| 02/01/2027 | 5.375% | | 504,000 | 514,080 |
| 01/15/2028 | 5.000% | | 167,000 | 163,967 |
| Targa Resources Partners LP/Finance Corp.(a) |
| 07/15/2027 | 6.500% | | 33,000 | 35,362 |
| 01/15/2029 | 6.875% | | 167,000 | 180,798 |
| TransMontaigne Partners LP/TLP Finance Corp. |
| 02/15/2026 | 6.125% | | 279,000 | 269,256 |
| Western Gas Partners LP |
| 08/15/2048 | 5.500% | | 1,520,000 | 1,590,548 |
| Williams Companies, Inc. (The) |
| 09/15/2045 | 5.100% | | 7,820,000 | 8,015,359 |
| Total | 35,626,946 |
| Natural Gas 0.9% |
| NiSource, Inc. |
| 02/15/2023 | 3.850% | | 3,305,000 | 3,372,680 |
| 02/15/2043 | 5.250% | | 535,000 | 595,199 |
| 05/15/2047 | 4.375% | | 4,850,000 | 4,955,740 |
| Sempra Energy |
| 11/15/2020 | 2.850% | | 5,135,000 | 5,125,577 |
| 11/15/2025 | 3.750% | | 3,620,000 | 3,634,856 |
| 06/15/2027 | 3.250% | | 302,000 | 291,487 |
| Total | 17,975,539 |
| Oil Field Services 0.1% |
| Apergy Corp. |
| 05/01/2026 | 6.375% | | 311,000 | 321,321 |
| Calfrac Holdings LP(a) |
| 06/15/2026 | 8.500% | | 91,000 | 76,440 |
| Diamond Offshore Drilling, Inc. |
| 08/15/2025 | 7.875% | | 62,000 | 60,639 |
| Nabors Industries, Inc. |
| 02/01/2025 | 5.750% | | 315,000 | 286,664 |
| Rowan Companies, Inc. |
| 01/15/2024 | 4.750% | | 71,000 | 58,961 |
The accompanying Notes to Financial Statements are an integral part of this statement.
| 18 | Columbia Total Return Bond Fund | Annual Report 2019 |
Portfolio of Investments (continued)
April 30, 2019
| Corporate Bonds & Notes (continued) |
| Issuer | Coupon
Rate | | Principal
Amount ($) | Value ($) |
| SESI LLC |
| 09/15/2024 | 7.750% | | 144,000 | 106,151 |
| Transocean Guardian Ltd.(a) |
| 01/15/2024 | 5.875% | | 78,435 | 80,396 |
| Transocean Pontus Ltd.(a) |
| 08/01/2025 | 6.125% | | 44,415 | 45,639 |
| Transocean Poseidon Ltd.(a) |
| 02/01/2027 | 6.875% | | 54,000 | 57,502 |
| Transocean, Inc.(a) |
| 01/15/2026 | 7.500% | | 105,000 | 103,799 |
| USA Compression Partners LP/Finance Corp. |
| 04/01/2026 | 6.875% | | 245,000 | 257,597 |
| Weatherford International Ltd. |
| 02/15/2024 | 9.875% | | 122,000 | 86,511 |
| Total | 1,541,620 |
| Other Industry 0.3% |
| KAR Auction Services, Inc.(a) |
| 06/01/2025 | 5.125% | | 214,000 | 214,836 |
| Massachusetts Institute of Technology |
| 07/01/2114 | 4.678% | | 2,869,000 | 3,319,921 |
| 07/01/2116 | 3.885% | | 1,510,000 | 1,438,148 |
| WeWork Companies, Inc.(a) |
| 05/01/2025 | 7.875% | | 98,000 | 96,851 |
| Total | 5,069,756 |
| Other REIT 0.0% |
| CyrusOne LP/Finance Corp. |
| 03/15/2024 | 5.000% | | 159,000 | 163,030 |
| 03/15/2027 | 5.375% | | 369,000 | 382,837 |
| Total | 545,867 |
| Packaging 0.1% |
| Ardagh Packaging Finance PLC/Holdings U.S.A., Inc.(a) |
| 02/15/2025 | 6.000% | | 501,000 | 505,672 |
| BWAY Holding Co.(a) |
| 04/15/2024 | 5.500% | | 173,000 | 171,691 |
| Flex Acquisition Co., Inc.(a) |
| 07/15/2026 | 7.875% | | 155,000 | 145,475 |
| Novolex(a) |
| 01/15/2025 | 6.875% | | 93,000 | 87,207 |
| Reynolds Group Issuer, Inc./LLC(a) |
| 07/15/2023 | 5.125% | | 163,000 | 165,529 |
| 07/15/2024 | 7.000% | | 159,000 | 164,323 |
| Total | 1,239,897 |
| Corporate Bonds & Notes (continued) |
| Issuer | Coupon
Rate | | Principal
Amount ($) | Value ($) |
| Pharmaceuticals 1.7% |
| AbbVie, Inc. |
| 05/14/2025 | 3.600% | | 990,000 | 994,594 |
| 11/14/2048 | 4.875% | | 5,070,000 | 5,009,160 |
| Allergan Funding SCS |
| 06/15/2044 | 4.850% | | 2,170,000 | 2,136,204 |
| Amgen, Inc. |
| 05/22/2019 | 2.200% | | 15,367,000 | 15,361,680 |
| 05/01/2045 | 4.400% | | 1,805,000 | 1,775,970 |
| 06/15/2048 | 4.563% | | 2,383,000 | 2,389,191 |
| Bausch Health Companies, Inc.(a) |
| 03/15/2024 | 7.000% | | 9,000 | 9,488 |
| 04/15/2025 | 6.125% | | 296,000 | 299,399 |
| 11/01/2025 | 5.500% | | 239,000 | 245,270 |
| 04/01/2026 | 9.250% | | 360,000 | 400,598 |
| 01/31/2027 | 8.500% | | 130,000 | 141,823 |
| Catalent Pharma Solutions, Inc.(a) |
| 01/15/2026 | 4.875% | | 158,000 | 158,373 |
| Celgene Corp. |
| 02/20/2048 | 4.550% | | 820,000 | 835,317 |
| Gilead Sciences, Inc. |
| 09/20/2019 | 1.850% | | 2,190,000 | 2,182,729 |
| Jaguar Holding Co. II/Pharmaceutical Product Development LLC(a) |
| 08/01/2023 | 6.375% | | 346,000 | 352,900 |
| Johnson & Johnson |
| 12/05/2033 | 4.375% | | 1,798,000 | 2,001,068 |
| Par Pharmaceutical, Inc.(a) |
| 04/01/2027 | 7.500% | | 118,000 | 122,552 |
| Total | 34,416,316 |
| Property & Casualty 0.1% |
| Acrisure LLC/Finance, Inc.(a) |
| 02/15/2024 | 8.125% | | 42,000 | 43,855 |
| Alliant Holdings Intermediate LLC/Co-Issuer(a) |
| 08/01/2023 | 8.250% | | 91,000 | 93,502 |
| HUB International Ltd.(a) |
| 05/01/2026 | 7.000% | | 260,000 | 262,119 |
| Liberty Mutual Group, Inc.(a) |
| 05/01/2042 | 6.500% | | 1,150,000 | 1,419,493 |
| Total | 1,818,969 |
| Railroads 0.3% |
| CSX Corp. |
| 05/30/2042 | 4.750% | | 1,335,000 | 1,438,797 |
| 11/01/2066 | 4.250% | | 4,481,000 | 4,149,191 |
| Total | 5,587,988 |
The accompanying Notes to Financial Statements are an integral part of this statement.
Columbia Total Return Bond Fund | Annual Report 2019
| 19 |
Portfolio of Investments (continued)
April 30, 2019
| Corporate Bonds & Notes (continued) |
| Issuer | Coupon
Rate | | Principal
Amount ($) | Value ($) |
| Restaurants 0.2% |
| 1011778 BC ULC/New Red Finance, Inc.(a) |
| 05/15/2024 | 4.250% | | 213,000 | 210,047 |
| IRB Holding Corp.(a) |
| 02/15/2026 | 6.750% | | 243,000 | 241,189 |
| KFC Holding Co./Pizza Hut Holdings LLC/Taco Bell of America LLC(a) |
| 06/01/2026 | 5.250% | | 126,000 | 129,907 |
| McDonald’s Corp. |
| 12/09/2045 | 4.875% | | 2,790,000 | 3,012,274 |
| Total | 3,593,417 |
| Retailers 0.1% |
| L Brands, Inc. |
| 11/01/2035 | 6.875% | | 105,000 | 93,524 |
| Lowe’s Companies, Inc. |
| 04/05/2049 | 4.550% | | 1,892,000 | 1,921,428 |
| Party City Holdings, Inc.(a) |
| 08/15/2023 | 6.125% | | 19,000 | 19,282 |
| 08/01/2026 | 6.625% | | 54,000 | 53,473 |
| PetSmart, Inc.(a) |
| 06/01/2025 | 5.875% | | 92,000 | 83,384 |
| Total | 2,171,091 |
| Supermarkets 0.4% |
| Albertsons Companies LLC/Safeway, Inc.(a) |
| 03/15/2026 | 7.500% | | 76,000 | 80,943 |
| Albertsons Companies LLC/Safeway, Inc./New Albertsons LP |
| 03/15/2025 | 5.750% | | 61,000 | 60,580 |
| Kroger Co. (The) |
| 04/15/2042 | 5.000% | | 1,527,000 | 1,504,739 |
| 02/01/2047 | 4.450% | | 830,000 | 762,869 |
| 01/15/2048 | 4.650% | | 6,723,000 | 6,367,380 |
| Total | 8,776,511 |
| Technology 0.6% |
| Ascend Learning LLC(a) |
| 08/01/2025 | 6.875% | | 122,000 | 124,109 |
| 08/01/2025 | 6.875% | | 107,000 | 108,843 |
| Broadcom Corp./Cayman Finance Ltd. |
| 01/15/2027 | 3.875% | | 7,105,000 | 6,781,431 |
| Camelot Finance SA(a) |
| 10/15/2024 | 7.875% | | 644,000 | 678,448 |
| CDK Global, Inc. |
| 06/01/2027 | 4.875% | | 227,000 | 229,284 |
| CommScope Finance LLC(a) |
| 03/01/2024 | 5.500% | | 90,000 | 93,857 |
| 03/01/2026 | 6.000% | | 136,000 | 144,078 |
| 03/01/2027 | 8.250% | | 54,000 | 58,455 |
| Corporate Bonds & Notes (continued) |
| Issuer | Coupon
Rate | | Principal
Amount ($) | Value ($) |
| CommScope Technologies LLC(a) |
| 06/15/2025 | 6.000% | | 195,000 | 198,256 |
| 03/15/2027 | 5.000% | | 80,000 | 75,461 |
| Dun & Bradstreet Corp. (The)(a) |
| 08/15/2026 | 6.875% | | 80,000 | 83,211 |
| Ensemble S Merger Sub, Inc.(a) |
| 09/30/2023 | 9.000% | | 45,000 | 46,803 |
| Equinix, Inc. |
| 01/15/2026 | 5.875% | | 473,000 | 499,698 |
| Gartner, Inc.(a) |
| 04/01/2025 | 5.125% | | 347,000 | 355,830 |
| Informatica LLC(a) |
| 07/15/2023 | 7.125% | | 205,000 | 209,588 |
| Iron Mountain, Inc. |
| 08/15/2024 | 5.750% | | 214,000 | 215,476 |
| NCR Corp. |
| 07/15/2022 | 5.000% | | 102,000 | 102,616 |
| 12/15/2023 | 6.375% | | 215,000 | 220,850 |
| PTC, Inc. |
| 05/15/2024 | 6.000% | | 220,000 | 230,386 |
| Qualitytech LP/QTS Finance Corp.(a) |
| 11/15/2025 | 4.750% | | 326,000 | 318,061 |
| Refinitiv US Holdings, Inc.(a) |
| 11/15/2026 | 8.250% | | 264,000 | 267,907 |
| Sensata Technologies UK Financing Co. PLC(a) |
| 02/15/2026 | 6.250% | | 152,000 | 161,822 |
| Symantec Corp.(a) |
| 04/15/2025 | 5.000% | | 388,000 | 395,171 |
| Tempo Acquisition LLC/Finance Corp.(a) |
| 06/01/2025 | 6.750% | | 112,000 | 114,502 |
| Verscend Escrow Corp.(a) |
| 08/15/2026 | 9.750% | | 158,000 | 167,940 |
| Total | 11,882,083 |
| Tobacco 0.3% |
| BAT Capital Corp. |
| 08/14/2020 | 2.297% | | 5,505,000 | 5,461,329 |
| Transportation Services 0.6% |
| Avis Budget Car Rental LLC/Finance, Inc. |
| 04/01/2023 | 5.500% | | 56,000 | 57,006 |
| Avis Budget Car Rental LLC/Finance, Inc.(a) |
| 03/15/2025 | 5.250% | | 99,000 | 98,246 |
| ERAC U.S.A. Finance LLC(a) |
| 12/01/2026 | 3.300% | | 2,705,000 | 2,640,002 |
| 11/01/2046 | 4.200% | | 1,720,000 | 1,643,303 |
| FedEx Corp. |
| 04/01/2046 | 4.550% | | 8,230,000 | 7,933,489 |
The accompanying Notes to Financial Statements are an integral part of this statement.
| 20 | Columbia Total Return Bond Fund | Annual Report 2019 |
Portfolio of Investments (continued)
April 30, 2019
| Corporate Bonds & Notes (continued) |
| Issuer | Coupon
Rate | | Principal
Amount ($) | Value ($) |
| Hertz Corp. (The)(a) |
| 06/01/2022 | 7.625% | | 264,000 | 272,709 |
| XPO Logistics, Inc.(a) |
| 06/15/2022 | 6.500% | | 94,000 | 95,978 |
| Total | 12,740,733 |
| Wireless 0.3% |
| Altice France SA(a) |
| 05/01/2026 | 7.375% | | 391,000 | 396,791 |
| 02/01/2027 | 8.125% | | 127,000 | 132,460 |
| Altice Luxembourg SA(a) |
| 05/15/2022 | 7.750% | | 98,000 | 99,807 |
| America Movil SAB de CV |
| 03/30/2020 | 5.000% | | 2,353,000 | 2,399,218 |
| SBA Communications Corp. |
| 09/01/2024 | 4.875% | | 431,000 | 438,308 |
| Sprint Corp. |
| 02/15/2025 | 7.625% | | 741,000 | 748,521 |
| T-Mobile U.S.A., Inc. |
| 01/15/2026 | 6.500% | | 584,000 | 624,562 |
| 02/01/2026 | 4.500% | | 172,000 | 173,046 |
| 02/01/2028 | 4.750% | | 286,000 | 288,792 |
| Wind Tre SpA(a) |
| 01/20/2026 | 5.000% | | 279,000 | 256,870 |
| Total | 5,558,375 |
| Wirelines 1.2% |
| AT&T, Inc. |
| 03/01/2029 | 4.350% | | 12,444,000 | 12,863,363 |
| 03/01/2037 | 5.250% | | 3,610,000 | 3,873,711 |
| CenturyLink, Inc. |
| 03/15/2022 | 5.800% | | 459,000 | 472,280 |
| 12/01/2023 | 6.750% | | 242,000 | 257,214 |
| Frontier Communications Corp. |
| 09/15/2022 | 10.500% | | 50,000 | 36,437 |
| 01/15/2023 | 7.125% | | 116,000 | 72,352 |
| 09/15/2025 | 11.000% | | 95,000 | 61,589 |
| Frontier Communications Corp.(a) |
| 04/01/2026 | 8.500% | | 127,000 | 119,862 |
| Telecom Italia Capital SA |
| 09/30/2034 | 6.000% | | 98,000 | 90,741 |
| Telecom Italia SpA(a) |
| 05/30/2024 | 5.303% | | 140,000 | 139,820 |
| Verizon Communications, Inc. |
| 08/10/2033 | 4.500% | | 5,615,000 | 6,023,519 |
| Corporate Bonds & Notes (continued) |
| Issuer | Coupon
Rate | | Principal
Amount ($) | Value ($) |
| Zayo Group LLC/Capital, Inc.(a) |
| 01/15/2027 | 5.750% | | 466,000 | 472,772 |
| Total | 24,483,660 |
Total Corporate Bonds & Notes
(Cost $511,427,312) | 490,762,912 |
|
| Foreign Government Obligations(m) 3.0% |
| | | | |
| Argentina 2.3% |
| Argentine Republic Government International Bond |
| 01/26/2027 | 6.875% | | 23,800,000 | 17,197,666 |
| 01/11/2028 | 5.875% | | 18,253,000 | 12,645,350 |
| Provincia de Buenos Aires(a) |
| 06/15/2027 | 7.875% | | 2,800,000 | 1,865,111 |
| Provincia de Cordoba(a) |
| 06/10/2021 | 7.125% | | 15,800,000 | 12,636,129 |
| 08/01/2027 | 7.125% | | 1,300,000 | 888,392 |
| Total | 45,232,648 |
| Belarus 0.0% |
| Republic of Belarus International Bond(a) |
| 02/28/2023 | 6.875% | | 660,000 | 690,744 |
| Dominican Republic 0.0% |
| Dominican Republic International Bond(a) |
| 01/25/2027 | 5.950% | | 785,000 | 828,528 |
| Egypt 0.1% |
| Egypt Government International Bond(a) |
| 01/31/2047 | 8.500% | | 1,015,000 | 1,033,826 |
| El Salvador 0.1% |
| El Salvador Government International Bond(a) |
| 12/01/2019 | 7.375% | | 971,000 | 981,683 |
| Honduras 0.1% |
| Honduras Government International Bond(a) |
| 03/15/2024 | 7.500% | | 1,710,000 | 1,870,065 |
| 03/15/2024 | 7.500% | | 971,000 | 1,061,890 |
| Total | 2,931,955 |
| Ivory Coast 0.1% |
| Ivory Coast Government International Bond(a) |
| 03/03/2028 | 6.375% | | 2,510,000 | 2,440,834 |
| Netherlands 0.0% |
| Equate Petrochemical BV(a) |
| 03/03/2022 | 3.000% | | 971,000 | 962,643 |
| Oman 0.0% |
| Oman Government International Bond(a) |
| 06/15/2021 | 3.625% | | 971,000 | 948,045 |
The accompanying Notes to Financial Statements are an integral part of this statement.
Columbia Total Return Bond Fund | Annual Report 2019
| 21 |
Portfolio of Investments (continued)
April 30, 2019
| Foreign Government Obligations(m) (continued) |
| Issuer | Coupon
Rate | | Principal
Amount ($) | Value ($) |
| Russian Federation 0.1% |
| Gazprom OAO Via Gaz Capital SA(a) |
| 02/06/2028 | 4.950% | | 1,320,000 | 1,344,064 |
| Senegal 0.0% |
| Senegal Government International Bond(a) |
| 05/23/2033 | 6.250% | | 855,000 | 824,080 |
| Trinidad and Tobago 0.1% |
| Petroleum Co. of Trinidad & Tobago Ltd.(a) |
| 08/14/2019 | 9.750% | | 1,690,000 | 1,656,452 |
| United Arab Emirates 0.1% |
| Abu Dhabi National Energy Co. PJSC(a) |
| 01/12/2023 | 3.625% | | 971,000 | 983,528 |
Total Foreign Government Obligations
(Cost $68,432,761) | 60,859,030 |
|
| Municipal Bonds 0.1% |
| Issue Description | Coupon
Rate | | Principal
Amount ($) | Value ($) |
| Local General Obligation 0.1% |
| City of Chicago |
| Unlimited Tax General Obligation Bonds |
| Series 2011-C1 |
| 01/01/2035 | 7.781% | | 545,000 | 618,346 |
| Series 2015B |
| 01/01/2033 | 7.375% | | 415,000 | 456,629 |
| Unlimited Tax General Obligation Refunding Bonds |
| Series 2014B |
| 01/01/2044 | 6.314% | | 705,000 | 716,914 |
| Total | 1,791,889 |
| Water & Sewer 0.0% |
| City of Chicago Waterworks |
| Revenue Bonds |
| Build America Bonds |
| Series 2010 |
| 11/01/2040 | 6.742% | | 840,000 | 1,110,539 |
Total Municipal Bonds
(Cost $2,457,500) | 2,902,428 |
|
| Residential Mortgage-Backed Securities - Agency 33.8% |
| Issuer | Coupon
Rate | | Principal
Amount ($) | Value ($) |
| Federal Home Loan Mortgage Corp. |
| 04/01/2021 | 9.000% | | 119 | 119 |
03/01/2022-
11/01/2026 | 8.500% | | 43,508 | 47,451 |
08/01/2024-
02/01/2025 | 8.000% | | 33,582 | 35,787 |
10/01/2028-
07/01/2032 | 7.000% | | 448,780 | 508,301 |
10/01/2031-
09/01/2033 | 6.000% | | 30,295 | 33,129 |
01/01/2046-
12/01/2046 | 3.500% | | 28,716,618 | 29,159,411 |
| Federal Home Loan Mortgage Corp.(k) |
| 05/13/2049 | 4.000% | | 18,000,000 | 18,485,116 |
| Federal Home Loan Mortgage Corp.(b),(n) |
| CMO Series 3922 Class SH |
-1.0 x 1-month USD LIBOR + 5.900%
Cap 5.900%
09/15/2041 | 3.427% | | 866,741 | 108,623 |
| CMO Series 4097 Class ST |
-1.0 x 1-month USD LIBOR + 6.050%
Cap 6.050%
08/15/2042 | 3.577% | | 2,058,871 | 353,335 |
| CMO STRIPS Series 2012-278 Class S1 |
-1.0 x 1-month USD LIBOR + 6.050%
Cap 6.050%
09/15/2042 | 3.577% | | 3,251,680 | 521,321 |
| CMO STRIPS Series 309 Class S4 |
-1.0 x 1-month USD LIBOR + 5.970%
Cap 5.970%
08/15/2043 | 3.497% | | 1,100,453 | 201,041 |
| Federal Home Loan Mortgage Corp.(n) |
| CMO Series 4176 Class BI |
| 03/15/2043 | 3.500% | | 2,531,665 | 461,830 |
| CMO Series 4182 Class DI |
| 05/15/2039 | 3.500% | | 6,542,733 | 589,470 |
| Federal Home Loan Mortgage Corp.(g),(n) |
| CMO Series 4620 Class AS |
| 11/15/2042 | 1.641% | | 2,050,062 | 89,942 |
| Federal National Mortgage Association |
| 04/01/2023 | 8.500% | | 643 | 645 |
| 06/01/2024 | 9.000% | | 4,352 | 4,388 |
02/01/2025-
08/01/2027 | 8.000% | | 69,955 | 76,250 |
03/01/2026-
08/01/2032 | 7.000% | | 1,281,231 | 1,449,642 |
04/01/2027-
06/01/2032 | 7.500% | | 127,247 | 140,999 |
The accompanying Notes to Financial Statements are an integral part of this statement.
| 22 | Columbia Total Return Bond Fund | Annual Report 2019 |
Portfolio of Investments (continued)
April 30, 2019
| Residential Mortgage-Backed Securities - Agency (continued) |
| Issuer | Coupon
Rate | | Principal
Amount ($) | Value ($) |
05/01/2029-
08/01/2038 | 6.000% | | 2,186,243 | 2,402,241 |
| 08/01/2034 | 5.500% | | 84,959 | 93,860 |
10/01/2040-
07/01/2041 | 4.500% | | 5,313,745 | 5,627,249 |
08/01/2043-
05/01/2048 | 4.000% | | 62,833,386 | 64,930,345 |
06/01/2045-
02/01/2048 | 3.500% | | 30,217,184 | 30,519,790 |
| CMO Series 2017-72 Class B |
| 09/25/2047 | 3.000% | | 15,051,683 | 14,989,092 |
| Federal National Mortgage Association(b) |
6-month USD LIBOR + 1.420%
Cap 11.126%
06/01/2032 | 4.165% | | 3,250 | 3,262 |
1-year CMT + 2.305%
Cap 10.839%
07/01/2037 | 4.477% | | 90,935 | 90,719 |
| Federal National Mortgage Association(k) |
| 05/16/2034 | 2.500% | | 27,000,000 | 26,716,264 |
05/16/2034-
06/13/2049 | 3.000% | | 68,500,000 | 68,215,460 |
| 05/13/2049 | 3.500% | | 12,000,000 | 12,108,516 |
| 05/13/2049 | 4.000% | | 56,750,000 | 58,237,471 |
| 05/13/2049 | 4.500% | | 35,500,000 | 36,938,721 |
| 05/13/2049 | 5.000% | | 111,000,000 | 116,990,097 |
| Federal National Mortgage Association(o) |
| 11/01/2046 | 3.500% | | 26,102,156 | 26,496,395 |
| Federal National Mortgage Association(n) |
| CMO Series 2012-118 Class BI |
| 12/25/2039 | 3.500% | | 3,505,512 | 442,980 |
| Federal National Mortgage Association(b),(n) |
| CMO Series 2013-101 Class CS |
-1.0 x 1-month USD LIBOR + 5.900%
Cap 5.900%
10/25/2043 | 3.423% | | 4,963,272 | 977,329 |
| CMO Series 2014-93 Class ES |
-1.0 x 1-month USD LIBOR + 6.150%
Cap 6.150%
01/25/2045 | 3.673% | | 2,814,246 | 477,165 |
| CMO Series 2016-31 Class VS |
-1.0 x 1-month USD LIBOR + 6.000%
Cap 6.000%
06/25/2046 | 3.523% | | 2,606,865 | 502,236 |
| CMO Series 2016-53 Class KS |
-1.0 x 1-month USD LIBOR + 6.000%
Cap 6.000%
08/25/2046 | 3.523% | | 8,542,804 | 1,679,349 |
| Residential Mortgage-Backed Securities - Agency (continued) |
| Issuer | Coupon
Rate | | Principal
Amount ($) | Value ($) |
| CMO Series 2016-57 Class SA |
-1.0 x 1-month USD LIBOR + 6.000%
Cap 6.000%
08/25/2046 | 3.523% | | 20,915,813 | 3,861,958 |
| CMO Series 2017-109 Class SA |
-1.0 x 1-month USD LIBOR + 6.150%
Cap 6.150%
01/25/2048 | 3.673% | | 9,086,916 | 1,891,638 |
| CMO Series 2017-20 Class SA |
-1.0 x 1-month USD LIBOR + 6.100%
Cap 6.100%
04/25/2047 | 3.623% | | 9,767,467 | 1,761,935 |
| CMO Series 2017-54 Class NS |
-1.0 x 1-month USD LIBOR + 6.150%
Cap 6.150%
07/25/2047 | 3.673% | | 7,328,938 | 1,581,319 |
| CMO Series 2018-66 Class SM |
-1.0 x 1-month USD LIBOR + 6.200%
Cap 6.200%
09/25/2048 | 3.723% | | 10,862,705 | 2,184,528 |
| CMO Series 2018-67 MS Class MS |
-1.0 x 1-month USD LIBOR + 6.200%
Cap 6.200%
09/25/2048 | 3.723% | | 9,557,282 | 1,865,723 |
| CMO Series 2018-74 Class SA |
-1.0 x 1-month USD LIBOR + 6.150%
Cap 6.150%
10/25/2048 | 3.673% | | 15,856,278 | 3,112,205 |
| Government National Mortgage Association |
12/15/2023-
07/20/2028 | 7.500% | | 99,723 | 107,463 |
| 02/15/2025 | 8.500% | | 11,651 | 12,745 |
| 01/15/2030 | 7.000% | | 157,067 | 179,204 |
| Government National Mortgage Association(b) |
1-year CMT + 1.500%
Floor 1.500%, Cap 11.500%
07/20/2025 | 3.750% | | 11,124 | 11,438 |
| Government National Mortgage Association(k) |
| 05/21/2049 | 3.500% | | 64,500,000 | 65,563,242 |
| 05/21/2049 | 4.500% | | 23,000,000 | 23,847,676 |
| Government National Mortgage Association(n) |
| CMO Series 2014-184 Class CI |
| 11/16/2041 | 3.500% | | 6,447,782 | 1,019,550 |
The accompanying Notes to Financial Statements are an integral part of this statement.
Columbia Total Return Bond Fund | Annual Report 2019
| 23 |
Portfolio of Investments (continued)
April 30, 2019
| Residential Mortgage-Backed Securities - Agency (continued) |
| Issuer | Coupon
Rate | | Principal
Amount ($) | Value ($) |
| Government National Mortgage Association(b),(n) |
| CMO Series 2017-112 Class KS |
-1.0 x 1-month USD LIBOR + 6.200%
Cap 6.200%
07/20/2047 | 3.719% | | 9,926,531 | 1,684,417 |
| CMO Series 2017-130 Class HS |
-1.0 x 1-month USD LIBOR + 6.200%
Cap 6.200%
08/20/2047 | 3.719% | | 9,662,074 | 1,866,326 |
| CMO Series 2017-149 Class BS |
-1.0 x 1-month USD LIBOR + 6.200%
Cap 6.200%
10/20/2047 | 3.719% | | 14,589,676 | 2,874,248 |
| CMO Series 2017-163 Class SA |
-1.0 x 1-month USD LIBOR + 6.200%
Cap 6.200%
11/20/2047 | 3.719% | | 8,292,844 | 1,451,784 |
| CMO Series 2017-37 Class SB |
-1.0 x 1-month USD LIBOR + 6.150%
Cap 6.150%
03/20/2047 | 3.669% | | 9,874,951 | 1,586,869 |
| CMO Series 2018-103 Class SA |
-1.0 x 1-month USD LIBOR + 6.200%
Cap 6.200%
08/20/2048 | 3.719% | | 11,423,730 | 2,033,624 |
| CMO Series 2018-112 Class LS |
-1.0 x 1-month USD LIBOR + 6.200%
Cap 6.200%
08/20/2048 | 3.719% | | 11,223,421 | 2,218,561 |
| CMO Series 2018-121 Class SA |
-1.0 x 1-month USD LIBOR + 6.200%
Cap 6.200%
09/20/2048 | 3.719% | | 8,462,782 | 1,519,999 |
| CMO Series 2018-125 Class SK |
-1.0 x 1-month USD LIBOR + 6.250%
Cap 6.250%
09/20/2048 | 3.769% | | 12,719,643 | 2,245,275 |
| CMO Series 2018-134 Class KS |
-1.0 x 1-month USD LIBOR + 6.200%
Cap 6.200%
10/20/2048 | 3.719% | | 10,866,319 | 1,878,255 |
| Residential Mortgage-Backed Securities - Agency (continued) |
| Issuer | Coupon
Rate | | Principal
Amount ($) | Value ($) |
| CMO Series 2018-134 Class SK |
-1.0 x 1-month USD LIBOR + 6.200%
Cap 6.200%
10/20/2048 | 3.719% | | 9,811,275 | 1,418,888 |
| CMO Series 2018-139 Class SC |
-1.0 x 1-month USD LIBOR + 6.150%
Cap 6.150%
10/20/2048 | 3.669% | | 9,939,910 | 1,655,922 |
| CMO Series 2018-148 Class SB |
-1.0 x 1-month USD LIBOR + 6.200%
Cap 6.200%
01/20/2048 | 3.719% | | 25,156,142 | 4,427,151 |
| CMO Series 2018-151 Class SA |
-1.0 x 1-month USD LIBOR + 6.150%
Cap 6.150%
11/20/2048 | 3.669% | | 21,475,749 | 3,855,642 |
| CMO Series 2018-155 Class SL |
-1.0 x 1-month USD LIBOR + 6.150%
Cap 6.150%
11/20/2048 | 3.669% | | 12,798,787 | 1,873,727 |
| CMO Series 2018-89 Class MS |
-1.0 x 1-month USD LIBOR + 6.200%
Cap 6.200%
06/20/2048 | 3.719% | | 10,896,495 | 2,066,835 |
| CMO Series 2018-89 Class SM |
-1.0 x 1-month USD LIBOR + 6.200%
Cap 6.200%
06/20/2048 | 3.719% | | 18,923,987 | 3,242,358 |
| CMO Series 2018-91 Class DS |
-1.0 x 1-month USD LIBOR + 6.200%
Cap 6.200%
07/20/2048 | 3.719% | | 13,265,572 | 2,073,751 |
| CMO Series 2019-20 Class JS |
-1.0 x 1-month USD LIBOR + 6.000%
Cap 6.000%
02/20/2049 | 3.519% | | 17,086,660 | 3,289,204 |
| CMO Series 2019-4 Class SJ |
-1.0 x 1-month USD LIBOR + 6.050%
Cap 6.050%
01/20/2049 | 3.569% | | 22,320,247 | 3,771,751 |
The accompanying Notes to Financial Statements are an integral part of this statement.
| 24 | Columbia Total Return Bond Fund | Annual Report 2019 |
Portfolio of Investments (continued)
April 30, 2019
| Residential Mortgage-Backed Securities - Agency (continued) |
| Issuer | Coupon
Rate | | Principal
Amount ($) | Value ($) |
| CMO Series 2019-5 Class SH |
-1.0 x 1-month USD LIBOR + 6.150%
Cap 6.150%
01/20/2049 | 3.669% | | 13,333,357 | 2,413,240 |
Total Residential Mortgage-Backed Securities - Agency
(Cost $672,055,282) | 677,153,792 |
|
| Residential Mortgage-Backed Securities - Non-Agency 25.6% |
| | | | |
| Ajax Mortgage Loan Trust(a) |
| CMO Series 2016-C Class A |
| 10/25/2057 | 4.000% | | 1,008,846 | 1,019,214 |
| CMO Series 2017-A Class A |
| 04/25/2057 | 3.470% | | 3,088,428 | 3,101,567 |
| Series 2017-B Class A |
| 09/25/2056 | 3.163% | | 9,975,535 | 9,860,675 |
| American Mortgage Trust(c),(e),(g) |
| CMO Series 2093-3 Class 3A |
| 07/27/2023 | 8.188% | | 1,232 | 747 |
| Angel Oak Mortgage Trust I LLC(a),(c),(g) |
| CMO Series 2018-3 Class M1 |
| 09/25/2048 | 4.421% | | 4,795,000 | 4,920,629 |
| Angel Oak Mortgage Trust I LLC(a),(g) |
| CMO Series 2019-1 Class A1 |
| 11/25/2048 | 3.920% | | 13,099,526 | 13,239,812 |
| Angel Oak Mortgage Trust LLC(a),(g) |
| CMO Series 2017-3 Class A3 |
| 11/25/2047 | 2.986% | | 3,240,606 | 3,229,652 |
| Arroyo Mortgage Trust(a) |
| CMO Series 2018-1 Class A2 |
| 04/25/2048 | 4.016% | | 2,964,375 | 3,028,771 |
| ASG Resecuritization Trust(a),(g) |
| CMO Series 2009-2 Class G75 |
| 05/24/2036 | 3.683% | | 3,228,593 | 3,206,090 |
| Bayview Opportunity Master Fund IVa Trust(a) |
| CMO Series 2018-RN6 Class A1 |
| 07/25/2033 | 4.090% | | 4,106,035 | 4,120,316 |
| Subordinated, CMO Series 2016-SPL1 Class B3 |
| 04/28/2055 | 5.500% | | 1,000,000 | 1,045,812 |
| Bayview Opportunity Master Fund IVa Trust(a),(g) |
| CMO Series 2019-RN2 Class A1 |
| 03/28/2034 | 3.967% | | 7,404,070 | 7,415,310 |
| Bayview Opportunity Master Fund Trust IVb(a) |
| CMO Series 2019-RN1 Class A1 |
| 02/28/2034 | 4.090% | | 7,979,716 | 8,042,974 |
| BCAP LLC Trust(a),(g) |
| CMO Series 2010-RR11 Class 8A1 |
| 05/27/2037 | 4.508% | | 1,487,524 | 1,492,636 |
| Residential Mortgage-Backed Securities - Non-Agency (continued) |
| Issuer | Coupon
Rate | | Principal
Amount ($) | Value ($) |
| BCAP LLC Trust(a) |
| CMO Series 2013-RR5 Class 3A1 |
| 09/26/2036 | 3.500% | | 77,001 | 76,814 |
| Bellemeade Re Ltd.(a),(b) |
| CMO Series 2018-2A Class M1A |
1-month USD LIBOR + 0.950%
08/25/2028 | 3.427% | | 7,369,844 | 7,366,986 |
| CMO Series 2018-2A Class M1B |
1-month USD LIBOR + 1.350%
08/25/2028 | 3.827% | | 4,000,000 | 3,991,099 |
| CMO Series 2019-1A Class M1A |
1-month USD LIBOR + 1.300%
Floor 1.300%
03/25/2029 | 3.784% | | 11,975,000 | 11,982,126 |
| CAM Mortgage Trust(a) |
| CMO Series 2018-1 Class A1 |
| 12/01/2065 | 3.960% | | 916,931 | 916,668 |
| CHL GMSR Issuer Trust(a),(b) |
| CMO Series 2018-GT1 Class A |
1-month USD LIBOR + 1.000%
05/25/2023 | 5.227% | | 6,600,000 | 6,608,203 |
| CIM Trust(a) |
| CMO Series 2017-6 Class A1 |
| 06/25/2057 | 3.015% | | 5,708,623 | 5,594,327 |
| CIM Trust(a),(g) |
| CMO Series 2018-R4 Class A1 |
| 12/26/2057 | 4.070% | | 10,129,838 | 10,175,372 |
| CIM Trust(a),(b) |
| CMO Series 2018-R6 Class A1 |
1-month USD LIBOR + 1.076%
Floor 1.080%
09/25/2058 | 3.562% | | 11,800,079 | 11,725,111 |
| Citigroup Mortgage Loan Trust, Inc.(a),(g) |
| CMO Series 2013-11 Class 3A3 |
| 09/25/2034 | 4.223% | | 605,365 | 605,775 |
| CMO Series 2014-12 Class 3A1 |
| 10/25/2035 | 4.470% | | 2,272,916 | 2,303,688 |
| CMO Series 2014-C Class A |
| 02/25/2054 | 3.250% | | 496,275 | 491,141 |
| CMO Series 2015-A Class A4 |
| 06/25/2058 | 4.250% | | 1,352,341 | 1,385,992 |
| CMO Series 2015-A Class B3 |
| 06/25/2058 | 4.500% | | 903,587 | 891,837 |
| CMO Series 2018-RP2 Class A1 |
| 02/25/2058 | 3.500% | | 4,309,163 | 4,244,874 |
| Citigroup Mortgage Loan Trust, Inc.(a),(n) |
| CMO Series 2015-A Class A1IO |
| 06/25/2058 | 1.000% | | 6,502,892 | 128,430 |
The accompanying Notes to Financial Statements are an integral part of this statement.
Columbia Total Return Bond Fund | Annual Report 2019
| 25 |
Portfolio of Investments (continued)
April 30, 2019
| Residential Mortgage-Backed Securities - Non-Agency (continued) |
| Issuer | Coupon
Rate | | Principal
Amount ($) | Value ($) |
| Citigroup Mortgage Loan Trust, Inc.(a) |
| Subordinated, CMO Series 2014-C Class B1 |
| 02/25/2054 | 4.250% | | 8,500,000 | 8,583,194 |
| COLT Mortgage Loan Trust(a) |
| CMO Series 2016-1 Class A2 |
| 05/25/2046 | 3.500% | | 116,437 | 115,834 |
| CMO Series 2018-1 Class A2 |
| 02/25/2048 | 2.981% | | 737,381 | 735,651 |
| CMO Series 2018-3 Class A1 |
| 10/26/2048 | 3.692% | | 4,906,815 | 4,959,057 |
| COLT Mortgage Loan Trust(a),(g) |
| CMO Series 2017-2 Class B1 |
| 10/25/2047 | 4.563% | | 1,000,000 | 992,191 |
| Credit Suisse Mortgage Capital Certificates(a),(g) |
| CMO Series 2009-14R Class 4A9 |
| 10/26/2035 | 4.698% | | 3,127,407 | 3,216,040 |
| CMO Series 2010-8R Class 1A5 |
| 03/26/2036 | 4.000% | | 1,712,722 | 1,711,302 |
| CMO Series 2011-12R Class 3A1 |
| 07/27/2036 | 3.991% | | 589,786 | 588,586 |
| CMO Series 2017-RPL3 Class A1 |
| 08/01/2057 | 4.000% | | 10,898,559 | 11,165,656 |
| Credit Suisse Mortgage Trust(a) |
| CMO Series 2018-RPL2 Class A1 |
| 08/25/2062 | 4.030% | | 2,449,129 | 2,450,006 |
| Deephaven Residential Mortgage Trust(a),(g) |
| CMO Series 2017-2A Class M1 |
| 06/25/2047 | 3.897% | | 500,000 | 499,147 |
| Deephaven Residential Mortgage Trust(a) |
| CMO Series 2017-3A Class M1 |
| 10/25/2047 | 3.511% | | 423,000 | 419,465 |
| CMO Series 2018-1A Class M1 |
| 12/25/2057 | 3.939% | | 3,000,000 | 3,034,840 |
| Eagle RE Ltd.(a),(b) |
| CMO Series 2019-1 Class M1A |
1-month USD LIBOR + 1.250%
04/25/2029 | 3.734% | | 12,500,000 | 12,508,570 |
| Ellington Financial Mortgage Trust(a),(c),(g) |
| CMO Series 2018-1 Class A2 |
| 10/25/2058 | 4.293% | | 2,647,217 | 2,689,837 |
| Ellington Financial Mortgage Trust(a),(g) |
| CMO Series 2018-1 Class A3 |
| 10/25/2058 | 4.394% | | 2,995,767 | 3,055,891 |
| GCAT LLC(a) |
| CMO Series 2017-2 Class A1 |
| 04/25/2047 | 3.500% | | 1,323,294 | 1,315,774 |
| CMO Series 2018-2 Class A1 |
| 06/26/2023 | 4.090% | | 6,496,436 | 6,523,671 |
| Residential Mortgage-Backed Securities - Non-Agency (continued) |
| Issuer | Coupon
Rate | | Principal
Amount ($) | Value ($) |
| GCAT LLC(a),(g) |
| CMO Series 2019-1 Class A1 |
| 04/26/2049 | 4.089% | | 6,614,777 | 6,622,190 |
| Grand Avenue Mortgage Loan Trust(a) |
| CMO Series 2017-RPL1 Class A1 |
| 08/25/2064 | 3.250% | | 19,074,458 | 18,692,433 |
| Homeward Opportunities Fund I Trust(a),(g) |
| CMO Series 2019-1 Class A1 |
| 01/25/2059 | 3.454% | | 9,106,877 | 9,141,854 |
| JPMorgan Resecuritization Trust(a),(g) |
| CMO Series 2014-1 Class 1016 |
| 03/26/2036 | 4.909% | | 226,055 | 224,673 |
| JPMorgan Resecuritization Trust(a) |
| CMO Series 2014-5 Class 6A |
| 09/27/2036 | 4.000% | | 633,040 | 631,810 |
| Legacy Mortgage Asset Trust(a) |
| CMO Series 2017-GS1 Class A1 |
| 01/25/2057 | 3.500% | | 4,923,992 | 4,903,197 |
| CMO Series 2017-GS1 Class A2 |
| 01/25/2057 | 3.500% | | 1,298,000 | 1,272,079 |
| CMO Series 2019-GS1 Class A1 |
| 01/25/2059 | 4.000% | | 5,424,488 | 5,423,922 |
| LVII Resecuritization Trust(a),(g) |
| Subordinated, CMO Series 2009-3 Class B3 |
| 11/27/2037 | 5.386% | | 8,000,000 | 8,182,712 |
| New Residential Mortgage LLC(a) |
| CMO Series 2018-FNT2 Class E |
| 07/25/2054 | 5.120% | | 3,624,405 | 3,639,566 |
| Subordinated, CMO Series 2018-FNT1 Class D |
| 05/25/2023 | 4.690% | | 7,699,869 | 7,708,462 |
| Subordinated, CMO Series 2018-FNT1 Class E |
| 05/25/2023 | 4.890% | | 3,079,948 | 3,106,781 |
| New Residential Mortgage Loan Trust(a) |
| CMO Series 2018-RPL1 Class A1 |
| 12/25/2057 | 3.500% | | 5,871,634 | 5,897,209 |
| New Residential Mortgage Loan Trust(a),(g) |
| CMO Series 2019-RPL1 Class A1 |
| 02/26/2024 | 4.335% | | 12,847,676 | 12,914,706 |
| Nomura Resecuritization Trust(a),(b) |
| CMO Series 2014-6R Class 3A1 |
1-month USD LIBOR + 0.260%
Floor 0.260%, Cap 11.500%
01/26/2036 | 3.006% | | 803,127 | 799,631 |
| NRZ Excess Spread-Collateralized Notes(a) |
| Series 2018-PLS1 Class A |
| 01/25/2023 | 3.193% | | 5,015,871 | 4,996,142 |
| Series 2018-PLS1 Class C |
| 01/25/2023 | 3.981% | | 7,882,083 | 7,865,804 |
The accompanying Notes to Financial Statements are an integral part of this statement.
| 26 | Columbia Total Return Bond Fund | Annual Report 2019 |
Portfolio of Investments (continued)
April 30, 2019
| Residential Mortgage-Backed Securities - Non-Agency (continued) |
| Issuer | Coupon
Rate | | Principal
Amount ($) | Value ($) |
| Subordinated, CMO Series 2018-PLS2 Class C |
| 02/25/2023 | 4.102% | | 5,176,963 | 5,185,433 |
| Subordinated, CMO Series 2018-PLS2 Class D |
| 02/25/2023 | 4.593% | | 7,395,661 | 7,407,653 |
| Oaktown Re II Ltd.(a),(b) |
| CMO Series 2018-1A Class M1 |
1-month USD LIBOR + 1.550%
07/25/2028 | 4.027% | | 5,000,000 | 4,966,366 |
| Oaktown Re Ltd.(a),(b) |
| CMO Series 2017-1A Class M1 |
1-month USD LIBOR + 2.250%
04/25/2027 | 4.727% | | 408,447 | 408,695 |
| PMT Credit Risk Transfer Trust(a),(b) |
| CMO Series 2019-1R Class A |
1-month USD LIBOR + 2.000%
Floor 2.000%
03/27/2024 | 4.484% | | 9,910,672 | 9,924,053 |
| PNMAC GMSR Issuer Trust(a),(b) |
| CMO Series 2018-GT1 Class A |
1-month USD LIBOR + 2.850%
Floor 2.850%
02/25/2023 | 5.327% | | 9,800,000 | 9,818,561 |
| CMO Series 2018-GT2 Class A |
1-month USD LIBOR + 2.650%
08/25/2025 | 5.127% | | 8,000,000 | 8,024,906 |
| Preston Ridge Partners Mortgage LLC(a) |
| CMO Series 2017-2A Class A2 |
| 09/25/2022 | 5.000% | | 4,500,000 | 4,502,062 |
| CMO Series 2018-2A Class A1 |
| 08/25/2023 | 4.000% | | 8,417,557 | 8,415,893 |
| Preston Ridge Partners Mortgage LLC(a),(g) |
| CMO Series 2017-3A Class A1 |
| 11/25/2022 | 3.470% | | 7,492,501 | 7,475,411 |
| CMO Series 2017-3A Class A2 |
| 11/25/2022 | 5.000% | | 3,000,000 | 2,989,099 |
| CMO Series 2018-1A Class A1 |
| 04/25/2023 | 3.750% | | 8,006,671 | 8,006,285 |
| CMO Series 2018-3A Class A1 |
| 10/25/2023 | 4.483% | | 9,334,217 | 9,419,187 |
| CMO Series 2019-1A Class A1 |
| 01/25/2024 | 4.500% | | 19,433,180 | 19,516,614 |
| Radnor Re Ltd.(a),(b) |
| CMO Series 2019-1 Class M1B |
1-month USD LIBOR + 1.950%
Floor 1.950%
02/25/2029 | 4.427% | | 7,000,000 | 7,022,936 |
| RCO Trust(a),(g) |
| CMO Series 2018-VFS1 Class A2 |
| 12/26/2053 | 4.472% | | 3,367,026 | 3,392,934 |
| Residential Mortgage-Backed Securities - Non-Agency (continued) |
| Issuer | Coupon
Rate | | Principal
Amount ($) | Value ($) |
| RCO V Mortgage LLC(a) |
| CMO Series 2018-1 Class A1 |
| 05/25/2023 | 4.000% | | 4,634,392 | 4,643,444 |
| RCO V Mortgage LLC(a),(g) |
| CMO Series 2018-2 Class A1 |
| 10/25/2023 | 4.458% | | 9,838,679 | 9,822,957 |
| Residential Mortgage Loan Trust(a),(g) |
| CMO Series 2019-1 Class A3 |
| 10/25/2058 | 4.242% | | 5,410,118 | 5,439,581 |
| Starwood Mortgage Residential Trust(a),(g) |
| CMO Series 2019-IMC1 Class A2 |
| 04/25/2049 | 3.651% | | 4,443,416 | 4,460,456 |
| Vericrest Opportunity Loan Transferee LXX LLC(a),(g) |
| CMO Series 2018-NPL6 Class A1A |
| 09/25/2048 | 4.115% | | 7,407,543 | 7,426,025 |
| Vericrest Opportunity Loan Transferee LXXI LLC(a) |
| CMO Series 2018-NPL7 Class A1A |
| 09/25/2048 | 3.967% | | 5,221,562 | 5,236,918 |
| Vericrest Opportunity Loan Transferee LXXII LLC(a) |
| CMO Series 2018-NPL8 Class A1B |
| 10/26/2048 | 4.655% | | 16,450,000 | 16,580,059 |
| Vericrest Opportunity Loan Transferee LXXIII LLC(a),(g) |
| CMO Series 2018-NPL9 Class A1A |
| 10/25/2048 | 4.458% | | 5,336,313 | 5,374,122 |
| Vericrest Opportunity Loan Transferee LXXV LLC(a) |
| CMO Series 2019-NPL1 Class A1A |
| 01/25/2049 | 4.336% | | 4,494,157 | 4,517,923 |
| Verus Securitization Trust(a) |
| CMO Series 2017-SG1A Class A1 |
| 11/25/2047 | 2.690% | | 7,122,739 | 7,067,802 |
| Subordinated, CMO Series 2017-SG1A Class B1 |
| 11/25/2047 | 3.615% | | 3,000,000 | 2,985,334 |
| Verus Securitization Trust(a),(g) |
| CMO Series 2018-3 Class A3 |
| 10/25/2058 | 4.282% | | 4,575,914 | 4,643,104 |
| CMO Series 2018-INV1 Class A1 |
| 03/25/2058 | 3.633% | | 10,792,636 | 10,925,204 |
| CMO Series 2019-1 Class A1 |
| 02/25/2059 | 3.836% | | 6,766,471 | 6,830,377 |
| CMO Series 2019-1 Class A3 |
| 02/25/2059 | 4.040% | | 2,753,463 | 2,779,448 |
Total Residential Mortgage-Backed Securities - Non-Agency
(Cost $512,776,276) | 514,009,373 |
|
The accompanying Notes to Financial Statements are an integral part of this statement.
Columbia Total Return Bond Fund | Annual Report 2019
| 27 |
Portfolio of Investments (continued)
April 30, 2019
| Senior Loans 0.1% |
| Borrower | Coupon
Rate | | Principal
Amount ($) | Value ($) |
| Chemicals 0.0% |
| Starfruit Finco BV/US Holdco LLC/AzkoNobel(b),(p) |
| Term Loan |
3-month USD LIBOR + 3.250%
10/01/2025 | 5.729% | | 123,000 | 122,462 |
| Finance Companies 0.0% |
| Ellie Mae, Inc.(b),(p),(q) |
| 1st Lien Term Loan |
3-month USD LIBOR + 4.000%
04/17/2026 | | | 133,000 | 133,583 |
| Food and Beverage 0.0% |
| 8th Avenue Food & Provisions, Inc.(b),(p),(q) |
| 1st Lien Term Loan |
3-month USD LIBOR + 3.750%
10/01/2025 | 6.229% | | 122,168 | 122,534 |
| 8th Avenue Food & Provisions, Inc.(b),(p) |
| 2nd Lien Term Loan |
3-month USD LIBOR + 7.750%
10/01/2026 | 10.229% | | 32,969 | 32,928 |
| Total | 155,462 |
| Health Care 0.0% |
| Avantor, Inc.(b),(p),(q) |
| Tranche B1 Term Loan |
3-month USD LIBOR + 3.750%
Floor 1.000%
11/21/2024 | 6.233% | | 24,913 | 25,020 |
| Metals and Mining 0.0% |
| Big River Steel LLC(b),(p) |
| Term Loan |
3-month USD LIBOR + 5.000%
Floor 1.000%
08/23/2023 | 7.601% | | 28,045 | 28,220 |
| Packaging 0.0% |
| Reynolds Group Holdings, Inc.(b),(p) |
| Term Loan |
3-month USD LIBOR + 2.750%
Floor 1.000%
02/05/2023 | 5.233% | | 67,827 | 67,913 |
| Pharmaceuticals 0.0% |
| Bausch Health Companies, Inc.(b),(p) |
| Term Loan |
3-month USD LIBOR + 3.000%
06/02/2025 | 5.474% | | 71,225 | 71,507 |
| Senior Loans (continued) |
| Borrower | Coupon
Rate | | Principal
Amount ($) | Value ($) |
| Property & Casualty 0.0% |
| HUB International Ltd.(b),(p) |
| Term Loan |
3-month USD LIBOR + 2.750%
04/25/2025 | 5.336% | | 83,370 | 82,453 |
| Technology 0.1% |
| Ascend Learning LLC(b),(p),(q) |
| Term Loan |
3-month USD LIBOR + 3.000%
Floor 1.000%
07/12/2024 | 5.483% | | 93,057 | 92,592 |
| CommScope, Inc.(b),(p) |
| Tranche B Term Loan |
3-month USD LIBOR + 3.250%
04/06/2026 | 5.733% | | 50,000 | 50,391 |
| Dun & Bradstreet Corp. (The)(b),(p) |
| Term Loan |
3-month USD LIBOR + 5.000%
02/06/2026 | 7.479% | | 116,000 | 116,798 |
| Greeneden US Holdings I LLC/Genesys Telecommunications Laboratories, Inc.(b),(p) |
| Tranche B3 Term Loan |
3-month USD LIBOR + 3.250%
12/01/2023 | 5.733% | | 62,841 | 62,919 |
| Misys Ltd./Almonde/Tahoe/Finastra USA(b),(p) |
| 1st Lien Term Loan |
3-month USD LIBOR + 3.500%
Floor 1.000%
06/13/2024 | 6.101% | | 88,838 | 88,024 |
| Qlik Technologies, Inc.(b),(p),(q) |
| Term Loan |
3-month USD LIBOR + 3.500%
Floor 1.000%
04/26/2024 | 6.252% | | 32,288 | 32,066 |
3-month USD LIBOR + 4.250%
04/26/2024 | 6.883% | | 99,200 | 99,634 |
| Refinitiv US Holdings, Inc.(a),(b),(p) |
| Term Loan |
3-month USD LIBOR + 3.750%
10/01/2025 | 6.233% | | 452,143 | 447,056 |
| Tempo Acquisition LLC(b),(p),(q) |
| Term Loan |
3-month USD LIBOR + 3.000%
05/01/2024 | 5.483% | | 88,774 | 88,793 |
The accompanying Notes to Financial Statements are an integral part of this statement.
| 28 | Columbia Total Return Bond Fund | Annual Report 2019 |
Portfolio of Investments (continued)
April 30, 2019
| Senior Loans (continued) |
| Borrower | Coupon
Rate | | Principal
Amount ($) | Value ($) |
| Ultimate Software Group, Inc. (The)(b),(p),(q) |
| Tranche B Term Loan |
3-month USD LIBOR + 3.750%
04/08/2026 | | | 73,000 | 73,475 |
| Total | 1,151,748 |
Total Senior Loans
(Cost $1,828,939) | 1,838,368 |
|
| U.S. Treasury Obligations 0.6% |
| Issuer | Coupon
Rate | | Principal
Amount ($) | Value ($) |
| U.S. Treasury |
| 08/15/2027 | 2.250% | | 6,872,500 | 6,764,421 |
| 08/15/2048 | 3.000% | | 4,590,000 | 4,644,786 |
Total U.S. Treasury Obligations
(Cost $11,354,670) | 11,409,207 |
| Options Purchased Calls 0.0% |
| | | | | Value ($) |
| (Cost $525,000) | 713,430 |
|
| Options Purchased Puts 0.0% |
| | | | |
| (Cost $1,158,000) | 318,900 |
| Money Market Funds 4.4% |
| | Shares | Value ($) |
| Columbia Short-Term Cash Fund, 2.519%(r),(s) | 87,817,905 | 87,809,124 |
Total Money Market Funds
(Cost $87,809,124) | 87,809,124 |
Total Investments in Securities
(Cost: $2,439,976,502) | 2,414,300,140 |
| Other Assets & Liabilities, Net | | (408,695,232) |
| Net Assets | 2,005,604,908 |
At April 30, 2019, securities and/or cash totaling $12,570,059 were pledged as collateral.
Investments in derivatives
| Long futures contracts |
| Description | Number of
contracts | Expiration
date | Trading
currency | Notional
amount | Value/Unrealized
appreciation ($) | Value/Unrealized
depreciation ($) |
| U.S. Treasury 10-Year Note | 3,172 | 06/2019 | USD | 392,287,188 | 4,404,032 | — |
| U.S. Treasury 2-Year Note | 1,976 | 06/2019 | USD | 420,903,437 | 80,396 | — |
| U.S. Treasury 5-Year Note | 1,874 | 06/2019 | USD | 216,710,531 | 1,086,507 | — |
| U.S. Ultra Treasury Bond | 309 | 06/2019 | USD | 50,762,906 | 926,912 | — |
| Total | | | | | 6,497,847 | — |
| Short futures contracts |
| Description | Number of
contracts | Expiration
date | Trading
currency | Notional
amount | Value/Unrealized
appreciation ($) | Value/Unrealized
depreciation ($) |
| 90-Day Euro$ | (2,425) | 12/2019 | USD | (591,457,500) | — | (1,937,403) |
| Euro-Bund | (706) | 06/2019 | EUR | (116,708,860) | — | (1,834,849) |
| U.S. Long Bond | (275) | 06/2019 | USD | (40,553,906) | — | (336,016) |
| Total | | | | | — | (4,108,268) |
| Call option contracts purchased |
| Description | Counterparty | Trading
currency | Notional
amount | Number of
contracts | Exercise
price/Rate | Expiration
date | Cost ($) | Value ($) |
| 10-Year OTC interest rate swap with Citi to receive 3-Month USD LIBOR BBA and pay exercise rate | Citi | USD | 100,000,000 | 100,000,000 | 2.50 | 06/19/2019 | 525,000 | 713,430 |
| Put option contracts purchased |
| Description | Counterparty | Trading
currency | Notional
amount | Number of
contracts | Exercise
price/Rate | Expiration
date | Cost ($) | Value ($) |
| 10-Year OTC interest rate swap with Morgan Stanley to receive 3-Month USD LIBOR BBA and pay exercise rate | Morgan Stanley | USD | 120,000,000 | 120,000,000 | 3.15 | 03/02/2020 | 1,158,000 | 318,900 |
The accompanying Notes to Financial Statements are an integral part of this statement.
Columbia Total Return Bond Fund | Annual Report 2019
| 29 |
Portfolio of Investments (continued)
April 30, 2019
| Call option contracts written |
| Description | Counterparty | Trading
currency | Notional
amount | Number of
contracts | Exercise
price/Rate | Expiration
date | Premium
received ($) | Value ($) |
| 3-Year OTC interest rate swap with Citi to receive 3-Month USD LIBOR BBA and pay exercise rate | Citi | USD | (300,000,000) | (300,000,000) | 2.25 | 7/24/2019 | (682,500) | (790,770) |
| 3-Year OTC interest rate swap with Citi to receive exercise rate and pay 3-Month USD LIBOR BBA | Citi | USD | (179,280,000) | (179,280,000) | 2.30 | 6/20/2019 | (277,884) | (435,668) |
| Total | | | | | | | (960,384) | (1,226,438) |
| Credit default swap contracts - buy protection |
Reference
entity | Counterparty | Maturity
date | Pay
fixed
rate
(%) | Payment
frequency | Notional
currency | Notional
amount | Value
($) | Periodic
payments
receivable
(payable)
($) | Upfront
payments
($) | Upfront
receipts
($) | Unrealized
appreciation
($) | Unrealized
depreciation
($) |
| Markit CMBX North America Index, Series 10 BBB- | Citi | 11/17/2059 | 3.000 | Monthly | USD | 3,500,000 | 117,852 | (1,750) | 150,340 | — | — | (34,238) |
| Markit CMBX North America Index, Series 10 BBB- | Citi | 11/17/2059 | 3.000 | Monthly | USD | 8,000,000 | 269,376 | (4,000) | 333,609 | — | — | (68,233) |
| Markit CMBX North America Index, Series 11 BBB- | Citi | 11/18/2054 | 3.000 | Monthly | USD | 7,000,000 | 315,000 | (3,500) | 398,429 | — | — | (86,929) |
| Markit CMBX North America Index, Series 10 BBB- | Credit Suisse | 11/17/2059 | 3.000 | Monthly | USD | 8,000,000 | 269,376 | (4,000) | 464,577 | — | — | (199,201) |
| Markit CMBX North America Index, Series 10 BBB- | JPMorgan | 11/17/2059 | 3.000 | Monthly | USD | 8,000,000 | 269,376 | (4,000) | 358,104 | — | — | (92,728) |
| Markit CMBX North America Index, Series 10 BBB- | JPMorgan | 11/17/2059 | 3.000 | Monthly | USD | 8,000,000 | 269,376 | (4,000) | 474,002 | — | — | (208,626) |
| Markit CMBX North America Index, Series 10 BBB- | Morgan Stanley | 11/17/2059 | 3.000 | Monthly | USD | 8,000,000 | 269,376 | (4,000) | 512,264 | — | — | (246,888) |
| Markit CMBX North America Index, Series 11 BBB- | Morgan Stanley | 11/18/2054 | 3.000 | Monthly | USD | 4,000,000 | 180,000 | (2,000) | 201,646 | — | — | (23,646) |
| Markit CMBX North America Index, Series 11 BBB- | Morgan Stanley | 11/18/2054 | 3.000 | Monthly | USD | 5,000,000 | 225,000 | (2,500) | 268,409 | — | — | (45,909) |
| Total | | | | | | | 2,184,732 | (29,750) | 3,161,380 | — | — | (1,006,398) |
| Cleared credit default swap contracts - buy protection |
Reference
entity | Counterparty | Maturity
date | Pay
fixed
rate
(%) | Payment
frequency | Notional
currency | Notional
amount | Value
($) | Upfront
payments
($) | Upfront
receipts
($) | Unrealized
appreciation
($) | Unrealized
depreciation
($) |
| Markit CDX North America High Yield Index, Series 32 | Morgan Stanley | 06/20/2024 | 5.000 | Quarterly | USD | 78,140,000 | (1,499,975) | — | — | — | (1,499,975) |
| Credit default swap contracts - sell protection |
Reference
entity | Counterparty | Maturity
date | Receive
fixed
rate
(%) | Payment
frequency | Implied
credit
spread
(%)* | Notional
currency | Notional
amount | Value
($) | Periodic
payments
receivable
(payable)
($) | Upfront
payments
($) | Upfront
receipts
($) | Unrealized
appreciation
($) | Unrealized
depreciation
($) |
| Markit CMBX North America Index, Series 6 BBB- | Morgan Stanley | 05/11/2063 | 3.000 | Monthly | 6.784 | USD | 5,000,000 | (541,700) | 2,500 | — | (674,471) | 135,271 | — |
| * | Implied credit spreads, represented in absolute terms, utilized in determining the market value of credit default swap agreements on corporate or sovereign issues as of period end serve as an indicator of the current status of the payment/performance risk and represent the likelihood or risk of default for the credit derivative. The implied credit spread of a particular referenced entity reflects the cost of buying/selling protection and may include upfront payments required to be made to enter into the agreement. Wider credit spreads represent a deterioration of the referenced entity’s credit soundness and a greater likelihood or risk of default or other credit event occurring as defined under the terms of the agreement. |
The accompanying Notes to Financial Statements are an integral part of this statement.
| 30 | Columbia Total Return Bond Fund | Annual Report 2019 |
Portfolio of Investments (continued)
April 30, 2019
Notes to Portfolio of Investments
| (a) | Represents privately placed and other securities and instruments exempt from Securities and Exchange Commission registration (collectively, private placements), such as Section 4(a)(2) and Rule 144A eligible securities, which are often sold only to qualified institutional buyers. The Fund may invest in private placements determined to be liquid as well as those determined to be illiquid. Private placements may be determined to be liquid under guidelines established by the Fund’s Board of Trustees. At April 30, 2019, the total value of these securities amounted to $1,149,098,778, which represents 57.29% of total net assets. |
| (b) | Variable rate security. The interest rate shown was the current rate as of April 30, 2019. |
| (c) | Valuation based on significant unobservable inputs. |
| (d) | Represents shares owned in the residual interest of an asset-backed securitization. |
| (e) | Represents fair value as determined in good faith under procedures approved by the Board of Trustees. At April 30, 2019, the total value of these securities amounted to $3,255,380, which represents 0.16% of total net assets. |
| (f) | Zero coupon bond. |
| (g) | Variable or floating rate security, the interest rate of which adjusts periodically based on changes in current interest rates and prepayments on the underlying pool of assets. The interest rate shown was the current rate as of April 30, 2019. |
| (h) | Non-income producing investment. |
| (i) | Negligible market value. |
| (j) | Represents a variable rate security with a step coupon where the rate adjusts according to a schedule for a series of periods, typically lower for an initial period and then increasing to a higher coupon rate thereafter. The interest rate shown was the current rate as of April 30, 2019. |
| (k) | Represents a security purchased on a when-issued basis. |
| (l) | Represents securities that have defaulted on payment of interest. The Fund has stopped accruing interest on these securities. At April 30, 2019, the total value of these securities amounted to $41,069, which represents less than 0.01% of total net assets. |
| (m) | Principal and interest may not be guaranteed by the government. |
| (n) | Represents interest only securities which have the right to receive the monthly interest payments on an underlying pool of mortgage loans. |
| (o) | This security or a portion of this security has been pledged as collateral in connection with derivative contracts. |
| (p) | The stated interest rate represents the weighted average interest rate at April 30, 2019 of contracts within the senior loan facility. Interest rates on contracts are primarily determined either weekly, monthly or quarterly by reference to the indicated base lending rate and spread and the reset period. These base lending rates are primarily the London Interbank Offered Rate (“LIBOR”) and other short-term rates. Base lending rates may be subject to a floor or minimum rate. The interest rate for senior loans purchased on a when-issued or delayed delivery basis will be determined upon settlement, therefore no interest rate is disclosed. Senior loans often require prepayments from excess cash flows or permit the borrowers to repay at their election. The degree to which borrowers repay, cannot be predicted with accuracy. As a result, remaining maturities of senior loans may be less than the stated maturities. |
| (q) | Represents a security purchased on a forward commitment basis. |
| (r) | The rate shown is the seven-day current annualized yield at April 30, 2019. |
| (s) | As defined in the Investment Company Act of 1940, an affiliated company is one in which the Fund owns 5% or more of the company’s outstanding voting securities, or a company which is under common ownership or control with the Fund. Holdings and transactions in these affiliated companies during the year ended April 30, 2019 are as follows: |
| Issuer | Beginning
shares | Shares
purchased | Shares
sold | Ending
shares | Realized gain
(loss) —
affiliated
issuers ($) | Net change in
unrealized
appreciation
(depreciation) —
affiliated
issuers ($) | Dividends —
affiliated
issuers ($) | Value —
affiliated
issuers
at end of
period ($) |
| Columbia Short-Term Cash Fund, 2.519% |
| | 97,258,162 | 895,581,243 | (905,021,500) | 87,817,905 | 1,918 | 158 | 1,371,559 | 87,809,124 |
Abbreviation Legend
| CMO | Collateralized Mortgage Obligation |
| PIK | Payment In Kind |
| STRIPS | Separate Trading of Registered Interest and Principal Securities |
Currency Legend
The accompanying Notes to Financial Statements are an integral part of this statement.
Columbia Total Return Bond Fund | Annual Report 2019
| 31 |
Portfolio of Investments (continued)
April 30, 2019
Fair value measurements
The Fund categorizes its fair value measurements according to a three-level hierarchy that maximizes the use of observable inputs and minimizes the use of unobservable inputs by prioritizing that the most observable input be used when available. Observable inputs are those that market participants would use in pricing an investment based on market data obtained from sources independent of the reporting entity. Unobservable inputs are those that reflect the Fund’s assumptions about the information market participants would use in pricing an investment. An investment’s level within the fair value hierarchy is based on the lowest level of any input that is deemed significant to the asset’s or liability’s fair value measurement. The input levels are not necessarily an indication of the risk or liquidity associated with investments at that level. For example, certain U.S. government securities are generally high quality and liquid, however, they are reflected as Level 2 because the inputs used to determine fair value may not always be quoted prices in an active market.
Fair value inputs are summarized in the three broad levels listed below:
| ■ | Level 1 — Valuations based on quoted prices for investments in active markets that the Fund has the ability to access at the measurement date. Valuation adjustments are not applied to Level 1 investments. |
| ■ | Level 2 — Valuations based on other significant observable inputs (including quoted prices for similar securities, interest rates, prepayment speeds, credit risks, etc.). |
| ■ | Level 3 — Valuations based on significant unobservable inputs (including the Fund’s own assumptions and judgment in determining the fair value of investments). |
Inputs that are used in determining fair value of an investment may include price information, credit data, volatility statistics, and other factors. These inputs can be either observable or unobservable. The availability of observable inputs can vary between investments, and is affected by various factors such as the type of investment, and the volume and level of activity for that investment or similar investments in the marketplace. The inputs will be considered by the Investment Manager, along with any other relevant factors in the calculation of an investment’s fair value. The Fund uses prices and inputs that are current as of the measurement date, which may include periods of market dislocations. During these periods, the availability of prices and inputs may be reduced for many investments. This condition could cause an investment to be reclassified between the various levels within the hierarchy.
Certain investments that have been measured at fair value using the net asset value (NAV) per share (or its equivalent) are not categorized in the fair value hierarchy. The fair value amounts presented in the table are intended to reconcile the fair value hierarchy to the amounts presented in the Portfolio of Investments. The Columbia Short-Term Cash Fund seeks to provide shareholders with maximum current income consistent with liquidity and stability of principal. Columbia Short-Term Cash Fund prices its shares with a floating NAV and no longer seeks to maintain a stable NAV.
Investments falling into the Level 3 category are primarily supported by quoted prices from brokers and dealers participating in the market for those investments. However, these may be classified as Level 3 investments due to lack of market transparency and corroboration to support these quoted prices. Additionally, valuation models may be used as the pricing source for any remaining investments classified as Level 3. These models may rely on one or more significant unobservable inputs and/or significant assumptions by the Investment Manager. Inputs used in valuations may include, but are not limited to, financial statement analysis, capital account balances, discount rates and estimated cash flows, and comparable company data.
Under the direction of the Fund’s Board of Trustees (the Board), the Investment Manager’s Valuation Committee (the Committee) is responsible for overseeing the valuation procedures approved by the Board. The Committee consists of voting and non-voting members from various groups within the Investment Manager’s organization, including operations and accounting, trading and investments, compliance, risk management and legal.
The Committee meets at least monthly to review and approve valuation matters, which may include a description of specific valuation determinations, data regarding pricing information received from approved pricing vendors and brokers and the results of Board-approved valuation control policies and procedures (the Policies). The Policies address, among other things, instances when market quotations are or are not readily available, including recommendations of third party pricing vendors and a determination of appropriate pricing methodologies; events that require specific valuation determinations and assessment of fair value techniques; securities with a potential for stale pricing, including those that are illiquid, restricted, or in default; and the effectiveness of third party pricing vendors, including periodic reviews of vendors. The Committee meets more frequently, as needed, to discuss additional valuation matters, which may include the need to review back-testing results, review time-sensitive information or approve related valuation actions. The Committee reports to the Board, with members of the Committee meeting with the Board at each of its regularly scheduled meetings to discuss valuation matters and actions during the period, similar to those described earlier.
For investments categorized as Level 3, the Committee monitors information similar to that described above, which may include: (i) data specific to the issuer or comparable issuers, (ii) general market or specific sector news and (iii) quoted prices and specific or similar security transactions. The Committee considers this data and any changes from prior periods in order to assess the reasonableness of observable and unobservable inputs, any assumptions or internal models used to value those securities and changes in fair value. This data is also used to corroborate, when available, information received from approved pricing vendors and brokers. Various factors impact the frequency of monitoring this information (which may occur as often as daily). However, the Committee may determine that changes to inputs, assumptions and models are not required as a result of the monitoring procedures performed.
The following table is a summary of the inputs used to value the Fund’s investments at April 30, 2019:
| | Level 1
quoted prices
in active
markets for
identical
assets ($) | Level 2
other
significant
observable
inputs ($) | Level 3
significant
unobservable
inputs ($) | Investments
measured at
net asset
value ($) | Total ($) |
| Investments in Securities | | | | | |
| Asset-Backed Securities — Non-Agency | — | 338,933,950 | 13,014,366 | — | 351,948,316 |
| Commercial Mortgage-Backed Securities - Agency | — | 37,180,522 | — | — | 37,180,522 |
| Commercial Mortgage-Backed Securities - Non-Agency | — | 177,223,215 | — | — | 177,223,215 |
| Common Stocks | | | | | |
| Financials | 38,855 | — | — | — | 38,855 |
| Industrials | 132,668 | — | — | — | 132,668 |
| Total Common Stocks | 171,523 | — | — | — | 171,523 |
| Corporate Bonds & Notes | — | 490,721,843 | 41,069 | — | 490,762,912 |
The accompanying Notes to Financial Statements are an integral part of this statement.
| 32 | Columbia Total Return Bond Fund | Annual Report 2019 |
Portfolio of Investments (continued)
April 30, 2019
Fair value measurements (continued)
| | Level 1
quoted prices
in active
markets for
identical
assets ($) | Level 2
other
significant
observable
inputs ($) | Level 3
significant
unobservable
inputs ($) | Investments
measured at
net asset
value ($) | Total ($) |
| Foreign Government Obligations | — | 60,859,030 | — | — | 60,859,030 |
| Municipal Bonds | — | 2,902,428 | — | — | 2,902,428 |
| Residential Mortgage-Backed Securities - Agency | — | 677,153,792 | — | — | 677,153,792 |
| Residential Mortgage-Backed Securities - Non-Agency | — | 506,398,160 | 7,611,213 | — | 514,009,373 |
| Senior Loans | — | 1,838,368 | — | — | 1,838,368 |
| U.S. Treasury Obligations | 11,409,207 | — | — | — | 11,409,207 |
| Options Purchased Calls | — | 713,430 | — | — | 713,430 |
| Options Purchased Puts | — | 318,900 | — | — | 318,900 |
| Money Market Funds | — | — | — | 87,809,124 | 87,809,124 |
| Total Investments in Securities | 11,580,730 | 2,294,243,638 | 20,666,648 | 87,809,124 | 2,414,300,140 |
| Investments in Derivatives | | | | | |
| Asset | | | | | |
| Futures Contracts | 6,497,847 | — | — | — | 6,497,847 |
| Swap Contracts | — | 135,271 | — | — | 135,271 |
| Liability | | | | | |
| Futures Contracts | (4,108,268) | — | — | — | (4,108,268) |
| Options Contracts Written | — | (1,226,438) | — | — | (1,226,438) |
| Swap Contracts | — | (2,506,373) | — | — | (2,506,373) |
| Total | 13,970,309 | 2,290,646,098 | 20,666,648 | 87,809,124 | 2,413,092,179 |
See the Portfolio of Investments for all investment classifications not indicated in the table.
The Fund’s assets assigned to the Level 2 input category are generally valued using the market approach, in which a security’s value is determined through reference to prices and information from market transactions for similar or identical assets.
Futures contracts and swap contracts are valued at unrealized appreciation (depreciation).
There were no transfers of financial assets between Levels 1 and 2 during the period.
Financial assets were transferred from Level 3 to Level 2 as observable market inputs were utilized and management determined that there was sufficient, reliable and observable market data to value these assets as of period end.
Transfers between levels are determined based on the fair value at the beginning of the period for security positions held throughout the period.
The following table is a reconciliation of Level 3 assets for which significant observable and unobservable inputs were used to determine fair value:
| | Balance
as of
04/30/2018
($) | Increase
(decrease)
in accrued
discounts/
premiums
($) | Realized
gain (loss)
($) | Change
in unrealized
appreciation
(depreciation)(a)
($) | Purchases
($) | Sales
($) | Transfers
into
Level 3
($) | Transfers
out of
Level 3
($) | Balance
as of
04/30/2019
($) |
| Asset-Backed Securities — Non-Agency | 14,359,830 | 46,454 | — | (1,132,897) | 9,036,329 | — | — | (9,295,350) | 13,014,366 |
| Common Stocks | — | — | — | — | — | — | — | — | — |
| Corporate Bonds & Notes | 41,069 | — | — | — | — | — | — | — | 41,069 |
| Residential Mortgage-Backed Securities — Non-Agency | 35,482,021 | (1,525) | (24,621) | 124,383 | 7,794,952 | (7,472,451) | — | (28,291,546) | 7,611,213 |
| Total | 49,882,920 | 44,929 | (24,621) | (1,008,514) | 16,831,281 | (7,472,451) | — | (37,586,896) | 20,666,648 |
(a) Change in unrealized appreciation (depreciation) relating to securities held at April 30, 2019 was $(964,367), which is comprised of Asset-Backed Securities — Non-Agency of $(1,132,897) and Residential Mortgage-Backed Securities — Non-Agency of $168,530.
The Fund’s assets assigned to the Level 3 category are valued utilizing the valuation technique deemed the most appropriate in the circumstances.
Certain corporate bonds and common stocks classified as Level 3 are valued using a market approach. To determine fair value for these securities, management considered various factors which may have included, but were not limited to, trades of similar securities, estimated earnings of the respective company, market multiples derived from a set of comparable companies, and the position of the security within the respective company’s capital structure. Significant increases (decreases) to any of these inputs would result in a significantly higher (lower) fair value measurement. Generally, a change in estimated earnings of the respective company might result in change to the comparable companies and market multiples.
The accompanying Notes to Financial Statements are an integral part of this statement.
Columbia Total Return Bond Fund | Annual Report 2019
| 33 |
Portfolio of Investments (continued)
April 30, 2019
Fair value measurements (continued)
Certain residential and asset-backed securities classified as Level 3 securities are valued using the market approach and utilize single market quotations from broker dealers which may have included, but were not limited to, observable transactions for identical or similar assets in the market and the distressed nature of the security. The appropriateness of fair values for these securities is monitored on an ongoing basis which may include results of back testing, manual price reviews and other control procedures. Significant increases (decreases) to any of these inputs would result in a significantly lower (higher) fair value measurement.
The accompanying Notes to Financial Statements are an integral part of this statement.
| 34 | Columbia Total Return Bond Fund | Annual Report 2019 |
Statement of Assets and Liabilities
April 30, 2019
| Assets | |
| Investments in securities, at value | |
| Unaffiliated issuers (cost $2,350,484,378) | $2,325,458,686 |
| Affiliated issuers (cost $87,809,124) | 87,809,124 |
| Options purchased (cost $1,683,000) | 1,032,330 |
| Cash | 13,571 |
| Cash collateral held at broker for: | |
| Options contracts written | 457,000 |
| Margin deposits on: | |
| Swap contracts | 2,731,187 |
| Unrealized appreciation on swap contracts | 135,271 |
| Upfront payments on swap contracts | 3,161,380 |
| Receivable for: | |
| Investments sold | 8,946,620 |
| Investments sold on a delayed delivery basis | 14,368,968 |
| Capital shares sold | 6,175,657 |
| Dividends | 105,261 |
| Interest | 11,968,300 |
| Foreign tax reclaims | 75,903 |
| Variation margin for futures contracts | 1,608,480 |
| Expense reimbursement due from Investment Manager | 1,705 |
| Prepaid expenses | 2,588 |
| Trustees’ deferred compensation plan | 273,061 |
| Total assets | 2,464,325,092 |
| Liabilities | |
| Option contracts written, at value (premiums received $960,384) | 1,226,438 |
| Unrealized depreciation on swap contracts | 1,006,398 |
| Upfront receipts on swap contracts | 674,471 |
| Payable for: | |
| Investments purchased | 1,978,952 |
| Investments purchased on a delayed delivery basis | 445,131,871 |
| Capital shares purchased | 2,410,310 |
| Distributions to shareholders | 5,376,332 |
| Variation margin for futures contracts | 232,780 |
| Variation margin for swap contracts | 13,478 |
| Management services fees | 26,751 |
| Distribution and/or service fees | 5,202 |
| Transfer agent fees | 219,445 |
| Compensation of board members | 4,457 |
| Compensation of chief compliance officer | 67 |
| Other expenses | 140,171 |
| Trustees’ deferred compensation plan | 273,061 |
| Total liabilities | 458,720,184 |
| Net assets applicable to outstanding capital stock | $2,005,604,908 |
| Represented by | |
| Paid in capital | 2,028,842,281 |
| Total distributable earnings (loss) (Note 2) | (23,237,373) |
| Total - representing net assets applicable to outstanding capital stock | $2,005,604,908 |
The accompanying Notes to Financial Statements are an integral part of this statement.
Columbia Total Return Bond Fund | Annual Report 2019
| 35 |
Statement of Assets and Liabilities (continued)
April 30, 2019
| Class A | |
| Net assets | $681,416,018 |
| Shares outstanding | 75,313,839 |
| Net asset value per share | $9.05 |
| Maximum sales charge | 3.00% |
| Maximum offering price per share (calculated by dividing the net asset value per share by 1.0 minus the maximum sales charge for Class A shares) | $9.33 |
| Advisor Class | |
| Net assets | $15,271,537 |
| Shares outstanding | 1,689,541 |
| Net asset value per share | $9.04 |
| Class C | |
| Net assets | $18,905,410 |
| Shares outstanding | 2,089,477 |
| Net asset value per share | $9.05 |
| Institutional Class | |
| Net assets | $949,377,462 |
| Shares outstanding | 104,882,520 |
| Net asset value per share | $9.05 |
| Institutional 2 Class | |
| Net assets | $80,082,615 |
| Shares outstanding | 8,862,284 |
| Net asset value per share | $9.04 |
| Institutional 3 Class | |
| Net assets | $258,172,272 |
| Shares outstanding | 28,520,919 |
| Net asset value per share | $9.05 |
| Class R | |
| Net assets | $2,379,594 |
| Shares outstanding | 262,918 |
| Net asset value per share | $9.05 |
The accompanying Notes to Financial Statements are an integral part of this statement.
| 36 | Columbia Total Return Bond Fund | Annual Report 2019 |
Statement of Operations
Year Ended April 30, 2019
| Net investment income | |
| Income: | |
| Dividends — unaffiliated issuers | $1,915,108 |
| Dividends — affiliated issuers | 1,371,559 |
| Interest | 77,849,205 |
| Foreign taxes withheld | (509) |
| Total income | 81,135,363 |
| Expenses: | |
| Management services fees | 9,794,055 |
| Distribution and/or service fees | |
| Class A | 1,707,198 |
| Class C | 228,840 |
| Class R | 9,617 |
| Class T | 4,058 |
| Transfer agent fees | |
| Class A | 991,872 |
| Advisor Class | 14,194 |
| Class C | 33,181 |
| Institutional Class | 1,422,654 |
| Institutional 2 Class | 28,715 |
| Institutional 3 Class | 18,832 |
| Class R | 2,791 |
| Class T | 2,360 |
| Compensation of board members | 43,406 |
| Custodian fees | 60,291 |
| Printing and postage fees | 136,457 |
| Registration fees | 132,308 |
| Audit fees | 63,388 |
| Legal fees | 44,050 |
| Interest on collateral | 64,759 |
| Compensation of chief compliance officer | 769 |
| Other | 64,508 |
| Total expenses | 14,868,303 |
| Fees waived or expenses reimbursed by Investment Manager and its affiliates | (984,584) |
| Expense reduction | (2,100) |
| Total net expenses | 13,881,619 |
| Net investment income | 67,253,744 |
| Realized and unrealized gain (loss) — net | |
| Net realized gain (loss) on: | |
| Investments — unaffiliated issuers | (5,701,645) |
| Investments — affiliated issuers | 1,918 |
| Foreign currency translations | 268 |
| Futures contracts | 5,359,341 |
| Options purchased | 5,028,500 |
| Options contracts written | 57,875 |
| Swap contracts | 4,412,963 |
| Net realized gain | 9,159,220 |
| Net change in unrealized appreciation (depreciation) on: | |
| Investments — unaffiliated issuers | 33,189,393 |
| Investments — affiliated issuers | 158 |
| Futures contracts | 4,008,372 |
| Options purchased | (3,205,545) |
| Options contracts written | (266,054) |
| Swap contracts | (3,366,600) |
| Net change in unrealized appreciation (depreciation) | 30,359,724 |
| Net realized and unrealized gain | 39,518,944 |
| Net increase in net assets resulting from operations | $106,772,688 |
The accompanying Notes to Financial Statements are an integral part of this statement.
Columbia Total Return Bond Fund | Annual Report 2019
| 37 |
Statement of Changes in Net Assets
| | Year Ended
April 30, 2019 | Year Ended
April 30, 2018 |
| Operations | | |
| Net investment income | $67,253,744 | $63,301,562 |
| Net realized gain | 9,159,220 | 12,081,779 |
| Net change in unrealized appreciation (depreciation) | 30,359,724 | (66,904,220) |
| Net increase in net assets resulting from operations | 106,772,688 | 8,479,121 |
| Distributions to shareholders | | |
| Net investment income and net realized gains | | |
| Class A | (19,443,978) | |
| Advisor Class | (314,908) | |
| Class C | (448,557) | |
| Institutional Class | (30,156,871) | |
| Institutional 2 Class | (1,745,560) | |
| Institutional 3 Class | (8,224,701) | |
| Class R | (50,420) | |
| Class T | (42,489) | |
| Net investment income | | |
| Class A | | (18,097,044) |
| Advisor Class | | (408,283) |
| Class B | | (7,150) |
| Class C | | (714,362) |
| Institutional Class | | (27,581,855) |
| Institutional 2 Class | | (819,334) |
| Institutional 3 Class | | (10,776,078) |
| Class K | | (64,211) |
| Class R | | (43,857) |
| Class T | | (101,580) |
| Return of capital | | |
| Class A | — | (819,817) |
| Advisor Class | — | (13,542) |
| Class C | — | (31,069) |
| Institutional Class | — | (1,299,402) |
| Institutional 2 Class | — | (39,002) |
| Institutional 3 Class | — | (502,689) |
| Class K | — | (1,355) |
| Class R | — | (1,635) |
| Class T | — | (3,502) |
| Total distributions to shareholders (Note 2) | (60,427,484) | (61,325,767) |
| Decrease in net assets from capital stock activity | (143,216,188) | (304,454,198) |
| Total decrease in net assets | (96,870,984) | (357,300,844) |
| Net assets at beginning of year | 2,102,475,892 | 2,459,776,736 |
| Net assets at end of year | $2,005,604,908 | $2,102,475,892 |
| Undistributed (excess of distributions over) net investment income | $650,120 | $(5,296,202) |
The accompanying Notes to Financial Statements are an integral part of this statement.
| 38 | Columbia Total Return Bond Fund | Annual Report 2019 |
Statement of Changes in Net Assets (continued)
| | Year Ended | Year Ended |
| | April 30, 2019 | April 30, 2018 |
| | Shares | Dollars ($) | Shares | Dollars ($) |
| Capital stock activity |
| Class A | | | | |
| Subscriptions | 7,559,039 | 67,041,185 | 5,116,828 | 46,221,131 |
| Distributions reinvested | 2,133,543 | 18,929,795 | 2,040,194 | 18,410,244 |
| Redemptions | (14,980,790) | (132,540,808) | (17,352,715) | (156,487,295) |
| Net decrease | (5,288,208) | (46,569,828) | (10,195,693) | (91,855,920) |
| Advisor Class | | | | |
| Subscriptions | 1,230,103 | 10,880,473 | 474,552 | 4,268,927 |
| Distributions reinvested | 33,847 | 300,754 | 44,973 | 406,191 |
| Redemptions | (336,846) | (2,984,554) | (1,758,241) | (15,708,706) |
| Net increase (decrease) | 927,104 | 8,196,673 | (1,238,716) | (11,033,588) |
| Class B | | | | |
| Subscriptions | — | — | 92 | 836 |
| Distributions reinvested | — | — | 611 | 5,547 |
| Redemptions | — | — | (244,307) | (2,222,352) |
| Net decrease | — | — | (243,604) | (2,215,969) |
| Class C | | | | |
| Subscriptions | 504,801 | 4,480,663 | 416,508 | 3,753,789 |
| Distributions reinvested | 46,505 | 412,518 | 77,630 | 700,760 |
| Redemptions | (2,874,845) | (25,477,444) | (1,545,579) | (13,926,923) |
| Net decrease | (2,323,539) | (20,584,263) | (1,051,441) | (9,472,374) |
| Institutional Class | | | | |
| Subscriptions | 29,142,509 | 257,585,685 | 25,841,081 | 233,942,778 |
| Distributions reinvested | 2,272,188 | 20,164,479 | 1,985,971 | 17,919,936 |
| Redemptions | (43,911,963) | (386,614,607) | (30,353,938) | (274,053,357) |
| Net decrease | (12,497,266) | (108,864,443) | (2,526,886) | (22,190,643) |
| Institutional 2 Class | | | | |
| Subscriptions | 6,174,021 | 54,216,625 | 2,066,473 | 18,670,006 |
| Distributions reinvested | 196,539 | 1,745,136 | 95,154 | 857,131 |
| Redemptions | (1,033,214) | (9,142,479) | (1,714,512) | (15,466,228) |
| Net increase | 5,337,346 | 46,819,282 | 447,115 | 4,060,909 |
| Institutional 3 Class | | | | |
| Subscriptions | 2,048,449 | 18,078,155 | 5,131,929 | 46,517,075 |
| Distributions reinvested | 925,409 | 8,213,609 | 1,234,672 | 11,151,412 |
| Redemptions | (5,272,364) | (46,454,241) | (24,787,528) | (221,125,812) |
| Net decrease | (2,298,506) | (20,162,477) | (18,420,927) | (163,457,325) |
| Class K | | | | |
| Subscriptions | — | — | 19,347 | 175,445 |
| Distributions reinvested | — | — | 7,196 | 65,191 |
| Redemptions | — | — | (397,724) | (3,553,499) |
| Net decrease | — | — | (371,181) | (3,312,863) |
| Class R | | | | |
| Subscriptions | 119,639 | 1,061,686 | 99,064 | 896,388 |
| Distributions reinvested | 5,423 | 48,177 | 4,373 | 39,499 |
| Redemptions | (47,463) | (418,780) | (170,808) | (1,549,815) |
| Net increase (decrease) | 77,599 | 691,083 | (67,371) | (613,928) |
| Class T | | | | |
| Subscriptions | — | — | 24 | 213 |
| Distributions reinvested | 4,309 | 37,945 | 11,601 | 104,835 |
| Redemptions | (316,508) | (2,780,160) | (494,017) | (4,467,545) |
| Net decrease | (312,199) | (2,742,215) | (482,392) | (4,362,497) |
| Total net decrease | (16,377,669) | (143,216,188) | (34,151,096) | (304,454,198) |
The accompanying Notes to Financial Statements are an integral part of this statement.
Columbia Total Return Bond Fund | Annual Report 2019
| 39 |
The following table is intended to help you understand the Fund’s financial performance. Certain information reflects financial results for a single share of a class held for the periods shown. Per share net investment income (loss) amounts are calculated based on average shares outstanding during the period. Total return assumes reinvestment of all dividends and distributions, if any. Total return does not reflect payment of sales charges, if any. Total return and portfolio turnover are not annualized for periods of less than one year. The portfolio turnover rate is calculated without regard to purchase and sales transactions of short-term instruments and certain derivatives, if any. If such transactions were included, the Fund’s portfolio turnover rate may be higher.
| | Net asset value,
beginning of
period | Net
investment
income | Net
realized
and
unrealized
gain (loss) | Total from
investment
operations | Distributions
from net
investment
income | Distributions
from net
realized
gains | Tax
return of
capital | Total
distributions to
shareholders |
| Class A |
| Year Ended 4/30/2019 | $8.83 | 0.28 | 0.19 | 0.47 | (0.25) | — | — | (0.25) |
| Year Ended 4/30/2018 | $9.04 | 0.23 | (0.22) | 0.01 | (0.21) | — | (0.01) | (0.22) |
| Year Ended 4/30/2017 | $9.20 | 0.25 | (0.04) | 0.21 | (0.23) | (0.14) | — | (0.37) |
| Year Ended 4/30/2016 | $9.25 | 0.22 | 0.01(f) | 0.23 | (0.17) | (0.11) | — | (0.28) |
| Year Ended 4/30/2015 | $9.15 | 0.23 | 0.09 | 0.32 | (0.22) | — | — | (0.22) |
| Advisor Class |
| Year Ended 4/30/2019 | $8.82 | 0.31 | 0.19 | 0.50 | (0.28) | — | — | (0.28) |
| Year Ended 4/30/2018 | $9.02 | 0.25 | (0.21) | 0.04 | (0.23) | — | (0.01) | (0.24) |
| Year Ended 4/30/2017 | $9.18 | 0.26 | (0.02) | 0.24 | (0.26) | (0.14) | — | (0.40) |
| Year Ended 4/30/2016 | $9.24 | 0.24 | 0.00(f),(g) | 0.24 | (0.19) | (0.11) | — | (0.30) |
| Year Ended 4/30/2015 | $9.14 | 0.25 | 0.10 | 0.35 | (0.25) | — | — | (0.25) |
| Class C |
| Year Ended 4/30/2019 | $8.83 | 0.21 | 0.20 | 0.41 | (0.19) | — | — | (0.19) |
| Year Ended 4/30/2018 | $9.04 | 0.16 | (0.22) | (0.06) | (0.14) | — | (0.01) | (0.15) |
| Year Ended 4/30/2017 | $9.20 | 0.18 | (0.04) | 0.14 | (0.16) | (0.14) | — | (0.30) |
| Year Ended 4/30/2016 | $9.25 | 0.15 | 0.01(f) | 0.16 | (0.10) | (0.11) | — | (0.21) |
| Year Ended 4/30/2015 | $9.15 | 0.17 | 0.09 | 0.26 | (0.16) | — | — | (0.16) |
| Institutional Class |
| Year Ended 4/30/2019 | $8.84 | 0.30 | 0.19 | 0.49 | (0.28) | — | — | (0.28) |
| Year Ended 4/30/2018 | $9.04 | 0.25 | (0.21) | 0.04 | (0.23) | — | (0.01) | (0.24) |
| Year Ended 4/30/2017 | $9.20 | 0.27 | (0.03) | 0.24 | (0.26) | (0.14) | — | (0.40) |
| Year Ended 4/30/2016 | $9.26 | 0.24 | 0.00(f),(g) | 0.24 | (0.19) | (0.11) | — | (0.30) |
| Year Ended 4/30/2015 | $9.15 | 0.25 | 0.11 | 0.36 | (0.25) | — | — | (0.25) |
| Institutional 2 Class |
| Year Ended 4/30/2019 | $8.82 | 0.32 | 0.18 | 0.50 | (0.28) | — | — | (0.28) |
| Year Ended 4/30/2018 | $9.03 | 0.26 | (0.22) | 0.04 | (0.24) | — | (0.01) | (0.25) |
| Year Ended 4/30/2017 | $9.18 | 0.27 | (0.02) | 0.25 | (0.26) | (0.14) | — | (0.40) |
| Year Ended 4/30/2016 | $9.24 | 0.25 | 0.00(f),(g) | 0.25 | (0.20) | (0.11) | — | (0.31) |
| Year Ended 4/30/2015 | $9.14 | 0.25 | 0.10 | 0.35 | (0.25) | — | — | (0.25) |
The accompanying Notes to Financial Statements are an integral part of this statement.
| 40 | Columbia Total Return Bond Fund | Annual Report 2019 |
Financial Highlights (continued)
| | Net
asset
value,
end of
period | Total
return | Total gross
expense
ratio to
average
net assets(a) | Total net
expense
ratio to
average
net assets(a),(b) | Net investment
income
ratio to
average
net assets | Portfolio
turnover | Net
assets,
end of
period
(000’s) |
| Class A |
| Year Ended 4/30/2019 | $9.05 | 5.45% | 0.91%(c) | 0.86%(c),(d) | 3.19% | 262% | $681,416 |
| Year Ended 4/30/2018 | $8.83 | 0.08% | 0.91% | 0.86%(d) | 2.51% | 300% | $711,850 |
| Year Ended 4/30/2017 | $9.04 | 2.37% | 0.89%(e) | 0.84%(d),(e) | 2.70% | 379% | $820,441 |
| Year Ended 4/30/2016 | $9.20 | 2.58% | 0.91% | 0.86%(d) | 2.39% | 458% | $978,460 |
| Year Ended 4/30/2015 | $9.25 | 3.56% | 0.92% | 0.85%(d) | 2.45% | 316% | $1,248,168 |
| Advisor Class |
| Year Ended 4/30/2019 | $9.04 | 5.72% | 0.66%(c) | 0.61%(c),(d) | 3.53% | 262% | $15,272 |
| Year Ended 4/30/2018 | $8.82 | 0.44% | 0.66% | 0.61%(d) | 2.72% | 300% | $6,726 |
| Year Ended 4/30/2017 | $9.02 | 2.63% | 0.63%(e) | 0.59%(d),(e) | 2.87% | 379% | $18,057 |
| Year Ended 4/30/2016 | $9.18 | 2.72% | 0.66% | 0.61%(d) | 2.65% | 458% | $8,265 |
| Year Ended 4/30/2015 | $9.24 | 3.82% | 0.67% | 0.60%(d) | 2.70% | 316% | $7,656 |
| Class C |
| Year Ended 4/30/2019 | $9.05 | 4.66% | 1.66%(c) | 1.61%(c),(d) | 2.37% | 262% | $18,905 |
| Year Ended 4/30/2018 | $8.83 | (0.67%) | 1.66% | 1.61%(d) | 1.75% | 300% | $38,975 |
| Year Ended 4/30/2017 | $9.04 | 1.61% | 1.64%(e) | 1.59%(d),(e) | 1.95% | 379% | $49,380 |
| Year Ended 4/30/2016 | $9.20 | 1.81% | 1.66% | 1.61%(d) | 1.65% | 458% | $55,975 |
| Year Ended 4/30/2015 | $9.25 | 2.89% | 1.67% | 1.50%(d) | 1.80% | 316% | $60,605 |
| Institutional Class |
| Year Ended 4/30/2019 | $9.05 | 5.60% | 0.66%(c) | 0.61%(c),(d) | 3.42% | 262% | $949,377 |
| Year Ended 4/30/2018 | $8.84 | 0.44% | 0.66% | 0.61%(d) | 2.76% | 300% | $1,037,101 |
| Year Ended 4/30/2017 | $9.04 | 2.63% | 0.64%(e) | 0.59%(d),(e) | 2.94% | 379% | $1,083,917 |
| Year Ended 4/30/2016 | $9.20 | 2.72% | 0.66% | 0.61%(d) | 2.64% | 458% | $1,078,815 |
| Year Ended 4/30/2015 | $9.26 | 3.93% | 0.67% | 0.60%(d) | 2.69% | 316% | $1,175,483 |
| Institutional 2 Class |
| Year Ended 4/30/2019 | $9.04 | 5.81% | 0.58%(c) | 0.53%(c) | 3.64% | 262% | $80,083 |
| Year Ended 4/30/2018 | $8.82 | 0.38% | 0.58% | 0.55% | 2.82% | 300% | $31,099 |
| Year Ended 4/30/2017 | $9.03 | 2.79% | 0.54%(e) | 0.54%(e) | 2.99% | 379% | $27,782 |
| Year Ended 4/30/2016 | $9.18 | 2.80% | 0.55% | 0.54% | 2.73% | 458% | $22,621 |
| Year Ended 4/30/2015 | $9.24 | 3.89% | 0.55% | 0.54% | 2.74% | 316% | $21,580 |
The accompanying Notes to Financial Statements are an integral part of this statement.
Columbia Total Return Bond Fund | Annual Report 2019
| 41 |
Financial Highlights (continued)
| | Net asset value,
beginning of
period | Net
investment
income | Net
realized
and
unrealized
gain (loss) | Total from
investment
operations | Distributions
from net
investment
income | Distributions
from net
realized
gains | Tax
return of
capital | Total
distributions to
shareholders |
| Institutional 3 Class |
| Year Ended 4/30/2019 | $8.84 | 0.32 | 0.18 | 0.50 | (0.29) | — | — | (0.29) |
| Year Ended 4/30/2018 | $9.04 | 0.26 | (0.21) | 0.05 | (0.24) | — | (0.01) | (0.25) |
| Year Ended 4/30/2017 | $9.20 | 0.24 | 0.01(f) | 0.25 | (0.27) | (0.14) | — | (0.41) |
| Year Ended 4/30/2016 | $9.26 | 0.25 | 0.00(f),(g) | 0.25 | (0.20) | (0.11) | — | (0.31) |
| Year Ended 4/30/2015 | $9.16 | 0.26 | 0.10 | 0.36 | (0.26) | — | — | (0.26) |
| Class R |
| Year Ended 4/30/2019 | $8.83 | 0.26 | 0.19 | 0.45 | (0.23) | — | — | (0.23) |
| Year Ended 4/30/2018 | $9.04 | 0.20 | (0.21) | (0.01) | (0.19) | — | (0.01) | (0.20) |
| Year Ended 4/30/2017 | $9.20 | 0.22 | (0.03) | 0.19 | (0.21) | (0.14) | — | (0.35) |
| Year Ended 4/30/2016 | $9.26 | 0.19 | 0.01(f) | 0.20 | (0.15) | (0.11) | — | (0.26) |
| Year Ended 4/30/2015 | $9.15 | 0.20 | 0.11 | 0.31 | (0.20) | — | — | (0.20) |
| Notes to Financial Highlights |
| (a) | In addition to the fees and expenses that the Fund bears directly, the Fund indirectly bears a pro rata share of the fees and expenses of any other funds in which it invests. Such indirect expenses are not included in the Fund’s reported expense ratios. |
| (b) | Total net expenses include the impact of certain fee waivers/expense reimbursements made by the Investment Manager and certain of its affiliates, if applicable. |
| (c) | Ratios include interest on collateral expense which is less than 0.01%. |
| (d) | The benefits derived from expense reductions had an impact of less than 0.01%. |
| (e) | Expenses have been reduced due to a reimbursement of expenses overbilled by a third party. If the reimbursement had been excluded, the expense ratios would have been higher by the percentages shown for each class in the table below. All fee waivers and expense reimbursements by the Investment Manager and its affiliates were applied before giving effect to this third party reimbursement. |
| Year Ended | Class A | Advisor
Class | Class C | Institutional
Class | Institutional 2
Class | Institutional 3
Class | Class R |
| 04/30/2017 | 0.02% | 0.02% | 0.02% | 0.02% | 0.02% | 0.01% | 0.02% |
| (f) | Calculation of the net gain (loss) per share (both realized and unrealized) does not correlate to the aggregate realized and unrealized gain (loss) presented in the Statement of Operations due to the timing of subscriptions and redemptions of Fund shares in relation to fluctuations in the market value of the portfolio. |
| (g) | Rounds to zero. |
The accompanying Notes to Financial Statements are an integral part of this statement.
| 42 | Columbia Total Return Bond Fund | Annual Report 2019 |
Financial Highlights (continued)
| | Net
asset
value,
end of
period | Total
return | Total gross
expense
ratio to
average
net assets(a) | Total net
expense
ratio to
average
net assets(a),(b) | Net investment
income
ratio to
average
net assets | Portfolio
turnover | Net
assets,
end of
period
(000’s) |
| Institutional 3 Class |
| Year Ended 4/30/2019 | $9.05 | 5.73% | 0.53%(c) | 0.49%(c) | 3.56% | 262% | $258,172 |
| Year Ended 4/30/2018 | $8.84 | 0.55% | 0.52% | 0.50% | 2.85% | 300% | $272,332 |
| Year Ended 4/30/2017 | $9.04 | 2.74% | 0.50%(e) | 0.50%(e) | 2.70% | 379% | $445,184 |
| Year Ended 4/30/2016 | $9.20 | 2.85% | 0.50% | 0.49% | 2.77% | 458% | $18,086 |
| Year Ended 4/30/2015 | $9.26 | 3.94% | 0.50% | 0.49% | 2.80% | 316% | $18,249 |
| Class R |
| Year Ended 4/30/2019 | $9.05 | 5.19% | 1.16%(c) | 1.11%(c),(d) | 2.97% | 262% | $2,380 |
| Year Ended 4/30/2018 | $8.83 | (0.17%) | 1.16% | 1.11%(d) | 2.24% | 300% | $1,637 |
| Year Ended 4/30/2017 | $9.04 | 2.12% | 1.14%(e) | 1.09%(d),(e) | 2.43% | 379% | $2,284 |
| Year Ended 4/30/2016 | $9.20 | 2.21% | 1.16% | 1.11%(d) | 2.13% | 458% | $2,407 |
| Year Ended 4/30/2015 | $9.26 | 3.41% | 1.17% | 1.10%(d) | 2.19% | 316% | $2,769 |
The accompanying Notes to Financial Statements are an integral part of this statement.
Columbia Total Return Bond Fund | Annual Report 2019
| 43 |
Notes to Financial Statements
April 30, 2019
Note 1. Organization
Columbia Total Return Bond Fund (the Fund), a series of Columbia Funds Series Trust I (the Trust), is a diversified fund. The Trust is registered under the Investment Company Act of 1940, as amended (the 1940 Act), as an open-end management investment company organized as a Massachusetts business trust.
Fund shares
The Trust may issue an unlimited number of shares (without par value). Although all share classes generally have identical voting, dividend and liquidation rights, each share class votes separately when required by the Trust’s organizational documents or by law. Different share classes pay different distribution amounts to the extent the expenses of such share classes differ, and distributions in liquidation will be proportional to the net asset value of each share class. Each share class has its own expense and sales charge structure. The Fund offers each of the share classes identified below.
Class A shares are subject to a maximum front-end sales charge of 3.00% based on the initial investment amount. Class A shares purchased without an initial sales charge in accounts aggregating $1 million to $50 million at the time of purchase are subject to a contingent deferred sales charge (CDSC) if the shares are sold within 18 months after purchase, charged as follows: 1.00% CDSC if redeemed within 12 months after purchase, and 0.50% CDSC if redeemed more than 12, but less than 18, months after purchase.
Advisor Class shares are not subject to sales charges and are generally available only to omnibus retirement plans and certain investors as described in the Fund’s prospectus.
Class C shares are subject to a 1.00% CDSC on shares redeemed within 12 months after purchase. Effective July 1, 2018, Class C shares automatically convert to Class A shares of the same Fund in the month of or the month following the 10-year anniversary of the Class C shares purchase date.
Institutional Class shares are not subject to sales charges and are generally available only to eligible investors, which are subject to different investment minimums as described in the Fund’s prospectus.
Institutional 2 Class shares are not subject to sales charges and are generally available only to investors purchasing through authorized investment professionals and omnibus retirement plans as described in the Fund’s prospectus.
Institutional 3 Class shares are not subject to sales charges and are available to institutional and certain other investors as described in the Fund’s prospectus.
Class R shares are not subject to sales charges and are generally available only to certain retirement plans and other investors as described in the Fund’s prospectus.
Class T shares were subject to a maximum front-end sales charge of 2.50% per transaction and were required to be purchased through financial intermediaries that, by written agreement with Columbia Management Investment Distributors, Inc., were specifically authorized to sell Class T shares. Effective at the close of business on December 14, 2018, Class T shares merged, in a tax-free transaction, into Class A shares of the Fund and are no longer offered for sale.
Note 2. Summary of significant accounting policies
Basis of preparation
The Fund is an investment company that applies the accounting and reporting guidance in the Financial Accounting Standards Board (FASB) Accounting Standards Codification Topic 946,Financial Services - Investment Companies (ASC 946). The financial statements are prepared in accordance with U.S. generally accepted accounting principles (GAAP), which requires management to make certain estimates and assumptions that affect the reported amounts of assets and liabilities, the disclosure of contingent assets and liabilities at the date of the financial statements and the reported amounts of income and expenses during the reporting period. Actual results could differ from those estimates.
The following is a summary of significant accounting policies followed by the Fund in the preparation of its financial statements.
| 44 | Columbia Total Return Bond Fund | Annual Report 2019 |
Notes to Financial Statements (continued)
April 30, 2019
Security valuation
All equity securities are valued at the close of business of the New York Stock Exchange. Equity securities are valued at the last quoted sales price on the principal exchange or market on which they trade, except for securities traded on the NASDAQ Stock Market, which are valued at the NASDAQ official close price. Unlisted securities or listed securities for which there were no sales during the day are valued at the mean of the latest quoted bid and ask prices on such exchanges or markets.
Debt securities generally are valued by pricing services approved by the Board of Trustees based upon market transactions for normal, institutional-size trading units of similar securities. The services may use various pricing techniques that take into account, as applicable, factors such as yield, quality, coupon rate, maturity, type of issue, trading characteristics and other data, as well as approved independent broker-dealer quotes. Debt securities for which quotations are not readily available or not believed to be reflective of market value may also be valued based upon a bid quote from an approved independent broker-dealer. Debt securities maturing in 60 days or less are valued primarily at amortized cost value, unless this method results in a valuation that management believes does not approximate market value.
Asset- and mortgage-backed securities are generally valued by pricing services, which utilize pricing models that incorporate the securities’ cash flow and loan performance data. These models also take into account available market data, including trades, market quotations, and benchmark yield curves for identical or similar securities. Factors used to identify similar securities may include, but are not limited to, issuer, collateral type, vintage, prepayment speeds, collateral performance, credit ratings, credit enhancement and expected life. Asset-backed securities for which quotations are readily available may also be valued based upon an over-the-counter or exchange bid quote from an approved independent broker-dealer.
Senior loan securities for which reliable market quotations are readily available are generally valued by pricing services at the average of the bids received.
Investments in open-end investment companies, including money market funds, are valued at their latest net asset value.
Futures and options on futures contracts are valued based upon the settlement price at the close of regular trading on their principal exchanges or, in the absence of transactions, at the mean of the latest quoted bid and ask prices.
Option contracts are valued at the mean of the latest quoted bid and ask prices on their primary exchanges. Option contracts, including over-the-counter option contracts, with no readily available market quotations are valued using quotes obtained from independent brokers as of the close of the New York Stock Exchange.
Swap transactions are valued through an independent pricing service or broker, or if neither is available, through an internal model based upon observable inputs.
Investments for which market quotations are not readily available, or that have quotations which management believes are not reflective of market value or reliable, are valued at fair value as determined in good faith under procedures approved by and under the general supervision of the Board of Trustees. If a security or class of securities (such as foreign securities) is valued at fair value, such value is likely to be different from the quoted or published price for the security.
The determination of fair value often requires significant judgment. To determine fair value, management may use assumptions including but not limited to future cash flows and estimated risk premiums. Multiple inputs from various sources may be used to determine fair value.
GAAP requires disclosure regarding the inputs and valuation techniques used to measure fair value and any changes in valuation inputs or techniques. In addition, investments shall be disclosed by major category. This information is disclosed following the Fund’s Portfolio of Investments.
Foreign currency transactions and translations
The values of all assets and liabilities denominated in foreign currencies are generally translated into U.S. dollars at exchange rates determined at the close of regular trading on the New York Stock Exchange. Net realized and unrealized gains (losses) on foreign currency transactions and translations include gains (losses) arising from the fluctuation in exchange
Columbia Total Return Bond Fund | Annual Report 2019
| 45 |
Notes to Financial Statements (continued)
April 30, 2019
rates between trade and settlement dates on securities transactions, gains (losses) arising from the disposition of foreign currency and currency gains (losses) between the accrual and payment dates on dividends, interest income and foreign withholding taxes.
For financial statement purposes, the Fund does not distinguish that portion of gains (losses) on investments which is due to changes in foreign exchange rates from that which is due to changes in market prices of the investments. Such fluctuations are included with the net realized and unrealized gains (losses) on investments in the Statement of Operations.
Derivative instruments
The Fund invests in certain derivative instruments, as detailed below, to meet its investment objectives. Derivatives are instruments whose values depend on, or are derived from, in whole or in part, the value of one or more securities, currencies, commodities, indices, or other assets or instruments. Derivatives may be used to increase investment flexibility (including to maintain cash reserves while maintaining desired exposure to certain assets), for risk management (hedging) purposes, to facilitate trading, to reduce transaction costs and to pursue higher investment returns. The Fund may also use derivative instruments to mitigate certain investment risks, such as foreign currency exchange rate risk, interest rate risk and credit risk. Derivatives may involve various risks, including the potential inability of the counterparty to fulfill its obligations under the terms of the contract, the potential for an illiquid secondary market (making it difficult for the Fund to sell or terminate, including at favorable prices) and the potential for market movements which may expose the Fund to gains or losses in excess of the amount shown in the Statement of Assets and Liabilities. The notional amounts of derivative instruments, if applicable, are not recorded in the financial statements.
A derivative instrument may suffer a marked-to-market loss if the value of the contract decreases due to an unfavorable change in the market rates or values of the underlying instrument. Losses can also occur if the counterparty does not perform its obligations under the contract. The Fund’s risk of loss from counterparty credit risk on over-the-counter derivatives is generally limited to the aggregate unrealized gain netted against any collateral held by the Fund and the amount of any variation margin held by the counterparty, plus any replacement costs or related amounts. With exchange-traded or centrally cleared derivatives, there is reduced counterparty credit risk to the Fund since the clearinghouse or central counterparty (CCP) provides some protection in the case of clearing member default. The clearinghouse or CCP stands between the buyer and the seller of the contract; therefore, additional counterparty credit risk is failure of the clearinghouse or CCP. However, credit risk still exists in exchange-traded or centrally cleared derivatives with respect to initial and variation margin that is held in a broker’s customer account. While brokers are required to segregate customer margin from their own assets, in the event that a broker becomes insolvent or goes into bankruptcy and at that time there is a shortfall in the aggregate amount of margin held by the broker for all its clients, U.S. bankruptcy laws will typically allocate that shortfall on a pro-rata basis across all the broker’s customers (including the Fund), potentially resulting in losses to the Fund.
In order to better define its contractual rights and to secure rights that will help the Fund mitigate its counterparty risk, the Fund may enter into an International Swaps and Derivatives Association, Inc. Master Agreement (ISDA Master Agreement) or similar agreement with its derivatives contract counterparties. An ISDA Master Agreement is an agreement between the Fund and a counterparty that governs over-the-counter derivatives and typically contains, among other things, collateral posting terms and netting provisions in the event of a default and/or termination event. Under an ISDA Master Agreement, the Fund may, under certain circumstances, offset with the counterparty certain derivative instrument’s payables and/or receivables with collateral held and/or posted and create one single net payment. The provisions of the ISDA Master Agreement typically permit a single net payment in the event of default (close-out netting), including the bankruptcy or insolvency of the counterparty. Note, however, that bankruptcy or insolvency laws of a particular jurisdiction may impose restrictions on or prohibitions against the right of offset or netting in bankruptcy, insolvency or other events.
Collateral (margin) requirements differ by type of derivative. Margin requirements are established by the clearinghouse or CCP for exchange-traded and centrally cleared derivatives. Brokers can ask for margin in excess of the minimum in certain circumstances. Collateral terms are contract specific for over-the-counter derivatives. For over-the-counter derivatives traded under an ISDA Master Agreement, the collateral requirements are typically calculated by netting the marked-to-market amount for each transaction under such agreement and comparing that amount to the value of any variation margin currently pledged by the Fund and/or the counterparty. Generally, the amount of collateral due from or to a party has to exceed a minimum transfer amount threshold (e.g., $250,000) before a transfer has to be made. To the extent amounts due to the Fund from its counterparties are not fully collateralized, contractually or otherwise, the Fund bears the risk of loss from counterparty
| 46 | Columbia Total Return Bond Fund | Annual Report 2019 |
Notes to Financial Statements (continued)
April 30, 2019
nonperformance. The Fund may also pay interest expense on cash collateral received from the broker. Any interest expense paid by the Fund is shown on the Statement of Operations. The Fund attempts to mitigate counterparty risk by only entering into agreements with counterparties that it believes have the financial resources to honor their obligations and by monitoring the financial stability of those counterparties.
Certain ISDA Master Agreements allow counterparties of over-the-counter derivatives transactions to terminate derivatives contracts prior to maturity in the event the Fund’s net asset value declines by a stated percentage over a specified time period or if the Fund fails to meet certain terms of the ISDA Master Agreement, which would cause the Fund to accelerate payment of any net liability owed to the counterparty. The Fund also has termination rights if the counterparty fails to meet certain terms of the ISDA Master Agreement. In determining whether to exercise such termination rights, the Fund would consider, in addition to counterparty credit risk, whether termination would result in a net liability owed from the counterparty.
For financial reporting purposes, the Fund does not offset derivative assets and derivative liabilities that are subject to netting arrangements in the Statement of Assets and Liabilities.
Futures contracts
Futures contracts are exchange-traded and represent commitments for the future purchase or sale of an asset at a specified price on a specified date. The Fund bought and sold futures contracts to manage the duration and yield curve exposure of the Fund versus the benchmark and to manage exposure to movements in interest rates (interest rate futures). These instruments may be used for other purposes in future periods. Upon entering into futures contracts, the Fund bears risks that it may not achieve the anticipated benefits of the futures contracts and may realize a loss. Additional risks include counterparty credit risk, the possibility of an illiquid market, and that a change in the value of the contract or option may not correlate with changes in the value of the underlying asset.
Upon entering into a futures contract, the Fund deposits cash or securities with the broker, known as a futures commission merchant (FCM), in an amount sufficient to meet the initial margin requirement. The initial margin deposit must be maintained at an established level over the life of the contract. Cash deposited as initial margin is recorded in the Statement of Assets and Liabilities as margin deposits. Securities deposited as initial margin are designated in the Portfolio of Investments. Subsequent payments (variation margin) are made or received by the Fund each day. The variation margin payments are equal to the daily change in the contract value and are recorded as variation margin receivable or payable and are offset in unrealized gains or losses. The Fund recognizes a realized gain or loss when the contract is closed or expires. Futures contracts involve, to varying degrees, risk of loss in excess of the variation margin disclosed in the Statement of Assets and Liabilities.
Options contracts
Options are contracts which entitle the holder to purchase or sell securities or other identified assets at a specified price, or in the case of index option contracts, to receive or pay the difference between the index value and the strike price of the index option contract. Option contracts can be either exchange-traded or over-the-counter. The Fund purchased and wrote option contracts to manage exposure to fluctuations in interest rates and to manage convexity risk. These instruments may be used for other purposes in future periods. Completion of transactions for option contracts traded in the over-the-counter market depends upon the performance of the other party. Cash collateral may be collected or posted by the Fund to secure certain over-the-counter option contract trades. Cash collateral held or posted by the Fund for such option contract trades must be returned to the broker or the Fund upon closure, exercise or expiration of the contract.
Options contracts purchased are recorded as investments. When the Fund writes an options contract, the premium received is recorded as an asset and an amount equivalent to the premium is recorded as a liability in the Statement of Assets and Liabilities and is subsequently adjusted to reflect the current fair value of the option written. Changes in the fair value of the written option are recorded as unrealized appreciation or depreciation until the contract is exercised or has expired. The Fund will realize a gain or loss when the option contract is closed or expires. When option contracts are exercised, the proceeds on sales for a written call or purchased put option contract, or the purchase cost for a written put or purchased call option contract, is adjusted by the amount of premium received or paid.
Columbia Total Return Bond Fund | Annual Report 2019
| 47 |
Notes to Financial Statements (continued)
April 30, 2019
For over-the-counter options purchased, the Fund bears the risk of loss of the amount of the premiums paid plus the positive change in market values net of any collateral held by the Fund should the counterparty fail to perform under the contracts. Option contracts written by the Fund do not typically give rise to significant counterparty credit risk, as options written generally obligate the Fund and not the counterparty to perform. The risk in writing a call option contract is that the Fund gives up the opportunity for profit if the market price of the security increases above the strike price and the option contract is exercised. The risk in writing a put option contract is that the Fund may incur a loss if the market price of the security decreases below the strike price and the option contract is exercised. Exercise of a written option could result in the Fund purchasing or selling a security or foreign currency when it otherwise would not, or at a price different from the current market value. In purchasing and writing options, the Fund bears the risk of an unfavorable change in the value of the underlying instrument or the risk that the Fund may not be able to enter into a closing transaction due to an illiquid market.
Interest rate swaption contracts
Interest rate swaption contracts entered into by the Fund typically represent an option that gives the purchaser the right, but not the obligation, to enter into an interest rate swap contract on a future date. Each interest rate swaption agreement will specify if the buyer is entitled to receive the fixed or floating rate if the interest rate is exercised. Changes in the value of a purchased interest rate swaption contracts are reported as unrealized appreciation or depreciation on options in the Statement of Assets and Liabilities. Gain or loss is recognized in the Statement of Operations when the interest rate swaption contract is closed or expires.
When the Fund writes an interest rate swaption contract, the premium received is recorded as an asset and an amount equivalent to the premium is recorded as a liability in the Statement of Assets and Liabilities and is subsequently adjusted to reflect the current fair value of the interest rate swaption contract written. Premiums received from writing interest rate swaption contracts that expire unexercised are recorded by the Fund on the expiration date as realized gains from options written in the Statement of Operations. The difference between the premium and the amount paid on effecting a closing purchase transaction, including brokerage commissions, is also recorded as realized gain, or if the premium is less than the amount paid for the closing purchase, as realized loss. These amounts are reflected as net realized gain (loss) on options written in the Statement of Operations.
Swap contracts
Swap contracts are negotiated in the over-the-counter market and may be entered into as a bilateral contract or centrally cleared (centrally cleared swap contract). In a centrally cleared swap contract, immediately following execution of the swap contract with a broker, the swap contract is novated to a central counterparty (the CCP) and the CCP becomes the Fund’s counterparty to the centrally cleared swap contract. The Fund is required to deposit initial margin with the futures commission merchant (FCM), which pledges it through to the CCP in the form of cash or securities in an amount that varies depending on the size and risk profile of the particular swap contract. Securities deposited as initial margin are designated in the Portfolio of Investments and cash deposited is recorded in the Statement of Assets and Liabilities as margin deposits. Unlike a bilateral swap contract, for centrally cleared swap contracts, the Fund has minimal credit exposure to the FCM because the CCP stands between the Fund and the relevant buyer/seller on the other side of the contract. Swap contracts are marked-to-market daily and changes in value are recorded as unrealized appreciation (depreciation). The daily change in valuation of centrally cleared swap contracts, if any, is recorded as a receivable or payable for variation margin in the Statement of Assets and Liabilities.
Entering into these contracts involves, to varying degrees, elements of interest, liquidity and counterparty credit risk in excess of the amounts recognized in the Statement of Assets and Liabilities. Such risks involve the possibility that there may be unfavorable changes in interest rates, market conditions or other conditions, that it may be difficult to initiate a swap transaction or liquidate a position at an advantageous time or price which may result in significant losses, and that the FCM or CCP may not fulfill its obligation under the contract.
Credit default swap contracts
The Fund entered into credit default swap contracts to increase or decrease its credit exposure to an index. These instruments may be used for other purposes in future periods. Credit default swap contracts are agreements in which one party pays fixed periodic payments to a counterparty in consideration for an agreement from the counterparty to make a
| 48 | Columbia Total Return Bond Fund | Annual Report 2019 |
Notes to Financial Statements (continued)
April 30, 2019
specific payment should a specified credit event(s) take place. Although specified credit events are contract specific, credit events are generally defined as bankruptcy, failure to pay, restructuring, obligation acceleration, obligation default, or repudiation/moratorium.
As the purchaser of a credit default swap contract, the Fund purchases protection by paying a periodic interest rate on the notional amount to the counterparty. The interest amount is accrued daily as a component of unrealized appreciation (depreciation) and is recorded as a realized loss upon payment. If a credit event as specified in the contract occurs, the Fund may have the option either to deliver the reference obligation to the seller in exchange for a cash payment of its par amount, or to receive a net cash settlement equal to the par amount less an agreed-upon value of the reference obligation as of the date of the credit event. The difference between the value of the obligation or cash delivered and the notional amount received will be recorded as a realized gain (loss).
As the seller of a credit default swap contract, the Fund sells protection to a buyer and will generally receive a periodic interest rate on a notional amount. The interest amount is accrued daily as a component of unrealized appreciation (depreciation) and is recorded as a realized gain upon receipt of the payment. If a credit event as specified in the contract with the counterparty occurs, the Fund may either be required to accept the reference obligation from the buyer in exchange for a cash payment of its notional amount, or to pay the buyer a net cash settlement equal to the notional amount less an agreed-upon value of the reference obligation (recovery value) as of the date of the credit event. The difference between the value of the obligation or cash received and the notional amount paid will be recorded as a realized gain (loss). The maximum potential amount of undiscounted future payments the Fund could be required to make as the seller of protection under a credit default swap contract is equal to the notional amount of the reference obligation. These potential amounts may be partially offset by any recovery values of the respective reference obligations or upfront receipts upon entering into the agreement. The notional amounts and market values of all credit default swap contracts in which the Fund is the seller of protection, if any, are disclosed in the Credit Default Swap Contracts Outstanding schedule following the Portfolio of Investments.
As a protection seller, the Fund bears the risk of loss from the credit events specified in the contract with the counterparty. For credit default swap contracts on credit indices, quoted market prices and resulting market values serve as an indicator of the current status of the payment/performance risk. Increasing market values, in absolute terms when compared to the notional amount of the swap, represent a deterioration of the reference entity’s credit soundness and a greater likelihood or risk of default or other credit event occurring as defined under the terms of the contract.
Any upfront payments or receipts by the Fund upon entering into a credit default swap contract is recorded as an asset or liability, respectively, and amortized daily as a component of realized gain (loss) in the Statement of Operations. Credit default swap contracts are valued daily, and the change in value is recorded as unrealized appreciation (depreciation) until the termination of the swap, at which time a realized gain (loss) is recorded.
Credit default swap contracts can involve greater risks than if a fund had invested in the reference obligation directly since, in addition to general market risks, credit default swaps are subject to counterparty credit risk, leverage risk, hedging risk, correlation risk and liquidity risk.
Effects of derivative transactions in the financial statements
The following tables are intended to provide additional information about the effect of derivatives on the financial statements of the Fund, including: the fair value of derivatives by risk category and the location of those fair values in the Statement of Assets and Liabilities; and the impact of derivative transactions over the period in the Statement of Operations, including realized and unrealized gains (losses). The derivative instrument schedules following the Portfolio of Investments present additional information regarding derivative instruments outstanding at the end of the period, if any.
Columbia Total Return Bond Fund | Annual Report 2019
| 49 |
Notes to Financial Statements (continued)
April 30, 2019
The following table is a summary of the fair value of derivative instruments (not considered to be hedging instruments for accounting disclosure purposes) at April 30, 2019:
| | Asset derivatives | |
Risk exposure
category | Statement
of assets and liabilities
location | Fair value ($) |
| Credit risk | Component of total distributable earnings (loss) — unrealized appreciation on swap contracts | 135,271* |
| Credit risk | Upfront payments on swap contracts | 3,161,380 |
| Interest rate risk | Component of total distributable earnings (loss) — unrealized appreciation on futures contracts | 6,497,847* |
| Interest rate risk | Investments, at value — Options purchased | 1,032,330 |
| Total | | 10,826,828 |
| | Liability derivatives | |
Risk exposure
category | Statement
of assets and liabilities
location | Fair value ($) |
| Credit risk | Component of total distributable earnings (loss) — unrealized depreciation on swap contracts | 2,506,373* |
| Credit risk | Upfront receipts on swap contracts | 674,471 |
| Interest rate risk | Component of total distributable earnings (loss) — unrealized depreciation on futures contracts | 4,108,268* |
| Interest rate risk | Options contracts written, at value | 1,226,438 |
| Total | | 8,515,550 |
| * | Includes cumulative appreciation (depreciation) as reported in the tables following the Portfolio of Investments. Only the current day’s variation margin is reported in receivables or payables in the Statement of Assets and Liabilities. |
The following table indicates the effect of derivative instruments (not considered to be hedging instruments for accounting disclosure purposes) in the Statement of Operations for the year ended April 30, 2019:
| Amount of realized gain (loss) on derivatives recognized in income |
| Risk exposure category | Futures
contracts
($) | Options
contracts
written
($) | Options
contracts
purchased
($) | Swap
contracts
($) | Total
($) |
| Credit risk | — | — | — | 4,412,963 | 4,412,963 |
| Interest rate risk | 5,359,341 | 57,875 | 5,028,500 | — | 10,445,716 |
| Total | 5,359,341 | 57,875 | 5,028,500 | 4,412,963 | 14,858,679 |
| |
| Change in unrealized appreciation (depreciation) on derivatives recognized in income |
| Risk exposure category | Futures
contracts
($) | Options
contracts
written
($) | Options
contracts
purchased
($) | Swap
contracts
($) | Total
($) |
| Credit risk | — | — | — | (3,366,600) | (3,366,600) |
| Interest rate risk | 4,008,372 | (266,054) | (3,205,545) | — | 536,773 |
| Total | 4,008,372 | (266,054) | (3,205,545) | (3,366,600) | (2,829,827) |
The following table is a summary of the average outstanding volume by derivative instrument for the year ended April 30, 2019:
| Derivative instrument | Average notional
amounts ($)* |
| Futures contracts — long | 686,286,030 |
| Futures contracts — short | 433,711,980 |
| Credit default swap contracts — buy protection | 63,259,300 |
| Credit default swap contracts — sell protection | 26,790,000 |
| 50 | Columbia Total Return Bond Fund | Annual Report 2019 |
Notes to Financial Statements (continued)
April 30, 2019
| Derivative instrument | Average
value ($)* |
| Options contracts — purchased | 426,003 |
| Options contracts — written | (1,688,303) |
| * | Based on the ending quarterly outstanding amounts for the year ended April 30, 2019. |
Investments in senior loans
The Fund may invest in senior loan assignments. When the Fund purchases an assignment of a senior loan, the Fund typically has direct rights against the borrower; provided, however, that the Fund’s rights may be more limited than the lender from which it acquired the assignment and the Fund may be able to enforce its rights only through an administrative agent. Although certain senior loan assignments are secured by collateral, the Fund could experience delays or limitations in realizing such collateral or have its interest subordinated to other indebtedness of the obligor. In the event that the administrator or collateral agent of a loan becomes insolvent or enters into receivership or bankruptcy, the Fund may incur costs and delays in realizing payment or may suffer a loss of principal and/or interest. The risk of loss is greater for unsecured or subordinated loans. In addition, senior loan assignments are vulnerable to market, economic or other conditions or events that may reduce the demand for senior loan assignments and certain senior loan assignments which were liquid when purchased, may become illiquid.
The Fund may enter into senior loan assignments where all or a portion of the loan may be unfunded. The Fund is obligated to fund these commitments at the borrower’s discretion. These commitments, if any, are generally traded and priced in the same manner as other senior loan securities and are disclosed as unfunded senior loan commitments in the Fund’s Portfolio of Investments with a corresponding payable for investments purchased. The Fund designates cash or liquid securities to cover these commitments.
Asset- and mortgage-backed securities
The Fund may invest in asset-backed and mortgage-backed securities. The maturity dates shown represent the original maturity of the underlying obligation. Actual maturity may vary based upon prepayment activity on these obligations. All, or a portion, of the obligation may be prepaid at any time because the underlying asset may be prepaid. As a result, decreasing market interest rates could result in an increased level of prepayment. An increased prepayment rate will have the effect of shortening the maturity of the security. Unless otherwise noted, the coupon rates presented are fixed rates.
Delayed delivery securities
The Fund may trade securities on other than normal settlement terms, including securities purchased or sold on a “when-issued” or "forward commitment" basis. This may increase risk to the Fund since the other party to the transaction may fail to deliver, which could cause the Fund to subsequently invest at less advantageous prices. The Fund designates cash or liquid securities in an amount equal to the delayed delivery commitment.
To be announced securities
The Fund may trade securities on a To Be Announced (TBA) basis. As with other delayed-delivery transactions, a seller agrees to issue a TBA security at a future date. However, the seller does not specify the particular securities to be delivered. Instead, the Fund agrees to accept any security that meets specified terms.
In some cases, Master Securities Forward Transaction Agreements (MSFTAs) may be used to govern transactions of certain forward-settling agency mortgage-backed securities, such as delayed-delivery and TBAs, between the Fund and counterparty. The MSFTA maintains provisions for, among other things, initiation and confirmation, payment and transfer, events of default, termination, and maintenance of collateral relating to such transactions.
Mortgage dollar roll transactions
The Fund may enter into mortgage “dollar rolls” in which the Fund sells securities for delivery in the current month and simultaneously contracts with the same counterparty to repurchase similar but not identical securities (same type, coupon and maturity) on a specified future date. During the roll period, the Fund loses the right to receive principal and interest paid on the securities sold. However, the Fund will benefit because it receives negotiated amounts in the form of reductions of the
Columbia Total Return Bond Fund | Annual Report 2019
| 51 |
Notes to Financial Statements (continued)
April 30, 2019
purchase price for the future purchase plus the interest earned on the cash proceeds of the securities sold until the settlement date of the forward purchase. The Fund records the incremental difference between the forward purchase and sale of each forward roll as a realized gain or loss. Unless any realized gains exceed the income, capital appreciation, and gain or loss due to mortgage prepayments that would have been realized on the securities sold as part of the mortgage dollar roll, the use of this technique will diminish the investment performance of the Fund compared to what the performance would have been without the use of mortgage dollar rolls. All cash proceeds will be invested in instruments that are permissible investments for the Fund. The Fund identifies cash or liquid securities in an amount equal to the forward purchase price.
For financial reporting and tax purposes, the Fund treats “to be announced” mortgage dollar rolls as two separate transactions, one involving the purchase of a security and a separate transaction involving a sale. These transactions may increase the Fund’s portfolio turnover rate. The Fund does not currently enter into mortgage dollar rolls that are accounted for as financing transactions.
Mortgage dollar rolls involve the risk that the market value of the securities the Fund is obligated to repurchase may decline below the repurchase price, or that the counterparty may default on its obligations.
Interest only and principal only securities
The Fund may invest in Interest Only (IO) or Principal Only (PO) securities. IOs are stripped securities entitled to receive all of the security’s interest, but none of its principal. IOs are particularly sensitive to changes in interest rates and therefore subject to greater fluctuations in price than typical interest bearing debt securities. IOs are also subject to credit risk because the Fund may not receive all or part of the interest payments if the issuer, obligor, guarantor or counterparty defaults on its obligation. Payments received for IOs are included in interest income on the Statement of Operations. Because no principal will be received at the maturity of an IO, adjustments are made to the cost of the security on a monthly basis until maturity. These adjustments are included in interest income on the Statement of Operations. POs are stripped securities entitled to receive the principal from the underlying obligation, but not the interest. POs are particularly sensitive to changes in interest rates and therefore are subject to fluctuations in price. POs are also subject to credit risk because the Fund may not receive all or part of its principal if the issuer, obligor, guarantor or counterparty defaults on its obligation. The Fund may also invest in IO or PO stripped mortgage-backed securities. Payments received for POs are treated as reductions to the cost and par value of the securities.
Offsetting of assets and liabilities
The following table presents the Fund’s gross and net amount of assets and liabilities available for offset under netting arrangements as well as any related collateral received or pledged by the Fund as of April 30, 2019:
| | Citi ($)(a) | Citi ($)(a) | Credit
Suisse ($) | JPMorgan ($) | Morgan
Stanley ($)(a) | Morgan
Stanley ($)(a) | Total ($) |
| Assets | | | | | | | |
| Options purchased calls | 713,430 | - | - | - | - | - | 713,430 |
| Options purchased puts | - | - | - | - | 318,900 | - | 318,900 |
| OTC credit default swap contracts(b) | - | 692,978 | 265,376 | 530,752 | 665,876 | - | 2,154,982 |
| Total assets | 713,430 | 692,978 | 265,376 | 530,752 | 984,776 | - | 3,187,312 |
| Liabilities | | | | | | | |
| Centrally cleared credit default swap contracts(c) | - | - | - | - | - | 13,478 | 13,478 |
| Options contracts written | 1,226,438 | - | - | - | - | - | 1,226,438 |
| OTC credit default swap contracts(b) | - | - | - | - | 539,200 | - | 539,200 |
| Total liabilities | 1,226,438 | - | - | - | 539,200 | 13,478 | 1,779,116 |
| Total financial and derivative net assets | (513,008) | 692,978 | 265,376 | 530,752 | 445,576 | (13,478) | 1,408,196 |
| Total collateral received (pledged)(d) | (457,000) | 636,000 | 265,376 | 530,752 | 445,576 | (13,478) | 1,407,226 |
| Net amount(e) | (56,008) | 56,978 | - | - | - | - | 970 |
| 52 | Columbia Total Return Bond Fund | Annual Report 2019 |
Notes to Financial Statements (continued)
April 30, 2019
| (a) | Exposure can only be netted across transactions governed under the same master agreement with the same legal entity. |
| (b) | Over-the-Counter (OTC) swap contracts are presented at market value plus periodic payments receivable (payable), which is comprised of unrealized appreciation, unrealized depreciation, upfront payments and upfront receipts. |
| (c) | Centrally cleared swaps are included within payable/receivable for variation margin on the Statement of Assets and Liabilities. |
| (d) | In some instances, the actual collateral received and/or pledged may be more than the amount shown due to overcollateralization. |
| (e) | Represents the net amount due from/(to) counterparties in the event of default. |
Security transactions
Security transactions are accounted for on the trade date. Cost is determined and gains (losses) are based upon the specific identification method for both financial statement and federal income tax purposes.
The trade date for senior loans purchased in the primary market is the date on which the loan is allocated. The trade date for senior loans purchased in the secondary market is the date on which the transaction is entered into.
Income recognition
Interest income is recorded on an accrual basis. Market premiums and discounts, including original issue discounts, are amortized and accreted, respectively, over the expected life of the security on all debt securities, unless otherwise noted. The Fund classifies gains and losses realized on prepayments received on mortgage-backed securities as adjustments to interest income.
The Fund may place a debt security on non-accrual status and reduce related interest income when it becomes probable that the interest will not be collected and the amount of uncollectible interest can be reasonably estimated. A defaulted debt security is removed from non-accrual status when the issuer resumes interest payments or when collectibility of interest is reasonably assured.
Corporate actions and dividend income are recorded on the ex-dividend date.
The Fund may receive distributions from holdings in equity securities, business development companies (BDCs), exchange-traded funds (ETFs), limited partnerships (LPs), other regulated investment companies (RICs), and real estate investment trusts (REITs), which report information on the tax character of their distributions annually. These distributions are allocated to dividend income, capital gain and return of capital based on actual information reported. Return of capital is recorded as a reduction of the cost basis of securities held. If the Fund no longer owns the applicable securities, return of capital is recorded as a realized gain. With respect to REITs, to the extent actual information has not yet been reported, estimates for return of capital are made by the Fund’s management. Management’s estimates are subsequently adjusted when the actual character of the distributions is disclosed by the REITs, which could result in a proportionate change in return of capital to shareholders.
Awards from class action litigation are recorded as a reduction of cost basis if the Fund still owns the applicable securities on the payment date. If the Fund no longer owns the applicable securities, the proceeds are recorded as realized gains.
The value of additional securities received as an income payment through a payment in kind, if any, is recorded as interest income and increases the cost basis of such securities.
The Fund may receive other income from senior loans, including amendment fees, consent fees and commitment fees. These fees are recorded as income when received by the Fund. These amounts are included in Interest Income in the Statement of Operations.
Expenses
General expenses of the Trust are allocated to the Fund and other funds of the Trust based upon relative net assets or other expense allocation methodologies determined by the nature of the expense. Expenses directly attributable to the Fund are charged to the Fund. Expenses directly attributable to a specific class of shares are charged to that share class.
Columbia Total Return Bond Fund | Annual Report 2019
| 53 |
Notes to Financial Statements (continued)
April 30, 2019
Determination of class net asset value
All income, expenses (other than class-specific expenses, which are charged to that share class, as shown in the Statement of Operations) and realized and unrealized gains (losses) are allocated to each class of the Fund on a daily basis, based on the relative net assets of each class, for purposes of determining the net asset value of each class.
Federal income tax status
The Fund intends to qualify each year as a regulated investment company under Subchapter M of the Internal Revenue Code, as amended, and will distribute substantially all of its investment company taxable income and net capital gain, if any, for its tax year, and as such will not be subject to federal income taxes. In addition, the Fund intends to distribute in each calendar year substantially all of its ordinary income, capital gain net income and certain other amounts, if any, such that the Fund should not be subject to federal excise tax. Therefore, no federal income or excise tax provision is recorded.
Foreign taxes
The Fund may be subject to foreign taxes on income, gains on investments or currency repatriation, a portion of which may be recoverable. The Fund will accrue such taxes and recoveries, as applicable, based upon its current interpretation of tax rules and regulations that exist in the markets in which it invests.
Realized gains in certain countries may be subject to foreign taxes at the Fund level, based on statutory rates. The Fund accrues for such foreign taxes on realized and unrealized gains at the appropriate rate for each jurisdiction, as applicable. The amount, if any, is disclosed as a liability on the Statement of Assets and Liabilities.
Distributions to shareholders
Distributions from net investment income, if any, are declared daily and paid monthly. Net realized capital gains, if any, are distributed at least annually. Income distributions and capital gain distributions are determined in accordance with federal income tax regulations, which may differ from GAAP.
Guarantees and indemnifications
Under the Trust’s organizational documents and, in some cases, by contract, its officers and trustees are indemnified against certain liabilities arising out of the performance of their duties to the Trust or its funds. In addition, certain of the Fund’s contracts with its service providers contain general indemnification clauses. The Fund’s maximum exposure under these arrangements is unknown since the amount of any future claims that may be made against the Fund cannot be determined, and the Fund has no historical basis for predicting the likelihood of any such claims.
Recent accounting pronouncements
Accounting Standards Update 2017-08 Premium Amortization on Purchased Callable Debt Securities
In March 2017, the Financial Accounting Standards Board issued Accounting Standards Update (ASU) No. 2017-08 Premium Amortization on Purchased Callable Debt Securities. ASU No. 2017-08 updates the accounting standards to shorten the amortization period for certain purchased callable debt securities, held at a premium, to be amortized to the earliest call date. The update applies to securities with explicit, noncontingent call features that are callable at fixed prices and on preset dates. The standard is effective for annual periods beginning after December 15, 2018 and interim periods within those fiscal years. Management does not expect the implementation of this guidance to have a material impact on the financial statement amounts and footnote disclosures.
Accounting Standards Update 2018-13 Disclosure Framework - Changes to the Disclosure Requirements for Fair Value Measurement
In August 2018, the Financial Accounting Standards Board issued Accounting Standards Update (ASU) No. 2018-13 Disclosure Framework - Changes to the Disclosure Requirements for Fair Value Measurement. ASU No. 2018-13, in addition to other modifications and additions, removes the requirement to disclose the amount and reasons for transfers between
| 54 | Columbia Total Return Bond Fund | Annual Report 2019 |
Notes to Financial Statements (continued)
April 30, 2019
Level 1 and Level 2 of the fair value hierarchy and the policy for the timing of transfers between levels. The standard is effective for annual periods beginning after December 15, 2019 and interim periods within those fiscal years. At this time, management is evaluating the implication of this guidance and the impact it will have on the financial statement disclosures, if any.
Disclosure Update and Simplification
In September 2018, the Securities and Exchange Commission (SEC) released Final Rule 33-10532, Disclosure Update and Simplification, which amends certain financial statement disclosure requirements that the SEC determined to be redundant, outdated, or superseded in light of other SEC disclosure requirements, GAAP, or changes in the information environment. As a result of the amendments, management implemented disclosure changes which included removing the components of distributable earnings presented on the Statement of Assets and Liabilities and combining income and gain distributions paid to shareholders as presented on the Statement of Changes in Net Assets. Any values presented to meet prior year requirements were left unchanged. The amendments had no effect on the Fund’s net assets or results of operation.
Note 3. Fees and other transactions with affiliates
Management services fees
The Fund has entered into a Management Agreement with Columbia Management Investment Advisers, LLC (the Investment Manager), a wholly-owned subsidiary of Ameriprise Financial, Inc. (Ameriprise Financial). Under the Management Agreement, the Investment Manager provides the Fund with investment research and advice, as well as administrative and accounting services. The management services fee is an annual fee that is equal to a percentage of the Fund’s daily net assets that declines from 0.50% to 0.34% as the Fund’s net assets increase. The effective management services fee rate for the year ended April 30, 2019 was 0.49% of the Fund’s average daily net assets.
Compensation of board members
Members of the Board of Trustees who are not officers or employees of the Investment Manager or Ameriprise Financial are compensated for their services to the Fund as disclosed in the Statement of Operations. These members of the Board of Trustees may participate in a Deferred Compensation Plan (the Deferred Plan) which may be terminated at any time. Obligations of the Deferred Plan will be paid solely out of the Fund’s assets, and all amounts payable under the Deferred Plan constitute a general unsecured obligation of the Fund.
Compensation of Chief Compliance Officer
The Board of Trustees has appointed a Chief Compliance Officer to the Fund in accordance with federal securities regulations. As disclosed in the Statement of Operations, a portion of the Chief Compliance Officer’s total compensation is allocated to the Fund, along with other allocations to affiliated registered investment companies managed by the Investment Manager and its affiliates, based on relative net assets.
Transactions with affiliates
For the year ended April 30, 2019, the Fund engaged in purchase and/or sale transactions with affiliates and/or accounts that have a common investment manager (or affiliated investment managers), common directors/trustees, and/or common officers. Those purchase and sale transactions complied with provisions of Rule 17a-7 under the 1940 Act and were $1,898,254 and $0, respectively.
Transfer agency fees
Under a Transfer and Dividend Disbursing Agent Agreement, Columbia Management Investment Services Corp. (the Transfer Agent), an affiliate of the Investment Manager and a wholly-owned subsidiary of Ameriprise Financial, is responsible for providing transfer agency services to the Fund. The Transfer Agent has contracted with DST Asset Manager Solutions, Inc. (DST) to serve as sub-transfer agent. The Transfer Agent pays the fees of DST for services as sub-transfer agent and DST is not entitled to reimbursement for such fees from the Fund (with the exception of out-of-pocket fees).
Columbia Total Return Bond Fund | Annual Report 2019
| 55 |
Notes to Financial Statements (continued)
April 30, 2019
The Fund pays the Transfer Agent a monthly transfer agency fee based on the number or the average value of accounts, depending on the type of account. In addition, the Fund pays the Transfer Agent a fee for shareholder services based on the number of accounts or on a percentage of the average aggregate value of the Fund’s shares maintained in omnibus accounts up to the lesser of the amount charged by the financial intermediary or a cap established by the Board of Trustees from time to time.
The Transfer Agent also receives compensation from the Fund for various shareholder services and reimbursements for certain out-of-pocket fees. Total transfer agency fees for Institutional 2 Class and Institutional 3 Class shares are subject to an annual limitation of not more than 0.07% and 0.02%, respectively, of the average daily net assets attributable to each share class.
For the year ended April 30, 2019, the Fund’s effective transfer agency fee rates as a percentage of average daily net assets of each class were as follows:
| | Effective rate (%) |
| Class A | 0.15 |
| Advisor Class | 0.15 |
| Class C | 0.14 |
| Institutional Class | 0.15 |
| Institutional 2 Class | 0.06 |
| Institutional 3 Class | 0.01 |
| Class R | 0.15 |
| Class T | 0.09(a) |
The Fund and certain other affiliated investment companies have severally, but not jointly, guaranteed the performance and observance of all the terms and conditions of a lease entered into by Seligman Data Corp. (SDC), the former transfer agent, including the payment of rent by SDC (the Guaranty). SDC was the legacy Seligman funds’ former transfer agent. The lease and the Guaranty expired on January 31, 2019.
An annual minimum account balance fee of $20 may apply to certain accounts with a value below the applicable share class’s initial minimum investment requirements to reduce the impact of small accounts on transfer agency fees. These minimum account balance fees are remitted to the Fund and recorded as part of expense reductions in the Statement of Operations. For the year ended April 30, 2019, these minimum account balance fees reduced total expenses of the Fund by $2,100.
Distribution and service fees
The Fund has entered into an agreement with Columbia Management Investment Distributors, Inc. (the Distributor), an affiliate of the Investment Manager and a wholly-owned subsidiary of Ameriprise Financial, for distribution and shareholder services. The Board of Trustees has approved, and the Fund has adopted, distribution and shareholder service plans (the Plans) applicable to certain share classes, which set the distribution and service fees for the Fund. These fees are calculated daily and are intended to compensate the Distributor and/or eligible selling and/or servicing agents for selling shares of the Fund and providing services to investors.
Under the Plans, the Fund pays a monthly service fee to the Distributor at the maximum annual rate of 0.25% of the average daily net assets attributable to Class A, Class C and Class T shares of the Fund. Also under the Plans, the Fund pays a monthly distribution fee to the Distributor at the maximum annual rates of 0.10%, 0.75%, 0.50% and 0.25% of the average daily net assets attributable to Class A, Class C, Class R and Class T shares of the Fund, respectively. As a result of all Class T shares of the Fund being redeemed or converted to Class A shares, December 14, 2018 was the last day the Fund paid a distribution and shareholder services fee for Class T shares.
| 56 | Columbia Total Return Bond Fund | Annual Report 2019 |
Notes to Financial Statements (continued)
April 30, 2019
Although the Fund may pay distribution and service fees up to a maximum annual rate of 0.35% of the Fund’s average daily net assets attributable to Class A shares (comprised of up to 0.10% for distribution services and up to 0.25% for shareholder liaison services), the Fund currently limits such fees to an aggregate fee of not more than 0.25% of the Fund’s average daily net assets attributable to Class A shares.
Although the Fund may have paid a distribution fee up to 0.25% of the Fund’s average daily net assets attributable to Class T shares and a service fee of up to 0.25% of the Fund’s average daily net assets attributable to Class T shares, the aggregate fee shall not exceed 0.25% of the Fund’s average daily net assets attributable to Class T shares.
Sales charges (unaudited)
Sales charges, including front-end charges and CDSCs, received by the Distributor for distributing Fund shares for the year ended April 30, 2019, if any, are listed below:
| | Amount ($) |
| Class A | 244,015 |
| Class C | 1,948 |
Expenses waived/reimbursed by the Investment Manager and its affiliates
The Investment Manager and certain of its affiliates have contractually agreed to waive fees and/or reimburse expenses (excluding certain fees and expenses described below) for the period(s) disclosed below, unless sooner terminated at the sole discretion of the Board of Trustees, so that the Fund’s net operating expenses, after giving effect to fees waived/expenses reimbursed and any balance credits and/or overdraft charges from the Fund’s custodian, do not exceed the following annual rate(s) as a percentage of the class’ average daily net assets:
| | May 1, 2019
through
August 31, 2020 | September 1, 2018
through
April 30, 2019 | Prior to
September 1, 2018 |
| Class A | 0.75% | 0.86% | 0.86% |
| Advisor Class | 0.50 | 0.61 | 0.61 |
| Class C | 1.50 | 1.61 | 1.61 |
| Institutional Class | 0.50 | 0.61 | 0.61 |
| Institutional 2 Class | 0.42 | 0.52 | 0.55 |
| Institutional 3 Class | 0.37 | 0.48 | 0.50 |
| Class R | 1.00 | 1.11 | 1.11 |
Under the agreement governing these fee waivers and/or expense reimbursement arrangements, the following fees and expenses are excluded from the waiver/reimbursement commitment, and therefore will be paid by the Fund, if applicable: taxes (including foreign transaction taxes), expenses associated with investments in affiliated and non-affiliated pooled investment vehicles (including mutual funds and exchange-traded funds), transaction costs and brokerage commissions, costs related to any securities lending program, dividend expenses associated with securities sold short, inverse floater program fees and expenses, transaction charges and interest on borrowed money, interest, infrequent and/or unusual expenses and any other expenses the exclusion of which is specifically approved by the Board of Trustees. This agreement may be modified or amended only with approval from the Investment Manager, certain of its affiliates and the Fund. Any fees waived and/or expenses reimbursed under the expense reimbursement arrangements described above are not recoverable by the Investment Manager or its affiliates in future periods.
Note 4. Federal tax information
The timing and character of income and capital gain distributions are determined in accordance with income tax regulations, which may differ from GAAP because of temporary or permanent book to tax differences.
Columbia Total Return Bond Fund | Annual Report 2019
| 57 |
Notes to Financial Statements (continued)
April 30, 2019
At April 30, 2019, these differences were primarily due to differing treatment for deferral/reversal of wash sale losses, derivative investments, tax straddles, trustees’ deferred compensation, distributions, principal and/or interest from fixed income securities, foreign currency transactions and investments in partnerships. To the extent these differences were permanent, reclassifications were made among the components of the Fund’s net assets. Temporary differences do not require reclassifications.
The following reclassifications were made:
Undistributed net
investment
income ($) | Accumulated
net realized
gain ($) | Paid in
capital ($) |
| (879,938) | 879,939 | (1) |
Net investment income (loss) and net realized gains (losses), as disclosed in the Statement of Operations, and net assets were not affected by this reclassification.
The tax character of distributions paid during the years indicated was as follows:
| Year Ended April 30, 2019 | Year Ended April 30, 2018 |
Ordinary
income ($) | Long-term
capital gains ($) | Total ($) | Ordinary
income ($) | Long-term
capital gains ($) | Tax return
of capital ($) | Total ($) |
| 60,427,484 | — | 60,427,484 | 58,613,754 | — | 2,712,013 | 61,325,767 |
Short-term capital gain distributions, if any, are considered ordinary income distributions for tax purposes.
At April 30, 2019, the components of distributable earnings on a tax basis were as follows:
Undistributed
ordinary income ($) | Undistributed
long-term
capital gains ($) | Capital loss
carryforwards ($) | Net unrealized
(depreciation) ($) |
| 11,745,518 | — | — | (29,327,197) |
At April 30, 2019, the cost of all investments for federal income tax purposes along with the aggregate gross unrealized appreciation and depreciation based on that cost was:
Federal
tax cost ($) | Gross unrealized
appreciation ($) | Gross unrealized
(depreciation) ($) | Net unrealized
(depreciation) ($) |
| 2,441,696,760 | 27,538,193 | (56,865,390) | (29,327,197) |
Tax cost of investments and unrealized appreciation/(depreciation) may also include timing differences that do not constitute adjustments to tax basis.
The following capital loss carryforwards, determined at April 30, 2019, may be available to reduce taxable income arising from future net realized gains on investments, if any, to the extent permitted by the Internal Revenue Code. Capital loss carryforwards with no expiration are required to be utilized prior to any capital losses which carry an expiration date. As a result of this ordering rule, capital loss carryforwards which carry an expiration date may be more likely to expire unused. In addition, for the year ended April 30, 2019, capital loss carryforwards utilized and expired unused, if any, were as follows:
No expiration
short-term ($) | No expiration
long-term ($) | Total ($) | Utilized ($) | Expired ($) |
| — | — | — | 2,587,156 | — |
Management of the Fund has concluded that there are no significant uncertain tax positions in the Fund that would require recognition in the financial statements. However, management’s conclusion may be subject to review and adjustment at a later date based on factors including, but not limited to, new tax laws, regulations, and administrative interpretations (including relevant court decisions). Generally, the Fund’s federal tax returns for the prior three fiscal years remain subject to examination by the Internal Revenue Service.
| 58 | Columbia Total Return Bond Fund | Annual Report 2019 |
Notes to Financial Statements (continued)
April 30, 2019
Note 5. Portfolio information
The cost of purchases and proceeds from sales of securities, excluding short-term investments and derivatives, if any, aggregated to $6,115,453,543 and $6,105,714,432, respectively, for the year ended April 30, 2019, of which $4,994,018,893 and $4,899,143,046, respectively, were U.S. government securities. The amount of purchase and sale activity impacts the portfolio turnover rate reported in the Financial Highlights.
Note 6. Affiliated money market fund
The Fund invests in Columbia Short-Term Cash Fund, an affiliated money market fund established for the exclusive use by the Fund and other affiliated funds (the Affiliated MMF). The income earned by the Fund from such investments is included as Dividends - affiliated issuers in the Statement of Operations. As an investing fund, the Fund indirectly bears its proportionate share of the expenses of the Affiliated MMF. The Affiliated MMF prices its shares with a floating net asset value. In addition, the Board of Trustees of the Affiliated MMF may impose a fee on redemptions (sometimes referred to as a liquidity fee) or temporarily suspend redemptions (sometimes referred to as imposing a redemption gate) in the event its liquidity falls below regulatory limits.
Note 7. Interfund lending
Pursuant to an exemptive order granted by the Securities and Exchange Commission, the Fund participates in a program (the Interfund Program) allowing each participating Columbia Fund (each, a Participating Fund) to lend money directly to and, except for closed-end funds and money market funds, borrow money directly from other Participating Funds for temporary purposes. The amounts eligible for borrowing and lending under the Interfund Program are subject to certain restrictions.
Interfund loans are subject to the risk that the borrowing fund could be unable to repay the loan when due, and a delay in repayment to the lending fund could result in lost opportunities and/or additional lending costs. The exemptive order is subject to conditions intended to mitigate conflicts of interest arising from the Investment Manager’s relationship with each Participating Fund.
The Fund did not borrow or lend money under the Interfund Program during the year ended April 30, 2019.
Note 8. Line of credit
The Fund has access to a revolving credit facility with a syndicate of banks led by Citibank, N.A., HSBC Bank USA, N.A. and JPMorgan Chase Bank, N.A. whereby the Fund may borrow for the temporary funding of shareholder redemptions or for other temporary or emergency purposes. The credit facility, which is a collective agreement between the Fund and certain other funds managed by the Investment Manager or an affiliated investment manager, severally and not jointly, permits collective borrowings up to $1 billion. Interest is charged to each participating fund based on its borrowings at a rate equal to the higher of (i) the federal funds effective rate, (ii) the one-month LIBOR rate and (iii) the overnight bank funding rate, plus in each case, 1.00%. Each borrowing under the credit facility matures no later than 60 days after the date of borrowing. The Fund also pays a commitment fee equal to its pro rata share of the unused amount of the credit facility at a rate of 0.15% per annum. The commitment fee is included in other expenses in the Statement of Operations. This agreement expires annually in December unless extended or renewed.
The Fund had no borrowings during the year ended April 30, 2019.
Note 9. Significant risks
Credit risk
Credit risk is the risk that the value of debt securities in the Fund’s portfolio may decline because the issuer may default and fail to pay interest or repay principal when due. Rating agencies assign credit ratings to debt securities to indicate their credit risk. Lower rated or unrated debt securities held by the Fund may present increased credit risk as compared to higher-rated debt securities.
Columbia Total Return Bond Fund | Annual Report 2019
| 59 |
Notes to Financial Statements (continued)
April 30, 2019
Derivatives risk
Losses involving derivative instruments may be substantial, because a relatively small price movement in the underlying security(ies), commodity, currency or index or other instrument or asset may result in a substantial loss for the Fund. In addition to the potential for increased losses, the use of derivative instruments may lead to increased volatility within the Fund. Derivatives will typically increase the Fund’s exposure to principal risks to which it is otherwise exposed, and may expose the Fund to additional risks, including correlation risk, counterparty risk, hedging risk, leverage risk and liquidity risk.
High-yield investments risk
Securities and other debt instruments held by the Fund that are rated below investment grade (commonly called "high-yield" or "junk" bonds) and unrated debt instruments of comparable quality expose the Fund to a greater risk of loss of principal and income than a fund that invests solely or primarily in investment grade securities. In addition, these investments have greater price fluctuations, are less liquid and are more likely to experience a default than higher-rated debt instruments. High-yield debt instruments are considered to be predominantly speculative with respect to the issuer’s capacity to pay interest and repay principal.
Interest rate risk
Interest rate risk is the risk of losses attributable to changes in interest rates. In general, if prevailing interest rates rise, the values of debt securities tend to fall, and if interest rates fall, the values of debt securities tend to rise. Actions by governments and central banking authorities can result in increases in interest rates. Increasing interest rates may negatively affect the value of debt securities held by the Fund, resulting in a negative impact on the Fund’s performance and net asset value per share. In general, the longer the maturity or duration of a debt security, the greater its sensitivity to changes in interest rates.
Liquidity risk
Liquidity risk is the risk associated with a lack of marketability of investments which may make it difficult to sell the investment at a desirable time or price. Changing regulatory, market or other conditions or environments (for example, the interest rate or credit environments) may adversely affect the liquidity of the Fund’s investments. The Fund may have to accept a lower selling price for the holding, sell other investments, or forego another, more appealing investment opportunity. Generally, the less liquid the market at the time the Fund sells a portfolio investment, the greater the risk of loss or decline of value to the Fund. A less liquid market can lead to an increase in Fund redemptions, which may negatively impact Fund performance and net asset value per share, including, for example, if the Fund is forced to sell securities in a down market.
Mortgage- and other asset-backed securities risk
The value of any mortgage-backed and other asset-backed securities held by the Fund may be affected by, among other things, changes or perceived changes in: interest rates; factors concerning the interests in and structure of the issuer or the originator of the mortgages or other assets; the creditworthiness of the entities that provide any supporting letters of credit, surety bonds or other credit enhancements; or the market’s assessment of the quality of underlying assets. Payment of principal and interest on some mortgage-backed securities (but not the market value of the securities themselves) may be guaranteed by the full faith and credit of a particular U.S. Government agency, authority, enterprise or instrumentality, and some, but not all, are also insured or guaranteed by the U.S. Government. Mortgage-backed securities issued by non-governmental issuers (such as commercial banks, savings and loan institutions, private mortgage insurance companies, mortgage bankers and other secondary market issuers) may entail greater risk than obligations guaranteed by the U.S. Government. Mortgage- and other asset-backed securities are subject to prepayment risk, which is the possibility that the underlying mortgage or other asset may be refinanced or prepaid prior to maturity during periods of declining or low interest rates, causing the Fund to have to reinvest the money received in securities that have lower yields. Rising or high interest rates tend to extend the duration of mortgage- and other asset-backed securities, making their prices more volatile and more sensitive to changes in interest rates.
| 60 | Columbia Total Return Bond Fund | Annual Report 2019 |
Notes to Financial Statements (continued)
April 30, 2019
Shareholder concentration risk
At April 30, 2019, one unaffiliated shareholder of record owned 14.0% of the outstanding shares of the Fund in one or more accounts. The Fund has no knowledge about whether any portion of those shares was owned beneficially. Affiliated shareholders of record owned 60.0% of the outstanding shares of the Fund in one or more accounts. Subscription and redemption activity by concentrated accounts may have a significant effect on the operations of the Fund. In the case of a large redemption, the Fund may be forced to sell investments at inopportune times, including its liquid positions, which may result in Fund losses and the Fund holding a higher percentage of less liquid positions. Large redemptions could result in decreased economies of scale and increased operating expenses for non-redeeming Fund shareholders.
Note 10. Subsequent events
Management has evaluated the events and transactions that have occurred through the date the financial statements were issued. Other than as noted in Note 3 above, there were no items requiring adjustment of the financial statements or additional disclosure.
Note 11. Information regarding pending and settled legal proceedings
Ameriprise Financial and certain of its affiliates have historically been involved in a number of legal, arbitration and regulatory proceedings, including routine litigation, class actions, and governmental actions, concerning matters arising in connection with the conduct of their business activities. Ameriprise Financial believes that the Fund is not currently the subject of, and that neither Ameriprise Financial nor any of its affiliates are the subject of, any pending legal, arbitration or regulatory proceedings that are likely to have a material adverse effect on the Fund or the ability of Ameriprise Financial or its affiliates to perform under their contracts with the Fund. Ameriprise Financial is required to make quarterly (10-Q), annual (10-K) and, as necessary, 8-K filings with the Securities and Exchange Commission (SEC) on legal and regulatory matters that relate to Ameriprise Financial and its affiliates. Copies of these filings may be obtained by accessing the SEC website at www.sec.gov.
There can be no assurance that these matters, or the adverse publicity associated with them, will not result in increased Fund redemptions, reduced sale of Fund shares or other adverse consequences to the Fund. Further, although we believe proceedings are not likely to have a material adverse effect on the Fund or the ability of Ameriprise Financial or its affiliates to perform under their contracts with the Fund, these proceedings are subject to uncertainties and, as such, we are unable to estimate the possible loss or range of loss that may result. An adverse outcome in one or more of these proceedings could result in adverse judgments, settlements, fines, penalties or other relief that could have a material adverse effect on the consolidated financial condition or results of operations of Ameriprise Financial.
Columbia Total Return Bond Fund | Annual Report 2019
| 61 |
Report of Independent Registered Public Accounting Firm
To the Board of Trustees of Columbia Funds Series Trust I and Shareholders of Columbia Total Return Bond Fund
Opinion on the Financial Statements
We have audited the accompanying statement of assets and liabilities, including the portfolio of investments, of Columbia Total Return Bond Fund (one of the funds constituting Columbia Funds Series Trust I, referred to hereafter as the "Fund") as of April 30, 2019, the related statement of operations for the year ended April 30, 2019, the statement of changes in net assets for each of the two years in the period ended April 30, 2019, including the related notes, and the financial highlights for each of the five years in the period ended April 30, 2019 (collectively referred to as the “financial statements”). In our opinion, the financial statements present fairly, in all material respects, the financial position of the Fund as of April 30, 2019, the results of its operations for the year then ended, the changes in its net assets for each of the two years in the period ended April 30, 2019 and the financial highlights for each of the five years in the period ended April 30, 2019 in conformity with accounting principles generally accepted in the United States of America.
Basis for Opinion
These financial statements are the responsibility of the Fund’s management. Our responsibility is to express an opinion on the Fund’s financial statements based on our audits. We are a public accounting firm registered with the Public Company Accounting Oversight Board (United States) (PCAOB) and are required to be independent with respect to the Fund in accordance with the U.S. federal securities laws and the applicable rules and regulations of the Securities and Exchange Commission and the PCAOB.
We conducted our audits of these financial statements in accordance with the standards of the PCAOB. Those standards require that we plan and perform the audit to obtain reasonable assurance about whether the financial statements are free of material misstatement, whether due to error or fraud.
Our audits included performing procedures to assess the risks of material misstatement of the financial statements, whether due to error or fraud, and performing procedures that respond to those risks. Such procedures included examining, on a test basis, evidence regarding the amounts and disclosures in the financial statements. Our audits also included evaluating the accounting principles used and significant estimates made by management, as well as evaluating the overall presentation of the financial statements. Our procedures included confirmation of securities owned as of April 30, 2019 by correspondence with the custodian, transfer agent, brokers and agent banks; when replies were not received from brokers, we performed other auditing procedures. We believe that our audits provide a reasonable basis for our opinion.
/s/PricewaterhouseCoopers LLP
Minneapolis, Minnesota
June 21, 2019
We have served as the auditor of one or more investment companies within the Columbia Funds Complex since 1977.
| 62 | Columbia Total Return Bond Fund | Annual Report 2019 |
The Board oversees the Fund’s operations and appoints officers who are responsible for day-to-day business decisions based on policies set by the Board. The following table provides basic biographical information about the Fund’s Trustees as of the printing of this report, including their principal occupations during the past five years, although specific titles for individuals may have varied over the period. The year set forth beneath Length of Service in the table below is the year in which the Trustee was first appointed or elected as Trustee to any Fund currently in the Columbia Funds Complex or a predecessor thereof. Under current Board policy, members serve terms of indefinite duration.
Independent trustees
| Name, address, year of birth | Position held with the Trust and length of service | Principal occupation(s) during the past five years and other relevant professional experience | Number of Funds in the Columbia Fund Complex overseen | Other directorships held by Trustee during the past five years |
Janet Langford Carrig
c/o Columbia Management
Investment Advisers, LLC
225 Franklin Street
Mail Drop BX32 05228
Boston, MA 02110
1957 | Trustee
1996 | Senior Vice President, General Counsel and Corporate Secretary, ConocoPhillips (independent energy company) from September 2007 to October 2018 | 69 | None |
Douglas A. Hacker
c/o Columbia Management
Investment Advisers, LLC
225 Franklin Street
Mail Drop BX32 05228
Boston, MA 02110
1955 | Trustee and Chairman of the Board
1996 | Independent business executive since May 2006; Executive Vice President — Strategy of United Airlines from December 2002 to May 2006; President of UAL Loyalty Services (airline marketing company) from September 2001 to December 2002; Executive Vice President and Chief Financial Officer of United Airlines from July 1999 to September 2001 | 69 | Spartan Nash Company, (food distributor); Nash Finch Company (food distributor) from 2005 to 2013; Aircastle Limited (aircraft leasing); SeaCube Container Leasing Ltd. (container leasing) from 2010 to 2013; and Travelport Worldwide Limited (travel information technology) |
Nancy T. Lukitsh
c/o Columbia Management
Investment Advisers, LLC
225 Franklin Street
Mail Drop BX32 05228
Boston, MA 02110
1956 | Trustee
2011 | Senior Vice President, Partner and Director of Marketing, Wellington Management Company, LLP (investment adviser) from 1997 to 2010; Chair, Wellington Management Portfolios (commingled non-U.S. investment pools) from 2007 to 2010; Director, Wellington Trust Company, NA and other Wellington affiliates from 1997 to 2010 | 69 | None |
David M. Moffett
c/o Columbia Management
Investment Advisers, LLC
225 Franklin Street
Mail Drop BX32 05228
Boston, MA 02110
1952 | Trustee
2011 | Retired. Consultant to Bridgewater and Associates | 69 | Director, CSX Corporation (transportation suppliers); Genworth Financial, Inc. (financial and insurance products and services); PayPal Holdings Inc. (payment and data processing services); Trustee, University of Oklahoma Foundation; former Director, eBay Inc. (online trading community), 2007-2015; and former Director, CIT Bank, CIT Group Inc. (commercial and consumer finance), 2010-2016 |
Columbia Total Return Bond Fund | Annual Report 2019
| 63 |
TRUSTEES AND OFFICERS (continued)
Independent trustees (continued)
| Name, address, year of birth | Position held with the Trust and length of service | Principal occupation(s) during the past five years and other relevant professional experience | Number of Funds in the Columbia Fund Complex overseen | Other directorships held by Trustee during the past five years |
John J. Neuhauser
c/o Columbia Management
Investment Advisers, LLC
225 Franklin Street
Mail Drop BX32 05228
Boston, MA 02110
1943 | Trustee
1984 | President, Saint Michael’s College from August 2007 to June 2018; Director or Trustee of several non-profit organizations, including University of Vermont Medical Center; Academic Vice President and Dean of Faculties, Boston College from August 1999 to October 2005; University Professor, Boston College from November 2005 to August 2007 | 69 | Liberty All-Star Equity Fund and Liberty All- Star Growth Fund (closed-end funds) |
Patrick J. Simpson
c/o Columbia Management
Investment Advisers, LLC
225 Franklin Street
Mail Drop BX32 05228
Boston, MA 02110
1944 | Trustee
2000 | Of Counsel, Perkins Coie LLP (law firm) since 2015; Partner, Perkins Coie LLP from 1988 to 2014 | 69 | M Fund, Inc. (M Funds mutual fund family) |
Anne-Lee Verville
c/o Columbia Management
Investment Advisers, LLC
225 Franklin Street
Mail Drop BX32 05228
Boston, MA 02110
1945 | Trustee
1998 | Retired. General Manager, Global Education Industry from 1994 to 1997, President – Application Systems Division from 1991 to 1994, Chief Financial Officer – US Marketing & Services from 1988 to 1991, and Chief Information Officer from 1987 to 1988, IBM Corporation (computer and technology) | 69 | Enesco Group, Inc. (producer of giftware and home and garden decor products) from 2001 to 2006 |
Consultants to the Independent Trustees*
| Name, address, year of birth | Position held with the Trust and length of service | Principal occupation(s) during the past five years and other relevant professional experience | Number of Funds in the Columbia Funds complex overseen | Other directorships held by Trustee during the past five years |
J. Kevin Connaughton
c/o Columbia
Management Investment
Advisers, LLC,
225 Franklin Street
Mail Drop BX32 05228,
Boston, MA 02110
1964 | Independent Trustee Consultant
2016 | Independent Trustee Consultant, Columbia Funds since March 2016; Adjunct Professor of Finance, Bentley University since November 2017; Managing Director and General Manager of Mutual Fund Products, Columbia Management Investment Advisers, LLC from May 2010 to February 2015; President, Columbia Funds from 2009 to 2015; and senior officer of Columbia Funds and affiliated funds from 2003 to 2015 | 69 | Director, The Autism Project since March 2015; former Trustee, New Century Portfolios, March 2015-December 2017; formerly on Board of Governors, Gateway Healthcare, January 2016 – December 2017 |
| 64 | Columbia Total Return Bond Fund | Annual Report 2019 |
TRUSTEES AND OFFICERS (continued)
Consultants to the Independent Trustees* (continued)
| Name, address, year of birth | Position held with the Trust and length of service | Principal occupation(s) during the past five years and other relevant professional experience | Number of Funds in the Columbia Funds complex overseen | Other directorships held by Trustee during the past five years |
Olive Darragh
c/o Columbia
Management Investment
Advisers, LLC,
225 Franklin Street,
Mail Drop BX32 05228,
Boston, MA 02110
1962 | Independent Trustee Consultant 2019 | Independent Trustee Consultant, Columbia Funds since June 2019; Managing Director of Darragh Inc. (a strategy and talent management consulting firm) since 2010; Founder and CEO, Zolio (an investment management talent identification platform) since 2004; Partner, Tudor Investments from 2004 to 2010; Senior Partner, McKinsey & Company from 2001 to 2004 | 69 | Director, University of Edinburgh Business School; former Director, Boston Public Library Foundation |
Natalie A. Trunow
c/o Columbia
Management Investment
Advisers, LLC,
225 Franklin Street
Mail Drop BX32 05228,
Boston, MA 02110
1967 | Independent Trustee Consultant
2016 | Independent Trustee Consultant, Columbia Funds since September 2016; Chief Executive Officer, Millennial Portfolio Solutions LLC (asset management and consulting services) since January 2016; Director of Investments, Casey Family Programs from April 2016 to September 2016; Senior Vice President and Chief Investment Officer, Calvert Investments from August 2008 to January 2016; Section Head and Portfolio Manager, General Motors Asset Management from June 1997 to August 2008 | 69 | Director, Health Services for Children with Special Needs, Inc.; Director, Guidewell Financial Solutions |
| * | J. Kevin Connaughton was appointed consultant to the Independent Trustees effective March 1, 2016. Olive Darragh was appointed consultant to the Independent Trustees effective June 10, 2019. Natalie A. Trunow was appointed consultant to the Independent Trustees effective September 1, 2016. Shareholders of the Funds are expected to be asked to elect each of Mr. Connaughton, Ms. Darragh and Ms. Trunow as a Trustee at a future shareholder meeting. |
Interested trustee affiliated with Investment Manager*
| Name, address, year of birth | Position held with the Trust and length of service | Principal occupation(s) during the past five years and other relevant professional experience | Number of Funds in the Columbia Funds Complex overseen | Other directorships held by Trustee during the past five years |
William F. Truscott
c/o Columbia Management
Investment Advisers, LLC
225 Franklin Street
Boston, MA 02110
1960 | Trustee
2012 | Chairman of the Board and President, Columbia Management Investment Advisers, LLC since May 2010 and February 2012, respectively; Chief Executive Officer, Global Asset Management, Ameriprise Financial, Inc. since September 2012 (previously Chief Executive Officer, U.S. Asset Management & President, Annuities, May 2010-September 2012); Director and Chief Executive Officer, Columbia Management Investment Distributors, Inc. since May 2010 and February 2012, respectively; Chairman of the Board and Chief Executive Officer, RiverSource Distributors, Inc. since 2006; Director, Threadneedle Asset Management Holdings, SARL since 2014; President and Chief Executive Officer, Ameriprise Certificate Company, 2006-August 2012 | 188 | Chairman of the Board, Columbia Management Investment Advisers, LLC since May 2010; Director, Columbia Management Investment Distributors, Inc. since May 2010; former Director, Ameriprise Certificate Company, 2006 - January 2013 |
| * | Interested person (as defined under the 1940 Act) by reason of being an officer, director, security holder and/or employee of the Investment Manager or Ameriprise Financial. |
The Statement of Additional Information has additional information about the Fund’s Board members and is available, without charge, upon request by calling 800.345.6611, visiting columbiathreadneedleus.com/investor/ or contacting your financial intermediary.
Columbia Total Return Bond Fund | Annual Report 2019
| 65 |
TRUSTEES AND OFFICERS (continued)
The Board has appointed officers who are responsible for day-to-day business decisions based on policies it has established. The officers serve at the pleasure of the Board. The following table provides basic information about the Officers of the Fund, including principal occupations during the past five years, although their specific titles may have varied over the period. In addition to Mr. Truscott, who is Senior Vice President, the Fund’s other officers are:
Fund officers
Name,
address and
year of birth | Position and year
first appointed to
position for any Fund
in the Columbia
Funds complex or a
predecessor thereof | Principal occupation(s) during past five years |
Christopher O. Petersen
5228 Ameriprise
Financial Center
Minneapolis, MN 55474
Born 1970 | President and Principal Executive Officer (2015) | Vice President and Lead Chief Counsel, Ameriprise Financial, Inc. since January 2015 (previously Vice President and Chief Counsel, January 2010 - December 2014; officer of Columbia Funds and affiliated funds since 2007. |
Michael G. Clarke
225 Franklin Street
Boston, MA 02110
Born 1969 | Chief Financial Officer (Principal Financial Officer) (2009) and Senior Vice President (2019) | Vice President, Head of North American Operations, and Co-Head of Global Operations, Columbia Management Investment Advisers, LLC, since June 2019 (previously Vice President – Accounting and Tax, May 2010 - May 2019); senior officer of Columbia Funds and affiliated funds since 2002 (previously Treasurer and Chief Accounting Officer, January 2009 - January 2019 and December 2015 - January 2019, respectively). |
Joseph Beranek
5890 Ameriprise
Financial Center
Minneapolis, MN 55474
Born 1965 | Treasurer and Chief Accounting Officer (Principal Accounting Officer) (2019) | Vice President — Mutual Fund Accounting and Financial Reporting, Columbia Management Investment Advisers, LLC, since December 2018 and March 2017, respectively (previously Vice President — Pricing and Corporate Actions, May 2010 - March 2017). |
Paul B. Goucher
485 Lexington Avenue
New York, NY 10017
Born 1968 | Senior Vice President (2011) and Assistant Secretary (2008) | Senior Vice President and Assistant General Counsel, Ameriprise Financial, Inc. since January 2017 (previously Vice President and Lead Chief Counsel, November 2008 - January 2017 and January 2013 - January 2017, respectively); Vice President, Chief Legal Officer and Assistant Secretary, Columbia Management Investment Advisers, LLC since March 2015 (previously Vice President and Assistant Secretary, May 2010 – March 2015). |
Thomas P. McGuire
225 Franklin Street
Boston, MA 02110
Born 1972 | Senior Vice President and Chief Compliance Officer (2012) | Vice President — Asset Management Compliance, Ameriprise Financial, Inc., since May 2010; Chief Compliance Officer, Ameriprise Certificate Company since September 2010. |
Colin Moore
225 Franklin Street
Boston, MA 02110
Born 1958 | Senior Vice President (2010) | Executive Vice President and Global Chief Investment Officer, Ameriprise Financial, Inc., since July 2013; Executive Vice President and Global Chief Investment Officer, Columbia Management Investment Advisers, LLC since July 2013. |
Ryan C. Larrenaga
225 Franklin Street
Boston, MA 02110
Born 1970 | Senior Vice President (2017), Chief Legal Officer (2017), and Secretary (2015) | Vice President and Chief Counsel, Ameriprise Financial, Inc. since August 2018 (previously Vice President and Group Counsel, August 2011 - August 2018); officer of Columbia Funds and affiliated funds since 2005. |
Michael E. DeFao
225 Franklin Street
Boston, MA 02110
Born 1968 | Vice President (2011) and Assistant Secretary (2010) | Vice President and Chief Counsel, Ameriprise Financial, Inc. since May 2010. |
Lyn Kephart-Strong
5228 Ameriprise
Financial Center
Minneapolis, MN 55474
Born 1960 | Vice President (2015) | President, Columbia Management Investment Services Corp. since October 2014; Vice President & Resolution Officer, Ameriprise Trust Company since August 2009. |
| 66 | Columbia Total Return Bond Fund | Annual Report 2019 |
The Fund mails one shareholder report to each shareholder address, unless such shareholder elected to receive shareholder reports from the Fund electronically. If you would like more than one report, please call shareholder services at 800.345.6611 and additional reports will be sent to you.
Proxy voting policies and procedures
The policy of the Board of Trustees is to vote the proxies of the companies in which the Fund holds investments consistent with the procedures as stated in the Statement of Additional Information (SAI). You may obtain a copy of the SAI without charge by calling 800.345.6611; contacting your financial intermediary; visiting columbiathreadneedleus.com/investor/; or searching the website of the Securities and Exchange Commission (SEC) at sec.gov. Information regarding how the Fund voted proxies relating to portfolio securities is filed with the SEC by August 31st for the most recent 12-month period ending June 30th of that year, and is available without charge by visiting columbiathreadneedleus.com/investor/, or searching the website of the SEC at sec.gov.
Quarterly schedule of investments
The Fund files a complete schedule of portfolio holdings with the SEC for the first and third quarters of each fiscal year on Form N-Q or Form N-PORT (available for filings after March 31, 2019). The Fund’s Form N-Q or Form N-PORT is available on the SEC’s website at sec.gov. The Fund’s complete schedule of portfolio holdings, as filed on Form N-Q or Form N-PORT, can also be obtained without charge, upon request, by calling 800.345.6611.
Additional Fund information
For more information about the Fund, please visit columbiathreadneedleus.com/investor/ or call 800.345.6611. Customer Service Representatives are available to answer your questions Monday through Friday from 8 a.m. to 7 p.m. Eastern time.
Fund investment manager
Columbia Management Investment Advisers, LLC
225 Franklin Street
Boston, MA 02110
Fund distributor
Columbia Management Investment Distributors, Inc.
225 Franklin Street
Boston, MA 02110
Fund transfer agent
Columbia Management Investment Services Corp.
P.O. Box 219104
Kansas City, MO 64121-9104
Columbia Total Return Bond Fund | Annual Report 2019
| 67 |
Columbia Total Return Bond Fund
P.O. Box 219104
Kansas City, MO 64121-9104
Please read and consider the investment objectives, risks, charges and expenses for any fund carefully before investing. For a prospectus and summary prospectus, which contains this and other important information about the Fund, go to
columbiathreadneedleus.com/investor/. The Fund is distributed by Columbia Management Investment Distributors, Inc., member FINRA, and managed by Columbia Management Investment Advisers, LLC.
Columbia Threadneedle Investments (Columbia Threadneedle) is the global brand name of the Columbia and Threadneedle group of companies. All rights reserved.
© 2019 Columbia Management Investment Advisers, LLC.
columbiathreadneedleus.com/investor/

Annual Report
April 30, 2019
Columbia Multi-Asset Income Fund
Beginning on January 1, 2021, as permitted by regulations adopted by the Securities and Exchange Commission, paper copies of the Fund’s annual and semiannual shareholder reports like this one will no longer be sent by mail, unless you specifically request paper copies of the reports. Instead, the reports will be made available on the Fund’s website (columbiathreadneedleus.com/investor/), and each time a report is posted you will be notified by mail and provided with a website address to access the report.
If you have already elected to receive shareholder reports electronically, you will not be affected by this change and you need not take any action. You may elect to receive shareholder reports and other communications from the Fund electronically at any time by contacting your financial intermediary (such as a broker-dealer or bank) or, for Fund shares held directly with the Fund, by calling 800.345.6611 or by enrolling in “eDelivery” by logging into your account at columbiathreadneedleus.com/investor/.
You may elect to receive all future reports in paper free of charge. If you invest through a financial intermediary, you can contact your financial intermediary to request that you continue receiving paper copies of your shareholder reports. If you invest directly with the Fund, you can call 800.345.6611 to let the Fund know you wish to continue receiving paper copies of your shareholder reports. Your election to receive paper reports will apply to all Columbia Funds held in your account if you invest through a financial intermediary or all Columbia Funds held with the fund complex if you invest directly with the Fund.
Not FDIC Insured • No bank guarantee • May lose value
Columbia Multi-Asset Income Fund | Annual Report 2019
Investment objective
Columbia Multi-Asset Income Fund (the Fund) seeks to provide shareholders with a high level of current income, with a secondary objective of total return.
Portfolio management
Anwiti Bahuguna, Ph.D.
Lead Portfolio Manager
Managed Fund since 2015
Dan Boncarosky, CFA
Portfolio Manager
Managed Fund since 2015
| Average annual total returns (%) (for the period ended April 30, 2019) |
| | | Inception | 1 Year | Life |
| Class A | Excluding sales charges | 03/27/15 | 5.06 | 3.92 |
| | Including sales charges | | 0.03 | 2.69 |
| Advisor Class | 03/27/15 | 5.33 | 4.19 |
| Class C | Excluding sales charges | 03/27/15 | 4.28 | 3.15 |
| | Including sales charges | | 3.30 | 3.15 |
| Institutional Class | 03/27/15 | 5.21 | 4.19 |
| Institutional 2 Class | 03/27/15 | 5.26 | 4.23 |
| Institutional 3 Class* | 03/01/17 | 5.33 | 4.09 |
| Blended Benchmark | | 8.84 | 5.84 |
| Bloomberg Barclays U.S. Aggregate Bond Index | | 5.29 | 2.00 |
Returns for Class A shares are shown with and without the maximum initial sales charge of 4.75%. Returns for Class C shares are shown with and without the 1.00% contingent deferred sales charge for the first year only. The Fund’s other share classes are not subject to sales charges and have limited eligibility. Please see the Fund’s prospectus for details. Performance for different share classes will vary based on differences in sales charges and fees associated with each share class. All results shown assume reinvestment of distributions during the period. Returns do not reflect the deduction of taxes that a shareholder may pay on Fund distributions or on the redemption of Fund shares. Performance results reflect the effect of any fee waivers or reimbursements of Fund expenses by Columbia Management Investment Advisers, LLC and/or any of its affiliates. Absent these fee waivers or expense reimbursement arrangements, performance results would have been lower.
The performance information shown represents past performance and is not a guarantee of future results. The investment return and principal value of your investment will fluctuate so that your shares, when redeemed, may be worth more or less than their original cost. Current performance may be lower or higher than the performance information shown. You may obtain performance information current to the most recent month-end by contacting your financial intermediary, visiting columbiathreadneedleus.com/investor/ or calling 800.345.6611.
| * | The returns shown for periods prior to the share class inception date (including returns for the Life of the Fund, if shown, which are since Fund inception) include the returns of the Fund’s oldest share class. Since the Fund launched more than one share class at its inception, Class A shares were used. These returns are adjusted to reflect any higher class-related operating expenses of the newer share classes, as applicable. Please visit columbiathreadneedleus.com/investor/investment-products/mutual-funds/appended-performance for more information. |
The Blended Benchmark is a weighted custom composite consisting of 60% Bloomberg Barclays U.S. Aggregate Bond Index and 40% S&P 500 Index. The S&P 500 Index, an unmanaged index, measures the performance of 500 widely held, large capitalization U.S. stocks and its frequently used as a general measure of market performance.
The Bloomberg Barclays U.S. Aggregate Bond Index, is a broad-based benchmark that measures the investment-grade, U.S. dollar denominated, fixed-rate taxable bond market, including Treasuries, government-related and corporate securities, mortgage-backed securities (agency fixed-rate and hybrid adjustable-rate mortgage passthroughs), asset-backed securities, and commercial mortgage-backed securities.
Indices are not available for investment, are not professionally managed and do not reflect sales charges, fees, brokerage commissions, taxes or other expenses of investing. Securities in the Fund may not match those in an index.
Columbia Multi-Asset Income Fund | Annual Report 2019
| 3 |
Fund at a Glance (continued)
Performance of a hypothetical $10,000 investment (March 27, 2015 — April 30, 2019)
The chart above shows the change in value of a hypothetical $10,000 investment in Class A shares of Columbia Multi-Asset Income Fund during the stated time period, and does not reflect the deduction of taxes that a shareholder may pay on Fund distributions or on the redemption of Fund shares.
| Top 10 holdings (%) (at April 30, 2019) |
| SPDR Blackstone/GSO Senior Loan ETF | 4.6 |
| SPDR Bloomberg Barclays Convertible Securities ETF | 4.2 |
| iShares US Preferred Stock ETF | 4.0 |
| Invesco S&P 500 High Dividend Low Volatility ETF | 3.6 |
Credit Suisse AG
10/04/2019 12.600% | 3.5 |
Wells Fargo Bank NA
09/11/2019 15.060% | 3.5 |
Citigroup Global Markets Holdings, Inc.
08/08/2019 14.480% | 3.4 |
Barclays Bank PLC
06/13/2019 17.320% | 3.3 |
UBS AG
07/17/2019 15.480% | 3.3 |
Morgan Stanley BV
05/07/2019 16.611% | 3.2 |
Percentages indicated are based upon total investments excluding Money Market Funds and investments in derivatives, if any.
For further detail about these holdings, please refer to the section entitled “Portfolio of Investments.”
Fund holdings are as of the date given, are subject to change at any time, and are not recommendations to buy or sell any security.
| Portfolio breakdown (%) (at April 30, 2019) |
| Asset-Backed Securities — Non-Agency | 3.3 |
| Commercial Mortgage-Backed Securities - Non-Agency | 0.9 |
| Common Stocks | 10.9 |
| Convertible Bonds | 0.0(a) |
| Convertible Preferred Stocks | 0.5 |
| Corporate Bonds & Notes | 20.9 |
| Equity-Linked Notes | 19.0 |
| Exchange-Traded Funds | 17.5 |
| Foreign Government Obligations | 10.9 |
| Money Market Funds | 5.6 |
| Residential Mortgage-Backed Securities - Agency | 0.8 |
| Residential Mortgage-Backed Securities - Non-Agency | 6.2 |
| Senior Loans | 0.6 |
| Treasury Bills | 0.2 |
| U.S. Treasury Obligations | 2.7 |
| Total | 100.0 |
Percentages indicated are based upon total investments excluding investments in derivatives, if any. The Fund’s portfolio composition is subject to change.
| 4 | Columbia Multi-Asset Income Fund | Annual Report 2019 |
Manager Discussion of Fund Performance
At April 30, 2019, approximately 94% of the Fund’s shares were owned in the aggregate by affiliated funds-of-funds managed by Columbia Management Investment Advisers, LLC (the Investment Manager). As a result of asset allocation decisions by the Investment Manager, it is possible that the Fund may experience relatively large purchases or redemptions from affiliated funds-of-funds. The Investment Manager seeks to minimize the impact of these transactions by structuring them over a reasonable period of time. The Fund may experience increased expenses as it buys and sells securities as a result of purchases or redemptions by affiliated funds-of-funds.
For the 12-month period that ended April 30, 2019, the Fund’s Class A shares returned 5.06% excluding sales charges. The Fund posted solid absolute returns but underperformed its Blended Benchmark, which returned 8.84% for the same time period. The Fund’s returns more closely matched the 5.29% return of the Bloomberg Barclays U.S. Aggregate Bond Index for the same period. To compare, the S&P 500 Index returned 13.49% for the same period. The Fund’s performance is primarily attributable to a combination of asset allocation decisions and underlying fund positioning across the asset class spectrum.
Fixed-income markets gained but significantly lagged equities despite heightened volatility
The 12-month period ended April 30, 2019 saw a market environment with positive absolute returns in many asset classes, though total returns do not tell the whole story, as markets experienced heightened volatility, leading to an equity market sell-off followed by a solid rebound. During the period, U.S. equities generally outperformed U.S. fixed income, in some cases rewarding investors with double-digit returns. Within the U.S., the S&P 500 Index posted positive absolute returns in the first five consecutive months of the period. However, the fourth quarter of 2018 proved to be a challenging one, as equity markets reversed course with volatility across capital markets increasing substantially. The S&P 500 Index lost 13.52% in the fourth quarter of 2018, but the turn of the new year proved beneficial for U.S. equities, as the S&P 500 Index posted positive returns in each of the first four months of 2019. U.S. dividend-paying equities, as measured by the MSCI USA High Dividend Yield Index (Net), posted a return of 11.70% for the period. Preferred stocks lagged the broad U.S. equity market, posting a return of 6.87%, as represented by the ICE BofAML U.S. Preferred Stock Fixed Rate Index. International equities did not experience the strong overall results U.S. equities did. The MSCI EAFE Index (Net), representing developed international equities, posted a return of -3.22%, and emerging markets equities performed even more weakly, with the MSCI Emerging Markets Index (Net) generating a return of -5.04%.
Returns of non-traditional asset classes were solidly positive but mixed in terms of magnitude. Real estate investment trusts (REITs) were the big winners, with the FTSE NAREIT Equity REITs Index posting a return of 18.88% for the period. Convertible securities, as measured by the ICE BofAML All Convertibles All Qualities Index, returned 10.96%. Floating rate loans posted more muted yet still solid absolute returns for the annual period, with the Credit Suisse Leveraged Loan Index returning 4.46%.
More traditional fixed income generated positive but more muted returns. The Bloomberg Barclays U.S. Aggregate Bond Index, a broad proxy for the U.S. fixed-income market, posted a return of 5.29% for the period. Within the asset class, investment-grade and high-yield corporate bonds performed well, buoyed by especially strong results in the first four months of 2019. Long maturity investment-grade corporate bonds, as measured by the Bloomberg Barclays U.S. Corporate Investment Grade Long Index, returned 7.17%, and high-yield corporate bonds, as measured by the ICE BofAML U.S. Cash Pay High Yield Constrained Index, returned 6.74%. Emerging markets bonds experienced a similar return pattern as other risk-on asset classes, with the JPMorgan Emerging Markets Bond Index-Global posting negative absolute returns through the first eight months of the period and then rebounding in 2019 to end the period with a return of 5.19%. Conversely, securitized bonds and U.S. Treasury securities posted healthy positive returns through the last eight months of 2018 and more modest, yet still positive, returns in the first four months of 2019. The Bloomberg Barclays U.S. Securitized Index and the Bloomberg Barclays U.S. Long Treasury Index returned 4.97% and 6.41%, respectively, for the period.
Asset allocation and underlying fund selection dampened relative results
Overall, asset allocation and underlying investment selection detracted from the Fund’s relative results during the period. The Fund, being well diversified across asset classes, had exposure to certain non-traditional asset classes that did not keep pace with the broad U.S. equity market. As the Blended Benchmark is comprised 40% of the S&P 500 Index, such exposure to these lagging alternative income sources detracted from relative results. Selection among equity income sources was also particularly challenged, while selection in traditional fixed-income sources overall added value.
Columbia Multi-Asset Income Fund | Annual Report 2019
| 5 |
Manager Discussion of Fund Performance (continued)
More specifically, within the Fund’s equity income allocation, allocation positioning and underlying fund selection in dividend equities, preferred stocks and equity-linked notes detracted from relative results, as these positions were not able to keep pace with the strong absolute returns of the S&P 500 Index during the period.
Among non-traditional income sources, convertible securities detracted most — even while posting positive absolute returns within the Fund. Selection within the convertible securities sector was weak, and the sector lagged the S&P 500 Index. Conversely, the Fund’s allocation to REITs added value, as the sector solidly outperformed the S&P 500 Index during the period and security selection within the sector proved effective. Positioning in floating rate loans had a muted effect on relative results during the period.
Overall, the Fund’s traditional fixed-income allocation contributed positively to relative results through a combination of style positioning within each sector and underlying selection decisions within these sectors. High-yield corporate bonds were the biggest positive contributor to relative performance, as the sector posted strong absolute returns that outpaced those of the Bloomberg Barclays U.S. Aggregate Bond Index for the period. Securitized bonds also added value, as our security selection within the sector was especially strong. U.S. Treasuries and emerging markets bonds detracted from the Fund’s relative performance due to a combination of asset allocation decisions and weak underlying security selection.
Portfolio changes
Asset class changes within the Fund can be driven by active trading, by tactically adjusting allocations to select asset classes or by market appreciation or depreciation within a given asset class. We made a number of positioning changes within the Fund to adapt to evolving market conditions during the period.
Early in the period, the Fund was positioned with a slight overweight to equities, as most of our indicators were in neutral territory, and we saw no evidence that recession risk was elevated. Conversely, the Fund was underweight in fixed income, as our research duration tools that measure how much interest rate sensitivity we want to take in the Fund remained neutral to negative, and our models for non-government bond sectors showed pessimism. By the end of the period, after experiencing the very different tales of the fourth quarter of 2018 and first quarter of 2019, we had an optimistic view of equities, as momentum had been strong and volatility had been lower. As such, the Fund had a modest overweight to equities relative to the Fund’s Blended Benchmark. We had increased the Fund’s fixed-income allocation to a rather neutral weight compared to the Blended Benchmark.
Within traditional fixed income, at the end of the period, we had increased the Fund’s allocation to high-yield corporate bonds and emerging markets bonds, as we expected to see continued strength for riskier segments of the fixed-income market alongside positive equity momentum. Within equity income, we thought market factors supported a modest overweight positioning by the end of the period. As such, we slightly increased the Fund’s allocation to dividend paying equities and slightly decreased its allocations to preferred securities and equity linked notes. Among non-traditional income sources, we increased the Fund’s allocation to REITs during the period, a shift that proved beneficial, as the sector posted some of the best returns among all asset classes for the period overall. We slightly decreased the Fund’s allocation to convertible bonds during the period.
Market risk may affect a single issuer, sector of the economy, industry or the market as a whole. The Fund’sinvestment in other funds subjects it to the investment performance (positive or negative), risks and expenses of these underlying funds. Fixed-income securities presentissuer default risk. A rise ininterest rates may result in a price decline of fixed-income instruments held by the Fund, negatively impacting its performance and NAV. Falling rates may result in the Fund investing in lower yielding debt instruments, lowering the Fund’s income and yield. These risks may be heightened for longer maturity and duration securities.Non-investment-grade (high-yield or junk) securities present greater price volatility and more risk to principal and income than higher rated securities.Prepayment and extension risk exists because the timing of payments on a loan, bond or other investment may accelerate when interest rates fall or decelerate when interest rates rise which may reduce investment opportunities and potential returns. Investing inderivatives is a specialized activity that involves special risks that subject the Fund to significant loss potential, including when used as leverage, and may result in greater fluctuation in fund value.Asset allocation does not assure a profit or protect against loss.International investing involves certain risks and volatility due to potential political, economic or currency instabilities and different financial and accounting standards. Risks are enhanced foremerging market issuers. Market or other (e.g., interest rate) environments may adversely affect theliquidity of fund investments, negatively impacting their price. Generally, the less liquid the market at the time the Fund sells a holding, the greater the risk of loss or decline of value to the Fund. Investments inEquity-Linked Notes (ELNs) have the potential to lead
| 6 | Columbia Multi-Asset Income Fund | Annual Report 2019 |
Manager Discussion of Fund Performance (continued)
to significant losses because ELNs are subject to the market and volatility risks associated with their underlying equity. In addition, because ELNs often take the form of unsecured notes of the issuer, the Fund may be subject to counterparty risk that the issuer may default on its obligations under the ELN. See the Fund’s prospectus for more information on these and other risks.
The views expressed in this report reflect the current views of the respective parties. These views are not guarantees of future performance and involve certain risks, uncertainties and assumptions that are difficult to predict, so actual outcomes and results may differ significantly from the views expressed. These views are subject to change at any time based upon economic, market or other conditions and the respective parties disclaim any responsibility to update such views. These views may not be relied on as investment advice and, because investment decisions for a Columbia fund are based on numerous factors, may not be relied on as an indication of trading intent on behalf of any particular Columbia fund. References to specific securities should not be construed as a recommendation or investment advice.
Columbia Multi-Asset Income Fund | Annual Report 2019
| 7 |
Understanding Your Fund’s Expenses
(Unaudited)
As an investor, you incur two types of costs. There are shareholder transaction costs, which generally include sales charges on purchases and may include redemption fees. There are also ongoing fund costs, which generally include management fees, distribution and/or service fees, and other fund expenses. The following information is intended to help you understand your ongoing costs (in dollars) of investing in the Fund and to help you compare these costs with the ongoing costs of investing in other mutual funds.
Analyzing your Fund’s expenses
To illustrate these ongoing costs, we have provided examples and calculated the expenses paid by investors in each share class of the Fund during the period. The actual and hypothetical information in the table is based on an initial investment of $1,000 at the beginning of the period indicated and held for the entire period. Expense information is calculated two ways and each method provides you with different information. The amount listed in the “Actual” column is calculated using the Fund’s actual operating expenses and total return for the period. You may use the Actual information, together with the amount invested, to estimate the expenses that you paid over the period. Simply divide your account value by $1,000 (for example, an $8,600 account value divided by $1,000 = 8.6), then multiply the results by the expenses paid during the period under the “Actual” column. The amount listed in the “Hypothetical” column assumes a 5% annual rate of return before expenses (which is not the Fund’s actual return) and then applies the Fund’s actual expense ratio for the period to the hypothetical return. You should not use the hypothetical account values and expenses to estimate either your actual account balance at the end of the period or the expenses you paid during the period. See “Compare with other funds” below for details on how to use the hypothetical data.
Compare with other funds
Since all mutual funds are required to include the same hypothetical calculations about expenses in shareholder reports, you can use this information to compare the ongoing cost of investing in the Fund with other funds. To do so, compare the hypothetical example with the 5% hypothetical examples that appear in the shareholder reports of other funds. As you compare hypothetical examples of other funds, it is important to note that hypothetical examples are meant to highlight the ongoing costs of investing in a fund only and do not reflect any transaction costs, such as sales charges, or redemption or exchange fees. Therefore, the hypothetical calculations are useful in comparing ongoing costs only, and will not help you determine the relative total costs of owning different funds. If transaction costs were included in these calculations, your costs would be higher.
| November 1, 2018 — April 30, 2019 |
| | Account value at the
beginning of the
period ($) | Account value at the
end of the
period ($) | Expenses paid during
the period ($) | Fund’s annualized
expense ratio (%) |
| | Actual | Hypothetical | Actual | Hypothetical | Actual | Hypothetical | Actual |
| Class A | 1,000.00 | 1,000.00 | 1,054.40 | 1,020.28 | 4.64 | 4.56 | 0.91 |
| Advisor Class | 1,000.00 | 1,000.00 | 1,055.70 | 1,021.52 | 3.36 | 3.31 | 0.66 |
| Class C | 1,000.00 | 1,000.00 | 1,050.50 | 1,016.56 | 8.44 | 8.30 | 1.66 |
| Institutional Class | 1,000.00 | 1,000.00 | 1,055.70 | 1,021.52 | 3.36 | 3.31 | 0.66 |
| Institutional 2 Class | 1,000.00 | 1,000.00 | 1,056.00 | 1,021.82 | 3.06 | 3.01 | 0.60 |
| Institutional 3 Class | 1,000.00 | 1,000.00 | 1,056.40 | 1,022.12 | 2.75 | 2.71 | 0.54 |
Expenses paid during the period are equal to the annualized expense ratio for each class as indicated above, multiplied by the average account value over the period and then multiplied by the number of days in the Fund’s most recent fiscal half year and divided by 365.
Expenses do not include fees and expenses incurred indirectly by the Fund from its investment in underlying funds, including affiliated and non-affiliated pooled investment vehicles, such as mutual funds and exchange-traded funds.
Had Columbia Management Investment Advisers, LLC and/or certain of its affiliates not waived/reimbursed certain fees and expenses, account value at the end of the period would have been reduced.
| 8 | Columbia Multi-Asset Income Fund | Annual Report 2019 |
Portfolio of Investments
April 30, 2019
(Percentages represent value of investments compared to net assets)
Investments in securities
| Asset-Backed Securities — Non-Agency 3.3% |
| Issuer | Coupon
Rate | | Principal
Amount ($) | Value ($) |
| ARES XLIV CLO Ltd.(a),(b) |
| Series 2017-44A Class D |
3-month USD LIBOR + 6.550%
10/15/2029 | 9.147% | | 500,000 | 491,897 |
| Avant Loans Funding Trust(a) |
| Subordinated, Series 2018-B Class B |
| 07/15/2022 | 4.110% | | 280,000 | 282,077 |
| CLUB Credit Trust(a) |
| Subordinated Series 2017-NP1 Class C |
| 04/17/2023 | 5.130% | | 119,561 | 120,020 |
| Conn’s Receivables Funding LLC(a) |
| Subordinated, Series 2017-B Class B |
| 04/15/2021 | 4.520% | | 134,810 | 135,128 |
| Consumer Loan Underlying Bond Credit Trust(a) |
| Series 2017-NP2 Class B |
| 01/16/2024 | 3.500% | | 47,588 | 47,597 |
| Drive Auto Receivables Trust |
| Series 2018-4 Class C |
| 11/15/2024 | 3.660% | | 300,000 | 302,118 |
| Hertz Vehicle Financing II LP(a) |
| Subordinated, Series 2016-3A Class D |
| 07/25/2020 | 5.410% | | 250,000 | 250,144 |
| Marlette Funding Trust(a) |
| Subordinated, Series 2018-2A Class C |
| 07/17/2028 | 4.370% | | 206,000 | 208,228 |
| OZLM Funding Ltd.(a),(b) |
| Series 2012-1A Class DR2 |
3-month USD LIBOR + 6.670%
07/23/2029 | 9.262% | | 500,000 | 497,802 |
| OZLM XXI(a),(b) |
| Series 2017-21A Class A2 |
3-month USD LIBOR + 1.450%
01/20/2031 | 4.042% | | 500,000 | 493,869 |
| Prosper Marketplace Issuance Trust(a) |
| Series 2018-1A Class B |
| 06/17/2024 | 3.900% | | 200,000 | 200,757 |
| Series 2019-1A Class B |
| 04/15/2025 | 4.030% | | 500,000 | 503,662 |
| Subordinated, Series 2017-1A Class C |
| 06/15/2023 | 5.800% | | 500,000 | 504,877 |
| Subordinated, Series 2017-2A Class C |
| 09/15/2023 | 5.370% | | 750,000 | 754,505 |
Total Asset-Backed Securities — Non-Agency
(Cost $4,804,798) | 4,792,681 |
|
| Commercial Mortgage-Backed Securities - Non-Agency 0.8% |
| Issuer | Coupon
Rate | | Principal
Amount ($) | Value ($) |
| Credit Suisse Mortgage Capital Certificates OA LLC(a) |
| Subordinated, Series 2014-USA Class D |
| 09/15/2037 | 4.373% | | 460,000 | 442,311 |
| Subordinated, Series 2014-USA Class F |
| 09/15/2037 | 4.373% | | 250,000 | 218,436 |
| Olympic Tower Mortgage Trust(a),(c) |
| Subordinated, Series 2017-OT Class D |
| 05/10/2039 | 4.077% | | 200,000 | 198,921 |
| Progress Residential Trust(a) |
| Subordinated Series 2019-SFR2 Class E |
| 05/17/2036 | 4.142% | | 150,000 | 150,165 |
| UBS Commercial Mortgage Trust(a),(b) |
| Series 2018-NYCH Class D |
1-month USD LIBOR + 2.100%
Floor 2.100%
02/15/2032 | 4.573% | | 250,000 | 250,436 |
Total Commercial Mortgage-Backed Securities - Non-Agency
(Cost $1,237,052) | 1,260,269 |
| Common Stocks 10.8% |
| Issuer | Shares | Value ($) |
| Communication Services 0.4% |
| Diversified Telecommunication Services 0.4% |
| AT&T, Inc. | 6,700 | 207,432 |
| BCE, Inc. | 2,400 | 107,376 |
| Verizon Communications, Inc. | 5,500 | 314,545 |
| Total | | 629,353 |
| Total Communication Services | 629,353 |
| Consumer Discretionary 0.5% |
| Automobiles 0.1% |
| General Motors Co. | 2,700 | 105,165 |
| Hotels, Restaurants & Leisure 0.3% |
| Carnival Corp. | 1,000 | 54,860 |
| Extended Stay America, Inc. | 2,800 | 50,148 |
| Las Vegas Sands Corp. | 1,400 | 93,870 |
| McDonald’s Corp. | 1,000 | 197,570 |
| Six Flags Entertainment Corp. | 800 | 42,472 |
| Total | | 438,920 |
| Leisure Products 0.0% |
| Hasbro, Inc. | 500 | 50,930 |
The accompanying Notes to Financial Statements are an integral part of this statement.
Columbia Multi-Asset Income Fund | Annual Report 2019
| 9 |
Portfolio of Investments (continued)
April 30, 2019
| Common Stocks (continued) |
| Issuer | Shares | Value ($) |
| Specialty Retail 0.1% |
| Home Depot, Inc. (The) | 400 | 81,480 |
| Williams-Sonoma, Inc. | 1,000 | 57,170 |
| Total | | 138,650 |
| Textiles, Apparel & Luxury Goods 0.0% |
| Tapestry, Inc. | 1,600 | 51,632 |
| Total Consumer Discretionary | 785,297 |
| Consumer Staples 0.9% |
| Beverages 0.2% |
| PepsiCo, Inc. | 2,300 | 294,515 |
| Food Products 0.2% |
| ConAgra Foods, Inc. | 3,500 | 107,730 |
| General Mills, Inc. | 2,200 | 113,234 |
| Mondelez International, Inc., Class A | 1,600 | 81,360 |
| Total | | 302,324 |
| Household Products 0.3% |
| Colgate-Palmolive Co. | 1,200 | 87,348 |
| Kimberly-Clark Corp. | 400 | 51,352 |
| Procter & Gamble Co. (The) | 3,100 | 330,088 |
| Total | | 468,788 |
| Tobacco 0.2% |
| Philip Morris International, Inc. | 3,500 | 302,960 |
| Total Consumer Staples | 1,368,587 |
| Energy 0.9% |
| Energy Equipment & Services 0.1% |
| Baker Hughes, Inc. | 2,200 | 52,844 |
| Oil, Gas & Consumable Fuels 0.8% |
| BP PLC, ADR | 8,500 | 371,705 |
| Chevron Corp. | 3,000 | 360,180 |
| Suncor Energy, Inc. | 6,100 | 201,300 |
| Valero Energy Corp. | 1,900 | 172,254 |
| Williams Companies, Inc. (The) | 2,900 | 82,157 |
| Total | | 1,187,596 |
| Total Energy | 1,240,440 |
| Common Stocks (continued) |
| Issuer | Shares | Value ($) |
| Financials 0.8% |
| Banks 0.6% |
| Bank of America Corp. | 3,500 | 107,030 |
| BB&T Corp. | 2,500 | 128,000 |
| JPMorgan Chase & Co. | 2,300 | 266,915 |
| PacWest Bancorp | 1,300 | 51,415 |
| Wells Fargo & Co. | 6,000 | 290,460 |
| Total | | 843,820 |
| Capital Markets 0.0% |
| Ares Capital Corp. | 3,000 | 54,000 |
| Insurance 0.2% |
| MetLife, Inc. | 1,800 | 83,034 |
| Principal Financial Group, Inc. | 1,500 | 85,740 |
| Prudential Financial, Inc. | 1,100 | 116,281 |
| Total | | 285,055 |
| Total Financials | 1,182,875 |
| Health Care 1.0% |
| Biotechnology 0.1% |
| AbbVie, Inc. | 1,000 | 79,390 |
| Gilead Sciences, Inc. | 2,000 | 130,080 |
| Total | | 209,470 |
| Pharmaceuticals 0.9% |
| Bristol-Myers Squibb Co. | 3,400 | 157,862 |
| Johnson & Johnson | 3,500 | 494,200 |
| Merck & Co., Inc. | 3,200 | 251,872 |
| Pfizer, Inc. | 8,500 | 345,185 |
| Total | | 1,249,119 |
| Total Health Care | 1,458,589 |
| Industrials 0.4% |
| Aerospace & Defense 0.1% |
| Lockheed Martin Corp. | 300 | 99,999 |
| Air Freight & Logistics 0.0% |
| United Parcel Service, Inc., Class B | 750 | 79,665 |
| Airlines 0.1% |
| Delta Air Lines, Inc. | 1,600 | 93,264 |
The accompanying Notes to Financial Statements are an integral part of this statement.
| 10 | Columbia Multi-Asset Income Fund | Annual Report 2019 |
Portfolio of Investments (continued)
April 30, 2019
| Common Stocks (continued) |
| Issuer | Shares | Value ($) |
| Machinery 0.1% |
| Caterpillar, Inc. | 800 | 111,536 |
| Ingersoll-Rand PLC | 750 | 91,958 |
| Total | | 203,494 |
| Road & Rail 0.1% |
| Union Pacific Corp. | 600 | 106,224 |
| Total Industrials | 582,646 |
| Information Technology 1.0% |
| Communications Equipment 0.2% |
| Cisco Systems, Inc. | 6,700 | 374,865 |
| Electronic Equipment, Instruments & Components 0.1% |
| Corning, Inc. | 3,000 | 95,550 |
| IT Services 0.2% |
| Automatic Data Processing, Inc. | 350 | 57,536 |
| International Business Machines Corp. | 1,500 | 210,405 |
| Total | | 267,941 |
| Semiconductors & Semiconductor Equipment 0.5% |
| Broadcom, Inc. | 550 | 175,120 |
| Intel Corp. | 2,000 | 102,080 |
| Lam Research Corp. | 900 | 186,687 |
| QUALCOMM, Inc. | 1,000 | 86,130 |
| Texas Instruments, Inc. | 1,400 | 164,962 |
| Total | | 714,979 |
| Technology Hardware, Storage & Peripherals 0.0% |
| Western Digital Corp. | 1,100 | 56,232 |
| Total Information Technology | 1,509,567 |
| Materials 0.2% |
| Chemicals 0.2% |
| Dow, Inc.(d) | 1,883 | 106,823 |
| Nutrien Ltd. | 2,100 | 113,778 |
| Total | | 220,601 |
| Total Materials | 220,601 |
| Common Stocks (continued) |
| Issuer | Shares | Value ($) |
| Real Estate 4.3% |
| Equity Real Estate Investment Trusts (REITS) 4.3% |
| Alexandria Real Estate Equities, Inc. | 3,397 | 483,699 |
| Americold Realty Trust | 6,863 | 219,685 |
| Armada Hoffler Properties, Inc. | 2,413 | 38,970 |
| Ashford Hospitality Trust, Inc. | 5,369 | 29,583 |
| Brandywine Realty Trust | 3,493 | 53,757 |
| Chesapeake Lodging Trust | 2,687 | 76,579 |
| Coresite Realty Corp. | 766 | 83,808 |
| Digital Realty Trust, Inc. | 5,055 | 595,024 |
| Duke Realty Corp. | 4,607 | 143,370 |
| EastGroup Properties, Inc. | 1,752 | 200,306 |
| EPR Properties | 3,067 | 241,864 |
| Four Corners Property Trust, Inc. | 2,513 | 71,470 |
| Front Yard Residential Corp. | 4,982 | 49,372 |
| Gaming and Leisure Properties, Inc. | 4,946 | 199,719 |
| GEO Group, Inc. (The) | 5,248 | 105,065 |
| Getty Realty Corp. | 3,363 | 109,062 |
| Gladstone Commercial Corp. | 2,091 | 45,479 |
| HCP, Inc. | 6,062 | 180,526 |
| Healthcare Trust of America, Inc., Class A | 4,641 | 127,999 |
| Highwoods Properties, Inc. | 3,425 | 152,686 |
| Host Hotels & Resorts, Inc. | 7,641 | 147,013 |
| Industrial Logistics Properties Trust | 2,072 | 41,129 |
| Lexington Realty Trust | 15,727 | 142,644 |
| Life Storage, Inc. | 1,322 | 125,973 |
| Medical Properties Trust, Inc. | 8,592 | 150,016 |
| Mid-America Apartment Communities, Inc. | 1,085 | 118,710 |
| Office Properties Income Trust | 1,931 | 52,407 |
| One Liberty Properties, Inc. | 3,170 | 89,711 |
| Outfront Media, Inc. | 1,960 | 46,707 |
| Pebblebrook Hotel Trust | 3,185 | 103,704 |
| Physicians Realty Trust | 5,861 | 105,850 |
| Retail Properties of America, Inc., Class A | 5,012 | 61,597 |
| RLJ Lodging Trust | 2,081 | 38,311 |
| RPT Realty | 8,698 | 105,507 |
| Sabra Health Care REIT, Inc. | 8,344 | 163,209 |
| Senior Housing Properties Trust | 2,330 | 18,710 |
| SITE Centers Corp. | 15,821 | 209,470 |
The accompanying Notes to Financial Statements are an integral part of this statement.
Columbia Multi-Asset Income Fund | Annual Report 2019
| 11 |
Portfolio of Investments (continued)
April 30, 2019
| Common Stocks (continued) |
| Issuer | Shares | Value ($) |
| Spirit Realty Capital, Inc. | 3,075 | 124,414 |
| STAG Industrial, Inc. | 10,883 | 313,213 |
| STORE Capital Corp. | 2,969 | 98,927 |
| Sun Communities, Inc. | 2,319 | 285,423 |
| UDR, Inc. | 3,064 | 137,727 |
| Ventas, Inc. | 1,229 | 75,104 |
| Washington Prime Group, Inc. | 17,946 | 79,860 |
| WP Carey, Inc. | 2,259 | 179,184 |
| Total | | 6,222,543 |
| Total Real Estate | 6,222,543 |
| Utilities 0.4% |
| Electric Utilities 0.2% |
| American Electric Power Co., Inc. | 700 | 59,885 |
| Edison International | 800 | 51,016 |
| Entergy Corp. | 1,400 | 135,660 |
| Xcel Energy, Inc. | 1,900 | 107,350 |
| Total | | 353,911 |
| Multi-Utilities 0.2% |
| Ameren Corp. | 1,400 | 101,878 |
| DTE Energy Co. | 400 | 50,284 |
| NiSource, Inc. | 3,000 | 83,340 |
| Total | | 235,502 |
| Total Utilities | 589,413 |
Total Common Stocks
(Cost $14,191,452) | 15,789,911 |
| Convertible Bonds 0.0% |
| Issuer | Coupon
Rate | | Principal
Amount ($) | Value ($) |
| Life Insurance 0.0% |
| AXA SA(a) |
| 05/15/2021 | 7.250% | | 50,000 | 54,296 |
Total Convertible Bonds
(Cost $50,300) | 54,296 |
| Convertible Preferred Stocks 0.5% |
| Issuer | | Shares | Value ($) |
| Health Care 0.1% |
| Health Care Equipment & Supplies 0.1% |
| Becton Dickinson and Co. | 6.125% | 1,700 | 101,184 |
| Danaher Corp. | 4.750% | 100 | 105,200 |
| Total | | | 206,384 |
| Total Health Care | 206,384 |
| Industrials 0.1% |
| Machinery 0.1% |
| Fortive Corp. | 5.000% | 100 | 107,825 |
| Total Industrials | 107,825 |
| Real Estate 0.1% |
| Equity Real Estate Investment Trusts (REITS) 0.1% |
| Crown Castle International Corp. | 6.875% | 70 | 80,648 |
| Total Real Estate | 80,648 |
| Utilities 0.2% |
| Electric Utilities 0.1% |
| American Electric Power Co., Inc. | 6.125% | 2,000 | 103,646 |
| Multi-Utilities 0.1% |
| CenterPoint Energy, Inc. | 7.000% | 1,000 | 53,365 |
| DTE Energy Co. | 6.500% | 1,900 | 105,715 |
| Total | | | 159,080 |
| Water Utilities 0.0% |
| Aqua America, Inc. | 6.000% | 885 | 47,609 |
| Total Utilities | 310,335 |
Total Convertible Preferred Stocks
(Cost $676,485) | 705,192 |
| Corporate Bonds & Notes 20.7% |
| Issuer | Coupon
Rate | | Principal
Amount ($) | Value ($) |
| Aerospace & Defense 0.5% |
| Bombardier, Inc.(a) |
| 12/01/2024 | 7.500% | | 22,000 | 22,361 |
| 03/15/2025 | 7.500% | | 55,000 | 55,193 |
| 04/15/2027 | 7.875% | | 38,000 | 38,270 |
| TransDigm, Inc. |
| 07/15/2024 | 6.500% | | 46,000 | 46,662 |
| 05/15/2025 | 6.500% | | 85,000 | 85,590 |
| 06/15/2026 | 6.375% | | 201,000 | 201,334 |
The accompanying Notes to Financial Statements are an integral part of this statement.
| 12 | Columbia Multi-Asset Income Fund | Annual Report 2019 |
Portfolio of Investments (continued)
April 30, 2019
| Corporate Bonds & Notes (continued) |
| Issuer | Coupon
Rate | | Principal
Amount ($) | Value ($) |
| TransDigm, Inc.(a) |
| 03/15/2026 | 6.250% | | 227,000 | 236,400 |
| 03/15/2027 | 7.500% | | 76,000 | 78,365 |
| Total | 764,175 |
| Automotive 0.1% |
| Delphi Technologies PLC(a) |
| 10/01/2025 | 5.000% | | 40,000 | 36,705 |
| Panther BF Aggregator 2 LP/Finance Co., Inc.(a) |
| 05/15/2026 | 6.250% | | 46,000 | 48,074 |
| 05/15/2027 | 8.500% | | 45,000 | 46,492 |
| Total | 131,271 |
| Banking 0.3% |
| Ally Financial, Inc. |
| 05/19/2022 | 4.625% | | 50,000 | 51,220 |
| 03/30/2025 | 4.625% | | 113,000 | 116,494 |
| 11/01/2031 | 8.000% | | 36,000 | 46,173 |
| Banco Mercantil del Norte SA(a),(e) |
| Subordinated |
| 10/04/2031 | 5.750% | | 200,000 | 195,800 |
| Total | 409,687 |
| Brokerage/Asset Managers/Exchanges 0.1% |
| NFP Corp.(a) |
| 07/15/2025 | 6.875% | | 101,000 | 99,595 |
| VFH Parent LLC/Orchestra Co-Issuer, Inc.(a) |
| 06/15/2022 | 6.750% | | 13,000 | 13,430 |
| Total | 113,025 |
| Building Materials 0.5% |
| American Builders & Contractors Supply Co., Inc.(a) |
| 12/15/2023 | 5.750% | | 132,000 | 137,067 |
| 05/15/2026 | 5.875% | | 87,000 | 89,949 |
| Beacon Roofing Supply, Inc. |
| 10/01/2023 | 6.375% | | 18,000 | 18,739 |
| Beacon Roofing Supply, Inc.(a) |
| 11/01/2025 | 4.875% | | 156,000 | 150,071 |
| Cemex SAB de CV(a) |
| 05/05/2025 | 6.125% | | 200,000 | 208,198 |
| Core & Main LP(a) |
| 08/15/2025 | 6.125% | | 82,000 | 81,652 |
| James Hardie International Finance DAC(a) |
| 01/15/2028 | 5.000% | | 48,000 | 46,807 |
| Total | 732,483 |
| Cable and Satellite 1.9% |
| Cable One, Inc.(a) |
| 06/15/2022 | 5.750% | | 30,000 | 30,509 |
| Corporate Bonds & Notes (continued) |
| Issuer | Coupon
Rate | | Principal
Amount ($) | Value ($) |
| CCO Holdings LLC/Capital Corp.(a) |
| 04/01/2024 | 5.875% | | 60,000 | 62,630 |
| 02/15/2026 | 5.750% | | 47,000 | 49,113 |
| 05/01/2026 | 5.500% | | 87,000 | 89,924 |
| 05/01/2027 | 5.125% | | 39,000 | 39,603 |
| 02/01/2028 | 5.000% | | 180,000 | 179,786 |
| CSC Holdings LLC(a) |
| 12/15/2021 | 5.125% | | 76,000 | 76,180 |
| 12/15/2021 | 5.125% | | 26,000 | 26,039 |
| 10/15/2025 | 6.625% | | 148,000 | 157,273 |
| 10/15/2025 | 10.875% | | 62,000 | 71,284 |
| 05/15/2026 | 5.500% | | 84,000 | 86,368 |
| 02/01/2028 | 5.375% | | 62,000 | 63,229 |
| 04/01/2028 | 7.500% | | 138,000 | 150,428 |
| 02/01/2029 | 6.500% | | 109,000 | 117,038 |
| DISH DBS Corp. |
| 06/01/2021 | 6.750% | | 66,000 | 68,165 |
| 11/15/2024 | 5.875% | | 21,000 | 18,119 |
| 07/01/2026 | 7.750% | | 267,000 | 238,989 |
| Intelsat Jackson Holdings SA(a) |
| 10/15/2024 | 8.500% | | 88,000 | 87,120 |
| Quebecor Media, Inc. |
| 01/15/2023 | 5.750% | | 40,000 | 41,934 |
| Radiate HoldCo LLC/Finance, Inc.(a) |
| 02/15/2023 | 6.875% | | 23,000 | 23,063 |
| 02/15/2025 | 6.625% | | 64,000 | 62,909 |
| Sirius XM Radio, Inc.(a) |
| 04/15/2025 | 5.375% | | 82,000 | 84,516 |
| 07/15/2026 | 5.375% | | 57,000 | 58,642 |
| 08/01/2027 | 5.000% | | 6,000 | 6,045 |
| Unitymedia GmbH(a) |
| 01/15/2025 | 6.125% | | 103,000 | 106,832 |
| Unitymedia Hessen GmbH & Co. KG NRW(a) |
| 01/15/2025 | 5.000% | | 90,000 | 92,150 |
| Viasat, Inc.(a) |
| 04/15/2027 | 5.625% | | 27,000 | 27,686 |
| Videotron Ltd. |
| 07/15/2022 | 5.000% | | 55,000 | 57,214 |
| Virgin Media Finance PLC(a) |
| 10/15/2024 | 6.000% | | 284,000 | 293,738 |
| Ziggo Bond Finance BV(a) |
| 01/15/2027 | 6.000% | | 87,000 | 85,498 |
| Ziggo BV(a) |
| 01/15/2027 | 5.500% | | 182,000 | 181,966 |
| Total | 2,733,990 |
| Chemicals 0.9% |
| Alpha 2 BV(a) |
| 06/01/2023 | 8.750% | | 71,000 | 70,541 |
The accompanying Notes to Financial Statements are an integral part of this statement.
Columbia Multi-Asset Income Fund | Annual Report 2019
| 13 |
Portfolio of Investments (continued)
April 30, 2019
| Corporate Bonds & Notes (continued) |
| Issuer | Coupon
Rate | | Principal
Amount ($) | Value ($) |
| Angus Chemical Co.(a) |
| 02/15/2023 | 8.750% | | 74,000 | 74,461 |
| Atotech U.S.A., Inc.(a) |
| 02/01/2025 | 6.250% | | 69,000 | 70,035 |
| Axalta Coating Systems LLC(a) |
| 08/15/2024 | 4.875% | | 64,000 | 64,388 |
| Chemours Co. (The) |
| 05/15/2023 | 6.625% | | 31,000 | 32,097 |
| 05/15/2025 | 7.000% | | 64,000 | 67,688 |
| INEOS Group Holdings SA(a) |
| 08/01/2024 | 5.625% | | 83,000 | 83,860 |
| Platform Specialty Products Corp.(a) |
| 12/01/2025 | 5.875% | | 156,000 | 159,946 |
| PQ Corp.(a) |
| 11/15/2022 | 6.750% | | 122,000 | 126,561 |
| 12/15/2025 | 5.750% | | 80,000 | 79,838 |
| Sasol Financing USA LLC |
| 03/27/2024 | 5.875% | | 200,000 | 212,562 |
| SPCM SA(a) |
| 09/15/2025 | 4.875% | | 44,000 | 42,923 |
| Starfruit Finco BV/US Holdco LLC(a) |
| 10/01/2026 | 8.000% | | 146,000 | 149,873 |
| WR Grace & Co.(a) |
| 10/01/2021 | 5.125% | | 60,000 | 62,088 |
| Total | 1,296,861 |
| Construction Machinery 0.3% |
| H&E Equipment Services, Inc. |
| 09/01/2025 | 5.625% | | 75,000 | 76,480 |
| Ritchie Bros. Auctioneers, Inc.(a) |
| 01/15/2025 | 5.375% | | 80,000 | 82,096 |
| United Rentals North America, Inc. |
| 10/15/2025 | 4.625% | | 30,000 | 29,774 |
| 12/15/2026 | 6.500% | | 60,000 | 64,221 |
| 05/15/2027 | 5.500% | | 95,000 | 97,847 |
| 01/15/2028 | 4.875% | | 58,000 | 57,561 |
| United Rentals North America, Inc.(f) |
| 01/15/2030 | 5.250% | | 19,000 | 19,094 |
| Total | 427,073 |
| Consumer Cyclical Services 0.2% |
| APX Group, Inc. |
| 12/01/2020 | 8.750% | | 40,000 | 39,428 |
| 12/01/2022 | 7.875% | | 77,000 | 77,144 |
| 09/01/2023 | 7.625% | | 40,000 | 35,234 |
| APX Group, Inc.(a),(f) |
| 11/01/2024 | 8.500% | | 51,000 | 50,635 |
| Corporate Bonds & Notes (continued) |
| Issuer | Coupon
Rate | | Principal
Amount ($) | Value ($) |
| CoreCivic, Inc. |
| 04/01/2020 | 4.125% | | 44,000 | 44,192 |
| frontdoor, Inc.(a) |
| 08/15/2026 | 6.750% | | 27,000 | 28,350 |
| Total | 274,983 |
| Consumer Products 0.5% |
| Energizer Holdings, Inc.(a) |
| 07/15/2026 | 6.375% | | 29,000 | 29,953 |
| 01/15/2027 | 7.750% | | 37,000 | 40,038 |
| Mattel, Inc.(a) |
| 12/31/2025 | 6.750% | | 58,000 | 58,087 |
| Prestige Brands, Inc.(a) |
| 03/01/2024 | 6.375% | | 96,000 | 99,057 |
| Resideo Funding, Inc.(a) |
| 11/01/2026 | 6.125% | | 43,000 | 44,635 |
| Scotts Miracle-Gro Co. (The) |
| 10/15/2023 | 6.000% | | 122,000 | 126,962 |
| 12/15/2026 | 5.250% | | 2,000 | 1,982 |
| Spectrum Brands, Inc. |
| 11/15/2022 | 6.625% | | 10,000 | 10,239 |
| 12/15/2024 | 6.125% | | 117,000 | 120,321 |
| 07/15/2025 | 5.750% | | 18,000 | 18,451 |
| Valvoline, Inc. |
| 07/15/2024 | 5.500% | | 87,000 | 89,600 |
| 08/15/2025 | 4.375% | | 59,000 | 57,257 |
| Total | 696,582 |
| Diversified Manufacturing 0.3% |
| BWX Technologies, Inc.(a) |
| 07/15/2026 | 5.375% | | 21,000 | 21,454 |
| CFX Escrow Corp.(a) |
| 02/15/2024 | 6.000% | | 18,000 | 18,703 |
| 02/15/2026 | 6.375% | | 22,000 | 23,320 |
| Gates Global LLC/Co.(a) |
| 07/15/2022 | 6.000% | | 65,000 | 65,182 |
| General Electric Co.(e) |
| Junior Subordinated |
| 12/31/2049 | 5.000% | | 63,000 | 59,676 |
| SPX FLOW, Inc.(a) |
| 08/15/2024 | 5.625% | | 13,000 | 13,322 |
| 08/15/2026 | 5.875% | | 48,000 | 49,295 |
| Stevens Holding Co., Inc.(a) |
| 10/01/2026 | 6.125% | | 18,000 | 18,948 |
| TriMas Corp.(a) |
| 10/15/2025 | 4.875% | | 9,000 | 8,999 |
| Welbilt, Inc. |
| 02/15/2024 | 9.500% | | 23,000 | 24,873 |
The accompanying Notes to Financial Statements are an integral part of this statement.
| 14 | Columbia Multi-Asset Income Fund | Annual Report 2019 |
Portfolio of Investments (continued)
April 30, 2019
| Corporate Bonds & Notes (continued) |
| Issuer | Coupon
Rate | | Principal
Amount ($) | Value ($) |
| WESCO Distribution, Inc. |
| 06/15/2024 | 5.375% | | 64,000 | 65,802 |
| Zekelman Industries, Inc.(a) |
| 06/15/2023 | 9.875% | | 31,000 | 32,715 |
| Total | 402,289 |
| Electric 0.8% |
| AES Corp. (The) |
| 03/15/2023 | 4.500% | | 53,000 | 53,779 |
| 05/15/2026 | 6.000% | | 18,000 | 19,089 |
| 09/01/2027 | 5.125% | | 63,000 | 65,677 |
| Calpine Corp. |
| 02/01/2024 | 5.500% | | 66,000 | 65,688 |
| Calpine Corp.(a) |
| 06/01/2026 | 5.250% | | 46,000 | 46,114 |
| Clearway Energy Operating LLC |
| 08/15/2024 | 5.375% | | 104,000 | 105,669 |
| 09/15/2026 | 5.000% | | 42,000 | 41,111 |
| Clearway Energy Operating LLC(a) |
| 10/15/2025 | 5.750% | | 70,000 | 71,642 |
| NextEra Energy Operating Partners LP(a) |
| 09/15/2027 | 4.500% | | 96,000 | 94,609 |
| NRG Energy, Inc. |
| 05/01/2024 | 6.250% | | 27,000 | 27,874 |
| 05/15/2026 | 7.250% | | 16,000 | 17,468 |
| 01/15/2027 | 6.625% | | 109,000 | 116,396 |
| Pattern Energy Group, Inc.(a) |
| 02/01/2024 | 5.875% | | 132,000 | 135,920 |
| TerraForm Power Operating LLC(a) |
| 01/31/2028 | 5.000% | | 87,000 | 85,878 |
| Vistra Energy Corp. |
| 11/01/2024 | 7.625% | | 59,000 | 62,245 |
| Vistra Operations Co. LLC(a) |
| 09/01/2026 | 5.500% | | 30,000 | 30,904 |
| 02/15/2027 | 5.625% | | 97,000 | 99,689 |
| Total | 1,139,752 |
| Environmental 0.1% |
| GFL Environmental, Inc.(a) |
| 03/01/2023 | 5.375% | | 20,000 | 19,448 |
| 05/01/2027 | 8.500% | | 47,000 | 48,932 |
| Hulk Finance Corp.(a) |
| 06/01/2026 | 7.000% | | 15,000 | 14,560 |
| Total | 82,940 |
| Corporate Bonds & Notes (continued) |
| Issuer | Coupon
Rate | | Principal
Amount ($) | Value ($) |
| Finance Companies 0.7% |
| Avolon Holdings Funding Ltd.(a) |
| 01/15/2023 | 5.500% | | 81,000 | 84,806 |
| 10/01/2023 | 5.125% | | 80,000 | 82,985 |
| 05/15/2024 | 5.250% | | 34,000 | 35,531 |
| iStar, Inc. |
| 04/01/2022 | 6.000% | | 54,000 | 55,265 |
| Navient Corp. |
| 03/25/2020 | 8.000% | | 7,000 | 7,254 |
| 10/26/2020 | 5.000% | | 99,000 | 100,485 |
| 07/26/2021 | 6.625% | | 39,000 | 40,989 |
| 06/15/2022 | 6.500% | | 82,000 | 86,360 |
| 06/15/2026 | 6.750% | | 30,000 | 30,215 |
| Park Aerospace Holdings Ltd.(a) |
| 08/15/2022 | 5.250% | | 8,000 | 8,329 |
| Provident Funding Associates LP/Finance Corp.(a) |
| 06/15/2025 | 6.375% | | 81,000 | 75,107 |
| Quicken Loans, Inc.(a) |
| 05/01/2025 | 5.750% | | 104,000 | 105,544 |
| 01/15/2028 | 5.250% | | 49,000 | 47,533 |
| Springleaf Finance Corp. |
| 03/15/2023 | 5.625% | | 42,000 | 43,705 |
| 03/15/2024 | 6.125% | | 108,000 | 114,048 |
| 03/15/2025 | 6.875% | | 54,000 | 57,906 |
| 03/15/2026 | 7.125% | | 40,000 | 42,959 |
| Total | 1,019,021 |
| Food and Beverage 0.6% |
| Aramark Services, Inc.(a) |
| 02/01/2028 | 5.000% | | 45,000 | 45,853 |
| B&G Foods, Inc. |
| 06/01/2021 | 4.625% | | 30,000 | 30,010 |
| 04/01/2025 | 5.250% | | 75,000 | 73,901 |
| Darling Ingredients, Inc.(a) |
| 04/15/2027 | 5.250% | | 11,000 | 11,210 |
| FAGE International SA/U.S.A. Dairy Industry, Inc.(a) |
| 08/15/2026 | 5.625% | | 66,000 | 55,582 |
| Lamb Weston Holdings, Inc.(a) |
| 11/01/2024 | 4.625% | | 25,000 | 25,372 |
| 11/01/2026 | 4.875% | | 60,000 | 60,980 |
| MHP SA(a) |
| 04/03/2026 | 6.950% | | 300,000 | 286,547 |
| Post Holdings, Inc.(a) |
| 03/01/2025 | 5.500% | | 24,000 | 24,555 |
| 08/15/2026 | 5.000% | | 117,000 | 116,494 |
| 03/01/2027 | 5.750% | | 170,000 | 174,332 |
| 01/15/2028 | 5.625% | | 39,000 | 39,409 |
| Total | 944,245 |
The accompanying Notes to Financial Statements are an integral part of this statement.
Columbia Multi-Asset Income Fund | Annual Report 2019
| 15 |
Portfolio of Investments (continued)
April 30, 2019
| Corporate Bonds & Notes (continued) |
| Issuer | Coupon
Rate | | Principal
Amount ($) | Value ($) |
| Gaming 1.0% |
| Boyd Gaming Corp. |
| 05/15/2023 | 6.875% | | 68,000 | 70,473 |
| 04/01/2026 | 6.375% | | 25,000 | 26,306 |
| 08/15/2026 | 6.000% | | 50,000 | 51,944 |
| Caesars Resort Collection LLC/CRC Finco, Inc.(a) |
| 10/15/2025 | 5.250% | | 42,000 | 41,048 |
| Eldorado Resorts, Inc. |
| 04/01/2025 | 6.000% | | 71,000 | 73,417 |
| 09/15/2026 | 6.000% | | 45,000 | 46,814 |
| International Game Technology PLC(a) |
| 02/15/2022 | 6.250% | | 148,000 | 155,054 |
| 02/15/2025 | 6.500% | | 105,000 | 111,815 |
| 01/15/2027 | 6.250% | | 22,000 | 23,097 |
| Jack Ohio Finance LLC/1 Corp.(a) |
| 11/15/2021 | 6.750% | | 77,000 | 79,503 |
| MGM Growth Properties Operating Partnership LP/Finance Co-Issuer, Inc. |
| 05/01/2024 | 5.625% | | 21,000 | 22,083 |
| 09/01/2026 | 4.500% | | 27,000 | 26,727 |
| 01/15/2028 | 4.500% | | 24,000 | 23,177 |
| MGM Growth Properties Operating Partnership LP/Finance Co-Issuer, Inc.(a) |
| 02/01/2027 | 5.750% | | 49,000 | 51,517 |
| MGM Resorts International |
| 12/15/2021 | 6.625% | | 98,000 | 105,205 |
| 03/15/2023 | 6.000% | | 92,000 | 98,197 |
| Penn National Gaming, Inc.(a) |
| 01/15/2027 | 5.625% | | 53,000 | 52,345 |
| Rivers Pittsburgh Borrower LP/Finance Corp.(a) |
| 08/15/2021 | 6.125% | | 73,000 | 74,022 |
| Scientific Games International, Inc. |
| 12/01/2022 | 10.000% | | 69,000 | 72,785 |
| Scientific Games International, Inc.(a) |
| 10/15/2025 | 5.000% | | 125,000 | 124,472 |
| 03/15/2026 | 8.250% | | 119,000 | 123,077 |
| Stars Group Holdings BV/Co-Borrower LLC(a) |
| 07/15/2026 | 7.000% | | 33,000 | 34,593 |
| Wynn Las Vegas LLC/Capital Corp.(a) |
| 03/01/2025 | 5.500% | | 43,000 | 43,467 |
| Total | 1,531,138 |
| Health Care 1.2% |
| Acadia Healthcare Co., Inc. |
| 07/01/2022 | 5.125% | | 32,000 | 32,275 |
| 02/15/2023 | 5.625% | | 33,000 | 33,331 |
| 03/01/2024 | 6.500% | | 39,000 | 40,270 |
| Avantor, Inc.(a) |
| 10/01/2025 | 9.000% | | 84,000 | 91,355 |
| Corporate Bonds & Notes (continued) |
| Issuer | Coupon
Rate | | Principal
Amount ($) | Value ($) |
| Change Healthcare Holdings LLC/Finance, Inc.(a) |
| 03/01/2025 | 5.750% | | 94,000 | 93,223 |
| Charles River Laboratories International, Inc.(a) |
| 04/01/2026 | 5.500% | | 25,000 | 26,306 |
| CHS/Community Health Systems, Inc. |
| 03/31/2023 | 6.250% | | 68,000 | 66,205 |
| DaVita, Inc. |
| 07/15/2024 | 5.125% | | 52,000 | 52,016 |
| 05/01/2025 | 5.000% | | 15,000 | 14,698 |
| HCA Healthcare, Inc. |
| Junior Subordinated |
| 02/15/2021 | 6.250% | | 163,000 | 170,946 |
| HCA, Inc. |
| 02/01/2025 | 5.375% | | 137,000 | 144,158 |
| 02/15/2026 | 5.875% | | 40,000 | 43,092 |
| 09/01/2028 | 5.625% | | 45,000 | 47,920 |
| 02/01/2029 | 5.875% | | 44,000 | 47,298 |
| Hill-Rom Holdings, Inc.(a) |
| 02/15/2025 | 5.000% | | 42,000 | 42,735 |
| Hologic, Inc.(a) |
| 10/15/2025 | 4.375% | | 15,000 | 14,881 |
| IQVIA, Inc.(a) |
| 05/15/2023 | 4.875% | | 42,000 | 42,618 |
| MPH Acquisition Holdings LLC(a) |
| 06/01/2024 | 7.125% | | 140,000 | 140,609 |
| Polaris Intermediate Corp. PIK(a) |
| 12/01/2022 | 8.500% | | 14,000 | 13,981 |
| Sotera Health Holdings LLC(a) |
| 05/15/2023 | 6.500% | | 129,000 | 130,351 |
| Teleflex, Inc. |
| 06/01/2026 | 4.875% | | 12,000 | 12,272 |
| Tenet Healthcare Corp. |
| 04/01/2021 | 4.500% | | 135,000 | 136,834 |
| 04/01/2022 | 8.125% | | 27,000 | 28,832 |
| 06/15/2023 | 6.750% | | 26,000 | 26,520 |
| 07/15/2024 | 4.625% | | 87,000 | 87,226 |
| 05/01/2025 | 5.125% | | 71,000 | 71,620 |
| 08/01/2025 | 7.000% | | 59,000 | 59,729 |
| Tenet Healthcare Corp.(a) |
| 02/01/2027 | 6.250% | | 83,000 | 86,515 |
| Total | 1,797,816 |
| Healthcare Insurance 0.2% |
| Centene Corp. |
| 02/15/2024 | 6.125% | | 126,000 | 131,969 |
| Centene Corp.(a) |
| 06/01/2026 | 5.375% | | 120,000 | 125,009 |
The accompanying Notes to Financial Statements are an integral part of this statement.
| 16 | Columbia Multi-Asset Income Fund | Annual Report 2019 |
Portfolio of Investments (continued)
April 30, 2019
| Corporate Bonds & Notes (continued) |
| Issuer | Coupon
Rate | | Principal
Amount ($) | Value ($) |
| WellCare Health Plans, Inc. |
| 04/01/2025 | 5.250% | | 98,000 | 101,205 |
| Total | 358,183 |
| Home Construction 0.4% |
| Lennar Corp. |
| 04/30/2024 | 4.500% | | 137,000 | 139,602 |
| 11/15/2024 | 5.875% | | 121,000 | 130,380 |
| Meritage Homes Corp. |
| 04/01/2022 | 7.000% | | 72,000 | 77,400 |
| 06/01/2025 | 6.000% | | 59,000 | 62,702 |
| 06/06/2027 | 5.125% | | 28,000 | 27,766 |
| Shea Homes LP/Funding Corp.(a) |
| 04/01/2023 | 5.875% | | 11,000 | 10,998 |
| Taylor Morrison Communities, Inc./Holdings II(a) |
| 04/15/2021 | 5.250% | | 59,000 | 59,148 |
| 04/15/2023 | 5.875% | | 24,000 | 24,722 |
| TRI Pointe Group, Inc./Homes |
| 06/15/2024 | 5.875% | | 4,000 | 4,059 |
| Total | 536,777 |
| Independent Energy 1.2% |
| California Resources Corp.(a) |
| 12/15/2022 | 8.000% | | 27,000 | 20,560 |
| Callon Petroleum Co. |
| 10/01/2024 | 6.125% | | 20,000 | 20,557 |
| 07/01/2026 | 6.375% | | 134,000 | 137,250 |
| Carrizo Oil & Gas, Inc. |
| 04/15/2023 | 6.250% | | 125,000 | 121,628 |
| Centennial Resource Production LLC(a) |
| 01/15/2026 | 5.375% | | 29,000 | 28,517 |
| 04/01/2027 | 6.875% | | 60,000 | 62,277 |
| Chesapeake Energy Corp. |
| 10/01/2026 | 7.500% | | 88,000 | 86,344 |
| CrownRock LP/Finance, Inc.(a) |
| 10/15/2025 | 5.625% | | 155,000 | 153,474 |
| Endeavor Energy Resources LP/Finance, Inc.(a) |
| 01/30/2028 | 5.750% | | 37,000 | 39,634 |
| Extraction Oil & Gas, Inc.(a) |
| 05/15/2024 | 7.375% | | 43,000 | 39,671 |
| 02/01/2026 | 5.625% | | 20,000 | 16,435 |
| Halcon Resources Corp. |
| 02/15/2025 | 6.750% | | 91,000 | 58,419 |
| Indigo Natural Resources LLC(a) |
| 02/15/2026 | 6.875% | | 47,000 | 43,642 |
| Jagged Peak Energy LLC |
| 05/01/2026 | 5.875% | | 72,000 | 72,599 |
| Corporate Bonds & Notes (continued) |
| Issuer | Coupon
Rate | | Principal
Amount ($) | Value ($) |
| Laredo Petroleum, Inc. |
| 03/15/2023 | 6.250% | | 33,000 | 30,489 |
| Matador Resources Co. |
| 09/15/2026 | 5.875% | | 85,000 | 85,816 |
| MEG Energy Corp.(a) |
| 01/15/2025 | 6.500% | | 19,000 | 19,176 |
| Parsley Energy LLC/Finance Corp.(a) |
| 06/01/2024 | 6.250% | | 31,000 | 32,242 |
| 01/15/2025 | 5.375% | | 49,000 | 49,841 |
| 08/15/2025 | 5.250% | | 72,000 | 72,983 |
| 10/15/2027 | 5.625% | | 96,000 | 98,929 |
| PDC Energy, Inc. |
| 09/15/2024 | 6.125% | | 76,000 | 77,147 |
| 05/15/2026 | 5.750% | | 17,000 | 17,013 |
| QEP Resources, Inc. |
| 03/01/2026 | 5.625% | | 41,000 | 38,440 |
| Range Resources Corp. |
| 08/15/2022 | 5.000% | | 52,000 | 51,550 |
| SM Energy Co. |
| 06/01/2025 | 5.625% | | 19,000 | 17,905 |
| 09/15/2026 | 6.750% | | 107,000 | 102,748 |
| 01/15/2027 | 6.625% | | 15,000 | 14,240 |
| WPX Energy, Inc. |
| 01/15/2022 | 6.000% | | 32,000 | 33,425 |
| 09/15/2024 | 5.250% | | 80,000 | 82,599 |
| 06/01/2026 | 5.750% | | 43,000 | 44,551 |
| Total | 1,770,101 |
| Leisure 0.2% |
| Boyne U.S.A., Inc.(a) |
| 05/01/2025 | 7.250% | | 43,000 | 46,492 |
| Cedar Fair LP/Canada’s Wonderland Co./Magnum Management Corp./Millennium Op |
| 04/15/2027 | 5.375% | | 57,000 | 58,140 |
| Live Nation Entertainment, Inc.(a) |
| 06/15/2022 | 5.375% | | 29,000 | 29,420 |
| 11/01/2024 | 4.875% | | 41,000 | 41,857 |
| 03/15/2026 | 5.625% | | 24,000 | 25,020 |
| LTF Merger Sub, Inc.(a) |
| 06/15/2023 | 8.500% | | 37,000 | 38,057 |
| Viking Cruises Ltd.(a) |
| 09/15/2027 | 5.875% | | 61,000 | 60,909 |
| Total | 299,895 |
| Lodging 0.2% |
| Grupo Posadas SAB de CV(a) |
| 06/30/2022 | 7.875% | | 200,000 | 197,771 |
| Hilton Domestic Operating Co., Inc. |
| 09/01/2024 | 4.250% | | 35,000 | 35,096 |
The accompanying Notes to Financial Statements are an integral part of this statement.
Columbia Multi-Asset Income Fund | Annual Report 2019
| 17 |
Portfolio of Investments (continued)
April 30, 2019
| Corporate Bonds & Notes (continued) |
| Issuer | Coupon
Rate | | Principal
Amount ($) | Value ($) |
| Hilton Domestic Operating Co., Inc.(a) |
| 05/01/2026 | 5.125% | | 19,000 | 19,464 |
| Marriott Ownership Resorts, Inc.(a) |
| 09/15/2026 | 6.500% | | 14,000 | 14,706 |
| Total | 267,037 |
| Media and Entertainment 0.6% |
| Clear Channel Worldwide Holdings, Inc.(a) |
| 02/15/2024 | 9.250% | | 156,000 | 167,891 |
| Lamar Media Corp. |
| 01/15/2024 | 5.375% | | 44,000 | 45,103 |
| Match Group, Inc. |
| 06/01/2024 | 6.375% | | 85,000 | 89,279 |
| Netflix, Inc. |
| 02/15/2025 | 5.875% | | 49,000 | 52,861 |
| 04/15/2028 | 4.875% | | 177,000 | 176,090 |
| 11/15/2028 | 5.875% | | 118,000 | 124,468 |
| Netflix, Inc.(a) |
| 05/15/2029 | 6.375% | | 32,000 | 34,959 |
| 11/15/2029 | 5.375% | | 92,000 | 93,266 |
| Outfront Media Capital LLC/Corp. |
| 02/15/2024 | 5.625% | | 72,000 | 74,145 |
| 03/15/2025 | 5.875% | | 53,000 | 55,015 |
| Total | 913,077 |
| Metals and Mining 0.7% |
| Big River Steel LLC/Finance Corp.(a) |
| 09/01/2025 | 7.250% | | 71,000 | 75,365 |
| Constellium NV(a) |
| 03/01/2025 | 6.625% | | 48,000 | 49,936 |
| 02/15/2026 | 5.875% | | 142,000 | 144,485 |
| Freeport-McMoRan, Inc. |
| 03/01/2022 | 3.550% | | 19,000 | 18,839 |
| 11/14/2024 | 4.550% | | 166,000 | 164,839 |
| 03/15/2043 | 5.450% | | 146,000 | 131,756 |
| HudBay Minerals, Inc.(a) |
| 01/15/2023 | 7.250% | | 47,000 | 48,880 |
| 01/15/2025 | 7.625% | | 116,000 | 121,025 |
| Novelis Corp.(a) |
| 08/15/2024 | 6.250% | | 30,000 | 31,283 |
| 09/30/2026 | 5.875% | | 175,000 | 177,899 |
| Teck Resources Ltd.(a) |
| 06/01/2024 | 8.500% | | 48,000 | 51,370 |
| Total | 1,015,677 |
| Midstream 1.1% |
| Antero Midstream Partners LP/Finance Corp.(a) |
| 03/01/2027 | 5.750% | | 68,000 | 69,390 |
| Corporate Bonds & Notes (continued) |
| Issuer | Coupon
Rate | | Principal
Amount ($) | Value ($) |
| Cheniere Corpus Christi Holdings LLC |
| 06/30/2027 | 5.125% | | 64,000 | 66,707 |
| Cheniere Energy Partners LP(a) |
| 10/01/2026 | 5.625% | | 83,000 | 85,753 |
| DCP Midstream Operating LP |
| 07/15/2025 | 5.375% | | 70,000 | 73,540 |
| 04/01/2044 | 5.600% | | 41,000 | 38,978 |
| Delek Logistics Partners LP/Finance Corp. |
| 05/15/2025 | 6.750% | | 55,000 | 55,233 |
| Holly Energy Partners LP/Finance Corp.(a) |
| 08/01/2024 | 6.000% | | 143,000 | 149,270 |
| NGPL PipeCo LLC(a) |
| 08/15/2022 | 4.375% | | 25,000 | 25,601 |
| 08/15/2027 | 4.875% | | 31,000 | 31,995 |
| 12/15/2037 | 7.768% | | 25,000 | 30,692 |
| NuStar Logistics LP |
| 04/28/2027 | 5.625% | | 58,000 | 58,082 |
| Rockpoint Gas Storage Canada Ltd.(a) |
| 03/31/2023 | 7.000% | | 74,000 | 73,883 |
| Star Energy Geothermal Wayang Windu Ltd.(a) |
| 04/24/2033 | 6.750% | | 191,600 | 191,081 |
| Sunoco LP/Finance Corp. |
| 01/15/2023 | 4.875% | | 27,000 | 27,437 |
| 02/15/2026 | 5.500% | | 75,000 | 76,402 |
| Tallgrass Energy Partners LP/Finance Corp.(a) |
| 09/15/2024 | 5.500% | | 14,000 | 14,479 |
| 01/15/2028 | 5.500% | | 66,000 | 67,227 |
| Targa Resources Partners LP/Finance Corp. |
| 11/15/2023 | 4.250% | | 32,000 | 32,005 |
| 02/01/2027 | 5.375% | | 135,000 | 137,700 |
| 01/15/2028 | 5.000% | | 203,000 | 199,314 |
| Targa Resources Partners LP/Finance Corp.(a) |
| 07/15/2027 | 6.500% | | 15,000 | 16,074 |
| 01/15/2029 | 6.875% | | 69,000 | 74,701 |
| TransMontaigne Partners LP/TLP Finance Corp. |
| 02/15/2026 | 6.125% | | 79,000 | 76,241 |
| Total | 1,671,785 |
| Oil Field Services 0.4% |
| Apergy Corp. |
| 05/01/2026 | 6.375% | | 84,000 | 86,788 |
| Calfrac Holdings LP(a) |
| 06/15/2026 | 8.500% | | 38,000 | 31,920 |
| Diamond Offshore Drilling, Inc. |
| 08/15/2025 | 7.875% | | 30,000 | 29,341 |
| Nabors Industries, Inc. |
| 02/01/2025 | 5.750% | | 145,000 | 131,956 |
The accompanying Notes to Financial Statements are an integral part of this statement.
| 18 | Columbia Multi-Asset Income Fund | Annual Report 2019 |
Portfolio of Investments (continued)
April 30, 2019
| Corporate Bonds & Notes (continued) |
| Issuer | Coupon
Rate | | Principal
Amount ($) | Value ($) |
| Rowan Companies, Inc. |
| 01/15/2024 | 4.750% | | 41,000 | 34,048 |
| SESI LLC |
| 09/15/2024 | 7.750% | | 68,000 | 50,127 |
| Transocean Guardian Ltd.(a) |
| 01/15/2024 | 5.875% | | 22,680 | 23,247 |
| Transocean Pontus Ltd.(a) |
| 08/01/2025 | 6.125% | | 17,955 | 18,450 |
| Transocean Poseidon Ltd.(a) |
| 02/01/2027 | 6.875% | | 25,000 | 26,621 |
| Transocean, Inc.(a) |
| 01/15/2026 | 7.500% | | 27,000 | 26,691 |
| USA Compression Partners LP/Finance Corp. |
| 04/01/2026 | 6.875% | | 63,000 | 66,239 |
| Weatherford International Ltd. |
| 06/15/2021 | 7.750% | | 44,000 | 38,704 |
| 06/15/2023 | 8.250% | | 12,000 | 8,455 |
| Total | 572,587 |
| Other Financial Institutions 0.0% |
| Icahn Enterprises LP/Finance Corp. |
| 02/01/2022 | 6.250% | | 33,000 | 33,945 |
| Other Industry 0.1% |
| KAR Auction Services, Inc.(a) |
| 06/01/2025 | 5.125% | | 90,000 | 90,352 |
| WeWork Companies, Inc.(a) |
| 05/01/2025 | 7.875% | | 37,000 | 36,566 |
| Total | 126,918 |
| Other REIT 0.1% |
| CyrusOne LP/Finance Corp. |
| 03/15/2024 | 5.000% | | 42,000 | 43,064 |
| 03/15/2027 | 5.375% | | 103,000 | 106,863 |
| Total | 149,927 |
| Packaging 0.6% |
| Ardagh Packaging Finance PLC/Holdings U.S.A., Inc.(a) |
| 05/15/2023 | 4.625% | | 39,000 | 39,445 |
| 05/15/2024 | 7.250% | | 137,000 | 144,522 |
| 02/15/2025 | 6.000% | | 92,000 | 92,858 |
| Berry Global, Inc. |
| 05/15/2022 | 5.500% | | 30,000 | 30,411 |
| 10/15/2022 | 6.000% | | 57,000 | 58,788 |
| 07/15/2023 | 5.125% | | 116,000 | 118,045 |
| BWAY Holding Co.(a) |
| 04/15/2024 | 5.500% | | 90,000 | 89,319 |
| Flex Acquisition Co., Inc.(a) |
| 07/15/2026 | 7.875% | | 48,000 | 45,050 |
| Corporate Bonds & Notes (continued) |
| Issuer | Coupon
Rate | | Principal
Amount ($) | Value ($) |
| Novolex(a) |
| 01/15/2025 | 6.875% | | 23,000 | 21,568 |
| Owens-Brockway Glass Container, Inc.(a) |
| 01/15/2025 | 5.375% | | 24,000 | 24,587 |
| Reynolds Group Issuer, Inc./LLC |
| 10/15/2020 | 5.750% | | 87,220 | 87,454 |
| 02/15/2021 | 6.875% | | 16,287 | 16,336 |
| Reynolds Group Issuer, Inc./LLC(a) |
| 07/15/2024 | 7.000% | | 99,000 | 102,314 |
| Total | 870,697 |
| Pharmaceuticals 0.5% |
| Bausch Health Companies, Inc.(a) |
| 03/15/2024 | 7.000% | | 19,000 | 20,030 |
| 04/15/2025 | 6.125% | | 285,000 | 288,273 |
| 11/01/2025 | 5.500% | | 50,000 | 51,312 |
| 04/01/2026 | 9.250% | | 49,000 | 54,526 |
| 01/31/2027 | 8.500% | | 63,000 | 68,729 |
| Catalent Pharma Solutions, Inc.(a) |
| 01/15/2026 | 4.875% | | 45,000 | 45,106 |
| Jaguar Holding Co. II/Pharmaceutical Product Development LLC(a) |
| 08/01/2023 | 6.375% | | 120,000 | 122,393 |
| Par Pharmaceutical, Inc.(a) |
| 04/01/2027 | 7.500% | | 57,000 | 59,199 |
| Total | 709,568 |
| Property & Casualty 0.1% |
| Acrisure LLC/Finance, Inc.(a) |
| 02/15/2024 | 8.125% | | 20,000 | 20,883 |
| Alliant Holdings Intermediate LLC/Co-Issuer(a) |
| 08/01/2023 | 8.250% | | 42,000 | 43,155 |
| HUB International Ltd.(a) |
| 05/01/2026 | 7.000% | | 92,000 | 92,750 |
| Total | 156,788 |
| Railroads 0.1% |
| BNSF Funding Trust I(e) |
| Junior Subordinated |
| 12/15/2055 | 6.613% | | 155,000 | 168,476 |
| Restaurants 0.2% |
| 1011778 BC ULC/New Red Finance, Inc.(a) |
| 01/15/2022 | 4.625% | | 76,000 | 76,317 |
| 05/15/2024 | 4.250% | | 138,000 | 136,087 |
| IRB Holding Corp.(a) |
| 02/15/2026 | 6.750% | | 90,000 | 89,329 |
| KFC Holding Co./Pizza Hut Holdings LLC/Taco Bell of America LLC(a) |
| 06/01/2026 | 5.250% | | 56,000 | 57,737 |
| Total | 359,470 |
The accompanying Notes to Financial Statements are an integral part of this statement.
Columbia Multi-Asset Income Fund | Annual Report 2019
| 19 |
Portfolio of Investments (continued)
April 30, 2019
| Corporate Bonds & Notes (continued) |
| Issuer | Coupon
Rate | | Principal
Amount ($) | Value ($) |
| Retailers 0.3% |
| Cencosud SA(a) |
| 02/12/2045 | 6.625% | | 200,000 | 204,519 |
| Hanesbrands, Inc.(a) |
| 05/15/2024 | 4.625% | | 27,000 | 27,255 |
| 05/15/2026 | 4.875% | | 27,000 | 27,022 |
| L Brands, Inc. |
| 11/01/2035 | 6.875% | | 48,000 | 42,754 |
| Party City Holdings, Inc.(a) |
| 08/15/2023 | 6.125% | | 8,000 | 8,119 |
| 08/01/2026 | 6.625% | | 24,000 | 23,766 |
| PetSmart, Inc.(a) |
| 06/01/2025 | 5.875% | | 51,000 | 46,224 |
| Total | 379,659 |
| Supermarkets 0.0% |
| Albertsons Companies LLC/Safeway, Inc.(a) |
| 03/15/2026 | 7.500% | | 35,000 | 37,276 |
| Albertsons Companies LLC/Safeway, Inc./New Albertsons LP |
| 03/15/2025 | 5.750% | | 28,000 | 27,807 |
| Total | 65,083 |
| Technology 1.8% |
| Ascend Learning LLC(a) |
| 08/01/2025 | 6.875% | | 51,000 | 51,878 |
| 08/01/2025 | 6.875% | | 47,000 | 47,812 |
| Camelot Finance SA(a) |
| 10/15/2024 | 7.875% | | 208,000 | 219,126 |
| CDK Global, Inc. |
| 06/01/2027 | 4.875% | | 100,000 | 101,006 |
| CommScope Finance LLC(a) |
| 03/01/2024 | 5.500% | | 43,000 | 44,843 |
| 03/01/2026 | 6.000% | | 65,000 | 68,861 |
| 03/01/2027 | 8.250% | | 26,000 | 28,145 |
| CommScope Technologies LLC(a) |
| 06/15/2025 | 6.000% | | 89,000 | 90,486 |
| 03/15/2027 | 5.000% | | 35,000 | 33,014 |
| Dun & Bradstreet Corp. (The)(a) |
| 08/15/2026 | 6.875% | | 38,000 | 39,525 |
| Ensemble S Merger Sub, Inc.(a) |
| 09/30/2023 | 9.000% | | 20,000 | 20,802 |
| Equinix, Inc. |
| 01/01/2022 | 5.375% | | 120,000 | 123,191 |
| 01/15/2026 | 5.875% | | 130,000 | 137,338 |
| 05/15/2027 | 5.375% | | 20,000 | 21,161 |
| Corporate Bonds & Notes (continued) |
| Issuer | Coupon
Rate | | Principal
Amount ($) | Value ($) |
| First Data Corp.(a) |
| 08/15/2023 | 5.375% | | 60,000 | 61,348 |
| 01/15/2024 | 5.000% | | 48,000 | 49,197 |
| 01/15/2024 | 5.750% | | 183,000 | 188,704 |
| Gartner, Inc.(a) |
| 04/01/2025 | 5.125% | | 132,000 | 135,359 |
| Informatica LLC(a) |
| 07/15/2023 | 7.125% | | 75,000 | 76,679 |
| Iron Mountain, Inc. |
| 08/15/2024 | 5.750% | | 96,000 | 96,662 |
| MSCI, Inc.(a) |
| 11/15/2024 | 5.250% | | 70,000 | 72,282 |
| NCR Corp. |
| 07/15/2022 | 5.000% | | 44,000 | 44,266 |
| 12/15/2023 | 6.375% | | 98,000 | 100,666 |
| PTC, Inc. |
| 05/15/2024 | 6.000% | | 72,000 | 75,399 |
| Qualitytech LP/QTS Finance Corp.(a) |
| 11/15/2025 | 4.750% | | 110,000 | 107,321 |
| Refinitiv US Holdings, Inc.(a) |
| 11/15/2026 | 8.250% | | 120,000 | 121,776 |
| Sensata Technologies UK Financing Co. PLC(a) |
| 02/15/2026 | 6.250% | | 85,000 | 90,493 |
| Symantec Corp.(a) |
| 04/15/2025 | 5.000% | | 133,000 | 135,458 |
| Tempo Acquisition LLC/Finance Corp.(a) |
| 06/01/2025 | 6.750% | | 57,000 | 58,273 |
| VeriSign, Inc. |
| 05/01/2023 | 4.625% | | 104,000 | 105,632 |
| 07/15/2027 | 4.750% | | 43,000 | 43,893 |
| Verscend Escrow Corp.(a) |
| 08/15/2026 | 9.750% | | 71,000 | 75,467 |
| Total | 2,666,063 |
| Transportation Services 0.2% |
| Avis Budget Car Rental LLC/Finance, Inc.(a) |
| 03/15/2025 | 5.250% | | 101,000 | 100,231 |
| Hertz Corp. (The)(a) |
| 06/01/2022 | 7.625% | | 116,000 | 119,827 |
| XPO Logistics, Inc.(a) |
| 06/15/2022 | 6.500% | | 42,000 | 42,883 |
| Total | 262,941 |
| Wireless 1.1% |
| Altice France SA(a) |
| 05/01/2026 | 7.375% | | 265,000 | 268,925 |
| 02/01/2027 | 8.125% | | 58,000 | 60,494 |
The accompanying Notes to Financial Statements are an integral part of this statement.
| 20 | Columbia Multi-Asset Income Fund | Annual Report 2019 |
Portfolio of Investments (continued)
April 30, 2019
| Corporate Bonds & Notes (continued) |
| Issuer | Coupon
Rate | | Principal
Amount ($) | Value ($) |
| Altice Luxembourg SA(a) |
| 05/15/2022 | 7.750% | | 45,000 | 45,830 |
| SBA Communications Corp. |
| 09/01/2024 | 4.875% | | 226,000 | 229,832 |
| Sprint Communications, Inc.(a) |
| 03/01/2020 | 7.000% | | 158,000 | 162,339 |
| Sprint Corp. |
| 06/15/2024 | 7.125% | | 242,000 | 242,897 |
| 02/15/2025 | 7.625% | | 53,000 | 53,538 |
| 03/01/2026 | 7.625% | | 59,000 | 59,012 |
| T-Mobile U.S.A., Inc. |
| 03/01/2025 | 6.375% | | 87,000 | 90,480 |
| 01/15/2026 | 6.500% | | 145,000 | 155,071 |
| 02/01/2026 | 4.500% | | 50,000 | 50,304 |
| 02/01/2028 | 4.750% | | 62,000 | 62,605 |
| Wind Tre SpA(a) |
| 01/20/2026 | 5.000% | | 145,000 | 133,499 |
| Total | 1,614,826 |
| Wirelines 0.6% |
| CenturyLink, Inc. |
| 03/15/2022 | 5.800% | | 86,000 | 88,488 |
| 04/01/2025 | 5.625% | | 189,000 | 186,064 |
| Frontier Communications Corp. |
| 09/15/2022 | 10.500% | | 26,000 | 18,947 |
| 01/15/2023 | 7.125% | | 55,000 | 34,305 |
| 09/15/2025 | 11.000% | | 47,000 | 30,471 |
| Frontier Communications Corp.(a) |
| 04/01/2026 | 8.500% | | 42,000 | 39,640 |
| Level 3 Financing, Inc. |
| 08/15/2022 | 5.375% | | 100,000 | 100,428 |
| Liquid Telecommunications Financing PLC(a) |
| 07/13/2022 | 8.500% | | 200,000 | 202,640 |
| Telecom Italia Capital SA |
| 09/30/2034 | 6.000% | | 47,000 | 43,519 |
| Telecom Italia SpA(a) |
| 05/30/2024 | 5.303% | | 23,000 | 22,970 |
| Zayo Group LLC/Capital, Inc.(a) |
| 01/15/2027 | 5.750% | | 149,000 | 151,165 |
| Total | 918,637 |
Total Corporate Bonds & Notes
(Cost $30,023,695) | 30,385,448 |
| Equity-Linked Notes 18.8% |
| Issuer | Coupon
Rate | Shares | Value ($) |
| Barclays Bank PLC(a),(g) |
| (linked to a basket of common stocks) |
| 06/13/2019 | 17.320% | 4,545 | 4,515,831 |
| Citigroup Global Markets Holdings, Inc.(a),(g) |
| (linked to a basket of common stocks) |
| 08/08/2019 | 14.480% | 45,980 | 4,616,157 |
| Credit Suisse AG(a),(g) |
| (linked to a basket of common stocks) |
| 10/04/2019 | 12.600% | 4,768 | 4,810,435 |
| Morgan Stanley BV(a),(g) |
| (linked to a basket of common stocks) |
| 05/07/2019 | 16.611% | 4,566 | 4,377,642 |
| UBS AG(a),(g) |
| (linked to a basket of common stocks) |
| 07/17/2019 | 15.480% | 4,484 | 4,499,605 |
| Wells Fargo Bank NA(a),(g) |
| (linked to a basket of common stocks) |
| 09/11/2019 | 15.060% | 4,707 | 4,738,223 |
Total Equity-Linked Notes
(Cost $27,668,000) | 27,557,893 |
| Exchange-Traded Funds 17.3% |
| | Shares | Value ($) |
| Invesco S&P 500 High Dividend Low Volatility ETF | 116,091 | 4,951,281 |
| iShares US Preferred Stock ETF | 147,716 | 5,409,360 |
| SPDR Blackstone/GSO Senior Loan ETF | 133,208 | 6,240,795 |
| SPDR Bloomberg Barclays Convertible Securities ETF | 107,580 | 5,755,530 |
| SPDR Portfolio Long Term Corporate Bond ETF | 112,902 | 3,069,805 |
Total Exchange-Traded Funds
(Cost $25,081,217) | 25,426,771 |
| Foreign Government Obligations(h) 10.8% |
| Issuer | Coupon
Rate | | Principal
Amount ($) | Value ($) |
| Angola 0.1% |
| Angolan Government International Bond(a) |
| 05/09/2028 | 8.250% | | 200,000 | 209,204 |
| Argentina 0.8% |
| Argentine Republic Government International Bond |
| 04/22/2021 | 6.875% | | 200,000 | 168,165 |
| 04/22/2026 | 7.500% | | 200,000 | 150,509 |
| 01/26/2027 | 6.875% | | 200,000 | 144,518 |
| Autonomous City of Buenos Aires Argentina(a) |
| 06/01/2027 | 7.500% | | 250,000 | 201,241 |
The accompanying Notes to Financial Statements are an integral part of this statement.
Columbia Multi-Asset Income Fund | Annual Report 2019
| 21 |
Portfolio of Investments (continued)
April 30, 2019
| Foreign Government Obligations(h) (continued) |
| Issuer | Coupon
Rate | | Principal
Amount ($) | Value ($) |
| Provincia de Buenos Aires(a) |
| 03/16/2024 | 9.125% | | 295,000 | 221,472 |
| 06/15/2027 | 7.875% | | 200,000 | 133,222 |
| Provincia de Cordoba(a) |
| 06/10/2021 | 7.125% | | 150,000 | 119,963 |
| Total | 1,139,090 |
| Belarus 0.2% |
| Republic of Belarus International Bond(a) |
| 02/28/2030 | 6.200% | | 300,000 | 296,445 |
| Brazil 0.7% |
| Brazilian Government International Bond |
| 04/07/2026 | 6.000% | | 400,000 | 441,206 |
| 01/07/2041 | 5.625% | | 650,000 | 649,532 |
| Total | 1,090,738 |
| China 0.6% |
| State Grid Overseas Investment 2016 Ltd.(a) |
| 05/04/2027 | 3.500% | | 400,000 | 398,755 |
| Syngenta Finance NV(a) |
| 04/24/2028 | 5.182% | | 400,000 | 409,354 |
| Total | 808,109 |
| Colombia 0.2% |
| Ecopetrol SA |
| 01/16/2025 | 4.125% | | 100,000 | 100,899 |
| 06/26/2026 | 5.375% | | 200,000 | 213,988 |
| Total | 314,887 |
| Croatia 0.3% |
| Hrvatska Elektroprivreda(a) |
| 10/23/2022 | 5.875% | | 400,000 | 429,135 |
| Dominican Republic 0.9% |
| Banco de Reservas de la Republica Dominicana(a) |
| Subordinated |
| 02/01/2023 | 7.000% | | 150,000 | 154,182 |
| 02/01/2023 | 7.000% | | 150,000 | 154,181 |
| Dominican Republic International Bond(a) |
| 01/29/2026 | 6.875% | | 400,000 | 441,871 |
| 04/20/2027 | 8.625% | | 300,000 | 352,317 |
| 07/19/2028 | 6.000% | | 200,000 | 211,078 |
| Total | 1,313,629 |
| Egypt 0.5% |
| Egypt Government International Bond(a) |
| 01/31/2022 | 6.125% | | 200,000 | 202,323 |
| 01/31/2027 | 7.500% | | 300,000 | 309,482 |
| 02/21/2048 | 7.903% | | 200,000 | 193,300 |
| Total | 705,105 |
| Foreign Government Obligations(h) (continued) |
| Issuer | Coupon
Rate | | Principal
Amount ($) | Value ($) |
| Gabon 0.1% |
| Gabon Government International Bond(a) |
| 12/12/2024 | 6.375% | | 200,000 | 192,782 |
| Ghana 0.2% |
| Ghana Government International Bond(a) |
| 10/14/2030 | 10.750% | | 200,000 | 246,598 |
| Honduras 0.3% |
| Honduras Government International Bond(a) |
| 03/15/2024 | 7.500% | | 200,000 | 218,721 |
| 01/19/2027 | 6.250% | | 200,000 | 210,964 |
| Total | 429,685 |
| Hungary 0.1% |
| MFB Magyar Fejlesztesi Bank Zrt.(a) |
| 10/21/2020 | 6.250% | | 200,000 | 209,392 |
| Indonesia 0.9% |
| Perusahaan Listrik Negara PT(a) |
| 05/21/2048 | 6.150% | | 200,000 | 221,984 |
| PT Pertamina Persero(a) |
| 05/03/2022 | 4.875% | | 400,000 | 415,351 |
| 05/27/2041 | 6.500% | | 300,000 | 346,311 |
| PT Perusahaan Listrik Negara(a) |
| 11/22/2021 | 5.500% | | 300,000 | 315,470 |
| Total | 1,299,116 |
| Ivory Coast 0.4% |
| Ivory Coast Government International Bond(a) |
| 03/03/2028 | 6.375% | | 400,000 | 388,977 |
| 06/15/2033 | 6.125% | | 200,000 | 182,050 |
| Total | 571,027 |
| Kazakhstan 0.5% |
| Kazakhstan Government International Bond(a) |
| 07/21/2045 | 6.500% | | 200,000 | 260,296 |
| KazMunayGas National Co. JSC(a) |
| 04/24/2030 | 5.375% | | 400,000 | 426,310 |
| Total | 686,606 |
| Mexico 1.1% |
| Petroleos Mexicanos |
| 06/02/2041 | 6.500% | | 1,800,000 | 1,660,280 |
| Netherlands 0.1% |
| Petrobras Global Finance BV |
| 02/01/2029 | 5.750% | | 25,000 | 25,043 |
| 03/19/2049 | 6.900% | | 51,000 | 50,948 |
| Total | 75,991 |
The accompanying Notes to Financial Statements are an integral part of this statement.
| 22 | Columbia Multi-Asset Income Fund | Annual Report 2019 |
Portfolio of Investments (continued)
April 30, 2019
| Foreign Government Obligations(h) (continued) |
| Issuer | Coupon
Rate | | Principal
Amount ($) | Value ($) |
| Nigeria 0.1% |
| Nigeria Government International Bond(a) |
| 02/16/2032 | 7.875% | | 200,000 | 206,880 |
| Oman 0.2% |
| Oman Government International Bond(a) |
| 01/17/2028 | 5.625% | | 300,000 | 286,277 |
| Qatar 0.2% |
| Qatar Government International Bond(a) |
| 03/14/2049 | 4.817% | | 200,000 | 215,529 |
| Russian Federation 0.4% |
| Gazprom OAO Via Gaz Capital SA(a) |
| 02/06/2028 | 4.950% | | 200,000 | 203,646 |
| Russian Foreign Bond - Eurobond(a) |
| 04/04/2022 | 4.500% | | 400,000 | 413,855 |
| Total | 617,501 |
| Saudi Arabia 0.3% |
| Saudi Arabian Oil Co.(a) |
| 04/16/2049 | 4.375% | | 217,000 | 211,273 |
| Saudi Government International Bond(a) |
| 04/16/2029 | 4.375% | | 200,000 | 209,981 |
| Total | 421,254 |
| Senegal 0.3% |
| Senegal Government International Bond(a) |
| 07/30/2024 | 6.250% | | 200,000 | 209,189 |
| 05/23/2033 | 6.250% | | 220,000 | 212,044 |
| Total | 421,233 |
| South Africa 0.2% |
| Republic of South Africa Government International Bond |
| 06/22/2030 | 5.875% | | 300,000 | 307,271 |
| Sri Lanka 0.3% |
| Sri Lanka Government International Bond(a) |
| 05/11/2027 | 6.200% | | 400,000 | 377,280 |
| Trinidad and Tobago 0.2% |
| Petroleum Co. of Trinidad & Tobago Ltd.(a) |
| 08/14/2019 | 9.750% | | 250,000 | 245,037 |
| 08/14/2019 | 9.750% | | 100,000 | 98,015 |
| Total | 343,052 |
| Turkey 0.3% |
| Export Credit Bank of Turkey(a) |
| 09/23/2021 | 5.000% | | 300,000 | 281,929 |
| Foreign Government Obligations(h) (continued) |
| Issuer | Coupon
Rate | | Principal
Amount ($) | Value ($) |
| Turkey Government International Bond |
| 03/25/2027 | 6.000% | | 200,000 | 180,286 |
| Total | 462,215 |
| Ukraine 0.1% |
| Ukraine Government International Bond(a) |
| 09/01/2026 | 7.750% | | 200,000 | 186,269 |
| Venezuela 0.2% |
| Petroleos de Venezuela SA(a),(i) |
| 05/16/2024 | 0.000% | | 1,329,556 | 285,854 |
| 11/15/2026 | 0.000% | | 120,724 | 26,218 |
| Total | 312,072 |
Total Foreign Government Obligations
(Cost $16,424,430) | 15,834,652 |
|
| Residential Mortgage-Backed Securities - Agency 0.8% |
| | | | |
| Federal Home Loan Mortgage Corp.(b),(j) |
| CMO Series 326 Class S2 |
-1.0 x 1-month USD LIBOR + 5.950%
Cap 5.950%
03/15/2044 | 3.477% | | 1,901,242 | 314,061 |
| Federal Home Loan Mortgage Corp.(j) |
| CMO Series 4121 Class IA |
| 01/15/2041 | 3.500% | | 1,206,009 | 133,611 |
| Federal National Mortgage Association(j) |
| CMO Series 2012-121 Class GI |
| 08/25/2039 | 3.500% | | 216,618 | 24,424 |
| Federal National Mortgage Association(b),(j) |
| CMO Series 2013-101 Class CS |
-1.0 x 1-month USD LIBOR + 5.900%
Cap 5.900%
10/25/2043 | 3.423% | | 1,188,886 | 234,106 |
| CMO Series 2016-57 Class SA |
-1.0 x 1-month USD LIBOR + 6.000%
Cap 6.000%
08/25/2046 | 3.523% | | 350,561 | 64,729 |
| CMO Series 2017-51 Class SC |
-1.0 x 1-month USD LIBOR + 6.150%
Cap 6.150%
07/25/2047 | 3.673% | | 776,185 | 150,080 |
| Government National Mortgage Association(b),(j) |
| CMO Series 2017-129 Class SA |
-1.0 x 1-month USD LIBOR + 6.200%
Cap 6.200%
08/20/2047 | 3.719% | | 855,231 | 158,871 |
| CMO Series 2018-155 Class LS |
-1.0 x 1-month USD LIBOR + 6.150%
Cap 6.150%
11/20/2048 | 3.669% | | 493,990 | 79,467 |
The accompanying Notes to Financial Statements are an integral part of this statement.
Columbia Multi-Asset Income Fund | Annual Report 2019
| 23 |
Portfolio of Investments (continued)
April 30, 2019
| Residential Mortgage-Backed Securities - Agency (continued) |
| Issuer | Coupon
Rate | | Principal
Amount ($) | Value ($) |
| CMO Series 2018-94 Class SA |
-1.0 x 1-month USD LIBOR + 6.200%
Cap 6.200%
05/20/2048 | 3.719% | | 216,677 | 42,597 |
| CMO Series 2019-6 Class SA |
-1.0 x 1-month USD LIBOR + 6.050%
Cap 6.050%
01/20/2049 | 3.569% | | 272,792 | 42,299 |
Total Residential Mortgage-Backed Securities - Agency
(Cost $1,292,754) | 1,244,245 |
|
| Residential Mortgage-Backed Securities - Non-Agency 6.1% |
| | | | |
| Angel Oak Mortgage Trust I LLC(a) |
| CMO Series 2016-1 Class A1 |
| 07/25/2046 | 3.500% | | 119,175 | 120,940 |
| Angel Oak Mortgage Trust I LLC(a),(c) |
| CMO Series 2017-2 Class M1 |
| 07/25/2047 | 3.737% | | 500,000 | 501,147 |
| Bayview Opportunity Master Fund IVa Trust(a) |
| CMO Series 2018-RN6 Class A1 |
| 07/25/2033 | 4.090% | | 205,302 | 206,016 |
| CHL GMSR Issuer Trust(a),(b) |
| CMO Series 2018-GT1 Class A |
1-month USD LIBOR + 1.000%
05/25/2023 | 5.227% | | 300,000 | 300,373 |
| CIM Trust(a) |
| CMO Series 2017-8 Class A1 |
| 12/25/2065 | 3.000% | | 366,023 | 361,221 |
| CIM Trust(a),(c) |
| CMO Series 2018-R4 Class A1 |
| 12/26/2057 | 4.070% | | 440,428 | 442,407 |
| Citigroup Mortgage Loan Trust, Inc.(a),(c) |
| CMO Series 2013-11 Class 3A3 |
| 09/25/2034 | 4.223% | | 151,341 | 151,444 |
| CMO Series 2013-2 Class 1A3 |
| 11/25/2037 | 4.801% | | 242,684 | 242,666 |
| CMO Series 2014-C Class A |
| 02/25/2054 | 3.250% | | 496,275 | 491,141 |
| CMO Series 2015-A Class B3 |
| 06/25/2058 | 4.500% | | 225,897 | 222,960 |
| Citigroup Mortgage Loan Trust, Inc.(a),(j) |
| CMO Series 2015-A Class A1IO |
| 06/25/2058 | 1.000% | | 2,601,157 | 51,372 |
| COLT Mortgage Loan Trust(a) |
| CMO Series 2016-1 Class A2 |
| 05/25/2046 | 3.500% | | 58,219 | 57,917 |
| Deephaven Residential Mortgage Trust(a),(c) |
| Subordinated, CMO Series 2018-4A Class B1 |
| 10/25/2058 | 5.535% | | 200,000 | 209,990 |
| Residential Mortgage-Backed Securities - Non-Agency (continued) |
| Issuer | Coupon
Rate | | Principal
Amount ($) | Value ($) |
| Ellington Financial Mortgage Trust(a),(c),(k) |
| CMO Series 2018-1 Class M1 |
| 10/25/2058 | 4.874% | | 300,000 | 309,870 |
| Legacy Mortgage Asset Trust(a) |
| CMO Series 2017-GS1 Class A2 |
| 01/25/2057 | 3.500% | | 500,000 | 490,015 |
| NRZ Excess Spread-Collateralized Notes(a) |
| Series 2018-PLS1 Class D |
| 01/25/2023 | 4.374% | | 358,276 | 357,726 |
| Subordinated, CMO Series 2018-PLS2 Class D |
| 02/25/2023 | 4.593% | | 184,892 | 185,191 |
| Oak Hill Advisors Residential Loan Trust(a) |
| CMO Series 2017-NPL1 Class A1 |
| 06/25/2057 | 3.000% | | 198,683 | 195,498 |
| Oaktown Re Ltd.(a),(b) |
| CMO Series 2017-1A Class M1 |
1-month USD LIBOR + 2.250%
04/25/2027 | 4.727% | | 24,026 | 24,041 |
| PMT Credit Risk Transfer Trust(a),(b) |
| CMO Series 2019-1R Class A |
1-month USD LIBOR + 2.000%
Floor 2.000%
03/27/2024 | 4.484% | | 396,427 | 396,962 |
| PNMAC GMSR Issuer Trust(a),(b) |
| CMO Series 2018-GT1 Class A |
1-month USD LIBOR + 2.850%
Floor 2.850%
02/25/2023 | 5.327% | | 200,000 | 200,379 |
| CMO Series 2018-GT2 Class A |
1-month USD LIBOR + 2.650%
08/25/2025 | 5.127% | | 400,000 | 401,245 |
| Preston Ridge Partners Mortgage LLC(a) |
| CMO Series 2017-2A Class A2 |
| 09/25/2022 | 5.000% | | 500,000 | 500,229 |
| Preston Ridge Partners Mortgage LLC(a),(c) |
| CMO Series 2018-3A Class A1 |
| 10/25/2023 | 4.483% | | 186,684 | 188,384 |
| CMO Series 2019-1A Class A1 |
| 01/25/2024 | 4.500% | | 485,829 | 487,915 |
| Radnor Re Ltd.(a),(b) |
| CMO Series 2019-1 Class M1B |
1-month USD LIBOR + 1.950%
Floor 1.950%
02/25/2029 | 4.427% | | 250,000 | 250,819 |
| RBSSP Resecuritization Trust(a),(c) |
| CMO Series 2010-1 Class 3A2 |
| 08/26/2035 | 4.478% | | 162,459 | 163,654 |
| Toorak Mortgage Corp., Ltd.(a),(c) |
| CMO Series 2019-1 Class A1 |
| 03/25/2022 | 4.458% | | 500,000 | 501,888 |
The accompanying Notes to Financial Statements are an integral part of this statement.
| 24 | Columbia Multi-Asset Income Fund | Annual Report 2019 |
Portfolio of Investments (continued)
April 30, 2019
| Residential Mortgage-Backed Securities - Non-Agency (continued) |
| Issuer | Coupon
Rate | | Principal
Amount ($) | Value ($) |
| Vericrest Opportunity Loan Transferee LXXII LLC(a) |
| CMO Series 2018-NPL8 Class A1B |
| 10/26/2048 | 4.655% | | 250,000 | 251,977 |
| Verus Securitization Trust(a) |
| CMO Series 2017-SG1A Class A3 |
| 11/25/2047 | 2.825% | | 229,766 | 227,819 |
| CMO Series 2018-1 Class A2 |
| 02/25/2048 | 3.031% | | 274,162 | 273,217 |
| Verus Securitization Trust(a),(c) |
| CMO Series 2018-INV1 Class A1 |
| 03/25/2058 | 3.633% | | 188,682 | 191,000 |
Total Residential Mortgage-Backed Securities - Non-Agency
(Cost $8,925,097) | 8,957,423 |
|
| Senior Loans 0.6% |
| Borrower | Coupon
Rate | | Principal
Amount ($) | Value ($) |
| Chemicals 0.0% |
| Starfruit Finco BV/US Holdco LLC/AzkoNobel(b),(l) |
| Term Loan |
3-month USD LIBOR + 3.250%
10/01/2025 | 5.729% | | 56,000 | 55,755 |
| Finance Companies 0.1% |
| Ellie Mae, Inc.(b),(l),(m) |
| 1st Lien Term Loan |
3-month USD LIBOR + 4.000%
04/17/2026 | | | 67,000 | 67,294 |
| Food and Beverage 0.1% |
| 8th Avenue Food & Provisions, Inc.(b),(l),(m) |
| 1st Lien Term Loan |
3-month USD LIBOR + 3.750%
10/01/2025 | 6.229% | | 57,293 | 57,465 |
| 8th Avenue Food & Provisions, Inc.(b),(l) |
| 2nd Lien Term Loan |
3-month USD LIBOR + 7.750%
10/01/2026 | 10.229% | | 15,270 | 15,251 |
| Total | 72,716 |
| Health Care 0.0% |
| Avantor, Inc.(b),(l),(m) |
| Tranche B1 Term Loan |
3-month USD LIBOR + 3.750%
Floor 1.000%
11/21/2024 | 6.233% | | 12,668 | 12,722 |
| Senior Loans (continued) |
| Borrower | Coupon
Rate | | Principal
Amount ($) | Value ($) |
| Metals and Mining 0.0% |
| Big River Steel LLC(b),(l) |
| Term Loan |
3-month USD LIBOR + 5.000%
Floor 1.000%
08/23/2023 | 7.601% | | 13,088 | 13,170 |
| Packaging 0.0% |
| Reynolds Group Holdings, Inc.(b),(l) |
| Term Loan |
3-month USD LIBOR + 2.750%
Floor 1.000%
02/05/2023 | 5.233% | | 31,918 | 31,959 |
| Pharmaceuticals 0.0% |
| Bausch Health Companies, Inc.(b),(l) |
| Term Loan |
3-month USD LIBOR + 3.000%
06/02/2025 | 5.474% | | 18,500 | 18,573 |
| Property & Casualty 0.0% |
| HUB International Ltd.(b),(l) |
| Term Loan |
3-month USD LIBOR + 2.750%
04/25/2025 | 5.336% | | 21,835 | 21,595 |
| Technology 0.4% |
| Ascend Learning LLC(b),(l),(m) |
| Term Loan |
3-month USD LIBOR + 3.000%
Floor 1.000%
07/12/2024 | 5.483% | | 44,074 | 43,853 |
| CommScope, Inc.(b),(l) |
| Tranche B Term Loan |
3-month USD LIBOR + 3.250%
04/06/2026 | 5.733% | | 24,000 | 24,187 |
| Dun & Bradstreet Corp. (The)(b),(l) |
| Term Loan |
3-month USD LIBOR + 5.000%
02/06/2026 | 7.479% | | 55,000 | 55,378 |
| Greeneden US Holdings I LLC/Genesys Telecommunications Laboratories, Inc.(b),(l) |
| Tranche B3 Term Loan |
3-month USD LIBOR + 3.250%
12/01/2023 | 5.733% | | 29,924 | 29,962 |
| Hyland Software, Inc.(b),(l) |
| 1st Lien Term Loan |
3-month USD LIBOR + 3.500%
Floor 0.750%
07/01/2024 | 5.983% | | 15,185 | 15,246 |
The accompanying Notes to Financial Statements are an integral part of this statement.
Columbia Multi-Asset Income Fund | Annual Report 2019
| 25 |
Portfolio of Investments (continued)
April 30, 2019
| Senior Loans (continued) |
| Borrower | Coupon
Rate | | Principal
Amount ($) | Value ($) |
| Misys Ltd./Almonde/Tahoe/Finastra USA(b),(l) |
| 1st Lien Term Loan |
3-month USD LIBOR + 3.500%
Floor 1.000%
06/13/2024 | 6.101% | | 32,456 | 32,158 |
| Qlik Technologies, Inc.(b),(l),(m) |
| Term Loan |
3-month USD LIBOR + 3.500%
Floor 1.000%
04/26/2024 | 6.252% | | 16,817 | 16,701 |
3-month USD LIBOR + 4.250%
04/26/2024 | 6.883% | | 50,163 | 50,383 |
| Refinitiv US Holdings, Inc.(a),(b),(l) |
| Term Loan |
3-month USD LIBOR + 3.750%
10/01/2025 | 6.233% | | 206,188 | 203,869 |
| Tempo Acquisition LLC(b),(l),(m) |
| Term Loan |
3-month USD LIBOR + 3.000%
05/01/2024 | 5.483% | | 44,886 | 44,895 |
| Ultimate Software Group, Inc. (The)(b),(l),(m) |
| Tranche B Term Loan |
3-month USD LIBOR + 3.750%
04/08/2026 | | | 37,000 | 37,241 |
| Total | 553,873 |
Total Senior Loans
(Cost $842,935) | 847,657 |
|
| Treasury Bills 0.2% |
| Issuer | Effective
Yield | | Principal
Amount ($) | Value ($) |
| Argentina 0.2% |
| Argentina Treasury Bill |
| 09/27/2019 | 4.040% | | 290,000 | 285,268 |
Total Treasury Bills
(Cost $284,768) | 285,268 |
|
| U.S. Treasury Obligations 2.7% |
| Issuer | Coupon
Rate | | Principal
Amount ($) | Value ($) |
| U.S. Treasury |
| 02/15/2031 | 5.375% | | 23,000 | 29,578 |
| 02/15/2036 | 4.500% | | 57,000 | 71,096 |
| 02/15/2037 | 4.750% | | 33,000 | 42,623 |
| 02/15/2038 | 4.375% | | 30,000 | 37,338 |
| 02/15/2039 | 3.500% | | 236,000 | 262,846 |
| 11/15/2039 | 4.375% | | 284,000 | 354,840 |
| 02/15/2041 | 4.750% | | 23,000 | 30,213 |
| 08/15/2042 | 2.750% | | 527,000 | 514,447 |
| 05/15/2043 | 2.875% | | 361,000 | 359,158 |
| 05/15/2044 | 3.375% | | 419,000 | 453,370 |
| 08/15/2044 | 3.125% | | 163,000 | 169,025 |
| 11/15/2044 | 3.000% | | 163,000 | 165,403 |
| 02/15/2045 | 2.500% | | 94,000 | 86,767 |
| 02/15/2046 | 2.500% | | 840,000 | 772,578 |
| 08/15/2046 | 2.250% | | 67,000 | 58,359 |
| 11/15/2046 | 2.875% | | 20,000 | 19,804 |
| 02/15/2047 | 3.000% | | 65,000 | 65,946 |
| 05/15/2047 | 3.000% | | 37,000 | 37,499 |
| 08/15/2047 | 2.750% | | 91,000 | 87,680 |
| 11/15/2047 | 2.750% | | 41,000 | 39,491 |
| 02/15/2048 | 3.000% | | 66,000 | 66,774 |
| 05/15/2048 | 3.125% | | 42,000 | 43,530 |
| 08/15/2048 | 3.000% | | 77,000 | 77,919 |
| 11/15/2048 | 3.375% | | 72,000 | 78,329 |
Total U.S. Treasury Obligations
(Cost $4,174,052) | 3,924,613 |
| Money Market Funds 5.6% |
| | Shares | Value ($) |
| Columbia Short-Term Cash Fund, 2.519%(n),(o) | 8,171,584 | 8,170,766 |
Total Money Market Funds
(Cost $8,170,766) | 8,170,766 |
Total Investments in Securities
(Cost: $143,847,801) | 145,237,085 |
| Other Assets & Liabilities, Net | | 1,487,036 |
| Net Assets | 146,724,121 |
At April 30, 2019, securities and/or cash totaling $888,300 were pledged as collateral.
Investments in derivatives
| Long futures contracts |
| Description | Number of
contracts | Expiration
date | Trading
currency | Notional
amount | Value/Unrealized
appreciation ($) | Value/Unrealized
depreciation ($) |
| S&P 500 E-mini | 93 | 06/2019 | USD | 13,710,525 | 595,729 | — |
| U.S. Treasury 10-Year Note | 63 | 06/2019 | USD | 7,791,328 | 87,490 | — |
| U.S. Ultra Treasury Bond | 63 | 06/2019 | USD | 10,349,719 | 197,019 | — |
| Total | | | | | 880,238 | — |
The accompanying Notes to Financial Statements are an integral part of this statement.
| 26 | Columbia Multi-Asset Income Fund | Annual Report 2019 |
Portfolio of Investments (continued)
April 30, 2019
Notes to Portfolio of Investments
| (a) | Represents privately placed and other securities and instruments exempt from Securities and Exchange Commission registration (collectively, private placements), such as Section 4(a)(2) and Rule 144A eligible securities, which are often sold only to qualified institutional buyers. The Fund may invest in private placements determined to be liquid as well as those determined to be illiquid. Private placements may be determined to be liquid under guidelines established by the Fund’s Board of Trustees. At April 30, 2019, the total value of these securities amounted to $72,132,338, which represents 49.16% of total net assets. |
| (b) | Variable rate security. The interest rate shown was the current rate as of April 30, 2019. |
| (c) | Variable or floating rate security, the interest rate of which adjusts periodically based on changes in current interest rates and prepayments on the underlying pool of assets. The interest rate shown was the current rate as of April 30, 2019. |
| (d) | Non-income producing investment. |
| (e) | Represents a variable rate security with a step coupon where the rate adjusts according to a schedule for a series of periods, typically lower for an initial period and then increasing to a higher coupon rate thereafter. The interest rate shown was the current rate as of April 30, 2019. |
| (f) | Represents a security purchased on a when-issued basis. |
| (g) | By investing in the equity-linked note, the Fund gains exposure to the underlying investments that make up the custom basket without having to own the underlying investments directly. The components of the basket are available on the Columbia Multi-Asset Income Fund’s page of columbiathreadneedleus.com website. |
| (h) | Principal and interest may not be guaranteed by the government. |
| (i) | Represents securities that have defaulted on payment of interest. The Fund has stopped accruing interest on these securities. At April 30, 2019, the total value of these securities amounted to $312,072, which represents 0.21% of total net assets. |
| (j) | Represents interest only securities which have the right to receive the monthly interest payments on an underlying pool of mortgage loans. |
| (k) | Valuation based on significant unobservable inputs. |
| (l) | The stated interest rate represents the weighted average interest rate at April 30, 2019 of contracts within the senior loan facility. Interest rates on contracts are primarily determined either weekly, monthly or quarterly by reference to the indicated base lending rate and spread and the reset period. These base lending rates are primarily the London Interbank Offered Rate (“LIBOR”) and other short-term rates. Base lending rates may be subject to a floor or minimum rate. The interest rate for senior loans purchased on a when-issued or delayed delivery basis will be determined upon settlement, therefore no interest rate is disclosed. Senior loans often require prepayments from excess cash flows or permit the borrowers to repay at their election. The degree to which borrowers repay, cannot be predicted with accuracy. As a result, remaining maturities of senior loans may be less than the stated maturities. |
| (m) | Represents a security purchased on a forward commitment basis. |
| (n) | The rate shown is the seven-day current annualized yield at April 30, 2019. |
| (o) | As defined in the Investment Company Act of 1940, an affiliated company is one in which the Fund owns 5% or more of the company’s outstanding voting securities, or a company which is under common ownership or control with the Fund. Holdings and transactions in these affiliated companies during the year ended April 30, 2019 are as follows: |
| Issuer | Beginning
shares | Shares
purchased | Shares
sold | Ending
shares | Realized gain
(loss) —
affiliated
issuers ($) | Net change in
unrealized
appreciation
(depreciation) —
affiliated
issuers ($) | Dividends —
affiliated
issuers ($) | Value —
affiliated
issuers
at end of
period ($) |
| Columbia Short-Term Cash Fund, 2.519% |
| | 4,743,524 | 78,441,751 | (75,013,691) | 8,171,584 | (790) | 81 | 160,811 | 8,170,766 |
Abbreviation Legend
| ADR | American Depositary Receipt |
| CMO | Collateralized Mortgage Obligation |
| PIK | Payment In Kind |
Currency Legend
Fair value measurements
The Fund categorizes its fair value measurements according to a three-level hierarchy that maximizes the use of observable inputs and minimizes the use of unobservable inputs by prioritizing that the most observable input be used when available. Observable inputs are those that market participants would use in pricing an investment based on market data obtained from sources independent of the reporting entity. Unobservable inputs are those that reflect the Fund’s assumptions about the information market participants would use in pricing an investment. An investment’s level within the fair value hierarchy is based on the lowest level of any input that is deemed significant to the asset’s or liability’s fair value measurement. The input levels are not necessarily an indication of the risk or liquidity associated with investments at that level. For example, certain U.S. government securities are generally high quality and liquid, however, they are reflected as Level 2 because the inputs used to determine fair value may not always be quoted prices in an active market.
Fair value inputs are summarized in the three broad levels listed below:
The accompanying Notes to Financial Statements are an integral part of this statement.
Columbia Multi-Asset Income Fund | Annual Report 2019
| 27 |
Portfolio of Investments (continued)
April 30, 2019
Fair value measurements (continued)
| ■ | Level 1 — Valuations based on quoted prices for investments in active markets that the Fund has the ability to access at the measurement date. Valuation adjustments are not applied to Level 1 investments. |
| ■ | Level 2 — Valuations based on other significant observable inputs (including quoted prices for similar securities, interest rates, prepayment speeds, credit risks, etc.). |
| ■ | Level 3 — Valuations based on significant unobservable inputs (including the Fund’s own assumptions and judgment in determining the fair value of investments). |
Inputs that are used in determining fair value of an investment may include price information, credit data, volatility statistics, and other factors. These inputs can be either observable or unobservable. The availability of observable inputs can vary between investments, and is affected by various factors such as the type of investment, and the volume and level of activity for that investment or similar investments in the marketplace. The inputs will be considered by the Investment Manager, along with any other relevant factors in the calculation of an investment’s fair value. The Fund uses prices and inputs that are current as of the measurement date, which may include periods of market dislocations. During these periods, the availability of prices and inputs may be reduced for many investments. This condition could cause an investment to be reclassified between the various levels within the hierarchy.
Foreign equity securities actively traded in markets where there is a significant delay in the local close relative to the New York Stock Exchange are classified as Level 2. The values of these securities may include an adjustment to reflect the impact of significant market movements following the close of local trading, as described in Note 2 to the financial statements – Security valuation.
Certain investments that have been measured at fair value using the net asset value (NAV) per share (or its equivalent) are not categorized in the fair value hierarchy. The fair value amounts presented in the table are intended to reconcile the fair value hierarchy to the amounts presented in the Portfolio of Investments. The Columbia Short-Term Cash Fund seeks to provide shareholders with maximum current income consistent with liquidity and stability of principal. Columbia Short-Term Cash Fund prices its shares with a floating NAV and no longer seeks to maintain a stable NAV.
Investments falling into the Level 3 category are primarily supported by quoted prices from brokers and dealers participating in the market for those investments. However, these may be classified as Level 3 investments due to lack of market transparency and corroboration to support these quoted prices. Additionally, valuation models may be used as the pricing source for any remaining investments classified as Level 3. These models may rely on one or more significant unobservable inputs and/or significant assumptions by the Investment Manager. Inputs used in valuations may include, but are not limited to, financial statement analysis, capital account balances, discount rates and estimated cash flows, and comparable company data.
Under the direction of the Fund’s Board of Trustees (the Board), the Investment Manager’s Valuation Committee (the Committee) is responsible for overseeing the valuation procedures approved by the Board. The Committee consists of voting and non-voting members from various groups within the Investment Manager’s organization, including operations and accounting, trading and investments, compliance, risk management and legal.
The Committee meets at least monthly to review and approve valuation matters, which may include a description of specific valuation determinations, data regarding pricing information received from approved pricing vendors and brokers and the results of Board-approved valuation control policies and procedures (the Policies). The Policies address, among other things, instances when market quotations are or are not readily available, including recommendations of third party pricing vendors and a determination of appropriate pricing methodologies; events that require specific valuation determinations and assessment of fair value techniques; securities with a potential for stale pricing, including those that are illiquid, restricted, or in default; and the effectiveness of third party pricing vendors, including periodic reviews of vendors. The Committee meets more frequently, as needed, to discuss additional valuation matters, which may include the need to review back-testing results, review time-sensitive information or approve related valuation actions. The Committee reports to the Board, with members of the Committee meeting with the Board at each of its regularly scheduled meetings to discuss valuation matters and actions during the period, similar to those described earlier.
For investments categorized as Level 3, the Committee monitors information similar to that described above, which may include: (i) data specific to the issuer or comparable issuers, (ii) general market or specific sector news and (iii) quoted prices and specific or similar security transactions. The Committee considers this data and any changes from prior periods in order to assess the reasonableness of observable and unobservable inputs, any assumptions or internal models used to value those securities and changes in fair value. This data is also used to corroborate, when available, information received from approved pricing vendors and brokers. Various factors impact the frequency of monitoring this information (which may occur as often as daily). However, the Committee may determine that changes to inputs, assumptions and models are not required as a result of the monitoring procedures performed.
The following table is a summary of the inputs used to value the Fund’s investments at April 30, 2019:
| | Level 1
quoted prices
in active
markets for
identical
assets ($) | Level 2
other
significant
observable
inputs ($) | Level 3
significant
unobservable
inputs ($) | Investments
measured at
net asset
value ($) | Total ($) |
| Investments in Securities | | | | | |
| Asset-Backed Securities — Non-Agency | — | 4,792,681 | — | — | 4,792,681 |
| Commercial Mortgage-Backed Securities - Non-Agency | — | 1,260,269 | — | — | 1,260,269 |
| Common Stocks | | | | | |
| Communication Services | 629,353 | — | — | — | 629,353 |
| Consumer Discretionary | 785,297 | — | — | — | 785,297 |
| Consumer Staples | 1,368,587 | — | — | — | 1,368,587 |
| Energy | 1,240,440 | — | — | — | 1,240,440 |
| Financials | 1,182,875 | — | — | — | 1,182,875 |
| Health Care | 1,458,589 | — | — | — | 1,458,589 |
| Industrials | 582,646 | — | — | — | 582,646 |
| Information Technology | 1,509,567 | — | — | — | 1,509,567 |
| Materials | 220,601 | — | — | — | 220,601 |
The accompanying Notes to Financial Statements are an integral part of this statement.
| 28 | Columbia Multi-Asset Income Fund | Annual Report 2019 |
Portfolio of Investments (continued)
April 30, 2019
Fair value measurements (continued)
| | Level 1
quoted prices
in active
markets for
identical
assets ($) | Level 2
other
significant
observable
inputs ($) | Level 3
significant
unobservable
inputs ($) | Investments
measured at
net asset
value ($) | Total ($) |
| Real Estate | 6,222,543 | — | — | — | 6,222,543 |
| Utilities | 589,413 | — | — | — | 589,413 |
| Total Common Stocks | 15,789,911 | — | — | — | 15,789,911 |
| Convertible Bonds | — | 54,296 | — | — | 54,296 |
| Convertible Preferred Stocks | | | | | |
| Health Care | — | 206,384 | — | — | 206,384 |
| Industrials | — | 107,825 | — | — | 107,825 |
| Real Estate | — | 80,648 | — | — | 80,648 |
| Utilities | — | 310,335 | — | — | 310,335 |
| Total Convertible Preferred Stocks | — | 705,192 | — | — | 705,192 |
| Corporate Bonds & Notes | — | 30,385,448 | — | — | 30,385,448 |
| Equity-Linked Notes | — | 27,557,893 | — | — | 27,557,893 |
| Exchange-Traded Funds | 25,426,771 | — | — | — | 25,426,771 |
| Foreign Government Obligations | — | 15,834,652 | — | — | 15,834,652 |
| Residential Mortgage-Backed Securities - Agency | — | 1,244,245 | — | — | 1,244,245 |
| Residential Mortgage-Backed Securities - Non-Agency | — | 8,647,553 | 309,870 | — | 8,957,423 |
| Senior Loans | — | 847,657 | — | — | 847,657 |
| Treasury Bills | — | 285,268 | — | — | 285,268 |
| U.S. Treasury Obligations | 3,924,613 | — | — | — | 3,924,613 |
| Money Market Funds | — | — | — | 8,170,766 | 8,170,766 |
| Total Investments in Securities | 45,141,295 | 91,615,154 | 309,870 | 8,170,766 | 145,237,085 |
| Investments in Derivatives | | | | | |
| Asset | | | | | |
| Futures Contracts | 880,238 | — | — | — | 880,238 |
| Total | 46,021,533 | 91,615,154 | 309,870 | 8,170,766 | 146,117,323 |
See the Portfolio of Investments for all investment classifications not indicated in the table.
The Fund’s assets assigned to the Level 2 input category are generally valued using the market approach, in which a security’s value is determined through reference to prices and information from market transactions for similar or identical assets. These assets include certain foreign securities for which a third party statistical pricing service may be employed for purposes of fair market valuation. The model utilized by such third party statistical pricing service takes into account a security’s correlation to available market data including, but not limited to, intraday index, ADR, and exchange-traded fund movements.
Derivative instruments are valued at unrealized appreciation (depreciation).
Financial assets were transferred from Level 1 to Level 2 as the market for these assets was deemed not to be active and fair values were consequently obtained using observable market inputs rather than quoted prices for identical assets as of period end.
Financial assets were transferred from Level 3 to Level 2 as observable market inputs were utilized and management determined that there was sufficient, reliable and observable market data to value these assets as of period end.
Transfers between levels are determined based on the fair value at the beginning of the period for security positions held throughout the period.
The following table(s) show(s) transfers between levels of the fair value hierarchy:
| Transfers In | Transfers Out |
| Level 1 ($) | Level 2 ($) | Level 1 ($) | Level 2 ($) |
| — | 78,334 | 78,334 | — |
| Transfers In | Transfers Out |
| Level 2 ($) | Level 3 ($) | Level 2 ($) | Level 3 ($) |
| 506,790 | — | — | 506,790 |
The Fund does not hold any significant investments (greater than one percent of net assets) categorized as Level 3.
The accompanying Notes to Financial Statements are an integral part of this statement.
Columbia Multi-Asset Income Fund | Annual Report 2019
| 29 |
Portfolio of Investments (continued)
April 30, 2019
Fair value measurements (continued)
The Fund’s assets assigned to the Level 3 category are valued utilizing the valuation technique deemed the most appropriate in the circumstances. Certain residential mortgage backed securities classified as Level 3 securities are valued using the market approach and utilize single market quotations from broker dealers which may have included, but were not limited to, observable transactions for identical or similar assets in the market and the distressed nature of the security. The appropriateness of fair values for these securities is monitored on an ongoing basis which may include results of back testing, manual price reviews and other control procedures. Significant increases (decreases) to any of these inputs would result in a significantly higher (lower) valuation measurement.
The accompanying Notes to Financial Statements are an integral part of this statement.
| 30 | Columbia Multi-Asset Income Fund | Annual Report 2019 |
Statement of Assets and Liabilities
April 30, 2019
| Assets | |
| Investments in securities, at value | |
| Unaffiliated issuers (cost $135,677,035) | $137,066,319 |
| Affiliated issuers (cost $8,170,766) | 8,170,766 |
| Margin deposits on: | |
| Futures contracts | 888,300 |
| Receivable for: | |
| Investments sold | 368,618 |
| Investments sold on a delayed delivery basis | 11,234 |
| Capital shares sold | 26,806 |
| Dividends | 37,298 |
| Interest | 1,030,974 |
| Foreign tax reclaims | 6,128 |
| Variation margin for futures contracts | 84,118 |
| Expense reimbursement due from Investment Manager | 960 |
| Prepaid expenses | 173 |
| Trustees’ deferred compensation plan | 20,088 |
| Total assets | 147,711,782 |
| Liabilities | |
| Payable for: | |
| Investments purchased | 572,149 |
| Investments purchased on a delayed delivery basis | 317,988 |
| Capital shares purchased | 1,526 |
| Management services fees | 2,644 |
| Distribution and/or service fees | 50 |
| Transfer agent fees | 953 |
| Compensation of chief compliance officer | 4 |
| Other expenses | 72,259 |
| Trustees’ deferred compensation plan | 20,088 |
| Total liabilities | 987,661 |
| Net assets applicable to outstanding capital stock | $146,724,121 |
| Represented by | |
| Paid in capital | 153,814,307 |
| Total distributable earnings (loss) (Note 2) | (7,090,186) |
| Total - representing net assets applicable to outstanding capital stock | $146,724,121 |
The accompanying Notes to Financial Statements are an integral part of this statement.
Columbia Multi-Asset Income Fund | Annual Report 2019
| 31 |
Statement of Assets and Liabilities (continued)
April 30, 2019
| Class A | |
| Net assets | $3,110,676 |
| Shares outstanding | 331,759 |
| Net asset value per share | $9.38 |
| Maximum sales charge | 4.75% |
| Maximum offering price per share (calculated by dividing the net asset value per share by 1.0 minus the maximum sales charge for Class A shares) | $9.85 |
| Advisor Class | |
| Net assets | $733,103 |
| Shares outstanding | 78,194 |
| Net asset value per share | $9.38 |
| Class C | |
| Net assets | $1,052,819 |
| Shares outstanding | 112,282 |
| Net asset value per share | $9.38 |
| Institutional Class | |
| Net assets | $3,833,981 |
| Shares outstanding | 408,778 |
| Net asset value per share | $9.38 |
| Institutional 2 Class | |
| Net assets | $60,183 |
| Shares outstanding | 6,415 |
| Net asset value per share | $9.38 |
| Institutional 3 Class | |
| Net assets | $137,933,359 |
| Shares outstanding | 14,739,279 |
| Net asset value per share | $9.36 |
The accompanying Notes to Financial Statements are an integral part of this statement.
| 32 | Columbia Multi-Asset Income Fund | Annual Report 2019 |
Statement of Operations
Year Ended April 30, 2019
| Net investment income | |
| Income: | |
| Dividends — unaffiliated issuers | $1,931,764 |
| Dividends — affiliated issuers | 160,811 |
| Interest | 7,465,564 |
| Foreign taxes withheld | (5,368) |
| Total income | 9,552,771 |
| Expenses: | |
| Management services fees | 913,614 |
| Distribution and/or service fees | |
| Class A | 4,997 |
| Class C | 11,169 |
| Class T | 15 |
| Transfer agent fees | |
| Class A | 2,725 |
| Advisor Class | 788 |
| Class C | 1,514 |
| Institutional Class | 2,641 |
| Institutional 2 Class | 31 |
| Institutional 3 Class | 9,785 |
| Class T | 9 |
| Compensation of board members | 15,072 |
| Custodian fees | 63,759 |
| Printing and postage fees | 10,595 |
| Registration fees | 89,308 |
| Audit fees | 52,812 |
| Legal fees | 3,066 |
| Compensation of chief compliance officer | 54 |
| Other | 13,619 |
| Total expenses | 1,195,573 |
| Fees waived or expenses reimbursed by Investment Manager and its affiliates | (413,261) |
| Total net expenses | 782,312 |
| Net investment income | 8,770,459 |
| Realized and unrealized gain (loss) — net | |
| Net realized gain (loss) on: | |
| Investments — unaffiliated issuers | (4,976,078) |
| Investments — affiliated issuers | (790) |
| Foreign currency translations | 336 |
| Forward foreign currency exchange contracts | 23,102 |
| Futures contracts | (2,040,285) |
| Swap contracts | 1,709 |
| Net realized loss | (6,992,006) |
| Net change in unrealized appreciation (depreciation) on: | |
| Investments — unaffiliated issuers | 3,806,046 |
| Investments — affiliated issuers | 81 |
| Foreign currency translations | (187) |
| Forward foreign currency exchange contracts | (6,270) |
| Futures contracts | 1,687,681 |
| Swap contracts | 59,166 |
| Net change in unrealized appreciation (depreciation) | 5,546,517 |
| Net realized and unrealized loss | (1,445,489) |
| Net increase in net assets resulting from operations | $7,324,970 |
The accompanying Notes to Financial Statements are an integral part of this statement.
Columbia Multi-Asset Income Fund | Annual Report 2019
| 33 |
Statement of Changes in Net Assets
| | Year Ended
April 30, 2019 | Year Ended
April 30, 2018 |
| Operations | | |
| Net investment income | $8,770,459 | $7,714,706 |
| Net realized gain (loss) | (6,992,006) | 97,829 |
| Net change in unrealized appreciation (depreciation) | 5,546,517 | (4,366,020) |
| Net increase in net assets resulting from operations | 7,324,970 | 3,446,515 |
| Distributions to shareholders | | |
| Net investment income and net realized gains | | |
| Class A | (130,571) | |
| Advisor Class | (38,945) | |
| Class C | (64,441) | |
| Institutional Class | (135,296) | |
| Institutional 2 Class | (2,868) | |
| Institutional 3 Class | (9,291,228) | |
| Class T | (443) | |
| Net investment income | | |
| Class A | | (57,443) |
| Advisor Class | | (14,947) |
| Class C | | (37,663) |
| Institutional Class | | (72,821) |
| Institutional 2 Class | | (600) |
| Institutional 3 Class | | (6,637,057) |
| Class T | | (463) |
| Total distributions to shareholders (Note 2) | (9,663,792) | (6,820,994) |
| Increase in net assets from capital stock activity | 13,771,117 | 8,077,665 |
| Total increase in net assets | 11,432,295 | 4,703,186 |
| Net assets at beginning of year | 135,291,826 | 130,588,640 |
| Net assets at end of year | $146,724,121 | $135,291,826 |
| Undistributed net investment income | $605,861 | $1,666,790 |
The accompanying Notes to Financial Statements are an integral part of this statement.
| 34 | Columbia Multi-Asset Income Fund | Annual Report 2019 |
Statement of Changes in Net Assets (continued)
| | Year Ended | Year Ended |
| | April 30, 2019 | April 30, 2018 |
| | Shares | Dollars ($) | Shares | Dollars ($) |
| Capital stock activity |
| Class A | | | | |
| Subscriptions | 204,949 | 1,900,073 | 80,602 | 790,736 |
| Distributions reinvested | 13,771 | 128,179 | 5,813 | 56,747 |
| Redemptions | (33,159) | (305,020) | (21,968) | (216,153) |
| Net increase | 185,561 | 1,723,232 | 64,447 | 631,330 |
| Advisor Class | | | | |
| Subscriptions | 51,608 | 487,407 | 26,344 | 258,014 |
| Distributions reinvested | 4,109 | 38,299 | 1,481 | 14,459 |
| Redemptions | (15,425) | (142,919) | (6,256) | (60,557) |
| Net increase | 40,292 | 382,787 | 21,569 | 211,916 |
| Class C | | | | |
| Subscriptions | 60,580 | 569,057 | 55,099 | 538,383 |
| Distributions reinvested | 6,725 | 62,735 | 3,741 | 36,547 |
| Redemptions | (61,755) | (571,400) | (20,395) | (199,398) |
| Net increase | 5,550 | 60,392 | 38,445 | 375,532 |
| Institutional Class | | | | |
| Subscriptions | 238,385 | 2,216,780 | 24,168 | 235,373 |
| Distributions reinvested | 13,509 | 126,123 | 6,893 | 67,322 |
| Redemptions | (7,640) | (70,785) | (7,872) | (77,162) |
| Net increase | 244,254 | 2,272,118 | 23,189 | 225,533 |
| Institutional 2 Class | | | | |
| Subscriptions | 9,310 | 85,960 | — | — |
| Distributions reinvested | 240 | 2,219 | 11 | 109 |
| Redemptions | (4,135) | (37,236) | (330) | (3,304) |
| Net increase (decrease) | 5,415 | 50,943 | (319) | (3,195) |
| Institutional 3 Class | | | | |
| Distributions reinvested | 995,478 | 9,290,578 | 680,793 | 6,636,549 |
| Net increase | 995,478 | 9,290,578 | 680,793 | 6,636,549 |
| Class T | | | | |
| Redemptions | (1,000) | (8,933) | — | — |
| Net decrease | (1,000) | (8,933) | — | — |
| Total net increase | 1,475,550 | 13,771,117 | 828,124 | 8,077,665 |
The accompanying Notes to Financial Statements are an integral part of this statement.
Columbia Multi-Asset Income Fund | Annual Report 2019
| 35 |
The following table is intended to help you understand the Fund’s financial performance. Certain information reflects financial results for a single share of a class held for the periods shown. Per share net investment income (loss) amounts are calculated based on average shares outstanding during the period. Total return assumes reinvestment of all dividends and distributions, if any. Total return does not reflect payment of sales charges, if any. Total return and portfolio turnover are not annualized for periods of less than one year. The portfolio turnover rate is calculated without regard to purchase and sales transactions of short-term instruments and certain derivatives, if any. If such transactions were included, the Fund’s portfolio turnover rate may be higher.
| | Net asset value,
beginning of
period | Net
investment
income | Net
realized
and
unrealized
gain (loss) | Total from
investment
operations | Distributions
from net
investment
income | Total
distributions to
shareholders |
| Class A |
| Year Ended 4/30/2019 | $9.54 | 0.57 | (0.11) | 0.46 | (0.62) | (0.62) |
| Year Ended 4/30/2018 | $9.78 | 0.53 | (0.31) | 0.22 | (0.46) | (0.46) |
| Year Ended 4/30/2017 | $9.43 | 0.56 | 0.26 | 0.82 | (0.47) | (0.47) |
| Year Ended 4/30/2016 | $10.05 | 0.57 | (0.65) | (0.08) | (0.54) | (0.54) |
| Year Ended 4/30/2015(c) | $10.00 | 0.03 | 0.04 | 0.07 | (0.02) | (0.02) |
| Advisor Class |
| Year Ended 4/30/2019 | $9.54 | 0.59 | (0.10) | 0.49 | (0.65) | (0.65) |
| Year Ended 4/30/2018 | $9.78 | 0.56 | (0.31) | 0.25 | (0.49) | (0.49) |
| Year Ended 4/30/2017 | $9.43 | 0.61 | 0.23 | 0.84 | (0.49) | (0.49) |
| Year Ended 4/30/2016 | $10.05 | 0.56 | (0.62) | (0.06) | (0.56) | (0.56) |
| Year Ended 4/30/2015(e) | $10.00 | 0.03 | 0.04 | 0.07 | (0.02) | (0.02) |
| Class C |
| Year Ended 4/30/2019 | $9.54 | 0.49 | (0.10) | 0.39 | (0.55) | (0.55) |
| Year Ended 4/30/2018 | $9.78 | 0.46 | (0.31) | 0.15 | (0.39) | (0.39) |
| Year Ended 4/30/2017 | $9.43 | 0.49 | 0.26 | 0.75 | (0.40) | (0.40) |
| Year Ended 4/30/2016 | $10.05 | 0.48 | (0.63) | (0.15) | (0.47) | (0.47) |
| Year Ended 4/30/2015(f) | $10.00 | 0.02 | 0.04 | 0.06 | (0.01) | (0.01) |
| Institutional Class |
| Year Ended 4/30/2019 | $9.55 | 0.60 | (0.12) | 0.48 | (0.65) | (0.65) |
| Year Ended 4/30/2018 | $9.79 | 0.55 | (0.30) | 0.25 | (0.49) | (0.49) |
| Year Ended 4/30/2017 | $9.43 | 0.59 | 0.26 | 0.85 | (0.49) | (0.49) |
| Year Ended 4/30/2016 | $10.06 | 0.56 | (0.63) | (0.07) | (0.56) | (0.56) |
| Year Ended 4/30/2015(g) | $10.00 | 0.03 | 0.05 | 0.08 | (0.02) | (0.02) |
| Institutional 2 Class |
| Year Ended 4/30/2019 | $9.55 | 0.61 | (0.13) | 0.48 | (0.65) | (0.65) |
| Year Ended 4/30/2018 | $9.78 | 0.55 | (0.29) | 0.26 | (0.49) | (0.49) |
| Year Ended 4/30/2017 | $9.43 | 0.57 | 0.28 | 0.85 | (0.50) | (0.50) |
| Year Ended 4/30/2016 | $10.05 | 0.57 | (0.63) | (0.06) | (0.56) | (0.56) |
| Year Ended 4/30/2015(h) | $10.00 | 0.03 | 0.04 | 0.07 | (0.02) | (0.02) |
The accompanying Notes to Financial Statements are an integral part of this statement.
| 36 | Columbia Multi-Asset Income Fund | Annual Report 2019 |
Financial Highlights (continued)
| | Net
asset
value,
end of
period | Total
return | Total gross
expense
ratio to
average
net assets(a) | Total net
expense
ratio to
average
net assets(a),(b) | Net investment
income
ratio to
average
net assets | Portfolio
turnover | Net
assets,
end of
period
(000’s) |
| Class A |
| Year Ended 4/30/2019 | $9.38 | 5.06% | 1.23% | 0.91% | 6.17% | 60% | $3,111 |
| Year Ended 4/30/2018 | $9.54 | 2.27% | 1.24% | 0.93% | 5.41% | 76% | $1,395 |
| Year Ended 4/30/2017 | $9.78 | 8.88% | 1.27% | 0.94% | 5.83% | 69% | $800 |
| Year Ended 4/30/2016 | $9.43 | (0.62%) | 1.34% | 0.91% | 6.15% | 70% | $138 |
| Year Ended 4/30/2015(c) | $10.05 | 0.69% | 1.24%(d) | 0.75%(d) | 2.70%(d) | 30% | $10 |
| Advisor Class |
| Year Ended 4/30/2019 | $9.38 | 5.33% | 0.98% | 0.66% | 6.37% | 60% | $733 |
| Year Ended 4/30/2018 | $9.54 | 2.53% | 0.99% | 0.68% | 5.74% | 76% | $362 |
| Year Ended 4/30/2017 | $9.78 | 9.17% | 1.05% | 0.69% | 6.57% | 69% | $160 |
| Year Ended 4/30/2016 | $9.43 | (0.36%) | 1.10% | 0.64% | 5.99% | 70% | $9 |
| Year Ended 4/30/2015(e) | $10.05 | 0.71% | 0.99%(d) | 0.50%(d) | 3.00%(d) | 30% | $10 |
| Class C |
| Year Ended 4/30/2019 | $9.38 | 4.28% | 1.98% | 1.66% | 5.29% | 60% | $1,053 |
| Year Ended 4/30/2018 | $9.54 | 1.51% | 1.99% | 1.68% | 4.63% | 76% | $1,019 |
| Year Ended 4/30/2017 | $9.78 | 8.07% | 2.02% | 1.69% | 5.10% | 69% | $668 |
| Year Ended 4/30/2016 | $9.43 | (1.37%) | 2.12% | 1.65% | 5.24% | 70% | $101 |
| Year Ended 4/30/2015(f) | $10.05 | 0.61% | 1.99%(d) | 1.50%(d) | 2.00%(d) | 30% | $10 |
| Institutional Class |
| Year Ended 4/30/2019 | $9.38 | 5.21% | 0.98% | 0.66% | 6.43% | 60% | $3,834 |
| Year Ended 4/30/2018 | $9.55 | 2.53% | 0.99% | 0.68% | 5.63% | 76% | $1,571 |
| Year Ended 4/30/2017 | $9.79 | 9.27% | 1.03% | 0.69% | 6.24% | 69% | $1,383 |
| Year Ended 4/30/2016 | $9.43 | (0.47%) | 1.11% | 0.65% | 5.99% | 70% | $313 |
| Year Ended 4/30/2015(g) | $10.06 | 0.82% | 0.99%(d) | 0.50%(d) | 3.61%(d) | 30% | $315 |
| Institutional 2 Class |
| Year Ended 4/30/2019 | $9.38 | 5.26% | 0.91% | 0.60% | 6.59% | 60% | $60 |
| Year Ended 4/30/2018 | $9.55 | 2.68% | 0.93% | 0.64% | 5.60% | 76% | $10 |
| Year Ended 4/30/2017 | $9.78 | 9.22% | 0.93% | 0.64% | 5.99% | 69% | $13 |
| Year Ended 4/30/2016 | $9.43 | (0.34%) | 1.06% | 0.60% | 6.03% | 70% | $9 |
| Year Ended 4/30/2015(h) | $10.05 | 0.73% | 0.97%(d) | 0.47%(d) | 3.02%(d) | 30% | $10 |
The accompanying Notes to Financial Statements are an integral part of this statement.
Columbia Multi-Asset Income Fund | Annual Report 2019
| 37 |
Financial Highlights (continued)
| | Net asset value,
beginning of
period | Net
investment
income | Net
realized
and
unrealized
gain (loss) | Total from
investment
operations | Distributions
from net
investment
income | Total
distributions to
shareholders |
| Institutional 3 Class |
| Year Ended 4/30/2019 | $9.53 | 0.59 | (0.10) | 0.49 | (0.66) | (0.66) |
| Year Ended 4/30/2018 | $9.76 | 0.56 | (0.29) | 0.27 | (0.50) | (0.50) |
| Year Ended 4/30/2017(i) | $9.78 | 0.11 | (0.05)(j) | 0.06 | (0.08) | (0.08) |
| Notes to Financial Highlights |
| (a) | In addition to the fees and expenses that the Fund bears directly, the Fund indirectly bears a pro rata share of the fees and expenses of any other funds in which it invests. Such indirect expenses are not included in the Fund’s reported expense ratios. |
| (b) | Total net expenses include the impact of certain fee waivers/expense reimbursements made by the Investment Manager and certain of its affiliates, if applicable. |
| (c) | Class A shares commenced operations on March 27, 2015. Per share data and total return reflect activity from that date. |
| (d) | Annualized. |
| (e) | Advisor Class shares commenced operations on March 27, 2015. Per share data and total return reflect activity from that date. |
| (f) | Class C shares commenced operations on March 27, 2015. Per share data and total return reflect activity from that date. |
| (g) | Institutional Class shares commenced operations on March 27, 2015. Per share data and total return reflect activity from that date. |
| (h) | Institutional 2 Class shares commenced operations on March 27, 2015. Per share data and total return reflect activity from that date. |
| (i) | Institutional 3 Class shares commenced operations on March 1, 2017. Per share data and total return reflect activity from that date. |
| (j) | Calculation of the net gain (loss) per share (both realized and unrealized) does not correlate to the aggregate realized and unrealized gain (loss) presented in the Statement of Operations due to the timing of subscriptions and redemptions of Fund shares in relation to fluctuations in the market value of the portfolio. |
The accompanying Notes to Financial Statements are an integral part of this statement.
| 38 | Columbia Multi-Asset Income Fund | Annual Report 2019 |
Financial Highlights (continued)
| | Net
asset
value,
end of
period | Total
return | Total gross
expense
ratio to
average
net assets(a) | Total net
expense
ratio to
average
net assets(a),(b) | Net investment
income
ratio to
average
net assets | Portfolio
turnover | Net
assets,
end of
period
(000’s) |
| Institutional 3 Class |
| Year Ended 4/30/2019 | $9.36 | 5.33% | 0.85% | 0.55% | 6.35% | 60% | $137,933 |
| Year Ended 4/30/2018 | $9.53 | 2.73% | 0.87% | 0.58% | 5.70% | 76% | $130,926 |
| Year Ended 4/30/2017(i) | $9.76 | 0.66% | 0.93%(d) | 0.60%(d) | 7.22%(d) | 69% | $127,555 |
The accompanying Notes to Financial Statements are an integral part of this statement.
Columbia Multi-Asset Income Fund | Annual Report 2019
| 39 |
Notes to Financial Statements
April 30, 2019
Note 1. Organization
Columbia Multi-Asset Income Fund (the Fund), a series of Columbia Funds Series Trust I (the Trust), is a diversified fund. The Trust is registered under the Investment Company Act of 1940, as amended (the 1940 Act), as an open-end management investment company organized as a Massachusetts business trust.
Fund shares
The Trust may issue an unlimited number of shares (without par value). Although all share classes generally have identical voting, dividend and liquidation rights, each share class votes separately when required by the Trust’s organizational documents or by law. Different share classes pay different distribution amounts to the extent the expenses of such share classes differ, and distributions in liquidation will be proportional to the net asset value of each share class. Each share class has its own expense and sales charge structure. The Fund offers each of the share classes identified below.
Class A shares are subject to a maximum front-end sales charge of 4.75% based on the initial investment amount. Class A shares purchased without an initial sales charge in accounts aggregating $1 million to $50 million at the time of purchase are subject to a contingent deferred sales charge (CDSC) if the shares are sold within 18 months after purchase, charged as follows: 1.00% CDSC if redeemed within 12 months after purchase, and 0.50% CDSC if redeemed more than 12, but less than 18, months after purchase.
Advisor Class shares are not subject to sales charges and are generally available only to omnibus retirement plans and certain investors as described in the Fund’s prospectus.
Class C shares are subject to a 1.00% CDSC on shares redeemed within 12 months after purchase. Effective July 1, 2018, Class C shares automatically convert to Class A shares of the same Fund in the month of or the month following the 10-year anniversary of the Class C shares purchase date.
Institutional Class shares are not subject to sales charges and are generally available only to eligible investors, which are subject to different investment minimums as described in the Fund’s prospectus.
Institutional 2 Class shares are not subject to sales charges and are generally available only to investors purchasing through authorized investment professionals and omnibus retirement plans as described in the Fund’s prospectus.
Institutional 3 Class shares are not subject to sales charges and are available to institutional and certain other investors as described in the Fund’s prospectus.
Class T shares were subject to a maximum front-end sales charge of 2.50% per transaction and were required to be purchased through financial intermediaries that, by written agreement with Columbia Management Investment Distributors, Inc., were specifically authorized to sell Class T shares. Effective at the close of business on December 14, 2018, Class T shares merged, in a tax-free transaction, into Class A shares of the Fund and are no longer offered for sale.
Note 2. Summary of significant accounting policies
Basis of preparation
The Fund is an investment company that applies the accounting and reporting guidance in the Financial Accounting Standards Board (FASB) Accounting Standards Codification Topic 946,Financial Services - Investment Companies (ASC 946). The financial statements are prepared in accordance with U.S. generally accepted accounting principles (GAAP), which requires management to make certain estimates and assumptions that affect the reported amounts of assets and liabilities, the disclosure of contingent assets and liabilities at the date of the financial statements and the reported amounts of income and expenses during the reporting period. Actual results could differ from those estimates.
The following is a summary of significant accounting policies followed by the Fund in the preparation of its financial statements.
| 40 | Columbia Multi-Asset Income Fund | Annual Report 2019 |
Notes to Financial Statements (continued)
April 30, 2019
Security valuation
All equity securities and exchange-traded funds are valued at the close of business of the New York Stock Exchange. Equity securities and exchange-traded funds are valued at the last quoted sales price on the principal exchange or market on which they trade, except for securities traded on the NASDAQ Stock Market, which are valued at the NASDAQ official close price. Unlisted securities or listed securities for which there were no sales during the day are valued at the mean of the latest quoted bid and ask prices on such exchanges or markets.
Debt securities generally are valued by pricing services approved by the Board of Trustees based upon market transactions for normal, institutional-size trading units of similar securities. The services may use various pricing techniques that take into account, as applicable, factors such as yield, quality, coupon rate, maturity, type of issue, trading characteristics and other data, as well as approved independent broker-dealer quotes. Debt securities for which quotations are not readily available or not believed to be reflective of market value may also be valued based upon a bid quote from an approved independent broker-dealer. Debt securities maturing in 60 days or less are valued primarily at amortized cost value, unless this method results in a valuation that management believes does not approximate market value.
Asset- and mortgage-backed securities are generally valued by pricing services, which utilize pricing models that incorporate the securities’ cash flow and loan performance data. These models also take into account available market data, including trades, market quotations, and benchmark yield curves for identical or similar securities. Factors used to identify similar securities may include, but are not limited to, issuer, collateral type, vintage, prepayment speeds, collateral performance, credit ratings, credit enhancement and expected life. Asset-backed securities for which quotations are readily available may also be valued based upon an over-the-counter or exchange bid quote from an approved independent broker-dealer.
Senior loan securities for which reliable market quotations are readily available are generally valued by pricing services at the average of the bids received.
Foreign equity securities are valued based on the closing price on the foreign exchange in which such securities are primarily traded. If any foreign equity security closing prices are not readily available, the securities are valued at the mean of the latest quoted bid and ask prices on such exchanges or markets. Foreign currency exchange rates are generally determined at 4:00 p.m. Eastern (U.S.) time. Many securities markets and exchanges outside the U.S. close prior to the close of the New York Stock Exchange; therefore, the closing prices for securities in such markets or on such exchanges may not fully reflect events that occur after such close but before the close of the New York Stock Exchange. In those situations, foreign securities will be fair valued pursuant to a policy adopted by the Board of Trustees, including, if available, utilizing a third party pricing service to determine these fair values. The third party pricing service takes into account multiple factors, including, but not limited to, movements in the U.S. securities markets, certain depositary receipts, futures contracts and foreign exchange rates that have occurred subsequent to the close of the foreign exchange or market, to determine a good faith estimate that reasonably reflects the current market conditions as of the close of the New York Stock Exchange. The fair value of a security is likely to be different from the quoted or published price, if available.
Investments in open-end investment companies, including money market funds, are valued at their latest net asset value.
Futures and options on futures contracts are valued based upon the settlement price at the close of regular trading on their principal exchanges or, in the absence of transactions, at the mean of the latest quoted bid and ask prices.
Investments for which market quotations are not readily available, or that have quotations which management believes are not reflective of market value or reliable, are valued at fair value as determined in good faith under procedures approved by and under the general supervision of the Board of Trustees. If a security or class of securities (such as foreign securities) is valued at fair value, such value is likely to be different from the quoted or published price for the security.
The determination of fair value often requires significant judgment. To determine fair value, management may use assumptions including but not limited to future cash flows and estimated risk premiums. Multiple inputs from various sources may be used to determine fair value.
GAAP requires disclosure regarding the inputs and valuation techniques used to measure fair value and any changes in valuation inputs or techniques. In addition, investments shall be disclosed by major category. This information is disclosed following the Fund’s Portfolio of Investments.
Columbia Multi-Asset Income Fund | Annual Report 2019
| 41 |
Notes to Financial Statements (continued)
April 30, 2019
Foreign currency transactions and translations
The values of all assets and liabilities denominated in foreign currencies are generally translated into U.S. dollars at exchange rates determined at the close of regular trading on the New York Stock Exchange. Net realized and unrealized gains (losses) on foreign currency transactions and translations include gains (losses) arising from the fluctuation in exchange rates between trade and settlement dates on securities transactions, gains (losses) arising from the disposition of foreign currency and currency gains (losses) between the accrual and payment dates on dividends, interest income and foreign withholding taxes.
For financial statement purposes, the Fund does not distinguish that portion of gains (losses) on investments which is due to changes in foreign exchange rates from that which is due to changes in market prices of the investments. Such fluctuations are included with the net realized and unrealized gains (losses) on investments in the Statement of Operations.
Derivative instruments
The Fund invests in certain derivative instruments, as detailed below, to meet its investment objectives. Derivatives are instruments whose values depend on, or are derived from, in whole or in part, the value of one or more securities, currencies, commodities, indices, or other assets or instruments. Derivatives may be used to increase investment flexibility (including to maintain cash reserves while maintaining desired exposure to certain assets), for risk management (hedging) purposes, to facilitate trading, to reduce transaction costs and to pursue higher investment returns. The Fund may also use derivative instruments to mitigate certain investment risks, such as foreign currency exchange rate risk, interest rate risk and credit risk. Derivatives may involve various risks, including the potential inability of the counterparty to fulfill its obligations under the terms of the contract, the potential for an illiquid secondary market (making it difficult for the Fund to sell or terminate, including at favorable prices) and the potential for market movements which may expose the Fund to gains or losses in excess of the amount shown in the Statement of Assets and Liabilities. The notional amounts of derivative instruments, if applicable, are not recorded in the financial statements.
A derivative instrument may suffer a marked-to-market loss if the value of the contract decreases due to an unfavorable change in the market rates or values of the underlying instrument. Losses can also occur if the counterparty does not perform its obligations under the contract. The Fund’s risk of loss from counterparty credit risk on over-the-counter derivatives is generally limited to the aggregate unrealized gain netted against any collateral held by the Fund and the amount of any variation margin held by the counterparty, plus any replacement costs or related amounts. With exchange-traded or centrally cleared derivatives, there is reduced counterparty credit risk to the Fund since the clearinghouse or central counterparty (CCP) provides some protection in the case of clearing member default. The clearinghouse or CCP stands between the buyer and the seller of the contract; therefore, additional counterparty credit risk is failure of the clearinghouse or CCP. However, credit risk still exists in exchange-traded or centrally cleared derivatives with respect to initial and variation margin that is held in a broker’s customer account. While brokers are required to segregate customer margin from their own assets, in the event that a broker becomes insolvent or goes into bankruptcy and at that time there is a shortfall in the aggregate amount of margin held by the broker for all its clients, U.S. bankruptcy laws will typically allocate that shortfall on a pro-rata basis across all the broker’s customers (including the Fund), potentially resulting in losses to the Fund.
In order to better define its contractual rights and to secure rights that will help the Fund mitigate its counterparty risk, the Fund may enter into an International Swaps and Derivatives Association, Inc. Master Agreement (ISDA Master Agreement) or similar agreement with its derivatives contract counterparties. An ISDA Master Agreement is an agreement between the Fund and a counterparty that governs over-the-counter derivatives and typically contains, among other things, collateral posting terms and netting provisions in the event of a default and/or termination event. Under an ISDA Master Agreement, the Fund may, under certain circumstances, offset with the counterparty certain derivative instrument’s payables and/or receivables with collateral held and/or posted and create one single net payment. The provisions of the ISDA Master Agreement typically permit a single net payment in the event of default (close-out netting), including the bankruptcy or insolvency of the counterparty. Note, however, that bankruptcy or insolvency laws of a particular jurisdiction may impose restrictions on or prohibitions against the right of offset or netting in bankruptcy, insolvency or other events.
Collateral (margin) requirements differ by type of derivative. Margin requirements are established by the clearinghouse or CCP for exchange-traded and centrally cleared derivatives. Brokers can ask for margin in excess of the minimum in certain circumstances. Collateral terms are contract specific for over-the-counter derivatives. For over-the-counter derivatives traded
| 42 | Columbia Multi-Asset Income Fund | Annual Report 2019 |
Notes to Financial Statements (continued)
April 30, 2019
under an ISDA Master Agreement, the collateral requirements are typically calculated by netting the marked-to-market amount for each transaction under such agreement and comparing that amount to the value of any variation margin currently pledged by the Fund and/or the counterparty. Generally, the amount of collateral due from or to a party has to exceed a minimum transfer amount threshold (e.g., $250,000) before a transfer has to be made. To the extent amounts due to the Fund from its counterparties are not fully collateralized, contractually or otherwise, the Fund bears the risk of loss from counterparty nonperformance. The Fund may also pay interest expense on cash collateral received from the broker. Any interest expense paid by the Fund is shown on the Statement of Operations. The Fund attempts to mitigate counterparty risk by only entering into agreements with counterparties that it believes have the financial resources to honor their obligations and by monitoring the financial stability of those counterparties.
Certain ISDA Master Agreements allow counterparties of over-the-counter derivatives transactions to terminate derivatives contracts prior to maturity in the event the Fund’s net asset value declines by a stated percentage over a specified time period or if the Fund fails to meet certain terms of the ISDA Master Agreement, which would cause the Fund to accelerate payment of any net liability owed to the counterparty. The Fund also has termination rights if the counterparty fails to meet certain terms of the ISDA Master Agreement. In determining whether to exercise such termination rights, the Fund would consider, in addition to counterparty credit risk, whether termination would result in a net liability owed from the counterparty.
For financial reporting purposes, the Fund does not offset derivative assets and derivative liabilities that are subject to netting arrangements in the Statement of Assets and Liabilities.
Forward foreign currency exchange contracts
Forward foreign currency exchange contracts are over-the-counter agreements between two parties to buy and sell a currency at a set price on a future date. The Fund utilized forward foreign currency exchange contracts to hedge the currency exposure associated with some or all of the Fund’s securities and to shift foreign currency exposure back to U.S. dollars. These instruments may be used for other purposes in future periods.
The values of forward foreign currency exchange contracts fluctuate daily with changes in foreign currency exchange rates. Changes in the value of these contracts are recorded as unrealized appreciation or depreciation until the contract is exercised or has expired. The Fund will realize a gain or loss when the forward foreign currency exchange contract is closed or expires. Non-deliverable forward foreign currency exchange contracts are settled with the counterparty in U.S. Dollars without delivery of foreign currency.
The use of forward foreign currency exchange contracts does not eliminate fluctuations in the prices of the Fund’s portfolio securities. The risks of forward foreign currency exchange contracts include movement in the values of the foreign currencies relative to the U.S. dollar (or other foreign currencies) and the possibility that counterparties will not complete their contractual obligations, which may be in excess of the amount reflected, if any, in the Statement of Assets and Liabilities.
Futures contracts
Futures contracts are exchange-traded and represent commitments for the future purchase or sale of an asset at a specified price on a specified date. The Fund bought and sold futures contracts to produce incremental earnings, to manage the duration and yield curve exposure of the Fund versus the benchmark, to manage exposure to movements in interest rates and to manage exposure to the securities market. These instruments may be used for other purposes in future periods. Upon entering into futures contracts, the Fund bears risks that it may not achieve the anticipated benefits of the futures contracts and may realize a loss. Additional risks include counterparty credit risk, the possibility of an illiquid market, and that a change in the value of the contract or option may not correlate with changes in the value of the underlying asset.
Upon entering into a futures contract, the Fund deposits cash or securities with the broker, known as a futures commission merchant (FCM), in an amount sufficient to meet the initial margin requirement. The initial margin deposit must be maintained at an established level over the life of the contract. Cash deposited as initial margin is recorded in the Statement of Assets and Liabilities as margin deposits. Securities deposited as initial margin are designated in the Portfolio of Investments. Subsequent payments (variation margin) are made or received by the Fund each day. The variation margin payments are
Columbia Multi-Asset Income Fund | Annual Report 2019
| 43 |
Notes to Financial Statements (continued)
April 30, 2019
equal to the daily change in the contract value and are recorded as variation margin receivable or payable and are offset in unrealized gains or losses. The Fund recognizes a realized gain or loss when the contract is closed or expires. Futures contracts involve, to varying degrees, risk of loss in excess of the variation margin disclosed in the Statement of Assets and Liabilities.
Swap contracts
Swap contracts are negotiated in the over-the-counter market and may be entered into as a bilateral contract or centrally cleared (centrally cleared swap contract). In a centrally cleared swap contract, immediately following execution of the swap contract with a broker, the swap contract is novated to a central counterparty (the CCP) and the CCP becomes the Fund’s counterparty to the centrally cleared swap contract. The Fund is required to deposit initial margin with the futures commission merchant (FCM), which pledges it through to the CCP in the form of cash or securities in an amount that varies depending on the size and risk profile of the particular swap contract. Securities deposited as initial margin are designated in the Portfolio of Investments and cash deposited is recorded in the Statement of Assets and Liabilities as margin deposits. Unlike a bilateral swap contract, for centrally cleared swap contracts, the Fund has minimal credit exposure to the FCM because the CCP stands between the Fund and the relevant buyer/seller on the other side of the contract. Swap contracts are marked-to-market daily and changes in value are recorded as unrealized appreciation (depreciation). The daily change in valuation of centrally cleared swap contracts, if any, is recorded as a receivable or payable for variation margin in the Statement of Assets and Liabilities.
Entering into these contracts involves, to varying degrees, elements of interest, liquidity and counterparty credit risk in excess of the amounts recognized in the Statement of Assets and Liabilities. Such risks involve the possibility that there may be unfavorable changes in interest rates, market conditions or other conditions, that it may be difficult to initiate a swap transaction or liquidate a position at an advantageous time or price which may result in significant losses, and that the FCM or CCP may not fulfill its obligation under the contract.
Credit default swap contracts
The Fund entered into credit default swap contracts to increase or decrease its credit exposure to a specific debt security or a basket of debt securities as a protection buyer to reduce overall credit exposure. These instruments may be used for other purposes in future periods. Credit default swap contracts are agreements in which one party pays fixed periodic payments to a counterparty in consideration for an agreement from the counterparty to make a specific payment should a specified credit event(s) take place. Although specified credit events are contract specific, credit events are generally defined as bankruptcy, failure to pay, restructuring, obligation acceleration, obligation default, or repudiation/moratorium.
As the purchaser of a credit default swap contract, the Fund purchases protection by paying a periodic interest rate on the notional amount to the counterparty. The interest amount is accrued daily as a component of unrealized appreciation (depreciation) and is recorded as a realized loss upon payment. If a credit event as specified in the contract occurs, the Fund may have the option either to deliver the reference obligation to the seller in exchange for a cash payment of its par amount, or to receive a net cash settlement equal to the par amount less an agreed-upon value of the reference obligation as of the date of the credit event. The difference between the value of the obligation or cash delivered and the notional amount received will be recorded as a realized gain (loss).
Effects of derivative transactions in the financial statements
The following tables are intended to provide additional information about the effect of derivatives on the financial statements of the Fund, including: the fair value of derivatives by risk category and the location of those fair values in the Statement of Assets and Liabilities; and the impact of derivative transactions over the period in the Statement of Operations, including realized and unrealized gains (losses). The derivative instrument schedules following the Portfolio of Investments present additional information regarding derivative instruments outstanding at the end of the period, if any.
| 44 | Columbia Multi-Asset Income Fund | Annual Report 2019 |
Notes to Financial Statements (continued)
April 30, 2019
The following table is a summary of the fair value of derivative instruments (not considered to be hedging instruments for accounting disclosure purposes) at April 30, 2019:
| | Asset derivatives | |
Risk exposure
category | Statement
of assets and liabilities
location | Fair value ($) |
| Equity risk | Component of total distributable earnings (loss) — unrealized appreciation on futures contracts | 595,729* |
| Interest rate risk | Component of total distributable earnings (loss) — unrealized appreciation on futures contracts | 284,509* |
| Total | | 880,238 |
| * | Includes cumulative appreciation (depreciation) as reported in the tables following the Portfolio of Investments. Only the current day’s variation margin is reported in receivables or payables in the Statement of Assets and Liabilities. |
The following table indicates the effect of derivative instruments (not considered to be hedging instruments for accounting disclosure purposes) in the Statement of Operations for the year ended April 30, 2019:
| Amount of realized gain (loss) on derivatives recognized in income |
| Risk exposure category | Forward
foreign
currency
exchange
contracts
($) | Futures
contracts
($) | Swap
contracts
($) | Total
($) |
| Credit risk | — | — | 1,709 | 1,709 |
| Equity risk | — | (1,840,242) | — | (1,840,242) |
| Foreign exchange risk | 23,102 | — | — | 23,102 |
| Interest rate risk | — | (200,043) | — | (200,043) |
| Total | 23,102 | (2,040,285) | 1,709 | (2,015,474) |
| |
| Change in unrealized appreciation (depreciation) on derivatives recognized in income |
| Risk exposure category | Forward
foreign
currency
exchange
contracts
($) | Futures
contracts
($) | Swap
contracts
($) | Total
($) |
| Credit risk | — | — | 59,166 | 59,166 |
| Equity risk | — | 1,369,082 | — | 1,369,082 |
| Foreign exchange risk | (6,270) | — | — | (6,270) |
| Interest rate risk | — | 318,599 | — | 318,599 |
| Total | (6,270) | 1,687,681 | 59,166 | 1,740,577 |
The following table is a summary of the average outstanding volume by derivative instrument for the year ended April 30, 2019:
| Derivative instrument | Average notional
amounts ($)* |
| Futures contracts — long | 29,082,022 |
| Credit default swap contracts — buy protection | 7,082,250 |
| Derivative instrument | Average unrealized
appreciation ($)** | Average unrealized
depreciation ($)** |
| Forward foreign currency exchange contracts | 2,126 | (174) |
| * | Based on the ending quarterly outstanding amounts for the year ended April 30, 2019. |
| ** | Based on the ending daily outstanding amounts for the year ended April 30, 2019. |
Columbia Multi-Asset Income Fund | Annual Report 2019
| 45 |
Notes to Financial Statements (continued)
April 30, 2019
Investments in senior loans
The Fund may invest in senior loan assignments. When the Fund purchases an assignment of a senior loan, the Fund typically has direct rights against the borrower; provided, however, that the Fund’s rights may be more limited than the lender from which it acquired the assignment and the Fund may be able to enforce its rights only through an administrative agent. Although certain senior loan assignments are secured by collateral, the Fund could experience delays or limitations in realizing such collateral or have its interest subordinated to other indebtedness of the obligor. In the event that the administrator or collateral agent of a loan becomes insolvent or enters into receivership or bankruptcy, the Fund may incur costs and delays in realizing payment or may suffer a loss of principal and/or interest. The risk of loss is greater for unsecured or subordinated loans. In addition, senior loan assignments are vulnerable to market, economic or other conditions or events that may reduce the demand for senior loan assignments and certain senior loan assignments which were liquid when purchased, may become illiquid.
The Fund may enter into senior loan assignments where all or a portion of the loan may be unfunded. The Fund is obligated to fund these commitments at the borrower’s discretion. These commitments, if any, are generally traded and priced in the same manner as other senior loan securities and are disclosed as unfunded senior loan commitments in the Fund’s Portfolio of Investments with a corresponding payable for investments purchased. The Fund designates cash or liquid securities to cover these commitments.
Asset- and mortgage-backed securities
The Fund may invest in asset-backed and mortgage-backed securities. The maturity dates shown represent the original maturity of the underlying obligation. Actual maturity may vary based upon prepayment activity on these obligations. All, or a portion, of the obligation may be prepaid at any time because the underlying asset may be prepaid. As a result, decreasing market interest rates could result in an increased level of prepayment. An increased prepayment rate will have the effect of shortening the maturity of the security. Unless otherwise noted, the coupon rates presented are fixed rates.
Delayed delivery securities
The Fund may trade securities on other than normal settlement terms, including securities purchased or sold on a “when-issued” or "forward commitment" basis. This may increase risk to the Fund since the other party to the transaction may fail to deliver, which could cause the Fund to subsequently invest at less advantageous prices. The Fund designates cash or liquid securities in an amount equal to the delayed delivery commitment.
Equity-linked notes
The Fund may invest in equity-linked notes (ELNs). An ELN is a debt instrument, generally valued based on a quotation received from a counterparty, which is based on the value of a single equity security, basket of equity securities or an index of equity securities (each, an Underlying Equity). An ELN typically provides interest income, thereby offering a yield advantage over investing directly in an Underlying Equity. However, the holder of an ELN may have limited or no benefit from any appreciation in the Underlying Equity, but is exposed to various risks, including, without limitation, volatility, issuer and market risk. The Fund may purchase ELNs that trade on a securities exchange or those that trade on the over-the-counter markets, including securities offered and sold under Rule 144A of the Securities Act of 1933, as amended. The Fund may also purchase an ELN in a privately negotiated transaction with the issuer of the ELN (or its broker-dealer affiliate).
Interest only and principal only securities
The Fund may invest in Interest Only (IO) or Principal Only (PO) securities. IOs are stripped securities entitled to receive all of the security’s interest, but none of its principal. IOs are particularly sensitive to changes in interest rates and therefore subject to greater fluctuations in price than typical interest bearing debt securities. IOs are also subject to credit risk because the Fund may not receive all or part of the interest payments if the issuer, obligor, guarantor or counterparty defaults on its obligation. Payments received for IOs are included in interest income on the Statement of Operations. Because no principal will be received at the maturity of an IO, adjustments are made to the cost of the security on a monthly basis until maturity. These adjustments are included in interest income on the Statement of Operations. POs are stripped securities entitled to receive the principal from the underlying obligation, but not the interest. POs are particularly sensitive to changes in interest rates and therefore are subject to fluctuations in price. POs are also subject to credit risk because the Fund may not receive
| 46 | Columbia Multi-Asset Income Fund | Annual Report 2019 |
Notes to Financial Statements (continued)
April 30, 2019
all or part of its principal if the issuer, obligor, guarantor or counterparty defaults on its obligation. The Fund may also invest in IO or PO stripped mortgage-backed securities. Payments received for POs are treated as reductions to the cost and par value of the securities.
Security transactions
Security transactions are accounted for on the trade date. Cost is determined and gains (losses) are based upon the specific identification method for both financial statement and federal income tax purposes.
The trade date for senior loans purchased in the primary market is the date on which the loan is allocated. The trade date for senior loans purchased in the secondary market is the date on which the transaction is entered into.
Income recognition
Interest income is recorded on an accrual basis. Market premiums and discounts, including original issue discounts, are amortized and accreted, respectively, over the expected life of the security on all debt securities, unless otherwise noted. The Fund classifies gains and losses realized on prepayments received on mortgage-backed securities as adjustments to interest income.
The Fund may place a debt security on non-accrual status and reduce related interest income when it becomes probable that the interest will not be collected and the amount of uncollectible interest can be reasonably estimated. A defaulted debt security is removed from non-accrual status when the issuer resumes interest payments or when collectibility of interest is reasonably assured.
Corporate actions and dividend income are generally recorded net of any non-reclaimable tax withholdings, on the ex-dividend date or upon receipt of ex-dividend notification in the case of certain foreign securities.
The Fund may receive distributions from holdings in equity securities, business development companies (BDCs), exchange-traded funds (ETFs), limited partnerships (LPs), other regulated investment companies (RICs), and real estate investment trusts (REITs), which report information on the tax character of their distributions annually. These distributions are allocated to dividend income, capital gain and return of capital based on actual information reported. Return of capital is recorded as a reduction of the cost basis of securities held. If the Fund no longer owns the applicable securities, return of capital is recorded as a realized gain. With respect to REITs, to the extent actual information has not yet been reported, estimates for return of capital are made by the Fund’s management. Management’s estimates are subsequently adjusted when the actual character of the distributions is disclosed by the REITs, which could result in a proportionate change in return of capital to shareholders.
Awards from class action litigation are recorded as a reduction of cost basis if the Fund still owns the applicable securities on the payment date. If the Fund no longer owns the applicable securities, the proceeds are recorded as realized gains.
The value of additional securities received as an income payment through a payment in kind, if any, is recorded as interest income and increases the cost basis of such securities.
The Fund may receive other income from senior loans, including amendment fees, consent fees and commitment fees. These fees are recorded as income when received by the Fund. These amounts are included in Interest Income in the Statement of Operations.
Expenses
General expenses of the Trust are allocated to the Fund and other funds of the Trust based upon relative net assets or other expense allocation methodologies determined by the nature of the expense. Expenses directly attributable to the Fund are charged to the Fund. Expenses directly attributable to a specific class of shares are charged to that share class.
Determination of class net asset value
All income, expenses (other than class-specific expenses, which are charged to that share class, as shown in the Statement of Operations) and realized and unrealized gains (losses) are allocated to each class of the Fund on a daily basis, based on the relative net assets of each class, for purposes of determining the net asset value of each class.
Columbia Multi-Asset Income Fund | Annual Report 2019
| 47 |
Notes to Financial Statements (continued)
April 30, 2019
Federal income tax status
The Fund intends to qualify each year as a regulated investment company under Subchapter M of the Internal Revenue Code, as amended, and will distribute substantially all of its investment company taxable income and net capital gain, if any, for its tax year, and as such will not be subject to federal income taxes. In addition, the Fund intends to distribute in each calendar year substantially all of its ordinary income, capital gain net income and certain other amounts, if any, such that the Fund should not be subject to federal excise tax. Therefore, no federal income or excise tax provision is recorded.
Foreign taxes
The Fund may be subject to foreign taxes on income, gains on investments or currency repatriation, a portion of which may be recoverable. The Fund will accrue such taxes and recoveries, as applicable, based upon its current interpretation of tax rules and regulations that exist in the markets in which it invests.
Realized gains in certain countries may be subject to foreign taxes at the Fund level, based on statutory rates. The Fund accrues for such foreign taxes on realized and unrealized gains at the appropriate rate for each jurisdiction, as applicable. The amount, if any, is disclosed as a liability on the Statement of Assets and Liabilities.
Distributions to shareholders
Distributions from net investment income, if any, are declared and paid monthly. Net realized capital gains, if any, are distributed at least annually. Income distributions and capital gain distributions are determined in accordance with federal income tax regulations, which may differ from GAAP.
Guarantees and indemnifications
Under the Trust’s organizational documents and, in some cases, by contract, its officers and trustees are indemnified against certain liabilities arising out of the performance of their duties to the Trust or its funds. In addition, certain of the Fund’s contracts with its service providers contain general indemnification clauses. The Fund’s maximum exposure under these arrangements is unknown since the amount of any future claims that may be made against the Fund cannot be determined, and the Fund has no historical basis for predicting the likelihood of any such claims.
Recent accounting pronouncements
Accounting Standards Update 2017-08 Premium Amortization on Purchased Callable Debt Securities
In March 2017, the Financial Accounting Standards Board issued Accounting Standards Update (ASU) No. 2017-08 Premium Amortization on Purchased Callable Debt Securities. ASU No. 2017-08 updates the accounting standards to shorten the amortization period for certain purchased callable debt securities, held at a premium, to be amortized to the earliest call date. The update applies to securities with explicit, noncontingent call features that are callable at fixed prices and on preset dates. The standard is effective for annual periods beginning after December 15, 2018 and interim periods within those fiscal years. Management does not expect the implementation of this guidance to have a material impact on the financial statement amounts and footnote disclosures.
Accounting Standards Update 2018-13 Disclosure Framework - Changes to the Disclosure Requirements for Fair Value Measurement
In August 2018, the Financial Accounting Standards Board issued Accounting Standards Update (ASU) No. 2018-13 Disclosure Framework - Changes to the Disclosure Requirements for Fair Value Measurement. ASU No. 2018-13, in addition to other modifications and additions, removes the requirement to disclose the amount and reasons for transfers between Level 1 and Level 2 of the fair value hierarchy and the policy for the timing of transfers between levels. The standard is effective for annual periods beginning after December 15, 2019 and interim periods within those fiscal years. At this time, management is evaluating the implication of this guidance and the impact it will have on the financial statement disclosures, if any.
Disclosure Update and Simplification
| 48 | Columbia Multi-Asset Income Fund | Annual Report 2019 |
Notes to Financial Statements (continued)
April 30, 2019
In September 2018, the Securities and Exchange Commission (SEC) released Final Rule 33-10532, Disclosure Update and Simplification, which amends certain financial statement disclosure requirements that the SEC determined to be redundant, outdated, or superseded in light of other SEC disclosure requirements, GAAP, or changes in the information environment. As a result of the amendments, management implemented disclosure changes which included removing the components of distributable earnings presented on the Statement of Assets and Liabilities and combining income and gain distributions paid to shareholders as presented on the Statement of Changes in Net Assets. Any values presented to meet prior year requirements were left unchanged. The amendments had no effect on the Fund’s net assets or results of operation.
Note 3. Fees and other transactions with affiliates
Management services fees
The Fund has entered into a Management Agreement with Columbia Management Investment Advisers, LLC (the Investment Manager), a wholly-owned subsidiary of Ameriprise Financial, Inc. (Ameriprise Financial). Under the Management Agreement, the Investment Manager provides the Fund with investment research and advice, as well as administrative and accounting services. The management services fee is an annual fee that is equal to a percentage of the Fund’s daily net assets that declines from 0.66% to 0.51% as the Fund’s net assets increase. The effective management services fee rate for the year ended April 30, 2019 was 0.66% of the Fund’s average daily net assets.
Subadvisory agreement
The Fund’s Board of Trustees has approved a subadvisory agreement between the Investment Manager and Threadneedle International Limited (Threadneedle), an affiliate of the Investment Manager and an indirect wholly-owned subsidiary of Ameriprise Financial. As of April 30, 2019, Threadneedle is not providing services to the Fund pursuant to the subadvisory agreement.
Compensation of board members
Members of the Board of Trustees who are not officers or employees of the Investment Manager or Ameriprise Financial are compensated for their services to the Fund as disclosed in the Statement of Operations. These members of the Board of Trustees may participate in a Deferred Compensation Plan (the Deferred Plan) which may be terminated at any time. Obligations of the Deferred Plan will be paid solely out of the Fund’s assets, and all amounts payable under the Deferred Plan constitute a general unsecured obligation of the Fund.
Compensation of Chief Compliance Officer
The Board of Trustees has appointed a Chief Compliance Officer to the Fund in accordance with federal securities regulations. As disclosed in the Statement of Operations, a portion of the Chief Compliance Officer’s total compensation is allocated to the Fund, along with other allocations to affiliated registered investment companies managed by the Investment Manager and its affiliates, based on relative net assets.
Transfer agency fees
Under a Transfer and Dividend Disbursing Agent Agreement, Columbia Management Investment Services Corp. (the Transfer Agent), an affiliate of the Investment Manager and a wholly-owned subsidiary of Ameriprise Financial, is responsible for providing transfer agency services to the Fund. The Transfer Agent has contracted with DST Asset Manager Solutions, Inc. (DST) to serve as sub-transfer agent. The Transfer Agent pays the fees of DST for services as sub-transfer agent and DST is not entitled to reimbursement for such fees from the Fund (with the exception of out-of-pocket fees).
The Fund pays the Transfer Agent a monthly transfer agency fee based on the number or the average value of accounts, depending on the type of account. In addition, the Fund pays the Transfer Agent a fee for shareholder services based on the number of accounts or on a percentage of the average aggregate value of the Fund’s shares maintained in omnibus accounts up to the lesser of the amount charged by the financial intermediary or a cap established by the Board of Trustees from time to time.
Columbia Multi-Asset Income Fund | Annual Report 2019
| 49 |
Notes to Financial Statements (continued)
April 30, 2019
The Transfer Agent also receives compensation from the Fund for various shareholder services and reimbursements for certain out-of-pocket fees. Total transfer agency fees for Institutional 2 Class and Institutional 3 Class shares are subject to an annual limitation of not more than 0.07% and 0.02%, respectively, of the average daily net assets attributable to each share class.
For the year ended April 30, 2019, the Fund’s effective transfer agency fee rates as a percentage of average daily net assets of each class were as follows:
| | Effective rate (%) |
| Class A | 0.14 |
| Advisor Class | 0.14 |
| Class C | 0.14 |
| Institutional Class | 0.14 |
| Institutional 2 Class | 0.07 |
| Institutional 3 Class | 0.01 |
| Class T | 0.09(a) |
An annual minimum account balance fee of $20 may apply to certain accounts with a value below the applicable share class’s initial minimum investment requirements to reduce the impact of small accounts on transfer agency fees. These minimum account balance fees are remitted to the Fund and recorded as part of expense reductions in the Statement of Operations. For the year ended April 30, 2019, no minimum account balance fees were charged by the Fund.
Distribution and service fees
The Fund has entered into an agreement with Columbia Management Investment Distributors, Inc. (the Distributor), an affiliate of the Investment Manager and a wholly-owned subsidiary of Ameriprise Financial, for distribution and shareholder services. The Board of Trustees has approved, and the Fund has adopted, distribution and shareholder service plans (the Plans) applicable to certain share classes, which set the distribution and service fees for the Fund. These fees are calculated daily and are intended to compensate the Distributor and/or eligible selling and/or servicing agents for selling shares of the Fund and providing services to investors.
Under the Plans, the Fund pays a monthly service fee to the Distributor at the maximum annual rate of 0.25% of the average daily net assets attributable to Class A, Class C and Class T shares of the Fund. Also under the Plans, the Fund pays a monthly distribution fee to the Distributor at the maximum annual rates of 0.75% and 0.25% of the average daily net assets attributable to Class C and Class T shares of the Fund, respectively. As a result of all Class T shares of the Fund being redeemed or converted to Class A shares, December 14, 2018 was the last day the Fund paid a distribution and shareholder services fee for Class T shares.
Although the Fund may have paid a distribution fee up to 0.25% of the Fund’s average daily net assets attributable to Class T shares and a service fee of up to 0.25% of the Fund’s average daily net assets attributable to Class T shares, the aggregate fee shall not exceed 0.25% of the Fund’s average daily net assets attributable to Class T shares.
Sales charges (unaudited)
Sales charges, including front-end charges and CDSCs, received by the Distributor for distributing Fund shares for the year ended April 30, 2019, if any, are listed below:
| | Amount ($) |
| Class A | 32,184 |
| Class C | 58 |
| 50 | Columbia Multi-Asset Income Fund | Annual Report 2019 |
Notes to Financial Statements (continued)
April 30, 2019
Expenses waived/reimbursed by the Investment Manager and its affiliates
The Investment Manager and certain of its affiliates have contractually agreed to waive fees and/or reimburse expenses (excluding certain fees and expenses described below) for the period(s) disclosed below, unless sooner terminated at the sole discretion of the Board of Trustees, so that the Fund’s net operating expenses, including indirect expenses of the Underlying Funds, after giving effect to fees waived/expenses reimbursed and any balance credits and/or overdraft charges from the Fund’s custodian, do not exceed the following annual rate(s) as a percentage of the class’ average daily net assets:
| | September 1, 2018
through
August 31, 2019 | Prior to
September 1, 2018 |
| Class A | 0.99% | 0.99% |
| Advisor Class | 0.74 | 0.74 |
| Class C | 1.74 | 1.74 |
| Institutional Class | 0.74 | 0.74 |
| Institutional 2 Class | 0.68 | 0.71 |
| Institutional 3 Class | 0.62 | 0.65 |
Under the agreement governing these fee waivers and/or expense reimbursement arrangements, the following fees and expenses are excluded from the waiver/reimbursement commitment, and therefore will be paid by the Fund, if applicable: taxes (including foreign transaction taxes), transaction costs and brokerage commissions, costs related to any securities lending program, dividend expenses associated with securities sold short, inverse floater program fees and expenses, transaction charges and interest on borrowed money, interest, infrequent and/or unusual expenses and any other expenses the exclusion of which is specifically approved by the Board of Trustees. This agreement may be modified or amended only with approval from the Investment Manager, certain of its affiliates and the Fund. Any fees waived and/or expenses reimbursed under the expense reimbursement arrangements described above are not recoverable by the Investment Manager or its affiliates in future periods.
Note 4. Federal tax information
The timing and character of income and capital gain distributions are determined in accordance with income tax regulations, which may differ from GAAP because of temporary or permanent book to tax differences.
At April 30, 2019, these differences were primarily due to differing treatment for deferral/reversal of wash sale losses, re-characterization of distributions for investments, derivative investments, capital loss carryforwards, trustees’ deferred compensation, principal and/or interest from fixed income securities, foreign currency transactions, investments in partnerships and amortization/accretion on certain convertible securities. To the extent these differences were permanent, reclassifications were made among the components of the Fund’s net assets. Temporary differences do not require reclassifications.
The following reclassifications were made:
Undistributed net
investment
income ($) | Accumulated
net realized
(loss) ($) | Paid in
capital ($) |
| (167,596) | 877,929 | (710,333) |
Net investment income (loss) and net realized gains (losses), as disclosed in the Statement of Operations, and net assets were not affected by this reclassification.
The tax character of distributions paid during the years indicated was as follows:
| Year Ended April 30, 2019 | Year Ended April 30, 2018 |
Ordinary
income ($) | Long-term
capital gains ($) | Total ($) | Ordinary
income ($) | Long-term
capital gains ($) | Total ($) |
| 9,663,792 | — | 9,663,792 | 6,820,994 | — | 6,820,994 |
Columbia Multi-Asset Income Fund | Annual Report 2019
| 51 |
Notes to Financial Statements (continued)
April 30, 2019
Short-term capital gain distributions, if any, are considered ordinary income distributions for tax purposes.
At April 30, 2019, the components of distributable earnings on a tax basis were as follows:
Undistributed
ordinary income ($) | Undistributed
long-term
capital gains ($) | Capital loss
carryforwards ($) | Net unrealized
appreciation ($) |
| 615,098 | — | (9,030,199) | 1,345,109 |
At April 30, 2019, the cost of all investments for federal income tax purposes along with the aggregate gross unrealized appreciation and depreciation based on that cost was:
Federal
tax cost ($) | Gross unrealized
appreciation ($) | Gross unrealized
(depreciation) ($) | Net unrealized
appreciation ($) |
| 144,772,214 | 4,611,983 | (3,266,874) | 1,345,109 |
Tax cost of investments and unrealized appreciation/(depreciation) may also include timing differences that do not constitute adjustments to tax basis.
The following capital loss carryforwards, determined at April 30, 2019, may be available to reduce taxable income arising from future net realized gains on investments, if any, to the extent permitted by the Internal Revenue Code. Capital loss carryforwards with no expiration are required to be utilized prior to any capital losses which carry an expiration date. As a result of this ordering rule, capital loss carryforwards which carry an expiration date may be more likely to expire unused. In addition, for the year ended April 30, 2019, capital loss carryforwards utilized and expired unused, if any, were as follows:
No expiration
short-term ($) | No expiration
long-term ($) | Total ($) | Utilized ($) | Expired ($) |
| 9,030,199 | — | 9,030,199 | — | — |
Management of the Fund has concluded that there are no significant uncertain tax positions in the Fund that would require recognition in the financial statements. However, management’s conclusion may be subject to review and adjustment at a later date based on factors including, but not limited to, new tax laws, regulations, and administrative interpretations (including relevant court decisions). Generally, the Fund’s federal tax returns for the prior three fiscal years remain subject to examination by the Internal Revenue Service.
Note 5. Portfolio information
The cost of purchases and proceeds from sales of securities, excluding short-term investments and derivatives, if any, aggregated to $88,581,820 and $78,677,660, respectively, for the year ended April 30, 2019, of which $279,529 and $161,791, respectively, were U.S. government securities. The amount of purchase and sale activity impacts the portfolio turnover rate reported in the Financial Highlights.
Note 6. Affiliated money market fund
The Fund invests in Columbia Short-Term Cash Fund, an affiliated money market fund established for the exclusive use by the Fund and other affiliated funds (the Affiliated MMF). The income earned by the Fund from such investments is included as Dividends - affiliated issuers in the Statement of Operations. As an investing fund, the Fund indirectly bears its proportionate share of the expenses of the Affiliated MMF. The Affiliated MMF prices its shares with a floating net asset value. In addition, the Board of Trustees of the Affiliated MMF may impose a fee on redemptions (sometimes referred to as a liquidity fee) or temporarily suspend redemptions (sometimes referred to as imposing a redemption gate) in the event its liquidity falls below regulatory limits.
| 52 | Columbia Multi-Asset Income Fund | Annual Report 2019 |
Notes to Financial Statements (continued)
April 30, 2019
Note 7. Interfund lending
Pursuant to an exemptive order granted by the Securities and Exchange Commission, the Fund participates in a program (the Interfund Program) allowing each participating Columbia Fund (each, a Participating Fund) to lend money directly to and, except for closed-end funds and money market funds, borrow money directly from other Participating Funds for temporary purposes. The amounts eligible for borrowing and lending under the Interfund Program are subject to certain restrictions.
Interfund loans are subject to the risk that the borrowing fund could be unable to repay the loan when due, and a delay in repayment to the lending fund could result in lost opportunities and/or additional lending costs. The exemptive order is subject to conditions intended to mitigate conflicts of interest arising from the Investment Manager’s relationship with each Participating Fund.
The Fund did not borrow or lend money under the Interfund Program during the year ended April 30, 2019.
Note 8. Line of credit
The Fund has access to a revolving credit facility with a syndicate of banks led by Citibank, N.A., HSBC Bank USA, N.A. and JPMorgan Chase Bank, N.A. whereby the Fund may borrow for the temporary funding of shareholder redemptions or for other temporary or emergency purposes. The credit facility, which is a collective agreement between the Fund and certain other funds managed by the Investment Manager or an affiliated investment manager, severally and not jointly, permits collective borrowings up to $1 billion. Interest is charged to each participating fund based on its borrowings at a rate equal to the higher of (i) the federal funds effective rate, (ii) the one-month LIBOR rate and (iii) the overnight bank funding rate, plus in each case, 1.00%. Each borrowing under the credit facility matures no later than 60 days after the date of borrowing. The Fund also pays a commitment fee equal to its pro rata share of the unused amount of the credit facility at a rate of 0.15% per annum. The commitment fee is included in other expenses in the Statement of Operations. This agreement expires annually in December unless extended or renewed.
The Fund had no borrowings during the year ended April 30, 2019.
Note 9. Significant risks
Credit risk
Credit risk is the risk that the value of debt securities in the Fund’s portfolio may decline because the issuer may default and fail to pay interest or repay principal when due. Rating agencies assign credit ratings to debt securities to indicate their credit risk. Lower rated or unrated debt securities held by the Fund may present increased credit risk as compared to higher-rated debt securities.
Foreign securities and emerging market countries risk
Investing in foreign securities may include certain risks and considerations not typically associated with investing in U.S. securities, such as fluctuating currency values and changing local and regional economic, political and social conditions, which may result in greater market volatility. In addition, certain foreign securities may not be as liquid as U.S. securities. Investing in emerging markets may accentuate these risks. These countries are also more likely to experience high levels of inflation, deflation or currency devaluation which could hurt their economies and securities markets. To the extent that the Fund concentrates its investment exposure to any one or a few specific countries, the Fund will be particularly susceptible to the various conditions, events or other factors impacting those countries and may, therefore, have a greater risk than that of a fund which is more geographically diversified.
Interest rate risk
Interest rate risk is the risk of losses attributable to changes in interest rates. In general, if prevailing interest rates rise, the values of debt securities tend to fall, and if interest rates fall, the values of debt securities tend to rise. Actions by governments and central banking authorities can result in increases in interest rates. Increasing interest rates may negatively affect the value of debt securities held by the Fund, resulting in a negative impact on the Fund’s performance and net asset value per share. In general, the longer the maturity or duration of a debt security, the greater its sensitivity to changes in interest rates.
Columbia Multi-Asset Income Fund | Annual Report 2019
| 53 |
Notes to Financial Statements (continued)
April 30, 2019
Liquidity risk
Liquidity risk is the risk associated with a lack of marketability of investments which may make it difficult to sell the investment at a desirable time or price. Changing regulatory, market or other conditions or environments (for example, the interest rate or credit environments) may adversely affect the liquidity of the Fund’s investments. The Fund may have to accept a lower selling price for the holding, sell other investments, or forego another, more appealing investment opportunity. Generally, the less liquid the market at the time the Fund sells a portfolio investment, the greater the risk of loss or decline of value to the Fund. A less liquid market can lead to an increase in Fund redemptions, which may negatively impact Fund performance and net asset value per share, including, for example, if the Fund is forced to sell securities in a down market.
Shareholder concentration risk
At April 30, 2019, affiliated shareholders of record owned 94.1% of the outstanding shares of the Fund in one or more accounts. Subscription and redemption activity by concentrated accounts may have a significant effect on the operations of the Fund. In the case of a large redemption, the Fund may be forced to sell investments at inopportune times, including its liquid positions, which may result in Fund losses and the Fund holding a higher percentage of less liquid positions. Large redemptions could result in decreased economies of scale and increased operating expenses for non-redeeming Fund shareholders.
Note 10. Subsequent events
Management has evaluated the events and transactions that have occurred through the date the financial statements were issued and noted no items requiring adjustment of the financial statements or additional disclosure.
Note 11. Information regarding pending and settled legal proceedings
Ameriprise Financial and certain of its affiliates have historically been involved in a number of legal, arbitration and regulatory proceedings, including routine litigation, class actions, and governmental actions, concerning matters arising in connection with the conduct of their business activities. Ameriprise Financial believes that the Fund is not currently the subject of, and that neither Ameriprise Financial nor any of its affiliates are the subject of, any pending legal, arbitration or regulatory proceedings that are likely to have a material adverse effect on the Fund or the ability of Ameriprise Financial or its affiliates to perform under their contracts with the Fund. Ameriprise Financial is required to make quarterly (10-Q), annual (10-K) and, as necessary, 8-K filings with the Securities and Exchange Commission (SEC) on legal and regulatory matters that relate to Ameriprise Financial and its affiliates. Copies of these filings may be obtained by accessing the SEC website at www.sec.gov.
There can be no assurance that these matters, or the adverse publicity associated with them, will not result in increased Fund redemptions, reduced sale of Fund shares or other adverse consequences to the Fund. Further, although we believe proceedings are not likely to have a material adverse effect on the Fund or the ability of Ameriprise Financial or its affiliates to perform under their contracts with the Fund, these proceedings are subject to uncertainties and, as such, we are unable to estimate the possible loss or range of loss that may result. An adverse outcome in one or more of these proceedings could result in adverse judgments, settlements, fines, penalties or other relief that could have a material adverse effect on the consolidated financial condition or results of operations of Ameriprise Financial.
| 54 | Columbia Multi-Asset Income Fund | Annual Report 2019 |
Report of Independent Registered Public Accounting Firm
To the Board of Trustees of Columbia Funds Series Trust I and Shareholders of Columbia Multi-Asset Income Fund
Opinion on the Financial Statements
We have audited the accompanying statement of assets and liabilities, including the portfolio of investments, of Columbia Multi-Asset Income Fund (one of the funds constituting Columbia Funds Series Trust I, referred to hereafter as the "Fund") as of April 30, 2019, the related statement of operations for the year ended April 30, 2019, the statement of changes in net assets for each of the two years in the period ended April 30, 2019, including the related notes, and the financial highlights for each of the periods indicated therein (collectively referred to as the “financial statements”). In our opinion, the financial statements present fairly, in all material respects, the financial position of the Fund as of April 30, 2019, the results of its operations for the year then ended, the changes in its net assets for each of the two years in the period ended April 30, 2019 and the financial highlights for each of the periods indicated therein in conformity with accounting principles generally accepted in the United States of America.
Basis for Opinion
These financial statements are the responsibility of the Fund’s management. Our responsibility is to express an opinion on the Fund’s financial statements based on our audits. We are a public accounting firm registered with the Public Company Accounting Oversight Board (United States) (PCAOB) and are required to be independent with respect to the Fund in accordance with the U.S. federal securities laws and the applicable rules and regulations of the Securities and Exchange Commission and the PCAOB.
We conducted our audits of these financial statements in accordance with the standards of the PCAOB. Those standards require that we plan and perform the audit to obtain reasonable assurance about whether the financial statements are free of material misstatement, whether due to error or fraud.
Our audits included performing procedures to assess the risks of material misstatement of the financial statements, whether due to error or fraud, and performing procedures that respond to those risks. Such procedures included examining, on a test basis, evidence regarding the amounts and disclosures in the financial statements. Our audits also included evaluating the accounting principles used and significant estimates made by management, as well as evaluating the overall presentation of the financial statements. Our procedures included confirmation of securities owned as of April 30, 2019 by correspondence with the custodian, transfer agent, brokers and agent banks; when replies were not received from brokers, we performed other auditing procedures. We believe that our audits provide a reasonable basis for our opinion.
/s/PricewaterhouseCoopers LLP
Minneapolis, Minnesota
June 21, 2019
We have served as the auditor of one or more investment companies within the Columbia Funds Complex since 1977.
Columbia Multi-Asset Income Fund | Annual Report 2019
| 55 |
Federal Income Tax Information
(Unaudited)
The Fund hereby designates the following tax attributes for the fiscal year ended April 30, 2019. Shareholders will be notified in early 2020 of the amounts for use in preparing 2019 income tax returns.
Qualified
dividend
income | Dividends
received
deduction |
| 4.21% | 3.51% |
Qualified dividend income. For taxable, non-corporate shareholders, the percentage of ordinary income distributed during the fiscal year that represents qualified dividend income subject to reduced tax rates.
Dividends received deduction. The percentage of ordinary income distributed during the fiscal year that qualifies for the corporate dividends received deduction.
| 56 | Columbia Multi-Asset Income Fund | Annual Report 2019 |
The Board oversees the Fund’s operations and appoints officers who are responsible for day-to-day business decisions based on policies set by the Board. The following table provides basic biographical information about the Fund’s Trustees as of the printing of this report, including their principal occupations during the past five years, although specific titles for individuals may have varied over the period. The year set forth beneath Length of Service in the table below is the year in which the Trustee was first appointed or elected as Trustee to any Fund currently in the Columbia Funds Complex or a predecessor thereof. Under current Board policy, members serve terms of indefinite duration.
Independent trustees
| Name, address, year of birth | Position held with the Trust and length of service | Principal occupation(s) during the past five years and other relevant professional experience | Number of Funds in the Columbia Fund Complex overseen | Other directorships held by Trustee during the past five years |
Janet Langford Carrig
c/o Columbia Management
Investment Advisers, LLC
225 Franklin Street
Mail Drop BX32 05228
Boston, MA 02110
1957 | Trustee
1996 | Senior Vice President, General Counsel and Corporate Secretary, ConocoPhillips (independent energy company) from September 2007 to October 2018 | 69 | None |
Douglas A. Hacker
c/o Columbia Management
Investment Advisers, LLC
225 Franklin Street
Mail Drop BX32 05228
Boston, MA 02110
1955 | Trustee and Chairman of the Board
1996 | Independent business executive since May 2006; Executive Vice President — Strategy of United Airlines from December 2002 to May 2006; President of UAL Loyalty Services (airline marketing company) from September 2001 to December 2002; Executive Vice President and Chief Financial Officer of United Airlines from July 1999 to September 2001 | 69 | Spartan Nash Company, (food distributor); Nash Finch Company (food distributor) from 2005 to 2013; Aircastle Limited (aircraft leasing); SeaCube Container Leasing Ltd. (container leasing) from 2010 to 2013; and Travelport Worldwide Limited (travel information technology) |
Nancy T. Lukitsh
c/o Columbia Management
Investment Advisers, LLC
225 Franklin Street
Mail Drop BX32 05228
Boston, MA 02110
1956 | Trustee
2011 | Senior Vice President, Partner and Director of Marketing, Wellington Management Company, LLP (investment adviser) from 1997 to 2010; Chair, Wellington Management Portfolios (commingled non-U.S. investment pools) from 2007 to 2010; Director, Wellington Trust Company, NA and other Wellington affiliates from 1997 to 2010 | 69 | None |
David M. Moffett
c/o Columbia Management
Investment Advisers, LLC
225 Franklin Street
Mail Drop BX32 05228
Boston, MA 02110
1952 | Trustee
2011 | Retired. Consultant to Bridgewater and Associates | 69 | Director, CSX Corporation (transportation suppliers); Genworth Financial, Inc. (financial and insurance products and services); PayPal Holdings Inc. (payment and data processing services); Trustee, University of Oklahoma Foundation; former Director, eBay Inc. (online trading community), 2007-2015; and former Director, CIT Bank, CIT Group Inc. (commercial and consumer finance), 2010-2016 |
Columbia Multi-Asset Income Fund | Annual Report 2019
| 57 |
TRUSTEES AND OFFICERS (continued)
Independent trustees (continued)
| Name, address, year of birth | Position held with the Trust and length of service | Principal occupation(s) during the past five years and other relevant professional experience | Number of Funds in the Columbia Fund Complex overseen | Other directorships held by Trustee during the past five years |
John J. Neuhauser
c/o Columbia Management
Investment Advisers, LLC
225 Franklin Street
Mail Drop BX32 05228
Boston, MA 02110
1943 | Trustee
1984 | President, Saint Michael’s College from August 2007 to June 2018; Director or Trustee of several non-profit organizations, including University of Vermont Medical Center; Academic Vice President and Dean of Faculties, Boston College from August 1999 to October 2005; University Professor, Boston College from November 2005 to August 2007 | 69 | Liberty All-Star Equity Fund and Liberty All- Star Growth Fund (closed-end funds) |
Patrick J. Simpson
c/o Columbia Management
Investment Advisers, LLC
225 Franklin Street
Mail Drop BX32 05228
Boston, MA 02110
1944 | Trustee
2000 | Of Counsel, Perkins Coie LLP (law firm) since 2015; Partner, Perkins Coie LLP from 1988 to 2014 | 69 | M Fund, Inc. (M Funds mutual fund family) |
Anne-Lee Verville
c/o Columbia Management
Investment Advisers, LLC
225 Franklin Street
Mail Drop BX32 05228
Boston, MA 02110
1945 | Trustee
1998 | Retired. General Manager, Global Education Industry from 1994 to 1997, President – Application Systems Division from 1991 to 1994, Chief Financial Officer – US Marketing & Services from 1988 to 1991, and Chief Information Officer from 1987 to 1988, IBM Corporation (computer and technology) | 69 | Enesco Group, Inc. (producer of giftware and home and garden decor products) from 2001 to 2006 |
Consultants to the Independent Trustees*
| Name, address, year of birth | Position held with the Trust and length of service | Principal occupation(s) during the past five years and other relevant professional experience | Number of Funds in the Columbia Funds complex overseen | Other directorships held by Trustee during the past five years |
J. Kevin Connaughton
c/o Columbia
Management Investment
Advisers, LLC,
225 Franklin Street
Mail Drop BX32 05228,
Boston, MA 02110
1964 | Independent Trustee Consultant
2016 | Independent Trustee Consultant, Columbia Funds since March 2016; Adjunct Professor of Finance, Bentley University since November 2017; Managing Director and General Manager of Mutual Fund Products, Columbia Management Investment Advisers, LLC from May 2010 to February 2015; President, Columbia Funds from 2009 to 2015; and senior officer of Columbia Funds and affiliated funds from 2003 to 2015 | 69 | Director, The Autism Project since March 2015; former Trustee, New Century Portfolios, March 2015-December 2017; formerly on Board of Governors, Gateway Healthcare, January 2016 – December 2017 |
| 58 | Columbia Multi-Asset Income Fund | Annual Report 2019 |
TRUSTEES AND OFFICERS (continued)
Consultants to the Independent Trustees* (continued)
| Name, address, year of birth | Position held with the Trust and length of service | Principal occupation(s) during the past five years and other relevant professional experience | Number of Funds in the Columbia Funds complex overseen | Other directorships held by Trustee during the past five years |
Olive Darragh
c/o Columbia
Management Investment
Advisers, LLC,
225 Franklin Street,
Mail Drop BX32 05228,
Boston, MA 02110
1962 | Independent Trustee Consultant 2019 | Independent Trustee Consultant, Columbia Funds since June 2019; Managing Director of Darragh Inc. (a strategy and talent management consulting firm) since 2010; Founder and CEO, Zolio (an investment management talent identification platform) since 2004; Partner, Tudor Investments from 2004 to 2010; Senior Partner, McKinsey & Company from 2001 to 2004 | 69 | Director, University of Edinburgh Business School; former Director, Boston Public Library Foundation |
Natalie A. Trunow
c/o Columbia
Management Investment
Advisers, LLC,
225 Franklin Street
Mail Drop BX32 05228,
Boston, MA 02110
1967 | Independent Trustee Consultant
2016 | Independent Trustee Consultant, Columbia Funds since September 2016; Chief Executive Officer, Millennial Portfolio Solutions LLC (asset management and consulting services) since January 2016; Director of Investments, Casey Family Programs from April 2016 to September 2016; Senior Vice President and Chief Investment Officer, Calvert Investments from August 2008 to January 2016; Section Head and Portfolio Manager, General Motors Asset Management from June 1997 to August 2008 | 69 | Director, Health Services for Children with Special Needs, Inc.; Director, Guidewell Financial Solutions |
| * | J. Kevin Connaughton was appointed consultant to the Independent Trustees effective March 1, 2016. Olive Darragh was appointed consultant to the Independent Trustees effective June 10, 2019. Natalie A. Trunow was appointed consultant to the Independent Trustees effective September 1, 2016. Shareholders of the Funds are expected to be asked to elect each of Mr. Connaughton, Ms. Darragh and Ms. Trunow as a Trustee at a future shareholder meeting. |
Interested trustee affiliated with Investment Manager*
| Name, address, year of birth | Position held with the Trust and length of service | Principal occupation(s) during the past five years and other relevant professional experience | Number of Funds in the Columbia Funds Complex overseen | Other directorships held by Trustee during the past five years |
William F. Truscott
c/o Columbia Management
Investment Advisers, LLC
225 Franklin Street
Boston, MA 02110
1960 | Trustee
2012 | Chairman of the Board and President, Columbia Management Investment Advisers, LLC since May 2010 and February 2012, respectively; Chief Executive Officer, Global Asset Management, Ameriprise Financial, Inc. since September 2012 (previously Chief Executive Officer, U.S. Asset Management & President, Annuities, May 2010-September 2012); Director and Chief Executive Officer, Columbia Management Investment Distributors, Inc. since May 2010 and February 2012, respectively; Chairman of the Board and Chief Executive Officer, RiverSource Distributors, Inc. since 2006; Director, Threadneedle Asset Management Holdings, SARL since 2014; President and Chief Executive Officer, Ameriprise Certificate Company, 2006-August 2012 | 188 | Chairman of the Board, Columbia Management Investment Advisers, LLC since May 2010; Director, Columbia Management Investment Distributors, Inc. since May 2010; former Director, Ameriprise Certificate Company, 2006 - January 2013 |
| * | Interested person (as defined under the 1940 Act) by reason of being an officer, director, security holder and/or employee of the Investment Manager or Ameriprise Financial. |
The Statement of Additional Information has additional information about the Fund’s Board members and is available, without charge, upon request by calling 800.345.6611, visiting columbiathreadneedleus.com/investor/ or contacting your financial intermediary.
Columbia Multi-Asset Income Fund | Annual Report 2019
| 59 |
TRUSTEES AND OFFICERS (continued)
The Board has appointed officers who are responsible for day-to-day business decisions based on policies it has established. The officers serve at the pleasure of the Board. The following table provides basic information about the Officers of the Fund, including principal occupations during the past five years, although their specific titles may have varied over the period. In addition to Mr. Truscott, who is Senior Vice President, the Fund’s other officers are:
Fund officers
Name,
address and
year of birth | Position and year
first appointed to
position for any Fund
in the Columbia
Funds complex or a
predecessor thereof | Principal occupation(s) during past five years |
Christopher O. Petersen
5228 Ameriprise
Financial Center
Minneapolis, MN 55474
Born 1970 | President and Principal Executive Officer (2015) | Vice President and Lead Chief Counsel, Ameriprise Financial, Inc. since January 2015 (previously Vice President and Chief Counsel, January 2010 - December 2014; officer of Columbia Funds and affiliated funds since 2007. |
Michael G. Clarke
225 Franklin Street
Boston, MA 02110
Born 1969 | Chief Financial Officer (Principal Financial Officer) (2009) and Senior Vice President (2019) | Vice President, Head of North American Operations, and Co-Head of Global Operations, Columbia Management Investment Advisers, LLC, since June 2019 (previously Vice President – Accounting and Tax, May 2010 - May 2019); senior officer of Columbia Funds and affiliated funds since 2002 (previously Treasurer and Chief Accounting Officer, January 2009 - January 2019 and December 2015 - January 2019, respectively). |
Joseph Beranek
5890 Ameriprise
Financial Center
Minneapolis, MN 55474
Born 1965 | Treasurer and Chief Accounting Officer (Principal Accounting Officer) (2019) | Vice President — Mutual Fund Accounting and Financial Reporting, Columbia Management Investment Advisers, LLC, since December 2018 and March 2017, respectively (previously Vice President — Pricing and Corporate Actions, May 2010 - March 2017). |
Paul B. Goucher
485 Lexington Avenue
New York, NY 10017
Born 1968 | Senior Vice President (2011) and Assistant Secretary (2008) | Senior Vice President and Assistant General Counsel, Ameriprise Financial, Inc. since January 2017 (previously Vice President and Lead Chief Counsel, November 2008 - January 2017 and January 2013 - January 2017, respectively); Vice President, Chief Legal Officer and Assistant Secretary, Columbia Management Investment Advisers, LLC since March 2015 (previously Vice President and Assistant Secretary, May 2010 – March 2015). |
Thomas P. McGuire
225 Franklin Street
Boston, MA 02110
Born 1972 | Senior Vice President and Chief Compliance Officer (2012) | Vice President — Asset Management Compliance, Ameriprise Financial, Inc., since May 2010; Chief Compliance Officer, Ameriprise Certificate Company since September 2010. |
Colin Moore
225 Franklin Street
Boston, MA 02110
Born 1958 | Senior Vice President (2010) | Executive Vice President and Global Chief Investment Officer, Ameriprise Financial, Inc., since July 2013; Executive Vice President and Global Chief Investment Officer, Columbia Management Investment Advisers, LLC since July 2013. |
Ryan C. Larrenaga
225 Franklin Street
Boston, MA 02110
Born 1970 | Senior Vice President (2017), Chief Legal Officer (2017), and Secretary (2015) | Vice President and Chief Counsel, Ameriprise Financial, Inc. since August 2018 (previously Vice President and Group Counsel, August 2011 - August 2018); officer of Columbia Funds and affiliated funds since 2005. |
Michael E. DeFao
225 Franklin Street
Boston, MA 02110
Born 1968 | Vice President (2011) and Assistant Secretary (2010) | Vice President and Chief Counsel, Ameriprise Financial, Inc. since May 2010. |
Lyn Kephart-Strong
5228 Ameriprise
Financial Center
Minneapolis, MN 55474
Born 1960 | Vice President (2015) | President, Columbia Management Investment Services Corp. since October 2014; Vice President & Resolution Officer, Ameriprise Trust Company since August 2009. |
| 60 | Columbia Multi-Asset Income Fund | Annual Report 2019 |
The Fund mails one shareholder report to each shareholder address, unless such shareholder elected to receive shareholder reports from the Fund electronically. If you would like more than one report, please call shareholder services at 800.345.6611 and additional reports will be sent to you.
Proxy voting policies and procedures
The policy of the Board of Trustees is to vote the proxies of the companies in which the Fund holds investments consistent with the procedures as stated in the Statement of Additional Information (SAI). You may obtain a copy of the SAI without charge by calling 800.345.6611; contacting your financial intermediary; visiting columbiathreadneedleus.com/investor/; or searching the website of the Securities and Exchange Commission (SEC) at sec.gov. Information regarding how the Fund voted proxies relating to portfolio securities is filed with the SEC by August 31st for the most recent 12-month period ending June 30th of that year, and is available without charge by visiting columbiathreadneedleus.com/investor/, or searching the website of the SEC at sec.gov.
Quarterly schedule of investments
The Fund files a complete schedule of portfolio holdings with the SEC for the first and third quarters of each fiscal year on Form N-Q or Form N-PORT (available for filings after March 31, 2019). The Fund’s Form N-Q or Form N-PORT is available on the SEC’s website at sec.gov. The Fund’s complete schedule of portfolio holdings, as filed on Form N-Q or Form N-PORT, can also be obtained without charge, upon request, by calling 800.345.6611.
Additional Fund information
For more information about the Fund, please visit columbiathreadneedleus.com/investor/ or call 800.345.6611. Customer Service Representatives are available to answer your questions Monday through Friday from 8 a.m. to 7 p.m. Eastern time.
Fund investment manager
Columbia Management Investment Advisers, LLC
225 Franklin Street
Boston, MA 02110
Fund distributor
Columbia Management Investment Distributors, Inc.
225 Franklin Street
Boston, MA 02110
Fund transfer agent
Columbia Management Investment Services Corp.
P.O. Box 219104
Kansas City, MO 64121-9104
Columbia Multi-Asset Income Fund | Annual Report 2019
| 61 |
[THIS PAGE INTENTIONALLY LEFT BLANK]
[THIS PAGE INTENTIONALLY LEFT BLANK]
Columbia Multi-Asset Income Fund
P.O. Box 219104
Kansas City, MO 64121-9104
Please read and consider the investment objectives, risks, charges and expenses for any fund carefully before investing. For a prospectus and summary prospectus, which contains this and other important information about the Fund, go to
columbiathreadneedleus.com/investor/. The Fund is distributed by Columbia Management Investment Distributors, Inc., member FINRA, and managed by Columbia Management Investment Advisers, LLC.
Columbia Threadneedle Investments (Columbia Threadneedle) is the global brand name of the Columbia and Threadneedle group of companies. All rights reserved.
© 2019 Columbia Management Investment Advisers, LLC.
columbiathreadneedleus.com/investor/
Item 2. Code of Ethics.
| | (a) | The registrant has adopted a code of ethics that applies to the registrant’s principal executive officer, principal financial officer, principal accounting officer or controller, or persons performing similar functions, regardless of whether these individuals are employed by the registrant or a third party. |
| | (b) | During the period covered by this report, there were not any amendments to a provision of the code of ethics that applies to the registrant’s principal executive officer, principal financial officer, principal accounting officer or controller, or persons performing similar functions, regardless of whether these individuals are employed by the registrant or a third party, and that relates to any element of the code of ethics definition enumerated in paragraph (b) of this Item. |
| | (c) | During the period covered by this report, there were no waivers, including any implicit waivers, from a provision of the code of ethics to the registrant’s principal executive officer, principal financial officer, principal accounting officer or controller, or persons performing similar functions, regardless of whether these individuals are employed by the registrant or a third party that relates to one or more of the items set forth in paragraph (b) of this Item. |
Item 3. Audit Committee Financial Expert.
The registrant’s Board of Trustees has determined that Douglas A. Hacker, David M. Moffett andAnne-Lee Verville, each of whom are members of the registrant’s Board of Trustees and Audit Committee, each qualify as an audit committee financial expert. Mr. Hacker, Mr. Moffett and Ms. Verville are each independent trustees, as defined in paragraph (a)(2) of this item’s instructions.
Item 4. Principal Accountant Fees and Services.
Fee information below is disclosed for the seven series of the registrant whose report to stockholders are included in this annual filing.
(a)Audit Fees. Aggregate Audit Fees billed by the principal accountant for professional services rendered during the fiscal years ended April 30, 2019 and April 30, 2018 are approximately as follows:
| | | | |
| 2019 | | 2018 | |
$286,500 | | $ | 267,900 | |
Audit Fees include amounts related to the audit of the registrant’s annual financial statements or services that are normally provided by the accountant in connection with statutory and regulatory filings or engagements for those fiscal years.
(b)Audit-Related Fees.Aggregate Audit-Related Fees billed to the registrant by the principal accountant for professional services rendered during the fiscal years ended April 30, 2019 and April 30, 2018 are approximately as follows:
Audit-Related Fees include amounts for assurance and related services by the principal accountant that are reasonably related to the performance of the audit of the registrant’s financial statements and are not reported in Audit Fees above. Fiscal year 2018 also includes agreed-upon procedures related to issuance of consents and review of FormN-1A.
During the fiscal years ended April 30, 2019 and April 30, 2018, there were no Audit-Related Fees billed by the registrant’s principal accountant to the registrant’s investment adviser (not including anysub-adviser whose role is primarily portfolio management and is subcontracted with or overseen by another investment adviser) and any entity controlling, controlled by, or under common control with the adviser that provides ongoing services to the registrant for an engagement that related directly to the operations and financial reporting of the registrant.
(c)Tax Fees. Aggregate Tax Fees billed by the principal accountant to the registrant for professional services rendered during the fiscal years ended April 30, 2019 and April 30, 2018 are approximately as follows:
| | | | |
| 2019 | | 2018 | |
$53,200 | | $ | 54,700 | |
Tax Fees include amounts for the review of annual tax returns, the review of required shareholder distribution calculations and typically include amounts for professional services by the principal accountant for tax compliance, tax advice and tax planning.
During the fiscal years ended April 30, 2019 and April 30, 2018, there were no Tax Fees billed by the registrant’s principal accountant to the registrant’s investment adviser (not including anysub-adviser whose role is primarily portfolio management and is subcontracted with or overseen by another investment adviser) and any entity controlling, controlled by, or under common control with the adviser that provides ongoing services to the registrant for an engagement that related directly to the operations and financial reporting of the registrant.
(d) All Other Fees. Aggregate All Other Fees billed by the principal accountant to the registrant for professional services rendered during the fiscal years ended April 30, 2019 and April 30, 2018 are approximately as follows:
All Other Fees include amounts for products and services provided by the principal accountant, other than the services reported in paragraphs (a) through (c) above.
Aggregate All Other Fees billed by the registrant’s principal accountant to the registrant’s investment adviser (not including anysub-adviser whose role is primarily portfolio management and is subcontracted with or overseen by another investment adviser) and any entity controlling, controlled by, or under common control with the adviser that provides ongoing services to the registrant for an engagement that related directly to the operations and financial reporting of the registrant during the fiscal years ended April 30, 2019 and April 30, 2018 are approximately as follows:
| | | | |
| 2019 | | 2018 | |
$242,500 | | $ | 242,500 | |
In fiscal years 2019 and 2018, All Other Fees primarily consists of fees billed for internal control examinations of the registrant’s transfer agent and investment adviser.
(e)(1) Audit CommitteePre-Approval Policies and Procedures
The registrant’s Audit Committee is required topre-approve the engagement of the registrant’s independent auditors to provide audit andnon-audit services to the registrant andnon-audit services to its investment adviser (excluding anysub-adviser whose role is primarily portfolio management and issub-contracted or overseen by another investment adviser (the “Adviser”) or any entity controlling, controlled by or under common control with the Adviser that provides ongoing services to the Fund (a “Control Affiliate”) if the engagement relates directly to the operations and financial reporting of the registrant.
The Audit Committee has adopted a Policy for Engagement of Independent Auditors for Audit andNon-Audit Services (the “Policy”). The Policy sets forth the understanding of the Audit Committee regarding the engagement of the registrant’s independent accountants to provide (i) audit and permissible audit-related, tax and other services to the registrant (“Fund Services”); (ii)non-audit services to the registrant’s Adviser and any Control Affiliates, that relates directly to the operations and financial reporting of a Fund (“Fund-related Adviser Services”); and (iii) certain other audit andnon-audit services to the registrant’s Adviser and its Control Affiliates. A service will require specificpre-approval by the Audit Committee if it is to be provided by the Fund’s independent auditor; provided, however, thatpre-approval ofnon-audit services to the Fund, the Adviser or Control Affiliates may be waived if certain de minimis requirements set forth in the SEC’s rules are met.
Under the Policy, the Audit Committee may delegatepre-approval authority to anypre-designated member or members who are independent board members. The member(s) to whom such authority is delegated must report, for informational purposes only, anypre-approval decisions to the Audit Committee at its next regular meeting. The Audit Committee’s responsibilities with respect to thepre-approval of services performed by the independent auditor may not be delegated to management.
On an annual basis, at a regularly scheduled Audit Committee meeting, the Fund’s Treasurer or other Fund officer shall submit to the Audit Committee a schedule of the types of Fund Services and Fund-related Adviser Services that are subject to specificpre-approval. This schedule will provide a description of each type of service that is subject to specificpre-approval, along with total projected fees for each service. Thepre-approval will generally cover aone-year period. The Audit Committee will review and approve the types of services and the projected fees for the nextone-year period and may add to, or subtract from, the list ofpre-approved services from time to time, based on subsequent determinations. This specific approval acknowledges that the Audit Committee is in agreement with the specific types of services that the independent auditor will be permitted to perform and the projected fees for each service.
The Fund’s Treasurer or other Fund officer shall report to the Audit Committee at each of its regular meetings regarding all Fund Services or Fund-related Adviser Services provided since the last such report was rendered, including a description of the services, by category, with forecasted fees for the annual reporting period, proposed changes requiring specificpre-approval and a description of services provided by the independent auditor, by category, with actual fees during the current reporting period.
*****
(e)(2) 100% of the services performed for items (b) through (d) above during 2019 and 2018 werepre-approved by the registrant’s Audit Committee.
(f) Not applicable.
(g) The aggregatenon-audit fees billed by the registrant’s accountant for services rendered to the registrant, and rendered to the registrant’s investment adviser (not including anysub-adviser whose role is primarily portfolio management and is subcontracted with or overseen by another investment adviser), and any entity controlling, controlled by, or under common control with the adviser that provides ongoing services to the registrant during the fiscal years ended April 30, 2019 and April 30, 2018 are approximately as follows:
| | | | |
| 2019 | | 2018 | |
$295,700 | | $ | 303,700 | |
(h) The registrant’s Audit Committee of the Board of Directors has considered whether the provision ofnon-audit services that were rendered to the registrant’s adviser (not including anysub-adviser whose role is primarily portfolio management and is subcontracted with or overseen by another investment adviser), and any entity controlling, controlled by, or under common control with the investment adviser that provides ongoing services to the registrant that were notpre-approved pursuant to paragraph (c)(7)(ii) of Rule2-01 of RegulationS-X, is compatible with maintaining the principal accountant’s independence.
Item 5. Audit Committee of Listed Registrants.
Not applicable.
Item 6. Investments
| | (a) | The registrant’s “Schedule I – Investments in securities of unaffiliated issuers” (as set forth in 17 CFR210.12-12) is included in Item 1 of this FormN-CSR. |
Item 7. Disclosure of Proxy Voting Policies and Procedures forClosed-End Management Investment Companies.
Not applicable.
Item 8. Portfolio Managers ofClosed-End Management Investment Companies.
Not applicable.
Item 9. Purchases of Equity Securities byClosed-End Management Investment Company and Affiliated Purchasers.
Not applicable.
Item 10. Submission of Matters to a Vote of Security Holders.
There were no material changes to the procedures by which shareholders may recommend nominees to the registrant’s board of directors.
Item 11. Controls and Procedures.
| | (a) | The registrant’s principal executive officer and principal financial officer, based on their evaluation of the registrant’s disclosure controls and procedures as of a date within 90 days of the filing of this report, have concluded that such controls and procedures are adequately designed to ensure that information required to be disclosed by the registrant in FormN-CSR is accumulated and communicated to the registrant’s management, including the principal executive officer and principal financial officer, or persons performing similar functions, as appropriate to allow timely decisions regarding required disclosure. |
| | (b) | There was no change in the registrant’s internal control over financial reporting that occurred during the period covered by this report that has materially affected, or is reasonably likely to materially affect, the registrant’s internal control over financial reporting. |
Item 12. Disclosure of Securities Lending Activities forClosed-End Management Investment Companies
Not applicable.
Item 13. Exhibits.
(a)(1) Code of ethics required to be disclosed under Item 2 of FormN-CSR attached hereto as Exhibit 99.CODE ETH.
(a)(2) Certifications pursuant to Rule30a-2(a) under the Investment Company Act of 1940 (17 CFR270.30a-2(a)) attached hereto as Exhibit 99.CERT.
(a)(3) Not applicable.
(b) Certification pursuant to Rule30a-2(b) under the Investment Company Act of 1940 (17 CFR270.30a-2(b)) attached hereto as Exhibit 99.906CERT.
SIGNATURES
Pursuant to the requirements of the Securities Exchange Act of 1934 and the Investment Company Act of 1940, the registrant has duly caused this report to be signed on its behalf by the undersigned, thereunto duly authorized.
(registrant) Columbia Funds Series Trust I
| | |
| By (Signature and Title) | | /s/ Christopher O. Petersen |
| | Christopher O. Petersen, President and Principal Executive Officer |
Date June 21, 2019
Pursuant to the requirements of the Securities Exchange Act of 1934 and the Investment Company Act of 1940, this report has been signed below by the following persons on behalf of the registrant and in the capacities and on the dates indicated.
| | |
| By (Signature and Title) | | /s/ Christopher O. Petersen |
| | Christopher O. Petersen, President and Principal Executive Officer |
Date June 21, 2019
| | |
| By (Signature and Title) | | /s/ Michael G. Clarke |
| | Michael G. Clarke, Chief Financial Officer |
Date June 21, 2019