UNITED STATES
SECURITIES AND EXCHANGE COMMISSION
Washington, D.C. 20549
FORMN-CSR
CERTIFIED SHAREHOLDER REPORT OF REGISTERED
MANAGEMENT INVESTMENT COMPANIES
Investment Company Act file number811-04367
Columbia Funds Series Trust I
(Exact name of registrant as specified in charter)
225 Franklin Street
Boston, Massachusetts 02110
(Address of principal executive offices) (Zip code)
Christopher O. Petersen, Esq.
c/o Columbia Management Investment Advisers, LLC
225 Franklin Street
Boston, Massachusetts 02110
Ryan C. Larrenaga, Esq.
c/o Columbia Management Investment Advisers, LLC
225 Franklin Street
Boston, MA 02110
(Name and address of agent for service)
Registrant’s telephone number, including area code: (800)345-6611
Date of fiscal year end: August 31
Date of reporting period: August 31, 2019
FormN-CSR is to be used by management investment companies to file reports with the Commission not later than 10 days after the transmission to stockholders of any report that is required to be transmitted to stockholders under Rule30e-1 under the Investment Company Act of 1940 (17 CFR270.30e-1). The Commission may use the information provided on FormN-CSR in its regulatory, disclosure review, inspection, and policymaking roles.
A registrant is required to disclose the information specified by FormN-CSR, and the Commission will make this information public. A registrant is not required to respond to the collection of information contained in FormN-CSR unless the Form displays a currently valid Office of Management and Budget (“OMB”) control number. Please direct comments concerning the accuracy of the information collection burden estimate and any suggestions for reducing the burden to Secretary, Securities and Exchange Commission, 100 F Street, NE, Washington, DC 20549. The OMB has reviewed this collection of information under the clearance requirements of 44 U.S.C. § 3507.
Item 1. Reports to Stockholders.

Annual Report
August 31, 2019
Columbia Contrarian Core Fund
Beginning on January 1, 2021, as permitted by regulations adopted by the Securities and Exchange Commission, paper copies of the Fund’s annual and semiannual shareholder reports like this one will no longer be sent by mail, unless you specifically request paper copies of the reports. Instead, the reports will be made available on the Fund’s website (columbiathreadneedleus.com/investor/), and each time a report is posted you will be notified by mail and provided with a website address to access the report.
If you have already elected to receive shareholder reports electronically, you will not be affected by this change and you need not take any action. You may elect to receive shareholder reports and other communications from the Fund electronically at any time by contacting your financial intermediary (such as a broker-dealer or bank) or, for Fund shares held directly with the Fund, by calling 800.345.6611 or by enrolling in “eDelivery” by logging into your account at columbiathreadneedleus.com/investor/.
You may elect to receive all future reports in paper free of charge. If you invest through a financial intermediary, you can contact your financial intermediary to request that you continue receiving paper copies of your shareholder reports. If you invest directly with the Fund, you can call 800.345.6611 to let the Fund know you wish to continue receiving paper copies of your shareholder reports. Your election to receive paper reports will apply to all Columbia Funds held in your account if you invest through a financial intermediary or all Columbia Funds held with the fund complex if you invest directly with the Fund.
Not FDIC Insured • No bank guarantee • May lose value
Columbia Contrarian Core Fund (the Fund) mails one shareholder report to each shareholder address, unless such shareholder elected to receive shareholder reports from the Fund electronically. If you would like more than one report, please call shareholder services at 800.345.6611 and additional reports will be sent to you.
Proxy voting policies and procedures
The policy of the Board of Trustees is to vote the proxies of the companies in which the Fund holds investments consistent with the procedures as stated in the Statement of Additional Information (SAI). You may obtain a copy of the SAI without charge by calling 800.345.6611; contacting your financial intermediary; visiting columbiathreadneedleus.com/investor/; or searching the website of the Securities and Exchange Commission (SEC) at sec.gov. Information regarding how the Fund voted proxies relating to portfolio securities is filed with the SEC by August 31st for the most recent 12-month period ending June 30th of that year, and is available without charge by visiting columbiathreadneedleus.com/investor/, or searching the website of the SEC at sec.gov.
Quarterly schedule of investments
The Fund files a complete schedule of portfolio holdings with the SEC for the first and third quarters of each fiscal year on Form N-PORT, and for reporting periods ended prior to March 31, 2019, on Form N-Q. The Fund’s Form N-Q and Form N-PORT filings are available on the SEC’s website at sec.gov. The Fund’s complete schedule of portfolio holdings, as filed on Form N-Q or Form N-PORT, can also be obtained without charge, upon request, by calling 800.345.6611.
Additional Fund information
For more information about the Fund, please visit columbiathreadneedleus.com/investor/ or call 800.345.6611. Customer Service Representatives are available to answer your questions Monday through Friday from 8 a.m. to 7 p.m. Eastern time.
Fund investment manager
Columbia Management Investment Advisers, LLC (the Investment Manager)
225 Franklin Street
Boston, MA 02110
Fund distributor
Columbia Management Investment Distributors, Inc.
225 Franklin Street
Boston, MA 02110
Fund transfer agent
Columbia Management Investment Services Corp.
P.O. Box 219104
Kansas City, MO 64121-9104
Columbia Contrarian Core Fund | Annual Report 2019
Investment objective
The Fund seeks total return, consisting of long-term capital appreciation and current income.
Portfolio management
Guy Pope, CFA
Portfolio Manager
Managed Fund since 2005
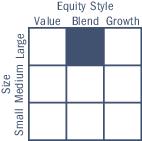
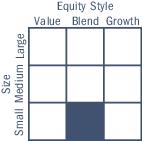
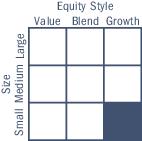
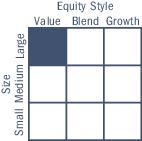
Morningstar style boxTM
The Morningstar Style Box is based on a fund’s portfolio holdings. For equity funds, the vertical axis shows the market capitalization of the stocks owned, and the horizontal axis shows investment style (value, blend, or growth). Information shown is based on the most recent data provided by Morningstar.
© 2019 Morningstar, Inc. All rights reserved. The Morningstar information contained herein: (1) is proprietary to Morningstar and/or its content providers; (2) may not be copied or distributed; and (3) is not warranted to be accurate, complete or timely. Neither Morningstar nor its content providers are responsible for any damages or losses arising from any use of this information.
| Average annual total returns (%) (for the period ended August 31, 2019) |
| | | Inception | 1 Year | 5 Years | 10 Years |
| Class A | Excluding sales charges | 11/01/98 | 2.49 | 8.65 | 12.81 |
| | Including sales charges | | -3.41 | 7.38 | 12.15 |
| Advisor Class* | 11/08/12 | 2.74 | 8.93 | 13.12 |
| Class C | Excluding sales charges | 12/09/02 | 1.73 | 7.84 | 11.98 |
| | Including sales charges | | 0.80 | 7.84 | 11.98 |
| Institutional Class | 12/14/92 | 2.75 | 8.93 | 13.11 |
| Institutional 2 Class* | 11/08/12 | 2.81 | 9.04 | 13.20 |
| Institutional 3 Class* | 11/08/12 | 2.90 | 9.10 | 13.24 |
| Class R* | 09/27/10 | 2.24 | 8.38 | 12.56 |
| Class V | Excluding sales charges | 02/12/93 | 2.52 | 8.65 | 12.80 |
| | Including sales charges | | -3.37 | 7.37 | 12.13 |
| Russell 1000 Index | | 2.49 | 9.85 | 13.49 |
Returns for Class A and Class V shares are shown with and without the maximum initial sales charge of 5.75%. Returns for Class C shares are shown with and without the 1.00% contingent deferred sales charge for the first year only. The Fund’s other share classes are not subject to sales charges and have limited eligibility. Please see the Fund’s prospectus for details. Performance for different share classes will vary based on differences in sales charges and fees associated with each share class. All results shown assume reinvestment of distributions during the period. Returns do not reflect the deduction of taxes that a shareholder may pay on Fund distributions or on the redemption of Fund shares. Performance results reflect the effect of any fee waivers or reimbursements of Fund expenses by Columbia Management Investment Advisers, LLC and/or any of its affiliates. Absent these fee waivers or expense reimbursement arrangements, performance results would have been lower.
The performance information shown represents past performance and is not a guarantee of future results. The investment return and principal value of your investment will fluctuate so that your shares, when redeemed, may be worth more or less than their original cost. Current performance may be lower or higher than the performance information shown. You may obtain performance information current to the most recent month-end by contacting your financial intermediary, visiting columbiathreadneedleus.com/investor/ or calling 800.345.6611.
| * | The returns shown for periods prior to the share class inception date (including returns for the Life of the Fund, if shown, which are since Fund inception) include the returns of the Fund’s oldest share class. These returns are adjusted to reflect any higher class-related operating expenses of the newer share classes, as applicable. Please visit columbiathreadneedleus.com/investor/investment-products/mutual-funds/appended-performance for more information. |
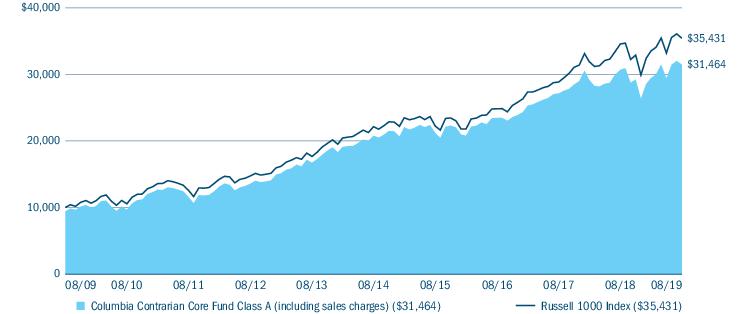
The Russell 1000 Index tracks the performance of 1,000 of the largest U.S. companies, based on market capitalization.
Indices are not available for investment, are not professionally managed and do not reflect sales charges, fees, brokerage commissions, taxes or other expenses of investing. Securities in the Fund may not match those in an index.
Columbia Contrarian Core Fund | Annual Report 2019
| 3 |
Fund at a Glance (continued)
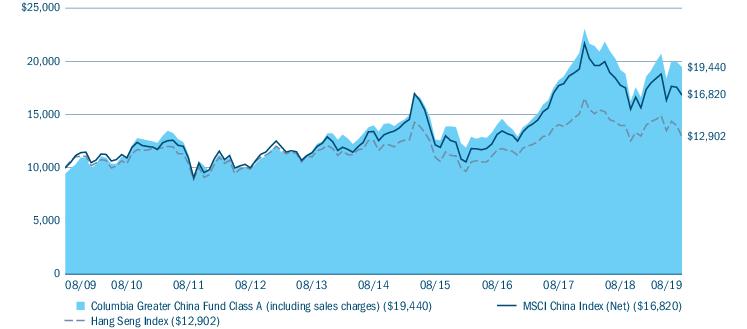
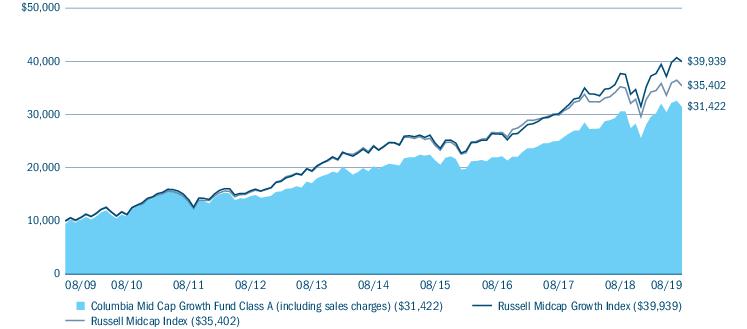
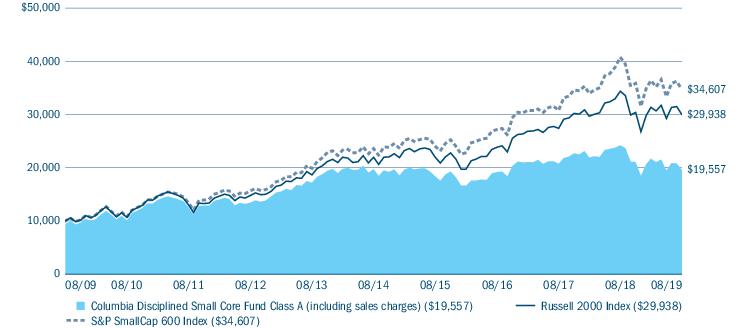
Performance of a hypothetical $10,000 investment (August 31, 2009 — August 31, 2019)
The chart above shows the change in value of a hypothetical $10,000 investment in Class A shares of Columbia Contrarian Core Fund during the stated time period, and does not reflect the deduction of taxes that a shareholder may pay on Fund distributions or on the redemption of Fund shares.
| Top 10 holdings (%) (at August 31, 2019) |
| Microsoft Corp. | 5.8 |
| Berkshire Hathaway, Inc., Class B | 4.0 |
| Apple, Inc. | 3.9 |
| Amazon.com, Inc. | 3.3 |
| Medtronic PLC | 3.0 |
| MasterCard, Inc., Class A | 3.0 |
| Comcast Corp., Class A | 2.9 |
| JPMorgan Chase & Co. | 2.9 |
| Citigroup, Inc. | 2.5 |
| Chevron Corp. | 2.4 |
Percentages indicated are based upon total investments excluding Money Market Funds and investments in derivatives, if any.
For further detail about these holdings, please refer to the section entitled “Portfolio of Investments.”
Fund holdings are as of the date given, are subject to change at any time, and are not recommendations to buy or sell any security.
| Portfolio breakdown (%) (at August 31, 2019) |
| Common Stocks | 98.3 |
| Money Market Funds | 1.7 |
| Total | 100.0 |
Percentages indicated are based upon total investments excluding investments in derivatives, if any. The Fund’s portfolio composition is subject to change.
| Equity sector breakdown (%) (at August 31, 2019) |
| Communication Services | 14.8 |
| Consumer Discretionary | 10.3 |
| Consumer Staples | 5.7 |
| Energy | 4.1 |
| Financials | 13.7 |
| Health Care | 13.5 |
| Industrials | 6.3 |
| Information Technology | 24.7 |
| Materials | 4.2 |
| Real Estate | 1.6 |
| Utilities | 1.1 |
| Total | 100.0 |
Percentages indicated are based upon total equity investments. The Fund’s portfolio composition is subject to change.
| 4 | Columbia Contrarian Core Fund | Annual Report 2019 |
Manager Discussion of Fund Performance
For the 12-month period that ended August 31, 2019, the Fund’s Class A shares returned 2.49% excluding sales charges. The Fund’s benchmark, the Russell 1000 Index, also returned 2.49% for the same period. The Fund performed in line with its benchmark, with stronger performance coming in the last nine months of the fiscal year.
Trade concerns, interest rates drove financial markets
Optimism prevailed early in the 12-month period ended August 31, 2019, as positive global economic conditions, the impact of broad U.S. corporate tax cuts and moves to reduce regulation in a number of industries buoyed confidence. The labor markets added 173,000 jobs per month, on average, and manufacturing activity remained solid. Unemployment fell to a 50-year low of 3.7%.
However, the economic backdrop looked less rosy as the period wore on. U.S. growth slowed from above 3.0% to 2.1% (annualized). European economies transitioned to a slower pace of growth, struggling with rising interest rates, trade tensions and uncertainty surrounding Brexit, the U.K.’s departure from the European Union. At the same time, China’s economic conditions weakened and emerging markets came under pressure, driven by trade and tariff concerns and a rising U.S. dollar.
With global uncertainties on the rise, investors sold stocks and other risky assets late in 2018. Stock markets rebounded early in 2019, as the Federal Reserve (the Fed) backed away from additional rate hikes, then dipped again in the final months of the period as trade concerns amplified. Late in July, the Fed lowered its key short-term borrowing rate by 25 basis points (a basis point is one hundredth of one percent).
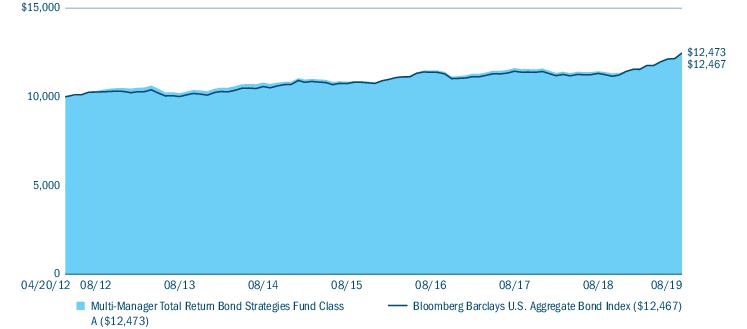
Bonds solidly outperformed equities for the 12-month period. The Bloomberg Barclays U.S. Aggregate Bond Index, a broad measure of investment-grade bonds, returned 10.17%. The S&P 500 Index, a broad measure of U.S. stock returns, gained 2.92%.
Contributors and detractors
In a volatile period for equities, the Fund generated solid gains through positive stock selection, especially in the information technology, real estate and communication services sectors. The Fund also benefited from a generally positive environment for growth stocks, which have been the beneficiaries of solid economic growth and low interest rates.
In the information technology sector, MasterCard, Inc., Microsoft Corp. and Fidelity National Information Services, Inc. were standout performers for the Fund. Mastercard has chalked up strong growth for such a large company. The company has benefited from the continued shift from cash to card payments, especially for smaller purchases, and from the growth in online purchases, which by definition are card purchases. We believe that Mastercard has the potential for additional domestic growth as well as international growth over the longer term. Microsoft continued to benefit from its shift to cloud computing. We believe Satya Nadella, Microsoft’s Chief Executive Officer, has done a great job of focusing the company on its core software business, which has enabled productivity for clients. Microsoft’s revenues and earnings have grown nicely, the valuation of the company has expanded and we believe investors have gained appreciation for the durability and growth potential of the franchise. Fidelity National is a financial processing and software company that provides software primarily to financial institutions. The company acquired Worldpay, Inc., which the Fund also owned, in a transaction that closed near the end of the period. We believe the acquisition has the potential to drive complementary synergies for the combined organization.
In the real estate sector, a position in global cell tower company American Tower Corp. generated outstanding gains. We believe that management has executed well, and investors currently appear to anticipate a healthy runway of growth linked to the introduction of fifth generation cellular network technology, commonly known as 5G. We believe that American Tower has the potential to see increased demand for its services as 5G technology is rolled out across the globe.
In the communication services sector, Comcast Corp. was a solid performer, with a double-digit rebound from the previous fiscal year. Early in 2018, Comcast announced that it would acquire U.K. media giant Sky Limited, beefing up its international presence. However, investors took a dim view of the acquisition and Comcast shares lost ground. Then, shares gained traction in 2019 as investors became more comfortable with the integration of the acquisition and strong broadband subscriber growth allayed concerns about weak video subscriber trends.
Columbia Contrarian Core Fund | Annual Report 2019
| 5 |
Manager Discussion of Fund Performance (continued)
In the biotechnology industry within health care, Biogen, Inc. was a significant disappointment as the company’s high-expectation Alzheimer’s drug aducanumab failed in its phase 3 trial. We had decreased the Fund’s position in Biogen, which helped mitigate the impact of its underperformance. American clothing company PVH Corp., owner of Calvin Klein, Tommy Hilfiger and other recognized brands, was hurt by slowing global growth and the potential impact of tariffs on the business. We chose to exit the position. In the financial sector, the Fund lost ground with Wells Fargo & Co. The company’s issues have taken longer than expected to resolve and the board has been slow to identify a replacement for the CEO, who recently stepped down. In addition, Wells Fargo has been hurt by declining interest rates, which have been a challenge for most banks. We reduced the Fund’s exposure but retained a position in Wells Fargo.
At period’s end
Mindful of the uncertainties of a slowing economy, the late stage of the economic cycle, rising geopolitical tensions and the forthcoming elections, we believe that investors will have much to negotiate and evaluate in the months ahead. As always, we plan to use the contrarian process that has served us well to find opportunities and manage risk in the portfolio. This discipline has also served our shareholders well over the long term.
Market riskmay affect a single issuer, sector of the economy, industry or the market as a whole.Foreign investments subject the Fund to risks, including political, economic, market, social and others within a particular country, as well as to currency instabilities and less stringent financial and accounting standards generally applicable to U.S. issuers.Growth securities, at times, may not perform as well as value securities or the stock market in general and may be out of favor with investors.Value securities may be unprofitable if the market fails to recognize their intrinsic worth or the portfolio manager misgauged that worth. The Fund may invest significantly in issuers within a particularsector, which may be negatively affected by market, economic or other conditions, making the Fund more vulnerable to unfavorable developments in the sector. See the Fund’s prospectus for more information on these and other risks.
The views expressed in this report reflect the current views of the respective parties. These views are not guarantees of future performance and involve certain risks, uncertainties and assumptions that are difficult to predict, so actual outcomes and results may differ significantly from the views expressed. These views are subject to change at any time based upon economic, market or other conditions and the respective parties disclaim any responsibility to update such views. These views may not be relied on as investment advice and, because investment decisions for a Columbia fund are based on numerous factors, may not be relied on as an indication of trading intent on behalf of any particular Columbia fund. References to specific securities should not be construed as a recommendation or investment advice.
| 6 | Columbia Contrarian Core Fund | Annual Report 2019 |
Understanding Your Fund’s Expenses
(Unaudited)
As an investor, you incur two types of costs. There are shareholder transaction costs, which generally include sales charges on purchases and may include redemption fees. There are also ongoing fund costs, which generally include management fees, distribution and/or service fees, and other fund expenses. The following information is intended to help you understand your ongoing costs (in dollars) of investing in the Fund and to help you compare these costs with the ongoing costs of investing in other mutual funds.
Analyzing your Fund’s expenses
To illustrate these ongoing costs, we have provided examples and calculated the expenses paid by investors in each share class of the Fund during the period. The actual and hypothetical information in the table is based on an initial investment of $1,000 at the beginning of the period indicated and held for the entire period. Expense information is calculated two ways and each method provides you with different information. The amount listed in the “Actual” column is calculated using the Fund’s actual operating expenses and total return for the period. You may use the Actual information, together with the amount invested, to estimate the expenses that you paid over the period. Simply divide your account value by $1,000 (for example, an $8,600 account value divided by $1,000 = 8.6), then multiply the results by the expenses paid during the period under the “Actual” column. The amount listed in the “Hypothetical” column assumes a 5% annual rate of return before expenses (which is not the Fund’s actual return) and then applies the Fund’s actual expense ratio for the period to the hypothetical return. You should not use the hypothetical account values and expenses to estimate either your actual account balance at the end of the period or the expenses you paid during the period. See “Compare with other funds” below for details on how to use the hypothetical data.
Compare with other funds
Since all mutual funds are required to include the same hypothetical calculations about expenses in shareholder reports, you can use this information to compare the ongoing cost of investing in the Fund with other funds. To do so, compare the hypothetical example with the 5% hypothetical examples that appear in the shareholder reports of other funds. As you compare hypothetical examples of other funds, it is important to note that hypothetical examples are meant to highlight the ongoing costs of investing in a fund only and do not reflect any transaction costs, such as sales charges, or redemption or exchange fees. Therefore, the hypothetical calculations are useful in comparing ongoing costs only, and will not help you determine the relative total costs of owning different funds. If transaction costs were included in these calculations, your costs would be higher.
| March 1, 2019 — August 31, 2019 |
| | Account value at the
beginning of the
period ($) | Account value at the
end of the
period ($) | Expenses paid during
the period ($) | Fund’s annualized
expense ratio (%) |
| | Actual | Hypothetical | Actual | Hypothetical | Actual | Hypothetical | Actual |
| Class A | 1,000.00 | 1,000.00 | 1,069.20 | 1,019.95 | 5.29 | 5.16 | 1.02 |
| Advisor Class | 1,000.00 | 1,000.00 | 1,070.70 | 1,021.21 | 4.00 | 3.90 | 0.77 |
| Class C | 1,000.00 | 1,000.00 | 1,065.30 | 1,016.19 | 9.16 | 8.95 | 1.77 |
| Institutional Class | 1,000.00 | 1,000.00 | 1,070.80 | 1,021.21 | 4.00 | 3.90 | 0.77 |
| Institutional 2 Class | 1,000.00 | 1,000.00 | 1,071.20 | 1,021.66 | 3.53 | 3.45 | 0.68 |
| Institutional 3 Class | 1,000.00 | 1,000.00 | 1,071.60 | 1,021.91 | 3.27 | 3.19 | 0.63 |
| Class R | 1,000.00 | 1,000.00 | 1,067.90 | 1,018.70 | 6.58 | 6.43 | 1.27 |
| Class V | 1,000.00 | 1,000.00 | 1,069.60 | 1,019.95 | 5.29 | 5.16 | 1.02 |
Expenses paid during the period are equal to the annualized expense ratio for each class as indicated above, multiplied by the average account value over the period and then multiplied by the number of days in the Fund’s most recent fiscal half year and divided by 365.
Expenses do not include fees and expenses incurred indirectly by the Fund from its investment in underlying funds, including affiliated and non-affiliated pooled investment vehicles, such as mutual funds and exchange-traded funds.
Columbia Contrarian Core Fund | Annual Report 2019
| 7 |
Portfolio of Investments
August 31, 2019
(Percentages represent value of investments compared to net assets)
Investments in securities
| Common Stocks 98.0% |
| Issuer | Shares | Value ($) |
| Communication Services 14.5% |
| Diversified Telecommunication Services 3.3% |
| AT&T, Inc. | 5,284,305 | 186,324,594 |
| Verizon Communications, Inc. | 2,276,623 | 132,408,394 |
| Total | | 318,732,988 |
| Entertainment 1.8% |
| Activision Blizzard, Inc. | 2,356,305 | 119,229,033 |
| Electronic Arts, Inc.(a) | 554,565 | 51,951,649 |
| Total | | 171,180,682 |
| Interactive Media & Services 6.1% |
| Alphabet, Inc., Class A(a) | 140,248 | 166,969,451 |
| Alphabet, Inc., Class C(a) | 184,887 | 219,664,245 |
| Facebook, Inc., Class A(a) | 1,093,885 | 203,101,628 |
| Total | | 589,735,324 |
| Media 2.8% |
| Comcast Corp., Class A | 6,233,736 | 275,905,156 |
| Wireless Telecommunication Services 0.5% |
| T-Mobile U.S.A., Inc.(a) | 683,875 | 53,376,444 |
| Total Communication Services | 1,408,930,594 |
| Consumer Discretionary 10.1% |
| Hotels, Restaurants & Leisure 2.5% |
| Aramark | 1,702,046 | 69,545,599 |
| McDonald’s Corp. | 601,673 | 131,146,664 |
| Restaurant Brands International, Inc. | 584,300 | 45,838,335 |
| Total | | 246,530,598 |
| Household Durables 0.7% |
| D.R. Horton, Inc. | 1,294,560 | 64,041,883 |
| Internet & Direct Marketing Retail 4.8% |
| Amazon.com, Inc.(a) | 178,815 | 317,627,296 |
| eBay, Inc. | 3,592,330 | 144,734,976 |
| Total | | 462,362,272 |
| Multiline Retail 0.2% |
| Dollar General Corp. | 148,998 | 23,257,098 |
| Common Stocks (continued) |
| Issuer | Shares | Value ($) |
| Specialty Retail 1.9% |
| Lowe’s Companies, Inc. | 1,628,079 | 182,670,464 |
| Total Consumer Discretionary | 978,862,315 |
| Consumer Staples 5.6% |
| Food & Staples Retailing 0.4% |
| Sysco Corp. | 511,726 | 38,036,594 |
| Food Products 2.6% |
| ConAgra Foods, Inc. | 3,386,456 | 96,039,892 |
| Mondelez International, Inc., Class A | 2,784,360 | 153,752,359 |
| Total | | 249,792,251 |
| Household Products 0.8% |
| Colgate-Palmolive Co. | 1,108,665 | 82,207,510 |
| Tobacco 1.8% |
| Philip Morris International, Inc. | 2,431,225 | 175,267,010 |
| Total Consumer Staples | 545,303,365 |
| Energy 4.0% |
| Energy Equipment & Services 0.1% |
| Schlumberger Ltd. | 513,285 | 16,645,833 |
| Oil, Gas & Consumable Fuels 3.9% |
| Canadian Natural Resources Ltd. | 2,524,939 | 60,346,042 |
| Chevron Corp. | 1,942,448 | 228,664,978 |
| EOG Resources, Inc. | 1,187,688 | 88,114,573 |
| Total | | 377,125,593 |
| Total Energy | 393,771,426 |
| Financials 13.4% |
| Banks 5.8% |
| Citigroup, Inc. | 3,733,506 | 240,251,111 |
| JPMorgan Chase & Co. | 2,494,913 | 274,091,142 |
| Wells Fargo & Co. | 1,062,990 | 49,503,445 |
| Total | | 563,845,698 |
| Capital Markets 2.5% |
| BlackRock, Inc. | 220,387 | 93,126,731 |
| Morgan Stanley | 3,591,200 | 148,998,888 |
| Total | | 242,125,619 |
The accompanying Notes to Financial Statements are an integral part of this statement.
| 8 | Columbia Contrarian Core Fund | Annual Report 2019 |
Portfolio of Investments (continued)
August 31, 2019
| Common Stocks (continued) |
| Issuer | Shares | Value ($) |
| Diversified Financial Services 3.9% |
| Berkshire Hathaway, Inc., Class B(a) | 1,879,006 | 382,208,610 |
| Insurance 1.2% |
| Aon PLC | 618,391 | 120,493,486 |
| Total Financials | 1,308,673,413 |
| Health Care 13.2% |
| Biotechnology 0.4% |
| Alexion Pharmaceuticals, Inc.(a) | 372,140 | 37,496,826 |
| Health Care Equipment & Supplies 6.4% |
| Abbott Laboratories | 969,994 | 82,759,888 |
| Baxter International, Inc. | 798,070 | 70,190,257 |
| Becton Dickinson and Co. | 394,190 | 100,092,725 |
| Dentsply Sirona, Inc. | 1,574,300 | 82,099,745 |
| Medtronic PLC | 2,687,672 | 289,972,932 |
| Total | | 625,115,547 |
| Health Care Providers & Services 2.7% |
| Anthem, Inc. | 475,109 | 124,250,506 |
| Cigna Corp. | 596,685 | 91,871,590 |
| Humana, Inc. | 161,040 | 45,608,138 |
| Total | | 261,730,234 |
| Pharmaceuticals 3.7% |
| Allergan PLC | 471,655 | 75,332,736 |
| Johnson & Johnson | 1,434,161 | 184,088,906 |
| Pfizer, Inc. | 2,841,934 | 101,030,754 |
| Total | | 360,452,396 |
| Total Health Care | 1,284,795,003 |
| Industrials 6.2% |
| Aerospace & Defense 3.3% |
| L3 Harris Technologies, Inc. | 404,480 | 85,511,116 |
| Northrop Grumman Corp. | 547,270 | 201,324,215 |
| Spirit AeroSystems Holdings, Inc., Class A | 441,318 | 35,570,231 |
| Total | | 322,405,562 |
| Electrical Equipment 0.7% |
| Emerson Electric Co. | 1,185,185 | 70,625,174 |
| Industrial Conglomerates 2.0% |
| Honeywell International, Inc. | 1,196,264 | 196,928,980 |
| Common Stocks (continued) |
| Issuer | Shares | Value ($) |
| Machinery 0.2% |
| Caterpillar, Inc. | 123,015 | 14,638,785 |
| Total Industrials | 604,598,501 |
| Information Technology 24.2% |
| Communications Equipment 0.9% |
| Cisco Systems, Inc. | 1,958,875 | 91,694,939 |
| Electronic Equipment, Instruments & Components 0.8% |
| Corning, Inc. | 2,633,445 | 73,341,443 |
| IT Services 7.6% |
| Fidelity National Information Services, Inc. | 1,442,065 | 196,438,094 |
| Fiserv, Inc.(a) | 1,220,494 | 130,519,628 |
| International Business Machines Corp. | 923,745 | 125,195,160 |
| MasterCard, Inc., Class A | 1,018,554 | 286,590,539 |
| Total | | 738,743,421 |
| Semiconductors & Semiconductor Equipment 4.0% |
| Broadcom, Inc. | 153,770 | 43,461,553 |
| Intel Corp. | 1,140,320 | 54,062,571 |
| Lam Research Corp. | 456,265 | 96,048,345 |
| Marvell Technology Group Ltd. | 1,759,265 | 42,169,582 |
| NVIDIA Corp. | 424,210 | 71,059,417 |
| NXP Semiconductors NV | 805,440 | 82,267,642 |
| Total | | 389,069,110 |
| Software 7.1% |
| Adobe, Inc.(a) | 401,680 | 114,281,977 |
| CDK Global, Inc. | 302,860 | 13,071,438 |
| Microsoft Corp. | 4,050,387 | 558,386,352 |
| Palo Alto Networks, Inc.(a) | 44,765 | 9,115,049 |
| Total | | 694,854,816 |
| Technology Hardware, Storage & Peripherals 3.8% |
| Apple, Inc. | 1,787,126 | 373,044,681 |
| Total Information Technology | 2,360,748,410 |
The accompanying Notes to Financial Statements are an integral part of this statement.
Columbia Contrarian Core Fund | Annual Report 2019
| 9 |
Portfolio of Investments (continued)
August 31, 2019
| Common Stocks (continued) |
| Issuer | Shares | Value ($) |
| Materials 4.2% |
| Chemicals 3.1% |
| Air Products & Chemicals, Inc. | 327,120 | 73,902,950 |
| Corteva, Inc. | 1,997,893 | 58,578,223 |
| DuPont de Nemours, Inc. | 1,137,873 | 77,295,713 |
| Mosaic Co. (The) | 1,589,145 | 29,224,377 |
| Sherwin-Williams Co. (The) | 111,619 | 58,795,308 |
| Total | | 297,796,571 |
| Metals & Mining 1.1% |
| Newmont Goldcorp Corp. | 2,667,175 | 106,393,611 |
| Total Materials | 404,190,182 |
| Real Estate 1.6% |
| Equity Real Estate Investment Trusts (REITS) 1.6% |
| American Tower Corp. | 677,372 | 155,924,261 |
| Total Real Estate | 155,924,261 |
| Common Stocks (continued) |
| Issuer | Shares | Value ($) |
| Utilities 1.0% |
| Electric Utilities 1.0% |
| American Electric Power Co., Inc. | 1,096,480 | 99,944,152 |
| Total Utilities | 99,944,152 |
Total Common Stocks
(Cost $6,392,617,457) | 9,545,741,622 |
|
| Money Market Funds 1.7% |
| | Shares | Value ($) |
| Columbia Short-Term Cash Fund, 2.208%(b),(c) | 164,033,216 | 164,016,812 |
Total Money Market Funds
(Cost $164,016,812) | 164,016,812 |
Total Investments in Securities
(Cost: $6,556,634,269) | 9,709,758,434 |
| Other Assets & Liabilities, Net | | 29,767,642 |
| Net Assets | 9,739,526,076 |
Notes to Portfolio of Investments
| (a) | Non-income producing investment. |
| (b) | The rate shown is the seven-day current annualized yield at August 31, 2019. |
| (c) | As defined in the Investment Company Act of 1940, an affiliated company is one in which the Fund owns 5% or more of the company’s outstanding voting securities, or a company which is under common ownership or control with the Fund. Holdings and transactions in these affiliated companies during the year ended August 31, 2019 are as follows: |
| Issuer | Beginning
shares | Shares
purchased | Shares
sold | Ending
shares | Realized gain
(loss) —
affiliated
issuers ($) | Net change in
unrealized
appreciation
(depreciation) —
affiliated
issuers ($) | Dividends —
affiliated
issuers ($) | Value —
affiliated
issuers
at end of
period ($) |
| Columbia Short-Term Cash Fund, 2.208% |
| | 40,983,443 | 2,980,284,472 | (2,857,234,699) | 164,033,216 | (740) | — | 3,966,060 | 164,016,812 |
Fair value measurements
The Fund categorizes its fair value measurements according to a three-level hierarchy that maximizes the use of observable inputs and minimizes the use of unobservable inputs by prioritizing that the most observable input be used when available. Observable inputs are those that market participants would use in pricing an investment based on market data obtained from sources independent of the reporting entity. Unobservable inputs are those that reflect the Fund’s assumptions about the information market participants would use in pricing an investment. An investment’s level within the fair value hierarchy is based on the lowest level of any input that is deemed significant to the asset’s or liability’s fair value measurement. The input levels are not necessarily an indication of the risk or liquidity associated with investments at that level. For example, certain U.S. government securities are generally high quality and liquid, however, they are reflected as Level 2 because the inputs used to determine fair value may not always be quoted prices in an active market.
Fair value inputs are summarized in the three broad levels listed below:
| ■ | Level 1 — Valuations based on quoted prices for investments in active markets that the Fund has the ability to access at the measurement date. Valuation adjustments are not applied to Level 1 investments. |
| ■ | Level 2 — Valuations based on other significant observable inputs (including quoted prices for similar securities, interest rates, prepayment speeds, credit risks, etc.). |
| ■ | Level 3 — Valuations based on significant unobservable inputs (including the Fund’s own assumptions and judgment in determining the fair value of investments). |
The accompanying Notes to Financial Statements are an integral part of this statement.
| 10 | Columbia Contrarian Core Fund | Annual Report 2019 |
Portfolio of Investments (continued)
August 31, 2019
Fair value measurements (continued)
Inputs that are used in determining fair value of an investment may include price information, credit data, volatility statistics, and other factors. These inputs can be either observable or unobservable. The availability of observable inputs can vary between investments, and is affected by various factors such as the type of investment, and the volume and level of activity for that investment or similar investments in the marketplace. The inputs will be considered by the Investment Manager, along with any other relevant factors in the calculation of an investment’s fair value. The Fund uses prices and inputs that are current as of the measurement date, which may include periods of market dislocations. During these periods, the availability of prices and inputs may be reduced for many investments. This condition could cause an investment to be reclassified between the various levels within the hierarchy.
Investments falling into the Level 3 category are primarily supported by quoted prices from brokers and dealers participating in the market for those investments. However, these may be classified as Level 3 investments due to lack of market transparency and corroboration to support these quoted prices. Additionally, valuation models may be used as the pricing source for any remaining investments classified as Level 3. These models may rely on one or more significant unobservable inputs and/or significant assumptions by the Investment Manager. Inputs used in valuations may include, but are not limited to, financial statement analysis, capital account balances, discount rates and estimated cash flows, and comparable company data.
Under the direction of the Fund’s Board of Trustees (the Board), the Investment Manager’s Valuation Committee (the Committee) is responsible for overseeing the valuation procedures approved by the Board. The Committee consists of voting and non-voting members from various groups within the Investment Manager’s organization, including operations and accounting, trading and investments, compliance, risk management and legal.
The Committee meets at least monthly to review and approve valuation matters, which may include a description of specific valuation determinations, data regarding pricing information received from approved pricing vendors and brokers and the results of Board-approved valuation control policies and procedures (the Policies). The Policies address, among other things, instances when market quotations are or are not readily available, including recommendations of third party pricing vendors and a determination of appropriate pricing methodologies; events that require specific valuation determinations and assessment of fair value techniques; securities with a potential for stale pricing, including those that are illiquid, restricted, or in default; and the effectiveness of third party pricing vendors, including periodic reviews of vendors. The Committee meets more frequently, as needed, to discuss additional valuation matters, which may include the need to review back-testing results, review time-sensitive information or approve related valuation actions. The Committee reports to the Board, with members of the Committee meeting with the Board at each of its regularly scheduled meetings to discuss valuation matters and actions during the period, similar to those described earlier.
The following table is a summary of the inputs used to value the Fund’s investments at August 31, 2019:
| | Level 1 ($) | Level 2 ($) | Level 3 ($) | Total ($) |
| Investments in Securities | | | | |
| Common Stocks | | | | |
| Communication Services | 1,408,930,594 | — | — | 1,408,930,594 |
| Consumer Discretionary | 978,862,315 | — | — | 978,862,315 |
| Consumer Staples | 545,303,365 | — | — | 545,303,365 |
| Energy | 393,771,426 | — | — | 393,771,426 |
| Financials | 1,308,673,413 | — | — | 1,308,673,413 |
| Health Care | 1,284,795,003 | — | — | 1,284,795,003 |
| Industrials | 604,598,501 | — | — | 604,598,501 |
| Information Technology | 2,360,748,410 | — | — | 2,360,748,410 |
| Materials | 404,190,182 | — | — | 404,190,182 |
| Real Estate | 155,924,261 | — | — | 155,924,261 |
| Utilities | 99,944,152 | — | — | 99,944,152 |
| Total Common Stocks | 9,545,741,622 | — | — | 9,545,741,622 |
| Money Market Funds | 164,016,812 | — | — | 164,016,812 |
| Total Investments in Securities | 9,709,758,434 | — | — | 9,709,758,434 |
See the Portfolio of Investments for all investment classifications not indicated in the table.
The accompanying Notes to Financial Statements are an integral part of this statement.
Columbia Contrarian Core Fund | Annual Report 2019
| 11 |
Statement of Assets and Liabilities
August 31, 2019
| Assets | |
| Investments in securities, at value | |
| Unaffiliated issuers (cost $6,392,617,457) | $9,545,741,622 |
| Affiliated issuers (cost $164,016,812) | 164,016,812 |
| Receivable for: | |
| Investments sold | 21,382,866 |
| Capital shares sold | 4,149,276 |
| Dividends | 14,917,043 |
| Foreign tax reclaims | 69,805 |
| Prepaid expenses | 63,004 |
| Trustees’ deferred compensation plan | 608,387 |
| Total assets | 9,750,948,815 |
| Liabilities | |
| Payable for: | |
| Investments purchased | 506,599 |
| Capital shares purchased | 8,756,748 |
| Management services fees | 163,946 |
| Distribution and/or service fees | 28,918 |
| Transfer agent fees | 1,120,400 |
| Compensation of chief compliance officer | 643 |
| Other expenses | 237,098 |
| Trustees’ deferred compensation plan | 608,387 |
| Total liabilities | 11,422,739 |
| Net assets applicable to outstanding capital stock | $9,739,526,076 |
| Represented by | |
| Paid in capital | 6,268,783,650 |
| Total distributable earnings (loss) (Note 2) | 3,470,742,426 |
| Total - representing net assets applicable to outstanding capital stock | $9,739,526,076 |
The accompanying Notes to Financial Statements are an integral part of this statement.
| 12 | Columbia Contrarian Core Fund | Annual Report 2019 |
Statement of Assets and Liabilities (continued)
August 31, 2019
| Class A | |
| Net assets | $1,568,622,301 |
| Shares outstanding | 61,551,079 |
| Net asset value per share | $25.48 |
| Maximum sales charge | 5.75% |
| Maximum offering price per share (calculated by dividing the net asset value per share by 1.0 minus the maximum sales charge for Class A shares) | $27.03 |
| Advisor Class | |
| Net assets | $610,685,984 |
| Shares outstanding | 23,320,405 |
| Net asset value per share | $26.19 |
| Class C | |
| Net assets | $561,715,981 |
| Shares outstanding | 24,592,407 |
| Net asset value per share | $22.84 |
| Institutional Class | |
| Net assets | $3,961,439,655 |
| Shares outstanding | 154,075,254 |
| Net asset value per share | $25.71 |
| Institutional 2 Class | |
| Net assets | $638,213,444 |
| Shares outstanding | 24,383,662 |
| Net asset value per share | $26.17 |
| Institutional 3 Class | |
| Net assets | $2,123,061,704 |
| Shares outstanding | 81,061,886 |
| Net asset value per share | $26.19 |
| Class R | |
| Net assets | $124,950,623 |
| Shares outstanding | 4,903,639 |
| Net asset value per share | $25.48 |
| Class V | |
| Net assets | $150,836,384 |
| Shares outstanding | 5,981,919 |
| Net asset value per share | $25.22 |
| Maximum sales charge | 5.75% |
| Maximum offering price per share (calculated by dividing the net asset value per share by 1.0 minus the maximum sales charge for Class V shares) | $26.76 |
The accompanying Notes to Financial Statements are an integral part of this statement.
Columbia Contrarian Core Fund | Annual Report 2019
| 13 |
Statement of Operations
Year Ended August 31, 2019
| Net investment income | |
| Income: | |
| Dividends — unaffiliated issuers | $191,896,759 |
| Dividends — affiliated issuers | 3,966,060 |
| Interfund lending | 2,307 |
| Foreign taxes withheld | (775,426) |
| Total income | 195,089,700 |
| Expenses: | |
| Management services fees | 61,766,499 |
| Distribution and/or service fees | |
| Class A | 4,107,841 |
| Class C | 6,052,781 |
| Class R | 653,845 |
| Class T | 704 |
| Class V | 374,613 |
| Transfer agent fees | |
| Class A | 2,439,945 |
| Advisor Class | 955,634 |
| Class C | 898,909 |
| Institutional Class | 6,120,009 |
| Institutional 2 Class | 413,758 |
| Institutional 3 Class | 159,636 |
| Class R | 194,224 |
| Class T | 413 |
| Class V | 222,519 |
| Compensation of board members | 164,919 |
| Custodian fees | 66,938 |
| Printing and postage fees | 488,698 |
| Registration fees | 212,569 |
| Audit fees | 29,000 |
| Legal fees | 205,131 |
| Interest on interfund lending | 5,546 |
| Compensation of chief compliance officer | 4,003 |
| Other | 276,644 |
| Total expenses | 85,814,778 |
| Net investment income | 109,274,922 |
| Realized and unrealized gain (loss) — net | |
| Net realized gain (loss) on: | |
| Investments — unaffiliated issuers | 434,323,724 |
| Investments — affiliated issuers | (740) |
| Foreign currency translations | 11,728 |
| Net realized gain | 434,334,712 |
| Net change in unrealized appreciation (depreciation) on: | |
| Investments — unaffiliated issuers | (379,960,922) |
| Net change in unrealized appreciation (depreciation) | (379,960,922) |
| Net realized and unrealized gain | 54,373,790 |
| Net increase in net assets resulting from operations | $163,648,712 |
The accompanying Notes to Financial Statements are an integral part of this statement.
| 14 | Columbia Contrarian Core Fund | Annual Report 2019 |
Statement of Changes in Net Assets
| | Year Ended
August 31, 2019 | Year Ended
August 31, 2018 |
| Operations | | |
| Net investment income | $109,274,922 | $99,168,716 |
| Net realized gain | 434,334,712 | 736,139,912 |
| Net change in unrealized appreciation (depreciation) | (379,960,922) | 591,454,414 |
| Net increase in net assets resulting from operations | 163,648,712 | 1,426,763,042 |
| Distributions to shareholders | | |
| Net investment income and net realized gains | | |
| Class A | (138,918,391) | |
| Advisor Class | (58,114,280) | |
| Class C | (52,570,730) | |
| Institutional Class | (360,754,860) | |
| Institutional 2 Class | (63,631,067) | |
| Institutional 3 Class | (168,677,334) | |
| Class R | (10,681,165) | |
| Class T | (77,659) | |
| Class V | (12,567,222) | |
| Net investment income | | |
| Class A | | (13,688,620) |
| Advisor Class | | (6,065,193) |
| Institutional Class | | (45,538,309) |
| Institutional 2 Class | | (8,571,940) |
| Institutional 3 Class | | (20,115,690) |
| Class K | | (48,187) |
| Class R | | (641,230) |
| Class T | | (8,444) |
| Class V | | (1,127,941) |
| Net realized gains | | |
| Class A | | (93,913,407) |
| Advisor Class | | (31,380,381) |
| Class C | | (40,119,346) |
| Institutional Class | | (235,608,254) |
| Institutional 2 Class | | (40,157,532) |
| Institutional 3 Class | | (90,640,911) |
| Class K | | (292,694) |
| Class R | | (6,615,240) |
| Class T | | (57,932) |
| Class V | | (7,738,463) |
| Total distributions to shareholders (Note 2) | (865,992,708) | (642,329,714) |
| Decrease in net assets from capital stock activity | (1,118,537,358) | (116,288,386) |
| Total increase (decrease) in net assets | (1,820,881,354) | 668,144,942 |
| Net assets at beginning of year | 11,560,407,430 | 10,892,262,488 |
| Net assets at end of year | $9,739,526,076 | $11,560,407,430 |
| Undistributed net investment income | $68,845,491 | $66,473,849 |
The accompanying Notes to Financial Statements are an integral part of this statement.
Columbia Contrarian Core Fund | Annual Report 2019
| 15 |
Statement of Changes in Net Assets (continued)
| | Year Ended | Year Ended |
| | August 31, 2019 | August 31, 2018 |
| | Shares | Dollars ($) | Shares | Dollars ($) |
| Capital stock activity |
| Class A | | | | |
| Subscriptions | 6,431,275 | 157,963,212 | 12,208,122 | 316,921,667 |
| Distributions reinvested | 5,690,953 | 128,729,350 | 3,884,229 | 99,008,995 |
| Redemptions | (20,887,147) | (515,474,948) | (22,154,412) | (575,389,741) |
| Net decrease | (8,764,919) | (228,782,386) | (6,062,061) | (159,459,079) |
| Advisor Class | | | | |
| Subscriptions | 6,887,887 | 176,244,532 | 11,310,517 | 300,451,143 |
| Distributions reinvested | 2,390,774 | 55,465,956 | 1,389,820 | 36,260,392 |
| Redemptions | (12,620,684) | (311,060,038) | (8,970,419) | (238,568,015) |
| Net increase (decrease) | (3,342,023) | (79,349,550) | 3,729,918 | 98,143,520 |
| Class C | | | | |
| Subscriptions | 2,228,152 | 48,745,816 | 4,636,954 | 109,134,302 |
| Distributions reinvested | 2,358,614 | 48,068,563 | 1,592,042 | 36,871,699 |
| Redemptions | (8,810,129) | (193,575,408) | (9,819,541) | (231,021,490) |
| Net decrease | (4,223,363) | (96,761,029) | (3,590,545) | (85,015,489) |
| Institutional Class | | | | |
| Subscriptions | 23,377,561 | 578,493,873 | 32,541,591 | 849,445,217 |
| Distributions reinvested | 14,515,717 | 330,668,024 | 10,065,737 | 258,286,816 |
| Redemptions | (62,124,113) | (1,527,803,654) | (57,893,556) | (1,516,465,968) |
| Net decrease | (24,230,835) | (618,641,757) | (15,286,228) | (408,733,935) |
| Institutional 2 Class | | | | |
| Subscriptions | 7,270,167 | 178,340,987 | 12,831,692 | 340,843,986 |
| Distributions reinvested | 2,742,768 | 63,549,930 | 1,868,398 | 48,709,121 |
| Redemptions | (17,730,297) | (441,115,098) | (12,546,333) | (332,078,939) |
| Net increase (decrease) | (7,717,362) | (199,224,181) | 2,153,757 | 57,474,168 |
| Institutional 3 Class | | | | |
| Subscriptions | 23,849,900 | 588,023,383 | 29,449,843 | 779,912,063 |
| Distributions reinvested | 4,840,762 | 112,208,870 | 2,580,501 | 67,273,670 |
| Redemptions | (22,980,661) | (579,666,449) | (17,189,124) | (461,087,450) |
| Net increase | 5,710,001 | 120,565,804 | 14,841,220 | 386,098,283 |
| Class K | | | | |
| Subscriptions | — | — | 10,761 | 288,499 |
| Distributions reinvested | — | — | 13,282 | 340,682 |
| Redemptions | — | — | (269,627) | (7,180,214) |
| Net decrease | — | — | (245,584) | (6,551,033) |
| Class R | | | | |
| Subscriptions | 731,640 | 18,022,092 | 1,298,152 | 33,613,269 |
| Distributions reinvested | 408,080 | 9,243,026 | 229,073 | 5,848,237 |
| Redemptions | (1,603,759) | (39,763,909) | (1,370,468) | (35,554,329) |
| Net increase (decrease) | (464,039) | (12,498,791) | 156,757 | 3,907,177 |
| Class T | | | | |
| Subscriptions | — | — | 726 | 19,043 |
| Distributions reinvested | 3,415 | 77,207 | 2,595 | 66,153 |
| Redemptions | (41,813) | (938,561) | (18,306) | (475,567) |
| Net decrease | (38,398) | (861,354) | (14,985) | (390,371) |
| Class V | | | | |
| Subscriptions | 142,392 | 3,222,198 | 246,930 | 6,375,877 |
| Distributions reinvested | 399,819 | 8,947,940 | 250,684 | 6,329,782 |
| Redemptions | (625,048) | (15,154,252) | (564,074) | (14,467,286) |
| Net decrease | (82,837) | (2,984,114) | (66,460) | (1,761,627) |
| Total net decrease | (43,153,775) | (1,118,537,358) | (4,384,211) | (116,288,386) |
The accompanying Notes to Financial Statements are an integral part of this statement.
| 16 | Columbia Contrarian Core Fund | Annual Report 2019 |
[THIS PAGE INTENTIONALLY LEFT BLANK]
Columbia Contrarian Core Fund | Annual Report 2019
| 17 |
The following table is intended to help you understand the Fund’s financial performance. Certain information reflects financial results for a single share of a class held for the periods shown. Per share net investment income (loss) amounts are calculated based on average shares outstanding during the period. Total return assumes reinvestment of all dividends and distributions, if any. Total return does not reflect payment of sales charges, if any. Total return and portfolio turnover are not annualized for periods of less than one year. The portfolio turnover rate is calculated without regard to purchase and sales transactions of short-term instruments and certain derivatives, if any. If such transactions were included, the Fund’s portfolio turnover rate may be higher.
| | Net asset value,
beginning of
period | Net
investment
income
(loss) | Net
realized
and
unrealized
gain (loss) | Total from
investment
operations | Distributions
from net
investment
income | Distributions
from net
realized
gains | Total
distributions to
shareholders |
| Class A |
| Year Ended 8/31/2019 | $27.19 | 0.22 | 0.19 | 0.41 | (0.22) | (1.90) | (2.12) |
| Year Ended 8/31/2018 | $25.41 | 0.18 | 3.05 | 3.23 | (0.18) | (1.27) | (1.45) |
| Year Ended 8/31/2017 | $22.29 | 0.19 | 3.25 | 3.44 | (0.15) | (0.17) | (0.32) |
| Year Ended 8/31/2016 | $21.27 | 0.15 | 2.05 | 2.20 | (0.55) | (0.63) | (1.18) |
| Year Ended 8/31/2015 | $22.37 | 0.65(e) | (0.23) | 0.42 | (0.10) | (1.42) | (1.52) |
| Advisor Class |
| Year Ended 8/31/2019 | $27.89 | 0.29 | 0.19 | 0.48 | (0.28) | (1.90) | (2.18) |
| Year Ended 8/31/2018 | $26.02 | 0.25 | 3.13 | 3.38 | (0.24) | (1.27) | (1.51) |
| Year Ended 8/31/2017 | $22.81 | 0.26 | 3.33 | 3.59 | (0.21) | (0.17) | (0.38) |
| Year Ended 8/31/2016 | $21.74 | 0.21 | 2.09 | 2.30 | (0.60) | (0.63) | (1.23) |
| Year Ended 8/31/2015 | $22.83 | 0.80(e) | (0.32) | 0.48 | (0.15) | (1.42) | (1.57) |
| Class C |
| Year Ended 8/31/2019 | $24.57 | 0.04 | 0.15 | 0.19 | (0.02) | (1.90) | (1.92) |
| Year Ended 8/31/2018 | $23.09 | (0.01) | 2.76 | 2.75 | — | (1.27) | (1.27) |
| Year Ended 8/31/2017 | $20.28 | 0.01 | 2.97 | 2.98 | (0.00)(f) | (0.17) | (0.17) |
| Year Ended 8/31/2016 | $19.43 | (0.00)(f) | 1.86 | 1.86 | (0.38) | (0.63) | (1.01) |
| Year Ended 8/31/2015 | $20.62 | 0.50(e) | (0.27) | 0.23 | — | (1.42) | (1.42) |
| Institutional Class |
| Year Ended 8/31/2019 | $27.42 | 0.29 | 0.18 | 0.47 | (0.28) | (1.90) | (2.18) |
| Year Ended 8/31/2018 | $25.61 | 0.25 | 3.07 | 3.32 | (0.24) | (1.27) | (1.51) |
| Year Ended 8/31/2017 | $22.45 | 0.25 | 3.29 | 3.54 | (0.21) | (0.17) | (0.38) |
| Year Ended 8/31/2016 | $21.42 | 0.21 | 2.05 | 2.26 | (0.60) | (0.63) | (1.23) |
| Year Ended 8/31/2015 | $22.52 | 0.66(e) | (0.18) | 0.48 | (0.16) | (1.42) | (1.58) |
| Institutional 2 Class |
| Year Ended 8/31/2019 | $27.88 | 0.32 | 0.18 | 0.50 | (0.31) | (1.90) | (2.21) |
| Year Ended 8/31/2018 | $26.01 | 0.28 | 3.13 | 3.41 | (0.27) | (1.27) | (1.54) |
| Year Ended 8/31/2017 | $22.80 | 0.28 | 3.33 | 3.61 | (0.23) | (0.17) | (0.40) |
| Year Ended 8/31/2016 | $21.73 | 0.24 | 2.09 | 2.33 | (0.63) | (0.63) | (1.26) |
| Year Ended 8/31/2015 | $22.83 | 0.78(e) | (0.28) | 0.50 | (0.18) | (1.42) | (1.60) |
The accompanying Notes to Financial Statements are an integral part of this statement.
| 18 | Columbia Contrarian Core Fund | Annual Report 2019 |
Financial Highlights (continued)
| | Net
asset
value,
end of
period | Total
return | Total gross
expense
ratio to
average
net assets(a) | Total net
expense
ratio to
average
net assets(a),(b) | Net investment
income (loss)
ratio to
average
net assets | Portfolio
turnover | Net
assets,
end of
period
(000’s) |
| Class A |
| Year Ended 8/31/2019 | $25.48 | 2.49% | 1.03%(c) | 1.03%(c) | 0.91% | 53% | $1,568,622 |
| Year Ended 8/31/2018 | $27.19 | 13.09% | 1.02% | 1.02%(d) | 0.70% | 63% | $1,912,203 |
| Year Ended 8/31/2017 | $25.41 | 15.61% | 1.04% | 1.04%(d) | 0.82% | 52% | $1,941,062 |
| Year Ended 8/31/2016 | $22.29 | 10.79% | 1.07% | 1.07%(d) | 0.72% | 47% | $2,860,806 |
| Year Ended 8/31/2015 | $21.27 | 1.99% | 1.09% | 1.09%(d) | 2.93% | 60% | $2,297,176 |
| Advisor Class |
| Year Ended 8/31/2019 | $26.19 | 2.74% | 0.78%(c) | 0.78%(c) | 1.16% | 53% | $610,686 |
| Year Ended 8/31/2018 | $27.89 | 13.39% | 0.77% | 0.77%(d) | 0.95% | 63% | $743,515 |
| Year Ended 8/31/2017 | $26.02 | 15.91% | 0.80% | 0.80%(d) | 1.07% | 52% | $596,704 |
| Year Ended 8/31/2016 | $22.81 | 11.07% | 0.82% | 0.82%(d) | 0.99% | 47% | $377,946 |
| Year Ended 8/31/2015 | $21.74 | 2.25% | 0.85% | 0.85%(d) | 3.53% | 60% | $227,941 |
| Class C |
| Year Ended 8/31/2019 | $22.84 | 1.73% | 1.78%(c) | 1.78%(c) | 0.16% | 53% | $561,716 |
| Year Ended 8/31/2018 | $24.57 | 12.23% | 1.77% | 1.77%(d) | (0.05%) | 63% | $708,041 |
| Year Ended 8/31/2017 | $23.09 | 14.80% | 1.79% | 1.79%(d) | 0.07% | 52% | $748,148 |
| Year Ended 8/31/2016 | $20.28 | 9.98% | 1.83% | 1.83%(d) | (0.02%) | 47% | $669,226 |
| Year Ended 8/31/2015 | $19.43 | 1.17% | 1.85% | 1.85%(d) | 2.46% | 60% | $409,798 |
| Institutional Class |
| Year Ended 8/31/2019 | $25.71 | 2.75% | 0.78%(c) | 0.78%(c) | 1.16% | 53% | $3,961,440 |
| Year Ended 8/31/2018 | $27.42 | 13.37% | 0.77% | 0.77%(d) | 0.95% | 63% | $4,889,699 |
| Year Ended 8/31/2017 | $25.61 | 15.95% | 0.80% | 0.80%(d) | 1.07% | 52% | $4,958,099 |
| Year Ended 8/31/2016 | $22.45 | 11.05% | 0.82% | 0.82%(d) | 0.99% | 47% | $4,234,639 |
| Year Ended 8/31/2015 | $21.42 | 2.24% | 0.84% | 0.84%(d) | 2.97% | 60% | $2,119,278 |
| Institutional 2 Class |
| Year Ended 8/31/2019 | $26.17 | 2.81% | 0.68%(c) | 0.68%(c) | 1.25% | 53% | $638,213 |
| Year Ended 8/31/2018 | $27.88 | 13.50% | 0.68% | 0.68% | 1.04% | 63% | $894,849 |
| Year Ended 8/31/2017 | $26.01 | 16.05% | 0.69% | 0.69% | 1.17% | 52% | $779,002 |
| Year Ended 8/31/2016 | $22.80 | 11.22% | 0.70% | 0.70% | 1.12% | 47% | $627,659 |
| Year Ended 8/31/2015 | $21.73 | 2.34% | 0.71% | 0.71% | 3.45% | 60% | $336,043 |
The accompanying Notes to Financial Statements are an integral part of this statement.
Columbia Contrarian Core Fund | Annual Report 2019
| 19 |
Financial Highlights (continued)
| | Net asset value,
beginning of
period | Net
investment
income
(loss) | Net
realized
and
unrealized
gain (loss) | Total from
investment
operations | Distributions
from net
investment
income | Distributions
from net
realized
gains | Total
distributions to
shareholders |
| Institutional 3 Class |
| Year Ended 8/31/2019 | $27.89 | 0.33 | 0.19 | 0.52 | (0.32) | (1.90) | (2.22) |
| Year Ended 8/31/2018 | $26.03 | 0.29 | 3.12 | 3.41 | (0.28) | (1.27) | (1.55) |
| Year Ended 8/31/2017 | $22.81 | 0.30 | 3.33 | 3.63 | (0.24) | (0.17) | (0.41) |
| Year Ended 8/31/2016 | $21.75 | 0.27 | 2.06 | 2.33 | (0.64) | (0.63) | (1.27) |
| Year Ended 8/31/2015 | $22.84 | 1.19(e) | (0.67) | 0.52 | (0.19) | (1.42) | (1.61) |
| Class R |
| Year Ended 8/31/2019 | $27.18 | 0.16 | 0.19 | 0.35 | (0.15) | (1.90) | (2.05) |
| Year Ended 8/31/2018 | $25.41 | 0.12 | 3.04 | 3.16 | (0.12) | (1.27) | (1.39) |
| Year Ended 8/31/2017 | $22.29 | 0.14 | 3.25 | 3.39 | (0.10) | (0.17) | (0.27) |
| Year Ended 8/31/2016 | $21.26 | 0.10 | 2.05 | 2.15 | (0.49) | (0.63) | (1.12) |
| Year Ended 8/31/2015 | $22.37 | 0.65(e) | (0.29) | 0.36 | (0.05) | (1.42) | (1.47) |
| Class V |
| Year Ended 8/31/2019 | $26.93 | 0.22 | 0.19 | 0.41 | (0.22) | (1.90) | (2.12) |
| Year Ended 8/31/2018 | $25.18 | 0.18 | 3.02 | 3.20 | (0.18) | (1.27) | (1.45) |
| Year Ended 8/31/2017 | $22.09 | 0.19 | 3.22 | 3.41 | (0.15) | (0.17) | (0.32) |
| Year Ended 8/31/2016 | $21.08 | 0.15 | 2.04 | 2.19 | (0.55) | (0.63) | (1.18) |
| Year Ended 8/31/2015 | $22.19 | 0.55(e) | (0.15) | 0.40 | (0.09) | (1.42) | (1.51) |
| Notes to Financial Highlights |
| (a) | In addition to the fees and expenses that the Fund bears directly, the Fund indirectly bears a pro rata share of the fees and expenses of any other funds in which it invests. Such indirect expenses are not included in the Fund’s reported expense ratios. |
| (b) | Total net expenses include the impact of certain fee waivers/expense reimbursements made by the Investment Manager and certain of its affiliates, if applicable. |
| (c) | Ratios include interfund lending expense which is less than 0.01%. |
| (d) | The benefits derived from expense reductions had an impact of less than 0.01%. |
| (e) | Net investment income per share includes special dividends. The per share effect of these dividends amounted to: |
| Year Ended | Class A | Advisor
Class | Class C | Institutional
Class | Institutional 2
Class | Institutional 3
Class | Class R | Class V |
| 08/31/2015 | $0.54 | $0.63 | $0.55 | $0.50 | $0.58 | $0.96 | $0.60 | $0.45 |
The accompanying Notes to Financial Statements are an integral part of this statement.
| 20 | Columbia Contrarian Core Fund | Annual Report 2019 |
Financial Highlights (continued)
| | Net
asset
value,
end of
period | Total
return | Total gross
expense
ratio to
average
net assets(a) | Total net
expense
ratio to
average
net assets(a),(b) | Net investment
income (loss)
ratio to
average
net assets | Portfolio
turnover | Net
assets,
end of
period
(000’s) |
| Institutional 3 Class |
| Year Ended 8/31/2019 | $26.19 | 2.90% | 0.64%(c) | 0.64%(c) | 1.30% | 53% | $2,123,062 |
| Year Ended 8/31/2018 | $27.89 | 13.50% | 0.63% | 0.63% | 1.10% | 63% | $2,101,809 |
| Year Ended 8/31/2017 | $26.03 | 16.14% | 0.65% | 0.65% | 1.23% | 52% | $1,574,824 |
| Year Ended 8/31/2016 | $22.81 | 11.22% | 0.65% | 0.65% | 1.23% | 47% | $329,514 |
| Year Ended 8/31/2015 | $21.75 | 2.44% | 0.66% | 0.66% | 5.26% | 60% | $53,246 |
| Class R |
| Year Ended 8/31/2019 | $25.48 | 2.24% | 1.28%(c) | 1.28%(c) | 0.66% | 53% | $124,951 |
| Year Ended 8/31/2018 | $27.18 | 12.78% | 1.27% | 1.27%(d) | 0.45% | 63% | $145,912 |
| Year Ended 8/31/2017 | $25.41 | 15.34% | 1.29% | 1.29%(d) | 0.57% | 52% | $132,392 |
| Year Ended 8/31/2016 | $22.29 | 10.55% | 1.32% | 1.32%(d) | 0.49% | 47% | $96,586 |
| Year Ended 8/31/2015 | $21.26 | 1.69% | 1.34% | 1.34%(d) | 2.93% | 60% | $50,048 |
| Class V |
| Year Ended 8/31/2019 | $25.22 | 2.52% | 1.03%(c) | 1.03%(c) | 0.91% | 53% | $150,836 |
| Year Ended 8/31/2018 | $26.93 | 13.09% | 1.02% | 1.02%(d) | 0.70% | 63% | $163,335 |
| Year Ended 8/31/2017 | $25.18 | 15.61% | 1.04% | 1.04%(d) | 0.82% | 52% | $154,392 |
| Year Ended 8/31/2016 | $22.09 | 10.83% | 1.08% | 1.08%(d) | 0.71% | 47% | $146,879 |
| Year Ended 8/31/2015 | $21.08 | 1.92% | 1.11% | 1.11%(d) | 2.49% | 60% | $143,304 |
The accompanying Notes to Financial Statements are an integral part of this statement.
Columbia Contrarian Core Fund | Annual Report 2019
| 21 |
Notes to Financial Statements
August 31, 2019
Note 1. Organization
Columbia Contrarian Core Fund (the Fund), a series of Columbia Funds Series Trust I (the Trust), is a diversified fund. The Trust is registered under the Investment Company Act of 1940, as amended (the 1940 Act), as an open-end management investment company organized as a Massachusetts business trust.
Fund shares
The Trust may issue an unlimited number of shares (without par value). The Fund offers each of the share classes listed in the Statement of Assets and Liabilities. Although all share classes generally have identical voting, dividend and liquidation rights, each share class votes separately when required by the Trust’s organizational documents or by law. Each share class has its own expense and sales charge structure. Different share classes may have different minimum initial investment amounts and pay different distribution amounts to the extent the expenses of distributing such share classes vary. Distributions to shareholders in a liquidation will be proportional to the net asset value of each share class.
As described in the Fund’s prospectus, Class A and Class C shares are offered to the general public for investment. Advisor Class, Institutional Class, Institutional 2 Class, Institutional 3 Class and Class R shares are available for purchase through authorized investment professionals to omnibus retirement plans or to institutional and to certain other investors as also described in the Fund’s prospectus. Class C shares automatically convert to Class A shares after 10 years. Effective December 14, 2018, Class T shares merged, in a tax-free transaction, into Class A shares of the Fund and are no longer offered for sale. Class V shares are available only to investors who received (and who continuously held) Class V shares in connection with previous fund reorganizations.
Note 2. Summary of significant accounting policies
Basis of preparation
The Fund is an investment company that applies the accounting and reporting guidance in the Financial Accounting Standards Board (FASB) Accounting Standards Codification Topic 946,Financial Services - Investment Companies (ASC 946). The financial statements are prepared in accordance with U.S. generally accepted accounting principles (GAAP), which requires management to make certain estimates and assumptions that affect the reported amounts of assets and liabilities, the disclosure of contingent assets and liabilities at the date of the financial statements and the reported amounts of income and expenses during the reporting period. Actual results could differ from those estimates.
The following is a summary of significant accounting policies followed by the Fund in the preparation of its financial statements.
Security valuation
All equity securities are valued at the close of business of the New York Stock Exchange. Equity securities are valued at the official closing price on the principal exchange or market on which they trade. Unlisted securities or listed securities for which there were no sales during the day are valued at the mean of the latest quoted bid and ask prices on such exchanges or markets.
Foreign equity securities are valued based on the closing price on the foreign exchange in which such securities are primarily traded. If any foreign equity security closing prices are not readily available, the securities are valued at the mean of the latest quoted bid and ask prices on such exchanges or markets. Foreign currency exchange rates are determined at the scheduled closing time of the New York Stock Exchange. Many securities markets and exchanges outside the U.S. close prior to the close of the New York Stock Exchange; therefore, the closing prices for securities in such markets or on such exchanges may not fully reflect events that occur after such close but before the close of the New York Stock Exchange. In those situations, foreign securities will be fair valued pursuant to a policy adopted by the Board of Trustees. Under the policy, the Fund may utilize a third party pricing service to determine these fair values. The third-party pricing service takes into account multiple factors, including, but not limited to, movements in the U.S. securities markets, certain depositary receipts, futures contracts and foreign exchange rates that have occurred subsequent to the close of the foreign exchange or market, to determine a good faith estimate that reasonably reflects the current market conditions as of the close of the New York Stock Exchange. The fair value of a security is likely to be different from the quoted or published price, if available.
| 22 | Columbia Contrarian Core Fund | Annual Report 2019 |
Notes to Financial Statements (continued)
August 31, 2019
Investments in open-end investment companies, including money market funds, are valued at their latest net asset value.
Investments for which market quotations are not readily available, or that have quotations which management believes are not reflective of market value or reliable, are valued at fair value as determined in good faith under procedures approved by and under the general supervision of the Board of Trustees. If a security or class of securities (such as foreign securities) is valued at fair value, such value is likely to be different from the quoted or published price for the security.
The determination of fair value often requires significant judgment. To determine fair value, management may use assumptions including but not limited to future cash flows and estimated risk premiums. Multiple inputs from various sources may be used to determine fair value.
GAAP requires disclosure regarding the inputs and valuation techniques used to measure fair value and any changes in valuation inputs or techniques. In addition, investments shall be disclosed by major category. This information is disclosed following the Fund’s Portfolio of Investments.
Foreign currency transactions and translations
The values of all assets and liabilities denominated in foreign currencies are generally translated into U.S. dollars at exchange rates determined at the close of regular trading on the New York Stock Exchange. Net realized and unrealized gains (losses) on foreign currency transactions and translations include gains (losses) arising from the fluctuation in exchange rates between trade and settlement dates on securities transactions, gains (losses) arising from the disposition of foreign currency and currency gains (losses) between the accrual and payment dates on dividends, interest income and foreign withholding taxes.
For financial statement purposes, the Fund does not distinguish that portion of gains (losses) on investments which is due to changes in foreign exchange rates from that which is due to changes in market prices of the investments. Such fluctuations are included with the net realized and unrealized gains (losses) on investments in the Statement of Operations.
Security transactions
Security transactions are accounted for on the trade date. Cost is determined and gains (losses) are based upon the specific identification method for both financial statement and federal income tax purposes.
Income recognition
Corporate actions and dividend income are generally recorded net of any non-reclaimable tax withholdings, on the ex-dividend date or upon receipt of ex-dividend notification in the case of certain foreign securities.
The Fund may receive distributions from holdings in equity securities, business development companies (BDCs), exchange-traded funds (ETFs), limited partnerships (LPs), other regulated investment companies (RICs), and real estate investment trusts (REITs), which report information on the tax character of their distributions annually. These distributions are allocated to dividend income, capital gain and return of capital based on actual information reported. Return of capital is recorded as a reduction of the cost basis of securities held. If the Fund no longer owns the applicable securities, return of capital is recorded as a realized gain. With respect to REITs, to the extent actual information has not yet been reported, estimates for return of capital are made by the Fund’s management. Management’s estimates are subsequently adjusted when the actual character of the distributions is disclosed by the REITs, which could result in a proportionate change in return of capital to shareholders.
Awards from class action litigation are recorded as a reduction of cost basis if the Fund still owns the applicable securities on the payment date. If the Fund no longer owns the applicable securities, the proceeds are recorded as realized gains.
Expenses
General expenses of the Trust are allocated to the Fund and other funds of the Trust based upon relative net assets or other expense allocation methodologies determined by the nature of the expense. Expenses directly attributable to the Fund are charged to the Fund. Expenses directly attributable to a specific class of shares are charged to that share class.
Columbia Contrarian Core Fund | Annual Report 2019
| 23 |
Notes to Financial Statements (continued)
August 31, 2019
Determination of class net asset value
All income, expenses (other than class-specific expenses, which are charged to that share class, as shown in the Statement of Operations) and realized and unrealized gains (losses) are allocated to each class of the Fund on a daily basis, based on the relative net assets of each class, for purposes of determining the net asset value of each class.
Federal income tax status
The Fund intends to qualify each year as a regulated investment company under Subchapter M of the Internal Revenue Code, as amended, and will distribute substantially all of its investment company taxable income and net capital gain, if any, for its tax year, and as such will not be subject to federal income taxes. In addition, the Fund intends to distribute in each calendar year substantially all of its ordinary income, capital gain net income and certain other amounts, if any, such that the Fund should not be subject to federal excise tax. Therefore, no federal income or excise tax provision is recorded.
Foreign taxes
The Fund may be subject to foreign taxes on income, gains on investments or currency repatriation, a portion of which may be recoverable. The Fund will accrue such taxes and recoveries, as applicable, based upon its current interpretation of tax rules and regulations that exist in the markets in which it invests.
Realized gains in certain countries may be subject to foreign taxes at the Fund level, based on statutory rates. The Fund accrues for such foreign taxes on realized and unrealized gains at the appropriate rate for each jurisdiction, as applicable. The amount, if any, is disclosed as a liability on the Statement of Assets and Liabilities.
Distributions to shareholders
Distributions from net investment income, if any, are declared and paid annually. Net realized capital gains, if any, are distributed at least annually. Income distributions and capital gain distributions are determined in accordance with federal income tax regulations, which may differ from GAAP.
Guarantees and indemnifications
Under the Trust’s organizational documents and, in some cases, by contract, its officers and trustees are indemnified against certain liabilities arising out of the performance of their duties to the Trust or its funds. In addition, certain of the Fund’s contracts with its service providers contain general indemnification clauses. The Fund’s maximum exposure under these arrangements is unknown since the amount of any future claims that may be made against the Fund cannot be determined, and the Fund has no historical basis for predicting the likelihood of any such claims.
Recent accounting pronouncements
Accounting Standards Update 2017-08 Premium Amortization on Purchased Callable Debt Securities
In March 2017, the Financial Accounting Standards Board issued Accounting Standards Update (ASU) No. 2017-08 Premium Amortization on Purchased Callable Debt Securities. ASU No. 2017-08 updates the accounting standards to shorten the amortization period for certain purchased callable debt securities, held at a premium, to be amortized to the earliest call date. The update applies to securities with explicit, noncontingent call features that are callable at fixed prices and on preset dates. The standard is effective for annual periods beginning after December 15, 2018 and interim periods within those fiscal years. Management does not expect the implementation of this guidance to have a material impact on the financial statement amounts and footnote disclosures.
Accounting Standards Update 2018-13 Disclosure Framework - Changes to the Disclosure Requirements for Fair Value Measurement
In August 2018, the Financial Accounting Standards Board issued Accounting Standards Update (ASU) No. 2018-13 Disclosure Framework - Changes to the Disclosure Requirements for Fair Value Measurement. The standard is effective for annual periods beginning after December 15, 2019 and interim periods within those fiscal years, with early adoption permitted. After evaluation, management determined to adopt the ASU effective for the period ended August 31, 2019 and all subsequent periods. As a result of the amendments, management implemented disclosure changes which include removal
| 24 | Columbia Contrarian Core Fund | Annual Report 2019 |
Notes to Financial Statements (continued)
August 31, 2019
of the amount and reasons for transfers between Level 1 and Level 2 of the fair value hierarchy, removal of the policy for the timing of transfers between levels, removal of the description of the Level 3 valuation processes, as well as modifications to the measurement uncertainty disclosure.
Disclosure Update and Simplification
In September 2018, the Securities and Exchange Commission (SEC) released Final Rule 33-10532, Disclosure Update and Simplification, which amends certain financial statement disclosure requirements that the SEC determined to be redundant, outdated, or superseded in light of other SEC disclosure requirements, GAAP, or changes in the information environment. As a result of the amendments, management implemented disclosure changes which included removing the components of distributable earnings presented on the Statement of Assets and Liabilities and combining income and gain distributions paid to shareholders as presented on the Statement of Changes in Net Assets. Any values presented to meet prior year requirements were left unchanged. The amendments had no effect on the Fund’s net assets or results of operation.
Note 3. Fees and other transactions with affiliates
Management services fees
The Fund has entered into a Management Agreement with Columbia Management Investment Advisers, LLC (the Investment Manager), a wholly-owned subsidiary of Ameriprise Financial, Inc. (Ameriprise Financial). Under the Management Agreement, the Investment Manager provides the Fund with investment research and advice, as well as administrative and accounting services. The management services fee is an annual fee that is equal to a percentage of the Fund’s daily net assets that declines from 0.77% to 0.57% as the Fund’s net assets increase. The effective management services fee rate for the year ended August 31, 2019 was 0.61% of the Fund’s average daily net assets.
Compensation of board members
Members of the Board of Trustees who are not officers or employees of the Investment Manager or Ameriprise Financial are compensated for their services to the Fund as disclosed in the Statement of Operations. These members of the Board of Trustees may participate in a Deferred Compensation Plan (the Deferred Plan) which may be terminated at any time. Obligations of the Deferred Plan will be paid solely out of the Fund’s assets, and all amounts payable under the Deferred Plan constitute a general unsecured obligation of the Fund.
Compensation of Chief Compliance Officer
The Board of Trustees has appointed a Chief Compliance Officer to the Fund in accordance with federal securities regulations. As disclosed in the Statement of Operations, a portion of the Chief Compliance Officer’s total compensation is allocated to the Fund, along with other allocations to affiliated registered investment companies managed by the Investment Manager and its affiliates, based on relative net assets.
Transfer agency fees
Under a Transfer and Dividend Disbursing Agent Agreement, Columbia Management Investment Services Corp. (the Transfer Agent), an affiliate of the Investment Manager and a wholly-owned subsidiary of Ameriprise Financial, is responsible for providing transfer agency services to the Fund. The Transfer Agent has contracted with DST Asset Manager Solutions, Inc. (DST) to serve as sub-transfer agent. The Transfer Agent pays the fees of DST for services as sub-transfer agent and DST is not entitled to reimbursement for such fees from the Fund (with the exception of out-of-pocket fees).
The Fund pays the Transfer Agent a monthly transfer agency fee based on the number or the average value of accounts, depending on the type of account. In addition, the Fund pays the Transfer Agent a fee for shareholder services based on the number of accounts or on a percentage of the average aggregate value of the Fund’s shares maintained in omnibus accounts up to the lesser of the amount charged by the financial intermediary or a cap established by the Board of Trustees from time to time.
Columbia Contrarian Core Fund | Annual Report 2019
| 25 |
Notes to Financial Statements (continued)
August 31, 2019
The Transfer Agent also receives compensation from the Fund for various shareholder services and reimbursements for certain out-of-pocket fees. Total transfer agency fees for Institutional 2 Class and Institutional 3 Class shares are subject to an annual limitation of not more than 0.07% and 0.02%, respectively, of the average daily net assets attributable to each share class.
For the year ended August 31, 2019, the Fund’s effective transfer agency fee rates as a percentage of average daily net assets of each class were as follows:
| | Effective rate (%) |
| Class A | 0.15 |
| Advisor Class | 0.15 |
| Class C | 0.15 |
| Institutional Class | 0.15 |
| Institutional 2 Class | 0.06 |
| Institutional 3 Class | 0.01 |
| Class R | 0.15 |
| Class T | 0.04(a) |
| Class V | 0.15 |
An annual minimum account balance fee of $20 may apply to certain accounts with a value below the applicable share class’s initial minimum investment requirements to reduce the impact of small accounts on transfer agency fees. These minimum account balance fees are remitted to the Fund and recorded as part of expense reductions in the Statement of Operations. For the year ended August 31, 2019, no minimum account balance fees were charged by the Fund.
Distribution and service fees
The Fund has entered into an agreement with Columbia Management Investment Distributors, Inc. (the Distributor), an affiliate of the Investment Manager and a wholly-owned subsidiary of Ameriprise Financial, for distribution and shareholder services. The Board of Trustees has approved, and the Fund has adopted, distribution and shareholder service plans (the Plans) applicable to certain share classes, which set the distribution and service fees for the Fund. These fees are calculated daily and are intended to compensate the Distributor and/or eligible selling and/or servicing agents for selling shares of the Fund and providing services to investors.
Under the Plans, the Fund pays a monthly service fee to the Distributor at the maximum annual rate of 0.25% of the average daily net assets attributable to Class A, Class C and Class T shares of the Fund. Also under the Plans, the Fund pays a monthly distribution fee to the Distributor at the maximum annual rates of 0.10%, 0.75%, 0.50% and 0.25% of the average daily net assets attributable to Class A, Class C, Class R and Class T shares of the Fund, respectively. As a result of all Class T shares of the Fund being redeemed or converted to Class A shares, December 14, 2018 was the last day the Fund paid a distribution and shareholder services fee for Class T shares.
Although the Fund may pay distribution and service fees up to a maximum annual rate of 0.35% of the Fund’s average daily net assets attributable to Class A shares (comprised of up to 0.10% for distribution services and up to 0.25% for shareholder liaison services), the Fund currently limits such fees to an aggregate fee of not more than 0.25% of the Fund’s average daily net assets attributable to Class A shares.
Although the Fund may have paid a distribution fee up to 0.25% of the Fund’s average daily net assets attributable to Class T shares and a service fee of up to 0.25% of the Fund’s average daily net assets attributable to Class T shares, the aggregate fee shall not exceed 0.25% of the Fund’s average daily net assets attributable to Class T shares.
| 26 | Columbia Contrarian Core Fund | Annual Report 2019 |
Notes to Financial Statements (continued)
August 31, 2019
Shareholder services fees
The Fund has adopted a shareholder services plan that permits it to pay for certain services provided to Class V shareholders by their selling and/or servicing agents. The Fund may pay shareholder servicing fees up to an aggregate annual rate of 0.50% of the Fund’s average daily net assets attributable to Class V shares (comprised of up to 0.25% for shareholder liaison services and up to 0.25% for administrative support services). These fees are currently limited to an aggregate annual rate of not more than 0.25% of the Fund’s average daily net assets attributable to Class V shares.
Sales charges (unaudited)
Sales charges, including front-end charges and contingent deferred sales charges (CDSC), received by the Distributor for distributing Fund shares for the year ended August 31, 2019, if any, are listed below:
| | Front End (%) | CDSC (%) | Amount ($) |
| Class A | 5.75 | 0.50 - 1.00(a) | 1,342,446 |
| Class C | — | 1.00(b) | 46,574 |
| Class T | 2.50 | — | — |
| Class V | 5.75 | 0.50 - 1.00(a) | 5,414 |
| (a) | This charge is imposed on certain investments of between $1 million and $50 million redeemed within 18 months after purchase, as follows: 1.00% if redeemed within 12 months after purchase, and 0.50% if redeemed more than 12, but less than 18, months after purchase, with certain limited exceptions. |
| (b) | This charge applies to redemptions within 12 months after purchase, with certain limited exceptions. |
The Fund’s other share classes are not subject to sales charges.
Expenses waived/reimbursed by the Investment Manager and its affiliates
The Investment Manager and certain of its affiliates have contractually agreed to waive fees and/or reimburse expenses (excluding certain fees and expenses described below) for the period(s) disclosed below, unless sooner terminated at the sole discretion of the Board of Trustees, so that the Fund’s net operating expenses, after giving effect to fees waived/expenses reimbursed and any balance credits and/or overdraft charges from the Fund’s custodian, do not exceed the following annual rate(s) as a percentage of the class’ average daily net assets:
| | January 1, 2019
through
December 31, 2019 | Prior to
January 1, 2019 |
| Class A | 1.14% | 1.15% |
| Advisor Class | 0.89 | 0.90 |
| Class C | 1.89 | 1.90 |
| Institutional Class | 0.89 | 0.90 |
| Institutional 2 Class | 0.80 | 0.81 |
| Institutional 3 Class | 0.75 | 0.76 |
| Class R | 1.39 | 1.40 |
| Class V | 1.14 | 1.15 |
Under the agreement governing these fee waivers and/or expense reimbursement arrangements, the following fees and expenses are excluded from the waiver/reimbursement commitment, and therefore will be paid by the Fund, if applicable: taxes (including foreign transaction taxes), expenses associated with investments in affiliated and non-affiliated pooled investment vehicles (including mutual funds and exchange-traded funds), transaction costs and brokerage commissions, costs related to any securities lending program, dividend expenses associated with securities sold short, inverse floater program fees and expenses, transaction charges and interest on borrowed money, interest, infrequent and/or unusual expenses and any other expenses the exclusion of which is specifically approved by the Board of Trustees. This agreement may be modified or amended only with approval from the Investment Manager, certain of its affiliates and the Fund. Any fees waived and/or expenses reimbursed under the expense reimbursement arrangements described above are not recoverable by the Investment Manager or its affiliates in future periods.
Columbia Contrarian Core Fund | Annual Report 2019
| 27 |
Notes to Financial Statements (continued)
August 31, 2019
Note 4. Federal tax information
The timing and character of income and capital gain distributions are determined in accordance with income tax regulations, which may differ from GAAP because of temporary or permanent book to tax differences.
At August 31, 2019, these differences were primarily due to differing treatment for deferral/reversal of wash sale losses, trustees’ deferred compensation, re-characterization of distributions for investments, distribution reclassifications, and foreign currency transactions. To the extent these differences were permanent, reclassifications were made among the components of the Fund’s net assets. Temporary differences do not require reclassifications.
The following reclassifications were made:
Undistributed net
investment
income ($) | Accumulated
net realized
gain ($) | Paid in
capital ($) |
| (223,589) | 223,589 | — |
Net investment income (loss) and net realized gains (losses), as disclosed in the Statement of Operations, and net assets were not affected by this reclassification.
The tax character of distributions paid during the years indicated was as follows:
| Year Ended August 31, 2019 | Year Ended August 31, 2018 |
Ordinary
income ($) | Long-term
capital gains ($) | Total ($) | Ordinary
income ($) | Long-term
capital gains ($) | Total ($) |
| 109,292,030 | 756,700,678 | 865,992,708 | 128,021,089 | 514,308,625 | 642,329,714 |
Short-term capital gain distributions, if any, are considered ordinary income distributions for tax purposes.
At August 31, 2019, the components of distributable earnings on a tax basis were as follows:
Undistributed
ordinary income ($) | Undistributed
long-term
capital gains ($) | Capital loss
carryforwards ($) | Net unrealized
appreciation ($) |
| 69,453,878 | 305,361,675 | — | 3,096,535,260 |
At August 31, 2019, the cost of all investments for federal income tax purposes along with the aggregate gross unrealized appreciation and depreciation based on that cost was:
Federal
tax cost ($) | Gross unrealized
appreciation ($) | Gross unrealized
(depreciation) ($) | Net unrealized
appreciation ($) |
| 6,613,223,174 | 3,247,057,236 | (150,521,976) | 3,096,535,260 |
Tax cost of investments and unrealized appreciation/(depreciation) may also include timing differences that do not constitute adjustments to tax basis.
Management of the Fund has concluded that there are no significant uncertain tax positions in the Fund that would require recognition in the financial statements. However, management’s conclusion may be subject to review and adjustment at a later date based on factors including, but not limited to, new tax laws, regulations, and administrative interpretations (including relevant court decisions). Generally, the Fund’s federal tax returns for the prior three fiscal years remain subject to examination by the Internal Revenue Service.
Note 5. Portfolio information
The cost of purchases and proceeds from sales of securities, excluding short-term investments and derivatives, if any, aggregated to $5,251,641,864 and $7,207,732,672, respectively, for the year ended August 31, 2019. The amount of purchase and sale activity impacts the portfolio turnover rate reported in the Financial Highlights.
| 28 | Columbia Contrarian Core Fund | Annual Report 2019 |
Notes to Financial Statements (continued)
August 31, 2019
Note 6. Affiliated money market fund
The Fund invests in Columbia Short-Term Cash Fund, an affiliated money market fund established for the exclusive use by the Fund and other affiliated funds (the Affiliated MMF). The income earned by the Fund from such investments is included as Dividends - affiliated issuers in the Statement of Operations. As an investing fund, the Fund indirectly bears its proportionate share of the expenses of the Affiliated MMF. The Affiliated MMF prices its shares with a floating net asset value. In addition, the Board of Trustees of the Affiliated MMF may impose a fee on redemptions (sometimes referred to as a liquidity fee) or temporarily suspend redemptions (sometimes referred to as imposing a redemption gate) in the event its liquidity falls below regulatory limits.
Note 7. Interfund lending
Pursuant to an exemptive order granted by the Securities and Exchange Commission, the Fund participates in a program (the Interfund Program) allowing each participating Columbia Fund (each, a Participating Fund) to lend money directly to and, except for closed-end funds and money market funds, borrow money directly from other Participating Funds for temporary purposes. The amounts eligible for borrowing and lending under the Interfund Program are subject to certain restrictions.
Interfund loans are subject to the risk that the borrowing fund could be unable to repay the loan when due, and a delay in repayment to the lending fund could result in lost opportunities and/or additional lending costs. The exemptive order is subject to conditions intended to mitigate conflicts of interest arising from the Investment Manager’s relationship with each Participating Fund.
The Fund’s activity in the Interfund Program during the year ended August 31, 2019 was as follows:
| Borrower or lender | Average loan
balance ($) | Weighted average
interest rate (%) | Days
outstanding |
| Borrower | 7,987,500 | 3.07 | 8 |
| Lender | 2,292,308 | 2.79 | 13 |
Interest income earned and interest expense incurred by the Fund is recorded as Interfund lending in the Statement of Operations. The Fund had no outstanding interfund loans at August 31, 2019.
Note 8. Line of credit
The Fund has access to a revolving credit facility with a syndicate of banks led by Citibank, N.A., HSBC Bank USA, N.A. and JPMorgan Chase Bank, N.A. whereby the Fund may borrow for the temporary funding of shareholder redemptions or for other temporary or emergency purposes. The credit facility, which is a collective agreement between the Fund and certain other funds managed by the Investment Manager or an affiliated investment manager, severally and not jointly, permits collective borrowings up to $1 billion. Interest is charged to each participating fund based on its borrowings at a rate equal to the higher of (i) the federal funds effective rate, (ii) the one-month LIBOR rate and (iii) the overnight bank funding rate, plus in each case, 1.00%. Each borrowing under the credit facility matures no later than 60 days after the date of borrowing. The Fund also pays a commitment fee equal to its pro rata share of the unused amount of the credit facility at a rate of 0.15% per annum. The commitment fee is included in other expenses in the Statement of Operations. This agreement expires annually in December unless extended or renewed.
The Fund had no borrowings during the year ended August 31, 2019.
Note 9. Significant risks
Shareholder concentration risk
At August 31, 2019, two unaffiliated shareholders of record owned 24.7% of the outstanding shares of the Fund in one or more accounts. The Fund has no knowledge about whether any portion of those shares was owned beneficially. Affiliated shareholders of record owned 22.3% of the outstanding shares of the Fund in one or more accounts. Subscription and redemption activity by concentrated accounts may have a significant effect on the operations of the Fund. In the case of a
Columbia Contrarian Core Fund | Annual Report 2019
| 29 |
Notes to Financial Statements (continued)
August 31, 2019
large redemption, the Fund may be forced to sell investments at inopportune times, including its liquid positions, which may result in Fund losses and the Fund holding a higher percentage of less liquid positions. Large redemptions could result in decreased economies of scale and increased operating expenses for non-redeeming Fund shareholders.
Technology and technology-related investment risk
The Fund may be more susceptible to the particular risks that may affect companies in the information technology sector, as well as other technology-related sectors (collectively, the technology sectors) than if it were invested in a wider variety of companies in unrelated sectors. Companies in the technology sectors are subject to certain risks, including the risk that new services, equipment or technologies will not be accepted by consumers and businesses or will become rapidly obsolete. Performance of such companies may be affected by factors including obtaining and protecting patents (or the failure to do so) and significant competitive pressures, including aggressive pricing of their products or services, new market entrants, competition for market share and short product cycles due to an accelerated rate of technological developments. Such competitive pressures may lead to limited earnings and/or falling profit margins. As a result, the value of their securities may fall or fail to rise. In addition, many technology sector companies have limited operating histories and prices of these companies’ securities historically have been more volatile than other securities, especially over the short term.
Note 10. Subsequent events
Management has evaluated the events and transactions that have occurred through the date the financial statements were issued and noted no items requiring adjustment of the financial statements or additional disclosure.
Note 11. Information regarding pending and settled legal proceedings
Ameriprise Financial and certain of its affiliates have historically been involved in a number of legal, arbitration and regulatory proceedings, including routine litigation, class actions, and governmental actions, concerning matters arising in connection with the conduct of their business activities. Ameriprise Financial believes that the Fund is not currently the subject of, and that neither Ameriprise Financial nor any of its affiliates are the subject of, any pending legal, arbitration or regulatory proceedings that are likely to have a material adverse effect on the Fund or the ability of Ameriprise Financial or its affiliates to perform under their contracts with the Fund. Ameriprise Financial is required to make quarterly (10-Q), annual (10-K) and, as necessary, 8-K filings with the Securities and Exchange Commission (SEC) on legal and regulatory matters that relate to Ameriprise Financial and its affiliates. Copies of these filings may be obtained by accessing the SEC website at www.sec.gov.
There can be no assurance that these matters, or the adverse publicity associated with them, will not result in increased Fund redemptions, reduced sale of Fund shares or other adverse consequences to the Fund. Further, although we believe proceedings are not likely to have a material adverse effect on the Fund or the ability of Ameriprise Financial or its affiliates to perform under their contracts with the Fund, these proceedings are subject to uncertainties and, as such, we are unable to estimate the possible loss or range of loss that may result. An adverse outcome in one or more of these proceedings could result in adverse judgments, settlements, fines, penalties or other relief that could have a material adverse effect on the consolidated financial condition or results of operations of Ameriprise Financial.
| 30 | Columbia Contrarian Core Fund | Annual Report 2019 |
Report of Independent Registered Public Accounting Firm
To the Board of Trustees of Columbia Funds Series Trust I and Shareholders of Columbia Contrarian Core Fund
Opinion on the Financial Statements
We have audited the accompanying statement of assets and liabilities, including the portfolio of investments, of Columbia Contrarian Core Fund (one of the funds constituting Columbia Funds Series Trust I, hereafter referred to as the “Fund”) as of August 31, 2019, the related statement of operations for the year ended August 31, 2019, the statement of changes in net assets for each of the two years in the period ended August 31, 2019, including the related notes, and the financial highlights for each of the five years in the period ended August 31, 2019, (collectively referred to as the “financial statements”). In our opinion, the financial statements present fairly, in all material respects, the financial position of the Fund as of August 31, 2019, the results of its operations for the year then ended, the changes in its net assets for each of the two years in the period ended August 31, 2019 and the financial highlights for each of the five years in the period ended August 31, 2019 in conformity with accounting principles generally accepted in the United States of America.
Basis for Opinion
These financial statements are the responsibility of the Fund’s management. Our responsibility is to express an opinion on the Fund’s financial statements based on our audits. We are a public accounting firm registered with the Public Company Accounting Oversight Board (United States) (PCAOB) and are required to be independent with respect to the Fund in accordance with the U.S. federal securities laws and the applicable rules and regulations of the Securities and Exchange Commission and the PCAOB.
We conducted our audits of these financial statements in accordance with the standards of the PCAOB. Those standards require that we plan and perform the audit to obtain reasonable assurance about whether the financial statements are free of material misstatement, whether due to error or fraud.
Our audits included performing procedures to assess the risks of material misstatement of the financial statements, whether due to error or fraud, and performing procedures that respond to those risks. Such procedures included examining, on a test basis, evidence regarding the amounts and disclosures in the financial statements. Our audits also included evaluating the accounting principles used and significant estimates made by management, as well as evaluating the overall presentation of the financial statements. Our procedures included confirmation of securities owned as of August 31, 2019, by correspondence with the custodian, transfer agent and brokers; when replies were not received from brokers, we performed other audit procedures. We believe that our audits provide a reasonable basis for our opinion.
/s/PricewaterhouseCoopers LLP
Minneapolis, Minnesota
October 24, 2019
We have served as the auditor of one or more investment companies within the Columbia Funds Complex since 1977.
Columbia Contrarian Core Fund | Annual Report 2019
| 31 |
Federal Income Tax Information
(Unaudited)
The Fund hereby designates the following tax attributes for the fiscal year ended August 31, 2019. Shareholders will be notified in early 2020 of the amounts for use in preparing 2019 income tax returns.
Qualified
dividend
income | Dividends
received
deduction | Capital
gain
dividend |
| 100.00% | 100.00% | $447,714,346 |
Qualified dividend income. For taxable, non-corporate shareholders, the percentage of ordinary income distributed during the fiscal year that represents qualified dividend income subject to reduced tax rates.
Dividends received deduction. The percentage of ordinary income distributed during the fiscal year that qualifies for the corporate dividends received deduction.
Capital gain dividend. The Fund designates as a capital gain dividend the amount reflected above, or if subsequently determined to be different, the net capital gain of such fiscal period.
TRUSTEES AND OFFICERS
The Board oversees the Fund’s operations and appoints officers who are responsible for day-to-day business decisions based on policies set by the Board. The following table provides basic biographical information about the Fund’s Trustees as of the printing of this report, including their principal occupations during the past five years, although specific titles for individuals may have varied over the period. The year set forth beneath Length of Service in the table below is the year in which the Trustee was first appointed or elected as Trustee to any Fund currently in the Columbia Funds Complex or a predecessor thereof. Under current Board policy, members serve terms of indefinite duration.
Independent trustees
| Name, address, year of birth | Position held with the Trust and length of service | Principal occupation(s) during the past five years and other relevant professional experience | Number of Funds in the Columbia Fund Complex overseen | Other directorships held by Trustee during the past five years |
Janet Langford Carrig
c/o Columbia Management
Investment Advisers, LLC
225 Franklin Street
Mail Drop BX32 05228
Boston, MA 02110
1957 | Trustee
1996 | Senior Vice President, General Counsel and Corporate Secretary, ConocoPhillips (independent energy company), September 2007-October 2018 | 70 | None |
Douglas A. Hacker
c/o Columbia Management
Investment Advisers, LLC
225 Franklin Street
Mail Drop BX32 05228
Boston, MA 02110
1955 | Trustee and Chairman of the Board
1996 | Independent business executive since May 2006; Executive Vice President — Strategy of United Airlines, December 2002-May 2006; President of UAL Loyalty Services (airline marketing company), September 2001-December 2002; Executive Vice President and Chief Financial Officer of United Airlines, July 1999-September 2001 | 70 | Spartan Nash Company, (food distributor); former Director, Nash Finch Company (food distributor), 2005-2013; Aircastle Limited (aircraft leasing); former Director, SeaCube Container Leasing Ltd. (container leasing), 2010-2013; and Travelport Worldwide Limited (travel information technology) |
| 32 | Columbia Contrarian Core Fund | Annual Report 2019 |
TRUSTEES AND OFFICERS (continued)
Independent trustees (continued)
| Name, address, year of birth | Position held with the Trust and length of service | Principal occupation(s) during the past five years and other relevant professional experience | Number of Funds in the Columbia Fund Complex overseen | Other directorships held by Trustee during the past five years |
Nancy T. Lukitsh
c/o Columbia Management
Investment Advisers, LLC
225 Franklin Street
Mail Drop BX32 05228
Boston, MA 02110
1956 | Trustee
2011 | Senior Vice President, Partner and Director of Marketing, Wellington Management Company, LLP (investment adviser), 1997-2010; Chair, Wellington Management Portfolios (commingled non-U.S. investment pools), 2007-2010; Director, Wellington Trust Company, NA and other Wellington affiliates, 1997-2010 | 70 | None |
David M. Moffett
c/o Columbia Management
Investment Advisers, LLC
225 Franklin Street
Mail Drop BX32 05228
Boston, MA 02110
1952 | Trustee
2011 | Retired. Consultant to Bridgewater and Associates | 70 | Director, CSX Corporation (transportation suppliers); Genworth Financial, Inc. (financial and insurance products and services); PayPal Holdings Inc. (payment and data processing services); Trustee, University of Oklahoma Foundation; former Director, eBay Inc. (online trading community), 2007-2015; and former Director, CIT Bank, CIT Group Inc. (commercial and consumer finance), 2010-2016 |
John J. Neuhauser
c/o Columbia Management
Investment Advisers, LLC
225 Franklin Street
Mail Drop BX32 05228
Boston, MA 02110
1943 | Trustee
1984 | President, Saint Michael’s College, August 2007-June 2018; Director or Trustee of several non-profit organizations, including University of Vermont Medical Center; Academic Vice President and Dean of Faculties, Boston College, August 1999-October 2005; University Professor, Boston College, November 2005-August 2007 | 70 | Liberty All-Star Equity Fund and Liberty All- Star Growth Fund (closed-end funds) |
Patrick J. Simpson
c/o Columbia Management
Investment Advisers, LLC
225 Franklin Street
Mail Drop BX32 05228
Boston, MA 02110
1944 | Trustee
2000 | Of Counsel, Perkins Coie LLP (law firm) since 2015; Partner, Perkins Coie LLP, 1988-2014 | 70 | Former Director, M Fund, Inc. (M Funds mutual fund family), July 2018-July 2019 |
Anne-Lee Verville
c/o Columbia Management
Investment Advisers, LLC
225 Franklin Street
Mail Drop BX32 05228
Boston, MA 02110
1945 | Trustee
1998 | Retired. General Manager, Global Education Industry, 1994-1997, President – Application Systems Division, 1991-1994, Chief Financial Officer – US Marketing & Services, 1988-1991, and Chief Information Officer, 1987-1988, IBM Corporation (computer and technology) | 70 | Former Director, Enesco Group, Inc. (producer of giftware and home and garden decor products), 2001-2006 |
Columbia Contrarian Core Fund | Annual Report 2019
| 33 |
TRUSTEES AND OFFICERS (continued)
Consultants to the Independent Trustees*
| Name, address, year of birth | Position held with the Trust and length of service | Principal occupation(s) during the past five years and other relevant professional experience | Number of Funds in the Columbia Funds complex overseen | Other directorships held by Trustee during the past five years |
J. Kevin Connaughton
c/o Columbia
Management Investment
Advisers, LLC,
225 Franklin Street
Mail Drop BX32 05228,
Boston, MA 02110
1964 | Independent Trustee Consultant
2016 | Independent Trustee Consultant, Columbia Funds since March 2016; Adjunct Professor of Finance, Bentley University since November 2017; Managing Director and General Manager of Mutual Fund Products, Columbia Management Investment Advisers, LLC, May 2010-February 2015; President, Columbia Funds, 2009-2015; and senior officer of Columbia Funds and affiliated funds, 2003-2015 | 70 | Director, The Autism Project since March 2015; former Trustee, New Century Portfolios, March 2015-December 2017; formerly on Board of Governors, Gateway Healthcare, January 2016 – December 2017 |
Olive Darragh
c/o Columbia
Management Investment
Advisers, LLC,
225 Franklin Street,
Mail Drop BX32 05228,
Boston, MA 02110
1962 | Independent Trustee Consultant 2019 | Independent Trustee Consultant, Columbia Funds since June 2019; Managing Director of Darragh Inc. (a strategy and talent management consulting firm) since 2010; Founder and CEO, Zolio (an investment management talent identification platform) since 2004; Partner, Tudor Investments, 2004-2010; Senior Partner, McKinsey & Company, 2001-2004 | 70 | Director, University of Edinburgh Business School; former Director, Boston Public Library Foundation |
Natalie A. Trunow
c/o Columbia
Management Investment
Advisers, LLC,
225 Franklin Street
Mail Drop BX32 05228,
Boston, MA 02110
1967 | Independent Trustee Consultant
2016 | Independent Trustee Consultant, Columbia Funds since September 2016; Chief Executive Officer, Millennial Portfolio Solutions LLC (asset management and consulting services) since January 2016; Director of Investments, Casey Family Programs, April 2016-September 2016; Senior Vice President and Chief Investment Officer, Calvert Investments, August 2008-January 2016; Section Head and Portfolio Manager, General Motors Asset Management, June 1997-August 2008 | 70 | Director, Health Services for Children with Special Needs, Inc.; Director, Consumer Credit Counseling Services (formerly Guidewell Financial Solutions) |
| * | J. Kevin Connaughton was appointed consultant to the Independent Trustees effective March 1, 2016. Olive Darragh was appointed consultant to the Independent Trustees effective June 10, 2019. Natalie A. Trunow was appointed consultant to the Independent Trustees effective September 1, 2016. Shareholders of the Funds are expected to be asked to elect each of Mr. Connaughton, Ms. Darragh and Ms. Trunow as a Trustee at a future shareholder meeting. |
Interested trustee affiliated with Investment Manager*
| Name, address, year of birth | Position held with the Trust and length of service | Principal occupation(s) during the past five years and other relevant professional experience | Number of Funds in the Columbia Funds Complex overseen | Other directorships held by Trustee during the past five years |
William F. Truscott
c/o Columbia Management
Investment Advisers, LLC
225 Franklin Street
Boston, MA 02110
1960 | Trustee
2012 | Chairman of the Board and President, Columbia Management Investment Advisers, LLC since May 2010 and February 2012, respectively; Chief Executive Officer, Global Asset Management, Ameriprise Financial, Inc. since September 2012 (previously Chief Executive Officer, U.S. Asset Management & President, Annuities, May 2010-September 2012); Director and Chief Executive Officer, Columbia Management Investment Distributors, Inc. since May 2010 and February 2012, respectively; Chairman of the Board and Chief Executive Officer, RiverSource Distributors, Inc. since 2006; Director, Threadneedle Asset Management Holdings, SARL since 2014; President and Chief Executive Officer, Ameriprise Certificate Company, 2006-August 2012 | 192 | Chairman of the Board, Columbia Management Investment Advisers, LLC since May 2010; Director, Columbia Management Investment Distributors, Inc. since May 2010; former Director, Ameriprise Certificate Company, August 2006 - January 2013 |
| 34 | Columbia Contrarian Core Fund | Annual Report 2019 |
TRUSTEES AND OFFICERS (continued)
| * | Interested person (as defined under the 1940 Act) by reason of being an officer, director, security holder and/or employee of the Investment Manager or Ameriprise Financial. |
The Statement of Additional Information has additional information about the Fund’s Board members and is available, without charge, upon request by calling 800.345.6611, visiting columbiathreadneedleus.com/investor/ or contacting your financial intermediary.
The Board has appointed officers who are responsible for day-to-day business decisions based on policies it has established. The officers serve at the pleasure of the Board. The following table provides basic information about the Officers of the Fund as of the printing of this report, including principal occupations during the past five years, although their specific titles may have varied over the period. In addition to Mr. Truscott, who is Senior Vice President, the Fund’s other officers are:
Fund officers
Name,
address and
year of birth | Position and year
first appointed to
position for any Fund
in the Columbia
Funds complex or a
predecessor thereof | Principal occupation(s) during past five years |
Christopher O. Petersen
5228 Ameriprise
Financial Center
Minneapolis, MN 55474
Born 1970 | President and Principal Executive Officer (2015) | Vice President and Lead Chief Counsel, Ameriprise Financial, Inc. since January 2015 (previously Vice President and Chief Counsel, January 2010 - December 2014; officer of Columbia Funds and affiliated funds since 2007. |
Michael G. Clarke
225 Franklin Street
Boston, MA 02110
Born 1969 | Chief Financial Officer (Principal Financial Officer) (2009) and Senior Vice President (2019) | Vice President, Head of North American Operations, and Co-Head of Global Operations, Columbia Management Investment Advisers, LLC, since June 2019 (previously Vice President – Accounting and Tax, May 2010 - May 2019); senior officer of Columbia Funds and affiliated funds since 2002 (previously Treasurer and Chief Accounting Officer, January 2009 - January 2019 and December 2015 - January 2019, respectively). |
Joseph Beranek
5890 Ameriprise
Financial Center
Minneapolis, MN 55474
Born 1965 | Treasurer and Chief Accounting Officer (Principal Accounting Officer) (2019) | Vice President — Mutual Fund Accounting and Financial Reporting, Columbia Management Investment Advisers, LLC, since December 2018 and March 2017, respectively (previously Vice President — Pricing and Corporate Actions, May 2010 - March 2017). |
Paul B. Goucher
485 Lexington Avenue
New York, NY 10017
Born 1968 | Senior Vice President (2011) and Assistant Secretary (2008) | Senior Vice President and Assistant General Counsel, Ameriprise Financial, Inc. since January 2017 (previously Vice President and Lead Chief Counsel, November 2008 - January 2017 and January 2013 - January 2017, respectively); Vice President, Chief Legal Officer and Assistant Secretary, Columbia Management Investment Advisers, LLC since March 2015 (previously Vice President and Assistant Secretary, May 2010 – March 2015). |
Thomas P. McGuire
225 Franklin Street
Boston, MA 02110
Born 1972 | Senior Vice President and Chief Compliance Officer (2012) | Vice President — Asset Management Compliance, Ameriprise Financial, Inc., since May 2010; Chief Compliance Officer, Ameriprise Certificate Company since September 2010. |
Colin Moore
225 Franklin Street
Boston, MA 02110
Born 1958 | Senior Vice President (2010) | Executive Vice President and Global Chief Investment Officer, Ameriprise Financial, Inc., since July 2013; Executive Vice President and Global Chief Investment Officer, Columbia Management Investment Advisers, LLC since July 2013. |
Ryan C. Larrenaga
225 Franklin Street
Boston, MA 02110
Born 1970 | Senior Vice President (2017), Chief Legal Officer (2017), and Secretary (2015) | Vice President and Chief Counsel, Ameriprise Financial, Inc. since August 2018 (previously Vice President and Group Counsel, August 2011 - August 2018); officer of Columbia Funds and affiliated funds since 2005. |
Michael E. DeFao
225 Franklin Street
Boston, MA 02110
Born 1968 | Vice President (2011) and Assistant Secretary (2010) | Vice President and Chief Counsel, Ameriprise Financial, Inc. since May 2010. |
Columbia Contrarian Core Fund | Annual Report 2019
| 35 |
TRUSTEES AND OFFICERS (continued)
Fund officers (continued)
Name,
address and
year of birth | Position and year
first appointed to
position for any Fund
in the Columbia
Funds complex or a
predecessor thereof | Principal occupation(s) during past five years |
Lyn Kephart-Strong
5228 Ameriprise
Financial Center
Minneapolis, MN 55474
Born 1960 | Vice President (2015) | President, Columbia Management Investment Services Corp. since October 2014; Vice President & Resolution Officer, Ameriprise Trust Company since August 2009. |
Board Consideration and Approval of Management
Agreement
On June 12, 2019, the Board of Trustees (the Board) and the Trustees who are not interested persons (as defined in the Investment Company Act of 1940) (the Independent Trustees) of Columbia Funds Series Trust I (the Trust) unanimously approved the continuation of the Management Agreement (the Management Agreement) with Columbia Management Investment Advisers, LLC (the Investment Manager) with respect to Columbia Contrarian Core Fund (the Fund), a series of the Trust. As detailed below, the Board’s Advisory Fees and Expenses Committee (the Committee) and the Board met on multiple occasions to review and discuss, among themselves, with the management team of the Investment Manager and with an independent fee consultant, materials provided by the Investment Manager, the independent fee consultant and others before determining to approve the continuation of the Management Agreement.
In connection with their deliberations regarding the continuation of the Management Agreement, the Committee and the Board evaluated materials requested from the Investment Manager regarding the Fund and the Management Agreement, and discussed these materials with representatives of the Investment Manager at Committee meetings held on March 5, 2019, April 25, 2019 and June 11, 2019 and at Board meetings held on March 6, 2019 and June 12, 2019. In addition, the Board and its various committees consider matters bearing on the Management Agreement at other meetings throughout the year and in prior years and meet regularly with senior management of the Trust and the Investment Manager. Through the Board’s Investment Oversight Committees, Trustees also meet with selected portfolio managers of the funds the Trustees oversee and with other investment personnel at various times throughout the year. The Committee and the Board also consulted with the independent fee consultant, Fund counsel and the Independent Trustees’ independent legal counsel, who advised on various matters with respect to the Committee’s and the Board’s considerations and otherwise assisted the Committee and the Board in their deliberations. On June 11, 2019, the Committee recommended that the Board approve the continuation of the Management Agreement. On June 12, 2019, the Board, including the Independent Trustees, voting separately, unanimously approved the continuation of the Management Agreement for the Fund.
The Committee and the Board considered all information that they, their legal counsel or the Investment Manager believed reasonably necessary to evaluate and to determine whether to recommend for approval or approve the continuation of the Management Agreement. The information and factors considered by the Committee and the Board in recommending for approval or approving the continuation of the Management Agreement for the Fund included the following:
| • | Information on the investment performance of the Fund relative to the performance of a group of mutual funds determined to be comparable to the Fund by an independent third-party data provider, as well as performance relative to benchmarks; |
| • | Information on the Fund’s management fees and total expenses, including information comparing the Fund’s expenses to those of a group of comparable mutual funds, as determined by the independent third-party data provider; |
| 36 | Columbia Contrarian Core Fund | Annual Report 2019 |
Board Consideration and Approval of Management
Agreement (continued)
| • | The Investment Manager’s agreement to contractually limit or cap total operating expenses for the Fund through December 31, 2020 so that total operating expenses (excluding certain fees and expenses, such as transaction costs and certain other investment related expenses, interest, taxes, acquired fund fees and expenses, and infrequent and/or unusual expenses) would not exceed a specified annual rate, as a percentage of the Fund’s net assets; |
| • | The terms and conditions of the Management Agreement; |
| • | The current and proposed terms and conditions of other agreements and arrangements with affiliates of the Investment Manager relating to the operations of the Fund, including agreements with respect to the provision of distribution, transfer agency and shareholder services to the Fund; |
| • | Descriptions of various functions performed by the Investment Manager under the Management Agreement, including portfolio management and portfolio trading practices; |
| • | Information regarding the management fees of similarly-managed portfolios of other clients of the Investment Manager, including institutional accounts and collective trusts; |
| • | Information regarding the reputation, regulatory history and resources of the Investment Manager, including information regarding senior management, portfolio managers and other personnel; |
| • | Information regarding the capabilities of the Investment Manager with respect to compliance monitoring services, including an assessment of the Investment Manager’s compliance system by the Fund’s Chief Compliance Officer; and |
| • | The profitability to the Investment Manager and its affiliates from their relationships with the Fund. |
Nature, extent and quality of services provided under the Management Agreement
The Committee and the Board considered the nature, extent and quality of services provided to the Fund by the Investment Manager and its affiliates under the Management Agreement and under separate agreements for the provision of transfer agency and shareholder services, and the resources dedicated to the Fund and the other Columbia Funds by the Investment Manager and its affiliates. The Committee and the Board considered, among other things, the Investment Manager’s ability to attract, motivate and retain highly qualified research, advisory and supervisory investment professionals (including compensation programs for personnel involved in fund management, reputation and other attributes), the portfolio management services provided by those investment professionals, and the quality of the Investment Manager’s investment research capabilities and trade execution services. The Committee and the Board also considered the potential benefits to shareholders of investing in a mutual fund that is part of a fund complex offering exposure to a variety of asset classes and investment disciplines and providing a variety of fund and shareholder services.
The Committee and the Board also considered the professional experience and qualifications of the senior personnel of the Investment Manager, which included consideration of the Investment Manager’s experience with funds using an investment strategy similar to that used by the Investment Manager for the Fund. The Committee and the Board noted the compliance programs of and the compliance-related resources provided to the Fund by the Investment Manager and its affiliates and the resources dedicated by the Investment Manager and its affiliates to risk management, and considered the Investment Manager’s ability to provide administrative services to the Fund and coordinate the activities of the Fund’s other service providers. After reviewing these and related factors, the Committee and the Board concluded, within the context of their overall conclusions, that the nature, extent and quality of the services provided to the Fund under the Management Agreement supported the continuation of the Management Agreement.
Investment performance
The Committee and the Board reviewed information about the performance of the Fund over various time periods, including performance information relative to benchmarks, information that compared the performance of the Fund to the performance of a group of comparable mutual funds as determined by the independent third-party data provider, and information and analysis provided by the independent fee consultant. The Committee and the Board also reviewed a description of the third party’s methodology for identifying the Fund’s peer groups for purposes of performance and expense comparisons. Although the Fund’s performance lagged that of a relevant peer group for certain (although not necessarily all) periods, the Committee
Columbia Contrarian Core Fund | Annual Report 2019
| 37 |
Board Consideration and Approval of Management
Agreement (continued)
and the Board concluded that other factors relevant to performance were sufficient, in light of other considerations, to support continuation of the Management Agreement. Those factors included one or more of the following: (i) that the Fund’s performance, although lagging in certain recent periods, was stronger over the longer term; (ii) that the underperformance was attributable, to a significant extent, to investment decisions that were reasonable and consistent with the Fund’s investment strategy and policies and that the Fund was performing within a reasonable range of expectations, given those investment decisions, market conditions and the Fund’s investment strategy; (iii) that the Fund’s performance was competitive when compared to other relevant performance benchmarks or peer groups; and (iv) that the Investment Manager had taken or was taking steps designed to help improve the Fund’s investment performance, including, but not limited to, replacing portfolio managers, enhancing the resources supporting the portfolio managers, or modifying investment strategies.
The Committee and the Board noted that, through December 31, 2018, the Fund’s performance was in the eighty-sixty, eighty-fifth and fifty-seventh percentile (where the best performance would be in the first percentile) of its category selected by the independent third-party data provider for the purposes of performance comparisons for the one-, three- and five-year periods, respectively.
The Committee and the Board also considered the Investment Manager’s performance and reputation generally, the Investment Manager’s historical responsiveness to Board concerns about performance, and the Investment Manager’s willingness to take steps intended to improve performance. After reviewing these and related factors, the Committee and the Board concluded, within the context of their overall conclusions, that the performance of the Fund and the Investment Manager was sufficient, in light of other considerations, to support the continuation of the Management Agreement.
Investment management fee rates and other expenses
The Committee and the Board considered the management fees charged to the Fund under the Management Agreement as well as the total expenses incurred by the Fund. In assessing the reasonableness of the fees under the Management Agreement, the Committee and the Board considered, among other information, the Fund’s total expense ratio as a percentage of average daily net assets. The Committee and the Board considered data provided by the independent third-party data provider and the independent fee consultant. The Committee and the Board noted that, as of December 31, 2018, the Fund’s actual management fee and net total expense ratio were both ranked in the third quintile (where the lowest fees and expenses would be in the first quintile) against the Fund’s expense universe as determined by the independent third-party data provider for purposes of expense comparison. The Committee and the Board also took into account the fee waiver and expense limitation arrangements agreed to by the Investment Manager, as noted above.
The Committee and the Board also received and considered information about the management fees charged by the Investment Manager to institutional accounts. In considering the fees charged to those accounts, the Committee and the Board took into account, among other things, the Investment Manager’s representations about the differences between managing mutual funds as compared to other types of accounts, including differences in the services provided, differences in the risk profile of such business for the Investment Manager and the additional resources required to manage mutual funds effectively. The Committee and the Board also received and considered information about the fees charged by the Investment Manager for sub-advisory services it provides to comparable unaffiliated funds. In evaluating the Fund’s management fees, the Committee and the Board also took into account the demands, complexity and quality of the investment management of the Fund.
After reviewing these and related factors, the Committee and the Board concluded, within the context of their overall conclusions, that the management fee rates and expenses of the Fund, in light of other considerations, supported the continuation of the Management Agreement.
Costs of services provided and profitability
The Committee and the Board also took note of the costs the Investment Manager and its affiliates incur in connection with the services provided and the profitability to the Investment Manager and its affiliates from their relationships with the Fund, and the efforts undertaken by the Investment Manager and its affiliates to manage efficiently their costs to provide such services.
| 38 | Columbia Contrarian Core Fund | Annual Report 2019 |
Board Consideration and Approval of Management
Agreement (continued)
The Committee and the Board also considered the compensation directly or indirectly received by the Investment Manager’s affiliates in connection with their relationships with the Fund. The Committee and the Board reviewed information provided by management as to the profitability to the Investment Manager and its affiliates of their relationships with the Fund, information about the allocation of expenses used to calculate profitability, and comparisons of profitability levels realized in 2018 to profitability levels realized in 2017. When reviewing profitability, the Committee and the Board also considered court cases in which adviser profitability was an issue in whole or in part, the performance of similarly managed funds, the performance of the Fund, and the expense ratio of the Fund. In addition, the Committee and the Board considered information provided by the Investment Manager regarding the Investment Manager’s financial condition and comparing its profitability to that of other asset management firms that are, or are subsidiaries of, publicly traded companies. In this regard, the Committee and the Board also considered data provided by the independent fee consultant.
After reviewing these and related factors, the Committee and the Board concluded, within the context of their overall conclusions, that the costs of services provided and the profitability to the Investment Manager and its affiliates from their relationships with the Fund supported the continuation of the Management Agreement.
Economies of scale
The Committee and the Board considered the potential existence of economies of scale in the provision by the Investment Manager of services to the Fund, to groups of related funds, and to the Investment Manager’s investment advisory clients as a whole, and whether those economies of scale were shared with the Fund through breakpoints in investment management fees or other means, such as expense limitation arrangements and additional investments by the Investment Manager in investment, trading, compliance and other resources. The Committee and the Board noted that the management fee schedules for the Fund contained breakpoints that would reduce the fee rate on assets above specified threshold levels.
In considering these matters, the Committee and the Board also considered the costs of the services provided and the profitability to the Investment Manager and its affiliates from their relationships with the Fund, as noted above. After reviewing these and related factors, the Committee and the Board concluded, within the context of their overall conclusions, that the extent to which any economies of scale were expected to be shared with the Fund supported the continuation of the Management Agreement.
Other benefits to the Investment Manager
The Committee and the Board received and considered information regarding “fall-out” or ancillary benefits received by the Investment Manager and its affiliates as a result of their relationships with the Fund, such as the engagement of the Investment Manager’s affiliates to provide distribution, transfer agency and shareholder services to the Fund. In this regard, among other matters, the Committee and the Board considered that the Fund’s distributor retains a portion of the distribution fees from the Fund and receives a portion of the sales charges on sales or redemptions of certain classes of shares of the Fund. The Committee and the Board also considered the benefits of research made available to the Investment Manager by reason of brokerage commissions generated by the Fund’s securities transactions, and reviewed information about the Investment Manager’s practices with respect to considering brokerage and research services when allocating portfolio transactions. In this connection, the Board also noted that the amount of research made available to the Investment Manager by reason of brokerage commissions had been declining over time, and may decline further. The Committee and the Board recognized that the Investment Manager’s profitability would be somewhat lower without these benefits.
Conclusion
The Committee and the Board reviewed all of the above considerations in reaching their decisions to recommend or approve the continuation of the Management Agreement. In their deliberations, the Trustees did not identify any particular information that was all-important or controlling, and individual Trustees may have attributed different weights to the various factors. Based on their evaluation of all factors that they deemed to be material, including those factors described above, and assisted by the advice of independent legal counsel, the Board, including the Independent Trustees, voting separately, unanimously approved the continuation of the Management Agreement.
Columbia Contrarian Core Fund | Annual Report 2019
| 39 |
Columbia Contrarian Core Fund
P.O. Box 219104
Kansas City, MO 64121-9104
Please read and consider the investment objectives, risks, charges and expenses for any fund carefully before investing. For a prospectus and summary prospectus, which contains this and other important information about the Fund, go to
columbiathreadneedleus.com/investor/. The Fund is distributed by Columbia Management Investment Distributors, Inc., member FINRA, and managed by Columbia Management Investment Advisers, LLC.
Columbia Threadneedle Investments (Columbia Threadneedle) is the global brand name of the Columbia and Threadneedle group of companies. All rights reserved.
© 2019 Columbia Management Investment Advisers, LLC.
columbiathreadneedleus.com/investor/

Annual Report
August 31, 2019
Columbia Emerging Markets Fund
Beginning on January 1, 2021, as permitted by regulations adopted by the Securities and Exchange Commission, paper copies of the Fund’s annual and semiannual shareholder reports like this one will no longer be sent by mail, unless you specifically request paper copies of the reports. Instead, the reports will be made available on the Fund’s website (columbiathreadneedleus.com/investor/), and each time a report is posted you will be notified by mail and provided with a website address to access the report.
If you have already elected to receive shareholder reports electronically, you will not be affected by this change and you need not take any action. You may elect to receive shareholder reports and other communications from the Fund electronically at any time by contacting your financial intermediary (such as a broker-dealer or bank) or, for Fund shares held directly with the Fund, by calling 800.345.6611 or by enrolling in “eDelivery” by logging into your account at columbiathreadneedleus.com/investor/.
You may elect to receive all future reports in paper free of charge. If you invest through a financial intermediary, you can contact your financial intermediary to request that you continue receiving paper copies of your shareholder reports. If you invest directly with the Fund, you can call 800.345.6611 to let the Fund know you wish to continue receiving paper copies of your shareholder reports. Your election to receive paper reports will apply to all Columbia Funds held in your account if you invest through a financial intermediary or all Columbia Funds held with the fund complex if you invest directly with the Fund.
Not FDIC Insured • No bank guarantee • May lose value
Columbia Emerging Markets Fund (the Fund) mails one shareholder report to each shareholder address, unless such shareholder elected to receive shareholder reports from the Fund electronically. If you would like more than one report, please call shareholder services at 800.345.6611 and additional reports will be sent to you.
Proxy voting policies and procedures
The policy of the Board of Trustees is to vote the proxies of the companies in which the Fund holds investments consistent with the procedures as stated in the Statement of Additional Information (SAI). You may obtain a copy of the SAI without charge by calling 800.345.6611; contacting your financial intermediary; visiting columbiathreadneedleus.com/investor/; or searching the website of the Securities and Exchange Commission (SEC) at sec.gov. Information regarding how the Fund voted proxies relating to portfolio securities is filed with the SEC by August 31st for the most recent 12-month period ending June 30th of that year, and is available without charge by visiting columbiathreadneedleus.com/investor/, or searching the website of the SEC at sec.gov.
Quarterly schedule of investments
The Fund files a complete schedule of portfolio holdings with the SEC for the first and third quarters of each fiscal year on Form N-PORT, and for reporting periods ended prior to March 31, 2019, on Form N-Q. The Fund’s Form N-Q and Form N-PORT filings are available on the SEC’s website at sec.gov. The Fund’s complete schedule of portfolio holdings, as filed on Form N-Q or Form N-PORT, can also be obtained without charge, upon request, by calling 800.345.6611.
Additional Fund information
For more information about the Fund, please visit columbiathreadneedleus.com/investor/ or call 800.345.6611. Customer Service Representatives are available to answer your questions Monday through Friday from 8 a.m. to 7 p.m. Eastern time.
Fund investment manager
Columbia Management Investment Advisers, LLC (the Investment Manager)
225 Franklin Street
Boston, MA 02110
Fund distributor
Columbia Management Investment Distributors, Inc.
225 Franklin Street
Boston, MA 02110
Fund transfer agent
Columbia Management Investment Services Corp.
P.O. Box 219104
Kansas City, MO 64121-9104
Columbia Emerging Markets Fund | Annual Report 2019
Investment objective
The Fund seeks long-term capital appreciation.
Portfolio management
Dara White, CFA
Lead Portfolio Manager
Managed Fund since 2008
Robert Cameron
Portfolio Manager
Managed Fund since 2008
Jasmine (Weili) Huang*, CFA, CPA (U.S. and China), CFM
Portfolio Manager
Managed Fund since 2008
Young Kim
Portfolio Manager
Managed Fund since 2015
Perry Vickery, CFA
Portfolio Manager
Managed Fund since 2017
* Jasmine (Weili) Huang is on a medical leave of absence. A timetable for her return is not set.
Morningstar style boxTM
The Morningstar Style Box is based on a fund’s portfolio holdings. For equity funds, the vertical axis shows the market capitalization of the stocks owned, and the horizontal axis shows investment style (value, blend, or growth). Information shown is based on the most recent data provided by Morningstar.
© 2019 Morningstar, Inc. All rights reserved. The Morningstar information contained herein: (1) is proprietary to Morningstar and/or its content providers; (2) may not be copied or distributed; and (3) is not warranted to be accurate, complete or timely. Neither Morningstar nor its content providers are responsible for any damages or losses arising from any use of this information.
| Average annual total returns (%) (for the period ended August 31, 2019) |
| | | Inception | 1 Year | 5 Years | 10 Years |
| Class A | Excluding sales charges | 09/28/07 | 0.00 | 2.15 | 5.38 |
| | Including sales charges | | -5.74 | 0.94 | 4.76 |
| Advisor Class* | 03/19/13 | 0.20 | 2.41 | 5.66 |
| Class C | Excluding sales charges | 09/28/07 | -0.79 | 1.39 | 4.60 |
| | Including sales charges | | -1.78 | 1.39 | 4.60 |
| Institutional Class | 01/02/98 | 0.20 | 2.41 | 5.65 |
| Institutional 2 Class* | 11/08/12 | 0.36 | 2.55 | 5.76 |
| Institutional 3 Class* | 11/08/12 | 0.43 | 2.60 | 5.80 |
| Class R* | 09/27/10 | -0.25 | 1.89 | 5.14 |
| MSCI Emerging Markets Index (Net) | | -4.36 | 0.38 | 4.07 |
| MSCI EAFE Index (Net) | | -3.26 | 1.89 | 5.00 |
Returns for Class A shares are shown with and without the maximum initial sales charge of 5.75%. Returns for Class C shares are shown with and without the 1.00% contingent deferred sales charge for the first year only. The Fund’s other share classes are not subject to sales charges and have limited eligibility. Please see the Fund’s prospectus for details. Performance for different share classes will vary based on differences in sales charges and fees associated with each share class. All results shown assume reinvestment of distributions during the period. Returns do not reflect the deduction of taxes that a shareholder may pay on Fund distributions or on the redemption of Fund shares. Performance results reflect the effect of any fee waivers or reimbursements of Fund expenses by Columbia Management Investment Advisers, LLC and/or any of its affiliates. Absent these fee waivers or expense reimbursement arrangements, performance results would have been lower.
The performance information shown represents past performance and is not a guarantee of future results. The investment return and principal value of your investment will fluctuate so that your shares, when redeemed, may be worth more or less than their original cost. Current performance may be lower or higher than the performance information shown. You may obtain performance information current to the most recent month-end by contacting your financial intermediary, visiting columbiathreadneedleus.com/investor/ or calling 800.345.6611.
| * | The returns shown for periods prior to the share class inception date (including returns for the Life of the Fund, if shown, which are since Fund inception) include the returns of the Fund’s oldest share class. These returns are adjusted to reflect any higher class-related operating expenses of the newer share classes, as applicable. Please visit columbiathreadneedleus.com/investor/investment-products/mutual-funds/appended-performance for more information. |
The MSCI Emerging Markets Index (Net) is a free float-adjusted market capitalization index that is designed to measure equity market performance of emerging markets.
The MSCI EAFE Index (Net) is a free float-adjusted market capitalization index that is designed to measure the equity market performance of developed markets, excluding the U.S. and Canada. The index is compiled from a composite of securities markets of Europe, Australasia and the Far East and is widely recognized by investors in foreign markets as the measurement index for portfolios of non-North American securities.
Indices are not available for investment, are not professionally managed and do not reflect sales charges, fees, brokerage commissions, taxes (except the MSCI Emerging Markets Index (Net) and the MSCI EAFE Index (Net) which reflect reinvested dividends net of withholding taxes) or other expenses of investing. Securities in the Fund may not match those in an index.
Columbia Emerging Markets Fund | Annual Report 2019
| 3 |
Fund at a Glance (continued)
Performance of a hypothetical $10,000 investment (August 31, 2009 — August 31, 2019)
The chart above shows the change in value of a hypothetical $10,000 investment in Class A shares of Columbia Emerging Markets Fund during the stated time period, and does not reflect the deduction of taxes that a shareholder may pay on Fund distributions or on the redemption of Fund shares.
| Top 10 holdings (%) (at August 31, 2019) |
| Alibaba Group Holding Ltd., ADR (China) | 7.0 |
| Tencent Holdings Ltd. (China) | 6.3 |
| Taiwan Semiconductor Manufacturing Co., Ltd. (Taiwan) | 4.0 |
| Naspers Ltd., Class N (South Africa) | 3.8 |
| Samsung Electronics Co., Ltd. (South Korea) | 3.6 |
| Ping An Insurance Group Co. of China Ltd., Class H (China) | 2.2 |
| PT Bank Rakyat Indonesia Persero Tbk (Indonesia) | 2.2 |
| PT Bank Central Asia Tbk (Indonesia) | 2.0 |
| Reliance Industries Ltd. (India) | 1.9 |
| Itaú Unibanco Holding SA, ADR (Brazil) | 1.8 |
Percentages indicated are based upon total investments excluding Money Market Funds and investments in derivatives, if any.
For further detail about these holdings, please refer to the section entitled “Portfolio of Investments.”
Fund holdings are as of the date given, are subject to change at any time, and are not recommendations to buy or sell any security.
| Equity sector breakdown (%) (at August 31, 2019) |
| Communication Services | 12.5 |
| Consumer Discretionary | 24.2 |
| Consumer Staples | 4.2 |
| Energy | 8.1 |
| Financials | 21.9 |
| Health Care | 5.4 |
| Industrials | 3.9 |
| Information Technology | 14.4 |
| Materials | 2.7 |
| Real Estate | 2.1 |
| Utilities | 0.6 |
| Total | 100.0 |
Percentages indicated are based upon total equity investments. The Fund’s portfolio composition is subject to change.
| 4 | Columbia Emerging Markets Fund | Annual Report 2019 |
Fund at a Glance (continued)
| Country breakdown (%) (at August 31, 2019) |
| Argentina | 0.3 |
| Brazil | 13.3 |
| Canada | 0.8 |
| China | 28.6 |
| Hong Kong | 3.2 |
| Hungary | 0.8 |
| India | 12.0 |
| Indonesia | 5.9 |
| Luxembourg | 0.5 |
| Mexico | 1.2 |
| Panama | 0.9 |
| Peru | 1.2 |
| Philippines | 1.4 |
| Poland | 1.3 |
| Russian Federation | 5.0 |
| South Africa | 4.9 |
| South Korea | 7.8 |
| Taiwan | 5.8 |
| Thailand | 2.7 |
| United States(a) | 2.4 |
| Total | 100.0 |
| (a) | Includes investments in Money Market Funds. |
Country breakdown is based primarily on issuer’s place of organization/incorporation. Percentages indicated are based upon total investments excluding investments in derivatives, if any. The Fund’s portfolio composition is subject to change.
Columbia Emerging Markets Fund | Annual Report 2019
| 5 |
Manager Discussion of Fund Performance
For the 12-month period ended August 31, 2019, the Fund’s Class A shares returned 0.00% excluding sales charges. During the same time period, the Fund outperformed its benchmark, the MSCI Emerging Markets Index (Net), which returned -4.36%, as well as the MSCI EAFE Index (Net), a measure of more developed foreign markets, which returned -3.26%. Individual stock selection, particularly in the financials, industrials, health care and consumer staples sectors, was the primary factor in the Fund’s outperformance, while country allocation also contributed positively.
Market overview
The 12 months ended August 31, 2019 saw notable volatility in risk assets including emerging market equities. The period opened against the backdrop of a slowing global economy and an escalating U.S.-China trade war. A sharp risk-off tone in late 2018 was driven by concerns that the U.S. Federal Reserve (Fed) would overshoot in raising rates given the already fragile growth outlook. The Fed responded to the deterioration in sentiment by executing a policy pivot entering 2019, signaling a pause in rate increases along with announcing an early end to its balance sheet reduction program. The Chinese government also moved toward increasing accommodation by putting to the side deleveraging efforts and adding stimulus in the form of lower bank reserve requirements, tax cuts and targeted infrastructure spending. Along with signs of modest progress in trade negotiations, these developments supported a rebound in global equities over the first few months of 2019. However, the rally would be derailed in early May as President Trump announced plans to raise tariffs from 10% to 25% on some $200 billion in imports from China. Sentiment was subsequently buffered to a degree as the Fed indicated a willingness to cut its benchmark overnight lending rate as needed to offset the impact on global growth of higher tariffs.
There was wide dispersion in performance across individual emerging markets over the 12 months. Brazilian equities led performance for the period, rising more than 30% on the back of elections in late 2018 that improved the outlook for government reform and fiscal restraint. Indonesia was another strong performer, as that country’s reform-minded president won reelection and Southeast Asian economies in general benefited from a shift in U.S. manufacturing supply chains away from China in the wake of trade tensions. Both Brazil and Indonesia overcame the narrative that they would be “the next Turkey” and fall prey to collapsing currencies due to a lack of market confidence in their fiscal management. That said, the oversold Turkish equity market experienced a strong gain over the period, coming off lows. Russia also outperformed, likely in part due to improved corporate governance in the wake of U.S. sanctions that have limited access to financing. Sharp declines were seen in Argentina, which required International Monetary Fund assistance to restructure its debt, as well as Mexico where elections went in a direction not viewed as friendly to free market enterprise. Korea was also in notable negative territory on concerns over slower global growth that were exacerbated by the U.S.-China trade war. Indian equities also declined more than the benchmark, as Prime Minister Modi’s necessary reform efforts have weighed on the domestic economy in the short term.
Contributors and detractors
While the Fund’s performance lagged the benchmark during the sell-off in risk assets seen in late 2018, this was more than offset by strong relative results in 2019 through August 31. Individual stock selection was the primary factor in the Fund’s outperformance relative to the benchmark. The Fund’s country allocation also contributed positively, most notably overweights to Brazil and Indonesia along with an underweight to Korea. Sector allocation detracted marginally, specifically overweights to consumer discretionary and healthcare and underweights to utilities and consumer staples. It should be noted that the Fund’s country and sector weightings are the result of our individual stock selection process rather than top-down analysis.
In China, we have increasingly focused on domestically oriented companies that are less vulnerable to global trade disruptions. Positive contributions from the Fund’s China holdings were highlighted by a pair of companies within consumer staples, premium liquor manufacturers Kweichow Moutai Co., Ltd. and Wuliangye Yibin Co., Ltd. Both companies have seen their results benefit from an increase in high-end consumption supported in part by the government’s recent stimulus efforts. Within consumer discretionary, a pair of educational services companies, TAL Education Group and New Oriental Education & Technology, were notable outperformers as both companies have experienced strong enrollment growth. Within healthcare, a position in WuXi AppTec Group aided performance as the China-based biopharmaceutical company has benefited from the industry trend toward outsourcing of clinical drug trials. Turning to Brazil, shares of rental car company Localiza Rent A Car rose on positive results driven by the recovery in the domestic economy and the growth of rideshare companies such as Uber and Lyft. Low cost airline Azul Brazilian Airlines was another contributor, with results benefiting as Brazil emerges from an
| 6 | Columbia Emerging Markets Fund | Annual Report 2019 |
Manager Discussion of Fund Performance (continued)
historically deep recession. In Indonesia, positive contributions were led by Banc Rakyat, a leading microfinance company which has experienced strong profit growth, and Ace Hardware Indonesia, which is well-positioned to benefit from a secular a rise in home ownership.
On the downside, shares of Sunny Optical Technology Co., Ltd., China’s largest manufacturer of smartphone camera components, declined notably. We exited the position on the view that the U.S.-China trade dispute and security concerns are likely to weigh on Chinese technology companies for some time. Nexteer Automotive Group Ltd. was another laggard, as the China-based auto parts company was negatively impacted by shifting supply chains resulting from higher U.S. tariffs. We sold the position during the period. Shares of Chinese online advertising firm 58.com also performed poorly as the slowing domestic economy hurt revenue growth. We have maintained our holdings of 58.com given the company’s leadership position in the Chinese market. Outside of China, detractors included Mexican petrochemical company Mexichem SAB de CB, as slowing growth and regulatory concerns weighed on the stock price.
Portfolio positioning
We continue to use a bottom-up approach designed to identify fast-growing, fundamentally sound companies that are capitalizing on favorable long-term trends, including the increase in emerging market consumers with rising incomes in developing economies. At the close of the reporting period, the Fund’s most meaningful overweights were in the consumer discretionary, communications services and healthcare sectors, while underweights included materials, utilities, consumer staples and industrials.
In China, the government’s focus had shifted away from deleveraging and toward measures to stimulate the economy at the close of the reporting period. The Chinese Purchasing Managers’ Index had shown signs of strengthening, suggesting a return on the part of companies to more of a “business as usual” approach despite the overhang from trade uncertainty. More broadly, we believe that reforms in emerging market economies have the potential to be transformational in unlocking growth potential. Reform efforts in countries such as Indonesia, China and India have been paving the way for greater macro stability and stronger structural growth. In Brazil as well, the new government has been pursuing reforms to boost productivity and address fiscal instability, most notably targeting pensions.
We believe the emerging market valuation case remains compelling, with most valuation metrics below their respective historical levels at the close of the reporting period. In addition, we viewed the improved composition of the emerging market universe, which featured higher quality names, as offering investors an attractive opportunity to invest in solid businesses supported by structural growth trends.
Marketrisk may affect a single issuer, sector of the economy, industry or the market as a whole.Internationalinvesting involves certain risks and volatility due to potential political, economic or currency instabilities and different financial and accounting standards. Risks are enhanced foremerging market issuers. Investments insmall- and mid-cap companies involve risks and volatility greater than investments in larger, more established companies.Value securitiesmay be unprofitable if the market fails to recognize their intrinsic worth or the portfolio manager misgauged that worth.Growth securities, at times, may not perform as well as value securities or the stock market in general and may be out of favor with investors. Certainissuer events, including initial public offerings, business consolidation or restructuring, may present heightened risks to securities from the high degree of uncertainty associated with such events. See the Fund’s prospectus for more information on these and other risks.
The views expressed in this report reflect the current views of the respective parties. These views are not guarantees of future performance and involve certain risks, uncertainties and assumptions that are difficult to predict, so actual outcomes and results may differ significantly from the views expressed. These views are subject to change at any time based upon economic, market or other conditions and the respective parties disclaim any responsibility to update such views. These views may not be relied on as investment advice and, because investment decisions for a Columbia fund are based on numerous factors, may not be relied on as an indication of trading intent on behalf of any particular Columbia fund. References to specific securities should not be construed as a recommendation or investment advice.
Columbia Emerging Markets Fund | Annual Report 2019
| 7 |
Understanding Your Fund’s Expenses
(Unaudited)
As an investor, you incur two types of costs. There are shareholder transaction costs, which generally include sales charges on purchases and may include redemption fees. There are also ongoing fund costs, which generally include management fees, distribution and/or service fees, and other fund expenses. The following information is intended to help you understand your ongoing costs (in dollars) of investing in the Fund and to help you compare these costs with the ongoing costs of investing in other mutual funds.
Analyzing your Fund’s expenses
To illustrate these ongoing costs, we have provided examples and calculated the expenses paid by investors in each share class of the Fund during the period. The actual and hypothetical information in the table is based on an initial investment of $1,000 at the beginning of the period indicated and held for the entire period. Expense information is calculated two ways and each method provides you with different information. The amount listed in the “Actual” column is calculated using the Fund’s actual operating expenses and total return for the period. You may use the Actual information, together with the amount invested, to estimate the expenses that you paid over the period. Simply divide your account value by $1,000 (for example, an $8,600 account value divided by $1,000 = 8.6), then multiply the results by the expenses paid during the period under the “Actual” column. The amount listed in the “Hypothetical” column assumes a 5% annual rate of return before expenses (which is not the Fund’s actual return) and then applies the Fund’s actual expense ratio for the period to the hypothetical return. You should not use the hypothetical account values and expenses to estimate either your actual account balance at the end of the period or the expenses you paid during the period. See “Compare with other funds” below for details on how to use the hypothetical data.
Compare with other funds
Since all mutual funds are required to include the same hypothetical calculations about expenses in shareholder reports, you can use this information to compare the ongoing cost of investing in the Fund with other funds. To do so, compare the hypothetical example with the 5% hypothetical examples that appear in the shareholder reports of other funds. As you compare hypothetical examples of other funds, it is important to note that hypothetical examples are meant to highlight the ongoing costs of investing in a fund only and do not reflect any transaction costs, such as sales charges, or redemption or exchange fees. Therefore, the hypothetical calculations are useful in comparing ongoing costs only, and will not help you determine the relative total costs of owning different funds. If transaction costs were included in these calculations, your costs would be higher.
| March 1, 2019 — August 31, 2019 |
| | Account value at the
beginning of the
period ($) | Account value at the
end of the
period ($) | Expenses paid during
the period ($) | Fund’s annualized
expense ratio (%) |
| | Actual | Hypothetical | Actual | Hypothetical | Actual | Hypothetical | Actual |
| Class A | 1,000.00 | 1,000.00 | 1,020.20 | 1,017.25 | 7.90 | 7.89 | 1.56 |
| Advisor Class | 1,000.00 | 1,000.00 | 1,020.60 | 1,018.50 | 6.64 | 6.63 | 1.31 |
| Class C | 1,000.00 | 1,000.00 | 1,016.10 | 1,013.49 | 11.67 | 11.66 | 2.31 |
| Institutional Class | 1,000.00 | 1,000.00 | 1,020.70 | 1,018.50 | 6.64 | 6.63 | 1.31 |
| Institutional 2 Class | 1,000.00 | 1,000.00 | 1,021.50 | 1,019.20 | 5.93 | 5.92 | 1.17 |
| Institutional 3 Class | 1,000.00 | 1,000.00 | 1,022.20 | 1,019.45 | 5.68 | 5.67 | 1.12 |
| Class R | 1,000.00 | 1,000.00 | 1,018.70 | 1,015.99 | 9.16 | 9.15 | 1.81 |
Expenses paid during the period are equal to the annualized expense ratio for each class as indicated above, multiplied by the average account value over the period and then multiplied by the number of days in the Fund’s most recent fiscal half year and divided by 365.
Expenses do not include fees and expenses incurred indirectly by the Fund from its investment in underlying funds, including affiliated and non-affiliated pooled investment vehicles, such as mutual funds and exchange-traded funds.
| 8 | Columbia Emerging Markets Fund | Annual Report 2019 |
Portfolio of Investments
August 31, 2019
(Percentages represent value of investments compared to net assets)
Investments in securities
| Common Stocks 94.9% |
| Issuer | Shares | Value ($) |
| Argentina 0.3% |
| MercadoLibre, Inc.(a) | 7,078 | 4,208,579 |
| Brazil 11.5% |
| Arco Platform Ltd., Class A(a) | 132,983 | 6,428,398 |
| B3 SA - Brasil Bolsa Balcao | 491,000 | 5,336,853 |
| BK Brasil Operacao e Assessoria a Restaurantes SA | 3,993,900 | 18,276,842 |
| IRB Brasil Resseguros SA | 155,800 | 3,986,238 |
| Itaú Unibanco Holding SA, ADR | 2,772,800 | 22,847,872 |
| Linx SA | 561,400 | 4,304,383 |
| Localiza Rent a Car SA | 1,437,302 | 16,434,738 |
| Lojas Renner SA | 549,340 | 6,715,187 |
| Magazine Luiza SA | 868,800 | 7,626,390 |
| Notre Dame Intermedica Participacoes SA | 910,700 | 11,924,210 |
| Pagseguro Digital Ltd., Class A(a) | 149,475 | 7,467,771 |
| Petrobras Distribuidora SA | 1,475,500 | 10,208,422 |
| Petroleo Brasileiro SA, ADR | 1,477,776 | 20,023,865 |
| Stone Co., Ltd., Class A(a) | 194,585 | 5,853,117 |
| Total | 147,434,286 |
| Canada 0.8% |
| Parex Resources, Inc.(a) | 652,110 | 9,986,873 |
| China 28.6% |
| 58.Com, Inc., ADR(a) | 125,859 | 6,769,956 |
| Alibaba Group Holding Ltd., ADR(a) | 497,827 | 87,134,660 |
| BeiGene Ltd., ADR(a) | 95,216 | 13,687,300 |
| China Animal Healthcare Ltd.(a),(b),(c) | 6,354,000 | 1 |
| China Resources Cement Holdings Ltd. | 12,272,000 | 10,843,316 |
| CNOOC Ltd. | 9,598,000 | 14,218,632 |
| Ctrip.com International Ltd., ADR(a) | 172,242 | 5,577,196 |
| HUYA, Inc. ADR(a) | 140,515 | 3,540,978 |
| Jiangsu Yanghe Brewery Joint-Stock Co., Ltd., Class A | 652,711 | 10,227,233 |
| Kingdee International Software Group Co., Ltd. | 5,726,000 | 5,165,576 |
| Kweichow Moutai Co., Ltd., Class A | 40,348 | 6,448,245 |
| Midea Group Co., Ltd., Class A | 1,161,153 | 8,591,618 |
| NetEase, Inc., ADR | 61,638 | 15,717,690 |
| New Oriental Education & Technology Group, Inc., ADR(a) | 105,605 | 11,975,607 |
| Common Stocks (continued) |
| Issuer | Shares | Value ($) |
| Ping An Insurance Group Co. of China Ltd., Class H | 2,408,000 | 27,627,013 |
| Shenzhou International Group Holdings Ltd. | 933,000 | 12,658,305 |
| TAL Education Group, ADR(a) | 310,237 | 11,053,744 |
| Tencent Holdings Ltd. | 1,909,900 | 78,851,240 |
| Tencent Music Entertainment Group, ADR(a) | 760,353 | 10,112,695 |
| Wuliangye Yibin Co., Ltd., Class A | 212,023 | 4,198,248 |
| WuXi AppTec Co., Ltd., Class H | 715,680 | 8,009,863 |
| Wuxi Biologics Cayman, Inc.(a) | 1,199,000 | 12,584,061 |
| Total | 364,993,177 |
| Hong Kong 3.2% |
| AIA Group Ltd. | 1,464,400 | 14,170,645 |
| Galaxy Entertainment Group Ltd. | 1,914,000 | 11,978,734 |
| Melco Resorts & Entertainment Ltd., ADR | 157,433 | 3,274,606 |
| Techtronic Industries Co., Ltd. | 1,675,500 | 11,557,137 |
| Total | 40,981,122 |
| Hungary 0.8% |
| OTP Bank Nyrt | 150,345 | 5,994,950 |
| Richter Gedeon Nyrt | 261,293 | 4,356,442 |
| Total | 10,351,392 |
| India 12.0% |
| Apollo Hospitals Enterprise Ltd. | 405,314 | 8,559,945 |
| Asian Paints Ltd. | 500,739 | 11,347,452 |
| AU Small Finance Bank Ltd. | 521,290 | 4,919,521 |
| Avenue Supermarts Ltd.(a) | 230,751 | 5,079,954 |
| Bajaj Finance Ltd. | 119,258 | 5,572,777 |
| Balkrishna Industries Ltd. | 619,122 | 6,457,615 |
| Biocon Ltd. | 1,129,926 | 3,727,994 |
| Eicher Motors Ltd. | 36,230 | 8,261,133 |
| HDFC Asset Management Co., Ltd. | 191,154 | 6,838,272 |
| HDFC Bank Ltd., ADR | 209,997 | 22,637,677 |
| HDFC Life Insurance Co., Ltd. | 1,144,623 | 8,939,143 |
| Indraprastha Gas Ltd. | 1,497,979 | 7,044,503 |
| Jubilant Foodworks Ltd. | 634,709 | 10,570,037 |
| Maruti Suzuki India Ltd. | 50,195 | 4,306,786 |
| Petronet LNG Ltd. | 2,285,927 | 8,547,615 |
| Reliance Industries Ltd. | 1,339,976 | 23,439,522 |
The accompanying Notes to Financial Statements are an integral part of this statement.
Columbia Emerging Markets Fund | Annual Report 2019
| 9 |
Portfolio of Investments (continued)
August 31, 2019
| Common Stocks (continued) |
| Issuer | Shares | Value ($) |
| Tech Mahindra Ltd. | 699,091 | 6,788,801 |
| Total | 153,038,747 |
| Indonesia 5.9% |
| PT Ace Hardware Indonesia Tbk | 71,267,400 | 8,656,563 |
| PT Bank Central Asia Tbk | 11,331,700 | 24,320,837 |
| PT Bank Rakyat Indonesia Persero Tbk | 90,089,000 | 27,039,611 |
| PT Pakuwon Jati Tbk | 160,903,400 | 7,248,308 |
| PT Telekomunikasi Indonesia Persero Tbk | 25,309,800 | 7,957,698 |
| Total | 75,223,017 |
| Luxembourg 0.5% |
| Ternium SA, ADR | 360,950 | 6,374,377 |
| Mexico 1.2% |
| Grupo Financiero Banorte SAB de CV, Class O | 2,003,100 | 10,808,334 |
| Mexichem SAB de CV | 2,716,171 | 4,973,853 |
| Total | 15,782,187 |
| Panama 0.9% |
| Copa Holdings SA, Class A | 107,421 | 11,083,699 |
| Peru 1.2% |
| Credicorp Ltd. | 72,229 | 14,960,071 |
| Philippines 1.4% |
| Ayala Land, Inc. | 20,084,900 | 18,240,319 |
| Poland 1.3% |
| Dino Polska SA(a) | 297,929 | 11,510,075 |
| KRUK SA | 122,895 | 5,124,677 |
| Total | 16,634,752 |
| Russian Federation 5.0% |
| Detsky Mir PJSC | 3,393,890 | 4,589,599 |
| Lukoil PJSC, ADR | 193,082 | 15,563,581 |
| Mail.ru Group Ltd., GDR(a),(d) | 405,164 | 9,134,449 |
| Sberbank of Russia PJSC, ADR | 809,745 | 11,113,784 |
| TCS Group Holding PLC, GDR(d) | 447,095 | 8,315,967 |
| Yandex NV, Class A(a) | 394,876 | 14,649,900 |
| Total | 63,367,280 |
| Common Stocks (continued) |
| Issuer | Shares | Value ($) |
| South Africa 4.9% |
| AVI Ltd. | 1,092,276 | 5,969,446 |
| Capitec Bank Holdings Ltd. | 95,555 | 6,897,284 |
| Clicks Group Ltd. | 219,159 | 2,875,164 |
| Naspers Ltd., Class N | 207,252 | 47,163,471 |
| Total | 62,905,365 |
| South Korea 6.9% |
| KB Financial Group, Inc. | 201,426 | 6,581,204 |
| Pearl Abyss Corp.(a) | 29,639 | 4,769,755 |
| Samsung Electronics Co., Ltd. | 1,231,103 | 44,823,205 |
| SK Hynix, Inc. | 276,978 | 17,737,867 |
| SK Innovation Co., Ltd. | 64,317 | 8,779,759 |
| SK Telecom Co., Ltd. | 24,201 | 4,784,106 |
| Total | 87,475,896 |
| Taiwan 5.8% |
| ASMedia Technology, Inc. | 338,000 | 5,431,572 |
| MediaTek, Inc. | 742,000 | 8,679,416 |
| Silergy Corp. | 326,000 | 7,243,319 |
| Taiwan Semiconductor Manufacturing Co., Ltd. | 6,055,048 | 49,752,091 |
| Taiwan Semiconductor Manufacturing Co., Ltd., ADR | 79,182 | 3,375,529 |
| Total | 74,481,927 |
| Thailand 2.7% |
| Mega Lifesciences PCL, Foreign Registered Shares | 4,650,400 | 4,735,675 |
| Muangthai Capital PCL, Foreign Registered Shares | 8,946,500 | 16,014,101 |
| Srisawad Corp., PCL, Foreign Registered Shares | 2,238,610 | 4,062,881 |
| Tisco Financial Group PCL, Foreign Registered Shares | 2,772,900 | 9,232,960 |
| Total | 34,045,617 |
Total Common Stocks
(Cost $844,272,006) | 1,211,568,683 |
| Preferred Stocks 2.7% |
| Issuer | | Shares | Value ($) |
| Brazil 1.7% |
| Azul SA(a) | | 859,900 | 10,042,203 |
| Cia Brasileira de Distribuicao | | 293,600 | 6,213,033 |
| Lojas Americanas SA | | 1,290,900 | 5,848,173 |
| Total | 22,103,409 |
The accompanying Notes to Financial Statements are an integral part of this statement.
| 10 | Columbia Emerging Markets Fund | Annual Report 2019 |
Portfolio of Investments (continued)
August 31, 2019
| Preferred Stocks (continued) |
| Issuer | | Shares | Value ($) |
| South Korea 1.0% |
| Samsung Electronics Co., Ltd. | | 399,050 | 12,158,075 |
Total Preferred Stocks
(Cost $26,670,363) | 34,261,484 |
| Money Market Funds 2.4% |
| | Shares | Value ($) |
| Columbia Short-Term Cash Fund, 2.208%(e),(f) | 31,144,946 | 31,141,831 |
Total Money Market Funds
(Cost $31,141,831) | 31,141,831 |
Total Investments in Securities
(Cost $902,084,200) | 1,276,971,998 |
| Other Assets & Liabilities, Net | | (155,488) |
| Net Assets | $1,276,816,510 |
Notes to Portfolio of Investments
| (a) | Non-income producing investment. |
| (b) | Represents fair value as determined in good faith under procedures approved by the Board of Trustees. At August 31, 2019, the total value of these securities amounted to $1, which represents less than 0.01% of total net assets. |
| (c) | Valuation based on significant unobservable inputs. |
| (d) | Represents privately placed and other securities and instruments exempt from Securities and Exchange Commission registration (collectively, private placements), such as Section 4(a)(2) and Rule 144A eligible securities, which are often sold only to qualified institutional buyers. The Fund may invest in private placements determined to be liquid as well as those determined to be illiquid. Private placements may be determined to be liquid under guidelines established by the Fund’s Board of Trustees. At August 31, 2019, the total value of these securities amounted to $17,450,416, which represents 1.37% of total net assets. |
| (e) | The rate shown is the seven-day current annualized yield at August 31, 2019. |
| (f) | As defined in the Investment Company Act of 1940, an affiliated company is one in which the Fund owns 5% or more of the company’s outstanding voting securities, or a company which is under common ownership or control with the Fund. Holdings and transactions in these affiliated companies during the year ended August 31, 2019 are as follows: |
| Issuer | Beginning
shares | Shares
purchased | Shares
sold | Ending
shares | Realized gain
(loss) —
affiliated
issuers ($) | Net change in
unrealized
appreciation
(depreciation) —
affiliated
issuers ($) | Dividends —
affiliated
issuers ($) | Value —
affiliated
issuers
at end of
period ($) |
| Columbia Short-Term Cash Fund, 2.208% |
| | 44,632,401 | 348,576,167 | (362,063,622) | 31,144,946 | (54) | — | 635,166 | 31,141,831 |
Abbreviation Legend
| ADR | American Depositary Receipt |
| GDR | Global Depositary Receipt |
Fair value measurements
The Fund categorizes its fair value measurements according to a three-level hierarchy that maximizes the use of observable inputs and minimizes the use of unobservable inputs by prioritizing that the most observable input be used when available. Observable inputs are those that market participants would use in pricing an investment based on market data obtained from sources independent of the reporting entity. Unobservable inputs are those that reflect the Fund’s assumptions about the information market participants would use in pricing an investment. An investment’s level within the fair value hierarchy is based on the lowest level of any input that is deemed significant to the asset’s or liability’s fair value measurement. The input levels are not necessarily an indication of the risk or liquidity associated with investments at that level. For example, certain U.S. government securities are generally high quality and liquid, however, they are reflected as Level 2 because the inputs used to determine fair value may not always be quoted prices in an active market.
Fair value inputs are summarized in the three broad levels listed below:
The accompanying Notes to Financial Statements are an integral part of this statement.
Columbia Emerging Markets Fund | Annual Report 2019
| 11 |
Portfolio of Investments (continued)
August 31, 2019
Fair value measurements (continued)
| ■ | Level 1 — Valuations based on quoted prices for investments in active markets that the Fund has the ability to access at the measurement date. Valuation adjustments are not applied to Level 1 investments. |
| ■ | Level 2 — Valuations based on other significant observable inputs (including quoted prices for similar securities, interest rates, prepayment speeds, credit risks, etc.). |
| ■ | Level 3 — Valuations based on significant unobservable inputs (including the Fund’s own assumptions and judgment in determining the fair value of investments). |
Inputs that are used in determining fair value of an investment may include price information, credit data, volatility statistics, and other factors. These inputs can be either observable or unobservable. The availability of observable inputs can vary between investments, and is affected by various factors such as the type of investment, and the volume and level of activity for that investment or similar investments in the marketplace. The inputs will be considered by the Investment Manager, along with any other relevant factors in the calculation of an investment’s fair value. The Fund uses prices and inputs that are current as of the measurement date, which may include periods of market dislocations. During these periods, the availability of prices and inputs may be reduced for many investments. This condition could cause an investment to be reclassified between the various levels within the hierarchy.
Foreign equity securities actively traded in markets where there is a significant delay in the local close relative to the New York Stock Exchange are classified as Level 2. The values of these securities may include an adjustment to reflect the impact of significant market movements following the close of local trading, as described in Note 2 to the financial statements – Security valuation.
Investments falling into the Level 3 category are primarily supported by quoted prices from brokers and dealers participating in the market for those investments. However, these may be classified as Level 3 investments due to lack of market transparency and corroboration to support these quoted prices. Additionally, valuation models may be used as the pricing source for any remaining investments classified as Level 3. These models may rely on one or more significant unobservable inputs and/or significant assumptions by the Investment Manager. Inputs used in valuations may include, but are not limited to, financial statement analysis, capital account balances, discount rates and estimated cash flows, and comparable company data.
Under the direction of the Fund’s Board of Trustees (the Board), the Investment Manager’s Valuation Committee (the Committee) is responsible for overseeing the valuation procedures approved by the Board. The Committee consists of voting and non-voting members from various groups within the Investment Manager’s organization, including operations and accounting, trading and investments, compliance, risk management and legal.
The Committee meets at least monthly to review and approve valuation matters, which may include a description of specific valuation determinations, data regarding pricing information received from approved pricing vendors and brokers and the results of Board-approved valuation control policies and procedures (the Policies). The Policies address, among other things, instances when market quotations are or are not readily available, including recommendations of third party pricing vendors and a determination of appropriate pricing methodologies; events that require specific valuation determinations and assessment of fair value techniques; securities with a potential for stale pricing, including those that are illiquid, restricted, or in default; and the effectiveness of third party pricing vendors, including periodic reviews of vendors. The Committee meets more frequently, as needed, to discuss additional valuation matters, which may include the need to review back-testing results, review time-sensitive information or approve related valuation actions. The Committee reports to the Board, with members of the Committee meeting with the Board at each of its regularly scheduled meetings to discuss valuation matters and actions during the period, similar to those described earlier.
The following table is a summary of the inputs used to value the Fund’s investments at August 31, 2019:
| | Level 1 ($) | Level 2 ($) | Level 3 ($) | Total ($) |
| Investments in Securities | | | | |
| Common Stocks | | | | |
| Argentina | 4,208,579 | — | — | 4,208,579 |
| Brazil | 147,434,286 | — | — | 147,434,286 |
| Canada | 9,986,873 | — | — | 9,986,873 |
| China | 165,569,826 | 199,423,350 | 1 | 364,993,177 |
| Hong Kong | 3,274,606 | 37,706,516 | — | 40,981,122 |
| Hungary | — | 10,351,392 | — | 10,351,392 |
| India | 22,637,677 | 130,401,070 | — | 153,038,747 |
| Indonesia | — | 75,223,017 | — | 75,223,017 |
| Luxembourg | 6,374,377 | — | — | 6,374,377 |
| Mexico | 15,782,187 | — | — | 15,782,187 |
| Panama | 11,083,699 | — | — | 11,083,699 |
| Peru | 14,960,071 | — | — | 14,960,071 |
| Philippines | — | 18,240,319 | — | 18,240,319 |
| Poland | — | 16,634,752 | — | 16,634,752 |
| Russian Federation | 14,649,900 | 48,717,380 | — | 63,367,280 |
| South Africa | — | 62,905,365 | — | 62,905,365 |
| South Korea | — | 87,475,896 | — | 87,475,896 |
The accompanying Notes to Financial Statements are an integral part of this statement.
| 12 | Columbia Emerging Markets Fund | Annual Report 2019 |
Portfolio of Investments (continued)
August 31, 2019
Fair value measurements (continued)
| | Level 1 ($) | Level 2 ($) | Level 3 ($) | Total ($) |
| Taiwan | 3,375,529 | 71,106,398 | — | 74,481,927 |
| Thailand | — | 34,045,617 | — | 34,045,617 |
| Total Common Stocks | 419,337,610 | 792,231,072 | 1 | 1,211,568,683 |
| Preferred Stocks | | | | |
| Brazil | 22,103,409 | — | — | 22,103,409 |
| South Korea | — | 12,158,075 | — | 12,158,075 |
| Total Preferred Stocks | 22,103,409 | 12,158,075 | — | 34,261,484 |
| Money Market Funds | 31,141,831 | — | — | 31,141,831 |
| Total Investments in Securities | 472,582,850 | 804,389,147 | 1 | 1,276,971,998 |
See the Portfolio of Investments for all investment classifications not indicated in the table.
The Fund’s assets assigned to the Level 2 input category are generally valued using the market approach, in which a security’s value is determined through reference to prices and information from market transactions for similar or identical assets. These assets include certain foreign securities for which a third party statistical pricing service may be employed for purposes of fair market valuation. The model utilized by such third party statistical pricing service takes into account a security’s correlation to available market data including, but not limited to, intraday index, ADR, and exchange-traded fund movements.
The Fund does not hold any significant investments (greater than one percent of net assets) categorized as Level 3.
The accompanying Notes to Financial Statements are an integral part of this statement.
Columbia Emerging Markets Fund | Annual Report 2019
| 13 |
Statement of Assets and Liabilities
August 31, 2019
| Assets | |
| Investments in securities, at value | |
| Unaffiliated issuers (cost $870,942,369) | $1,245,830,167 |
| Affiliated issuers (cost $31,141,831) | 31,141,831 |
| Foreign currency (cost $2,011,966) | 2,011,966 |
| Receivable for: | |
| Investments sold | 1,483,069 |
| Capital shares sold | 496,166 |
| Dividends | 1,522,086 |
| Foreign tax reclaims | 39,998 |
| Prepaid expenses | 8,514 |
| Trustees’ deferred compensation plan | 97,770 |
| Total assets | 1,282,631,567 |
| Liabilities | |
| Due to custodian | 3,188 |
| Payable for: | |
| Investments purchased | 3,119,609 |
| Capital shares purchased | 2,081,031 |
| Foreign capital gains taxes deferred | 363 |
| Management services fees | 35,905 |
| Distribution and/or service fees | 2,195 |
| Transfer agent fees | 134,758 |
| Compensation of board members | 330 |
| Compensation of chief compliance officer | 87 |
| Other expenses | 339,821 |
| Trustees’ deferred compensation plan | 97,770 |
| Total liabilities | 5,815,057 |
| Net assets applicable to outstanding capital stock | $1,276,816,510 |
| Represented by | |
| Paid in capital | 937,976,249 |
| Total distributable earnings (loss) (Note 2) | 338,840,261 |
| Total - representing net assets applicable to outstanding capital stock | $1,276,816,510 |
The accompanying Notes to Financial Statements are an integral part of this statement.
| 14 | Columbia Emerging Markets Fund | Annual Report 2019 |
Statement of Assets and Liabilities (continued)
August 31, 2019
| Class A | |
| Net assets | $249,512,281 |
| Shares outstanding | 20,541,736 |
| Net asset value per share | $12.15 |
| Maximum sales charge | 5.75% |
| Maximum offering price per share (calculated by dividing the net asset value per share by 1.0 minus the maximum sales charge for Class A shares) | $12.89 |
| Advisor Class | |
| Net assets | $23,160,854 |
| Shares outstanding | 1,869,389 |
| Net asset value per share | $12.39 |
| Class C | |
| Net assets | $14,829,970 |
| Shares outstanding | 1,305,536 |
| Net asset value per share | $11.36 |
| Institutional Class | |
| Net assets | $210,843,843 |
| Shares outstanding | 17,144,650 |
| Net asset value per share | $12.30 |
| Institutional 2 Class | |
| Net assets | $161,553,556 |
| Shares outstanding | 13,046,087 |
| Net asset value per share | $12.38 |
| Institutional 3 Class | |
| Net assets | $609,791,200 |
| Shares outstanding | 49,030,273 |
| Net asset value per share | $12.44 |
| Class R | |
| Net assets | $7,124,806 |
| Shares outstanding | 595,917 |
| Net asset value per share | $11.96 |
The accompanying Notes to Financial Statements are an integral part of this statement.
Columbia Emerging Markets Fund | Annual Report 2019
| 15 |
Statement of Operations
Year Ended August 31, 2019
| Net investment income | |
| Income: | |
| Dividends — unaffiliated issuers | $23,518,017 |
| Dividends — affiliated issuers | 635,166 |
| Interest | 32,225 |
| Interfund lending | 269 |
| Foreign taxes withheld | (2,358,059) |
| Total income | 21,827,618 |
| Expenses: | |
| Management services fees | 13,209,425 |
| Distribution and/or service fees | |
| Class A | 631,755 |
| Class C | 176,752 |
| Class R | 42,099 |
| Class T | 95 |
| Transfer agent fees | |
| Class A | 523,429 |
| Advisor Class | 46,416 |
| Class C | 36,645 |
| Institutional Class | 403,774 |
| Institutional 2 Class | 90,766 |
| Institutional 3 Class | 48,354 |
| Class R | 17,452 |
| Class T | 79 |
| Compensation of board members | 32,297 |
| Custodian fees | 403,826 |
| Printing and postage fees | 108,243 |
| Registration fees | 138,016 |
| Audit fees | 88,348 |
| Legal fees | 25,937 |
| Interest on interfund lending | 266 |
| Compensation of chief compliance officer | 503 |
| Other | 278,938 |
| Total expenses | 16,303,415 |
| Net investment income | 5,524,203 |
| Realized and unrealized gain (loss) — net | |
| Net realized gain (loss) on: | |
| Investments — unaffiliated issuers | (14,523,417) |
| Investments — affiliated issuers | (54) |
| Foreign currency translations | (489,764) |
| Net realized loss | (15,013,235) |
| Net change in unrealized appreciation (depreciation) on: | |
| Investments — unaffiliated issuers | 8,977,103 |
| Foreign currency translations | 8,053 |
| Foreign capital gains tax | 846,600 |
| Net change in unrealized appreciation (depreciation) | 9,831,756 |
| Net realized and unrealized loss | (5,181,479) |
| Net increase in net assets resulting from operations | $342,724 |
The accompanying Notes to Financial Statements are an integral part of this statement.
| 16 | Columbia Emerging Markets Fund | Annual Report 2019 |
Statement of Changes in Net Assets
| | Year Ended
August 31, 2019 | Year Ended
August 31, 2018 |
| Operations | | |
| Net investment income | $5,524,203 | $5,791,258 |
| Net realized gain (loss) | (15,013,235) | 48,614,991 |
| Net change in unrealized appreciation (depreciation) | 9,831,756 | (103,432,166) |
| Net increase (decrease) in net assets resulting from operations | 342,724 | (49,025,917) |
| Distributions to shareholders | | |
| Net investment income and net realized gains | | |
| Advisor Class | (24,274) | |
| Institutional Class | (200,983) | |
| Institutional 2 Class | (359,831) | |
| Institutional 3 Class | (2,014,299) | |
| Net investment income | | |
| Class A | | (428,669) |
| Advisor Class | | (246,201) |
| Institutional Class | | (663,215) |
| Institutional 2 Class | | (591,542) |
| Institutional 3 Class | | (3,566,018) |
| Class K | | (265) |
| Class T | | (273) |
| Total distributions to shareholders (Note 2) | (2,599,387) | (5,496,183) |
| Increase (decrease) in net assets from capital stock activity | (86,007,158) | 61,209,749 |
| Total increase (decrease) in net assets | (88,263,821) | 6,687,649 |
| Net assets at beginning of year | 1,365,080,331 | 1,358,392,682 |
| Net assets at end of year | $1,276,816,510 | $1,365,080,331 |
| Undistributed net investment income | $4,889,117 | $2,344,628 |
The accompanying Notes to Financial Statements are an integral part of this statement.
Columbia Emerging Markets Fund | Annual Report 2019
| 17 |
Statement of Changes in Net Assets (continued)
| | Year Ended | Year Ended |
| | August 31, 2019 | August 31, 2018 |
| | Shares | Dollars ($) | Shares | Dollars ($) |
| Capital stock activity |
| Class A | | | | |
| Subscriptions | 3,226,742 | 37,908,150 | 6,518,228 | 87,750,740 |
| Distributions reinvested | — | — | 30,980 | 414,207 |
| Redemptions | (5,414,706) | (63,444,477) | (5,276,371) | (70,201,930) |
| Net increase (decrease) | (2,187,964) | (25,536,327) | 1,272,837 | 17,963,017 |
| Advisor Class | | | | |
| Subscriptions | 876,086 | 10,474,656 | 5,182,839 | 69,700,665 |
| Distributions reinvested | 1,432 | 15,556 | 16,026 | 217,629 |
| Redemptions | (977,592) | (11,589,595) | (4,887,806) | (68,542,788) |
| Net increase (decrease) | (100,074) | (1,099,383) | 311,059 | 1,375,506 |
| Class C | | | | |
| Subscriptions | 279,757 | 3,043,581 | 798,806 | 10,227,940 |
| Redemptions | (911,098) | (9,990,004) | (919,710) | (11,349,229) |
| Net decrease | (631,341) | (6,946,423) | (120,904) | (1,121,289) |
| Institutional Class | | | | |
| Subscriptions | 7,907,090 | 92,844,941 | 7,368,950 | 100,703,261 |
| Distributions reinvested | 12,604 | 135,877 | 34,024 | 458,987 |
| Redemptions | (7,311,724) | (86,023,138) | (4,938,883) | (66,091,619) |
| Net increase | 607,970 | 6,957,680 | 2,464,091 | 35,070,629 |
| Institutional 2 Class | | | | |
| Subscriptions | 5,860,742 | 68,952,373 | 6,934,574 | 92,870,933 |
| Distributions reinvested | 33,128 | 359,106 | 42,452 | 576,068 |
| Redemptions | (5,409,492) | (63,203,448) | (4,022,170) | (55,890,014) |
| Net increase | 484,378 | 6,108,031 | 2,954,856 | 37,556,987 |
| Institutional 3 Class | | | | |
| Subscriptions | 7,975,489 | 94,409,262 | 7,735,597 | 107,784,636 |
| Distributions reinvested | 85,596 | 932,136 | 104,027 | 1,417,884 |
| Redemptions | (13,227,089) | (158,079,243) | (9,957,728) | (136,688,116) |
| Net decrease | (5,166,004) | (62,737,845) | (2,118,104) | (27,485,596) |
| Class K | | | | |
| Distributions reinvested | — | — | 20 | 256 |
| Redemptions | — | — | (7,495) | (107,872) |
| Net decrease | — | — | (7,475) | (107,616) |
| Class R | | | | |
| Subscriptions | 165,990 | 1,911,070 | 344,871 | 4,595,479 |
| Redemptions | (391,268) | (4,534,318) | (500,192) | (6,547,665) |
| Net decrease | (225,278) | (2,623,248) | (155,321) | (1,952,186) |
| Class T | | | | |
| Distributions reinvested | — | — | 21 | 269 |
| Redemptions | (12,005) | (129,643) | (6,816) | (89,972) |
| Net decrease | (12,005) | (129,643) | (6,795) | (89,703) |
| Total net increase (decrease) | (7,230,318) | (86,007,158) | 4,594,244 | 61,209,749 |
The accompanying Notes to Financial Statements are an integral part of this statement.
| 18 | Columbia Emerging Markets Fund | Annual Report 2019 |
[THIS PAGE INTENTIONALLY LEFT BLANK]
Columbia Emerging Markets Fund | Annual Report 2019
| 19 |
The following table is intended to help you understand the Fund’s financial performance. Certain information reflects financial results for a single share of a class held for the periods shown. Per share net investment income (loss) amounts are calculated based on average shares outstanding during the period. Total return assumes reinvestment of all dividends and distributions, if any. Total return does not reflect payment of sales charges, if any. Total return and portfolio turnover are not annualized for periods of less than one year. The portfolio turnover rate is calculated without regard to purchase and sales transactions of short-term instruments and certain derivatives, if any. If such transactions were included, the Fund’s portfolio turnover rate may be higher.
| | Net asset value,
beginning of
period | Net
investment
income
(loss) | Net
realized
and
unrealized
gain (loss) | Total from
investment
operations | Distributions
from net
investment
income | Total
distributions to
shareholders |
| Class A |
| Year Ended 8/31/2019 | $12.15 | 0.01 | (0.01) | 0.00(c) | — | — |
| Year Ended 8/31/2018 | $12.62 | 0.02 | (0.47) | (0.45) | (0.02) | (0.02) |
| Year Ended 8/31/2017 | $9.99 | 0.01 | 2.62 | 2.63 | — | — |
| Year Ended 8/31/2016 | $8.79 | (0.01) | 1.21 | 1.20 | — | — |
| Year Ended 8/31/2015 | $10.94 | (0.01) | (2.14) | (2.15) | (0.00)(c) | (0.00)(c) |
| Advisor Class |
| Year Ended 8/31/2019 | $12.38 | 0.04 | (0.02) | 0.02 | (0.01) | (0.01) |
| Year Ended 8/31/2018 | $12.84 | 0.02 | (0.43) | (0.41) | (0.05) | (0.05) |
| Year Ended 8/31/2017 | $10.14 | 0.07 | 2.63 | 2.70 | — | — |
| Year Ended 8/31/2016 | $8.90 | 0.01 | 1.23 | 1.24 | — | — |
| Year Ended 8/31/2015 | $11.08 | 0.09 | (2.24) | (2.15) | (0.03) | (0.03) |
| Class C |
| Year Ended 8/31/2019 | $11.45 | (0.08) | (0.01) | (0.09) | — | — |
| Year Ended 8/31/2018 | $11.96 | (0.08) | (0.43) | (0.51) | — | — |
| Year Ended 8/31/2017 | $9.54 | (0.06) | 2.48 | 2.42 | — | — |
| Year Ended 8/31/2016 | $8.45 | (0.08) | 1.17 | 1.09 | — | — |
| Year Ended 8/31/2015 | $10.60 | (0.08) | (2.07) | (2.15) | — | — |
| Institutional Class |
| Year Ended 8/31/2019 | $12.29 | 0.05 | (0.03) | 0.02 | (0.01) | (0.01) |
| Year Ended 8/31/2018 | $12.76 | 0.05 | (0.47) | (0.42) | (0.05) | (0.05) |
| Year Ended 8/31/2017 | $10.07 | 0.04 | 2.65 | 2.69 | — | — |
| Year Ended 8/31/2016 | $8.84 | 0.01 | 1.22 | 1.23 | — | — |
| Year Ended 8/31/2015 | $11.00 | 0.02 | (2.15) | (2.13) | (0.03) | (0.03) |
| Institutional 2 Class |
| Year Ended 8/31/2019 | $12.37 | 0.07 | (0.03) | 0.04 | (0.03) | (0.03) |
| Year Ended 8/31/2018 | $12.84 | 0.08 | (0.49) | (0.41) | (0.06) | (0.06) |
| Year Ended 8/31/2017 | $10.12 | 0.06 | 2.66 | 2.72 | — | — |
| Year Ended 8/31/2016 | $8.87 | 0.05 | 1.20 | 1.25 | — | — |
| Year Ended 8/31/2015 | $11.05 | 0.11 | (2.24) | (2.13) | (0.05) | (0.05) |
The accompanying Notes to Financial Statements are an integral part of this statement.
| 20 | Columbia Emerging Markets Fund | Annual Report 2019 |
Financial Highlights (continued)
| | Net
asset
value,
end of
period | Total
return | Total gross
expense
ratio to
average
net assets(a) | Total net
expense
ratio to
average
net assets(a),(b) | Net investment
income (loss)
ratio to
average
net assets | Portfolio
turnover | Net
assets,
end of
period
(000’s) |
| Class A |
| Year Ended 8/31/2019 | $12.15 | 0.00% | 1.58%(d) | 1.58%(d) | 0.12% | 38% | $249,512 |
| Year Ended 8/31/2018 | $12.15 | (3.58%) | 1.54% | 1.54%(e) | 0.12% | 39% | $276,209 |
| Year Ended 8/31/2017 | $12.62 | 26.33% | 1.65%(f) | 1.62%(e),(f) | 0.14% | 51% | $270,816 |
| Year Ended 8/31/2016 | $9.99 | 13.65% | 1.67%(f) | 1.67%(e),(f) | (0.16%) | 81% | $244,190 |
| Year Ended 8/31/2015 | $8.79 | (19.65%) | 1.62%(f) | 1.62%(e),(f) | (0.07%) | 76% | $238,932 |
| Advisor Class |
| Year Ended 8/31/2019 | $12.39 | 0.20% | 1.33%(d) | 1.33%(d) | 0.36% | 38% | $23,161 |
| Year Ended 8/31/2018 | $12.38 | (3.26%) | 1.29% | 1.29%(e) | 0.14% | 39% | $24,379 |
| Year Ended 8/31/2017 | $12.84 | 26.63% | 1.41%(f) | 1.37%(e),(f) | 0.68% | 51% | $21,298 |
| Year Ended 8/31/2016 | $10.14 | 13.93% | 1.42%(f) | 1.42%(e),(f) | 0.13% | 81% | $2,205 |
| Year Ended 8/31/2015 | $8.90 | (19.45%) | 1.39%(f) | 1.39%(e),(f) | 0.91% | 76% | $1,827 |
| Class C |
| Year Ended 8/31/2019 | $11.36 | (0.79%) | 2.33%(d) | 2.33%(d) | (0.69%) | 38% | $14,830 |
| Year Ended 8/31/2018 | $11.45 | (4.26%) | 2.29% | 2.29%(e) | (0.62%) | 39% | $22,177 |
| Year Ended 8/31/2017 | $11.96 | 25.37% | 2.40%(f) | 2.37%(e),(f) | (0.57%) | 51% | $24,616 |
| Year Ended 8/31/2016 | $9.54 | 12.90% | 2.42%(f) | 2.42%(e),(f) | (0.92%) | 81% | $19,419 |
| Year Ended 8/31/2015 | $8.45 | (20.28%) | 2.37%(f) | 2.37%(e),(f) | (0.83%) | 76% | $20,462 |
| Institutional Class |
| Year Ended 8/31/2019 | $12.30 | 0.20% | 1.33%(d) | 1.33%(d) | 0.41% | 38% | $210,844 |
| Year Ended 8/31/2018 | $12.29 | (3.35%) | 1.29% | 1.29%(e) | 0.40% | 39% | $203,193 |
| Year Ended 8/31/2017 | $12.76 | 26.71% | 1.40%(f) | 1.37%(e),(f) | 0.39% | 51% | $179,501 |
| Year Ended 8/31/2016 | $10.07 | 13.91% | 1.42%(f) | 1.42%(e),(f) | 0.07% | 81% | $647,011 |
| Year Ended 8/31/2015 | $8.84 | (19.41%) | 1.37%(f) | 1.37%(e),(f) | 0.18% | 76% | $760,839 |
| Institutional 2 Class |
| Year Ended 8/31/2019 | $12.38 | 0.36% | 1.18%(d) | 1.18%(d) | 0.55% | 38% | $161,554 |
| Year Ended 8/31/2018 | $12.37 | (3.22%) | 1.16% | 1.16% | 0.58% | 39% | $155,442 |
| Year Ended 8/31/2017 | $12.84 | 26.88% | 1.22%(f) | 1.22%(f) | 0.57% | 51% | $123,364 |
| Year Ended 8/31/2016 | $10.12 | 14.09% | 1.26%(f) | 1.26%(f) | 0.54% | 81% | $113,041 |
| Year Ended 8/31/2015 | $8.87 | (19.35%) | 1.21%(f) | 1.21%(f) | 1.08% | 76% | $17,559 |
The accompanying Notes to Financial Statements are an integral part of this statement.
Columbia Emerging Markets Fund | Annual Report 2019
| 21 |
Financial Highlights (continued)
| | Net asset value,
beginning of
period | Net
investment
income
(loss) | Net
realized
and
unrealized
gain (loss) | Total from
investment
operations | Distributions
from net
investment
income | Total
distributions to
shareholders |
| Institutional 3 Class |
| Year Ended 8/31/2019 | $12.43 | 0.07 | (0.02) | 0.05 | (0.04) | (0.04) |
| Year Ended 8/31/2018 | $12.90 | 0.07 | (0.47) | (0.40) | (0.07) | (0.07) |
| Year Ended 8/31/2017 | $10.17 | 0.10 | 2.63 | 2.73 | — | — |
| Year Ended 8/31/2016 | $8.90 | 0.05 | 1.22 | 1.27 | — | — |
| Year Ended 8/31/2015 | $11.09 | 0.05 | (2.19) | (2.14) | (0.05) | (0.05) |
| Class R |
| Year Ended 8/31/2019 | $11.99 | (0.02) | (0.01) | (0.03) | — | — |
| Year Ended 8/31/2018 | $12.47 | (0.02) | (0.46) | (0.48) | — | — |
| Year Ended 8/31/2017 | $9.89 | (0.01) | 2.59 | 2.58 | — | — |
| Year Ended 8/31/2016 | $8.72 | (0.03) | 1.20 | 1.17 | — | — |
| Year Ended 8/31/2015 | $10.89 | (0.03) | (2.14) | (2.17) | — | — |
| Notes to Financial Highlights |
| (a) | In addition to the fees and expenses that the Fund bears directly, the Fund indirectly bears a pro rata share of the fees and expenses of any other funds in which it invests. Such indirect expenses are not included in the Fund’s reported expense ratios. |
| (b) | Total net expenses include the impact of certain fee waivers/expense reimbursements made by the Investment Manager and certain of its affiliates, if applicable. |
| (c) | Rounds to zero. |
| (d) | Ratios include interfund lending expense which is less than 0.01%. |
| (e) | The benefits derived from expense reductions had an impact of less than 0.01%. |
| (f) | Ratios include line of credit interest expense which is less than 0.01%. |
The accompanying Notes to Financial Statements are an integral part of this statement.
| 22 | Columbia Emerging Markets Fund | Annual Report 2019 |
Financial Highlights (continued)
| | Net
asset
value,
end of
period | Total
return | Total gross
expense
ratio to
average
net assets(a) | Total net
expense
ratio to
average
net assets(a),(b) | Net investment
income (loss)
ratio to
average
net assets | Portfolio
turnover | Net
assets,
end of
period
(000’s) |
| Institutional 3 Class |
| Year Ended 8/31/2019 | $12.44 | 0.43% | 1.13%(d) | 1.13%(d) | 0.58% | 38% | $609,791 |
| Year Ended 8/31/2018 | $12.43 | (3.18%) | 1.10% | 1.10% | 0.54% | 39% | $673,688 |
| Year Ended 8/31/2017 | $12.90 | 26.84% | 1.19%(f) | 1.19%(f) | 0.86% | 51% | $726,291 |
| Year Ended 8/31/2016 | $10.17 | 14.27% | 1.20%(f) | 1.20%(f) | 0.58% | 81% | $22,104 |
| Year Ended 8/31/2015 | $8.90 | (19.34%) | 1.15%(f) | 1.15%(f) | 0.46% | 76% | $5,351 |
| Class R |
| Year Ended 8/31/2019 | $11.96 | (0.25%) | 1.83%(d) | 1.83%(d) | (0.16%) | 38% | $7,125 |
| Year Ended 8/31/2018 | $11.99 | (3.85%) | 1.79% | 1.79%(e) | (0.17%) | 39% | $9,847 |
| Year Ended 8/31/2017 | $12.47 | 26.09% | 1.90%(f) | 1.87%(e),(f) | (0.08%) | 51% | $12,175 |
| Year Ended 8/31/2016 | $9.89 | 13.42% | 1.92%(f) | 1.92%(e),(f) | (0.37%) | 81% | $9,683 |
| Year Ended 8/31/2015 | $8.72 | (19.93%) | 1.87%(f) | 1.87%(e),(f) | (0.30%) | 76% | $6,997 |
The accompanying Notes to Financial Statements are an integral part of this statement.
Columbia Emerging Markets Fund | Annual Report 2019
| 23 |
Notes to Financial Statements
August 31, 2019
Note 1. Organization
Columbia Emerging Markets Fund (the Fund), a series of Columbia Funds Series Trust I (the Trust), is a diversified fund. The Trust is registered under the Investment Company Act of 1940, as amended (the 1940 Act), as an open-end management investment company organized as a Massachusetts business trust.
Fund shares
The Trust may issue an unlimited number of shares (without par value). The Fund offers each of the share classes listed in the Statement of Assets and Liabilities. Although all share classes generally have identical voting, dividend and liquidation rights, each share class votes separately when required by the Trust’s organizational documents or by law. Each share class has its own expense and sales charge structure. Different share classes may have different minimum initial investment amounts and pay different distribution amounts to the extent the expenses of distributing such share classes vary. Distributions to shareholders in a liquidation will be proportional to the net asset value of each share class.
As described in the Fund’s prospectus, Class A and Class C shares are offered to the general public for investment. Advisor Class, Institutional Class, Institutional 2 Class, Institutional 3 Class and Class R shares are available for purchase through authorized investment professionals to omnibus retirement plans or to institutional and to certain other investors as also described in the Fund’s prospectus. Class C shares automatically convert to Class A shares after 10 years. Effective December 14, 2018, Class T shares merged, in a tax-free transaction, into Class A shares of the Fund and are no longer offered for sale.
Note 2. Summary of significant accounting policies
Basis of preparation
The Fund is an investment company that applies the accounting and reporting guidance in the Financial Accounting Standards Board (FASB) Accounting Standards Codification Topic 946,Financial Services - Investment Companies (ASC 946). The financial statements are prepared in accordance with U.S. generally accepted accounting principles (GAAP), which requires management to make certain estimates and assumptions that affect the reported amounts of assets and liabilities, the disclosure of contingent assets and liabilities at the date of the financial statements and the reported amounts of income and expenses during the reporting period. Actual results could differ from those estimates.
The following is a summary of significant accounting policies followed by the Fund in the preparation of its financial statements.
Security valuation
All equity securities are valued at the close of business of the New York Stock Exchange. Equity securities are valued at the official closing price on the principal exchange or market on which they trade. Unlisted securities or listed securities for which there were no sales during the day are valued at the mean of the latest quoted bid and ask prices on such exchanges or markets.
Foreign equity securities are valued based on the closing price on the foreign exchange in which such securities are primarily traded. If any foreign equity security closing prices are not readily available, the securities are valued at the mean of the latest quoted bid and ask prices on such exchanges or markets. Foreign currency exchange rates are determined at the scheduled closing time of the New York Stock Exchange. Many securities markets and exchanges outside the U.S. close prior to the close of the New York Stock Exchange; therefore, the closing prices for securities in such markets or on such exchanges may not fully reflect events that occur after such close but before the close of the New York Stock Exchange. In those situations, foreign securities will be fair valued pursuant to a policy adopted by the Board of Trustees. Under the policy, the Fund may utilize a third party pricing service to determine these fair values. The third-party pricing service takes into account multiple factors, including, but not limited to, movements in the U.S. securities markets, certain depositary receipts, futures contracts and foreign exchange rates that have occurred subsequent to the close of the foreign exchange or market, to determine a good faith estimate that reasonably reflects the current market conditions as of the close of the New York Stock Exchange. The fair value of a security is likely to be different from the quoted or published price, if available.
Investments in open-end investment companies, including money market funds, are valued at their latest net asset value.
| 24 | Columbia Emerging Markets Fund | Annual Report 2019 |
Notes to Financial Statements (continued)
August 31, 2019
Investments for which market quotations are not readily available, or that have quotations which management believes are not reflective of market value or reliable, are valued at fair value as determined in good faith under procedures approved by and under the general supervision of the Board of Trustees. If a security or class of securities (such as foreign securities) is valued at fair value, such value is likely to be different from the quoted or published price for the security.
The determination of fair value often requires significant judgment. To determine fair value, management may use assumptions including but not limited to future cash flows and estimated risk premiums. Multiple inputs from various sources may be used to determine fair value.
GAAP requires disclosure regarding the inputs and valuation techniques used to measure fair value and any changes in valuation inputs or techniques. In addition, investments shall be disclosed by major category. This information is disclosed following the Fund’s Portfolio of Investments.
Foreign currency transactions and translations
The values of all assets and liabilities denominated in foreign currencies are generally translated into U.S. dollars at exchange rates determined at the close of regular trading on the New York Stock Exchange. Net realized and unrealized gains (losses) on foreign currency transactions and translations include gains (losses) arising from the fluctuation in exchange rates between trade and settlement dates on securities transactions, gains (losses) arising from the disposition of foreign currency and currency gains (losses) between the accrual and payment dates on dividends, interest income and foreign withholding taxes.
For financial statement purposes, the Fund does not distinguish that portion of gains (losses) on investments which is due to changes in foreign exchange rates from that which is due to changes in market prices of the investments. Such fluctuations are included with the net realized and unrealized gains (losses) on investments in the Statement of Operations.
Security transactions
Security transactions are accounted for on the trade date. Cost is determined and gains (losses) are based upon the specific identification method for both financial statement and federal income tax purposes.
Income recognition
Corporate actions and dividend income are generally recorded net of any non-reclaimable tax withholdings, on the ex-dividend date or upon receipt of ex-dividend notification in the case of certain foreign securities.
The Fund may receive distributions from holdings in equity securities, business development companies (BDCs), exchange-traded funds (ETFs), limited partnerships (LPs), other regulated investment companies (RICs), and real estate investment trusts (REITs), which report information on the tax character of their distributions annually. These distributions are allocated to dividend income, capital gain and return of capital based on actual information reported. Return of capital is recorded as a reduction of the cost basis of securities held. If the Fund no longer owns the applicable securities, return of capital is recorded as a realized gain. With respect to REITs, to the extent actual information has not yet been reported, estimates for return of capital are made by the Fund’s management. Management’s estimates are subsequently adjusted when the actual character of the distributions is disclosed by the REITs, which could result in a proportionate change in return of capital to shareholders.
Awards from class action litigation are recorded as a reduction of cost basis if the Fund still owns the applicable securities on the payment date. If the Fund no longer owns the applicable securities, the proceeds are recorded as realized gains.
Expenses
General expenses of the Trust are allocated to the Fund and other funds of the Trust based upon relative net assets or other expense allocation methodologies determined by the nature of the expense. Expenses directly attributable to the Fund are charged to the Fund. Expenses directly attributable to a specific class of shares are charged to that share class.
Columbia Emerging Markets Fund | Annual Report 2019
| 25 |
Notes to Financial Statements (continued)
August 31, 2019
Determination of class net asset value
All income, expenses (other than class-specific expenses, which are charged to that share class, as shown in the Statement of Operations) and realized and unrealized gains (losses) are allocated to each class of the Fund on a daily basis, based on the relative net assets of each class, for purposes of determining the net asset value of each class.
Federal income tax status
The Fund intends to qualify each year as a regulated investment company under Subchapter M of the Internal Revenue Code, as amended, and will distribute substantially all of its investment company taxable income and net capital gain, if any, for its tax year, and as such will not be subject to federal income taxes. In addition, the Fund intends to distribute in each calendar year substantially all of its ordinary income, capital gain net income and certain other amounts, if any, such that the Fund should not be subject to federal excise tax. Therefore, no federal income or excise tax provision is recorded.
Foreign taxes
The Fund may be subject to foreign taxes on income, gains on investments or currency repatriation, a portion of which may be recoverable. The Fund will accrue such taxes and recoveries, as applicable, based upon its current interpretation of tax rules and regulations that exist in the markets in which it invests.
Realized gains in certain countries may be subject to foreign taxes at the Fund level, based on statutory rates. The Fund accrues for such foreign taxes on realized and unrealized gains at the appropriate rate for each jurisdiction, as applicable. The amount, if any, is disclosed as a liability on the Statement of Assets and Liabilities.
Distributions to shareholders
Distributions from net investment income, if any, are declared and paid annually. Net realized capital gains, if any, are distributed at least annually. Income distributions and capital gain distributions are determined in accordance with federal income tax regulations, which may differ from GAAP.
Guarantees and indemnifications
Under the Trust’s organizational documents and, in some cases, by contract, its officers and trustees are indemnified against certain liabilities arising out of the performance of their duties to the Trust or its funds. In addition, certain of the Fund’s contracts with its service providers contain general indemnification clauses. The Fund’s maximum exposure under these arrangements is unknown since the amount of any future claims that may be made against the Fund cannot be determined, and the Fund has no historical basis for predicting the likelihood of any such claims.
Recent accounting pronouncements
Accounting Standards Update 2017-08 Premium Amortization on Purchased Callable Debt Securities
In March 2017, the Financial Accounting Standards Board issued Accounting Standards Update (ASU) No. 2017-08 Premium Amortization on Purchased Callable Debt Securities. ASU No. 2017-08 updates the accounting standards to shorten the amortization period for certain purchased callable debt securities, held at a premium, to be amortized to the earliest call date. The update applies to securities with explicit, noncontingent call features that are callable at fixed prices and on preset dates. The standard is effective for annual periods beginning after December 15, 2018 and interim periods within those fiscal years. Management does not expect the implementation of this guidance to have a material impact on the financial statement amounts and footnote disclosures.
Accounting Standards Update 2018-13 Disclosure Framework - Changes to the Disclosure Requirements for Fair Value Measurement
In August 2018, the Financial Accounting Standards Board issued Accounting Standards Update (ASU) No. 2018-13 Disclosure Framework - Changes to the Disclosure Requirements for Fair Value Measurement. The standard is effective for annual periods beginning after December 15, 2019 and interim periods within those fiscal years, with early adoption permitted. After evaluation, management determined to adopt the ASU effective for the period ended August 31, 2019 and all subsequent periods. As a result of the amendments, management implemented disclosure changes which include removal
| 26 | Columbia Emerging Markets Fund | Annual Report 2019 |
Notes to Financial Statements (continued)
August 31, 2019
of the amount and reasons for transfers between Level 1 and Level 2 of the fair value hierarchy, removal of the policy for the timing of transfers between levels, removal of the description of the Level 3 valuation processes, as well as modifications to the measurement uncertainty disclosure.
Disclosure Update and Simplification
In September 2018, the Securities and Exchange Commission (SEC) released Final Rule 33-10532, Disclosure Update and Simplification, which amends certain financial statement disclosure requirements that the SEC determined to be redundant, outdated, or superseded in light of other SEC disclosure requirements, GAAP, or changes in the information environment. As a result of the amendments, management implemented disclosure changes which included removing the components of distributable earnings presented on the Statement of Assets and Liabilities and combining income and gain distributions paid to shareholders as presented on the Statement of Changes in Net Assets. Any values presented to meet prior year requirements were left unchanged. The amendments had no effect on the Fund’s net assets or results of operation.
Note 3. Fees and other transactions with affiliates
Management services fees
The Fund has entered into a Management Agreement with Columbia Management Investment Advisers, LLC (the Investment Manager), a wholly-owned subsidiary of Ameriprise Financial, Inc. (Ameriprise Financial). Under the Management Agreement, the Investment Manager provides the Fund with investment research and advice, as well as administrative and accounting services. The management services fee is an annual fee that is equal to a percentage of the Fund’s daily net assets that declines from 1.10% to 0.70% as the Fund’s net assets increase. The effective management services fee rate for the year ended August 31, 2019 was 1.03% of the Fund’s average daily net assets.
Compensation of board members
Members of the Board of Trustees who are not officers or employees of the Investment Manager or Ameriprise Financial are compensated for their services to the Fund as disclosed in the Statement of Operations. These members of the Board of Trustees may participate in a Deferred Compensation Plan (the Deferred Plan) which may be terminated at any time. Obligations of the Deferred Plan will be paid solely out of the Fund’s assets, and all amounts payable under the Deferred Plan constitute a general unsecured obligation of the Fund.
Compensation of Chief Compliance Officer
The Board of Trustees has appointed a Chief Compliance Officer to the Fund in accordance with federal securities regulations. As disclosed in the Statement of Operations, a portion of the Chief Compliance Officer’s total compensation is allocated to the Fund, along with other allocations to affiliated registered investment companies managed by the Investment Manager and its affiliates, based on relative net assets.
Transfer agency fees
Under a Transfer and Dividend Disbursing Agent Agreement, Columbia Management Investment Services Corp. (the Transfer Agent), an affiliate of the Investment Manager and a wholly-owned subsidiary of Ameriprise Financial, is responsible for providing transfer agency services to the Fund. The Transfer Agent has contracted with DST Asset Manager Solutions, Inc. (DST) to serve as sub-transfer agent. The Transfer Agent pays the fees of DST for services as sub-transfer agent and DST is not entitled to reimbursement for such fees from the Fund (with the exception of out-of-pocket fees).
The Fund pays the Transfer Agent a monthly transfer agency fee based on the number or the average value of accounts, depending on the type of account. In addition, the Fund pays the Transfer Agent a fee for shareholder services based on the number of accounts or on a percentage of the average aggregate value of the Fund’s shares maintained in omnibus accounts up to the lesser of the amount charged by the financial intermediary or a cap established by the Board of Trustees from time to time.
Columbia Emerging Markets Fund | Annual Report 2019
| 27 |
Notes to Financial Statements (continued)
August 31, 2019
The Transfer Agent also receives compensation from the Fund for various shareholder services and reimbursements for certain out-of-pocket fees. Total transfer agency fees for Institutional 2 Class and Institutional 3 Class shares are subject to an annual limitation of not more than 0.07% and 0.02%, respectively, of the average daily net assets attributable to each share class.
For the year ended August 31, 2019, the Fund’s effective transfer agency fee rates as a percentage of average daily net assets of each class were as follows:
| | Effective rate (%) |
| Class A | 0.21 |
| Advisor Class | 0.21 |
| Class C | 0.21 |
| Institutional Class | 0.21 |
| Institutional 2 Class | 0.06 |
| Institutional 3 Class | 0.01 |
| Class R | 0.21 |
| Class T | 0.06(a) |
An annual minimum account balance fee of $20 may apply to certain accounts with a value below the applicable share class’s initial minimum investment requirements to reduce the impact of small accounts on transfer agency fees. These minimum account balance fees are remitted to the Fund and recorded as part of expense reductions in the Statement of Operations. For the year ended August 31, 2019, no minimum account balance fees were charged by the Fund.
Distribution and service fees
The Fund has entered into an agreement with Columbia Management Investment Distributors, Inc. (the Distributor), an affiliate of the Investment Manager and a wholly-owned subsidiary of Ameriprise Financial, for distribution and shareholder services. The Board of Trustees has approved, and the Fund has adopted, distribution and shareholder service plans (the Plans) applicable to certain share classes, which set the distribution and service fees for the Fund. These fees are calculated daily and are intended to compensate the Distributor and/or eligible selling and/or servicing agents for selling shares of the Fund and providing services to investors.
Under the Plans, the Fund pays a monthly service fee to the Distributor at the maximum annual rate of 0.25% of the average daily net assets attributable to Class A, Class C and Class T shares of the Fund. Also under the Plans, the Fund pays a monthly distribution fee to the Distributor at the maximum annual rates of 0.75%, 0.50% and 0.25% of the average daily net assets attributable to Class C, Class R and Class T shares of the Fund, respectively. As a result of all Class T shares of the Fund being redeemed or converted to Class A shares, December 14, 2018 was the last day the Fund paid a distribution and shareholder services fee for Class T shares.
Although the Fund may have paid a distribution fee up to 0.25% of the Fund’s average daily net assets attributable to Class T shares and a service fee of up to 0.25% of the Fund’s average daily net assets attributable to Class T shares, the aggregate fee shall not exceed 0.25% of the Fund’s average daily net assets attributable to Class T shares.
Sales charges (unaudited)
Sales charges, including front-end charges and contingent deferred sales charges (CDSC), received by the Distributor for distributing Fund shares for the year ended August 31, 2019, if any, are listed below:
| | Front End (%) | CDSC (%) | Amount ($) |
| Class A | 5.75 | 0.50 - 1.00(a) | 219,981 |
| Class C | — | 1.00(b) | 4,058 |
| Class T | 2.50 | — | — |
| (a) | This charge is imposed on certain investments of between $1 million and $50 million redeemed within 18 months after purchase, as follows: 1.00% if redeemed within 12 months after purchase, and 0.50% if redeemed more than 12, but less than 18, months after purchase, with certain limited exceptions. |
| (b) | This charge applies to redemptions within 12 months after purchase, with certain limited exceptions. |
| 28 | Columbia Emerging Markets Fund | Annual Report 2019 |
Notes to Financial Statements (continued)
August 31, 2019
The Fund’s other share classes are not subject to sales charges.
Expenses waived/reimbursed by the Investment Manager and its affiliates
The Investment Manager and certain of its affiliates have contractually agreed to waive fees and/or reimburse expenses (excluding certain fees and expenses described below) for the period(s) disclosed below, unless sooner terminated at the sole discretion of the Board of Trustees, so that the Fund’s net operating expenses, after giving effect to fees waived/expenses reimbursed and any balance credits and/or overdraft charges from the Fund’s custodian, do not exceed the following annual rate(s) as a percentage of the class’ average daily net assets:
| | January 1, 2019
through
December 31, 2019 | Prior to
January 1, 2019 |
| Class A | 1.65% | 1.65% |
| Advisor Class | 1.40 | 1.40 |
| Class C | 2.40 | 2.40 |
| Institutional Class | 1.40 | 1.40 |
| Institutional 2 Class | 1.26 | 1.27 |
| Institutional 3 Class | 1.21 | 1.22 |
| Class R | 1.90 | 1.90 |
Under the agreement governing these fee waivers and/or expense reimbursement arrangements, the following fees and expenses are excluded from the waiver/reimbursement commitment, and therefore will be paid by the Fund, if applicable: taxes (including foreign transaction taxes), expenses associated with investments in affiliated and non-affiliated pooled investment vehicles (including mutual funds and exchange-traded funds), transaction costs and brokerage commissions, costs related to any securities lending program, dividend expenses associated with securities sold short, inverse floater program fees and expenses, transaction charges and interest on borrowed money, interest, infrequent and/or unusual expenses and any other expenses the exclusion of which is specifically approved by the Board of Trustees. This agreement may be modified or amended only with approval from the Investment Manager, certain of its affiliates and the Fund. Any fees waived and/or expenses reimbursed under the expense reimbursement arrangements described above are not recoverable by the Investment Manager or its affiliates in future periods.
Note 4. Federal tax information
The timing and character of income and capital gain distributions are determined in accordance with income tax regulations, which may differ from GAAP because of temporary or permanent book to tax differences.
At August 31, 2019, these differences were primarily due to differing treatment for deferral/reversal of wash sale losses, trustees’ deferred compensation, capital loss carryforward, foreign capital gains tax and foreign currency transactions. To the extent these differences were permanent, reclassifications were made among the components of the Fund’s net assets. Temporary differences do not require reclassifications.
The following reclassifications were made:
Undistributed net
investment
income ($) | Accumulated
net realized
(loss) ($) | Paid in
capital ($) |
| (380,327) | 380,327 | — |
Net investment income (loss) and net realized gains (losses), as disclosed in the Statement of Operations, and net assets were not affected by this reclassification.
Columbia Emerging Markets Fund | Annual Report 2019
| 29 |
Notes to Financial Statements (continued)
August 31, 2019
The tax character of distributions paid during the years indicated was as follows:
| Year Ended August 31, 2019 | Year Ended August 31, 2018 |
Ordinary
income ($) | Long-term
capital gains ($) | Total ($) | Ordinary
income ($) | Long-term
capital gains ($) | Total ($) |
| 2,599,387 | — | 2,599,387 | 5,496,183 | — | 5,496,183 |
Short-term capital gain distributions, if any, are considered ordinary income distributions for tax purposes.
At August 31, 2019, the components of distributable earnings on a tax basis were as follows:
Undistributed
ordinary income ($) | Undistributed
long-term
capital gains ($) | Capital loss
carryforwards ($) | Net unrealized
appreciation ($) |
| 4,987,217 | — | (40,549,041) | 374,505,153 |
At August 31, 2019, the cost of all investments for federal income tax purposes along with the aggregate gross unrealized appreciation and depreciation based on that cost was:
Federal
tax cost ($) | Gross unrealized
appreciation ($) | Gross unrealized
(depreciation) ($) | Net unrealized
appreciation ($) |
| 902,466,845 | 415,753,530 | (41,248,377) | 374,505,153 |
Tax cost of investments and unrealized appreciation/(depreciation) may also include timing differences that do not constitute adjustments to tax basis.
The following capital loss carryforwards, determined at August 31, 2019, may be available to reduce taxable income arising from future net realized gains on investments, if any, to the extent permitted by the Internal Revenue Code. Capital loss carryforwards with no expiration are required to be utilized prior to any capital losses which carry an expiration date. As a result of this ordering rule, capital loss carryforwards which carry an expiration date may be more likely to expire unused. In addition, for the year ended August 31, 2019, capital loss carryforwards utilized and expired unused, if any, were as follows:
No expiration
short-term ($) | No expiration
long-term ($) | Total ($) | Utilized ($) | Expired ($) |
| (40,549,041) | — | (40,549,041) | — | — |
Management of the Fund has concluded that there are no significant uncertain tax positions in the Fund that would require recognition in the financial statements. However, management’s conclusion may be subject to review and adjustment at a later date based on factors including, but not limited to, new tax laws, regulations, and administrative interpretations (including relevant court decisions). Generally, the Fund’s federal tax returns for the prior three fiscal years remain subject to examination by the Internal Revenue Service.
Note 5. Portfolio information
The cost of purchases and proceeds from sales of securities, excluding short-term investments and derivatives, if any, aggregated to $481,815,012 and $550,102,126, respectively, for the year ended August 31, 2019. The amount of purchase and sale activity impacts the portfolio turnover rate reported in the Financial Highlights.
Note 6. Affiliated money market fund
The Fund invests in Columbia Short-Term Cash Fund, an affiliated money market fund established for the exclusive use by the Fund and other affiliated funds (the Affiliated MMF). The income earned by the Fund from such investments is included as Dividends - affiliated issuers in the Statement of Operations. As an investing fund, the Fund indirectly bears its proportionate share of the expenses of the Affiliated MMF. The Affiliated MMF prices its shares with a floating net asset value. In addition, the Board of Trustees of the Affiliated MMF may impose a fee on redemptions (sometimes referred to as a liquidity fee) or temporarily suspend redemptions (sometimes referred to as imposing a redemption gate) in the event its liquidity falls below regulatory limits.
| 30 | Columbia Emerging Markets Fund | Annual Report 2019 |
Notes to Financial Statements (continued)
August 31, 2019
Note 7. Interfund lending
Pursuant to an exemptive order granted by the Securities and Exchange Commission, the Fund participates in a program (the Interfund Program) allowing each participating Columbia Fund (each, a Participating Fund) to lend money directly to and, except for closed-end funds and money market funds, borrow money directly from other Participating Funds for temporary purposes. The amounts eligible for borrowing and lending under the Interfund Program are subject to certain restrictions.
Interfund loans are subject to the risk that the borrowing fund could be unable to repay the loan when due, and a delay in repayment to the lending fund could result in lost opportunities and/or additional lending costs. The exemptive order is subject to conditions intended to mitigate conflicts of interest arising from the Investment Manager’s relationship with each Participating Fund.
The Fund’s activity in the Interfund Program during the year ended August 31, 2019 was as follows:
| Borrower or lender | Average loan
balance ($) | Weighted average
interest rate (%) | Days
outstanding |
| Borrower | 850,000 | 2.82 | 4 |
| Lender | 550,000 | 2.92 | 6 |
Interest income earned and interest expense incurred by the Fund is recorded as Interfund lending in the Statement of Operations. The Fund had no outstanding interfund loans at August 31, 2019.
Note 8. Line of credit
The Fund has access to a revolving credit facility with a syndicate of banks led by Citibank, N.A., HSBC Bank USA, N.A. and JPMorgan Chase Bank, N.A. whereby the Fund may borrow for the temporary funding of shareholder redemptions or for other temporary or emergency purposes. The credit facility, which is a collective agreement between the Fund and certain other funds managed by the Investment Manager or an affiliated investment manager, severally and not jointly, permits collective borrowings up to $1 billion. Interest is charged to each participating fund based on its borrowings at a rate equal to the higher of (i) the federal funds effective rate, (ii) the one-month LIBOR rate and (iii) the overnight bank funding rate, plus in each case, 1.00%. Each borrowing under the credit facility matures no later than 60 days after the date of borrowing. The Fund also pays a commitment fee equal to its pro rata share of the unused amount of the credit facility at a rate of 0.15% per annum. The commitment fee is included in other expenses in the Statement of Operations. This agreement expires annually in December unless extended or renewed.
The Fund had no borrowings during the year ended August 31, 2019.
Note 9. Significant risks
Consumer discretionary sector risk
The Fund may be more susceptible to the particular risks that may affect companies in the consumer discretionary sector than if it were invested in a wider variety of companies in unrelated sectors. Companies in the consumer discretionary sector are subject to certain risks, including fluctuations in the performance of the overall domestic and international economy, interest rate changes, increased competition and consumer confidence. Performance of such companies may be affected by factors including reduced disposable household income, reduced consumer spending, changing demographics and consumer tastes.
Financial sector risk
The Fund may be more susceptible to the particular risks that may affect companies in the financial services sector than if it were invested in a wider variety of companies in unrelated sectors. Companies in the financial services sector are subject to certain risks, including the risk of regulatory change, decreased liquidity in credit markets and unstable interest rates. Such companies may have concentrated portfolios, such as a high level of loans to real estate developers, which makes them vulnerable to economic conditions that affect that industry. Performance of such companies may be affected by competitive pressures and exposure to investments or agreements that, under certain circumstances, may lead to losses (e.g., subprime
Columbia Emerging Markets Fund | Annual Report 2019
| 31 |
Notes to Financial Statements (continued)
August 31, 2019
loans). Companies in the financial services sector are subject to extensive governmental regulation that may limit the amount and types of loans and other financial commitments they can make, and interest rates and fees that they may charge. In addition, profitability of such companies is largely dependent upon the availability and the cost of capital.
Foreign securities and emerging market countries risk
Investing in foreign securities may involve certain risks not typically associated with investing in U.S. securities, such as increased currency volatility and risks associated with political, regulatory, economic, social, diplomatic and other conditions or events occurring in the country or region, which may result in significant market volatility. In addition, certain foreign securities may not be as liquid as U.S. securities. Investing in emerging markets may increase these risks and expose the Fund to elevated risks associated with increased inflation, deflation or currency devaluation. To the extent that the Fund concentrates its investment exposure to any one or a few specific countries, the Fund will be particularly susceptible to the risks associated with the conditions, events or other factors impacting those countries or regions and may, therefore, have a greater risk than that of a fund that is more geographically diversified.
Shareholder concentration risk
At August 31, 2019, two unaffiliated shareholders of record owned 38.0% of the outstanding shares of the Fund in one or more accounts. The Fund has no knowledge about whether any portion of those shares was owned beneficially. Affiliated shareholders of record owned 34.8% of the outstanding shares of the Fund in one or more accounts. Subscription and redemption activity by concentrated accounts may have a significant effect on the operations of the Fund. In the case of a large redemption, the Fund may be forced to sell investments at inopportune times, including its liquid positions, which may result in Fund losses and the Fund holding a higher percentage of less liquid positions. Large redemptions could result in decreased economies of scale and increased operating expenses for non-redeeming Fund shareholders.
Note 10. Subsequent events
Management has evaluated the events and transactions that have occurred through the date the financial statements were issued and noted no items requiring adjustment of the financial statements or additional disclosure.
Note 11. Information regarding pending and settled legal proceedings
Ameriprise Financial and certain of its affiliates have historically been involved in a number of legal, arbitration and regulatory proceedings, including routine litigation, class actions, and governmental actions, concerning matters arising in connection with the conduct of their business activities. Ameriprise Financial believes that the Fund is not currently the subject of, and that neither Ameriprise Financial nor any of its affiliates are the subject of, any pending legal, arbitration or regulatory proceedings that are likely to have a material adverse effect on the Fund or the ability of Ameriprise Financial or its affiliates to perform under their contracts with the Fund. Ameriprise Financial is required to make quarterly (10-Q), annual (10-K) and, as necessary, 8-K filings with the Securities and Exchange Commission (SEC) on legal and regulatory matters that relate to Ameriprise Financial and its affiliates. Copies of these filings may be obtained by accessing the SEC website at www.sec.gov.
There can be no assurance that these matters, or the adverse publicity associated with them, will not result in increased Fund redemptions, reduced sale of Fund shares or other adverse consequences to the Fund. Further, although we believe proceedings are not likely to have a material adverse effect on the Fund or the ability of Ameriprise Financial or its affiliates to perform under their contracts with the Fund, these proceedings are subject to uncertainties and, as such, we are unable to estimate the possible loss or range of loss that may result. An adverse outcome in one or more of these proceedings could result in adverse judgments, settlements, fines, penalties or other relief that could have a material adverse effect on the consolidated financial condition or results of operations of Ameriprise Financial.
| 32 | Columbia Emerging Markets Fund | Annual Report 2019 |
Report of Independent Registered Public Accounting Firm
To the Board of Trustees of Columbia Funds Series Trust I and Shareholders of Columbia Emerging Markets Fund
Opinion on the Financial Statements
We have audited the accompanying statement of assets and liabilities, including the portfolio of investments, of Columbia Emerging Markets Fund (one of the funds constituting Columbia Funds Series Trust I, hereafter referred to as the “Fund”) as of August 31, 2019, the related statement of operations for the year ended August 31, 2019, the statement of changes in net assets for each of the two years in the period ended August 31, 2019, including the related notes, and the financial highlights for each of the five years in the period ended August 31, 2019, (collectively referred to as the “financial statements”). In our opinion, the financial statements present fairly, in all material respects, the financial position of the Fund as of August 31, 2019, the results of its operations for the year then ended, the changes in its net assets for each of the two years in the period ended August 31, 2019 and the financial highlights for each of the five years in the period ended August 31, 2019 in conformity with accounting principles generally accepted in the United States of America.
Basis for Opinion
These financial statements are the responsibility of the Fund’s management. Our responsibility is to express an opinion on the Fund’s financial statements based on our audits. We are a public accounting firm registered with the Public Company Accounting Oversight Board (United States) (PCAOB) and are required to be independent with respect to the Fund in accordance with the U.S. federal securities laws and the applicable rules and regulations of the Securities and Exchange Commission and the PCAOB.
We conducted our audits of these financial statements in accordance with the standards of the PCAOB. Those standards require that we plan and perform the audit to obtain reasonable assurance about whether the financial statements are free of material misstatement, whether due to error or fraud.
Our audits included performing procedures to assess the risks of material misstatement of the financial statements, whether due to error or fraud, and performing procedures that respond to those risks. Such procedures included examining, on a test basis, evidence regarding the amounts and disclosures in the financial statements. Our audits also included evaluating the accounting principles used and significant estimates made by management, as well as evaluating the overall presentation of the financial statements. Our procedures included confirmation of securities owned as of August 31, 2019, by correspondence with the custodian, transfer agent and brokers; when replies were not received from brokers, we performed other audit procedures. We believe that our audits provide a reasonable basis for our opinion.
/s/PricewaterhouseCoopers LLP
Minneapolis, Minnesota
October 24, 2019
We have served as the auditor of one or more investment companies within the Columbia Funds Complex since 1977.
Columbia Emerging Markets Fund | Annual Report 2019
| 33 |
Federal Income Tax Information
(Unaudited)
The Fund hereby designates the following tax attributes for the fiscal year ended August 31, 2019. Shareholders will be notified in early 2020 of the amounts for use in preparing 2019 income tax returns.
Qualified
dividend
income | Dividends
received
deduction | Foreign
taxes paid
to foreign
countries | Foreign
taxes paid
per share
to foreign
countries | Foreign
source
income | Foreign
source
income per
share |
| 100.00% | 0.22% | $2,358,059 | $0.02 | $23,501,645 | $0.23 |
Qualified dividend income. For taxable, non-corporate shareholders, the percentage of ordinary income distributed during the fiscal year that represents qualified dividend income subject to reduced tax rates.
Dividends received deduction. The percentage of ordinary income distributed during the fiscal year that qualifies for the corporate dividends received deduction.
Foreign taxes. The Fund makes the election to pass through to shareholders the foreign taxes paid. Eligible shareholders may claim a foreign tax credit. These taxes, and the corresponding foreign source income, are provided.
TRUSTEES AND OFFICERS
The Board oversees the Fund’s operations and appoints officers who are responsible for day-to-day business decisions based on policies set by the Board. The following table provides basic biographical information about the Fund’s Trustees as of the printing of this report, including their principal occupations during the past five years, although specific titles for individuals may have varied over the period. The year set forth beneath Length of Service in the table below is the year in which the Trustee was first appointed or elected as Trustee to any Fund currently in the Columbia Funds Complex or a predecessor thereof. Under current Board policy, members serve terms of indefinite duration.
Independent trustees
| Name, address, year of birth | Position held with the Trust and length of service | Principal occupation(s) during the past five years and other relevant professional experience | Number of Funds in the Columbia Fund Complex overseen | Other directorships held by Trustee during the past five years |
Janet Langford Carrig
c/o Columbia Management
Investment Advisers, LLC
225 Franklin Street
Mail Drop BX32 05228
Boston, MA 02110
1957 | Trustee
1996 | Senior Vice President, General Counsel and Corporate Secretary, ConocoPhillips (independent energy company), September 2007-October 2018 | 70 | None |
Douglas A. Hacker
c/o Columbia Management
Investment Advisers, LLC
225 Franklin Street
Mail Drop BX32 05228
Boston, MA 02110
1955 | Trustee and Chairman of the Board
1996 | Independent business executive since May 2006; Executive Vice President — Strategy of United Airlines, December 2002-May 2006; President of UAL Loyalty Services (airline marketing company), September 2001-December 2002; Executive Vice President and Chief Financial Officer of United Airlines, July 1999-September 2001 | 70 | Spartan Nash Company, (food distributor); former Director, Nash Finch Company (food distributor), 2005-2013; Aircastle Limited (aircraft leasing); former Director, SeaCube Container Leasing Ltd. (container leasing), 2010-2013; and Travelport Worldwide Limited (travel information technology) |
| 34 | Columbia Emerging Markets Fund | Annual Report 2019 |
TRUSTEES AND OFFICERS (continued)
Independent trustees (continued)
| Name, address, year of birth | Position held with the Trust and length of service | Principal occupation(s) during the past five years and other relevant professional experience | Number of Funds in the Columbia Fund Complex overseen | Other directorships held by Trustee during the past five years |
Nancy T. Lukitsh
c/o Columbia Management
Investment Advisers, LLC
225 Franklin Street
Mail Drop BX32 05228
Boston, MA 02110
1956 | Trustee
2011 | Senior Vice President, Partner and Director of Marketing, Wellington Management Company, LLP (investment adviser), 1997-2010; Chair, Wellington Management Portfolios (commingled non-U.S. investment pools), 2007-2010; Director, Wellington Trust Company, NA and other Wellington affiliates, 1997-2010 | 70 | None |
David M. Moffett
c/o Columbia Management
Investment Advisers, LLC
225 Franklin Street
Mail Drop BX32 05228
Boston, MA 02110
1952 | Trustee
2011 | Retired. Consultant to Bridgewater and Associates | 70 | Director, CSX Corporation (transportation suppliers); Genworth Financial, Inc. (financial and insurance products and services); PayPal Holdings Inc. (payment and data processing services); Trustee, University of Oklahoma Foundation; former Director, eBay Inc. (online trading community), 2007-2015; and former Director, CIT Bank, CIT Group Inc. (commercial and consumer finance), 2010-2016 |
John J. Neuhauser
c/o Columbia Management
Investment Advisers, LLC
225 Franklin Street
Mail Drop BX32 05228
Boston, MA 02110
1943 | Trustee
1984 | President, Saint Michael’s College, August 2007-June 2018; Director or Trustee of several non-profit organizations, including University of Vermont Medical Center; Academic Vice President and Dean of Faculties, Boston College, August 1999-October 2005; University Professor, Boston College, November 2005-August 2007 | 70 | Liberty All-Star Equity Fund and Liberty All- Star Growth Fund (closed-end funds) |
Patrick J. Simpson
c/o Columbia Management
Investment Advisers, LLC
225 Franklin Street
Mail Drop BX32 05228
Boston, MA 02110
1944 | Trustee
2000 | Of Counsel, Perkins Coie LLP (law firm) since 2015; Partner, Perkins Coie LLP, 1988-2014 | 70 | Former Director, M Fund, Inc. (M Funds mutual fund family), July 2018-July 2019 |
Anne-Lee Verville
c/o Columbia Management
Investment Advisers, LLC
225 Franklin Street
Mail Drop BX32 05228
Boston, MA 02110
1945 | Trustee
1998 | Retired. General Manager, Global Education Industry, 1994-1997, President – Application Systems Division, 1991-1994, Chief Financial Officer – US Marketing & Services, 1988-1991, and Chief Information Officer, 1987-1988, IBM Corporation (computer and technology) | 70 | Former Director, Enesco Group, Inc. (producer of giftware and home and garden decor products), 2001-2006 |
Columbia Emerging Markets Fund | Annual Report 2019
| 35 |
TRUSTEES AND OFFICERS (continued)
Consultants to the Independent Trustees*
| Name, address, year of birth | Position held with the Trust and length of service | Principal occupation(s) during the past five years and other relevant professional experience | Number of Funds in the Columbia Funds complex overseen | Other directorships held by Trustee during the past five years |
J. Kevin Connaughton
c/o Columbia
Management Investment
Advisers, LLC,
225 Franklin Street
Mail Drop BX32 05228,
Boston, MA 02110
1964 | Independent Trustee Consultant
2016 | Independent Trustee Consultant, Columbia Funds since March 2016; Adjunct Professor of Finance, Bentley University since November 2017; Managing Director and General Manager of Mutual Fund Products, Columbia Management Investment Advisers, LLC, May 2010-February 2015; President, Columbia Funds, 2009-2015; and senior officer of Columbia Funds and affiliated funds, 2003-2015 | 70 | Director, The Autism Project since March 2015; former Trustee, New Century Portfolios, March 2015-December 2017; formerly on Board of Governors, Gateway Healthcare, January 2016 – December 2017 |
Olive Darragh
c/o Columbia
Management Investment
Advisers, LLC,
225 Franklin Street,
Mail Drop BX32 05228,
Boston, MA 02110
1962 | Independent Trustee Consultant 2019 | Independent Trustee Consultant, Columbia Funds since June 2019; Managing Director of Darragh Inc. (a strategy and talent management consulting firm) since 2010; Founder and CEO, Zolio (an investment management talent identification platform) since 2004; Partner, Tudor Investments, 2004-2010; Senior Partner, McKinsey & Company, 2001-2004 | 70 | Director, University of Edinburgh Business School; former Director, Boston Public Library Foundation |
Natalie A. Trunow
c/o Columbia
Management Investment
Advisers, LLC,
225 Franklin Street
Mail Drop BX32 05228,
Boston, MA 02110
1967 | Independent Trustee Consultant
2016 | Independent Trustee Consultant, Columbia Funds since September 2016; Chief Executive Officer, Millennial Portfolio Solutions LLC (asset management and consulting services) since January 2016; Director of Investments, Casey Family Programs, April 2016-September 2016; Senior Vice President and Chief Investment Officer, Calvert Investments, August 2008-January 2016; Section Head and Portfolio Manager, General Motors Asset Management, June 1997-August 2008 | 70 | Director, Health Services for Children with Special Needs, Inc.; Director, Consumer Credit Counseling Services (formerly Guidewell Financial Solutions) |
| * | J. Kevin Connaughton was appointed consultant to the Independent Trustees effective March 1, 2016. Olive Darragh was appointed consultant to the Independent Trustees effective June 10, 2019. Natalie A. Trunow was appointed consultant to the Independent Trustees effective September 1, 2016. Shareholders of the Funds are expected to be asked to elect each of Mr. Connaughton, Ms. Darragh and Ms. Trunow as a Trustee at a future shareholder meeting. |
Interested trustee affiliated with Investment Manager*
| Name, address, year of birth | Position held with the Trust and length of service | Principal occupation(s) during the past five years and other relevant professional experience | Number of Funds in the Columbia Funds Complex overseen | Other directorships held by Trustee during the past five years |
William F. Truscott
c/o Columbia Management
Investment Advisers, LLC
225 Franklin Street
Boston, MA 02110
1960 | Trustee
2012 | Chairman of the Board and President, Columbia Management Investment Advisers, LLC since May 2010 and February 2012, respectively; Chief Executive Officer, Global Asset Management, Ameriprise Financial, Inc. since September 2012 (previously Chief Executive Officer, U.S. Asset Management & President, Annuities, May 2010-September 2012); Director and Chief Executive Officer, Columbia Management Investment Distributors, Inc. since May 2010 and February 2012, respectively; Chairman of the Board and Chief Executive Officer, RiverSource Distributors, Inc. since 2006; Director, Threadneedle Asset Management Holdings, SARL since 2014; President and Chief Executive Officer, Ameriprise Certificate Company, 2006-August 2012 | 192 | Chairman of the Board, Columbia Management Investment Advisers, LLC since May 2010; Director, Columbia Management Investment Distributors, Inc. since May 2010; former Director, Ameriprise Certificate Company, August 2006 - January 2013 |
| 36 | Columbia Emerging Markets Fund | Annual Report 2019 |
TRUSTEES AND OFFICERS (continued)
| * | Interested person (as defined under the 1940 Act) by reason of being an officer, director, security holder and/or employee of the Investment Manager or Ameriprise Financial. |
The Statement of Additional Information has additional information about the Fund’s Board members and is available, without charge, upon request by calling 800.345.6611, visiting columbiathreadneedleus.com/investor/ or contacting your financial intermediary.
The Board has appointed officers who are responsible for day-to-day business decisions based on policies it has established. The officers serve at the pleasure of the Board. The following table provides basic information about the Officers of the Fund as of the printing of this report, including principal occupations during the past five years, although their specific titles may have varied over the period. In addition to Mr. Truscott, who is Senior Vice President, the Fund’s other officers are:
Fund officers
Name,
address and
year of birth | Position and year
first appointed to
position for any Fund
in the Columbia
Funds complex or a
predecessor thereof | Principal occupation(s) during past five years |
Christopher O. Petersen
5228 Ameriprise
Financial Center
Minneapolis, MN 55474
Born 1970 | President and Principal Executive Officer (2015) | Vice President and Lead Chief Counsel, Ameriprise Financial, Inc. since January 2015 (previously Vice President and Chief Counsel, January 2010 - December 2014; officer of Columbia Funds and affiliated funds since 2007. |
Michael G. Clarke
225 Franklin Street
Boston, MA 02110
Born 1969 | Chief Financial Officer (Principal Financial Officer) (2009) and Senior Vice President (2019) | Vice President, Head of North American Operations, and Co-Head of Global Operations, Columbia Management Investment Advisers, LLC, since June 2019 (previously Vice President – Accounting and Tax, May 2010 - May 2019); senior officer of Columbia Funds and affiliated funds since 2002 (previously Treasurer and Chief Accounting Officer, January 2009 - January 2019 and December 2015 - January 2019, respectively). |
Joseph Beranek
5890 Ameriprise
Financial Center
Minneapolis, MN 55474
Born 1965 | Treasurer and Chief Accounting Officer (Principal Accounting Officer) (2019) | Vice President — Mutual Fund Accounting and Financial Reporting, Columbia Management Investment Advisers, LLC, since December 2018 and March 2017, respectively (previously Vice President — Pricing and Corporate Actions, May 2010 - March 2017). |
Paul B. Goucher
485 Lexington Avenue
New York, NY 10017
Born 1968 | Senior Vice President (2011) and Assistant Secretary (2008) | Senior Vice President and Assistant General Counsel, Ameriprise Financial, Inc. since January 2017 (previously Vice President and Lead Chief Counsel, November 2008 - January 2017 and January 2013 - January 2017, respectively); Vice President, Chief Legal Officer and Assistant Secretary, Columbia Management Investment Advisers, LLC since March 2015 (previously Vice President and Assistant Secretary, May 2010 – March 2015). |
Thomas P. McGuire
225 Franklin Street
Boston, MA 02110
Born 1972 | Senior Vice President and Chief Compliance Officer (2012) | Vice President — Asset Management Compliance, Ameriprise Financial, Inc., since May 2010; Chief Compliance Officer, Ameriprise Certificate Company since September 2010. |
Colin Moore
225 Franklin Street
Boston, MA 02110
Born 1958 | Senior Vice President (2010) | Executive Vice President and Global Chief Investment Officer, Ameriprise Financial, Inc., since July 2013; Executive Vice President and Global Chief Investment Officer, Columbia Management Investment Advisers, LLC since July 2013. |
Ryan C. Larrenaga
225 Franklin Street
Boston, MA 02110
Born 1970 | Senior Vice President (2017), Chief Legal Officer (2017), and Secretary (2015) | Vice President and Chief Counsel, Ameriprise Financial, Inc. since August 2018 (previously Vice President and Group Counsel, August 2011 - August 2018); officer of Columbia Funds and affiliated funds since 2005. |
Michael E. DeFao
225 Franklin Street
Boston, MA 02110
Born 1968 | Vice President (2011) and Assistant Secretary (2010) | Vice President and Chief Counsel, Ameriprise Financial, Inc. since May 2010. |
Columbia Emerging Markets Fund | Annual Report 2019
| 37 |
TRUSTEES AND OFFICERS (continued)
Fund officers (continued)
Name,
address and
year of birth | Position and year
first appointed to
position for any Fund
in the Columbia
Funds complex or a
predecessor thereof | Principal occupation(s) during past five years |
Lyn Kephart-Strong
5228 Ameriprise
Financial Center
Minneapolis, MN 55474
Born 1960 | Vice President (2015) | President, Columbia Management Investment Services Corp. since October 2014; Vice President & Resolution Officer, Ameriprise Trust Company since August 2009. |
Board Consideration and Approval of Management
Agreement
On June 12, 2019, the Board of Trustees (the Board) and the Trustees who are not interested persons (as defined in the Investment Company Act of 1940) (the Independent Trustees) of Columbia Funds Series Trust I (the Trust) unanimously approved the continuation of the Management Agreement (the Management Agreement) with Columbia Management Investment Advisers, LLC (the Investment Manager) with respect to Columbia Emerging Markets Fund (the Fund), a series of the Trust. As detailed below, the Board’s Advisory Fees and Expenses Committee (the Committee) and the Board met on multiple occasions to review and discuss, among themselves, with the management team of the Investment Manager and with an independent fee consultant, materials provided by the Investment Manager, the independent fee consultant and others before determining to approve the continuation of the Management Agreement.
In connection with their deliberations regarding the continuation of the Management Agreement, the Committee and the Board evaluated materials requested from the Investment Manager regarding the Fund and the Management Agreement, and discussed these materials with representatives of the Investment Manager at Committee meetings held on March 5, 2019, April 25, 2019 and June 11, 2019 and at Board meetings held on March 6, 2019 and June 12, 2019. In addition, the Board and its various committees consider matters bearing on the Management Agreement at other meetings throughout the year and in prior years and meet regularly with senior management of the Trust and the Investment Manager. Through the Board’s Investment Oversight Committees, Trustees also meet with selected portfolio managers of the funds the Trustees oversee and with other investment personnel at various times throughout the year. The Committee and the Board also consulted with the independent fee consultant, Fund counsel and the Independent Trustees’ independent legal counsel, who advised on various matters with respect to the Committee’s and the Board’s considerations and otherwise assisted the Committee and the Board in their deliberations. On June 11, 2019, the Committee recommended that the Board approve the continuation of the Management Agreement. On June 12, 2019, the Board, including the Independent Trustees, voting separately, unanimously approved the continuation of the Management Agreement for the Fund.
The Committee and the Board considered all information that they, their legal counsel or the Investment Manager believed reasonably necessary to evaluate and to determine whether to recommend for approval or approve the continuation of the Management Agreement. The information and factors considered by the Committee and the Board in recommending for approval or approving the continuation of the Management Agreement for the Fund included the following:
| • | Information on the investment performance of the Fund relative to the performance of a group of mutual funds determined to be comparable to the Fund by an independent third-party data provider, as well as performance relative to benchmarks; |
| • | Information on the Fund’s management fees and total expenses, including information comparing the Fund’s expenses to those of a group of comparable mutual funds, as determined by the independent third-party data provider; |
| 38 | Columbia Emerging Markets Fund | Annual Report 2019 |
Board Consideration and Approval of Management
Agreement (continued)
| • | The Investment Manager’s agreement to contractually limit or cap total operating expenses for the Fund through December 31, 2020 so that total operating expenses (excluding certain fees and expenses, such as transaction costs and certain other investment related expenses, interest, taxes, acquired fund fees and expenses, and infrequent and/or unusual expenses) would not exceed a specified annual rate, as a percentage of the Fund’s net assets; |
| • | The terms and conditions of the Management Agreement; |
| • | The current and proposed terms and conditions of other agreements and arrangements with affiliates of the Investment Manager relating to the operations of the Fund, including agreements with respect to the provision of distribution, transfer agency and shareholder services to the Fund; |
| • | Descriptions of various functions performed by the Investment Manager under the Management Agreement, including portfolio management and portfolio trading practices; |
| • | Information regarding the management fees of similarly-managed portfolios of other clients of the Investment Manager, including institutional accounts and collective trusts; |
| • | Information regarding the reputation, regulatory history and resources of the Investment Manager, including information regarding senior management, portfolio managers and other personnel; |
| �� | Information regarding the capabilities of the Investment Manager with respect to compliance monitoring services, including an assessment of the Investment Manager’s compliance system by the Fund’s Chief Compliance Officer; and |
| • | The profitability to the Investment Manager and its affiliates from their relationships with the Fund. |
Nature, extent and quality of services provided under the Management Agreement
The Committee and the Board considered the nature, extent and quality of services provided to the Fund by the Investment Manager and its affiliates under the Management Agreement and under separate agreements for the provision of transfer agency and shareholder services, and the resources dedicated to the Fund and the other Columbia Funds by the Investment Manager and its affiliates. The Committee and the Board considered, among other things, the Investment Manager’s ability to attract, motivate and retain highly qualified research, advisory and supervisory investment professionals (including compensation programs for personnel involved in fund management, reputation and other attributes), the portfolio management services provided by those investment professionals, and the quality of the Investment Manager’s investment research capabilities and trade execution services. The Committee and the Board also considered the potential benefits to shareholders of investing in a mutual fund that is part of a fund complex offering exposure to a variety of asset classes and investment disciplines and providing a variety of fund and shareholder services.
The Committee and the Board also considered the professional experience and qualifications of the senior personnel of the Investment Manager, which included consideration of the Investment Manager’s experience with funds using an investment strategy similar to that used by the Investment Manager for the Fund. The Committee and the Board noted the compliance programs of and the compliance-related resources provided to the Fund by the Investment Manager and its affiliates and the resources dedicated by the Investment Manager and its affiliates to risk management, and considered the Investment Manager’s ability to provide administrative services to the Fund and coordinate the activities of the Fund’s other service providers. After reviewing these and related factors, the Committee and the Board concluded, within the context of their overall conclusions, that the nature, extent and quality of the services provided to the Fund under the Management Agreement supported the continuation of the Management Agreement.
Investment performance
The Committee and the Board reviewed information about the performance of the Fund over various time periods, including performance information relative to benchmarks, information that compared the performance of the Fund to the performance of a group of comparable mutual funds as determined by the independent third-party data provider, and information and analysis provided by the independent fee consultant. The Committee and the Board also reviewed a description of the third party’s methodology for identifying the Fund’s peer groups for purposes of performance and expense comparisons. Although the Fund’s performance lagged that of a relevant peer group for certain (although not necessarily all) periods, the Committee
Columbia Emerging Markets Fund | Annual Report 2019
| 39 |
Board Consideration and Approval of Management
Agreement (continued)
and the Board concluded that other factors relevant to performance were sufficient, in light of other considerations, to support continuation of the Management Agreement. Those factors included one or more of the following: (i) that the Fund’s performance, although lagging in certain recent periods, was stronger over the longer term; (ii) that the underperformance was attributable, to a significant extent, to investment decisions that were reasonable and consistent with the Fund’s investment strategy and policies and that the Fund was performing within a reasonable range of expectations, given those investment decisions, market conditions and the Fund’s investment strategy; (iii) that the Fund’s performance was competitive when compared to other relevant performance benchmarks or peer groups; and (iv) that the Investment Manager had taken or was taking steps designed to help improve the Fund’s investment performance, including, but not limited to, replacing portfolio managers, enhancing the resources supporting the portfolio managers, or modifying investment strategies.
The Committee and the Board noted that, through December 31, 2018, the Fund’s performance was in the ninety-second, fifty-sixth and forty-third percentile (where the best performance would be in the first percentile) of its category selected by the independent third-party data provider for the purposes of performance comparisons for the one-, three- and five-year periods, respectively.
The Committee and the Board also considered the Investment Manager’s performance and reputation generally, the Investment Manager’s historical responsiveness to Board concerns about performance, and the Investment Manager’s willingness to take steps intended to improve performance. After reviewing these and related factors, the Committee and the Board concluded, within the context of their overall conclusions, that the performance of the Fund and the Investment Manager was sufficient, in light of other considerations, to support the continuation of the Management Agreement.
Investment management fee rates and other expenses
The Committee and the Board considered the management fees charged to the Fund under the Management Agreement as well as the total expenses incurred by the Fund. In assessing the reasonableness of the fees under the Management Agreement, the Committee and the Board considered, among other information, the Fund’s total expense ratio as a percentage of average daily net assets. The Committee and the Board considered data provided by the independent third-party data provider and the independent fee consultant. The Committee and the Board noted that, as of December 31, 2018, the Fund’s actual management fee and net total expense ratio were ranked in the fourth and third quintiles, respectively, (where the lowest fees and expenses would be in the first quintile) against the Fund’s expense universe as determined by the independent third-party data provider for purposes of expense comparison. The Committee and the Board also took into account the fee waiver and expense limitation arrangements agreed to by the Investment Manager, as noted above.
The Committee and the Board also received and considered information about the management fees charged by the Investment Manager to institutional accounts. In considering the fees charged to those accounts, the Committee and the Board took into account, among other things, the Investment Manager’s representations about the differences between managing mutual funds as compared to other types of accounts, including differences in the services provided, differences in the risk profile of such business for the Investment Manager and the additional resources required to manage mutual funds effectively. The Committee and the Board also received and considered information about the fees charged by the Investment Manager for sub-advisory services it provides to comparable unaffiliated funds. In evaluating the Fund’s management fees, the Committee and the Board also took into account the demands, complexity and quality of the investment management of the Fund.
After reviewing these and related factors, the Committee and the Board concluded, within the context of their overall conclusions, that the management fee rates and expenses of the Fund, in light of other considerations, supported the continuation of the Management Agreement.
Costs of services provided and profitability
The Committee and the Board also took note of the costs the Investment Manager and its affiliates incur in connection with the services provided and the profitability to the Investment Manager and its affiliates from their relationships with the Fund, and the efforts undertaken by the Investment Manager and its affiliates to manage efficiently their costs to provide such services.
| 40 | Columbia Emerging Markets Fund | Annual Report 2019 |
Board Consideration and Approval of Management
Agreement (continued)
The Committee and the Board also considered the compensation directly or indirectly received by the Investment Manager’s affiliates in connection with their relationships with the Fund. The Committee and the Board reviewed information provided by management as to the profitability to the Investment Manager and its affiliates of their relationships with the Fund, information about the allocation of expenses used to calculate profitability, and comparisons of profitability levels realized in 2018 to profitability levels realized in 2017. When reviewing profitability, the Committee and the Board also considered court cases in which adviser profitability was an issue in whole or in part, the performance of similarly managed funds, the performance of the Fund, and the expense ratio of the Fund. In addition, the Committee and the Board considered information provided by the Investment Manager regarding the Investment Manager’s financial condition and comparing its profitability to that of other asset management firms that are, or are subsidiaries of, publicly traded companies. In this regard, the Committee and the Board also considered data provided by the independent fee consultant.
After reviewing these and related factors, the Committee and the Board concluded, within the context of their overall conclusions, that the costs of services provided and the profitability to the Investment Manager and its affiliates from their relationships with the Fund supported the continuation of the Management Agreement.
Economies of scale
The Committee and the Board considered the potential existence of economies of scale in the provision by the Investment Manager of services to the Fund, to groups of related funds, and to the Investment Manager’s investment advisory clients as a whole, and whether those economies of scale were shared with the Fund through breakpoints in investment management fees or other means, such as expense limitation arrangements and additional investments by the Investment Manager in investment, trading, compliance and other resources. The Committee and the Board noted that the management fee schedules for the Fund contained breakpoints that would reduce the fee rate on assets above specified threshold levels.
In considering these matters, the Committee and the Board also considered the costs of the services provided and the profitability to the Investment Manager and its affiliates from their relationships with the Fund, as noted above. After reviewing these and related factors, the Committee and the Board concluded, within the context of their overall conclusions, that the extent to which any economies of scale were expected to be shared with the Fund supported the continuation of the Management Agreement.
Other benefits to the Investment Manager
The Committee and the Board received and considered information regarding “fall-out” or ancillary benefits received by the Investment Manager and its affiliates as a result of their relationships with the Fund, such as the engagement of the Investment Manager’s affiliates to provide distribution, transfer agency and shareholder services to the Fund. In this regard, among other matters, the Committee and the Board considered that the Fund’s distributor retains a portion of the distribution fees from the Fund and receives a portion of the sales charges on sales or redemptions of certain classes of shares of the Fund. The Committee and the Board also considered the benefits of research made available to the Investment Manager by reason of brokerage commissions generated by the Fund’s securities transactions, and reviewed information about the Investment Manager’s practices with respect to considering brokerage and research services when allocating portfolio transactions. In this connection, the Board also noted that the amount of research made available to the Investment Manager by reason of brokerage commissions had been declining over time, and may decline further. The Committee and the Board recognized that the Investment Manager’s profitability would be somewhat lower without these benefits.
Conclusion
The Committee and the Board reviewed all of the above considerations in reaching their decisions to recommend or approve the continuation of the Management Agreement. In their deliberations, the Trustees did not identify any particular information that was all-important or controlling, and individual Trustees may have attributed different weights to the various factors. Based on their evaluation of all factors that they deemed to be material, including those factors described above, and assisted by the advice of independent legal counsel, the Board, including the Independent Trustees, voting separately, unanimously approved the continuation of the Management Agreement.
Columbia Emerging Markets Fund | Annual Report 2019
| 41 |
[THIS PAGE INTENTIONALLY LEFT BLANK]
[THIS PAGE INTENTIONALLY LEFT BLANK]
Columbia Emerging Markets Fund
P.O. Box 219104
Kansas City, MO 64121-9104
Please read and consider the investment objectives, risks, charges and expenses for any fund carefully before investing. For a prospectus and summary prospectus, which contains this and other important information about the Fund, go to
columbiathreadneedleus.com/investor/. The Fund is distributed by Columbia Management Investment Distributors, Inc., member FINRA, and managed by Columbia Management Investment Advisers, LLC.
Columbia Threadneedle Investments (Columbia Threadneedle) is the global brand name of the Columbia and Threadneedle group of companies. All rights reserved.
© 2019 Columbia Management Investment Advisers, LLC.
columbiathreadneedleus.com/investor/

Annual Report
August 31, 2019
Columbia Greater China Fund
Beginning on January 1, 2021, as permitted by regulations adopted by the Securities and Exchange Commission, paper copies of the Fund’s annual and semiannual shareholder reports like this one will no longer be sent by mail, unless you specifically request paper copies of the reports. Instead, the reports will be made available on the Fund’s website (columbiathreadneedleus.com/investor/), and each time a report is posted you will be notified by mail and provided with a website address to access the report.
If you have already elected to receive shareholder reports electronically, you will not be affected by this change and you need not take any action. You may elect to receive shareholder reports and other communications from the Fund electronically at any time by contacting your financial intermediary (such as a broker-dealer or bank) or, for Fund shares held directly with the Fund, by calling 800.345.6611 or by enrolling in “eDelivery” by logging into your account at columbiathreadneedleus.com/investor/.
You may elect to receive all future reports in paper free of charge. If you invest through a financial intermediary, you can contact your financial intermediary to request that you continue receiving paper copies of your shareholder reports. If you invest directly with the Fund, you can call 800.345.6611 to let the Fund know you wish to continue receiving paper copies of your shareholder reports. Your election to receive paper reports will apply to all Columbia Funds held in your account if you invest through a financial intermediary or all Columbia Funds held with the fund complex if you invest directly with the Fund.
Not FDIC Insured • No bank guarantee • May lose value
Columbia Greater China Fund (the Fund) mails one shareholder report to each shareholder address, unless such shareholder elected to receive shareholder reports from the Fund electronically. If you would like more than one report, please call shareholder services at 800.345.6611 and additional reports will be sent to you.
Proxy voting policies and procedures
The policy of the Board of Trustees is to vote the proxies of the companies in which the Fund holds investments consistent with the procedures as stated in the Statement of Additional Information (SAI). You may obtain a copy of the SAI without charge by calling 800.345.6611; contacting your financial intermediary; visiting columbiathreadneedleus.com/investor/; or searching the website of the Securities and Exchange Commission (SEC) at sec.gov. Information regarding how the Fund voted proxies relating to portfolio securities is filed with the SEC by August 31st for the most recent 12-month period ending June 30th of that year, and is available without charge by visiting columbiathreadneedleus.com/investor/, or searching the website of the SEC at sec.gov.
Quarterly schedule of investments
The Fund files a complete schedule of portfolio holdings with the SEC for the first and third quarters of each fiscal year on Form N-PORT, and for reporting periods ended prior to March 31, 2019, on Form N-Q. The Fund’s Form N-Q and Form N-PORT filings are available on the SEC’s website at sec.gov. The Fund’s complete schedule of portfolio holdings, as filed on Form N-Q or Form N-PORT, can also be obtained without charge, upon request, by calling 800.345.6611.
Additional Fund information
For more information about the Fund, please visit columbiathreadneedleus.com/investor/ or call 800.345.6611. Customer Service Representatives are available to answer your questions Monday through Friday from 8 a.m. to 7 p.m. Eastern time.
Fund investment manager
Columbia Management Investment Advisers, LLC (the Investment Manager)
225 Franklin Street
Boston, MA 02110
Fund distributor
Columbia Management Investment Distributors, Inc.
225 Franklin Street
Boston, MA 02110
Fund transfer agent
Columbia Management Investment Services Corp.
P.O. Box 219104
Kansas City, MO 64121-9104
Columbia Greater China Fund | Annual Report 2019
Investment objective
The Fund seeks long-term capital appreciation.
Portfolio management
Dara White, CFA
Co-Portfolio Manager
Managed Fund since January 2019
Jasmine (Weili) Huang, CFA, CPA (U.S. and China), CFM*
Co-Portfolio Manager
Managed Fund since 2005
*Ms. Huang is on a medical leave of absence, a timetable for her return is not set.
Morningstar style boxTM
The Morningstar Style Box is based on a fund’s portfolio holdings. For equity funds, the vertical axis shows the market capitalization of the stocks owned, and the horizontal axis shows investment style (value, blend, or growth). Information shown is based on the most recent data provided by Morningstar.
© 2019 Morningstar, Inc. All rights reserved. The Morningstar information contained herein: (1) is proprietary to Morningstar and/or its content providers; (2) may not be copied or distributed; and (3) is not warranted to be accurate, complete or timely. Neither Morningstar nor its content providers are responsible for any damages or losses arising from any use of this information.
| Average annual total returns (%) (for the period ended August 31, 2019) |
| | | Inception | 1 Year | 5 Years | 10 Years |
| Class A | Excluding sales charges | 05/16/97 | 1.28 | 6.83 | 7.51 |
| | Including sales charges | | -4.54 | 5.57 | 6.87 |
| Advisor Class* | 03/19/13 | 1.53 | 7.10 | 7.68 |
| Class C | Excluding sales charges | 05/16/97 | 0.53 | 6.03 | 6.70 |
| | Including sales charges | | -0.41 | 6.03 | 6.70 |
| Institutional Class | 05/16/97 | 1.54 | 7.10 | 7.78 |
| Institutional 2 Class* | 11/08/12 | 1.65 | 7.23 | 7.78 |
| Institutional 3 Class* | 03/01/17 | 1.69 | 7.04 | 7.61 |
| MSCI China Index (Net) | | -5.25 | 4.66 | 5.34 |
| Hang Seng Index | | -7.60 | 0.56 | 2.58 |
Returns for Class A shares are shown with and without the maximum initial sales charge of 5.75%. Returns for Class C shares are shown with and without the 1.00% contingent deferred sales charge for the first year only. The Fund’s other share classes are not subject to sales charges and have limited eligibility. Please see the Fund’s prospectus for details. Performance for different share classes will vary based on differences in sales charges and fees associated with each share class. All results shown assume reinvestment of distributions during the period. Returns do not reflect the deduction of taxes that a shareholder may pay on Fund distributions or on the redemption of Fund shares. Performance results reflect the effect of any fee waivers or reimbursements of Fund expenses by Columbia Management Investment Advisers, LLC and/or any of its affiliates. Absent these fee waivers or expense reimbursement arrangements, performance results would have been lower.
The performance information shown represents past performance and is not a guarantee of future results. The investment return and principal value of your investment will fluctuate so that your shares, when redeemed, may be worth more or less than their original cost. Current performance may be lower or higher than the performance information shown. You may obtain performance information current to the most recent month-end by contacting your financial intermediary, visiting columbiathreadneedleus.com/investor/ or calling 800.345.6611.
| * | The returns shown for periods prior to the share class inception date (including returns for the Life of the Fund, if shown, which are since Fund inception) include the returns of the Fund’s oldest share class. Since the Fund launched more than one share class at its inception, Class A shares were used. These returns are adjusted to reflect any higher class-related operating expenses of the newer share classes, as applicable. Please visit columbiathreadneedleus.com/investor/investment-products/mutual-funds/appended-performance for more information. |
The MSCI China Index (Net) is designed to broadly and fairly represent the full diversity of business activities in China. This index aims to capture 85% of the free float adjusted market capitalization in each industry group.
The Hang Seng Index tracks the performance of approximately 70% of the total market capitalization of the stock exchange of Hong Kong.
Indices are not available for investment, are not professionally managed and do not reflect sales charges, fees, brokerage commissions, taxes (except the MSCI China Index (Net) which reflects reinvested dividends net of withholding taxes) or other expenses of investing. Securities in the Fund may not match those in an index.
Columbia Greater China Fund | Annual Report 2019
| 3 |
Fund at a Glance (continued)
Performance of a hypothetical $10,000 investment (August 31, 2009 — August 31, 2019)
The chart above shows the change in value of a hypothetical $10,000 investment in Class A shares of Columbia Greater China Fund during the stated time period, and does not reflect the deduction of taxes that a shareholder may pay on Fund distributions or on the redemption of Fund shares.
| Top 10 holdings (%) (at August 31, 2019) |
| Tencent Holdings Ltd. | 22.0 |
| Alibaba Group Holding Ltd., ADR | 17.0 |
| Ping An Insurance Group Co. of China Ltd., Class H | 5.8 |
| Shenzhou International Group Holdings Ltd. | 4.2 |
| CNOOC Ltd. | 4.1 |
| China Construction Bank Corp., Class H | 3.8 |
| China Mengniu Dairy Co., Ltd. | 2.7 |
| NetEase, Inc., ADR | 2.7 |
| TAL Education Group, ADR | 2.3 |
| Jiangsu Yanghe Brewery Joint-Stock Co., Ltd., Class A | 2.2 |
Percentages indicated are based upon total investments excluding Money Market Funds and investments in derivatives, if any.
For further detail about these holdings, please refer to the section entitled “Portfolio of Investments.”
Fund holdings are as of the date given, are subject to change at any time, and are not recommendations to buy or sell any security.
| Equity sector breakdown (%) (at August 31, 2019) |
| Communication Services | 26.6 |
| Consumer Discretionary | 30.8 |
| Consumer Staples | 9.9 |
| Energy | 4.2 |
| Financials | 14.0 |
| Health Care | 9.4 |
| Industrials | 1.9 |
| Information Technology | 0.7 |
| Materials | 1.1 |
| Real Estate | 1.4 |
| Total | 100.0 |
Percentages indicated are based upon total equity investments. The Fund’s portfolio composition is subject to change.
| 4 | Columbia Greater China Fund | Annual Report 2019 |
Fund at a Glance (continued)
| Country breakdown (%) (at August 31, 2019) |
| China | 96.2 |
| Hong Kong | 3.2 |
| United States(a) | 0.6 |
| Total | 100.0 |
| (a) | Includes investments in Money Market Funds. |
Country breakdown is based primarily on issuer’s place of organization/incorporation. Percentages indicated are based upon total investments excluding investments in derivatives, if any. The Fund’s portfolio composition is subject to change.
Columbia Greater China Fund | Annual Report 2019
| 5 |
Manager Discussion of Fund Performance
For the 12-month period that ended August 31, 2019, the Fund’s Class A shares returned 1.28% excluding sales charges. The Fund’s performance exceeded the MSCI China Index (Net) benchmark return of -5.25% and the Hang Seng Index return of -7.60%, for the same 12-month period. Selection within communication services, consumer staples and financials added to the Fund’s relative performance, while selection within information technology constrained return.
Trade and monetary policy concerns overhung market
The 12 months ended August 31, 2019 saw notable volatility in risk assets including Chinese equities. The period opened against the backdrop of a slowing global economy and an escalating U.S.-China trade war. A sharp risk-off tone in late 2018 was driven by concerns that the U.S. Federal Reserve (Fed) would overshoot in raising rates given the already fragile growth outlook. The Fed responded to the deterioration in sentiment by executing a policy pivot entering 2019, signaling a pause in rate increases along with announcing an early end to its balance sheet reduction program. The Chinese government also moved toward increasing accommodation by putting to the side deleveraging efforts and adding stimulus in the form of lower bank reserve requirements, tax cuts and targeted infrastructure spending. Along with signs of modest progress in trade negotiations, these developments supported a rebound in global equities over the first few months of 2019.
However, the rally would be derailed in early May as President Trump announced plans to raise tariffs from 10% to 25% on some $200 billion in imports from China. Sentiment was subsequently buffered to a degree as the Fed indicated a willingness to cut its benchmark overnight lending rate as needed to offset the impact on global growth of higher tariffs
Fund performance aided by security selection
For the 12 months ended August 31, 2019, performance in the Chinese market was led by domestically focused sectors such as consumer staples, consumer discretionary and utilities. By contrast, energy, healthcare, information technology and industrials issues lagged as the trade war weighed on these sectors.
Security selection was the primary driver of the Fund’s outperformance relative to the MSCI benchmark, highlighted by choices within communication services, consumer staples and financials. Selection within information technology detracted from relative performance. The Fund’s sector allocations in aggregate added modestly to returns versus the benchmark as we sought to focus on companies with results primarily reliant on the domestic consumer.
Within communication services, contributions were led by exposure to Netease, as the internet technology company benefited from a more relaxed regulatory environment around online games. An underweight to internet search company Baidu also added to relative performance, as the slowing Chinese economy has hampered growth in online searches and associated advertising revenue. Within consumer discretionary, a pair of educational services companies, TAL Education Group and New Oriental Education & Technology, were notable outperformers as both companies have experienced strong enrollment growth. In consumer staples, positive results for premium liquor manufacturer Kweichow Moutai have been driven by an increase in high-end consumption, while China Resources Beer, brewer of the world’s best-selling beer, has seen its results benefit as it pursues a “premiumization” strategy. In financials, contributions were led by Ping An Insurance, which given its market leadership is well-positioned to experience further growth from addressing what we believe to be the underpenetrated Chinese insurance market. Within health care, a position in WuXi AppTec Group aided performance as the biopharmaceutical company has benefited from the industry trend toward outsourcing of clinical drug trials.
On the downside, as noted selection within information technology was the leading constraint on return. Shares of Sunny Optical, China’s largest manufacturer of smartphone camera components, declined notably. We exited the position on the view that the U.S.-China trade dispute and security concerns are likely to weigh on Chinese technology companies for some time. Online advertising agency Focus Media Internet Technology also performed poorly, and we sold out of that position as well.
Focus on secular growth themes
We continue to use a bottom-up approach designed to identify fast-growing, fundamentally sound companies that we believe are capitalizing on favorable long-term trends, including the emerging Chinese consumer fueled by rising incomes.
| 6 | Columbia Greater China Fund | Annual Report 2019 |
Manager Discussion of Fund Performance (continued)
In China, the government’s focus had shifted away from deleveraging and toward measures to stimulate the economy at the close of the reporting period. Chinese Purchasing Managers’ Index had shown some signs of strengthening, suggesting a return on the part of companies to more of a “business as usual” approach despite the overhang from trade concerns. However, real activity growth remained under pressure, with particular headwinds related to exports. We had observed an increase in government support for the private sector and an improvement in the regulatory environment.
In managing the Fund, our investment focus remains on long-term secular Chinese domestic growth themes rather than global trade and cyclical trends. We continue to believe the long-term outlook for China’s “new economy” remains robust and that market volatility can create opportunities to invest in high quality companies at reasonable prices.
Marketrisk may affect a single issuer, sector of the economy, industry or the market as a whole.International investing involves certain risks and volatility due to potential political, economic or currency instabilities and different financial and accounting standards. Risks are enhanced foremerging market issuers. Concentration in theGreater China region, where issuers tend to be less developed than U.S. issuers, presents increased risk of loss than a fund that does not concentrate its investments. Investments in small- and mid-capcompanies involve risks and volatility greater than investments in larger, more established companies. As anon-diversified fund, fewer investments could have a greater affect on performance. See the Fund’s prospectus for more information on these and other risks.
The views expressed in this report reflect the current views of the respective parties. These views are not guarantees of future performance and involve certain risks, uncertainties and assumptions that are difficult to predict, so actual outcomes and results may differ significantly from the views expressed. These views are subject to change at any time based upon economic, market or other conditions and the respective parties disclaim any responsibility to update such views. These views may not be relied on as investment advice and, because investment decisions for a Columbia fund are based on numerous factors, may not be relied on as an indication of trading intent on behalf of any particular Columbia fund. References to specific securities should not be construed as a recommendation or investment advice.
Columbia Greater China Fund | Annual Report 2019
| 7 |
Understanding Your Fund’s Expenses
(Unaudited)
As an investor, you incur two types of costs. There are shareholder transaction costs, which generally include sales charges on purchases and may include redemption fees. There are also ongoing fund costs, which generally include management fees, distribution and/or service fees, and other fund expenses. The following information is intended to help you understand your ongoing costs (in dollars) of investing in the Fund and to help you compare these costs with the ongoing costs of investing in other mutual funds.
Analyzing your Fund’s expenses
To illustrate these ongoing costs, we have provided examples and calculated the expenses paid by investors in each share class of the Fund during the period. The actual and hypothetical information in the table is based on an initial investment of $1,000 at the beginning of the period indicated and held for the entire period. Expense information is calculated two ways and each method provides you with different information. The amount listed in the “Actual” column is calculated using the Fund’s actual operating expenses and total return for the period. You may use the Actual information, together with the amount invested, to estimate the expenses that you paid over the period. Simply divide your account value by $1,000 (for example, an $8,600 account value divided by $1,000 = 8.6), then multiply the results by the expenses paid during the period under the “Actual” column. The amount listed in the “Hypothetical” column assumes a 5% annual rate of return before expenses (which is not the Fund’s actual return) and then applies the Fund’s actual expense ratio for the period to the hypothetical return. You should not use the hypothetical account values and expenses to estimate either your actual account balance at the end of the period or the expenses you paid during the period. See “Compare with other funds” below for details on how to use the hypothetical data.
Compare with other funds
Since all mutual funds are required to include the same hypothetical calculations about expenses in shareholder reports, you can use this information to compare the ongoing cost of investing in the Fund with other funds. To do so, compare the hypothetical example with the 5% hypothetical examples that appear in the shareholder reports of other funds. As you compare hypothetical examples of other funds, it is important to note that hypothetical examples are meant to highlight the ongoing costs of investing in a fund only and do not reflect any transaction costs, such as sales charges, or redemption or exchange fees. Therefore, the hypothetical calculations are useful in comparing ongoing costs only, and will not help you determine the relative total costs of owning different funds. If transaction costs were included in these calculations, your costs would be higher.
| March 1, 2019 — August 31, 2019 |
| | Account value at the
beginning of the
period ($) | Account value at the
end of the
period ($) | Expenses paid during
the period ($) | Fund’s annualized
expense ratio (%) |
| | Actual | Hypothetical | Actual | Hypothetical | Actual | Hypothetical | Actual |
| Class A | 1,000.00 | 1,000.00 | 1,018.30 | 1,017.45 | 7.69 | 7.69 | 1.52 |
| Advisor Class | 1,000.00 | 1,000.00 | 1,019.70 | 1,018.65 | 6.48 | 6.48 | 1.28 |
| Class C | 1,000.00 | 1,000.00 | 1,014.60 | 1,013.69 | 11.46 | 11.46 | 2.27 |
| Institutional Class | 1,000.00 | 1,000.00 | 1,019.70 | 1,018.70 | 6.43 | 6.43 | 1.27 |
| Institutional 2 Class | 1,000.00 | 1,000.00 | 1,020.30 | 1,019.10 | 6.03 | 6.02 | 1.19 |
| Institutional 3 Class | 1,000.00 | 1,000.00 | 1,020.60 | 1,019.35 | 5.77 | 5.77 | 1.14 |
Expenses paid during the period are equal to the annualized expense ratio for each class as indicated above, multiplied by the average account value over the period and then multiplied by the number of days in the Fund’s most recent fiscal half year and divided by 365.
Expenses do not include fees and expenses incurred indirectly by the Fund from its investment in underlying funds, including affiliated and non-affiliated pooled investment vehicles, such as mutual funds and exchange-traded funds.
| 8 | Columbia Greater China Fund | Annual Report 2019 |
Portfolio of Investments
August 31, 2019
(Percentages represent value of investments compared to net assets)
Investments in securities
| Common Stocks 99.4% |
| Issuer | Shares | Value ($) |
| Communication Services 26.4% |
| Entertainment 4.6% |
| HUYA, Inc. ADR(a) | 48,227 | 1,215,321 |
| NetEase, Inc., ADR | 11,446 | 2,918,730 |
| Tencent Music Entertainment Group, ADR(a) | 63,623 | 846,186 |
| Total | | 4,980,237 |
| Interactive Media & Services 21.8% |
| Tencent Holdings Ltd. | 577,100 | 23,825,881 |
| Total Communication Services | 28,806,118 |
| Consumer Discretionary 30.7% |
| Diversified Consumer Services 4.4% |
| New Oriental Education & Technology Group, Inc., ADR(a) | 20,630 | 2,339,442 |
| TAL Education Group, ADR(a) | 70,085 | 2,497,128 |
| Total | | 4,836,570 |
| Hotels, Restaurants & Leisure 1.8% |
| China International Travel Service Corp., Ltd., Class A | 35,000 | 468,345 |
| Galaxy Entertainment Group Ltd. | 246,000 | 1,539,587 |
| Total | | 2,007,932 |
| Household Durables 2.3% |
| Haier Smart Home Co., Ltd., Class A | 356,620 | 794,053 |
| Midea Group Co., Ltd., Class A | 224,975 | 1,664,638 |
| Total | | 2,458,691 |
| Internet & Direct Marketing Retail 17.6% |
| Alibaba Group Holding Ltd., ADR(a) | 105,061 | 18,388,827 |
| Ctrip.com International Ltd., ADR(a) | 23,985 | 776,634 |
| Total | | 19,165,461 |
| Specialty Retail 0.4% |
| Zhongsheng Group Holdings Ltd. | 124,000 | 386,509 |
| Textiles, Apparel & Luxury Goods 4.2% |
| Shenzhou International Group Holdings Ltd. | 336,000 | 4,558,618 |
| Total Consumer Discretionary | 33,413,781 |
| Common Stocks (continued) |
| Issuer | Shares | Value ($) |
| Consumer Staples 9.8% |
| Beverages 5.9% |
| China Resources Beer Holdings Co., Ltd. | 392,000 | 2,218,905 |
| Jiangsu Yanghe Brewery Joint-Stock Co., Ltd., Class A | 154,290 | 2,417,548 |
| Kweichow Moutai Co., Ltd., Class A | 11,700 | 1,869,844 |
| Total | | 6,506,297 |
| Food Products 3.9% |
| China Mengniu Dairy Co., Ltd. | 748,000 | 2,959,046 |
| Foshan Haitian Flavouring & Food Co., Ltd., Class A | 79,136 | 1,269,631 |
| Total | | 4,228,677 |
| Total Consumer Staples | 10,734,974 |
| Energy 4.1% |
| Oil, Gas & Consumable Fuels 4.1% |
| CNOOC Ltd. | 3,029,500 | 4,487,950 |
| Total Energy | 4,487,950 |
| Financials 14.0% |
| Banks 6.8% |
| China Construction Bank Corp., Class H | 5,476,340 | 4,069,548 |
| China Merchants Bank Co., Ltd., Class H | 318,500 | 1,445,023 |
| Industrial & Commercial Bank of China Ltd., Class H | 3,021,000 | 1,905,215 |
| Total | | 7,419,786 |
| Insurance 7.2% |
| AIA Group Ltd. | 161,200 | 1,559,893 |
| Ping An Insurance Group Co. of China Ltd., Class H | 543,500 | 6,235,582 |
| Total | | 7,795,475 |
| Total Financials | 15,215,261 |
| Health Care 9.4% |
| Biotechnology 2.8% |
| BeiGene Ltd., ADR(a) | 9,283 | 1,334,431 |
| CStone Pharmaceuticals(a) | 450,000 | 661,191 |
| Zai Lab Ltd., ADR(a) | 32,460 | 1,058,520 |
| Total | | 3,054,142 |
| Life Sciences Tools & Services 2.9% |
| WuXi AppTec Co., Ltd., Class H | 124,880 | 1,397,652 |
| Wuxi Biologics Cayman, Inc.(a) | 170,500 | 1,789,477 |
| Total | | 3,187,129 |
The accompanying Notes to Financial Statements are an integral part of this statement.
Columbia Greater China Fund | Annual Report 2019
| 9 |
Portfolio of Investments (continued)
August 31, 2019
| Common Stocks (continued) |
| Issuer | Shares | Value ($) |
| Pharmaceuticals 3.7% |
| China Animal Healthcare Ltd.(a),(b),(c),(d) | 1,050,000 | 0 |
| CSPC Pharmaceutical Group Ltd. | 686,000 | 1,366,827 |
| Jiangsu Hengrui Medicine Co., Ltd., Class A | 52,131 | 584,234 |
| Sino Biopharmaceutical Ltd. | 1,375,500 | 2,038,037 |
| Total | | 3,989,098 |
| Total Health Care | 10,230,369 |
| Industrials 1.9% |
| Electrical Equipment 0.8% |
| Zhuzhou CRRC Times Electric Co., Ltd., Class H | 202,100 | 802,297 |
| Machinery 0.3% |
| Techtronic Industries Co., Ltd. | 51,000 | 351,784 |
| Transportation Infrastructure 0.8% |
| Shanghai International Airport Co., Ltd., Class A | 73,800 | 868,168 |
| Total Industrials | 2,022,249 |
| Information Technology 0.7% |
| Software 0.7% |
| Kingdee International Software Group Co., Ltd. | 873,000 | 787,556 |
| Total Information Technology | 787,556 |
| Common Stocks (continued) |
| Issuer | Shares | Value ($) |
| Materials 1.1% |
| Construction Materials 1.1% |
| China Resources Cement Holdings Ltd. | 1,394,000 | 1,231,713 |
| Total Materials | 1,231,713 |
| Real Estate 1.3% |
| Real Estate Management & Development 1.3% |
| China Resources Land Ltd. | 360,000 | 1,459,502 |
| Total Real Estate | 1,459,502 |
Total Common Stocks
(Cost $54,321,687) | 108,389,473 |
|
| Money Market Funds 0.6% |
| | Shares | Value ($) |
| Columbia Short-Term Cash Fund, 2.208%(e),(f) | 635,900 | 635,836 |
Total Money Market Funds
(Cost $635,836) | 635,836 |
Total Investments in Securities
(Cost: $54,957,523) | 109,025,309 |
| Other Assets & Liabilities, Net | | (45,840) |
| Net Assets | 108,979,469 |
Notes to Portfolio of Investments
| (a) | Non-income producing investment. |
| (b) | Represents fair value as determined in good faith under procedures approved by the Board of Trustees. At August 31, 2019, the total value of these securities amounted to $0, which represents less than 0.01% of total net assets. |
| (c) | Negligible market value. |
| (d) | Valuation based on significant unobservable inputs. |
| (e) | The rate shown is the seven-day current annualized yield at August 31, 2019. |
| (f) | As defined in the Investment Company Act of 1940, an affiliated company is one in which the Fund owns 5% or more of the company’s outstanding voting securities, or a company which is under common ownership or control with the Fund. Holdings and transactions in these affiliated companies during the year ended August 31, 2019 are as follows: |
| Issuer | Beginning
shares | Shares
purchased | Shares
sold | Ending
shares | Realized gain
(loss) —
affiliated
issuers ($) | Net change in
unrealized
appreciation
(depreciation) —
affiliated
issuers ($) | Dividends —
affiliated
issuers ($) | Value —
affiliated
issuers
at end of
period ($) |
| Columbia Short-Term Cash Fund, 2.208% |
| | 6,297,619 | 39,997,465 | (45,659,184) | 635,900 | 51 | — | 68,381 | 635,836 |
Abbreviation Legend
| ADR | American Depositary Receipt |
The accompanying Notes to Financial Statements are an integral part of this statement.
| 10 | Columbia Greater China Fund | Annual Report 2019 |
Portfolio of Investments (continued)
August 31, 2019
Fair value measurements
The Fund categorizes its fair value measurements according to a three-level hierarchy that maximizes the use of observable inputs and minimizes the use of unobservable inputs by prioritizing that the most observable input be used when available. Observable inputs are those that market participants would use in pricing an investment based on market data obtained from sources independent of the reporting entity. Unobservable inputs are those that reflect the Fund’s assumptions about the information market participants would use in pricing an investment. An investment’s level within the fair value hierarchy is based on the lowest level of any input that is deemed significant to the asset’s or liability’s fair value measurement. The input levels are not necessarily an indication of the risk or liquidity associated with investments at that level. For example, certain U.S. government securities are generally high quality and liquid, however, they are reflected as Level 2 because the inputs used to determine fair value may not always be quoted prices in an active market.
Fair value inputs are summarized in the three broad levels listed below:
| ■ | Level 1 — Valuations based on quoted prices for investments in active markets that the Fund has the ability to access at the measurement date. Valuation adjustments are not applied to Level 1 investments. |
| ■ | Level 2 — Valuations based on other significant observable inputs (including quoted prices for similar securities, interest rates, prepayment speeds, credit risks, etc.). |
| ■ | Level 3 — Valuations based on significant unobservable inputs (including the Fund’s own assumptions and judgment in determining the fair value of investments). |
Inputs that are used in determining fair value of an investment may include price information, credit data, volatility statistics, and other factors. These inputs can be either observable or unobservable. The availability of observable inputs can vary between investments, and is affected by various factors such as the type of investment, and the volume and level of activity for that investment or similar investments in the marketplace. The inputs will be considered by the Investment Manager, along with any other relevant factors in the calculation of an investment’s fair value. The Fund uses prices and inputs that are current as of the measurement date, which may include periods of market dislocations. During these periods, the availability of prices and inputs may be reduced for many investments. This condition could cause an investment to be reclassified between the various levels within the hierarchy.
Foreign equity securities actively traded in markets where there is a significant delay in the local close relative to the New York Stock Exchange are classified as Level 2. The values of these securities may include an adjustment to reflect the impact of significant market movements following the close of local trading, as described in Note 2 to the financial statements – Security valuation.
Investments falling into the Level 3 category are primarily supported by quoted prices from brokers and dealers participating in the market for those investments. However, these may be classified as Level 3 investments due to lack of market transparency and corroboration to support these quoted prices. Additionally, valuation models may be used as the pricing source for any remaining investments classified as Level 3. These models may rely on one or more significant unobservable inputs and/or significant assumptions by the Investment Manager. Inputs used in valuations may include, but are not limited to, financial statement analysis, capital account balances, discount rates and estimated cash flows, and comparable company data.
Under the direction of the Fund’s Board of Trustees (the Board), the Investment Manager’s Valuation Committee (the Committee) is responsible for overseeing the valuation procedures approved by the Board. The Committee consists of voting and non-voting members from various groups within the Investment Manager’s organization, including operations and accounting, trading and investments, compliance, risk management and legal.
The Committee meets at least monthly to review and approve valuation matters, which may include a description of specific valuation determinations, data regarding pricing information received from approved pricing vendors and brokers and the results of Board-approved valuation control policies and procedures (the Policies). The Policies address, among other things, instances when market quotations are or are not readily available, including recommendations of third party pricing vendors and a determination of appropriate pricing methodologies; events that require specific valuation determinations and assessment of fair value techniques; securities with a potential for stale pricing, including those that are illiquid, restricted, or in default; and the effectiveness of third party pricing vendors, including periodic reviews of vendors. The Committee meets more frequently, as needed, to discuss additional valuation matters, which may include the need to review back-testing results, review time-sensitive information or approve related valuation actions. The Committee reports to the Board, with members of the Committee meeting with the Board at each of its regularly scheduled meetings to discuss valuation matters and actions during the period, similar to those described earlier.
The following table is a summary of the inputs used to value the Fund’s investments at August 31, 2019:
| | Level 1 ($) | Level 2 ($) | Level 3 ($) | Total ($) |
| Investments in Securities | | | | |
| Common Stocks | | | | |
| Communication Services | 4,980,237 | 23,825,881 | — | 28,806,118 |
| Consumer Discretionary | 24,002,031 | 9,411,750 | — | 33,413,781 |
| Consumer Staples | — | 10,734,974 | — | 10,734,974 |
| Energy | — | 4,487,950 | — | 4,487,950 |
| Financials | — | 15,215,261 | — | 15,215,261 |
| Health Care | 2,392,951 | 7,837,418 | 0* | 10,230,369 |
| Industrials | — | 2,022,249 | — | 2,022,249 |
| Information Technology | — | 787,556 | — | 787,556 |
| Materials | — | 1,231,713 | — | 1,231,713 |
| Real Estate | — | 1,459,502 | — | 1,459,502 |
| Total Common Stocks | 31,375,219 | 77,014,254 | 0* | 108,389,473 |
| Money Market Funds | 635,836 | — | — | 635,836 |
| Total Investments in Securities | 32,011,055 | 77,014,254 | 0* | 109,025,309 |
See the Portfolio of Investments for all investment classifications not indicated in the table.
The accompanying Notes to Financial Statements are an integral part of this statement.
Columbia Greater China Fund | Annual Report 2019
| 11 |
Portfolio of Investments (continued)
August 31, 2019
Fair value measurements (continued)
The Fund’s assets assigned to the Level 2 input category are generally valued using the market approach, in which a security’s value is determined through reference to prices and information from market transactions for similar or identical assets. These assets include certain foreign securities for which a third party statistical pricing service may be employed for purposes of fair market valuation. The model utilized by such third party statistical pricing service takes into account a security’s correlation to available market data including, but not limited to, intraday index, ADR, and exchange-traded fund movements.
The Fund does not hold any significant investments (greater than one percent of net assets) categorized as Level 3.
The accompanying Notes to Financial Statements are an integral part of this statement.
| 12 | Columbia Greater China Fund | Annual Report 2019 |
Statement of Assets and Liabilities
August 31, 2019
| Assets | |
| Investments in securities, at value | |
| Unaffiliated issuers (cost $54,321,687) | $108,389,473 |
| Affiliated issuers (cost $635,836) | 635,836 |
| Cash | 29 |
| Receivable for: | |
| Capital shares sold | 17,861 |
| Dividends | 49,115 |
| Prepaid expenses | 714 |
| Trustees’ deferred compensation plan | 68,808 |
| Total assets | 109,161,836 |
| Liabilities | |
| Payable for: | |
| Capital shares purchased | 61,748 |
| Management services fees | 2,830 |
| Distribution and/or service fees | 519 |
| Transfer agent fees | 14,320 |
| Compensation of chief compliance officer | 8 |
| Audit fees | 19,225 |
| Custodian fees | 11,358 |
| Other expenses | 3,551 |
| Trustees’ deferred compensation plan | 68,808 |
| Total liabilities | 182,367 |
| Net assets applicable to outstanding capital stock | $108,979,469 |
| Represented by | |
| Paid in capital | 53,463,616 |
| Total distributable earnings (loss) (Note 2) | 55,515,853 |
| Total - representing net assets applicable to outstanding capital stock | $108,979,469 |
| Class A | |
| Net assets | $65,762,336 |
| Shares outstanding | 1,461,239 |
| Net asset value per share | $45.00 |
| Maximum sales charge | 5.75% |
| Maximum offering price per share (calculated by dividing the net asset value per share by 1.0 minus the maximum sales charge for Class A shares) | $47.75 |
| Advisor Class | |
| Net assets | $1,027,223 |
| Shares outstanding | 20,466 |
| Net asset value per share | $50.19 |
| Class C | |
| Net assets | $2,553,867 |
| Shares outstanding | 62,348 |
| Net asset value per share | $40.96 |
| Institutional Class | |
| Net assets | $31,243,913 |
| Shares outstanding | 634,588 |
| Net asset value per share | $49.23 |
| Institutional 2 Class | |
| Net assets | $3,001,300 |
| Shares outstanding | 59,575 |
| Net asset value per share | $50.38 |
| Institutional 3 Class | |
| Net assets | $5,390,830 |
| Shares outstanding | 109,849 |
| Net asset value per share(a) | $49.08 |
| (a) | Net asset value per share rounds to this amount due to fractional shares outstanding. |
The accompanying Notes to Financial Statements are an integral part of this statement.
Columbia Greater China Fund | Annual Report 2019
| 13 |
Statement of Operations
Year Ended August 31, 2019
| Net investment income | |
| Income: | |
| Dividends — unaffiliated issuers | $1,786,174 |
| Dividends — affiliated issuers | 68,381 |
| Foreign taxes withheld | (128,387) |
| Total income | 1,726,168 |
| Expenses: | |
| Management services fees | 1,101,436 |
| Distribution and/or service fees | |
| Class A | 166,442 |
| Class C | 41,736 |
| Class T | 2 |
| Transfer agent fees | |
| Class A | 98,264 |
| Advisor Class | 4,444 |
| Class C | 6,210 |
| Institutional Class | 50,418 |
| Institutional 2 Class | 1,787 |
| Institutional 3 Class | 510 |
| Class T | 1 |
| Compensation of board members | 15,166 |
| Custodian fees | 17,259 |
| Printing and postage fees | 21,376 |
| Registration fees | 95,803 |
| Audit fees | 39,274 |
| Legal fees | 2,312 |
| Interest on interfund lending | 172 |
| Compensation of chief compliance officer | 46 |
| Other | 20,439 |
| Total expenses | 1,683,097 |
| Net investment income | 43,071 |
| Realized and unrealized gain (loss) — net | |
| Net realized gain (loss) on: | |
| Investments — unaffiliated issuers | 2,556,911 |
| Investments — affiliated issuers | 51 |
| Foreign currency translations | (15,419) |
| Net realized gain | 2,541,543 |
| Net change in unrealized appreciation (depreciation) on: | |
| Investments — unaffiliated issuers | (2,754,977) |
| Foreign currency translations | 33 |
| Net change in unrealized appreciation (depreciation) | (2,754,944) |
| Net realized and unrealized loss | (213,401) |
| Net decrease in net assets resulting from operations | $(170,330) |
The accompanying Notes to Financial Statements are an integral part of this statement.
| 14 | Columbia Greater China Fund | Annual Report 2019 |
Statement of Changes in Net Assets
| | Year Ended
August 31, 2019 | Year Ended
August 31, 2018 |
| Operations | | |
| Net investment income (loss) | $43,071 | $(207,375) |
| Net realized gain | 2,541,543 | 9,630,829 |
| Net change in unrealized appreciation (depreciation) | (2,754,944) | (3,756,926) |
| Net increase (decrease) in net assets resulting from operations | (170,330) | 5,666,528 |
| Distributions to shareholders | | |
| Net investment income and net realized gains | | |
| Class A | (3,661,678) | |
| Advisor Class | (97,147) | |
| Class C | (279,328) | |
| Institutional Class | (1,849,058) | |
| Institutional 2 Class | (130,519) | |
| Institutional 3 Class | (374,829) | |
| Net investment income | | |
| Class A | | (417,242) |
| Advisor Class | | (9,370) |
| Institutional Class | | (254,856) |
| Institutional 2 Class | | (16,423) |
| Institutional 3 Class | | (48,186) |
| Class T | | (16) |
| Net realized gains | | |
| Class A | | (999,421) |
| Advisor Class | | (16,158) |
| Class C | | (142,541) |
| Institutional Class | | (436,288) |
| Institutional 2 Class | | (25,504) |
| Institutional 3 Class | | (75,324) |
| Class T | | (38) |
| Total distributions to shareholders (Note 2) | (6,392,559) | (2,441,367) |
| Increase (decrease) in net assets from capital stock activity | (14,903,835) | 2,163,844 |
| Total increase (decrease) in net assets | (21,466,724) | 5,389,005 |
| Net assets at beginning of year | 130,446,193 | 125,057,188 |
| Net assets at end of year | $108,979,469 | $130,446,193 |
| Excess of distributions over net investment income | $(68,808) | $(786,878) |
The accompanying Notes to Financial Statements are an integral part of this statement.
Columbia Greater China Fund | Annual Report 2019
| 15 |
Statement of Changes in Net Assets (continued)
| | Year Ended | Year Ended |
| | August 31, 2019 | August 31, 2018 |
| | Shares | Dollars ($) | Shares | Dollars ($) |
| Capital stock activity |
| Class A | | | | |
| Subscriptions | 293,595 | 13,045,239 | 488,536 | 25,350,672 |
| Distributions reinvested | 84,947 | 3,282,349 | 25,274 | 1,257,391 |
| Redemptions | (466,874) | (20,192,754) | (460,353) | (23,554,912) |
| Net increase (decrease) | (88,332) | (3,865,166) | 53,457 | 3,053,151 |
| Advisor Class | | | | |
| Subscriptions | 110,263 | 5,328,559 | 49,981 | 2,825,421 |
| Distributions reinvested | 2,255 | 97,017 | 464 | 25,473 |
| Redemptions | (130,492) | (6,322,936) | (75,925) | (4,056,287) |
| Net decrease | (17,974) | (897,360) | (25,480) | (1,205,393) |
| Class C | | | | |
| Subscriptions | 19,516 | 782,288 | 67,512 | 3,183,493 |
| Distributions reinvested | 7,589 | 268,361 | 2,943 | 135,746 |
| Redemptions | (92,940) | (3,736,176) | (158,393) | (7,532,398) |
| Net decrease | (65,835) | (2,685,527) | (87,938) | (4,213,159) |
| Institutional Class | | | | |
| Subscriptions | 295,807 | 13,942,662 | 438,459 | 24,336,834 |
| Distributions reinvested | 32,556 | 1,373,839 | 11,538 | 622,116 |
| Redemptions | (523,058) | (24,321,127) | (395,992) | (21,306,306) |
| Net increase (decrease) | (194,695) | (9,004,626) | 54,005 | 3,652,644 |
| Institutional 2 Class | | | | |
| Subscriptions | 40,978 | 2,022,243 | 62,028 | 3,525,467 |
| Distributions reinvested | 3,021 | 130,388 | 761 | 41,868 |
| Redemptions | (28,907) | (1,410,541) | (36,118) | (2,069,011) |
| Net increase | 15,092 | 742,090 | 26,671 | 1,498,324 |
| Institutional 3 Class | | | | |
| Subscriptions | 119,938 | 5,653,638 | 46,467 | 2,552,658 |
| Distributions reinvested | 6,638 | 278,940 | 263 | 14,088 |
| Redemptions | (110,078) | (5,123,412) | (57,187) | (3,188,469) |
| Net increase (decrease) | 16,498 | 809,166 | (10,457) | (621,723) |
| Class T | | | | |
| Redemptions | (57) | (2,412) | — | — |
| Net decrease | (57) | (2,412) | — | — |
| Total net increase (decrease) | (335,303) | (14,903,835) | 10,258 | 2,163,844 |
The accompanying Notes to Financial Statements are an integral part of this statement.
| 16 | Columbia Greater China Fund | Annual Report 2019 |
[THIS PAGE INTENTIONALLY LEFT BLANK]
Columbia Greater China Fund | Annual Report 2019
| 17 |
The following table is intended to help you understand the Fund’s financial performance. Certain information reflects financial results for a single share of a class held for the periods shown. Per share net investment income (loss) amounts are calculated based on average shares outstanding during the period. Total return assumes reinvestment of all dividends and distributions, if any. Total return does not reflect payment of sales charges, if any. Total return and portfolio turnover are not annualized for periods of less than one year. The portfolio turnover rate is calculated without regard to purchase and sales transactions of short-term instruments and certain derivatives, if any. If such transactions were included, the Fund’s portfolio turnover rate may be higher.
| | Net asset value,
beginning of
period | Net
investment
income
(loss) | Net
realized
and
unrealized
gain (loss) | Increase
from
payment
by affiliate | Total from
investment
operations | Distributions
from net
investment
income | Distributions
from net
realized
gains | Total
distributions to
shareholders |
| Class A |
| Year Ended 8/31/2019 | $47.25 | 0.00(c) | 0.20(d) | — | 0.20 | — | (2.45) | (2.45) |
| Year Ended 8/31/2018 | $45.67 | (0.10) | 2.62 | — | 2.52 | (0.28) | (0.66) | (0.94) |
| Year Ended 8/31/2017 | $35.20 | 0.06 | 10.41 | — | 10.47 | — | — | — |
| Year Ended 8/31/2016 | $33.33 | (0.04) | 3.66 | — | 3.62 | (0.05) | (1.70) | (1.75) |
| Year Ended 8/31/2015 | $45.93 | 0.02 | (3.87) | 0.15 | (3.70) | (0.30) | (8.60) | (8.90) |
| Advisor Class |
| Year Ended 8/31/2019 | $52.25 | (0.12) | 0.51(d) | — | 0.39 | — | (2.45) | (2.45) |
| Year Ended 8/31/2018 | $50.38 | 0.12 | 2.80 | — | 2.92 | (0.39) | (0.66) | (1.05) |
| Year Ended 8/31/2017 | $38.74 | 0.18 | 11.46 | — | 11.64 | — | — | — |
| Year Ended 8/31/2016 | $36.53 | 0.11 | 3.96 | — | 4.07 | (0.16) | (1.70) | (1.86) |
| Year Ended 8/31/2015 | $49.47 | 1.09 | (5.18) | 0.16 | (3.93) | (0.41) | (8.60) | (9.01) |
| Class C |
| Year Ended 8/31/2019 | $43.57 | (0.41) | 0.25(d) | — | (0.16) | — | (2.45) | (2.45) |
| Year Ended 8/31/2018 | $42.24 | (0.43) | 2.42 | — | 1.99 | — | (0.66) | (0.66) |
| Year Ended 8/31/2017 | $32.81 | (0.24) | 9.67 | — | 9.43 | — | — | — |
| Year Ended 8/31/2016 | $31.35 | (0.22) | 3.38 | — | 3.16 | — | (1.70) | (1.70) |
| Year Ended 8/31/2015 | $43.71 | (0.28) | (3.62) | 0.14 | (3.76) | — | (8.60) | (8.60) |
| Institutional Class |
| Year Ended 8/31/2019 | $51.30 | 0.08 | 0.30(d) | — | 0.38 | — | (2.45) | (2.45) |
| Year Ended 8/31/2018 | $49.49 | 0.03 | 2.83 | — | 2.86 | (0.39) | (0.66) | (1.05) |
| Year Ended 8/31/2017 | $38.05 | 0.17 | 11.27 | — | 11.44 | — | — | — |
| Year Ended 8/31/2016 | $35.91 | 0.12 | 3.87 | — | 3.99 | (0.15) | (1.70) | (1.85) |
| Year Ended 8/31/2015 | $48.78 | 0.38 | (4.39) | 0.16 | (3.85) | (0.42) | (8.60) | (9.02) |
| Institutional 2 Class |
| Year Ended 8/31/2019 | $52.38 | 0.16 | 0.29(d) | — | 0.45 | — | (2.45) | (2.45) |
| Year Ended 8/31/2018 | $50.52 | 0.11 | 2.84 | — | 2.95 | (0.43) | (0.66) | (1.09) |
| Year Ended 8/31/2017 | $38.80 | 0.22 | 11.50 | — | 11.72 | — | — | — |
| Year Ended 8/31/2016 | $36.58 | 0.24 | 3.90 | — | 4.14 | (0.22) | (1.70) | (1.92) |
| Year Ended 8/31/2015 | $49.52 | 0.52 | (4.54) | 0.16 | (3.86) | (0.48) | (8.60) | (9.08) |
The accompanying Notes to Financial Statements are an integral part of this statement.
| 18 | Columbia Greater China Fund | Annual Report 2019 |
Financial Highlights (continued)
| | Net
asset
value,
end of
period | Total
return | Total gross
expense
ratio to
average
net assets(a) | Total net
expense
ratio to
average
net assets(a),(b) | Net investment
income (loss)
ratio to
average
net assets | Portfolio
turnover | Net
assets,
end of
period
(000’s) |
| Class A |
| Year Ended 8/31/2019 | $45.00 | 1.28% | 1.53%(e) | 1.53%(e) | 0.00%(c) | 18% | $65,762 |
| Year Ended 8/31/2018 | $47.25 | 5.41% | 1.51%(f) | 1.51%(f),(g) | (0.20%) | 26% | $73,210 |
| Year Ended 8/31/2017 | $45.67 | 29.74% | 1.55%(h) | 1.55%(g),(h) | 0.17% | 35% | $68,323 |
| Year Ended 8/31/2016 | $35.20 | 10.97% | 1.60%(f) | 1.60%(f),(g) | (0.11%) | 39% | $58,385 |
| Year Ended 8/31/2015 | $33.33 | (9.49%)(i) | 1.56%(f) | 1.56%(f),(g) | 0.04% | 74% | $63,284 |
| Advisor Class |
| Year Ended 8/31/2019 | $50.19 | 1.53% | 1.29%(e) | 1.29%(e) | (0.23%) | 18% | $1,027 |
| Year Ended 8/31/2018 | $52.25 | 5.69% | 1.26%(f) | 1.26%(f),(g) | 0.22% | 26% | $2,008 |
| Year Ended 8/31/2017 | $50.38 | 30.05% | 1.30%(h) | 1.30%(g),(h) | 0.43% | 35% | $3,220 |
| Year Ended 8/31/2016 | $38.74 | 11.27% | 1.36%(f) | 1.36%(f),(g) | 0.30% | 39% | $3,532 |
| Year Ended 8/31/2015 | $36.53 | (9.26%)(i) | 1.29%(f) | 1.29%(f),(g) | 2.47% | 74% | $2,473 |
| Class C |
| Year Ended 8/31/2019 | $40.96 | 0.53% | 2.28%(e) | 2.28%(e) | (1.02%) | 18% | $2,554 |
| Year Ended 8/31/2018 | $43.57 | 4.63% | 2.26%(f) | 2.26%(f),(g) | (0.90%) | 26% | $5,585 |
| Year Ended 8/31/2017 | $42.24 | 28.74% | 2.29%(h) | 2.29%(g),(h) | (0.70%) | 35% | $9,130 |
| Year Ended 8/31/2016 | $32.81 | 10.15% | 2.36%(f) | 2.36%(f),(g) | (0.71%) | 39% | $10,952 |
| Year Ended 8/31/2015 | $31.35 | (10.16%)(i) | 2.32%(f) | 2.32%(f),(g) | (0.71%) | 74% | $12,103 |
| Institutional Class |
| Year Ended 8/31/2019 | $49.23 | 1.54% | 1.28%(e) | 1.28%(e) | 0.17% | 18% | $31,244 |
| Year Ended 8/31/2018 | $51.30 | 5.68% | 1.26%(f) | 1.26%(f),(g) | 0.05% | 26% | $42,542 |
| Year Ended 8/31/2017 | $49.49 | 30.07% | 1.29%(h) | 1.29%(g),(h) | 0.43% | 35% | $38,369 |
| Year Ended 8/31/2016 | $38.05 | 11.24% | 1.35%(f) | 1.35%(f),(g) | 0.34% | 39% | $40,293 |
| Year Ended 8/31/2015 | $35.91 | (9.24%)(i) | 1.31%(f) | 1.31%(f),(g) | 0.86% | 74% | $49,047 |
| Institutional 2 Class |
| Year Ended 8/31/2019 | $50.38 | 1.65% | 1.20%(e) | 1.20%(e) | 0.32% | 18% | $3,001 |
| Year Ended 8/31/2018 | $52.38 | 5.73% | 1.18%(f) | 1.18%(f) | 0.19% | 26% | $2,330 |
| Year Ended 8/31/2017 | $50.52 | 30.21% | 1.18%(h) | 1.18%(h) | 0.54% | 35% | $900 |
| Year Ended 8/31/2016 | $38.80 | 11.44% | 1.21%(f) | 1.21%(f) | 0.66% | 39% | $879 |
| Year Ended 8/31/2015 | $36.58 | (9.11%)(i) | 1.16%(f) | 1.16%(f) | 1.17% | 74% | $438 |
The accompanying Notes to Financial Statements are an integral part of this statement.
Columbia Greater China Fund | Annual Report 2019
| 19 |
Financial Highlights (continued)
| | Net asset value,
beginning of
period | Net
investment
income
(loss) | Net
realized
and
unrealized
gain (loss) | Increase
from
payment
by affiliate | Total from
investment
operations | Distributions
from net
investment
income | Distributions
from net
realized
gains | Total
distributions to
shareholders |
| Institutional 3 Class |
| Year Ended 8/31/2019 | $51.08 | 0.20 | 0.25(d) | — | 0.45 | — | (2.45) | (2.45) |
| Year Ended 8/31/2018 | $49.25 | 0.09 | 2.83 | — | 2.92 | (0.43) | (0.66) | (1.09) |
| Year Ended 8/31/2017(j) | $38.50 | 0.22 | 10.53 | — | 10.75 | — | — | — |
| Notes to Financial Highlights |
| (a) | In addition to the fees and expenses that the Fund bears directly, the Fund indirectly bears a pro rata share of the fees and expenses of any other funds in which it invests. Such indirect expenses are not included in the Fund’s reported expense ratios. |
| (b) | Total net expenses include the impact of certain fee waivers/expense reimbursements made by the Investment Manager and certain of its affiliates, if applicable. |
| (c) | Rounds to zero. |
| (d) | Calculation of the net gain (loss) per share (both realized and unrealized) does not correlate to the aggregate realized and unrealized gain (loss) presented in the Statement of Operations due to the timing of subscriptions and redemptions of Fund shares in relation to fluctuations in the market value of the portfolio. |
| (e) | Ratios include interfund lending expense which is less than 0.01%. |
| (f) | Ratios include line of credit interest expense which is less than 0.01%. |
| (g) | The benefits derived from expense reductions had an impact of less than 0.01%. |
| (h) | Expenses have been reduced due to a reimbursement of expenses overbilled by a third party. If the reimbursement had been excluded, the expense ratios would have been higher by the percentages shown for each class in the table below. All fee waivers and expense reimbursements by the Investment Manager and its affiliates were applied before giving effect to this third party reimbursement. |
| Year Ended | Class A | Advisor
Class | Class C | Institutional
Class | Institutional 2
Class |
| 08/31/2017 | 0.06% | 0.05% | 0.06% | 0.06% | 0.06% |
| (i) | The Fund received a payment from an affiliate. Had the Fund not received this payment, the total return would have been lower by 0.33%. |
| (j) | Institutional 3 Class shares commenced operations on March 1, 2017. Per share data and total return reflect activity from that date. |
| (k) | Annualized. |
The accompanying Notes to Financial Statements are an integral part of this statement.
| 20 | Columbia Greater China Fund | Annual Report 2019 |
Financial Highlights (continued)
| | Net
asset
value,
end of
period | Total
return | Total gross
expense
ratio to
average
net assets(a) | Total net
expense
ratio to
average
net assets(a),(b) | Net investment
income (loss)
ratio to
average
net assets | Portfolio
turnover | Net
assets,
end of
period
(000’s) |
| Institutional 3 Class |
| Year Ended 8/31/2019 | $49.08 | 1.69% | 1.14%(e) | 1.14%(e) | 0.42% | 18% | $5,391 |
| Year Ended 8/31/2018 | $51.08 | 5.82% | 1.13%(f) | 1.13%(f) | 0.17% | 26% | $4,768 |
| Year Ended 8/31/2017(j) | $49.25 | 27.92% | 1.22%(k) | 1.22%(k) | 1.45%(k) | 35% | $5,112 |
The accompanying Notes to Financial Statements are an integral part of this statement.
Columbia Greater China Fund | Annual Report 2019
| 21 |
Notes to Financial Statements
August 31, 2019
Note 1. Organization
Columbia Greater China Fund (the Fund), a series of Columbia Funds Series Trust I (the Trust), is a non-diversified fund. The Trust is registered under the Investment Company Act of 1940, as amended (the 1940 Act), as an open-end management investment company organized as a Massachusetts business trust.
Fund shares
The Trust may issue an unlimited number of shares (without par value). The Fund offers each of the share classes listed in the Statement of Assets and Liabilities. Although all share classes generally have identical voting, dividend and liquidation rights, each share class votes separately when required by the Trust’s organizational documents or by law. Each share class has its own expense and sales charge structure. Different share classes may have different minimum initial investment amounts and pay different distribution amounts to the extent the expenses of distributing such share classes vary. Distributions to shareholders in a liquidation will be proportional to the net asset value of each share class.
As described in the Fund’s prospectus, Class A and Class C shares are offered to the general public for investment. Advisor Class, Institutional Class, Institutional 2 Class and Institutional 3 Class shares are available for purchase through authorized investment professionals to omnibus retirement plans or to institutional and to certain other investors as also described in the Fund’s prospectus. Class C shares automatically convert to Class A shares after 10 years. Effective December 14, 2018, Class T shares merged, in a tax-free transaction, into Class A shares of the Fund and are no longer offered for sale.
Note 2. Summary of significant accounting policies
Basis of preparation
The Fund is an investment company that applies the accounting and reporting guidance in the Financial Accounting Standards Board (FASB) Accounting Standards Codification Topic 946,Financial Services - Investment Companies (ASC 946). The financial statements are prepared in accordance with U.S. generally accepted accounting principles (GAAP), which requires management to make certain estimates and assumptions that affect the reported amounts of assets and liabilities, the disclosure of contingent assets and liabilities at the date of the financial statements and the reported amounts of income and expenses during the reporting period. Actual results could differ from those estimates.
The following is a summary of significant accounting policies followed by the Fund in the preparation of its financial statements.
Security valuation
All equity securities are valued at the close of business of the New York Stock Exchange. Equity securities are valued at the official closing price on the principal exchange or market on which they trade. Unlisted securities or listed securities for which there were no sales during the day are valued at the mean of the latest quoted bid and ask prices on such exchanges or markets.
Foreign equity securities are valued based on the closing price on the foreign exchange in which such securities are primarily traded. If any foreign equity security closing prices are not readily available, the securities are valued at the mean of the latest quoted bid and ask prices on such exchanges or markets. Foreign currency exchange rates are determined at the scheduled closing time of the New York Stock Exchange. Many securities markets and exchanges outside the U.S. close prior to the close of the New York Stock Exchange; therefore, the closing prices for securities in such markets or on such exchanges may not fully reflect events that occur after such close but before the close of the New York Stock Exchange. In those situations, foreign securities will be fair valued pursuant to a policy adopted by the Board of Trustees. Under the policy, the Fund may utilize a third party pricing service to determine these fair values. The third-party pricing service takes into account multiple factors, including, but not limited to, movements in the U.S. securities markets, certain depositary receipts, futures contracts and foreign exchange rates that have occurred subsequent to the close of the foreign exchange or market, to determine a good faith estimate that reasonably reflects the current market conditions as of the close of the New York Stock Exchange. The fair value of a security is likely to be different from the quoted or published price, if available.
Investments in open-end investment companies, including money market funds, are valued at their latest net asset value.
| 22 | Columbia Greater China Fund | Annual Report 2019 |
Notes to Financial Statements (continued)
August 31, 2019
Investments for which market quotations are not readily available, or that have quotations which management believes are not reflective of market value or reliable, are valued at fair value as determined in good faith under procedures approved by and under the general supervision of the Board of Trustees. If a security or class of securities (such as foreign securities) is valued at fair value, such value is likely to be different from the quoted or published price for the security.
The determination of fair value often requires significant judgment. To determine fair value, management may use assumptions including but not limited to future cash flows and estimated risk premiums. Multiple inputs from various sources may be used to determine fair value.
GAAP requires disclosure regarding the inputs and valuation techniques used to measure fair value and any changes in valuation inputs or techniques. In addition, investments shall be disclosed by major category. This information is disclosed following the Fund’s Portfolio of Investments.
Foreign currency transactions and translations
The values of all assets and liabilities denominated in foreign currencies are generally translated into U.S. dollars at exchange rates determined at the close of regular trading on the New York Stock Exchange. Net realized and unrealized gains (losses) on foreign currency transactions and translations include gains (losses) arising from the fluctuation in exchange rates between trade and settlement dates on securities transactions, gains (losses) arising from the disposition of foreign currency and currency gains (losses) between the accrual and payment dates on dividends, interest income and foreign withholding taxes.
For financial statement purposes, the Fund does not distinguish that portion of gains (losses) on investments which is due to changes in foreign exchange rates from that which is due to changes in market prices of the investments. Such fluctuations are included with the net realized and unrealized gains (losses) on investments in the Statement of Operations.
Security transactions
Security transactions are accounted for on the trade date. Cost is determined and gains (losses) are based upon the specific identification method for both financial statement and federal income tax purposes.
Income recognition
Corporate actions and dividend income are generally recorded net of any non-reclaimable tax withholdings, on the ex-dividend date or upon receipt of ex-dividend notification in the case of certain foreign securities.
Awards from class action litigation are recorded as a reduction of cost basis if the Fund still owns the applicable securities on the payment date. If the Fund no longer owns the applicable securities, the proceeds are recorded as realized gains.
Expenses
General expenses of the Trust are allocated to the Fund and other funds of the Trust based upon relative net assets or other expense allocation methodologies determined by the nature of the expense. Expenses directly attributable to the Fund are charged to the Fund. Expenses directly attributable to a specific class of shares are charged to that share class.
Determination of class net asset value
All income, expenses (other than class-specific expenses, which are charged to that share class, as shown in the Statement of Operations) and realized and unrealized gains (losses) are allocated to each class of the Fund on a daily basis, based on the relative net assets of each class, for purposes of determining the net asset value of each class.
Federal income tax status
The Fund intends to qualify each year as a regulated investment company under Subchapter M of the Internal Revenue Code, as amended, and will distribute substantially all of its investment company taxable income and net capital gain, if any, for its tax year, and as such will not be subject to federal income taxes. In addition, the Fund intends to distribute in each calendar year substantially all of its ordinary income, capital gain net income and certain other amounts, if any, such that the Fund should not be subject to federal excise tax. Therefore, no federal income or excise tax provision is recorded.
Columbia Greater China Fund | Annual Report 2019
| 23 |
Notes to Financial Statements (continued)
August 31, 2019
Foreign taxes
The Fund may be subject to foreign taxes on income, gains on investments or currency repatriation, a portion of which may be recoverable. The Fund will accrue such taxes and recoveries, as applicable, based upon its current interpretation of tax rules and regulations that exist in the markets in which it invests.
Realized gains in certain countries may be subject to foreign taxes at the Fund level, based on statutory rates. The Fund accrues for such foreign taxes on realized and unrealized gains at the appropriate rate for each jurisdiction, as applicable. The amount, if any, is disclosed as a liability on the Statement of Assets and Liabilities.
Distributions to shareholders
Distributions from net investment income, if any, are declared and paid annually. Net realized capital gains, if any, are distributed at least annually. Income distributions and capital gain distributions are determined in accordance with federal income tax regulations, which may differ from GAAP.
Guarantees and indemnifications
Under the Trust’s organizational documents and, in some cases, by contract, its officers and trustees are indemnified against certain liabilities arising out of the performance of their duties to the Trust or its funds. In addition, certain of the Fund’s contracts with its service providers contain general indemnification clauses. The Fund’s maximum exposure under these arrangements is unknown since the amount of any future claims that may be made against the Fund cannot be determined, and the Fund has no historical basis for predicting the likelihood of any such claims.
Recent accounting pronouncements
Accounting Standards Update 2017-08 Premium Amortization on Purchased Callable Debt Securities
In March 2017, the Financial Accounting Standards Board issued Accounting Standards Update (ASU) No. 2017-08 Premium Amortization on Purchased Callable Debt Securities. ASU No. 2017-08 updates the accounting standards to shorten the amortization period for certain purchased callable debt securities, held at a premium, to be amortized to the earliest call date. The update applies to securities with explicit, noncontingent call features that are callable at fixed prices and on preset dates. The standard is effective for annual periods beginning after December 15, 2018 and interim periods within those fiscal years. Management does not expect the implementation of this guidance to have a material impact on the financial statement amounts and footnote disclosures.
Accounting Standards Update 2018-13 Disclosure Framework - Changes to the Disclosure Requirements for Fair Value Measurement
In August 2018, the Financial Accounting Standards Board issued Accounting Standards Update (ASU) No. 2018-13 Disclosure Framework - Changes to the Disclosure Requirements for Fair Value Measurement. The standard is effective for annual periods beginning after December 15, 2019 and interim periods within those fiscal years, with early adoption permitted. After evaluation, management determined to adopt the ASU effective for the period ended August 31, 2019 and all subsequent periods. As a result of the amendments, management implemented disclosure changes which include removal of the amount and reasons for transfers between Level 1 and Level 2 of the fair value hierarchy, removal of the policy for the timing of transfers between levels, removal of the description of the Level 3 valuation processes, as well as modifications to the measurement uncertainty disclosure.
Disclosure Update and Simplification
In September 2018, the Securities and Exchange Commission (SEC) released Final Rule 33-10532, Disclosure Update and Simplification, which amends certain financial statement disclosure requirements that the SEC determined to be redundant, outdated, or superseded in light of other SEC disclosure requirements, GAAP, or changes in the information environment. As a result of the amendments, management implemented disclosure changes which included removing the components of distributable earnings presented on the Statement of Assets and Liabilities and combining income and gain distributions paid to shareholders as presented on the Statement of Changes in Net Assets. Any values presented to meet prior year requirements were left unchanged. The amendments had no effect on the Fund’s net assets or results of operation.
| 24 | Columbia Greater China Fund | Annual Report 2019 |
Notes to Financial Statements (continued)
August 31, 2019
Note 3. Fees and other transactions with affiliates
Management services fees
The Fund has entered into a Management Agreement with Columbia Management Investment Advisers, LLC (the Investment Manager), a wholly-owned subsidiary of Ameriprise Financial, Inc. (Ameriprise Financial). Under the Management Agreement, the Investment Manager provides the Fund with investment research and advice, as well as administrative and accounting services. The management services fee is an annual fee that is equal to a percentage of the Fund’s daily net assets that declines from 0.95% to 0.72% as the Fund’s net assets increase. The effective management services fee rate for the year ended August 31, 2019 was 0.95% of the Fund’s average daily net assets.
Compensation of board members
Members of the Board of Trustees who are not officers or employees of the Investment Manager or Ameriprise Financial are compensated for their services to the Fund as disclosed in the Statement of Operations. These members of the Board of Trustees may participate in a Deferred Compensation Plan (the Deferred Plan) which may be terminated at any time. Obligations of the Deferred Plan will be paid solely out of the Fund’s assets, and all amounts payable under the Deferred Plan constitute a general unsecured obligation of the Fund.
Compensation of Chief Compliance Officer
The Board of Trustees has appointed a Chief Compliance Officer to the Fund in accordance with federal securities regulations. As disclosed in the Statement of Operations, a portion of the Chief Compliance Officer’s total compensation is allocated to the Fund, along with other allocations to affiliated registered investment companies managed by the Investment Manager and its affiliates, based on relative net assets.
Transfer agency fees
Under a Transfer and Dividend Disbursing Agent Agreement, Columbia Management Investment Services Corp. (the Transfer Agent), an affiliate of the Investment Manager and a wholly-owned subsidiary of Ameriprise Financial, is responsible for providing transfer agency services to the Fund. The Transfer Agent has contracted with DST Asset Manager Solutions, Inc. (DST) to serve as sub-transfer agent. The Transfer Agent pays the fees of DST for services as sub-transfer agent and DST is not entitled to reimbursement for such fees from the Fund (with the exception of out-of-pocket fees).
The Fund pays the Transfer Agent a monthly transfer agency fee based on the number or the average value of accounts, depending on the type of account. In addition, the Fund pays the Transfer Agent a fee for shareholder services based on the number of accounts or on a percentage of the average aggregate value of the Fund’s shares maintained in omnibus accounts up to the lesser of the amount charged by the financial intermediary or a cap established by the Board of Trustees from time to time.
The Transfer Agent also receives compensation from the Fund for various shareholder services and reimbursements for certain out-of-pocket fees. Total transfer agency fees for Institutional 2 Class and Institutional 3 Class shares are subject to an annual limitation of not more than 0.07% and 0.02%, respectively, of the average daily net assets attributable to each share class.
For the year ended August 31, 2019, the Fund’s effective transfer agency fee rates as a percentage of average daily net assets of each class were as follows:
| | Effective rate (%) |
| Class A | 0.15 |
| Advisor Class | 0.15 |
| Class C | 0.15 |
| Institutional Class | 0.15 |
| Institutional 2 Class | 0.07 |
| Institutional 3 Class | 0.01 |
| Class T | 0.05(a) |
Columbia Greater China Fund | Annual Report 2019
| 25 |
Notes to Financial Statements (continued)
August 31, 2019
An annual minimum account balance fee of $20 may apply to certain accounts with a value below the applicable share class’s initial minimum investment requirements to reduce the impact of small accounts on transfer agency fees. These minimum account balance fees are remitted to the Fund and recorded as part of expense reductions in the Statement of Operations. For the year ended August 31, 2019, no minimum account balance fees were charged by the Fund.
Distribution and service fees
The Fund has entered into an agreement with Columbia Management Investment Distributors, Inc. (the Distributor), an affiliate of the Investment Manager and a wholly-owned subsidiary of Ameriprise Financial, for distribution and shareholder services. The Board of Trustees has approved, and the Fund has adopted, distribution and shareholder service plans (the Plans) applicable to certain share classes, which set the distribution and service fees for the Fund. These fees are calculated daily and are intended to compensate the Distributor and/or eligible selling and/or servicing agents for selling shares of the Fund and providing services to investors.
Under the Plans, the Fund pays a monthly service fee to the Distributor at the maximum annual rate of 0.25% of the average daily net assets attributable to Class A, Class C and Class T shares of the Fund. Also under the Plans, the Fund pays a monthly distribution fee to the Distributor at the maximum annual rates of 0.75% and 0.25% of the average daily net assets attributable to Class C and Class T shares of the Fund, respectively. As a result of all Class T shares of the Fund being redeemed or converted to Class A shares, December 14, 2018 was the last day the Fund paid a distribution and shareholder services fee for Class T shares.
Although the Fund may have paid a distribution fee up to 0.25% of the Fund’s average daily net assets attributable to Class T shares and a service fee of up to 0.25% of the Fund’s average daily net assets attributable to Class T shares, the aggregate fee shall not exceed 0.25% of the Fund’s average daily net assets attributable to Class T shares.
Sales charges (unaudited)
Sales charges, including front-end charges and contingent deferred sales charges (CDSC), received by the Distributor for distributing Fund shares for the year ended August 31, 2019, if any, are listed below:
| | Front End (%) | CDSC (%) | Amount ($) |
| Class A | 5.75 | 0.50 - 1.00(a) | 56,476 |
| Class C | — | 1.00(b) | 2,327 |
| Class T | 2.50 | — | — |
| (a) | This charge is imposed on certain investments of between $1 million and $50 million redeemed within 18 months after purchase, as follows: 1.00% if redeemed within 12 months after purchase, and 0.50% if redeemed more than 12, but less than 18, months after purchase, with certain limited exceptions. |
| (b) | This charge applies to redemptions within 12 months after purchase, with certain limited exceptions. |
The Fund’s other share classes are not subject to sales charges.
| 26 | Columbia Greater China Fund | Annual Report 2019 |
Notes to Financial Statements (continued)
August 31, 2019
Expenses waived/reimbursed by the Investment Manager and its affiliates
The Investment Manager and certain of its affiliates have contractually agreed to waive fees and/or reimburse expenses (excluding certain fees and expenses described below) for the period(s) disclosed below, unless sooner terminated at the sole discretion of the Board of Trustees, so that the Fund’s net operating expenses, after giving effect to fees waived/expenses reimbursed and any balance credits and/or overdraft charges from the Fund’s custodian, do not exceed the following annual rate(s) as a percentage of the class’ average daily net assets:
| | January 1, 2019
through
December 31, 2019 | Prior to
January 1, 2019 |
| Class A | 1.85% | 1.86% |
| Advisor Class | 1.60 | 1.61 |
| Class C | 2.60 | 2.61 |
| Institutional Class | 1.60 | 1.61 |
| Institutional 2 Class | 1.53 | 1.54 |
| Institutional 3 Class | 1.47 | 1.48 |
Under the agreement governing these fee waivers and/or expense reimbursement arrangements, the following fees and expenses are excluded from the waiver/reimbursement commitment, and therefore will be paid by the Fund, if applicable: taxes (including foreign transaction taxes), expenses associated with investments in affiliated and non-affiliated pooled investment vehicles (including mutual funds and exchange-traded funds), transaction costs and brokerage commissions, costs related to any securities lending program, dividend expenses associated with securities sold short, inverse floater program fees and expenses, transaction charges and interest on borrowed money, interest, infrequent and/or unusual expenses and any other expenses the exclusion of which is specifically approved by the Board of Trustees. This agreement may be modified or amended only with approval from the Investment Manager, certain of its affiliates and the Fund. Any fees waived and/or expenses reimbursed under the expense reimbursement arrangements described above are not recoverable by the Investment Manager or its affiliates in future periods.
Note 4. Federal tax information
The timing and character of income and capital gain distributions are determined in accordance with income tax regulations, which may differ from GAAP because of temporary or permanent book to tax differences.
At August 31, 2019, these differences were primarily due to differing treatment for deferral/reversal of wash sale losses, trustees’ deferred compensation, net operating loss reclassification and foreign currency transactions. To the extent these differences were permanent, reclassifications were made among the components of the Fund’s net assets. Temporary differences do not require reclassifications.
The following reclassifications were made:
Excess of distributions
over net investment
income ($) | Accumulated
net realized
gain ($) | Paid in
capital ($) |
| 674,999 | 15,420 | (690,419) |
Net investment income (loss) and net realized gains (losses), as disclosed in the Statement of Operations, and net assets were not affected by this reclassification.
The tax character of distributions paid during the years indicated was as follows:
| Year Ended August 31, 2019 | Year Ended August 31, 2018 |
Ordinary
income ($) | Long-term
capital gains ($) | Total ($) | Ordinary
income ($) | Long-term
capital gains ($) | Total ($) |
| — | 6,392,559 | 6,392,559 | 746,093 | 1,695,274 | 2,441,367 |
Short-term capital gain distributions, if any, are considered ordinary income distributions for tax purposes.
Columbia Greater China Fund | Annual Report 2019
| 27 |
Notes to Financial Statements (continued)
August 31, 2019
At August 31, 2019, the components of distributable earnings on a tax basis were as follows:
Undistributed
ordinary income ($) | Undistributed
long-term
capital gains ($) | Capital loss
carryforwards ($) | Net unrealized
appreciation ($) |
| — | 1,726,687 | — | 53,857,939 |
At August 31, 2019, the cost of all investments for federal income tax purposes along with the aggregate gross unrealized appreciation and depreciation based on that cost was:
Federal
tax cost ($) | Gross unrealized
appreciation ($) | Gross unrealized
(depreciation) ($) | Net unrealized
appreciation ($) |
| 55,167,370 | 55,992,724 | (2,134,785) | 53,857,939 |
Tax cost of investments and unrealized appreciation/(depreciation) may also include timing differences that do not constitute adjustments to tax basis.
Management of the Fund has concluded that there are no significant uncertain tax positions in the Fund that would require recognition in the financial statements. However, management’s conclusion may be subject to review and adjustment at a later date based on factors including, but not limited to, new tax laws, regulations, and administrative interpretations (including relevant court decisions). Generally, the Fund’s federal tax returns for the prior three fiscal years remain subject to examination by the Internal Revenue Service.
Note 5. Portfolio information
The cost of purchases and proceeds from sales of securities, excluding short-term investments and derivatives, if any, aggregated to $20,707,149 and $36,100,641, respectively, for the year ended August 31, 2019. The amount of purchase and sale activity impacts the portfolio turnover rate reported in the Financial Highlights.
Note 6. Affiliated money market fund
The Fund invests in Columbia Short-Term Cash Fund, an affiliated money market fund established for the exclusive use by the Fund and other affiliated funds (the Affiliated MMF). The income earned by the Fund from such investments is included as Dividends - affiliated issuers in the Statement of Operations. As an investing fund, the Fund indirectly bears its proportionate share of the expenses of the Affiliated MMF. The Affiliated MMF prices its shares with a floating net asset value. In addition, the Board of Trustees of the Affiliated MMF may impose a fee on redemptions (sometimes referred to as a liquidity fee) or temporarily suspend redemptions (sometimes referred to as imposing a redemption gate) in the event its liquidity falls below regulatory limits.
Note 7. Interfund lending
Pursuant to an exemptive order granted by the Securities and Exchange Commission, the Fund participates in a program (the Interfund Program) allowing each participating Columbia Fund (each, a Participating Fund) to lend money directly to and, except for closed-end funds and money market funds, borrow money directly from other Participating Funds for temporary purposes. The amounts eligible for borrowing and lending under the Interfund Program are subject to certain restrictions.
Interfund loans are subject to the risk that the borrowing fund could be unable to repay the loan when due, and a delay in repayment to the lending fund could result in lost opportunities and/or additional lending costs. The exemptive order is subject to conditions intended to mitigate conflicts of interest arising from the Investment Manager’s relationship with each Participating Fund.
The Fund’s activity in the Interfund Program during the year ended August 31, 2019 was as follows:
| Borrower or lender | Average loan
balance ($) | Weighted average
interest rate (%) | Days
outstanding |
| Borrower | 700,000 | 2.95 | 3 |
| 28 | Columbia Greater China Fund | Annual Report 2019 |
Notes to Financial Statements (continued)
August 31, 2019
Interest expense incurred by the Fund is recorded as Interfund lending in the Statement of Operations. The Fund had no outstanding interfund loans at August 31, 2019.
Note 8. Line of credit
The Fund has access to a revolving credit facility with a syndicate of banks led by Citibank, N.A., HSBC Bank USA, N.A. and JPMorgan Chase Bank, N.A. whereby the Fund may borrow for the temporary funding of shareholder redemptions or for other temporary or emergency purposes. The credit facility, which is a collective agreement between the Fund and certain other funds managed by the Investment Manager or an affiliated investment manager, severally and not jointly, permits collective borrowings up to $1 billion. Interest is charged to each participating fund based on its borrowings at a rate equal to the higher of (i) the federal funds effective rate, (ii) the one-month LIBOR rate and (iii) the overnight bank funding rate, plus in each case, 1.00%. Each borrowing under the credit facility matures no later than 60 days after the date of borrowing. The Fund also pays a commitment fee equal to its pro rata share of the unused amount of the credit facility at a rate of 0.15% per annum. The commitment fee is included in other expenses in the Statement of Operations. This agreement expires annually in December unless extended or renewed.
The Fund had no borrowings during the year ended August 31, 2019.
Note 9. Significant risks
Consumer discretionary sector risk
The Fund may be more susceptible to the particular risks that may affect companies in the consumer discretionary sector than if it were invested in a wider variety of companies in unrelated sectors. Companies in the consumer discretionary sector are subject to certain risks, including fluctuations in the performance of the overall domestic and international economy, interest rate changes, increased competition and consumer confidence. Performance of such companies may be affected by factors including reduced disposable household income, reduced consumer spending, changing demographics and consumer tastes.
Foreign securities and emerging market countries risk
Investing in foreign securities may involve certain risks not typically associated with investing in U.S. securities, such as increased currency volatility and risks associated with political, regulatory, economic, social, diplomatic and other conditions or events occurring in the country or region, which may result in significant market volatility. In addition, certain foreign securities may not be as liquid as U.S. securities. Investing in emerging markets may increase these risks and expose the Fund to elevated risks associated with increased inflation, deflation or currency devaluation. To the extent that the Fund concentrates its investment exposure to any one or a few specific countries, the Fund will be particularly susceptible to the risks associated with the conditions, events or other factors impacting those countries or regions and may, therefore, have a greater risk than that of a fund that is more geographically diversified.
Geographic focus risk
The Fund may be particularly susceptible to economic, political, regulatory or other events or conditions affecting issuers and countries within the specific geographic regions in which the Fund invests. Currency devaluations could occur in countries that have not yet experienced currency devaluation to date, or could continue to occur in countries that have already experienced such devaluations. As a result the Fund’s NAV may be more volatile than the NAV of a more geographically diversified fund.
Non-diversification risk
A non-diversified fund is permitted to invest a greater percentage of its total assets in fewer issuers than a diversified fund. This increases the risk that a change in the value of any one investment held by the Fund could affect the overall value of the Fund more than it would affect that of a diversified fund holding a greater number of investments. Accordingly, the Fund’s value will likely be more volatile than the value of a more diversified fund.
Columbia Greater China Fund | Annual Report 2019
| 29 |
Notes to Financial Statements (continued)
August 31, 2019
Shareholder concentration risk
At August 31, 2019, one unaffiliated shareholder of record owned 10.6% of the outstanding shares of the Fund in one or more accounts. The Fund has no knowledge about whether any portion of those shares was owned beneficially. Subscription and redemption activity by concentrated accounts may have a significant effect on the operations of the Fund. In the case of a large redemption, the Fund may be forced to sell investments at inopportune times, including its liquid positions, which may result in Fund losses and the Fund holding a higher percentage of less liquid positions. Large redemptions could result in decreased economies of scale and increased operating expenses for non-redeeming Fund shareholders.
Technology and technology-related investment risk
The Fund may be more susceptible to the particular risks that may affect companies in the information technology sector, as well as other technology-related sectors (collectively, the technology sectors) than if it were invested in a wider variety of companies in unrelated sectors. Companies in the technology sectors are subject to certain risks, including the risk that new services, equipment or technologies will not be accepted by consumers and businesses or will become rapidly obsolete. Performance of such companies may be affected by factors including obtaining and protecting patents (or the failure to do so) and significant competitive pressures, including aggressive pricing of their products or services, new market entrants, competition for market share and short product cycles due to an accelerated rate of technological developments. Such competitive pressures may lead to limited earnings and/or falling profit margins. As a result, the value of their securities may fall or fail to rise. In addition, many technology sector companies have limited operating histories and prices of these companies’ securities historically have been more volatile than other securities, especially over the short term.
Note 10. Subsequent events
Management has evaluated the events and transactions that have occurred through the date the financial statements were issued and noted no items requiring adjustment of the financial statements or additional disclosure.
Note 11. Information regarding pending and settled legal proceedings
Ameriprise Financial and certain of its affiliates have historically been involved in a number of legal, arbitration and regulatory proceedings, including routine litigation, class actions, and governmental actions, concerning matters arising in connection with the conduct of their business activities. Ameriprise Financial believes that the Fund is not currently the subject of, and that neither Ameriprise Financial nor any of its affiliates are the subject of, any pending legal, arbitration or regulatory proceedings that are likely to have a material adverse effect on the Fund or the ability of Ameriprise Financial or its affiliates to perform under their contracts with the Fund. Ameriprise Financial is required to make quarterly (10-Q), annual (10-K) and, as necessary, 8-K filings with the Securities and Exchange Commission (SEC) on legal and regulatory matters that relate to Ameriprise Financial and its affiliates. Copies of these filings may be obtained by accessing the SEC website at www.sec.gov.
There can be no assurance that these matters, or the adverse publicity associated with them, will not result in increased Fund redemptions, reduced sale of Fund shares or other adverse consequences to the Fund. Further, although we believe proceedings are not likely to have a material adverse effect on the Fund or the ability of Ameriprise Financial or its affiliates to perform under their contracts with the Fund, these proceedings are subject to uncertainties and, as such, we are unable to estimate the possible loss or range of loss that may result. An adverse outcome in one or more of these proceedings could result in adverse judgments, settlements, fines, penalties or other relief that could have a material adverse effect on the consolidated financial condition or results of operations of Ameriprise Financial.
| 30 | Columbia Greater China Fund | Annual Report 2019 |
Report of Independent Registered Public Accounting Firm
To the Board of Trustees of Columbia Funds Series Trust I and Shareholders of Columbia Greater China Fund
Opinion on the Financial Statements
We have audited the accompanying statement of assets and liabilities, including the portfolio of investments, of Columbia Greater China Fund (one of the funds constituting Columbia Funds Series Trust I, hereafter referred to as the “Fund”) as of August 31, 2019, the related statement of operations for the year ended August 31, 2019, the statement of changes in net assets for each of the two years in the period ended August 31, 2019, including the related notes, and the financial highlights for each of the periods indicated therein (collectively referred to as the “financial statements”). In our opinion, the financial statements present fairly, in all material respects, the financial position of the Fund as of August 31, 2019, the results of its operations for the year then ended, the changes in its net assets for each of the two years in the period ended August 31, 2019 and the financial highlights for each of the periods indicated therein in conformity with accounting principles generally accepted in the United States of America.
Basis for Opinion
These financial statements are the responsibility of the Fund’s management. Our responsibility is to express an opinion on the Fund’s financial statements based on our audits. We are a public accounting firm registered with the Public Company Accounting Oversight Board (United States) (PCAOB) and are required to be independent with respect to the Fund in accordance with the U.S. federal securities laws and the applicable rules and regulations of the Securities and Exchange Commission and the PCAOB.
We conducted our audits of these financial statements in accordance with the standards of the PCAOB. Those standards require that we plan and perform the audit to obtain reasonable assurance about whether the financial statements are free of material misstatement, whether due to error or fraud.
Our audits included performing procedures to assess the risks of material misstatement of the financial statements, whether due to error or fraud, and performing procedures that respond to those risks. Such procedures included examining, on a test basis, evidence regarding the amounts and disclosures in the financial statements. Our audits also included evaluating the accounting principles used and significant estimates made by management, as well as evaluating the overall presentation of the financial statements. Our procedures included confirmation of securities owned as of August 31, 2019, by correspondence with the custodian and transfer agent. We believe that our audits provide a reasonable basis for our opinion.
/s/PricewaterhouseCoopers LLP
Minneapolis, Minnesota
October 24, 2019
We have served as the auditor of one or more investment companies within the Columbia Funds Complex since 1977.
Columbia Greater China Fund | Annual Report 2019
| 31 |
Federal Income Tax Information
(Unaudited)
The Fund hereby designates the following tax attributes for the fiscal year ended August 31, 2019. Shareholders will be notified in early 2020 of the amounts for use in preparing 2019 income tax returns.
Capital
gain
dividend | Foreign
taxes paid
to foreign
countries | Foreign
taxes paid
per share
to foreign
countries | Foreign
source
income | Foreign
source
income per
share |
| $2,684,811 | $128,387 | $0.05 | $1,786,303 | $0.76 |
Capital gain dividend. The Fund designates as a capital gain dividend the amount reflected above, or if subsequently determined to be different, the net capital gain of such fiscal period.
Foreign taxes. The Fund makes the election to pass through to shareholders the foreign taxes paid. Eligible shareholders may claim a foreign tax credit. These taxes, and the corresponding foreign source income, are provided.
TRUSTEES AND OFFICERS
The Board oversees the Fund’s operations and appoints officers who are responsible for day-to-day business decisions based on policies set by the Board. The following table provides basic biographical information about the Fund’s Trustees as of the printing of this report, including their principal occupations during the past five years, although specific titles for individuals may have varied over the period. The year set forth beneath Length of Service in the table below is the year in which the Trustee was first appointed or elected as Trustee to any Fund currently in the Columbia Funds Complex or a predecessor thereof. Under current Board policy, members serve terms of indefinite duration.
Independent trustees
| Name, address, year of birth | Position held with the Trust and length of service | Principal occupation(s) during the past five years and other relevant professional experience | Number of Funds in the Columbia Fund Complex overseen | Other directorships held by Trustee during the past five years |
Janet Langford Carrig
c/o Columbia Management
Investment Advisers, LLC
225 Franklin Street
Mail Drop BX32 05228
Boston, MA 02110
1957 | Trustee
1996 | Senior Vice President, General Counsel and Corporate Secretary, ConocoPhillips (independent energy company), September 2007-October 2018 | 70 | None |
Douglas A. Hacker
c/o Columbia Management
Investment Advisers, LLC
225 Franklin Street
Mail Drop BX32 05228
Boston, MA 02110
1955 | Trustee and Chairman of the Board
1996 | Independent business executive since May 2006; Executive Vice President — Strategy of United Airlines, December 2002-May 2006; President of UAL Loyalty Services (airline marketing company), September 2001-December 2002; Executive Vice President and Chief Financial Officer of United Airlines, July 1999-September 2001 | 70 | Spartan Nash Company, (food distributor); former Director, Nash Finch Company (food distributor), 2005-2013; Aircastle Limited (aircraft leasing); former Director, SeaCube Container Leasing Ltd. (container leasing), 2010-2013; and Travelport Worldwide Limited (travel information technology) |
Nancy T. Lukitsh
c/o Columbia Management
Investment Advisers, LLC
225 Franklin Street
Mail Drop BX32 05228
Boston, MA 02110
1956 | Trustee
2011 | Senior Vice President, Partner and Director of Marketing, Wellington Management Company, LLP (investment adviser), 1997-2010; Chair, Wellington Management Portfolios (commingled non-U.S. investment pools), 2007-2010; Director, Wellington Trust Company, NA and other Wellington affiliates, 1997-2010 | 70 | None |
| 32 | Columbia Greater China Fund | Annual Report 2019 |
TRUSTEES AND OFFICERS (continued)
Independent trustees (continued)
| Name, address, year of birth | Position held with the Trust and length of service | Principal occupation(s) during the past five years and other relevant professional experience | Number of Funds in the Columbia Fund Complex overseen | Other directorships held by Trustee during the past five years |
David M. Moffett
c/o Columbia Management
Investment Advisers, LLC
225 Franklin Street
Mail Drop BX32 05228
Boston, MA 02110
1952 | Trustee
2011 | Retired. Consultant to Bridgewater and Associates | 70 | Director, CSX Corporation (transportation suppliers); Genworth Financial, Inc. (financial and insurance products and services); PayPal Holdings Inc. (payment and data processing services); Trustee, University of Oklahoma Foundation; former Director, eBay Inc. (online trading community), 2007-2015; and former Director, CIT Bank, CIT Group Inc. (commercial and consumer finance), 2010-2016 |
John J. Neuhauser
c/o Columbia Management
Investment Advisers, LLC
225 Franklin Street
Mail Drop BX32 05228
Boston, MA 02110
1943 | Trustee
1984 | President, Saint Michael’s College, August 2007-June 2018; Director or Trustee of several non-profit organizations, including University of Vermont Medical Center; Academic Vice President and Dean of Faculties, Boston College, August 1999-October 2005; University Professor, Boston College, November 2005-August 2007 | 70 | Liberty All-Star Equity Fund and Liberty All- Star Growth Fund (closed-end funds) |
Patrick J. Simpson
c/o Columbia Management
Investment Advisers, LLC
225 Franklin Street
Mail Drop BX32 05228
Boston, MA 02110
1944 | Trustee
2000 | Of Counsel, Perkins Coie LLP (law firm) since 2015; Partner, Perkins Coie LLP, 1988-2014 | 70 | Former Director, M Fund, Inc. (M Funds mutual fund family), July 2018-July 2019 |
Anne-Lee Verville
c/o Columbia Management
Investment Advisers, LLC
225 Franklin Street
Mail Drop BX32 05228
Boston, MA 02110
1945 | Trustee
1998 | Retired. General Manager, Global Education Industry, 1994-1997, President – Application Systems Division, 1991-1994, Chief Financial Officer – US Marketing & Services, 1988-1991, and Chief Information Officer, 1987-1988, IBM Corporation (computer and technology) | 70 | Former Director, Enesco Group, Inc. (producer of giftware and home and garden decor products), 2001-2006 |
Consultants to the Independent Trustees*
| Name, address, year of birth | Position held with the Trust and length of service | Principal occupation(s) during the past five years and other relevant professional experience | Number of Funds in the Columbia Funds complex overseen | Other directorships held by Trustee during the past five years |
J. Kevin Connaughton
c/o Columbia
Management Investment
Advisers, LLC,
225 Franklin Street
Mail Drop BX32 05228,
Boston, MA 02110
1964 | Independent Trustee Consultant
2016 | Independent Trustee Consultant, Columbia Funds since March 2016; Adjunct Professor of Finance, Bentley University since November 2017; Managing Director and General Manager of Mutual Fund Products, Columbia Management Investment Advisers, LLC, May 2010-February 2015; President, Columbia Funds, 2009-2015; and senior officer of Columbia Funds and affiliated funds, 2003-2015 | 70 | Director, The Autism Project since March 2015; former Trustee, New Century Portfolios, March 2015-December 2017; formerly on Board of Governors, Gateway Healthcare, January 2016 – December 2017 |
Columbia Greater China Fund | Annual Report 2019
| 33 |
TRUSTEES AND OFFICERS (continued)
Consultants to the Independent Trustees* (continued)
| Name, address, year of birth | Position held with the Trust and length of service | Principal occupation(s) during the past five years and other relevant professional experience | Number of Funds in the Columbia Funds complex overseen | Other directorships held by Trustee during the past five years |
Olive Darragh
c/o Columbia
Management Investment
Advisers, LLC,
225 Franklin Street,
Mail Drop BX32 05228,
Boston, MA 02110
1962 | Independent Trustee Consultant 2019 | Independent Trustee Consultant, Columbia Funds since June 2019; Managing Director of Darragh Inc. (a strategy and talent management consulting firm) since 2010; Founder and CEO, Zolio (an investment management talent identification platform) since 2004; Partner, Tudor Investments, 2004-2010; Senior Partner, McKinsey & Company, 2001-2004 | 70 | Director, University of Edinburgh Business School; former Director, Boston Public Library Foundation |
Natalie A. Trunow
c/o Columbia
Management Investment
Advisers, LLC,
225 Franklin Street
Mail Drop BX32 05228,
Boston, MA 02110
1967 | Independent Trustee Consultant
2016 | Independent Trustee Consultant, Columbia Funds since September 2016; Chief Executive Officer, Millennial Portfolio Solutions LLC (asset management and consulting services) since January 2016; Director of Investments, Casey Family Programs, April 2016-September 2016; Senior Vice President and Chief Investment Officer, Calvert Investments, August 2008-January 2016; Section Head and Portfolio Manager, General Motors Asset Management, June 1997-August 2008 | 70 | Director, Health Services for Children with Special Needs, Inc.; Director, Consumer Credit Counseling Services (formerly Guidewell Financial Solutions) |
| * | J. Kevin Connaughton was appointed consultant to the Independent Trustees effective March 1, 2016. Olive Darragh was appointed consultant to the Independent Trustees effective June 10, 2019. Natalie A. Trunow was appointed consultant to the Independent Trustees effective September 1, 2016. Shareholders of the Funds are expected to be asked to elect each of Mr. Connaughton, Ms. Darragh and Ms. Trunow as a Trustee at a future shareholder meeting. |
Interested trustee affiliated with Investment Manager*
| Name, address, year of birth | Position held with the Trust and length of service | Principal occupation(s) during the past five years and other relevant professional experience | Number of Funds in the Columbia Funds Complex overseen | Other directorships held by Trustee during the past five years |
William F. Truscott
c/o Columbia Management
Investment Advisers, LLC
225 Franklin Street
Boston, MA 02110
1960 | Trustee
2012 | Chairman of the Board and President, Columbia Management Investment Advisers, LLC since May 2010 and February 2012, respectively; Chief Executive Officer, Global Asset Management, Ameriprise Financial, Inc. since September 2012 (previously Chief Executive Officer, U.S. Asset Management & President, Annuities, May 2010-September 2012); Director and Chief Executive Officer, Columbia Management Investment Distributors, Inc. since May 2010 and February 2012, respectively; Chairman of the Board and Chief Executive Officer, RiverSource Distributors, Inc. since 2006; Director, Threadneedle Asset Management Holdings, SARL since 2014; President and Chief Executive Officer, Ameriprise Certificate Company, 2006-August 2012 | 192 | Chairman of the Board, Columbia Management Investment Advisers, LLC since May 2010; Director, Columbia Management Investment Distributors, Inc. since May 2010; former Director, Ameriprise Certificate Company, August 2006 - January 2013 |
| * | Interested person (as defined under the 1940 Act) by reason of being an officer, director, security holder and/or employee of the Investment Manager or Ameriprise Financial. |
The Statement of Additional Information has additional information about the Fund’s Board members and is available, without charge, upon request by calling 800.345.6611, visiting columbiathreadneedleus.com/investor/ or contacting your financial intermediary.
| 34 | Columbia Greater China Fund | Annual Report 2019 |
TRUSTEES AND OFFICERS (continued)
The Board has appointed officers who are responsible for day-to-day business decisions based on policies it has established. The officers serve at the pleasure of the Board. The following table provides basic information about the Officers of the Fund as of the printing of this report, including principal occupations during the past five years, although their specific titles may have varied over the period. In addition to Mr. Truscott, who is Senior Vice President, the Fund’s other officers are:
Fund officers
Name,
address and
year of birth | Position and year
first appointed to
position for any Fund
in the Columbia
Funds complex or a
predecessor thereof | Principal occupation(s) during past five years |
Christopher O. Petersen
5228 Ameriprise
Financial Center
Minneapolis, MN 55474
Born 1970 | President and Principal Executive Officer (2015) | Vice President and Lead Chief Counsel, Ameriprise Financial, Inc. since January 2015 (previously Vice President and Chief Counsel, January 2010 - December 2014; officer of Columbia Funds and affiliated funds since 2007. |
Michael G. Clarke
225 Franklin Street
Boston, MA 02110
Born 1969 | Chief Financial Officer (Principal Financial Officer) (2009) and Senior Vice President (2019) | Vice President, Head of North American Operations, and Co-Head of Global Operations, Columbia Management Investment Advisers, LLC, since June 2019 (previously Vice President – Accounting and Tax, May 2010 - May 2019); senior officer of Columbia Funds and affiliated funds since 2002 (previously Treasurer and Chief Accounting Officer, January 2009 - January 2019 and December 2015 - January 2019, respectively). |
Joseph Beranek
5890 Ameriprise
Financial Center
Minneapolis, MN 55474
Born 1965 | Treasurer and Chief Accounting Officer (Principal Accounting Officer) (2019) | Vice President — Mutual Fund Accounting and Financial Reporting, Columbia Management Investment Advisers, LLC, since December 2018 and March 2017, respectively (previously Vice President — Pricing and Corporate Actions, May 2010 - March 2017). |
Paul B. Goucher
485 Lexington Avenue
New York, NY 10017
Born 1968 | Senior Vice President (2011) and Assistant Secretary (2008) | Senior Vice President and Assistant General Counsel, Ameriprise Financial, Inc. since January 2017 (previously Vice President and Lead Chief Counsel, November 2008 - January 2017 and January 2013 - January 2017, respectively); Vice President, Chief Legal Officer and Assistant Secretary, Columbia Management Investment Advisers, LLC since March 2015 (previously Vice President and Assistant Secretary, May 2010 – March 2015). |
Thomas P. McGuire
225 Franklin Street
Boston, MA 02110
Born 1972 | Senior Vice President and Chief Compliance Officer (2012) | Vice President — Asset Management Compliance, Ameriprise Financial, Inc., since May 2010; Chief Compliance Officer, Ameriprise Certificate Company since September 2010. |
Colin Moore
225 Franklin Street
Boston, MA 02110
Born 1958 | Senior Vice President (2010) | Executive Vice President and Global Chief Investment Officer, Ameriprise Financial, Inc., since July 2013; Executive Vice President and Global Chief Investment Officer, Columbia Management Investment Advisers, LLC since July 2013. |
Ryan C. Larrenaga
225 Franklin Street
Boston, MA 02110
Born 1970 | Senior Vice President (2017), Chief Legal Officer (2017), and Secretary (2015) | Vice President and Chief Counsel, Ameriprise Financial, Inc. since August 2018 (previously Vice President and Group Counsel, August 2011 - August 2018); officer of Columbia Funds and affiliated funds since 2005. |
Michael E. DeFao
225 Franklin Street
Boston, MA 02110
Born 1968 | Vice President (2011) and Assistant Secretary (2010) | Vice President and Chief Counsel, Ameriprise Financial, Inc. since May 2010. |
Lyn Kephart-Strong
5228 Ameriprise
Financial Center
Minneapolis, MN 55474
Born 1960 | Vice President (2015) | President, Columbia Management Investment Services Corp. since October 2014; Vice President & Resolution Officer, Ameriprise Trust Company since August 2009. |
Columbia Greater China Fund | Annual Report 2019
| 35 |
Board Consideration and Approval of Management
Agreement
On June 12, 2019, the Board of Trustees (the Board) and the Trustees who are not interested persons (as defined in the Investment Company Act of 1940) (the Independent Trustees) of Columbia Funds Series Trust I (the Trust) unanimously approved the continuation of the Management Agreement (the Management Agreement) with Columbia Management Investment Advisers, LLC (the Investment Manager) with respect to Columbia Greater China Fund (the Fund), a series of the Trust. As detailed below, the Board’s Advisory Fees and Expenses Committee (the Committee) and the Board met on multiple occasions to review and discuss, among themselves, with the management team of the Investment Manager and with an independent fee consultant, materials provided by the Investment Manager, the independent fee consultant and others before determining to approve the continuation of the Management Agreement.
In connection with their deliberations regarding the continuation of the Management Agreement, the Committee and the Board evaluated materials requested from the Investment Manager regarding the Fund and the Management Agreement, and discussed these materials with representatives of the Investment Manager at Committee meetings held on March 5, 2019, April 25, 2019 and June 11, 2019 and at Board meetings held on March 6, 2019 and June 12, 2019. In addition, the Board and its various committees consider matters bearing on the Management Agreement at other meetings throughout the year and in prior years and meet regularly with senior management of the Trust and the Investment Manager. Through the Board’s Investment Oversight Committees, Trustees also meet with selected portfolio managers of the funds the Trustees oversee and with other investment personnel at various times throughout the year. The Committee and the Board also consulted with the independent fee consultant, Fund counsel and the Independent Trustees’ independent legal counsel, who advised on various matters with respect to the Committee’s and the Board’s considerations and otherwise assisted the Committee and the Board in their deliberations. On June 11, 2019, the Committee recommended that the Board approve the continuation of the Management Agreement. On June 12, 2019, the Board, including the Independent Trustees, voting separately, unanimously approved the continuation of the Management Agreement for the Fund.
The Committee and the Board considered all information that they, their legal counsel or the Investment Manager believed reasonably necessary to evaluate and to determine whether to recommend for approval or approve the continuation of the Management Agreement. The information and factors considered by the Committee and the Board in recommending for approval or approving the continuation of the Management Agreement for the Fund included the following:
| • | Information on the investment performance of the Fund relative to the performance of a group of mutual funds determined to be comparable to the Fund by an independent third-party data provider, as well as performance relative to benchmarks; |
| • | Information on the Fund’s management fees and total expenses, including information comparing the Fund’s expenses to those of a group of comparable mutual funds, as determined by the independent third-party data provider; |
| • | The Investment Manager’s agreement to contractually limit or cap total operating expenses for the Fund through December 31, 2020 so that total operating expenses (excluding certain fees and expenses, such as transaction costs and certain other investment related expenses, interest, taxes, acquired fund fees and expenses, and infrequent and/or unusual expenses) would not exceed a specified annual rate, as a percentage of the Fund’s net assets; |
| • | The terms and conditions of the Management Agreement; |
| • | The current and proposed terms and conditions of other agreements and arrangements with affiliates of the Investment Manager relating to the operations of the Fund, including agreements with respect to the provision of distribution, transfer agency and shareholder services to the Fund; |
| • | Descriptions of various functions performed by the Investment Manager under the Management Agreement, including portfolio management and portfolio trading practices; |
| • | Information regarding the management fees of similarly-managed portfolios of other clients of the Investment Manager, including institutional accounts and collective trusts; |
| • | Information regarding the reputation, regulatory history and resources of the Investment Manager, including information regarding senior management, portfolio managers and other personnel; |
| 36 | Columbia Greater China Fund | Annual Report 2019 |
Board Consideration and Approval of Management
Agreement (continued)
| • | Information regarding the capabilities of the Investment Manager with respect to compliance monitoring services, including an assessment of the Investment Manager’s compliance system by the Fund’s Chief Compliance Officer; and |
| • | The profitability to the Investment Manager and its affiliates from their relationships with the Fund. |
Nature, extent and quality of services provided under the Management Agreement
The Committee and the Board considered the nature, extent and quality of services provided to the Fund by the Investment Manager and its affiliates under the Management Agreement and under separate agreements for the provision of transfer agency and shareholder services, and the resources dedicated to the Fund and the other Columbia Funds by the Investment Manager and its affiliates. The Committee and the Board considered, among other things, the Investment Manager’s ability to attract, motivate and retain highly qualified research, advisory and supervisory investment professionals (including compensation programs for personnel involved in fund management, reputation and other attributes), the portfolio management services provided by those investment professionals, and the quality of the Investment Manager’s investment research capabilities and trade execution services. The Committee and the Board also considered the potential benefits to shareholders of investing in a mutual fund that is part of a fund complex offering exposure to a variety of asset classes and investment disciplines and providing a variety of fund and shareholder services.
The Committee and the Board also considered the professional experience and qualifications of the senior personnel of the Investment Manager, which included consideration of the Investment Manager’s experience with funds using an investment strategy similar to that used by the Investment Manager for the Fund. The Committee and the Board noted the compliance programs of and the compliance-related resources provided to the Fund by the Investment Manager and its affiliates and the resources dedicated by the Investment Manager and its affiliates to risk management, and considered the Investment Manager’s ability to provide administrative services to the Fund and coordinate the activities of the Fund’s other service providers. After reviewing these and related factors, the Committee and the Board concluded, within the context of their overall conclusions, that the nature, extent and quality of the services provided to the Fund under the Management Agreement supported the continuation of the Management Agreement.
Investment performance
The Committee and the Board reviewed information about the performance of the Fund over various time periods, including performance information relative to benchmarks, information that compared the performance of the Fund to the performance of a group of comparable mutual funds as determined by the independent third-party data provider, and information and analysis provided by the independent fee consultant. The Committee and the Board also reviewed a description of the third party’s methodology for identifying the Fund’s peer groups for purposes of performance and expense comparisons. Although the Fund’s performance lagged that of a relevant peer group for certain (although not necessarily all) periods, the Committee and the Board concluded that other factors relevant to performance were sufficient, in light of other considerations, to support continuation of the Management Agreement. Those factors included one or more of the following: (i) that the Fund’s performance, although lagging in certain recent periods, was stronger over the longer term; (ii) that the underperformance was attributable, to a significant extent, to investment decisions that were reasonable and consistent with the Fund’s investment strategy and policies and that the Fund was performing within a reasonable range of expectations, given those investment decisions, market conditions and the Fund’s investment strategy; (iii) that the Fund’s performance was competitive when compared to other relevant performance benchmarks or peer groups; and (iv) that the Investment Manager had taken or was taking steps designed to help improve the Fund’s investment performance, including, but not limited to, replacing portfolio managers, enhancing the resources supporting the portfolio managers, or modifying investment strategies.
The Committee and the Board noted that, through December 31, 2018, the Fund’s performance was in the seventy-third, fifty-fifth and twenty-eighth percentile (where the best performance would be in the first percentile) of its category selected by the independent third-party data provider for the purposes of performance comparisons for the one-, three- and five-year periods, respectively.
Columbia Greater China Fund | Annual Report 2019
| 37 |
Board Consideration and Approval of Management
Agreement (continued)
The Committee and the Board also considered the Investment Manager’s performance and reputation generally, the Investment Manager’s historical responsiveness to Board concerns about performance, and the Investment Manager’s willingness to take steps intended to improve performance. After reviewing these and related factors, the Committee and the Board concluded, within the context of their overall conclusions, that the performance of the Fund and the Investment Manager was sufficient, in light of other considerations, to support the continuation of the Management Agreement.
Investment management fee rates and other expenses
The Committee and the Board considered the management fees charged to the Fund under the Management Agreement as well as the total expenses incurred by the Fund. In assessing the reasonableness of the fees under the Management Agreement, the Committee and the Board considered, among other information, the Fund’s total expense ratio as a percentage of average daily net assets. The Committee and the Board considered data provided by the independent third-party data provider and the independent fee consultant. The Committee and the Board noted that, as of December 31, 2018, the Fund’s actual management fee and net total expense ratio were ranked in the third and first quintiles, respectively, (where the lowest fees and expenses would be in the first quintile) against the Fund’s expense universe as determined by the independent third-party data provider for purposes of expense comparison. The Committee and the Board also took into account the fee waiver and expense limitation arrangements agreed to by the Investment Manager, as noted above.
The Committee and the Board also received and considered information about the management fees charged by the Investment Manager to institutional accounts. In considering the fees charged to those accounts, the Committee and the Board took into account, among other things, the Investment Manager’s representations about the differences between managing mutual funds as compared to other types of accounts, including differences in the services provided, differences in the risk profile of such business for the Investment Manager and the additional resources required to manage mutual funds effectively. The Committee and the Board also received and considered information about the fees charged by the Investment Manager for sub-advisory services it provides to comparable unaffiliated funds. In evaluating the Fund’s management fees, the Committee and the Board also took into account the demands, complexity and quality of the investment management of the Fund.
After reviewing these and related factors, the Committee and the Board concluded, within the context of their overall conclusions, that the management fee rates and expenses of the Fund, in light of other considerations, supported the continuation of the Management Agreement.
Costs of services provided and profitability
The Committee and the Board also took note of the costs the Investment Manager and its affiliates incur in connection with the services provided and the profitability to the Investment Manager and its affiliates from their relationships with the Fund, and the efforts undertaken by the Investment Manager and its affiliates to manage efficiently their costs to provide such services.
The Committee and the Board also considered the compensation directly or indirectly received by the Investment Manager’s affiliates in connection with their relationships with the Fund. The Committee and the Board reviewed information provided by management as to the profitability to the Investment Manager and its affiliates of their relationships with the Fund, information about the allocation of expenses used to calculate profitability, and comparisons of profitability levels realized in 2018 to profitability levels realized in 2017. When reviewing profitability, the Committee and the Board also considered court cases in which adviser profitability was an issue in whole or in part, the performance of similarly managed funds, the performance of the Fund, and the expense ratio of the Fund. In addition, the Committee and the Board considered information provided by the Investment Manager regarding the Investment Manager’s financial condition and comparing its profitability to that of other asset management firms that are, or are subsidiaries of, publicly traded companies. In this regard, the Committee and the Board also considered data provided by the independent fee consultant.
After reviewing these and related factors, the Committee and the Board concluded, within the context of their overall conclusions, that the costs of services provided and the profitability to the Investment Manager and its affiliates from their relationships with the Fund supported the continuation of the Management Agreement.
| 38 | Columbia Greater China Fund | Annual Report 2019 |
Board Consideration and Approval of Management
Agreement (continued)
Economies of scale
The Committee and the Board considered the potential existence of economies of scale in the provision by the Investment Manager of services to the Fund, to groups of related funds, and to the Investment Manager’s investment advisory clients as a whole, and whether those economies of scale were shared with the Fund through breakpoints in investment management fees or other means, such as expense limitation arrangements and additional investments by the Investment Manager in investment, trading, compliance and other resources. The Committee and the Board noted that the management fee schedules for the Fund contained breakpoints that would reduce the fee rate on assets above specified threshold levels.
In considering these matters, the Committee and the Board also considered the costs of the services provided and the profitability to the Investment Manager and its affiliates from their relationships with the Fund, as noted above. After reviewing these and related factors, the Committee and the Board concluded, within the context of their overall conclusions, that the extent to which any economies of scale were expected to be shared with the Fund supported the continuation of the Management Agreement.
Other benefits to the Investment Manager
The Committee and the Board received and considered information regarding “fall-out” or ancillary benefits received by the Investment Manager and its affiliates as a result of their relationships with the Fund, such as the engagement of the Investment Manager’s affiliates to provide distribution, transfer agency and shareholder services to the Fund. In this regard, among other matters, the Committee and the Board considered that the Fund’s distributor retains a portion of the distribution fees from the Fund and receives a portion of the sales charges on sales or redemptions of certain classes of shares of the Fund. The Committee and the Board also considered the benefits of research made available to the Investment Manager by reason of brokerage commissions generated by the Fund’s securities transactions, and reviewed information about the Investment Manager’s practices with respect to considering brokerage and research services when allocating portfolio transactions. In this connection, the Board also noted that the amount of research made available to the Investment Manager by reason of brokerage commissions had been declining over time, and may decline further. The Committee and the Board recognized that the Investment Manager’s profitability would be somewhat lower without these benefits.
Conclusion
The Committee and the Board reviewed all of the above considerations in reaching their decisions to recommend or approve the continuation of the Management Agreement. In their deliberations, the Trustees did not identify any particular information that was all-important or controlling, and individual Trustees may have attributed different weights to the various factors. Based on their evaluation of all factors that they deemed to be material, including those factors described above, and assisted by the advice of independent legal counsel, the Board, including the Independent Trustees, voting separately, unanimously approved the continuation of the Management Agreement.
Columbia Greater China Fund | Annual Report 2019
| 39 |
Columbia Greater China Fund
P.O. Box 219104
Kansas City, MO 64121-9104
Please read and consider the investment objectives, risks, charges and expenses for any fund carefully before investing. For a prospectus and summary prospectus, which contains this and other important information about the Fund, go to
columbiathreadneedleus.com/investor/. The Fund is distributed by Columbia Management Investment Distributors, Inc., member FINRA, and managed by Columbia Management Investment Advisers, LLC.
Columbia Threadneedle Investments (Columbia Threadneedle) is the global brand name of the Columbia and Threadneedle group of companies. All rights reserved.
© 2019 Columbia Management Investment Advisers, LLC.
columbiathreadneedleus.com/investor/

Annual Report
August 31, 2019
Columbia Mid Cap Growth Fund
Beginning on January 1, 2021, as permitted by regulations adopted by the Securities and Exchange Commission, paper copies of the Fund’s annual and semiannual shareholder reports like this one will no longer be sent by mail, unless you specifically request paper copies of the reports. Instead, the reports will be made available on the Fund’s website (columbiathreadneedleus.com/investor/), and each time a report is posted you will be notified by mail and provided with a website address to access the report.
If you have already elected to receive shareholder reports electronically, you will not be affected by this change and you need not take any action. You may elect to receive shareholder reports and other communications from the Fund electronically at any time by contacting your financial intermediary (such as a broker-dealer or bank) or, for Fund shares held directly with the Fund, by calling 800.345.6611 or by enrolling in “eDelivery” by logging into your account at columbiathreadneedleus.com/investor/.
You may elect to receive all future reports in paper free of charge. If you invest through a financial intermediary, you can contact your financial intermediary to request that you continue receiving paper copies of your shareholder reports. If you invest directly with the Fund, you can call 800.345.6611 to let the Fund know you wish to continue receiving paper copies of your shareholder reports. Your election to receive paper reports will apply to all Columbia Funds held in your account if you invest through a financial intermediary or all Columbia Funds held with the fund complex if you invest directly with the Fund.
Not FDIC Insured • No bank guarantee • May lose value
Columbia Mid Cap Growth Fund (the Fund) mails one shareholder report to each shareholder address, unless such shareholder elected to receive shareholder reports from the Fund electronically. If you would like more than one report, please call shareholder services at 800.345.6611 and additional reports will be sent to you.
Proxy voting policies and procedures
The policy of the Board of Trustees is to vote the proxies of the companies in which the Fund holds investments consistent with the procedures as stated in the Statement of Additional Information (SAI). You may obtain a copy of the SAI without charge by calling 800.345.6611; contacting your financial intermediary; visiting columbiathreadneedleus.com/investor/; or searching the website of the Securities and Exchange Commission (SEC) at sec.gov. Information regarding how the Fund voted proxies relating to portfolio securities is filed with the SEC by August 31st for the most recent 12-month period ending June 30th of that year, and is available without charge by visiting columbiathreadneedleus.com/investor/, or searching the website of the SEC at sec.gov.
Quarterly schedule of investments
The Fund files a complete schedule of portfolio holdings with the SEC for the first and third quarters of each fiscal year on Form N-PORT, and for reporting periods ended prior to March 31, 2019, on Form N-Q. The Fund’s Form N-Q and Form N-PORT filings are available on the SEC’s website at sec.gov. The Fund’s complete schedule of portfolio holdings, as filed on Form N-Q or Form N-PORT, can also be obtained without charge, upon request, by calling 800.345.6611.
Additional Fund information
For more information about the Fund, please visit columbiathreadneedleus.com/investor/ or call 800.345.6611. Customer Service Representatives are available to answer your questions Monday through Friday from 8 a.m. to 7 p.m. Eastern time.
Fund investment manager
Columbia Management Investment Advisers, LLC (the Investment Manager)
225 Franklin Street
Boston, MA 02110
Fund distributor
Columbia Management Investment Distributors, Inc.
225 Franklin Street
Boston, MA 02110
Fund transfer agent
Columbia Management Investment Services Corp.
P.O. Box 219104
Kansas City, MO 64121-9104
Columbia Mid Cap Growth Fund | Annual Report 2019
Investment objective
The Fund seeks significant capital appreciation by investing, under normal market conditions, at least 80% of its net assets (plus any borrowings for investment purposes) in stocks of companies with a market capitalization, at the time of initial purchase, equal to or less than the largest stock in the Russell Midcap Index.
Portfolio management
Matthew Litfin, CFA
Lead Portfolio Manager
Managed Fund since 2018
Erika Maschmeyer, CFA
Portfolio Manager
Managed Fund since 2018
John Emerson, CFA
Portfolio Manager
Managed Fund since 2018
Morningstar style boxTM
The Morningstar Style Box is based on a fund’s portfolio holdings. For equity funds, the vertical axis shows the market capitalization of the stocks owned, and the horizontal axis shows investment style (value, blend, or growth). Information shown is based on the most recent data provided by Morningstar.
© 2019 Morningstar, Inc. All rights reserved. The Morningstar information contained herein: (1) is proprietary to Morningstar and/or its content providers; (2) may not be copied or distributed; and (3) is not warranted to be accurate, complete or timely. Neither Morningstar nor its content providers are responsible for any damages or losses arising from any use of this information.
| Average annual total returns (%) (for the period ended August 31, 2019) |
| | | Inception | 1 Year | 5 Years | 10 Years |
| Class A | Excluding sales charges | 11/01/02 | 2.78 | 9.17 | 12.79 |
| | Including sales charges | | -3.13 | 7.89 | 12.13 |
| Advisor Class* | 11/08/12 | 3.08 | 9.45 | 13.07 |
| Class C | Excluding sales charges | 10/13/03 | 2.03 | 8.35 | 11.95 |
| | Including sales charges | | 1.26 | 8.35 | 11.95 |
| Institutional Class | 11/20/85 | 3.07 | 9.45 | 13.08 |
| Institutional 2 Class* | 03/07/11 | 3.11 | 9.55 | 13.18 |
| Institutional 3 Class | 07/15/09 | 3.18 | 9.62 | 13.23 |
| Class R | 01/23/06 | 2.56 | 8.90 | 12.51 |
| Class V | Excluding sales charges | 11/01/02 | 2.83 | 9.18 | 12.77 |
| | Including sales charges | | -3.08 | 7.89 | 12.10 |
| Russell Midcap Growth Index | | 5.96 | 10.72 | 14.85 |
| Russell Midcap Index | | 0.54 | 7.94 | 13.48 |
Returns for Class A and Class V shares are shown with and without the maximum initial sales charge of 5.75%. Returns for Class C shares are shown with and without the 1.00% contingent deferred sales charge for the first year only. The Fund’s other share classes are not subject to sales charges and have limited eligibility. Please see the Fund’s prospectus for details. Performance for different share classes will vary based on differences in sales charges and fees associated with each share class. All results shown assume reinvestment of distributions during the period. Returns do not reflect the deduction of taxes that a shareholder may pay on Fund distributions or on the redemption of Fund shares. Performance results reflect the effect of any fee waivers or reimbursements of Fund expenses by Columbia Management Investment Advisers, LLC and/or any of its affiliates. Absent these fee waivers or expense reimbursement arrangements, performance results would have been lower.
The performance information shown represents past performance and is not a guarantee of future results. The investment return and principal value of your investment will fluctuate so that your shares, when redeemed, may be worth more or less than their original cost. Current performance may be lower or higher than the performance information shown. You may obtain performance information current to the most recent month-end by contacting your financial intermediary, visiting columbiathreadneedleus.com/investor/ or calling 800.345.6611.
| * | The returns shown for periods prior to the share class inception date (including returns for the Life of the Fund, if shown, which are since Fund inception) include the returns of the Fund’s oldest share class. These returns are adjusted to reflect any higher class-related operating expenses of the newer share classes, as applicable. Please visit columbiathreadneedleus.com/investor/investment-products/mutual-funds/appended-performance for more information. |
The Russell Midcap Growth Index, an unmanaged index, measures the performance of those Russell Midcap Index companies with higher price-to-book ratios and forecasted growth values.
The Russell Midcap Index, an unmanaged index, measures the performance of the 800 smallest companies in the Russell 1000 Index, which represents approximately 25% of the total market capitalization or the Russell 1000 Index.
Indices are not available for investment, are not professionally managed and do not reflect sales charges, fees, brokerage commissions, taxes or other expenses of investing. Securities in the Fund may not match those in an index.
Columbia Mid Cap Growth Fund | Annual Report 2019
| 3 |
Fund at a Glance (continued)
Performance of a hypothetical $10,000 investment (August 31, 2009 — August 31, 2019)
The chart above shows the change in value of a hypothetical $10,000 investment in Class A shares of Columbia Mid Cap Growth Fund during the stated time period, and does not reflect the deduction of taxes that a shareholder may pay on Fund distributions or on the redemption of Fund shares.
| Top 10 holdings (%) (at August 31, 2019) |
| O’Reilly Automotive, Inc. | 2.5 |
| Aspen Technology, Inc. | 2.4 |
| Booz Allen Hamilton Holdings Corp. | 2.4 |
| Tractor Supply Co. | 2.3 |
| ANSYS, Inc. | 2.3 |
| Teradyne, Inc. | 2.3 |
| IDEXX Laboratories, Inc. | 2.1 |
| Equity LifeStyle Properties, Inc. | 2.1 |
| Toro Co. (The) | 2.0 |
| Churchill Downs, Inc. | 2.0 |
Percentages indicated are based upon total investments excluding Money Market Funds and investments in derivatives, if any.
For further detail about these holdings, please refer to the section entitled “Portfolio of Investments.”
Fund holdings are as of the date given, are subject to change at any time, and are not recommendations to buy or sell any security.
| Portfolio breakdown (%) (at August 31, 2019) |
| Common Stocks | 99.3 |
| Money Market Funds | 0.7 |
| Total | 100.0 |
Percentages indicated are based upon total investments excluding investments in derivatives, if any. The Fund’s portfolio composition is subject to change.
| Equity sector breakdown (%) (at August 31, 2019) |
| Communication Services | 3.6 |
| Consumer Discretionary | 21.0 |
| Consumer Staples | 1.5 |
| Energy | 0.8 |
| Financials | 4.4 |
| Health Care | 17.5 |
| Industrials | 16.8 |
| Information Technology | 30.7 |
| Materials | 1.6 |
| Real Estate | 2.1 |
| Total | 100.0 |
Percentages indicated are based upon total equity investments. The Fund’s portfolio composition is subject to change.
| 4 | Columbia Mid Cap Growth Fund | Annual Report 2019 |
Manager Discussion of Fund Performance
For the 12-month period ended August 31, 2019, the Fund’s Class A shares returned 2.78% excluding sales charges. During the same period, the Fund underperformed its benchmark, the Russell Midcap Growth Index, which returned 5.96%, and outperformed the broader based Russell Midcap Index, which returned 0.54%. The Fund’s sector positioning represented the largest overall detractor from performance during the period as overweights to health care and energy and an underweight to information technology weighed on returns. Stock selection within industrials, consumer discretionary and information technology contributed positively to performance.
Trade tensions and Fed statements drove the markets
During the 12 months ended August 31, 2019, domestic stocks managed positive returns despite significant volatility along the way. After registering solid gains in September 2018, stocks reversed course in early October when remarks by U.S. Federal Reserve (Fed) Chair Jerome Powell seemed to indicate that the Fed would continue to aggressively tighten monetary policy despite slowing global growth. Fed officials immediately sought to reassure investors, but stocks nevertheless declined sharply. Cyclical stocks sold off and investors looked for more defensive “safe havens” in various sectors of financial markets, including consumer staples, health care and utilities stocks. Entering 2019, the Fed pivoted sharply, indicating that economic weakness arising in part from trade tensions with China called for a relaxation of policy, including a pause in rate hikes. As a result, stocks essentially regained the ground lost in late 2018. However, stocks turned sharply lower in May on reignited concerns about the U.S./China trade dispute against an already fragile global growth backdrop. The market then rebounded in June as the Fed indicated it was prepared to cut rates if necessary to offset the impact of higher tariffs on growth. Sentiment was also supported by the view that corporate earnings growth, while slowing considerably from its 2018 pace, was unlikely to slip into negative territory. As the period drew to a close, investors continued to focus on U.S./China trade tensions, uncertainty over Brexit (the U.K.’s exit from the European Union), an emerging geopolitical crisis in the Middle East and a generally slowing global economy. During a protracted period of uncertainty about global trade, many companies have had to focus their energies on adjusting to tariffs and severe disruptions of pre-existing manufacturing supply chains.
Contributors and detractors
During the period, the Fund’s sector positioning represented the largest overall detractor from performance, as overweights to health care and energy and an underweight to information technology weighed on returns. Overall stock selection also was negative. While selection was strong within industrials, consumer discretionary and information technology, this was offset by unfavorable selection in financials, energy and communication services.
In terms of individual holdings, the Fund’s position in leading cardiac medical device firm Abiomed was the largest detractor from performance during the period. Known for its flagship Impella heart pump, Abiomed has faced slower than expected growth and a more modest earnings outlook. We are currently reassessing Abiomed’s growth prospects. In addition, holdings in the medical device company Align Technology, a manufacturer of 3D digital scanners and clear aligners used in orthodontics, detracted on investor concerns surrounding increased competition. We thought that these concerns were overdone, and viewed Align as attractively valued, with significant revenue and earnings growth prospects over the next several years. Finally, holdings in SVB Financial Group, a U.S.-based high-tech commercial bank, detracted due to SVB’s earnings were negatively affected by recent short-term rate declines. We believed that the stock’s valuation underplayed the bank’s competitive advantages, along with its ability to grow alongside early-stage U.S. technology companies. We continued to the hold the stock.
Conversely, holdings in the software and engineering services company Cadence Design Systems added to both absolute and relative returns. Cadence has been acquiring market share in the growing electronic design automation market. The company has also exhibited high profit margins and stable high-single-digit revenue growth. Another positive contributor was single-family homebuilder NVR. NVR’s centralized manufacturing model has led to attractive returns and a lower risk profile compared with its peers. Positive contributions within information technology were also highlighted by consulting firm Booz Allen Hamilton. As a government contractor with high earnings visibility, the company was viewed by investors as largely insulated from any fallout deriving from the U.S.-China trade war.
Columbia Mid Cap Growth Fund | Annual Report 2019
| 5 |
Manager Discussion of Fund Performance (continued)
At period’s end
Regardless of short-term market conditions, our investment process is based on bottom-up fundamental analysis of individual companies and on constructing an optimal portfolio of high-quality growth stocks. At the same time, we monitor macroeconomic conditions and take likely scenarios into account around the margins in managing the Fund. While the Treasury yield curve has become inverted along much of its length, we believe that the economy may be poised for slower but still positive growth. On balance, the Fund was positioned at period’s end for slow, steady growth, while reflecting an awareness of the risks posed by trade wars to certain segments and companies.
The Fund’s sector weights are largely the result of individual stock selection. We believe that our investment philosophy, which favors higher quality and structural growth based on such factors as return on invested capital, revenue and earnings growth, and debt ratios, is well suited for this uncertain environment.
Market risk may affect a single issuer, sector of the economy, industry or the market as a whole.Growth securities, at times, may not perform as well as value securities or the stock market in general and may be out of favor with investors.Foreigninvestments subject the Fund to risks, including political, economic, market, social and others within a particular country, as well as to currency instabilities and less stringent financial and accounting standards generally applicable to U.S. issuers. Investments inmid-cap companies involve risks and volatility greater than investments in larger, more established companies. The Fund may invest significantly in issuers within a particularsector, which may be negatively affected by market, economic or other conditions, making the Fund more vulnerable to unfavorable developments in the sector. See the Fund’s prospectus for more information on these and other risks.
The views expressed in this report reflect the current views of the respective parties. These views are not guarantees of future performance and involve certain risks, uncertainties and assumptions that are difficult to predict, so actual outcomes and results may differ significantly from the views expressed. These views are subject to change at any time based upon economic, market or other conditions and the respective parties disclaim any responsibility to update such views. These views may not be relied on as investment advice and, because investment decisions for a Columbia fund are based on numerous factors, may not be relied on as an indication of trading intent on behalf of any particular Columbia fund. References to specific securities should not be construed as a recommendation or investment advice.
| 6 | Columbia Mid Cap Growth Fund | Annual Report 2019 |
Understanding Your Fund’s Expenses
(Unaudited)
As an investor, you incur two types of costs. There are shareholder transaction costs, which generally include sales charges on purchases and may include redemption fees. There are also ongoing fund costs, which generally include management fees, distribution and/or service fees, and other fund expenses. The following information is intended to help you understand your ongoing costs (in dollars) of investing in the Fund and to help you compare these costs with the ongoing costs of investing in other mutual funds.
Analyzing your Fund’s expenses
To illustrate these ongoing costs, we have provided examples and calculated the expenses paid by investors in each share class of the Fund during the period. The actual and hypothetical information in the table is based on an initial investment of $1,000 at the beginning of the period indicated and held for the entire period. Expense information is calculated two ways and each method provides you with different information. The amount listed in the “Actual” column is calculated using the Fund’s actual operating expenses and total return for the period. You may use the Actual information, together with the amount invested, to estimate the expenses that you paid over the period. Simply divide your account value by $1,000 (for example, an $8,600 account value divided by $1,000 = 8.6), then multiply the results by the expenses paid during the period under the “Actual” column. The amount listed in the “Hypothetical” column assumes a 5% annual rate of return before expenses (which is not the Fund’s actual return) and then applies the Fund’s actual expense ratio for the period to the hypothetical return. You should not use the hypothetical account values and expenses to estimate either your actual account balance at the end of the period or the expenses you paid during the period. See “Compare with other funds” below for details on how to use the hypothetical data.
Compare with other funds
Since all mutual funds are required to include the same hypothetical calculations about expenses in shareholder reports, you can use this information to compare the ongoing cost of investing in the Fund with other funds. To do so, compare the hypothetical example with the 5% hypothetical examples that appear in the shareholder reports of other funds. As you compare hypothetical examples of other funds, it is important to note that hypothetical examples are meant to highlight the ongoing costs of investing in a fund only and do not reflect any transaction costs, such as sales charges, or redemption or exchange fees. Therefore, the hypothetical calculations are useful in comparing ongoing costs only, and will not help you determine the relative total costs of owning different funds. If transaction costs were included in these calculations, your costs would be higher.
| March 1, 2019 — August 31, 2019 |
| | Account value at the
beginning of the
period ($) | Account value at the
end of the
period ($) | Expenses paid during
the period ($) | Fund’s annualized
expense ratio (%) |
| | Actual | Hypothetical | Actual | Hypothetical | Actual | Hypothetical | Actual |
| Class A | 1,000.00 | 1,000.00 | 1,063.00 | 1,019.25 | 6.00 | 5.87 | 1.16 |
| Advisor Class | 1,000.00 | 1,000.00 | 1,064.40 | 1,020.51 | 4.71 | 4.61 | 0.91 |
| Class C | 1,000.00 | 1,000.00 | 1,059.00 | 1,015.49 | 9.86 | 9.65 | 1.91 |
| Institutional Class | 1,000.00 | 1,000.00 | 1,064.30 | 1,020.51 | 4.71 | 4.61 | 0.91 |
| Institutional 2 Class | 1,000.00 | 1,000.00 | 1,064.50 | 1,020.86 | 4.35 | 4.26 | 0.84 |
| Institutional 3 Class | 1,000.00 | 1,000.00 | 1,064.90 | 1,021.11 | 4.09 | 4.00 | 0.79 |
| Class R | 1,000.00 | 1,000.00 | 1,061.60 | 1,018.00 | 7.29 | 7.13 | 1.41 |
| Class V | 1,000.00 | 1,000.00 | 1,063.40 | 1,019.25 | 6.00 | 5.87 | 1.16 |
Expenses paid during the period are equal to the annualized expense ratio for each class as indicated above, multiplied by the average account value over the period and then multiplied by the number of days in the Fund’s most recent fiscal half year and divided by 365.
Expenses do not include fees and expenses incurred indirectly by the Fund from its investment in underlying funds, including affiliated and non-affiliated pooled investment vehicles, such as mutual funds and exchange-traded funds.
Columbia Mid Cap Growth Fund | Annual Report 2019
| 7 |
Portfolio of Investments
August 31, 2019
(Percentages represent value of investments compared to net assets)
Investments in securities
| Common Stocks 99.4% |
| Issuer | Shares | Value ($) |
| Communication Services 3.6% |
| Entertainment 3.6% |
| Live Nation Entertainment, Inc.(a) | 352,695 | 24,515,829 |
| Madison Square Garden Co. (The), Class A(a) | 76,390 | 19,275,489 |
| Zynga, Inc., Class A(a) | 2,830,000 | 16,159,300 |
| Total | | 59,950,618 |
| Total Communication Services | 59,950,618 |
| Consumer Discretionary 20.9% |
| Distributors 1.5% |
| Pool Corp. | 129,310 | 25,393,898 |
| Diversified Consumer Services 1.9% |
| Grand Canyon Education, Inc.(a) | 244,500 | 30,709,200 |
| Hotels, Restaurants & Leisure 8.7% |
| Chipotle Mexican Grill, Inc.(a) | 37,300 | 31,273,066 |
| Choice Hotels International, Inc. | 313,484 | 28,520,774 |
| Churchill Downs, Inc. | 268,815 | 33,134,137 |
| Domino’s Pizza, Inc. | 136,238 | 30,904,228 |
| Texas Roadhouse, Inc. | 407,200 | 20,954,512 |
| Total | | 144,786,717 |
| Household Durables 1.6% |
| NVR, Inc.(a) | 7,140 | 25,696,860 |
| Internet & Direct Marketing Retail 1.0% |
| Wayfair, Inc., Class A(a) | 146,100 | 16,471,314 |
| Specialty Retail 6.2% |
| O’Reilly Automotive, Inc.(a) | 109,579 | 42,052,037 |
| Tractor Supply Co. | 375,767 | 38,283,142 |
| Ulta Beauty, Inc.(a) | 98,009 | 23,299,680 |
| Total | | 103,634,859 |
| Total Consumer Discretionary | 346,692,848 |
| Consumer Staples 1.5% |
| Food Products 1.5% |
| Lamb Weston Holdings, Inc. | 357,200 | 25,143,308 |
| Total Consumer Staples | 25,143,308 |
| Common Stocks (continued) |
| Issuer | Shares | Value ($) |
| Energy 0.8% |
| Energy Equipment & Services 0.8% |
| Helmerich & Payne, Inc. | 353,000 | 13,269,270 |
| Total Energy | 13,269,270 |
| Financials 4.4% |
| Banks 1.7% |
| SVB Financial Group(a) | 147,300 | 28,667,526 |
| Capital Markets 1.7% |
| Raymond James Financial, Inc. | 363,737 | 28,556,992 |
| Consumer Finance 1.0% |
| Synchrony Financial | 497,000 | 15,928,850 |
| Total Financials | 73,153,368 |
| Health Care 17.3% |
| Biotechnology 3.9% |
| Exact Sciences Corp.(a) | 217,054 | 25,877,178 |
| Sarepta Therapeutics, Inc.(a) | 175,352 | 15,807,983 |
| Seattle Genetics, Inc.(a) | 320,084 | 23,250,901 |
| Total | | 64,936,062 |
| Health Care Equipment & Supplies 8.0% |
| ABIOMED, Inc.(a) | 100,900 | 19,480,763 |
| Align Technology, Inc.(a) | 76,678 | 14,040,509 |
| IDEXX Laboratories, Inc.(a) | 119,721 | 34,687,962 |
| ResMed, Inc. | 169,986 | 23,679,050 |
| STERIS PLC | 116,627 | 18,007,209 |
| Varian Medical Systems, Inc.(a) | 209,288 | 22,169,878 |
| Total | | 132,065,371 |
| Health Care Providers & Services 2.7% |
| Encompass Health Corp. | 448,709 | 27,277,020 |
| Laboratory Corp. of America Holdings(a) | 109,654 | 18,373,624 |
| Total | | 45,650,644 |
| Life Sciences Tools & Services 2.7% |
| Mettler-Toledo International, Inc.(a) | 35,710 | 23,453,971 |
| Pra Health Sciences, Inc.(a) | 217,000 | 21,448,280 |
| Total | | 44,902,251 |
| Total Health Care | 287,554,328 |
The accompanying Notes to Financial Statements are an integral part of this statement.
| 8 | Columbia Mid Cap Growth Fund | Annual Report 2019 |
Portfolio of Investments (continued)
August 31, 2019
| Common Stocks (continued) |
| Issuer | Shares | Value ($) |
| Industrials 16.7% |
| Aerospace & Defense 1.5% |
| BWX Technologies, Inc. | 426,984 | 25,277,453 |
| Building Products 2.7% |
| Allegion PLC | 167,000 | 16,077,090 |
| Lennox International, Inc. | 114,785 | 29,130,137 |
| Total | | 45,207,227 |
| Commercial Services & Supplies 4.8% |
| Cintas Corp. | 73,240 | 19,320,712 |
| Copart, Inc.(a) | 388,011 | 29,252,149 |
| Rollins, Inc. | 926,999 | 30,414,837 |
| Total | | 78,987,698 |
| Machinery 4.8% |
| Donaldson Co., Inc. | 512,070 | 24,763,705 |
| IDEX Corp. | 122,000 | 20,094,620 |
| Toro Co. (The) | 470,855 | 33,906,269 |
| Total | | 78,764,594 |
| Professional Services 1.2% |
| CoStar Group, Inc.(a) | 31,049 | 19,091,099 |
| Road & Rail 1.7% |
| Old Dominion Freight Line, Inc. | 177,000 | 28,985,520 |
| Total Industrials | 276,313,591 |
| Information Technology 30.5% |
| Electronic Equipment, Instruments & Components 1.9% |
| CDW Corp. | 271,712 | 31,382,736 |
| IT Services 11.2% |
| Black Knight, Inc.(a) | 270,000 | 16,807,500 |
| Booz Allen Hamilton Holdings Corp. | 523,805 | 39,552,515 |
| EPAM Systems, Inc.(a) | 151,500 | 28,986,495 |
| Gartner, Inc.(a) | 221,116 | 29,556,576 |
| GoDaddy, Inc., Class A(a) | 513,265 | 32,510,205 |
| Jack Henry & Associates, Inc. | 121,800 | 17,656,128 |
| WEX, Inc.(a) | 98,569 | 20,162,289 |
| Total | | 185,231,708 |
| Common Stocks (continued) |
| Issuer | Shares | Value ($) |
| Semiconductors & Semiconductor Equipment 5.4% |
| Advanced Micro Devices, Inc.(a) | 1,000,000 | 31,450,000 |
| Lam Research Corp. | 99,294 | 20,902,380 |
| Teradyne, Inc. | 703,469 | 37,262,753 |
| Total | | 89,615,133 |
| Software 12.0% |
| Alteryx, Inc., Class A(a) | 227,000 | 32,336,150 |
| ANSYS, Inc.(a) | 185,026 | 38,218,971 |
| Aspen Technology, Inc.(a) | 297,549 | 39,633,527 |
| Cadence Design Systems, Inc.(a) | 236,998 | 16,229,623 |
| Guidewire Software, Inc.(a) | 185,046 | 17,797,724 |
| ServiceNow, Inc.(a) | 111,477 | 29,189,138 |
| Tyler Technologies, Inc.(a) | 98,749 | 25,333,068 |
| Total | | 198,738,201 |
| Total Information Technology | 504,967,778 |
| Materials 1.6% |
| Chemicals 1.6% |
| Celanese Corp., Class A | 236,670 | 26,831,278 |
| Total Materials | 26,831,278 |
| Real Estate 2.1% |
| Equity Real Estate Investment Trusts (REITS) 2.1% |
| Equity LifeStyle Properties, Inc. | 251,947 | 33,942,300 |
| Total Real Estate | 33,942,300 |
Total Common Stocks
(Cost $1,398,136,357) | 1,647,818,687 |
|
| Money Market Funds 0.7% |
| | Shares | Value ($) |
| Columbia Short-Term Cash Fund, 2.208%(b),(c) | 11,703,100 | 11,701,929 |
Total Money Market Funds
(Cost $11,701,929) | 11,701,929 |
Total Investments in Securities
(Cost: $1,409,838,286) | 1,659,520,616 |
| Other Assets & Liabilities, Net | | (1,107,336) |
| Net Assets | 1,658,413,280 |
The accompanying Notes to Financial Statements are an integral part of this statement.
Columbia Mid Cap Growth Fund | Annual Report 2019
| 9 |
Portfolio of Investments (continued)
August 31, 2019
Notes to Portfolio of Investments
| (a) | Non-income producing investment. |
| (b) | The rate shown is the seven-day current annualized yield at August 31, 2019. |
| (c) | As defined in the Investment Company Act of 1940, an affiliated company is one in which the Fund owns 5% or more of the company’s outstanding voting securities, or a company which is under common ownership or control with the Fund. Holdings and transactions in these affiliated companies during the year ended August 31, 2019 are as follows: |
| Issuer | Beginning
shares | Shares
purchased | Shares
sold | Ending
shares | Realized gain
(loss) —
affiliated
issuers ($) | Net change in
unrealized
appreciation
(depreciation) —
affiliated
issuers ($) | Dividends —
affiliated
issuers ($) | Value —
affiliated
issuers
at end of
period ($) |
| Columbia Short-Term Cash Fund, 2.208% |
| | 19,029,731 | 649,435,985 | (656,762,616) | 11,703,100 | 2,647 | — | 611,427 | 11,701,929 |
Fair value measurements
The Fund categorizes its fair value measurements according to a three-level hierarchy that maximizes the use of observable inputs and minimizes the use of unobservable inputs by prioritizing that the most observable input be used when available. Observable inputs are those that market participants would use in pricing an investment based on market data obtained from sources independent of the reporting entity. Unobservable inputs are those that reflect the Fund’s assumptions about the information market participants would use in pricing an investment. An investment’s level within the fair value hierarchy is based on the lowest level of any input that is deemed significant to the asset’s or liability’s fair value measurement. The input levels are not necessarily an indication of the risk or liquidity associated with investments at that level. For example, certain U.S. government securities are generally high quality and liquid, however, they are reflected as Level 2 because the inputs used to determine fair value may not always be quoted prices in an active market.
Fair value inputs are summarized in the three broad levels listed below:
| ■ | Level 1 — Valuations based on quoted prices for investments in active markets that the Fund has the ability to access at the measurement date. Valuation adjustments are not applied to Level 1 investments. |
| ■ | Level 2 — Valuations based on other significant observable inputs (including quoted prices for similar securities, interest rates, prepayment speeds, credit risks, etc.). |
| ■ | Level 3 — Valuations based on significant unobservable inputs (including the Fund’s own assumptions and judgment in determining the fair value of investments). |
Inputs that are used in determining fair value of an investment may include price information, credit data, volatility statistics, and other factors. These inputs can be either observable or unobservable. The availability of observable inputs can vary between investments, and is affected by various factors such as the type of investment, and the volume and level of activity for that investment or similar investments in the marketplace. The inputs will be considered by the Investment Manager, along with any other relevant factors in the calculation of an investment’s fair value. The Fund uses prices and inputs that are current as of the measurement date, which may include periods of market dislocations. During these periods, the availability of prices and inputs may be reduced for many investments. This condition could cause an investment to be reclassified between the various levels within the hierarchy.
Investments falling into the Level 3 category are primarily supported by quoted prices from brokers and dealers participating in the market for those investments. However, these may be classified as Level 3 investments due to lack of market transparency and corroboration to support these quoted prices. Additionally, valuation models may be used as the pricing source for any remaining investments classified as Level 3. These models may rely on one or more significant unobservable inputs and/or significant assumptions by the Investment Manager. Inputs used in valuations may include, but are not limited to, financial statement analysis, capital account balances, discount rates and estimated cash flows, and comparable company data.
Under the direction of the Fund’s Board of Trustees (the Board), the Investment Manager’s Valuation Committee (the Committee) is responsible for overseeing the valuation procedures approved by the Board. The Committee consists of voting and non-voting members from various groups within the Investment Manager’s organization, including operations and accounting, trading and investments, compliance, risk management and legal.
The Committee meets at least monthly to review and approve valuation matters, which may include a description of specific valuation determinations, data regarding pricing information received from approved pricing vendors and brokers and the results of Board-approved valuation control policies and procedures (the Policies). The Policies address, among other things, instances when market quotations are or are not readily available, including recommendations of third party pricing vendors and a determination of appropriate pricing methodologies; events that require specific valuation determinations and assessment of fair value techniques; securities with a potential for stale pricing, including those that are illiquid, restricted, or in default; and the effectiveness of third party pricing vendors, including periodic reviews of vendors. The Committee meets more frequently, as needed, to discuss additional valuation matters, which may include the need to review back-testing results, review time-sensitive information or approve related valuation actions. The Committee reports to the Board, with members of the Committee meeting with the Board at each of its regularly scheduled meetings to discuss valuation matters and actions during the period, similar to those described earlier.
The following table is a summary of the inputs used to value the Fund’s investments at August 31, 2019:
| | Level 1 ($) | Level 2 ($) | Level 3 ($) | Total ($) |
| Investments in Securities | | | | |
| Common Stocks | | | | |
| Communication Services | 59,950,618 | — | — | 59,950,618 |
| Consumer Discretionary | 346,692,848 | — | — | 346,692,848 |
| Consumer Staples | 25,143,308 | — | — | 25,143,308 |
| Energy | 13,269,270 | — | — | 13,269,270 |
| Financials | 73,153,368 | — | — | 73,153,368 |
| Health Care | 287,554,328 | — | — | 287,554,328 |
The accompanying Notes to Financial Statements are an integral part of this statement.
| 10 | Columbia Mid Cap Growth Fund | Annual Report 2019 |
Portfolio of Investments (continued)
August 31, 2019
Fair value measurements (continued)
| | Level 1 ($) | Level 2 ($) | Level 3 ($) | Total ($) |
| Industrials | 276,313,591 | — | — | 276,313,591 |
| Information Technology | 504,967,778 | — | — | 504,967,778 |
| Materials | 26,831,278 | — | — | 26,831,278 |
| Real Estate | 33,942,300 | — | — | 33,942,300 |
| Total Common Stocks | 1,647,818,687 | — | — | 1,647,818,687 |
| Money Market Funds | 11,701,929 | — | — | 11,701,929 |
| Total Investments in Securities | 1,659,520,616 | — | — | 1,659,520,616 |
See the Portfolio of Investments for all investment classifications not indicated in the table.
The accompanying Notes to Financial Statements are an integral part of this statement.
Columbia Mid Cap Growth Fund | Annual Report 2019
| 11 |
Statement of Assets and Liabilities
August 31, 2019
| Assets | |
| Investments in securities, at value | |
| Unaffiliated issuers (cost $1,398,136,357) | $1,647,818,687 |
| Affiliated issuers (cost $11,701,929) | 11,701,929 |
| Receivable for: | |
| Capital shares sold | 185,739 |
| Dividends | 759,265 |
| Prepaid expenses | 11,139 |
| Trustees’ deferred compensation plan | 192,171 |
| Other assets | 2,199 |
| Total assets | 1,660,671,129 |
| Liabilities | |
| Payable for: | |
| Capital shares purchased | 1,730,299 |
| Management services fees | 34,783 |
| Distribution and/or service fees | 6,258 |
| Transfer agent fees | 168,677 |
| Compensation of board members | 51,620 |
| Compensation of chief compliance officer | 112 |
| Other expenses | 73,929 |
| Trustees’ deferred compensation plan | 192,171 |
| Total liabilities | 2,257,849 |
| Net assets applicable to outstanding capital stock | $1,658,413,280 |
| Represented by | |
| Paid in capital | 1,282,102,664 |
| Total distributable earnings (loss) (Note 2) | 376,310,616 |
| Total - representing net assets applicable to outstanding capital stock | $1,658,413,280 |
The accompanying Notes to Financial Statements are an integral part of this statement.
| 12 | Columbia Mid Cap Growth Fund | Annual Report 2019 |
Statement of Assets and Liabilities (continued)
August 31, 2019
| Class A | |
| Net assets | $810,160,844 |
| Shares outstanding | 34,559,933 |
| Net asset value per share | $23.44 |
| Maximum sales charge | 5.75% |
| Maximum offering price per share (calculated by dividing the net asset value per share by 1.0 minus the maximum sales charge for Class A shares) | $24.87 |
| Advisor Class | |
| Net assets | $17,075,450 |
| Shares outstanding | 646,147 |
| Net asset value per share | $26.43 |
| Class C | |
| Net assets | $12,862,528 |
| Shares outstanding | 695,970 |
| Net asset value per share | $18.48 |
| Institutional Class | |
| Net assets | $652,042,813 |
| Shares outstanding | 25,584,509 |
| Net asset value per share | $25.49 |
| Institutional 2 Class | |
| Net assets | $46,284,428 |
| Shares outstanding | 1,797,331 |
| Net asset value per share | $25.75 |
| Institutional 3 Class | |
| Net assets | $86,115,483 |
| Shares outstanding | 3,341,993 |
| Net asset value per share | $25.77 |
| Class R | |
| Net assets | $10,592,697 |
| Shares outstanding | 476,810 |
| Net asset value per share | $22.22 |
| Class V | |
| Net assets | $23,279,037 |
| Shares outstanding | 997,997 |
| Net asset value per share | $23.33 |
| Maximum sales charge | 5.75% |
| Maximum offering price per share (calculated by dividing the net asset value per share by 1.0 minus the maximum sales charge for Class V shares) | $24.75 |
The accompanying Notes to Financial Statements are an integral part of this statement.
Columbia Mid Cap Growth Fund | Annual Report 2019
| 13 |
Statement of Operations
Year Ended August 31, 2019
| Net investment income | |
| Income: | |
| Dividends — unaffiliated issuers | $14,005,244 |
| Dividends — affiliated issuers | 611,427 |
| Foreign taxes withheld | (14,102) |
| Total income | 14,602,569 |
| Expenses: | |
| Management services fees | 12,857,303 |
| Distribution and/or service fees | |
| Class A | 2,049,948 |
| Class C | 145,644 |
| Class R | 56,277 |
| Class T | 52 |
| Class V | 57,714 |
| Transfer agent fees | |
| Class A | 1,072,153 |
| Advisor Class | 20,088 |
| Class C | 19,101 |
| Institutional Class | 875,097 |
| Institutional 2 Class | 25,895 |
| Institutional 3 Class | 7,379 |
| Class R | 14,742 |
| Class T | 28 |
| Class V | 30,172 |
| Compensation of board members | 40,477 |
| Custodian fees | 17,868 |
| Printing and postage fees | 118,530 |
| Registration fees | 144,644 |
| Audit fees | 29,000 |
| Legal fees | 34,460 |
| Compensation of chief compliance officer | 674 |
| Other | 66,440 |
| Total expenses | 17,683,686 |
| Net investment loss | (3,081,117) |
| Realized and unrealized gain (loss) — net | |
| Net realized gain (loss) on: | |
| Investments — unaffiliated issuers | 132,173,378 |
| Investments — affiliated issuers | 2,647 |
| Net realized gain | 132,176,025 |
| Net change in unrealized appreciation (depreciation) on: | |
| Investments — unaffiliated issuers | (100,472,666) |
| Net change in unrealized appreciation (depreciation) | (100,472,666) |
| Net realized and unrealized gain | 31,703,359 |
| Net increase in net assets resulting from operations | $28,622,242 |
The accompanying Notes to Financial Statements are an integral part of this statement.
| 14 | Columbia Mid Cap Growth Fund | Annual Report 2019 |
Statement of Changes in Net Assets
| | Year Ended
August 31, 2019 | Year Ended
August 31, 2018 |
| Operations | | |
| Net investment loss | $(3,081,117) | $(5,002,069) |
| Net realized gain | 132,176,025 | 387,294,251 |
| Net change in unrealized appreciation (depreciation) | (100,472,666) | (2,096,912) |
| Net increase in net assets resulting from operations | 28,622,242 | 380,195,270 |
| Distributions to shareholders | | |
| Net investment income and net realized gains | | |
| Class A | (166,912,970) | |
| Advisor Class | (2,634,235) | |
| Class C | (3,657,183) | |
| Institutional Class | (130,195,142) | |
| Institutional 2 Class | (8,351,752) | |
| Institutional 3 Class | (21,319,046) | |
| Class R | (2,476,579) | |
| Class T | (12,685) | |
| Class V | (4,632,188) | |
| Net realized gains | | |
| Class A | | (105,220,136) |
| Advisor Class | | (4,507,137) |
| Class C | | (5,722,872) |
| Institutional Class | | (82,635,824) |
| Institutional 2 Class | | (6,394,483) |
| Institutional 3 Class | | (18,192,893) |
| Class K | | (48,940) |
| Class R | | (1,655,980) |
| Class T | | (16,630) |
| Class V | | (2,907,267) |
| Total distributions to shareholders (Note 2) | (340,191,780) | (227,302,162) |
| Increase (decrease) in net assets from capital stock activity | 32,140,604 | (40,756,164) |
| Total increase (decrease) in net assets | (279,428,934) | 112,136,944 |
| Net assets at beginning of year | 1,937,842,214 | 1,825,705,270 |
| Net assets at end of year | $1,658,413,280 | $1,937,842,214 |
| Excess of distributions over net investment income | $(3,094,291) | $(216,816) |
The accompanying Notes to Financial Statements are an integral part of this statement.
Columbia Mid Cap Growth Fund | Annual Report 2019
| 15 |
Statement of Changes in Net Assets (continued)
| | Year Ended | Year Ended |
| | August 31, 2019 | August 31, 2018 |
| | Shares | Dollars ($) | Shares | Dollars ($) |
| Capital stock activity |
| Class A | | | | |
| Subscriptions | 1,406,230 | 31,603,643 | 1,910,223 | 52,520,354 |
| Distributions reinvested | 7,814,810 | 160,125,449 | 4,044,479 | 100,950,198 |
| Redemptions | (6,673,931) | (152,377,661) | (4,953,334) | (133,269,622) |
| Net increase | 2,547,109 | 39,351,431 | 1,001,368 | 20,200,930 |
| Advisor Class | | | | |
| Subscriptions | 377,704 | 9,546,375 | 454,467 | 13,424,077 |
| Distributions reinvested | 36,178 | 834,258 | 139,602 | 3,826,498 |
| Redemptions | (256,104) | (6,667,558) | (1,317,881) | (40,333,359) |
| Net increase (decrease) | 157,778 | 3,713,075 | (723,812) | (23,082,784) |
| Class C | | | | |
| Subscriptions | 117,659 | 2,202,100 | 140,699 | 3,189,968 |
| Distributions reinvested | 211,520 | 3,437,201 | 265,314 | 5,542,415 |
| Redemptions | (360,826) | (6,643,757) | (1,469,074) | (34,096,662) |
| Net decrease | (31,647) | (1,004,456) | (1,063,061) | (25,364,279) |
| Institutional Class | | | | |
| Subscriptions | 1,214,017 | 30,336,834 | 1,047,744 | 30,091,638 |
| Distributions reinvested | 5,464,026 | 121,519,951 | 2,875,772 | 76,553,065 |
| Redemptions | (5,717,714) | (141,093,517) | (3,139,551) | (90,275,444) |
| Net increase | 960,329 | 10,763,268 | 783,965 | 16,369,259 |
| Institutional 2 Class | | | | |
| Subscriptions | 352,459 | 8,653,527 | 319,028 | 9,203,476 |
| Distributions reinvested | 371,831 | 8,351,315 | 238,412 | 6,394,196 |
| Redemptions | (498,062) | (12,227,828) | (765,851) | (22,045,765) |
| Net increase (decrease) | 226,228 | 4,777,014 | (208,411) | (6,448,093) |
| Institutional 3 Class | | | | |
| Subscriptions | 365,215 | 8,926,511 | 378,819 | 10,762,862 |
| Distributions reinvested | 169,327 | 3,804,787 | 76,819 | 2,060,281 |
| Redemptions | (1,561,347) | (39,614,073) | (1,153,614) | (33,061,314) |
| Net decrease | (1,026,805) | (26,882,775) | (697,976) | (20,238,171) |
| Class K | | | | |
| Subscriptions | — | — | 362 | 10,225 |
| Distributions reinvested | — | — | 1,832 | 48,646 |
| Redemptions | — | — | (15,939) | (457,104) |
| Net decrease | — | — | (13,745) | (398,233) |
| Class R | | | | |
| Subscriptions | 163,014 | 3,573,731 | 134,778 | 3,410,677 |
| Distributions reinvested | 70,303 | 1,368,098 | 35,729 | 856,409 |
| Redemptions | (241,836) | (5,306,084) | (276,570) | (7,270,777) |
| Net decrease | (8,519) | (364,255) | (106,063) | (3,003,691) |
| Class T | | | | |
| Distributions reinvested | 598 | 12,245 | 655 | 16,346 |
| Redemptions | (3,713) | (78,794) | (2,442) | (62,892) |
| Net decrease | (3,115) | (66,549) | (1,787) | (46,546) |
| Class V | | | | |
| Subscriptions | 26,525 | 548,841 | 30,854 | 827,255 |
| Distributions reinvested | 194,536 | 3,966,600 | 100,223 | 2,491,545 |
| Redemptions | (113,437) | (2,661,590) | (76,862) | (2,063,356) |
| Net increase | 107,624 | 1,853,851 | 54,215 | 1,255,444 |
| Total net increase (decrease) | 2,928,982 | 32,140,604 | (975,307) | (40,756,164) |
The accompanying Notes to Financial Statements are an integral part of this statement.
| 16 | Columbia Mid Cap Growth Fund | Annual Report 2019 |
[THIS PAGE INTENTIONALLY LEFT BLANK]
Columbia Mid Cap Growth Fund | Annual Report 2019
| 17 |
The following table is intended to help you understand the Fund’s financial performance. Certain information reflects financial results for a single share of a class held for the periods shown. Per share net investment income (loss) amounts are calculated based on average shares outstanding during the period. Total return assumes reinvestment of all dividends and distributions, if any. Total return does not reflect payment of sales charges, if any. Total return and portfolio turnover are not annualized for periods of less than one year. The portfolio turnover rate is calculated without regard to purchase and sales transactions of short-term instruments and certain derivatives, if any. If such transactions were included, the Fund’s portfolio turnover rate may be higher.
| | Net asset value,
beginning of
period | Net
investment
income
(loss) | Net
realized
and
unrealized
gain (loss) | Total from
investment
operations | Distributions
from net
investment
income | Distributions
from net
realized
gains | Total
distributions to
shareholders |
| Class A |
| Year Ended 8/31/2019 | $28.83 | (0.07) | 0.09 | 0.02 | — | (5.41) | (5.41) |
| Year Ended 8/31/2018 | $26.90 | (0.10) | 5.54 | 5.44 | — | (3.51) | (3.51) |
| Year Ended 8/31/2017 | $25.09 | (0.09) | 3.42 | 3.33 | — | (1.52) | (1.52) |
| Year Ended 8/31/2016 | $28.69 | (0.06) | 0.84 | 0.78 | (0.26) | (4.12) | (4.38) |
| Year Ended 8/31/2015 | $32.14 | 0.25(d) | 1.29 | 1.54 | — | (4.99) | (4.99) |
| Advisor Class |
| Year Ended 8/31/2019 | $31.71 | (0.02) | 0.20 | 0.18 | — | (5.46) | (5.46) |
| Year Ended 8/31/2018 | $29.26 | (0.05) | 6.07 | 6.02 | — | (3.57) | (3.57) |
| Year Ended 8/31/2017 | $27.12 | (0.03) | 3.71 | 3.68 | — | (1.54) | (1.54) |
| Year Ended 8/31/2016 | $30.67 | 0.00(e) | 0.91 | 0.91 | (0.34) | (4.12) | (4.46) |
| Year Ended 8/31/2015 | $33.99 | 1.93(d) | (0.21)(f) | 1.72 | — | (5.04) | (5.04) |
| Class C |
| Year Ended 8/31/2019 | $23.99 | (0.20) | (0.04)(f) | (0.24) | — | (5.27) | (5.27) |
| Year Ended 8/31/2018 | $22.91 | (0.26) | 4.64 | 4.38 | — | (3.30) | (3.30) |
| Year Ended 8/31/2017 | $21.70 | (0.24) | 2.93 | 2.69 | — | (1.48) | (1.48) |
| Year Ended 8/31/2016 | $25.34 | (0.21) | 0.72 | 0.51 | (0.03) | (4.12) | (4.15) |
| Year Ended 8/31/2015 | $28.99 | 0.03(d) | 1.15 | 1.18 | — | (4.83) | (4.83) |
| Institutional Class |
| Year Ended 8/31/2019 | $30.80 | (0.01) | 0.16 | 0.15 | — | (5.46) | (5.46) |
| Year Ended 8/31/2018 | $28.52 | (0.04) | 5.89 | 5.85 | — | (3.57) | (3.57) |
| Year Ended 8/31/2017 | $26.46 | (0.03) | 3.63 | 3.60 | — | (1.54) | (1.54) |
| Year Ended 8/31/2016 | $30.03 | 0.01 | 0.87 | 0.88 | (0.33) | (4.12) | (4.45) |
| Year Ended 8/31/2015 | $33.39 | 0.32(d) | 1.36 | 1.68 | — | (5.04) | (5.04) |
| Institutional 2 Class |
| Year Ended 8/31/2019 | $31.06 | 0.00(e) | 0.16 | 0.16 | — | (5.47) | (5.47) |
| Year Ended 8/31/2018 | $28.73 | (0.02) | 5.95 | 5.93 | — | (3.60) | (3.60) |
| Year Ended 8/31/2017 | $26.63 | (0.00)(e) | 3.65 | 3.65 | — | (1.55) | (1.55) |
| Year Ended 8/31/2016 | $30.20 | 0.04 | 0.88 | 0.92 | (0.37) | (4.12) | (4.49) |
| Year Ended 8/31/2015 | $33.54 | 0.40(d) | 1.33 | 1.73 | — | (5.07) | (5.07) |
The accompanying Notes to Financial Statements are an integral part of this statement.
| 18 | Columbia Mid Cap Growth Fund | Annual Report 2019 |
Financial Highlights (continued)
| | Net
asset
value,
end of
period | Total
return | Total gross
expense
ratio to
average
net assets(a) | Total net
expense
ratio to
average
net assets(a),(b) | Net investment
income (loss)
ratio to
average
net assets | Portfolio
turnover | Net
assets,
end of
period
(000’s) |
| Class A |
| Year Ended 8/31/2019 | $23.44 | 2.78% | 1.17% | 1.17% | (0.31%) | 89% | $810,161 |
| Year Ended 8/31/2018 | $28.83 | 22.23% | 1.16% | 1.16%(c) | (0.38%) | 140% | $922,862 |
| Year Ended 8/31/2017 | $26.90 | 13.97% | 1.19% | 1.19%(c) | (0.37%) | 119% | $834,347 |
| Year Ended 8/31/2016 | $25.09 | 2.83% | 1.19% | 1.19%(c) | (0.23%) | 130% | $880,155 |
| Year Ended 8/31/2015 | $28.69 | 5.33% | 1.19% | 1.19%(c) | 0.83% | 101% | $948,826 |
| Advisor Class |
| Year Ended 8/31/2019 | $26.43 | 3.08% | 0.92% | 0.92% | (0.06%) | 89% | $17,075 |
| Year Ended 8/31/2018 | $31.71 | 22.50% | 0.91% | 0.91%(c) | (0.16%) | 140% | $15,488 |
| Year Ended 8/31/2017 | $29.26 | 14.24% | 0.94% | 0.94%(c) | (0.11%) | 119% | $35,473 |
| Year Ended 8/31/2016 | $27.12 | 3.10% | 0.94% | 0.94%(c) | 0.02% | 130% | $26,945 |
| Year Ended 8/31/2015 | $30.67 | 5.61% | 0.93% | 0.93%(c) | 6.10% | 101% | $26,912 |
| Class C |
| Year Ended 8/31/2019 | $18.48 | 2.03% | 1.92% | 1.92% | (1.05%) | 89% | $12,863 |
| Year Ended 8/31/2018 | $23.99 | 21.27% | 1.91% | 1.91%(c) | (1.15%) | 140% | $17,458 |
| Year Ended 8/31/2017 | $22.91 | 13.12% | 1.94% | 1.94%(c) | (1.12%) | 119% | $41,030 |
| Year Ended 8/31/2016 | $21.70 | 2.05% | 1.94% | 1.94%(c) | (0.98%) | 130% | $46,355 |
| Year Ended 8/31/2015 | $25.34 | 4.56% | 1.94% | 1.94%(c) | 0.11% | 101% | $51,859 |
| Institutional Class |
| Year Ended 8/31/2019 | $25.49 | 3.07% | 0.92% | 0.92% | (0.05%) | 89% | $652,043 |
| Year Ended 8/31/2018 | $30.80 | 22.49% | 0.91% | 0.91%(c) | (0.13%) | 140% | $758,444 |
| Year Ended 8/31/2017 | $28.52 | 14.29% | 0.94% | 0.94%(c) | (0.12%) | 119% | $679,866 |
| Year Ended 8/31/2016 | $26.46 | 3.09% | 0.94% | 0.94%(c) | 0.02% | 130% | $813,009 |
| Year Ended 8/31/2015 | $30.03 | 5.58% | 0.94% | 0.94%(c) | 1.01% | 101% | $938,781 |
| Institutional 2 Class |
| Year Ended 8/31/2019 | $25.75 | 3.11% | 0.84% | 0.84% | 0.02% | 89% | $46,284 |
| Year Ended 8/31/2018 | $31.06 | 22.60% | 0.83% | 0.83% | (0.06%) | 140% | $48,792 |
| Year Ended 8/31/2017 | $28.73 | 14.40% | 0.84% | 0.84% | (0.01%) | 119% | $51,118 |
| Year Ended 8/31/2016 | $26.63 | 3.21% | 0.83% | 0.83% | 0.14% | 130% | $36,964 |
| Year Ended 8/31/2015 | $30.20 | 5.72% | 0.82% | 0.82% | 1.28% | 101% | $37,589 |
The accompanying Notes to Financial Statements are an integral part of this statement.
Columbia Mid Cap Growth Fund | Annual Report 2019
| 19 |
Financial Highlights (continued)
| | Net asset value,
beginning of
period | Net
investment
income
(loss) | Net
realized
and
unrealized
gain (loss) | Total from
investment
operations | Distributions
from net
investment
income | Distributions
from net
realized
gains | Total
distributions to
shareholders |
| Institutional 3 Class |
| Year Ended 8/31/2019 | $31.07 | 0.02 | 0.16 | 0.18 | — | (5.48) | (5.48) |
| Year Ended 8/31/2018 | $28.74 | (0.00)(e) | 5.94 | 5.94 | — | (3.61) | (3.61) |
| Year Ended 8/31/2017 | $26.63 | 0.03 | 3.63 | 3.66 | — | (1.55) | (1.55) |
| Year Ended 8/31/2016 | $30.21 | 0.03 | 0.91 | 0.94 | (0.40) | (4.12) | (4.52) |
| Year Ended 8/31/2015 | $33.53 | 0.05(d) | 1.71 | 1.76 | — | (5.08) | (5.08) |
| Class R |
| Year Ended 8/31/2019 | $27.64 | (0.12) | 0.07 | (0.05) | — | (5.37) | (5.37) |
| Year Ended 8/31/2018 | $25.93 | (0.16) | 5.31 | 5.15 | — | (3.44) | (3.44) |
| Year Ended 8/31/2017 | $24.27 | (0.15) | 3.31 | 3.16 | — | (1.50) | (1.50) |
| Year Ended 8/31/2016 | $27.88 | (0.12) | 0.81 | 0.69 | (0.18) | (4.12) | (4.30) |
| Year Ended 8/31/2015 | $31.39 | 0.15(d) | 1.28 | 1.43 | — | (4.94) | (4.94) |
| Class V |
| Year Ended 8/31/2019 | $28.71 | (0.07) | 0.10 | 0.03 | — | (5.41) | (5.41) |
| Year Ended 8/31/2018 | $26.81 | (0.10) | 5.51 | 5.41 | — | (3.51) | (3.51) |
| Year Ended 8/31/2017 | $25.01 | (0.09) | 3.41 | 3.32 | — | (1.52) | (1.52) |
| Year Ended 8/31/2016 | $28.61 | (0.06) | 0.83 | 0.77 | (0.25) | (4.12) | (4.37) |
| Year Ended 8/31/2015 | $32.05 | 0.24(d) | 1.30 | 1.54 | — | (4.98) | (4.98) |
| Notes to Financial Highlights |
| (a) | In addition to the fees and expenses that the Fund bears directly, the Fund indirectly bears a pro rata share of the fees and expenses of any other funds in which it invests. Such indirect expenses are not included in the Fund’s reported expense ratios. |
| (b) | Total net expenses include the impact of certain fee waivers/expense reimbursements made by the Investment Manager and certain of its affiliates, if applicable. |
| (c) | The benefits derived from expense reductions had an impact of less than 0.01%. |
| (d) | Net investment income per share includes special dividends. The per share effect of these dividends amounted to: |
| Year Ended | Class A | Advisor
Class | Class C | Institutional
Class | Institutional 2
Class | Institutional 3
Class | Class R | Class V |
| 08/31/2015 | $0.35 | $2.00 | $0.32 | $0.34 | $0.39 | $0.04 | $0.32 | $0.34 |
| (e) | Rounds to zero. |
| (f) | Calculation of the net gain (loss) per share (both realized and unrealized) does not correlate to the aggregate realized and unrealized gain (loss) presented in the Statement of Operations due to the timing of subscriptions and redemptions of Fund shares in relation to fluctuations in the market value of the portfolio. |
The accompanying Notes to Financial Statements are an integral part of this statement.
| 20 | Columbia Mid Cap Growth Fund | Annual Report 2019 |
Financial Highlights (continued)
| | Net
asset
value,
end of
period | Total
return | Total gross
expense
ratio to
average
net assets(a) | Total net
expense
ratio to
average
net assets(a),(b) | Net investment
income (loss)
ratio to
average
net assets | Portfolio
turnover | Net
assets,
end of
period
(000’s) |
| Institutional 3 Class |
| Year Ended 8/31/2019 | $25.77 | 3.18% | 0.79% | 0.79% | 0.08% | 89% | $86,115 |
| Year Ended 8/31/2018 | $31.07 | 22.66% | 0.78% | 0.78% | (0.01%) | 140% | $135,728 |
| Year Ended 8/31/2017 | $28.74 | 14.45% | 0.79% | 0.79% | 0.11% | 119% | $145,597 |
| Year Ended 8/31/2016 | $26.63 | 3.27% | 0.79% | 0.79% | 0.13% | 130% | $5,869 |
| Year Ended 8/31/2015 | $30.21 | 5.83% | 0.73% | 0.73% | 0.15% | 101% | $3 |
| Class R |
| Year Ended 8/31/2019 | $22.22 | 2.56% | 1.42% | 1.42% | (0.55%) | 89% | $10,593 |
| Year Ended 8/31/2018 | $27.64 | 21.89% | 1.41% | 1.41%(c) | (0.63%) | 140% | $13,414 |
| Year Ended 8/31/2017 | $25.93 | 13.71% | 1.44% | 1.44%(c) | (0.62%) | 119% | $15,333 |
| Year Ended 8/31/2016 | $24.27 | 2.58% | 1.44% | 1.44%(c) | (0.48%) | 130% | $16,796 |
| Year Ended 8/31/2015 | $27.88 | 5.06% | 1.44% | 1.44%(c) | 0.52% | 101% | $18,965 |
| Class V |
| Year Ended 8/31/2019 | $23.33 | 2.83% | 1.17% | 1.17% | (0.31%) | 89% | $23,279 |
| Year Ended 8/31/2018 | $28.71 | 22.19% | 1.16% | 1.16%(c) | (0.37%) | 140% | $25,566 |
| Year Ended 8/31/2017 | $26.81 | 13.97% | 1.19% | 1.19%(c) | (0.36%) | 119% | $22,419 |
| Year Ended 8/31/2016 | $25.01 | 2.83% | 1.19% | 1.19%(c) | (0.23%) | 130% | $21,346 |
| Year Ended 8/31/2015 | $28.61 | 5.34% | 1.20% | 1.20%(c) | 0.80% | 101% | $22,590 |
The accompanying Notes to Financial Statements are an integral part of this statement.
Columbia Mid Cap Growth Fund | Annual Report 2019
| 21 |
Notes to Financial Statements
August 31, 2019
Note 1. Organization
Columbia Mid Cap Growth Fund (the Fund), a series of Columbia Funds Series Trust I (the Trust), is a diversified fund. The Trust is registered under the Investment Company Act of 1940, as amended (the 1940 Act), as an open-end management investment company organized as a Massachusetts business trust.
Fund shares
The Trust may issue an unlimited number of shares (without par value). The Fund offers each of the share classes listed in the Statement of Assets and Liabilities. Although all share classes generally have identical voting, dividend and liquidation rights, each share class votes separately when required by the Trust’s organizational documents or by law. Each share class has its own expense and sales charge structure. Different share classes may have different minimum initial investment amounts and pay different distribution amounts to the extent the expenses of distributing such share classes vary. Distributions to shareholders in a liquidation will be proportional to the net asset value of each share class.
As described in the Fund’s prospectus, Class A and Class C shares are offered to the general public for investment. Advisor Class, Institutional Class, Institutional 2 Class, Institutional 3 Class and Class R shares are available for purchase through authorized investment professionals to omnibus retirement plans or to institutional and to certain other investors as also described in the Fund’s prospectus. Class C shares automatically convert to Class A shares after 10 years. Effective December 14, 2018, Class T shares merged, in a tax-free transaction, into Class A shares of the Fund and are no longer offered for sale. Class V shares are available only to investors who received (and who continuously held) Class V shares in connection with previous fund reorganizations.
Note 2. Summary of significant accounting policies
Basis of preparation
The Fund is an investment company that applies the accounting and reporting guidance in the Financial Accounting Standards Board (FASB) Accounting Standards Codification Topic 946,Financial Services - Investment Companies (ASC 946). The financial statements are prepared in accordance with U.S. generally accepted accounting principles (GAAP), which requires management to make certain estimates and assumptions that affect the reported amounts of assets and liabilities, the disclosure of contingent assets and liabilities at the date of the financial statements and the reported amounts of income and expenses during the reporting period. Actual results could differ from those estimates.
The following is a summary of significant accounting policies followed by the Fund in the preparation of its financial statements.
Security valuation
All equity securities are valued at the close of business of the New York Stock Exchange. Equity securities are valued at the official closing price on the principal exchange or market on which they trade. Unlisted securities or listed securities for which there were no sales during the day are valued at the mean of the latest quoted bid and ask prices on such exchanges or markets.
Foreign equity securities are valued based on the closing price on the foreign exchange in which such securities are primarily traded. If any foreign equity security closing prices are not readily available, the securities are valued at the mean of the latest quoted bid and ask prices on such exchanges or markets. Foreign currency exchange rates are determined at the scheduled closing time of the New York Stock Exchange. Many securities markets and exchanges outside the U.S. close prior to the close of the New York Stock Exchange; therefore, the closing prices for securities in such markets or on such exchanges may not fully reflect events that occur after such close but before the close of the New York Stock Exchange. In those situations, foreign securities will be fair valued pursuant to a policy adopted by the Board of Trustees. Under the policy, the Fund may utilize a third party pricing service to determine these fair values. The third-party pricing service takes into account multiple factors, including, but not limited to, movements in the U.S. securities markets, certain depositary receipts, futures contracts and foreign exchange rates that have occurred subsequent to the close of the foreign exchange or market, to determine a good faith estimate that reasonably reflects the current market conditions as of the close of the New York Stock Exchange. The fair value of a security is likely to be different from the quoted or published price, if available.
| 22 | Columbia Mid Cap Growth Fund | Annual Report 2019 |
Notes to Financial Statements (continued)
August 31, 2019
Investments in open-end investment companies, including money market funds, are valued at their latest net asset value.
Investments for which market quotations are not readily available, or that have quotations which management believes are not reflective of market value or reliable, are valued at fair value as determined in good faith under procedures approved by and under the general supervision of the Board of Trustees. If a security or class of securities (such as foreign securities) is valued at fair value, such value is likely to be different from the quoted or published price for the security.
The determination of fair value often requires significant judgment. To determine fair value, management may use assumptions including but not limited to future cash flows and estimated risk premiums. Multiple inputs from various sources may be used to determine fair value.
GAAP requires disclosure regarding the inputs and valuation techniques used to measure fair value and any changes in valuation inputs or techniques. In addition, investments shall be disclosed by major category. This information is disclosed following the Fund’s Portfolio of Investments.
Security transactions
Security transactions are accounted for on the trade date. Cost is determined and gains (losses) are based upon the specific identification method for both financial statement and federal income tax purposes.
Income recognition
Corporate actions and dividend income are generally recorded net of any non-reclaimable tax withholdings, on the ex-dividend date or upon receipt of ex-dividend notification in the case of certain foreign securities.
The Fund may receive distributions from holdings in equity securities, business development companies (BDCs), exchange-traded funds (ETFs), limited partnerships (LPs), other regulated investment companies (RICs), and real estate investment trusts (REITs), which report information on the tax character of their distributions annually. These distributions are allocated to dividend income, capital gain and return of capital based on actual information reported. Return of capital is recorded as a reduction of the cost basis of securities held. If the Fund no longer owns the applicable securities, return of capital is recorded as a realized gain. With respect to REITs, to the extent actual information has not yet been reported, estimates for return of capital are made by the Fund’s management. Management’s estimates are subsequently adjusted when the actual character of the distributions is disclosed by the REITs, which could result in a proportionate change in return of capital to shareholders.
Awards from class action litigation are recorded as a reduction of cost basis if the Fund still owns the applicable securities on the payment date. If the Fund no longer owns the applicable securities, the proceeds are recorded as realized gains.
Expenses
General expenses of the Trust are allocated to the Fund and other funds of the Trust based upon relative net assets or other expense allocation methodologies determined by the nature of the expense. Expenses directly attributable to the Fund are charged to the Fund. Expenses directly attributable to a specific class of shares are charged to that share class.
Determination of class net asset value
All income, expenses (other than class-specific expenses, which are charged to that share class, as shown in the Statement of Operations) and realized and unrealized gains (losses) are allocated to each class of the Fund on a daily basis, based on the relative net assets of each class, for purposes of determining the net asset value of each class.
Federal income tax status
The Fund intends to qualify each year as a regulated investment company under Subchapter M of the Internal Revenue Code, as amended, and will distribute substantially all of its investment company taxable income and net capital gain, if any, for its tax year, and as such will not be subject to federal income taxes. In addition, the Fund intends to distribute in each calendar year substantially all of its ordinary income, capital gain net income and certain other amounts, if any, such that the Fund should not be subject to federal excise tax. Therefore, no federal income or excise tax provision is recorded.
Columbia Mid Cap Growth Fund | Annual Report 2019
| 23 |
Notes to Financial Statements (continued)
August 31, 2019
Foreign taxes
The Fund may be subject to foreign taxes on income, gains on investments or currency repatriation, a portion of which may be recoverable. The Fund will accrue such taxes and recoveries, as applicable, based upon its current interpretation of tax rules and regulations that exist in the markets in which it invests.
Realized gains in certain countries may be subject to foreign taxes at the Fund level, based on statutory rates. The Fund accrues for such foreign taxes on realized and unrealized gains at the appropriate rate for each jurisdiction, as applicable. The amount, if any, is disclosed as a liability on the Statement of Assets and Liabilities.
Distributions to shareholders
Distributions from net investment income, if any, are declared and paid annually. Net realized capital gains, if any, are distributed at least annually. Income distributions and capital gain distributions are determined in accordance with federal income tax regulations, which may differ from GAAP.
Guarantees and indemnifications
Under the Trust’s organizational documents and, in some cases, by contract, its officers and trustees are indemnified against certain liabilities arising out of the performance of their duties to the Trust or its funds. In addition, certain of the Fund’s contracts with its service providers contain general indemnification clauses. The Fund’s maximum exposure under these arrangements is unknown since the amount of any future claims that may be made against the Fund cannot be determined, and the Fund has no historical basis for predicting the likelihood of any such claims.
Recent accounting pronouncements
Accounting Standards Update 2017-08 Premium Amortization on Purchased Callable Debt Securities
In March 2017, the Financial Accounting Standards Board issued Accounting Standards Update (ASU) No. 2017-08 Premium Amortization on Purchased Callable Debt Securities. ASU No. 2017-08 updates the accounting standards to shorten the amortization period for certain purchased callable debt securities, held at a premium, to be amortized to the earliest call date. The update applies to securities with explicit, noncontingent call features that are callable at fixed prices and on preset dates. The standard is effective for annual periods beginning after December 15, 2018 and interim periods within those fiscal years. Management does not expect the implementation of this guidance to have a material impact on the financial statement amounts and footnote disclosures.
Accounting Standards Update 2018-13 Disclosure Framework - Changes to the Disclosure Requirements for Fair Value Measurement
In August 2018, the Financial Accounting Standards Board issued Accounting Standards Update (ASU) No. 2018-13 Disclosure Framework - Changes to the Disclosure Requirements for Fair Value Measurement. The standard is effective for annual periods beginning after December 15, 2019 and interim periods within those fiscal years, with early adoption permitted. After evaluation, management determined to adopt the ASU effective for the period ended August 31, 2019 and all subsequent periods. As a result of the amendments, management implemented disclosure changes which include removal of the amount and reasons for transfers between Level 1 and Level 2 of the fair value hierarchy, removal of the policy for the timing of transfers between levels, removal of the description of the Level 3 valuation processes, as well as modifications to the measurement uncertainty disclosure.
Disclosure Update and Simplification
In September 2018, the Securities and Exchange Commission (SEC) released Final Rule 33-10532, Disclosure Update and Simplification, which amends certain financial statement disclosure requirements that the SEC determined to be redundant, outdated, or superseded in light of other SEC disclosure requirements, GAAP, or changes in the information environment. As a result of the amendments, management implemented disclosure changes which included removing the components of distributable earnings presented on the Statement of Assets and Liabilities and combining income and gain distributions paid to shareholders as presented on the Statement of Changes in Net Assets. Any values presented to meet prior year requirements were left unchanged. The amendments had no effect on the Fund’s net assets or results of operation.
| 24 | Columbia Mid Cap Growth Fund | Annual Report 2019 |
Notes to Financial Statements (continued)
August 31, 2019
Note 3. Fees and other transactions with affiliates
Management services fees
The Fund has entered into a Management Agreement with Columbia Management Investment Advisers, LLC (the Investment Manager), a wholly-owned subsidiary of Ameriprise Financial, Inc. (Ameriprise Financial). Under the Management Agreement, the Investment Manager provides the Fund with investment research and advice, as well as administrative and accounting services. The management services fee is an annual fee that is equal to a percentage of the Fund’s daily net assets that declines from 0.82% to 0.65% as the Fund’s net assets increase. The effective management services fee rate for the year ended August 31, 2019 was 0.76% of the Fund’s average daily net assets.
Participating Affiliates
The Investment Manager and its investment advisory affiliates (Affiliates) may coordinate in providing services to their clients. From time to time, the Investment Manager may engage its Affiliates to provide a variety of services such as investment research, investment monitoring, trading and discretionary investment management (including portfolio management) to certain accounts managed by the Investment Manager, including the Fund. These Affiliates will provide services to the Investment Manager pursuant to personnel-sharing agreements or similar inter-company arrangements and the Fund will pay no additional fees and expenses as a result of any such arrangements.
These Affiliates, like the Investment Manager, are direct or indirect subsidiaries of Ameriprise Financial and are registered with the appropriate respective regulators and, where required, the Securities and Exchange Commission and the Commodity Futures Trading Commission in the United States. Pursuant to some of these arrangements, certain employees of these Affiliates may serve as “associated persons” of the Investment Manager and, in this capacity, subject to the oversight and supervision of the Investment Manager and consistent with the investment objectives, policies and limitations set forth in the Fund’s prospectus and SAI, may provide such services to the Fund on behalf of the Investment Manager.
Compensation of board members
Members of the Board of Trustees who are not officers or employees of the Investment Manager or Ameriprise Financial are compensated for their services to the Fund as disclosed in the Statement of Operations. These members of the Board of Trustees may participate in a Deferred Compensation Plan (the Deferred Plan) which may be terminated at any time. Obligations of the Deferred Plan will be paid solely out of the Fund’s assets, and all amounts payable under the Deferred Plan constitute a general unsecured obligation of the Fund.
Compensation of Chief Compliance Officer
The Board of Trustees has appointed a Chief Compliance Officer to the Fund in accordance with federal securities regulations. As disclosed in the Statement of Operations, a portion of the Chief Compliance Officer’s total compensation is allocated to the Fund, along with other allocations to affiliated registered investment companies managed by the Investment Manager and its affiliates, based on relative net assets.
Transfer agency fees
Under a Transfer and Dividend Disbursing Agent Agreement, Columbia Management Investment Services Corp. (the Transfer Agent), an affiliate of the Investment Manager and a wholly-owned subsidiary of Ameriprise Financial, is responsible for providing transfer agency services to the Fund. The Transfer Agent has contracted with DST Asset Manager Solutions, Inc. (DST) to serve as sub-transfer agent. The Transfer Agent pays the fees of DST for services as sub-transfer agent and DST is not entitled to reimbursement for such fees from the Fund (with the exception of out-of-pocket fees).
The Fund pays the Transfer Agent a monthly transfer agency fee based on the number or the average value of accounts, depending on the type of account. In addition, the Fund pays the Transfer Agent a fee for shareholder services based on the number of accounts or on a percentage of the average aggregate value of the Fund’s shares maintained in omnibus accounts up to the lesser of the amount charged by the financial intermediary or a cap established by the Board of Trustees from time to time.
Columbia Mid Cap Growth Fund | Annual Report 2019
| 25 |
Notes to Financial Statements (continued)
August 31, 2019
The Transfer Agent also receives compensation from the Fund for various shareholder services and reimbursements for certain out-of-pocket fees. Total transfer agency fees for Institutional 2 Class and Institutional 3 Class shares are subject to an annual limitation of not more than 0.07% and 0.02%, respectively, of the average daily net assets attributable to each share class.
For the year ended August 31, 2019, the Fund’s effective transfer agency fee rates as a percentage of average daily net assets of each class were as follows:
| | Effective rate (%) |
| Class A | 0.13 |
| Advisor Class | 0.13 |
| Class C | 0.13 |
| Institutional Class | 0.13 |
| Institutional 2 Class | 0.06 |
| Institutional 3 Class | 0.01 |
| Class R | 0.13 |
| Class T | 0.04(a) |
| Class V | 0.13 |
The Fund and certain other associated investment companies have severally, but not jointly, guaranteed the performance and observance of all the terms and conditions of a lease entered into by Seligman Data Corp. (SDC), the former transfer agent, including the payment of rent by SDC (the Guaranty). SDC was the legacy Seligman funds’ former transfer agent.
The lease and the Guaranty expired on January 31, 2019. SDC is owned by six associated investment companies, including the Fund. The Fund’s ownership interest in SDC at August 31, 2019 is recorded as a part of other assets in the Statement of Assets and Liabilities at a cost of $2,199, which approximates the fair value of the ownership interest.
An annual minimum account balance fee of $20 may apply to certain accounts with a value below the applicable share class’s initial minimum investment requirements to reduce the impact of small accounts on transfer agency fees. These minimum account balance fees are remitted to the Fund and recorded as part of expense reductions in the Statement of Operations. For the year ended August 31, 2019, no minimum account balance fees were charged by the Fund.
Distribution and service fees
The Fund has entered into an agreement with Columbia Management Investment Distributors, Inc. (the Distributor), an affiliate of the Investment Manager and a wholly-owned subsidiary of Ameriprise Financial, for distribution and shareholder services. The Board of Trustees has approved, and the Fund has adopted, distribution and shareholder service plans (the Plans) applicable to certain share classes, which set the distribution and service fees for the Fund. These fees are calculated daily and are intended to compensate the Distributor and/or eligible selling and/or servicing agents for selling shares of the Fund and providing services to investors.
Under the Plans, the Fund pays a monthly service fee to the Distributor at the maximum annual rate of 0.25% of the average daily net assets attributable to Class A, Class C and Class T shares of the Fund. Also under the Plans, the Fund pays a monthly distribution fee to the Distributor at the maximum annual rates of 0.10%, 0.75%, 0.50% and 0.25% of the average daily net assets attributable to Class A, Class C, Class R and Class T shares of the Fund, respectively. As a result of all Class T shares of the Fund being redeemed or converted to Class A shares, December 14, 2018 was the last day the Fund paid a distribution and shareholder services fee for Class T shares.
Although the Fund may pay distribution and service fees up to a maximum annual rate of 0.35% of the Fund’s average daily net assets attributable to Class A shares (comprised of up to 0.10% for distribution services and up to 0.25% for shareholder liaison services), the Fund currently limits such fees to an aggregate fee of not more than 0.25% of the Fund’s average daily net assets attributable to Class A shares.
| 26 | Columbia Mid Cap Growth Fund | Annual Report 2019 |
Notes to Financial Statements (continued)
August 31, 2019
Although the Fund may have paid a distribution fee up to 0.25% of the Fund’s average daily net assets attributable to Class T shares and a service fee of up to 0.25% of the Fund’s average daily net assets attributable to Class T shares, the aggregate fee shall not exceed 0.25% of the Fund’s average daily net assets attributable to Class T shares.
Shareholder services fees
The Fund has adopted a shareholder services plan that permits it to pay for certain services provided to Class V shareholders by their selling and/or servicing agents. The Fund may pay shareholder servicing fees up to an aggregate annual rate of 0.50% of the Fund’s average daily net assets attributable to Class V shares (comprised of up to 0.25% for shareholder liaison services and up to 0.25% for administrative support services). These fees are currently limited to an aggregate annual rate of not more than 0.25% of the Fund’s average daily net assets attributable to Class V shares.
Sales charges (unaudited)
Sales charges, including front-end charges and contingent deferred sales charges (CDSC), received by the Distributor for distributing Fund shares for the year ended August 31, 2019, if any, are listed below:
| | Front End (%) | CDSC (%) | Amount ($) |
| Class A | 5.75 | 0.50 - 1.00(a) | 222,772 |
| Class C | — | 1.00(b) | 1,059 |
| Class T | 2.50 | — | — |
| Class V | 5.75 | 0.50 - 1.00(a) | 193 |
| (a) | This charge is imposed on certain investments of between $1 million and $50 million redeemed within 18 months after purchase, as follows: 1.00% if redeemed within 12 months after purchase, and 0.50% if redeemed more than 12, but less than 18, months after purchase, with certain limited exceptions. |
| (b) | This charge applies to redemptions within 12 months after purchase, with certain limited exceptions. |
The Fund’s other share classes are not subject to sales charges.
Expenses waived/reimbursed by the Investment Manager and its affiliates
The Investment Manager and certain of its affiliates have contractually agreed to waive fees and/or reimburse expenses (excluding certain fees and expenses described below) for the period(s) disclosed below, unless sooner terminated at the sole discretion of the Board of Trustees, so that the Fund’s net operating expenses, after giving effect to fees waived/expenses reimbursed and any balance credits and/or overdraft charges from the Fund’s custodian, do not exceed the following annual rate(s) as a percentage of the class’ average daily net assets:
| | January 1, 2019
through
December 31, 2019 | Prior to
January 1, 2019 |
| Class A | 1.24% | 1.30% |
| Advisor Class | 0.99 | 1.05 |
| Class C | 1.99 | 2.05 |
| Institutional Class | 0.99 | 1.05 |
| Institutional 2 Class | 0.92 | 0.96 |
| Institutional 3 Class | 0.87 | 0.92 |
| Class R | 1.49 | 1.55 |
| Class V | 1.24 | 1.30 |
Under the agreement governing these fee waivers and/or expense reimbursement arrangements, the following fees and expenses are excluded from the waiver/reimbursement commitment, and therefore will be paid by the Fund, if applicable: taxes (including foreign transaction taxes), expenses associated with investments in affiliated and non-affiliated pooled investment vehicles (including mutual funds and exchange-traded funds), transaction costs and brokerage commissions, costs related to any securities lending program, dividend expenses associated with securities sold short, inverse floater program fees and expenses, transaction charges and interest on borrowed money, interest, infrequent and/or unusual expenses and any other expenses the exclusion of which is specifically approved by the Board of Trustees. This
Columbia Mid Cap Growth Fund | Annual Report 2019
| 27 |
Notes to Financial Statements (continued)
August 31, 2019
agreement may be modified or amended only with approval from the Investment Manager, certain of its affiliates and the Fund. Any fees waived and/or expenses reimbursed under the expense reimbursement arrangements described above are not recoverable by the Investment Manager or its affiliates in future periods.
Note 4. Federal tax information
The timing and character of income and capital gain distributions are determined in accordance with income tax regulations, which may differ from GAAP because of temporary or permanent book to tax differences.
At August 31, 2019, these differences were primarily due to differing treatment for deferral/reversal of wash sale losses, trustees’ deferred compensation, late-year ordinary losses, non-deductible expenses, net operating loss reclassification, and investments in partnerships.To the extent these differences were permanent, reclassifications were made among the components of the Fund’s net assets. Temporary differences do not require reclassifications.
The following reclassifications were made:
Excess of distributions
over net investment
income ($) | Accumulated
net realized
gain ($) | Paid in
capital ($) |
| 203,642 | (203,636) | (6) |
Net investment income (loss) and net realized gains (losses), as disclosed in the Statement of Operations, and net assets were not affected by this reclassification.
The tax character of distributions paid during the years indicated was as follows:
| Year Ended August 31, 2019 | Year Ended August 31, 2018 |
Ordinary
income ($) | Long-term
capital gains ($) | Total ($) | Ordinary
income ($) | Long-term
capital gains ($) | Total ($) |
| 29,282,463 | 310,909,317 | 340,191,780 | 63,483,335 | 163,818,827 | 227,302,162 |
Short-term capital gain distributions, if any, are considered ordinary income distributions for tax purposes.
At August 31, 2019, the components of distributable earnings on a tax basis were as follows:
Undistributed
ordinary income ($) | Undistributed
long-term
capital gains ($) | Capital loss
carryforwards ($) | Net unrealized
appreciation ($) |
| — | 130,552,043 | — | 248,852,864 |
At August 31, 2019, the cost of all investments for federal income tax purposes along with the aggregate gross unrealized appreciation and depreciation based on that cost was:
Federal
tax cost ($) | Gross unrealized
appreciation ($) | Gross unrealized
(depreciation) ($) | Net unrealized
appreciation ($) |
| 1,410,667,752 | 293,709,289 | (44,856,425) | 248,852,864 |
Tax cost of investments and unrealized appreciation/(depreciation) may also include timing differences that do not constitute adjustments to tax basis.
Under current tax rules, regulated investment companies can elect to treat certain late-year ordinary losses incurred and post-October capital losses (capital losses realized after October 31) as arising on the first day of the following taxable year. As of August 31, 2019, the Fund will elect to treat the following late-year ordinary losses and post-October capital losses as arising on September 1, 2019.
Late year
ordinary losses ($) | Post-October
capital losses ($) |
| 2,848,643 | — |
| 28 | Columbia Mid Cap Growth Fund | Annual Report 2019 |
Notes to Financial Statements (continued)
August 31, 2019
Management of the Fund has concluded that there are no significant uncertain tax positions in the Fund that would require recognition in the financial statements. However, management’s conclusion may be subject to review and adjustment at a later date based on factors including, but not limited to, new tax laws, regulations, and administrative interpretations (including relevant court decisions). Generally, the Fund’s federal tax returns for the prior three fiscal years remain subject to examination by the Internal Revenue Service.
Note 5. Portfolio information
The cost of purchases and proceeds from sales of securities, excluding short-term investments and derivatives, if any, aggregated to $1,512,653,745 and $1,811,732,992, respectively, for the year ended August 31, 2019. The amount of purchase and sale activity impacts the portfolio turnover rate reported in the Financial Highlights.
Note 6. Affiliated money market fund
The Fund invests in Columbia Short-Term Cash Fund, an affiliated money market fund established for the exclusive use by the Fund and other affiliated funds (the Affiliated MMF). The income earned by the Fund from such investments is included as Dividends - affiliated issuers in the Statement of Operations. As an investing fund, the Fund indirectly bears its proportionate share of the expenses of the Affiliated MMF. The Affiliated MMF prices its shares with a floating net asset value. In addition, the Board of Trustees of the Affiliated MMF may impose a fee on redemptions (sometimes referred to as a liquidity fee) or temporarily suspend redemptions (sometimes referred to as imposing a redemption gate) in the event its liquidity falls below regulatory limits.
Note 7. Interfund lending
Pursuant to an exemptive order granted by the Securities and Exchange Commission, the Fund participates in a program (the Interfund Program) allowing each participating Columbia Fund (each, a Participating Fund) to lend money directly to and, except for closed-end funds and money market funds, borrow money directly from other Participating Funds for temporary purposes. The amounts eligible for borrowing and lending under the Interfund Program are subject to certain restrictions.
Interfund loans are subject to the risk that the borrowing fund could be unable to repay the loan when due, and a delay in repayment to the lending fund could result in lost opportunities and/or additional lending costs. The exemptive order is subject to conditions intended to mitigate conflicts of interest arising from the Investment Manager’s relationship with each Participating Fund.
The Fund did not borrow or lend money under the Interfund Program during the year ended August 31, 2019.
Note 8. Line of credit
The Fund has access to a revolving credit facility with a syndicate of banks led by Citibank, N.A., HSBC Bank USA, N.A. and JPMorgan Chase Bank, N.A. whereby the Fund may borrow for the temporary funding of shareholder redemptions or for other temporary or emergency purposes. The credit facility, which is a collective agreement between the Fund and certain other funds managed by the Investment Manager or an affiliated investment manager, severally and not jointly, permits collective borrowings up to $1 billion. Interest is charged to each participating fund based on its borrowings at a rate equal to the higher of (i) the federal funds effective rate, (ii) the one-month LIBOR rate and (iii) the overnight bank funding rate, plus in each case, 1.00%. Each borrowing under the credit facility matures no later than 60 days after the date of borrowing. The Fund also pays a commitment fee equal to its pro rata share of the unused amount of the credit facility at a rate of 0.15% per annum. The commitment fee is included in other expenses in the Statement of Operations. This agreement expires annually in December unless extended or renewed.
The Fund had no borrowings during the year ended August 31, 2019.
Columbia Mid Cap Growth Fund | Annual Report 2019
| 29 |
Notes to Financial Statements (continued)
August 31, 2019
Note 9. Significant risks
Consumer discretionary sector risk
The Fund may be more susceptible to the particular risks that may affect companies in the consumer discretionary sector than if it were invested in a wider variety of companies in unrelated sectors. Companies in the consumer discretionary sector are subject to certain risks, including fluctuations in the performance of the overall domestic and international economy, interest rate changes, increased competition and consumer confidence. Performance of such companies may be affected by factors including reduced disposable household income, reduced consumer spending, changing demographics and consumer tastes.
Shareholder concentration risk
At August 31, 2019, affiliated shareholders of record owned 33.0% of the outstanding shares of the Fund in one or more accounts. Subscription and redemption activity by concentrated accounts may have a significant effect on the operations of the Fund. In the case of a large redemption, the Fund may be forced to sell investments at inopportune times, including its liquid positions, which may result in Fund losses and the Fund holding a higher percentage of less liquid positions. Large redemptions could result in decreased economies of scale and increased operating expenses for non-redeeming Fund shareholders.
Technology and technology-related investment risk
The Fund may be more susceptible to the particular risks that may affect companies in the information technology sector, as well as other technology-related sectors (collectively, the technology sectors) than if it were invested in a wider variety of companies in unrelated sectors. Companies in the technology sectors are subject to certain risks, including the risk that new services, equipment or technologies will not be accepted by consumers and businesses or will become rapidly obsolete. Performance of such companies may be affected by factors including obtaining and protecting patents (or the failure to do so) and significant competitive pressures, including aggressive pricing of their products or services, new market entrants, competition for market share and short product cycles due to an accelerated rate of technological developments. Such competitive pressures may lead to limited earnings and/or falling profit margins. As a result, the value of their securities may fall or fail to rise. In addition, many technology sector companies have limited operating histories and prices of these companies’ securities historically have been more volatile than other securities, especially over the short term.
Note 10. Subsequent events
Management has evaluated the events and transactions that have occurred through the date the financial statements were issued and noted no items requiring adjustment of the financial statements or additional disclosure.
Note 11. Information regarding pending and settled legal proceedings
Ameriprise Financial and certain of its affiliates have historically been involved in a number of legal, arbitration and regulatory proceedings, including routine litigation, class actions, and governmental actions, concerning matters arising in connection with the conduct of their business activities. Ameriprise Financial believes that the Fund is not currently the subject of, and that neither Ameriprise Financial nor any of its affiliates are the subject of, any pending legal, arbitration or regulatory proceedings that are likely to have a material adverse effect on the Fund or the ability of Ameriprise Financial or its affiliates to perform under their contracts with the Fund. Ameriprise Financial is required to make quarterly (10-Q), annual (10-K) and, as necessary, 8-K filings with the Securities and Exchange Commission (SEC) on legal and regulatory matters that relate to Ameriprise Financial and its affiliates. Copies of these filings may be obtained by accessing the SEC website at www.sec.gov.
There can be no assurance that these matters, or the adverse publicity associated with them, will not result in increased Fund redemptions, reduced sale of Fund shares or other adverse consequences to the Fund. Further, although we believe proceedings are not likely to have a material adverse effect on the Fund or the ability of Ameriprise Financial or its affiliates to perform under their contracts with the Fund, these proceedings are subject to uncertainties and, as such, we are unable to estimate the possible loss or range of loss that may result. An adverse outcome in one or more of these proceedings could result in adverse judgments, settlements, fines, penalties or other relief that could have a material adverse effect on the consolidated financial condition or results of operations of Ameriprise Financial.
| 30 | Columbia Mid Cap Growth Fund | Annual Report 2019 |
Report of Independent Registered Public Accounting Firm
To the Board of Trustees of Columbia Funds Series Trust I and Shareholders of Columbia Mid Cap Growth Fund
Opinion on the Financial Statements
We have audited the accompanying statement of assets and liabilities, including the portfolio of investments, of Columbia Mid Cap Growth Fund (one of the funds constituting Columbia Funds Series Trust I, hereafter referred to as the “Fund”) as of August 31, 2019, the related statement of operations for the year ended August 31, 2019, the statement of changes in net assets for each of the two years in the period ended August 31, 2019, including the related notes, and the financial highlights for each of the five years in the period ended August 31, 2019, (collectively referred to as the “financial statements”). In our opinion, the financial statements present fairly, in all material respects, the financial position of the Fund as of August 31, 2019, the results of its operations for the year then ended, the changes in its net assets for each of the two years in the period ended August 31, 2019 and the financial highlights for each of the five years in the period ended August 31, 2019 in conformity with accounting principles generally accepted in the United States of America.
Basis for Opinion
These financial statements are the responsibility of the Fund’s management. Our responsibility is to express an opinion on the Fund’s financial statements based on our audits. We are a public accounting firm registered with the Public Company Accounting Oversight Board (United States) (PCAOB) and are required to be independent with respect to the Fund in accordance with the U.S. federal securities laws and the applicable rules and regulations of the Securities and Exchange Commission and the PCAOB.
We conducted our audits of these financial statements in accordance with the standards of the PCAOB. Those standards require that we plan and perform the audit to obtain reasonable assurance about whether the financial statements are free of material misstatement, whether due to error or fraud.
Our audits included performing procedures to assess the risks of material misstatement of the financial statements, whether due to error or fraud, and performing procedures that respond to those risks. Such procedures included examining, on a test basis, evidence regarding the amounts and disclosures in the financial statements. Our audits also included evaluating the accounting principles used and significant estimates made by management, as well as evaluating the overall presentation of the financial statements. Our procedures included confirmation of securities owned as of August 31, 2019, by correspondence with the custodian and transfer agent. We believe that our audits provide a reasonable basis for our opinion.
/s/PricewaterhouseCoopers LLP
Minneapolis, Minnesota
October 24, 2019
We have served as the auditor of one or more investment companies within the Columbia Funds Complex since 1977.
Columbia Mid Cap Growth Fund | Annual Report 2019
| 31 |
Federal Income Tax Information
(Unaudited)
The Fund hereby designates the following tax attributes for the fiscal year ended August 31, 2019. Shareholders will be notified in early 2020 of the amounts for use in preparing 2019 income tax returns.
Qualified
dividend
income | Dividends
received
deduction | Capital
gain
dividend |
| 29.80% | 28.64% | $137,371,719 |
Qualified dividend income. For taxable, non-corporate shareholders, the percentage of ordinary income distributed during the fiscal year that represents qualified dividend income subject to reduced tax rates.
Dividends received deduction. The percentage of ordinary income distributed during the fiscal year that qualifies for the corporate dividends received deduction.
Capital gain dividend. The Fund designates as a capital gain dividend the amount reflected above, or if subsequently determined to be different, the net capital gain of such fiscal period.
TRUSTEES AND OFFICERS
The Board oversees the Fund’s operations and appoints officers who are responsible for day-to-day business decisions based on policies set by the Board. The following table provides basic biographical information about the Fund’s Trustees as of the printing of this report, including their principal occupations during the past five years, although specific titles for individuals may have varied over the period. The year set forth beneath Length of Service in the table below is the year in which the Trustee was first appointed or elected as Trustee to any Fund currently in the Columbia Funds Complex or a predecessor thereof. Under current Board policy, members serve terms of indefinite duration.
Independent trustees
| Name, address, year of birth | Position held with the Trust and length of service | Principal occupation(s) during the past five years and other relevant professional experience | Number of Funds in the Columbia Fund Complex overseen | Other directorships held by Trustee during the past five years |
Janet Langford Carrig
c/o Columbia Management
Investment Advisers, LLC
225 Franklin Street
Mail Drop BX32 05228
Boston, MA 02110
1957 | Trustee
1996 | Senior Vice President, General Counsel and Corporate Secretary, ConocoPhillips (independent energy company), September 2007-October 2018 | 70 | None |
Douglas A. Hacker
c/o Columbia Management
Investment Advisers, LLC
225 Franklin Street
Mail Drop BX32 05228
Boston, MA 02110
1955 | Trustee and Chairman of the Board
1996 | Independent business executive since May 2006; Executive Vice President — Strategy of United Airlines, December 2002-May 2006; President of UAL Loyalty Services (airline marketing company), September 2001-December 2002; Executive Vice President and Chief Financial Officer of United Airlines, July 1999-September 2001 | 70 | Spartan Nash Company, (food distributor); former Director, Nash Finch Company (food distributor), 2005-2013; Aircastle Limited (aircraft leasing); former Director, SeaCube Container Leasing Ltd. (container leasing), 2010-2013; and Travelport Worldwide Limited (travel information technology) |
| 32 | Columbia Mid Cap Growth Fund | Annual Report 2019 |
TRUSTEES AND OFFICERS (continued)
Independent trustees (continued)
| Name, address, year of birth | Position held with the Trust and length of service | Principal occupation(s) during the past five years and other relevant professional experience | Number of Funds in the Columbia Fund Complex overseen | Other directorships held by Trustee during the past five years |
Nancy T. Lukitsh
c/o Columbia Management
Investment Advisers, LLC
225 Franklin Street
Mail Drop BX32 05228
Boston, MA 02110
1956 | Trustee
2011 | Senior Vice President, Partner and Director of Marketing, Wellington Management Company, LLP (investment adviser), 1997-2010; Chair, Wellington Management Portfolios (commingled non-U.S. investment pools), 2007-2010; Director, Wellington Trust Company, NA and other Wellington affiliates, 1997-2010 | 70 | None |
David M. Moffett
c/o Columbia Management
Investment Advisers, LLC
225 Franklin Street
Mail Drop BX32 05228
Boston, MA 02110
1952 | Trustee
2011 | Retired. Consultant to Bridgewater and Associates | 70 | Director, CSX Corporation (transportation suppliers); Genworth Financial, Inc. (financial and insurance products and services); PayPal Holdings Inc. (payment and data processing services); Trustee, University of Oklahoma Foundation; former Director, eBay Inc. (online trading community), 2007-2015; and former Director, CIT Bank, CIT Group Inc. (commercial and consumer finance), 2010-2016 |
John J. Neuhauser
c/o Columbia Management
Investment Advisers, LLC
225 Franklin Street
Mail Drop BX32 05228
Boston, MA 02110
1943 | Trustee
1984 | President, Saint Michael’s College, August 2007-June 2018; Director or Trustee of several non-profit organizations, including University of Vermont Medical Center; Academic Vice President and Dean of Faculties, Boston College, August 1999-October 2005; University Professor, Boston College, November 2005-August 2007 | 70 | Liberty All-Star Equity Fund and Liberty All- Star Growth Fund (closed-end funds) |
Patrick J. Simpson
c/o Columbia Management
Investment Advisers, LLC
225 Franklin Street
Mail Drop BX32 05228
Boston, MA 02110
1944 | Trustee
2000 | Of Counsel, Perkins Coie LLP (law firm) since 2015; Partner, Perkins Coie LLP, 1988-2014 | 70 | Former Director, M Fund, Inc. (M Funds mutual fund family), July 2018-July 2019 |
Anne-Lee Verville
c/o Columbia Management
Investment Advisers, LLC
225 Franklin Street
Mail Drop BX32 05228
Boston, MA 02110
1945 | Trustee
1998 | Retired. General Manager, Global Education Industry, 1994-1997, President – Application Systems Division, 1991-1994, Chief Financial Officer – US Marketing & Services, 1988-1991, and Chief Information Officer, 1987-1988, IBM Corporation (computer and technology) | 70 | Former Director, Enesco Group, Inc. (producer of giftware and home and garden decor products), 2001-2006 |
Columbia Mid Cap Growth Fund | Annual Report 2019
| 33 |
TRUSTEES AND OFFICERS (continued)
Consultants to the Independent Trustees*
| Name, address, year of birth | Position held with the Trust and length of service | Principal occupation(s) during the past five years and other relevant professional experience | Number of Funds in the Columbia Funds complex overseen | Other directorships held by Trustee during the past five years |
J. Kevin Connaughton
c/o Columbia
Management Investment
Advisers, LLC,
225 Franklin Street
Mail Drop BX32 05228,
Boston, MA 02110
1964 | Independent Trustee Consultant
2016 | Independent Trustee Consultant, Columbia Funds since March 2016; Adjunct Professor of Finance, Bentley University since November 2017; Managing Director and General Manager of Mutual Fund Products, Columbia Management Investment Advisers, LLC, May 2010-February 2015; President, Columbia Funds, 2009-2015; and senior officer of Columbia Funds and affiliated funds, 2003-2015 | 70 | Director, The Autism Project since March 2015; former Trustee, New Century Portfolios, March 2015-December 2017; formerly on Board of Governors, Gateway Healthcare, January 2016 – December 2017 |
Olive Darragh
c/o Columbia
Management Investment
Advisers, LLC,
225 Franklin Street,
Mail Drop BX32 05228,
Boston, MA 02110
1962 | Independent Trustee Consultant 2019 | Independent Trustee Consultant, Columbia Funds since June 2019; Managing Director of Darragh Inc. (a strategy and talent management consulting firm) since 2010; Founder and CEO, Zolio (an investment management talent identification platform) since 2004; Partner, Tudor Investments, 2004-2010; Senior Partner, McKinsey & Company, 2001-2004 | 70 | Director, University of Edinburgh Business School; former Director, Boston Public Library Foundation |
Natalie A. Trunow
c/o Columbia
Management Investment
Advisers, LLC,
225 Franklin Street
Mail Drop BX32 05228,
Boston, MA 02110
1967 | Independent Trustee Consultant
2016 | Independent Trustee Consultant, Columbia Funds since September 2016; Chief Executive Officer, Millennial Portfolio Solutions LLC (asset management and consulting services) since January 2016; Director of Investments, Casey Family Programs, April 2016-September 2016; Senior Vice President and Chief Investment Officer, Calvert Investments, August 2008-January 2016; Section Head and Portfolio Manager, General Motors Asset Management, June 1997-August 2008 | 70 | Director, Health Services for Children with Special Needs, Inc.; Director, Consumer Credit Counseling Services (formerly Guidewell Financial Solutions) |
| * | J. Kevin Connaughton was appointed consultant to the Independent Trustees effective March 1, 2016. Olive Darragh was appointed consultant to the Independent Trustees effective June 10, 2019. Natalie A. Trunow was appointed consultant to the Independent Trustees effective September 1, 2016. Shareholders of the Funds are expected to be asked to elect each of Mr. Connaughton, Ms. Darragh and Ms. Trunow as a Trustee at a future shareholder meeting. |
Interested trustee affiliated with Investment Manager*
| Name, address, year of birth | Position held with the Trust and length of service | Principal occupation(s) during the past five years and other relevant professional experience | Number of Funds in the Columbia Funds Complex overseen | Other directorships held by Trustee during the past five years |
William F. Truscott
c/o Columbia Management
Investment Advisers, LLC
225 Franklin Street
Boston, MA 02110
1960 | Trustee
2012 | Chairman of the Board and President, Columbia Management Investment Advisers, LLC since May 2010 and February 2012, respectively; Chief Executive Officer, Global Asset Management, Ameriprise Financial, Inc. since September 2012 (previously Chief Executive Officer, U.S. Asset Management & President, Annuities, May 2010-September 2012); Director and Chief Executive Officer, Columbia Management Investment Distributors, Inc. since May 2010 and February 2012, respectively; Chairman of the Board and Chief Executive Officer, RiverSource Distributors, Inc. since 2006; Director, Threadneedle Asset Management Holdings, SARL since 2014; President and Chief Executive Officer, Ameriprise Certificate Company, 2006-August 2012 | 192 | Chairman of the Board, Columbia Management Investment Advisers, LLC since May 2010; Director, Columbia Management Investment Distributors, Inc. since May 2010; former Director, Ameriprise Certificate Company, August 2006 - January 2013 |
| 34 | Columbia Mid Cap Growth Fund | Annual Report 2019 |
TRUSTEES AND OFFICERS (continued)
| * | Interested person (as defined under the 1940 Act) by reason of being an officer, director, security holder and/or employee of the Investment Manager or Ameriprise Financial. |
The Statement of Additional Information has additional information about the Fund’s Board members and is available, without charge, upon request by calling 800.345.6611, visiting columbiathreadneedleus.com/investor/ or contacting your financial intermediary.
The Board has appointed officers who are responsible for day-to-day business decisions based on policies it has established. The officers serve at the pleasure of the Board. The following table provides basic information about the Officers of the Fund as of the printing of this report, including principal occupations during the past five years, although their specific titles may have varied over the period. In addition to Mr. Truscott, who is Senior Vice President, the Fund’s other officers are:
Fund officers
Name,
address and
year of birth | Position and year
first appointed to
position for any Fund
in the Columbia
Funds complex or a
predecessor thereof | Principal occupation(s) during past five years |
Christopher O. Petersen
5228 Ameriprise
Financial Center
Minneapolis, MN 55474
Born 1970 | President and Principal Executive Officer (2015) | Vice President and Lead Chief Counsel, Ameriprise Financial, Inc. since January 2015 (previously Vice President and Chief Counsel, January 2010 - December 2014; officer of Columbia Funds and affiliated funds since 2007. |
Michael G. Clarke
225 Franklin Street
Boston, MA 02110
Born 1969 | Chief Financial Officer (Principal Financial Officer) (2009) and Senior Vice President (2019) | Vice President, Head of North American Operations, and Co-Head of Global Operations, Columbia Management Investment Advisers, LLC, since June 2019 (previously Vice President – Accounting and Tax, May 2010 - May 2019); senior officer of Columbia Funds and affiliated funds since 2002 (previously Treasurer and Chief Accounting Officer, January 2009 - January 2019 and December 2015 - January 2019, respectively). |
Joseph Beranek
5890 Ameriprise
Financial Center
Minneapolis, MN 55474
Born 1965 | Treasurer and Chief Accounting Officer (Principal Accounting Officer) (2019) | Vice President — Mutual Fund Accounting and Financial Reporting, Columbia Management Investment Advisers, LLC, since December 2018 and March 2017, respectively (previously Vice President — Pricing and Corporate Actions, May 2010 - March 2017). |
Paul B. Goucher
485 Lexington Avenue
New York, NY 10017
Born 1968 | Senior Vice President (2011) and Assistant Secretary (2008) | Senior Vice President and Assistant General Counsel, Ameriprise Financial, Inc. since January 2017 (previously Vice President and Lead Chief Counsel, November 2008 - January 2017 and January 2013 - January 2017, respectively); Vice President, Chief Legal Officer and Assistant Secretary, Columbia Management Investment Advisers, LLC since March 2015 (previously Vice President and Assistant Secretary, May 2010 – March 2015). |
Thomas P. McGuire
225 Franklin Street
Boston, MA 02110
Born 1972 | Senior Vice President and Chief Compliance Officer (2012) | Vice President — Asset Management Compliance, Ameriprise Financial, Inc., since May 2010; Chief Compliance Officer, Ameriprise Certificate Company since September 2010. |
Colin Moore
225 Franklin Street
Boston, MA 02110
Born 1958 | Senior Vice President (2010) | Executive Vice President and Global Chief Investment Officer, Ameriprise Financial, Inc., since July 2013; Executive Vice President and Global Chief Investment Officer, Columbia Management Investment Advisers, LLC since July 2013. |
Ryan C. Larrenaga
225 Franklin Street
Boston, MA 02110
Born 1970 | Senior Vice President (2017), Chief Legal Officer (2017), and Secretary (2015) | Vice President and Chief Counsel, Ameriprise Financial, Inc. since August 2018 (previously Vice President and Group Counsel, August 2011 - August 2018); officer of Columbia Funds and affiliated funds since 2005. |
Michael E. DeFao
225 Franklin Street
Boston, MA 02110
Born 1968 | Vice President (2011) and Assistant Secretary (2010) | Vice President and Chief Counsel, Ameriprise Financial, Inc. since May 2010. |
Columbia Mid Cap Growth Fund | Annual Report 2019
| 35 |
TRUSTEES AND OFFICERS (continued)
Fund officers (continued)
Name,
address and
year of birth | Position and year
first appointed to
position for any Fund
in the Columbia
Funds complex or a
predecessor thereof | Principal occupation(s) during past five years |
Lyn Kephart-Strong
5228 Ameriprise
Financial Center
Minneapolis, MN 55474
Born 1960 | Vice President (2015) | President, Columbia Management Investment Services Corp. since October 2014; Vice President & Resolution Officer, Ameriprise Trust Company since August 2009. |
Board Consideration and Approval of Management
Agreement
On June 12, 2019, the Board of Trustees (the Board) and the Trustees who are not interested persons (as defined in the Investment Company Act of 1940) (the Independent Trustees) of Columbia Funds Series Trust I (the Trust) unanimously approved the continuation of the Management Agreement (the Management Agreement) with Columbia Management Investment Advisers, LLC (the Investment Manager) with respect to Columbia Mid Cap Growth Fund (the Fund), a series of the Trust. As detailed below, the Board’s Advisory Fees and Expenses Committee (the Committee) and the Board met on multiple occasions to review and discuss, among themselves, with the management team of the Investment Manager and with an independent fee consultant, materials provided by the Investment Manager, the independent fee consultant and others before determining to approve the continuation of the Management Agreement.
In connection with their deliberations regarding the continuation of the Management Agreement, the Committee and the Board evaluated materials requested from the Investment Manager regarding the Fund and the Management Agreement, and discussed these materials with representatives of the Investment Manager at Committee meetings held on March 5, 2019, April 25, 2019 and June 11, 2019 and at Board meetings held on March 6, 2019 and June 12, 2019. In addition, the Board and its various committees consider matters bearing on the Management Agreement at other meetings throughout the year and in prior years and meet regularly with senior management of the Trust and the Investment Manager. Through the Board’s Investment Oversight Committees, Trustees also meet with selected portfolio managers of the funds the Trustees oversee and with other investment personnel at various times throughout the year. The Committee and the Board also consulted with the independent fee consultant, Fund counsel and the Independent Trustees’ independent legal counsel, who advised on various matters with respect to the Committee’s and the Board’s considerations and otherwise assisted the Committee and the Board in their deliberations. On June 11, 2019, the Committee recommended that the Board approve the continuation of the Management Agreement. On June 12, 2019, the Board, including the Independent Trustees, voting separately, unanimously approved the continuation of the Management Agreement for the Fund.
The Committee and the Board considered all information that they, their legal counsel or the Investment Manager believed reasonably necessary to evaluate and to determine whether to recommend for approval or approve the continuation of the Management Agreement. The information and factors considered by the Committee and the Board in recommending for approval or approving the continuation of the Management Agreement for the Fund included the following:
| • | Information on the investment performance of the Fund relative to the performance of a group of mutual funds determined to be comparable to the Fund by an independent third-party data provider, as well as performance relative to benchmarks; |
| • | Information on the Fund’s management fees and total expenses, including information comparing the Fund’s expenses to those of a group of comparable mutual funds, as determined by the independent third-party data provider; |
| 36 | Columbia Mid Cap Growth Fund | Annual Report 2019 |
Board Consideration and Approval of Management
Agreement (continued)
| • | The Investment Manager’s agreement to contractually limit or cap total operating expenses for the Fund through December 31, 2020 so that total operating expenses (excluding certain fees and expenses, such as transaction costs and certain other investment related expenses, interest, taxes, acquired fund fees and expenses, and infrequent and/or unusual expenses) would not exceed a specified annual rate, as a percentage of the Fund’s net assets; |
| • | The terms and conditions of the Management Agreement; |
| • | The current and proposed terms and conditions of other agreements and arrangements with affiliates of the Investment Manager relating to the operations of the Fund, including agreements with respect to the provision of distribution, transfer agency and shareholder services to the Fund; |
| • | Descriptions of various functions performed by the Investment Manager under the Management Agreement, including portfolio management and portfolio trading practices; |
| • | Information regarding the management fees of similarly-managed portfolios of other clients of the Investment Manager, including institutional accounts and collective trusts; |
| • | Information regarding the reputation, regulatory history and resources of the Investment Manager, including information regarding senior management, portfolio managers and other personnel; |
| • | Information regarding the capabilities of the Investment Manager with respect to compliance monitoring services, including an assessment of the Investment Manager’s compliance system by the Fund’s Chief Compliance Officer; and |
| • | The profitability to the Investment Manager and its affiliates from their relationships with the Fund. |
Nature, extent and quality of services provided under the Management Agreement
The Committee and the Board considered the nature, extent and quality of services provided to the Fund by the Investment Manager and its affiliates under the Management Agreement and under separate agreements for the provision of transfer agency and shareholder services, and the resources dedicated to the Fund and the other Columbia Funds by the Investment Manager and its affiliates. The Committee and the Board considered, among other things, the Investment Manager’s ability to attract, motivate and retain highly qualified research, advisory and supervisory investment professionals (including compensation programs for personnel involved in fund management, reputation and other attributes), the portfolio management services provided by those investment professionals, and the quality of the Investment Manager’s investment research capabilities and trade execution services. The Committee and the Board also considered the potential benefits to shareholders of investing in a mutual fund that is part of a fund complex offering exposure to a variety of asset classes and investment disciplines and providing a variety of fund and shareholder services.
The Committee and the Board also considered the professional experience and qualifications of the senior personnel of the Investment Manager, which included consideration of the Investment Manager’s experience with funds using an investment strategy similar to that used by the Investment Manager for the Fund. The Committee and the Board noted the compliance programs of and the compliance-related resources provided to the Fund by the Investment Manager and its affiliates and the resources dedicated by the Investment Manager and its affiliates to risk management, and considered the Investment Manager’s ability to provide administrative services to the Fund and coordinate the activities of the Fund’s other service providers. After reviewing these and related factors, the Committee and the Board concluded, within the context of their overall conclusions, that the nature, extent and quality of the services provided to the Fund under the Management Agreement supported the continuation of the Management Agreement.
Investment performance
The Committee and the Board reviewed information about the performance of the Fund over various time periods, including performance information relative to benchmarks, information that compared the performance of the Fund to the performance of a group of comparable mutual funds as determined by the independent third-party data provider, and information and analysis provided by the independent fee consultant. The Committee and the Board also reviewed a description of the third party’s methodology for identifying the Fund’s peer groups for purposes of performance and expense comparisons. Although the Fund’s performance lagged that of a relevant peer group for certain (although not necessarily all) periods, the Committee
Columbia Mid Cap Growth Fund | Annual Report 2019
| 37 |
Board Consideration and Approval of Management
Agreement (continued)
and the Board concluded that other factors relevant to performance were sufficient, in light of other considerations, to support continuation of the Management Agreement. Those factors included one or more of the following: (i) that the Fund’s performance, although lagging in certain recent periods, was stronger over the longer term; (ii) that the underperformance was attributable, to a significant extent, to investment decisions that were reasonable and consistent with the Fund’s investment strategy and policies and that the Fund was performing within a reasonable range of expectations, given those investment decisions, market conditions and the Fund’s investment strategy; (iii) that the Fund’s performance was competitive when compared to other relevant performance benchmarks or peer groups; and (iv) that the Investment Manager had taken or was taking steps designed to help improve the Fund’s investment performance, including, but not limited to, replacing portfolio managers, enhancing the resources supporting the portfolio managers, or modifying investment strategies.
The Committee and the Board noted that, through December 31, 2018, the Fund’s performance was in the forty-seventh, seventy-fourth and forty-eighth percentile (where the best performance would be in the first percentile) of its category selected by the independent third-party data provider for the purposes of performance comparisons for the one-, three- and five-year periods, respectively.
The Committee and the Board also considered the Investment Manager’s performance and reputation generally, the Investment Manager’s historical responsiveness to Board concerns about performance, and the Investment Manager’s willingness to take steps intended to improve performance. After reviewing these and related factors, the Committee and the Board concluded, within the context of their overall conclusions, that the performance of the Fund and the Investment Manager was sufficient, in light of other considerations, to support the continuation of the Management Agreement.
Investment management fee rates and other expenses
The Committee and the Board considered the management fees charged to the Fund under the Management Agreement as well as the total expenses incurred by the Fund. In assessing the reasonableness of the fees under the Management Agreement, the Committee and the Board considered, among other information, the Fund’s total expense ratio as a percentage of average daily net assets. The Committee and the Board considered data provided by the independent third-party data provider and the independent fee consultant. The Committee and the Board noted that, as of December 31, 2018, the Fund’s actual management fee and net total expense ratio were ranked in the third and second quintiles, respectively, (where the lowest fees and expenses would be in the first quintile) against the Fund’s expense universe as determined by the independent third-party data provider for purposes of expense comparison. The Committee and the Board also took into account the fee waiver and expense limitation arrangements agreed to by the Investment Manager, as noted above.
The Committee and the Board also received and considered information about the management fees charged by the Investment Manager to institutional accounts. In considering the fees charged to those accounts, the Committee and the Board took into account, among other things, the Investment Manager’s representations about the differences between managing mutual funds as compared to other types of accounts, including differences in the services provided, differences in the risk profile of such business for the Investment Manager and the additional resources required to manage mutual funds effectively. The Committee and the Board also received and considered information about the fees charged by the Investment Manager for sub-advisory services it provides to comparable unaffiliated funds. In evaluating the Fund’s management fees, the Committee and the Board also took into account the demands, complexity and quality of the investment management of the Fund.
After reviewing these and related factors, the Committee and the Board concluded, within the context of their overall conclusions, that the management fee rates and expenses of the Fund, in light of other considerations, supported the continuation of the Management Agreement.
Costs of services provided and profitability
The Committee and the Board also took note of the costs the Investment Manager and its affiliates incur in connection with the services provided and the profitability to the Investment Manager and its affiliates from their relationships with the Fund, and the efforts undertaken by the Investment Manager and its affiliates to manage efficiently their costs to provide such services.
| 38 | Columbia Mid Cap Growth Fund | Annual Report 2019 |
Board Consideration and Approval of Management
Agreement (continued)
The Committee and the Board also considered the compensation directly or indirectly received by the Investment Manager’s affiliates in connection with their relationships with the Fund. The Committee and the Board reviewed information provided by management as to the profitability to the Investment Manager and its affiliates of their relationships with the Fund, information about the allocation of expenses used to calculate profitability, and comparisons of profitability levels realized in 2018 to profitability levels realized in 2017. When reviewing profitability, the Committee and the Board also considered court cases in which adviser profitability was an issue in whole or in part, the performance of similarly managed funds, the performance of the Fund, and the expense ratio of the Fund. In addition, the Committee and the Board considered information provided by the Investment Manager regarding the Investment Manager’s financial condition and comparing its profitability to that of other asset management firms that are, or are subsidiaries of, publicly traded companies. In this regard, the Committee and the Board also considered data provided by the independent fee consultant.
After reviewing these and related factors, the Committee and the Board concluded, within the context of their overall conclusions, that the costs of services provided and the profitability to the Investment Manager and its affiliates from their relationships with the Fund supported the continuation of the Management Agreement.
Economies of scale
The Committee and the Board considered the potential existence of economies of scale in the provision by the Investment Manager of services to the Fund, to groups of related funds, and to the Investment Manager’s investment advisory clients as a whole, and whether those economies of scale were shared with the Fund through breakpoints in investment management fees or other means, such as expense limitation arrangements and additional investments by the Investment Manager in investment, trading, compliance and other resources. The Committee and the Board noted that the management fee schedules for the Fund contained breakpoints that would reduce the fee rate on assets above specified threshold levels.
In considering these matters, the Committee and the Board also considered the costs of the services provided and the profitability to the Investment Manager and its affiliates from their relationships with the Fund, as noted above. After reviewing these and related factors, the Committee and the Board concluded, within the context of their overall conclusions, that the extent to which any economies of scale were expected to be shared with the Fund supported the continuation of the Management Agreement.
Other benefits to the Investment Manager
The Committee and the Board received and considered information regarding “fall-out” or ancillary benefits received by the Investment Manager and its affiliates as a result of their relationships with the Fund, such as the engagement of the Investment Manager’s affiliates to provide distribution, transfer agency and shareholder services to the Fund. In this regard, among other matters, the Committee and the Board considered that the Fund’s distributor retains a portion of the distribution fees from the Fund and receives a portion of the sales charges on sales or redemptions of certain classes of shares of the Fund. The Committee and the Board also considered the benefits of research made available to the Investment Manager by reason of brokerage commissions generated by the Fund’s securities transactions, and reviewed information about the Investment Manager’s practices with respect to considering brokerage and research services when allocating portfolio transactions. In this connection, the Board also noted that the amount of research made available to the Investment Manager by reason of brokerage commissions had been declining over time, and may decline further. The Committee and the Board recognized that the Investment Manager’s profitability would be somewhat lower without these benefits.
Conclusion
The Committee and the Board reviewed all of the above considerations in reaching their decisions to recommend or approve the continuation of the Management Agreement. In their deliberations, the Trustees did not identify any particular information that was all-important or controlling, and individual Trustees may have attributed different weights to the various factors. Based on their evaluation of all factors that they deemed to be material, including those factors described above, and assisted by the advice of independent legal counsel, the Board, including the Independent Trustees, voting separately, unanimously approved the continuation of the Management Agreement.
Columbia Mid Cap Growth Fund | Annual Report 2019
| 39 |
Columbia Mid Cap Growth Fund
P.O. Box 219104
Kansas City, MO 64121-9104
Please read and consider the investment objectives, risks, charges and expenses for any fund carefully before investing. For a prospectus and summary prospectus, which contains this and other important information about the Fund, go to
columbiathreadneedleus.com/investor/. The Fund is distributed by Columbia Management Investment Distributors, Inc., member FINRA, and managed by Columbia Management Investment Advisers, LLC.
Columbia Threadneedle Investments (Columbia Threadneedle) is the global brand name of the Columbia and Threadneedle group of companies. All rights reserved.
© 2019 Columbia Management Investment Advisers, LLC.
columbiathreadneedleus.com/investor/

Annual Report
August 31, 2019
Columbia Disciplined Small Core Fund
Beginning on January 1, 2021, as permitted by regulations adopted by the Securities and Exchange Commission, paper copies of the Fund’s annual and semiannual shareholder reports like this one will no longer be sent by mail, unless you specifically request paper copies of the reports. Instead, the reports will be made available on the Fund’s website (columbiathreadneedleus.com/investor/), and each time a report is posted you will be notified by mail and provided with a website address to access the report.
If you have already elected to receive shareholder reports electronically, you will not be affected by this change and you need not take any action. You may elect to receive shareholder reports and other communications from the Fund electronically at any time by contacting your financial intermediary (such as a broker-dealer or bank) or, for Fund shares held directly with the Fund, by calling 800.345.6611 or by enrolling in “eDelivery” by logging into your account at columbiathreadneedleus.com/investor/.
You may elect to receive all future reports in paper free of charge. If you invest through a financial intermediary, you can contact your financial intermediary to request that you continue receiving paper copies of your shareholder reports. If you invest directly with the Fund, you can call 800.345.6611 to let the Fund know you wish to continue receiving paper copies of your shareholder reports. Your election to receive paper reports will apply to all Columbia Funds held in your account if you invest through a financial intermediary or all Columbia Funds held with the fund complex if you invest directly with the Fund.
Not FDIC Insured • No bank guarantee • May lose value
Columbia Disciplined Small Core Fund (the Fund) mails one shareholder report to each shareholder address, unless such shareholder elected to receive shareholder reports from the Fund electronically. If you would like more than one report, please call shareholder services at 800.345.6611 and additional reports will be sent to you.
Proxy voting policies and procedures
The policy of the Board of Trustees is to vote the proxies of the companies in which the Fund holds investments consistent with the procedures as stated in the Statement of Additional Information (SAI). You may obtain a copy of the SAI without charge by calling 800.345.6611; contacting your financial intermediary; visiting columbiathreadneedleus.com/investor/; or searching the website of the Securities and Exchange Commission (SEC) at sec.gov. Information regarding how the Fund voted proxies relating to portfolio securities is filed with the SEC by August 31st for the most recent 12-month period ending June 30th of that year, and is available without charge by visiting columbiathreadneedleus.com/investor/, or searching the website of the SEC at sec.gov.
Quarterly schedule of investments
The Fund files a complete schedule of portfolio holdings with the SEC for the first and third quarters of each fiscal year on Form N-PORT, and for reporting periods ended prior to March 31, 2019, on Form N-Q. The Fund’s Form N-Q and Form N-PORT filings are available on the SEC’s website at sec.gov. The Fund’s complete schedule of portfolio holdings, as filed on Form N-Q or Form N-PORT, can also be obtained without charge, upon request, by calling 800.345.6611.
Additional Fund information
For more information about the Fund, please visit columbiathreadneedleus.com/investor/ or call 800.345.6611. Customer Service Representatives are available to answer your questions Monday through Friday from 8 a.m. to 7 p.m. Eastern time.
Fund investment manager
Columbia Management Investment Advisers, LLC (the Investment Manager)
225 Franklin Street
Boston, MA 02110
Fund distributor
Columbia Management Investment Distributors, Inc.
225 Franklin Street
Boston, MA 02110
Fund transfer agent
Columbia Management Investment Services Corp.
P.O. Box 219104
Kansas City, MO 64121-9104
Columbia Disciplined Small Core Fund | Annual Report 2019
Investment objective
The Fund seeks long-term capital appreciation.
Portfolio management
Brian Condon, CFA
Co-Portfolio Manager
Managed Fund since 2016
Peter Albanese
Co-Portfolio Manager
Managed Fund since 2017
Morningstar style boxTM
The Morningstar Style Box is based on a fund’s portfolio holdings. For equity funds, the vertical axis shows the market capitalization of the stocks owned, and the horizontal axis shows investment style (value, blend, or growth). Information shown is based on the most recent data provided by Morningstar.
© 2019 Morningstar, Inc. All rights reserved. The Morningstar information contained herein: (1) is proprietary to Morningstar and/or its content providers; (2) may not be copied or distributed; and (3) is not warranted to be accurate, complete or timely. Neither Morningstar nor its content providers are responsible for any damages or losses arising from any use of this information.
| Average annual total returns (%) (for the period ended August 31, 2019) |
| | | Inception | 1 Year | 5 Years | 10 Years |
| Class A | Excluding sales charges | 11/01/98 | -19.21 | -0.16 | 7.57 |
| | Including sales charges | | -23.87 | -1.33 | 6.94 |
| Advisor Class* | 11/08/12 | -19.11 | 0.07 | 7.83 |
| Class C | Excluding sales charges | 11/18/02 | -19.95 | -0.95 | 6.75 |
| | Including sales charges | | -20.34 | -0.95 | 6.75 |
| Institutional Class | 12/14/92 | -18.92 | 0.11 | 7.85 |
| Institutional 2 Class* | 11/08/12 | -18.91 | 0.22 | 7.95 |
| Institutional 3 Class* | 11/08/12 | -18.92 | 0.25 | 7.98 |
| Class V | Excluding sales charges | 02/12/93 | -19.32 | -0.19 | 7.54 |
| | Including sales charges | | -23.99 | -1.36 | 6.90 |
| Russell 2000 Index | | -12.89 | 6.41 | 11.59 |
| S&P SmallCap 600 Index | | -15.06 | 7.97 | 13.22 |
Returns for Class A shares and Class V shares are shown with and without the maximum initial sales charge of 5.75%. Returns for Class C shares are shown with and without the 1.00% contingent deferred sales charge for the first year only. The Fund’s other share classes are not subject to sales charges and have limited eligibility. Please see the Fund’s prospectus for details. Performance for different share classes will vary based on differences in sales charges and fees associated with each share class. All results shown assume reinvestment of distributions during the period. Returns do not reflect the deduction of taxes that a shareholder may pay on Fund distributions or on the redemption of Fund shares. Performance results reflect the effect of any fee waivers or reimbursements of Fund expenses by Columbia Management Investment Advisers, LLC and/or any of its affiliates. Absent these fee waivers or expense reimbursement arrangements, performance results would have been lower.
The performance information shown represents past performance and is not a guarantee of future results. The investment return and principal value of your investment will fluctuate so that your shares, when redeemed, may be worth more or less than their original cost. Current performance may be lower or higher than the performance information shown. You may obtain performance information current to the most recent month-end by contacting your financial intermediary, visiting columbiathreadneedleus.com/investor/ or calling 800.345.6611.
| * | The returns shown for periods prior to the share class inception date (including returns for the Life of the Fund, if shown, which are since Fund inception) include the returns of the Fund’s oldest share class. These returns are adjusted to reflect any higher class-related operating expenses of the newer share classes, as applicable. Please visit columbiathreadneedleus.com/investor/investment-products/mutual-funds/appended-performance for more information. |
The Russell 2000 Index measures the performance of the small-cap segment of the U.S. equity universe. The Russell 2000 is a subset of the Russell 3000 Index representing approximately 10% of the total market capitalization of that index. It includes the securities of approximately 2,000 of the smallest companies in the Russell 3000 Index based on a combination of their market capitalization and current index membership.
The S&P SmallCap 600 Index tracks the performance of 600 domestic companies traded on major stock exchanges. The S&P SmallCap 600 is heavily weighted with the stocks of companies with small market capitalizations.
Indices are not available for investment, are not professionally managed and do not reflect sales charges, fees, brokerage commissions, taxes or other expenses of investing. Securities in the Fund may not match those in an index.
Columbia Disciplined Small Core Fund | Annual Report 2019
| 3 |
Fund at a Glance (continued)
Performance of a hypothetical $10,000 investment (August 31, 2009 — August 31, 2019)
The chart above shows the change in value of a hypothetical $10,000 investment in Class A shares of Columbia Disciplined Small Core Fund during the stated time period, and does not reflect the deduction of taxes that a shareholder may pay on Fund distributions or on the redemption of Fund shares.
| Top 10 holdings (%) (at August 31, 2019) |
| Portland General Electric Co. | 0.8 |
| Radian Group, Inc. | 0.8 |
| Essent Group Ltd. | 0.8 |
| Southwest Gas Holdings, Inc. | 0.8 |
| j2 Global, Inc. | 0.8 |
| PS Business Parks, Inc. | 0.8 |
| Syneos Health, Inc. | 0.8 |
| Cirrus Logic, Inc. | 0.7 |
| Medpace Holdings, Inc. | 0.7 |
| Federated Investors, Inc., Class B | 0.7 |
Percentages indicated are based upon total investments excluding Money Market Funds and investments in derivatives, if any.
For further detail about these holdings, please refer to the section entitled “Portfolio of Investments.”
Fund holdings are as of the date given, are subject to change at any time, and are not recommendations to buy or sell any security.
| Portfolio breakdown (%) (at August 31, 2019) |
| Common Stocks | 100.0 |
| Total | 100.0 |
Percentages indicated are based upon total investments excluding investments in derivatives, if any. The Fund’s portfolio composition is subject to change.
| Equity sector breakdown (%) (at August 31, 2019) |
| Communication Services | 2.9 |
| Consumer Discretionary | 11.2 |
| Consumer Staples | 3.3 |
| Energy | 3.2 |
| Financials | 17.9 |
| Health Care | 16.3 |
| Industrials | 16.0 |
| Information Technology | 14.1 |
| Materials | 3.4 |
| Real Estate | 7.8 |
| Utilities | 3.9 |
| Total | 100.0 |
Percentages indicated are based upon total equity investments. The Fund’s portfolio composition is subject to change.
| 4 | Columbia Disciplined Small Core Fund | Annual Report 2019 |
Manager Discussion of Fund Performance
For the 12-month period that ended August 31, 2019, the Fund’s Class A shares returned -19.21% excluding sales charges. The Fund underperformed the Russell 2000 Index, which returned -12.89%, and the S&P SmallCap 600 Index, which returned -15.06%, for the same period. Stock selection detracted from the Fund’s relative results, while sector allocation contributed positively, albeit modestly.
Small-cap U.S. equity markets declined amid heightened volatility
The period began in September 2018 with U.S. equity markets continuing their climb from earlier in the year, supported by a growing U.S. economy and strong corporate earnings, each, in turn, fueled in large part by December 2017’s tax reform legislation. The U.S. equity market rally came to an end in the fourth quarter of 2018, as investors grappled with the U.S. Federal Reserve (Fed) continuing to raise interest rates, the sharp slowdown in eurozone business confidence, weaker economic growth in China and heightened geopolitical concerns, including trade and tariff tensions. Long dormant volatility spiked, and U.S. equity markets declined precipitously in the final weeks of the calendar year. This sharp sell-off then set the stage for the nearly equally dramatic rally in the first quarter of 2019, as much of the ground lost in December 2018 was retraced. Following a relative calm in ongoing U.S.-China trade negotiations, volatility then returned in the second quarter of 2019 amid signs that trade talks had soured. Offsetting this disappointment was the apparent change in the stance of the Fed, which had adopted a more dovish posture with respect to the direction of interest rates — a shift much applauded by the U.S. equity markets. On July 31, 2019, the Fed lowered interest rates for the first time since 2008 to help stave off the possibility of an economic downturn. August 2019 headlines were dominated by trade tensions, as the U.S. administration announced its intention to impose tariffs on Chinese goods not yet subject to tariffs, causing increased market volatility. Economic data was largely mixed, with manufacturing data and consumer confidence showing signs of weakness, but domestic demand steady in the context of a strong labor market and rising wages. Against this increasingly uncertain backdrop, wherein longer term U.S. Treasury yields declined significantly, small-cap equities struggled significantly more than their larger cap counterparts.
Growth stocks outperformed value stocks
Risk-off sentiment impacted the performance of companies with varying quantitative factors differently. Stocks characterized by low beta, low volatility, high momentum, larger capitalization and higher dividend yields were generally in favor during the period. Conversely, high growth stocks and stocks with lower valuations were out of favor.
Our stock selection model generated mixed results during the period. We divide the metrics for our stock selection model into three broad categories: valuation, catalyst and quality. We then rank the securities within a sector/industry from “1” (most attractive) to “5” (least attractive) based upon the metrics within these categories. During the period, our quality and catalyst models outperformed the Russell 2000 Index, becoming especially potent due to market trends toward low volatility and high momentum stocks, respectively. The value model, however, materially underperformed the Russell 2000 Index, as the divergence in performance between growth stocks and value stocks amplified. For the period overall, growth strategies significantly outperformed value strategies across the capitalization spectrum.
A persistently low interest rate environment has historically promoted financing and shifted investor sentiment toward growth-oriented companies. This was immediately apparent following the 2008 financial crisis when the effective federal funds rate fell and the returns of value stocks and growth stocks diverged. The margin between these equity segments increased during the last decade and widened at an elevated pace as interest rate cuts resumed this past summer. Consequently, the value component of our quantitative stock selection model corresponded to disappointing returns, as effective rates fell and growth remained aligned with momentum. In other words, the value and catalyst model categories operated in opposition due to the extremity of the market’s bias toward momentum amid falling rates.
Stock selection overall detracted from returns
As usual, the Fund maintained a relatively neutral stance on sector allocation, though sector allocation did contribute positively, albeit modestly, to relative performance during the period. Stock selection overall, in eight of the 11 sectors of the Russell 2000 Index, detracted from the Fund’s performance relative to the Russell 2000 Index. Stock selection in the consumer discretionary, industrials and communication services sectors were the primary detractors from the Fund’s relative performance.
Columbia Disciplined Small Core Fund | Annual Report 2019
| 5 |
Manager Discussion of Fund Performance (continued)
Among the individual stocks detracting most from relative performance were Endo International, Weight Watchers International and Tailored Brands. Pharmaceutical company Endo International focuses on developing, manufacturing and distributing branded and generic pharmaceutical products. Its shares declined during the period due to reputational damage around a class action lawsuit. Weight Watchers International is a wellness company and commercial weight management program. During the period, the company’s management acknowledged its rebranding from a focus on weight loss to wellness may have cost it some momentum, but defended the move, stating it maintained conviction in its shift. Its shares were also pressured on weak subscriber growth and we exited the position. Tailored Brands engages in the retail of men’s suits and the provision of tuxedo rental under various brands, including Men’s Wearhouse and Joseph A. Bank. Both of these brands faced weakness in late 2018 that extended into 2019, causing negative comparative guidance, which, in turn, drove the company’s shares to decline significantly. We sold our position in Tailored Brands.
Health care and energy stock selection boosted returns
Stock selection in the health care and energy sectors contributed most positively to the Fund’s performance relative to the Russell 2000 Index during the period, followed at some distance by stock selection in the utilities sector.
Among the Fund’s greatest individual positive contributors were TESARO, Medpace Holdings and EVERTEC. TESARO, an out-of-benchmark holding, is an oncology-focused biopharmaceutical company. It posted a triple-digit positive return in anticipation of its acquisition by GlaxoSmithKline, which was completed in January 2019. (As a result of its acquisition, we no longer own TESARO.) Medpace Holdings is a contract research organization that engages in the provision of outsourced clinical development services to the biotechnology, pharmaceutical and medical device industries. Its shares gained, as long-term trends in the life science and biotechnology industries appeared intact and the funding environment appeared robust. EVERTEC is a full-service transaction processing business in Latin America, providing a broad range of merchant acquiring, payment processing and business solutions services. During the period, EVERTEC executed well and benefited from the long-term secular shift toward electronic forms of payment.
Portfolio construction process guided investment changes
While there were some changes in sector allocations and individual security positions during the period as a result of the Fund’s bottom-up stock selection process, all changes were quite modest, as we maintained our sector neutral investment approach. Within our stock selection model, we replaced the Credit Suisse HOLT Adjusted Value Target signal in all 11 sector models with other value factors and bolstered many investment themes with complementary and efficacious indicators. We believe that the updated models are more diversified and may exhibit better consistency of performance in different market regimes. We also completed a comprehensive review of our utilities sector models and put more emphasis on forward-looking valuation multiples, dividend growth, cash flow generation and business momentum. Finally, we adjusted factors to handle inconsistency in the quarterly cash flow numbers for managed care companies due to misaligned monthly premium payments, which improved stability and comparability.
Marketrisk may affect a single issuer, sector of the economy, industry or the market as a whole.Foreigninvestments subject the Fund to risks, including political, economic, market, social and others within a particular country, as well as to currency instabilities and less stringent financial and accounting standards generally applicable to U.S. issuers. Investments insmall-cap companies involve risks and volatility greater than investments in larger, more established companies. The Fund may invest significantly in issuers within a particularsector, which may be negatively affected by market, economic or other conditions, making the Fund more vulnerable to unfavorable developments in the sector. Investments selected usingquantitative methods may perform differently from the market as a whole and may not enable the Fund to achieve its objective. See the Fund’s prospectus for more information on these and other risks.
The views expressed in this report reflect the current views of the respective parties. These views are not guarantees of future performance and involve certain risks, uncertainties and assumptions that are difficult to predict, so actual outcomes and results may differ significantly from the views expressed. These views are subject to change at any time based upon economic, market or other conditions and the respective parties disclaim any responsibility to update such views. These views may not be relied on as investment advice and, because investment decisions for a Columbia fund are based on numerous factors, may not be relied on as an indication of trading intent on behalf of any particular Columbia fund. References to specific securities should not be construed as a recommendation or investment advice.
| 6 | Columbia Disciplined Small Core Fund | Annual Report 2019 |
Understanding Your Fund’s Expenses
(Unaudited)
As an investor, you incur two types of costs. There are shareholder transaction costs, which generally include sales charges on purchases and may include redemption fees. There are also ongoing fund costs, which generally include management fees, distribution and/or service fees, and other fund expenses. The following information is intended to help you understand your ongoing costs (in dollars) of investing in the Fund and to help you compare these costs with the ongoing costs of investing in other mutual funds.
Analyzing your Fund’s expenses
To illustrate these ongoing costs, we have provided examples and calculated the expenses paid by investors in each share class of the Fund during the period. The actual and hypothetical information in the table is based on an initial investment of $1,000 at the beginning of the period indicated and held for the entire period. Expense information is calculated two ways and each method provides you with different information. The amount listed in the “Actual” column is calculated using the Fund’s actual operating expenses and total return for the period. You may use the Actual information, together with the amount invested, to estimate the expenses that you paid over the period. Simply divide your account value by $1,000 (for example, an $8,600 account value divided by $1,000 = 8.6), then multiply the results by the expenses paid during the period under the “Actual” column. The amount listed in the “Hypothetical” column assumes a 5% annual rate of return before expenses (which is not the Fund’s actual return) and then applies the Fund’s actual expense ratio for the period to the hypothetical return. You should not use the hypothetical account values and expenses to estimate either your actual account balance at the end of the period or the expenses you paid during the period. See “Compare with other funds” below for details on how to use the hypothetical data.
Compare with other funds
Since all mutual funds are required to include the same hypothetical calculations about expenses in shareholder reports, you can use this information to compare the ongoing cost of investing in the Fund with other funds. To do so, compare the hypothetical example with the 5% hypothetical examples that appear in the shareholder reports of other funds. As you compare hypothetical examples of other funds, it is important to note that hypothetical examples are meant to highlight the ongoing costs of investing in a fund only and do not reflect any transaction costs, such as sales charges, or redemption or exchange fees. Therefore, the hypothetical calculations are useful in comparing ongoing costs only, and will not help you determine the relative total costs of owning different funds. If transaction costs were included in these calculations, your costs would be higher.
| March 1, 2019 — August 31, 2019 |
| | Account value at the
beginning of the
period ($) | Account value at the
end of the
period ($) | Expenses paid during
the period ($) | Fund’s annualized
expense ratio (%) |
| | Actual | Hypothetical | Actual | Hypothetical | Actual | Hypothetical | Actual |
| Class A | 1,000.00 | 1,000.00 | 901.30 | 1,018.40 | 6.34 | 6.73 | 1.33 |
| Advisor Class | 1,000.00 | 1,000.00 | 902.70 | 1,019.65 | 5.15 | 5.47 | 1.08 |
| Class C | 1,000.00 | 1,000.00 | 897.80 | 1,014.64 | 9.90 | 10.50 | 2.08 |
| Institutional Class | 1,000.00 | 1,000.00 | 902.90 | 1,019.65 | 5.15 | 5.47 | 1.08 |
| Institutional 2 Class | 1,000.00 | 1,000.00 | 903.90 | 1,020.26 | 4.58 | 4.86 | 0.96 |
| Institutional 3 Class | 1,000.00 | 1,000.00 | 903.80 | 1,020.51 | 4.34 | 4.61 | 0.91 |
| Class V | 1,000.00 | 1,000.00 | 900.40 | 1,018.40 | 6.34 | 6.73 | 1.33 |
Expenses paid during the period are equal to the annualized expense ratio for each class as indicated above, multiplied by the average account value over the period and then multiplied by the number of days in the Fund’s most recent fiscal half year and divided by 365.
Expenses do not include fees and expenses incurred indirectly by the Fund from its investment in underlying funds, including affiliated and non-affiliated pooled investment vehicles, such as mutual funds and exchange-traded funds.
Had Columbia Management Investment Advisers, LLC and/or certain of its affiliates not waived/reimbursed certain fees and expenses, account value at the end of the period would have been reduced.
Columbia Disciplined Small Core Fund | Annual Report 2019
| 7 |
Portfolio of Investments
August 31, 2019
(Percentages represent value of investments compared to net assets)
Investments in securities
| Common Stocks 97.0% |
| Issuer | Shares | Value ($) |
| Communication Services 2.8% |
| Entertainment 0.3% |
| Glu Mobile, Inc.(a) | 64,400 | 285,936 |
| Interactive Media & Services 0.5% |
| Meet Group, Inc. (The)(a) | 120,000 | 414,000 |
| Media 1.6% |
| Entravision Communications Corp., Class A | 56,800 | 173,808 |
| EW Scripps Co. (The), Class A | 5,400 | 66,744 |
| Gray Television, Inc.(a) | 11,900 | 182,070 |
| MSG Networks, Inc., Class A(a) | 17,700 | 290,280 |
| National CineMedia, Inc. | 56,100 | 460,020 |
| TEGNA, Inc. | 11,000 | 157,410 |
| Total | | 1,330,332 |
| Wireless Telecommunication Services 0.4% |
| Shenandoah Telecommunications Co. | 11,900 | 375,326 |
| Total Communication Services | 2,405,594 |
| Consumer Discretionary 10.9% |
| Auto Components 0.4% |
| Dana, Inc. | 8,300 | 105,659 |
| Modine Manufacturing Co.(a) | 24,100 | 246,061 |
| Total | | 351,720 |
| Distributors 0.6% |
| Core-Mark Holding Co., Inc. | 4,800 | 155,472 |
| Funko, Inc., Class A(a) | 15,600 | 374,244 |
| Total | | 529,716 |
| Diversified Consumer Services 0.7% |
| Collectors Universe, Inc. | 6,300 | 163,296 |
| K12, Inc.(a) | 16,300 | 429,505 |
| Total | | 592,801 |
| Hotels, Restaurants & Leisure 3.1% |
| Boyd Gaming Corp. | 2,300 | 55,292 |
| Brinker International, Inc. | 12,400 | 471,200 |
| Dave & Buster’s Entertainment, Inc. | 11,000 | 473,550 |
| Dine Brands Global, Inc. | 6,250 | 440,937 |
| Everi Holdings, Inc.(a) | 45,800 | 409,452 |
| Common Stocks (continued) |
| Issuer | Shares | Value ($) |
| Penn National Gaming, Inc.(a) | 15,200 | 291,384 |
| SeaWorld Entertainment, Inc.(a) | 18,000 | 522,180 |
| Total | | 2,663,995 |
| Household Durables 0.9% |
| Ethan Allen Interiors, Inc. | 4,500 | 77,400 |
| M/I Homes, Inc.(a) | 3,300 | 119,262 |
| Taylor Morrison Home Corp., Class A(a) | 22,700 | 541,622 |
| Total | | 738,284 |
| Internet & Direct Marketing Retail 0.3% |
| Stamps.com, Inc.(a) | 4,350 | 279,966 |
| Leisure Products 1.0% |
| Malibu Boats, Inc., Class A(a) | 16,000 | 445,120 |
| MasterCraft Boat Holdings, Inc.(a) | 11,000 | 166,650 |
| Sturm Ruger & Co., Inc. | 5,400 | 221,454 |
| Total | | 833,224 |
| Specialty Retail 2.6% |
| Bed Bath & Beyond, Inc. | 29,700 | 287,199 |
| Genesco, Inc.(a) | 9,700 | 346,096 |
| Hibbett Sports, Inc.(a) | 19,600 | 324,184 |
| Lithia Motors, Inc., Class A | 3,550 | 465,298 |
| Office Depot, Inc. | 169,800 | 220,740 |
| Rent-A-Center, Inc.(a) | 15,850 | 404,651 |
| Shoe Carnival, Inc. | 6,100 | 187,514 |
| Total | | 2,235,682 |
| Textiles, Apparel & Luxury Goods 1.3% |
| Crocs, Inc.(a) | 2,400 | 53,520 |
| Deckers Outdoor Corp.(a) | 3,450 | 508,703 |
| Fossil Group, Inc.(a) | 30,800 | 394,240 |
| Movado Group, Inc. | 5,200 | 111,904 |
| Vera Bradley, Inc.(a) | 6,000 | 63,540 |
| Total | | 1,131,907 |
| Total Consumer Discretionary | 9,357,295 |
The accompanying Notes to Financial Statements are an integral part of this statement.
| 8 | Columbia Disciplined Small Core Fund | Annual Report 2019 |
Portfolio of Investments (continued)
August 31, 2019
| Common Stocks (continued) |
| Issuer | Shares | Value ($) |
| Consumer Staples 3.2% |
| Food & Staples Retailing 0.8% |
| Ingles Markets, Inc., Class A | 9,700 | 377,136 |
| SpartanNash Co. | 30,300 | 326,331 |
| Total | | 703,467 |
| Food Products 0.6% |
| John B. Sanfilippo & Son, Inc. | 5,600 | 518,560 |
| Personal Products 1.3% |
| Edgewell Personal Care Co.(a) | 9,500 | 264,480 |
| Medifast, Inc. | 4,350 | 434,826 |
| Usana Health Sciences, Inc.(a) | 5,980 | 406,461 |
| Total | | 1,105,767 |
| Tobacco 0.5% |
| Universal Corp. | 5,300 | 265,318 |
| Vector Group Ltd. | 9,900 | 115,632 |
| Total | | 380,950 |
| Total Consumer Staples | 2,708,744 |
| Energy 3.1% |
| Energy Equipment & Services 1.4% |
| C&J Energy Services, Inc.(a) | 13,500 | 129,060 |
| Keane Group, Inc.(a) | 78,200 | 414,460 |
| Liberty Oilfield Services, Inc., Class A | 12,800 | 137,856 |
| Matrix Service Co.(a) | 24,800 | 492,776 |
| Total | | 1,174,152 |
| Oil, Gas & Consumable Fuels 1.7% |
| California Resources Corp.(a) | 20,400 | 199,716 |
| CVR Energy, Inc. | 11,000 | 437,580 |
| Delek U.S. Holdings, Inc. | 12,000 | 393,000 |
| Denbury Resources, Inc.(a) | 73,200 | 79,056 |
| REX American Resources Corp.(a) | 1,850 | 127,058 |
| Southwestern Energy Co.(a) | 49,000 | 77,420 |
| W&T Offshore, Inc.(a) | 7,800 | 34,164 |
| World Fuel Services Corp. | 4,000 | 153,600 |
| Total | | 1,501,594 |
| Total Energy | 2,675,746 |
| Common Stocks (continued) |
| Issuer | Shares | Value ($) |
| Financials 17.3% |
| Banks 7.8% |
| Bancorp, Inc. (The)(a) | 53,500 | 488,455 |
| Bank of NT Butterfield & Son Ltd. (The) | 8,600 | 237,016 |
| Cadence BanCorp | 12,000 | 184,440 |
| Cathay General Bancorp | 16,600 | 550,954 |
| Customers Bancorp, Inc.(a) | 22,450 | 424,081 |
| Enterprise Financial Services Corp. | 3,900 | 153,738 |
| First BanCorp | 53,800 | 515,404 |
| Fulton Financial Corp. | 24,100 | 384,395 |
| Hancock Whitney Corp. | 15,000 | 526,650 |
| Hilltop Holdings, Inc. | 22,100 | 524,875 |
| Hope Bancorp, Inc. | 19,400 | 260,154 |
| Iberiabank Corp. | 8,550 | 589,864 |
| International Bancshares Corp. | 14,300 | 508,937 |
| Metropolitan Bank Holding Corp.(a) | 1,500 | 54,300 |
| OFG Bancorp | 24,300 | 498,636 |
| Preferred Bank | 10,100 | 504,596 |
| United Community Banks, Inc. | 11,300 | 298,433 |
| Total | | 6,704,928 |
| Capital Markets 1.8% |
| Cohen & Steers, Inc. | 8,800 | 474,584 |
| Federated Investors, Inc., Class B | 18,800 | 602,352 |
| Waddell & Reed Financial, Inc., Class A | 29,200 | 472,164 |
| Total | | 1,549,100 |
| Consumer Finance 1.2% |
| Enova International, Inc.(a) | 19,300 | 461,270 |
| Nelnet, Inc., Class A | 8,350 | 559,868 |
| Total | | 1,021,138 |
| Insurance 1.8% |
| American Equity Investment Life Holding Co. | 16,300 | 351,265 |
| Employers Holdings, Inc. | 12,600 | 543,438 |
| Genworth Financial, Inc., Class A(a) | 56,200 | 248,966 |
| Selective Insurance Group, Inc. | 1,450 | 115,463 |
| Universal Insurance Holdings, Inc. | 12,100 | 302,500 |
| Total | | 1,561,632 |
The accompanying Notes to Financial Statements are an integral part of this statement.
Columbia Disciplined Small Core Fund | Annual Report 2019
| 9 |
Portfolio of Investments (continued)
August 31, 2019
| Common Stocks (continued) |
| Issuer | Shares | Value ($) |
| Mortgage Real Estate Investment Trusts (REITS) 1.3% |
| Ellington Financial, Inc. | 22,200 | 387,834 |
| New York Mortgage Trust, Inc. | 16,500 | 101,475 |
| PennyMac Mortgage Investment Trust | 22,600 | 491,776 |
| Western Asset Mortgage Capital Corp. | 17,100 | 160,740 |
| Total | | 1,141,825 |
| Thrifts & Mortgage Finance 3.4% |
| Essent Group Ltd.(a) | 14,300 | 693,550 |
| Federal Agricultural Mortgage Corp. | 6,650 | 547,627 |
| Merchants Bancorp | 5,800 | 91,988 |
| NMI Holdings, Inc., Class A(a) | 19,000 | 538,460 |
| Radian Group, Inc. | 31,000 | 699,050 |
| Washington Federal, Inc. | 9,200 | 327,520 |
| Total | | 2,898,195 |
| Total Financials | 14,876,818 |
| Health Care 15.8% |
| Biotechnology 6.2% |
| ACADIA Pharmaceuticals, Inc.(a) | 8,280 | 229,025 |
| Alder Biopharmaceuticals, Inc.(a) | 25,011 | 223,849 |
| Apellis Pharmaceuticals, Inc.(a) | 7,530 | 219,123 |
| Arena Pharmaceuticals, Inc.(a) | 4,650 | 245,939 |
| ArQule, Inc.(a) | 8,400 | 75,264 |
| Arrowhead Pharmaceuticals, Inc.(a) | 4,290 | 146,589 |
| Atara Biotherapeutics, Inc.(a) | 8,630 | 116,505 |
| bluebird bio, Inc.(a) | 2,040 | 210,752 |
| Blueprint Medicines Corp.(a) | 3,860 | 295,946 |
| Clovis Oncology, Inc.(a) | 5,925 | 33,239 |
| Dynavax Technologies Corp.(a) | 16,565 | 68,579 |
| FibroGen, Inc.(a) | 3,470 | 154,970 |
| Gossamer Bio, Inc.(a) | 8,271 | 173,360 |
| Immunomedics, Inc.(a) | 33,010 | 422,528 |
| Insmed, Inc.(a) | 14,340 | 235,750 |
| Medicines Co. (The)(a) | 7,230 | 303,371 |
| Mirati Therapeutics, Inc.(a) | 3,510 | 287,715 |
| Precision BioSciences, Inc.(a) | 15,414 | 131,327 |
| Repligen Corp.(a) | 2,130 | 197,685 |
| Rubius Therapeutics, Inc.(a) | 12,210 | 113,309 |
| Sage Therapeutics, Inc.(a) | 1,800 | 309,006 |
| Common Stocks (continued) |
| Issuer | Shares | Value ($) |
| Sarepta Therapeutics, Inc.(a) | 2,275 | 205,091 |
| TCR2 Therapeutics, Inc.(a) | 15,290 | 257,790 |
| Turning Point Therapeutics, Inc.(a) | 5,008 | 273,086 |
| Ultragenyx Pharmaceutical, Inc.(a) | 2,390 | 130,183 |
| uniQure NV(a) | 4,620 | 250,635 |
| Total | | 5,310,616 |
| Health Care Equipment & Supplies 3.6% |
| CryoLife, Inc.(a) | 11,500 | 308,200 |
| Integer Holdings Corp.(a) | 7,350 | 532,140 |
| Lantheus Holdings, Inc.(a) | 18,700 | 406,912 |
| Meridian Bioscience, Inc. | 39,500 | 364,585 |
| Natus Medical, Inc.(a) | 5,000 | 138,400 |
| NuVasive, Inc.(a) | 3,800 | 241,376 |
| Quidel Corp.(a) | 9,250 | 583,212 |
| Varex Imaging Corp.(a) | 15,200 | 400,520 |
| Zynex, Inc. | 9,800 | 87,612 |
| Total | | 3,062,957 |
| Health Care Providers & Services 2.1% |
| Amedisys, Inc.(a) | 800 | 102,968 |
| AMN Healthcare Services, Inc.(a) | 3,700 | 216,080 |
| Corvel Corp.(a) | 5,500 | 463,265 |
| Ensign Group, Inc. (The) | 3,600 | 179,640 |
| Magellan Health, Inc.(a) | 7,300 | 459,973 |
| Tenet Healthcare Corp.(a) | 10,700 | 231,655 |
| Triple-S Management Corp., Class B(a) | 8,873 | 182,074 |
| Total | | 1,835,655 |
| Health Care Technology 0.3% |
| HealthStream, Inc.(a) | 11,200 | 283,024 |
| Life Sciences Tools & Services 1.4% |
| Medpace Holdings, Inc.(a) | 7,450 | 602,780 |
| Syneos Health, Inc.(a) | 12,100 | 635,613 |
| Total | | 1,238,393 |
| Pharmaceuticals 2.2% |
| Aerie Pharmaceuticals, Inc.(a) | 7,760 | 168,081 |
| Amphastar Pharmaceuticals, Inc.(a) | 4,200 | 94,332 |
| ANI Pharmaceuticals, Inc.(a) | 5,450 | 356,975 |
| Endo International PLC(a) | 53,900 | 127,743 |
| GW Pharmaceuticals PLC, ADR(a) | 1,795 | 255,626 |
The accompanying Notes to Financial Statements are an integral part of this statement.
| 10 | Columbia Disciplined Small Core Fund | Annual Report 2019 |
Portfolio of Investments (continued)
August 31, 2019
| Common Stocks (continued) |
| Issuer | Shares | Value ($) |
| Horizon Therapeutics PLC(a) | 5,590 | 154,452 |
| Odonate Therapeutics, Inc.(a) | 9,700 | 298,857 |
| Reata Pharmaceuticals, Inc., Class A(a) | 3,080 | 237,468 |
| Supernus Pharmaceuticals, Inc.(a) | 6,455 | 174,479 |
| Total | | 1,868,013 |
| Total Health Care | 13,598,658 |
| Industrials 15.6% |
| Aerospace & Defense 0.1% |
| Vectrus, Inc.(a) | 1,400 | 56,644 |
| Air Freight & Logistics 0.3% |
| Echo Global Logistics, Inc.(a) | 13,200 | 264,528 |
| Building Products 3.8% |
| Advanced Drainage Systems, Inc. | 16,400 | 514,796 |
| American Woodmark Corp.(a) | 6,050 | 498,338 |
| Builders FirstSource, Inc.(a) | 29,400 | 571,830 |
| Continental Building Product(a) | 10,300 | 258,942 |
| CSW Industrials, Inc. | 4,250 | 289,893 |
| Gibraltar Industries, Inc.(a) | 11,320 | 455,856 |
| Masonite International Corp.(a) | 3,300 | 176,187 |
| Quanex Building Products Corp. | 25,600 | 440,832 |
| Total | | 3,206,674 |
| Commercial Services & Supplies 1.7% |
| Deluxe Corp. | 5,800 | 267,264 |
| Ennis, Inc. | 11,600 | 233,276 |
| Herman Miller, Inc. | 12,600 | 532,728 |
| HNI Corp. | 13,000 | 405,470 |
| Total | | 1,438,738 |
| Construction & Engineering 1.8% |
| EMCOR Group, Inc. | 4,850 | 424,084 |
| Great Lakes Dredge & Dock Corp.(a) | 50,170 | 543,843 |
| MasTec, Inc.(a) | 9,500 | 597,265 |
| Total | | 1,565,192 |
| Electrical Equipment 0.6% |
| Atkore International Group, Inc.(a) | 18,800 | 545,388 |
| Machinery 2.7% |
| Barnes Group, Inc. | 5,100 | 228,735 |
| EnPro Industries, Inc. | 7,750 | 482,670 |
| Federal Signal Corp. | 5,000 | 148,550 |
| Common Stocks (continued) |
| Issuer | Shares | Value ($) |
| Gorman-Rupp Co. | 3,100 | 92,597 |
| Hillenbrand, Inc. | 2,500 | 68,600 |
| Mueller Industries, Inc. | 10,900 | 287,324 |
| Rexnord Corp.(a) | 22,400 | 586,432 |
| Wabash National Corp. | 31,600 | 431,024 |
| Total | | 2,325,932 |
| Professional Services 2.6% |
| Barrett Business Services, Inc. | 4,250 | 370,302 |
| Heidrick & Struggles International, Inc. | 14,900 | 395,595 |
| Insperity, Inc. | 575 | 56,960 |
| Kforce, Inc. | 14,700 | 478,338 |
| Korn/Ferry International | 10,100 | 394,708 |
| TriNet Group, Inc.(a) | 8,000 | 537,040 |
| Total | | 2,232,943 |
| Road & Rail 0.4% |
| ArcBest Corp. | 8,800 | 260,568 |
| YRC Worldwide, Inc.(a) | 42,400 | 92,432 |
| Total | | 353,000 |
| Trading Companies & Distributors 1.6% |
| Applied Industrial Technologies, Inc. | 9,230 | 492,790 |
| BMC Stock Holdings, Inc.(a) | 22,200 | 564,546 |
| Foundation Building Materials, Inc.(a) | 8,300 | 142,179 |
| Titan Machinery, Inc.(a) | 11,400 | 171,684 |
| Total | | 1,371,199 |
| Total Industrials | 13,360,238 |
| Information Technology 13.7% |
| Communications Equipment 0.9% |
| Acacia Communications, Inc.(a) | 4,200 | 264,810 |
| ADTRAN, Inc. | 22,510 | 231,178 |
| Extreme Networks, Inc.(a) | 39,900 | 266,532 |
| Total | | 762,520 |
| Electronic Equipment, Instruments & Components 3.0% |
| AVX Corp. | 13,900 | 188,345 |
| Badger Meter, Inc. | 1,200 | 61,896 |
| Belden, Inc. | 6,800 | 310,148 |
| Benchmark Electronics, Inc. | 6,500 | 172,120 |
| Fabrinet(a) | 11,300 | 570,537 |
| PC Connection, Inc. | 12,700 | 447,421 |
The accompanying Notes to Financial Statements are an integral part of this statement.
Columbia Disciplined Small Core Fund | Annual Report 2019
| 11 |
Portfolio of Investments (continued)
August 31, 2019
| Common Stocks (continued) |
| Issuer | Shares | Value ($) |
| Tech Data Corp.(a) | 4,750 | 440,467 |
| Vishay Intertechnology, Inc. | 25,300 | 400,499 |
| Total | | 2,591,433 |
| IT Services 3.4% |
| Cardtronics PLC, Class A(a) | 16,500 | 488,730 |
| Cass Information Systems, Inc. | 1,960 | 99,176 |
| EVERTEC, Inc. | 16,500 | 575,190 |
| KBR, Inc. | 18,900 | 482,328 |
| MAXIMUS, Inc. | 4,800 | 369,312 |
| Perspecta, Inc. | 15,300 | 397,035 |
| TTEC Holdings, Inc. | 10,500 | 492,555 |
| Total | | 2,904,326 |
| Semiconductors & Semiconductor Equipment 2.6% |
| Amkor Technology, Inc.(a) | 59,000 | 516,250 |
| Cirrus Logic, Inc.(a) | 11,600 | 622,224 |
| Diodes, Inc.(a) | 11,100 | 405,705 |
| MACOM Technology Solutions Holdings, Inc.(a) | 12,400 | 243,536 |
| Synaptics, Inc.(a) | 14,900 | 477,098 |
| Total | | 2,264,813 |
| Software 3.8% |
| Bottomline Technologies de, Inc.(a) | 3,100 | 127,844 |
| CommVault Systems, Inc.(a) | 11,300 | 490,081 |
| Intelligent Systems Corp.(a) | 3,600 | 190,404 |
| j2 Global, Inc. | 7,775 | 657,765 |
| Progress Software Corp. | 13,600 | 513,808 |
| Qualys, Inc.(a) | 3,350 | 266,727 |
| SPS Commerce, Inc.(a) | 9,600 | 485,184 |
| Tenable Holdings, Inc.(a) | 5,400 | 123,120 |
| TiVo Corp. | 52,700 | 396,831 |
| Total | | 3,251,764 |
| Total Information Technology | 11,774,856 |
| Materials 3.3% |
| Chemicals 1.4% |
| Chase Corp. | 1,800 | 180,396 |
| Ingevity Corp.(a) | 6,200 | 472,254 |
| Quaker Chemical Corp. | 875 | 139,002 |
| Stepan Co. | 4,000 | 381,560 |
| Total | | 1,173,212 |
| Common Stocks (continued) |
| Issuer | Shares | Value ($) |
| Construction Materials 0.2% |
| U.S. Concrete, Inc.(a) | 3,400 | 137,768 |
| Metals & Mining 1.1% |
| Materion Corp. | 8,500 | 500,140 |
| Schnitzer Steel Industries, Inc., Class A | 20,300 | 449,442 |
| Total | | 949,582 |
| Paper & Forest Products 0.6% |
| Louisiana-Pacific Corp. | 18,900 | 454,356 |
| Verso Corp., Class A(a) | 9,500 | 96,995 |
| Total | | 551,351 |
| Total Materials | 2,811,913 |
| Real Estate 7.6% |
| Equity Real Estate Investment Trusts (REITS) 7.0% |
| American Assets Trust, Inc. | 11,100 | 520,146 |
| Braemar Hotels & Resorts, Inc. | 15,600 | 143,052 |
| CareTrust REIT, Inc. | 9,100 | 216,489 |
| CoreCivic, Inc. | 27,000 | 457,650 |
| CorEnergy Infrastructure Trust, Inc. | 11,006 | 496,481 |
| EastGroup Properties, Inc. | 4,675 | 582,131 |
| GEO Group, Inc. (The) | 26,300 | 451,308 |
| Investors Real Estate Trust | 7,698 | 533,086 |
| Lexington Realty Trust | 50,300 | 522,617 |
| Piedmont Office Realty Trust, Inc. | 10,700 | 211,218 |
| PS Business Parks, Inc. | 3,655 | 656,475 |
| Ryman Hospitality Properties, Inc. | 1,550 | 123,473 |
| Uniti Group, Inc. | 60,600 | 447,834 |
| Washington Prime Group, Inc. | 89,600 | 289,408 |
| Xenia Hotels & Resorts, Inc. | 18,600 | 375,906 |
| Total | | 6,027,274 |
| Real Estate Management & Development 0.6% |
| RE/MAX Holdings, Inc., Class A | 1,900 | 48,773 |
| RMR Group, Inc. (The), Class A | 9,000 | 419,310 |
| Total | | 468,083 |
| Total Real Estate | 6,495,357 |
The accompanying Notes to Financial Statements are an integral part of this statement.
| 12 | Columbia Disciplined Small Core Fund | Annual Report 2019 |
Portfolio of Investments (continued)
August 31, 2019
| Common Stocks (continued) |
| Issuer | Shares | Value ($) |
| Utilities 3.7% |
| Electric Utilities 1.4% |
| Otter Tail Corp. | 1,100 | 55,682 |
| PNM Resources, Inc. | 8,900 | 453,989 |
| Portland General Electric Co. | 12,450 | 708,281 |
| Total | | 1,217,952 |
| Gas Utilities 1.4% |
| Chesapeake Utilities Corp. | 5,625 | 532,012 |
| Southwest Gas Holdings, Inc. | 7,600 | 693,348 |
| Total | | 1,225,360 |
| Multi-Utilities 0.9% |
| Avista Corp. | 5,500 | 257,950 |
| NorthWestern Corp. | 7,150 | 517,946 |
| Total | | 775,896 |
| Total Utilities | 3,219,208 |
Total Common Stocks
(Cost $84,005,552) | 83,284,427 |
Total Investments in Securities
(Cost: $84,005,552)(b) | 83,284,427 |
| Other Assets & Liabilities, Net | | 2,549,108 |
| Net Assets | 85,833,535 |
At August 31, 2019, securities and/or cash totaling $52,000 were pledged as collateral.
Investments in derivatives
| Long futures contracts |
| Description | Number of
contracts | Expiration
date | Trading
currency | Notional
amount | Value/Unrealized
appreciation ($) | Value/Unrealized
depreciation ($) |
| Russell 2000 E-mini | 36 | 09/2019 | USD | 2,689,560 | — | (29,472) |
Notes to Portfolio of Investments
| (a) | Non-income producing investment. |
| (b) | As defined in the Investment Company Act of 1940, an affiliated company is one in which the Fund owns 5% or more of the company’s outstanding voting securities, or a company which is under common ownership or control with the Fund. Holdings and transactions in these affiliated companies during the year ended August 31, 2019 are as follows: |
| Issuer | Beginning
shares | Shares
purchased | Shares
sold | Ending
shares | Realized gain
(loss) —
affiliated
issuers ($) | Net change in
unrealized
appreciation
(depreciation) —
affiliated
issuers ($) | Dividends —
affiliated
issuers ($) | Value —
affiliated
issuers
at end of
period ($) |
| Columbia Short-Term Cash Fund, 2.208% |
| | 2,838,511 | 23,140,643 | (25,979,154) | — | 88 | — | 38,640 | — |
The accompanying Notes to Financial Statements are an integral part of this statement.
Columbia Disciplined Small Core Fund | Annual Report 2019
| 13 |
Portfolio of Investments (continued)
August 31, 2019
Abbreviation Legend
| ADR | American Depositary Receipt |
Currency Legend
Fair value measurements
The Fund categorizes its fair value measurements according to a three-level hierarchy that maximizes the use of observable inputs and minimizes the use of unobservable inputs by prioritizing that the most observable input be used when available. Observable inputs are those that market participants would use in pricing an investment based on market data obtained from sources independent of the reporting entity. Unobservable inputs are those that reflect the Fund’s assumptions about the information market participants would use in pricing an investment. An investment’s level within the fair value hierarchy is based on the lowest level of any input that is deemed significant to the asset’s or liability’s fair value measurement. The input levels are not necessarily an indication of the risk or liquidity associated with investments at that level. For example, certain U.S. government securities are generally high quality and liquid, however, they are reflected as Level 2 because the inputs used to determine fair value may not always be quoted prices in an active market.
Fair value inputs are summarized in the three broad levels listed below:
| ■ | Level 1 — Valuations based on quoted prices for investments in active markets that the Fund has the ability to access at the measurement date. Valuation adjustments are not applied to Level 1 investments. |
| ■ | Level 2 — Valuations based on other significant observable inputs (including quoted prices for similar securities, interest rates, prepayment speeds, credit risks, etc.). |
| ■ | Level 3 — Valuations based on significant unobservable inputs (including the Fund’s own assumptions and judgment in determining the fair value of investments). |
Inputs that are used in determining fair value of an investment may include price information, credit data, volatility statistics, and other factors. These inputs can be either observable or unobservable. The availability of observable inputs can vary between investments, and is affected by various factors such as the type of investment, and the volume and level of activity for that investment or similar investments in the marketplace. The inputs will be considered by the Investment Manager, along with any other relevant factors in the calculation of an investment’s fair value. The Fund uses prices and inputs that are current as of the measurement date, which may include periods of market dislocations. During these periods, the availability of prices and inputs may be reduced for many investments. This condition could cause an investment to be reclassified between the various levels within the hierarchy.
Investments falling into the Level 3 category are primarily supported by quoted prices from brokers and dealers participating in the market for those investments. However, these may be classified as Level 3 investments due to lack of market transparency and corroboration to support these quoted prices. Additionally, valuation models may be used as the pricing source for any remaining investments classified as Level 3. These models may rely on one or more significant unobservable inputs and/or significant assumptions by the Investment Manager. Inputs used in valuations may include, but are not limited to, financial statement analysis, capital account balances, discount rates and estimated cash flows, and comparable company data.
Under the direction of the Fund’s Board of Trustees (the Board), the Investment Manager’s Valuation Committee (the Committee) is responsible for overseeing the valuation procedures approved by the Board. The Committee consists of voting and non-voting members from various groups within the Investment Manager’s organization, including operations and accounting, trading and investments, compliance, risk management and legal.
The Committee meets at least monthly to review and approve valuation matters, which may include a description of specific valuation determinations, data regarding pricing information received from approved pricing vendors and brokers and the results of Board-approved valuation control policies and procedures (the Policies). The Policies address, among other things, instances when market quotations are or are not readily available, including recommendations of third party pricing vendors and a determination of appropriate pricing methodologies; events that require specific valuation determinations and assessment of fair value techniques; securities with a potential for stale pricing, including those that are illiquid, restricted, or in default; and the effectiveness of third party pricing vendors, including periodic reviews of vendors. The Committee meets more frequently, as needed, to discuss additional valuation matters, which may include the need to review back-testing results, review time-sensitive information or approve related valuation actions. The Committee reports to the Board, with members of the Committee meeting with the Board at each of its regularly scheduled meetings to discuss valuation matters and actions during the period, similar to those described earlier.
The following table is a summary of the inputs used to value the Fund’s investments at August 31, 2019:
| | Level 1 ($) | Level 2 ($) | Level 3 ($) | Total ($) |
| Investments in Securities | | | | |
| Common Stocks | | | | |
| Communication Services | 2,405,594 | — | — | 2,405,594 |
| Consumer Discretionary | 9,357,295 | — | — | 9,357,295 |
| Consumer Staples | 2,708,744 | — | — | 2,708,744 |
| Energy | 2,675,746 | — | — | 2,675,746 |
| Financials | 14,876,818 | — | — | 14,876,818 |
| Health Care | 13,598,658 | — | — | 13,598,658 |
| Industrials | 13,360,238 | — | — | 13,360,238 |
| Information Technology | 11,774,856 | — | — | 11,774,856 |
| Materials | 2,811,913 | — | — | 2,811,913 |
| Real Estate | 6,495,357 | — | — | 6,495,357 |
| Utilities | 3,219,208 | — | — | 3,219,208 |
| Total Common Stocks | 83,284,427 | — | — | 83,284,427 |
| Total Investments in Securities | 83,284,427 | — | — | 83,284,427 |
The accompanying Notes to Financial Statements are an integral part of this statement.
| 14 | Columbia Disciplined Small Core Fund | Annual Report 2019 |
Portfolio of Investments (continued)
August 31, 2019
Fair value measurements (continued)
| | Level 1 ($) | Level 2 ($) | Level 3 ($) | Total ($) |
| Investments in Derivatives | | | | |
| Liability | | | | |
| Futures Contracts | (29,472) | — | — | (29,472) |
| Total | 83,254,955 | — | — | 83,254,955 |
See the Portfolio of Investments for all investment classifications not indicated in the table.
Derivative instruments are valued at unrealized appreciation (depreciation).
The accompanying Notes to Financial Statements are an integral part of this statement.
Columbia Disciplined Small Core Fund | Annual Report 2019
| 15 |
Statement of Assets and Liabilities
August 31, 2019
| Assets | |
| Investments in securities, at value | |
| Unaffiliated issuers (cost $84,005,552) | $83,284,427 |
| Margin deposits on: | |
| Futures contracts | 52,000 |
| Receivable for: | |
| Investments sold | 2,532,772 |
| Capital shares sold | 4,963 |
| Dividends | 78,720 |
| Prepaid expenses | 602 |
| Trustees’ deferred compensation plan | 129,108 |
| Total assets | 86,082,592 |
| Liabilities | |
| Due to custodian | 19,676 |
| Payable for: | |
| Capital shares purchased | 38,814 |
| Variation margin for futures contracts | 11,705 |
| Management services fees | 2,028 |
| Distribution and/or service fees | 546 |
| Transfer agent fees | 13,975 |
| Compensation of chief compliance officer | 7 |
| Audit fees | 18,050 |
| Other expenses | 15,148 |
| Trustees’ deferred compensation plan | 129,108 |
| Total liabilities | 249,057 |
| Net assets applicable to outstanding capital stock | $85,833,535 |
| Represented by | |
| Paid in capital | 91,252,372 |
| Total distributable earnings (loss) (Note 2) | (5,418,837) |
| Total - representing net assets applicable to outstanding capital stock | $85,833,535 |
The accompanying Notes to Financial Statements are an integral part of this statement.
| 16 | Columbia Disciplined Small Core Fund | Annual Report 2019 |
Statement of Assets and Liabilities (continued)
August 31, 2019
| Class A | |
| Net assets | $27,782,296 |
| Shares outstanding | 5,847,126 |
| Net asset value per share | $4.75 |
| Maximum sales charge | 5.75% |
| Maximum offering price per share (calculated by dividing the net asset value per share by 1.0 minus the maximum sales charge for Class A shares) | $5.04 |
| Advisor Class | |
| Net assets | $991,157 |
| Shares outstanding | 172,236 |
| Net asset value per share | $5.75 |
| Class C | |
| Net assets | $2,685,103 |
| Shares outstanding | 1,603,683 |
| Net asset value per share | $1.67 |
| Institutional Class | |
| Net assets | $12,772,353 |
| Shares outstanding | 2,290,121 |
| Net asset value per share | $5.58 |
| Institutional 2 Class | |
| Net assets | $418,736 |
| Shares outstanding | 71,847 |
| Net asset value per share | $5.83 |
| Institutional 3 Class | |
| Net assets | $258,538 |
| Shares outstanding | 43,668 |
| Net asset value per share | $5.92 |
| Class V | |
| Net assets | $40,925,352 |
| Shares outstanding | 9,418,993 |
| Net asset value per share | $4.34 |
| Maximum sales charge | 5.75% |
| Maximum offering price per share (calculated by dividing the net asset value per share by 1.0 minus the maximum sales charge for Class V shares) | $4.60 |
The accompanying Notes to Financial Statements are an integral part of this statement.
Columbia Disciplined Small Core Fund | Annual Report 2019
| 17 |
Statement of Operations
Year Ended August 31, 2019
| Net investment income | |
| Income: | |
| Dividends — unaffiliated issuers | $1,731,611 |
| Dividends — affiliated issuers | 38,640 |
| Foreign taxes withheld | (1,708) |
| Total income | 1,768,543 |
| Expenses: | |
| Management services fees | 884,008 |
| Distribution and/or service fees | |
| Class A | 81,576 |
| Class C | 41,004 |
| Class T | 69 |
| Class V | 115,569 |
| Transfer agent fees | |
| Class A | 64,226 |
| Advisor Class | 2,418 |
| Class C | 8,135 |
| Institutional Class | 37,438 |
| Institutional 2 Class | 307 |
| Institutional 3 Class | 63 |
| Class T | 54 |
| Class V | 90,894 |
| Compensation of board members | 15,079 |
| Custodian fees | 14,026 |
| Printing and postage fees | 22,984 |
| Registration fees | 101,876 |
| Audit fees | 33,013 |
| Legal fees | 2,093 |
| Compensation of chief compliance officer | 40 |
| Other | 14,199 |
| Total expenses | 1,529,071 |
| Fees waived or expenses reimbursed by Investment Manager and its affiliates | (150,693) |
| Total net expenses | 1,378,378 |
| Net investment income | 390,165 |
| Realized and unrealized gain (loss) — net | |
| Net realized gain (loss) on: | |
| Investments — unaffiliated issuers | (1,428,930) |
| Investments — affiliated issuers | 88 |
| Futures contracts | (175,391) |
| Net realized loss | (1,604,233) |
| Net change in unrealized appreciation (depreciation) on: | |
| Investments — unaffiliated issuers | (23,609,719) |
| Futures contracts | (150,896) |
| Net change in unrealized appreciation (depreciation) | (23,760,615) |
| Net realized and unrealized loss | (25,364,848) |
| Net decrease in net assets resulting from operations | $(24,974,683) |
The accompanying Notes to Financial Statements are an integral part of this statement.
| 18 | Columbia Disciplined Small Core Fund | Annual Report 2019 |
Statement of Changes in Net Assets
| | Year Ended
August 31, 2019 | Year Ended
August 31, 2018 |
| Operations | | |
| Net investment income | $390,165 | $217,933 |
| Net realized gain (loss) | (1,604,233) | 29,489,716 |
| Net change in unrealized appreciation (depreciation) | (23,760,615) | (1,134,216) |
| Net increase (decrease) in net assets resulting from operations | (24,974,683) | 28,573,433 |
| Distributions to shareholders | | |
| Net investment income and net realized gains | | |
| Class A | (8,732,915) | |
| Advisor Class | (298,122) | |
| Class C | (2,286,002) | |
| Institutional Class | (4,509,687) | |
| Institutional 2 Class | (100,346) | |
| Institutional 3 Class | (70,786) | |
| Class T | (23,229) | |
| Class V | (13,199,232) | |
| Net investment income | | |
| Class A | | (117,801) |
| Advisor Class | | (3,861) |
| Institutional Class | | (157,929) |
| Institutional 2 Class | | (2,701) |
| Institutional 3 Class | | (288,519) |
| Class T | | (368) |
| Class V | | (150,990) |
| Net realized gains | | |
| Class A | | (8,786,999) |
| Advisor Class | | (147,372) |
| Class C | | (3,194,732) |
| Institutional Class | | (6,027,157) |
| Institutional 2 Class | | (84,852) |
| Institutional 3 Class | | (8,389,930) |
| Class T | | (27,419) |
| Class V | | (11,262,638) |
| Total distributions to shareholders (Note 2) | (29,220,319) | (38,643,268) |
| Increase (decrease) in net assets from capital stock activity | 649,238 | (59,793,571) |
| Total decrease in net assets | (53,545,764) | (69,863,406) |
| Net assets at beginning of year | 139,379,299 | 209,242,705 |
| Net assets at end of year | $85,833,535 | $139,379,299 |
| Excess of distributions over net investment income | $(129,108) | $(226,427) |
The accompanying Notes to Financial Statements are an integral part of this statement.
Columbia Disciplined Small Core Fund | Annual Report 2019
| 19 |
Statement of Changes in Net Assets (continued)
| | Year Ended | Year Ended |
| | August 31, 2019 | August 31, 2018 |
| | Shares | Dollars ($) | Shares | Dollars ($) |
| Capital stock activity |
| Class A | | | | |
| Subscriptions | 888,655 | 4,698,564 | 1,003,977 | 7,828,959 |
| Distributions reinvested | 1,529,127 | 7,553,890 | 962,296 | 7,082,498 |
| Redemptions | (1,818,328) | (10,141,615) | (2,418,383) | (19,062,523) |
| Net increase (decrease) | 599,454 | 2,110,839 | (452,110) | (4,151,066) |
| Advisor Class | | | | |
| Subscriptions | 31,081 | 212,866 | 118,622 | 1,046,725 |
| Distributions reinvested | 49,937 | 298,121 | 17,855 | 151,233 |
| Redemptions | (74,472) | (466,700) | (41,088) | (359,090) |
| Net increase | 6,546 | 44,287 | 95,389 | 838,868 |
| Class C | | | | |
| Subscriptions | 344,092 | 628,573 | 238,410 | 996,761 |
| Distributions reinvested | 1,084,924 | 1,898,617 | 725,953 | 2,831,219 |
| Redemptions | (1,157,717) | (2,152,318) | (1,653,648) | (7,002,867) |
| Net increase (decrease) | 271,299 | 374,872 | (689,285) | (3,174,887) |
| Institutional Class | | | | |
| Subscriptions | 267,867 | 1,692,305 | 427,057 | 3,736,189 |
| Distributions reinvested | 652,638 | 3,778,774 | 610,617 | 5,049,807 |
| Redemptions | (2,209,170) | (15,135,793) | (2,125,619) | (19,952,608) |
| Net decrease | (1,288,665) | (9,664,714) | (1,087,945) | (11,166,612) |
| Institutional 2 Class | | | | |
| Subscriptions | 33,987 | 214,869 | 27,494 | 260,982 |
| Distributions reinvested | 16,614 | 100,346 | 10,252 | 87,553 |
| Redemptions | (33,406) | (210,168) | (270,793) | (2,696,793) |
| Net increase (decrease) | 17,195 | 105,047 | (233,047) | (2,348,258) |
| Institutional 3 Class | | | | |
| Subscriptions | 11,643 | 76,191 | 104,501 | 962,885 |
| Distributions reinvested | 11,347 | 69,674 | 991,424 | 8,565,902 |
| Redemptions | (37,567) | (282,957) | (6,079,741) | (53,906,097) |
| Net decrease | (14,577) | (137,092) | (4,983,816) | (44,377,310) |
| Class T | | | | |
| Distributions reinvested | 4,656 | 23,001 | 3,746 | 27,567 |
| Redemptions | (17,980) | (85,412) | (7,342) | (56,483) |
| Net decrease | (13,324) | (62,411) | (3,596) | (28,916) |
| Class V | | | | |
| Subscriptions | 705,670 | 3,193,461 | 422,269 | 2,927,131 |
| Distributions reinvested | 2,145,976 | 9,699,811 | 1,197,764 | 8,264,569 |
| Redemptions | (1,016,835) | (5,014,862) | (887,544) | (6,577,090) |
| Net increase | 1,834,811 | 7,878,410 | 732,489 | 4,614,610 |
| Total net increase (decrease) | 1,412,739 | 649,238 | (6,621,921) | (59,793,571) |
The accompanying Notes to Financial Statements are an integral part of this statement.
| 20 | Columbia Disciplined Small Core Fund | Annual Report 2019 |
[THIS PAGE INTENTIONALLY LEFT BLANK]
Columbia Disciplined Small Core Fund | Annual Report 2019
| 21 |
The following table is intended to help you understand the Fund’s financial performance. Certain information reflects financial results for a single share of a class held for the periods shown. Per share net investment income (loss) amounts are calculated based on average shares outstanding during the period. Total return assumes reinvestment of all dividends and distributions, if any. Total return does not reflect payment of sales charges, if any. Total return and portfolio turnover are not annualized for periods of less than one year. The portfolio turnover rate is calculated without regard to purchase and sales transactions of short-term instruments and certain derivatives, if any. If such transactions were included, the Fund’s portfolio turnover rate may be higher.
| | Net asset value,
beginning of
period | Net
investment
income
(loss) | Net
realized
and
unrealized
gain (loss) | Increase
from
payment
by affiliate | Total from
investment
operations | Distributions
from net
investment
income | Distributions
from net
realized
gains | Total
distributions to
shareholders |
| Class A |
| Year Ended 8/31/2019 | $8.00 | 0.02 | (1.49) | — | (1.47) | (0.08) | (1.70) | (1.78) |
| Year Ended 8/31/2018 | $8.45 | (0.00)(c) | 1.26 | 0.00(c) | 1.26 | (0.02) | (1.69) | (1.71) |
| Year Ended 8/31/2017 | $11.81 | 0.02 | 0.94 | — | 0.96 | (0.03) | (4.29) | (4.32) |
| Year Ended 8/31/2016 | $16.72 | 0.00(c) | 0.65 | — | 0.65 | (0.01) | (5.55) | (5.56) |
| Year Ended 8/31/2015 | $19.57 | (0.06) | (1.21) | — | (1.27) | (0.01) | (1.57) | (1.58) |
| Advisor Class |
| Year Ended 8/31/2019 | $9.23 | 0.04 | (1.74) | — | (1.70) | (0.08) | (1.70) | (1.78) |
| Year Ended 8/31/2018 | $9.49 | 0.02 | 1.45 | 0.00(c) | 1.47 | (0.04) | (1.69) | (1.73) |
| Year Ended 8/31/2017 | $12.79 | 0.05 | 0.99 | — | 1.04 | (0.05) | (4.29) | (4.34) |
| Year Ended 8/31/2016 | $17.63 | 0.03 | 0.70 | — | 0.73 | (0.02) | (5.55) | (5.57) |
| Year Ended 8/31/2015 | $20.51 | (0.02) | (1.26) | — | (1.28) | (0.03) | (1.57) | (1.60) |
| Class C |
| Year Ended 8/31/2019 | $4.21 | (0.01) | (0.75) | — | (0.76) | (0.08) | (1.70) | (1.78) |
| Year Ended 8/31/2018 | $5.21 | (0.03) | 0.72 | 0.00(c) | 0.69 | — | (1.69) | (1.69) |
| Year Ended 8/31/2017 | $8.84 | (0.03) | 0.69 | — | 0.66 | — | (4.29) | (4.29) |
| Year Ended 8/31/2016 | $13.93 | (0.07) | 0.53 | — | 0.46 | — | (5.55) | (5.55) |
| Year Ended 8/31/2015 | $16.68 | (0.17) | (1.01) | — | (1.18) | — | (1.57) | (1.57) |
| Institutional Class |
| Year Ended 8/31/2019 | $9.00 | 0.04 | (1.68) | — | (1.64) | (0.08) | (1.70) | (1.78) |
| Year Ended 8/31/2018 | $9.30 | 0.02 | 1.41 | 0.00(c) | 1.43 | (0.04) | (1.69) | (1.73) |
| Year Ended 8/31/2017 | $12.61 | 0.05 | 0.98 | — | 1.03 | (0.05) | (4.29) | (4.34) |
| Year Ended 8/31/2016 | $17.46 | 0.03 | 0.69 | — | 0.72 | (0.02) | (5.55) | (5.57) |
| Year Ended 8/31/2015 | $20.33 | (0.02) | (1.25) | — | (1.27) | (0.03) | (1.57) | (1.60) |
| Institutional 2 Class |
| Year Ended 8/31/2019 | $9.31 | 0.05 | (1.75) | — | (1.70) | (0.08) | (1.70) | (1.78) |
| Year Ended 8/31/2018 | $9.56 | 0.02 | 1.47 | 0.00(c) | 1.49 | (0.05) | (1.69) | (1.74) |
| Year Ended 8/31/2017 | $12.85 | 0.06 | 1.01 | — | 1.07 | (0.07) | (4.29) | (4.36) |
| Year Ended 8/31/2016 | $17.68 | 0.05 | 0.70 | — | 0.75 | (0.03) | (5.55) | (5.58) |
| Year Ended 8/31/2015 | $20.55 | 0.02 | (1.28) | — | (1.26) | (0.04) | (1.57) | (1.61) |
The accompanying Notes to Financial Statements are an integral part of this statement.
| 22 | Columbia Disciplined Small Core Fund | Annual Report 2019 |
Financial Highlights (continued)
| | Net
asset
value,
end of
period | Total
return | Total gross
expense
ratio to
average
net assets(a) | Total net
expense
ratio to
average
net assets(a),(b) | Net investment
income (loss)
ratio to
average
net assets | Portfolio
turnover | Net
assets,
end of
period
(000’s) |
| Class A |
| Year Ended 8/31/2019 | $4.75 | (19.21%) | 1.49% | 1.35% | 0.36% | 87% | $27,782 |
| Year Ended 8/31/2018 | $8.00 | 16.70%(d) | 1.43%(e) | 1.37%(e),(f) | (0.00%)(c) | 87% | $41,991 |
| Year Ended 8/31/2017 | $8.45 | 8.22% | 1.42%(g) | 1.37%(f),(g) | 0.26% | 87% | $48,138 |
| Year Ended 8/31/2016 | $11.81 | 4.32% | 1.39% | 1.38%(f) | 0.01% | 112% | $74,434 |
| Year Ended 8/31/2015 | $16.72 | (6.81%) | 1.36% | 1.36%(f) | (0.35%) | 23% | $137,486 |
| Advisor Class |
| Year Ended 8/31/2019 | $5.75 | (19.11%) | 1.24% | 1.10% | 0.61% | 87% | $991 |
| Year Ended 8/31/2018 | $9.23 | 17.17%(d) | 1.19%(e) | 1.12%(e),(f) | 0.20% | 87% | $1,529 |
| Year Ended 8/31/2017 | $9.49 | 8.30% | 1.16%(g) | 1.12%(f),(g) | 0.47% | 87% | $667 |
| Year Ended 8/31/2016 | $12.79 | 4.64% | 1.14% | 1.13%(f) | 0.26% | 112% | $2,926 |
| Year Ended 8/31/2015 | $17.63 | (6.56%) | 1.11% | 1.11%(f) | (0.09%) | 23% | $6,123 |
| Class C |
| Year Ended 8/31/2019 | $1.67 | (19.95%) | 2.24% | 2.10% | (0.39%) | 87% | $2,685 |
| Year Ended 8/31/2018 | $4.21 | 15.81%(d) | 2.18%(e) | 2.12%(e),(f) | (0.73%) | 87% | $5,613 |
| Year Ended 8/31/2017 | $5.21 | 7.34% | 2.17%(g) | 2.12%(f),(g) | (0.49%) | 87% | $10,530 |
| Year Ended 8/31/2016 | $8.84 | 3.62% | 2.14% | 2.13%(f) | (0.73%) | 112% | $15,654 |
| Year Ended 8/31/2015 | $13.93 | (7.53%) | 2.11% | 2.11%(f) | (1.09%) | 23% | $22,625 |
| Institutional Class |
| Year Ended 8/31/2019 | $5.58 | (18.92%) | 1.24% | 1.10% | 0.57% | 87% | $12,772 |
| Year Ended 8/31/2018 | $9.00 | 17.06%(d) | 1.18%(e) | 1.12%(e),(f) | 0.27% | 87% | $32,221 |
| Year Ended 8/31/2017 | $9.30 | 8.34% | 1.18%(g) | 1.12%(f),(g) | 0.50% | 87% | $43,415 |
| Year Ended 8/31/2016 | $12.61 | 4.64% | 1.14% | 1.13%(f) | 0.22% | 112% | $58,911 |
| Year Ended 8/31/2015 | $17.46 | (6.56%) | 1.11% | 1.11%(f) | (0.09%) | 23% | $239,255 |
| Institutional 2 Class |
| Year Ended 8/31/2019 | $5.83 | (18.91%) | 1.12% | 0.97% | 0.75% | 87% | $419 |
| Year Ended 8/31/2018 | $9.31 | 17.26%(d) | 1.04%(e) | 1.00%(e) | 0.17% | 87% | $509 |
| Year Ended 8/31/2017 | $9.56 | 8.47% | 1.04%(g) | 1.02%(g) | 0.57% | 87% | $2,751 |
| Year Ended 8/31/2016 | $12.85 | 4.76% | 0.98% | 0.98% | 0.35% | 112% | $2,876 |
| Year Ended 8/31/2015 | $17.68 | (6.43%) | 0.93% | 0.93% | 0.10% | 23% | $12,955 |
The accompanying Notes to Financial Statements are an integral part of this statement.
Columbia Disciplined Small Core Fund | Annual Report 2019
| 23 |
Financial Highlights (continued)
| | Net asset value,
beginning of
period | Net
investment
income
(loss) | Net
realized
and
unrealized
gain (loss) | Increase
from
payment
by affiliate | Total from
investment
operations | Distributions
from net
investment
income | Distributions
from net
realized
gains | Total
distributions to
shareholders |
| Institutional 3 Class |
| Year Ended 8/31/2019 | $9.42 | 0.05 | (1.77) | — | (1.72) | (0.08) | (1.70) | (1.78) |
| Year Ended 8/31/2018 | $9.66 | 0.05 | 1.46 | 0.00(c) | 1.51 | (0.06) | (1.69) | (1.75) |
| Year Ended 8/31/2017 | $12.94 | 0.06 | 1.02 | — | 1.08 | (0.07) | (4.29) | (4.36) |
| Year Ended 8/31/2016 | $17.76 | 0.06 | 0.70 | — | 0.76 | (0.03) | (5.55) | (5.58) |
| Year Ended 8/31/2015 | $20.63 | 0.03 | (1.29) | — | (1.26) | (0.04) | (1.57) | (1.61) |
| Class V |
| Year Ended 8/31/2019 | $7.50 | 0.02 | (1.40) | — | (1.38) | (0.08) | (1.70) | (1.78) |
| Year Ended 8/31/2018 | $8.01 | (0.00)(c) | 1.20 | 0.00(c) | 1.20 | (0.02) | (1.69) | (1.71) |
| Year Ended 8/31/2017 | $11.41 | 0.02 | 0.90 | — | 0.92 | (0.03) | (4.29) | (4.32) |
| Year Ended 8/31/2016 | $16.33 | 0.00(c) | 0.64 | — | 0.64 | (0.01) | (5.55) | (5.56) |
| Year Ended 8/31/2015 | $19.16 | (0.06) | (1.19) | — | (1.25) | (0.01) | (1.57) | (1.58) |
| Notes to Financial Highlights |
| (a) | In addition to the fees and expenses that the Fund bears directly, the Fund indirectly bears a pro rata share of the fees and expenses of any other funds in which it invests. Such indirect expenses are not included in the Fund’s reported expense ratios. |
| (b) | Total net expenses include the impact of certain fee waivers/expense reimbursements made by the Investment Manager and certain of its affiliates, if applicable. |
| (c) | Rounds to zero. |
| (d) | The Fund received a payment from an affiliate. Had the Fund not received this payment, the total return would have been lower by 0.04%. |
| (e) | Ratios include line of credit interest expense which is less than 0.01%. |
| (f) | The benefits derived from expense reductions had an impact of less than 0.01%. |
| (g) | Expenses have been reduced due to a reimbursement of expenses overbilled by a third party. If the reimbursement had been excluded, the expense ratios would have been higher by the percentages shown for each class in the table below. All fee waivers and expense reimbursements by the Investment Manager and its affiliates were applied before giving effect to this third party reimbursement. |
| Year Ended | Class A | Advisor
Class | Class C | Institutional
Class | Institutional 2
Class | Class V |
| 08/31/2017 | 0.01% | 0.01% | 0.01% | 0.01% | 0.01% | 0.01% |
The accompanying Notes to Financial Statements are an integral part of this statement.
| 24 | Columbia Disciplined Small Core Fund | Annual Report 2019 |
Financial Highlights (continued)
| | Net
asset
value,
end of
period | Total
return | Total gross
expense
ratio to
average
net assets(a) | Total net
expense
ratio to
average
net assets(a),(b) | Net investment
income (loss)
ratio to
average
net assets | Portfolio
turnover | Net
assets,
end of
period
(000’s) |
| Institutional 3 Class |
| Year Ended 8/31/2019 | $5.92 | (18.92%) | 1.06% | 0.92% | 0.76% | 87% | $259 |
| Year Ended 8/31/2018 | $9.42 | 17.24%(d) | 0.98%(e) | 0.95%(e) | 0.55% | 87% | $548 |
| Year Ended 8/31/2017 | $9.66 | 8.57% | 1.00% | 0.98% | 0.57% | 87% | $48,689 |
| Year Ended 8/31/2016 | $12.94 | 4.83% | 0.94% | 0.94% | 0.49% | 112% | $6,736 |
| Year Ended 8/31/2015 | $17.76 | (6.39%) | 0.88% | 0.88% | 0.17% | 23% | $3,024 |
| Class V |
| Year Ended 8/31/2019 | $4.34 | (19.32%) | 1.49% | 1.35% | 0.36% | 87% | $40,925 |
| Year Ended 8/31/2018 | $7.50 | 16.87%(d) | 1.43%(e) | 1.37%(e),(f) | (0.01%) | 87% | $56,862 |
| Year Ended 8/31/2017 | $8.01 | 8.12% | 1.43%(g) | 1.37%(f),(g) | 0.25% | 87% | $54,908 |
| Year Ended 8/31/2016 | $11.41 | 4.35% | 1.39% | 1.38%(f) | 0.03% | 112% | $60,071 |
| Year Ended 8/31/2015 | $16.33 | (6.87%) | 1.38% | 1.38%(f) | (0.36%) | 23% | $65,184 |
The accompanying Notes to Financial Statements are an integral part of this statement.
Columbia Disciplined Small Core Fund | Annual Report 2019
| 25 |
Notes to Financial Statements
August 31, 2019
Note 1. Organization
Columbia Disciplined Small Core Fund (the Fund), a series of Columbia Funds Series Trust I (the Trust), is a diversified fund. The Trust is registered under the Investment Company Act of 1940, as amended (the 1940 Act), as an open-end management investment company organized as a Massachusetts business trust.
Fund shares
The Trust may issue an unlimited number of shares (without par value). The Fund offers each of the share classes listed in the Statement of Assets and Liabilities. Although all share classes generally have identical voting, dividend and liquidation rights, each share class votes separately when required by the Trust’s organizational documents or by law. Each share class has its own expense and sales charge structure. Different share classes may have different minimum initial investment amounts and pay different distribution amounts to the extent the expenses of distributing such share classes vary. Distributions to shareholders in a liquidation will be proportional to the net asset value of each share class.
As described in the Fund’s prospectus, Class A and Class C shares are offered to the general public for investment. Advisor Class, Institutional Class, Institutional 2 Class and Institutional 3 Class are available for purchase through authorized investment professionals to omnibus retirement plans or to institutional and to certain other investors as also described in the Fund’s prospectus. Class C shares automatically convert to Class A shares after 10 years. Effective December 14, 2018, Class T shares merged, in a tax-free transaction, into Class A shares of the Fund and are no longer offered for sale. Class V shares are available only to investors who received (and who continuously held) Class V shares in connection with previous fund reorganizations.
Note 2. Summary of significant accounting policies
Basis of preparation
The Fund is an investment company that applies the accounting and reporting guidance in the Financial Accounting Standards Board (FASB) Accounting Standards Codification Topic 946,Financial Services - Investment Companies (ASC 946). The financial statements are prepared in accordance with U.S. generally accepted accounting principles (GAAP), which requires management to make certain estimates and assumptions that affect the reported amounts of assets and liabilities, the disclosure of contingent assets and liabilities at the date of the financial statements and the reported amounts of income and expenses during the reporting period. Actual results could differ from those estimates.
The following is a summary of significant accounting policies followed by the Fund in the preparation of its financial statements.
Security valuation
All equity securities are valued at the close of business of the New York Stock Exchange. Equity securities are valued at the official closing price on the principal exchange or market on which they trade. Unlisted securities or listed securities for which there were no sales during the day are valued at the mean of the latest quoted bid and ask prices on such exchanges or markets.
Foreign equity securities are valued based on the closing price on the foreign exchange in which such securities are primarily traded. If any foreign equity security closing prices are not readily available, the securities are valued at the mean of the latest quoted bid and ask prices on such exchanges or markets. Foreign currency exchange rates are determined at the scheduled closing time of the New York Stock Exchange. Many securities markets and exchanges outside the U.S. close prior to the close of the New York Stock Exchange; therefore, the closing prices for securities in such markets or on such exchanges may not fully reflect events that occur after such close but before the close of the New York Stock Exchange. In those situations, foreign securities will be fair valued pursuant to a policy adopted by the Board of Trustees. Under the policy, the Fund may utilize a third party pricing service to determine these fair values. The third-party pricing service takes into account multiple factors, including, but not limited to, movements in the U.S. securities markets, certain depositary receipts, futures contracts and foreign exchange rates that have occurred subsequent to the close of the foreign exchange or market, to determine a good faith estimate that reasonably reflects the current market conditions as of the close of the New York Stock Exchange. The fair value of a security is likely to be different from the quoted or published price, if available.
| 26 | Columbia Disciplined Small Core Fund | Annual Report 2019 |
Notes to Financial Statements (continued)
August 31, 2019
Futures and options on futures contracts are valued based upon the settlement price at the close of regular trading on their principal exchanges or, in the absence of transactions, at the mean of the latest quoted bid and ask prices.
Investments for which market quotations are not readily available, or that have quotations which management believes are not reflective of market value or reliable, are valued at fair value as determined in good faith under procedures approved by and under the general supervision of the Board of Trustees. If a security or class of securities (such as foreign securities) is valued at fair value, such value is likely to be different from the quoted or published price for the security.
The determination of fair value often requires significant judgment. To determine fair value, management may use assumptions including but not limited to future cash flows and estimated risk premiums. Multiple inputs from various sources may be used to determine fair value.
GAAP requires disclosure regarding the inputs and valuation techniques used to measure fair value and any changes in valuation inputs or techniques. In addition, investments shall be disclosed by major category. This information is disclosed following the Fund’s Portfolio of Investments.
Derivative instruments
The Fund invests in certain derivative instruments, as detailed below, to meet its investment objectives. Derivatives are instruments whose values depend on, or are derived from, in whole or in part, the value of one or more securities, currencies, commodities, indices, or other assets or instruments. Derivatives may be used to increase investment flexibility (including to maintain cash reserves while maintaining desired exposure to certain assets), for risk management (hedging) purposes, to facilitate trading, to reduce transaction costs and to pursue higher investment returns. The Fund may also use derivative instruments to mitigate certain investment risks, such as foreign currency exchange rate risk, interest rate risk and credit risk. Derivatives may involve various risks, including the potential inability of the counterparty to fulfill its obligations under the terms of the contract, the potential for an illiquid secondary market (making it difficult for the Fund to sell or terminate, including at favorable prices) and the potential for market movements which may expose the Fund to gains or losses in excess of the amount shown in the Statement of Assets and Liabilities. The notional amounts of derivative instruments, if applicable, are not recorded in the financial statements.
A derivative instrument may suffer a marked-to-market loss if the value of the contract decreases due to an unfavorable change in the market rates or values of the underlying instrument. Losses can also occur if the counterparty does not perform its obligations under the contract. The Fund’s risk of loss from counterparty credit risk on over-the-counter derivatives is generally limited to the aggregate unrealized gain netted against any collateral held by the Fund and the amount of any variation margin held by the counterparty, plus any replacement costs or related amounts. With exchange-traded or centrally cleared derivatives, there is reduced counterparty credit risk to the Fund since the clearinghouse or central counterparty (CCP) provides some protection in the case of clearing member default. The clearinghouse or CCP stands between the buyer and the seller of the contract; therefore, additional counterparty credit risk is failure of the clearinghouse or CCP. However, credit risk still exists in exchange-traded or centrally cleared derivatives with respect to initial and variation margin that is held in a broker’s customer account. While brokers are required to segregate customer margin from their own assets, in the event that a broker becomes insolvent or goes into bankruptcy and at that time there is a shortfall in the aggregate amount of margin held by the broker for all its clients, U.S. bankruptcy laws will typically allocate that shortfall on a pro-rata basis across all the broker’s customers (including the Fund), potentially resulting in losses to the Fund.
In order to better define its contractual rights and to secure rights that will help the Fund mitigate its counterparty risk, the Fund may enter into an International Swaps and Derivatives Association, Inc. Master Agreement (ISDA Master Agreement) or similar agreement with its derivatives contract counterparties. An ISDA Master Agreement is an agreement between the Fund and a counterparty that governs over-the-counter derivatives and typically contains, among other things, collateral posting terms and netting provisions in the event of a default and/or termination event. Under an ISDA Master Agreement, the Fund may, under certain circumstances, offset with the counterparty certain derivative instrument’s payables and/or receivables with collateral held and/or posted and create one single net payment. The provisions of the ISDA Master Agreement typically permit a single net payment in the event of default (close-out netting), including the bankruptcy or insolvency of the counterparty. Note, however, that bankruptcy or insolvency laws of a particular jurisdiction may impose restrictions on or prohibitions against the right of offset or netting in bankruptcy, insolvency or other events.
Columbia Disciplined Small Core Fund | Annual Report 2019
| 27 |
Notes to Financial Statements (continued)
August 31, 2019
Collateral (margin) requirements differ by type of derivative. Margin requirements are established by the clearinghouse or CCP for exchange-traded and centrally cleared derivatives. Brokers can ask for margin in excess of the minimum in certain circumstances. Collateral terms are contract specific for over-the-counter derivatives. For over-the-counter derivatives traded under an ISDA Master Agreement, the collateral requirements are typically calculated by netting the marked-to-market amount for each transaction under such agreement and comparing that amount to the value of any variation margin currently pledged by the Fund and/or the counterparty. Generally, the amount of collateral due from or to a party has to exceed a minimum transfer amount threshold (e.g., $250,000) before a transfer has to be made. To the extent amounts due to the Fund from its counterparties are not fully collateralized, contractually or otherwise, the Fund bears the risk of loss from counterparty nonperformance. The Fund may also pay interest expense on cash collateral received from the broker. Any interest expense paid by the Fund is shown on the Statement of Operations. The Fund attempts to mitigate counterparty risk by only entering into agreements with counterparties that it believes have the financial resources to honor their obligations and by monitoring the financial stability of those counterparties.
Certain ISDA Master Agreements allow counterparties of over-the-counter derivatives transactions to terminate derivatives contracts prior to maturity in the event the Fund’s net asset value declines by a stated percentage over a specified time period or if the Fund fails to meet certain terms of the ISDA Master Agreement, which would cause the Fund to accelerate payment of any net liability owed to the counterparty. The Fund also has termination rights if the counterparty fails to meet certain terms of the ISDA Master Agreement. In determining whether to exercise such termination rights, the Fund would consider, in addition to counterparty credit risk, whether termination would result in a net liability owed from the counterparty.
For financial reporting purposes, the Fund does not offset derivative assets and derivative liabilities that are subject to netting arrangements in the Statement of Assets and Liabilities.
Futures contracts
Futures contracts are exchange-traded and represent commitments for the future purchase or sale of an asset at a specified price on a specified date. The Fund bought and sold futures contracts to maintain appropriate equity market exposure while keeping sufficient cash to accommodate daily redemptions. These instruments may be used for other purposes in future periods. Upon entering into futures contracts, the Fund bears risks that it may not achieve the anticipated benefits of the futures contracts and may realize a loss. Additional risks include counterparty credit risk, the possibility of an illiquid market, and that a change in the value of the contract or option may not correlate with changes in the value of the underlying asset.
Upon entering into a futures contract, the Fund deposits cash or securities with the broker, known as a futures commission merchant (FCM), in an amount sufficient to meet the initial margin requirement. The initial margin deposit must be maintained at an established level over the life of the contract. Cash deposited as initial margin is recorded in the Statement of Assets and Liabilities as margin deposits. Securities deposited as initial margin are designated in the Portfolio of Investments. Subsequent payments (variation margin) are made or received by the Fund each day. The variation margin payments are equal to the daily change in the contract value and are recorded as variation margin receivable or payable and are offset in unrealized gains or losses. The Fund recognizes a realized gain or loss when the contract is closed or expires. Futures contracts involve, to varying degrees, risk of loss in excess of the variation margin disclosed in the Statement of Assets and Liabilities.
Effects of derivative transactions in the financial statements
The following tables are intended to provide additional information about the effect of derivatives on the financial statements of the Fund, including: the fair value of derivatives by risk category and the location of those fair values in the Statement of Assets and Liabilities; and the impact of derivative transactions over the period in the Statement of Operations, including realized and unrealized gains (losses). The derivative instrument schedules following the Portfolio of Investments present additional information regarding derivative instruments outstanding at the end of the period, if any.
| 28 | Columbia Disciplined Small Core Fund | Annual Report 2019 |
Notes to Financial Statements (continued)
August 31, 2019
The following table is a summary of the fair value of derivative instruments (not considered to be hedging instruments for accounting disclosure purposes) at August 31, 2019:
| | Liability derivatives | |
Risk exposure
category | Statement
of assets and liabilities
location | Fair value ($) |
| Equity risk | Component of total distributable earnings (loss) — unrealized depreciation on futures contracts | 29,472* |
| * | Includes cumulative appreciation (depreciation) as reported in the tables following the Portfolio of Investments. Only the current day’s variation margin is reported in receivables or payables in the Statement of Assets and Liabilities. |
The following table indicates the effect of derivative instruments (not considered to be hedging instruments for accounting disclosure purposes) in the Statement of Operations for the year ended August 31, 2019:
| Amount of realized gain (loss) on derivatives recognized in income |
| Risk exposure category | | | | | | Futures
contracts
($) |
| Equity risk | | | | | | (175,391) |
| Total | | | | | | (175,391) |
| |
| Change in unrealized appreciation (depreciation) on derivatives recognized in income |
| Risk exposure category | | | | | | Futures
contracts
($) |
| Equity risk | | | | | | (150,896) |
The following table is a summary of the average outstanding volume by derivative instrument for the year ended August 31, 2019:
| Derivative instrument | Average notional
amounts ($)* |
| Futures contracts — long | 2,337,540 |
| * | Based on the ending quarterly outstanding amounts for the year ended August 31, 2019. |
Security transactions
Security transactions are accounted for on the trade date. Cost is determined and gains (losses) are based upon the specific identification method for both financial statement and federal income tax purposes.
Income recognition
Corporate actions and dividend income are generally recorded net of any non-reclaimable tax withholdings, on the ex-dividend date or upon receipt of ex-dividend notification in the case of certain foreign securities.
The Fund may receive distributions from holdings in equity securities, business development companies (BDCs), exchange-traded funds (ETFs), limited partnerships (LPs), other regulated investment companies (RICs), and real estate investment trusts (REITs), which report information on the tax character of their distributions annually. These distributions are allocated to dividend income, capital gain and return of capital based on actual information reported. Return of capital is recorded as a reduction of the cost basis of securities held. If the Fund no longer owns the applicable securities, return of capital is recorded as a realized gain. With respect to REITs, to the extent actual information has not yet been reported, estimates for return of capital are made by the Fund’s management. Management’s estimates are subsequently adjusted when the actual character of the distributions is disclosed by the REITs, which could result in a proportionate change in return of capital to shareholders.
Awards from class action litigation are recorded as a reduction of cost basis if the Fund still owns the applicable securities on the payment date. If the Fund no longer owns the applicable securities, the proceeds are recorded as realized gains.
Columbia Disciplined Small Core Fund | Annual Report 2019
| 29 |
Notes to Financial Statements (continued)
August 31, 2019
Expenses
General expenses of the Trust are allocated to the Fund and other funds of the Trust based upon relative net assets or other expense allocation methodologies determined by the nature of the expense. Expenses directly attributable to the Fund are charged to the Fund. Expenses directly attributable to a specific class of shares are charged to that share class.
Determination of class net asset value
All income, expenses (other than class-specific expenses, which are charged to that share class, as shown in the Statement of Operations) and realized and unrealized gains (losses) are allocated to each class of the Fund on a daily basis, based on the relative net assets of each class, for purposes of determining the net asset value of each class.
Federal income tax status
The Fund intends to qualify each year as a regulated investment company under Subchapter M of the Internal Revenue Code, as amended, and will distribute substantially all of its investment company taxable income and net capital gain, if any, for its tax year, and as such will not be subject to federal income taxes. In addition, the Fund intends to distribute in each calendar year substantially all of its ordinary income, capital gain net income and certain other amounts, if any, such that the Fund should not be subject to federal excise tax. Therefore, no federal income or excise tax provision is recorded.
Foreign taxes
The Fund may be subject to foreign taxes on income, gains on investments or currency repatriation, a portion of which may be recoverable. The Fund will accrue such taxes and recoveries, as applicable, based upon its current interpretation of tax rules and regulations that exist in the markets in which it invests.
Realized gains in certain countries may be subject to foreign taxes at the Fund level, based on statutory rates. The Fund accrues for such foreign taxes on realized and unrealized gains at the appropriate rate for each jurisdiction, as applicable. The amount, if any, is disclosed as a liability on the Statement of Assets and Liabilities.
Distributions to shareholders
Distributions from net investment income, if any, are declared and paid annually. Net realized capital gains, if any, are distributed at least annually. Income distributions and capital gain distributions are determined in accordance with federal income tax regulations, which may differ from GAAP.
Guarantees and indemnifications
Under the Trust’s organizational documents and, in some cases, by contract, its officers and trustees are indemnified against certain liabilities arising out of the performance of their duties to the Trust or its funds. In addition, certain of the Fund’s contracts with its service providers contain general indemnification clauses. The Fund’s maximum exposure under these arrangements is unknown since the amount of any future claims that may be made against the Fund cannot be determined, and the Fund has no historical basis for predicting the likelihood of any such claims.
Recent accounting pronouncements
Accounting Standards Update 2017-08 Premium Amortization on Purchased Callable Debt Securities
In March 2017, the Financial Accounting Standards Board issued Accounting Standards Update (ASU) No. 2017-08 Premium Amortization on Purchased Callable Debt Securities. ASU No. 2017-08 updates the accounting standards to shorten the amortization period for certain purchased callable debt securities, held at a premium, to be amortized to the earliest call date. The update applies to securities with explicit, noncontingent call features that are callable at fixed prices and on preset dates. The standard is effective for annual periods beginning after December 15, 2018 and interim periods within those fiscal years. Management does not expect the implementation of this guidance to have a material impact on the financial statement amounts and footnote disclosures.
Accounting Standards Update 2018-13 Disclosure Framework - Changes to the Disclosure Requirements for Fair Value Measurement
| 30 | Columbia Disciplined Small Core Fund | Annual Report 2019 |
Notes to Financial Statements (continued)
August 31, 2019
In August 2018, the Financial Accounting Standards Board issued Accounting Standards Update (ASU) No. 2018-13 Disclosure Framework - Changes to the Disclosure Requirements for Fair Value Measurement. The standard is effective for annual periods beginning after December 15, 2019 and interim periods within those fiscal years, with early adoption permitted. After evaluation, management determined to adopt the ASU effective for the period ended August 31, 2019 and all subsequent periods. As a result of the amendments, management implemented disclosure changes which include removal of the amount and reasons for transfers between Level 1 and Level 2 of the fair value hierarchy, removal of the policy for the timing of transfers between levels, removal of the description of the Level 3 valuation processes, as well as modifications to the measurement uncertainty disclosure.
Disclosure Update and Simplification
In September 2018, the Securities and Exchange Commission (SEC) released Final Rule 33-10532, Disclosure Update and Simplification, which amends certain financial statement disclosure requirements that the SEC determined to be redundant, outdated, or superseded in light of other SEC disclosure requirements, GAAP, or changes in the information environment. As a result of the amendments, management implemented disclosure changes which included removing the components of distributable earnings presented on the Statement of Assets and Liabilities and combining income and gain distributions paid to shareholders as presented on the Statement of Changes in Net Assets. Any values presented to meet prior year requirements were left unchanged. The amendments had no effect on the Fund’s net assets or results of operation.
Note 3. Fees and other transactions with affiliates
Management services fees
The Fund has entered into a Management Agreement with Columbia Management Investment Advisers, LLC (the Investment Manager), a wholly-owned subsidiary of Ameriprise Financial, Inc. (Ameriprise Financial). Under the Management Agreement, the Investment Manager provides the Fund with investment research and advice, as well as administrative and accounting services. The management services fee is an annual fee that is equal to a percentage of the Fund’s daily net assets that declines from 0.85% to 0.73% as the Fund’s net assets increase. The effective management services fee rate for the year ended August 31, 2019 was 0.85% of the Fund’s average daily net assets.
Compensation of board members
Members of the Board of Trustees who are not officers or employees of the Investment Manager or Ameriprise Financial are compensated for their services to the Fund as disclosed in the Statement of Operations. These members of the Board of Trustees may participate in a Deferred Compensation Plan (the Deferred Plan) which may be terminated at any time. Obligations of the Deferred Plan will be paid solely out of the Fund’s assets, and all amounts payable under the Deferred Plan constitute a general unsecured obligation of the Fund.
Compensation of Chief Compliance Officer
The Board of Trustees has appointed a Chief Compliance Officer to the Fund in accordance with federal securities regulations. As disclosed in the Statement of Operations, a portion of the Chief Compliance Officer’s total compensation is allocated to the Fund, along with other allocations to affiliated registered investment companies managed by the Investment Manager and its affiliates, based on relative net assets.
Transactions with affiliates
For the year ended August 31, 2019, the Fund engaged in purchase and/or sale transactions with affiliates and/or accounts that have a common investment manager (or affiliated investment managers), common directors/trustees, and/or common officers. Those purchase and sale transactions complied with provisions of Rule 17a-7 under the 1940 Act and were $0 and $63,310, respectively. The sale transactions resulted in a net realized loss of $114,474.
Columbia Disciplined Small Core Fund | Annual Report 2019
| 31 |
Notes to Financial Statements (continued)
August 31, 2019
Transfer agency fees
Under a Transfer and Dividend Disbursing Agent Agreement, Columbia Management Investment Services Corp. (the Transfer Agent), an affiliate of the Investment Manager and a wholly-owned subsidiary of Ameriprise Financial, is responsible for providing transfer agency services to the Fund. The Transfer Agent has contracted with DST Asset Manager Solutions, Inc. (DST) to serve as sub-transfer agent. The Transfer Agent pays the fees of DST for services as sub-transfer agent and DST is not entitled to reimbursement for such fees from the Fund (with the exception of out-of-pocket fees).
The Fund pays the Transfer Agent a monthly transfer agency fee based on the number or the average value of accounts, depending on the type of account. In addition, the Fund pays the Transfer Agent a fee for shareholder services based on the number of accounts or on a percentage of the average aggregate value of the Fund’s shares maintained in omnibus accounts up to the lesser of the amount charged by the financial intermediary or a cap established by the Board of Trustees from time to time.
The Transfer Agent also receives compensation from the Fund for various shareholder services and reimbursements for certain out-of-pocket fees. Total transfer agency fees for Institutional 2 Class and Institutional 3 Class shares are subject to an annual limitation of not more than 0.07% and 0.02%, respectively, of the average daily net assets attributable to each share class.
For the year ended August 31, 2019, the Fund’s effective transfer agency fee rates as a percentage of average daily net assets of each class were as follows:
| | Effective rate (%) |
| Class A | 0.20 |
| Advisor Class | 0.20 |
| Class C | 0.20 |
| Institutional Class | 0.20 |
| Institutional 2 Class | 0.07 |
| Institutional 3 Class | 0.02 |
| Class T | 0.06(a) |
| Class V | 0.20 |
An annual minimum account balance fee of $20 may apply to certain accounts with a value below the applicable share class’s initial minimum investment requirements to reduce the impact of small accounts on transfer agency fees. These minimum account balance fees are remitted to the Fund and recorded as part of expense reductions in the Statement of Operations. For the year ended August 31, 2019, no minimum account balance fees were charged by the Fund.
Distribution and service fees
The Fund has entered into an agreement with Columbia Management Investment Distributors, Inc. (the Distributor), an affiliate of the Investment Manager and a wholly-owned subsidiary of Ameriprise Financial, for distribution and shareholder services. The Board of Trustees has approved, and the Fund has adopted, distribution and shareholder service plans (the Plans) applicable to certain share classes, which set the distribution and service fees for the Fund. These fees are calculated daily and are intended to compensate the Distributor and/or eligible selling and/or servicing agents for selling shares of the Fund and providing services to investors.
Under the Plans, the Fund pays a monthly service fee to the Distributor at the maximum annual rate of 0.25% of the average daily net assets attributable to Class A, Class C and Class T shares of the Fund. Also under the Plans, the Fund pays a monthly distribution fee to the Distributor at the maximum annual rates of 0.10%, 0.75% and 0.25% of the average daily net assets attributable to Class A, Class C and Class T shares of the Fund, respectively. As a result of all Class T shares of the Fund being redeemed or converted to Class A shares, December 14, 2018 was the last day the Fund paid a service fee or distribution fee for Class T shares.
| 32 | Columbia Disciplined Small Core Fund | Annual Report 2019 |
Notes to Financial Statements (continued)
August 31, 2019
Although the Fund may pay distribution and service fees up to a maximum annual rate of 0.35% of the Fund’s average daily net assets attributable to Class A shares (comprised of up to 0.10% for distribution services and up to 0.25% for shareholder liaison services), the Fund currently limits such fees to an aggregate fee of not more than 0.25% of the Fund’s average daily net assets attributable to Class A shares.
Although the Fund may have paid a distribution fee up to 0.25% of the Fund’s average daily net assets attributable to Class T shares and a service fee of up to 0.25% of the Fund’s average daily net assets attributable to Class T shares, the aggregate fee shall not exceed 0.25% of the Fund’s average daily net assets attributable to Class T shares.
Shareholder services fees
The Fund has adopted a shareholder services plan that permits it to pay for certain services provided to Class V shareholders by their selling and/or servicing agents. The Fund may pay shareholder servicing fees up to an aggregate annual rate of 0.50% of the Fund’s average daily net assets attributable to Class V shares (comprised of up to 0.25% for shareholder liaison services and up to 0.25% for administrative support services). These fees are currently limited to an aggregate annual rate of not more than 0.25% of the Fund’s average daily net assets attributable to Class V shares.
Sales charges (unaudited)
Sales charges, including front-end charges and contingent deferred sales charges (CDSC), received by the Distributor for distributing Fund shares for the year ended August 31, 2019, if any, are listed below:
| | Front End (%) | CDSC (%) | Amount ($) |
| Class A | 5.75 | 0.50 - 1.00(a) | 11,694 |
| Class C | — | 1.00(b) | 34 |
| Class T | 2.50 | — | — |
| Class V | 5.75 | 0.50 - 1.00(a) | 1,903 |
| (a) | This charge is imposed on certain investments of between $1 million and $50 million redeemed within 18 months after purchase, as follows: 1.00% if redeemed within 12 months after purchase, and 0.50% if redeemed more than 12, but less than 18, months after purchase, with certain limited exceptions. |
| (b) | This charge applies to redemptions within 12 months after purchase, with certain limited exceptions. |
The Fund’s other share classes are not subject to sales charges.
Expenses waived/reimbursed by the Investment Manager and its affiliates
The Investment Manager and certain of its affiliates have contractually agreed to waive fees and/or reimburse expenses (excluding certain fees and expenses described below) for the period(s) disclosed below, unless sooner terminated at the sole discretion of the Board of Trustees, so that the Fund’s net operating expenses, after giving effect to fees waived/expenses reimbursed and any balance credits and/or overdraft charges from the Fund’s custodian, do not exceed the following annual rate(s) as a percentage of the class’ average daily net assets:
| | January 1, 2019
through
December 31, 2019 | Prior to
January 1, 2019 |
| Class A | 1.33% | 1.38% |
| Advisor Class | 1.08 | 1.13 |
| Class C | 2.08 | 2.13 |
| Institutional Class | 1.08 | 1.13 |
| Institutional 2 Class | 0.96 | 1.00 |
| Institutional 3 Class | 0.91 | 0.94 |
| Class V | 1.33 | 1.38 |
Under the agreement governing these fee waivers and/or expense reimbursement arrangements, the following fees and expenses are excluded from the waiver/reimbursement commitment, and therefore will be paid by the Fund, if applicable: taxes (including foreign transaction taxes), expenses associated with investments in affiliated and non-affiliated pooled investment vehicles (including mutual funds and exchange-traded funds), transaction costs and brokerage commissions, costs related to any securities lending program, dividend expenses associated with securities sold short,
Columbia Disciplined Small Core Fund | Annual Report 2019
| 33 |
Notes to Financial Statements (continued)
August 31, 2019
inverse floater program fees and expenses, transaction charges and interest on borrowed money, interest, infrequent and/or unusual expenses and any other expenses the exclusion of which is specifically approved by the Board of Trustees. This agreement may be modified or amended only with approval from the Investment Manager, certain of its affiliates and the Fund. Any fees waived and/or expenses reimbursed under the expense reimbursement arrangements described above are not recoverable by the Investment Manager or its affiliates in future periods.
Note 4. Federal tax information
The timing and character of income and capital gain distributions are determined in accordance with income tax regulations, which may differ from GAAP because of temporary or permanent book to tax differences.
At August 31, 2019, these differences were primarily due to differing treatment for deferral/reversal of wash sale losses, trustees’ deferred compensation, derivative investments, post-October capital losses, re-characterization of distributions for investments, distribution reclassifications, passive foreign investment company (PFIC) holdings and excess distributions. To the extent these differences were permanent, reclassifications were made among the components of the Fund’s net assets. Temporary differences do not require reclassifications.
The following reclassifications were made:
Excess of distributions
over net investment
income ($) | Accumulated
net realized
(loss) ($) | Paid in
capital ($) |
| (292,846) | 1,133,690 | (840,844) |
Net investment income (loss) and net realized gains (losses), as disclosed in the Statement of Operations, and net assets were not affected by this reclassification.
The tax character of distributions paid during the years indicated was as follows:
| Year Ended August 31, 2019 | Year Ended August 31, 2018 |
Ordinary
income ($) | Long-term
capital gains ($) | Total ($) | Ordinary
income ($) | Long-term
capital gains ($) | Total ($) |
| 3,073,510 | 26,146,809 | 29,220,319 | 10,740,732 | 27,902,536 | 38,643,268 |
Short-term capital gain distributions, if any, are considered ordinary income distributions for tax purposes.
At August 31, 2019, the components of distributable earnings on a tax basis were as follows:
Undistributed
ordinary income ($) | Undistributed
long-term
capital gains ($) | Capital loss
carryforwards ($) | Net unrealized
(depreciation) ($) |
| — | — | — | (1,357,692) |
At August 31, 2019, the cost of all investments for federal income tax purposes along with the aggregate gross unrealized appreciation and depreciation based on that cost was:
Federal
tax cost ($) | Gross unrealized
appreciation ($) | Gross unrealized
(depreciation) ($) | Net unrealized
(depreciation) ($) |
| 84,612,647 | 9,710,231 | (11,067,923) | (1,357,692) |
Tax cost of investments and unrealized appreciation/(depreciation) may also include timing differences that do not constitute adjustments to tax basis.
Under current tax rules, regulated investment companies can elect to treat certain late-year ordinary losses incurred and post-October capital losses (capital losses realized after October 31) as arising on the first day of the following taxable year. As of August 31, 2019, the Fund will elect to treat the following late-year ordinary losses and post-October capital losses as arising on September 1, 2019.
| 34 | Columbia Disciplined Small Core Fund | Annual Report 2019 |
Notes to Financial Statements (continued)
August 31, 2019
Late year
ordinary losses ($) | Post-October
capital losses ($) |
| — | 3,932,037 |
Management of the Fund has concluded that there are no significant uncertain tax positions in the Fund that would require recognition in the financial statements. However, management’s conclusion may be subject to review and adjustment at a later date based on factors including, but not limited to, new tax laws, regulations, and administrative interpretations (including relevant court decisions). Generally, the Fund’s federal tax returns for the prior three fiscal years remain subject to examination by the Internal Revenue Service.
Note 5. Portfolio information
The cost of purchases and proceeds from sales of securities, excluding short-term investments and derivatives, if any, aggregated to $90,114,002 and $118,159,069, respectively, for the year ended August 31, 2019. The amount of purchase and sale activity impacts the portfolio turnover rate reported in the Financial Highlights.
Note 6. Interfund lending
Pursuant to an exemptive order granted by the Securities and Exchange Commission, the Fund participates in a program (the Interfund Program) allowing each participating Columbia Fund (each, a Participating Fund) to lend money directly to and, except for closed-end funds and money market funds, borrow money directly from other Participating Funds for temporary purposes. The amounts eligible for borrowing and lending under the Interfund Program are subject to certain restrictions.
Interfund loans are subject to the risk that the borrowing fund could be unable to repay the loan when due, and a delay in repayment to the lending fund could result in lost opportunities and/or additional lending costs. The exemptive order is subject to conditions intended to mitigate conflicts of interest arising from the Investment Manager’s relationship with each Participating Fund.
The Fund did not borrow or lend money under the Interfund Program during the year ended August 31, 2019.
Note 7. Line of credit
The Fund has access to a revolving credit facility with a syndicate of banks led by Citibank, N.A., HSBC Bank USA, N.A. and JPMorgan Chase Bank, N.A. whereby the Fund may borrow for the temporary funding of shareholder redemptions or for other temporary or emergency purposes. The credit facility, which is a collective agreement between the Fund and certain other funds managed by the Investment Manager or an affiliated investment manager, severally and not jointly, permits collective borrowings up to $1 billion. Interest is charged to each participating fund based on its borrowings at a rate equal to the higher of (i) the federal funds effective rate, (ii) the one-month LIBOR rate and (iii) the overnight bank funding rate, plus in each case, 1.00%. Each borrowing under the credit facility matures no later than 60 days after the date of borrowing. The Fund also pays a commitment fee equal to its pro rata share of the unused amount of the credit facility at a rate of 0.15% per annum. The commitment fee is included in other expenses in the Statement of Operations. This agreement expires annually in December unless extended or renewed.
The Fund had no borrowings during the year ended August 31, 2019.
Note 8. Significant risks
Shareholder concentration risk
At August 31, 2019, one unaffiliated shareholder of record owned 17.3% of the outstanding shares of the Fund in one or more accounts. The Fund has no knowledge about whether any portion of those shares was owned beneficially. Affiliated shareholders of record owned 11.7% of the outstanding shares of the Fund in one or more accounts. Subscription and redemption activity by concentrated accounts may have a significant effect on the operations of the Fund. In the case of a large redemption, the Fund may be forced to sell investments at inopportune times, including its liquid positions, which may result in Fund losses and the Fund holding a higher percentage of less liquid positions. Large redemptions could result in decreased economies of scale and increased operating expenses for non-redeeming Fund shareholders.
Columbia Disciplined Small Core Fund | Annual Report 2019
| 35 |
Notes to Financial Statements (continued)
August 31, 2019
Note 9. Subsequent events
Management has evaluated the events and transactions that have occurred through the date the financial statements were issued and noted no items requiring adjustment of the financial statements or additional disclosure.
Note 10. Information regarding pending and settled legal proceedings
Ameriprise Financial and certain of its affiliates have historically been involved in a number of legal, arbitration and regulatory proceedings, including routine litigation, class actions, and governmental actions, concerning matters arising in connection with the conduct of their business activities. Ameriprise Financial believes that the Fund is not currently the subject of, and that neither Ameriprise Financial nor any of its affiliates are the subject of, any pending legal, arbitration or regulatory proceedings that are likely to have a material adverse effect on the Fund or the ability of Ameriprise Financial or its affiliates to perform under their contracts with the Fund. Ameriprise Financial is required to make quarterly (10-Q), annual (10-K) and, as necessary, 8-K filings with the Securities and Exchange Commission (SEC) on legal and regulatory matters that relate to Ameriprise Financial and its affiliates. Copies of these filings may be obtained by accessing the SEC website at www.sec.gov.
There can be no assurance that these matters, or the adverse publicity associated with them, will not result in increased Fund redemptions, reduced sale of Fund shares or other adverse consequences to the Fund. Further, although we believe proceedings are not likely to have a material adverse effect on the Fund or the ability of Ameriprise Financial or its affiliates to perform under their contracts with the Fund, these proceedings are subject to uncertainties and, as such, we are unable to estimate the possible loss or range of loss that may result. An adverse outcome in one or more of these proceedings could result in adverse judgments, settlements, fines, penalties or other relief that could have a material adverse effect on the consolidated financial condition or results of operations of Ameriprise Financial.
| 36 | Columbia Disciplined Small Core Fund | Annual Report 2019 |
Report of Independent Registered Public Accounting Firm
To the Board of Trustees of Columbia Funds Series Trust I and Shareholders of Columbia Disciplined Small Core Fund
Opinion on the Financial Statements
We have audited the accompanying statement of assets and liabilities, including the portfolio of investments, of Columbia Disciplined Small Core Fund (one of the funds constituting Columbia Funds Series Trust I, hereafter referred to as the “Fund”) as of August 31, 2019, the related statement of operations for the year ended August 31, 2019, the statement of changes in net assets for each of the two years in the period ended August 31, 2019, including the related notes, and the financial highlights for each of the five years in the period ended August 31, 2019, (collectively referred to as the “financial statements”). In our opinion, the financial statements present fairly, in all material respects, the financial position of the Fund as of August 31, 2019, the results of its operations for the year then ended, the changes in its net assets for each of the two years in the period ended August 31, 2019 and the financial highlights for each of the five years in the period ended August 31, 2019 in conformity with accounting principles generally accepted in the United States of America.
Basis for Opinion
These financial statements are the responsibility of the Fund’s management. Our responsibility is to express an opinion on the Fund’s financial statements based on our audits. We are a public accounting firm registered with the Public Company Accounting Oversight Board (United States) (PCAOB) and are required to be independent with respect to the Fund in accordance with the U.S. federal securities laws and the applicable rules and regulations of the Securities and Exchange Commission and the PCAOB.
We conducted our audits of these financial statements in accordance with the standards of the PCAOB. Those standards require that we plan and perform the audit to obtain reasonable assurance about whether the financial statements are free of material misstatement, whether due to error or fraud.
Our audits included performing procedures to assess the risks of material misstatement of the financial statements, whether due to error or fraud, and performing procedures that respond to those risks. Such procedures included examining, on a test basis, evidence regarding the amounts and disclosures in the financial statements. Our audits also included evaluating the accounting principles used and significant estimates made by management, as well as evaluating the overall presentation of the financial statements. Our procedures included confirmation of securities owned as of August 31, 2019, by correspondence with the custodian and brokers; when replies were not received from brokers, we performed other audit procedures. We believe that our audits provide a reasonable basis for our opinion.
/s/PricewaterhouseCoopers LLP
Minneapolis, Minnesota
October 24, 2019
We have served as the auditor of one or more investment companies within the Columbia Funds Complex since 1977.
Columbia Disciplined Small Core Fund | Annual Report 2019
| 37 |
Federal Income Tax Information
(Unaudited)
The Fund hereby designates the following tax attributes for the fiscal year ended August 31, 2019. Shareholders will be notified in early 2020 of the amounts for use in preparing 2019 income tax returns.
Qualified
dividend
income | Dividends
received
deduction | Capital
gain
dividend |
| 81.85% | 80.36% | $2,081,545 |
Qualified dividend income. For taxable, non-corporate shareholders, the percentage of ordinary income distributed during the fiscal year that represents qualified dividend income subject to reduced tax rates.
Dividends received deduction. The percentage of ordinary income distributed during the fiscal year that qualifies for the corporate dividends received deduction.
Capital gain dividend. The Fund designates as a capital gain dividend the amount reflected above, or if subsequently determined to be different, the net capital gain of such fiscal period.
TRUSTEES AND OFFICERS
The Board oversees the Fund’s operations and appoints officers who are responsible for day-to-day business decisions based on policies set by the Board. The following table provides basic biographical information about the Fund’s Trustees as of the printing of this report, including their principal occupations during the past five years, although specific titles for individuals may have varied over the period. The year set forth beneath Length of Service in the table below is the year in which the Trustee was first appointed or elected as Trustee to any Fund currently in the Columbia Funds Complex or a predecessor thereof. Under current Board policy, members serve terms of indefinite duration.
Independent trustees
| Name, address, year of birth | Position held with the Trust and length of service | Principal occupation(s) during the past five years and other relevant professional experience | Number of Funds in the Columbia Fund Complex overseen | Other directorships held by Trustee during the past five years |
Janet Langford Carrig
c/o Columbia Management
Investment Advisers, LLC
225 Franklin Street
Mail Drop BX32 05228
Boston, MA 02110
1957 | Trustee
1996 | Senior Vice President, General Counsel and Corporate Secretary, ConocoPhillips (independent energy company), September 2007-October 2018 | 70 | None |
Douglas A. Hacker
c/o Columbia Management
Investment Advisers, LLC
225 Franklin Street
Mail Drop BX32 05228
Boston, MA 02110
1955 | Trustee and Chairman of the Board
1996 | Independent business executive since May 2006; Executive Vice President — Strategy of United Airlines, December 2002-May 2006; President of UAL Loyalty Services (airline marketing company), September 2001-December 2002; Executive Vice President and Chief Financial Officer of United Airlines, July 1999-September 2001 | 70 | Spartan Nash Company, (food distributor); former Director, Nash Finch Company (food distributor), 2005-2013; Aircastle Limited (aircraft leasing); former Director, SeaCube Container Leasing Ltd. (container leasing), 2010-2013; and Travelport Worldwide Limited (travel information technology) |
| 38 | Columbia Disciplined Small Core Fund | Annual Report 2019 |
TRUSTEES AND OFFICERS (continued)
Independent trustees (continued)
| Name, address, year of birth | Position held with the Trust and length of service | Principal occupation(s) during the past five years and other relevant professional experience | Number of Funds in the Columbia Fund Complex overseen | Other directorships held by Trustee during the past five years |
Nancy T. Lukitsh
c/o Columbia Management
Investment Advisers, LLC
225 Franklin Street
Mail Drop BX32 05228
Boston, MA 02110
1956 | Trustee
2011 | Senior Vice President, Partner and Director of Marketing, Wellington Management Company, LLP (investment adviser), 1997-2010; Chair, Wellington Management Portfolios (commingled non-U.S. investment pools), 2007-2010; Director, Wellington Trust Company, NA and other Wellington affiliates, 1997-2010 | 70 | None |
David M. Moffett
c/o Columbia Management
Investment Advisers, LLC
225 Franklin Street
Mail Drop BX32 05228
Boston, MA 02110
1952 | Trustee
2011 | Retired. Consultant to Bridgewater and Associates | 70 | Director, CSX Corporation (transportation suppliers); Genworth Financial, Inc. (financial and insurance products and services); PayPal Holdings Inc. (payment and data processing services); Trustee, University of Oklahoma Foundation; former Director, eBay Inc. (online trading community), 2007-2015; and former Director, CIT Bank, CIT Group Inc. (commercial and consumer finance), 2010-2016 |
John J. Neuhauser
c/o Columbia Management
Investment Advisers, LLC
225 Franklin Street
Mail Drop BX32 05228
Boston, MA 02110
1943 | Trustee
1984 | President, Saint Michael’s College, August 2007-June 2018; Director or Trustee of several non-profit organizations, including University of Vermont Medical Center; Academic Vice President and Dean of Faculties, Boston College, August 1999-October 2005; University Professor, Boston College, November 2005-August 2007 | 70 | Liberty All-Star Equity Fund and Liberty All- Star Growth Fund (closed-end funds) |
Patrick J. Simpson
c/o Columbia Management
Investment Advisers, LLC
225 Franklin Street
Mail Drop BX32 05228
Boston, MA 02110
1944 | Trustee
2000 | Of Counsel, Perkins Coie LLP (law firm) since 2015; Partner, Perkins Coie LLP, 1988-2014 | 70 | Former Director, M Fund, Inc. (M Funds mutual fund family), July 2018-July 2019 |
Anne-Lee Verville
c/o Columbia Management
Investment Advisers, LLC
225 Franklin Street
Mail Drop BX32 05228
Boston, MA 02110
1945 | Trustee
1998 | Retired. General Manager, Global Education Industry, 1994-1997, President – Application Systems Division, 1991-1994, Chief Financial Officer – US Marketing & Services, 1988-1991, and Chief Information Officer, 1987-1988, IBM Corporation (computer and technology) | 70 | Former Director, Enesco Group, Inc. (producer of giftware and home and garden decor products), 2001-2006 |
Columbia Disciplined Small Core Fund | Annual Report 2019
| 39 |
TRUSTEES AND OFFICERS (continued)
Consultants to the Independent Trustees*
| Name, address, year of birth | Position held with the Trust and length of service | Principal occupation(s) during the past five years and other relevant professional experience | Number of Funds in the Columbia Funds complex overseen | Other directorships held by Trustee during the past five years |
J. Kevin Connaughton
c/o Columbia
Management Investment
Advisers, LLC,
225 Franklin Street
Mail Drop BX32 05228,
Boston, MA 02110
1964 | Independent Trustee Consultant
2016 | Independent Trustee Consultant, Columbia Funds since March 2016; Adjunct Professor of Finance, Bentley University since November 2017; Managing Director and General Manager of Mutual Fund Products, Columbia Management Investment Advisers, LLC, May 2010-February 2015; President, Columbia Funds, 2009-2015; and senior officer of Columbia Funds and affiliated funds, 2003-2015 | 70 | Director, The Autism Project since March 2015; former Trustee, New Century Portfolios, March 2015-December 2017; formerly on Board of Governors, Gateway Healthcare, January 2016 – December 2017 |
Olive Darragh
c/o Columbia
Management Investment
Advisers, LLC,
225 Franklin Street,
Mail Drop BX32 05228,
Boston, MA 02110
1962 | Independent Trustee Consultant 2019 | Independent Trustee Consultant, Columbia Funds since June 2019; Managing Director of Darragh Inc. (a strategy and talent management consulting firm) since 2010; Founder and CEO, Zolio (an investment management talent identification platform) since 2004; Partner, Tudor Investments, 2004-2010; Senior Partner, McKinsey & Company, 2001-2004 | 70 | Director, University of Edinburgh Business School; former Director, Boston Public Library Foundation |
Natalie A. Trunow
c/o Columbia
Management Investment
Advisers, LLC,
225 Franklin Street
Mail Drop BX32 05228,
Boston, MA 02110
1967 | Independent Trustee Consultant
2016 | Independent Trustee Consultant, Columbia Funds since September 2016; Chief Executive Officer, Millennial Portfolio Solutions LLC (asset management and consulting services) since January 2016; Director of Investments, Casey Family Programs, April 2016-September 2016; Senior Vice President and Chief Investment Officer, Calvert Investments, August 2008-January 2016; Section Head and Portfolio Manager, General Motors Asset Management, June 1997-August 2008 | 70 | Director, Health Services for Children with Special Needs, Inc.; Director, Consumer Credit Counseling Services (formerly Guidewell Financial Solutions) |
| * | J. Kevin Connaughton was appointed consultant to the Independent Trustees effective March 1, 2016. Olive Darragh was appointed consultant to the Independent Trustees effective June 10, 2019. Natalie A. Trunow was appointed consultant to the Independent Trustees effective September 1, 2016. Shareholders of the Funds are expected to be asked to elect each of Mr. Connaughton, Ms. Darragh and Ms. Trunow as a Trustee at a future shareholder meeting. |
Interested trustee affiliated with Investment Manager*
| Name, address, year of birth | Position held with the Trust and length of service | Principal occupation(s) during the past five years and other relevant professional experience | Number of Funds in the Columbia Funds Complex overseen | Other directorships held by Trustee during the past five years |
William F. Truscott
c/o Columbia Management
Investment Advisers, LLC
225 Franklin Street
Boston, MA 02110
1960 | Trustee
2012 | Chairman of the Board and President, Columbia Management Investment Advisers, LLC since May 2010 and February 2012, respectively; Chief Executive Officer, Global Asset Management, Ameriprise Financial, Inc. since September 2012 (previously Chief Executive Officer, U.S. Asset Management & President, Annuities, May 2010-September 2012); Director and Chief Executive Officer, Columbia Management Investment Distributors, Inc. since May 2010 and February 2012, respectively; Chairman of the Board and Chief Executive Officer, RiverSource Distributors, Inc. since 2006; Director, Threadneedle Asset Management Holdings, SARL since 2014; President and Chief Executive Officer, Ameriprise Certificate Company, 2006-August 2012 | 192 | Chairman of the Board, Columbia Management Investment Advisers, LLC since May 2010; Director, Columbia Management Investment Distributors, Inc. since May 2010; former Director, Ameriprise Certificate Company, August 2006 - January 2013 |
| 40 | Columbia Disciplined Small Core Fund | Annual Report 2019 |
TRUSTEES AND OFFICERS (continued)
| * | Interested person (as defined under the 1940 Act) by reason of being an officer, director, security holder and/or employee of the Investment Manager or Ameriprise Financial. |
The Statement of Additional Information has additional information about the Fund’s Board members and is available, without charge, upon request by calling 800.345.6611, visiting columbiathreadneedleus.com/investor/ or contacting your financial intermediary.
The Board has appointed officers who are responsible for day-to-day business decisions based on policies it has established. The officers serve at the pleasure of the Board. The following table provides basic information about the Officers of the Fund as of the printing of this report, including principal occupations during the past five years, although their specific titles may have varied over the period. In addition to Mr. Truscott, who is Senior Vice President, the Fund’s other officers are:
Fund officers
Name,
address and
year of birth | Position and year
first appointed to
position for any Fund
in the Columbia
Funds complex or a
predecessor thereof | Principal occupation(s) during past five years |
Christopher O. Petersen
5228 Ameriprise
Financial Center
Minneapolis, MN 55474
Born 1970 | President and Principal Executive Officer (2015) | Vice President and Lead Chief Counsel, Ameriprise Financial, Inc. since January 2015 (previously Vice President and Chief Counsel, January 2010 - December 2014; officer of Columbia Funds and affiliated funds since 2007. |
Michael G. Clarke
225 Franklin Street
Boston, MA 02110
Born 1969 | Chief Financial Officer (Principal Financial Officer) (2009) and Senior Vice President (2019) | Vice President, Head of North American Operations, and Co-Head of Global Operations, Columbia Management Investment Advisers, LLC, since June 2019 (previously Vice President – Accounting and Tax, May 2010 - May 2019); senior officer of Columbia Funds and affiliated funds since 2002 (previously Treasurer and Chief Accounting Officer, January 2009 - January 2019 and December 2015 - January 2019, respectively). |
Joseph Beranek
5890 Ameriprise
Financial Center
Minneapolis, MN 55474
Born 1965 | Treasurer and Chief Accounting Officer (Principal Accounting Officer) (2019) | Vice President — Mutual Fund Accounting and Financial Reporting, Columbia Management Investment Advisers, LLC, since December 2018 and March 2017, respectively (previously Vice President — Pricing and Corporate Actions, May 2010 - March 2017). |
Paul B. Goucher
485 Lexington Avenue
New York, NY 10017
Born 1968 | Senior Vice President (2011) and Assistant Secretary (2008) | Senior Vice President and Assistant General Counsel, Ameriprise Financial, Inc. since January 2017 (previously Vice President and Lead Chief Counsel, November 2008 - January 2017 and January 2013 - January 2017, respectively); Vice President, Chief Legal Officer and Assistant Secretary, Columbia Management Investment Advisers, LLC since March 2015 (previously Vice President and Assistant Secretary, May 2010 – March 2015). |
Thomas P. McGuire
225 Franklin Street
Boston, MA 02110
Born 1972 | Senior Vice President and Chief Compliance Officer (2012) | Vice President — Asset Management Compliance, Ameriprise Financial, Inc., since May 2010; Chief Compliance Officer, Ameriprise Certificate Company since September 2010. |
Colin Moore
225 Franklin Street
Boston, MA 02110
Born 1958 | Senior Vice President (2010) | Executive Vice President and Global Chief Investment Officer, Ameriprise Financial, Inc., since July 2013; Executive Vice President and Global Chief Investment Officer, Columbia Management Investment Advisers, LLC since July 2013. |
Ryan C. Larrenaga
225 Franklin Street
Boston, MA 02110
Born 1970 | Senior Vice President (2017), Chief Legal Officer (2017), and Secretary (2015) | Vice President and Chief Counsel, Ameriprise Financial, Inc. since August 2018 (previously Vice President and Group Counsel, August 2011 - August 2018); officer of Columbia Funds and affiliated funds since 2005. |
Michael E. DeFao
225 Franklin Street
Boston, MA 02110
Born 1968 | Vice President (2011) and Assistant Secretary (2010) | Vice President and Chief Counsel, Ameriprise Financial, Inc. since May 2010. |
Columbia Disciplined Small Core Fund | Annual Report 2019
| 41 |
TRUSTEES AND OFFICERS (continued)
Fund officers (continued)
Name,
address and
year of birth | Position and year
first appointed to
position for any Fund
in the Columbia
Funds complex or a
predecessor thereof | Principal occupation(s) during past five years |
Lyn Kephart-Strong
5228 Ameriprise
Financial Center
Minneapolis, MN 55474
Born 1960 | Vice President (2015) | President, Columbia Management Investment Services Corp. since October 2014; Vice President & Resolution Officer, Ameriprise Trust Company since August 2009. |
Board Consideration and Approval of Management
Agreement
On June 12, 2019, the Board of Trustees (the Board) and the Trustees who are not interested persons (as defined in the Investment Company Act of 1940) (the Independent Trustees) of Columbia Funds Series Trust I (the Trust) unanimously approved the continuation of the Management Agreement (the Management Agreement) with Columbia Management Investment Advisers, LLC (the Investment Manager) with respect to Columbia Disciplined Small Core Fund (the Fund), a series of the Trust. As detailed below, the Board’s Advisory Fees and Expenses Committee (the Committee) and the Board met on multiple occasions to review and discuss, among themselves, with the management team of the Investment Manager and with an independent fee consultant, materials provided by the Investment Manager, the independent fee consultant and others before determining to approve the continuation of the Management Agreement.
In connection with their deliberations regarding the continuation of the Management Agreement, the Committee and the Board evaluated materials requested from the Investment Manager regarding the Fund and the Management Agreement, and discussed these materials with representatives of the Investment Manager at Committee meetings held on March 5, 2019, April 25, 2019 and June 11, 2019 and at Board meetings held on March 6, 2019 and June 12, 2019. In addition, the Board and its various committees consider matters bearing on the Management Agreement at other meetings throughout the year and in prior years and meet regularly with senior management of the Trust and the Investment Manager. Through the Board’s Investment Oversight Committees, Trustees also meet with selected portfolio managers of the funds the Trustees oversee and with other investment personnel at various times throughout the year. The Committee and the Board also consulted with the independent fee consultant, Fund counsel and the Independent Trustees’ independent legal counsel, who advised on various matters with respect to the Committee’s and the Board’s considerations and otherwise assisted the Committee and the Board in their deliberations. On June 11, 2019, the Committee recommended that the Board approve the continuation of the Management Agreement. On June 12, 2019, the Board, including the Independent Trustees, voting separately, unanimously approved the continuation of the Management Agreement for the Fund.
The Committee and the Board considered all information that they, their legal counsel or the Investment Manager believed reasonably necessary to evaluate and to determine whether to recommend for approval or approve the continuation of the Management Agreement. The information and factors considered by the Committee and the Board in recommending for approval or approving the continuation of the Management Agreement for the Fund included the following:
| • | Information on the investment performance of the Fund relative to the performance of a group of mutual funds determined to be comparable to the Fund by an independent third-party data provider, as well as performance relative to benchmarks; |
| • | Information on the Fund’s management fees and total expenses, including information comparing the Fund’s expenses to those of a group of comparable mutual funds, as determined by the independent third-party data provider; |
| 42 | Columbia Disciplined Small Core Fund | Annual Report 2019 |
Board Consideration and Approval of Management
Agreement (continued)
| • | The Investment Manager’s agreement to contractually limit or cap total operating expenses for the Fund through December 31, 2020 so that total operating expenses (excluding certain fees and expenses, such as transaction costs and certain other investment related expenses, interest, taxes, acquired fund fees and expenses, and infrequent and/or unusual expenses) would not exceed a specified annual rate, as a percentage of the Fund’s net assets; |
| • | The terms and conditions of the Management Agreement; |
| • | The current and proposed terms and conditions of other agreements and arrangements with affiliates of the Investment Manager relating to the operations of the Fund, including agreements with respect to the provision of distribution, transfer agency and shareholder services to the Fund; |
| • | Descriptions of various functions performed by the Investment Manager under the Management Agreement, including portfolio management and portfolio trading practices; |
| • | Information regarding the management fees of similarly-managed portfolios of other clients of the Investment Manager, including institutional accounts and collective trusts; |
| • | Information regarding the reputation, regulatory history and resources of the Investment Manager, including information regarding senior management, portfolio managers and other personnel; |
| • | Information regarding the capabilities of the Investment Manager with respect to compliance monitoring services, including an assessment of the Investment Manager’s compliance system by the Fund’s Chief Compliance Officer; and |
| • | The profitability to the Investment Manager and its affiliates from their relationships with the Fund. |
Nature, extent and quality of services provided under the Management Agreement
The Committee and the Board considered the nature, extent and quality of services provided to the Fund by the Investment Manager and its affiliates under the Management Agreement and under separate agreements for the provision of transfer agency and shareholder services, and the resources dedicated to the Fund and the other Columbia Funds by the Investment Manager and its affiliates. The Committee and the Board considered, among other things, the Investment Manager’s ability to attract, motivate and retain highly qualified research, advisory and supervisory investment professionals (including compensation programs for personnel involved in fund management, reputation and other attributes), the portfolio management services provided by those investment professionals, and the quality of the Investment Manager’s investment research capabilities and trade execution services. The Committee and the Board also considered the potential benefits to shareholders of investing in a mutual fund that is part of a fund complex offering exposure to a variety of asset classes and investment disciplines and providing a variety of fund and shareholder services.
The Committee and the Board also considered the professional experience and qualifications of the senior personnel of the Investment Manager, which included consideration of the Investment Manager’s experience with funds using an investment strategy similar to that used by the Investment Manager for the Fund. The Committee and the Board noted the compliance programs of and the compliance-related resources provided to the Fund by the Investment Manager and its affiliates and the resources dedicated by the Investment Manager and its affiliates to risk management, and considered the Investment Manager’s ability to provide administrative services to the Fund and coordinate the activities of the Fund’s other service providers. After reviewing these and related factors, the Committee and the Board concluded, within the context of their overall conclusions, that the nature, extent and quality of the services provided to the Fund under the Management Agreement supported the continuation of the Management Agreement.
Investment performance
The Committee and the Board reviewed information about the performance of the Fund over various time periods, including performance information relative to benchmarks, information that compared the performance of the Fund to the performance of a group of comparable mutual funds as determined by the independent third-party data provider, and information and analysis provided by the independent fee consultant. The Committee and the Board also reviewed a description of the third party’s methodology for identifying the Fund’s peer groups for purposes of performance and expense comparisons. Although the Fund’s performance lagged that of a relevant peer group for certain (although not necessarily all) periods, the Committee
Columbia Disciplined Small Core Fund | Annual Report 2019
| 43 |
Board Consideration and Approval of Management
Agreement (continued)
and the Board concluded that other factors relevant to performance were sufficient, in light of other considerations, to support continuation of the Management Agreement. Those factors included one or more of the following: (i) that the Fund’s performance, although lagging in certain recent periods, was stronger over the longer term; (ii) that the underperformance was attributable, to a significant extent, to investment decisions that were reasonable and consistent with the Fund’s investment strategy and policies and that the Fund was performing within a reasonable range of expectations, given those investment decisions, market conditions and the Fund’s investment strategy; (iii) that the Fund’s performance was competitive when compared to other relevant performance benchmarks or peer groups; and (iv) that the Investment Manager had taken or was taking steps designed to help improve the Fund’s investment performance, including, but not limited to, replacing portfolio managers, enhancing the resources supporting the portfolio managers, or modifying investment strategies.
The Committee and the Board noted that, through December 31, 2018, the Fund’s performance was in the ninety-first, ninety-ninth and ninety-seventh percentile (where the best performance would be in the first percentile) of its category selected by the independent third-party data provider for the purposes of performance comparisons for the one-, three- and five-year periods, respectively.
The Committee and the Board also considered the Investment Manager’s performance and reputation generally, the Investment Manager’s historical responsiveness to Board concerns about performance, and the Investment Manager’s willingness to take steps intended to improve performance. After reviewing these and related factors, the Committee and the Board concluded, within the context of their overall conclusions, that the performance of the Fund and the Investment Manager was sufficient, in light of other considerations, to support the continuation of the Management Agreement.
Investment management fee rates and other expenses
The Committee and the Board considered the management fees charged to the Fund under the Management Agreement as well as the total expenses incurred by the Fund. In assessing the reasonableness of the fees under the Management Agreement, the Committee and the Board considered, among other information, the Fund’s total expense ratio as a percentage of average daily net assets. The Committee and the Board considered data provided by the independent third-party data provider and the independent fee consultant. The Committee and the Board noted that, as of December 31, 2018, the Fund’s actual management fee and net total expense ratio were both ranked in the third quintiles, respectively, (where the lowest fees and expenses would be in the first quintile) against the Fund’s expense universe as determined by the independent third-party data provider for purposes of expense comparison. The Committee and the Board also took into account the fee waiver and expense limitation arrangements agreed to by the Investment Manager, as noted above.
The Committee and the Board also received and considered information about the management fees charged by the Investment Manager to institutional accounts. In considering the fees charged to those accounts, the Committee and the Board took into account, among other things, the Investment Manager’s representations about the differences between managing mutual funds as compared to other types of accounts, including differences in the services provided, differences in the risk profile of such business for the Investment Manager and the additional resources required to manage mutual funds effectively. The Committee and the Board also received and considered information about the fees charged by the Investment Manager for sub-advisory services it provides to comparable unaffiliated funds. In evaluating the Fund’s management fees, the Committee and the Board also took into account the demands, complexity and quality of the investment management of the Fund.
After reviewing these and related factors, the Committee and the Board concluded, within the context of their overall conclusions, that the management fee rates and expenses of the Fund, in light of other considerations, supported the continuation of the Management Agreement.
Costs of services provided and profitability
The Committee and the Board also took note of the costs the Investment Manager and its affiliates incur in connection with the services provided and the profitability to the Investment Manager and its affiliates from their relationships with the Fund, and the efforts undertaken by the Investment Manager and its affiliates to manage efficiently their costs to provide such services.
| 44 | Columbia Disciplined Small Core Fund | Annual Report 2019 |
Board Consideration and Approval of Management
Agreement (continued)
The Committee and the Board also considered the compensation directly or indirectly received by the Investment Manager’s affiliates in connection with their relationships with the Fund. The Committee and the Board reviewed information provided by management as to the profitability to the Investment Manager and its affiliates of their relationships with the Fund, information about the allocation of expenses used to calculate profitability, and comparisons of profitability levels realized in 2018 to profitability levels realized in 2017. When reviewing profitability, the Committee and the Board also considered court cases in which adviser profitability was an issue in whole or in part, the performance of similarly managed funds, the performance of the Fund, and the expense ratio of the Fund. In addition, the Committee and the Board considered information provided by the Investment Manager regarding the Investment Manager’s financial condition and comparing its profitability to that of other asset management firms that are, or are subsidiaries of, publicly traded companies. In this regard, the Committee and the Board also considered data provided by the independent fee consultant.
After reviewing these and related factors, the Committee and the Board concluded, within the context of their overall conclusions, that the costs of services provided and the profitability to the Investment Manager and its affiliates from their relationships with the Fund supported the continuation of the Management Agreement.
Economies of scale
The Committee and the Board considered the potential existence of economies of scale in the provision by the Investment Manager of services to the Fund, to groups of related funds, and to the Investment Manager’s investment advisory clients as a whole, and whether those economies of scale were shared with the Fund through breakpoints in investment management fees or other means, such as expense limitation arrangements and additional investments by the Investment Manager in investment, trading, compliance and other resources. The Committee and the Board noted that the management fee schedules for the Fund contained breakpoints that would reduce the fee rate on assets above specified threshold levels.
In considering these matters, the Committee and the Board also considered the costs of the services provided and the profitability to the Investment Manager and its affiliates from their relationships with the Fund, as noted above. After reviewing these and related factors, the Committee and the Board concluded, within the context of their overall conclusions, that the extent to which any economies of scale were expected to be shared with the Fund supported the continuation of the Management Agreement.
Other benefits to the Investment Manager
The Committee and the Board received and considered information regarding “fall-out” or ancillary benefits received by the Investment Manager and its affiliates as a result of their relationships with the Fund, such as the engagement of the Investment Manager’s affiliates to provide distribution, transfer agency and shareholder services to the Fund. In this regard, among other matters, the Committee and the Board considered that the Fund’s distributor retains a portion of the distribution fees from the Fund and receives a portion of the sales charges on sales or redemptions of certain classes of shares of the Fund. The Committee and the Board also considered the benefits of research made available to the Investment Manager by reason of brokerage commissions generated by the Fund’s securities transactions, and reviewed information about the Investment Manager’s practices with respect to considering brokerage and research services when allocating portfolio transactions. In this connection, the Board also noted that the amount of research made available to the Investment Manager by reason of brokerage commissions had been declining over time, and may decline further. The Committee and the Board recognized that the Investment Manager’s profitability would be somewhat lower without these benefits.
Conclusion
The Committee and the Board reviewed all of the above considerations in reaching their decisions to recommend or approve the continuation of the Management Agreement. In their deliberations, the Trustees did not identify any particular information that was all-important or controlling, and individual Trustees may have attributed different weights to the various factors. Based on their evaluation of all factors that they deemed to be material, including those factors described above, and assisted by the advice of independent legal counsel, the Board, including the Independent Trustees, voting separately, unanimously approved the continuation of the Management Agreement.
Columbia Disciplined Small Core Fund | Annual Report 2019
| 45 |
[THIS PAGE INTENTIONALLY LEFT BLANK]
[THIS PAGE INTENTIONALLY LEFT BLANK]
Columbia Disciplined Small Core Fund
P.O. Box 219104
Kansas City, MO 64121-9104
Please read and consider the investment objectives, risks, charges and expenses for any fund carefully before investing. For a prospectus and summary prospectus, which contains this and other important information about the Fund, go to
columbiathreadneedleus.com/investor/. The Fund is distributed by Columbia Management Investment Distributors, Inc., member FINRA, and managed by Columbia Management Investment Advisers, LLC.
Columbia Threadneedle Investments (Columbia Threadneedle) is the global brand name of the Columbia and Threadneedle group of companies. All rights reserved.
© 2019 Columbia Management Investment Advisers, LLC.
columbiathreadneedleus.com/investor/

Annual Report
August 31, 2019
Columbia Small Cap Growth Fund I
Beginning on January 1, 2021, as permitted by regulations adopted by the Securities and Exchange Commission, paper copies of the Fund’s annual and semiannual shareholder reports like this one will no longer be sent by mail, unless you specifically request paper copies of the reports. Instead, the reports will be made available on the Fund’s website (columbiathreadneedleus.com/investor/), and each time a report is posted you will be notified by mail and provided with a website address to access the report.
If you have already elected to receive shareholder reports electronically, you will not be affected by this change and you need not take any action. You may elect to receive shareholder reports and other communications from the Fund electronically at any time by contacting your financial intermediary (such as a broker-dealer or bank) or, for Fund shares held directly with the Fund, by calling 800.345.6611 or by enrolling in “eDelivery” by logging into your account at columbiathreadneedleus.com/investor/.
You may elect to receive all future reports in paper free of charge. If you invest through a financial intermediary, you can contact your financial intermediary to request that you continue receiving paper copies of your shareholder reports. If you invest directly with the Fund, you can call 800.345.6611 to let the Fund know you wish to continue receiving paper copies of your shareholder reports. Your election to receive paper reports will apply to all Columbia Funds held in your account if you invest through a financial intermediary or all Columbia Funds held with the fund complex if you invest directly with the Fund.
Not FDIC Insured • No bank guarantee • May lose value
Columbia Small Cap Growth Fund I (the Fund) mails one shareholder report to each shareholder address, unless such shareholder elected to receive shareholder reports from the Fund electronically. If you would like more than one report, please call shareholder services at 800.345.6611 and additional reports will be sent to you.
Proxy voting policies and procedures
The policy of the Board of Trustees is to vote the proxies of the companies in which the Fund holds investments consistent with the procedures as stated in the Statement of Additional Information (SAI). You may obtain a copy of the SAI without charge by calling 800.345.6611; contacting your financial intermediary; visiting columbiathreadneedleus.com/investor/; or searching the website of the Securities and Exchange Commission (SEC) at sec.gov. Information regarding how the Fund voted proxies relating to portfolio securities is filed with the SEC by August 31st for the most recent 12-month period ending June 30th of that year, and is available without charge by visiting columbiathreadneedleus.com/investor/, or searching the website of the SEC at sec.gov.
Quarterly schedule of investments
The Fund files a complete schedule of portfolio holdings with the SEC for the first and third quarters of each fiscal year on Form N-PORT, and for reporting periods ended prior to March 31, 2019, on Form N-Q. The Fund’s Form N-Q and Form N-PORT filings are available on the SEC’s website at sec.gov. The Fund’s complete schedule of portfolio holdings, as filed on Form N-Q or Form N-PORT, can also be obtained without charge, upon request, by calling 800.345.6611.
Additional Fund information
For more information about the Fund, please visit columbiathreadneedleus.com/investor/ or call 800.345.6611. Customer Service Representatives are available to answer your questions Monday through Friday from 8 a.m. to 7 p.m. Eastern time.
Fund investment manager
Columbia Management Investment Advisers, LLC (the Investment Manager)
225 Franklin Street
Boston, MA 02110
Fund distributor
Columbia Management Investment Distributors, Inc.
225 Franklin Street
Boston, MA 02110
Fund transfer agent
Columbia Management Investment Services Corp.
P.O. Box 219104
Kansas City, MO 64121-9104
Columbia Small Cap Growth Fund I | Annual Report 2019
Investment objective
The Fund seeks capital appreciation, by investing, under normal market conditions, at least 80% of its net assets (plus any borrowings for investment purposes) in stocks of companies with a market capitalization, at the time of initial purchase, equal to or less than, the largest stock in the Standard & Poor’s (S&P) SmallCap 600® Index.
Portfolio management
Daniel Cole, CFA
Co-Portfolio Manager
Managed Fund since 2015
Wayne Collette, CFA
Co-Portfolio Manager
Managed Fund since 2006
Lawrence Lin, CFA
Co-Portfolio Manager
Managed Fund since 2007
Morningstar style boxTM
The Morningstar Style Box is based on a fund’s portfolio holdings. For equity funds, the vertical axis shows the market capitalization of the stocks owned, and the horizontal axis shows investment style (value, blend, or growth). Information shown is based on the most recent data provided by Morningstar.
© 2019 Morningstar, Inc. All rights reserved. The Morningstar information contained herein: (1) is proprietary to Morningstar and/or its content providers; (2) may not be copied or distributed; and (3) is not warranted to be accurate, complete or timely. Neither Morningstar nor its content providers are responsible for any damages or losses arising from any use of this information.
| Average annual total returns (%) (for the period ended August 31, 2019) |
| | | Inception | 1 Year | 5 Years | 10 Years |
| Class A | Excluding sales charges | 11/01/05 | 7.76 | 15.20 | 15.17 |
| | Including sales charges | | 1.55 | 13.84 | 14.49 |
| Advisor Class* | 11/08/12 | 8.05 | 15.49 | 15.46 |
| Class C | Excluding sales charges | 11/01/05 | 6.93 | 14.33 | 14.30 |
| | Including sales charges | | 6.08 | 14.33 | 14.30 |
| Institutional Class | 10/01/96 | 8.08 | 15.49 | 15.46 |
| Institutional 2 Class* | 02/28/13 | 8.16 | 15.62 | 15.58 |
| Institutional 3 Class | 07/15/09 | 8.26 | 15.69 | 15.66 |
| Class R* | 09/27/10 | 7.53 | 14.92 | 14.88 |
| Russell 2000 Growth Index | | -11.02 | 8.06 | 13.06 |
| Russell 2000 Index | | -12.89 | 6.41 | 11.59 |
Returns for Class A shares are shown with and without the maximum initial sales charge of 5.75%. Returns for Class C shares are shown with and without the 1.00% contingent deferred sales charge for the first year only. The Fund’s other share classes are not subject to sales charges and have limited eligibility. Please see the Fund’s prospectus for details. Performance for different share classes will vary based on differences in sales charges and fees associated with each share class. All results shown assume reinvestment of distributions during the period. Returns do not reflect the deduction of taxes that a shareholder may pay on Fund distributions or on the redemption of Fund shares. Performance results reflect the effect of any fee waivers or reimbursements of Fund expenses by Columbia Management Investment Advisers, LLC and/or any of its affiliates. Absent these fee waivers or expense reimbursement arrangements, performance results would have been lower.
The performance information shown represents past performance and is not a guarantee of future results. The investment return and principal value of your investment will fluctuate so that your shares, when redeemed, may be worth more or less than their original cost. Current performance may be lower or higher than the performance information shown. You may obtain performance information current to the most recent month-end by contacting your financial intermediary, visiting columbiathreadneedleus.com/investor/ or calling 800.345.6611.
| * | The returns shown for periods prior to the share class inception date (including returns for the Life of the Fund, if shown, which are since Fund inception) include the returns of the Fund’s oldest share class. These returns are adjusted to reflect any higher class-related operating expenses of the newer share classes, as applicable. Please visit columbiathreadneedleus.com/investor/investment-products/mutual-funds/appended-performance for more information. |
The Russell 2000 Growth Index, an unmanaged index, measures the performance of those Russell 2000 Index companies with higher price-to-book ratios and higher forecasted growth values.
The Russell 2000 Index measures the performance of the small-cap segment of the U.S. equity universe. The Russell 2000 is a subset of the Russell 3000 Index representing approximately 10% of the total market capitalization of that index. It includes approximately 2,000 of the smallest securities based on a combination of their market capitalization and current index membership.
Indices are not available for investment, are not professionally managed and do not reflect sales charges, fees, brokerage commissions, taxes or other expenses of investing. Securities in the Fund may not match those in an index.
Columbia Small Cap Growth Fund I | Annual Report 2019
| 3 |
Fund at a Glance (continued)
Performance of a hypothetical $10,000 investment (August 31, 2009 — August 31, 2019)
The chart above shows the change in value of a hypothetical $10,000 investment in Class A shares of Columbia Small Cap Growth Fund I during the stated time period, and does not reflect the deduction of taxes that a shareholder may pay on Fund distributions or on the redemption of Fund shares.
| Top 10 holdings (%) (at August 31, 2019) |
| World Wrestling Entertainment, Inc., Class A | 3.2 |
| Bio-Techne Corp. | 3.2 |
| Quidel Corp. | 2.6 |
| Cantel Medical Corp. | 2.6 |
| Everbridge, Inc. | 2.5 |
| Planet Fitness, Inc., Class A | 2.5 |
| Trex Company, Inc. | 2.3 |
| Neogen Corp. | 2.3 |
| Chemed Corp. | 2.3 |
| Five Below, Inc. | 2.2 |
Percentages indicated are based upon total investments excluding Money Market Funds and investments in derivatives, if any.
For further detail about these holdings, please refer to the section entitled “Portfolio of Investments.”
Fund holdings are as of the date given, are subject to change at any time, and are not recommendations to buy or sell any security.
| Portfolio breakdown (%) (at August 31, 2019) |
| Common Stocks | 98.3 |
| Limited Partnerships | 0.7 |
| Money Market Funds | 1.0 |
| Total | 100.0 |
Percentages indicated are based upon total investments excluding investments in derivatives, if any. The Fund’s portfolio composition is subject to change.
| Equity sector breakdown (%) (at August 31, 2019) |
| Communication Services | 3.2 |
| Consumer Discretionary | 12.7 |
| Consumer Staples | 1.9 |
| Energy | 1.0 |
| Financials | 2.8 |
| Health Care | 35.0 |
| Industrials | 14.3 |
| Information Technology | 23.7 |
| Materials | 2.3 |
| Real Estate | 3.1 |
| Total | 100.0 |
Percentages indicated are based upon total equity investments. The Fund’s portfolio composition is subject to change.
| 4 | Columbia Small Cap Growth Fund I | Annual Report 2019 |
Manager Discussion of Fund Performance
For the 12-month period that ended August 31, 2019, the Fund’s Class A shares returned 7.76% excluding sales charges. The Fund solidly outperformed its benchmarks, the Russell 2000 Growth Index and the Russell 2000 Index, which lost 11.02% and 12.89%, respectively. The Fund outperformed in all key sectors, including technology, health care, consumer discretionary and industrials. Our triangulated approach toward risk management served the Fund well in the difficult fourth calendar quarter of 2018, which positioned the Fund strongly entering calendar year 2019.
Trade concerns, interest rates drove financial markets
Optimism prevailed early in the 12-month period ended August 31, 2019, as positive global economic conditions, the impact of broad U.S. corporate tax cuts and moves to reduce regulation in a number of industries buoyed confidence. The labor markets added 173,000 jobs per month, on average, and manufacturing activity remained solid. Unemployment fell to a 50-year low of 3.7%.
However, the economic backdrop looked less rosy as the period wore on. U.S. growth slowed from above 3.0% to 2.1% (annualized). European economies transitioned to a slower pace of growth, struggling with rising interest rates, trade tensions and uncertainty surrounding Brexit (the U.K’s departure from the European Union). At the same time, China’s economic conditions weakened and emerging markets came under pressure, driven by trade and tariff concerns and a rising U.S dollar.
With global uncertainties on the rise, investors sold stocks and other risky assets late in 2018. Stock markets rebounded early in 2019, as the Federal Reserve (Fed) backed away from additional rate hikes, then dipped again in the final months of the period as trade concerns amplified. Late in July, the Fed lowered its key short-term borrowing rate by 25 basis points (a basis point is one hundredth of one percent).
Bonds solidly outperformed equities for the 12-month period. The Bloomberg Barclays U.S. Aggregate Bond Index, a broad measure of investment-grade bonds, returned 10.17%. The S&P 500 Index, a broad measure of U.S. stock returns, gained 2.92%.
Contributors and detractors
As stocks fell broadly at the end of 2018, trading at or below our average entry points of 70% of expected value, we added to many of the Fund’s software, health care and earlier stage companies. These areas of the portfolio contributed heavily to the Fund’s exceptional outperformance for the 12-month period.
In the technology sector, Coupa Software was the Fund’s top contributor for the year. Cloud-based Coupa specializes in business-spending management. The company has revolutionized the business procurement process by providing visibility and cost savings to customers. Coupa is both a transaction and an innovation platform and has multi-sided network effects, which is one of the core competitive advantages we look for in portfolio candidates. As Coupa adds customers, it increases the aggregate buying power of its platform, which attracts suppliers and makes the platform more useful to customers. Through new offerings such as the “Community Intelligence” module and the “Business Spend Index” module, Coupa relays best practices to its customer base, which incentivizes more users onto the network. The company is adding a “payments” module to aggregate buying as well as payments through its network. We continued to believe in Coupa’s long-term potential.
Healthcare Services Group (HCSG) was the Fund’s biggest disappointment for the period. HCSG provides management, administrative and operating services to the housekeeping, laundry, linen, facility maintenance and dietary service departments of U.S. nursing homes, retirement complexes, rehabilitation centers and hospitals. The Skilled Nursing Facility segment of the company’s customer base has been under considerable duress over the past couple of years, as contract renegotiations due to facility owner/operator changes have disrupted business. However, we’ve seen similar cycles before and see the potential for improvement. HCSG provides essential services. The company’s market share and scale equate to niche dominance that we believe is unlikely to be overthrown over the course of our investment time horizon. We believe that management has made positive economic value-added changes, such as reducing client billing periods and weeding out weaker players. Over the years, HCSG has created value by generating earnings well in excess of its industry cost of capital and we have maintained our position in the stock.
Columbia Small Cap Growth Fund I | Annual Report 2019
| 5 |
Manager Discussion of Fund Performance (continued)
At period’s end
Even though we harvested some gains in the last months of the period as certain stocks approached our price targets, the Fund remained overweight in health care and technology. We keep a watchful eye on the risk exposure of the overall portfolio, and we are confident in the risk/reward tradeoffs of core holdings. We expect sector rotations to result in occasional disappointments versus the Fund’s benchmark, and we have accounted for this possibility in the overall design of the process by which we allocate capital. We monitor risk at the individual stock level, the portfolio level and the firm level, which has guided us well. The single most important aspect of risk that we control for is the correct analysis of our portfolio businesses and respective valuations, which gives us the confidence to initiate or add to positions when entry points are attractive. We do not plan to deviate from this process.
Marketrisk may affect a single issuer, sector of the economy, industry or the market as a whole.Foreigninvestments subject the Fund to risks, including political, economic, market, social and others within a particular country, as well as to currency instabilities and less stringent financial and accounting standards generally applicable to U.S. issuers. Investments insmall-cap companies involve risks and volatility greater than investments in larger, more established companies.Growthsecurities, at times, may not perform as well as value securities or the stock market in general and may be out of favor with investors. The Fund may invest significantly in issuers within a particularsector, which may be negatively affected by market, economic or other conditions, making the Fund more vulnerable to unfavorable developments in the sector. See the Fund’s prospectus for more information on these and other risks.
The views expressed in this report reflect the current views of the respective parties. These views are not guarantees of future performance and involve certain risks, uncertainties and assumptions that are difficult to predict, so actual outcomes and results may differ significantly from the views expressed. These views are subject to change at any time based upon economic, market or other conditions and the respective parties disclaim any responsibility to update such views. These views may not be relied on as investment advice and, because investment decisions for a Columbia fund are based on numerous factors, may not be relied on as an indication of trading intent on behalf of any particular Columbia fund. References to specific securities should not be construed as a recommendation or investment advice.
| 6 | Columbia Small Cap Growth Fund I | Annual Report 2019 |
Understanding Your Fund’s Expenses
(Unaudited)
As an investor, you incur two types of costs. There are shareholder transaction costs, which generally include sales charges on purchases and may include redemption fees. There are also ongoing fund costs, which generally include management fees, distribution and/or service fees, and other fund expenses. The following information is intended to help you understand your ongoing costs (in dollars) of investing in the Fund and to help you compare these costs with the ongoing costs of investing in other mutual funds.
Analyzing your Fund’s expenses
To illustrate these ongoing costs, we have provided examples and calculated the expenses paid by investors in each share class of the Fund during the period. The actual and hypothetical information in the table is based on an initial investment of $1,000 at the beginning of the period indicated and held for the entire period. Expense information is calculated two ways and each method provides you with different information. The amount listed in the “Actual” column is calculated using the Fund’s actual operating expenses and total return for the period. You may use the Actual information, together with the amount invested, to estimate the expenses that you paid over the period. Simply divide your account value by $1,000 (for example, an $8,600 account value divided by $1,000 = 8.6), then multiply the results by the expenses paid during the period under the “Actual” column. The amount listed in the “Hypothetical” column assumes a 5% annual rate of return before expenses (which is not the Fund’s actual return) and then applies the Fund’s actual expense ratio for the period to the hypothetical return. You should not use the hypothetical account values and expenses to estimate either your actual account balance at the end of the period or the expenses you paid during the period. See “Compare with other funds” below for details on how to use the hypothetical data.
Compare with other funds
Since all mutual funds are required to include the same hypothetical calculations about expenses in shareholder reports, you can use this information to compare the ongoing cost of investing in the Fund with other funds. To do so, compare the hypothetical example with the 5% hypothetical examples that appear in the shareholder reports of other funds. As you compare hypothetical examples of other funds, it is important to note that hypothetical examples are meant to highlight the ongoing costs of investing in a fund only and do not reflect any transaction costs, such as sales charges, or redemption or exchange fees. Therefore, the hypothetical calculations are useful in comparing ongoing costs only, and will not help you determine the relative total costs of owning different funds. If transaction costs were included in these calculations, your costs would be higher.
| March 1, 2019 — August 31, 2019 |
| | Account value at the
beginning of the
period ($) | Account value at the
end of the
period ($) | Expenses paid during
the period ($) | Fund’s annualized
expense ratio (%) |
| | Actual | Hypothetical | Actual | Hypothetical | Actual | Hypothetical | Actual |
| Class A | 1,000.00 | 1,000.00 | 1,089.50 | 1,018.50 | 6.86 | 6.63 | 1.31 |
| Advisor Class | 1,000.00 | 1,000.00 | 1,090.70 | 1,019.75 | 5.56 | 5.37 | 1.06 |
| Class C | 1,000.00 | 1,000.00 | 1,084.90 | 1,014.74 | 10.77 | 10.40 | 2.06 |
| Institutional Class | 1,000.00 | 1,000.00 | 1,091.10 | 1,019.75 | 5.56 | 5.37 | 1.06 |
| Institutional 2 Class | 1,000.00 | 1,000.00 | 1,091.00 | 1,020.05 | 5.24 | 5.06 | 1.00 |
| Institutional 3 Class | 1,000.00 | 1,000.00 | 1,091.90 | 1,020.51 | 4.77 | 4.61 | 0.91 |
| Class R | 1,000.00 | 1,000.00 | 1,088.30 | 1,017.25 | 8.17 | 7.89 | 1.56 |
Expenses paid during the period are equal to the annualized expense ratio for each class as indicated above, multiplied by the average account value over the period and then multiplied by the number of days in the Fund’s most recent fiscal half year and divided by 365.
Expenses do not include fees and expenses incurred indirectly by the Fund from its investment in underlying funds, including affiliated and non-affiliated pooled investment vehicles, such as mutual funds and exchange-traded funds.
Had Columbia Management Investment Advisers, LLC and/or certain of its affiliates not waived/reimbursed certain fees and expenses, account value at the end of the period would have been reduced.
Columbia Small Cap Growth Fund I | Annual Report 2019
| 7 |
Portfolio of Investments
August 31, 2019
(Percentages represent value of investments compared to net assets)
Investments in securities
| Common Stocks 97.8% |
| Issuer | Shares | Value ($) |
| Communication Services 3.2% |
| Entertainment 3.2% |
| World Wrestling Entertainment, Inc., Class A | 301,692 | 21,549,860 |
| Total Communication Services | 21,549,860 |
| Consumer Discretionary 12.6% |
| Hotels, Restaurants & Leisure 5.1% |
| Planet Fitness, Inc., Class A(a) | 232,900 | 16,445,069 |
| Six Flags Entertainment Corp. | 87,500 | 5,177,375 |
| Texas Roadhouse, Inc. | 248,900 | 12,808,394 |
| Total | | 34,430,838 |
| Internet & Direct Marketing Retail 1.8% |
| Etsy, Inc.(a) | 161,700 | 8,536,143 |
| Revolve Group, Inc.(a) | 138,900 | 3,148,863 |
| Total | | 11,685,006 |
| Multiline Retail 0.7% |
| Ollie’s Bargain Outlet Holdings, Inc.(a) | 87,607 | 4,857,808 |
| Specialty Retail 5.0% |
| Five Below, Inc.(a) | 121,200 | 14,891,844 |
| Floor & Decor Holdings, Inc.(a) | 223,400 | 10,995,748 |
| Monro, Inc. | 99,000 | 7,694,280 |
| Total | | 33,581,872 |
| Total Consumer Discretionary | 84,555,524 |
| Consumer Staples 1.9% |
| Food & Staples Retailing 1.0% |
| BJ’s Wholesale Club Holdings, Inc.(a) | 248,530 | 6,526,398 |
| Food Products 0.9% |
| Freshpet, Inc.(a) | 124,200 | 6,095,736 |
| Total Consumer Staples | 12,622,134 |
| Energy 0.3% |
| Energy Equipment & Services 0.3% |
| Frank’s International NV(a) | 480,300 | 2,089,305 |
| Total Energy | 2,089,305 |
| Financials 2.7% |
| Insurance 0.6% |
| Goosehead Insurance, Inc., Class A | 92,500 | 4,277,200 |
| Common Stocks (continued) |
| Issuer | Shares | Value ($) |
| Thrifts & Mortgage Finance 2.1% |
| LendingTree, Inc.(a) | 45,200 | 14,016,068 |
| Total Financials | 18,293,268 |
| Health Care 34.5% |
| Biotechnology 3.8% |
| Adamas Pharmaceuticals, Inc.(a) | 321,523 | 2,028,810 |
| bluebird bio, Inc.(a) | 11,022 | 1,138,683 |
| Immunomedics, Inc.(a) | 234,700 | 3,004,160 |
| Invitae Corp.(a) | 250,800 | 6,084,408 |
| Ligand Pharmaceuticals, Inc.(a) | 57,100 | 5,190,961 |
| Mirati Therapeutics, Inc.(a) | 12,900 | 1,057,413 |
| Precision BioSciences, Inc.(a) | 165,089 | 1,406,559 |
| Sarepta Therapeutics, Inc.(a) | 42,200 | 3,804,330 |
| uniQure NV(a) | 29,200 | 1,584,100 |
| Total | | 25,299,424 |
| Health Care Equipment & Supplies 16.5% |
| BioLife Solutions, Inc.(a) | 369,700 | 7,649,093 |
| Cantel Medical Corp. | 186,400 | 17,135,752 |
| Glaukos Corp.(a) | 105,400 | 6,778,274 |
| Heska Corp.(a) | 128,600 | 9,026,434 |
| Insulet Corp.(a) | 96,300 | 14,846,571 |
| Neogen Corp.(a) | 212,700 | 14,999,604 |
| Quidel Corp.(a) | 272,700 | 17,193,735 |
| Quotient Ltd.(a) | 569,600 | 5,137,792 |
| Tactile Systems Technology, Inc.(a) | 82,600 | 4,166,344 |
| West Pharmaceutical Services, Inc. | 95,700 | 13,920,522 |
| Total | | 110,854,121 |
| Health Care Providers & Services 5.1% |
| Addus HomeCare Corp.(a) | 51,700 | 4,548,566 |
| Amedisys, Inc.(a) | 53,000 | 6,821,630 |
| Chemed Corp. | 34,883 | 14,979,807 |
| Guardant Health, Inc.(a) | 90,414 | 7,913,937 |
| Total | | 34,263,940 |
| Health Care Technology 1.3% |
| Teladoc Health, Inc.(a) | 149,065 | 8,627,882 |
The accompanying Notes to Financial Statements are an integral part of this statement.
| 8 | Columbia Small Cap Growth Fund I | Annual Report 2019 |
Portfolio of Investments (continued)
August 31, 2019
| Common Stocks (continued) |
| Issuer | Shares | Value ($) |
| Life Sciences Tools & Services 7.3% |
| Adaptive Biotechnologies Corp.(a) | 143,806 | 7,312,535 |
| Bio-Techne Corp. | 111,100 | 21,283,427 |
| Charles River Laboratories International, Inc.(a) | 74,400 | 9,761,280 |
| Codexis, Inc.(a) | 169,900 | 2,383,697 |
| Quanterix Corp.(a) | 318,500 | 8,386,105 |
| Total | | 49,127,044 |
| Pharmaceuticals 0.5% |
| Reata Pharmaceuticals, Inc., Class A(a) | 46,200 | 3,562,020 |
| Total Health Care | 231,734,431 |
| Industrials 14.1% |
| Aerospace & Defense 1.3% |
| Aerojet Rocketdyne Holdings, Inc.(a) | 163,600 | 8,544,828 |
| Building Products 4.1% |
| Simpson Manufacturing Co., Inc. | 188,800 | 12,120,960 |
| Trex Company, Inc.(a) | 178,302 | 15,250,170 |
| Total | | 27,371,130 |
| Commercial Services & Supplies 2.0% |
| Casella Waste Systems, Inc., Class A(a) | 71,648 | 3,259,984 |
| Healthcare Services Group, Inc. | 471,800 | 10,639,090 |
| Total | | 13,899,074 |
| Machinery 2.6% |
| John Bean Technologies Corp. | 48,500 | 4,962,520 |
| Proto Labs, Inc.(a) | 133,600 | 12,657,264 |
| Total | | 17,619,784 |
| Professional Services 0.8% |
| Insperity, Inc. | 53,100 | 5,260,086 |
| Road & Rail 3.3% |
| Knight-Swift Transportation Holdings, Inc. | 248,400 | 8,480,376 |
| Saia, Inc.(a) | 160,700 | 13,746,278 |
| Total | | 22,226,654 |
| Total Industrials | 94,921,556 |
| Information Technology 23.3% |
| Electronic Equipment, Instruments & Components 1.1% |
| Littelfuse, Inc. | 48,900 | 7,631,823 |
| IT Services 0.4% |
| Paysign, Inc.(a) | 222,400 | 2,955,696 |
| Common Stocks (continued) |
| Issuer | Shares | Value ($) |
| Semiconductors & Semiconductor Equipment 2.3% |
| Cabot Microelectronics Corp. | 35,700 | 4,450,005 |
| MKS Instruments, Inc. | 44,500 | 3,483,905 |
| Monolithic Power Systems, Inc. | 48,500 | 7,302,160 |
| Total | | 15,236,070 |
| Software 19.5% |
| Alteryx, Inc., Class A(a) | 38,300 | 5,455,835 |
| Anaplan, Inc.(a) | 73,000 | 3,966,090 |
| Avalara, Inc.(a) | 118,900 | 10,028,026 |
| Coupa Software, Inc.(a) | 78,200 | 10,864,326 |
| Everbridge, Inc.(a) | 195,100 | 16,817,620 |
| Five9, Inc.(a) | 186,700 | 11,801,307 |
| ForeScout Technologies, Inc.(a) | 137,100 | 4,912,293 |
| HubSpot, Inc.(a) | 40,070 | 8,001,177 |
| Medallia, Inc.(a) | 217,024 | 7,730,395 |
| Mimecast Ltd.(a) | 171,500 | 7,019,495 |
| Paylocity Holding Corp.(a) | 97,700 | 10,670,794 |
| RingCentral, Inc., Class A(a) | 43,700 | 6,167,381 |
| SailPoint Technologies Holding, Inc.(a) | 316,000 | 7,119,480 |
| Smartsheet, Inc., Class A(a) | 290,700 | 14,128,020 |
| Trade Desk, Inc. (The), Class A(a) | 26,000 | 6,390,020 |
| Total | | 131,072,259 |
| Total Information Technology | 156,895,848 |
| Materials 2.2% |
| Chemicals 2.2% |
| Balchem Corp. | 120,400 | 10,690,316 |
| Livent Corp.(a) | 710,500 | 4,369,575 |
| Total | | 15,059,891 |
| Total Materials | 15,059,891 |
| Real Estate 3.0% |
| Equity Real Estate Investment Trusts (REITS) 3.0% |
| Coresite Realty Corp. | 108,900 | 12,652,002 |
| STORE Capital Corp. | 205,604 | 7,763,607 |
| Total | | 20,415,609 |
| Total Real Estate | 20,415,609 |
Total Common Stocks
(Cost $568,505,278) | 658,137,426 |
|
The accompanying Notes to Financial Statements are an integral part of this statement.
Columbia Small Cap Growth Fund I | Annual Report 2019
| 9 |
Portfolio of Investments (continued)
August 31, 2019
| Limited Partnerships 0.7% |
| Issuer | Shares | Value ($) |
| Energy 0.7% |
| Oil, Gas & Consumable Fuels 0.7% |
| Viper Energy Partners LP | 160,100 | 4,638,097 |
| Total Energy | 4,638,097 |
Total Limited Partnerships
(Cost $5,273,740) | 4,638,097 |
|
| Money Market Funds 1.0% |
| | Shares | Value ($) |
| Columbia Short-Term Cash Fund, 2.208%(b),(c) | 6,715,537 | 6,714,865 |
Total Money Market Funds
(Cost $6,714,865) | 6,714,865 |
Total Investments in Securities
(Cost: $580,493,883) | 669,490,388 |
| Other Assets & Liabilities, Net | | 3,239,765 |
| Net Assets | 672,730,153 |
Notes to Portfolio of Investments
| (a) | Non-income producing investment. |
| (b) | The rate shown is the seven-day current annualized yield at August 31, 2019. |
| (c) | As defined in the Investment Company Act of 1940, an affiliated company is one in which the Fund owns 5% or more of the company’s outstanding voting securities, or a company which is under common ownership or control with the Fund. Holdings and transactions in these affiliated companies during the year ended August 31, 2019 are as follows: |
| Issuer | Beginning
shares | Shares
purchased | Shares
sold | Ending
shares | Realized gain
(loss) —
affiliated
issuers ($) | Net change in
unrealized
appreciation
(depreciation) —
affiliated
issuers ($) | Dividends —
affiliated
issuers ($) | Value —
affiliated
issuers
at end of
period ($) |
| Columbia Short-Term Cash Fund, 2.208% |
| | 3,659,207 | 359,584,321 | (356,527,991) | 6,715,537 | 1,509 | — | 521,789 | 6,714,865 |
Fair value measurements
The Fund categorizes its fair value measurements according to a three-level hierarchy that maximizes the use of observable inputs and minimizes the use of unobservable inputs by prioritizing that the most observable input be used when available. Observable inputs are those that market participants would use in pricing an investment based on market data obtained from sources independent of the reporting entity. Unobservable inputs are those that reflect the Fund’s assumptions about the information market participants would use in pricing an investment. An investment’s level within the fair value hierarchy is based on the lowest level of any input that is deemed significant to the asset’s or liability’s fair value measurement. The input levels are not necessarily an indication of the risk or liquidity associated with investments at that level. For example, certain U.S. government securities are generally high quality and liquid, however, they are reflected as Level 2 because the inputs used to determine fair value may not always be quoted prices in an active market.
Fair value inputs are summarized in the three broad levels listed below:
| ■ | Level 1 — Valuations based on quoted prices for investments in active markets that the Fund has the ability to access at the measurement date. Valuation adjustments are not applied to Level 1 investments. |
| ■ | Level 2 — Valuations based on other significant observable inputs (including quoted prices for similar securities, interest rates, prepayment speeds, credit risks, etc.). |
| ■ | Level 3 — Valuations based on significant unobservable inputs (including the Fund’s own assumptions and judgment in determining the fair value of investments). |
Inputs that are used in determining fair value of an investment may include price information, credit data, volatility statistics, and other factors. These inputs can be either observable or unobservable. The availability of observable inputs can vary between investments, and is affected by various factors such as the type of investment, and the volume and level of activity for that investment or similar investments in the marketplace. The inputs will be considered by the Investment Manager, along with any other relevant factors in the calculation of an investment’s fair value. The Fund uses prices and inputs that are current as of the measurement date, which may include periods of market dislocations. During these periods, the availability of prices and inputs may be reduced for many investments. This condition could cause an investment to be reclassified between the various levels within the hierarchy.
The accompanying Notes to Financial Statements are an integral part of this statement.
| 10 | Columbia Small Cap Growth Fund I | Annual Report 2019 |
Portfolio of Investments (continued)
August 31, 2019
Fair value measurements (continued)
Investments falling into the Level 3 category are primarily supported by quoted prices from brokers and dealers participating in the market for those investments. However, these may be classified as Level 3 investments due to lack of market transparency and corroboration to support these quoted prices. Additionally, valuation models may be used as the pricing source for any remaining investments classified as Level 3. These models may rely on one or more significant unobservable inputs and/or significant assumptions by the Investment Manager. Inputs used in valuations may include, but are not limited to, financial statement analysis, capital account balances, discount rates and estimated cash flows, and comparable company data.
Under the direction of the Fund’s Board of Trustees (the Board), the Investment Manager’s Valuation Committee (the Committee) is responsible for overseeing the valuation procedures approved by the Board. The Committee consists of voting and non-voting members from various groups within the Investment Manager’s organization, including operations and accounting, trading and investments, compliance, risk management and legal.
The Committee meets at least monthly to review and approve valuation matters, which may include a description of specific valuation determinations, data regarding pricing information received from approved pricing vendors and brokers and the results of Board-approved valuation control policies and procedures (the Policies). The Policies address, among other things, instances when market quotations are or are not readily available, including recommendations of third party pricing vendors and a determination of appropriate pricing methodologies; events that require specific valuation determinations and assessment of fair value techniques; securities with a potential for stale pricing, including those that are illiquid, restricted, or in default; and the effectiveness of third party pricing vendors, including periodic reviews of vendors. The Committee meets more frequently, as needed, to discuss additional valuation matters, which may include the need to review back-testing results, review time-sensitive information or approve related valuation actions. The Committee reports to the Board, with members of the Committee meeting with the Board at each of its regularly scheduled meetings to discuss valuation matters and actions during the period, similar to those described earlier.
The following table is a summary of the inputs used to value the Fund’s investments at August 31, 2019:
| | Level 1 ($) | Level 2 ($) | Level 3 ($) | Total ($) |
| Investments in Securities | | | | |
| Common Stocks | | | | |
| Communication Services | 21,549,860 | — | — | 21,549,860 |
| Consumer Discretionary | 84,555,524 | — | — | 84,555,524 |
| Consumer Staples | 12,622,134 | — | — | 12,622,134 |
| Energy | 2,089,305 | — | — | 2,089,305 |
| Financials | 18,293,268 | — | — | 18,293,268 |
| Health Care | 231,734,431 | — | — | 231,734,431 |
| Industrials | 94,921,556 | — | — | 94,921,556 |
| Information Technology | 156,895,848 | — | — | 156,895,848 |
| Materials | 15,059,891 | — | — | 15,059,891 |
| Real Estate | 20,415,609 | — | — | 20,415,609 |
| Total Common Stocks | 658,137,426 | — | — | 658,137,426 |
| Limited Partnerships | | | | |
| Energy | 4,638,097 | — | — | 4,638,097 |
| Total Limited Partnerships | 4,638,097 | — | — | 4,638,097 |
| Money Market Funds | 6,714,865 | — | — | 6,714,865 |
| Total Investments in Securities | 669,490,388 | — | — | 669,490,388 |
See the Portfolio of Investments for all investment classifications not indicated in the table.
The accompanying Notes to Financial Statements are an integral part of this statement.
Columbia Small Cap Growth Fund I | Annual Report 2019
| 11 |
Statement of Assets and Liabilities
August 31, 2019
| Assets | |
| Investments in securities, at value | |
| Unaffiliated issuers (cost $573,779,018) | $662,775,523 |
| Affiliated issuers (cost $6,714,865) | 6,714,865 |
| Receivable for: | |
| Investments sold | 44,020 |
| Capital shares sold | 3,550,592 |
| Dividends | 231,772 |
| Prepaid expenses | 3,924 |
| Trustees’ deferred compensation plan | 127,137 |
| Total assets | 673,447,833 |
| Liabilities | |
| Payable for: | |
| Capital shares purchased | 425,863 |
| Management services fees | 15,803 |
| Distribution and/or service fees | 2,090 |
| Transfer agent fees | 84,005 |
| Compensation of board members | 17,388 |
| Compensation of chief compliance officer | 38 |
| Other expenses | 45,356 |
| Trustees’ deferred compensation plan | 127,137 |
| Total liabilities | 717,680 |
| Net assets applicable to outstanding capital stock | $672,730,153 |
| Represented by | |
| Paid in capital | 522,582,184 |
| Total distributable earnings (loss) (Note 2) | 150,147,969 |
| Total - representing net assets applicable to outstanding capital stock | $672,730,153 |
The accompanying Notes to Financial Statements are an integral part of this statement.
| 12 | Columbia Small Cap Growth Fund I | Annual Report 2019 |
Statement of Assets and Liabilities (continued)
August 31, 2019
| Class A | |
| Net assets | $265,472,544 |
| Shares outstanding | 13,459,873 |
| Net asset value per share | $19.72 |
| Maximum sales charge | 5.75% |
| Maximum offering price per share (calculated by dividing the net asset value per share by 1.0 minus the maximum sales charge for Class A shares) | $20.92 |
| Advisor Class | |
| Net assets | $20,203,345 |
| Shares outstanding | 898,545 |
| Net asset value per share | $22.48 |
| Class C | |
| Net assets | $8,886,916 |
| Shares outstanding | 579,150 |
| Net asset value per share | $15.34 |
| Institutional Class | |
| Net assets | $283,780,831 |
| Shares outstanding | 13,387,507 |
| Net asset value per share | $21.20 |
| Institutional 2 Class | |
| Net assets | $26,190,262 |
| Shares outstanding | 1,219,706 |
| Net asset value per share | $21.47 |
| Institutional 3 Class | |
| Net assets | $66,684,998 |
| Shares outstanding | 3,066,329 |
| Net asset value per share | $21.75 |
| Class R | |
| Net assets | $1,511,257 |
| Shares outstanding | 78,639 |
| Net asset value per share | $19.22 |
The accompanying Notes to Financial Statements are an integral part of this statement.
Columbia Small Cap Growth Fund I | Annual Report 2019
| 13 |
Statement of Operations
Year Ended August 31, 2019
| Net investment income | |
| Income: | |
| Dividends — unaffiliated issuers | $2,495,846 |
| Dividends — affiliated issuers | 521,789 |
| Interfund lending | 138 |
| Total income | 3,017,773 |
| Expenses: | |
| Management services fees | 4,852,998 |
| Distribution and/or service fees | |
| Class A | 592,770 |
| Class C | 77,499 |
| Class R | 7,128 |
| Transfer agent fees | |
| Class A | 387,816 |
| Advisor Class | 18,838 |
| Class C | 12,684 |
| Institutional Class | 359,786 |
| Institutional 2 Class | 13,506 |
| Institutional 3 Class | 4,651 |
| Class R | 2,339 |
| Compensation of board members | 21,944 |
| Custodian fees | 14,232 |
| Printing and postage fees | 49,078 |
| Registration fees | 113,609 |
| Audit fees | 33,013 |
| Legal fees | 11,348 |
| Interest on interfund lending | 663 |
| Compensation of chief compliance officer | 219 |
| Other | 26,341 |
| Total expenses | 6,600,462 |
| Fees waived or expenses reimbursed by Investment Manager and its affiliates | (1,078) |
| Total net expenses | 6,599,384 |
| Net investment loss | (3,581,611) |
| Realized and unrealized gain (loss) — net | |
| Net realized gain (loss) on: | |
| Investments — unaffiliated issuers | 86,651,647 |
| Investments — affiliated issuers | 1,509 |
| Foreign currency translations | 1,320 |
| Net realized gain | 86,654,476 |
| Net change in unrealized appreciation (depreciation) on: | |
| Investments — unaffiliated issuers | (38,072,232) |
| Foreign currency translations | (27) |
| Net change in unrealized appreciation (depreciation) | (38,072,259) |
| Net realized and unrealized gain | 48,582,217 |
| Net increase in net assets resulting from operations | $45,000,606 |
The accompanying Notes to Financial Statements are an integral part of this statement.
| 14 | Columbia Small Cap Growth Fund I | Annual Report 2019 |
Statement of Changes in Net Assets
| | Year Ended
August 31, 2019 | Year Ended
August 31, 2018 |
| Operations | | |
| Net investment loss | $(3,581,611) | $(3,208,002) |
| Net realized gain | 86,654,476 | 80,013,273 |
| Net change in unrealized appreciation (depreciation) | (38,072,259) | 68,934,559 |
| Net increase in net assets resulting from operations | 45,000,606 | 145,739,830 |
| Distributions to shareholders | | |
| Net investment income and net realized gains | | |
| Class A | (36,731,171) | |
| Advisor Class | (1,694,946) | |
| Class C | (1,393,865) | |
| Institutional Class | (30,338,730) | |
| Institutional 2 Class | (2,996,770) | |
| Institutional 3 Class | (9,102,033) | |
| Class R | (247,105) | |
| Net realized gains | | |
| Class A | | (30,755,838) |
| Advisor Class | | (658,517) |
| Class C | | (2,144,127) |
| Institutional Class | | (24,892,211) |
| Institutional 2 Class | | (2,219,843) |
| Institutional 3 Class | | (8,099,292) |
| Class K | | (7,567) |
| Class R | | (214,788) |
| Total distributions to shareholders (Note 2) | (82,504,620) | (68,992,183) |
| Increase in net assets from capital stock activity | 130,755,178 | 68,865,412 |
| Total increase in net assets | 93,251,164 | 145,613,059 |
| Net assets at beginning of year | 579,478,989 | 433,865,930 |
| Net assets at end of year | $672,730,153 | $579,478,989 |
| Excess of distributions over net investment income | $(145,320) | $(699,076) |
The accompanying Notes to Financial Statements are an integral part of this statement.
Columbia Small Cap Growth Fund I | Annual Report 2019
| 15 |
Statement of Changes in Net Assets (continued)
| | Year Ended | Year Ended |
| | August 31, 2019 | August 31, 2018 |
| | Shares | Dollars ($) | Shares | Dollars ($) |
| Capital stock activity |
| Class A | | | | |
| Subscriptions | 2,031,906 | 36,814,367 | 1,797,326 | 35,428,984 |
| Distributions reinvested | 1,982,814 | 31,943,124 | 1,506,195 | 26,328,292 |
| Redemptions | (1,856,347) | (34,113,050) | (1,713,663) | (33,470,462) |
| Net increase | 2,158,373 | 34,644,441 | 1,589,858 | 28,286,814 |
| Advisor Class | | | | |
| Subscriptions | 765,805 | 16,468,112 | 337,404 | 7,486,300 |
| Distributions reinvested | 92,455 | 1,694,701 | 33,793 | 658,285 |
| Redemptions | (321,820) | (6,401,435) | (90,216) | (1,903,391) |
| Net increase | 536,440 | 11,761,378 | 280,981 | 6,241,194 |
| Class C | | | | |
| Subscriptions | 367,095 | 5,136,467 | 220,813 | 3,492,513 |
| Distributions reinvested | 106,019 | 1,335,841 | 145,159 | 2,075,777 |
| Redemptions | (362,548) | (5,101,535) | (648,507) | (10,712,615) |
| Net increase (decrease) | 110,566 | 1,370,773 | (282,535) | (5,144,325) |
| Institutional Class | | | | |
| Subscriptions | 4,799,308 | 95,316,410 | 2,370,671 | 49,045,174 |
| Distributions reinvested | 1,626,644 | 28,108,415 | 1,236,081 | 22,916,948 |
| Redemptions | (2,693,174) | (53,588,623) | (1,727,964) | (35,613,868) |
| Net increase | 3,732,778 | 69,836,202 | 1,878,788 | 36,348,254 |
| Institutional 2 Class | | | | |
| Subscriptions | 755,042 | 15,675,077 | 368,410 | 7,872,631 |
| Distributions reinvested | 171,328 | 2,996,518 | 118,506 | 2,219,604 |
| Redemptions | (594,595) | (12,184,911) | (347,447) | (7,431,467) |
| Net increase | 331,775 | 6,486,684 | 139,469 | 2,660,768 |
| Institutional 3 Class | | | | |
| Subscriptions | 542,455 | 11,380,908 | 342,976 | 7,370,900 |
| Distributions reinvested | 513,934 | 9,101,773 | 428,068 | 8,099,045 |
| Redemptions | (673,127) | (13,849,671) | (702,720) | (15,017,161) |
| Net increase | 383,262 | 6,633,010 | 68,324 | 452,784 |
| Class K | | | | |
| Distributions reinvested | — | — | 399 | 7,344 |
| Redemptions | — | — | (2,800) | (57,962) |
| Net decrease | — | — | (2,401) | (50,618) |
| Class R | | | | |
| Subscriptions | 26,392 | 481,566 | 26,914 | 518,546 |
| Distributions reinvested | 14,470 | 227,460 | 11,736 | 201,152 |
| Redemptions | (38,773) | (686,336) | (34,714) | (649,157) |
| Net increase | 2,089 | 22,690 | 3,936 | 70,541 |
| Total net increase | 7,255,283 | 130,755,178 | 3,676,420 | 68,865,412 |
The accompanying Notes to Financial Statements are an integral part of this statement.
| 16 | Columbia Small Cap Growth Fund I | Annual Report 2019 |
[THIS PAGE INTENTIONALLY LEFT BLANK]
Columbia Small Cap Growth Fund I | Annual Report 2019
| 17 |
The following table is intended to help you understand the Fund’s financial performance. Certain information reflects financial results for a single share of a class held for the periods shown. Per share net investment income (loss) amounts are calculated based on average shares outstanding during the period. Total return assumes reinvestment of all dividends and distributions, if any. Total return does not reflect payment of sales charges, if any. Total return and portfolio turnover are not annualized for periods of less than one year. The portfolio turnover rate is calculated without regard to purchase and sales transactions of short-term instruments and certain derivatives, if any. If such transactions were included, the Fund’s portfolio turnover rate may be higher.
| | Net asset value,
beginning of
period | Net
investment
income
(loss) | Net
realized
and
unrealized
gain | Total from
investment
operations | Distributions
from net
realized
gains | Total
distributions to
shareholders |
| Class A |
| Year Ended 8/31/2019 | $22.05 | (0.15) | 1.12 | 0.97 | (3.30) | (3.30) |
| Year Ended 8/31/2018 | $19.46 | (0.15) | 5.87 | 5.72 | (3.13) | (3.13) |
| Year Ended 8/31/2017 | $17.29 | (0.13) | 3.78 | 3.65 | (1.48) | (1.48) |
| Year Ended 8/31/2016 | $27.22 | (0.11)(g) | 0.40 | 0.29 | (10.22) | (10.22) |
| Year Ended 8/31/2015 | $29.40 | (0.27) | 3.09 | 2.82 | (5.11) | (5.11) |
| Advisor Class |
| Year Ended 8/31/2019 | $24.61 | (0.11) | 1.33 | 1.22 | (3.35) | (3.35) |
| Year Ended 8/31/2018 | $21.38 | (0.12) | 6.53 | 6.41 | (3.18) | (3.18) |
| Year Ended 8/31/2017 | $18.86 | (0.09) | 4.13 | 4.04 | (1.52) | (1.52) |
| Year Ended 8/31/2016 | $28.69 | (0.03)(g) | 0.42 | 0.39 | (10.22) | (10.22) |
| Year Ended 8/31/2015 | $30.64 | (0.20) | 3.24 | 3.04 | (5.11) | (5.11) |
| Class C |
| Year Ended 8/31/2019 | $17.93 | (0.22) | 0.78 | 0.56 | (3.15) | (3.15) |
| Year Ended 8/31/2018 | $16.35 | (0.25) | 4.82 | 4.57 | (2.99) | (2.99) |
| Year Ended 8/31/2017 | $14.74 | (0.23) | 3.20 | 2.97 | (1.36) | (1.36) |
| Year Ended 8/31/2016 | $24.87 | (0.21)(g) | 0.30 | 0.09 | (10.22) | (10.22) |
| Year Ended 8/31/2015 | $27.47 | (0.44) | 2.85 | 2.41 | (5.11) | (5.11) |
| Institutional Class |
| Year Ended 8/31/2019 | $23.42 | (0.11) | 1.24 | 1.13 | (3.35) | (3.35) |
| Year Ended 8/31/2018 | $20.49 | (0.11) | 6.22 | 6.11 | (3.18) | (3.18) |
| Year Ended 8/31/2017 | $18.13 | (0.09) | 3.97 | 3.88 | (1.52) | (1.52) |
| Year Ended 8/31/2016 | $27.98 | (0.07)(g) | 0.44 | 0.37 | (10.22) | (10.22) |
| Year Ended 8/31/2015 | $30.01 | (0.20) | 3.16 | 2.96 | (5.11) | (5.11) |
| Institutional 2 Class |
| Year Ended 8/31/2019 | $23.68 | (0.09) | 1.26 | 1.17 | (3.38) | (3.38) |
| Year Ended 8/31/2018 | $20.68 | (0.09) | 6.29 | 6.20 | (3.20) | (3.20) |
| Year Ended 8/31/2017 | $18.28 | (0.07) | 4.01 | 3.94 | (1.54) | (1.54) |
| Year Ended 8/31/2016 | $28.11 | (0.04)(g) | 0.43 | 0.39 | (10.22) | (10.22) |
| Year Ended 8/31/2015 | $30.09 | (0.16) | 3.17 | 3.01 | (5.11) | (5.11) |
The accompanying Notes to Financial Statements are an integral part of this statement.
| 18 | Columbia Small Cap Growth Fund I | Annual Report 2019 |
Financial Highlights (continued)
| | Proceeds from
regulatory
settlements | Net
asset
value,
end of
period | Total
return | Total gross
expense
ratio to
average
net assets(a) | Total net
expense
ratio to
average
net assets(a),(b) | Net investment
income (loss)
ratio to
average
net assets | Portfolio
turnover | Net
assets,
end of
period
(000’s) |
| Class A |
| Year Ended 8/31/2019 | — | $19.72 | 7.76% | 1.33%(c) | 1.33%(c) | (0.79%) | 113% | $265,473 |
| Year Ended 8/31/2018 | — | $22.05 | 33.62% | 1.35%(d) | 1.34%(d),(e) | (0.79%) | 156% | $249,156 |
| Year Ended 8/31/2017 | — | $19.46 | 22.42% | 1.39%(f) | 1.34%(e),(f) | (0.74%) | 174% | $189,019 |
| Year Ended 8/31/2016 | — | $17.29 | 2.88% | 1.41%(d) | 1.36%(d),(e) | (0.62%) | 142% | $174,183 |
| Year Ended 8/31/2015 | 0.11 | $27.22 | 11.87%(h) | 1.36% | 1.36%(e) | (0.98%) | 117% | $202,566 |
| Advisor Class |
| Year Ended 8/31/2019 | — | $22.48 | 8.05% | 1.07%(c) | 1.07%(c) | (0.54%) | 113% | $20,203 |
| Year Ended 8/31/2018 | — | $24.61 | 33.91% | 1.10%(d) | 1.09%(d),(e) | (0.53%) | 156% | $8,913 |
| Year Ended 8/31/2017 | — | $21.38 | 22.68% | 1.12%(f) | 1.09%(e),(f) | (0.46%) | 174% | $1,734 |
| Year Ended 8/31/2016 | — | $18.86 | 3.15% | 1.16%(d) | 1.10%(d),(e) | (0.16%) | 142% | $1,283 |
| Year Ended 8/31/2015 | 0.12 | $28.69 | 12.18%(h) | 1.10% | 1.10%(e) | (0.68%) | 117% | $69 |
| Class C |
| Year Ended 8/31/2019 | — | $15.34 | 6.93% | 2.08%(c) | 2.08%(c) | (1.54%) | 113% | $8,887 |
| Year Ended 8/31/2018 | — | $17.93 | 32.58% | 2.10%(d) | 2.09%(d),(e) | (1.54%) | 156% | $8,401 |
| Year Ended 8/31/2017 | — | $16.35 | 21.48% | 2.14%(f) | 2.09%(e),(f) | (1.49%) | 174% | $12,281 |
| Year Ended 8/31/2016 | — | $14.74 | 2.12% | 2.16%(d) | 2.12%(d),(e) | (1.37%) | 142% | $13,187 |
| Year Ended 8/31/2015 | 0.10 | $24.87 | 11.07%(h) | 2.11% | 2.11%(e) | (1.72%) | 117% | $16,810 |
| Institutional Class |
| Year Ended 8/31/2019 | — | $21.20 | 8.08% | 1.08%(c) | 1.08%(c) | (0.54%) | 113% | $283,781 |
| Year Ended 8/31/2018 | — | $23.42 | 33.91% | 1.10%(d) | 1.09%(d),(e) | (0.54%) | 156% | $226,120 |
| Year Ended 8/31/2017 | — | $20.49 | 22.72% | 1.14%(f) | 1.09%(e),(f) | (0.49%) | 174% | $159,344 |
| Year Ended 8/31/2016 | — | $18.13 | 3.15% | 1.15%(d) | 1.12%(d),(e) | (0.38%) | 142% | $157,826 |
| Year Ended 8/31/2015 | 0.12 | $27.98 | 12.16%(h) | 1.11% | 1.11%(e) | (0.69%) | 117% | $215,938 |
| Institutional 2 Class |
| Year Ended 8/31/2019 | — | $21.47 | 8.16% | 0.97%(c) | 0.97%(c) | (0.45%) | 113% | $26,190 |
| Year Ended 8/31/2018 | — | $23.68 | 34.07% | 0.99%(d) | 0.98%(d) | (0.43%) | 156% | $21,024 |
| Year Ended 8/31/2017 | — | $20.68 | 22.87% | 1.00%(f) | 0.99%(f) | (0.39%) | 174% | $15,478 |
| Year Ended 8/31/2016 | — | $18.28 | 3.24% | 0.99%(d) | 0.99%(d) | (0.23%) | 142% | $11,704 |
| Year Ended 8/31/2015 | 0.12 | $28.11 | 12.33%(h) | 0.96% | 0.96% | (0.58%) | 117% | $11,990 |
The accompanying Notes to Financial Statements are an integral part of this statement.
Columbia Small Cap Growth Fund I | Annual Report 2019
| 19 |
Financial Highlights (continued)
| | Net asset value,
beginning of
period | Net
investment
income
(loss) | Net
realized
and
unrealized
gain | Total from
investment
operations | Distributions
from net
realized
gains | Total
distributions to
shareholders |
| Institutional 3 Class |
| Year Ended 8/31/2019 | $23.93 | (0.08) | 1.29 | 1.21 | (3.39) | (3.39) |
| Year Ended 8/31/2018 | $20.87 | (0.08) | 6.35 | 6.27 | (3.21) | (3.21) |
| Year Ended 8/31/2017 | $18.43 | (0.07) | 4.06 | 3.99 | (1.55) | (1.55) |
| Year Ended 8/31/2016 | $28.24 | (0.03)(g) | 0.44 | 0.41 | (10.22) | (10.22) |
| Year Ended 8/31/2015 | $30.19 | (0.14) | 3.18 | 3.04 | (5.11) | (5.11) |
| Class R |
| Year Ended 8/31/2019 | $21.57 | (0.19) | 1.09 | 0.90 | (3.25) | (3.25) |
| Year Ended 8/31/2018 | $19.10 | (0.20) | 5.75 | 5.55 | (3.08) | (3.08) |
| Year Ended 8/31/2017 | $17.00 | (0.17) | 3.71 | 3.54 | (1.44) | (1.44) |
| Year Ended 8/31/2016 | $26.99 | (0.16)(g) | 0.39 | 0.23 | (10.22) | (10.22) |
| Year Ended 8/31/2015 | $29.25 | (0.33) | 3.07 | 2.74 | (5.11) | (5.11) |
| Notes to Financial Highlights |
| (a) | In addition to the fees and expenses that the Fund bears directly, the Fund indirectly bears a pro rata share of the fees and expenses of any other funds in which it invests. Such indirect expenses are not included in the Fund’s reported expense ratios. |
| (b) | Total net expenses include the impact of certain fee waivers/expense reimbursements made by the Investment Manager and certain of its affiliates, if applicable. |
| (c) | Ratios include interfund lending expense which is less than 0.01%. |
| (d) | Ratios include line of credit interest expense which is less than 0.01%. |
| (e) | The benefits derived from expense reductions had an impact of less than 0.01%. |
| (f) | Expenses have been reduced due to a reimbursement of expenses overbilled by a third party. If the reimbursement had been excluded, the expense ratios would have been higher by the percentages shown for each class in the table below. All fee waivers and expense reimbursements by the Investment Manager and its affiliates were applied before giving effect to this third party reimbursement. |
| Year Ended | Class A | Advisor
Class | Class C | Institutional
Class | Institutional 2
Class | Class R |
| 08/31/2017 | 0.01% | 0.01% | 0.01% | 0.01% | 0.01% | 0.01% |
| (g) | Net investment income per share includes special dividends. The per share effect of these dividends amounted to: |
| Year Ended | Class A | Advisor
Class | Class C | Institutional
Class | Institutional 2
Class | Institutional 3
Class | Class R |
| 08/31/2016 | $0.04 | $0.07 | $0.03 | $0.04 | $0.05 | $0.05 | $0.04 |
| (h) | The Fund received proceeds from regulatory settlements. Had the Fund not received these proceeds, the total return would have been lower by 0.39%. |
The accompanying Notes to Financial Statements are an integral part of this statement.
| 20 | Columbia Small Cap Growth Fund I | Annual Report 2019 |
Financial Highlights (continued)
| | Proceeds from
regulatory
settlements | Net
asset
value,
end of
period | Total
return | Total gross
expense
ratio to
average
net assets(a) | Total net
expense
ratio to
average
net assets(a),(b) | Net investment
income (loss)
ratio to
average
net assets | Portfolio
turnover | Net
assets,
end of
period
(000’s) |
| Institutional 3 Class |
| Year Ended 8/31/2019 | — | $21.75 | 8.26% | 0.92%(c) | 0.92%(c) | (0.38%) | 113% | $66,685 |
| Year Ended 8/31/2018 | — | $23.93 | 34.12% | 0.94%(d) | 0.93%(d) | (0.38%) | 156% | $64,214 |
| Year Ended 8/31/2017 | — | $20.87 | 22.96% | 0.96% | 0.94% | (0.38%) | 174% | $54,574 |
| Year Ended 8/31/2016 | — | $18.43 | 3.30% | 0.94%(d) | 0.94%(d) | (0.14%) | 142% | $6,562 |
| Year Ended 8/31/2015 | 0.12 | $28.24 | 12.38%(h) | 0.90% | 0.90% | (0.50%) | 117% | $3,823 |
| Class R |
| Year Ended 8/31/2019 | — | $19.22 | 7.53% | 1.58%(c) | 1.58%(c) | (1.03%) | 113% | $1,511 |
| Year Ended 8/31/2018 | — | $21.57 | 33.26% | 1.60%(d) | 1.59%(d),(e) | (1.04%) | 156% | $1,651 |
| Year Ended 8/31/2017 | — | $19.10 | 22.10% | 1.64%(f) | 1.59%(e),(f) | (0.99%) | 174% | $1,387 |
| Year Ended 8/31/2016 | — | $17.00 | 2.61% | 1.66%(d) | 1.62%(d),(e) | (0.88%) | 142% | $1,356 |
| Year Ended 8/31/2015 | 0.11 | $26.99 | 11.63%(h) | 1.61% | 1.61%(e) | (1.22%) | 117% | $1,706 |
The accompanying Notes to Financial Statements are an integral part of this statement.
Columbia Small Cap Growth Fund I | Annual Report 2019
| 21 |
Notes to Financial Statements
August 31, 2019
Note 1. Organization
Columbia Small Cap Growth Fund I (the Fund), a series of Columbia Funds Series Trust I (the Trust), is a diversified fund. The Trust is registered under the Investment Company Act of 1940, as amended (the 1940 Act), as an open-end management investment company organized as a Massachusetts business trust.
Fund shares
The Trust may issue an unlimited number of shares (without par value). The Fund offers each of the share classes listed in the Statement of Assets and Liabilities. Although all share classes generally have identical voting, dividend and liquidation rights, each share class votes separately when required by the Trust’s organizational documents or by law. Each share class has its own expense and sales charge structure. Different share classes may have different minimum initial investment amounts and pay different distribution amounts to the extent the expenses of distributing such share classes vary. Distributions to shareholders in a liquidation will be proportional to the net asset value of each share class.
As described in the Fund’s prospectus, Class A and Class C shares are offered to the general public for investment. Advisor Class, Institutional Class, Institutional 2 Class, Institutional 3 Class and Class R shares are available for purchase through authorized investment professionals to omnibus retirement plans or to institutional and to certain other investors as also described in the Fund’s prospectus. Class C shares automatically convert to Class A shares after 10 years.
Note 2. Summary of significant accounting policies
Basis of preparation
The Fund is an investment company that applies the accounting and reporting guidance in the Financial Accounting Standards Board (FASB) Accounting Standards Codification Topic 946,Financial Services - Investment Companies (ASC 946). The financial statements are prepared in accordance with U.S. generally accepted accounting principles (GAAP), which requires management to make certain estimates and assumptions that affect the reported amounts of assets and liabilities, the disclosure of contingent assets and liabilities at the date of the financial statements and the reported amounts of income and expenses during the reporting period. Actual results could differ from those estimates.
The following is a summary of significant accounting policies followed by the Fund in the preparation of its financial statements.
Security valuation
All equity securities are valued at the close of business of the New York Stock Exchange. Equity securities are valued at the official closing price on the principal exchange or market on which they trade. Unlisted securities or listed securities for which there were no sales during the day are valued at the mean of the latest quoted bid and ask prices on such exchanges or markets.
Foreign equity securities are valued based on the closing price on the foreign exchange in which such securities are primarily traded. If any foreign equity security closing prices are not readily available, the securities are valued at the mean of the latest quoted bid and ask prices on such exchanges or markets. Foreign currency exchange rates are determined at the scheduled closing time of the New York Stock Exchange. Many securities markets and exchanges outside the U.S. close prior to the close of the New York Stock Exchange; therefore, the closing prices for securities in such markets or on such exchanges may not fully reflect events that occur after such close but before the close of the New York Stock Exchange. In those situations, foreign securities will be fair valued pursuant to a policy adopted by the Board of Trustees. Under the policy, the Fund may utilize a third party pricing service to determine these fair values. The third-party pricing service takes into account multiple factors, including, but not limited to, movements in the U.S. securities markets, certain depositary receipts, futures contracts and foreign exchange rates that have occurred subsequent to the close of the foreign exchange or market, to determine a good faith estimate that reasonably reflects the current market conditions as of the close of the New York Stock Exchange. The fair value of a security is likely to be different from the quoted or published price, if available.
Investments in open-end investment companies, including money market funds, are valued at their latest net asset value.
| 22 | Columbia Small Cap Growth Fund I | Annual Report 2019 |
Notes to Financial Statements (continued)
August 31, 2019
Investments for which market quotations are not readily available, or that have quotations which management believes are not reflective of market value or reliable, are valued at fair value as determined in good faith under procedures approved by and under the general supervision of the Board of Trustees. If a security or class of securities (such as foreign securities) is valued at fair value, such value is likely to be different from the quoted or published price for the security.
The determination of fair value often requires significant judgment. To determine fair value, management may use assumptions including but not limited to future cash flows and estimated risk premiums. Multiple inputs from various sources may be used to determine fair value.
GAAP requires disclosure regarding the inputs and valuation techniques used to measure fair value and any changes in valuation inputs or techniques. In addition, investments shall be disclosed by major category. This information is disclosed following the Fund’s Portfolio of Investments.
Foreign currency transactions and translations
The values of all assets and liabilities denominated in foreign currencies are generally translated into U.S. dollars at exchange rates determined at the close of regular trading on the New York Stock Exchange. Net realized and unrealized gains (losses) on foreign currency transactions and translations include gains (losses) arising from the fluctuation in exchange rates between trade and settlement dates on securities transactions, gains (losses) arising from the disposition of foreign currency and currency gains (losses) between the accrual and payment dates on dividends, interest income and foreign withholding taxes.
For financial statement purposes, the Fund does not distinguish that portion of gains (losses) on investments which is due to changes in foreign exchange rates from that which is due to changes in market prices of the investments. Such fluctuations are included with the net realized and unrealized gains (losses) on investments in the Statement of Operations.
Security transactions
Security transactions are accounted for on the trade date. Cost is determined and gains (losses) are based upon the specific identification method for both financial statement and federal income tax purposes.
Income recognition
Corporate actions and dividend income are generally recorded net of any non-reclaimable tax withholdings, on the ex-dividend date or upon receipt of ex-dividend notification in the case of certain foreign securities.
The Fund may receive distributions from holdings in equity securities, business development companies (BDCs), exchange-traded funds (ETFs), limited partnerships (LPs), other regulated investment companies (RICs), and real estate investment trusts (REITs), which report information on the tax character of their distributions annually. These distributions are allocated to dividend income, capital gain and return of capital based on actual information reported. Return of capital is recorded as a reduction of the cost basis of securities held. If the Fund no longer owns the applicable securities, return of capital is recorded as a realized gain. With respect to REITs, to the extent actual information has not yet been reported, estimates for return of capital are made by the Fund’s management. Management’s estimates are subsequently adjusted when the actual character of the distributions is disclosed by the REITs, which could result in a proportionate change in return of capital to shareholders.
Awards from class action litigation are recorded as a reduction of cost basis if the Fund still owns the applicable securities on the payment date. If the Fund no longer owns the applicable securities, the proceeds are recorded as realized gains.
Expenses
General expenses of the Trust are allocated to the Fund and other funds of the Trust based upon relative net assets or other expense allocation methodologies determined by the nature of the expense. Expenses directly attributable to the Fund are charged to the Fund. Expenses directly attributable to a specific class of shares are charged to that share class.
Columbia Small Cap Growth Fund I | Annual Report 2019
| 23 |
Notes to Financial Statements (continued)
August 31, 2019
Determination of class net asset value
All income, expenses (other than class-specific expenses, which are charged to that share class, as shown in the Statement of Operations) and realized and unrealized gains (losses) are allocated to each class of the Fund on a daily basis, based on the relative net assets of each class, for purposes of determining the net asset value of each class.
Federal income tax status
The Fund intends to qualify each year as a regulated investment company under Subchapter M of the Internal Revenue Code, as amended, and will distribute substantially all of its investment company taxable income and net capital gain, if any, for its tax year, and as such will not be subject to federal income taxes. In addition, the Fund intends to distribute in each calendar year substantially all of its ordinary income, capital gain net income and certain other amounts, if any, such that the Fund should not be subject to federal excise tax. Therefore, no federal income or excise tax provision is recorded.
Distributions to shareholders
Distributions from net investment income, if any, are declared and paid annually. Net realized capital gains, if any, are distributed at least annually. Income distributions and capital gain distributions are determined in accordance with federal income tax regulations, which may differ from GAAP.
Guarantees and indemnifications
Under the Trust’s organizational documents and, in some cases, by contract, its officers and trustees are indemnified against certain liabilities arising out of the performance of their duties to the Trust or its funds. In addition, certain of the Fund’s contracts with its service providers contain general indemnification clauses. The Fund’s maximum exposure under these arrangements is unknown since the amount of any future claims that may be made against the Fund cannot be determined, and the Fund has no historical basis for predicting the likelihood of any such claims.
Recent accounting pronouncements
Accounting Standards Update 2017-08 Premium Amortization on Purchased Callable Debt Securities
In March 2017, the Financial Accounting Standards Board issued Accounting Standards Update (ASU) No. 2017-08 Premium Amortization on Purchased Callable Debt Securities. ASU No. 2017-08 updates the accounting standards to shorten the amortization period for certain purchased callable debt securities, held at a premium, to be amortized to the earliest call date. The update applies to securities with explicit, noncontingent call features that are callable at fixed prices and on preset dates. The standard is effective for annual periods beginning after December 15, 2018 and interim periods within those fiscal years. Management does not expect the implementation of this guidance to have a material impact on the financial statement amounts and footnote disclosures.
Accounting Standards Update 2018-13 Disclosure Framework - Changes to the Disclosure Requirements for Fair Value Measurement
In August 2018, the Financial Accounting Standards Board issued Accounting Standards Update (ASU) No. 2018-13 Disclosure Framework - Changes to the Disclosure Requirements for Fair Value Measurement. The standard is effective for annual periods beginning after December 15, 2019 and interim periods within those fiscal years, with early adoption permitted. After evaluation, management determined to adopt the ASU effective for the period ended August 31, 2019 and all subsequent periods. As a result of the amendments, management implemented disclosure changes which include removal of the amount and reasons for transfers between Level 1 and Level 2 of the fair value hierarchy, removal of the policy for the timing of transfers between levels, removal of the description of the Level 3 valuation processes, as well as modifications to the measurement uncertainty disclosure.
Disclosure Update and Simplification
In September 2018, the Securities and Exchange Commission (SEC) released Final Rule 33-10532, Disclosure Update and Simplification, which amends certain financial statement disclosure requirements that the SEC determined to be redundant, outdated, or superseded in light of other SEC disclosure requirements, GAAP, or changes in the information environment. As a result of the amendments, management implemented disclosure changes which included removing the components of
| 24 | Columbia Small Cap Growth Fund I | Annual Report 2019 |
Notes to Financial Statements (continued)
August 31, 2019
distributable earnings presented on the Statement of Assets and Liabilities and combining income and gain distributions paid to shareholders as presented on the Statement of Changes in Net Assets. Any values presented to meet prior year requirements were left unchanged. The amendments had no effect on the Fund’s net assets or results of operation.
Note 3. Fees and other transactions with affiliates
Management services fees
The Fund has entered into a Management Agreement with Columbia Management Investment Advisers, LLC (the Investment Manager), a wholly-owned subsidiary of Ameriprise Financial, Inc. (Ameriprise Financial). Under the Management Agreement, the Investment Manager provides the Fund with investment research and advice, as well as administrative and accounting services. The management services fee is an annual fee that is equal to a percentage of the Fund’s daily net assets that declines from 0.87% to 0.75% as the Fund’s net assets increase. The effective management services fee rate for the year ended August 31, 2019 was 0.86% of the Fund’s average daily net assets.
Compensation of board members
Members of the Board of Trustees who are not officers or employees of the Investment Manager or Ameriprise Financial are compensated for their services to the Fund as disclosed in the Statement of Operations. These members of the Board of Trustees may participate in a Deferred Compensation Plan (the Deferred Plan) which may be terminated at any time. Obligations of the Deferred Plan will be paid solely out of the Fund’s assets, and all amounts payable under the Deferred Plan constitute a general unsecured obligation of the Fund.
Compensation of Chief Compliance Officer
The Board of Trustees has appointed a Chief Compliance Officer to the Fund in accordance with federal securities regulations. As disclosed in the Statement of Operations, a portion of the Chief Compliance Officer’s total compensation is allocated to the Fund, along with other allocations to affiliated registered investment companies managed by the Investment Manager and its affiliates, based on relative net assets.
Transfer agency fees
Under a Transfer and Dividend Disbursing Agent Agreement, Columbia Management Investment Services Corp. (the Transfer Agent), an affiliate of the Investment Manager and a wholly-owned subsidiary of Ameriprise Financial, is responsible for providing transfer agency services to the Fund. The Transfer Agent has contracted with DST Asset Manager Solutions, Inc. (DST) to serve as sub-transfer agent. The Transfer Agent pays the fees of DST for services as sub-transfer agent and DST is not entitled to reimbursement for such fees from the Fund (with the exception of out-of-pocket fees).
The Fund pays the Transfer Agent a monthly transfer agency fee based on the number or the average value of accounts, depending on the type of account. In addition, the Fund pays the Transfer Agent a fee for shareholder services based on the number of accounts or on a percentage of the average aggregate value of the Fund’s shares maintained in omnibus accounts up to the lesser of the amount charged by the financial intermediary or a cap established by the Board of Trustees from time to time.
The Transfer Agent also receives compensation from the Fund for various shareholder services and reimbursements for certain out-of-pocket fees. Total transfer agency fees for Institutional 2 Class and Institutional 3 Class shares are subject to an annual limitation of not more than 0.07% and 0.02%, respectively, of the average daily net assets attributable to each share class.
Columbia Small Cap Growth Fund I | Annual Report 2019
| 25 |
Notes to Financial Statements (continued)
August 31, 2019
For the year ended August 31, 2019, the Fund’s effective transfer agency fee rates as a percentage of average daily net assets of each class were as follows:
| | Effective rate (%) |
| Class A | 0.16 |
| Advisor Class | 0.16 |
| Class C | 0.16 |
| Institutional Class | 0.16 |
| Institutional 2 Class | 0.06 |
| Institutional 3 Class | 0.01 |
| Class R | 0.16 |
An annual minimum account balance fee of $20 may apply to certain accounts with a value below the applicable share class’s initial minimum investment requirements to reduce the impact of small accounts on transfer agency fees. These minimum account balance fees are remitted to the Fund and recorded as part of expense reductions in the Statement of Operations. For the year ended August 31, 2019, no minimum account balance fees were charged by the Fund.
Distribution and service fees
The Fund has entered into an agreement with Columbia Management Investment Distributors, Inc. (the Distributor), an affiliate of the Investment Manager and a wholly-owned subsidiary of Ameriprise Financial, for distribution and shareholder services. The Board of Trustees has approved, and the Fund has adopted, distribution and shareholder service plans (the Plans) applicable to certain share classes, which set the distribution and service fees for the Fund. These fees are calculated daily and are intended to compensate the Distributor and/or eligible selling and/or servicing agents for selling shares of the Fund and providing services to investors.
Under the Plans, the Fund pays a monthly service fee to the Distributor at the maximum annual rate of 0.25% of the average daily net assets attributable to Class A and Class C shares of the Fund. Also under the Plans, the Fund pays a monthly distribution fee to the Distributor at the maximum annual rates of 0.10%, 0.75% and 0.50% of the average daily net assets attributable to Class A, Class C and Class R shares of the Fund, respectively.
Although the Fund may pay distribution and service fees up to a maximum annual rate of 0.35% of the Fund’s average daily net assets attributable to Class A shares (comprised of up to 0.10% for distribution services and up to 0.25% for shareholder liaison services), the Fund currently limits such fees to an aggregate fee of not more than 0.25% of the Fund’s average daily net assets attributable to Class A shares.
Sales charges (unaudited)
Sales charges, including front-end charges and contingent deferred sales charges (CDSC), received by the Distributor for distributing Fund shares for the year ended August 31, 2019, if any, are listed below:
| | Front End (%) | CDSC (%) | Amount ($) |
| Class A | 5.75 | 0.50 - 1.00(a) | 267,554 |
| Class C | — | 1.00(b) | 1,230 |
| (a) | This charge is imposed on certain investments of between $1 million and $50 million redeemed within 18 months after purchase, as follows: 1.00% if redeemed within 12 months after purchase, and 0.50% if redeemed more than 12, but less than 18, months after purchase, with certain limited exceptions. |
| (b) | This charge applies to redemptions within 12 months after purchase, with certain limited exceptions. |
The Fund’s other share classes are not subject to sales charges.
| 26 | Columbia Small Cap Growth Fund I | Annual Report 2019 |
Notes to Financial Statements (continued)
August 31, 2019
Expenses waived/reimbursed by the Investment Manager and its affiliates
The Investment Manager and certain of its affiliates have contractually agreed to waive fees and/or reimburse expenses (excluding certain fees and expenses described below) for the period(s) disclosed below, unless sooner terminated at the sole discretion of the Board of Trustees, so that the Fund’s net operating expenses, after giving effect to fees waived/expenses reimbursed and any balance credits and/or overdraft charges from the Fund’s custodian, do not exceed the following annual rate(s) as a percentage of the class’ average daily net assets:
| | January 1, 2019
through
December 31, 2019 | Prior to
January 1, 2019 |
| Class A | 1.35% | 1.35% |
| Advisor Class | 1.10 | 1.10 |
| Class C | 2.10 | 2.10 |
| Institutional Class | 1.10 | 1.10 |
| Institutional 2 Class | 1.00 | 0.98 |
| Institutional 3 Class | 0.95 | 0.93 |
| Class R | 1.60 | 1.60 |
Under the agreement governing these fee waivers and/or expense reimbursement arrangements, the following fees and expenses are excluded from the waiver/reimbursement commitment, and therefore will be paid by the Fund, if applicable: taxes (including foreign transaction taxes), expenses associated with investments in affiliated and non-affiliated pooled investment vehicles (including mutual funds and exchange-traded funds), transaction costs and brokerage commissions, costs related to any securities lending program, dividend expenses associated with securities sold short, inverse floater program fees and expenses, transaction charges and interest on borrowed money, interest, infrequent and/or unusual expenses and any other expenses the exclusion of which is specifically approved by the Board of Trustees. This agreement may be modified or amended only with approval from the Investment Manager, certain of its affiliates and the Fund. In addition to the contractual agreement, the Investment Manager and certain of its affiliates have voluntarily agreed to waive fees and/or reimburse Fund expenses (excluding certain fees and expenses described above) so that Fund level expenses (expenses directly attributable to the Fund and not to a specific share class) are waived proportionately across all share classes, but the Fund’s net operating expenses shall not exceed the contractual annual rates listed in the table above. This arrangement may be revised or discontinued at any time. Any fees waived and/or expenses reimbursed under the expense reimbursement arrangements described above are not recoverable by the Investment Manager or its affiliates in future periods.
Note 4. Federal tax information
The timing and character of income and capital gain distributions are determined in accordance with income tax regulations, which may differ from GAAP because of temporary or permanent book to tax differences.
At August 31, 2019, these differences were primarily due to differing treatment for deferral/reversal of wash sale losses, trustees’ deferred compensation, re-characterization of distributions for investments, net operating loss reclassification, investments in partnerships, foreign currency transactions, and passive foreign investment company (PFIC) holdings. To the extent these differences were permanent, reclassifications were made among the components of the Fund’s net assets. Temporary differences do not require reclassifications.
The following reclassifications were made:
Excess of distributions
over net investment
income ($) | Accumulated
net realized
gain ($) | Paid in
capital ($) |
| 4,135,367 | (4,135,367) | — |
Net investment income (loss) and net realized gains (losses), as disclosed in the Statement of Operations, and net assets were not affected by this reclassification.
Columbia Small Cap Growth Fund I | Annual Report 2019
| 27 |
Notes to Financial Statements (continued)
August 31, 2019
The tax character of distributions paid during the years indicated was as follows:
| Year Ended August 31, 2019 | Year Ended August 31, 2018 |
Ordinary
income ($) | Long-term
capital gains ($) | Total ($) | Ordinary
income ($) | Long-term
capital gains ($) | Total ($) |
| 42,023,297 | 40,481,323 | 82,504,620 | 47,718,358 | 21,273,825 | 68,992,183 |
Short-term capital gain distributions, if any, are considered ordinary income distributions for tax purposes.
At August 31, 2019, the components of distributable earnings on a tax basis were as follows:
Undistributed
ordinary income ($) | Undistributed
long-term
capital gains ($) | Capital loss
carryforwards ($) | Net unrealized
appreciation ($) |
| 22,766,705 | 40,185,015 | — | 87,341,569 |
At August 31, 2019, the cost of all investments for federal income tax purposes along with the aggregate gross unrealized appreciation and depreciation based on that cost was:
Federal
tax cost ($) | Gross unrealized
appreciation ($) | Gross unrealized
(depreciation) ($) | Net unrealized
appreciation ($) |
| 582,148,819 | 118,449,982 | (31,108,413) | 87,341,569 |
Tax cost of investments and unrealized appreciation/(depreciation) may also include timing differences that do not constitute adjustments to tax basis.
Management of the Fund has concluded that there are no significant uncertain tax positions in the Fund that would require recognition in the financial statements. However, management’s conclusion may be subject to review and adjustment at a later date based on factors including, but not limited to, new tax laws, regulations, and administrative interpretations (including relevant court decisions). Generally, the Fund’s federal tax returns for the prior three fiscal years remain subject to examination by the Internal Revenue Service.
Note 5. Portfolio information
The cost of purchases and proceeds from sales of securities, excluding short-term investments and derivatives, if any, aggregated to $658,831,384 and $622,940,792, respectively, for the year ended August 31, 2019. The amount of purchase and sale activity impacts the portfolio turnover rate reported in the Financial Highlights.
Note 6. Affiliated money market fund
The Fund invests in Columbia Short-Term Cash Fund, an affiliated money market fund established for the exclusive use by the Fund and other affiliated funds (the Affiliated MMF). The income earned by the Fund from such investments is included as Dividends - affiliated issuers in the Statement of Operations. As an investing fund, the Fund indirectly bears its proportionate share of the expenses of the Affiliated MMF. The Affiliated MMF prices its shares with a floating net asset value. In addition, the Board of Trustees of the Affiliated MMF may impose a fee on redemptions (sometimes referred to as a liquidity fee) or temporarily suspend redemptions (sometimes referred to as imposing a redemption gate) in the event its liquidity falls below regulatory limits.
Note 7. Interfund lending
Pursuant to an exemptive order granted by the Securities and Exchange Commission, the Fund participates in a program (the Interfund Program) allowing each participating Columbia Fund (each, a Participating Fund) to lend money directly to and, except for closed-end funds and money market funds, borrow money directly from other Participating Funds for temporary purposes. The amounts eligible for borrowing and lending under the Interfund Program are subject to certain restrictions.
| 28 | Columbia Small Cap Growth Fund I | Annual Report 2019 |
Notes to Financial Statements (continued)
August 31, 2019
Interfund loans are subject to the risk that the borrowing fund could be unable to repay the loan when due, and a delay in repayment to the lending fund could result in lost opportunities and/or additional lending costs. The exemptive order is subject to conditions intended to mitigate conflicts of interest arising from the Investment Manager’s relationship with each Participating Fund.
The Fund’s activity in the Interfund Program during the year ended August 31, 2019 was as follows:
| Borrower or lender | Average loan
balance ($) | Weighted average
interest rate (%) | Days
outstanding |
| Borrower | 2,800,000 | 2.84 | 3 |
| Lender | 225,000 | 2.74 | 8 |
Interest income earned and interest expense incurred by the Fund is recorded as Interfund lending in the Statement of Operations. The Fund had no outstanding interfund loans at August 31, 2019.
Note 8. Line of credit
The Fund has access to a revolving credit facility with a syndicate of banks led by Citibank, N.A., HSBC Bank USA, N.A. and JPMorgan Chase Bank, N.A. whereby the Fund may borrow for the temporary funding of shareholder redemptions or for other temporary or emergency purposes. The credit facility, which is a collective agreement between the Fund and certain other funds managed by the Investment Manager or an affiliated investment manager, severally and not jointly, permits collective borrowings up to $1 billion. Interest is charged to each participating fund based on its borrowings at a rate equal to the higher of (i) the federal funds effective rate, (ii) the one-month LIBOR rate and (iii) the overnight bank funding rate, plus in each case, 1.00%. Each borrowing under the credit facility matures no later than 60 days after the date of borrowing. The Fund also pays a commitment fee equal to its pro rata share of the unused amount of the credit facility at a rate of 0.15% per annum. The commitment fee is included in other expenses in the Statement of Operations. This agreement expires annually in December unless extended or renewed.
The Fund had no borrowings during the year ended August 31, 2019.
Note 9. Significant risks
Health care sector risk
The Fund may be more susceptible to the particular risks that may affect companies in the health care sector than if it were invested in a wider variety of companies in unrelated sectors. Companies in the health care sector are subject to certain risks, including restrictions on government reimbursement for medical expenses, government approval of medical products and services, competitive pricing pressures, and the rising cost of medical products and services (especially for companies dependent upon a relatively limited number of products or services). Performance of such companies may be affected by factors including, government regulation, obtaining and protecting patents (or the failure to do so), product liability and other similar litigation as well as product obsolescence.
Shareholder concentration risk
At August 31, 2019, affiliated shareholders of record owned 19.2% of the outstanding shares of the Fund in one or more accounts. Subscription and redemption activity by concentrated accounts may have a significant effect on the operations of the Fund. In the case of a large redemption, the Fund may be forced to sell investments at inopportune times, including its liquid positions, which may result in Fund losses and the Fund holding a higher percentage of less liquid positions. Large redemptions could result in decreased economies of scale and increased operating expenses for non-redeeming Fund shareholders.
Technology and technology-related investment risk
The Fund may be more susceptible to the particular risks that may affect companies in the information technology sector, as well as other technology-related sectors (collectively, the technology sectors) than if it were invested in a wider variety of companies in unrelated sectors. Companies in the technology sectors are subject to certain risks, including the risk that new services, equipment or technologies will not be accepted by consumers and businesses or will become rapidly obsolete.
Columbia Small Cap Growth Fund I | Annual Report 2019
| 29 |
Notes to Financial Statements (continued)
August 31, 2019
Performance of such companies may be affected by factors including obtaining and protecting patents (or the failure to do so) and significant competitive pressures, including aggressive pricing of their products or services, new market entrants, competition for market share and short product cycles due to an accelerated rate of technological developments. Such competitive pressures may lead to limited earnings and/or falling profit margins. As a result, the value of their securities may fall or fail to rise. In addition, many technology sector companies have limited operating histories and prices of these companies’ securities historically have been more volatile than other securities, especially over the short term.
Note 10. Subsequent events
Management has evaluated the events and transactions that have occurred through the date the financial statements were issued and noted no items requiring adjustment of the financial statements or additional disclosure.
Note 11. Information regarding pending and settled legal proceedings
Ameriprise Financial and certain of its affiliates have historically been involved in a number of legal, arbitration and regulatory proceedings, including routine litigation, class actions, and governmental actions, concerning matters arising in connection with the conduct of their business activities. Ameriprise Financial believes that the Fund is not currently the subject of, and that neither Ameriprise Financial nor any of its affiliates are the subject of, any pending legal, arbitration or regulatory proceedings that are likely to have a material adverse effect on the Fund or the ability of Ameriprise Financial or its affiliates to perform under their contracts with the Fund. Ameriprise Financial is required to make quarterly (10-Q), annual (10-K) and, as necessary, 8-K filings with the Securities and Exchange Commission (SEC) on legal and regulatory matters that relate to Ameriprise Financial and its affiliates. Copies of these filings may be obtained by accessing the SEC website at www.sec.gov.
There can be no assurance that these matters, or the adverse publicity associated with them, will not result in increased Fund redemptions, reduced sale of Fund shares or other adverse consequences to the Fund. Further, although we believe proceedings are not likely to have a material adverse effect on the Fund or the ability of Ameriprise Financial or its affiliates to perform under their contracts with the Fund, these proceedings are subject to uncertainties and, as such, we are unable to estimate the possible loss or range of loss that may result. An adverse outcome in one or more of these proceedings could result in adverse judgments, settlements, fines, penalties or other relief that could have a material adverse effect on the consolidated financial condition or results of operations of Ameriprise Financial.
| 30 | Columbia Small Cap Growth Fund I | Annual Report 2019 |
Report of Independent Registered Public Accounting Firm
To the Board of Trustees of Columbia Funds Series Trust I and Shareholders of Columbia Small Cap Growth Fund I
Opinion on the Financial Statements
We have audited the accompanying statement of assets and liabilities, including the portfolio of investments, of Columbia Small Cap Growth Fund I (one of the funds constituting Columbia Funds Series Trust I, hereafter referred to as the “Fund”) as of August 31, 2019, the related statement of operations for the year ended August 31, 2019, the statement of changes in net assets for each of the two years in the period ended August 31, 2019, including the related notes, and the financial highlights for each of the five years in the period ended August 31, 2019, (collectively referred to as the “financial statements”). In our opinion, the financial statements present fairly, in all material respects, the financial position of the Fund as of August 31, 2019, the results of its operations for the year then ended, the changes in its net assets for each of the two years in the period ended August 31, 2019 and the financial highlights for each of the five years in the period ended August 31, 2019 in conformity with accounting principles generally accepted in the United States of America.
Basis for Opinion
These financial statements are the responsibility of the Fund’s management. Our responsibility is to express an opinion on the Fund’s financial statements based on our audits. We are a public accounting firm registered with the Public Company Accounting Oversight Board (United States) (PCAOB) and are required to be independent with respect to the Fund in accordance with the U.S. federal securities laws and the applicable rules and regulations of the Securities and Exchange Commission and the PCAOB.
We conducted our audits of these financial statements in accordance with the standards of the PCAOB. Those standards require that we plan and perform the audit to obtain reasonable assurance about whether the financial statements are free of material misstatement, whether due to error or fraud.
Our audits included performing procedures to assess the risks of material misstatement of the financial statements, whether due to error or fraud, and performing procedures that respond to those risks. Such procedures included examining, on a test basis, evidence regarding the amounts and disclosures in the financial statements. Our audits also included evaluating the accounting principles used and significant estimates made by management, as well as evaluating the overall presentation of the financial statements. Our procedures included confirmation of securities owned as of August 31, 2019, by correspondence with the custodian, transfer agent and brokers; when replies were not received from brokers, we performed other audit procedures. We believe that our audits provide a reasonable basis for our opinion.
/s/PricewaterhouseCoopers LLP
Minneapolis, Minnesota
October 24, 2019
We have served as the auditor of one or more investment companies within the Columbia Funds Complex since 1977.
Columbia Small Cap Growth Fund I | Annual Report 2019
| 31 |
Federal Income Tax Information
(Unaudited)
The Fund hereby designates the following tax attributes for the fiscal year ended August 31, 2019. Shareholders will be notified in early 2020 of the amounts for use in preparing 2019 income tax returns.
Qualified
dividend
income | Dividends
received
deduction | Capital
gain
dividend |
| 4.90% | 4.90% | $54,837,145 |
Qualified dividend income. For taxable, non-corporate shareholders, the percentage of ordinary income distributed during the fiscal year that represents qualified dividend income subject to reduced tax rates.
Dividends received deduction. The percentage of ordinary income distributed during the fiscal year that qualifies for the corporate dividends received deduction.
Capital gain dividend. The Fund designates as a capital gain dividend the amount reflected above, or if subsequently determined to be different, the net capital gain of such fiscal period.
TRUSTEES AND OFFICERS
The Board oversees the Fund’s operations and appoints officers who are responsible for day-to-day business decisions based on policies set by the Board. The following table provides basic biographical information about the Fund’s Trustees as of the printing of this report, including their principal occupations during the past five years, although specific titles for individuals may have varied over the period. The year set forth beneath Length of Service in the table below is the year in which the Trustee was first appointed or elected as Trustee to any Fund currently in the Columbia Funds Complex or a predecessor thereof. Under current Board policy, members serve terms of indefinite duration.
Independent trustees
| Name, address, year of birth | Position held with the Trust and length of service | Principal occupation(s) during the past five years and other relevant professional experience | Number of Funds in the Columbia Fund Complex overseen | Other directorships held by Trustee during the past five years |
Janet Langford Carrig
c/o Columbia Management
Investment Advisers, LLC
225 Franklin Street
Mail Drop BX32 05228
Boston, MA 02110
1957 | Trustee
1996 | Senior Vice President, General Counsel and Corporate Secretary, ConocoPhillips (independent energy company), September 2007-October 2018 | 70 | None |
Douglas A. Hacker
c/o Columbia Management
Investment Advisers, LLC
225 Franklin Street
Mail Drop BX32 05228
Boston, MA 02110
1955 | Trustee and Chairman of the Board
1996 | Independent business executive since May 2006; Executive Vice President — Strategy of United Airlines, December 2002-May 2006; President of UAL Loyalty Services (airline marketing company), September 2001-December 2002; Executive Vice President and Chief Financial Officer of United Airlines, July 1999-September 2001 | 70 | Spartan Nash Company, (food distributor); former Director, Nash Finch Company (food distributor), 2005-2013; Aircastle Limited (aircraft leasing); former Director, SeaCube Container Leasing Ltd. (container leasing), 2010-2013; and Travelport Worldwide Limited (travel information technology) |
| 32 | Columbia Small Cap Growth Fund I | Annual Report 2019 |
TRUSTEES AND OFFICERS (continued)
Independent trustees (continued)
| Name, address, year of birth | Position held with the Trust and length of service | Principal occupation(s) during the past five years and other relevant professional experience | Number of Funds in the Columbia Fund Complex overseen | Other directorships held by Trustee during the past five years |
Nancy T. Lukitsh
c/o Columbia Management
Investment Advisers, LLC
225 Franklin Street
Mail Drop BX32 05228
Boston, MA 02110
1956 | Trustee
2011 | Senior Vice President, Partner and Director of Marketing, Wellington Management Company, LLP (investment adviser), 1997-2010; Chair, Wellington Management Portfolios (commingled non-U.S. investment pools), 2007-2010; Director, Wellington Trust Company, NA and other Wellington affiliates, 1997-2010 | 70 | None |
David M. Moffett
c/o Columbia Management
Investment Advisers, LLC
225 Franklin Street
Mail Drop BX32 05228
Boston, MA 02110
1952 | Trustee
2011 | Retired. Consultant to Bridgewater and Associates | 70 | Director, CSX Corporation (transportation suppliers); Genworth Financial, Inc. (financial and insurance products and services); PayPal Holdings Inc. (payment and data processing services); Trustee, University of Oklahoma Foundation; former Director, eBay Inc. (online trading community), 2007-2015; and former Director, CIT Bank, CIT Group Inc. (commercial and consumer finance), 2010-2016 |
John J. Neuhauser
c/o Columbia Management
Investment Advisers, LLC
225 Franklin Street
Mail Drop BX32 05228
Boston, MA 02110
1943 | Trustee
1984 | President, Saint Michael’s College, August 2007-June 2018; Director or Trustee of several non-profit organizations, including University of Vermont Medical Center; Academic Vice President and Dean of Faculties, Boston College, August 1999-October 2005; University Professor, Boston College, November 2005-August 2007 | 70 | Liberty All-Star Equity Fund and Liberty All- Star Growth Fund (closed-end funds) |
Patrick J. Simpson
c/o Columbia Management
Investment Advisers, LLC
225 Franklin Street
Mail Drop BX32 05228
Boston, MA 02110
1944 | Trustee
2000 | Of Counsel, Perkins Coie LLP (law firm) since 2015; Partner, Perkins Coie LLP, 1988-2014 | 70 | Former Director, M Fund, Inc. (M Funds mutual fund family), July 2018-July 2019 |
Anne-Lee Verville
c/o Columbia Management
Investment Advisers, LLC
225 Franklin Street
Mail Drop BX32 05228
Boston, MA 02110
1945 | Trustee
1998 | Retired. General Manager, Global Education Industry, 1994-1997, President – Application Systems Division, 1991-1994, Chief Financial Officer – US Marketing & Services, 1988-1991, and Chief Information Officer, 1987-1988, IBM Corporation (computer and technology) | 70 | Former Director, Enesco Group, Inc. (producer of giftware and home and garden decor products), 2001-2006 |
Columbia Small Cap Growth Fund I | Annual Report 2019
| 33 |
TRUSTEES AND OFFICERS (continued)
Consultants to the Independent Trustees*
| Name, address, year of birth | Position held with the Trust and length of service | Principal occupation(s) during the past five years and other relevant professional experience | Number of Funds in the Columbia Funds complex overseen | Other directorships held by Trustee during the past five years |
J. Kevin Connaughton
c/o Columbia
Management Investment
Advisers, LLC,
225 Franklin Street
Mail Drop BX32 05228,
Boston, MA 02110
1964 | Independent Trustee Consultant
2016 | Independent Trustee Consultant, Columbia Funds since March 2016; Adjunct Professor of Finance, Bentley University since November 2017; Managing Director and General Manager of Mutual Fund Products, Columbia Management Investment Advisers, LLC, May 2010-February 2015; President, Columbia Funds, 2009-2015; and senior officer of Columbia Funds and affiliated funds, 2003-2015 | 70 | Director, The Autism Project since March 2015; former Trustee, New Century Portfolios, March 2015-December 2017; formerly on Board of Governors, Gateway Healthcare, January 2016 – December 2017 |
Olive Darragh
c/o Columbia
Management Investment
Advisers, LLC,
225 Franklin Street,
Mail Drop BX32 05228,
Boston, MA 02110
1962 | Independent Trustee Consultant 2019 | Independent Trustee Consultant, Columbia Funds since June 2019; Managing Director of Darragh Inc. (a strategy and talent management consulting firm) since 2010; Founder and CEO, Zolio (an investment management talent identification platform) since 2004; Partner, Tudor Investments, 2004-2010; Senior Partner, McKinsey & Company, 2001-2004 | 70 | Director, University of Edinburgh Business School; former Director, Boston Public Library Foundation |
Natalie A. Trunow
c/o Columbia
Management Investment
Advisers, LLC,
225 Franklin Street
Mail Drop BX32 05228,
Boston, MA 02110
1967 | Independent Trustee Consultant
2016 | Independent Trustee Consultant, Columbia Funds since September 2016; Chief Executive Officer, Millennial Portfolio Solutions LLC (asset management and consulting services) since January 2016; Director of Investments, Casey Family Programs, April 2016-September 2016; Senior Vice President and Chief Investment Officer, Calvert Investments, August 2008-January 2016; Section Head and Portfolio Manager, General Motors Asset Management, June 1997-August 2008 | 70 | Director, Health Services for Children with Special Needs, Inc.; Director, Consumer Credit Counseling Services (formerly Guidewell Financial Solutions) |
| * | J. Kevin Connaughton was appointed consultant to the Independent Trustees effective March 1, 2016. Olive Darragh was appointed consultant to the Independent Trustees effective June 10, 2019. Natalie A. Trunow was appointed consultant to the Independent Trustees effective September 1, 2016. Shareholders of the Funds are expected to be asked to elect each of Mr. Connaughton, Ms. Darragh and Ms. Trunow as a Trustee at a future shareholder meeting. |
Interested trustee affiliated with Investment Manager*
| Name, address, year of birth | Position held with the Trust and length of service | Principal occupation(s) during the past five years and other relevant professional experience | Number of Funds in the Columbia Funds Complex overseen | Other directorships held by Trustee during the past five years |
William F. Truscott
c/o Columbia Management
Investment Advisers, LLC
225 Franklin Street
Boston, MA 02110
1960 | Trustee
2012 | Chairman of the Board and President, Columbia Management Investment Advisers, LLC since May 2010 and February 2012, respectively; Chief Executive Officer, Global Asset Management, Ameriprise Financial, Inc. since September 2012 (previously Chief Executive Officer, U.S. Asset Management & President, Annuities, May 2010-September 2012); Director and Chief Executive Officer, Columbia Management Investment Distributors, Inc. since May 2010 and February 2012, respectively; Chairman of the Board and Chief Executive Officer, RiverSource Distributors, Inc. since 2006; Director, Threadneedle Asset Management Holdings, SARL since 2014; President and Chief Executive Officer, Ameriprise Certificate Company, 2006-August 2012 | 192 | Chairman of the Board, Columbia Management Investment Advisers, LLC since May 2010; Director, Columbia Management Investment Distributors, Inc. since May 2010; former Director, Ameriprise Certificate Company, August 2006 - January 2013 |
| 34 | Columbia Small Cap Growth Fund I | Annual Report 2019 |
TRUSTEES AND OFFICERS (continued)
| * | Interested person (as defined under the 1940 Act) by reason of being an officer, director, security holder and/or employee of the Investment Manager or Ameriprise Financial. |
The Statement of Additional Information has additional information about the Fund’s Board members and is available, without charge, upon request by calling 800.345.6611, visiting columbiathreadneedleus.com/investor/ or contacting your financial intermediary.
The Board has appointed officers who are responsible for day-to-day business decisions based on policies it has established. The officers serve at the pleasure of the Board. The following table provides basic information about the Officers of the Fund as of the printing of this report, including principal occupations during the past five years, although their specific titles may have varied over the period. In addition to Mr. Truscott, who is Senior Vice President, the Fund’s other officers are:
Fund officers
Name,
address and
year of birth | Position and year
first appointed to
position for any Fund
in the Columbia
Funds complex or a
predecessor thereof | Principal occupation(s) during past five years |
Christopher O. Petersen
5228 Ameriprise
Financial Center
Minneapolis, MN 55474
Born 1970 | President and Principal Executive Officer (2015) | Vice President and Lead Chief Counsel, Ameriprise Financial, Inc. since January 2015 (previously Vice President and Chief Counsel, January 2010 - December 2014; officer of Columbia Funds and affiliated funds since 2007. |
Michael G. Clarke
225 Franklin Street
Boston, MA 02110
Born 1969 | Chief Financial Officer (Principal Financial Officer) (2009) and Senior Vice President (2019) | Vice President, Head of North American Operations, and Co-Head of Global Operations, Columbia Management Investment Advisers, LLC, since June 2019 (previously Vice President – Accounting and Tax, May 2010 - May 2019); senior officer of Columbia Funds and affiliated funds since 2002 (previously Treasurer and Chief Accounting Officer, January 2009 - January 2019 and December 2015 - January 2019, respectively). |
Joseph Beranek
5890 Ameriprise
Financial Center
Minneapolis, MN 55474
Born 1965 | Treasurer and Chief Accounting Officer (Principal Accounting Officer) (2019) | Vice President — Mutual Fund Accounting and Financial Reporting, Columbia Management Investment Advisers, LLC, since December 2018 and March 2017, respectively (previously Vice President — Pricing and Corporate Actions, May 2010 - March 2017). |
Paul B. Goucher
485 Lexington Avenue
New York, NY 10017
Born 1968 | Senior Vice President (2011) and Assistant Secretary (2008) | Senior Vice President and Assistant General Counsel, Ameriprise Financial, Inc. since January 2017 (previously Vice President and Lead Chief Counsel, November 2008 - January 2017 and January 2013 - January 2017, respectively); Vice President, Chief Legal Officer and Assistant Secretary, Columbia Management Investment Advisers, LLC since March 2015 (previously Vice President and Assistant Secretary, May 2010 – March 2015). |
Thomas P. McGuire
225 Franklin Street
Boston, MA 02110
Born 1972 | Senior Vice President and Chief Compliance Officer (2012) | Vice President — Asset Management Compliance, Ameriprise Financial, Inc., since May 2010; Chief Compliance Officer, Ameriprise Certificate Company since September 2010. |
Colin Moore
225 Franklin Street
Boston, MA 02110
Born 1958 | Senior Vice President (2010) | Executive Vice President and Global Chief Investment Officer, Ameriprise Financial, Inc., since July 2013; Executive Vice President and Global Chief Investment Officer, Columbia Management Investment Advisers, LLC since July 2013. |
Ryan C. Larrenaga
225 Franklin Street
Boston, MA 02110
Born 1970 | Senior Vice President (2017), Chief Legal Officer (2017), and Secretary (2015) | Vice President and Chief Counsel, Ameriprise Financial, Inc. since August 2018 (previously Vice President and Group Counsel, August 2011 - August 2018); officer of Columbia Funds and affiliated funds since 2005. |
Michael E. DeFao
225 Franklin Street
Boston, MA 02110
Born 1968 | Vice President (2011) and Assistant Secretary (2010) | Vice President and Chief Counsel, Ameriprise Financial, Inc. since May 2010. |
Columbia Small Cap Growth Fund I | Annual Report 2019
| 35 |
TRUSTEES AND OFFICERS (continued)
Fund officers (continued)
Name,
address and
year of birth | Position and year
first appointed to
position for any Fund
in the Columbia
Funds complex or a
predecessor thereof | Principal occupation(s) during past five years |
Lyn Kephart-Strong
5228 Ameriprise
Financial Center
Minneapolis, MN 55474
Born 1960 | Vice President (2015) | President, Columbia Management Investment Services Corp. since October 2014; Vice President & Resolution Officer, Ameriprise Trust Company since August 2009. |
Board Consideration and Approval of Management
Agreement
On June 12, 2019, the Board of Trustees (the Board) and the Trustees who are not interested persons (as defined in the Investment Company Act of 1940) (the Independent Trustees) of Columbia Funds Series Trust I (the Trust) unanimously approved the continuation of the Management Agreement (the Management Agreement) with Columbia Management Investment Advisers, LLC (the Investment Manager) with respect to Columbia Small Cap Growth Fund I (the Fund), a series of the Trust. As detailed below, the Board’s Advisory Fees and Expenses Committee (the Committee) and the Board met on multiple occasions to review and discuss, among themselves, with the management team of the Investment Manager and with an independent fee consultant, materials provided by the Investment Manager, the independent fee consultant and others before determining to approve the continuation of the Management Agreement.
In connection with their deliberations regarding the continuation of the Management Agreement, the Committee and the Board evaluated materials requested from the Investment Manager regarding the Fund and the Management Agreement, and discussed these materials with representatives of the Investment Manager at Committee meetings held on March 5, 2019, April 25, 2019 and June 11, 2019 and at Board meetings held on March 6, 2019 and June 12, 2019. In addition, the Board and its various committees consider matters bearing on the Management Agreement at other meetings throughout the year and in prior years and meet regularly with senior management of the Trust and the Investment Manager. Through the Board’s Investment Oversight Committees, Trustees also meet with selected portfolio managers of the funds the Trustees oversee and with other investment personnel at various times throughout the year. The Committee and the Board also consulted with the independent fee consultant, Fund counsel and the Independent Trustees’ independent legal counsel, who advised on various matters with respect to the Committee’s and the Board’s considerations and otherwise assisted the Committee and the Board in their deliberations. On June 11, 2019, the Committee recommended that the Board approve the continuation of the Management Agreement. On June 12, 2019, the Board, including the Independent Trustees, voting separately, unanimously approved the continuation of the Management Agreement for the Fund.
The Committee and the Board considered all information that they, their legal counsel or the Investment Manager believed reasonably necessary to evaluate and to determine whether to recommend for approval or approve the continuation of the Management Agreement. The information and factors considered by the Committee and the Board in recommending for approval or approving the continuation of the Management Agreement for the Fund included the following:
| • | Information on the investment performance of the Fund relative to the performance of a group of mutual funds determined to be comparable to the Fund by an independent third-party data provider, as well as performance relative to benchmarks; |
| • | Information on the Fund’s management fees and total expenses, including information comparing the Fund’s expenses to those of a group of comparable mutual funds, as determined by the independent third-party data provider; |
| 36 | Columbia Small Cap Growth Fund I | Annual Report 2019 |
Board Consideration and Approval of Management
Agreement (continued)
| • | The Investment Manager’s agreement to contractually limit or cap total operating expenses for the Fund through December 31, 2020 so that total operating expenses (excluding certain fees and expenses, such as transaction costs and certain other investment related expenses, interest, taxes, acquired fund fees and expenses, and infrequent and/or unusual expenses) would not exceed a specified annual rate, as a percentage of the Fund’s net assets; |
| • | The terms and conditions of the Management Agreement; |
| • | The current and proposed terms and conditions of other agreements and arrangements with affiliates of the Investment Manager relating to the operations of the Fund, including agreements with respect to the provision of distribution, transfer agency and shareholder services to the Fund; |
| • | Descriptions of various functions performed by the Investment Manager under the Management Agreement, including portfolio management and portfolio trading practices; |
| • | Information regarding the management fees of similarly-managed portfolios of other clients of the Investment Manager, including institutional accounts and collective trusts; |
| • | Information regarding the reputation, regulatory history and resources of the Investment Manager, including information regarding senior management, portfolio managers and other personnel; |
| • | Information regarding the capabilities of the Investment Manager with respect to compliance monitoring services, including an assessment of the Investment Manager’s compliance system by the Fund’s Chief Compliance Officer; and |
| • | The profitability to the Investment Manager and its affiliates from their relationships with the Fund. |
Nature, extent and quality of services provided under the Management Agreement
The Committee and the Board considered the nature, extent and quality of services provided to the Fund by the Investment Manager and its affiliates under the Management Agreement and under separate agreements for the provision of transfer agency and shareholder services, and the resources dedicated to the Fund and the other Columbia Funds by the Investment Manager and its affiliates. The Committee and the Board considered, among other things, the Investment Manager’s ability to attract, motivate and retain highly qualified research, advisory and supervisory investment professionals (including compensation programs for personnel involved in fund management, reputation and other attributes), the portfolio management services provided by those investment professionals, and the quality of the Investment Manager’s investment research capabilities and trade execution services. The Committee and the Board also considered the potential benefits to shareholders of investing in a mutual fund that is part of a fund complex offering exposure to a variety of asset classes and investment disciplines and providing a variety of fund and shareholder services.
The Committee and the Board also considered the professional experience and qualifications of the senior personnel of the Investment Manager, which included consideration of the Investment Manager’s experience with funds using an investment strategy similar to that used by the Investment Manager for the Fund. The Committee and the Board noted the compliance programs of and the compliance-related resources provided to the Fund by the Investment Manager and its affiliates and the resources dedicated by the Investment Manager and its affiliates to risk management, and considered the Investment Manager’s ability to provide administrative services to the Fund and coordinate the activities of the Fund’s other service providers. After reviewing these and related factors, the Committee and the Board concluded, within the context of their overall conclusions, that the nature, extent and quality of the services provided to the Fund under the Management Agreement supported the continuation of the Management Agreement.
Investment performance
The Committee and the Board reviewed information about the performance of the Fund over various time periods, including performance information relative to benchmarks, information that compared the performance of the Fund to the performance of a group of comparable mutual funds as determined by the independent third-party data provider, and information and analysis provided by the independent fee consultant. The Committee and the Board also reviewed a description of the third party’s methodology for identifying the Fund’s peer groups for purposes of performance and expense comparisons.
Columbia Small Cap Growth Fund I | Annual Report 2019
| 37 |
Board Consideration and Approval of Management
Agreement (continued)
The Committee and the Board noted that, through December 31, 2018, the Fund’s performance was in the thirtieth, sixteenth and twenty-sixth percentile (where the best performance would be in the first percentile) of its category selected by the independent third-party data provider for the purposes of performance comparisons for the one-, three- and five-year periods, respectively.
The Committee and the Board also considered the Investment Manager’s performance and reputation generally, the Investment Manager’s historical responsiveness to Board concerns about performance, and the Investment Manager’s willingness to take steps intended to improve performance. After reviewing these and related factors, the Committee and the Board concluded, within the context of their overall conclusions, that the performance of the Fund and the Investment Manager was sufficient, in light of other considerations, to support the continuation of the Management Agreement.
Investment management fee rates and other expenses
The Committee and the Board considered the management fees charged to the Fund under the Management Agreement as well as the total expenses incurred by the Fund. In assessing the reasonableness of the fees under the Management Agreement, the Committee and the Board considered, among other information, the Fund’s total expense ratio as a percentage of average daily net assets. The Committee and the Board considered data provided by the independent third-party data provider and the independent fee consultant. The Committee and the Board noted that, as of December 31, 2018, the Fund’s actual management fee and net total expense ratio were both ranked in the fourth quintile (where the lowest fees and expenses would be in the first quintile) against the Fund’s expense universe as determined by the independent third-party data provider for purposes of expense comparison. The Committee and the Board also took into account the fee waiver and expense limitation arrangements agreed to by the Investment Manager, as noted above.
The Committee and the Board also received and considered information about the management fees charged by the Investment Manager to institutional accounts. In considering the fees charged to those accounts, the Committee and the Board took into account, among other things, the Investment Manager’s representations about the differences between managing mutual funds as compared to other types of accounts, including differences in the services provided, differences in the risk profile of such business for the Investment Manager and the additional resources required to manage mutual funds effectively. The Committee and the Board also received and considered information about the fees charged by the Investment Manager for sub-advisory services it provides to comparable unaffiliated funds. In evaluating the Fund’s management fees, the Committee and the Board also took into account the demands, complexity and quality of the investment management of the Fund.
After reviewing these and related factors, the Committee and the Board concluded, within the context of their overall conclusions, that the management fee rates and expenses of the Fund, in light of other considerations, supported the continuation of the Management Agreement.
Costs of services provided and profitability
The Committee and the Board also took note of the costs the Investment Manager and its affiliates incur in connection with the services provided and the profitability to the Investment Manager and its affiliates from their relationships with the Fund, and the efforts undertaken by the Investment Manager and its affiliates to manage efficiently their costs to provide such services.
The Committee and the Board also considered the compensation directly or indirectly received by the Investment Manager’s affiliates in connection with their relationships with the Fund. The Committee and the Board reviewed information provided by management as to the profitability to the Investment Manager and its affiliates of their relationships with the Fund, information about the allocation of expenses used to calculate profitability, and comparisons of profitability levels realized in 2018 to profitability levels realized in 2017. When reviewing profitability, the Committee and the Board also considered court cases in which adviser profitability was an issue in whole or in part, the performance of similarly managed funds, the performance of the Fund, and the expense ratio of the Fund. In addition, the Committee and the Board considered information provided by the Investment Manager regarding the Investment Manager’s financial condition and comparing its profitability to that of other asset management firms that are, or are subsidiaries of, publicly traded companies. In this regard, the Committee and the Board also considered data provided by the independent fee consultant.
| 38 | Columbia Small Cap Growth Fund I | Annual Report 2019 |
Board Consideration and Approval of Management
Agreement (continued)
After reviewing these and related factors, the Committee and the Board concluded, within the context of their overall conclusions, that the costs of services provided and the profitability to the Investment Manager and its affiliates from their relationships with the Fund supported the continuation of the Management Agreement.
Economies of scale
The Committee and the Board considered the potential existence of economies of scale in the provision by the Investment Manager of services to the Fund, to groups of related funds, and to the Investment Manager’s investment advisory clients as a whole, and whether those economies of scale were shared with the Fund through breakpoints in investment management fees or other means, such as expense limitation arrangements and additional investments by the Investment Manager in investment, trading, compliance and other resources. The Committee and the Board noted that the management fee schedules for the Fund contained breakpoints that would reduce the fee rate on assets above specified threshold levels.
In considering these matters, the Committee and the Board also considered the costs of the services provided and the profitability to the Investment Manager and its affiliates from their relationships with the Fund, as noted above. After reviewing these and related factors, the Committee and the Board concluded, within the context of their overall conclusions, that the extent to which any economies of scale were expected to be shared with the Fund supported the continuation of the Management Agreement.
Other benefits to the Investment Manager
The Committee and the Board received and considered information regarding “fall-out” or ancillary benefits received by the Investment Manager and its affiliates as a result of their relationships with the Fund, such as the engagement of the Investment Manager’s affiliates to provide distribution, transfer agency and shareholder services to the Fund. In this regard, among other matters, the Committee and the Board considered that the Fund’s distributor retains a portion of the distribution fees from the Fund and receives a portion of the sales charges on sales or redemptions of certain classes of shares of the Fund. The Committee and the Board also considered the benefits of research made available to the Investment Manager by reason of brokerage commissions generated by the Fund’s securities transactions, and reviewed information about the Investment Manager’s practices with respect to considering brokerage and research services when allocating portfolio transactions. In this connection, the Board also noted that the amount of research made available to the Investment Manager by reason of brokerage commissions had been declining over time, and may decline further. The Committee and the Board recognized that the Investment Manager’s profitability would be somewhat lower without these benefits.
Conclusion
The Committee and the Board reviewed all of the above considerations in reaching their decisions to recommend or approve the continuation of the Management Agreement. In their deliberations, the Trustees did not identify any particular information that was all-important or controlling, and individual Trustees may have attributed different weights to the various factors. Based on their evaluation of all factors that they deemed to be material, including those factors described above, and assisted by the advice of independent legal counsel, the Board, including the Independent Trustees, voting separately, unanimously approved the continuation of the Management Agreement.
Columbia Small Cap Growth Fund I | Annual Report 2019
| 39 |
Columbia Small Cap Growth Fund I
P.O. Box 219104
Kansas City, MO 64121-9104
Please read and consider the investment objectives, risks, charges and expenses for any fund carefully before investing. For a prospectus and summary prospectus, which contains this and other important information about the Fund, go to
columbiathreadneedleus.com/investor/. The Fund is distributed by Columbia Management Investment Distributors, Inc., member FINRA, and managed by Columbia Management Investment Advisers, LLC.
Columbia Threadneedle Investments (Columbia Threadneedle) is the global brand name of the Columbia and Threadneedle group of companies. All rights reserved.
© 2019 Columbia Management Investment Advisers, LLC.
columbiathreadneedleus.com/investor/

Annual Report
August 31, 2019
Columbia Global Dividend Opportunity Fund
Beginning on January 1, 2021, as permitted by regulations adopted by the Securities and Exchange Commission, paper copies of the Fund’s annual and semiannual shareholder reports like this one will no longer be sent by mail, unless you specifically request paper copies of the reports. Instead, the reports will be made available on the Fund’s website (columbiathreadneedleus.com/investor/), and each time a report is posted you will be notified by mail and provided with a website address to access the report.
If you have already elected to receive shareholder reports electronically, you will not be affected by this change and you need not take any action. You may elect to receive shareholder reports and other communications from the Fund electronically at any time by contacting your financial intermediary (such as a broker-dealer or bank) or, for Fund shares held directly with the Fund, by calling 800.345.6611 or by enrolling in “eDelivery” by logging into your account at columbiathreadneedleus.com/investor/.
You may elect to receive all future reports in paper free of charge. If you invest through a financial intermediary, you can contact your financial intermediary to request that you continue receiving paper copies of your shareholder reports. If you invest directly with the Fund, you can call 800.345.6611 to let the Fund know you wish to continue receiving paper copies of your shareholder reports. Your election to receive paper reports will apply to all Columbia Funds held in your account if you invest through a financial intermediary or all Columbia Funds held with the fund complex if you invest directly with the Fund.
Not FDIC Insured • No bank guarantee • May lose value
Columbia Global Dividend Opportunity Fund (the Fund) mails one shareholder report to each shareholder address, unless such shareholder elected to receive shareholder reports from the Fund electronically. If you would like more than one report, please call shareholder services at 800.345.6611 and additional reports will be sent to you.
Proxy voting policies and procedures
The policy of the Board of Trustees is to vote the proxies of the companies in which the Fund holds investments consistent with the procedures as stated in the Statement of Additional Information (SAI). You may obtain a copy of the SAI without charge by calling 800.345.6611; contacting your financial intermediary; visiting columbiathreadneedleus.com/investor/; or searching the website of the Securities and Exchange Commission (SEC) at sec.gov. Information regarding how the Fund voted proxies relating to portfolio securities is filed with the SEC by August 31st for the most recent 12-month period ending June 30th of that year, and is available without charge by visiting columbiathreadneedleus.com/investor/, or searching the website of the SEC at sec.gov.
Quarterly schedule of investments
The Fund files a complete schedule of portfolio holdings with the SEC for the first and third quarters of each fiscal year on Form N-PORT, and for reporting periods ended prior to March 31, 2019, on Form N-Q. The Fund’s Form N-Q and Form N-PORT filings are available on the SEC’s website at sec.gov. The Fund’s complete schedule of portfolio holdings, as filed on Form N-Q or Form N-PORT, can also be obtained without charge, upon request, by calling 800.345.6611.
Additional Fund information
For more information about the Fund, please visit columbiathreadneedleus.com/investor/ or call 800.345.6611. Customer Service Representatives are available to answer your questions Monday through Friday from 8 a.m. to 7 p.m. Eastern time.
Fund investment manager
Columbia Management Investment Advisers, LLC (the Investment Manager)
225 Franklin Street
Boston, MA 02110
Fund distributor
Columbia Management Investment Distributors, Inc.
225 Franklin Street
Boston, MA 02110
Fund transfer agent
Columbia Management Investment Services Corp.
P.O. Box 219104
Kansas City, MO 64121-9104
Columbia Global Dividend Opportunity Fund | Annual Report 2019
Investment objective
The Fund seeks total return, consisting of current income and capital appreciation.
Portfolio management
Jonathan Crown
Lead Portfolio Manager
Managed Fund since 2016
Georgina Hellyer, CFA
Portfolio Manager
Managed Fund since 2018
Morningstar style boxTM
The Morningstar Style Box is based on a fund’s portfolio holdings. For equity funds, the vertical axis shows the market capitalization of the stocks owned, and the horizontal axis shows investment style (value, blend, or growth). Information shown is based on the most recent data provided by Morningstar.
© 2019 Morningstar, Inc. All rights reserved. The Morningstar information contained herein: (1) is proprietary to Morningstar and/or its content providers; (2) may not be copied or distributed; and (3) is not warranted to be accurate, complete or timely. Neither Morningstar nor its content providers are responsible for any damages or losses arising from any use of this information.
| Average annual total returns (%) (for the period ended August 31, 2019) |
| | | Inception | 1 Year | 5 Years | 10 Years |
| Class A | Excluding sales charges | 11/01/02 | -0.16 | 1.81 | 6.82 |
| | Including sales charges | | -5.90 | 0.62 | 6.19 |
| Advisor Class* | 03/19/13 | 0.10 | 2.07 | 7.09 |
| Class C | Excluding sales charges | 10/13/03 | -0.86 | 1.07 | 6.03 |
| | Including sales charges | | -1.81 | 1.07 | 6.03 |
| Institutional Class | 11/09/00 | 0.10 | 2.08 | 7.09 |
| Institutional 2 Class* | 01/08/14 | 0.23 | 2.22 | 7.18 |
| Institutional 3 Class | 07/15/09 | 0.29 | 2.30 | 7.30 |
| Class R* | 09/27/10 | -0.41 | 1.55 | 6.55 |
| MSCI ACWI High Dividend Yield Index (Net) | | 2.40 | 3.69 | 7.39 |
| MSCI ACWI (Net) | | -0.28 | 5.51 | 8.61 |
Returns for Class A shares are shown with and without the maximum initial sales charge of 5.75%. Returns for Class C shares are shown with and without the 1.00% contingent deferred sales charge for the first year only. The Fund’s other share classes are not subject to sales charges and have limited eligibility. Please see the Fund’s prospectus for details. Performance for different share classes will vary based on differences in sales charges and fees associated with each share class. All results shown assume reinvestment of distributions during the period. Returns do not reflect the deduction of taxes that a shareholder may pay on Fund distributions or on the redemption of Fund shares. Performance results reflect the effect of any fee waivers or reimbursements of Fund expenses by Columbia Management Investment Advisers, LLC and/or any of its affiliates. Absent these fee waivers or expense reimbursement arrangements, performance results would have been lower.
The performance information shown represents past performance and is not a guarantee of future results. The investment return and principal value of your investment will fluctuate so that your shares, when redeemed, may be worth more or less than their original cost. Current performance may be lower or higher than the performance information shown. You may obtain performance information current to the most recent month-end by contacting your financial intermediary, visiting columbiathreadneedleus.com/investor/ or calling 800.345.6611.
| * | The returns shown for periods prior to the share class inception date (including returns for the Life of the Fund, if shown, which are since Fund inception) include the returns of the Fund’s oldest share class. These returns are adjusted to reflect any higher class-related operating expenses of the newer share classes, as applicable. Please visit columbiathreadneedleus.com/investor/investment-products/mutual-funds/appended-performance for more information. |
The MSCI ACWI High Dividend Yield Index (Net) includes large and mid-cap stocks across 23 developed market countries. The index is designed to reflect the performance of equities selected from the MSCI World Index with higher than average dividend yields that are both sustainable and persistent.
The MSCI ACWI (Net) is a free float-adjusted market capitalization weighted index that is designed to measure the equity market performance of developed and emerging markets. The index consists of 45 country indices comprising 24 developed and 21 emerging market country indices.
Indices are not available for investment, are not professionally managed and do not reflect sales charges, fees, brokerage commissions, taxes (except the MSCI ACWI High Dividend Yield Index (Net) and the MSCI ACWI (Net) which reflect reinvested dividends net of withholding taxes) or other expenses of investing. Securities in the Fund may not match those in an index.
Columbia Global Dividend Opportunity Fund | Annual Report 2019
| 3 |
Fund at a Glance (continued)
Performance of a hypothetical $10,000 investment (August 31, 2009 — August 31, 2019)
The chart above shows the change in value of a hypothetical $10,000 investment in Class A shares of Columbia Global Dividend Opportunity Fund during the stated time period, and does not reflect the deduction of taxes that a shareholder may pay on Fund distributions or on the redemption of Fund shares.
| Top 10 holdings (%) (at August 31, 2019) |
| Samsung Electronics Co., Ltd. (South Korea) | 3.8 |
| PepsiCo, Inc. (United States) | 3.4 |
| Unilever NV (Netherlands) | 3.3 |
| Pfizer, Inc. (United States) | 3.3 |
| Novartis AG, ADR (Switzerland) | 3.3 |
| Verizon Communications, Inc. (United States) | 3.1 |
| CME Group, Inc. (United States) | 2.9 |
| Wells Fargo & Co. (United States) | 2.8 |
| Lockheed Martin Corp. (United States) | 2.8 |
| Deutsche Telekom AG, Registered Shares (Germany) | 2.4 |
Percentages indicated are based upon total investments excluding Money Market Funds and investments in derivatives, if any.
For further detail about these holdings, please refer to the section entitled “Portfolio of Investments.”
Fund holdings are as of the date given, are subject to change at any time, and are not recommendations to buy or sell any security.
| Equity sector breakdown (%) (at August 31, 2019) |
| Communication Services | 10.4 |
| Consumer Discretionary | 4.0 |
| Consumer Staples | 14.2 |
| Energy | 7.9 |
| Financials | 15.5 |
| Health Care | 14.7 |
| Industrials | 10.3 |
| Information Technology | 11.4 |
| Materials | 6.8 |
| Real Estate | 1.2 |
| Utilities | 3.6 |
| Total | 100.0 |
Percentages indicated are based upon total equity investments. The Fund’s portfolio composition is subject to change.
| 4 | Columbia Global Dividend Opportunity Fund | Annual Report 2019 |
Fund at a Glance (continued)
| Country breakdown (%) (at August 31, 2019) |
| Australia | 1.0 |
| Austria | 1.0 |
| Brazil | 1.3 |
| Canada | 6.3 |
| China | 0.5 |
| Finland | 1.8 |
| France | 0.8 |
| Germany | 4.4 |
| Hong Kong | 1.5 |
| Indonesia | 1.2 |
| Isle of Man | 0.4 |
| Japan | 3.9 |
| Jersey | 1.2 |
| Netherlands | 3.3 |
| South Korea | 3.7 |
| Spain | 2.2 |
| Switzerland | 4.3 |
| Taiwan | 1.8 |
| United Kingdom | 13.6 |
| United States(a) | 45.8 |
| Total | 100.0 |
| (a) | Includes investments in Money Market Funds. |
Country breakdown is based primarily on issuer’s place of organization/incorporation. Percentages indicated are based upon total investments excluding investments in derivatives, if any. The Fund’s portfolio composition is subject to change.
Columbia Global Dividend Opportunity Fund | Annual Report 2019
| 5 |
Manager Discussion of Fund Performance
For the 12-month period that ended August 31, 2019, the Fund’s Class A shares returned -0.16% excluding sales charges. The Fund underperformed its primary benchmark, the MSCI ACWI High Dividend Yield Index (Net), which returned 2.40%, but outperformed its secondary benchmark, the MSCI ACWI (Net), which returned -0.28%, for the same period. The Fund’s underperformance of the primary benchmark can be attributed primarily to sector allocation and country allocation overall, which more than offset the positive contribution of effective stock selection as a whole.
Global equity markets gained despite persistent trade tensions
Global equities gained for the period despite an initial decline between September and December 2018 caused by persisting trade tensions, unrest in the Middle East and investor concerns around the outlook for global economic growth. The four months that followed saw these losses fully recouped. Investors welcomed the dovish pivot by the U.S. Federal Reserve, plans for economic stimulus in Europe and Asia, and seeming progress in trade talks between the U.S. and China. Equity market rotations in the last four months of the period continued to reflect rhetoric from the U.S. President and his Chinese counterparts regarding additional tariffs and, alternately, calls for calm from Beijing, swinging investor sentiment. In Europe, the formation of a Euro-sceptic Italian government prompted caution. Initial concerns around the expansionary nature of the country’s budget receded when the European Union adopted a more conciliatory tone, having first warned of disciplinary action for breaching its rules. In the U.K., the sterling’s decline benefited overseas investors but reflected fears that a Brexit (the U.K.’s departure from the European Union) deadline may be hit without any agreement on the nation’s future relationship with the European Union. Elsewhere, Japanese stocks were among the hardest hit by ongoing global economic growth concerns, while emerging markets fell away as resurgent trade tensions prompted a flight to “safe haven” assets at the start of August 2019.
Against a backdrop of declining bond yields and bouts of risk aversion, defensive sectors generally outperformed sources of cyclical growth. Utilities and consumer staples were the best performers in the primary benchmark by a wide margin during the period. Conversely, materials and energy were the weakest sectors in the primary benchmark during the period, weighed on by the subdued outlook for global economic growth. Fears around a crude supply glut and OPEC’s struggles to agree to an output cut also applied significant downward pressure on the energy sector between October and December 2018. From a country perspective, Russia, Brazil, Denmark, Spain and New Zealand performed best within the primary benchmark for the period overall. The U.S. posted single-digit positive absolute returns that outpaced the primary benchmark but lagged these other nations’ markets. The weakest performers within the primary benchmark during the period were Austria, Pakistan, Belgium, Chile and Egypt.
Sector allocation overall dampened Fund results most
Sector allocation decisions overall dampened Fund results most. More specifically, having underweights to utilities and consumer staples, the two best performing sectors in the primary benchmark during the period, especially hurt. Having overweights to materials and industrials, which each significantly lagged the primary benchmark during the period, further detracted. Stock selection in financials, consumer staples and energy also detracted from performance during the period as did having a position in cash, albeit a modest one, during an period when the primary benchmark advanced. From a country perspective, stock selection in the U.S. detracted most. Having an underweight to Switzerland, which strongly outpaced the primary benchmark during the period, and having an overweight to the U.K., which underperformed the primary benchmark during the period, also hurt as did stock selection in each of these countries.
Among the individual holdings that detracted most from relative results during the period were U.K. tobacco company British American Tobacco, U.S. oilfield services provider Schlumberger and Finland-based insurance company Sampo. British American Tobacco detracted from the Fund’s relative results owing to concerns around tobacco industry sales volumes, regulations and the company’s share in combustibles (cigarettes, cigars and loose roll-your-own and pipe tobacco). Shares of Schlumberger declined along with the broad energy sector amid a backdrop of falling crude oil prices. The pullback in Sampo’s shares largely reflected investor concerns about the outlook for its dividend, as Finnish bank Nordea Bank — in which Sampo has a significant stake — proposed a review of its capital and dividend policy.
| 6 | Columbia Global Dividend Opportunity Fund | Annual Report 2019 |
Manager Discussion of Fund Performance (continued)
Stock selection as a whole boosted Fund results
Stock selection as a whole boosted Fund results during the period, especially in the industrials, communication services, consumer discretionary, materials and real estate sectors. From a country perspective, stock selection in China, Germany and Indonesia, along with an underweight to the weakly performing China equity market and an overweight to the stronger performing Indonesia equity market, contributed positively to Fund results.
During the period, U.S. derivatives exchange operator CME Group, Hong Kong-based telecommunications services provider HKT Trust and HKT (HKT) and China-based sportswear manufacturer ANTA Sports Products were among the top contributors to Fund results. CME Group benefited during the period from an increase in market volatility. HKT performed well based on both effective execution in the mobile industry and on subscriber gains in broadband. Shares of ANTA Sports Products gained, buoyed by compelling sales guidance, upcoming sporting events and e-commerce potential. The company also benefited from investor optimism around its multi-brand strategy, which has enabled it to access a wide customer base.
Stock selection strategy drove weighting changes
In implementing our bottom-up selection strategy during the period, the Fund’s allocation to utilities increased relative to the primary benchmark, mainly via purchases of U.S. companies where we felt a shift to renewables could help their medium-term growth prospects. We shifted to an overweight in consumer staples, though we reduced the Fund’s exposure to the food and staples retailing industry within the sector. We decreased the Fund’s exposure to the consumer discretionary sector, primarily the result of a reduction in exposure to the auto industry. We also decreased the Fund’s allocation to financials, reducing exposure to banks and diversified financials though increasing exposure to the insurance industry.
Among the most significant purchases for the Fund during the period were U.K.-based consumer health, hygiene and home products manufacturer Reckitt Benckiser. Following significant reinvestment, we expect the company’s operational performance to improve. A new Chief Executive Officer also brought renewed investor optimism and prospects of a more clearly delineated strategic focus. We also initiated a Fund position in U.S. electric utilities company American Electric Power, which operates across multiple U.S. states and boasts one of the nation’s largest generation portfolios. In our view, its diversified asset base produces stable cash flows and helps mitigate exposure to changing regulatory or customer usage trends. We further believe the company is well positioned to meet pending environmental standards. Conversely, we sold the Fund’s position in U.S. regional theme park operator Six Flags Entertainment based on concerns about the effect of construction delays and slower U.S. economic growth on its future earnings. We also exited the Fund’s position in Thai full-service bank Siam Commercial Bank. The bank’s results had demonstrated solid trends in loan growth but also showed, in our view, that its transformation program, designed to enhance its digital capabilities, drove its costs higher relative to its peers. Though its stock’s valuation was supportive, in our opinion, this lack of cost control led us to believe better investment opportunities were available elsewhere.
From a country perspective, we increased the Fund’s exposure to the U.S. and the Netherlands and reduced its exposure to Japan and Australia relative to the primary benchmark.
At the end of the period, the Fund was most overweight the information technology, materials, communication services and industrials sectors and most underweight the consumer discretionary, utilities and health care sectors relative to the primary benchmark. By country, the Fund was most overweight the U.K., the U.S., the Netherlands, South Korea and Finland and was most underweight Switzerland, France, China, Japan and Taiwan relative to the primary benchmark.
Marketrisk may affect a single issuer, sector of the economy, industry or the market as a whole.Internationalinvesting involves certain risks and volatility due to potential political, economic or currency instabilities and different financial and accounting standards. Risks are enhanced foremerging market issuers.Valuesecurities may be unprofitable if the market fails to recognize their intrinsic worth or the portfolio manager misgauged that worth. See the Fund’s prospectus for more information on these and other risks.
The views expressed in this report reflect the current views of the respective parties. These views are not guarantees of future performance and involve certain risks, uncertainties and assumptions that are difficult to predict, so actual outcomes and results may differ significantly from the views expressed. These views are subject to change at any time based upon economic, market or other conditions and the respective parties disclaim any responsibility to
Columbia Global Dividend Opportunity Fund | Annual Report 2019
| 7 |
Manager Discussion of Fund Performance (continued)
update such views. These views may not be relied on as investment advice and, because investment decisions for a Columbia fund are based on numerous factors, may not be relied on as an indication of trading intent on behalf of any particular Columbia fund. References to specific securities should not be construed as a recommendation or investment advice.
| 8 | Columbia Global Dividend Opportunity Fund | Annual Report 2019 |
Understanding Your Fund’s Expenses
(Unaudited)
As an investor, you incur two types of costs. There are shareholder transaction costs, which generally include sales charges on purchases and may include redemption fees. There are also ongoing fund costs, which generally include management fees, distribution and/or service fees, and other fund expenses. The following information is intended to help you understand your ongoing costs (in dollars) of investing in the Fund and to help you compare these costs with the ongoing costs of investing in other mutual funds.
Analyzing your Fund’s expenses
To illustrate these ongoing costs, we have provided examples and calculated the expenses paid by investors in each share class of the Fund during the period. The actual and hypothetical information in the table is based on an initial investment of $1,000 at the beginning of the period indicated and held for the entire period. Expense information is calculated two ways and each method provides you with different information. The amount listed in the “Actual” column is calculated using the Fund’s actual operating expenses and total return for the period. You may use the Actual information, together with the amount invested, to estimate the expenses that you paid over the period. Simply divide your account value by $1,000 (for example, an $8,600 account value divided by $1,000 = 8.6), then multiply the results by the expenses paid during the period under the “Actual” column. The amount listed in the “Hypothetical” column assumes a 5% annual rate of return before expenses (which is not the Fund’s actual return) and then applies the Fund’s actual expense ratio for the period to the hypothetical return. You should not use the hypothetical account values and expenses to estimate either your actual account balance at the end of the period or the expenses you paid during the period. See “Compare with other funds” below for details on how to use the hypothetical data.
Compare with other funds
Since all mutual funds are required to include the same hypothetical calculations about expenses in shareholder reports, you can use this information to compare the ongoing cost of investing in the Fund with other funds. To do so, compare the hypothetical example with the 5% hypothetical examples that appear in the shareholder reports of other funds. As you compare hypothetical examples of other funds, it is important to note that hypothetical examples are meant to highlight the ongoing costs of investing in a fund only and do not reflect any transaction costs, such as sales charges, or redemption or exchange fees. Therefore, the hypothetical calculations are useful in comparing ongoing costs only, and will not help you determine the relative total costs of owning different funds. If transaction costs were included in these calculations, your costs would be higher.
| March 1, 2019 — August 31, 2019 |
| | Account value at the
beginning of the
period ($) | Account value at the
end of the
period ($) | Expenses paid during
the period ($) | Fund’s annualized
expense ratio (%) |
| | Actual | Hypothetical | Actual | Hypothetical | Actual | Hypothetical | Actual |
| Class A | 1,000.00 | 1,000.00 | 1,024.00 | 1,018.80 | 6.34 | 6.33 | 1.25 |
| Advisor Class | 1,000.00 | 1,000.00 | 1,025.60 | 1,020.05 | 5.08 | 5.06 | 1.00 |
| Class C | 1,000.00 | 1,000.00 | 1,020.50 | 1,015.04 | 10.13 | 10.10 | 2.00 |
| Institutional Class | 1,000.00 | 1,000.00 | 1,025.70 | 1,020.05 | 5.08 | 5.06 | 1.00 |
| Institutional 2 Class | 1,000.00 | 1,000.00 | 1,025.90 | 1,020.76 | 4.37 | 4.36 | 0.86 |
| Institutional 3 Class | 1,000.00 | 1,000.00 | 1,026.70 | 1,021.01 | 4.12 | 4.10 | 0.81 |
| Class R | 1,000.00 | 1,000.00 | 1,022.20 | 1,017.55 | 7.60 | 7.59 | 1.50 |
Expenses paid during the period are equal to the annualized expense ratio for each class as indicated above, multiplied by the average account value over the period and then multiplied by the number of days in the Fund’s most recent fiscal half year and divided by 365.
Expenses do not include fees and expenses incurred indirectly by the Fund from its investment in underlying funds, including affiliated and non-affiliated pooled investment vehicles, such as mutual funds and exchange-traded funds.
Had Columbia Management Investment Advisers, LLC and/or certain of its affiliates not waived/reimbursed certain fees and expenses, account value at the end of the period would have been reduced.
Columbia Global Dividend Opportunity Fund | Annual Report 2019
| 9 |
Portfolio of Investments
August 31, 2019
(Percentages represent value of investments compared to net assets)
Investments in securities
| Common Stocks 97.1% |
| Issuer | Shares | Value ($) |
| Australia 1.0% |
| Transurban Group | 498,753 | 5,020,371 |
| Austria 1.0% |
| Erste Group Bank AG | 153,025 | 4,921,971 |
| Brazil 1.2% |
| Ambev SA | 1,326,800 | 6,033,239 |
| Canada 6.3% |
| Manulife Financial Corp. | 354,709 | 5,885,175 |
| Nutrien Ltd. | 227,705 | 11,467,224 |
| Suncor Energy, Inc. | 265,920 | 7,777,471 |
| TC Energy Corp. | 102,442 | 5,249,056 |
| Total | 30,378,926 |
| China 0.5% |
| Ping An Insurance Group Co. of China Ltd., Class H | 213,500 | 2,449,488 |
| Finland 1.8% |
| Nordea Bank | 21,772 | 135,848 |
| Sampo OYJ, Class A | 217,721 | 8,650,289 |
| Total | 8,786,137 |
| France 0.8% |
| BNP Paribas SA | 85,649 | 3,860,705 |
| Germany 4.4% |
| Axel Springer SE(a) | 73,796 | 5,069,092 |
| Deutsche Telekom AG, Registered Shares | 694,468 | 11,593,892 |
| Evonik Industries AG | 183,430 | 4,689,340 |
| Total | 21,352,324 |
| Hong Kong 1.5% |
| HKT Trust & HKT Ltd. | 2,415,000 | 3,772,558 |
| Hong Kong Exchanges and Clearing Ltd. | 109,400 | 3,338,761 |
| Total | 7,111,319 |
| Indonesia 1.2% |
| PT Telekomunikasi Indonesia Persero Tbk | 18,203,100 | 5,723,268 |
| Isle of Man 0.4% |
| GVC Holdings PLC | 266,148 | 2,042,098 |
| Common Stocks (continued) |
| Issuer | Shares | Value ($) |
| Japan 3.9% |
| Bridgestone Corp. | 129,000 | 4,885,422 |
| Nintendo Co., Ltd. | 23,400 | 8,854,576 |
| Tokyo Electron Ltd. | 28,700 | 5,117,549 |
| Total | 18,857,547 |
| Jersey 1.2% |
| Amcor PLC | 601,750 | 5,860,185 |
| Netherlands 3.3% |
| Unilever NV(a) | 254,637 | 15,799,789 |
| South Korea 3.7% |
| Samsung Electronics Co., Ltd. | 492,227 | 17,921,483 |
| Spain 2.2% |
| Ferrovial SA | 366,782 | 10,439,958 |
| Switzerland 4.3% |
| Nestlé SA, Registered Shares | 14,834 | 1,666,963 |
| Novartis AG, ADR | 172,036 | 15,502,164 |
| UBS AG(a) | 330,316 | 3,507,191 |
| Total | 20,676,318 |
| Taiwan 1.8% |
| Taiwan Semiconductor Manufacturing Co., Ltd. | 1,081,000 | 8,882,177 |
| United Kingdom 13.5% |
| Anglo American PLC | 138,526 | 3,001,790 |
| BAE Systems PLC | 1,100,438 | 7,318,054 |
| British American Tobacco PLC | 216,801 | 7,605,017 |
| GlaxoSmithKline PLC | 480,778 | 10,019,110 |
| Legal & General Group PLC | 1,685,184 | 4,514,946 |
| Prudential PLC | 277,982 | 4,633,427 |
| Reckitt Benckiser Group PLC | 88,816 | 6,941,054 |
| RELX PLC | 288,870 | 6,907,171 |
| Rio Tinto PLC | 143,428 | 7,269,762 |
| Royal Dutch Shell PLC, Class A | 269,628 | 7,491,131 |
| Total | 65,701,462 |
The accompanying Notes to Financial Statements are an integral part of this statement.
| 10 | Columbia Global Dividend Opportunity Fund | Annual Report 2019 |
Portfolio of Investments (continued)
August 31, 2019
| Common Stocks (continued) |
| Issuer | Shares | Value ($) |
| United States 43.1% |
| American Electric Power Co., Inc. | 92,600 | 8,440,490 |
| BB&T Corp. | 103,104 | 4,912,906 |
| Cisco Systems, Inc. | 111,879 | 5,237,056 |
| CME Group, Inc. | 63,651 | 13,830,726 |
| Crown Castle International Corp. | 39,309 | 5,706,488 |
| Emerson Electric Co. | 107,529 | 6,407,653 |
| General Motors Co. | 197,769 | 7,335,252 |
| Gilead Sciences, Inc. | 168,369 | 10,698,166 |
| International Business Machines Corp. | 82,467 | 11,176,752 |
| Johnson & Johnson | 53,782 | 6,903,458 |
| Las Vegas Sands Corp. | 84,660 | 4,696,090 |
| Lockheed Martin Corp. | 34,188 | 13,131,953 |
| Maxim Integrated Products, Inc. | 108,341 | 5,908,918 |
| Merck & Co., Inc. | 132,809 | 11,483,994 |
| Occidental Petroleum Corp. | 69,624 | 3,027,252 |
| PepsiCo, Inc. | 119,838 | 16,385,450 |
| Pfizer, Inc. | 436,839 | 15,529,626 |
| Philip Morris International, Inc. | 112,857 | 8,135,861 |
| Procter & Gamble Co. (The) | 42,778 | 5,143,199 |
| Valero Energy Corp. | 109,676 | 8,256,409 |
| Common Stocks (continued) |
| Issuer | Shares | Value ($) |
| Verizon Communications, Inc. | 251,494 | 14,626,891 |
| Wells Fargo & Co. | 289,416 | 13,478,103 |
| Xcel Energy, Inc. | 133,307 | 8,560,976 |
| Total | 209,013,669 |
Total Common Stocks
(Cost $444,171,258) | 470,832,434 |
|
| Limited Partnerships 1.2% |
| | |
| United States 1.2% |
| Enterprise Products Partners LP | 200,271 | 5,709,726 |
Total Limited Partnerships
(Cost $4,333,744) | 5,709,726 |
|
| Money Market Funds 1.2% |
| | Shares | Value ($) |
| Columbia Short-Term Cash Fund, 2.208%(b),(c) | 6,045,551 | 6,044,947 |
Total Money Market Funds
(Cost $6,044,947) | 6,044,947 |
Total Investments in Securities
(Cost $454,549,949) | 482,587,107 |
| Other Assets & Liabilities, Net | | 2,283,869 |
| Net Assets | $484,870,976 |
Notes to Portfolio of Investments
| (a) | Non-income producing investment. |
| (b) | The rate shown is the seven-day current annualized yield at August 31, 2019. |
| (c) | As defined in the Investment Company Act of 1940, an affiliated company is one in which the Fund owns 5% or more of the company’s outstanding voting securities, or a company which is under common ownership or control with the Fund. Holdings and transactions in these affiliated companies during the year ended August 31, 2019 are as follows: |
| Issuer | Beginning
shares | Shares
purchased | Shares
sold | Ending
shares | Realized gain
(loss) —
affiliated
issuers ($) | Net change in
unrealized
appreciation
(depreciation) —
affiliated
issuers ($) | Dividends —
affiliated
issuers ($) | Value —
affiliated
issuers
at end of
period ($) |
| Columbia Short-Term Cash Fund, 2.208% |
| | 10,000,767 | 116,127,279 | (120,082,495) | 6,045,551 | 13 | — | 180,840 | 6,044,947 |
Abbreviation Legend
| ADR | American Depositary Receipt |
Fair value measurements
The Fund categorizes its fair value measurements according to a three-level hierarchy that maximizes the use of observable inputs and minimizes the use of unobservable inputs by prioritizing that the most observable input be used when available. Observable inputs are those that market participants would use in pricing an investment based on market data obtained from sources independent of the reporting entity. Unobservable inputs are those that reflect the Fund’s assumptions about the information market participants would use in
The accompanying Notes to Financial Statements are an integral part of this statement.
Columbia Global Dividend Opportunity Fund | Annual Report 2019
| 11 |
Portfolio of Investments (continued)
August 31, 2019
Fair value measurements (continued)
pricing an investment. An investment’s level within the fair value hierarchy is based on the lowest level of any input that is deemed significant to the asset’s or liability’s fair value measurement. The input levels are not necessarily an indication of the risk or liquidity associated with investments at that level. For example, certain U.S. government securities are generally high quality and liquid, however, they are reflected as Level 2 because the inputs used to determine fair value may not always be quoted prices in an active market.
Fair value inputs are summarized in the three broad levels listed below:
| ■ | Level 1 — Valuations based on quoted prices for investments in active markets that the Fund has the ability to access at the measurement date. Valuation adjustments are not applied to Level 1 investments. |
| ■ | Level 2 — Valuations based on other significant observable inputs (including quoted prices for similar securities, interest rates, prepayment speeds, credit risks, etc.). |
| ■ | Level 3 — Valuations based on significant unobservable inputs (including the Fund’s own assumptions and judgment in determining the fair value of investments). |
Inputs that are used in determining fair value of an investment may include price information, credit data, volatility statistics, and other factors. These inputs can be either observable or unobservable. The availability of observable inputs can vary between investments, and is affected by various factors such as the type of investment, and the volume and level of activity for that investment or similar investments in the marketplace. The inputs will be considered by the Investment Manager, along with any other relevant factors in the calculation of an investment’s fair value. The Fund uses prices and inputs that are current as of the measurement date, which may include periods of market dislocations. During these periods, the availability of prices and inputs may be reduced for many investments. This condition could cause an investment to be reclassified between the various levels within the hierarchy.
Foreign equity securities actively traded in markets where there is a significant delay in the local close relative to the New York Stock Exchange are classified as Level 2. The values of these securities may include an adjustment to reflect the impact of significant market movements following the close of local trading, as described in Note 2 to the financial statements – Security valuation.
Investments falling into the Level 3 category are primarily supported by quoted prices from brokers and dealers participating in the market for those investments. However, these may be classified as Level 3 investments due to lack of market transparency and corroboration to support these quoted prices. Additionally, valuation models may be used as the pricing source for any remaining investments classified as Level 3. These models may rely on one or more significant unobservable inputs and/or significant assumptions by the Investment Manager. Inputs used in valuations may include, but are not limited to, financial statement analysis, capital account balances, discount rates and estimated cash flows, and comparable company data.
Under the direction of the Fund’s Board of Trustees (the Board), the Investment Manager’s Valuation Committee (the Committee) is responsible for overseeing the valuation procedures approved by the Board. The Committee consists of voting and non-voting members from various groups within the Investment Manager’s organization, including operations and accounting, trading and investments, compliance, risk management and legal.
The Committee meets at least monthly to review and approve valuation matters, which may include a description of specific valuation determinations, data regarding pricing information received from approved pricing vendors and brokers and the results of Board-approved valuation control policies and procedures (the Policies). The Policies address, among other things, instances when market quotations are or are not readily available, including recommendations of third party pricing vendors and a determination of appropriate pricing methodologies; events that require specific valuation determinations and assessment of fair value techniques; securities with a potential for stale pricing, including those that are illiquid, restricted, or in default; and the effectiveness of third party pricing vendors, including periodic reviews of vendors. The Committee meets more frequently, as needed, to discuss additional valuation matters, which may include the need to review back-testing results, review time-sensitive information or approve related valuation actions. The Committee reports to the Board, with members of the Committee meeting with the Board at each of its regularly scheduled meetings to discuss valuation matters and actions during the period, similar to those described earlier.
The following table is a summary of the inputs used to value the Fund’s investments at August 31, 2019:
| | Level 1 ($) | Level 2 ($) | Level 3 ($) | Total ($) |
| Investments in Securities | | | | |
| Common Stocks | | | | |
| Australia | — | 5,020,371 | — | 5,020,371 |
| Austria | — | 4,921,971 | — | 4,921,971 |
| Brazil | 6,033,239 | — | — | 6,033,239 |
| Canada | 30,378,926 | — | — | 30,378,926 |
| China | — | 2,449,488 | — | 2,449,488 |
| Finland | — | 8,786,137 | — | 8,786,137 |
| France | — | 3,860,705 | — | 3,860,705 |
| Germany | — | 21,352,324 | — | 21,352,324 |
| Hong Kong | — | 7,111,319 | — | 7,111,319 |
| Indonesia | — | 5,723,268 | — | 5,723,268 |
| Isle of Man | — | 2,042,098 | — | 2,042,098 |
| Japan | — | 18,857,547 | — | 18,857,547 |
| Jersey | — | 5,860,185 | — | 5,860,185 |
| Netherlands | — | 15,799,789 | — | 15,799,789 |
| South Korea | — | 17,921,483 | — | 17,921,483 |
| Spain | — | 10,439,958 | — | 10,439,958 |
| Switzerland | 15,502,164 | 5,174,154 | — | 20,676,318 |
| Taiwan | — | 8,882,177 | — | 8,882,177 |
The accompanying Notes to Financial Statements are an integral part of this statement.
| 12 | Columbia Global Dividend Opportunity Fund | Annual Report 2019 |
Portfolio of Investments (continued)
August 31, 2019
Fair value measurements (continued)
| | Level 1 ($) | Level 2 ($) | Level 3 ($) | Total ($) |
| United Kingdom | — | 65,701,462 | — | 65,701,462 |
| United States | 209,013,669 | — | — | 209,013,669 |
| Total Common Stocks | 260,927,998 | 209,904,436 | — | 470,832,434 |
| Limited Partnerships | | | | |
| United States | 5,709,726 | — | — | 5,709,726 |
| Total Limited Partnerships | 5,709,726 | — | — | 5,709,726 |
| Money Market Funds | 6,044,947 | — | — | 6,044,947 |
| Total Investments in Securities | 272,682,671 | 209,904,436 | — | 482,587,107 |
See the Portfolio of Investments for all investment classifications not indicated in the table.
The Fund’s assets assigned to the Level 2 input category are generally valued using the market approach, in which a security’s value is determined through reference to prices and information from market transactions for similar or identical assets. These assets include certain foreign securities for which a third party statistical pricing service may be employed for purposes of fair market valuation. The model utilized by such third party statistical pricing service takes into account a security’s correlation to available market data including, but not limited to, intraday index, ADR, and exchange-traded fund movements.
The following table is a reconciliation of Level 3 assets for which significant observable and unobservable inputs were used to determine fair value:
| | Balance
as of
08/31/2018
($) | Increase
(decrease)
in accrued
discounts/
premiums
($) | Realized
gain (loss)
($) | Change
in unrealized
appreciation
(depreciation)
($) | Purchases
($) | Sales
($) | Transfers
into
Level 3
($) | Transfers
out of
Level 3
($) | Balance
as of
08/31/2019
($) |
| Common Stocks | 6,269,975 | — | — | — | — | — | — | (6,269,975) | — |
Financial assets were transferred from Level 3 to Level 2 as observable market inputs were utilized and management determined that there was sufficient, reliable and observable market data to value these assets as of period end.
The accompanying Notes to Financial Statements are an integral part of this statement.
Columbia Global Dividend Opportunity Fund | Annual Report 2019
| 13 |
Statement of Assets and Liabilities
August 31, 2019
| Assets | |
| Investments in securities, at value | |
| Unaffiliated issuers (cost $448,505,002) | $476,542,160 |
| Affiliated issuers (cost $6,044,947) | 6,044,947 |
| Receivable for: | |
| Capital shares sold | 19,671 |
| Dividends | 2,171,435 |
| Foreign tax reclaims | 449,218 |
| Expense reimbursement due from Investment Manager | 761 |
| Prepaid expenses | 3,259 |
| Trustees’ deferred compensation plan | 199,643 |
| Total assets | 485,431,094 |
| Liabilities | |
| Payable for: | |
| Capital shares purchased | 213,195 |
| Foreign capital gains taxes deferred | 1 |
| Management services fees | 10,205 |
| Distribution and/or service fees | 588 |
| Transfer agent fees | 44,035 |
| Compensation of chief compliance officer | 33 |
| Custodian fees | 47,574 |
| Other expenses | 44,844 |
| Trustees’ deferred compensation plan | 199,643 |
| Total liabilities | 560,118 |
| Net assets applicable to outstanding capital stock | $484,870,976 |
| Represented by | |
| Paid in capital | 451,476,027 |
| Total distributable earnings (loss) (Note 2) | 33,394,949 |
| Total - representing net assets applicable to outstanding capital stock | $484,870,976 |
The accompanying Notes to Financial Statements are an integral part of this statement.
| 14 | Columbia Global Dividend Opportunity Fund | Annual Report 2019 |
Statement of Assets and Liabilities (continued)
August 31, 2019
| Class A | |
| Net assets | $78,887,314 |
| Shares outstanding | 4,411,459 |
| Net asset value per share | $17.88 |
| Maximum sales charge | 5.75% |
| Maximum offering price per share (calculated by dividing the net asset value per share by 1.0 minus the maximum sales charge for Class A shares) | $18.97 |
| Advisor Class | |
| Net assets | $1,026,939 |
| Shares outstanding | 56,925 |
| Net asset value per share | $18.04 |
| Class C | |
| Net assets | $1,745,371 |
| Shares outstanding | 104,524 |
| Net asset value per share | $16.70 |
| Institutional Class | |
| Net assets | $354,127,357 |
| Shares outstanding | 19,729,859 |
| Net asset value per share | $17.95 |
| Institutional 2 Class | |
| Net assets | $1,337,190 |
| Shares outstanding | 74,692 |
| Net asset value per share | $17.90 |
| Institutional 3 Class | |
| Net assets | $47,630,052 |
| Shares outstanding | 2,655,277 |
| Net asset value per share | $17.94 |
| Class R | |
| Net assets | $116,753 |
| Shares outstanding | 6,540 |
| Net asset value per share | $17.85 |
The accompanying Notes to Financial Statements are an integral part of this statement.
Columbia Global Dividend Opportunity Fund | Annual Report 2019
| 15 |
Statement of Operations
Year Ended August 31, 2019
| Net investment income | |
| Income: | |
| Dividends — unaffiliated issuers | $20,085,015 |
| Dividends — affiliated issuers | 180,840 |
| Interfund lending | 76 |
| Foreign taxes withheld | (931,005) |
| Total income | 19,334,926 |
| Expenses: | |
| Management services fees | 3,905,665 |
| Distribution and/or service fees | |
| Class A | 208,667 |
| Class C | 24,242 |
| Class R | 4,256 |
| Class T | 1 |
| Transfer agent fees | |
| Class A | 290,126 |
| Advisor Class | 3,569 |
| Class C | 8,497 |
| Institutional Class | 1,267,408 |
| Institutional 2 Class | 540 |
| Institutional 3 Class | 4,062 |
| Class R | 3,082 |
| Class T | 2 |
| Compensation of board members | 21,025 |
| Custodian fees | 72,173 |
| Printing and postage fees | 77,501 |
| Registration fees | 100,086 |
| Audit fees | 54,874 |
| Legal fees | 10,361 |
| Compensation of chief compliance officer | 200 |
| Other | 25,125 |
| Total expenses | 6,081,462 |
| Fees waived or expenses reimbursed by Investment Manager and its affiliates | (869,672) |
| Total net expenses | 5,211,790 |
| Net investment income | 14,123,136 |
| Realized and unrealized gain (loss) — net | |
| Net realized gain (loss) on: | |
| Investments — unaffiliated issuers | 5,544,214 |
| Investments — affiliated issuers | 13 |
| Foreign currency translations | (76,807) |
| Net realized gain | 5,467,420 |
| Net change in unrealized appreciation (depreciation) on: | |
| Investments — unaffiliated issuers | (21,071,840) |
| Foreign currency translations | (34,365) |
| Foreign capital gains tax | (1) |
| Net change in unrealized appreciation (depreciation) | (21,106,206) |
| Net realized and unrealized loss | (15,638,786) |
| Net decrease in net assets resulting from operations | $(1,515,650) |
The accompanying Notes to Financial Statements are an integral part of this statement.
| 16 | Columbia Global Dividend Opportunity Fund | Annual Report 2019 |
Statement of Changes in Net Assets
| | Year Ended
August 31, 2019 | Year Ended
August 31, 2018 |
| Operations | | |
| Net investment income | $14,123,136 | $16,259,303 |
| Net realized gain | 5,467,420 | 25,852,333 |
| Net change in unrealized appreciation (depreciation) | (21,106,206) | (4,000,961) |
| Net increase (decrease) in net assets resulting from operations | (1,515,650) | 38,110,675 |
| Distributions to shareholders | | |
| Net investment income and net realized gains | | |
| Class A | (4,106,392) | |
| Advisor Class | (49,857) | |
| Class C | (109,117) | |
| Institutional Class | (18,590,879) | |
| Institutional 2 Class | (35,286) | |
| Institutional 3 Class | (3,062,005) | |
| Class R | (55,785) | |
| Class T | (16) | |
| Net investment income | | |
| Class A | | (2,790,164) |
| Advisor Class | | (32,632) |
| Class C | | (164,543) |
| Institutional Class | | (12,899,186) |
| Institutional 2 Class | | (16,467) |
| Institutional 3 Class | | (2,123,203) |
| Class R | | (46,263) |
| Class T | | (64) |
| Total distributions to shareholders (Note 2) | (26,009,337) | (18,072,522) |
| Decrease in net assets from capital stock activity | (45,761,542) | (55,488,120) |
| Total decrease in net assets | (73,286,529) | (35,449,967) |
| Net assets at beginning of year | 558,157,505 | 593,607,472 |
| Net assets at end of year | $484,870,976 | $558,157,505 |
| Undistributed net investment income | $3,160,791 | $4,845,224 |
The accompanying Notes to Financial Statements are an integral part of this statement.
Columbia Global Dividend Opportunity Fund | Annual Report 2019
| 17 |
Statement of Changes in Net Assets (continued)
| | Year Ended | Year Ended |
| | August 31, 2019 | August 31, 2018 |
| | Shares | Dollars ($) | Shares | Dollars ($) |
| Capital stock activity |
| Class A | | | | |
| Subscriptions | 111,509 | 1,971,268 | 301,751 | 5,672,608 |
| Distributions reinvested | 219,091 | 3,734,517 | 134,471 | 2,538,124 |
| Redemptions | (867,654) | (15,385,037) | (979,090) | (18,745,306) |
| Net decrease | (537,054) | (9,679,252) | (542,868) | (10,534,574) |
| Advisor Class | | | | |
| Subscriptions | 7,898 | 138,814 | 11,591 | 224,578 |
| Distributions reinvested | 2,878 | 49,746 | 1,714 | 32,560 |
| Redemptions | (13,940) | (250,895) | (6,662) | (126,921) |
| Net increase (decrease) | (3,164) | (62,335) | 6,643 | 130,217 |
| Class C | | | | |
| Subscriptions | 10,742 | 179,331 | 11,582 | 206,921 |
| Distributions reinvested | 6,444 | 102,281 | 8,968 | 159,104 |
| Redemptions | (98,038) | (1,620,218) | (291,033) | (5,111,690) |
| Net decrease | (80,852) | (1,338,606) | (270,483) | (4,745,665) |
| Institutional Class | | | | |
| Subscriptions | 290,985 | 5,174,112 | 361,156 | 6,897,051 |
| Distributions reinvested | 1,058,880 | 18,141,803 | 663,386 | 12,552,315 |
| Redemptions | (2,531,926) | (45,149,225) | (2,937,324) | (55,959,813) |
| Net decrease | (1,182,061) | (21,833,310) | (1,912,782) | (36,510,447) |
| Institutional 2 Class | | | | |
| Subscriptions | 48,563 | 876,720 | 3,423 | 64,093 |
| Distributions reinvested | 2,040 | 35,172 | 869 | 16,393 |
| Redemptions | (5,231) | (94,111) | (2,700) | (50,958) |
| Net increase | 45,372 | 817,781 | 1,592 | 29,528 |
| Institutional 3 Class | | | | |
| Subscriptions | 392,600 | 6,962,056 | 103,378 | 1,981,411 |
| Distributions reinvested | 179,538 | 3,061,275 | 112,334 | 2,123,127 |
| Redemptions | (1,260,542) | (22,199,948) | (410,212) | (7,848,185) |
| Net decrease | (688,404) | (12,176,617) | (194,500) | (3,743,647) |
| Class R | | | | |
| Subscriptions | 3,116 | 57,102 | 2,429 | 45,845 |
| Distributions reinvested | 3,343 | 55,785 | 2,452 | 46,263 |
| Redemptions | (90,619) | (1,600,082) | (10,460) | (205,640) |
| Net decrease | (84,160) | (1,487,195) | (5,579) | (113,532) |
| Class T | | | | |
| Redemptions | (119) | (2,008) | — | — |
| Net decrease | (119) | (2,008) | — | — |
| Total net decrease | (2,530,442) | (45,761,542) | (2,917,977) | (55,488,120) |
The accompanying Notes to Financial Statements are an integral part of this statement.
| 18 | Columbia Global Dividend Opportunity Fund | Annual Report 2019 |
[THIS PAGE INTENTIONALLY LEFT BLANK]
Columbia Global Dividend Opportunity Fund | Annual Report 2019
| 19 |
The following table is intended to help you understand the Fund’s financial performance. Certain information reflects financial results for a single share of a class held for the periods shown. Per share net investment income (loss) amounts are calculated based on average shares outstanding during the period. Total return assumes reinvestment of all dividends and distributions, if any. Total return does not reflect payment of sales charges, if any. Total return and portfolio turnover are not annualized for periods of less than one year. The portfolio turnover rate is calculated without regard to purchase and sales transactions of short-term instruments and certain derivatives, if any. If such transactions were included, the Fund’s portfolio turnover rate may be higher.
| | Net asset value,
beginning of
period | Net
investment
income | Net
realized
and
unrealized
gain (loss) | Total from
investment
operations | Distributions
from net
investment
income | Distributions
from net
realized
gains | Total
distributions to
shareholders |
| Class A |
| Year Ended 8/31/2019 | $18.83 | 0.45 | (0.54) | (0.09) | (0.49) | (0.37) | (0.86) |
| Year Ended 8/31/2018 | $18.24 | 0.48 | 0.65 | 1.13 | (0.54) | — | (0.54) |
| Year Ended 8/31/2017 | $17.05 | 0.49 | 1.26 | 1.75 | (0.56) | — | (0.56) |
| Year Ended 8/31/2016 | $16.56 | 0.47 | 0.42 | 0.89 | (0.40) | — | (0.40) |
| Year Ended 8/31/2015 | $21.63 | 0.58 | (2.93) | (2.35) | (0.70) | (2.02) | (2.72) |
| Advisor Class |
| Year Ended 8/31/2019 | $18.99 | 0.51 | (0.55) | (0.04) | (0.54) | (0.37) | (0.91) |
| Year Ended 8/31/2018 | $18.39 | 0.54 | 0.64 | 1.18 | (0.58) | — | (0.58) |
| Year Ended 8/31/2017 | $17.19 | 0.54 | 1.26 | 1.80 | (0.60) | — | (0.60) |
| Year Ended 8/31/2016 | $16.69 | 0.52 | 0.43 | 0.95 | (0.45) | — | (0.45) |
| Year Ended 8/31/2015 | $21.78 | 0.67 | (2.99) | (2.32) | (0.75) | (2.02) | (2.77) |
| Class C |
| Year Ended 8/31/2019 | $17.63 | 0.29 | (0.49) | (0.20) | (0.36) | (0.37) | (0.73) |
| Year Ended 8/31/2018 | $17.10 | 0.31 | 0.62 | 0.93 | (0.40) | — | (0.40) |
| Year Ended 8/31/2017 | $16.02 | 0.33 | 1.18 | 1.51 | (0.43) | — | (0.43) |
| Year Ended 8/31/2016 | $15.56 | 0.32 | 0.42 | 0.74 | (0.28) | — | (0.28) |
| Year Ended 8/31/2015 | $20.49 | 0.41 | (2.77) | (2.36) | (0.55) | (2.02) | (2.57) |
| Institutional Class |
| Year Ended 8/31/2019 | $18.90 | 0.50 | (0.54) | (0.04) | (0.54) | (0.37) | (0.91) |
| Year Ended 8/31/2018 | $18.30 | 0.53 | 0.65 | 1.18 | (0.58) | — | (0.58) |
| Year Ended 8/31/2017 | $17.11 | 0.54 | 1.25 | 1.79 | (0.60) | — | (0.60) |
| Year Ended 8/31/2016 | $16.61 | 0.51 | 0.43 | 0.94 | (0.44) | — | (0.44) |
| Year Ended 8/31/2015 | $21.69 | 0.63 | (2.94) | (2.31) | (0.75) | (2.02) | (2.77) |
| Institutional 2 Class |
| Year Ended 8/31/2019 | $18.85 | 0.56 | (0.58) | (0.02) | (0.56) | (0.37) | (0.93) |
| Year Ended 8/31/2018 | $18.26 | 0.56 | 0.64 | 1.20 | (0.61) | — | (0.61) |
| Year Ended 8/31/2017 | $17.07 | 0.60 | 1.22 | 1.82 | (0.63) | — | (0.63) |
| Year Ended 8/31/2016 | $16.58 | 0.54 | 0.42 | 0.96 | (0.47) | — | (0.47) |
| Year Ended 8/31/2015 | $21.66 | 0.64 | (2.92) | (2.28) | (0.78) | (2.02) | (2.80) |
The accompanying Notes to Financial Statements are an integral part of this statement.
| 20 | Columbia Global Dividend Opportunity Fund | Annual Report 2019 |
Financial Highlights (continued)
| | Net
asset
value,
end of
period | Total
return | Total gross
expense
ratio to
average
net assets(a) | Total net
expense
ratio to
average
net assets(a),(b) | Net investment
income
ratio to
average
net assets | Portfolio
turnover | Net
assets,
end of
period
(000’s) |
| Class A |
| Year Ended 8/31/2019 | $17.88 | (0.16%) | 1.44% | 1.25% | 2.56% | 56% | $78,887 |
| Year Ended 8/31/2018 | $18.83 | 6.21% | 1.44% | 1.26%(c) | 2.52% | 39% | $93,177 |
| Year Ended 8/31/2017 | $18.24 | 10.48% | 1.46%(d) | 1.29%(c),(d) | 2.79% | 43% | $100,146 |
| Year Ended 8/31/2016 | $17.05 | 5.51% | 1.45% | 1.30%(c) | 2.85% | 115% | $108,978 |
| Year Ended 8/31/2015 | $16.56 | (11.49%) | 1.38% | 1.31%(c) | 3.05% | 63% | $118,275 |
| Advisor Class |
| Year Ended 8/31/2019 | $18.04 | 0.10% | 1.19% | 1.00% | 2.84% | 56% | $1,027 |
| Year Ended 8/31/2018 | $18.99 | 6.47% | 1.19% | 1.01%(c) | 2.82% | 39% | $1,141 |
| Year Ended 8/31/2017 | $18.39 | 10.73% | 1.21%(d) | 1.04%(c),(d) | 3.08% | 43% | $983 |
| Year Ended 8/31/2016 | $17.19 | 5.80% | 1.20% | 1.05%(c) | 3.12% | 115% | $853 |
| Year Ended 8/31/2015 | $16.69 | (11.27%) | 1.16% | 1.04%(c) | 3.68% | 63% | $782 |
| Class C |
| Year Ended 8/31/2019 | $16.70 | (0.86%) | 2.19% | 2.00% | 1.72% | 56% | $1,745 |
| Year Ended 8/31/2018 | $17.63 | 5.42% | 2.19% | 2.01%(c) | 1.76% | 39% | $3,268 |
| Year Ended 8/31/2017 | $17.10 | 9.60% | 2.20%(d) | 2.04%(c),(d) | 2.03% | 43% | $7,795 |
| Year Ended 8/31/2016 | $16.02 | 4.82% | 2.20% | 2.05%(c) | 2.07% | 115% | $10,164 |
| Year Ended 8/31/2015 | $15.56 | (12.18%) | 2.13% | 2.06%(c) | 2.30% | 63% | $12,440 |
| Institutional Class |
| Year Ended 8/31/2019 | $17.95 | 0.10% | 1.19% | 1.00% | 2.83% | 56% | $354,127 |
| Year Ended 8/31/2018 | $18.90 | 6.51% | 1.19% | 1.01%(c) | 2.78% | 39% | $395,163 |
| Year Ended 8/31/2017 | $18.30 | 10.72% | 1.21%(d) | 1.04%(c),(d) | 3.06% | 43% | $417,705 |
| Year Ended 8/31/2016 | $17.11 | 5.82% | 1.20% | 1.05%(c) | 3.10% | 115% | $424,724 |
| Year Ended 8/31/2015 | $16.61 | (11.28%) | 1.13% | 1.06%(c) | 3.30% | 63% | $457,640 |
| Institutional 2 Class |
| Year Ended 8/31/2019 | $17.90 | 0.23% | 0.91% | 0.87% | 3.13% | 56% | $1,337 |
| Year Ended 8/31/2018 | $18.85 | 6.62% | 0.91% | 0.88% | 2.93% | 39% | $553 |
| Year Ended 8/31/2017 | $18.26 | 10.92% | 0.91% | 0.91% | 3.37% | 43% | $506 |
| Year Ended 8/31/2016 | $17.07 | 5.96% | 0.88% | 0.88% | 3.26% | 115% | $175 |
| Year Ended 8/31/2015 | $16.58 | (11.13%) | 0.87% | 0.87% | 3.52% | 63% | $178 |
The accompanying Notes to Financial Statements are an integral part of this statement.
Columbia Global Dividend Opportunity Fund | Annual Report 2019
| 21 |
Financial Highlights (continued)
| | Net asset value,
beginning of
period | Net
investment
income | Net
realized
and
unrealized
gain (loss) | Total from
investment
operations | Distributions
from net
investment
income | Distributions
from net
realized
gains | Total
distributions to
shareholders |
| Institutional 3 Class |
| Year Ended 8/31/2019 | $18.89 | 0.51 | (0.52) | (0.01) | (0.57) | (0.37) | (0.94) |
| Year Ended 8/31/2018 | $18.29 | 0.57 | 0.65 | 1.22 | (0.62) | — | (0.62) |
| Year Ended 8/31/2017 | $17.10 | 0.68 | 1.15 | 1.83 | (0.64) | — | (0.64) |
| Year Ended 8/31/2016 | $16.60 | 0.53 | 0.45 | 0.98 | (0.48) | — | (0.48) |
| Year Ended 8/31/2015 | $21.68 | 0.70 | (2.96) | (2.26) | (0.80) | (2.02) | (2.82) |
| Class R |
| Year Ended 8/31/2019 | $18.80 | 0.25 | (0.38) | (0.13) | (0.45) | (0.37) | (0.82) |
| Year Ended 8/31/2018 | $18.21 | 0.43 | 0.65 | 1.08 | (0.49) | — | (0.49) |
| Year Ended 8/31/2017 | $17.03 | 0.45 | 1.24 | 1.69 | (0.51) | — | (0.51) |
| Year Ended 8/31/2016 | $16.53 | 0.42 | 0.44 | 0.86 | (0.36) | — | (0.36) |
| Year Ended 8/31/2015 | $21.61 | 0.53 | (2.94) | (2.41) | (0.65) | (2.02) | (2.67) |
| Notes to Financial Highlights |
| (a) | In addition to the fees and expenses that the Fund bears directly, the Fund indirectly bears a pro rata share of the fees and expenses of any other funds in which it invests. Such indirect expenses are not included in the Fund’s reported expense ratios. |
| (b) | Total net expenses include the impact of certain fee waivers/expense reimbursements made by the Investment Manager and certain of its affiliates, if applicable. |
| (c) | The benefits derived from expense reductions had an impact of: |
| Class | 8/31/2019 | 8/31/2018 | 8/31/2017 | 8/31/2016 | 8/31/2015 |
| Class A | —% | 0.01% | 0.02% | 0.01% | 0.01% |
| Advisor Class | —% | 0.02% | 0.02% | 0.01% | 0.02% |
| Class C | —% | 0.02% | 0.02% | 0.01% | 0.01% |
| Institutional Class | —% | 0.02% | 0.02% | 0.01% | 0.01% |
| Class R | —% | 0.01% | 0.02% | 0.01% | 0.01% |
| (d) | Expenses have been reduced due to a reimbursement of expenses overbilled by a third party. If the reimbursement had been excluded, the expense ratios would have been higher by the percentages shown for each class in the table below. All fee waivers and expense reimbursements by the Investment Manager and its affiliates were applied before giving effect to this third party reimbursement. |
| Year Ended | Class A | Advisor
Class | Class C | Institutional
Class | Class R |
| 08/31/2017 | 0.01% | 0.01% | 0.01% | 0.01% | 0.01% |
The accompanying Notes to Financial Statements are an integral part of this statement.
| 22 | Columbia Global Dividend Opportunity Fund | Annual Report 2019 |
Financial Highlights (continued)
| | Net
asset
value,
end of
period | Total
return | Total gross
expense
ratio to
average
net assets(a) | Total net
expense
ratio to
average
net assets(a),(b) | Net investment
income
ratio to
average
net assets | Portfolio
turnover | Net
assets,
end of
period
(000’s) |
| Institutional 3 Class |
| Year Ended 8/31/2019 | $17.94 | 0.29% | 0.85% | 0.81% | 2.87% | 56% | $47,630 |
| Year Ended 8/31/2018 | $18.89 | 6.72% | 0.85% | 0.82% | 2.98% | 39% | $63,148 |
| Year Ended 8/31/2017 | $18.29 | 10.95% | 0.85% | 0.85% | 3.77% | 43% | $64,718 |
| Year Ended 8/31/2016 | $17.10 | 6.07% | 0.83% | 0.83% | 3.23% | 115% | $790 |
| Year Ended 8/31/2015 | $16.60 | (11.04%) | 0.82% | 0.82% | 3.89% | 63% | $1,149 |
| Class R |
| Year Ended 8/31/2019 | $17.85 | (0.41%) | 1.70% | 1.50% | 1.41% | 56% | $117 |
| Year Ended 8/31/2018 | $18.80 | 5.95% | 1.69% | 1.51%(c) | 2.27% | 39% | $1,705 |
| Year Ended 8/31/2017 | $18.21 | 10.16% | 1.71%(d) | 1.54%(c),(d) | 2.57% | 43% | $1,753 |
| Year Ended 8/31/2016 | $17.03 | 5.32% | 1.70% | 1.55%(c) | 2.57% | 115% | $1,533 |
| Year Ended 8/31/2015 | $16.53 | (11.78%) | 1.62% | 1.55%(c) | 2.77% | 63% | $671 |
The accompanying Notes to Financial Statements are an integral part of this statement.
Columbia Global Dividend Opportunity Fund | Annual Report 2019
| 23 |
Notes to Financial Statements
August 31, 2019
Note 1. Organization
Columbia Global Dividend Opportunity Fund (the Fund), a series of Columbia Funds Series Trust I (the Trust), is a diversified fund. The Trust is registered under the Investment Company Act of 1940, as amended (the 1940 Act), as an open-end management investment company organized as a Massachusetts business trust.
Fund shares
The Trust may issue an unlimited number of shares (without par value). The Fund offers each of the share classes listed in the Statement of Assets and Liabilities. Although all share classes generally have identical voting, dividend and liquidation rights, each share class votes separately when required by the Trust’s organizational documents or by law. Each share class has its own expense and sales charge structure. Different share classes may have different minimum initial investment amounts and pay different distribution amounts to the extent the expenses of distributing such share classes vary. Distributions to shareholders in a liquidation will be proportional to the net asset value of each share class.
As described in the Fund’s prospectus, Class A and Class C shares are offered to the general public for investment. Advisor Class, Institutional Class, Institutional 2 Class, Institutional 3 Class and Class R shares are available for purchase through authorized investment professionals to omnibus retirement plans or to institutional and to certain other investors as also described in the Fund’s prospectus. Class C shares automatically convert to Class A shares after 10 years. Effective December 14, 2018, Class T shares merged, in a tax-free transaction, into Class A shares of the Fund and are no longer offered for sale.
Note 2. Summary of significant accounting policies
Basis of preparation
The Fund is an investment company that applies the accounting and reporting guidance in the Financial Accounting Standards Board (FASB) Accounting Standards Codification Topic 946,Financial Services - Investment Companies (ASC 946). The financial statements are prepared in accordance with U.S. generally accepted accounting principles (GAAP), which requires management to make certain estimates and assumptions that affect the reported amounts of assets and liabilities, the disclosure of contingent assets and liabilities at the date of the financial statements and the reported amounts of income and expenses during the reporting period. Actual results could differ from those estimates.
The following is a summary of significant accounting policies followed by the Fund in the preparation of its financial statements.
Security valuation
All equity securities are valued at the close of business of the New York Stock Exchange. Equity securities are valued at the official closing price on the principal exchange or market on which they trade. Unlisted securities or listed securities for which there were no sales during the day are valued at the mean of the latest quoted bid and ask prices on such exchanges or markets.
Foreign equity securities are valued based on the closing price on the foreign exchange in which such securities are primarily traded. If any foreign equity security closing prices are not readily available, the securities are valued at the mean of the latest quoted bid and ask prices on such exchanges or markets. Foreign currency exchange rates are determined at the scheduled closing time of the New York Stock Exchange. Many securities markets and exchanges outside the U.S. close prior to the close of the New York Stock Exchange; therefore, the closing prices for securities in such markets or on such exchanges may not fully reflect events that occur after such close but before the close of the New York Stock Exchange. In those situations, foreign securities will be fair valued pursuant to a policy adopted by the Board of Trustees. Under the policy, the Fund may utilize a third party pricing service to determine these fair values. The third-party pricing service takes into account multiple factors, including, but not limited to, movements in the U.S. securities markets, certain depositary receipts, futures contracts and foreign exchange rates that have occurred subsequent to the close of the foreign exchange or market, to determine a good faith estimate that reasonably reflects the current market conditions as of the close of the New York Stock Exchange. The fair value of a security is likely to be different from the quoted or published price, if available.
Investments in open-end investment companies, including money market funds, are valued at their latest net asset value.
| 24 | Columbia Global Dividend Opportunity Fund | Annual Report 2019 |
Notes to Financial Statements (continued)
August 31, 2019
Investments for which market quotations are not readily available, or that have quotations which management believes are not reflective of market value or reliable, are valued at fair value as determined in good faith under procedures approved by and under the general supervision of the Board of Trustees. If a security or class of securities (such as foreign securities) is valued at fair value, such value is likely to be different from the quoted or published price for the security.
The determination of fair value often requires significant judgment. To determine fair value, management may use assumptions including but not limited to future cash flows and estimated risk premiums. Multiple inputs from various sources may be used to determine fair value.
GAAP requires disclosure regarding the inputs and valuation techniques used to measure fair value and any changes in valuation inputs or techniques. In addition, investments shall be disclosed by major category. This information is disclosed following the Fund’s Portfolio of Investments.
Foreign currency transactions and translations
The values of all assets and liabilities denominated in foreign currencies are generally translated into U.S. dollars at exchange rates determined at the close of regular trading on the New York Stock Exchange. Net realized and unrealized gains (losses) on foreign currency transactions and translations include gains (losses) arising from the fluctuation in exchange rates between trade and settlement dates on securities transactions, gains (losses) arising from the disposition of foreign currency and currency gains (losses) between the accrual and payment dates on dividends, interest income and foreign withholding taxes.
For financial statement purposes, the Fund does not distinguish that portion of gains (losses) on investments which is due to changes in foreign exchange rates from that which is due to changes in market prices of the investments. Such fluctuations are included with the net realized and unrealized gains (losses) on investments in the Statement of Operations.
Security transactions
Security transactions are accounted for on the trade date. Cost is determined and gains (losses) are based upon the specific identification method for both financial statement and federal income tax purposes.
Income recognition
Corporate actions and dividend income are generally recorded net of any non-reclaimable tax withholdings, on the ex-dividend date or upon receipt of ex-dividend notification in the case of certain foreign securities.
The Fund may receive distributions from holdings in equity securities, business development companies (BDCs), exchange-traded funds (ETFs), limited partnerships (LPs), other regulated investment companies (RICs), and real estate investment trusts (REITs), which report information on the tax character of their distributions annually. These distributions are allocated to dividend income, capital gain and return of capital based on actual information reported. Return of capital is recorded as a reduction of the cost basis of securities held. If the Fund no longer owns the applicable securities, return of capital is recorded as a realized gain. With respect to REITs, to the extent actual information has not yet been reported, estimates for return of capital are made by the Fund’s management. Management’s estimates are subsequently adjusted when the actual character of the distributions is disclosed by the REITs, which could result in a proportionate change in return of capital to shareholders.
Awards from class action litigation are recorded as a reduction of cost basis if the Fund still owns the applicable securities on the payment date. If the Fund no longer owns the applicable securities, the proceeds are recorded as realized gains.
Expenses
General expenses of the Trust are allocated to the Fund and other funds of the Trust based upon relative net assets or other expense allocation methodologies determined by the nature of the expense. Expenses directly attributable to the Fund are charged to the Fund. Expenses directly attributable to a specific class of shares are charged to that share class.
Columbia Global Dividend Opportunity Fund | Annual Report 2019
| 25 |
Notes to Financial Statements (continued)
August 31, 2019
Determination of class net asset value
All income, expenses (other than class-specific expenses, which are charged to that share class, as shown in the Statement of Operations) and realized and unrealized gains (losses) are allocated to each class of the Fund on a daily basis, based on the relative net assets of each class, for purposes of determining the net asset value of each class.
Federal income tax status
The Fund intends to qualify each year as a regulated investment company under Subchapter M of the Internal Revenue Code, as amended, and will distribute substantially all of its investment company taxable income and net capital gain, if any, for its tax year, and as such will not be subject to federal income taxes. In addition, the Fund intends to distribute in each calendar year substantially all of its ordinary income, capital gain net income and certain other amounts, if any, such that the Fund should not be subject to federal excise tax. Therefore, no federal income or excise tax provision is recorded.
Foreign taxes
The Fund may be subject to foreign taxes on income, gains on investments or currency repatriation, a portion of which may be recoverable. The Fund will accrue such taxes and recoveries, as applicable, based upon its current interpretation of tax rules and regulations that exist in the markets in which it invests.
Realized gains in certain countries may be subject to foreign taxes at the Fund level, based on statutory rates. The Fund accrues for such foreign taxes on realized and unrealized gains at the appropriate rate for each jurisdiction, as applicable. The amount, if any, is disclosed as a liability on the Statement of Assets and Liabilities.
Distributions to shareholders
Distributions from net investment income, if any, are declared and paid each calendar quarter. Net realized capital gains, if any, are distributed at least annually. Income distributions and capital gain distributions are determined in accordance with federal income tax regulations, which may differ from GAAP.
Guarantees and indemnifications
Under the Trust’s organizational documents and, in some cases, by contract, its officers and trustees are indemnified against certain liabilities arising out of the performance of their duties to the Trust or its funds. In addition, certain of the Fund’s contracts with its service providers contain general indemnification clauses. The Fund’s maximum exposure under these arrangements is unknown since the amount of any future claims that may be made against the Fund cannot be determined, and the Fund has no historical basis for predicting the likelihood of any such claims.
Recent accounting pronouncements
Accounting Standards Update 2017-08 Premium Amortization on Purchased Callable Debt Securities
In March 2017, the Financial Accounting Standards Board issued Accounting Standards Update (ASU) No. 2017-08 Premium Amortization on Purchased Callable Debt Securities. ASU No. 2017-08 updates the accounting standards to shorten the amortization period for certain purchased callable debt securities, held at a premium, to be amortized to the earliest call date. The update applies to securities with explicit, noncontingent call features that are callable at fixed prices and on preset dates. The standard is effective for annual periods beginning after December 15, 2018 and interim periods within those fiscal years. Management does not expect the implementation of this guidance to have a material impact on the financial statement amounts and footnote disclosures.
Accounting Standards Update 2018-13 Disclosure Framework - Changes to the Disclosure Requirements for Fair Value Measurement
In August 2018, the Financial Accounting Standards Board issued Accounting Standards Update (ASU) No. 2018-13 Disclosure Framework - Changes to the Disclosure Requirements for Fair Value Measurement. The standard is effective for annual periods beginning after December 15, 2019 and interim periods within those fiscal years, with early adoption permitted. After evaluation, management determined to adopt the ASU effective for the period ended August 31, 2019 and all subsequent periods. As a result of the amendments, management implemented disclosure changes which include removal
| 26 | Columbia Global Dividend Opportunity Fund | Annual Report 2019 |
Notes to Financial Statements (continued)
August 31, 2019
of the amount and reasons for transfers between Level 1 and Level 2 of the fair value hierarchy, removal of the policy for the timing of transfers between levels, removal of the description of the Level 3 valuation processes, as well as modifications to the measurement uncertainty disclosure.
Disclosure Update and Simplification
In September 2018, the Securities and Exchange Commission (SEC) released Final Rule 33-10532, Disclosure Update and Simplification, which amends certain financial statement disclosure requirements that the SEC determined to be redundant, outdated, or superseded in light of other SEC disclosure requirements, GAAP, or changes in the information environment. As a result of the amendments, management implemented disclosure changes which included removing the components of distributable earnings presented on the Statement of Assets and Liabilities and combining income and gain distributions paid to shareholders as presented on the Statement of Changes in Net Assets. Any values presented to meet prior year requirements were left unchanged. The amendments had no effect on the Fund’s net assets or results of operation.
Note 3. Fees and other transactions with affiliates
Management services fees
The Fund has entered into a Management Agreement with Columbia Management Investment Advisers, LLC (the Investment Manager), a wholly-owned subsidiary of Ameriprise Financial, Inc. (Ameriprise Financial). Under the Management Agreement, the Investment Manager provides the Fund with investment research and advice, as well as administrative and accounting services. The management services fee is an annual fee that is equal to a percentage of the Fund’s daily net assets that declines from 0.77% to 0.57% as the Fund’s net assets increase. The effective management services fee rate for the year ended August 31, 2019 was 0.77% of the Fund’s average daily net assets.
Participating Affiliates
The Investment Manager and its investment advisory affiliates (Participating Affiliates) around the world may coordinate in providing services to their clients. From time to time the Investment Manager (or any affiliated investment subadviser to the Fund, as the case may be) may engage its Participating Affiliates to provide a variety of services such as investment research, investment monitoring, trading and discretionary investment management (including portfolio management) to certain accounts managed by the Investment Manager, including the Fund. These Participating Affiliates will provide services to the Investment Manager (or any affiliated investment subadviser to the Fund as the case may be) either pursuant to subadvisory agreements, personnel-sharing agreements or similar inter-company arrangements and the Fund will pay no additional fees and expenses as a result of any such arrangements.
These Participating Affiliates, like the Investment Manager, are direct or indirect subsidiaries of Ameriprise Financial and are registered with appropriate respective regulators in their home jurisdictions and, where required, the Securities and Exchange Commission and the Commodity Futures Trading Commission in the United States.
Pursuant to some of these arrangements, certain employees of these Participating Affiliates may serve as "associated persons" of the Investment Manager and, in this capacity, subject to the oversight and supervision of the Investment Manager and consistent with the investment objectives, policies and limitations set forth in the Fund’s prospectus and Statement of Additional Information (SAI), may provide such services to the Fund on behalf of the Investment Manager.
Compensation of board members
Members of the Board of Trustees who are not officers or employees of the Investment Manager or Ameriprise Financial are compensated for their services to the Fund as disclosed in the Statement of Operations. These members of the Board of Trustees may participate in a Deferred Compensation Plan (the Deferred Plan) which may be terminated at any time. Obligations of the Deferred Plan will be paid solely out of the Fund’s assets, and all amounts payable under the Deferred Plan constitute a general unsecured obligation of the Fund.
Columbia Global Dividend Opportunity Fund | Annual Report 2019
| 27 |
Notes to Financial Statements (continued)
August 31, 2019
Compensation of Chief Compliance Officer
The Board of Trustees has appointed a Chief Compliance Officer to the Fund in accordance with federal securities regulations. As disclosed in the Statement of Operations, a portion of the Chief Compliance Officer’s total compensation is allocated to the Fund, along with other allocations to affiliated registered investment companies managed by the Investment Manager and its affiliates, based on relative net assets.
Transfer agency fees
Under a Transfer and Dividend Disbursing Agent Agreement, Columbia Management Investment Services Corp. (the Transfer Agent), an affiliate of the Investment Manager and a wholly-owned subsidiary of Ameriprise Financial, is responsible for providing transfer agency services to the Fund. The Transfer Agent has contracted with DST Asset Manager Solutions, Inc. (DST) to serve as sub-transfer agent. The Transfer Agent pays the fees of DST for services as sub-transfer agent and DST is not entitled to reimbursement for such fees from the Fund (with the exception of out-of-pocket fees).
The Fund pays the Transfer Agent a monthly transfer agency fee based on the number or the average value of accounts, depending on the type of account. In addition, the Fund pays the Transfer Agent a fee for shareholder services based on the number of accounts or on a percentage of the average aggregate value of the Fund’s shares maintained in omnibus accounts up to the lesser of the amount charged by the financial intermediary or a cap established by the Board of Trustees from time to time.
The Transfer Agent also receives compensation from the Fund for various shareholder services and reimbursements for certain out-of-pocket fees. Total transfer agency fees for Institutional 2 Class and Institutional 3 Class shares are subject to an annual limitation of not more than 0.07% and 0.02%, respectively, of the average daily net assets attributable to each share class.
For the year ended August 31, 2019, the Fund’s effective transfer agency fee rates as a percentage of average daily net assets of each class were as follows:
| | Effective rate (%) |
| Class A | 0.35 |
| Advisor Class | 0.35 |
| Class C | 0.35 |
| Institutional Class | 0.35 |
| Institutional 2 Class | 0.07 |
| Institutional 3 Class | 0.01 |
| Class R | 0.36 |
| Class T | 0.10(a) |
An annual minimum account balance fee of $20 may apply to certain accounts with a value below the applicable share class’s initial minimum investment requirements to reduce the impact of small accounts on transfer agency fees. These minimum account balance fees are remitted to the Fund and recorded as part of expense reductions in the Statement of Operations. For the year ended August 31, 2019, no minimum account balance fees were charged by the Fund.
Distribution and service fees
The Fund has entered into an agreement with Columbia Management Investment Distributors, Inc. (the Distributor), an affiliate of the Investment Manager and a wholly-owned subsidiary of Ameriprise Financial, for distribution and shareholder services. The Board of Trustees has approved, and the Fund has adopted, distribution and shareholder service plans (the Plans) applicable to certain share classes, which set the distribution and service fees for the Fund. These fees are calculated daily and are intended to compensate the Distributor and/or eligible selling and/or servicing agents for selling shares of the Fund and providing services to investors.
| 28 | Columbia Global Dividend Opportunity Fund | Annual Report 2019 |
Notes to Financial Statements (continued)
August 31, 2019
Under the Plans, the Fund pays a monthly service fee to the Distributor at the maximum annual rate of 0.25% of the average daily net assets attributable to Class A, Class C and Class T shares of the Fund. Also under the Plans, the Fund pays a monthly distribution fee to the Distributor at the maximum annual rates of 0.75%, 0.50% and 0.25% of the average daily net assets attributable to Class C, Class R and Class T shares of the Fund, respectively. As a result of all Class T shares of the Fund being redeemed or converted to Class A shares, December 14, 2018 was the last day the Fund paid a distribution and shareholder services fee for Class T shares.
Although the Fund may have paid a distribution fee up to 0.25% of the Fund’s average daily net assets attributable to Class T shares and a service fee of up to 0.25% of the Fund’s average daily net assets attributable to Class T shares, the aggregate fee shall not exceed 0.25% of the Fund’s average daily net assets attributable to Class T shares.
Sales charges (unaudited)
Sales charges, including front-end charges and contingent deferred sales charges (CDSC), received by the Distributor for distributing Fund shares for the year ended August 31, 2019, if any, are listed below:
| | Front End (%) | CDSC (%) | Amount ($) |
| Class A | 5.75 | 0.50 - 1.00(a) | 24,864 |
| Class C | — | 1.00(b) | 393 |
| Class T | 2.50 | — | — |
| (a) | This charge is imposed on certain investments of between $1 million and $50 million redeemed within 18 months after purchase, as follows: 1.00% if redeemed within 12 months after purchase, and 0.50% if redeemed more than 12, but less than 18, months after purchase, with certain limited exceptions. |
| (b) | This charge applies to redemptions within 12 months after purchase, with certain limited exceptions. |
The Fund’s other share classes are not subject to sales charges.
Expenses waived/reimbursed by the Investment Manager and its affiliates
The Investment Manager and certain of its affiliates have contractually agreed to waive fees and/or reimburse expenses (excluding certain fees and expenses described below) for the period(s) disclosed below, unless sooner terminated at the sole discretion of the Board of Trustees, so that the Fund’s net operating expenses, after giving effect to fees waived/expenses reimbursed and any balance credits and/or overdraft charges from the Fund’s custodian, do not exceed the following annual rate(s) as a percentage of the class’ average daily net assets:
| | Fee rate(s) contractual
through
December 31, 2019 |
| Class A | 1.25% |
| Advisor Class | 1.00 |
| Class C | 2.00 |
| Institutional Class | 1.00 |
| Institutional 2 Class | 0.87 |
| Institutional 3 Class | 0.81 |
| Class R | 1.50 |
Under the agreement governing these fee waivers and/or expense reimbursement arrangements, the following fees and expenses are excluded from the waiver/reimbursement commitment, and therefore will be paid by the Fund, if applicable: taxes (including foreign transaction taxes), expenses associated with investments in affiliated and non-affiliated pooled investment vehicles (including mutual funds and exchange-traded funds), transaction costs and brokerage commissions, costs related to any securities lending program, dividend expenses associated with securities sold short, inverse floater program fees and expenses, transaction charges and interest on borrowed money, interest, infrequent and/or unusual expenses and any other expenses the exclusion of which is specifically approved by the Board of Trustees. This agreement may be modified or amended only with approval from the Investment Manager, certain of its affiliates and the Fund. Any fees waived and/or expenses reimbursed under the expense reimbursement arrangements described above are not recoverable by the Investment Manager or its affiliates in future periods.
Columbia Global Dividend Opportunity Fund | Annual Report 2019
| 29 |
Notes to Financial Statements (continued)
August 31, 2019
Note 4. Federal tax information
The timing and character of income and capital gain distributions are determined in accordance with income tax regulations, which may differ from GAAP because of temporary or permanent book to tax differences.
At August 31, 2019, these differences were primarily due to differing treatment for deferral/reversal of wash sale losses, trustees’ deferred compensation, re-characterization of distributions for investments, investments in partnerships, foreign currency transactions and passive foreign investment company (PFIC) holdings. To the extent these differences were permanent, reclassifications were made among the components of the Fund’s net assets. Temporary differences do not require reclassifications.
The following reclassifications were made:
Undistributed net
investment
income ($) | Accumulated
net realized
gain ($) | Paid in
capital ($) |
| (505,729) | 505,956 | (227) |
Net investment income (loss) and net realized gains (losses), as disclosed in the Statement of Operations, and net assets were not affected by this reclassification.
The tax character of distributions paid during the years indicated was as follows:
| Year Ended August 31, 2019 | Year Ended August 31, 2018 |
Ordinary
income ($) | Long-term
capital gains ($) | Total ($) | Ordinary
income ($) | Long-term
capital gains ($) | Total ($) |
| 15,301,840 | 10,707,497 | 26,009,337 | 18,072,522 | — | 18,072,522 |
Short-term capital gain distributions, if any, are considered ordinary income distributions for tax purposes.
At August 31, 2019, the components of distributable earnings on a tax basis were as follows:
Undistributed
ordinary income ($) | Undistributed
long-term
capital gains ($) | Capital loss
carryforwards ($) | Net unrealized
appreciation ($) |
| 3,360,434 | 2,153,821 | — | 28,102,253 |
At August 31, 2019, the cost of all investments for federal income tax purposes along with the aggregate gross unrealized appreciation and depreciation based on that cost was:
Federal
tax cost ($) | Gross unrealized
appreciation ($) | Gross unrealized
(depreciation) ($) | Net unrealized
appreciation ($) |
| 454,484,854 | 54,399,362 | (26,297,109) | 28,102,253 |
Tax cost of investments and unrealized appreciation/(depreciation) may also include timing differences that do not constitute adjustments to tax basis.
Management of the Fund has concluded that there are no significant uncertain tax positions in the Fund that would require recognition in the financial statements. However, management’s conclusion may be subject to review and adjustment at a later date based on factors including, but not limited to, new tax laws, regulations, and administrative interpretations (including relevant court decisions). Generally, the Fund’s federal tax returns for the prior three fiscal years remain subject to examination by the Internal Revenue Service.
Note 5. Portfolio information
The cost of purchases and proceeds from sales of securities, excluding short-term investments and derivatives, if any, aggregated to $280,038,767 and $335,779,057, respectively, for the year ended August 31, 2019. The amount of purchase and sale activity impacts the portfolio turnover rate reported in the Financial Highlights.
| 30 | Columbia Global Dividend Opportunity Fund | Annual Report 2019 |
Notes to Financial Statements (continued)
August 31, 2019
Note 6. Affiliated money market fund
The Fund invests in Columbia Short-Term Cash Fund, an affiliated money market fund established for the exclusive use by the Fund and other affiliated funds (the Affiliated MMF). The income earned by the Fund from such investments is included as Dividends - affiliated issuers in the Statement of Operations. As an investing fund, the Fund indirectly bears its proportionate share of the expenses of the Affiliated MMF. The Affiliated MMF prices its shares with a floating net asset value. In addition, the Board of Trustees of the Affiliated MMF may impose a fee on redemptions (sometimes referred to as a liquidity fee) or temporarily suspend redemptions (sometimes referred to as imposing a redemption gate) in the event its liquidity falls below regulatory limits.
Note 7. Interfund lending
Pursuant to an exemptive order granted by the Securities and Exchange Commission, the Fund participates in a program (the Interfund Program) allowing each participating Columbia Fund (each, a Participating Fund) to lend money directly to and, except for closed-end funds and money market funds, borrow money directly from other Participating Funds for temporary purposes. The amounts eligible for borrowing and lending under the Interfund Program are subject to certain restrictions.
Interfund loans are subject to the risk that the borrowing fund could be unable to repay the loan when due, and a delay in repayment to the lending fund could result in lost opportunities and/or additional lending costs. The exemptive order is subject to conditions intended to mitigate conflicts of interest arising from the Investment Manager’s relationship with each Participating Fund.
The Fund’s activity in the Interfund Program during the year ended August 31, 2019 was as follows:
| Borrower or lender | Average loan
balance ($) | Weighted average
interest rate (%) | Days
outstanding |
| Lender | 1,000,000 | 2.75 | 1 |
Interest income earned by the Fund is recorded as Interfund lending in the Statement of Operations. The Fund had no outstanding interfund loans at August 31, 2019.
Note 8. Line of credit
The Fund has access to a revolving credit facility with a syndicate of banks led by Citibank, N.A., HSBC Bank USA, N.A. and JPMorgan Chase Bank, N.A. whereby the Fund may borrow for the temporary funding of shareholder redemptions or for other temporary or emergency purposes. The credit facility, which is a collective agreement between the Fund and certain other funds managed by the Investment Manager or an affiliated investment manager, severally and not jointly, permits collective borrowings up to $1 billion. Interest is charged to each participating fund based on its borrowings at a rate equal to the higher of (i) the federal funds effective rate, (ii) the one-month LIBOR rate and (iii) the overnight bank funding rate, plus in each case, 1.00%. Each borrowing under the credit facility matures no later than 60 days after the date of borrowing. The Fund also pays a commitment fee equal to its pro rata share of the unused amount of the credit facility at a rate of 0.15% per annum. The commitment fee is included in other expenses in the Statement of Operations. This agreement expires annually in December unless extended or renewed.
The Fund had no borrowings during the year ended August 31, 2019.
Note 9. Significant risks
Foreign securities and emerging market countries risk
Investing in foreign securities may involve certain risks not typically associated with investing in U.S. securities, such as increased currency volatility and risks associated with political, regulatory, economic, social, diplomatic and other conditions or events occurring in the country or region, which may result in significant market volatility. In addition, certain foreign securities may not be as liquid as U.S. securities. Investing in emerging markets may increase these risks and expose the Fund to elevated risks associated with increased inflation, deflation or currency devaluation. To the extent that the Fund
Columbia Global Dividend Opportunity Fund | Annual Report 2019
| 31 |
Notes to Financial Statements (continued)
August 31, 2019
concentrates its investment exposure to any one or a few specific countries, the Fund will be particularly susceptible to the risks associated with the conditions, events or other factors impacting those countries or regions and may, therefore, have a greater risk than that of a fund that is more geographically diversified.
Shareholder concentration risk
At August 31, 2019, affiliated shareholders of record owned 10.7% of the outstanding shares of the Fund in one or more accounts. Subscription and redemption activity by concentrated accounts may have a significant effect on the operations of the Fund. In the case of a large redemption, the Fund may be forced to sell investments at inopportune times, including its liquid positions, which may result in Fund losses and the Fund holding a higher percentage of less liquid positions. Large redemptions could result in decreased economies of scale and increased operating expenses for non-redeeming Fund shareholders.
Note 10. Subsequent events
Management has evaluated the events and transactions that have occurred through the date the financial statements were issued and noted no items requiring adjustment of the financial statements or additional disclosure.
Note 11. Information regarding pending and settled legal proceedings
Ameriprise Financial and certain of its affiliates have historically been involved in a number of legal, arbitration and regulatory proceedings, including routine litigation, class actions, and governmental actions, concerning matters arising in connection with the conduct of their business activities. Ameriprise Financial believes that the Fund is not currently the subject of, and that neither Ameriprise Financial nor any of its affiliates are the subject of, any pending legal, arbitration or regulatory proceedings that are likely to have a material adverse effect on the Fund or the ability of Ameriprise Financial or its affiliates to perform under their contracts with the Fund. Ameriprise Financial is required to make quarterly (10-Q), annual (10-K) and, as necessary, 8-K filings with the Securities and Exchange Commission (SEC) on legal and regulatory matters that relate to Ameriprise Financial and its affiliates. Copies of these filings may be obtained by accessing the SEC website at www.sec.gov.
There can be no assurance that these matters, or the adverse publicity associated with them, will not result in increased Fund redemptions, reduced sale of Fund shares or other adverse consequences to the Fund. Further, although we believe proceedings are not likely to have a material adverse effect on the Fund or the ability of Ameriprise Financial or its affiliates to perform under their contracts with the Fund, these proceedings are subject to uncertainties and, as such, we are unable to estimate the possible loss or range of loss that may result. An adverse outcome in one or more of these proceedings could result in adverse judgments, settlements, fines, penalties or other relief that could have a material adverse effect on the consolidated financial condition or results of operations of Ameriprise Financial.
| 32 | Columbia Global Dividend Opportunity Fund | Annual Report 2019 |
Report of Independent Registered Public Accounting Firm
To the Board of Trustees of Columbia Funds Series Trust I and Shareholders of Columbia Global Dividend Opportunity Fund
Opinion on the Financial Statements
We have audited the accompanying statement of assets and liabilities, including the portfolio of investments, of Columbia Global Dividend Opportunity Fund (one of the funds constituting Columbia Funds Series Trust I, hereafter referred to as the “Fund”) as of August 31, 2019, the related statement of operations for the year ended August 31, 2019, the statement of changes in net assets for each of the two years in the period ended August 31, 2019, including the related notes, and the financial highlights for each of the five years in the period ended August 31, 2019, (collectively referred to as the “financial statements”). In our opinion, the financial statements present fairly, in all material respects, the financial position of the Fund as of August 31, 2019, the results of its operations for the year then ended, the changes in its net assets for each of the two years in the period ended August 31, 2019 and the financial highlights for each of the five years in the period ended August 31, 2019 in conformity with accounting principles generally accepted in the United States of America.
Basis for Opinion
These financial statements are the responsibility of the Fund’s management. Our responsibility is to express an opinion on the Fund’s financial statements based on our audits. We are a public accounting firm registered with the Public Company Accounting Oversight Board (United States) (PCAOB) and are required to be independent with respect to the Fund in accordance with the U.S. federal securities laws and the applicable rules and regulations of the Securities and Exchange Commission and the PCAOB.
We conducted our audits of these financial statements in accordance with the standards of the PCAOB. Those standards require that we plan and perform the audit to obtain reasonable assurance about whether the financial statements are free of material misstatement, whether due to error or fraud.
Our audits included performing procedures to assess the risks of material misstatement of the financial statements, whether due to error or fraud, and performing procedures that respond to those risks. Such procedures included examining, on a test basis, evidence regarding the amounts and disclosures in the financial statements. Our audits also included evaluating the accounting principles used and significant estimates made by management, as well as evaluating the overall presentation of the financial statements. Our procedures included confirmation of securities owned as of August 31, 2019, by correspondence with the custodian and transfer agent. We believe that our audits provide a reasonable basis for our opinion.
/s/PricewaterhouseCoopers LLP
Minneapolis, Minnesota
October 24, 2019
We have served as the auditor of one or more investment companies within the Columbia Funds Complex since 1977.
Columbia Global Dividend Opportunity Fund | Annual Report 2019
| 33 |
Federal Income Tax Information
(Unaudited)
The Fund hereby designates the following tax attributes for the fiscal year ended August 31, 2019. Shareholders will be notified in early 2020 of the amounts for use in preparing 2019 income tax returns.
Qualified
dividend
income | Dividends
received
deduction | Capital
gain
dividend | Foreign
taxes paid
to foreign
countries | Foreign
taxes paid
per share
to foreign
countries | Foreign
source
income | Foreign
source
income per
share |
| 100.00% | 42.40% | $5,303,302 | $850,314 | $0.03 | $13,152,306 | $0.49 |
Qualified dividend income. For taxable, non-corporate shareholders, the percentage of ordinary income distributed during the fiscal year that represents qualified dividend income subject to reduced tax rates.
Dividends received deduction. The percentage of ordinary income distributed during the fiscal year that qualifies for the corporate dividends received deduction.
Capital gain dividend. The Fund designates as a capital gain dividend the amount reflected above, or if subsequently determined to be different, the net capital gain of such fiscal period.
Foreign taxes. The Fund makes the election to pass through to shareholders the foreign taxes paid. Eligible shareholders may claim a foreign tax credit. These taxes, and the corresponding foreign source income, are provided.
TRUSTEES AND OFFICERS
The Board oversees the Fund’s operations and appoints officers who are responsible for day-to-day business decisions based on policies set by the Board. The following table provides basic biographical information about the Fund’s Trustees as of the printing of this report, including their principal occupations during the past five years, although specific titles for individuals may have varied over the period. The year set forth beneath Length of Service in the table below is the year in which the Trustee was first appointed or elected as Trustee to any Fund currently in the Columbia Funds Complex or a predecessor thereof. Under current Board policy, members serve terms of indefinite duration.
Independent trustees
| Name, address, year of birth | Position held with the Trust and length of service | Principal occupation(s) during the past five years and other relevant professional experience | Number of Funds in the Columbia Fund Complex overseen | Other directorships held by Trustee during the past five years |
Janet Langford Carrig
c/o Columbia Management
Investment Advisers, LLC
225 Franklin Street
Mail Drop BX32 05228
Boston, MA 02110
1957 | Trustee
1996 | Senior Vice President, General Counsel and Corporate Secretary, ConocoPhillips (independent energy company), September 2007-October 2018 | 70 | None |
Douglas A. Hacker
c/o Columbia Management
Investment Advisers, LLC
225 Franklin Street
Mail Drop BX32 05228
Boston, MA 02110
1955 | Trustee and Chairman of the Board
1996 | Independent business executive since May 2006; Executive Vice President — Strategy of United Airlines, December 2002-May 2006; President of UAL Loyalty Services (airline marketing company), September 2001-December 2002; Executive Vice President and Chief Financial Officer of United Airlines, July 1999-September 2001 | 70 | Spartan Nash Company, (food distributor); former Director, Nash Finch Company (food distributor), 2005-2013; Aircastle Limited (aircraft leasing); former Director, SeaCube Container Leasing Ltd. (container leasing), 2010-2013; and Travelport Worldwide Limited (travel information technology) |
| 34 | Columbia Global Dividend Opportunity Fund | Annual Report 2019 |
TRUSTEES AND OFFICERS (continued)
Independent trustees (continued)
| Name, address, year of birth | Position held with the Trust and length of service | Principal occupation(s) during the past five years and other relevant professional experience | Number of Funds in the Columbia Fund Complex overseen | Other directorships held by Trustee during the past five years |
Nancy T. Lukitsh
c/o Columbia Management
Investment Advisers, LLC
225 Franklin Street
Mail Drop BX32 05228
Boston, MA 02110
1956 | Trustee
2011 | Senior Vice President, Partner and Director of Marketing, Wellington Management Company, LLP (investment adviser), 1997-2010; Chair, Wellington Management Portfolios (commingled non-U.S. investment pools), 2007-2010; Director, Wellington Trust Company, NA and other Wellington affiliates, 1997-2010 | 70 | None |
David M. Moffett
c/o Columbia Management
Investment Advisers, LLC
225 Franklin Street
Mail Drop BX32 05228
Boston, MA 02110
1952 | Trustee
2011 | Retired. Consultant to Bridgewater and Associates | 70 | Director, CSX Corporation (transportation suppliers); Genworth Financial, Inc. (financial and insurance products and services); PayPal Holdings Inc. (payment and data processing services); Trustee, University of Oklahoma Foundation; former Director, eBay Inc. (online trading community), 2007-2015; and former Director, CIT Bank, CIT Group Inc. (commercial and consumer finance), 2010-2016 |
John J. Neuhauser
c/o Columbia Management
Investment Advisers, LLC
225 Franklin Street
Mail Drop BX32 05228
Boston, MA 02110
1943 | Trustee
1984 | President, Saint Michael’s College, August 2007-June 2018; Director or Trustee of several non-profit organizations, including University of Vermont Medical Center; Academic Vice President and Dean of Faculties, Boston College, August 1999-October 2005; University Professor, Boston College, November 2005-August 2007 | 70 | Liberty All-Star Equity Fund and Liberty All- Star Growth Fund (closed-end funds) |
Patrick J. Simpson
c/o Columbia Management
Investment Advisers, LLC
225 Franklin Street
Mail Drop BX32 05228
Boston, MA 02110
1944 | Trustee
2000 | Of Counsel, Perkins Coie LLP (law firm) since 2015; Partner, Perkins Coie LLP, 1988-2014 | 70 | Former Director, M Fund, Inc. (M Funds mutual fund family), July 2018-July 2019 |
Anne-Lee Verville
c/o Columbia Management
Investment Advisers, LLC
225 Franklin Street
Mail Drop BX32 05228
Boston, MA 02110
1945 | Trustee
1998 | Retired. General Manager, Global Education Industry, 1994-1997, President – Application Systems Division, 1991-1994, Chief Financial Officer – US Marketing & Services, 1988-1991, and Chief Information Officer, 1987-1988, IBM Corporation (computer and technology) | 70 | Former Director, Enesco Group, Inc. (producer of giftware and home and garden decor products), 2001-2006 |
Columbia Global Dividend Opportunity Fund | Annual Report 2019
| 35 |
TRUSTEES AND OFFICERS (continued)
Consultants to the Independent Trustees*
| Name, address, year of birth | Position held with the Trust and length of service | Principal occupation(s) during the past five years and other relevant professional experience | Number of Funds in the Columbia Funds complex overseen | Other directorships held by Trustee during the past five years |
J. Kevin Connaughton
c/o Columbia
Management Investment
Advisers, LLC,
225 Franklin Street
Mail Drop BX32 05228,
Boston, MA 02110
1964 | Independent Trustee Consultant
2016 | Independent Trustee Consultant, Columbia Funds since March 2016; Adjunct Professor of Finance, Bentley University since November 2017; Managing Director and General Manager of Mutual Fund Products, Columbia Management Investment Advisers, LLC, May 2010-February 2015; President, Columbia Funds, 2009-2015; and senior officer of Columbia Funds and affiliated funds, 2003-2015 | 70 | Director, The Autism Project since March 2015; former Trustee, New Century Portfolios, March 2015-December 2017; formerly on Board of Governors, Gateway Healthcare, January 2016 – December 2017 |
Olive Darragh
c/o Columbia
Management Investment
Advisers, LLC,
225 Franklin Street,
Mail Drop BX32 05228,
Boston, MA 02110
1962 | Independent Trustee Consultant 2019 | Independent Trustee Consultant, Columbia Funds since June 2019; Managing Director of Darragh Inc. (a strategy and talent management consulting firm) since 2010; Founder and CEO, Zolio (an investment management talent identification platform) since 2004; Partner, Tudor Investments, 2004-2010; Senior Partner, McKinsey & Company, 2001-2004 | 70 | Director, University of Edinburgh Business School; former Director, Boston Public Library Foundation |
Natalie A. Trunow
c/o Columbia
Management Investment
Advisers, LLC,
225 Franklin Street
Mail Drop BX32 05228,
Boston, MA 02110
1967 | Independent Trustee Consultant
2016 | Independent Trustee Consultant, Columbia Funds since September 2016; Chief Executive Officer, Millennial Portfolio Solutions LLC (asset management and consulting services) since January 2016; Director of Investments, Casey Family Programs, April 2016-September 2016; Senior Vice President and Chief Investment Officer, Calvert Investments, August 2008-January 2016; Section Head and Portfolio Manager, General Motors Asset Management, June 1997-August 2008 | 70 | Director, Health Services for Children with Special Needs, Inc.; Director, Consumer Credit Counseling Services (formerly Guidewell Financial Solutions) |
| * | J. Kevin Connaughton was appointed consultant to the Independent Trustees effective March 1, 2016. Olive Darragh was appointed consultant to the Independent Trustees effective June 10, 2019. Natalie A. Trunow was appointed consultant to the Independent Trustees effective September 1, 2016. Shareholders of the Funds are expected to be asked to elect each of Mr. Connaughton, Ms. Darragh and Ms. Trunow as a Trustee at a future shareholder meeting. |
Interested trustee affiliated with Investment Manager*
| Name, address, year of birth | Position held with the Trust and length of service | Principal occupation(s) during the past five years and other relevant professional experience | Number of Funds in the Columbia Funds Complex overseen | Other directorships held by Trustee during the past five years |
William F. Truscott
c/o Columbia Management
Investment Advisers, LLC
225 Franklin Street
Boston, MA 02110
1960 | Trustee
2012 | Chairman of the Board and President, Columbia Management Investment Advisers, LLC since May 2010 and February 2012, respectively; Chief Executive Officer, Global Asset Management, Ameriprise Financial, Inc. since September 2012 (previously Chief Executive Officer, U.S. Asset Management & President, Annuities, May 2010-September 2012); Director and Chief Executive Officer, Columbia Management Investment Distributors, Inc. since May 2010 and February 2012, respectively; Chairman of the Board and Chief Executive Officer, RiverSource Distributors, Inc. since 2006; Director, Threadneedle Asset Management Holdings, SARL since 2014; President and Chief Executive Officer, Ameriprise Certificate Company, 2006-August 2012 | 192 | Chairman of the Board, Columbia Management Investment Advisers, LLC since May 2010; Director, Columbia Management Investment Distributors, Inc. since May 2010; former Director, Ameriprise Certificate Company, August 2006 - January 2013 |
| 36 | Columbia Global Dividend Opportunity Fund | Annual Report 2019 |
TRUSTEES AND OFFICERS (continued)
| * | Interested person (as defined under the 1940 Act) by reason of being an officer, director, security holder and/or employee of the Investment Manager or Ameriprise Financial. |
The Statement of Additional Information has additional information about the Fund’s Board members and is available, without charge, upon request by calling 800.345.6611, visiting columbiathreadneedleus.com/investor/ or contacting your financial intermediary.
The Board has appointed officers who are responsible for day-to-day business decisions based on policies it has established. The officers serve at the pleasure of the Board. The following table provides basic information about the Officers of the Fund as of the printing of this report, including principal occupations during the past five years, although their specific titles may have varied over the period. In addition to Mr. Truscott, who is Senior Vice President, the Fund’s other officers are:
Fund officers
Name,
address and
year of birth | Position and year
first appointed to
position for any Fund
in the Columbia
Funds complex or a
predecessor thereof | Principal occupation(s) during past five years |
Christopher O. Petersen
5228 Ameriprise
Financial Center
Minneapolis, MN 55474
Born 1970 | President and Principal Executive Officer (2015) | Vice President and Lead Chief Counsel, Ameriprise Financial, Inc. since January 2015 (previously Vice President and Chief Counsel, January 2010 - December 2014; officer of Columbia Funds and affiliated funds since 2007. |
Michael G. Clarke
225 Franklin Street
Boston, MA 02110
Born 1969 | Chief Financial Officer (Principal Financial Officer) (2009) and Senior Vice President (2019) | Vice President, Head of North American Operations, and Co-Head of Global Operations, Columbia Management Investment Advisers, LLC, since June 2019 (previously Vice President – Accounting and Tax, May 2010 - May 2019); senior officer of Columbia Funds and affiliated funds since 2002 (previously Treasurer and Chief Accounting Officer, January 2009 - January 2019 and December 2015 - January 2019, respectively). |
Joseph Beranek
5890 Ameriprise
Financial Center
Minneapolis, MN 55474
Born 1965 | Treasurer and Chief Accounting Officer (Principal Accounting Officer) (2019) | Vice President — Mutual Fund Accounting and Financial Reporting, Columbia Management Investment Advisers, LLC, since December 2018 and March 2017, respectively (previously Vice President — Pricing and Corporate Actions, May 2010 - March 2017). |
Paul B. Goucher
485 Lexington Avenue
New York, NY 10017
Born 1968 | Senior Vice President (2011) and Assistant Secretary (2008) | Senior Vice President and Assistant General Counsel, Ameriprise Financial, Inc. since January 2017 (previously Vice President and Lead Chief Counsel, November 2008 - January 2017 and January 2013 - January 2017, respectively); Vice President, Chief Legal Officer and Assistant Secretary, Columbia Management Investment Advisers, LLC since March 2015 (previously Vice President and Assistant Secretary, May 2010 – March 2015). |
Thomas P. McGuire
225 Franklin Street
Boston, MA 02110
Born 1972 | Senior Vice President and Chief Compliance Officer (2012) | Vice President — Asset Management Compliance, Ameriprise Financial, Inc., since May 2010; Chief Compliance Officer, Ameriprise Certificate Company since September 2010. |
Colin Moore
225 Franklin Street
Boston, MA 02110
Born 1958 | Senior Vice President (2010) | Executive Vice President and Global Chief Investment Officer, Ameriprise Financial, Inc., since July 2013; Executive Vice President and Global Chief Investment Officer, Columbia Management Investment Advisers, LLC since July 2013. |
Ryan C. Larrenaga
225 Franklin Street
Boston, MA 02110
Born 1970 | Senior Vice President (2017), Chief Legal Officer (2017), and Secretary (2015) | Vice President and Chief Counsel, Ameriprise Financial, Inc. since August 2018 (previously Vice President and Group Counsel, August 2011 - August 2018); officer of Columbia Funds and affiliated funds since 2005. |
Michael E. DeFao
225 Franklin Street
Boston, MA 02110
Born 1968 | Vice President (2011) and Assistant Secretary (2010) | Vice President and Chief Counsel, Ameriprise Financial, Inc. since May 2010. |
Columbia Global Dividend Opportunity Fund | Annual Report 2019
| 37 |
TRUSTEES AND OFFICERS (continued)
Fund officers (continued)
Name,
address and
year of birth | Position and year
first appointed to
position for any Fund
in the Columbia
Funds complex or a
predecessor thereof | Principal occupation(s) during past five years |
Lyn Kephart-Strong
5228 Ameriprise
Financial Center
Minneapolis, MN 55474
Born 1960 | Vice President (2015) | President, Columbia Management Investment Services Corp. since October 2014; Vice President & Resolution Officer, Ameriprise Trust Company since August 2009. |
Board Consideration and Approval of Management
Agreement
On June 12, 2019, the Board of Trustees (the Board) and the Trustees who are not interested persons (as defined in the Investment Company Act of 1940) (the Independent Trustees) of Columbia Funds Series Trust I (the Trust) unanimously approved the continuation of the Management Agreement (the Management Agreement) with Columbia Management Investment Advisers, LLC (the Investment Manager) with respect to Columbia Global Dividend Opportunity Fund (the Fund), a series of the Trust. As detailed below, the Board’s Advisory Fees and Expenses Committee (the Committee) and the Board met on multiple occasions to review and discuss, among themselves, with the management team of the Investment Manager and with an independent fee consultant, materials provided by the Investment Manager, the independent fee consultant and others before determining to approve the continuation of the Management Agreement.
In connection with their deliberations regarding the continuation of the Management Agreement, the Committee and the Board evaluated materials requested from the Investment Manager regarding the Fund and the Management Agreement, and discussed these materials with representatives of the Investment Manager at Committee meetings held on March 5, 2019, April 25, 2019 and June 11, 2019 and at Board meetings held on March 6, 2019 and June 12, 2019. In addition, the Board and its various committees consider matters bearing on the Management Agreement at other meetings throughout the year and in prior years and meet regularly with senior management of the Trust and the Investment Manager. Through the Board’s Investment Oversight Committees, Trustees also meet with selected portfolio managers of the funds the Trustees oversee and with other investment personnel at various times throughout the year. The Committee and the Board also consulted with the independent fee consultant, Fund counsel and the Independent Trustees’ independent legal counsel, who advised on various matters with respect to the Committee’s and the Board’s considerations and otherwise assisted the Committee and the Board in their deliberations. On June 11, 2019, the Committee recommended that the Board approve the continuation of the Management Agreement. On June 12, 2019, the Board, including the Independent Trustees, voting separately, unanimously approved the continuation of the Management Agreement for the Fund.
The Committee and the Board considered all information that they, their legal counsel or the Investment Manager believed reasonably necessary to evaluate and to determine whether to recommend for approval or approve the continuation of the Management Agreement. The information and factors considered by the Committee and the Board in recommending for approval or approving the continuation of the Management Agreement for the Fund included the following:
| • | Information on the investment performance of the Fund relative to the performance of a group of mutual funds determined to be comparable to the Fund by an independent third-party data provider, as well as performance relative to benchmarks; |
| • | Information on the Fund’s management fees and total expenses, including information comparing the Fund’s expenses to those of a group of comparable mutual funds, as determined by the independent third-party data provider; |
| 38 | Columbia Global Dividend Opportunity Fund | Annual Report 2019 |
Board Consideration and Approval of Management
Agreement (continued)
| • | The Investment Manager’s agreement to contractually limit or cap total operating expenses for the Fund through December 31, 2020 so that total operating expenses (excluding certain fees and expenses, such as transaction costs and certain other investment related expenses, interest, taxes, acquired fund fees and expenses, and infrequent and/or unusual expenses) would not exceed a specified annual rate, as a percentage of the Fund’s net assets; |
| • | The terms and conditions of the Management Agreement; |
| • | The current and proposed terms and conditions of other agreements and arrangements with affiliates of the Investment Manager relating to the operations of the Fund, including agreements with respect to the provision of distribution, transfer agency and shareholder services to the Fund; |
| • | Descriptions of various functions performed by the Investment Manager under the Management Agreement, including portfolio management and portfolio trading practices; |
| • | Information regarding the management fees of similarly-managed portfolios of other clients of the Investment Manager, including institutional accounts and collective trusts; |
| • | Information regarding the reputation, regulatory history and resources of the Investment Manager, including information regarding senior management, portfolio managers and other personnel; |
| • | Information regarding the capabilities of the Investment Manager with respect to compliance monitoring services, including an assessment of the Investment Manager’s compliance system by the Fund’s Chief Compliance Officer; and |
| • | The profitability to the Investment Manager and its affiliates from their relationships with the Fund. |
Nature, extent and quality of services provided under the Management Agreement
The Committee and the Board considered the nature, extent and quality of services provided to the Fund by the Investment Manager and its affiliates under the Management Agreement and under separate agreements for the provision of transfer agency and shareholder services, and the resources dedicated to the Fund and the other Columbia Funds by the Investment Manager and its affiliates. The Committee and the Board considered, among other things, the Investment Manager’s ability to attract, motivate and retain highly qualified research, advisory and supervisory investment professionals (including compensation programs for personnel involved in fund management, reputation and other attributes), the portfolio management services provided by those investment professionals, and the quality of the Investment Manager’s investment research capabilities and trade execution services. The Committee and the Board also considered the potential benefits to shareholders of investing in a mutual fund that is part of a fund complex offering exposure to a variety of asset classes and investment disciplines and providing a variety of fund and shareholder services.
The Committee and the Board also considered the professional experience and qualifications of the senior personnel of the Investment Manager, which included consideration of the Investment Manager’s experience with funds using an investment strategy similar to that used by the Investment Manager for the Fund. The Committee and the Board noted the compliance programs of and the compliance-related resources provided to the Fund by the Investment Manager and its affiliates and the resources dedicated by the Investment Manager and its affiliates to risk management, and considered the Investment Manager’s ability to provide administrative services to the Fund and coordinate the activities of the Fund’s other service providers. After reviewing these and related factors, the Committee and the Board concluded, within the context of their overall conclusions, that the nature, extent and quality of the services provided to the Fund under the Management Agreement supported the continuation of the Management Agreement.
Investment performance
The Committee and the Board reviewed information about the performance of the Fund over various time periods, including performance information relative to benchmarks, information that compared the performance of the Fund to the performance of a group of comparable mutual funds as determined by the independent third-party data provider, and information and analysis provided by the independent fee consultant. The Committee and the Board also reviewed a description of the third party’s methodology for identifying the Fund’s peer groups for purposes of performance and expense comparisons. Although the Fund’s performance lagged that of a relevant peer group for certain (although not necessarily all) periods, the Committee
Columbia Global Dividend Opportunity Fund | Annual Report 2019
| 39 |
Board Consideration and Approval of Management
Agreement (continued)
and the Board concluded that other factors relevant to performance were sufficient, in light of other considerations, to support continuation of the Management Agreement. Those factors included one or more of the following: (i) that the Fund’s performance, although lagging in certain recent periods, was stronger over the longer term; (ii) that the underperformance was attributable, to a significant extent, to investment decisions that were reasonable and consistent with the Fund’s investment strategy and policies and that the Fund was performing within a reasonable range of expectations, given those investment decisions, market conditions and the Fund’s investment strategy; (iii) that the Fund’s performance was competitive when compared to other relevant performance benchmarks or peer groups; and (iv) that the Investment Manager had taken or was taking steps designed to help improve the Fund’s investment performance, including, but not limited to, replacing portfolio managers, enhancing the resources supporting the portfolio managers, or modifying investment strategies.
The Committee and the Board noted that, through December 31, 2018, the Fund’s performance was in the eighty-fourth, seventy-fifth and eighty-ninth percentile (where the best performance would be in the first percentile) of its category selected by the independent third-party data provider for the purposes of performance comparisons for the one-, three- and five-year periods, respectively.
The Committee and the Board also considered the Investment Manager’s performance and reputation generally, the Investment Manager’s historical responsiveness to Board concerns about performance, and the Investment Manager’s willingness to take steps intended to improve performance. After reviewing these and related factors, the Committee and the Board concluded, within the context of their overall conclusions, that the performance of the Fund and the Investment Manager was sufficient, in light of other considerations, to support the continuation of the Management Agreement.
Investment management fee rates and other expenses
The Committee and the Board considered the management fees charged to the Fund under the Management Agreement as well as the total expenses incurred by the Fund. In assessing the reasonableness of the fees under the Management Agreement, the Committee and the Board considered, among other information, the Fund’s total expense ratio as a percentage of average daily net assets. The Committee and the Board considered data provided by the independent third-party data provider and the independent fee consultant. The Committee and the Board noted that, as of December 31, 2018, the Fund’s actual management fee and net total expense ratio were ranked in the first and third quintiles, respectively, (where the lowest fees and expenses would be in the first quintile) against the Fund’s expense universe as determined by the independent third-party data provider for purposes of expense comparison. The Committee and the Board also took into account the fee waiver and expense limitation arrangements agreed to by the Investment Manager, as noted above.
The Committee and the Board also received and considered information about the management fees charged by the Investment Manager to institutional accounts. In considering the fees charged to those accounts, the Committee and the Board took into account, among other things, the Investment Manager’s representations about the differences between managing mutual funds as compared to other types of accounts, including differences in the services provided, differences in the risk profile of such business for the Investment Manager and the additional resources required to manage mutual funds effectively. The Committee and the Board also received and considered information about the fees charged by the Investment Manager for sub-advisory services it provides to comparable unaffiliated funds. In evaluating the Fund’s management fees, the Committee and the Board also took into account the demands, complexity and quality of the investment management of the Fund.
After reviewing these and related factors, the Committee and the Board concluded, within the context of their overall conclusions, that the management fee rates and expenses of the Fund, in light of other considerations, supported the continuation of the Management Agreement.
Costs of services provided and profitability
The Committee and the Board also took note of the costs the Investment Manager and its affiliates incur in connection with the services provided and the profitability to the Investment Manager and its affiliates from their relationships with the Fund, and the efforts undertaken by the Investment Manager and its affiliates to manage efficiently their costs to provide such services.
| 40 | Columbia Global Dividend Opportunity Fund | Annual Report 2019 |
Board Consideration and Approval of Management
Agreement (continued)
The Committee and the Board also considered the compensation directly or indirectly received by the Investment Manager’s affiliates in connection with their relationships with the Fund. The Committee and the Board reviewed information provided by management as to the profitability to the Investment Manager and its affiliates of their relationships with the Fund, information about the allocation of expenses used to calculate profitability, and comparisons of profitability levels realized in 2018 to profitability levels realized in 2017. When reviewing profitability, the Committee and the Board also considered court cases in which adviser profitability was an issue in whole or in part, the performance of similarly managed funds, the performance of the Fund, and the expense ratio of the Fund. In addition, the Committee and the Board considered information provided by the Investment Manager regarding the Investment Manager’s financial condition and comparing its profitability to that of other asset management firms that are, or are subsidiaries of, publicly traded companies. In this regard, the Committee and the Board also considered data provided by the independent fee consultant.
After reviewing these and related factors, the Committee and the Board concluded, within the context of their overall conclusions, that the costs of services provided and the profitability to the Investment Manager and its affiliates from their relationships with the Fund supported the continuation of the Management Agreement.
Economies of scale
The Committee and the Board considered the potential existence of economies of scale in the provision by the Investment Manager of services to the Fund, to groups of related funds, and to the Investment Manager’s investment advisory clients as a whole, and whether those economies of scale were shared with the Fund through breakpoints in investment management fees or other means, such as expense limitation arrangements and additional investments by the Investment Manager in investment, trading, compliance and other resources. The Committee and the Board noted that the management fee schedules for the Fund contained breakpoints that would reduce the fee rate on assets above specified threshold levels.
In considering these matters, the Committee and the Board also considered the costs of the services provided and the profitability to the Investment Manager and its affiliates from their relationships with the Fund, as noted above. After reviewing these and related factors, the Committee and the Board concluded, within the context of their overall conclusions, that the extent to which any economies of scale were expected to be shared with the Fund supported the continuation of the Management Agreement.
Other benefits to the Investment Manager
The Committee and the Board received and considered information regarding “fall-out” or ancillary benefits received by the Investment Manager and its affiliates as a result of their relationships with the Fund, such as the engagement of the Investment Manager’s affiliates to provide distribution, transfer agency and shareholder services to the Fund. In this regard, among other matters, the Committee and the Board considered that the Fund’s distributor retains a portion of the distribution fees from the Fund and receives a portion of the sales charges on sales or redemptions of certain classes of shares of the Fund. The Committee and the Board also considered the benefits of research made available to the Investment Manager by reason of brokerage commissions generated by the Fund’s securities transactions, and reviewed information about the Investment Manager’s practices with respect to considering brokerage and research services when allocating portfolio transactions. In this connection, the Board also noted that the amount of research made available to the Investment Manager by reason of brokerage commissions had been declining over time, and may decline further. The Committee and the Board recognized that the Investment Manager’s profitability would be somewhat lower without these benefits.
Conclusion
The Committee and the Board reviewed all of the above considerations in reaching their decisions to recommend or approve the continuation of the Management Agreement. In their deliberations, the Trustees did not identify any particular information that was all-important or controlling, and individual Trustees may have attributed different weights to the various factors. Based on their evaluation of all factors that they deemed to be material, including those factors described above, and assisted by the advice of independent legal counsel, the Board, including the Independent Trustees, voting separately, unanimously approved the continuation of the Management Agreement.
Columbia Global Dividend Opportunity Fund | Annual Report 2019
| 41 |
[THIS PAGE INTENTIONALLY LEFT BLANK]
[THIS PAGE INTENTIONALLY LEFT BLANK]
Columbia Global Dividend Opportunity Fund
P.O. Box 219104
Kansas City, MO 64121-9104
Please read and consider the investment objectives, risks, charges and expenses for any fund carefully before investing. For a prospectus and summary prospectus, which contains this and other important information about the Fund, go to
columbiathreadneedleus.com/investor/. The Fund is distributed by Columbia Management Investment Distributors, Inc., member FINRA, and managed by Columbia Management Investment Advisers, LLC.
Columbia Threadneedle Investments (Columbia Threadneedle) is the global brand name of the Columbia and Threadneedle group of companies. All rights reserved.
© 2019 Columbia Management Investment Advisers, LLC.
columbiathreadneedleus.com/investor/

Annual Report
August 31, 2019
Columbia Global Technology Growth Fund
Beginning on January 1, 2021, as permitted by regulations adopted by the Securities and Exchange Commission, paper copies of the Fund’s annual and semiannual shareholder reports like this one will no longer be sent by mail, unless you specifically request paper copies of the reports. Instead, the reports will be made available on the Fund’s website (columbiathreadneedleus.com/investor/), and each time a report is posted you will be notified by mail and provided with a website address to access the report.
If you have already elected to receive shareholder reports electronically, you will not be affected by this change and you need not take any action. You may elect to receive shareholder reports and other communications from the Fund electronically at any time by contacting your financial intermediary (such as a broker-dealer or bank) or, for Fund shares held directly with the Fund, by calling 800.345.6611 or by enrolling in “eDelivery” by logging into your account at columbiathreadneedleus.com/investor/.
You may elect to receive all future reports in paper free of charge. If you invest through a financial intermediary, you can contact your financial intermediary to request that you continue receiving paper copies of your shareholder reports. If you invest directly with the Fund, you can call 800.345.6611 to let the Fund know you wish to continue receiving paper copies of your shareholder reports. Your election to receive paper reports will apply to all Columbia Funds held in your account if you invest through a financial intermediary or all Columbia Funds held with the fund complex if you invest directly with the Fund.
Not FDIC Insured • No bank guarantee • May lose value
Columbia Global Technology Growth Fund (the Fund) mails one shareholder report to each shareholder address, unless such shareholder elected to receive shareholder reports from the Fund electronically. If you would like more than one report, please call shareholder services at 800.345.6611 and additional reports will be sent to you.
Proxy voting policies and procedures
The policy of the Board of Trustees is to vote the proxies of the companies in which the Fund holds investments consistent with the procedures as stated in the Statement of Additional Information (SAI). You may obtain a copy of the SAI without charge by calling 800.345.6611; contacting your financial intermediary; visiting columbiathreadneedleus.com/investor/; or searching the website of the Securities and Exchange Commission (SEC) at sec.gov. Information regarding how the Fund voted proxies relating to portfolio securities is filed with the SEC by August 31st for the most recent 12-month period ending June 30th of that year, and is available without charge by visiting columbiathreadneedleus.com/investor/, or searching the website of the SEC at sec.gov.
Quarterly schedule of investments
The Fund files a complete schedule of portfolio holdings with the SEC for the first and third quarters of each fiscal year on Form N-PORT, and for reporting periods ended prior to March 31, 2019, on Form N-Q. The Fund’s Form N-Q and Form N-PORT filings are available on the SEC’s website at sec.gov. The Fund’s complete schedule of portfolio holdings, as filed on Form N-Q or Form N-PORT, can also be obtained without charge, upon request, by calling 800.345.6611.
Additional Fund information
For more information about the Fund, please visit columbiathreadneedleus.com/investor/ or call 800.345.6611. Customer Service Representatives are available to answer your questions Monday through Friday from 8 a.m. to 7 p.m. Eastern time.
Fund investment manager
Columbia Management Investment Advisers, LLC (the Investment Manager)
225 Franklin Street
Boston, MA 02110
Fund distributor
Columbia Management Investment Distributors, Inc.
225 Franklin Street
Boston, MA 02110
Fund transfer agent
Columbia Management Investment Services Corp.
P.O. Box 219104
Kansas City, MO 64121-9104
Columbia Global Technology Growth Fund | Annual Report 2019
Investment objective
The Fund seeks capital appreciation by investing, under normal market conditions, at least 80% of its total net assets (plus any borrowings for investment purposes) in stocks of technology companies that may benefit from technological improvements, advancements or developments.
Portfolio management
Rahul Narang
Portfolio Manager
Managed Fund since 2012
Morningstar style boxTM
The Morningstar Style Box is based on a fund’s portfolio holdings. For equity funds, the vertical axis shows the market capitalization of the stocks owned, and the horizontal axis shows investment style (value, blend, or growth). Information shown is based on the most recent data provided by Morningstar.
© 2019 Morningstar, Inc. All rights reserved. The Morningstar information contained herein: (1) is proprietary to Morningstar and/or its content providers; (2) may not be copied or distributed; and (3) is not warranted to be accurate, complete or timely. Neither Morningstar nor its content providers are responsible for any damages or losses arising from any use of this information.
| Average annual total returns (%) (for the period ended August 31, 2019) |
| | | Inception | 1 Year | 5 Years | 10 Years |
| Class A | Excluding sales charges | 11/01/02 | 4.08 | 18.12 | 18.62 |
| | Including sales charges | | -1.90 | 16.72 | 17.92 |
| Advisor Class* | 11/08/12 | 4.33 | 18.42 | 18.92 |
| Class C | Excluding sales charges | 10/13/03 | 3.31 | 17.23 | 17.75 |
| | Including sales charges | | 2.33 | 17.23 | 17.75 |
| Institutional Class | 11/09/00 | 4.32 | 18.42 | 18.92 |
| Institutional 2 Class* | 11/08/12 | 4.42 | 18.53 | 19.01 |
| Institutional 3 Class* | 03/01/16 | 4.47 | 18.53 | 18.98 |
| S&P Global 1200 Information Technology Index (Net) | | 3.57 | 15.62 | 15.15 |
Returns for Class A shares are shown with and without the maximum initial sales charge of 5.75%. Returns for Class C shares are shown with and without the 1.00% contingent deferred sales charge for the first year only. The Fund’s other share classes are not subject to sales charges and have limited eligibility. Please see the Fund’s prospectus for details. Performance for different share classes will vary based on differences in sales charges and fees associated with each share class. All results shown assume reinvestment of distributions during the period. Returns do not reflect the deduction of taxes that a shareholder may pay on Fund distributions or on the redemption of Fund shares. Performance results reflect the effect of any fee waivers or reimbursements of Fund expenses by Columbia Management Investment Advisers, LLC and/or any of its affiliates. Absent these fee waivers or expense reimbursement arrangements, performance results would have been lower.
The performance information shown represents past performance and is not a guarantee of future results. The investment return and principal value of your investment will fluctuate so that your shares, when redeemed, may be worth more or less than their original cost. Current performance may be lower or higher than the performance information shown. You may obtain performance information current to the most recent month-end by contacting your financial intermediary, visiting columbiathreadneedleus.com/investor/ or calling 800.345.6611.
| * | The returns shown for periods prior to the share class inception date (including returns for the Life of the Fund, if shown, which are since Fund inception) include the returns of the Fund’s oldest share class. These returns are adjusted to reflect any higher class-related operating expenses of the newer share classes, as applicable. Please visit columbiathreadneedleus.com/investor/investment-products/mutual-funds/appended-performance for more information. |
The Fund’s performance prior to July 2014 reflects returns achieved pursuant to different principal investment strategies. If the Fund’s current strategies had been in place for the prior periods, results shown may have been different.
The S&P Global 1200 Information Technology Index (Net) is a float-adjusted, market-cap-weighted index consisting of all members of the S&P Global 1200 that are classified within the GICS Information Technology sector.
Indices are not available for investment, are not professionally managed and do not reflect sales charges, fees, brokerage commissions, taxes or other expenses of investing. Securities in the Fund may not match those in an index.
Columbia Global Technology Growth Fund | Annual Report 2019
| 3 |
Fund at a Glance (continued)
Performance of a hypothetical $10,000 investment (August 31, 2009 — August 31, 2019)
The chart above shows the change in value of a hypothetical $10,000 investment in Class A shares of Columbia Global Technology Growth Fund during the stated time period, and does not reflect the deduction of taxes that a shareholder may pay on Fund distributions or on the redemption of Fund shares.
| Top 10 holdings (%) (at August 31, 2019) |
| Microsoft Corp. (United States) | 7.4 |
| Alphabet, Inc., Class A (United States) | 4.9 |
| Apple, Inc. (United States) | 4.7 |
| Visa, Inc., Class A (United States) | 4.3 |
| Amazon.com, Inc. (United States) | 4.2 |
| MasterCard, Inc., Class A (United States) | 3.3 |
| Broadcom, Inc. (United States) | 2.5 |
| Salesforce.com, Inc. (United States) | 2.1 |
| Alibaba Group Holding Ltd., ADR (China) | 2.1 |
| Cisco Systems, Inc. (United States) | 2.0 |
Percentages indicated are based upon total investments excluding Money Market Funds and investments in derivatives, if any.
For further detail about these holdings, please refer to the section entitled “Portfolio of Investments.”
Fund holdings are as of the date given, are subject to change at any time, and are not recommendations to buy or sell any security.
| Equity sector breakdown (%) (at August 31, 2019) |
| Communication Services | 12.0 |
| Consumer Discretionary | 7.5 |
| Financials | 0.1 |
| Health Care | 0.2 |
| Industrials | 0.5 |
| Information Technology | 79.2 |
| Materials | 0.1 |
| Real Estate | 0.4 |
| Total | 100.0 |
Percentages indicated are based upon total equity investments. The Fund’s portfolio composition is subject to change.
| 4 | Columbia Global Technology Growth Fund | Annual Report 2019 |
Fund at a Glance (continued)
| Equity sub-industry breakdown (%) (at August 31, 2019) |
| Information Technology | |
| Application Software | 13.1 |
| Communications Equipment | 3.7 |
| Data Processing & Outsourced Services | 15.1 |
| Electronic Components | 1.3 |
| Electronic Equipment & Instruments | 1.1 |
| Electronic Manufacturing Services | 0.5 |
| Internet Services & Infrastructure | 2.9 |
| IT Consulting & Other Services | 3.4 |
| Semiconductor Equipment | 4.5 |
| Semiconductors | 14.8 |
| Systems Software | 11.0 |
| Technology Distributors | 0.5 |
| Technology Hardware, Storage & Peripherals | 7.3 |
| Total | 79.2 |
Percentages indicated are based upon total equity investments. The Fund’s portfolio composition is subject to change.
| Country breakdown (%) (at August 31, 2019) |
| Brazil | 0.6 |
| China | 3.3 |
| Finland | 0.2 |
| France | 0.3 |
| Germany | 0.9 |
| Guernsey | 0.2 |
| Hong Kong | 0.1 |
| Japan | 1.0 |
| Netherlands | 3.2 |
| Russian Federation | 0.2 |
| South Korea | 1.1 |
| Spain | 0.2 |
| Sweden | 0.3 |
| Switzerland | 0.6 |
| Taiwan | 1.5 |
| United Kingdom | 0.7 |
| United States(a) | 85.6 |
| Total | 100.0 |
| (a) | Includes investments in Money Market Funds. |
Country breakdown is based primarily on issuer’s place of organization/incorporation. Percentages indicated are based upon total investments excluding investments in derivatives, if any. The Fund’s portfolio composition is subject to change.
The Fund may use place of organization/incorporation or other factors in determining whether an issuer is domestic (U.S.) or foreign for purposes of its investment policies. At August 31, 2019, the Fund invested at least 40% of its net assets in foreign companies in accordance with its principal investment strategy.
Columbia Global Technology Growth Fund | Annual Report 2019
| 5 |
Manager Discussion of Fund Performance
For the 12-month period ended August 31, 2019, the Fund’s Class A shares returned 4.08% excluding sales charges. The Fund modestly outperformed its benchmark, the S&P Global 1200 Information Technology Index (Net), which returned 3.57%. Security selection drove the Fund’s performance advantage over the benchmark.
Trade concerns, interest rates weighed on financial markets
Optimism prevailed early in the 12-month period ended August 31, 2019, as positive global economic conditions buoyed investor confidence. However, the global economic backdrop looked less rosy as the period wore on. U.S. growth slowed from above 3.0% to 2.1% (annualized) and is expected to slow further in 2020. European economies transitioned to a slower pace of growth, struggling with rising interest rates, trade tensions and uncertainty surrounding the U.K.’s departure from the European Union (Brexit). At the same time, China’s economic conditions weakened and emerging markets came under pressure, driven by trade and tariff concerns and a rising U.S. dollar.
With global uncertainties on the rise, investors sold stocks and other risky assets late in 2018. Stock markets rebounded early in 2019, as the Federal Reserve (Fed) backed away from additional rate hikes and central banks around the world stood poised to loosen monetary policy — the Bank of England the lone outlier. Even though the Fed lowered its key short-term borrowing rate in July 2019, stocks dipped again in the final month of the period as trade concerns amplified.
Against this backdrop, the S&P 500 Index, a broad measure of U.S. stock returns, gained 2.92%. The MSCI ACWI ex USA Index (Net), a broad measure of stock markets outside the United States, returned -3.27%.
Contributors and detractors
Heightened geopolitical tensions between China and the United States rippled across global technology supply chains, especially for those companies with outsized exposure to China. As a result, IT services and software — with the majority of their revenues derived from the developed world — were the best performing segments of technology. Technology hardware was the worst performing segment, in part the result of significant exposure to China.
> MongoDB was the best performing stock within the portfolio’s IT services holdings during the period, as the market re-rated MongoDB, significantly raising its valuations. MongoDB is a provider of next-generation database software, with market penetration of less than one percent of a total market opportunity estimated at over $60 billion as of the writing of this report. The company rapidly won customers and disrupted decades-old and inflexible legacy database architectures. MongoDB’s cloud-agnostic approach, combined with a lower priced offering for smaller customers, drove steady organic growth during the period.
> On the other side of the Atlantic Ocean, investors cheered Trainline’s debut in the public markets. London-based Trainline is a leading online ticket aggregator for selling train tickets throughout the United Kingdom and parts of Europe. With more than 400 rail carriers and 27,000 train stations across Europe, rail infrastructure is complex, pricing lacks transparency, and online penetration of ticket sales significantly lags compared to other modes of transportation. Trainline held a dominant position in that market and had added value by simplifying the booking process for passengers. We believed the company had the potential to continue to grow faster than the market through a combination of pricing power, increased scale and a continued shift from offline to online ticket purchases.
> Shares of semiconductor manufacturer Marvell Technology generated double-digit gains for the period, as the market rewarded the company’s emerging growth profile and market consolidation. Marvell designs integrated circuits for storage, network infrastructure and connectivity applications. During the reporting period the company acquired two semiconductor companies to help balance its portfolio, while divesting non-core assets. More important to investors, the company continued to secure “design wins” — selection to design customized components — from manufacturers of products related to the next generation of mobile Internet connectivity, known as 5G. As continued innovation and easing regulatory standards allow the 5G network to expand globally and enable connectivity for new applications such as smart cities, factory automation and the “Internet of Things,” we believed that Marvell remained a compelling investment for its long-term growth potential.
> Amazon, one of the Fund’s top performers for the prior 12-month period, detracted from performance in 2019. Amazon shares fell by double digits on mounting allegations that its dominant position resulted in anti-competitive behavior. Any potential resolution is likely to take years. Amazon remained a core position within the Fund.
| 6 | Columbia Global Technology Growth Fund | Annual Report 2019 |
Manager Discussion of Fund Performance (continued)
> Finally, Chinese internet giant TenCent underperformed the market, the result of slowing growth within its core lines of business. The company has a broad collection of high quality assets, with leading content in video, music and games, plus a premier user ecosystem that includes messaging, e-commerce assets, financial technology and cloud services. The pervasive use of the company’s messaging, e-commerce and payment applications remained robust throughout the period. However, the overall growth profile was compressed by increased regulatory scrutiny of video game content, as well as an unfavorable environment for advertising growth.
At period’s end
The Fund generated solid gains, maintaining its strategy of constructing a diversified global portfolio of both growth and value opportunities. As the Fund is global in nature and technology is pervasive throughout the world, we intend to remain true to our process and continue to monitor geo-political risks. Central to this is the belief that unlike hardware-centric technology companies of the past, many of today’s companies have used new forms of technology such as the cloud to shift toward capital-light business models. The resulting increase in cash flow generation has resulted in some of the best balance sheets across the economy, which has resulted in favorable capital returns to shareholders. We believe that increased regulation of market leaders and the imposition of tariffs are the primary risks to the technology sector. We continue to view market pullbacks as an opportunity to deploy capital to ideas where our conviction is the highest.
Marketrisk may affect a single issuer, sector of the economy, industry or the market as a whole. The products oftechnology companies may be subject to severe competition and rapid obsolescence, and technology stocks may be subject to greater price fluctuations.Growthsecurities, at times, may not perform as well as value securities or the stock market in general and may be out of favor with investors.Foreigninvestments subject the Fund to risks, including political, economic, market, social and others within a particular country, as well as to currency instabilities and less stringent financial and accounting standards generally applicable to U.S. issuers. Risks are enhanced foremerging market issuers. See the Fund’s prospectus for more information on these and other risks.
The views expressed in this report reflect the current views of the respective parties. These views are not guarantees of future performance and involve certain risks, uncertainties and assumptions that are difficult to predict, so actual outcomes and results may differ significantly from the views expressed. These views are subject to change at any time based upon economic, market or other conditions and the respective parties disclaim any responsibility to update such views. These views may not be relied on as investment advice and, because investment decisions for a Columbia fund are based on numerous factors, may not be relied on as an indication of trading intent on behalf of any particular Columbia fund. References to specific securities should not be construed as a recommendation or investment advice.
Columbia Global Technology Growth Fund | Annual Report 2019
| 7 |
Understanding Your Fund’s Expenses
(Unaudited)
As an investor, you incur two types of costs. There are shareholder transaction costs, which generally include sales charges on purchases and may include redemption fees. There are also ongoing fund costs, which generally include management fees, distribution and/or service fees, and other fund expenses. The following information is intended to help you understand your ongoing costs (in dollars) of investing in the Fund and to help you compare these costs with the ongoing costs of investing in other mutual funds.
Analyzing your Fund’s expenses
To illustrate these ongoing costs, we have provided examples and calculated the expenses paid by investors in each share class of the Fund during the period. The actual and hypothetical information in the table is based on an initial investment of $1,000 at the beginning of the period indicated and held for the entire period. Expense information is calculated two ways and each method provides you with different information. The amount listed in the “Actual” column is calculated using the Fund’s actual operating expenses and total return for the period. You may use the Actual information, together with the amount invested, to estimate the expenses that you paid over the period. Simply divide your account value by $1,000 (for example, an $8,600 account value divided by $1,000 = 8.6), then multiply the results by the expenses paid during the period under the “Actual” column. The amount listed in the “Hypothetical” column assumes a 5% annual rate of return before expenses (which is not the Fund’s actual return) and then applies the Fund’s actual expense ratio for the period to the hypothetical return. You should not use the hypothetical account values and expenses to estimate either your actual account balance at the end of the period or the expenses you paid during the period. See “Compare with other funds” below for details on how to use the hypothetical data.
Compare with other funds
Since all mutual funds are required to include the same hypothetical calculations about expenses in shareholder reports, you can use this information to compare the ongoing cost of investing in the Fund with other funds. To do so, compare the hypothetical example with the 5% hypothetical examples that appear in the shareholder reports of other funds. As you compare hypothetical examples of other funds, it is important to note that hypothetical examples are meant to highlight the ongoing costs of investing in a fund only and do not reflect any transaction costs, such as sales charges, or redemption or exchange fees. Therefore, the hypothetical calculations are useful in comparing ongoing costs only, and will not help you determine the relative total costs of owning different funds. If transaction costs were included in these calculations, your costs would be higher.
| March 1, 2019 — August 31, 2019 |
| | Account value at the
beginning of the
period ($) | Account value at the
end of the
period ($) | Expenses paid during
the period ($) | Fund’s annualized
expense ratio (%) |
| | Actual | Hypothetical | Actual | Hypothetical | Actual | Hypothetical | Actual |
| Class A | 1,000.00 | 1,000.00 | 1,099.50 | 1,018.85 | 6.53 | 6.28 | 1.24 |
| Advisor Class | 1,000.00 | 1,000.00 | 1,100.80 | 1,020.10 | 5.21 | 5.01 | 0.99 |
| Class C | 1,000.00 | 1,000.00 | 1,095.20 | 1,015.09 | 10.45 | 10.05 | 1.99 |
| Institutional Class | 1,000.00 | 1,000.00 | 1,100.70 | 1,020.10 | 5.21 | 5.01 | 0.99 |
| Institutional 2 Class | 1,000.00 | 1,000.00 | 1,101.30 | 1,020.46 | 4.85 | 4.66 | 0.92 |
| Institutional 3 Class | 1,000.00 | 1,000.00 | 1,101.30 | 1,020.76 | 4.53 | 4.36 | 0.86 |
Expenses paid during the period are equal to the annualized expense ratio for each class as indicated above, multiplied by the average account value over the period and then multiplied by the number of days in the Fund’s most recent fiscal half year and divided by 365.
Expenses do not include fees and expenses incurred indirectly by the Fund from its investment in underlying funds, including affiliated and non-affiliated pooled investment vehicles, such as mutual funds and exchange-traded funds.
| 8 | Columbia Global Technology Growth Fund | Annual Report 2019 |
Portfolio of Investments
August 31, 2019
(Percentages represent value of investments compared to net assets)
Investments in securities
| Common Stocks 98.1% |
| Issuer | Shares | Value ($) |
| Brazil 0.6% |
| Afya Ltd., Class A(a) | 90,297 | 1,977,504 |
| Arco Platform Ltd., Class A(a) | 60,381 | 2,918,818 |
| Stone Co., Ltd., Class A(a) | 128,365 | 3,861,219 |
| Total | 8,757,541 |
| China 3.3% |
| Alibaba Group Holding Ltd., ADR(a) | 177,947 | 31,146,063 |
| HUYA, Inc. ADR(a) | 88,939 | 2,241,263 |
| Tencent Holdings Ltd. | 413,420 | 17,068,265 |
| Total | 50,455,591 |
| Finland 0.2% |
| Nokia OYJ, ADR | 679,499 | 3,370,315 |
| France 0.3% |
| Capgemini SE | 33,532 | 4,023,420 |
| Germany 0.9% |
| SAP SE, ADR | 113,307 | 13,500,529 |
| Guernsey 0.2% |
| Amdocs Ltd. | 51,300 | 3,321,162 |
| Hong Kong 0.1% |
| Wanda Sports Group Co., Ltd., ADR(a) | 406,126 | 2,128,100 |
| Japan 1.0% |
| Keyence Corp. | 12,400 | 7,327,158 |
| Kyocera Corp. | 28,600 | 1,697,478 |
| Murata Manufacturing Co., Ltd. | 96,600 | 4,015,944 |
| TDK Corp. | 27,200 | 2,157,863 |
| Total | 15,198,443 |
| Netherlands 3.2% |
| ASML Holding NV | 90,364 | 20,115,930 |
| Elastic NV(a) | 57,370 | 5,042,249 |
| NXP Semiconductors NV | 162,548 | 16,602,653 |
| STMicroelectronics NV, Registered Shares | 381,079 | 6,745,098 |
| Total | 48,505,930 |
| Russian Federation 0.2% |
| Yandex NV, Class A(a) | 81,966 | 3,040,939 |
| Common Stocks (continued) |
| Issuer | Shares | Value ($) |
| South Korea 1.1% |
| Samsung Electronics Co., Ltd. | 482,593 | 17,570,719 |
| Spain 0.2% |
| Amadeus IT Group SA, Class A | 45,364 | 3,382,831 |
| Sweden 0.3% |
| Telefonaktiebolaget LM Ericsson, ADR | 647,156 | 5,073,703 |
| Switzerland 0.6% |
| Logitech International SA | 73,743 | 3,002,588 |
| TE Connectivity Ltd. | 69,305 | 6,322,002 |
| Total | 9,324,590 |
| Taiwan 1.5% |
| Taiwan Semiconductor Manufacturing Co., Ltd., ADR | 555,420 | 23,677,555 |
| United Kingdom 0.7% |
| Finablr PLC(a) | 650,481 | 1,407,296 |
| Network International Holdings PLC(a) | 642,977 | 4,739,047 |
| Trainline PLC(a) | 676,479 | 3,914,028 |
| Total | 10,060,371 |
| United States 83.7% |
| Accenture PLC, Class A | 97,199 | 19,261,926 |
| ACM Research, Inc., Class A(a) | 90,217 | 1,290,103 |
| Activision Blizzard, Inc. | 233,232 | 11,801,539 |
| Adobe, Inc.(a) | 86,279 | 24,547,238 |
| Advanced Micro Devices, Inc.(a) | 193,487 | 6,085,166 |
| Alphabet, Inc., Class A(a) | 61,817 | 73,594,993 |
| Alteryx, Inc., Class A(a) | 33,989 | 4,841,733 |
| Amazon.com, Inc.(a) | 35,912 | 63,790,127 |
| Amphenol Corp., Class A | 77,613 | 6,794,242 |
| Analog Devices, Inc. | 102,028 | 11,205,735 |
| ANSYS, Inc.(a) | 56,944 | 11,762,353 |
| Apple, Inc. | 338,213 | 70,598,582 |
| Applied Materials, Inc. | 192,593 | 9,248,316 |
| Arista Networks, Inc.(a) | 29,639 | 6,716,790 |
| Autodesk, Inc.(a) | 52,712 | 7,528,328 |
| Automatic Data Processing, Inc. | 112,714 | 19,143,346 |
| Avaya Holdings Corp.(a) | 124,113 | 1,752,476 |
| Booking Holdings, Inc.(a) | 2,907 | 5,716,354 |
The accompanying Notes to Financial Statements are an integral part of this statement.
Columbia Global Technology Growth Fund | Annual Report 2019
| 9 |
Portfolio of Investments (continued)
August 31, 2019
| Common Stocks (continued) |
| Issuer | Shares | Value ($) |
| Broadcom, Inc. | 130,513 | 36,888,194 |
| Cadence Design Systems, Inc.(a) | 96,609 | 6,615,784 |
| CDW Corp. | 61,013 | 7,047,002 |
| Cisco Systems, Inc. | 632,319 | 29,598,852 |
| Cognizant Technology Solutions Corp., Class A | 60,156 | 3,692,977 |
| Comcast Corp., Class A | 125,102 | 5,537,015 |
| Corning, Inc. | 148,610 | 4,138,789 |
| Coupa Software, Inc.(a) | 57,072 | 7,929,013 |
| Crowdstrike Holdings, Inc., Class A(a) | 22,255 | 1,808,886 |
| DXC Technology Co. | 123,224 | 4,093,501 |
| Electronic Arts, Inc.(a) | 63,621 | 5,960,015 |
| Expedia Group, Inc. | 17,431 | 2,267,773 |
| Facebook, Inc., Class A(a) | 156,826 | 29,117,883 |
| Fidelity National Information Services, Inc. | 170,600 | 23,239,132 |
| Fiserv, Inc.(a) | 91,128 | 9,745,228 |
| FleetCor Technologies, Inc.(a) | 27,106 | 8,088,430 |
| ForeScout Technologies, Inc.(a) | 120,926 | 4,332,779 |
| Green Dot Corp., Class A(a) | 62,671 | 1,916,479 |
| Guidewire Software, Inc.(a) | 73,535 | 7,072,596 |
| Health Catalyst, Inc.(a) | 32,979 | 1,314,543 |
| HP, Inc. | 340,753 | 6,232,372 |
| Intel Corp. | 454,067 | 21,527,316 |
| International Business Machines Corp. | 93,030 | 12,608,356 |
| Intuit, Inc. | 78,901 | 22,751,892 |
| IPG Photonics Corp.(a) | 11,278 | 1,395,427 |
| Keysight Technologies, Inc.(a) | 90,743 | 8,789,367 |
| KLA Corp. | 62,120 | 9,187,548 |
| Lam Research Corp. | 131,837 | 27,753,007 |
| Livent Corp.(a) | 199,637 | 1,227,768 |
| Lyft, Inc., Class A(a) | 56,572 | 2,770,331 |
| Marvell Technology Group Ltd. | 624,979 | 14,980,747 |
| MasterCard, Inc., Class A | 178,980 | 50,359,603 |
| Maxim Integrated Products, Inc. | 63,143 | 3,443,819 |
| Microchip Technology, Inc. | 85,761 | 7,403,747 |
| Micron Technology, Inc.(a) | 301,846 | 13,664,568 |
| Microsoft Corp. | 809,999 | 111,666,462 |
| MongoDB, Inc.(a) | 43,035 | 6,554,661 |
| Motorola Solutions, Inc. | 64,066 | 11,590,180 |
| NetApp, Inc. | 65,776 | 3,161,195 |
| Common Stocks (continued) |
| Issuer | Shares | Value ($) |
| Netflix, Inc.(a) | 42,138 | 12,378,038 |
| NVIDIA Corp. | 133,827 | 22,417,361 |
| Okta, Inc.(a) | 42,390 | 5,362,335 |
| Oracle Corp. | 208,587 | 10,859,039 |
| Palo Alto Networks, Inc.(a) | 49,047 | 9,986,950 |
| Parsons Corp.(a) | 144,190 | 4,905,344 |
| PayPal Holdings, Inc.(a) | 181,229 | 19,763,022 |
| Perspecta, Inc. | 154,858 | 4,018,565 |
| Phreesia, Inc.(a) | 62,778 | 1,680,567 |
| PTC, Inc.(a) | 52,833 | 3,458,977 |
| QUALCOMM, Inc. | 157,096 | 12,217,356 |
| SailPoint Technologies Holding, Inc.(a) | 204,407 | 4,605,290 |
| Salesforce.com, Inc.(a) | 199,995 | 31,213,220 |
| SBA Communications Corp. | 23,303 | 6,115,406 |
| ServiceNow, Inc.(a) | 52,281 | 13,689,257 |
| SMART Global Holdings, Inc.(a) | 134,036 | 3,807,963 |
| Smartsheet, Inc., Class A(a) | 106,777 | 5,189,362 |
| Splunk, Inc.(a) | 52,085 | 5,824,145 |
| Square, Inc., Class A(a) | 165,266 | 10,220,049 |
| Synopsys, Inc.(a) | 195,648 | 27,744,843 |
| Take-Two Interactive Software, Inc.(a) | 31,509 | 4,158,243 |
| Tesla Motors, Inc.(a) | 6,068 | 1,369,001 |
| Texas Instruments, Inc. | 153,343 | 18,976,196 |
| T-Mobile U.S.A., Inc.(a) | 63,664 | 4,968,975 |
| Total System Services, Inc. | 64,143 | 8,609,273 |
| Twilio, Inc., Class A(a) | 120,115 | 15,671,404 |
| Universal Display Corp. | 11,424 | 2,347,289 |
| Varonis Systems, Inc.(a) | 42,900 | 2,930,928 |
| VeriSign, Inc.(a) | 77,390 | 15,775,952 |
| Visa, Inc., Class A | 360,958 | 65,268,426 |
| VMware, Inc., Class A | 39,435 | 5,577,686 |
| Walt Disney Co. (The) | 61,493 | 8,440,529 |
| Western Digital Corp. | 172,567 | 9,882,912 |
| Workday, Inc., Class A(a) | 35,599 | 6,310,991 |
| Xilinx, Inc. | 14,650 | 1,524,479 |
| Zendesk, Inc.(a) | 42,604 | 3,416,841 |
| Total | 1,283,838,798 |
Total Common Stocks
(Cost $958,367,033) | 1,505,230,537 |
|
The accompanying Notes to Financial Statements are an integral part of this statement.
| 10 | Columbia Global Technology Growth Fund | Annual Report 2019 |
Portfolio of Investments (continued)
August 31, 2019
| Money Market Funds 1.8% |
| | Shares | Value ($) |
| Columbia Short-Term Cash Fund, 2.208%(b),(c) | 27,255,146 | 27,252,420 |
Total Money Market Funds
(Cost $27,252,420) | 27,252,420 |
Total Investments in Securities
(Cost $985,619,453) | 1,532,482,957 |
| Other Assets & Liabilities, Net | | 1,665,867 |
| Net Assets | $1,534,148,824 |
Notes to Portfolio of Investments
| (a) | Non-income producing investment. |
| (b) | The rate shown is the seven-day current annualized yield at August 31, 2019. |
| (c) | As defined in the Investment Company Act of 1940, an affiliated company is one in which the Fund owns 5% or more of the company’s outstanding voting securities, or a company which is under common ownership or control with the Fund. Holdings and transactions in these affiliated companies during the year ended August 31, 2019 are as follows: |
| Issuer | Beginning
shares | Shares
purchased | Shares
sold | Ending
shares | Realized gain
(loss) —
affiliated
issuers ($) | Net change in
unrealized
appreciation
(depreciation) —
affiliated
issuers ($) | Dividends —
affiliated
issuers ($) | Value —
affiliated
issuers
at end of
period ($) |
| Columbia Short-Term Cash Fund, 2.208% |
| | 40,804,024 | 303,456,652 | (317,005,530) | 27,255,146 | (418) | — | 674,726 | 27,252,420 |
Abbreviation Legend
| ADR | American Depositary Receipt |
Fair value measurements
The Fund categorizes its fair value measurements according to a three-level hierarchy that maximizes the use of observable inputs and minimizes the use of unobservable inputs by prioritizing that the most observable input be used when available. Observable inputs are those that market participants would use in pricing an investment based on market data obtained from sources independent of the reporting entity. Unobservable inputs are those that reflect the Fund’s assumptions about the information market participants would use in pricing an investment. An investment’s level within the fair value hierarchy is based on the lowest level of any input that is deemed significant to the asset’s or liability’s fair value measurement. The input levels are not necessarily an indication of the risk or liquidity associated with investments at that level. For example, certain U.S. government securities are generally high quality and liquid, however, they are reflected as Level 2 because the inputs used to determine fair value may not always be quoted prices in an active market.
Fair value inputs are summarized in the three broad levels listed below:
| ■ | Level 1 — Valuations based on quoted prices for investments in active markets that the Fund has the ability to access at the measurement date. Valuation adjustments are not applied to Level 1 investments. |
| ■ | Level 2 — Valuations based on other significant observable inputs (including quoted prices for similar securities, interest rates, prepayment speeds, credit risks, etc.). |
| ■ | Level 3 — Valuations based on significant unobservable inputs (including the Fund’s own assumptions and judgment in determining the fair value of investments). |
Inputs that are used in determining fair value of an investment may include price information, credit data, volatility statistics, and other factors. These inputs can be either observable or unobservable. The availability of observable inputs can vary between investments, and is affected by various factors such as the type of investment, and the volume and level of activity for that investment or similar investments in the marketplace. The inputs will be considered by the Investment Manager, along with any other relevant factors in the calculation of an investment’s fair value. The Fund uses prices and inputs that are current as of the measurement date, which may include periods of market dislocations. During these periods, the availability of prices and inputs may be reduced for many investments. This condition could cause an investment to be reclassified between the various levels within the hierarchy.
Foreign equity securities actively traded in markets where there is a significant delay in the local close relative to the New York Stock Exchange are classified as Level 2. The values of these securities may include an adjustment to reflect the impact of significant market movements following the close of local trading, as described in Note 2 to the financial statements – Security valuation.
Investments falling into the Level 3 category are primarily supported by quoted prices from brokers and dealers participating in the market for those investments. However, these may be classified as Level 3 investments due to lack of market transparency and corroboration to support these quoted prices. Additionally, valuation models may be used as the pricing source for any remaining investments classified as Level 3. These models may rely on one or more significant unobservable inputs and/or significant assumptions by the Investment Manager. Inputs used in valuations may include, but are not limited to, financial statement analysis, capital account balances, discount rates and estimated cash flows, and comparable company data.
The accompanying Notes to Financial Statements are an integral part of this statement.
Columbia Global Technology Growth Fund | Annual Report 2019
| 11 |
Portfolio of Investments (continued)
August 31, 2019
Fair value measurements (continued)
Under the direction of the Fund’s Board of Trustees (the Board), the Investment Manager’s Valuation Committee (the Committee) is responsible for overseeing the valuation procedures approved by the Board. The Committee consists of voting and non-voting members from various groups within the Investment Manager’s organization, including operations and accounting, trading and investments, compliance, risk management and legal.
The Committee meets at least monthly to review and approve valuation matters, which may include a description of specific valuation determinations, data regarding pricing information received from approved pricing vendors and brokers and the results of Board-approved valuation control policies and procedures (the Policies). The Policies address, among other things, instances when market quotations are or are not readily available, including recommendations of third party pricing vendors and a determination of appropriate pricing methodologies; events that require specific valuation determinations and assessment of fair value techniques; securities with a potential for stale pricing, including those that are illiquid, restricted, or in default; and the effectiveness of third party pricing vendors, including periodic reviews of vendors. The Committee meets more frequently, as needed, to discuss additional valuation matters, which may include the need to review back-testing results, review time-sensitive information or approve related valuation actions. The Committee reports to the Board, with members of the Committee meeting with the Board at each of its regularly scheduled meetings to discuss valuation matters and actions during the period, similar to those described earlier.
The following table is a summary of the inputs used to value the Fund’s investments at August 31, 2019:
| | Level 1 ($) | Level 2 ($) | Level 3 ($) | Total ($) |
| Investments in Securities | | | | |
| Common Stocks | | | | |
| Brazil | 8,757,541 | — | — | 8,757,541 |
| China | 33,387,326 | 17,068,265 | — | 50,455,591 |
| Finland | 3,370,315 | — | — | 3,370,315 |
| France | — | 4,023,420 | — | 4,023,420 |
| Germany | 13,500,529 | — | — | 13,500,529 |
| Guernsey | 3,321,162 | — | — | 3,321,162 |
| Hong Kong | 2,128,100 | — | — | 2,128,100 |
| Japan | — | 15,198,443 | — | 15,198,443 |
| Netherlands | 48,505,930 | — | — | 48,505,930 |
| Russian Federation | 3,040,939 | — | — | 3,040,939 |
| South Korea | — | 17,570,719 | — | 17,570,719 |
| Spain | — | 3,382,831 | — | 3,382,831 |
| Sweden | 5,073,703 | — | — | 5,073,703 |
| Switzerland | 6,322,002 | 3,002,588 | — | 9,324,590 |
| Taiwan | 23,677,555 | — | — | 23,677,555 |
| United Kingdom | — | 10,060,371 | — | 10,060,371 |
| United States | 1,283,838,798 | — | — | 1,283,838,798 |
| Total Common Stocks | 1,434,923,900 | 70,306,637 | — | 1,505,230,537 |
| Money Market Funds | 27,252,420 | — | — | 27,252,420 |
| Total Investments in Securities | 1,462,176,320 | 70,306,637 | — | 1,532,482,957 |
See the Portfolio of Investments for all investment classifications not indicated in the table.
The Fund’s assets assigned to the Level 2 input category are generally valued using the market approach, in which a security’s value is determined through reference to prices and information from market transactions for similar or identical assets. These assets include certain foreign securities for which a third party statistical pricing service may be employed for purposes of fair market valuation. The model utilized by such third party statistical pricing service takes into account a security’s correlation to available market data including, but not limited to, intraday index, ADR, and exchange-traded fund movements.
The accompanying Notes to Financial Statements are an integral part of this statement.
| 12 | Columbia Global Technology Growth Fund | Annual Report 2019 |
Statement of Assets and Liabilities
August 31, 2019
| Assets | |
| Investments in securities, at value | |
| Unaffiliated issuers (cost $958,367,033) | $1,505,230,537 |
| Affiliated issuers (cost $27,252,420) | 27,252,420 |
| Receivable for: | |
| Investments sold | 1,101,646 |
| Capital shares sold | 3,277,541 |
| Dividends | 1,120,279 |
| Foreign tax reclaims | 42,703 |
| Prepaid expenses | 9,492 |
| Trustees’ deferred compensation plan | 78,045 |
| Total assets | 1,538,112,663 |
| Liabilities | |
| Payable for: | |
| Investments purchased | 1,262,246 |
| Capital shares purchased | 2,328,871 |
| Management services fees | 34,441 |
| Distribution and/or service fees | 6,112 |
| Transfer agent fees | 180,465 |
| Compensation of chief compliance officer | 96 |
| Other expenses | 73,563 |
| Trustees’ deferred compensation plan | 78,045 |
| Total liabilities | 3,963,839 |
| Net assets applicable to outstanding capital stock | $1,534,148,824 |
| Represented by | |
| Paid in capital | 979,123,248 |
| Total distributable earnings (loss) (Note 2) | 555,025,576 |
| Total - representing net assets applicable to outstanding capital stock | $1,534,148,824 |
| Class A | |
| Net assets | $333,216,782 |
| Shares outstanding | 9,336,545 |
| Net asset value per share | $35.69 |
| Maximum sales charge | 5.75% |
| Maximum offering price per share (calculated by dividing the net asset value per share by 1.0 minus the maximum sales charge for Class A shares) | $37.87 |
| Advisor Class | |
| Net assets | $135,472,376 |
| Shares outstanding | 3,594,345 |
| Net asset value per share | $37.69 |
| Class C | |
| Net assets | $139,366,078 |
| Shares outstanding | 4,371,285 |
| Net asset value per share | $31.88 |
| Institutional Class | |
| Net assets | $693,232,290 |
| Shares outstanding | 18,648,066 |
| Net asset value per share | $37.17 |
| Institutional 2 Class | |
| Net assets | $130,114,847 |
| Shares outstanding | 3,429,484 |
| Net asset value per share | $37.94 |
| Institutional 3 Class | |
| Net assets | $102,746,451 |
| Shares outstanding | 2,700,658 |
| Net asset value per share | $38.04 |
The accompanying Notes to Financial Statements are an integral part of this statement.
Columbia Global Technology Growth Fund | Annual Report 2019
| 13 |
Statement of Operations
Year Ended August 31, 2019
| Net investment income | |
| Income: | |
| Dividends — unaffiliated issuers | $15,079,512 |
| Dividends — affiliated issuers | 674,726 |
| Interfund lending | 2,783 |
| Foreign taxes withheld | (436,283) |
| Total income | 15,320,738 |
| Expenses: | |
| Management services fees | 11,607,081 |
| Distribution and/or service fees | |
| Class A | 823,154 |
| Class C | 1,322,971 |
| Transfer agent fees | |
| Class A | 442,593 |
| Advisor Class | 159,292 |
| Class C | 178,041 |
| Institutional Class | 865,540 |
| Institutional 2 Class | 65,121 |
| Institutional 3 Class | 6,685 |
| Compensation of board members | 33,551 |
| Custodian fees | 42,004 |
| Printing and postage fees | 95,623 |
| Registration fees | 189,185 |
| Audit fees | 37,699 |
| Legal fees | 28,868 |
| Compensation of chief compliance officer | 563 |
| Other | 70,584 |
| Total expenses | 15,968,555 |
| Net investment loss | (647,817) |
| Realized and unrealized gain (loss) — net | |
| Net realized gain (loss) on: | |
| Investments — unaffiliated issuers | 22,362,021 |
| Investments — affiliated issuers | (418) |
| Foreign currency translations | (10,549) |
| Net realized gain | 22,351,054 |
| Net change in unrealized appreciation (depreciation) on: | |
| Investments — unaffiliated issuers | 28,484,911 |
| Foreign currency translations | (7,636) |
| Net change in unrealized appreciation (depreciation) | 28,477,275 |
| Net realized and unrealized gain | 50,828,329 |
| Net increase in net assets resulting from operations | $50,180,512 |
The accompanying Notes to Financial Statements are an integral part of this statement.
| 14 | Columbia Global Technology Growth Fund | Annual Report 2019 |
Statement of Changes in Net Assets
| | Year Ended
August 31, 2019 | Year Ended
August 31, 2018 |
| Operations | | |
| Net investment loss | $(647,817) | $(2,720,228) |
| Net realized gain | 22,351,054 | 73,596,084 |
| Net change in unrealized appreciation (depreciation) | 28,477,275 | 218,809,996 |
| Net increase in net assets resulting from operations | 50,180,512 | 289,685,852 |
| Distributions to shareholders | | |
| Net investment income and net realized gains | | |
| Class A | (17,028,304) | |
| Advisor Class | (6,067,235) | |
| Class C | (5,809,230) | |
| Institutional Class | (30,637,503) | |
| Institutional 2 Class | (4,987,412) | |
| Institutional 3 Class | (3,371,906) | |
| Net realized gains | | |
| Class A | | (9,039,993) |
| Advisor Class | | (765,620) |
| Class C | | (3,335,038) |
| Institutional Class | | (15,778,111) |
| Institutional 2 Class | | (2,022,287) |
| Institutional 3 Class | | (1,724,744) |
| Total distributions to shareholders (Note 2) | (67,901,590) | (32,665,793) |
| Increase in net assets from capital stock activity | 83,226,306 | 392,571,410 |
| Total increase in net assets | 65,505,228 | 649,591,469 |
| Net assets at beginning of year | 1,468,643,596 | 819,052,127 |
| Net assets at end of year | $1,534,148,824 | $1,468,643,596 |
| Excess of distributions over net investment income | $(953,302) | $(60,368) |
The accompanying Notes to Financial Statements are an integral part of this statement.
Columbia Global Technology Growth Fund | Annual Report 2019
| 15 |
Statement of Changes in Net Assets (continued)
| | Year Ended | Year Ended |
| | August 31, 2019 | August 31, 2018 |
| | Shares | Dollars ($) | Shares | Dollars ($) |
| Capital stock activity |
| Class A | | | | |
| Subscriptions | 2,797,043 | 92,395,868 | 5,228,272 | 171,416,129 |
| Distributions reinvested | 553,690 | 15,669,419 | 273,655 | 8,335,524 |
| Redemptions | (4,288,596) | (137,119,082) | (3,223,158) | (105,707,338) |
| Net increase (decrease) | (937,863) | (29,053,795) | 2,278,769 | 74,044,315 |
| Advisor Class | | | | |
| Subscriptions | 2,906,178 | 98,645,285 | 2,626,473 | 95,114,876 |
| Distributions reinvested | 203,325 | 6,067,235 | 23,911 | 765,620 |
| Redemptions | (2,238,829) | (75,509,145) | (380,288) | (12,748,446) |
| Net increase | 870,674 | 29,203,375 | 2,270,096 | 83,132,050 |
| Class C | | | | |
| Subscriptions | 1,074,393 | 30,886,087 | 1,703,988 | 50,186,699 |
| Distributions reinvested | 197,041 | 5,008,771 | 101,583 | 2,790,479 |
| Redemptions | (1,189,609) | (34,897,882) | (1,091,125) | (32,625,945) |
| Net increase | 81,825 | 996,976 | 714,446 | 20,351,233 |
| Institutional Class | | | | |
| Subscriptions | 6,271,021 | 214,054,919 | 7,685,998 | 263,957,209 |
| Distributions reinvested | 719,120 | 21,163,729 | 343,383 | 10,854,349 |
| Redemptions | (6,533,837) | (217,526,637) | (3,249,564) | (109,198,998) |
| Net increase | 456,304 | 17,692,011 | 4,779,817 | 165,612,560 |
| Institutional 2 Class | | | | |
| Subscriptions | 1,906,819 | 67,469,747 | 1,844,002 | 63,310,391 |
| Distributions reinvested | 166,128 | 4,987,155 | 62,779 | 2,022,118 |
| Redemptions | (1,273,627) | (44,147,478) | (789,834) | (27,030,387) |
| Net increase | 799,320 | 28,309,424 | 1,116,947 | 38,302,122 |
| Institutional 3 Class | | | | |
| Subscriptions | 1,375,078 | 49,596,390 | 669,830 | 22,877,348 |
| Distributions reinvested | 112,053 | 3,371,677 | 53,409 | 1,724,593 |
| Redemptions | (472,288) | (16,889,752) | (386,910) | (13,472,811) |
| Net increase | 1,014,843 | 36,078,315 | 336,329 | 11,129,130 |
| Total net increase | 2,285,103 | 83,226,306 | 11,496,404 | 392,571,410 |
The accompanying Notes to Financial Statements are an integral part of this statement.
| 16 | Columbia Global Technology Growth Fund | Annual Report 2019 |
[THIS PAGE INTENTIONALLY LEFT BLANK]
Columbia Global Technology Growth Fund | Annual Report 2019
| 17 |
The following table is intended to help you understand the Fund’s financial performance. Certain information reflects financial results for a single share of a class held for the periods shown. Per share net investment income (loss) amounts are calculated based on average shares outstanding during the period. Total return assumes reinvestment of all dividends and distributions, if any. Total return does not reflect payment of sales charges, if any. Total return and portfolio turnover are not annualized for periods of less than one year. The portfolio turnover rate is calculated without regard to purchase and sales transactions of short-term instruments and certain derivatives, if any. If such transactions were included, the Fund’s portfolio turnover rate may be higher.
| | Net asset value,
beginning of
period | Net
investment
income
(loss) | Net
realized
and
unrealized
gain | Total from
investment
operations | Distributions
from net
investment
income | Distributions
from net
realized
gains | Total
distributions to
shareholders |
| Class A |
| Year Ended 8/31/2019 | $36.28 | (0.05) | 1.10 | 1.05 | — | (1.64) | (1.64) |
| Year Ended 8/31/2018 | $28.59 | (0.11) | 8.86 | 8.75 | — | (1.06) | (1.06) |
| Year Ended 8/31/2017 | $21.19 | (0.08) | 7.56 | 7.48 | — | (0.08) | (0.08) |
| Year Ended 8/31/2016 | $18.36 | (0.04) | 3.22 | 3.18 | — | (0.35) | (0.35) |
| Year Ended 8/31/2015 | $18.18 | (0.07) | 1.10 | 1.03 | (0.09) | (0.76) | (0.85) |
| Advisor Class |
| Year Ended 8/31/2019 | $38.21 | 0.04 | 1.16 | 1.20 | — | (1.72) | (1.72) |
| Year Ended 8/31/2018 | $30.05 | (0.02) | 9.31 | 9.29 | — | (1.13) | (1.13) |
| Year Ended 8/31/2017 | $22.21 | (0.02) | 7.94 | 7.92 | — | (0.08) | (0.08) |
| Year Ended 8/31/2016 | $19.19 | 0.01 | 3.36 | 3.37 | — | (0.35) | (0.35) |
| Year Ended 8/31/2015 | $18.92 | (0.04) | 1.17 | 1.13 | (0.10) | (0.76) | (0.86) |
| Class C |
| Year Ended 8/31/2019 | $32.54 | (0.27) | 0.99 | 0.72 | — | (1.38) | (1.38) |
| Year Ended 8/31/2018 | $25.78 | (0.32) | 7.97 | 7.65 | — | (0.89) | (0.89) |
| Year Ended 8/31/2017 | $19.26 | (0.24) | 6.84 | 6.60 | — | (0.08) | (0.08) |
| Year Ended 8/31/2016 | $16.84 | (0.17) | 2.94 | 2.77 | — | (0.35) | (0.35) |
| Year Ended 8/31/2015 | $16.82 | (0.20) | 1.02 | 0.82 | (0.04) | (0.76) | (0.80) |
| Institutional Class |
| Year Ended 8/31/2019 | $37.72 | 0.03 | 1.15 | 1.18 | — | (1.73) | (1.73) |
| Year Ended 8/31/2018 | $29.68 | (0.03) | 9.20 | 9.17 | — | (1.13) | (1.13) |
| Year Ended 8/31/2017 | $21.94 | (0.02) | 7.84 | 7.82 | — | (0.08) | (0.08) |
| Year Ended 8/31/2016 | $18.95 | 0.01 | 3.33 | 3.34 | — | (0.35) | (0.35) |
| Year Ended 8/31/2015 | $18.70 | (0.02) | 1.13 | 1.11 | (0.10) | (0.76) | (0.86) |
The accompanying Notes to Financial Statements are an integral part of this statement.
| 18 | Columbia Global Technology Growth Fund | Annual Report 2019 |
Financial Highlights (continued)
| | Net
asset
value,
end of
period | Total
return | Total gross
expense
ratio to
average
net assets(a) | Total net
expense
ratio to
average
net assets(a),(b) | Net investment
income (loss)
ratio to
average
net assets | Portfolio
turnover | Net
assets,
end of
period
(000’s) |
| Class A |
| Year Ended 8/31/2019 | $35.69 | 4.08% | 1.24% | 1.24% | (0.16%) | 40% | $333,217 |
| Year Ended 8/31/2018 | $36.28 | 31.32% | 1.25% | 1.25%(c) | (0.33%) | 28% | $372,730 |
| Year Ended 8/31/2017 | $28.59 | 35.41% | 1.32% | 1.32%(c) | (0.33%) | 40% | $228,598 |
| Year Ended 8/31/2016 | $21.19 | 17.52% | 1.36% | 1.36%(c) | (0.21%) | 55% | $165,271 |
| Year Ended 8/31/2015 | $18.36 | 5.70% | 1.40% | 1.40%(c) | (0.37%) | 60% | $131,079 |
| Advisor Class |
| Year Ended 8/31/2019 | $37.69 | 4.33% | 0.99% | 0.99% | 0.11% | 40% | $135,472 |
| Year Ended 8/31/2018 | $38.21 | 31.65% | 1.01% | 1.01%(c) | (0.05%) | 28% | $104,061 |
| Year Ended 8/31/2017 | $30.05 | 35.77% | 1.07% | 1.07%(c) | (0.06%) | 40% | $13,629 |
| Year Ended 8/31/2016 | $22.21 | 17.76% | 1.11% | 1.11%(c) | 0.07% | 55% | $7,235 |
| Year Ended 8/31/2015 | $19.19 | 6.04% | 1.15% | 1.15%(c) | (0.23%) | 60% | $8,345 |
| Class C |
| Year Ended 8/31/2019 | $31.88 | 3.31% | 1.99% | 1.99% | (0.90%) | 40% | $139,366 |
| Year Ended 8/31/2018 | $32.54 | 30.31% | 2.00% | 2.00%(c) | (1.08%) | 28% | $139,590 |
| Year Ended 8/31/2017 | $25.78 | 34.39% | 2.07% | 2.07%(c) | (1.08%) | 40% | $92,158 |
| Year Ended 8/31/2016 | $19.26 | 16.65% | 2.12% | 2.12%(c) | (0.97%) | 55% | $60,684 |
| Year Ended 8/31/2015 | $16.84 | 4.91% | 2.15% | 2.15%(c) | (1.13%) | 60% | $39,660 |
| Institutional Class |
| Year Ended 8/31/2019 | $37.17 | 4.32% | 0.99% | 0.99% | 0.09% | 40% | $693,232 |
| Year Ended 8/31/2018 | $37.72 | 31.64% | 1.00% | 1.00%(c) | (0.09%) | 28% | $686,134 |
| Year Ended 8/31/2017 | $29.68 | 35.75% | 1.07% | 1.07%(c) | (0.08%) | 40% | $398,021 |
| Year Ended 8/31/2016 | $21.94 | 17.82% | 1.11% | 1.11%(c) | 0.04% | 55% | $233,750 |
| Year Ended 8/31/2015 | $18.95 | 6.00% | 1.15% | 1.15%(c) | (0.11%) | 60% | $165,748 |
The accompanying Notes to Financial Statements are an integral part of this statement.
Columbia Global Technology Growth Fund | Annual Report 2019
| 19 |
Financial Highlights (continued)
| | Net asset value,
beginning of
period | Net
investment
income
(loss) | Net
realized
and
unrealized
gain | Total from
investment
operations | Distributions
from net
investment
income | Distributions
from net
realized
gains | Total
distributions to
shareholders |
| Institutional 2 Class |
| Year Ended 8/31/2019 | $38.45 | 0.06 | 1.18 | 1.24 | — | (1.75) | (1.75) |
| Year Ended 8/31/2018 | $30.23 | (0.00)(d) | 9.37 | 9.37 | — | (1.15) | (1.15) |
| Year Ended 8/31/2017 | $22.33 | 0.01 | 7.97 | 7.98 | — | (0.08) | (0.08) |
| Year Ended 8/31/2016 | $19.26 | 0.03 | 3.39 | 3.42 | — | (0.35) | (0.35) |
| Year Ended 8/31/2015 | $18.98 | (0.01) | 1.16 | 1.15 | (0.11) | (0.76) | (0.87) |
| Institutional 3 Class |
| Year Ended 8/31/2019 | $38.55 | 0.08 | 1.18 | 1.26 | — | (1.77) | (1.77) |
| Year Ended 8/31/2018 | $30.31 | 0.01 | 9.39 | 9.40 | — | (1.16) | (1.16) |
| Year Ended 8/31/2017 | $22.37 | 0.03 | 7.99 | 8.02 | — | (0.08) | (0.08) |
| Year Ended 8/31/2016(e) | $19.26 | 0.04 | 3.07 | 3.11 | — | — | — |
| Notes to Financial Highlights |
| (a) | In addition to the fees and expenses that the Fund bears directly, the Fund indirectly bears a pro rata share of the fees and expenses of any other funds in which it invests. Such indirect expenses are not included in the Fund’s reported expense ratios. |
| (b) | Total net expenses include the impact of certain fee waivers/expense reimbursements made by the Investment Manager and certain of its affiliates, if applicable. |
| (c) | The benefits derived from expense reductions had an impact of less than 0.01%. |
| (d) | Rounds to zero. |
| (e) | Institutional 3 Class shares commenced operations on March 1, 2016. Per share data and total return reflect activity from that date. |
| (f) | Annualized. |
The accompanying Notes to Financial Statements are an integral part of this statement.
| 20 | Columbia Global Technology Growth Fund | Annual Report 2019 |
Financial Highlights (continued)
| | Net
asset
value,
end of
period | Total
return | Total gross
expense
ratio to
average
net assets(a) | Total net
expense
ratio to
average
net assets(a),(b) | Net investment
income (loss)
ratio to
average
net assets | Portfolio
turnover | Net
assets,
end of
period
(000’s) |
| Institutional 2 Class |
| Year Ended 8/31/2019 | $37.94 | 4.42% | 0.92% | 0.92% | 0.17% | 40% | $130,115 |
| Year Ended 8/31/2018 | $38.45 | 31.73% | 0.93% | 0.93% | (0.00%)(d) | 28% | $101,134 |
| Year Ended 8/31/2017 | $30.23 | 35.84% | 0.98% | 0.98% | 0.02% | 40% | $45,747 |
| Year Ended 8/31/2016 | $22.33 | 17.95% | 0.98% | 0.98% | 0.16% | 55% | $18,492 |
| Year Ended 8/31/2015 | $19.26 | 6.13% | 1.00% | 1.00% | (0.05%) | 60% | $9,964 |
| Institutional 3 Class |
| Year Ended 8/31/2019 | $38.04 | 4.47% | 0.87% | 0.87% | 0.22% | 40% | $102,746 |
| Year Ended 8/31/2018 | $38.55 | 31.77% | 0.88% | 0.88% | 0.03% | 28% | $64,995 |
| Year Ended 8/31/2017 | $30.31 | 35.96% | 0.93% | 0.93% | 0.10% | 40% | $40,899 |
| Year Ended 8/31/2016(e) | $22.37 | 16.15% | 0.94%(f) | 0.94%(f) | 0.33%(f) | 55% | $675 |
The accompanying Notes to Financial Statements are an integral part of this statement.
Columbia Global Technology Growth Fund | Annual Report 2019
| 21 |
Notes to Financial Statements
August 31, 2019
Note 1. Organization
Columbia Global Technology Growth Fund (the Fund), a series of Columbia Funds Series Trust I (the Trust), is a diversified fund. The Trust is registered under the Investment Company Act of 1940, as amended (the 1940 Act), as an open-end management investment company organized as a Massachusetts business trust.
Fund shares
The Trust may issue an unlimited number of shares (without par value). The Fund offers each of the share classes listed in the Statement of Assets and Liabilities. Although all share classes generally have identical voting, dividend and liquidation rights, each share class votes separately when required by the Trust’s organizational documents or by law. Each share class has its own expense and sales charge structure. Different share classes may have different minimum initial investment amounts and pay different distribution amounts to the extent the expenses of distributing such share classes vary. Distributions to shareholders in a liquidation will be proportional to the net asset value of each share class.
As described in the Fund’s prospectus, Class A and Class C shares are offered to the general public for investment. Advisor Class, Institutional Class, Institutional 2 Class and Institutional 3 Class shares are available for purchase through authorized investment professionals to omnibus retirement plans or to institutional and to certain other investors as also described in the Fund’s prospectus. Class C shares automatically convert to Class A shares after 10 years.
Note 2. Summary of significant accounting policies
Basis of preparation
The Fund is an investment company that applies the accounting and reporting guidance in the Financial Accounting Standards Board (FASB) Accounting Standards Codification Topic 946,Financial Services - Investment Companies (ASC 946). The financial statements are prepared in accordance with U.S. generally accepted accounting principles (GAAP), which requires management to make certain estimates and assumptions that affect the reported amounts of assets and liabilities, the disclosure of contingent assets and liabilities at the date of the financial statements and the reported amounts of income and expenses during the reporting period. Actual results could differ from those estimates.
The following is a summary of significant accounting policies followed by the Fund in the preparation of its financial statements.
Security valuation
All equity securities are valued at the close of business of the New York Stock Exchange. Equity securities are valued at the official closing price on the principal exchange or market on which they trade. Unlisted securities or listed securities for which there were no sales during the day are valued at the mean of the latest quoted bid and ask prices on such exchanges or markets.
Foreign equity securities are valued based on the closing price on the foreign exchange in which such securities are primarily traded. If any foreign equity security closing prices are not readily available, the securities are valued at the mean of the latest quoted bid and ask prices on such exchanges or markets. Foreign currency exchange rates are determined at the scheduled closing time of the New York Stock Exchange. Many securities markets and exchanges outside the U.S. close prior to the close of the New York Stock Exchange; therefore, the closing prices for securities in such markets or on such exchanges may not fully reflect events that occur after such close but before the close of the New York Stock Exchange. In those situations, foreign securities will be fair valued pursuant to a policy adopted by the Board of Trustees. Under the policy, the Fund may utilize a third party pricing service to determine these fair values. The third-party pricing service takes into account multiple factors, including, but not limited to, movements in the U.S. securities markets, certain depositary receipts, futures contracts and foreign exchange rates that have occurred subsequent to the close of the foreign exchange or market, to determine a good faith estimate that reasonably reflects the current market conditions as of the close of the New York Stock Exchange. The fair value of a security is likely to be different from the quoted or published price, if available.
Investments in open-end investment companies, including money market funds, are valued at their latest net asset value.
| 22 | Columbia Global Technology Growth Fund | Annual Report 2019 |
Notes to Financial Statements (continued)
August 31, 2019
Investments for which market quotations are not readily available, or that have quotations which management believes are not reflective of market value or reliable, are valued at fair value as determined in good faith under procedures approved by and under the general supervision of the Board of Trustees. If a security or class of securities (such as foreign securities) is valued at fair value, such value is likely to be different from the quoted or published price for the security.
The determination of fair value often requires significant judgment. To determine fair value, management may use assumptions including but not limited to future cash flows and estimated risk premiums. Multiple inputs from various sources may be used to determine fair value.
GAAP requires disclosure regarding the inputs and valuation techniques used to measure fair value and any changes in valuation inputs or techniques. In addition, investments shall be disclosed by major category. This information is disclosed following the Fund’s Portfolio of Investments.
Foreign currency transactions and translations
The values of all assets and liabilities denominated in foreign currencies are generally translated into U.S. dollars at exchange rates determined at the close of regular trading on the New York Stock Exchange. Net realized and unrealized gains (losses) on foreign currency transactions and translations include gains (losses) arising from the fluctuation in exchange rates between trade and settlement dates on securities transactions, gains (losses) arising from the disposition of foreign currency and currency gains (losses) between the accrual and payment dates on dividends, interest income and foreign withholding taxes.
For financial statement purposes, the Fund does not distinguish that portion of gains (losses) on investments which is due to changes in foreign exchange rates from that which is due to changes in market prices of the investments. Such fluctuations are included with the net realized and unrealized gains (losses) on investments in the Statement of Operations.
Security transactions
Security transactions are accounted for on the trade date. Cost is determined and gains (losses) are based upon the specific identification method for both financial statement and federal income tax purposes.
Income recognition
Corporate actions and dividend income are generally recorded net of any non-reclaimable tax withholdings, on the ex-dividend date or upon receipt of ex-dividend notification in the case of certain foreign securities.
The Fund may receive distributions from holdings in equity securities, business development companies (BDCs), exchange-traded funds (ETFs), limited partnerships (LPs), other regulated investment companies (RICs), and real estate investment trusts (REITs), which report information on the tax character of their distributions annually. These distributions are allocated to dividend income, capital gain and return of capital based on actual information reported. Return of capital is recorded as a reduction of the cost basis of securities held. If the Fund no longer owns the applicable securities, return of capital is recorded as a realized gain. With respect to REITs, to the extent actual information has not yet been reported, estimates for return of capital are made by the Fund’s management. Management’s estimates are subsequently adjusted when the actual character of the distributions is disclosed by the REITs, which could result in a proportionate change in return of capital to shareholders.
Awards from class action litigation are recorded as a reduction of cost basis if the Fund still owns the applicable securities on the payment date. If the Fund no longer owns the applicable securities, the proceeds are recorded as realized gains.
Expenses
General expenses of the Trust are allocated to the Fund and other funds of the Trust based upon relative net assets or other expense allocation methodologies determined by the nature of the expense. Expenses directly attributable to the Fund are charged to the Fund. Expenses directly attributable to a specific class of shares are charged to that share class.
Columbia Global Technology Growth Fund | Annual Report 2019
| 23 |
Notes to Financial Statements (continued)
August 31, 2019
Determination of class net asset value
All income, expenses (other than class-specific expenses, which are charged to that share class, as shown in the Statement of Operations) and realized and unrealized gains (losses) are allocated to each class of the Fund on a daily basis, based on the relative net assets of each class, for purposes of determining the net asset value of each class.
Federal income tax status
The Fund intends to qualify each year as a regulated investment company under Subchapter M of the Internal Revenue Code, as amended, and will distribute substantially all of its investment company taxable income and net capital gain, if any, for its tax year, and as such will not be subject to federal income taxes. In addition, the Fund intends to distribute in each calendar year substantially all of its ordinary income, capital gain net income and certain other amounts, if any, such that the Fund should not be subject to federal excise tax. Therefore, no federal income or excise tax provision is recorded.
Foreign taxes
The Fund may be subject to foreign taxes on income, gains on investments or currency repatriation, a portion of which may be recoverable. The Fund will accrue such taxes and recoveries, as applicable, based upon its current interpretation of tax rules and regulations that exist in the markets in which it invests.
Realized gains in certain countries may be subject to foreign taxes at the Fund level, based on statutory rates. The Fund accrues for such foreign taxes on realized and unrealized gains at the appropriate rate for each jurisdiction, as applicable. The amount, if any, is disclosed as a liability on the Statement of Assets and Liabilities.
Distributions to shareholders
Distributions from net investment income, if any, are declared and paid annually. Net realized capital gains, if any, are distributed at least annually. Income distributions and capital gain distributions are determined in accordance with federal income tax regulations, which may differ from GAAP.
Guarantees and indemnifications
Under the Trust’s organizational documents and, in some cases, by contract, its officers and trustees are indemnified against certain liabilities arising out of the performance of their duties to the Trust or its funds. In addition, certain of the Fund’s contracts with its service providers contain general indemnification clauses. The Fund’s maximum exposure under these arrangements is unknown since the amount of any future claims that may be made against the Fund cannot be determined, and the Fund has no historical basis for predicting the likelihood of any such claims.
Recent accounting pronouncements
Accounting Standards Update 2017-08 Premium Amortization on Purchased Callable Debt Securities
In March 2017, the Financial Accounting Standards Board issued Accounting Standards Update (ASU) No. 2017-08 Premium Amortization on Purchased Callable Debt Securities. ASU No. 2017-08 updates the accounting standards to shorten the amortization period for certain purchased callable debt securities, held at a premium, to be amortized to the earliest call date. The update applies to securities with explicit, noncontingent call features that are callable at fixed prices and on preset dates. The standard is effective for annual periods beginning after December 15, 2018 and interim periods within those fiscal years. Management does not expect the implementation of this guidance to have a material impact on the financial statement amounts and footnote disclosures.
Accounting Standards Update 2018-13 Disclosure Framework - Changes to the Disclosure Requirements for Fair Value Measurement
In August 2018, the Financial Accounting Standards Board issued Accounting Standards Update (ASU) No. 2018-13 Disclosure Framework - Changes to the Disclosure Requirements for Fair Value Measurement. The standard is effective for annual periods beginning after December 15, 2019 and interim periods within those fiscal years, with early adoption permitted. After evaluation, management determined to adopt the ASU effective for the period ended August 31, 2019 and all subsequent periods. As a result of the amendments, management implemented disclosure changes which include removal
| 24 | Columbia Global Technology Growth Fund | Annual Report 2019 |
Notes to Financial Statements (continued)
August 31, 2019
of the amount and reasons for transfers between Level 1 and Level 2 of the fair value hierarchy, removal of the policy for the timing of transfers between levels, removal of the description of the Level 3 valuation processes, as well as modifications to the measurement uncertainty disclosure.
Disclosure Update and Simplification
In September 2018, the Securities and Exchange Commission (SEC) released Final Rule 33-10532, Disclosure Update and Simplification, which amends certain financial statement disclosure requirements that the SEC determined to be redundant, outdated, or superseded in light of other SEC disclosure requirements, GAAP, or changes in the information environment. As a result of the amendments, management implemented disclosure changes which included removing the components of distributable earnings presented on the Statement of Assets and Liabilities and combining income and gain distributions paid to shareholders as presented on the Statement of Changes in Net Assets. Any values presented to meet prior year requirements were left unchanged. The amendments had no effect on the Fund’s net assets or results of operation.
Note 3. Fees and other transactions with affiliates
Management services fees
The Fund has entered into a Management Agreement with Columbia Management Investment Advisers, LLC (the Investment Manager), a wholly-owned subsidiary of Ameriprise Financial, Inc. (Ameriprise Financial). Under the Management Agreement, the Investment Manager provides the Fund with investment research and advice, as well as administrative and accounting services. The management services fee is an annual fee that is equal to a percentage of the Fund’s daily net assets that declines from 0.87% to 0.77% as the Fund’s net assets increase. The effective management services fee rate for the year ended August 31, 2019 was 0.82% of the Fund’s average daily net assets.
Compensation of board members
Members of the Board of Trustees who are not officers or employees of the Investment Manager or Ameriprise Financial are compensated for their services to the Fund as disclosed in the Statement of Operations. These members of the Board of Trustees may participate in a Deferred Compensation Plan (the Deferred Plan) which may be terminated at any time. Obligations of the Deferred Plan will be paid solely out of the Fund’s assets, and all amounts payable under the Deferred Plan constitute a general unsecured obligation of the Fund.
Compensation of Chief Compliance Officer
The Board of Trustees has appointed a Chief Compliance Officer to the Fund in accordance with federal securities regulations. As disclosed in the Statement of Operations, a portion of the Chief Compliance Officer’s total compensation is allocated to the Fund, along with other allocations to affiliated registered investment companies managed by the Investment Manager and its affiliates, based on relative net assets.
Transfer agency fees
Under a Transfer and Dividend Disbursing Agent Agreement, Columbia Management Investment Services Corp. (the Transfer Agent), an affiliate of the Investment Manager and a wholly-owned subsidiary of Ameriprise Financial, is responsible for providing transfer agency services to the Fund. The Transfer Agent has contracted with DST Asset Manager Solutions, Inc. (DST) to serve as sub-transfer agent. The Transfer Agent pays the fees of DST for services as sub-transfer agent and DST is not entitled to reimbursement for such fees from the Fund (with the exception of out-of-pocket fees).
The Fund pays the Transfer Agent a monthly transfer agency fee based on the number or the average value of accounts, depending on the type of account. In addition, the Fund pays the Transfer Agent a fee for shareholder services based on the number of accounts or on a percentage of the average aggregate value of the Fund’s shares maintained in omnibus accounts up to the lesser of the amount charged by the financial intermediary or a cap established by the Board of Trustees from time to time.
Columbia Global Technology Growth Fund | Annual Report 2019
| 25 |
Notes to Financial Statements (continued)
August 31, 2019
The Transfer Agent also receives compensation from the Fund for various shareholder services and reimbursements for certain out-of-pocket fees. Total transfer agency fees for Institutional 2 Class and Institutional 3 Class shares are subject to an annual limitation of not more than 0.07% and 0.02%, respectively, of the average daily net assets attributable to each share class.
For the year ended August 31, 2019, the Fund’s effective transfer agency fee rates as a percentage of average daily net assets of each class were as follows:
| | Effective rate (%) |
| Class A | 0.13 |
| Advisor Class | 0.14 |
| Class C | 0.13 |
| Institutional Class | 0.13 |
| Institutional 2 Class | 0.06 |
| Institutional 3 Class | 0.01 |
An annual minimum account balance fee of $20 may apply to certain accounts with a value below the applicable share class’s initial minimum investment requirements to reduce the impact of small accounts on transfer agency fees. These minimum account balance fees are remitted to the Fund and recorded as part of expense reductions in the Statement of Operations. For the year ended August 31, 2019, no minimum account balance fees were charged by the Fund.
Distribution and service fees
The Fund has entered into an agreement with Columbia Management Investment Distributors, Inc. (the Distributor), an affiliate of the Investment Manager and a wholly-owned subsidiary of Ameriprise Financial, for distribution and shareholder services. The Board of Trustees has approved, and the Fund has adopted, distribution and shareholder service plans (the Plans) applicable to certain share classes, which set the distribution and service fees for the Fund. These fees are calculated daily and are intended to compensate the Distributor and/or eligible selling and/or servicing agents for selling shares of the Fund and providing services to investors.
Under the Plans, the Fund pays a monthly service fee to the Distributor at the maximum annual rate of 0.25% of the average daily net assets attributable to Class A and Class C shares of the Fund. Also under the Plans, the Fund pays a monthly distribution fee to the Distributor at the maximum annual rates of 0.10% and 0.75% of the average daily net assets attributable to Class A and Class C shares of the Fund, respectively.
Although the Fund may pay distribution and service fees up to a maximum annual rate of 0.35% of the Fund’s average daily net assets attributable to Class A shares (comprised of up to 0.10% for distribution services and up to 0.25% for shareholder liaison services), the Fund currently limits such fees to an aggregate fee of not more than 0.25% of the Fund’s average daily net assets attributable to Class A shares.
Sales charges (unaudited)
Sales charges, including front-end charges and contingent deferred sales charges (CDSC), received by the Distributor for distributing Fund shares for the year ended August 31, 2019, if any, are listed below:
| | Front End (%) | CDSC (%) | Amount ($) |
| Class A | 5.75 | 0.05 - 1.00(a) | 915,174 |
| Class C | — | 1.00(b) | 29,642 |
| (a) | This charge is imposed on certain investments of between $1 million and $50 million redeemed within 18 months after purchase, as follows: 1.00% if redeemed within 12 months after purchase, and 0.50% if redeemed more than 12, but less than 18, months after purchase, with certain limited exceptions. |
| (b) | This charge applies to redemptions within 12 months after purchase, with certain limited exceptions. |
The Fund’s other share classes are not subject to sales charges.
| 26 | Columbia Global Technology Growth Fund | Annual Report 2019 |
Notes to Financial Statements (continued)
August 31, 2019
Expenses waived/reimbursed by the Investment Manager and its affiliates
The Investment Manager and certain of its affiliates have contractually agreed to waive fees and/or reimburse expenses (excluding certain fees and expenses described below) for the period(s) disclosed below, unless sooner terminated at the sole discretion of the Board of Trustees, so that the Fund’s net operating expenses, after giving effect to fees waived/expenses reimbursed and any balance credits and/or overdraft charges from the Fund’s custodian, do not exceed the following annual rate(s) as a percentage of the class’ average daily net assets:
| | January 1, 2019
through
December 31, 2019 | Prior to
January 1, 2019 |
| Class A | 1.43% | 1.43% |
| Advisor Class | 1.18 | 1.18 |
| Class C | 2.18 | 2.18 |
| Institutional Class | 1.18 | 1.18 |
| Institutional 2 Class | 1.12 | 1.11 |
| Institutional 3 Class | 1.07 | 1.07 |
Under the agreement governing these fee waivers and/or expense reimbursement arrangements, the following fees and expenses are excluded from the waiver/reimbursement commitment, and therefore will be paid by the Fund, if applicable: taxes (including foreign transaction taxes), expenses associated with investments in affiliated and non-affiliated pooled investment vehicles (including mutual funds and exchange-traded funds), transaction costs and brokerage commissions, costs related to any securities lending program, dividend expenses associated with securities sold short, inverse floater program fees and expenses, transaction charges and interest on borrowed money, interest, infrequent and/or unusual expenses and any other expenses the exclusion of which is specifically approved by the Board of Trustees. This agreement may be modified or amended only with approval from the Investment Manager, certain of its affiliates and the Fund. Any fees waived and/or expenses reimbursed under the expense reimbursement arrangements described above are not recoverable by the Investment Manager or its affiliates in future periods.
Note 4. Federal tax information
The timing and character of income and capital gain distributions are determined in accordance with income tax regulations, which may differ from GAAP because of temporary or permanent book to tax differences.
At August 31, 2019, these differences were primarily due to differing treatment for deferral/reversal of wash sale losses, trustees’ deferred compensation, PY Post Tax Return update for EQ, late-year ordinary losses, distribution reclassifications, earnings and profits distributed to shareholders on the redemption of shares, foreign currency transactions, and passive foreign investment company (PFIC) holdings. To the extent these differences were permanent, reclassifications were made among the components of the Fund’s net assets. Temporary differences do not require reclassifications.
The following reclassifications were made:
Excess of distributions
over net investment
income ($) | Accumulated
net realized
gain ($) | Paid in
capital ($) |
| (245,117) | (117,787) | 362,904 |
Net investment income (loss) and net realized gains (losses), as disclosed in the Statement of Operations, and net assets were not affected by this reclassification.
The tax character of distributions paid during the years indicated was as follows:
| Year Ended August 31, 2019 | Year Ended August 31, 2018 |
Ordinary
income ($) | Long-term
capital gains ($) | Total ($) | Ordinary
income ($) | Long-term
capital gains ($) | Total ($) |
| 21,632,647 | 46,268,943 | 67,901,590 | 5,842,954 | 26,822,839 | 32,665,793 |
Columbia Global Technology Growth Fund | Annual Report 2019
| 27 |
Notes to Financial Statements (continued)
August 31, 2019
Short-term capital gain distributions, if any, are considered ordinary income distributions for tax purposes.
At August 31, 2019, the components of distributable earnings on a tax basis were as follows:
Undistributed
ordinary income ($) | Undistributed
long-term
capital gains ($) | Capital loss
carryforwards ($) | Net unrealized
appreciation ($) |
| — | 14,111,339 | — | 541,867,618 |
At August 31, 2019, the cost of all investments for federal income tax purposes along with the aggregate gross unrealized appreciation and depreciation based on that cost was:
Federal
tax cost ($) | Gross unrealized
appreciation ($) | Gross unrealized
(depreciation) ($) | Net unrealized
appreciation ($) |
| 990,615,339 | 558,679,492 | (16,811,874) | 541,867,618 |
Tax cost of investments and unrealized appreciation/(depreciation) may also include timing differences that do not constitute adjustments to tax basis.
Under current tax rules, regulated investment companies can elect to treat certain late-year ordinary losses incurred and post-October capital losses (capital losses realized after October 31) as arising on the first day of the following taxable year. As of August 31, 2019, the Fund will elect to treat the following late-year ordinary losses and post-October capital losses as arising on September 1, 2019.
Late year
ordinary losses ($) | Post-October
capital losses ($) |
| 875,257 | — |
Management of the Fund has concluded that there are no significant uncertain tax positions in the Fund that would require recognition in the financial statements. However, management’s conclusion may be subject to review and adjustment at a later date based on factors including, but not limited to, new tax laws, regulations, and administrative interpretations (including relevant court decisions). Generally, the Fund’s federal tax returns for the prior three fiscal years remain subject to examination by the Internal Revenue Service.
Note 5. Portfolio information
The cost of purchases and proceeds from sales of securities, excluding short-term investments and derivatives, if any, aggregated to $580,818,887 and $552,839,424, respectively, for the year ended August 31, 2019. The amount of purchase and sale activity impacts the portfolio turnover rate reported in the Financial Highlights.
Note 6. Affiliated money market fund
The Fund invests in Columbia Short-Term Cash Fund, an affiliated money market fund established for the exclusive use by the Fund and other affiliated funds (the Affiliated MMF). The income earned by the Fund from such investments is included as Dividends - affiliated issuers in the Statement of Operations. As an investing fund, the Fund indirectly bears its proportionate share of the expenses of the Affiliated MMF. The Affiliated MMF prices its shares with a floating net asset value. In addition, the Board of Trustees of the Affiliated MMF may impose a fee on redemptions (sometimes referred to as a liquidity fee) or temporarily suspend redemptions (sometimes referred to as imposing a redemption gate) in the event its liquidity falls below regulatory limits.
Note 7. Interfund lending
Pursuant to an exemptive order granted by the Securities and Exchange Commission, the Fund participates in a program (the Interfund Program) allowing each participating Columbia Fund (each, a Participating Fund) to lend money directly to and, except for closed-end funds and money market funds, borrow money directly from other Participating Funds for temporary purposes. The amounts eligible for borrowing and lending under the Interfund Program are subject to certain restrictions.
| 28 | Columbia Global Technology Growth Fund | Annual Report 2019 |
Notes to Financial Statements (continued)
August 31, 2019
Interfund loans are subject to the risk that the borrowing fund could be unable to repay the loan when due, and a delay in repayment to the lending fund could result in lost opportunities and/or additional lending costs. The exemptive order is subject to conditions intended to mitigate conflicts of interest arising from the Investment Manager’s relationship with each Participating Fund.
The Fund’s activity in the Interfund Program during the year ended August 31, 2019 was as follows:
| Borrower or lender | Average loan
balance ($) | Weighted average
interest rate (%) | Days
outstanding |
| Lender | 7,253,284 | 2.76 | 5 |
Interest income earned by the Fund is recorded as Interfund lending in the Statement of Operations. The Fund had no outstanding interfund loans at August 31, 2019.
Note 8. Line of credit
The Fund has access to a revolving credit facility with a syndicate of banks led by Citibank, N.A., HSBC Bank USA, N.A. and JPMorgan Chase Bank, N.A. whereby the Fund may borrow for the temporary funding of shareholder redemptions or for other temporary or emergency purposes. The credit facility, which is a collective agreement between the Fund and certain other funds managed by the Investment Manager or an affiliated investment manager, severally and not jointly, permits collective borrowings up to $1 billion. Interest is charged to each participating fund based on its borrowings at a rate equal to the higher of (i) the federal funds effective rate, (ii) the one-month LIBOR rate and (iii) the overnight bank funding rate, plus in each case, 1.00%. Each borrowing under the credit facility matures no later than 60 days after the date of borrowing. The Fund also pays a commitment fee equal to its pro rata share of the unused amount of the credit facility at a rate of 0.15% per annum. The commitment fee is included in other expenses in the Statement of Operations. This agreement expires annually in December unless extended or renewed.
The Fund had no borrowings during the year ended August 31, 2019.
Note 9. Significant risks
Shareholder concentration risk
At August 31, 2019, three unaffiliated shareholders of record owned 38.1% of the outstanding shares of the Fund in one or more accounts. The Fund has no knowledge about whether any portion of those shares was owned beneficially. Affiliated shareholders of record owned 17.3% of the outstanding shares of the Fund in one or more accounts. Subscription and redemption activity by concentrated accounts may have a significant effect on the operations of the Fund. In the case of a large redemption, the Fund may be forced to sell investments at inopportune times, including its liquid positions, which may result in Fund losses and the Fund holding a higher percentage of less liquid positions. Large redemptions could result in decreased economies of scale and increased operating expenses for non-redeeming Fund shareholders.
Technology and technology-related investment risk
The Fund may be more susceptible to the particular risks that may affect companies in the information technology sector, as well as other technology-related sectors (collectively, the technology sectors) than if it were invested in a wider variety of companies in unrelated sectors. Companies in the technology sectors are subject to certain risks, including the risk that new services, equipment or technologies will not be accepted by consumers and businesses or will become rapidly obsolete. Performance of such companies may be affected by factors including obtaining and protecting patents (or the failure to do so) and significant competitive pressures, including aggressive pricing of their products or services, new market entrants, competition for market share and short product cycles due to an accelerated rate of technological developments. Such competitive pressures may lead to limited earnings and/or falling profit margins. As a result, the value of their securities may fall or fail to rise. In addition, many technology sector companies have limited operating histories and prices of these companies’ securities historically have been more volatile than other securities, especially over the short term.
Columbia Global Technology Growth Fund | Annual Report 2019
| 29 |
Notes to Financial Statements (continued)
August 31, 2019
Note 10. Subsequent events
Management has evaluated the events and transactions that have occurred through the date the financial statements were issued and noted no items requiring adjustment of the financial statements or additional disclosure.
Note 11. Information regarding pending and settled legal proceedings
Ameriprise Financial and certain of its affiliates have historically been involved in a number of legal, arbitration and regulatory proceedings, including routine litigation, class actions, and governmental actions, concerning matters arising in connection with the conduct of their business activities. Ameriprise Financial believes that the Fund is not currently the subject of, and that neither Ameriprise Financial nor any of its affiliates are the subject of, any pending legal, arbitration or regulatory proceedings that are likely to have a material adverse effect on the Fund or the ability of Ameriprise Financial or its affiliates to perform under their contracts with the Fund. Ameriprise Financial is required to make quarterly (10-Q), annual (10-K) and, as necessary, 8-K filings with the Securities and Exchange Commission (SEC) on legal and regulatory matters that relate to Ameriprise Financial and its affiliates. Copies of these filings may be obtained by accessing the SEC website at www.sec.gov.
There can be no assurance that these matters, or the adverse publicity associated with them, will not result in increased Fund redemptions, reduced sale of Fund shares or other adverse consequences to the Fund. Further, although we believe proceedings are not likely to have a material adverse effect on the Fund or the ability of Ameriprise Financial or its affiliates to perform under their contracts with the Fund, these proceedings are subject to uncertainties and, as such, we are unable to estimate the possible loss or range of loss that may result. An adverse outcome in one or more of these proceedings could result in adverse judgments, settlements, fines, penalties or other relief that could have a material adverse effect on the consolidated financial condition or results of operations of Ameriprise Financial.
| 30 | Columbia Global Technology Growth Fund | Annual Report 2019 |
Report of Independent Registered Public Accounting Firm
To the Board of Trustees of Columbia Funds Series Trust I and Shareholders of Columbia Global Technology Growth Fund
Opinion on the Financial Statements
We have audited the accompanying statement of assets and liabilities, including the portfolio of investments, of Columbia Technology Growth Fund (one of the funds constituting Columbia Funds Series Trust I, hereafter referred to as the “Fund”) as of August 31, 2019, the related statement of operations for the year ended August 31, 2019, the statement of changes in net assets for each of the two years in the period ended August 31, 2019, including the related notes, and the financial highlights for each of the periods indicated therein (collectively referred to as the “financial statements”). In our opinion, the financial statements present fairly, in all material respects, the financial position of the Fund as of August 31, 2019, the results of its operations for the year then ended, the changes in its net assets for each of the two years in the period ended August 31, 2019 and the financial highlights for each of the periods indicated therein in conformity with accounting principles generally accepted in the United States of America.
Basis for Opinion
These financial statements are the responsibility of the Fund’s management. Our responsibility is to express an opinion on the Fund’s financial statements based on our audits. We are a public accounting firm registered with the Public Company Accounting Oversight Board (United States) (PCAOB) and are required to be independent with respect to the Fund in accordance with the U.S. federal securities laws and the applicable rules and regulations of the Securities and Exchange Commission and the PCAOB.
We conducted our audits of these financial statements in accordance with the standards of the PCAOB. Those standards require that we plan and perform the audit to obtain reasonable assurance about whether the financial statements are free of material misstatement, whether due to error or fraud.
Our audits included performing procedures to assess the risks of material misstatement of the financial statements, whether due to error or fraud, and performing procedures that respond to those risks. Such procedures included examining, on a test basis, evidence regarding the amounts and disclosures in the financial statements. Our audits also included evaluating the accounting principles used and significant estimates made by management, as well as evaluating the overall presentation of the financial statements. Our procedures included confirmation of securities owned as of August 31, 2019, by correspondence with the custodian, transfer agent, and brokers; when replies were not received from brokers, we performed other audit procedures. We believe that our audits provide a reasonable basis for our opinion.
/s/PricewaterhouseCoopers LLP
Minneapolis, Minnesota
October 24, 2019
We have served as the auditor of one or more investment companies within the Columbia Funds Complex since 1977.
Columbia Global Technology Growth Fund | Annual Report 2019
| 31 |
Federal Income Tax Information
(Unaudited)
The Fund hereby designates the following tax attributes for the fiscal year ended August 31, 2019. Shareholders will be notified in early 2020 of the amounts for use in preparing 2019 income tax returns.
Qualified
dividend
income | Dividends
received
deduction | Capital
gain
dividend |
| 32.47% | 24.75% | $26,500,150 |
Qualified dividend income. For taxable, non-corporate shareholders, the percentage of ordinary income distributed during the fiscal year that represents qualified dividend income subject to reduced tax rates.
Dividends received deduction. The percentage of ordinary income distributed during the fiscal year that qualifies for the corporate dividends received deduction.
Capital gain dividend. The Fund designates as a capital gain dividend the amount reflected above, or if subsequently determined to be different, the net capital gain of such fiscal period.
TRUSTEES AND OFFICERS
The Board oversees the Fund’s operations and appoints officers who are responsible for day-to-day business decisions based on policies set by the Board. The following table provides basic biographical information about the Fund’s Trustees as of the printing of this report, including their principal occupations during the past five years, although specific titles for individuals may have varied over the period. The year set forth beneath Length of Service in the table below is the year in which the Trustee was first appointed or elected as Trustee to any Fund currently in the Columbia Funds Complex or a predecessor thereof. Under current Board policy, members serve terms of indefinite duration.
Independent trustees
| Name, address, year of birth | Position held with the Trust and length of service | Principal occupation(s) during the past five years and other relevant professional experience | Number of Funds in the Columbia Fund Complex overseen | Other directorships held by Trustee during the past five years |
Janet Langford Carrig
c/o Columbia Management
Investment Advisers, LLC
225 Franklin Street
Mail Drop BX32 05228
Boston, MA 02110
1957 | Trustee
1996 | Senior Vice President, General Counsel and Corporate Secretary, ConocoPhillips (independent energy company), September 2007-October 2018 | 70 | None |
Douglas A. Hacker
c/o Columbia Management
Investment Advisers, LLC
225 Franklin Street
Mail Drop BX32 05228
Boston, MA 02110
1955 | Trustee and Chairman of the Board
1996 | Independent business executive since May 2006; Executive Vice President — Strategy of United Airlines, December 2002-May 2006; President of UAL Loyalty Services (airline marketing company), September 2001-December 2002; Executive Vice President and Chief Financial Officer of United Airlines, July 1999-September 2001 | 70 | Spartan Nash Company, (food distributor); former Director, Nash Finch Company (food distributor), 2005-2013; Aircastle Limited (aircraft leasing); former Director, SeaCube Container Leasing Ltd. (container leasing), 2010-2013; and Travelport Worldwide Limited (travel information technology) |
| 32 | Columbia Global Technology Growth Fund | Annual Report 2019 |
TRUSTEES AND OFFICERS (continued)
Independent trustees (continued)
| Name, address, year of birth | Position held with the Trust and length of service | Principal occupation(s) during the past five years and other relevant professional experience | Number of Funds in the Columbia Fund Complex overseen | Other directorships held by Trustee during the past five years |
Nancy T. Lukitsh
c/o Columbia Management
Investment Advisers, LLC
225 Franklin Street
Mail Drop BX32 05228
Boston, MA 02110
1956 | Trustee
2011 | Senior Vice President, Partner and Director of Marketing, Wellington Management Company, LLP (investment adviser), 1997-2010; Chair, Wellington Management Portfolios (commingled non-U.S. investment pools), 2007-2010; Director, Wellington Trust Company, NA and other Wellington affiliates, 1997-2010 | 70 | None |
David M. Moffett
c/o Columbia Management
Investment Advisers, LLC
225 Franklin Street
Mail Drop BX32 05228
Boston, MA 02110
1952 | Trustee
2011 | Retired. Consultant to Bridgewater and Associates | 70 | Director, CSX Corporation (transportation suppliers); Genworth Financial, Inc. (financial and insurance products and services); PayPal Holdings Inc. (payment and data processing services); Trustee, University of Oklahoma Foundation; former Director, eBay Inc. (online trading community), 2007-2015; and former Director, CIT Bank, CIT Group Inc. (commercial and consumer finance), 2010-2016 |
John J. Neuhauser
c/o Columbia Management
Investment Advisers, LLC
225 Franklin Street
Mail Drop BX32 05228
Boston, MA 02110
1943 | Trustee
1984 | President, Saint Michael’s College, August 2007-June 2018; Director or Trustee of several non-profit organizations, including University of Vermont Medical Center; Academic Vice President and Dean of Faculties, Boston College, August 1999-October 2005; University Professor, Boston College, November 2005-August 2007 | 70 | Liberty All-Star Equity Fund and Liberty All- Star Growth Fund (closed-end funds) |
Patrick J. Simpson
c/o Columbia Management
Investment Advisers, LLC
225 Franklin Street
Mail Drop BX32 05228
Boston, MA 02110
1944 | Trustee
2000 | Of Counsel, Perkins Coie LLP (law firm) since 2015; Partner, Perkins Coie LLP, 1988-2014 | 70 | Former Director, M Fund, Inc. (M Funds mutual fund family), July 2018-July 2019 |
Anne-Lee Verville
c/o Columbia Management
Investment Advisers, LLC
225 Franklin Street
Mail Drop BX32 05228
Boston, MA 02110
1945 | Trustee
1998 | Retired. General Manager, Global Education Industry, 1994-1997, President – Application Systems Division, 1991-1994, Chief Financial Officer – US Marketing & Services, 1988-1991, and Chief Information Officer, 1987-1988, IBM Corporation (computer and technology) | 70 | Former Director, Enesco Group, Inc. (producer of giftware and home and garden decor products), 2001-2006 |
Columbia Global Technology Growth Fund | Annual Report 2019
| 33 |
TRUSTEES AND OFFICERS (continued)
Consultants to the Independent Trustees*
| Name, address, year of birth | Position held with the Trust and length of service | Principal occupation(s) during the past five years and other relevant professional experience | Number of Funds in the Columbia Funds complex overseen | Other directorships held by Trustee during the past five years |
J. Kevin Connaughton
c/o Columbia
Management Investment
Advisers, LLC,
225 Franklin Street
Mail Drop BX32 05228,
Boston, MA 02110
1964 | Independent Trustee Consultant
2016 | Independent Trustee Consultant, Columbia Funds since March 2016; Adjunct Professor of Finance, Bentley University since November 2017; Managing Director and General Manager of Mutual Fund Products, Columbia Management Investment Advisers, LLC, May 2010-February 2015; President, Columbia Funds, 2009-2015; and senior officer of Columbia Funds and affiliated funds, 2003-2015 | 70 | Director, The Autism Project since March 2015; former Trustee, New Century Portfolios, March 2015-December 2017; formerly on Board of Governors, Gateway Healthcare, January 2016 – December 2017 |
Olive Darragh
c/o Columbia
Management Investment
Advisers, LLC,
225 Franklin Street,
Mail Drop BX32 05228,
Boston, MA 02110
1962 | Independent Trustee Consultant 2019 | Independent Trustee Consultant, Columbia Funds since June 2019; Managing Director of Darragh Inc. (a strategy and talent management consulting firm) since 2010; Founder and CEO, Zolio (an investment management talent identification platform) since 2004; Partner, Tudor Investments, 2004-2010; Senior Partner, McKinsey & Company, 2001-2004 | 70 | Director, University of Edinburgh Business School; former Director, Boston Public Library Foundation |
Natalie A. Trunow
c/o Columbia
Management Investment
Advisers, LLC,
225 Franklin Street
Mail Drop BX32 05228,
Boston, MA 02110
1967 | Independent Trustee Consultant
2016 | Independent Trustee Consultant, Columbia Funds since September 2016; Chief Executive Officer, Millennial Portfolio Solutions LLC (asset management and consulting services) since January 2016; Director of Investments, Casey Family Programs, April 2016-September 2016; Senior Vice President and Chief Investment Officer, Calvert Investments, August 2008-January 2016; Section Head and Portfolio Manager, General Motors Asset Management, June 1997-August 2008 | 70 | Director, Health Services for Children with Special Needs, Inc.; Director, Consumer Credit Counseling Services (formerly Guidewell Financial Solutions) |
| * | J. Kevin Connaughton was appointed consultant to the Independent Trustees effective March 1, 2016. Olive Darragh was appointed consultant to the Independent Trustees effective June 10, 2019. Natalie A. Trunow was appointed consultant to the Independent Trustees effective September 1, 2016. Shareholders of the Funds are expected to be asked to elect each of Mr. Connaughton, Ms. Darragh and Ms. Trunow as a Trustee at a future shareholder meeting. |
Interested trustee affiliated with Investment Manager*
| Name, address, year of birth | Position held with the Trust and length of service | Principal occupation(s) during the past five years and other relevant professional experience | Number of Funds in the Columbia Funds Complex overseen | Other directorships held by Trustee during the past five years |
William F. Truscott
c/o Columbia Management
Investment Advisers, LLC
225 Franklin Street
Boston, MA 02110
1960 | Trustee
2012 | Chairman of the Board and President, Columbia Management Investment Advisers, LLC since May 2010 and February 2012, respectively; Chief Executive Officer, Global Asset Management, Ameriprise Financial, Inc. since September 2012 (previously Chief Executive Officer, U.S. Asset Management & President, Annuities, May 2010-September 2012); Director and Chief Executive Officer, Columbia Management Investment Distributors, Inc. since May 2010 and February 2012, respectively; Chairman of the Board and Chief Executive Officer, RiverSource Distributors, Inc. since 2006; Director, Threadneedle Asset Management Holdings, SARL since 2014; President and Chief Executive Officer, Ameriprise Certificate Company, 2006-August 2012 | 192 | Chairman of the Board, Columbia Management Investment Advisers, LLC since May 2010; Director, Columbia Management Investment Distributors, Inc. since May 2010; former Director, Ameriprise Certificate Company, August 2006 - January 2013 |
| 34 | Columbia Global Technology Growth Fund | Annual Report 2019 |
TRUSTEES AND OFFICERS (continued)
| * | Interested person (as defined under the 1940 Act) by reason of being an officer, director, security holder and/or employee of the Investment Manager or Ameriprise Financial. |
The Statement of Additional Information has additional information about the Fund’s Board members and is available, without charge, upon request by calling 800.345.6611, visiting columbiathreadneedleus.com/investor/ or contacting your financial intermediary.
The Board has appointed officers who are responsible for day-to-day business decisions based on policies it has established. The officers serve at the pleasure of the Board. The following table provides basic information about the Officers of the Fund as of the printing of this report, including principal occupations during the past five years, although their specific titles may have varied over the period. In addition to Mr. Truscott, who is Senior Vice President, the Fund’s other officers are:
Fund officers
Name,
address and
year of birth | Position and year
first appointed to
position for any Fund
in the Columbia
Funds complex or a
predecessor thereof | Principal occupation(s) during past five years |
Christopher O. Petersen
5228 Ameriprise
Financial Center
Minneapolis, MN 55474
Born 1970 | President and Principal Executive Officer (2015) | Vice President and Lead Chief Counsel, Ameriprise Financial, Inc. since January 2015 (previously Vice President and Chief Counsel, January 2010 - December 2014; officer of Columbia Funds and affiliated funds since 2007. |
Michael G. Clarke
225 Franklin Street
Boston, MA 02110
Born 1969 | Chief Financial Officer (Principal Financial Officer) (2009) and Senior Vice President (2019) | Vice President, Head of North American Operations, and Co-Head of Global Operations, Columbia Management Investment Advisers, LLC, since June 2019 (previously Vice President – Accounting and Tax, May 2010 - May 2019); senior officer of Columbia Funds and affiliated funds since 2002 (previously Treasurer and Chief Accounting Officer, January 2009 - January 2019 and December 2015 - January 2019, respectively). |
Joseph Beranek
5890 Ameriprise
Financial Center
Minneapolis, MN 55474
Born 1965 | Treasurer and Chief Accounting Officer (Principal Accounting Officer) (2019) | Vice President — Mutual Fund Accounting and Financial Reporting, Columbia Management Investment Advisers, LLC, since December 2018 and March 2017, respectively (previously Vice President — Pricing and Corporate Actions, May 2010 - March 2017). |
Paul B. Goucher
485 Lexington Avenue
New York, NY 10017
Born 1968 | Senior Vice President (2011) and Assistant Secretary (2008) | Senior Vice President and Assistant General Counsel, Ameriprise Financial, Inc. since January 2017 (previously Vice President and Lead Chief Counsel, November 2008 - January 2017 and January 2013 - January 2017, respectively); Vice President, Chief Legal Officer and Assistant Secretary, Columbia Management Investment Advisers, LLC since March 2015 (previously Vice President and Assistant Secretary, May 2010 – March 2015). |
Thomas P. McGuire
225 Franklin Street
Boston, MA 02110
Born 1972 | Senior Vice President and Chief Compliance Officer (2012) | Vice President — Asset Management Compliance, Ameriprise Financial, Inc., since May 2010; Chief Compliance Officer, Ameriprise Certificate Company since September 2010. |
Colin Moore
225 Franklin Street
Boston, MA 02110
Born 1958 | Senior Vice President (2010) | Executive Vice President and Global Chief Investment Officer, Ameriprise Financial, Inc., since July 2013; Executive Vice President and Global Chief Investment Officer, Columbia Management Investment Advisers, LLC since July 2013. |
Ryan C. Larrenaga
225 Franklin Street
Boston, MA 02110
Born 1970 | Senior Vice President (2017), Chief Legal Officer (2017), and Secretary (2015) | Vice President and Chief Counsel, Ameriprise Financial, Inc. since August 2018 (previously Vice President and Group Counsel, August 2011 - August 2018); officer of Columbia Funds and affiliated funds since 2005. |
Michael E. DeFao
225 Franklin Street
Boston, MA 02110
Born 1968 | Vice President (2011) and Assistant Secretary (2010) | Vice President and Chief Counsel, Ameriprise Financial, Inc. since May 2010. |
Columbia Global Technology Growth Fund | Annual Report 2019
| 35 |
TRUSTEES AND OFFICERS (continued)
Fund officers (continued)
Name,
address and
year of birth | Position and year
first appointed to
position for any Fund
in the Columbia
Funds complex or a
predecessor thereof | Principal occupation(s) during past five years |
Lyn Kephart-Strong
5228 Ameriprise
Financial Center
Minneapolis, MN 55474
Born 1960 | Vice President (2015) | President, Columbia Management Investment Services Corp. since October 2014; Vice President & Resolution Officer, Ameriprise Trust Company since August 2009. |
Board Consideration and Approval of Management
Agreement
On June 12, 2019, the Board of Trustees (the Board) and the Trustees who are not interested persons (as defined in the Investment Company Act of 1940) (the Independent Trustees) of Columbia Funds Series Trust I (the Trust) unanimously approved the continuation of the Management Agreement (the Management Agreement) with Columbia Management Investment Advisers, LLC (the Investment Manager) with respect to Columbia Global Technology Growth Fund (the Fund), a series of the Trust. As detailed below, the Board’s Advisory Fees and Expenses Committee (the Committee) and the Board met on multiple occasions to review and discuss, among themselves, with the management team of the Investment Manager and with an independent fee consultant, materials provided by the Investment Manager, the independent fee consultant and others before determining to approve the continuation of the Management Agreement.
In connection with their deliberations regarding the continuation of the Management Agreement, the Committee and the Board evaluated materials requested from the Investment Manager regarding the Fund and the Management Agreement, and discussed these materials with representatives of the Investment Manager at Committee meetings held on March 5, 2019, April 25, 2019 and June 11, 2019 and at Board meetings held on March 6, 2019 and June 12, 2019. In addition, the Board and its various committees consider matters bearing on the Management Agreement at other meetings throughout the year and in prior years and meet regularly with senior management of the Trust and the Investment Manager. Through the Board’s Investment Oversight Committees, Trustees also meet with selected portfolio managers of the funds the Trustees oversee and with other investment personnel at various times throughout the year. The Committee and the Board also consulted with the independent fee consultant, Fund counsel and the Independent Trustees’ independent legal counsel, who advised on various matters with respect to the Committee’s and the Board’s considerations and otherwise assisted the Committee and the Board in their deliberations. On June 11, 2019, the Committee recommended that the Board approve the continuation of the Management Agreement. On June 12, 2019, the Board, including the Independent Trustees, voting separately, unanimously approved the continuation of the Management Agreement for the Fund.
The Committee and the Board considered all information that they, their legal counsel or the Investment Manager believed reasonably necessary to evaluate and to determine whether to recommend for approval or approve the continuation of the Management Agreement. The information and factors considered by the Committee and the Board in recommending for approval or approving the continuation of the Management Agreement for the Fund included the following:
| • | Information on the investment performance of the Fund relative to the performance of a group of mutual funds determined to be comparable to the Fund by an independent third-party data provider, as well as performance relative to benchmarks; |
| • | Information on the Fund’s management fees and total expenses, including information comparing the Fund’s expenses to those of a group of comparable mutual funds, as determined by the independent third-party data provider; |
| 36 | Columbia Global Technology Growth Fund | Annual Report 2019 |
Board Consideration and Approval of Management
Agreement (continued)
| • | The Investment Manager’s agreement to contractually limit or cap total operating expenses for the Fund through December 31, 2020 so that total operating expenses (excluding certain fees and expenses, such as transaction costs and certain other investment related expenses, interest, taxes, acquired fund fees and expenses, and infrequent and/or unusual expenses) would not exceed a specified annual rate, as a percentage of the Fund’s net assets; |
| • | The terms and conditions of the Management Agreement; |
| • | The current and proposed terms and conditions of other agreements and arrangements with affiliates of the Investment Manager relating to the operations of the Fund, including agreements with respect to the provision of distribution, transfer agency and shareholder services to the Fund; |
| • | Descriptions of various functions performed by the Investment Manager under the Management Agreement, including portfolio management and portfolio trading practices; |
| • | Information regarding the management fees of similarly-managed portfolios of other clients of the Investment Manager, including institutional accounts and collective trusts; |
| • | Information regarding the reputation, regulatory history and resources of the Investment Manager, including information regarding senior management, portfolio managers and other personnel; |
| • | Information regarding the capabilities of the Investment Manager with respect to compliance monitoring services, including an assessment of the Investment Manager’s compliance system by the Fund’s Chief Compliance Officer; and |
| • | The profitability to the Investment Manager and its affiliates from their relationships with the Fund. |
Nature, extent and quality of services provided under the Management Agreement
The Committee and the Board considered the nature, extent and quality of services provided to the Fund by the Investment Manager and its affiliates under the Management Agreement and under separate agreements for the provision of transfer agency and shareholder services, and the resources dedicated to the Fund and the other Columbia Funds by the Investment Manager and its affiliates. The Committee and the Board considered, among other things, the Investment Manager’s ability to attract, motivate and retain highly qualified research, advisory and supervisory investment professionals (including compensation programs for personnel involved in fund management, reputation and other attributes), the portfolio management services provided by those investment professionals, and the quality of the Investment Manager’s investment research capabilities and trade execution services. The Committee and the Board also considered the potential benefits to shareholders of investing in a mutual fund that is part of a fund complex offering exposure to a variety of asset classes and investment disciplines and providing a variety of fund and shareholder services.
The Committee and the Board also considered the professional experience and qualifications of the senior personnel of the Investment Manager, which included consideration of the Investment Manager’s experience with funds using an investment strategy similar to that used by the Investment Manager for the Fund. The Committee and the Board noted the compliance programs of and the compliance-related resources provided to the Fund by the Investment Manager and its affiliates and the resources dedicated by the Investment Manager and its affiliates to risk management, and considered the Investment Manager’s ability to provide administrative services to the Fund and coordinate the activities of the Fund’s other service providers. After reviewing these and related factors, the Committee and the Board concluded, within the context of their overall conclusions, that the nature, extent and quality of the services provided to the Fund under the Management Agreement supported the continuation of the Management Agreement.
Investment performance
The Committee and the Board reviewed information about the performance of the Fund over various time periods, including performance information relative to benchmarks, information that compared the performance of the Fund to the performance of a group of comparable mutual funds as determined by the independent third-party data provider, and information and analysis provided by the independent fee consultant. The Committee and the Board also reviewed a description of the third party’s methodology for identifying the Fund’s peer groups for purposes of performance and expense comparisons.
Columbia Global Technology Growth Fund | Annual Report 2019
| 37 |
Board Consideration and Approval of Management
Agreement (continued)
The Committee and the Board noted that, through December 31, 2018, the Fund’s performance was in the forty-fifth, twelfth and twelfth percentile (where the best performance would be in the first percentile) of its category selected by the independent third-party data provider for the purposes of performance comparisons for the one-, three- and five-year periods, respectively.
The Committee and the Board also considered the Investment Manager’s performance and reputation generally, the Investment Manager’s historical responsiveness to Board concerns about performance, and the Investment Manager’s willingness to take steps intended to improve performance. After reviewing these and related factors, the Committee and the Board concluded, within the context of their overall conclusions, that the performance of the Fund and the Investment Manager was sufficient, in light of other considerations, to support the continuation of the Management Agreement.
Investment management fee rates and other expenses
The Committee and the Board considered the management fees charged to the Fund under the Management Agreement as well as the total expenses incurred by the Fund. In assessing the reasonableness of the fees under the Management Agreement, the Committee and the Board considered, among other information, the Fund’s total expense ratio as a percentage of average daily net assets. The Committee and the Board considered data provided by the independent third-party data provider and the independent fee consultant. The Committee and the Board noted that, as of December 31, 2018, the Fund’s actual management fee and net total expense ratio were ranked in the third and second quintiles, respectively, (where the lowest fees and expenses would be in the first quintile) against the Fund’s expense universe as determined by the independent third-party data provider for purposes of expense comparison. The Committee and the Board also took into account the fee waiver and expense limitation arrangements agreed to by the Investment Manager, as noted above.
The Committee and the Board also received and considered information about the management fees charged by the Investment Manager to institutional accounts. In considering the fees charged to those accounts, the Committee and the Board took into account, among other things, the Investment Manager’s representations about the differences between managing mutual funds as compared to other types of accounts, including differences in the services provided, differences in the risk profile of such business for the Investment Manager and the additional resources required to manage mutual funds effectively. The Committee and the Board also received and considered information about the fees charged by the Investment Manager for sub-advisory services it provides to comparable unaffiliated funds. In evaluating the Fund’s management fees, the Committee and the Board also took into account the demands, complexity and quality of the investment management of the Fund.
After reviewing these and related factors, the Committee and the Board concluded, within the context of their overall conclusions, that the management fee rates and expenses of the Fund, in light of other considerations, supported the continuation of the Management Agreement.
Costs of services provided and profitability
The Committee and the Board also took note of the costs the Investment Manager and its affiliates incur in connection with the services provided and the profitability to the Investment Manager and its affiliates from their relationships with the Fund, and the efforts undertaken by the Investment Manager and its affiliates to manage efficiently their costs to provide such services.
The Committee and the Board also considered the compensation directly or indirectly received by the Investment Manager’s affiliates in connection with their relationships with the Fund. The Committee and the Board reviewed information provided by management as to the profitability to the Investment Manager and its affiliates of their relationships with the Fund, information about the allocation of expenses used to calculate profitability, and comparisons of profitability levels realized in 2018 to profitability levels realized in 2017. When reviewing profitability, the Committee and the Board also considered court cases in which adviser profitability was an issue in whole or in part, the performance of similarly managed funds, the performance of the Fund, and the expense ratio of the Fund. In addition, the Committee and the Board considered information provided by the Investment Manager regarding the Investment Manager’s financial condition and comparing its profitability to that of other asset management firms that are, or are subsidiaries of, publicly traded companies. In this regard, the Committee and the Board also considered data provided by the independent fee consultant.
| 38 | Columbia Global Technology Growth Fund | Annual Report 2019 |
Board Consideration and Approval of Management
Agreement (continued)
After reviewing these and related factors, the Committee and the Board concluded, within the context of their overall conclusions, that the costs of services provided and the profitability to the Investment Manager and its affiliates from their relationships with the Fund supported the continuation of the Management Agreement.
Economies of scale
The Committee and the Board considered the potential existence of economies of scale in the provision by the Investment Manager of services to the Fund, to groups of related funds, and to the Investment Manager’s investment advisory clients as a whole, and whether those economies of scale were shared with the Fund through breakpoints in investment management fees or other means, such as expense limitation arrangements and additional investments by the Investment Manager in investment, trading, compliance and other resources. The Committee and the Board noted that the management fee schedules for the Fund contained breakpoints that would reduce the fee rate on assets above specified threshold levels.
In considering these matters, the Committee and the Board also considered the costs of the services provided and the profitability to the Investment Manager and its affiliates from their relationships with the Fund, as noted above. After reviewing these and related factors, the Committee and the Board concluded, within the context of their overall conclusions, that the extent to which any economies of scale were expected to be shared with the Fund supported the continuation of the Management Agreement.
Other benefits to the Investment Manager
The Committee and the Board received and considered information regarding “fall-out” or ancillary benefits received by the Investment Manager and its affiliates as a result of their relationships with the Fund, such as the engagement of the Investment Manager’s affiliates to provide distribution, transfer agency and shareholder services to the Fund. In this regard, among other matters, the Committee and the Board considered that the Fund’s distributor retains a portion of the distribution fees from the Fund and receives a portion of the sales charges on sales or redemptions of certain classes of shares of the Fund. The Committee and the Board also considered the benefits of research made available to the Investment Manager by reason of brokerage commissions generated by the Fund’s securities transactions, and reviewed information about the Investment Manager’s practices with respect to considering brokerage and research services when allocating portfolio transactions. In this connection, the Board also noted that the amount of research made available to the Investment Manager by reason of brokerage commissions had been declining over time, and may decline further. The Committee and the Board recognized that the Investment Manager’s profitability would be somewhat lower without these benefits.
Conclusion
The Committee and the Board reviewed all of the above considerations in reaching their decisions to recommend or approve the continuation of the Management Agreement. In their deliberations, the Trustees did not identify any particular information that was all-important or controlling, and individual Trustees may have attributed different weights to the various factors. Based on their evaluation of all factors that they deemed to be material, including those factors described above, and assisted by the advice of independent legal counsel, the Board, including the Independent Trustees, voting separately, unanimously approved the continuation of the Management Agreement.
Columbia Global Technology Growth Fund | Annual Report 2019
| 39 |
Columbia Global Technology Growth Fund
P.O. Box 219104
Kansas City, MO 64121-9104
Please read and consider the investment objectives, risks, charges and expenses for any fund carefully before investing. For a prospectus and summary prospectus, which contains this and other important information about the Fund, go to
columbiathreadneedleus.com/investor/. The Fund is distributed by Columbia Management Investment Distributors, Inc., member FINRA, and managed by Columbia Management Investment Advisers, LLC.
Columbia Threadneedle Investments (Columbia Threadneedle) is the global brand name of the Columbia and Threadneedle group of companies. All rights reserved.
© 2019 Columbia Management Investment Advisers, LLC.
columbiathreadneedleus.com/investor/

Annual Report
August 31, 2019
Beginning on January 1, 2021, as permitted by regulations adopted by the Securities and Exchange Commission, paper copies of the Fund’s annual and semiannual shareholder reports like this one will no longer be sent by mail, unless you specifically request paper copies of the reports. Instead, the reports will be made available on the Fund’s website (columbiathreadneedleus.com/investor/), and each time a report is posted you will be notified by mail and provided with a website address to access the report.
If you have already elected to receive shareholder reports electronically, you will not be affected by this change and you need not take any action. You may elect to receive shareholder reports and other communications from the Fund electronically at any time by contacting your financial intermediary (such as a broker-dealer or bank) or, for Fund shares held directly with the Fund, by calling 800.345.6611 or by enrolling in “eDelivery” by logging into your account at columbiathreadneedleus.com/investor/.
You may elect to receive all future reports in paper free of charge. If you invest through a financial intermediary, you can contact your financial intermediary to request that you continue receiving paper copies of your shareholder reports. If you invest directly with the Fund, you can call 800.345.6611 to let the Fund know you wish to continue receiving paper copies of your shareholder reports. Your election to receive paper reports will apply to all Columbia Funds held in your account if you invest through a financial intermediary or all Columbia Funds held with the fund complex if you invest directly with the Fund.
Not FDIC Insured • No bank guarantee • May lose value
Columbia Balanced Fund (the Fund) mails one shareholder report to each shareholder address, unless such shareholder elected to receive shareholder reports from the Fund electronically. If you would like more than one report, please call shareholder services at 800.345.6611 and additional reports will be sent to you.
Proxy voting policies and procedures
The policy of the Board of Trustees is to vote the proxies of the companies in which the Fund holds investments consistent with the procedures as stated in the Statement of Additional Information (SAI). You may obtain a copy of the SAI without charge by calling 800.345.6611; contacting your financial intermediary; visiting columbiathreadneedleus.com/investor/; or searching the website of the Securities and Exchange Commission (SEC) at sec.gov. Information regarding how the Fund voted proxies relating to portfolio securities is filed with the SEC by August 31st for the most recent 12-month period ending June 30th of that year, and is available without charge by visiting columbiathreadneedleus.com/investor/, or searching the website of the SEC at sec.gov.
Quarterly schedule of investments
The Fund files a complete schedule of portfolio holdings with the SEC for the first and third quarters of each fiscal year on Form N-PORT, and for reporting periods ended prior to March 31, 2019, on Form N-Q. The Fund’s Form N-Q and Form N-PORT filings are available on the SEC’s website at sec.gov. The Fund’s complete schedule of portfolio holdings, as filed on Form N-Q or Form N-PORT, can also be obtained without charge, upon request, by calling 800.345.6611.
Additional Fund information
For more information about the Fund, please visit columbiathreadneedleus.com/investor/ or call 800.345.6611. Customer Service Representatives are available to answer your questions Monday through Friday from 8 a.m. to 7 p.m. Eastern time.
Fund investment manager
Columbia Management Investment Advisers, LLC (the Investment Manager)
225 Franklin Street
Boston, MA 02110
Fund distributor
Columbia Management Investment Distributors, Inc.
225 Franklin Street
Boston, MA 02110
Fund transfer agent
Columbia Management Investment Services Corp.
P.O. Box 219104
Kansas City, MO 64121-9104
Columbia Balanced Fund | Annual Report 2019
Investment objective
The Fund seeks high total return by investing in common stocks and debt securities.
Portfolio management
Guy Pope, CFA
Lead Portfolio Manager
Managed Fund since 1997
Jason Callan
Portfolio Manager
Managed Fund since 2018
Gregory Liechty
Portfolio Manager
Managed Fund since 2011
Ronald Stahl, CFA
Portfolio Manager
Managed Fund since 2005
| Average annual total returns (%) (for the period ended August 31, 2019) |
| | | Inception | 1 Year | 5 Years | 10 Years |
| Class A | Excluding sales charges | 11/01/02 | 4.79 | 6.35 | 9.42 |
| | Including sales charges | | -1.22 | 5.09 | 8.78 |
| Advisor Class* | 11/08/12 | 5.04 | 6.60 | 9.70 |
| Class C | Excluding sales charges | 10/13/03 | 4.00 | 5.55 | 8.60 |
| | Including sales charges | | 3.00 | 5.55 | 8.60 |
| Institutional Class | 10/01/91 | 5.04 | 6.61 | 9.69 |
| Institutional 2 Class* | 03/07/11 | 5.09 | 6.69 | 9.78 |
| Institutional 3 Class* | 11/08/12 | 5.14 | 6.74 | 9.80 |
| Class R* | 09/27/10 | 4.50 | 6.08 | 9.15 |
| Blended Benchmark | | 6.22 | 7.57 | 9.77 |
| S&P 500 Index | | 2.92 | 10.11 | 13.45 |
| Bloomberg Barclays U.S. Aggregate Bond Index | | 10.17 | 3.35 | 3.91 |
Returns for Class A shares are shown with and without the maximum initial sales charge of 5.75%. Returns for Class C shares are shown with and without the 1.00% contingent deferred sales charge for the first year only. The Fund’s other share classes are not subject to sales charges and have limited eligibility. Please see the Fund’s prospectus for details. Performance for different share classes will vary based on differences in sales charges and fees associated with each share class. All results shown assume reinvestment of distributions during the period. Returns do not reflect the deduction of taxes that a shareholder may pay on Fund distributions or on the redemption of Fund shares. Performance results reflect the effect of any fee waivers or reimbursements of Fund expenses by Columbia Management Investment Advisers, LLC and/or any of its affiliates. Absent these fee waivers or expense reimbursement arrangements, performance results would have been lower.
The performance information shown represents past performance and is not a guarantee of future results. The investment return and principal value of your investment will fluctuate so that your shares, when redeemed, may be worth more or less than their original cost. Current performance may be lower or higher than the performance information shown. You may obtain performance information current to the most recent month-end by contacting your financial intermediary, visiting columbiathreadneedle.com/investor/ or calling 800.345.6611.
| * | The returns shown for periods prior to the share class inception date (including returns for the Life of the Fund, if shown, which are since Fund inception) include the returns of the Fund’s oldest share class. These returns are adjusted to reflect any higher class-related operating expenses of the newer share classes, as applicable. Please visit investor.columbiathreadneedleus.com/investment-products/mutual-funds/appended-performance for more information. |
The Blended Benchmark is a weighted custom composite consisting of 60% S&P 500 Index and 40% Bloomberg Barclays U.S. Aggregate Bond Index.
The S&P 500 Index, an unmanaged index, measures the performance of 500 widely held, large-capitalization U.S. stocks and is frequently used as a general measure of market performance.
The Bloomberg Barclays U.S. Aggregate Bond Index is a broad-based benchmark that measures the investment-grade, U.S. dollar-denominated, fixed-rate taxable bond market, including Treasuries, government-related and corporate securities, mortgage-backed securities (agency fixed-rate and hybrid adjustable-rate mortgage passthroughs), asset-backed securities, and commercial mortgage-backed securities.
Indices are not available for investment, are not professionally managed and do not reflect sales charges, fees, brokerage commissions, taxes or other expenses of investing. Securities in the Fund may not match those in an index.
Columbia Balanced Fund | Annual Report 2019
| 3 |
Fund at a Glance (continued)
Performance of a hypothetical $10,000 investment (August 31, 2009 — August 31, 2019)
The chart above shows the change in value of a hypothetical $10,000 investment in Class A shares of Columbia Balanced Fund during the stated time period, and does not reflect the deduction of taxes that a shareholder may pay on Fund distributions or on the redemption of Fund shares.
| Top 10 holdings (%) (at August 31, 2019) |
| Microsoft Corp. | 3.5 |
Federal National Mortgage Association
09/12/2049 4.000% | 2.4 |
| Berkshire Hathaway, Inc., Class B | 2.4 |
| Apple, Inc. | 2.3 |
Federal National Mortgage Association
09/12/2049 3.500% | 2.2 |
| Amazon.com, Inc. | 2.0 |
U.S. Treasury
02/15/2045 2.500% | 1.9 |
| MasterCard, Inc., Class A | 1.8 |
| Medtronic PLC | 1.8 |
| JPMorgan Chase & Co. | 1.7 |
Percentages indicated are based upon total investments excluding Money Market Funds and investments in derivatives, if any.
For further detail about these holdings, please refer to the section entitled “Portfolio of Investments.”
Fund holdings are as of the date given, are subject to change at any time, and are not recommendations to buy or sell any security.
| Portfolio breakdown (%) (at August 31, 2019) |
| Asset-Backed Securities — Non-Agency | 5.7 |
| Commercial Mortgage-Backed Securities - Agency | 0.2 |
| Commercial Mortgage-Backed Securities - Non-Agency | 2.7 |
| Common Stocks | 56.2 |
| Corporate Bonds & Notes | 8.5 |
| Exchange-Traded Funds | 0.9 |
| Foreign Government Obligations | 0.0(a) |
| Inflation-Indexed Bonds | 0.6 |
| Money Market Funds | 5.4 |
| Residential Mortgage-Backed Securities - Agency | 9.3 |
| Residential Mortgage-Backed Securities - Non-Agency | 8.4 |
| Senior Loans | 0.0(a) |
| U.S. Government & Agency Obligations | 0.3 |
| U.S. Treasury Obligations | 1.8 |
| Total | 100.0 |
Percentages indicated are based upon total investments excluding investments in derivatives, if any. The Fund’s portfolio composition is subject to change.
| 4 | Columbia Balanced Fund | Annual Report 2019 |
Manager Discussion of Fund Performance
For the 12-month period that ended August 31, 2019, the Fund’s Class A shares returned 4.79% excluding sales charges. The Fund’s Blended Benchmark returned 6.22%. During the same 12-month period, the Fund’s equity benchmark, the S&P 500 Index, returned 2.92% while the Fund’s fixed-income benchmark, the Bloomberg Barclays U.S. Aggregate Bond Index, returned 10.17%. An overweight in stocks weighed on results, as bonds outperformed stocks for the period. The equity portion of the Fund performed in line with the equity benchmark while the fixed-income portion outperformed the Fund’s fixed-income benchmark.
Trade concerns, interest rates drove financial markets
Optimism prevailed early in the 12-month period ended August 31, 2019, as positive global economic conditions, the impact of broad U.S. corporate tax cuts and moves to reduce regulation in a number of industries buoyed confidence. The labor markets added 173,000 jobs per month, on average, and manufacturing activity remained solid. Unemployment fell to a 50-year low of 3.7%.
However, the economic backdrop looked less rosy as the period wore on. U.S. growth slowed from above 3.0% to 2.1% (annualized). European economies transitioned to a slower pace of growth, struggling with rising interest rates, trade tensions and uncertainty surrounding Brexit, the U.K.’s departure from the European Union. At the same time, China’s economic conditions weakened and emerging markets came under pressure, driven by trade and tariff concerns and a rising U.S. dollar.
With global uncertainties on the rise, investors sold stocks and other risky assets late in 2018. Stock markets rebounded early in 2019, as the Federal Reserve (Fed) backed away from additional rate hikes, then dipped again in the final months of the period as trade concerns amplified. Late in July, the Fed lowered its key short-term borrowing rate by 25 basis points (a basis point is one hundredth of one percent).
Bonds solidly outperformed equities for the 12-month period. The Bloomberg Barclays U.S. Aggregate Bond Index, a broad measure of investment-grade bonds, returned 10.17%. The S&P 500 Index, a broad measure of U.S. stock returns, gained 2.92%.
Stock selection drove equity portfolio performance
In a volatile period for equities, the Fund generated solid gains through positive stock selection, especially in the information technology, real estate and communication services sectors. The Fund also benefited from a generally positive environment for growth stocks, which have been the beneficiaries of solid economic growth and low interest rates.
In the information technology sector, MasterCard, Microsoft and Fidelity National were standout performers for the Fund. Mastercard has chalked up phenomenal growth for such a large company. The company has benefited from the continued shift from cash to card payments, especially for smaller purchases, and from the growth in online purchases, which by definition are card purchases. We believe that Mastercard has the potential for additional domestic growth as well as international growth over the longer term. Microsoft continued to benefit from its shift to the Cloud. We believe CEO Satya Nadella has done a great job of focusing the company on its core software business, which has enabled productivity for clients. Revenues and earnings have grown nicely, the valuation of the company has expanded and we believe investors have gained appreciation for the durability and growth potential of the franchise. Fidelity National is a financial processing and software company that provides software primarily to financial institutions. The company acquired Worldpay, which the Fund also owns, in a transaction that closed near the end of the period. We believe the acquisition has the potential to drive complimentary synergies for the combined organization. The move was broadly applauded by investors.
In the real estate sector, a position in global cell tower company American Tower generated outstanding gains. Management has executed well, and investors anticipate a healthy runway of growth linked to the introduction of fifth generation cellular network technology, commonly known as 5G. We believe that American Tower has the potential to see increased demand for its services as 5G technology is rolled out across the globe.
Columbia Balanced Fund | Annual Report 2019
| 5 |
Manager Discussion of Fund Performance (continued)
In the communication services sector, Comcast was a solid performer, with a double-digit rebound from the previous fiscal year. Early in 2018, Comcast announced that it would acquire U.K. media giant Sky, beefing up its international presence. However, investors took a dim view of the acquisition and Comcast shares lost ground. Then, shares gained traction in 2019 as investors became more comfortable with the integration of the acquisition and strong broadband subscriber growth allayed concerns about weak video subscriber trends.
In the biotechnology industry within health care, Biogen was a significant disappointment as the company’s high-expectation Alzheimer’s drugaducanumabfailed in its phase 3 trial. We had decreased the Fund’s position in Biogen, which helped mitigate the impact of its underperformance. American clothing company PVH, owner of Calvin Klein, Tommy Hilfiger and other recognized brands, was hurt by slowing global growth and the potential impact of tariffs on the business. We chose to exit the position. In the financial sector, the Fund lost ground with Wells Fargo. The company’s issues have taken longer than expected to resolve and the board has been slow to identify a replacement for the CEO, who recently stepped down. In addition, Wells Fargo has been hurt by declining interest rates, which have been a challenge for most banks. We reduced the Fund’s exposure but retained a position in Wells Fargo.
Portfolio positioning aided fixed-income outperformance
Overweights in the wireline, media and REIT segments of the corporate market and in BBB rated securities pushed the fixed-income portfolio’s return above its benchmark. Overweights in both asset-backed securities (ABS) and commercial mortgage-backed securities (CMBS) also aided relative performance, as both outperformed U.S. Treasuries.
Within the corporate market, exposure to the electric utility and energy segments had a negative impact on performance as they underperformed Treasuries for the year. Agency mortgage backed securities (MBS) also underperformed Treasuries. The Fund was mostly underweight in agency MBS and held a higher weighted-average coupon than the benchmark. We moved closer to a neutral weight near the end of the reporting period. Within the securitized market, we continued to find particular value in ABS, CMBS and non-agency CMOs.
During the period, we reduced the portfolio’s exposure to corporate bonds, because we saw more value in non-agency MBS and CMBS and in certain segments of the ABS sector. The portfolio’s largest overweight relative to the fixed-income benchmark was in non-agency CMOs, where we are constructive on consumer fundamentals, while finding particular value in the pricing, structure and performance of a variety of non-agency CMO collateral types.
At period’s end
Mindful of the uncertainties of a slowing economy, the late stage of the economic cycle, rising geopolitical tensions and the forthcoming elections, we believed that investors will have much to negotiate and evaluate in the months ahead. As always, we plan to use the contrarian process that has served us well to find opportunities in the equity market and manage risk in the portfolio. We believe this discipline has also served our shareholders well over the long term.
Within the Fund’s fixed-income portfolio, we targeted duration, a measure of interest-rate sensitivity, that is relatively neutral to that of the benchmark, as interest rates remained range bound. (We use Treasury future contracts to hedge the Fund’s duration.) We continued to watch employment figures and monitored the impact of trade concerns on the global economy, even though we believed the risks of an escalating trade war have recently eased. Interest rate policy remained data dependent, with expectations leaning toward more cuts from the Fed. Economic indicators continued to point towards weakness in global manufacturing with no signs of inflationary pressures.
At the end of the period, the portfolio remained underweight in U.S. government securities relative to its fixed-income benchmark. We expect spread volatility but consider current risk premiums to be reasonably attractive in most sectors. We continued to like high quality non-agency CMOs, ABS and CMBS, as the yields they offered remained attractive relative to similar-duration Treasuries. We also believed the corporate sector had the potential to outperform Treasuries, especially lower quality segments of the corporate bond market. With the overall supply of corporate bonds lower than in the prior 12-month period, demand for corporate bonds remained strong.
| 6 | Columbia Balanced Fund | Annual Report 2019 |
Manager Discussion of Fund Performance (continued)
Marketrisk may affect a single issuer, sector of the economy, industry or the market as a whole. There are risks associated withfixed-income investments, including credit risk, interest rate risk, and prepayment and extension risk. In general, bond prices rise wheninterest rates fall and vice versa. This effect is usually more pronounced for longer term securities. A rise in interest rates may result in a price decline of fixed-income instruments held by the Fund, negatively impacting its performance and NAV. Falling rates may result in the Fund investing in lower yielding debt instruments, lowering the Fund’s income and yield. These risks may be heightened for longer maturity and duration securities.Foreigninvestments subject the Fund to risks, including political, economic, market, social and others within a particular country, as well as to currency instabilities and less stringent financial and accounting standards generally applicable to U.S. issuers. Investing inderivativesis a specialized activity that involves special risks that subject the Fund to significant loss potential, including when used as leverage, and may result in greater fluctuation in Fund value. See the Fund’s prospectus for more information on these and other risks.
The views expressed in this report reflect the current views of the respective parties. These views are not guarantees of future performance and involve certain risks, uncertainties and assumptions that are difficult to predict, so actual outcomes and results may differ significantly from the views expressed. These views are subject to change at any time based upon economic, market or other conditions and the respective parties disclaim any responsibility to update such views. These views may not be relied on as investment advice and, because investment decisions for a Columbia fund are based on numerous factors, may not be relied on as an indication of trading intent on behalf of any particular Columbia fund. References to specific securities should not be construed as a recommendation or investment advice.
Columbia Balanced Fund | Annual Report 2019
| 7 |
Understanding Your Fund’s Expenses
(Unaudited)
As an investor, you incur two types of costs. There are shareholder transaction costs, which generally include sales charges on purchases and may include redemption fees. There are also ongoing fund costs, which generally include management fees, distribution and/or service fees, and other fund expenses. The following information is intended to help you understand your ongoing costs (in dollars) of investing in the Fund and to help you compare these costs with the ongoing costs of investing in other mutual funds.
Analyzing your Fund’s expenses
To illustrate these ongoing costs, we have provided examples and calculated the expenses paid by investors in each share class of the Fund during the period. The actual and hypothetical information in the table is based on an initial investment of $1,000 at the beginning of the period indicated and held for the entire period. Expense information is calculated two ways and each method provides you with different information. The amount listed in the “Actual” column is calculated using the Fund’s actual operating expenses and total return for the period. You may use the Actual information, together with the amount invested, to estimate the expenses that you paid over the period. Simply divide your account value by $1,000 (for example, an $8,600 account value divided by $1,000 = 8.6), then multiply the results by the expenses paid during the period under the “Actual” column. The amount listed in the “Hypothetical” column assumes a 5% annual rate of return before expenses (which is not the Fund’s actual return) and then applies the Fund’s actual expense ratio for the period to the hypothetical return. You should not use the hypothetical account values and expenses to estimate either your actual account balance at the end of the period or the expenses you paid during the period. See “Compare with other funds” below for details on how to use the hypothetical data.
Compare with other funds
Since all mutual funds are required to include the same hypothetical calculations about expenses in shareholder reports, you can use this information to compare the ongoing cost of investing in the Fund with other funds. To do so, compare the hypothetical example with the 5% hypothetical examples that appear in the shareholder reports of other funds. As you compare hypothetical examples of other funds, it is important to note that hypothetical examples are meant to highlight the ongoing costs of investing in a fund only and do not reflect any transaction costs, such as sales charges, or redemption or exchange fees. Therefore, the hypothetical calculations are useful in comparing ongoing costs only, and will not help you determine the relative total costs of owning different funds. If transaction costs were included in these calculations, your costs would be higher.
| March 1, 2019 — August 31, 2019 |
| | Account value at the
beginning of the
period ($) | Account value at the
end of the
period ($) | Expenses paid during
the period ($) | Fund’s annualized
expense ratio (%) |
| | Actual | Hypothetical | Actual | Hypothetical | Actual | Hypothetical | Actual |
| Class A | 1,000.00 | 1,000.00 | 1,069.80 | 1,020.31 | 4.93 | 4.81 | 0.95 |
| Advisor Class | 1,000.00 | 1,000.00 | 1,071.00 | 1,021.56 | 3.63 | 3.55 | 0.70 |
| Class C | 1,000.00 | 1,000.00 | 1,065.60 | 1,016.55 | 8.80 | 8.59 | 1.70 |
| Institutional Class | 1,000.00 | 1,000.00 | 1,071.20 | 1,021.56 | 3.63 | 3.55 | 0.70 |
| Institutional 2 Class | 1,000.00 | 1,000.00 | 1,071.40 | 1,021.81 | 3.38 | 3.29 | 0.65 |
| Institutional 3 Class | 1,000.00 | 1,000.00 | 1,071.70 | 1,022.01 | 3.17 | 3.09 | 0.61 |
| Class R | 1,000.00 | 1,000.00 | 1,068.50 | 1,019.05 | 6.22 | 6.07 | 1.20 |
Expenses paid during the period are equal to the annualized expense ratio for each class as indicated above, multiplied by the average account value over the period and then multiplied by the number of days in the Fund’s most recent fiscal half year and divided by 365.
Expenses do not include fees and expenses incurred indirectly by the Fund from its investment in underlying funds, including affiliated and non-affiliated pooled investment vehicles, such as mutual funds and exchange-traded funds.
| 8 | Columbia Balanced Fund | Annual Report 2019 |
Portfolio of Investments
August 31, 2019
(Percentages represent value of investments compared to net assets)
Investments in securities
| Asset-Backed Securities — Non-Agency 6.0% |
| Issuer | Coupon
Rate | | Principal
Amount ($) | Value ($) |
| American Credit Acceptance Receivables Trust(a) |
| Subordinated, Series 2018-3 Class C |
| 10/15/2024 | 3.750% | | 5,600,000 | 5,664,771 |
| Apidos CLO XI(a),(b),(c),(d) |
| Series 2012-11A Class BRR |
3-month USD LIBOR + 1.700%
Floor 1.750%
10/17/2030 | 3.000% | | 12,575,000 | 12,575,000 |
| Apidos CLO XX(a),(c) |
| Series 2015-20A Class A1RA |
3-month USD LIBOR + 1.100%
07/16/2031 | 3.422% | | 15,245,000 | 15,151,777 |
| Apidos CLO XXVIII(a),(c) |
| Series 2017-28A Class A1B |
3-month USD LIBOR + 1.150%
Floor 1.150%
01/20/2031 | 3.428% | | 5,925,000 | 5,754,698 |
| ARES XLVII CLO Ltd.(a),(c) |
| Series 2018-47A Class B |
3-month USD LIBOR + 1.450%
Floor 1.450%
04/15/2030 | 3.753% | | 3,450,000 | 3,401,838 |
| Avant Loans Funding Trust(a) |
| Series 2019-A Class B |
| 12/15/2022 | 3.800% | | 5,975,000 | 6,068,619 |
| Avis Budget Rental Car Funding AESOP LLC(a) |
| Series 2016-2A Class A |
| 11/20/2022 | 2.720% | | 4,100,000 | 4,145,203 |
| Series 2018-2A Class A |
| 03/20/2025 | 4.000% | | 19,775,000 | 21,227,377 |
| Barings CLO Ltd.(a),(c) |
| Series 2018-4A Class B |
3-month USD LIBOR + 1.700%
Floor 1.700%
10/15/2030 | 4.003% | | 22,000,000 | 21,750,718 |
| Carbone CLO Ltd.(a),(c) |
| Series 2017-1A Class A1 |
3-month USD LIBOR + 1.140%
01/20/2031 | 3.418% | | 12,000,000 | 11,941,788 |
| Carlyle Group LP(a),(c) |
| Series 2017-5A Class A2 |
3-month USD LIBOR + 1.400%
01/20/2030 | 3.678% | | 2,000,000 | 1,949,104 |
| Carlyle US CLO Ltd.(a),(c) |
| Series 2016-4A Class A2R |
3-month USD LIBOR + 1.450%
Floor 1.450%
10/20/2027 | 3.728% | | 21,575,000 | 21,305,571 |
| Asset-Backed Securities — Non-Agency (continued) |
| Issuer | Coupon
Rate | | Principal
Amount ($) | Value ($) |
| Chesapeake Funding II LLC(a) |
| Series 2016-2A Class A1 |
| 06/15/2028 | 1.880% | | 690,840 | 690,167 |
| Conn’s Receivables Funding LLC(a) |
| Series 2018-A Class A |
| 01/15/2023 | 3.250% | | 1,056,922 | 1,060,971 |
| Consumer Loan Underlying Bond Credit Trust(a) |
| Series 2018-P2 Class A |
| 10/15/2025 | 3.470% | | 7,595,492 | 7,638,719 |
| Drive Auto Receivables Trust |
| Series 2018-4 Class C |
| 11/15/2024 | 3.660% | | 9,600,000 | 9,731,937 |
| Series 2019-2 Class C |
| 06/16/2025 | 3.420% | | 6,300,000 | 6,459,399 |
| Subordinated Series 2018-4 Class D |
| 01/15/2026 | 4.090% | | 10,900,000 | 11,243,454 |
| Subordinated Series 2018-5 Class C |
| 01/15/2025 | 3.990% | | 7,225,000 | 7,445,442 |
| Dryden 33 Senior Loan Fund(a),(c) |
| Series 2014-33A Class AR2 |
3-month USD LIBOR + 1.230%
Floor 1.230%
04/15/2029 | 3.533% | | 3,000,000 | 3,000,690 |
| Series 2014-33A Class BR2 |
3-month USD LIBOR + 1.750%
Floor 1.750%
04/15/2029 | 4.053% | | 3,450,000 | 3,444,825 |
| Dryden 41 Senior Loan Fund(a),(c) |
| Series 2015-41A Class AR |
3-month USD LIBOR + 0.970%
Floor 0.970%
04/15/2031 | 3.273% | | 13,175,000 | 13,055,134 |
| Dryden 42 Senior Loan Fund(a),(c) |
| Series 2016-42A Class BR |
3-month USD LIBOR + 1.550%
07/15/2030 | 3.853% | | 6,025,000 | 5,939,463 |
| Dryden 55 CLO Ltd.(a),(c) |
| Series 2018-55A Class A1 |
3-month USD LIBOR + 1.020%
04/15/2031 | 3.323% | | 8,450,000 | 8,394,610 |
| DT Auto Owner Trust(a) |
| Series 2019-1A Class C |
| 11/15/2024 | 3.610% | | 5,000,000 | 5,097,498 |
| Series 2019-3A Class D |
| 04/15/2025 | 2.960% | | 10,025,000 | 10,137,944 |
| Subordinated Series 2018-3A Class B |
| 09/15/2022 | 3.560% | | 6,575,000 | 6,665,723 |
The accompanying Notes to Financial Statements are an integral part of this statement.
Columbia Balanced Fund | Annual Report 2019
| 9 |
Portfolio of Investments (continued)
August 31, 2019
| Asset-Backed Securities — Non-Agency (continued) |
| Issuer | Coupon
Rate | | Principal
Amount ($) | Value ($) |
| Subordinated, Series 2018-3A Class C |
| 07/15/2024 | 3.790% | | 8,400,000 | 8,563,074 |
| Foundation Finance Trust(a),(b),(e) |
| Series 2019-1A Class A |
| 11/15/2034 | 3.860% | | 5,986,643 | 6,004,603 |
| Hilton Grand Vacations Trust(a) |
| Series 2013-A Class A |
| 01/25/2026 | 2.280% | | 204,492 | 204,455 |
| Series 2014-AA Class A |
| 11/25/2026 | 1.770% | | 422,846 | 421,156 |
| Series 2018-AA Class A |
| 02/25/2032 | 3.540% | | 3,400,509 | 3,534,351 |
| Series 2019-AA Class A |
| 07/25/2033 | 2.340% | | 7,760,000 | 7,778,981 |
| Jay Park CLO Ltd.(a),(c) |
| Series 2016-1A Class A2R |
3-month USD LIBOR + 1.450%
10/20/2027 | 3.728% | | 25,675,000 | 25,534,609 |
| Magnetite XII Ltd.(a),(c) |
| Series 2015-12A Class ARR |
3-month USD LIBOR + 1.100%
10/15/2031 | 3.403% | | 13,830,000 | 13,786,629 |
| Marlette Funding Trust(a) |
| Series 2018-4A Class A |
| 12/15/2028 | 3.710% | | 4,483,638 | 4,529,252 |
| Series 2019-1A Class A |
| 04/16/2029 | 3.440% | | 3,899,076 | 3,937,221 |
| Series 2019-3A Class B |
| 09/17/2029 | 3.070% | | 10,780,000 | 10,902,102 |
| Subordinated Series 2019-2A Class B |
| 07/16/2029 | 3.530% | | 4,550,000 | 4,644,999 |
| MVW Owner Trust(a) |
| Series 2015-1A Class A |
| 12/20/2032 | 2.520% | | 1,023,329 | 1,025,094 |
| Series 2016-1A Class A |
| 12/20/2033 | 2.250% | | 1,716,394 | 1,711,591 |
| New York City Tax Lien Trust(a) |
| Series 2017-A Class A |
| 11/10/2030 | 1.870% | | 416,366 | 417,469 |
| Octagon Investment Partners 39 Ltd.(a),(c) |
| Series 2018-3A Class B |
3-month USD LIBOR + 1.650%
Floor 1.650%
10/20/2030 | 4.128% | | 22,575,000 | 22,348,956 |
| Ocwen Master Advance Receivables Trust(a) |
| Series 2019-T1 Class AT1 |
| 08/15/2050 | 2.514% | | 1,725,000 | 1,727,230 |
| Series 2019-T1 Class DT1 |
| 08/15/2050 | 3.107% | | 975,000 | 976,255 |
| Asset-Backed Securities — Non-Agency (continued) |
| Issuer | Coupon
Rate | | Principal
Amount ($) | Value ($) |
| Prosper Marketplace Issuance Trust(a) |
| Series 2019-1A Class A |
| 04/15/2025 | 3.540% | | 3,050,161 | 3,066,480 |
| Series 2019-2A Class B |
| 09/15/2025 | 3.690% | | 6,175,000 | 6,226,090 |
| Series 2019-3A Class B |
| 07/15/2025 | 3.590% | | 6,100,000 | 6,157,425 |
| Redding Ridge Asset Management Ltd.(a),(c) |
| Series 2018-4A Class A2 |
3-month USD LIBOR + 1.550%
04/15/2030 | 3.803% | | 3,000,000 | 2,956,173 |
| Sierra Receivables Funding Co., LLC(a) |
| Series 2017-1A Class A |
| 03/20/2034 | 2.910% | | 1,359,048 | 1,380,219 |
| Sierra Timeshare Receivables Funding LLC(a) |
| Series 2016-3A Class A |
| 10/20/2033 | 2.430% | | 1,720,582 | 1,724,114 |
| Series 2018-2A Class A |
| 06/20/2035 | 3.500% | | 3,288,202 | 3,362,045 |
| Series 2018-3A Class A |
| 09/20/2035 | 3.690% | | 2,381,790 | 2,435,361 |
| SoFi Consumer Loan Program LLC(a) |
| Series 2017-4 Class A |
| 05/26/2026 | 2.500% | | 1,908,198 | 1,911,297 |
| SoFi Consumer Loan Program Trust(a) |
| Series 2019-1 Class B |
| 02/25/2028 | 3.450% | | 5,050,000 | 5,196,562 |
| SPS Servicer Advance Receivables Trust Advance Receivables Backed Notes(a) |
| Series 2018-T1 Class AT1 |
| 10/17/2050 | 3.620% | | 7,179,993 | 7,281,374 |
| Upgrade Receivables Trust(a) |
| Series 2019-2A Class B |
| 10/15/2025 | 3.510% | | 3,263,000 | 3,262,475 |
| Voya CLO Ltd.(a),(c) |
| Series 2017-3A Class A2 |
3-month USD LIBOR + 1.770%
07/20/2030 | 4.048% | | 4,000,000 | 3,972,296 |
| VSE Voi Mortgage LLC(a) |
| Series 2018-A Class A |
| 02/20/2036 | 3.560% | | 4,743,897 | 4,919,453 |
| Westlake Automobile Receivables Trust(a) |
| Series 2019-1A Class C |
| 03/15/2024 | 3.450% | | 7,600,000 | 7,733,657 |
Total Asset-Backed Securities — Non-Agency
(Cost $407,797,176) | 410,575,488 |
|
The accompanying Notes to Financial Statements are an integral part of this statement.
| 10 | Columbia Balanced Fund | Annual Report 2019 |
Portfolio of Investments (continued)
August 31, 2019
| Commercial Mortgage-Backed Securities - Agency 0.2% |
| Issuer | Coupon
Rate | | Principal
Amount ($) | Value ($) |
| Government National Mortgage Association |
| CMO Series 2012-25 Class A |
| 11/16/2042 | 2.575% | | 488,494 | 488,638 |
| CMO Series 2012-58 Class A |
| 01/16/2040 | 2.500% | | 498,927 | 498,528 |
| CMO Series 2014-33 Class A |
| 08/16/2039 | 2.300% | | 566,210 | 566,757 |
| CMO Series 2014-64 Class A |
| 02/16/2045 | 2.200% | | 707,152 | 705,074 |
| CMO Series 2014-67 Class AE |
| 05/16/2039 | 2.150% | | 466,521 | 468,931 |
| CMO Series 2015-33 Class AH |
| 02/16/2045 | 2.650% | | 610,985 | 613,476 |
| CMO Series 2015-85 Class AF |
| 05/16/2044 | 2.400% | | 4,231,779 | 4,238,249 |
| CMO Series 2016-39 Class AG |
| 01/16/2043 | 2.300% | | 6,041,583 | 6,043,405 |
Total Commercial Mortgage-Backed Securities - Agency
(Cost $13,762,030) | 13,623,058 |
|
| Commercial Mortgage-Backed Securities - Non-Agency 2.8% |
| | | | |
| American Homes 4 Rent Trust(a) |
| Series 2014-SFR2 Class A |
| 10/17/2036 | 3.786% | | 2,786,415 | 2,962,617 |
| Series 2014-SFR3 Class A |
| 12/17/2036 | 3.678% | | 3,258,619 | 3,446,119 |
| Series 2015-SFR1 Class A |
| 04/17/2052 | 3.467% | | 3,383,693 | 3,554,078 |
| Series 2015-SFR2 Class A |
| 10/17/2045 | 3.732% | | 2,544,213 | 2,719,288 |
| Americold 2010 LLC(a) |
| Series 2010-ARTA Class A1 |
| 01/14/2029 | 3.847% | | 78,050 | 78,891 |
| Ashford Hospitality Trust(a),(c) |
| Series 2018-KEYS Class B |
1-month USD LIBOR + 1.300%
Floor 1.300%
05/15/2035 | 3.495% | | 8,525,000 | 8,509,031 |
| BBCMS Trust(a),(c) |
| Subordinated, Series 2018-BXH Class B |
1-month USD LIBOR + 1.250%
Floor 1.250%
10/15/2037 | 3.445% | | 7,370,000 | 7,370,002 |
| Subordinated, Series 2018-BXH Class C |
1-month USD LIBOR + 1.500%
Floor 1.500%
10/15/2037 | 3.695% | | 3,975,000 | 3,974,924 |
| Commercial Mortgage-Backed Securities - Non-Agency (continued) |
| Issuer | Coupon
Rate | | Principal
Amount ($) | Value ($) |
| BX Commercial Mortgage Trust(a),(c) |
| Series 2018-IND Class C |
1-month USD LIBOR + 1.100%
Floor 1.100%
11/15/2035 | 3.295% | | 7,735,478 | 7,730,560 |
| Commercial Mortgage Trust |
| Series 2013-CR8 Class A5 |
| 06/10/2046 | 3.612% | | 10,380,000 | 10,945,677 |
| CSAIL Commercial Mortgage Trust |
| Series 2016-C5 Class A1 |
| 11/15/2048 | 1.747% | | 613,302 | 611,386 |
| DBUBS Mortgage Trust(a) |
| Series 2011-LC1A Class A3 |
| 11/10/2046 | 5.002% | | 148,437 | 151,734 |
| Home Partners of America Trust(a),(c) |
| Series 2018-1 Class A |
1-month USD LIBOR + 0.900%
Floor 0.900%
07/17/2037 | 3.082% | | 9,324,997 | 9,316,901 |
| Invitation Homes Trust(a),(c) |
| Series 2018-SFR3 Class A |
1-month USD LIBOR + 1.000%
Floor 1.000%
07/17/2037 | 3.182% | | 16,915,057 | 16,900,357 |
| Series 2018-SFR4 Class A |
1-month USD LIBOR + 1.100%
Floor 1.000%
01/17/2038 | 3.282% | | 9,763,916 | 9,803,803 |
| JPMBB Commercial Mortgage Securities Trust |
| Series 2013-C14 Class ASB |
| 08/15/2046 | 3.761% | | 3,673,042 | 3,797,696 |
| JPMorgan Chase Commercial Mortgage Securities Trust(a) |
| Series 2011-C3 Class A4 |
| 02/15/2046 | 4.717% | | 393,251 | 403,866 |
| Morgan Stanley Capital I Trust(a) |
| Series 2011-C1 Class A4 |
| 09/15/2047 | 5.033% | | 266,070 | 271,240 |
| Morgan Stanley Capital I Trust |
| Series 2016-BNK2 Class A2 |
| 11/15/2049 | 2.454% | | 5,625,000 | 5,666,256 |
| Progress Residential Trust(a) |
| Series 2018-SF3 Class A |
| 10/17/2035 | 3.880% | | 23,884,984 | 24,857,760 |
| Series 2018-SFR2 Class A |
| 08/17/2035 | 3.712% | | 4,305,000 | 4,453,952 |
| Series 2019-SFR3 Class C |
| 09/17/2036 | 2.721% | | 4,750,000 | 4,744,244 |
| Series 2019-SFR3 Class D |
| 09/17/2036 | 2.871% | | 7,049,000 | 7,073,275 |
The accompanying Notes to Financial Statements are an integral part of this statement.
Columbia Balanced Fund | Annual Report 2019
| 11 |
Portfolio of Investments (continued)
August 31, 2019
| Commercial Mortgage-Backed Securities - Non-Agency (continued) |
| Issuer | Coupon
Rate | | Principal
Amount ($) | Value ($) |
| Subordinated Series 2019-SFR2 Class C |
| 05/17/2036 | 3.545% | | 6,350,000 | 6,560,100 |
| RETL(a),(c) |
| Series 2019-RVP Class A |
1-month USD LIBOR + 1.150%
Floor 1.150%
03/15/2036 | 3.345% | | 3,956,260 | 3,963,652 |
| UBS-Barclays Commercial Mortgage Trust |
| Series 2012-C4 Class A5 |
| 12/10/2045 | 2.850% | | 8,550,000 | 8,770,062 |
| Series 2013-C5 Class A3 |
| 03/10/2046 | 2.920% | | 1,672,133 | 1,716,062 |
| Series 2013-C5 Class A4 |
| 03/10/2046 | 3.185% | | 10,651,000 | 11,043,617 |
| WF-RBS Commercial Mortgage Trust |
| Series 2012-C9 Class A3 |
| 11/15/2045 | 2.870% | | 9,126,310 | 9,349,492 |
| Series 2013-C15 Class A3 |
| 08/15/2046 | 3.881% | | 9,909,122 | 10,544,324 |
Total Commercial Mortgage-Backed Securities - Non-Agency
(Cost $188,925,247) | 191,290,966 |
| Common Stocks 59.7% |
| Issuer | Shares | Value ($) |
| Communication Services 8.8% |
| Diversified Telecommunication Services 2.0% |
| AT&T, Inc. | 2,263,380 | 79,806,779 |
| Verizon Communications, Inc. | 975,689 | 56,746,072 |
| Total | | 136,552,851 |
| Entertainment 1.1% |
| Activision Blizzard, Inc. | 1,010,769 | 51,144,911 |
| Electronic Arts, Inc.(f) | 236,725 | 22,176,398 |
| Total | | 73,321,309 |
| Interactive Media & Services 3.7% |
| Alphabet, Inc., Class A(f) | 59,259 | 70,549,617 |
| Alphabet, Inc., Class C(f) | 78,063 | 92,746,650 |
| Facebook, Inc., Class A(f) | 461,570 | 85,699,702 |
| Total | | 248,995,969 |
| Media 1.7% |
| Comcast Corp., Class A | 2,607,077 | 115,389,228 |
| Common Stocks (continued) |
| Issuer | Shares | Value ($) |
| Wireless Telecommunication Services 0.3% |
| T-Mobile U.S.A., Inc.(f) | 293,210 | 22,885,041 |
| Total Communication Services | 597,144,398 |
| Consumer Discretionary 6.1% |
| Hotels, Restaurants & Leisure 1.5% |
| Aramark | 726,147 | 29,670,366 |
| McDonald’s Corp. | 254,539 | 55,481,866 |
| Restaurant Brands International, Inc. | 245,461 | 19,256,416 |
| Total | | 104,408,648 |
| Household Durables 0.4% |
| D.R. Horton, Inc. | 554,510 | 27,431,610 |
| Internet & Direct Marketing Retail 2.9% |
| Amazon.com, Inc.(f) | 76,670 | 136,188,154 |
| eBay, Inc. | 1,482,500 | 59,729,925 |
| Total | | 195,918,079 |
| Multiline Retail 0.2% |
| Dollar General Corp. | 63,796 | 9,957,918 |
| Specialty Retail 1.1% |
| Lowe’s Companies, Inc. | 671,882 | 75,385,160 |
| Total Consumer Discretionary | 413,101,415 |
| Consumer Staples 3.4% |
| Food & Staples Retailing 0.2% |
| Sysco Corp. | 219,191 | 16,292,467 |
| Food Products 1.6% |
| ConAgra Foods, Inc. | 1,445,039 | 40,981,306 |
| Mondelez International, Inc., Class A | 1,192,545 | 65,852,335 |
| Total | | 106,833,641 |
| Household Products 0.5% |
| Colgate-Palmolive Co. | 469,220 | 34,792,663 |
| Tobacco 1.1% |
| Philip Morris International, Inc. | 1,037,780 | 74,813,560 |
| Total Consumer Staples | 232,732,331 |
| Energy 2.5% |
| Energy Equipment & Services 0.1% |
| Schlumberger Ltd. | 219,100 | 7,105,413 |
The accompanying Notes to Financial Statements are an integral part of this statement.
| 12 | Columbia Balanced Fund | Annual Report 2019 |
Portfolio of Investments (continued)
August 31, 2019
| Common Stocks (continued) |
| Issuer | Shares | Value ($) |
| Oil, Gas & Consumable Fuels 2.4% |
| Canadian Natural Resources Ltd. | 1,075,099 | 25,694,866 |
| Chevron Corp. | 824,501 | 97,060,258 |
| EOG Resources, Inc. | 509,714 | 37,815,681 |
| Total | | 160,570,805 |
| Total Energy | 167,676,218 |
| Financials 8.2% |
| Banks 3.6% |
| Citigroup, Inc. | 1,630,411 | 104,916,948 |
| JPMorgan Chase & Co. | 1,053,863 | 115,777,389 |
| Wells Fargo & Co. | 453,900 | 21,138,123 |
| Total | | 241,832,460 |
| Capital Markets 1.5% |
| BlackRock, Inc. | 94,500 | 39,931,920 |
| Morgan Stanley | 1,533,455 | 63,623,048 |
| Total | | 103,554,968 |
| Diversified Financial Services 2.4% |
| Berkshire Hathaway, Inc., Class B(f) | 802,345 | 163,204,996 |
| Insurance 0.7% |
| Aon PLC | 262,041 | 51,058,689 |
| Total Financials | 559,651,113 |
| Health Care 8.0% |
| Biotechnology 0.2% |
| Alexion Pharmaceuticals, Inc.(f) | 158,610 | 15,981,544 |
| Health Care Equipment & Supplies 3.9% |
| Abbott Laboratories | 408,531 | 34,855,865 |
| Baxter International, Inc. | 337,345 | 29,669,493 |
| Becton Dickinson and Co. | 167,045 | 42,416,066 |
| Dentsply Sirona, Inc. | 669,610 | 34,920,162 |
| Medtronic PLC | 1,130,078 | 121,924,115 |
| Total | | 263,785,701 |
| Health Care Providers & Services 1.6% |
| Anthem, Inc. | 203,793 | 53,295,945 |
| Cigna Corp. | 252,334 | 38,851,866 |
| Humana, Inc. | 69,075 | 19,562,731 |
| Total | | 111,710,542 |
| Common Stocks (continued) |
| Issuer | Shares | Value ($) |
| Pharmaceuticals 2.3% |
| Allergan PLC | 201,825 | 32,235,489 |
| Johnson & Johnson | 611,250 | 78,460,050 |
| Pfizer, Inc. | 1,216,842 | 43,258,733 |
| Total | | 153,954,272 |
| Total Health Care | 545,432,059 |
| Industrials 3.8% |
| Aerospace & Defense 2.0% |
| L3 Harris Technologies, Inc. | 171,025 | 36,156,395 |
| Northrop Grumman Corp. | 232,500 | 85,529,775 |
| Spirit AeroSystems Holdings, Inc., Class A | 188,398 | 15,184,879 |
| Total | | 136,871,049 |
| Electrical Equipment 0.5% |
| Emerson Electric Co. | 508,165 | 30,281,552 |
| Industrial Conglomerates 1.2% |
| Honeywell International, Inc. | 505,793 | 83,263,644 |
| Machinery 0.1% |
| Caterpillar, Inc. | 52,765 | 6,279,035 |
| Total Industrials | 256,695,280 |
| Information Technology 14.8% |
| Communications Equipment 0.6% |
| Cisco Systems, Inc. | 840,270 | 39,333,039 |
| Electronic Equipment, Instruments & Components 0.5% |
| Corning, Inc. | 1,124,470 | 31,316,490 |
| IT Services 4.6% |
| Fidelity National Information Services, Inc. | 607,580 | 82,764,548 |
| Fiserv, Inc.(f) | 513,958 | 54,962,668 |
| International Business Machines Corp. | 396,060 | 53,678,012 |
| MasterCard, Inc., Class A | 436,734 | 122,883,845 |
| Total | | 314,289,073 |
| Semiconductors & Semiconductor Equipment 2.4% |
| Broadcom, Inc. | 65,955 | 18,641,521 |
| Intel Corp. | 484,135 | 22,952,840 |
| Lam Research Corp. | 194,935 | 41,035,767 |
| Marvell Technology Group Ltd. | 726,010 | 17,402,460 |
The accompanying Notes to Financial Statements are an integral part of this statement.
Columbia Balanced Fund | Annual Report 2019
| 13 |
Portfolio of Investments (continued)
August 31, 2019
| Common Stocks (continued) |
| Issuer | Shares | Value ($) |
| NVIDIA Corp. | 181,960 | 30,480,120 |
| NXP Semiconductors NV | 345,490 | 35,288,348 |
| Total | | 165,801,056 |
| Software 4.4% |
| Adobe, Inc.(f) | 171,460 | 48,782,084 |
| CDK Global, Inc. | 128,260 | 5,535,702 |
| Microsoft Corp. | 1,728,894 | 238,345,327 |
| Palo Alto Networks, Inc.(f) | 19,215 | 3,912,558 |
| Total | | 296,575,671 |
| Technology Hardware, Storage & Peripherals 2.3% |
| Apple, Inc. | 766,170 | 159,930,326 |
| Total Information Technology | 1,007,245,655 |
| Materials 2.5% |
| Chemicals 1.8% |
| Air Products & Chemicals, Inc. | 140,260 | 31,687,539 |
| Corteva, Inc. | 853,123 | 25,013,566 |
| DuPont de Nemours, Inc. | 487,803 | 33,136,458 |
| Mosaic Co. (The) | 678,335 | 12,474,581 |
| Sherwin-Williams Co. (The) | 47,403 | 24,969,530 |
| Total | | 127,281,674 |
| Metals & Mining 0.7% |
| Newmont Goldcorp Corp. | 1,145,475 | 45,692,998 |
| Total Materials | 172,974,672 |
| Real Estate 1.0% |
| Equity Real Estate Investment Trusts (REITS) 1.0% |
| American Tower Corp. | 286,993 | 66,062,919 |
| Total Real Estate | 66,062,919 |
| Utilities 0.6% |
| Electric Utilities 0.6% |
| American Electric Power Co., Inc. | 464,345 | 42,325,047 |
| Total Utilities | 42,325,047 |
Total Common Stocks
(Cost $2,836,690,509) | 4,061,041,107 |
| Corporate Bonds & Notes 9.1% |
| Issuer | Coupon
Rate | | Principal
Amount ($) | Value ($) |
| Aerospace & Defense 0.2% |
| Bombardier, Inc.(a) |
| 10/15/2022 | 6.000% | | 43,000 | 42,669 |
| 12/01/2024 | 7.500% | | 43,000 | 42,862 |
| 03/15/2025 | 7.500% | | 54,000 | 52,686 |
| 04/15/2027 | 7.875% | | 140,000 | 135,491 |
| L3Harris Technologies, Inc.(a) |
| 12/15/2026 | 3.850% | | 8,000,000 | 8,674,192 |
| Northrop Grumman Systems Corp. |
| 02/15/2031 | 7.750% | | 4,429,000 | 6,539,928 |
| TransDigm, Inc. |
| 07/15/2022 | 6.000% | | 69,000 | 70,211 |
| 05/15/2025 | 6.500% | | 604,000 | 629,911 |
| TransDigm, Inc.(a) |
| 03/15/2026 | 6.250% | | 480,000 | 517,989 |
| 03/15/2027 | 7.500% | | 184,000 | 197,796 |
| Total | 16,903,735 |
| Automotive 0.1% |
| Delphi Technologies PLC(a) |
| 10/01/2025 | 5.000% | | 97,000 | 83,677 |
| Ford Motor Credit Co. LLC |
| 08/01/2026 | 4.542% | | 5,875,000 | 5,985,608 |
| IAA Spinco, Inc.(a) |
| 06/15/2027 | 5.500% | | 170,000 | 182,337 |
| Panther BF Aggregator 2 LP/Finance Co., Inc.(a) |
| 05/15/2026 | 6.250% | | 167,000 | 173,180 |
| 05/15/2027 | 8.500% | | 135,000 | 131,631 |
| Total | 6,556,433 |
| Banking 1.5% |
| Ally Financial, Inc. |
| 11/01/2031 | 8.000% | | 157,000 | 219,941 |
| Bank of America Corp.(g) |
| 12/20/2028 | 3.419% | | 11,009,000 | 11,636,612 |
| Capital One Financial Corp. |
| 03/09/2027 | 3.750% | | 8,000,000 | 8,472,000 |
| Citigroup, Inc. |
| Subordinated |
| 03/09/2026 | 4.600% | | 8,000,000 | 8,819,264 |
| Discover Bank |
| 09/13/2028 | 4.650% | | 4,200,000 | 4,752,287 |
| Goldman Sachs Group, Inc. (The) |
| 01/26/2027 | 3.850% | | 13,000,000 | 13,889,655 |
| HSBC Holdings PLC |
| 05/25/2026 | 3.900% | | 9,000,000 | 9,625,554 |
| JPMorgan Chase & Co.(g) |
| 04/23/2029 | 4.005% | | 14,000,000 | 15,549,688 |
The accompanying Notes to Financial Statements are an integral part of this statement.
| 14 | Columbia Balanced Fund | Annual Report 2019 |
Portfolio of Investments (continued)
August 31, 2019
| Corporate Bonds & Notes (continued) |
| Issuer | Coupon
Rate | | Principal
Amount ($) | Value ($) |
| Morgan Stanley |
| 01/20/2027 | 3.625% | | 8,000,000 | 8,563,872 |
| PNC Bank NA |
| Subordinated |
| 01/30/2023 | 2.950% | | 5,800,000 | 5,957,522 |
| Wells Fargo & Co. |
| Subordinated |
| 06/03/2026 | 4.100% | | 10,400,000 | 11,248,276 |
| Total | 98,734,671 |
| Brokerage/Asset Managers/Exchanges 0.0% |
| NFP Corp.(a) |
| 07/15/2025 | 6.875% | | 250,000 | 248,092 |
| Building Materials 0.0% |
| American Builders & Contractors Supply Co., Inc.(a) |
| 12/15/2023 | 5.750% | | 275,000 | 285,144 |
| 05/15/2026 | 5.875% | | 190,000 | 202,180 |
| Beacon Roofing Supply, Inc. |
| 10/01/2023 | 6.375% | | 385,000 | 398,500 |
| Beacon Roofing Supply, Inc.(a) |
| 11/01/2025 | 4.875% | | 304,000 | 299,802 |
| Core & Main LP(a) |
| 08/15/2025 | 6.125% | | 202,000 | 205,753 |
| James Hardie International Finance DAC(a) |
| 01/15/2028 | 5.000% | | 176,000 | 180,682 |
| Total | 1,572,061 |
| Cable and Satellite 0.3% |
| CCO Holdings LLC/Capital Corp. |
| 01/15/2024 | 5.750% | | 170,000 | 173,847 |
| CCO Holdings LLC/Capital Corp.(a) |
| 05/01/2025 | 5.375% | | 81,000 | 84,178 |
| 02/15/2026 | 5.750% | | 303,000 | 320,779 |
| 05/01/2027 | 5.125% | | 488,000 | 516,581 |
| 05/01/2027 | 5.875% | | 70,000 | 74,598 |
| Comcast Corp. |
| 08/15/2035 | 4.400% | | 5,600,000 | 6,552,454 |
| CSC Holdings LLC(a) |
| 10/15/2025 | 6.625% | | 398,000 | 426,011 |
| 10/15/2025 | 10.875% | | 208,000 | 237,637 |
| 05/15/2026 | 5.500% | | 276,000 | 291,814 |
| 02/01/2028 | 5.375% | | 107,000 | 114,328 |
| 04/01/2028 | 7.500% | | 351,000 | 393,145 |
| 02/01/2029 | 6.500% | | 325,000 | 363,384 |
| 01/15/2030 | 5.750% | | 114,000 | 119,119 |
| DISH DBS Corp. |
| 03/15/2023 | 5.000% | | 67,000 | 66,060 |
| 11/15/2024 | 5.875% | | 245,000 | 233,336 |
| 07/01/2026 | 7.750% | | 241,000 | 236,870 |
| Corporate Bonds & Notes (continued) |
| Issuer | Coupon
Rate | | Principal
Amount ($) | Value ($) |
| Intelsat Jackson Holdings SA(a) |
| 10/15/2024 | 8.500% | | 210,000 | 208,115 |
| Quebecor Media, Inc. |
| 01/15/2023 | 5.750% | | 128,000 | 138,711 |
| Radiate HoldCo LLC/Finance, Inc.(a) |
| 02/15/2023 | 6.875% | | 58,000 | 58,801 |
| 02/15/2025 | 6.625% | | 166,000 | 164,713 |
| Sirius XM Radio, Inc.(a) |
| 07/15/2024 | 4.625% | | 80,000 | 83,677 |
| 04/15/2025 | 5.375% | | 305,000 | 317,144 |
| Time Warner Cable LLC |
| 05/01/2037 | 6.550% | | 5,000,000 | 6,029,460 |
| Unitymedia Hessen GmbH & Co. KG NRW(a) |
| 01/15/2025 | 5.000% | | 237,000 | 245,111 |
| Viasat, Inc.(a) |
| 04/15/2027 | 5.625% | | 67,000 | 71,196 |
| Virgin Media Finance PLC(a) |
| 01/15/2025 | 5.750% | | 175,000 | 181,883 |
| Virgin Media Secured Finance PLC(a) |
| 01/15/2026 | 5.250% | | 433,000 | 445,627 |
| 08/15/2026 | 5.500% | | 64,000 | 67,037 |
| 05/15/2029 | 5.500% | | 70,000 | 73,142 |
| Ziggo Bond Finance BV(a) |
| 01/15/2027 | 6.000% | | 332,000 | 347,302 |
| Ziggo BV(a) |
| 01/15/2027 | 5.500% | | 292,000 | 306,481 |
| Total | 18,942,541 |
| Chemicals 0.2% |
| Alpha 2 BV PIK(a) |
| 06/01/2023 | 8.750% | | 79,000 | 76,278 |
| Angus Chemical Co.(a) |
| 02/15/2023 | 8.750% | | 109,000 | 107,475 |
| Atotech U.S.A., Inc.(a) |
| 02/01/2025 | 6.250% | | 261,000 | 259,450 |
| Axalta Coating Systems LLC(a) |
| 08/15/2024 | 4.875% | | 171,000 | 177,033 |
| Chemours Co. (The) |
| 05/15/2023 | 6.625% | | 46,000 | 46,730 |
| 05/15/2025 | 7.000% | | 59,000 | 58,393 |
| 05/15/2027 | 5.375% | | 35,000 | 31,606 |
| Dow Chemical Co. (The) |
| 11/01/2029 | 7.375% | | 1,103,000 | 1,475,206 |
| DowDuPont, Inc. |
| 11/15/2028 | 4.725% | | 4,180,000 | 4,839,863 |
| INEOS Group Holdings SA(a) |
| 08/01/2024 | 5.625% | | 196,000 | 199,613 |
The accompanying Notes to Financial Statements are an integral part of this statement.
Columbia Balanced Fund | Annual Report 2019
| 15 |
Portfolio of Investments (continued)
August 31, 2019
| Corporate Bonds & Notes (continued) |
| Issuer | Coupon
Rate | | Principal
Amount ($) | Value ($) |
| LYB International Finance BV |
| 03/15/2044 | 4.875% | | 2,000,000 | 2,211,572 |
| Platform Specialty Products Corp.(a) |
| 12/01/2025 | 5.875% | | 419,000 | 436,060 |
| PQ Corp.(a) |
| 11/15/2022 | 6.750% | | 334,000 | 346,463 |
| 12/15/2025 | 5.750% | | 229,000 | 234,669 |
| SPCM SA(a) |
| 09/15/2025 | 4.875% | | 87,000 | 88,432 |
| Starfruit Finco BV/US Holdco LLC(a) |
| 10/01/2026 | 8.000% | | 432,000 | 421,509 |
| WR Grace & Co.(a) |
| 10/01/2021 | 5.125% | | 168,000 | 174,966 |
| Total | 11,185,318 |
| Construction Machinery 0.0% |
| H&E Equipment Services, Inc. |
| 09/01/2025 | 5.625% | | 274,000 | 286,968 |
| Herc Holdings, Inc.(a) |
| 07/15/2027 | 5.500% | | 158,000 | 163,297 |
| Ritchie Bros. Auctioneers, Inc.(a) |
| 01/15/2025 | 5.375% | | 140,000 | 145,642 |
| United Rentals North America, Inc. |
| 09/15/2026 | 5.875% | | 226,000 | 242,335 |
| 12/15/2026 | 6.500% | | 270,000 | 294,881 |
| Total | 1,133,123 |
| Consumer Cyclical Services 0.1% |
| Amazon.com, Inc. |
| 08/22/2027 | 3.150% | | 6,000,000 | 6,446,238 |
| APX Group, Inc. |
| 12/01/2020 | 8.750% | | 77,000 | 73,114 |
| 12/01/2022 | 7.875% | | 308,000 | 293,117 |
| 09/01/2023 | 7.625% | | 79,000 | 59,258 |
| APX Group, Inc.(a) |
| 11/01/2024 | 8.500% | | 98,000 | 91,363 |
| frontdoor, Inc.(a) |
| 08/15/2026 | 6.750% | | 194,000 | 210,216 |
| Realogy Group LLC/Co-Issuer Corp.(a) |
| 12/01/2021 | 5.250% | | 172,000 | 167,392 |
| Total | 7,340,698 |
| Consumer Products 0.0% |
| Energizer Holdings, Inc.(a) |
| 01/15/2027 | 7.750% | | 208,000 | 227,642 |
| Mattel, Inc.(a) |
| 12/31/2025 | 6.750% | | 135,000 | 139,013 |
| Corporate Bonds & Notes (continued) |
| Issuer | Coupon
Rate | | Principal
Amount ($) | Value ($) |
| Prestige Brands, Inc.(a) |
| 12/15/2021 | 5.375% | | 189,000 | 190,320 |
| 03/01/2024 | 6.375% | | 137,000 | 143,423 |
| Scotts Miracle-Gro Co. (The) |
| 10/15/2023 | 6.000% | | 199,000 | 206,037 |
| Spectrum Brands, Inc. |
| 12/15/2024 | 6.125% | | 227,000 | 236,088 |
| Valvoline, Inc. |
| 07/15/2024 | 5.500% | | 138,000 | 143,577 |
| Total | 1,286,100 |
| Diversified Manufacturing 0.1% |
| BWX Technologies, Inc.(a) |
| 07/15/2026 | 5.375% | | 44,000 | 46,429 |
| CFX Escrow Corp.(a) |
| 02/15/2024 | 6.000% | | 125,000 | 133,328 |
| 02/15/2026 | 6.375% | | 72,000 | 78,080 |
| Gates Global LLC/Co.(a) |
| 07/15/2022 | 6.000% | | 442,000 | 441,337 |
| MTS Systems Corp.(a) |
| 08/15/2027 | 5.750% | | 37,000 | 38,666 |
| Resideo Funding, Inc.(a) |
| 11/01/2026 | 6.125% | | 104,000 | 110,524 |
| Stevens Holding Co., Inc.(a) |
| 10/01/2026 | 6.125% | | 142,000 | 148,126 |
| United Technologies Corp. |
| 08/16/2025 | 3.950% | | 6,000,000 | 6,587,898 |
| WESCO Distribution, Inc. |
| 12/15/2021 | 5.375% | | 171,000 | 172,732 |
| 06/15/2024 | 5.375% | | 99,000 | 102,517 |
| Zekelman Industries, Inc.(a) |
| 06/15/2023 | 9.875% | | 132,000 | 139,161 |
| Total | 7,998,798 |
| Electric 1.0% |
| AES Corp. (The) |
| 09/01/2027 | 5.125% | | 195,000 | 209,320 |
| Arizona Public Service Co. |
| 04/01/2042 | 4.500% | | 1,925,000 | 2,306,564 |
| Calpine Corp.(a) |
| 06/01/2026 | 5.250% | | 240,000 | 243,642 |
| Clearway Energy Operating LLC |
| 08/15/2024 | 5.375% | | 509,000 | 522,473 |
| Clearway Energy Operating LLC(a) |
| 10/15/2025 | 5.750% | | 109,000 | 113,614 |
| CMS Energy Corp. |
| 03/01/2024 | 3.875% | | 5,052,000 | 5,354,256 |
The accompanying Notes to Financial Statements are an integral part of this statement.
| 16 | Columbia Balanced Fund | Annual Report 2019 |
Portfolio of Investments (continued)
August 31, 2019
| Corporate Bonds & Notes (continued) |
| Issuer | Coupon
Rate | | Principal
Amount ($) | Value ($) |
| Consolidated Edison Co. of New York, Inc. |
| 12/01/2045 | 4.500% | | 2,500,000 | 3,037,150 |
| Dominion Energy, Inc. |
| 10/01/2025 | 3.900% | | 5,000,000 | 5,392,555 |
| DTE Energy Co. |
| 04/15/2033 | 6.375% | | 4,000,000 | 5,419,312 |
| Indiana Michigan Power Co. |
| 03/15/2037 | 6.050% | | 4,925,000 | 6,770,831 |
| NextEra Energy Capital Holdings, Inc. |
| 06/15/2023 | 3.625% | | 5,070,000 | 5,307,854 |
| NextEra Energy Operating Partners LP(a) |
| 07/15/2024 | 4.250% | | 100,000 | 103,590 |
| 09/15/2027 | 4.500% | | 232,000 | 237,942 |
| NRG Energy, Inc. |
| 05/15/2026 | 7.250% | | 50,000 | 54,855 |
| 01/15/2027 | 6.625% | | 292,000 | 317,335 |
| 01/15/2028 | 5.750% | | 21,000 | 22,637 |
| NRG Energy, Inc.(a) |
| 06/15/2029 | 5.250% | | 111,000 | 118,322 |
| Pennsylvania Electric Co.(a) |
| 06/01/2029 | 3.600% | | 6,477,000 | 6,946,187 |
| Progress Energy, Inc. |
| 03/01/2031 | 7.750% | | 4,500,000 | 6,500,803 |
| Public Service Co. of Colorado |
| 05/15/2025 | 2.900% | | 3,650,000 | 3,767,212 |
| Southern Co. (The) |
| 07/01/2046 | 4.400% | | 6,150,000 | 6,934,039 |
| TerraForm Power Operating LLC(a) |
| 01/31/2023 | 4.250% | | 172,000 | 176,149 |
| 01/31/2028 | 5.000% | | 105,000 | 109,283 |
| Vistra Energy Corp. |
| 11/01/2024 | 7.625% | | 188,000 | 199,696 |
| Vistra Operations Co. LLC(a) |
| 09/01/2026 | 5.500% | | 64,000 | 67,381 |
| 02/15/2027 | 5.625% | | 204,000 | 216,181 |
| 07/31/2027 | 5.000% | | 148,000 | 153,408 |
| WEC Energy Group, Inc. |
| 06/15/2025 | 3.550% | | 4,750,000 | 5,086,913 |
| Total | 65,689,504 |
| Environmental 0.0% |
| Clean Harbors, Inc.(a) |
| 07/15/2027 | 4.875% | | 53,000 | 56,002 |
| 07/15/2029 | 5.125% | | 37,000 | 39,387 |
| GFL Environmental, Inc.(a) |
| 05/01/2022 | 5.625% | | 105,000 | 106,537 |
| 03/01/2023 | 5.375% | | 47,000 | 47,266 |
| 05/01/2027 | 8.500% | | 140,000 | 152,936 |
| Corporate Bonds & Notes (continued) |
| Issuer | Coupon
Rate | | Principal
Amount ($) | Value ($) |
| Hulk Finance Corp.(a) |
| 06/01/2026 | 7.000% | | 29,000 | 30,070 |
| Total | 432,198 |
| Finance Companies 0.2% |
| GE Capital International Funding Co. Unlimited Co. |
| 11/15/2035 | 4.418% | | 10,000,000 | 10,162,450 |
| Global Aircraft Leasing Co., Ltd. PIK(a) |
| 09/15/2024 | 6.500% | | 180,000 | 179,122 |
| iStar, Inc. |
| 04/01/2022 | 6.000% | | 134,000 | 138,013 |
| Navient Corp. |
| 06/15/2022 | 6.500% | | 180,000 | 194,624 |
| 01/25/2023 | 5.500% | | 417,000 | 438,112 |
| 09/25/2023 | 7.250% | | 3,000 | 3,328 |
| Provident Funding Associates LP/Finance Corp.(a) |
| 06/15/2025 | 6.375% | | 272,000 | 264,395 |
| Quicken Loans, Inc.(a) |
| 05/01/2025 | 5.750% | | 415,000 | 432,596 |
| Springleaf Finance Corp. |
| 03/15/2024 | 6.125% | | 256,000 | 279,508 |
| 03/15/2025 | 6.875% | | 182,000 | 206,259 |
| 03/15/2026 | 7.125% | | 80,000 | 91,327 |
| Total | 12,389,734 |
| Food and Beverage 0.6% |
| Anheuser-Busch InBev Worldwide, Inc. |
| 01/15/2042 | 4.950% | | 11,145,000 | 13,301,758 |
| B&G Foods, Inc. |
| 06/01/2021 | 4.625% | | 330,000 | 330,831 |
| 04/01/2025 | 5.250% | | 211,000 | 214,050 |
| Bacardi Ltd.(a) |
| 05/15/2038 | 5.150% | | 6,860,000 | 7,650,560 |
| Conagra Brands, Inc. |
| 11/01/2048 | 5.400% | | 4,270,000 | 5,076,808 |
| Darling Ingredients, Inc.(a) |
| 04/15/2027 | 5.250% | | 27,000 | 28,805 |
| FAGE International SA/U.S.A. Dairy Industry, Inc.(a) |
| 08/15/2026 | 5.625% | | 118,000 | 103,487 |
| Kraft Heinz Co. (The)(a) |
| 02/15/2025 | 4.875% | | 8,000,000 | 8,242,688 |
| PepsiCo, Inc. |
| 02/24/2026 | 2.850% | | 4,125,000 | 4,333,795 |
| Post Holdings, Inc.(a) |
| 08/15/2026 | 5.000% | | 635,000 | 661,973 |
| 03/01/2027 | 5.750% | | 156,000 | 166,205 |
| 12/15/2029 | 5.500% | | 143,000 | 151,131 |
| Total | 40,262,091 |
The accompanying Notes to Financial Statements are an integral part of this statement.
Columbia Balanced Fund | Annual Report 2019
| 17 |
Portfolio of Investments (continued)
August 31, 2019
| Corporate Bonds & Notes (continued) |
| Issuer | Coupon
Rate | | Principal
Amount ($) | Value ($) |
| Gaming 0.0% |
| Boyd Gaming Corp. |
| 05/15/2023 | 6.875% | | 260,000 | 269,824 |
| 04/01/2026 | 6.375% | | 85,000 | 90,071 |
| Caesars Resort Collection LLC/CRC Finco, Inc.(a) |
| 10/15/2025 | 5.250% | | 84,000 | 85,440 |
| Eldorado Resorts, Inc. |
| 08/01/2023 | 7.000% | | 136,000 | 142,460 |
| 04/01/2025 | 6.000% | | 249,000 | 263,742 |
| International Game Technology PLC(a) |
| 02/15/2022 | 6.250% | | 180,000 | 190,323 |
| 02/15/2025 | 6.500% | | 224,000 | 245,739 |
| MGM Growth Properties Operating Partnership LP/Finance Co-Issuer, Inc. |
| 05/01/2024 | 5.625% | | 266,000 | 290,552 |
| MGM Growth Properties Operating Partnership LP/Finance Co-Issuer, Inc.(a) |
| 02/01/2027 | 5.750% | | 165,000 | 182,372 |
| MGM Resorts International |
| 12/15/2021 | 6.625% | | 157,000 | 170,658 |
| 03/15/2023 | 6.000% | | 97,000 | 106,720 |
| Scientific Games International, Inc.(a) |
| 10/15/2025 | 5.000% | | 248,000 | 256,097 |
| 03/15/2026 | 8.250% | | 196,000 | 206,863 |
| Stars Group Holdings BV/Co-Borrower LLC(a) |
| 07/15/2026 | 7.000% | | 139,000 | 147,429 |
| Wynn Las Vegas LLC/Capital Corp.(a) |
| 03/01/2025 | 5.500% | | 173,000 | 182,406 |
| Total | 2,830,696 |
| Health Care 0.5% |
| Acadia Healthcare Co., Inc. |
| 03/01/2024 | 6.500% | | 232,000 | 239,676 |
| Avantor, Inc.(a) |
| 10/01/2025 | 9.000% | | 263,000 | 296,363 |
| Becton Dickinson and Co. |
| 06/06/2027 | 3.700% | | 5,216,000 | 5,592,700 |
| Cardinal Health, Inc. |
| 03/15/2043 | 4.600% | | 6,500,000 | 6,393,250 |
| Change Healthcare Holdings LLC/Finance, Inc.(a) |
| 03/01/2025 | 5.750% | | 246,000 | 247,430 |
| CHS/Community Health Systems, Inc. |
| 03/31/2023 | 6.250% | | 143,000 | 137,934 |
| CVS Health Corp. |
| 03/25/2048 | 5.050% | | 6,215,000 | 7,251,898 |
| CVS Pass-Through Trust(a) |
| 01/10/2032 | 7.507% | | 256,847 | 321,829 |
| Corporate Bonds & Notes (continued) |
| Issuer | Coupon
Rate | | Principal
Amount ($) | Value ($) |
| DaVita, Inc. |
| 08/15/2022 | 5.750% | | 168,000 | 169,676 |
| 05/01/2025 | 5.000% | | 71,000 | 71,093 |
| Express Scripts Holding Co. |
| 07/15/2046 | 4.800% | | 5,090,000 | 5,834,438 |
| HCA, Inc. |
| 09/01/2028 | 5.625% | | 522,000 | 594,648 |
| Hill-Rom Holdings, Inc.(a) |
| 09/01/2023 | 5.750% | | 199,000 | 205,389 |
| McKesson Corp. |
| 05/30/2029 | 4.750% | | 4,320,000 | 4,915,128 |
| MPH Acquisition Holdings LLC(a) |
| 06/01/2024 | 7.125% | | 137,000 | 122,278 |
| Select Medical Corp.(a) |
| 08/15/2026 | 6.250% | | 91,000 | 94,354 |
| Sotera Health Holdings LLC(a) |
| 05/15/2023 | 6.500% | | 276,000 | 280,839 |
| Tenet Healthcare Corp. |
| 04/01/2022 | 8.125% | | 164,000 | 176,689 |
| 06/15/2023 | 6.750% | | 101,000 | 104,124 |
| 07/15/2024 | 4.625% | | 274,000 | 281,824 |
| Tenet Healthcare Corp.(a) |
| 01/01/2026 | 4.875% | | 245,000 | 251,804 |
| 02/01/2027 | 6.250% | | 399,000 | 415,013 |
| 11/01/2027 | 5.125% | | 438,000 | 452,587 |
| Total | 34,450,964 |
| Healthcare Insurance 0.1% |
| Anthem, Inc. |
| 03/01/2028 | 4.101% | | 4,150,000 | 4,515,524 |
| Centene Corp. |
| 02/15/2024 | 6.125% | | 162,000 | 169,829 |
| Centene Corp.(a) |
| 06/01/2026 | 5.375% | | 287,000 | 306,186 |
| UnitedHealth Group, Inc. |
| 01/15/2027 | 3.450% | | 4,425,000 | 4,758,760 |
| WellCare Health Plans, Inc. |
| 04/01/2025 | 5.250% | | 248,000 | 259,953 |
| Total | 10,010,252 |
| Healthcare REIT 0.1% |
| Welltower, Inc. |
| 01/15/2030 | 3.100% | | 5,150,000 | 5,234,681 |
| Home Construction 0.0% |
| Lennar Corp. |
| 04/30/2024 | 4.500% | | 108,000 | 115,234 |
| 11/15/2024 | 5.875% | | 198,000 | 221,360 |
| 06/01/2026 | 5.250% | | 117,000 | 127,235 |
The accompanying Notes to Financial Statements are an integral part of this statement.
| 18 | Columbia Balanced Fund | Annual Report 2019 |
Portfolio of Investments (continued)
August 31, 2019
| Corporate Bonds & Notes (continued) |
| Issuer | Coupon
Rate | | Principal
Amount ($) | Value ($) |
| Meritage Homes Corp. |
| 04/01/2022 | 7.000% | | 159,000 | 174,740 |
| 06/01/2025 | 6.000% | | 136,000 | 149,759 |
| Taylor Morrison Communities, Inc.(a) |
| 01/15/2028 | 5.750% | | 106,000 | 112,714 |
| Taylor Morrison Communities, Inc./Holdings II(a) |
| 04/15/2023 | 5.875% | | 180,000 | 190,663 |
| 03/01/2024 | 5.625% | | 90,000 | 94,635 |
| TRI Pointe Group, Inc./Homes |
| 06/15/2024 | 5.875% | | 70,000 | 75,055 |
| Total | 1,261,395 |
| Independent Energy 0.3% |
| Anadarko Petroleum Corp. |
| 09/15/2036 | 6.450% | | 3,500,000 | 4,401,625 |
| California Resources Corp.(a) |
| 12/15/2022 | 8.000% | | 66,000 | 37,942 |
| Callon Petroleum Co. |
| 10/01/2024 | 6.125% | | 26,000 | 25,211 |
| 07/01/2026 | 6.375% | | 419,000 | 405,629 |
| Canadian Natural Resources Ltd. |
| 02/01/2025 | 3.900% | | 5,243,000 | 5,513,591 |
| Carrizo Oil & Gas, Inc. |
| 04/15/2023 | 6.250% | | 210,000 | 199,990 |
| Centennial Resource Production LLC(a) |
| 01/15/2026 | 5.375% | | 181,000 | 172,774 |
| 04/01/2027 | 6.875% | | 229,000 | 228,983 |
| Chesapeake Energy Corp. |
| 10/01/2026 | 7.500% | | 172,000 | 118,862 |
| CrownRock LP/Finance, Inc.(a) |
| 10/15/2025 | 5.625% | | 462,000 | 456,349 |
| Endeavor Energy Resources LP/Finance, Inc.(a) |
| 01/30/2026 | 5.500% | | 33,000 | 34,371 |
| 01/30/2028 | 5.750% | | 20,000 | 21,014 |
| Extraction Oil & Gas, Inc.(a) |
| 05/15/2024 | 7.375% | | 108,000 | 80,709 |
| Indigo Natural Resources LLC(a) |
| 02/15/2026 | 6.875% | | 101,000 | 83,314 |
| Jagged Peak Energy LLC |
| 05/01/2026 | 5.875% | | 184,000 | 184,734 |
| Matador Resources Co. |
| 09/15/2026 | 5.875% | | 245,000 | 238,199 |
| MEG Energy Corp.(a) |
| 01/15/2025 | 6.500% | | 40,000 | 40,250 |
| Noble Energy, Inc. |
| 03/01/2041 | 6.000% | | 4,000,000 | 4,804,184 |
| Corporate Bonds & Notes (continued) |
| Issuer | Coupon
Rate | | Principal
Amount ($) | Value ($) |
| Parsley Energy LLC/Finance Corp.(a) |
| 08/15/2025 | 5.250% | | 468,000 | 475,269 |
| 10/15/2027 | 5.625% | | 316,000 | 326,414 |
| PDC Energy, Inc. |
| 09/15/2024 | 6.125% | | 145,000 | 144,612 |
| SM Energy Co. |
| 09/15/2026 | 6.750% | | 236,000 | 202,070 |
| 01/15/2027 | 6.625% | | 38,000 | 32,322 |
| WPX Energy, Inc. |
| 01/15/2022 | 6.000% | | 65,000 | 67,113 |
| 06/01/2026 | 5.750% | | 373,000 | 386,805 |
| Total | 18,682,336 |
| Integrated Energy 0.1% |
| Cenovus Energy, Inc. |
| 04/15/2027 | 4.250% | | 4,665,000 | 4,882,431 |
| Leisure 0.0% |
| Cedar Fair LP(a) |
| 07/15/2029 | 5.250% | | 54,000 | 58,533 |
| Cedar Fair LP/Canada’s Wonderland Co./Magnum Management Corp. |
| 06/01/2024 | 5.375% | | 167,000 | 171,930 |
| Cinemark U.S.A., Inc. |
| 06/01/2023 | 4.875% | | 139,000 | 141,554 |
| Live Nation Entertainment, Inc.(a) |
| 11/01/2024 | 4.875% | | 118,000 | 122,288 |
| 03/15/2026 | 5.625% | | 86,000 | 91,712 |
| Viking Cruises Ltd.(a) |
| 09/15/2027 | 5.875% | | 210,000 | 218,816 |
| Total | 804,833 |
| Life Insurance 0.5% |
| American International Group, Inc. |
| 07/10/2025 | 3.750% | | 6,000,000 | 6,387,594 |
| Five Corners Funding Trust(a) |
| 11/15/2023 | 4.419% | | 5,725,000 | 6,206,146 |
| High Street Funding Trust I(a) |
| 02/15/2028 | 4.111% | | 5,000,000 | 5,471,175 |
| MetLife Global Funding I(a) |
| 12/18/2026 | 3.450% | | 5,000,000 | 5,383,285 |
| Northwestern Mutual Life Insurance Co. (The)(a) |
| Subordinated |
| 09/30/2047 | 3.850% | | 3,500,000 | 3,965,007 |
| Peachtree Corners Funding Trust(a) |
| 02/15/2025 | 3.976% | | 6,000,000 | 6,346,092 |
| Total | 33,759,299 |
The accompanying Notes to Financial Statements are an integral part of this statement.
Columbia Balanced Fund | Annual Report 2019
| 19 |
Portfolio of Investments (continued)
August 31, 2019
| Corporate Bonds & Notes (continued) |
| Issuer | Coupon
Rate | | Principal
Amount ($) | Value ($) |
| Media and Entertainment 0.1% |
| Clear Channel Worldwide Holdings, Inc.(a) |
| 02/15/2024 | 9.250% | | 375,000 | 411,410 |
| 08/15/2027 | 5.125% | | 213,000 | 222,911 |
| Diamond Sports Group LLC/Finance Co.(a) |
| 08/15/2026 | 5.375% | | 147,000 | 154,324 |
| 08/15/2027 | 6.625% | | 107,000 | 111,900 |
| Discovery Communications LLC |
| 06/01/2040 | 6.350% | | 2,500,000 | 3,095,023 |
| iHeartCommunications, Inc. |
| 05/01/2026 | 6.375% | | 98,481 | 106,863 |
| 05/01/2027 | 8.375% | | 392,858 | 424,498 |
| iHeartCommunications, Inc.(a) |
| 08/15/2027 | 5.250% | | 53,000 | 55,701 |
| Lamar Media Corp. |
| 01/15/2024 | 5.375% | | 171,000 | 175,789 |
| Match Group, Inc. |
| 06/01/2024 | 6.375% | | 133,000 | 140,212 |
| National CineMedia LLC |
| 04/15/2022 | 6.000% | | 108,000 | 109,177 |
| Netflix, Inc. |
| 04/15/2028 | 4.875% | | 225,000 | 235,416 |
| 11/15/2028 | 5.875% | | 361,000 | 404,694 |
| Netflix, Inc.(a) |
| 05/15/2029 | 6.375% | | 218,000 | 252,113 |
| 11/15/2029 | 5.375% | | 175,000 | 190,268 |
| Outfront Media Capital LLC/Corp. |
| 03/15/2025 | 5.875% | | 246,000 | 254,457 |
| Outfront Media Capital LLC/Corp.(a) |
| 08/15/2027 | 5.000% | | 128,000 | 132,753 |
| Scripps Escrow, Inc.(a) |
| 07/15/2027 | 5.875% | | 60,000 | 60,495 |
| Walt Disney Co. (The)(a) |
| 03/15/2033 | 6.550% | | 2,156,000 | 3,093,793 |
| Total | 9,631,797 |
| Metals and Mining 0.0% |
| Alcoa Nederland Holding BV(a) |
| 09/30/2024 | 6.750% | | 231,000 | 242,634 |
| Big River Steel LLC/Finance Corp.(a) |
| 09/01/2025 | 7.250% | | 284,000 | 300,059 |
| Constellium NV(a) |
| 02/15/2026 | 5.875% | | 479,000 | 499,529 |
| Freeport-McMoRan, Inc. |
| 11/14/2024 | 4.550% | | 249,000 | 251,728 |
| 09/01/2029 | 5.250% | | 106,000 | 105,024 |
| 03/15/2043 | 5.450% | | 319,000 | 289,996 |
| Corporate Bonds & Notes (continued) |
| Issuer | Coupon
Rate | | Principal
Amount ($) | Value ($) |
| HudBay Minerals, Inc.(a) |
| 01/15/2023 | 7.250% | | 31,000 | 31,969 |
| 01/15/2025 | 7.625% | | 371,000 | 377,376 |
| Novelis Corp.(a) |
| 09/30/2026 | 5.875% | | 454,000 | 479,673 |
| Total | 2,577,988 |
| Midstream 0.7% |
| Antero Midstream Partners LP/Finance Corp.(a) |
| 03/01/2027 | 5.750% | | 64,000 | 58,696 |
| Cheniere Corpus Christi Holdings LLC |
| 06/30/2027 | 5.125% | | 143,000 | 158,376 |
| Cheniere Energy Partners LP |
| 10/01/2026 | 5.625% | | 202,000 | 213,438 |
| DCP Midstream Operating LP |
| 07/15/2025 | 5.375% | | 136,000 | 144,506 |
| 05/15/2029 | 5.125% | | 108,000 | 110,540 |
| 04/01/2044 | 5.600% | | 90,000 | 84,957 |
| Delek Logistics Partners LP/Finance Corp. |
| 05/15/2025 | 6.750% | | 208,000 | 206,836 |
| Energy Transfer Partners LP |
| 02/01/2042 | 6.500% | | 4,315,000 | 5,241,909 |
| Holly Energy Partners LP/Finance Corp.(a) |
| 08/01/2024 | 6.000% | | 394,000 | 412,717 |
| Kinder Morgan Energy Partners LP |
| 03/01/2044 | 5.500% | | 7,000,000 | 8,244,285 |
| MPLX LP |
| 02/15/2049 | 5.500% | | 5,100,000 | 5,838,414 |
| NuStar Logistics LP |
| 06/01/2026 | 6.000% | | 131,000 | 140,872 |
| 04/28/2027 | 5.625% | | 146,000 | 151,814 |
| Plains All American Pipeline LP/Finance Corp. |
| 01/15/2037 | 6.650% | | 7,000,000 | 8,453,291 |
| Rockpoint Gas Storage Canada Ltd.(a) |
| 03/31/2023 | 7.000% | | 201,000 | 203,312 |
| Southern Natural Gas Co. LLC(a) |
| 03/15/2047 | 4.800% | | 2,951,000 | 3,322,590 |
| Sunoco LP/Finance Corp. |
| 02/15/2026 | 5.500% | | 168,000 | 174,535 |
| Tallgrass Energy Partners LP/Finance Corp.(a) |
| 10/01/2023 | 4.750% | | 102,000 | 101,122 |
| 09/15/2024 | 5.500% | | 65,000 | 63,433 |
| 01/15/2028 | 5.500% | | 235,000 | 221,078 |
| Targa Resources Partners LP/Finance Corp. |
| 02/01/2027 | 5.375% | | 621,000 | 641,225 |
| 01/15/2028 | 5.000% | | 264,000 | 265,206 |
| Targa Resources Partners LP/Finance Corp.(a) |
| 01/15/2029 | 6.875% | | 61,000 | 67,411 |
The accompanying Notes to Financial Statements are an integral part of this statement.
| 20 | Columbia Balanced Fund | Annual Report 2019 |
Portfolio of Investments (continued)
August 31, 2019
| Corporate Bonds & Notes (continued) |
| Issuer | Coupon
Rate | | Principal
Amount ($) | Value ($) |
| TransMontaigne Partners LP/TLP Finance Corp. |
| 02/15/2026 | 6.125% | | 211,000 | 203,923 |
| Western Gas Partners LP |
| 08/15/2048 | 5.500% | | 4,500,000 | 4,199,301 |
| Williams Companies, Inc. (The) |
| 09/15/2045 | 5.100% | | 7,000,000 | 7,827,071 |
| Total | 46,750,858 |
| Natural Gas 0.2% |
| NiSource, Inc. |
| 02/15/2044 | 4.800% | | 5,000,000 | 6,012,675 |
| Sempra Energy |
| 11/15/2025 | 3.750% | | 7,000,000 | 7,450,247 |
| Total | 13,462,922 |
| Oil Field Services 0.0% |
| Apergy Corp. |
| 05/01/2026 | 6.375% | | 234,000 | 235,862 |
| Calfrac Holdings LP(a) |
| 06/15/2026 | 8.500% | | 82,000 | 51,601 |
| Diamond Offshore Drilling, Inc. |
| 08/15/2025 | 7.875% | | 57,000 | 51,667 |
| Nabors Industries, Inc. |
| 02/01/2025 | 5.750% | | 250,000 | 199,474 |
| SESI LLC |
| 09/15/2024 | 7.750% | | 55,000 | 33,652 |
| Transocean Guardian Ltd.(a) |
| 01/15/2024 | 5.875% | | 2,448 | 2,467 |
| Transocean Poseidon Ltd.(a) |
| 02/01/2027 | 6.875% | | 83,000 | 86,373 |
| Transocean Sentry Ltd.(a) |
| 05/15/2023 | 5.375% | | 187,000 | 185,130 |
| Total | 846,226 |
| Other Industry 0.0% |
| KAR Auction Services, Inc.(a) |
| 06/01/2025 | 5.125% | | 240,000 | 247,178 |
| Other REIT 0.0% |
| CyrusOne LP/Finance Corp. |
| 03/15/2027 | 5.375% | | 397,000 | 423,434 |
| Packaging 0.0% |
| ARD Finance SA PIK |
| 09/15/2023 | 7.125% | | 72,000 | 74,133 |
| Ardagh Packaging Finance PLC/Holdings U.S.A., Inc.(a) |
| 02/15/2025 | 6.000% | | 270,000 | 282,372 |
| Corporate Bonds & Notes (continued) |
| Issuer | Coupon
Rate | | Principal
Amount ($) | Value ($) |
| Ardagh Packaging Finance PLC/Holdings USA, Inc.(a) |
| 08/15/2027 | 5.250% | | 285,000 | 287,531 |
| Berry Global Escrow Corp.(a) |
| 07/15/2026 | 4.875% | | 139,000 | 146,324 |
| 07/15/2027 | 5.625% | | 137,000 | 144,052 |
| Berry Global, Inc. |
| 07/15/2023 | 5.125% | | 295,000 | 302,450 |
| BWAY Holding Co.(a) |
| 04/15/2024 | 5.500% | | 279,000 | 287,996 |
| Flex Acquisition Co., Inc.(a) |
| 07/15/2026 | 7.875% | | 117,000 | 105,886 |
| Reynolds Group Issuer, Inc./LLC |
| 10/15/2020 | 5.750% | | 279,103 | 279,859 |
| Reynolds Group Issuer, Inc./LLC(a) |
| 07/15/2023 | 5.125% | | 236,000 | 242,460 |
| 07/15/2024 | 7.000% | | 234,000 | 242,559 |
| Trivium Packaging Finance BV(a) |
| 08/15/2026 | 5.500% | | 110,000 | 116,474 |
| Total | 2,512,096 |
| Pharmaceuticals 0.4% |
| AbbVie, Inc. |
| 11/06/2042 | 4.400% | | 5,500,000 | 5,787,369 |
| Allergan Funding SCS |
| 03/15/2035 | 4.550% | | 3,500,000 | 3,745,567 |
| Amgen, Inc. |
| 03/15/2040 | 5.750% | | 2,400,000 | 3,133,001 |
| Bausch Health Companies, Inc.(a) |
| 05/15/2023 | 5.875% | | 31,000 | 31,411 |
| 03/15/2024 | 7.000% | | 221,000 | 233,189 |
| 12/15/2025 | 9.000% | | 143,000 | 160,749 |
| 04/01/2026 | 9.250% | | 565,000 | 640,928 |
| 01/31/2027 | 8.500% | | 89,000 | 98,708 |
| Bristol-Myers Squibb Co.(a) |
| 07/26/2029 | 3.400% | | 5,900,000 | 6,385,399 |
| Catalent Pharma Solutions, Inc.(a) |
| 07/15/2027 | 5.000% | | 56,000 | 58,621 |
| Eagle Holding Co. II LLC PIK(a) |
| 05/15/2022 | 7.750% | | 138,000 | 139,553 |
| Gilead Sciences, Inc. |
| 02/01/2025 | 3.500% | | 3,000,000 | 3,190,278 |
| Horizon Pharma USA, Inc.(a) |
| 08/01/2027 | 5.500% | | 132,000 | 137,643 |
| Jaguar Holding Co. II/Pharmaceutical Product Development LLC(a) |
| 08/01/2023 | 6.375% | | 299,000 | 309,022 |
| Par Pharmaceutical, Inc.(a) |
| 04/01/2027 | 7.500% | | 136,000 | 126,984 |
| Total | 24,178,422 |
The accompanying Notes to Financial Statements are an integral part of this statement.
Columbia Balanced Fund | Annual Report 2019
| 21 |
Portfolio of Investments (continued)
August 31, 2019
| Corporate Bonds & Notes (continued) |
| Issuer | Coupon
Rate | | Principal
Amount ($) | Value ($) |
| Property & Casualty 0.2% |
| Acrisure LLC/Finance, Inc.(a) |
| 02/15/2024 | 8.125% | | 65,000 | 70,171 |
| CNA Financial Corp. |
| 03/01/2026 | 4.500% | | 4,000,000 | 4,406,068 |
| HUB International Ltd.(a) |
| 05/01/2026 | 7.000% | | 196,000 | 198,859 |
| Loews Corp. |
| 04/01/2026 | 3.750% | | 5,500,000 | 5,927,812 |
| USI, Inc.(a) |
| 05/01/2025 | 6.875% | | 18,000 | 18,009 |
| Total | 10,620,919 |
| Railroads 0.1% |
| CSX Corp. |
| 03/15/2044 | 4.100% | | 3,750,000 | 4,186,155 |
| Union Pacific Corp. |
| 09/15/2037 | 3.600% | | 4,500,000 | 4,823,433 |
| Total | 9,009,588 |
| Restaurants 0.0% |
| 1011778 BC ULC/New Red Finance, Inc.(a) |
| 05/15/2024 | 4.250% | | 85,000 | 87,859 |
| 10/15/2025 | 5.000% | | 174,000 | 179,697 |
| IRB Holding Corp.(a) |
| 02/15/2026 | 6.750% | | 210,000 | 212,083 |
| Total | 479,639 |
| Retail REIT 0.2% |
| Kimco Realty Corp. |
| 10/01/2026 | 2.800% | | 5,500,000 | 5,560,742 |
| Simon Property Group LP |
| 02/01/2040 | 6.750% | | 3,400,000 | 5,132,106 |
| Total | 10,692,848 |
| Retailers 0.2% |
| L Brands, Inc. |
| 06/15/2029 | 7.500% | | 62,000 | 60,822 |
| 11/01/2035 | 6.875% | | 87,000 | 73,785 |
| Lowe’s Companies, Inc. |
| 04/05/2049 | 4.550% | | 4,480,000 | 5,244,516 |
| Penske Automotive Group, Inc. |
| 10/01/2022 | 5.750% | | 138,000 | 139,753 |
| PetSmart, Inc.(a) |
| 03/15/2023 | 7.125% | | 150,000 | 139,719 |
| 06/01/2025 | 5.875% | | 155,000 | 151,911 |
| Corporate Bonds & Notes (continued) |
| Issuer | Coupon
Rate | | Principal
Amount ($) | Value ($) |
| Target Corp. |
| 04/15/2026 | 2.500% | | 5,000,000 | 5,154,895 |
| Total | 10,965,401 |
| Supermarkets 0.1% |
| Albertsons Companies LLC/Safeway, Inc.(a) |
| 03/15/2026 | 7.500% | | 117,000 | 130,262 |
| Albertsons Companies LLC/Safeway, Inc./New Albertsons LP |
| 03/15/2025 | 5.750% | | 60,000 | 61,653 |
| Albertsons Companies LLC/Safeway, Inc./New Albertsons LP(a) |
| 02/15/2028 | 5.875% | | 147,000 | 154,841 |
| Kroger Co. (The) |
| 01/15/2048 | 4.650% | | 5,165,000 | 5,522,842 |
| Total | 5,869,598 |
| Technology 0.3% |
| Ascend Learning LLC(a) |
| 08/01/2025 | 6.875% | | 135,000 | 140,049 |
| 08/01/2025 | 6.875% | | 126,000 | 130,604 |
| Broadcom Corp./Cayman Finance Ltd. |
| 01/15/2027 | 3.875% | | 7,340,000 | 7,342,665 |
| Camelot Finance SA(a) |
| 10/15/2024 | 7.875% | | 407,000 | 422,677 |
| CDK Global, Inc. |
| 06/01/2027 | 4.875% | | 222,000 | 229,470 |
| CommScope Finance LLC(a) |
| 03/01/2024 | 5.500% | | 66,000 | 67,132 |
| 03/01/2026 | 6.000% | | 168,000 | 170,784 |
| CommScope Technologies LLC(a) |
| 06/15/2025 | 6.000% | | 115,000 | 103,041 |
| 03/15/2027 | 5.000% | | 81,000 | 67,686 |
| Ensemble S Merger Sub, Inc.(a) |
| 09/30/2023 | 9.000% | | 69,000 | 70,874 |
| Equinix, Inc. |
| 04/01/2023 | 5.375% | | 235,000 | 239,967 |
| 05/15/2027 | 5.375% | | 172,000 | 186,475 |
| Gartner, Inc.(a) |
| 04/01/2025 | 5.125% | | 306,000 | 320,711 |
| Genesys Telecommunications Laboratories, Inc./Greeneden Lux 3 Sarl/U.S. Holdings I LLC(a) |
| 11/30/2024 | 10.000% | | 130,000 | 140,432 |
| Informatica LLC(a) |
| 07/15/2023 | 7.125% | | 194,000 | 197,216 |
| Iron Mountain, Inc. |
| 08/15/2024 | 5.750% | | 307,000 | 310,007 |
| NCR Corp. |
| 12/15/2021 | 5.875% | | 272,000 | 274,683 |
| 12/15/2023 | 6.375% | | 395,000 | 407,189 |
The accompanying Notes to Financial Statements are an integral part of this statement.
| 22 | Columbia Balanced Fund | Annual Report 2019 |
Portfolio of Investments (continued)
August 31, 2019
| Corporate Bonds & Notes (continued) |
| Issuer | Coupon
Rate | | Principal
Amount ($) | Value ($) |
| NCR Corp.(a) |
| 09/01/2027 | 5.750% | | 103,000 | 108,696 |
| 09/01/2029 | 6.125% | | 131,000 | 138,967 |
| Oracle Corp. |
| 04/15/2038 | 6.500% | | 3,700,000 | 5,444,280 |
| PTC, Inc. |
| 05/15/2024 | 6.000% | | 136,000 | 142,459 |
| Qualitytech LP/QTS Finance Corp.(a) |
| 11/15/2025 | 4.750% | | 462,000 | 468,685 |
| Refinitiv US Holdings, Inc.(a) |
| 11/15/2026 | 8.250% | | 275,000 | 310,087 |
| Symantec Corp.(a) |
| 04/15/2025 | 5.000% | | 108,000 | 108,502 |
| Tempo Acquisition LLC/Finance Corp.(a) |
| 06/01/2025 | 6.750% | | 237,000 | 243,352 |
| Verscend Escrow Corp.(a) |
| 08/15/2026 | 9.750% | | 167,000 | 178,752 |
| Total | 17,965,442 |
| Transportation Services 0.1% |
| Avis Budget Car Rental LLC/Finance, Inc.(a) |
| 03/15/2025 | 5.250% | | 319,000 | 324,328 |
| ERAC U.S.A. Finance LLC(a) |
| 10/15/2037 | 7.000% | | 3,285,000 | 4,698,526 |
| Hertz Corp. (The)(a) |
| 06/01/2022 | 7.625% | | 264,000 | 274,698 |
| 10/15/2024 | 5.500% | | 140,000 | 137,679 |
| 08/01/2026 | 7.125% | | 117,000 | 119,431 |
| XPO Logistics, Inc.(a) |
| 06/15/2022 | 6.500% | | 135,000 | 137,699 |
| Total | 5,692,361 |
| Wireless 0.2% |
| Altice France SA(a) |
| 05/01/2026 | 7.375% | | 664,000 | 708,147 |
| Altice Luxembourg SA(a) |
| 05/15/2027 | 10.500% | | 196,000 | 212,612 |
| American Tower Corp. |
| 07/15/2027 | 3.550% | | 5,125,000 | 5,434,786 |
| Rogers Communications, Inc. |
| 11/15/2026 | 2.900% | | 5,000,000 | 5,158,990 |
| SBA Communications Corp. |
| 09/01/2024 | 4.875% | | 410,000 | 425,882 |
| Sprint Corp. |
| 02/15/2025 | 7.625% | | 136,000 | 152,632 |
| 03/01/2026 | 7.625% | | 692,000 | 782,023 |
| Corporate Bonds & Notes (continued) |
| Issuer | Coupon
Rate | | Principal
Amount ($) | Value ($) |
| T-Mobile U.S.A., Inc. |
| 01/15/2026 | 6.500% | | 356,000 | 382,939 |
| 02/01/2026 | 4.500% | | 265,000 | 275,001 |
| 02/01/2028 | 4.750% | | 206,000 | 216,853 |
| Total | 13,749,865 |
| Wirelines 0.4% |
| AT&T, Inc. |
| 08/15/2040 | 6.000% | | 8,815,000 | 11,083,981 |
| CenturyLink, Inc. |
| 03/15/2022 | 5.800% | | 556,000 | 583,764 |
| 04/01/2024 | 7.500% | | 134,000 | 148,753 |
| Frontier Communications Corp. |
| 01/15/2023 | 7.125% | | 101,000 | 51,835 |
| 09/15/2025 | 11.000% | | 25,000 | 12,658 |
| Frontier Communications Corp.(a) |
| 04/01/2026 | 8.500% | | 106,000 | 102,945 |
| Level 3 Financing, Inc. |
| 01/15/2021 | 6.125% | | 89,000 | 89,414 |
| Telecom Italia Capital SA |
| 09/30/2034 | 6.000% | | 61,000 | 62,177 |
| Telecom Italia SpA(a) |
| 05/30/2024 | 5.303% | | 186,000 | 198,227 |
| Telefonica Emisiones SAU |
| 06/20/2036 | 7.045% | | 2,800,000 | 3,820,902 |
| Verizon Communications, Inc. |
| 08/10/2033 | 4.500% | | 9,000,000 | 10,610,550 |
| Zayo Group LLC/Capital, Inc. |
| 05/15/2025 | 6.375% | | 120,000 | 123,617 |
| Zayo Group LLC/Capital, Inc.(a) |
| 01/15/2027 | 5.750% | | 344,000 | 353,032 |
| Total | 27,241,855 |
Total Corporate Bonds & Notes
(Cost $563,839,574) | 615,510,421 |
| Exchange-Traded Funds 0.9% |
| | Shares | Value ($) |
| iShares Core MSCI EAFE ETF | 1,079,495 | 64,046,438 |
Total Exchange-Traded Funds
(Cost $72,408,419) | 64,046,438 |
The accompanying Notes to Financial Statements are an integral part of this statement.
Columbia Balanced Fund | Annual Report 2019
| 23 |
Portfolio of Investments (continued)
August 31, 2019
| Foreign Government Obligations(h) 0.0% |
| Issuer | Coupon
Rate | | Principal
Amount ($) | Value ($) |
| Canada 0.0% |
| NOVA Chemicals Corp.(a) |
| 06/01/2027 | 5.250% | | 57,000 | 59,659 |
Total Foreign Government Obligations
(Cost $58,445) | 59,659 |
|
| Inflation-Indexed Bonds 0.7% |
| | | | |
| United States 0.7% |
| U.S. Treasury Inflation-Indexed Bond |
| 04/15/2022 | 0.125% | | 45,604,859 | 45,309,745 |
Total Inflation-Indexed Bonds
(Cost $44,630,624) | 45,309,745 |
|
| Residential Mortgage-Backed Securities - Agency 9.8% |
| | | | |
| Federal Home Loan Mortgage Corp. |
07/01/2021-
01/01/2039 | 5.500% | | 302,749 | 340,220 |
10/01/2026-
05/01/2049 | 3.500% | | 50,316,235 | 51,910,373 |
10/01/2031-
10/01/2039 | 6.000% | | 578,553 | 658,380 |
06/01/2032-
07/01/2032 | 7.000% | | 230,168 | 267,816 |
| 03/01/2038 | 6.500% | | 4,659 | 5,425 |
10/01/2038-
05/01/2041 | 5.000% | | 854,409 | 940,203 |
05/01/2039-
06/01/2041 | 4.500% | | 3,532,838 | 3,827,816 |
12/01/2042-
05/01/2049 | 3.000% | | 55,337,074 | 56,620,309 |
12/01/2042-
10/01/2045 | 4.000% | | 26,518,164 | 28,038,817 |
| CMO Series 1614 Class MZ |
| 11/15/2023 | 6.500% | | 5,863 | 6,213 |
| Federal Home Loan Mortgage Corp.(i) |
07/01/2034-
09/01/2034 | 3.000% | | 42,621,652 | 43,714,078 |
| Federal Home Loan Mortgage Corp.(c) |
12-month USD LIBOR + 1.709%
Cap 11.091%
08/01/2036 | 4.522% | | 10,191 | 10,672 |
12-month USD LIBOR + 1.768%
Cap 11.060%
12/01/2036 | 4.640% | | 1,792 | 1,867 |
| Federal National Mortgage Association |
| 12/01/2020 | 5.000% | | 8,741 | 9,010 |
12/01/2025-
03/01/2049 | 3.500% | | 37,630,880 | 39,128,987 |
07/01/2027-
10/01/2046 | 3.000% | | 11,542,477 | 11,894,443 |
01/01/2029-
10/01/2045 | 4.000% | | 15,531,690 | 16,444,035 |
| Residential Mortgage-Backed Securities - Agency (continued) |
| Issuer | Coupon
Rate | | Principal
Amount ($) | Value ($) |
| 06/01/2031 | 7.000% | | 138,523 | 160,428 |
07/01/2032-
03/01/2037 | 6.500% | | 300,938 | 337,544 |
06/01/2037-
02/01/2038 | 5.500% | | 145,776 | 163,989 |
05/01/2040-
06/01/2044 | 4.500% | | 4,140,932 | 4,469,718 |
| Series 2006-M2 Class A2A |
| 10/25/2032 | 5.271% | | 983,601 | 1,126,017 |
| Federal National Mortgage Association(d) |
09/17/2034-
09/12/2049 | 4.000% | | 194,575,000 | 202,109,780 |
| 09/12/2049 | 3.000% | | 53,300,000 | 54,353,508 |
| 09/12/2049 | 3.500% | | 142,750,000 | 146,720,234 |
| Federal National Mortgage Association(j) |
| 10/01/2045 | 3.500% | | 4,147,107 | 4,327,926 |
Total Residential Mortgage-Backed Securities - Agency
(Cost $665,694,871) | 667,587,808 |
|
| Residential Mortgage-Backed Securities - Non-Agency 9.0% |
| | | | |
| Angel Oak Mortgage Trust I LLC(a),(k) |
| CMO Series 2018-3 Class A3 |
| 09/25/2048 | 3.853% | | 6,763,644 | 6,926,567 |
| CMO Series 2019-2 Class A3 |
| 03/25/2049 | 3.833% | | 6,810,670 | 6,946,907 |
| Angel Oak Mortgage Trust LLC(a),(k) |
| CMO Series 2017-1 Class A1 |
| 01/25/2047 | 2.810% | | 638,857 | 637,801 |
| Arroyo Mortgage Trust(a),(k) |
| CMO Series 2018-1 Class A1 |
| 04/25/2048 | 3.763% | | 8,710,452 | 8,916,217 |
| CMO Series 2019-1 Class A1 |
| 01/25/2049 | 3.805% | | 12,835,049 | 13,157,508 |
| Bayview Opportunity Master Fund IIIb Trust(a),(b),(k) |
| CMO Series 2019-LT1 Class A1 |
| 08/28/2034 | 3.228% | | 21,975,000 | 21,975,000 |
| Bayview Opportunity Master Fund IVa Trust(a) |
| CMO Series 2016-SPL1 Class A |
| 04/28/2055 | 4.000% | | 2,356,299 | 2,415,123 |
| Bayview Opportunity Master Fund IVa Trust(a),(k) |
| CMO Series 2019-RN2 Class A1 |
| 03/28/2034 | 3.967% | | 2,424,430 | 2,433,167 |
| Bayview Opportunity Master Fund IVb Trust(a) |
| CMO Series 2018-RN9 Class A1 |
| 10/29/2033 | 4.213% | | 4,819,363 | 4,862,884 |
| Bellemeade Re Ltd.(a),(c) |
| CMO Series 2018-2A Class M1A |
1-month USD LIBOR + 0.950%
08/25/2028 | 3.354% | | 4,499,575 | 4,498,687 |
The accompanying Notes to Financial Statements are an integral part of this statement.
| 24 | Columbia Balanced Fund | Annual Report 2019 |
Portfolio of Investments (continued)
August 31, 2019
| Residential Mortgage-Backed Securities - Non-Agency (continued) |
| Issuer | Coupon
Rate | | Principal
Amount ($) | Value ($) |
| CMO Series 2019-1A Class M1A |
1-month USD LIBOR + 1.300%
Floor 1.300%
03/25/2029 | 3.445% | | 6,589,316 | 6,589,316 |
| CMO Series 2019-3A Class M1A |
1-month USD LIBOR + 1.100%
Floor 1.100%
07/25/2029 | 3.490% | | 8,525,000 | 8,524,987 |
| BRAVO Residential Funding Trust(a),(k) |
| CMO Series 2019-NQM1 Class A1 |
| 07/25/2059 | 2.666% | | 13,849,079 | 13,894,747 |
| CMO Series 2019-NQM1 Class A3 |
| 07/25/2059 | 2.996% | | 5,418,601 | 5,431,580 |
| CMO Series 2019-NQM1 Class M1 |
| 07/25/2059 | 2.997% | | 2,162,500 | 2,164,704 |
| CIM Trust(a),(c) |
| CMO Series 2018-R6 Class A1 |
1-month USD LIBOR + 1.076%
Floor 1.080%
09/25/2058 | 3.176% | | 20,278,589 | 20,137,298 |
| Citigroup Mortgage Loan Trust(a),(b),(k) |
| CMO Series 2019-C Class A1 |
| 03/25/2082 | 3.228% | | 10,713,200 | 10,713,151 |
| Citigroup Mortgage Loan Trust(a),(k) |
| CMO Series 2019-IMC1 Class A3 |
| 07/25/2049 | 3.030% | | 6,125,000 | 6,129,801 |
| COLT 2019-1 Mortgage Loan Trust(a),(k) |
| CMO Series 2019-1 Class A3 |
| 03/25/2049 | 4.012% | | 7,233,291 | 7,414,375 |
| COLT Mortgage Loan Trust(a),(k) |
| CMO Series 2018-2 Class A1 |
| 07/27/2048 | 3.470% | | 2,355,308 | 2,368,285 |
| CMO Series 2018-4 Class A1 |
| 12/28/2048 | 4.006% | | 9,513,879 | 9,651,721 |
| COLT Mortgage Loan Trust(a) |
| CMO Series 2018-3 Class A1 |
| 10/26/2048 | 3.692% | | 5,344,392 | 5,427,371 |
| CSMC Trust(a),(k) |
| CMO Series 2018-RPL9 Class A |
| 09/25/2057 | 3.850% | | 21,152,202 | 22,104,658 |
| CSMC Trust(a) |
| CMO Series 2019-AFC1 Class A1 |
| 07/25/2049 | 2.573% | | 15,575,000 | 15,572,478 |
| Deephaven Residential Mortgage Trust(a),(k) |
| CMO Series 2017-1A Class A1 |
| 12/26/2046 | 2.725% | | 1,367,153 | 1,362,626 |
| CMO Series 2017-2A Class A1 |
| 06/25/2047 | 2.453% | | 2,815,405 | 2,809,907 |
| Residential Mortgage-Backed Securities - Non-Agency (continued) |
| Issuer | Coupon
Rate | | Principal
Amount ($) | Value ($) |
| CMO Series 2018-3A Class A3 |
| 08/25/2058 | 3.963% | | 3,772,563 | 3,873,253 |
| CMO Series 2018-4A Class A1 |
| 10/25/2058 | 4.080% | | 15,513,973 | 15,911,917 |
| CMO Series 2019-1A Class A3 |
| 01/25/2059 | 3.948% | | 3,740,139 | 3,818,525 |
| Eagle RE Ltd.(a),(c) |
| CMO Series 2019-1 Class M1A |
1-month USD LIBOR + 1.250%
04/25/2029 | 3.395% | | 5,350,000 | 5,348,078 |
| Equifirst Mortgage Loan Trust(k) |
| CMO Series 2003-1 Class IF1 |
| 12/25/2032 | 4.010% | | 37,984 | 39,323 |
| GCAT LLC(a),(k) |
| CMO Series 2019-1 Class A1 |
| 04/26/2049 | 4.089% | | 4,722,199 | 4,733,805 |
| CMO Series 2019-2 Class A1 |
| 06/25/2024 | 3.475% | | 10,739,595 | 10,742,795 |
| GCAT Trust(a),(b),(k) |
| CMO Series 2019-RPL1 Class A1 |
| 10/25/2068 | 2.650% | | 12,675,000 | 12,710,660 |
| GS Mortgage-Backed Securities Trust(a),(k) |
| CMO Series 2019-SL1 Class A1 |
| 01/25/2059 | 2.625% | | 21,861,819 | 21,779,852 |
| Homeward Opportunities Fund I Trust(a) |
| CMO Series 2018-2 Class A3 |
| 11/25/2058 | 4.239% | | 7,600,555 | 7,749,227 |
| Homeward Opportunities Fund I Trust(a),(k) |
| CMO Series 2019-1 Class A3 |
| 01/25/2059 | 3.606% | | 8,631,935 | 8,794,357 |
| Legacy Mortgage Asset Trust(a),(k) |
| CMO Series 2019-GS5 Class A1 |
| 05/25/2059 | 3.200% | | 7,385,144 | 7,399,599 |
| MetLife Securitization Trust(a) |
| CMO Series 2018-1A Class A |
| 03/25/2057 | 3.750% | | 6,202,272 | 6,513,915 |
| MFA Trust(a),(k) |
| CMO Series 2017-RPL1 Class A1 |
| 02/25/2057 | 2.588% | | 3,873,928 | 3,855,636 |
| Mill City Mortgage Loan Trust(a) |
| CMO Series 2016-1 Class A1 |
| 04/25/2057 | 2.500% | | 2,745,410 | 2,741,080 |
| CMO Series 2018-3 Class A1 |
| 08/25/2058 | 3.500% | | 13,859,431 | 14,217,696 |
| New Residential Mortgage Loan Trust(a) |
| CMO Series 2016-3A Class A1 |
| 09/25/2056 | 3.750% | | 2,091,053 | 2,166,106 |
| CMO Series 2018-NQM1 Class A1 |
| 11/25/2048 | 3.986% | | 14,599,250 | 15,062,383 |
The accompanying Notes to Financial Statements are an integral part of this statement.
Columbia Balanced Fund | Annual Report 2019
| 25 |
Portfolio of Investments (continued)
August 31, 2019
| Residential Mortgage-Backed Securities - Non-Agency (continued) |
| Issuer | Coupon
Rate | | Principal
Amount ($) | Value ($) |
| CMO Series 2018-NQM1 Class A3 |
| 11/25/2048 | 4.138% | | 4,532,238 | 4,707,581 |
| New Residential Mortgage Loan Trust(a),(k) |
| CMO Series 2019-NQM2 Class A3 |
| 04/25/2049 | 3.752% | | 7,079,708 | 7,304,913 |
| CMO Series 2019-RPL1 Class A1 |
| 02/26/2024 | 4.335% | | 8,530,675 | 8,602,974 |
| Preston Ridge Partners Mortgage LLC(a) |
| CMO Series 2019-2A Class A1 |
| 04/25/2024 | 3.967% | | 8,483,693 | 8,562,109 |
| Radnor Re Ltd.(a),(c) |
| CMO Series 2019-1 Class M1A |
1-month USD LIBOR + 1.250%
Floor 1.250%
02/25/2029 | 3.395% | | 4,125,000 | 4,123,516 |
| RCO Trust(a),(k) |
| CMO Series 2018-VFS1 Class A1 |
| 12/26/2053 | 4.270% | | 19,625,889 | 20,078,642 |
| RCO V Mortgage LLC(a),(k) |
| CMO Series 2018-2 Class A1 |
| 10/25/2023 | 4.458% | | 9,198,191 | 9,238,663 |
| RCO V Mortgage LLC(a) |
| CMO Series 2019-1 Class A1 |
| 05/24/2024 | 3.721% | | 7,209,487 | 7,244,396 |
| Residential Mortgage Loan Trust(a),(k) |
| CMO Series 2019-1 Class A3 |
| 10/25/2058 | 4.242% | | 6,571,707 | 6,682,448 |
| Starwood Mortgage Residential Trust(a),(k) |
| CMO Series 2018-IMC1 Class A3 |
| 03/25/2048 | 3.977% | | 4,374,636 | 4,512,267 |
| CMO Series 2019-1 Class A3 |
| 06/25/2049 | 3.299% | | 4,106,851 | 4,127,003 |
| CMO Series 2019-IMC1 Class A3 |
| 04/25/2049 | 3.754% | | 2,615,849 | 2,657,445 |
| Towd Point Mortgage Trust(a) |
| CMO Series 15-5 Class A1 |
| 05/25/2055 | 3.500% | | 1,986,639 | 2,004,991 |
| CMO Series 2015-6 Class A1 |
| 04/25/2055 | 3.500% | | 2,467,428 | 2,506,371 |
| CMO Series 2016-1 Class A1 |
| 02/25/2055 | 3.500% | | 2,369,344 | 2,394,834 |
| CMO Series 2016-2 Class A1 |
| 08/25/2055 | 3.000% | | 3,722,649 | 3,760,838 |
| CMO Series 2016-3 Class A1 |
| 04/25/2056 | 2.250% | | 1,883,850 | 1,876,011 |
| CMO Series 2017-1 Class A1 |
| 10/25/2056 | 2.750% | | 2,729,389 | 2,742,506 |
| Residential Mortgage-Backed Securities - Non-Agency (continued) |
| Issuer | Coupon
Rate | | Principal
Amount ($) | Value ($) |
| CMO Series 2017-4 Class A1 |
| 06/25/2057 | 2.750% | | 5,047,135 | 5,084,683 |
| Towd Point Mortgage Trust(a),(k) |
| CMO Series 2018-1 Class A1 |
| 01/25/2058 | 3.000% | | 3,509,418 | 3,569,013 |
| CMO Series 2018-5 Class A1 |
| 07/25/2058 | 3.250% | | 7,367,689 | 7,548,696 |
| CMO Series 2018-6 Class A1A |
| 03/25/2058 | 3.750% | | 14,927,192 | 15,389,857 |
| Towd Point Mortgage Trust(a),(c) |
| CMO Series 2019-HY1 Class A1 |
1-month USD LIBOR + 1.000%
10/25/2048 | 3.145% | | 10,904,599 | 10,957,632 |
| CMO Series 2019-HY2 Class A1 |
1-month USD LIBOR + 1.000%
Floor 1.000%
05/25/2058 | 3.145% | | 12,288,949 | 12,341,388 |
| Vericrest Opportunity Loan Transferee LXX LLC(a),(k) |
| CMO Series 2018-NPL6 Class A1A |
| 09/25/2048 | 4.115% | | 4,237,613 | 4,257,301 |
| Vericrest Opportunity Loan Transferee LXXI LLC(a) |
| CMO Series 2018-NPL7 Class A1A |
| 09/25/2048 | 3.967% | | 2,313,598 | 2,327,854 |
| Vericrest Opportunity Loan Transferee LXXII LLC(a) |
| CMO Series 2018-NPL8 Class A1A |
| 10/26/2048 | 4.213% | | 9,604,921 | 9,660,334 |
| Vericrest Opportunity Loan Transferee LXXV LLC(a) |
| CMO Series 2019-NPL1 Class A1A |
| 01/25/2049 | 4.336% | | 7,557,082 | 7,600,914 |
| Vericrest Opportunity Loan Trust(a),(k) |
| CMO Series 2019-NPL3 Class A1 |
| 03/25/2049 | 3.967% | | 2,798,577 | 2,820,365 |
| CMO Series 2019-NPL4 Class A1A |
| 08/25/2049 | 3.352% | | 10,114,772 | 10,114,763 |
| CMO Series 2019-NPL5 Class A1A |
| 09/25/2049 | 3.352% | | 14,595,000 | 14,594,991 |
| Verus Securitization Trust(a),(k) |
| CMO Series 2017-1A Class A1 |
| 01/25/2047 | 2.881% | | 1,224,522 | 1,222,643 |
| CMO Series 2018-2 Class A3 |
| 06/01/2058 | 3.830% | | 8,679,538 | 8,910,330 |
| CMO Series 2019-1 Class A3 |
| 02/25/2059 | 4.040% | | 8,360,606 | 8,480,867 |
| CMO Series 2019-3 Class A3 |
| 07/25/2059 | 3.040% | | 10,714,974 | 10,735,924 |
| CMO Series 2019-INV1 Class A3 |
| 12/25/2059 | 3.658% | | 5,159,636 | 5,313,972 |
The accompanying Notes to Financial Statements are an integral part of this statement.
| 26 | Columbia Balanced Fund | Annual Report 2019 |
Portfolio of Investments (continued)
August 31, 2019
| Residential Mortgage-Backed Securities - Non-Agency (continued) |
| Issuer | Coupon
Rate | | Principal
Amount ($) | Value ($) |
| Visio Trust(a),(k) |
| CMO Series 2019-1 Class A3 |
| 06/25/2054 | 3.825% | | 4,302,370 | 4,343,253 |
Total Residential Mortgage-Backed Securities - Non-Agency
(Cost $601,511,244) | 608,927,361 |
|
| Senior Loans 0.0% |
| Borrower | Coupon
Rate | | Principal
Amount ($) | Value ($) |
| Chemicals 0.0% |
| Starfruit Finco BV/US Holdco LLC/AzkoNobel(c),(l) |
| Term Loan |
3-month USD LIBOR + 3.250%
10/01/2025 | 5.463% | | 118,703 | 114,498 |
| Finance Companies 0.0% |
| Ellie Mae, Inc.(c),(l) |
| 1st Lien Term Loan |
3-month USD LIBOR + 4.000%
04/17/2026 | 6.172% | | 160,000 | 159,301 |
| Food and Beverage 0.0% |
| 8th Avenue Food & Provisions, Inc.(c),(l) |
| 1st Lien Term Loan |
3-month USD LIBOR + 3.750%
10/01/2025 | 5.963% | | 179,662 | 179,775 |
| 2nd Lien Term Loan |
3-month USD LIBOR + 7.750%
10/01/2026 | 9.963% | | 32,969 | 32,475 |
| Total | 212,250 |
| Metals and Mining 0.0% |
| Big River Steel LLC(c),(l) |
| Term Loan |
3-month USD LIBOR + 5.000%
Floor 1.000%
08/23/2023 | 7.330% | | 43,359 | 43,359 |
| Property & Casualty 0.0% |
| HUB International Ltd.(c),(l) |
| Term Loan |
3-month USD LIBOR + 3.000%
04/25/2025 | 5.267% | | 45,540 | 44,590 |
| Restaurants 0.0% |
| IRB Holding Corp./Arby’s/Buffalo Wild Wings(c),(l) |
| Tranche B Term Loan |
3-month USD LIBOR + 3.250%
Floor 1.000%
02/05/2025 | 5.550% | | 103,738 | 102,927 |
| Senior Loans (continued) |
| Borrower | Coupon
Rate | | Principal
Amount ($) | Value ($) |
| Technology 0.0% |
| Ascend Learning LLC(c),(l) |
| Term Loan |
3-month USD LIBOR + 3.000%
Floor 1.000%
07/12/2024 | 5.112% | | 146,772 | 145,304 |
| Dun & Bradstreet Corp. (The)(c),(l) |
| Term Loan |
3-month USD LIBOR + 5.000%
02/06/2026 | 7.145% | | 183,000 | 183,381 |
| Greeneden US Holdings I LLC/Genesys Telecommunications Laboratories, Inc.(c),(l) |
| Tranche B3 Term Loan |
3-month USD LIBOR + 3.250%
12/01/2023 | 5.362% | | 146,147 | 144,357 |
| Misys Ltd./Almonde/Tahoe/Finastra USA(c),(l) |
| 1st Lien Term Loan |
3-month USD LIBOR + 3.500%
Floor 1.000%
06/13/2024 | 5.696% | | 106,036 | 102,177 |
| Project Alpha Intermediate Holding, Inc.(c),(l) |
| Term Loan |
3-month USD LIBOR + 3.500%
Floor 1.000%
04/26/2024 | 5.810% | | 40,258 | 39,680 |
3-month USD LIBOR + 4.250%
04/26/2024 | 6.560% | | 119,490 | 119,117 |
| Refinitiv US Holdings, Inc.(a),(c),(l) |
| Term Loan |
3-month USD LIBOR + 3.750%
10/01/2025 | 5.862% | | 290,592 | 291,882 |
| Tempo Acquisition LLC(c),(l) |
| Term Loan |
3-month USD LIBOR + 3.000%
05/01/2024 | 5.112% | | 106,457 | 106,369 |
| Ultimate Software Group, Inc. (The)(c),(l) |
| 1st Lien Term Loan |
3-month USD LIBOR + 3.750%
05/04/2026 | 6.080% | | 89,000 | 89,159 |
| Total | 1,221,426 |
Total Senior Loans
(Cost $1,897,835) | 1,898,351 |
|
| U.S. Government & Agency Obligations 0.3% |
| Issuer | Coupon
Rate | | Principal
Amount ($) | Value ($) |
| Federal Home Loan Banks |
| 10/01/2020 | 2.625% | | 22,300,000 | 22,520,436 |
Total U.S. Government & Agency Obligations
(Cost $22,311,885) | 22,520,436 |
|
The accompanying Notes to Financial Statements are an integral part of this statement.
Columbia Balanced Fund | Annual Report 2019
| 27 |
Portfolio of Investments (continued)
August 31, 2019
| U.S. Treasury Obligations 1.9% |
| Issuer | Coupon
Rate | | Principal
Amount ($) | Value ($) |
| U.S. Treasury |
| 02/15/2045 | 2.500% | | 115,225,000 | 127,665,699 |
Total U.S. Treasury Obligations
(Cost $103,849,884) | 127,665,699 |
| Money Market Funds 5.8% |
| | Shares | Value ($) |
| Columbia Short-Term Cash Fund, 2.208%(m),(n) | 391,867,751 | 391,828,565 |
Total Money Market Funds
(Cost $391,844,087) | 391,828,565 |
Total Investments in Securities
(Cost: $5,915,221,830) | 7,221,885,102 |
| Other Assets & Liabilities, Net | | (421,164,626) |
| Net Assets | 6,800,720,476 |
At August 31, 2019, securities and/or cash totaling $4,393,384 were pledged as collateral.
Investments in derivatives
| Long futures contracts |
| Description | Number of
contracts | Expiration
date | Trading
currency | Notional
amount | Value/Unrealized
appreciation ($) | Value/Unrealized
depreciation ($) |
| U.S. Treasury 10-Year Note | 1,375 | 12/2019 | USD | 181,113,281 | 861,410 | — |
| U.S. Treasury 2-Year Note | 1,025 | 12/2019 | USD | 221,520,118 | 278,326 | — |
| U.S. Treasury 5-Year Note | 1,125 | 12/2019 | USD | 134,973,633 | 525,206 | — |
| U.S. Treasury 5-Year Note | 375 | 12/2019 | USD | 44,991,211 | — | (38,667) |
| U.S. Ultra Treasury Bond | 20 | 12/2019 | USD | 3,948,750 | 59,819 | — |
| Total | | | | | 1,724,761 | (38,667) |
Notes to Portfolio of Investments
| (a) | Represents privately placed and other securities and instruments exempt from Securities and Exchange Commission registration (collectively, private placements), such as Section 4(a)(2) and Rule 144A eligible securities, which are often sold only to qualified institutional buyers. The Fund may invest in private placements determined to be liquid as well as those determined to be illiquid. Private placements may be determined to be liquid under guidelines established by the Fund’s Board of Trustees. At August 31, 2019, the total value of these securities amounted to $1,231,410,016, which represents 18.11% of total net assets. |
| (b) | Valuation based on significant unobservable inputs. |
| (c) | Variable rate security. The interest rate shown was the current rate as of August 31, 2019. |
| (d) | Represents a security purchased on a when-issued basis. |
| (e) | Represents fair value as determined in good faith under procedures approved by the Board of Trustees. At August 31, 2019, the total value of these securities amounted to $6,004,603, which represents 0.09% of total net assets. |
| (f) | Non-income producing investment. |
| (g) | Represents a variable rate security with a step coupon where the rate adjusts according to a schedule for a series of periods, typically lower for an initial period and then increasing to a higher coupon rate thereafter. The interest rate shown was the current rate as of August 31, 2019. |
| (h) | Principal and interest may not be guaranteed by the government. |
| (i) | Represents a security purchased on a forward commitment basis. |
| (j) | This security or a portion of this security has been pledged as collateral in connection with derivative contracts. |
| (k) | Variable or floating rate security, the interest rate of which adjusts periodically based on changes in current interest rates and prepayments on the underlying pool of assets. The interest rate shown was the current rate as of August 31, 2019. |
The accompanying Notes to Financial Statements are an integral part of this statement.
| 28 | Columbia Balanced Fund | Annual Report 2019 |
Portfolio of Investments (continued)
August 31, 2019
Notes to Portfolio of Investments (continued)
| (l) | The stated interest rate represents the weighted average interest rate at August 31, 2019 of contracts within the senior loan facility. Interest rates on contracts are primarily determined either weekly, monthly or quarterly by reference to the indicated base lending rate and spread and the reset period. These base lending rates are primarily the London Interbank Offered Rate (“LIBOR”) and other short-term rates. Base lending rates may be subject to a floor or minimum rate. The interest rate for senior loans purchased on a when-issued or delayed delivery basis will be determined upon settlement, therefore no interest rate is disclosed. Senior loans often require prepayments from excess cash flows or permit the borrowers to repay at their election. The degree to which borrowers repay, cannot be predicted with accuracy. As a result, remaining maturities of senior loans may be less than the stated maturities. |
| (m) | The rate shown is the seven-day current annualized yield at August 31, 2019. |
| (n) | As defined in the Investment Company Act of 1940, an affiliated company is one in which the Fund owns 5% or more of the company’s outstanding voting securities, or a company which is under common ownership or control with the Fund. Holdings and transactions in these affiliated companies during the year ended August 31, 2019 are as follows: |
| Issuer | Beginning
shares | Shares
purchased | Shares
sold | Ending
shares | Realized gain
(loss) —
affiliated
issuers ($) | Net change in
unrealized
appreciation
(depreciation) —
affiliated
issuers ($) | Dividends —
affiliated
issuers ($) | Value —
affiliated
issuers
at end of
period ($) |
| Columbia Short-Term Cash Fund, 2.208% |
| | 315,856,889 | 2,353,977,595 | (2,277,966,733) | 391,867,751 | (4,793) | 8,746 | 10,193,006 | 391,828,565 |
Abbreviation Legend
| CMO | Collateralized Mortgage Obligation |
| PIK | Payment In Kind |
Currency Legend
Fair value measurements
The Fund categorizes its fair value measurements according to a three-level hierarchy that maximizes the use of observable inputs and minimizes the use of unobservable inputs by prioritizing that the most observable input be used when available. Observable inputs are those that market participants would use in pricing an investment based on market data obtained from sources independent of the reporting entity. Unobservable inputs are those that reflect the Fund’s assumptions about the information market participants would use in pricing an investment. An investment’s level within the fair value hierarchy is based on the lowest level of any input that is deemed significant to the asset’s or liability’s fair value measurement. The input levels are not necessarily an indication of the risk or liquidity associated with investments at that level. For example, certain U.S. government securities are generally high quality and liquid, however, they are reflected as Level 2 because the inputs used to determine fair value may not always be quoted prices in an active market.
Fair value inputs are summarized in the three broad levels listed below:
| ■ | Level 1 — Valuations based on quoted prices for investments in active markets that the Fund has the ability to access at the measurement date. Valuation adjustments are not applied to Level 1 investments. |
| ■ | Level 2 — Valuations based on other significant observable inputs (including quoted prices for similar securities, interest rates, prepayment speeds, credit risks, etc.). |
| ■ | Level 3 — Valuations based on significant unobservable inputs (including the Fund’s own assumptions and judgment in determining the fair value of investments). |
Inputs that are used in determining fair value of an investment may include price information, credit data, volatility statistics, and other factors. These inputs can be either observable or unobservable. The availability of observable inputs can vary between investments, and is affected by various factors such as the type of investment, and the volume and level of activity for that investment or similar investments in the marketplace. The inputs will be considered by the Investment Manager, along with any other relevant factors in the calculation of an investment’s fair value. The Fund uses prices and inputs that are current as of the measurement date, which may include periods of market dislocations. During these periods, the availability of prices and inputs may be reduced for many investments. This condition could cause an investment to be reclassified between the various levels within the hierarchy.
Investments falling into the Level 3 category are primarily supported by quoted prices from brokers and dealers participating in the market for those investments. However, these may be classified as Level 3 investments due to lack of market transparency and corroboration to support these quoted prices. Additionally, valuation models may be used as the pricing source for any remaining investments classified as Level 3. These models may rely on one or more significant unobservable inputs and/or significant assumptions by the Investment Manager. Inputs used in valuations may include, but are not limited to, financial statement analysis, capital account balances, discount rates and estimated cash flows, and comparable company data.
Under the direction of the Fund’s Board of Trustees (the Board), the Investment Manager’s Valuation Committee (the Committee) is responsible for overseeing the valuation procedures approved by the Board. The Committee consists of voting and non-voting members from various groups within the Investment Manager’s organization, including operations and accounting, trading and investments, compliance, risk management and legal.
The Committee meets at least monthly to review and approve valuation matters, which may include a description of specific valuation determinations, data regarding pricing information received from approved pricing vendors and brokers and the results of Board-approved valuation control policies and procedures (the Policies). The Policies address, among other things, instances when market quotations are or are not readily available, including recommendations of third party pricing vendors and a determination of appropriate pricing methodologies; events that require specific valuation determinations and assessment of fair value techniques; securities with a potential for stale pricing, including those that are illiquid, restricted, or in default; and the effectiveness of third party pricing vendors, including periodic reviews of vendors. The Committee meets more frequently, as needed, to discuss
The accompanying Notes to Financial Statements are an integral part of this statement.
Columbia Balanced Fund | Annual Report 2019
| 29 |
Portfolio of Investments (continued)
August 31, 2019
Fair value measurements (continued)
additional valuation matters, which may include the need to review back-testing results, review time-sensitive information or approve related valuation actions. The Committee reports to the Board, with members of the Committee meeting with the Board at each of its regularly scheduled meetings to discuss valuation matters and actions during the period, similar to those described earlier.
The following table is a summary of the inputs used to value the Fund’s investments at August 31, 2019:
| | Level 1 ($) | Level 2 ($) | Level 3 ($) | Total ($) |
| Investments in Securities | | | | |
| Asset-Backed Securities — Non-Agency | — | 391,995,885 | 18,579,603 | 410,575,488 |
| Commercial Mortgage-Backed Securities - Agency | — | 13,623,058 | — | 13,623,058 |
| Commercial Mortgage-Backed Securities - Non-Agency | — | 191,290,966 | — | 191,290,966 |
| Common Stocks | | | | |
| Communication Services | 597,144,398 | — | — | 597,144,398 |
| Consumer Discretionary | 413,101,415 | — | — | 413,101,415 |
| Consumer Staples | 232,732,331 | — | — | 232,732,331 |
| Energy | 167,676,218 | — | — | 167,676,218 |
| Financials | 559,651,113 | — | — | 559,651,113 |
| Health Care | 545,432,059 | — | — | 545,432,059 |
| Industrials | 256,695,280 | — | — | 256,695,280 |
| Information Technology | 1,007,245,655 | — | — | 1,007,245,655 |
| Materials | 172,974,672 | — | — | 172,974,672 |
| Real Estate | 66,062,919 | — | — | 66,062,919 |
| Utilities | 42,325,047 | — | — | 42,325,047 |
| Total Common Stocks | 4,061,041,107 | — | — | 4,061,041,107 |
| Corporate Bonds & Notes | — | 615,510,421 | — | 615,510,421 |
| Exchange-Traded Funds | 64,046,438 | — | — | 64,046,438 |
| Foreign Government Obligations | — | 59,659 | — | 59,659 |
| Inflation-Indexed Bonds | — | 45,309,745 | — | 45,309,745 |
| Residential Mortgage-Backed Securities - Agency | — | 667,587,808 | — | 667,587,808 |
| Residential Mortgage-Backed Securities - Non-Agency | — | 563,528,550 | 45,398,811 | 608,927,361 |
| Senior Loans | — | 1,898,351 | — | 1,898,351 |
| U.S. Government & Agency Obligations | — | 22,520,436 | — | 22,520,436 |
| U.S. Treasury Obligations | 127,665,699 | — | — | 127,665,699 |
| Money Market Funds | 391,828,565 | — | — | 391,828,565 |
| Total Investments in Securities | 4,644,581,809 | 2,513,324,879 | 63,978,414 | 7,221,885,102 |
| Investments in Derivatives | | | | |
| Asset | | | | |
| Futures Contracts | 1,724,761 | — | — | 1,724,761 |
| Liability | | | | |
| Futures Contracts | (38,667) | — | — | (38,667) |
| Total | 4,646,267,903 | 2,513,324,879 | 63,978,414 | 7,223,571,196 |
See the Portfolio of Investments for all investment classifications not indicated in the table.
The Fund’s assets assigned to the Level 2 input category are generally valued using the market approach, in which a security’s value is determined through reference to prices and information from market transactions for similar or identical assets.
Derivative instruments are valued at unrealized appreciation (depreciation).
The Fund does not hold any significant investments (greater than one percent of net assets) categorized as Level 3.
The accompanying Notes to Financial Statements are an integral part of this statement.
| 30 | Columbia Balanced Fund | Annual Report 2019 |
Statement of Assets and Liabilities
August 31, 2019
| Assets | |
| Investments in securities, at value | |
| Unaffiliated issuers (cost $5,523,377,743) | $6,830,056,537 |
| Affiliated issuers (cost $391,844,087) | 391,828,565 |
| Cash collateral held at broker for: | |
| TBA | 76,000 |
| Receivable for: | |
| Investments sold | 20,726,170 |
| Investments sold on a delayed delivery basis | 143,251,595 |
| Capital shares sold | 6,806,986 |
| Dividends | 7,083,278 |
| Interest | 11,029,673 |
| Foreign tax reclaims | 64,454 |
| Variation margin for futures contracts | 370,000 |
| Prepaid expenses | 43,622 |
| Trustees’ deferred compensation plan | 216,140 |
| Other assets | 3,553 |
| Total assets | 7,411,556,573 |
| Liabilities | |
| Due to custodian | 88,281 |
| Payable for: | |
| Investments purchased | 217,653 |
| Investments purchased on a delayed delivery basis | 603,001,642 |
| Capital shares purchased | 6,274,068 |
| Management services fees | 107,800 |
| Distribution and/or service fees | 59,705 |
| Transfer agent fees | 639,022 |
| Compensation of chief compliance officer | 438 |
| Other expenses | 231,348 |
| Trustees’ deferred compensation plan | 216,140 |
| Total liabilities | 610,836,097 |
| Net assets applicable to outstanding capital stock | $6,800,720,476 |
| Represented by | |
| Paid in capital | 5,397,125,796 |
| Total distributable earnings (loss) (Note 2) | 1,403,594,680 |
| Total - representing net assets applicable to outstanding capital stock | $6,800,720,476 |
The accompanying Notes to Financial Statements are an integral part of this statement.
Columbia Balanced Fund | Annual Report 2019
| 31 |
Statement of Assets and Liabilities (continued)
August 31, 2019
| Class A | |
| Net assets | $2,685,000,887 |
| Shares outstanding | 63,566,149 |
| Net asset value per share | $42.24 |
| Maximum sales charge | 5.75% |
| Maximum offering price per share (calculated by dividing the net asset value per share by 1.0 minus the maximum sales charge for Class A shares) | $44.82 |
| Advisor Class | |
| Net assets | $248,877,137 |
| Shares outstanding | 5,844,525 |
| Net asset value per share | $42.58 |
| Class C | |
| Net assets | $1,443,467,825 |
| Shares outstanding | 34,299,005 |
| Net asset value per share | $42.08 |
| Institutional Class | |
| Net assets | $1,672,559,898 |
| Shares outstanding | 39,662,477 |
| Net asset value per share | $42.17 |
| Institutional 2 Class | |
| Net assets | $245,737,081 |
| Shares outstanding | 5,823,490 |
| Net asset value per share | $42.20 |
| Institutional 3 Class | |
| Net assets | $377,342,214 |
| Shares outstanding | 8,858,156 |
| Net asset value per share | $42.60 |
| Class R | |
| Net assets | $127,735,434 |
| Shares outstanding | 3,024,596 |
| Net asset value per share | $42.23 |
The accompanying Notes to Financial Statements are an integral part of this statement.
| 32 | Columbia Balanced Fund | Annual Report 2019 |
Statement of Operations
Year Ended August 31, 2019
| Net investment income | |
| Income: | |
| Dividends — unaffiliated issuers | $80,880,533 |
| Dividends — affiliated issuers | 10,193,006 |
| Interest | 78,496,854 |
| Interfund lending | 9,539 |
| Foreign taxes withheld | (313,114) |
| Total income | 169,266,818 |
| Expenses: | |
| Management services fees | 39,147,898 |
| Distribution and/or service fees | |
| Class A | 6,621,271 |
| Class C | 14,622,823 |
| Class R | 628,198 |
| Class T | 2 |
| Transfer agent fees | |
| Class A | 2,822,417 |
| Advisor Class | 258,872 |
| Class C | 1,558,612 |
| Institutional Class | 1,819,022 |
| Institutional 2 Class | 145,375 |
| Institutional 3 Class | 31,485 |
| Class R | 133,858 |
| Class T | 1 |
| Compensation of board members | 113,244 |
| Custodian fees | 80,936 |
| Printing and postage fees | 405,889 |
| Registration fees | 205,436 |
| Audit fees | 40,188 |
| Legal fees | 137,786 |
| Compensation of chief compliance officer | 2,667 |
| Other | 185,365 |
| Total expenses | 68,961,345 |
| Net investment income | 100,305,473 |
| Realized and unrealized gain (loss) — net | |
| Net realized gain (loss) on: | |
| Investments — unaffiliated issuers | 134,182,500 |
| Investments — affiliated issuers | (4,793) |
| Foreign currency translations | 4,658 |
| Futures contracts | 11,648,636 |
| Net realized gain | 145,831,001 |
| Net change in unrealized appreciation (depreciation) on: | |
| Investments — unaffiliated issuers | 38,205,640 |
| Investments — affiliated issuers | 8,746 |
| Futures contracts | 1,772,271 |
| Net change in unrealized appreciation (depreciation) | 39,986,657 |
| Net realized and unrealized gain | 185,817,658 |
| Net increase in net assets resulting from operations | $286,123,131 |
The accompanying Notes to Financial Statements are an integral part of this statement.
Columbia Balanced Fund | Annual Report 2019
| 33 |
Statement of Changes in Net Assets
| | Year Ended
August 31, 2019 | Year Ended
August 31, 2018 |
| Operations | | |
| Net investment income | $100,305,473 | $80,749,030 |
| Net realized gain | 145,831,001 | 249,229,059 |
| Net change in unrealized appreciation (depreciation) | 39,986,657 | 197,406,268 |
| Net increase in net assets resulting from operations | 286,123,131 | 527,384,357 |
| Distributions to shareholders | | |
| Net investment income and net realized gains | | |
| Class A | (137,845,970) | |
| Advisor Class | (12,950,747) | |
| Class C | (66,040,717) | |
| Institutional Class | (95,434,231) | |
| Institutional 2 Class | (14,171,696) | |
| Institutional 3 Class | (17,115,933) | |
| Class R | (6,263,886) | |
| Class T | (119) | |
| Net investment income | | |
| Class A | | (32,119,116) |
| Advisor Class | | (4,342,151) |
| Class C | | (5,858,667) |
| Institutional Class | | (24,669,492) |
| Institutional 2 Class | | (4,667,983) |
| Institutional 3 Class | | (3,826,408) |
| Class K | | (3,059) |
| Class R | | (1,185,792) |
| Class T | | (30) |
| Net realized gains | | |
| Class A | | (43,794,715) |
| Advisor Class | | (5,173,147) |
| Class C | | (23,969,628) |
| Institutional Class | | (27,034,308) |
| Institutional 2 Class | | (5,273,688) |
| Institutional 3 Class | | (4,144,929) |
| Class K | | (7,102) |
| Class R | | (2,079,860) |
| Class T | | (40) |
| Total distributions to shareholders (Note 2) | (349,823,299) | (188,150,115) |
| Decrease in net assets from capital stock activity | (381,811,889) | (217,869,957) |
| Total increase (decrease) in net assets | (445,512,057) | 121,364,285 |
| Net assets at beginning of year | 7,246,232,533 | 7,124,868,248 |
| Net assets at end of year | $6,800,720,476 | $7,246,232,533 |
| Undistributed net investment income | $25,117,803 | $21,489,491 |
The accompanying Notes to Financial Statements are an integral part of this statement.
| 34 | Columbia Balanced Fund | Annual Report 2019 |
Statement of Changes in Net Assets (continued)
| | Year Ended | Year Ended |
| | August 31, 2019 | August 31, 2018 |
| | Shares | Dollars ($) | Shares | Dollars ($) |
| Capital stock activity |
| Class A | | | | |
| Subscriptions | 7,883,597 | 320,045,212 | 11,907,451 | 491,495,200 |
| Distributions reinvested | 3,422,796 | 132,504,975 | 1,767,262 | 72,594,492 |
| Redemptions | (13,530,024) | (545,707,259) | (18,800,971) | (774,256,063) |
| Net decrease | (2,223,631) | (93,157,072) | (5,126,258) | (210,166,371) |
| Advisor Class | | | | |
| Subscriptions | 1,711,204 | 69,734,612 | 3,049,876 | 126,357,688 |
| Distributions reinvested | 331,181 | 12,946,495 | 227,462 | 9,410,310 |
| Redemptions | (2,325,652) | (94,705,855) | (4,931,823) | (203,348,145) |
| Net decrease | (283,267) | (12,024,748) | (1,654,485) | (67,580,147) |
| Class C | | | | |
| Subscriptions | 3,769,063 | 151,794,053 | 7,310,481 | 300,534,318 |
| Distributions reinvested | 1,627,100 | 62,423,760 | 687,910 | 28,197,620 |
| Redemptions | (8,646,978) | (348,114,583) | (8,466,088) | (348,287,316) |
| Net decrease | (3,250,815) | (133,896,770) | (467,697) | (19,555,378) |
| Institutional Class | | | | |
| Subscriptions | 8,832,929 | 355,464,542 | 12,547,575 | 516,259,609 |
| Distributions reinvested | 2,061,186 | 79,730,522 | 1,062,981 | 43,575,598 |
| Redemptions | (15,320,788) | (610,609,660) | (12,811,443) | (527,156,600) |
| Net increase (decrease) | (4,426,673) | (175,414,596) | 799,113 | 32,678,607 |
| Institutional 2 Class | | | | |
| Subscriptions | 2,128,294 | 85,394,773 | 4,231,266 | 174,312,801 |
| Distributions reinvested | 366,046 | 14,168,314 | 242,349 | 9,939,541 |
| Redemptions | (3,241,919) | (129,367,557) | (5,624,483) | (232,142,525) |
| Net decrease | (747,579) | (29,804,470) | (1,150,868) | (47,890,183) |
| Institutional 3 Class | | | | |
| Subscriptions | 3,173,084 | 129,959,562 | 4,090,596 | 168,904,814 |
| Distributions reinvested | 388,385 | 15,203,392 | 173,114 | 7,166,163 |
| Redemptions | (1,905,244) | (77,981,961) | (1,717,571) | (71,525,736) |
| Net increase | 1,656,225 | 67,180,993 | 2,546,139 | 104,545,241 |
| Class K | | | | |
| Subscriptions | — | — | 58 | 2,342 |
| Distributions reinvested | — | — | 246 | 10,079 |
| Redemptions | — | — | (11,877) | (496,307) |
| Net decrease | — | — | (11,573) | (483,886) |
| Class R | | | | |
| Subscriptions | 701,719 | 28,372,734 | 976,195 | 40,211,637 |
| Distributions reinvested | 134,674 | 5,204,240 | 56,558 | 2,324,052 |
| Redemptions | (950,703) | (38,269,762) | (1,259,000) | (51,953,529) |
| Net decrease | (114,310) | (4,692,788) | (226,247) | (9,417,840) |
| Class T | | | | |
| Redemptions | (64) | (2,438) | — | — |
| Net decrease | (64) | (2,438) | — | — |
| Total net decrease | (9,390,114) | (381,811,889) | (5,291,876) | (217,869,957) |
The accompanying Notes to Financial Statements are an integral part of this statement.
Columbia Balanced Fund | Annual Report 2019
| 35 |
The following table is intended to help you understand the Fund’s financial performance. Certain information reflects financial results for a single share of a class held for the periods shown. Per share net investment income (loss) amounts are calculated based on average shares outstanding during the period. Total return assumes reinvestment of all dividends and distributions, if any. Total return does not reflect payment of sales charges, if any. Total return and portfolio turnover are not annualized for periods of less than one year. The portfolio turnover rate is calculated without regard to purchase and sales transactions of short-term instruments and certain derivatives, if any. If such transactions were included, the Fund’s portfolio turnover rate may be higher.
| | Net asset value,
beginning of
period | Net
investment
income | Net
realized
and
unrealized
gain (loss) | Total from
investment
operations | Distributions
from net
investment
income | Distributions
from net
realized
gains | Total
distributions to
shareholders |
| Class A |
| Year Ended 8/31/2019 | $42.53 | 0.63 | 1.19 | 1.82 | (0.60) | (1.51) | (2.11) |
| Year Ended 8/31/2018 | $40.56 | 0.48 | 2.57 | 3.05 | (0.46) | (0.62) | (1.08) |
| Year Ended 8/31/2017 | $37.54 | 0.42 | 3.12 | 3.54 | (0.40) | (0.12) | (0.52) |
| Year Ended 8/31/2016 | $35.80 | 0.38 | 2.62 | 3.00 | (0.58) | (0.68) | (1.26) |
| Year Ended 8/31/2015 | $37.01 | 0.75(d) | (0.23) | 0.52 | (0.40) | (1.33) | (1.73) |
| Advisor Class |
| Year Ended 8/31/2019 | $42.86 | 0.73 | 1.21 | 1.94 | (0.71) | (1.51) | (2.22) |
| Year Ended 8/31/2018 | $40.87 | 0.58 | 2.59 | 3.17 | (0.56) | (0.62) | (1.18) |
| Year Ended 8/31/2017 | $37.82 | 0.53 | 3.14 | 3.67 | (0.50) | (0.12) | (0.62) |
| Year Ended 8/31/2016 | $36.06 | 0.48 | 2.63 | 3.11 | (0.67) | (0.68) | (1.35) |
| Year Ended 8/31/2015 | $37.27 | 0.88(d) | (0.27) | 0.61 | (0.49) | (1.33) | (1.82) |
| Class C |
| Year Ended 8/31/2019 | $42.38 | 0.32 | 1.19 | 1.51 | (0.30) | (1.51) | (1.81) |
| Year Ended 8/31/2018 | $40.42 | 0.17 | 2.56 | 2.73 | (0.15) | (0.62) | (0.77) |
| Year Ended 8/31/2017 | $37.42 | 0.14 | 3.10 | 3.24 | (0.12) | (0.12) | (0.24) |
| Year Ended 8/31/2016 | $35.68 | 0.11 | 2.62 | 2.73 | (0.31) | (0.68) | (0.99) |
| Year Ended 8/31/2015 | $36.92 | 0.56(d) | (0.32) | 0.24 | (0.15) | (1.33) | (1.48) |
| Institutional Class |
| Year Ended 8/31/2019 | $42.47 | 0.73 | 1.19 | 1.92 | (0.71) | (1.51) | (2.22) |
| Year Ended 8/31/2018 | $40.50 | 0.58 | 2.57 | 3.15 | (0.56) | (0.62) | (1.18) |
| Year Ended 8/31/2017 | $37.48 | 0.53 | 3.11 | 3.64 | (0.50) | (0.12) | (0.62) |
| Year Ended 8/31/2016 | $35.75 | 0.47 | 2.61 | 3.08 | (0.67) | (0.68) | (1.35) |
| Year Ended 8/31/2015 | $36.96 | 0.83(d) | (0.22) | 0.61 | (0.49) | (1.33) | (1.82) |
| Institutional 2 Class |
| Year Ended 8/31/2019 | $42.50 | 0.75 | 1.19 | 1.94 | (0.73) | (1.51) | (2.24) |
| Year Ended 8/31/2018 | $40.53 | 0.60 | 2.57 | 3.17 | (0.58) | (0.62) | (1.20) |
| Year Ended 8/31/2017 | $37.51 | 0.55 | 3.12 | 3.67 | (0.53) | (0.12) | (0.65) |
| Year Ended 8/31/2016 | $35.78 | 0.51 | 2.60 | 3.11 | (0.70) | (0.68) | (1.38) |
| Year Ended 8/31/2015 | $36.99 | 0.97(d) | (0.32) | 0.65 | (0.53) | (1.33) | (1.86) |
The accompanying Notes to Financial Statements are an integral part of this statement.
| 36 | Columbia Balanced Fund | Annual Report 2019 |
Financial Highlights (continued)
| | Net
asset
value,
end of
period | Total
return | Total gross
expense
ratio to
average
net assets(a) | Total net
expense
ratio to
average
net assets(a),(b) | Net investment
income
ratio to
average
net assets | Portfolio
turnover | Net
assets,
end of
period
(000’s) |
| Class A |
| Year Ended 8/31/2019 | $42.24 | 4.79% | 0.95% | 0.95% | 1.55% | 119% | $2,685,001 |
| Year Ended 8/31/2018 | $42.53 | 7.63% | 0.95% | 0.95%(c) | 1.16% | 76% | $2,798,246 |
| Year Ended 8/31/2017 | $40.56 | 9.54% | 0.97% | 0.97%(c) | 1.10% | 63% | $2,876,519 |
| Year Ended 8/31/2016 | $37.54 | 8.60% | 1.03% | 1.03%(c) | 1.06% | 60% | $2,960,832 |
| Year Ended 8/31/2015 | $35.80 | 1.38% | 1.06% | 1.06%(c) | 2.03% | 102% | $1,885,538 |
| Advisor Class |
| Year Ended 8/31/2019 | $42.58 | 5.04% | 0.70% | 0.70% | 1.80% | 119% | $248,877 |
| Year Ended 8/31/2018 | $42.86 | 7.89% | 0.70% | 0.70%(c) | 1.41% | 76% | $262,644 |
| Year Ended 8/31/2017 | $40.87 | 9.82% | 0.72% | 0.72%(c) | 1.37% | 63% | $318,026 |
| Year Ended 8/31/2016 | $37.82 | 8.86% | 0.78% | 0.78%(c) | 1.33% | 60% | $112,108 |
| Year Ended 8/31/2015 | $36.06 | 1.62% | 0.81% | 0.81%(c) | 2.37% | 102% | $38,489 |
| Class C |
| Year Ended 8/31/2019 | $42.08 | 4.00% | 1.70% | 1.70% | 0.80% | 119% | $1,443,468 |
| Year Ended 8/31/2018 | $42.38 | 6.83% | 1.70% | 1.70%(c) | 0.42% | 76% | $1,591,465 |
| Year Ended 8/31/2017 | $40.42 | 8.71% | 1.72% | 1.72%(c) | 0.35% | 63% | $1,536,796 |
| Year Ended 8/31/2016 | $37.42 | 7.80% | 1.78% | 1.78%(c) | 0.32% | 60% | $1,265,079 |
| Year Ended 8/31/2015 | $35.68 | 0.63% | 1.81% | 1.81%(c) | 1.52% | 102% | $612,243 |
| Institutional Class |
| Year Ended 8/31/2019 | $42.17 | 5.04% | 0.70% | 0.70% | 1.80% | 119% | $1,672,560 |
| Year Ended 8/31/2018 | $42.47 | 7.91% | 0.70% | 0.70%(c) | 1.42% | 76% | $1,872,366 |
| Year Ended 8/31/2017 | $40.50 | 9.83% | 0.72% | 0.72%(c) | 1.36% | 63% | $1,753,306 |
| Year Ended 8/31/2016 | $37.48 | 8.85% | 0.78% | 0.78%(c) | 1.32% | 60% | $867,554 |
| Year Ended 8/31/2015 | $35.75 | 1.64% | 0.81% | 0.81%(c) | 2.24% | 102% | $480,162 |
| Institutional 2 Class |
| Year Ended 8/31/2019 | $42.20 | 5.09% | 0.65% | 0.65% | 1.84% | 119% | $245,737 |
| Year Ended 8/31/2018 | $42.50 | 7.96% | 0.65% | 0.65% | 1.46% | 76% | $279,242 |
| Year Ended 8/31/2017 | $40.53 | 9.91% | 0.66% | 0.66% | 1.42% | 63% | $312,952 |
| Year Ended 8/31/2016 | $37.51 | 8.96% | 0.68% | 0.68% | 1.41% | 60% | $181,221 |
| Year Ended 8/31/2015 | $35.78 | 1.74% | 0.70% | 0.70% | 2.63% | 102% | $110,946 |
The accompanying Notes to Financial Statements are an integral part of this statement.
Columbia Balanced Fund | Annual Report 2019
| 37 |
Financial Highlights (continued)
| | Net asset value,
beginning of
period | Net
investment
income | Net
realized
and
unrealized
gain (loss) | Total from
investment
operations | Distributions
from net
investment
income | Distributions
from net
realized
gains | Total
distributions to
shareholders |
| Institutional 3 Class |
| Year Ended 8/31/2019 | $42.88 | 0.78 | 1.20 | 1.98 | (0.75) | (1.51) | (2.26) |
| Year Ended 8/31/2018 | $40.88 | 0.63 | 2.59 | 3.22 | (0.60) | (0.62) | (1.22) |
| Year Ended 8/31/2017 | $37.83 | 0.57 | 3.15 | 3.72 | (0.55) | (0.12) | (0.67) |
| Year Ended 8/31/2016 | $36.07 | 0.53 | 2.63 | 3.16 | (0.72) | (0.68) | (1.40) |
| Year Ended 8/31/2015 | $37.28 | 1.21(d) | (0.54) | 0.67 | (0.55) | (1.33) | (1.88) |
| Class R |
| Year Ended 8/31/2019 | $42.53 | 0.53 | 1.18 | 1.71 | (0.50) | (1.51) | (2.01) |
| Year Ended 8/31/2018 | $40.56 | 0.38 | 2.57 | 2.95 | (0.36) | (0.62) | (0.98) |
| Year Ended 8/31/2017 | $37.54 | 0.33 | 3.12 | 3.45 | (0.31) | (0.12) | (0.43) |
| Year Ended 8/31/2016 | $35.79 | 0.29 | 2.63 | 2.92 | (0.49) | (0.68) | (1.17) |
| Year Ended 8/31/2015 | $37.01 | 0.73(d) | (0.31) | 0.42 | (0.31) | (1.33) | (1.64) |
| Notes to Financial Highlights |
| (a) | In addition to the fees and expenses that the Fund bears directly, the Fund indirectly bears a pro rata share of the fees and expenses of any other funds in which it invests. Such indirect expenses are not included in the Fund’s reported expense ratios. |
| (b) | Total net expenses include the impact of certain fee waivers/expense reimbursements made by the Investment Manager and certain of its affiliates, if applicable. |
| (c) | The benefits derived from expense reductions had an impact of less than 0.01%. |
| (d) | Net investment income per share includes special dividends. The per share effect of these dividends amounted to: |
| Year Ended | Class A | Advisor
Class | Class C | Institutional
Class | Institutional 2
Class | Institutional 3
Class | Class R |
| 08/31/2015 | $0.48 | $0.51 | $0.56 | $0.47 | $0.57 | $0.78 | $0.55 |
The accompanying Notes to Financial Statements are an integral part of this statement.
| 38 | Columbia Balanced Fund | Annual Report 2019 |
Financial Highlights (continued)
| | Net
asset
value,
end of
period | Total
return | Total gross
expense
ratio to
average
net assets(a) | Total net
expense
ratio to
average
net assets(a),(b) | Net investment
income
ratio to
average
net assets | Portfolio
turnover | Net
assets,
end of
period
(000’s) |
| Institutional 3 Class |
| Year Ended 8/31/2019 | $42.60 | 5.14% | 0.61% | 0.61% | 1.90% | 119% | $377,342 |
| Year Ended 8/31/2018 | $42.88 | 8.01% | 0.60% | 0.60% | 1.53% | 76% | $308,783 |
| Year Ended 8/31/2017 | $40.88 | 9.96% | 0.61% | 0.61% | 1.47% | 63% | $190,322 |
| Year Ended 8/31/2016 | $37.83 | 9.02% | 0.63% | 0.63% | 1.47% | 60% | $118,553 |
| Year Ended 8/31/2015 | $36.07 | 1.78% | 0.66% | 0.66% | 3.27% | 102% | $65,758 |
| Class R |
| Year Ended 8/31/2019 | $42.23 | 4.50% | 1.20% | 1.20% | 1.30% | 119% | $127,735 |
| Year Ended 8/31/2018 | $42.53 | 7.36% | 1.20% | 1.20%(c) | 0.91% | 76% | $133,485 |
| Year Ended 8/31/2017 | $40.56 | 9.27% | 1.22% | 1.22%(c) | 0.86% | 63% | $136,478 |
| Year Ended 8/31/2016 | $37.54 | 8.35% | 1.28% | 1.28%(c) | 0.82% | 60% | $79,917 |
| Year Ended 8/31/2015 | $35.79 | 1.10% | 1.31% | 1.31%(c) | 1.97% | 102% | $37,089 |
The accompanying Notes to Financial Statements are an integral part of this statement.
Columbia Balanced Fund | Annual Report 2019
| 39 |
Notes to Financial Statements
August 31, 2019
Note 1. Organization
Columbia Balanced Fund (the Fund), a series of Columbia Funds Series Trust I (the Trust), is a diversified fund. The Trust is registered under the Investment Company Act of 1940, as amended (the 1940 Act), as an open-end management investment company organized as a Massachusetts business trust.
Fund shares
The Trust may issue an unlimited number of shares (without par value). The Fund offers each of the share classes listed in the Statement of Assets and Liabilities. Although all share classes generally have identical voting, dividend and liquidation rights, each share class votes separately when required by the Trust’s organizational documents or by law. Each share class has its own expense and sales charge structure. Different share classes may have different minimum initial investment amounts and pay different distribution amounts to the extent the expenses of distributing such share classes vary. Distributions to shareholders in a liquidation will be proportional to the net asset value of each share class.
As described in the Fund’s prospectus, Class A and Class C shares are offered to the general public for investment. Advisor Class, Institutional Class, Institutional 2 Class, Institutional 3 Class and Class R shares are available for purchase through authorized investment professionals to omnibus retirement plans or to institutional and to certain other investors as also described in the Fund’s prospectus. Class C shares automatically convert to Class A shares after 10 years. Effective December 14, 2018, Class T shares merged, in a tax-free transaction, into Class A shares of the Fund and are no longer offered for sale.
Note 2. Summary of significant accounting policies
Basis of preparation
The Fund is an investment company that applies the accounting and reporting guidance in the Financial Accounting Standards Board (FASB) Accounting Standards Codification Topic 946,Financial Services - Investment Companies (ASC 946). The financial statements are prepared in accordance with U.S. generally accepted accounting principles (GAAP), which requires management to make certain estimates and assumptions that affect the reported amounts of assets and liabilities, the disclosure of contingent assets and liabilities at the date of the financial statements and the reported amounts of income and expenses during the reporting period. Actual results could differ from those estimates.
The following is a summary of significant accounting policies followed by the Fund in the preparation of its financial statements.
Security valuation
All equity securities and exchange-traded funds are valued at the close of business of the New York Stock Exchange. Equity securities and exchange-traded funds are valued at the official closing price on the principal exchange or market on which they trade. Unlisted securities or listed securities for which there were no sales during the day are valued at the mean of the latest quoted bid and ask prices on such exchanges or markets.
Debt securities generally are valued by pricing services approved by the Board of Trustees based upon market transactions for normal, institutional-size trading units of similar securities. The services may use various pricing techniques that take into account, as applicable, factors such as yield, quality, coupon rate, maturity, type of issue, trading characteristics and other data, as well as approved independent broker-dealer quotes. Debt securities for which quotations are not readily available or not believed to be reflective of market value may also be valued based upon a bid quote from an approved independent broker-dealer. Debt securities maturing in 60 days or less are valued primarily at amortized cost value, unless this method results in a valuation that management believes does not approximate market value.
Asset- and mortgage-backed securities are generally valued by pricing services, which utilize pricing models that incorporate the securities’ cash flow and loan performance data. These models also take into account available market data, including trades, market quotations, and benchmark yield curves for identical or similar securities. Factors used to identify similar securities may include, but are not limited to, issuer, collateral type, vintage, prepayment speeds, collateral performance, credit ratings, credit enhancement and expected life. Asset-backed securities for which quotations are readily available may also be valued based upon an over-the-counter or exchange bid quote from an approved independent broker-dealer.
| 40 | Columbia Balanced Fund | Annual Report 2019 |
Notes to Financial Statements (continued)
August 31, 2019
Senior loan securities for which reliable market quotations are readily available are generally valued by pricing services at the average of the bids received.
Foreign equity securities are valued based on the closing price on the foreign exchange in which such securities are primarily traded. If any foreign equity security closing prices are not readily available, the securities are valued at the mean of the latest quoted bid and ask prices on such exchanges or markets. Foreign currency exchange rates are determined at the scheduled closing time of the New York Stock Exchange. Many securities markets and exchanges outside the U.S. close prior to the close of the New York Stock Exchange; therefore, the closing prices for securities in such markets or on such exchanges may not fully reflect events that occur after such close but before the close of the New York Stock Exchange. In those situations, foreign securities will be fair valued pursuant to a policy adopted by the Board of Trustees. Under the policy, the Fund may utilize a third party pricing service to determine these fair values. The third-party pricing service takes into account multiple factors, including, but not limited to, movements in the U.S. securities markets, certain depositary receipts, futures contracts and foreign exchange rates that have occurred subsequent to the close of the foreign exchange or market, to determine a good faith estimate that reasonably reflects the current market conditions as of the close of the New York Stock Exchange. The fair value of a security is likely to be different from the quoted or published price, if available.
Investments in open-end investment companies, including money market funds, are valued at their latest net asset value.
Futures and options on futures contracts are valued based upon the settlement price at the close of regular trading on their principal exchanges or, in the absence of transactions, at the mean of the latest quoted bid and ask prices.
Investments for which market quotations are not readily available, or that have quotations which management believes are not reflective of market value or reliable, are valued at fair value as determined in good faith under procedures approved by and under the general supervision of the Board of Trustees. If a security or class of securities (such as foreign securities) is valued at fair value, such value is likely to be different from the quoted or published price for the security.
The determination of fair value often requires significant judgment. To determine fair value, management may use assumptions including but not limited to future cash flows and estimated risk premiums. Multiple inputs from various sources may be used to determine fair value.
GAAP requires disclosure regarding the inputs and valuation techniques used to measure fair value and any changes in valuation inputs or techniques. In addition, investments shall be disclosed by major category. This information is disclosed following the Fund’s Portfolio of Investments.
Foreign currency transactions and translations
The values of all assets and liabilities denominated in foreign currencies are generally translated into U.S. dollars at exchange rates determined at the close of regular trading on the New York Stock Exchange. Net realized and unrealized gains (losses) on foreign currency transactions and translations include gains (losses) arising from the fluctuation in exchange rates between trade and settlement dates on securities transactions, gains (losses) arising from the disposition of foreign currency and currency gains (losses) between the accrual and payment dates on dividends, interest income and foreign withholding taxes.
For financial statement purposes, the Fund does not distinguish that portion of gains (losses) on investments which is due to changes in foreign exchange rates from that which is due to changes in market prices of the investments. Such fluctuations are included with the net realized and unrealized gains (losses) on investments in the Statement of Operations.
Derivative instruments
The Fund invests in certain derivative instruments, as detailed below, to meet its investment objectives. Derivatives are instruments whose values depend on, or are derived from, in whole or in part, the value of one or more securities, currencies, commodities, indices, or other assets or instruments. Derivatives may be used to increase investment flexibility (including to maintain cash reserves while maintaining desired exposure to certain assets), for risk management (hedging) purposes, to facilitate trading, to reduce transaction costs and to pursue higher investment returns. The Fund may also use derivative instruments to mitigate certain investment risks, such as foreign currency exchange rate risk, interest rate risk and credit risk. Derivatives may involve various risks, including the potential inability of the counterparty to fulfill its obligations
Columbia Balanced Fund | Annual Report 2019
| 41 |
Notes to Financial Statements (continued)
August 31, 2019
under the terms of the contract, the potential for an illiquid secondary market (making it difficult for the Fund to sell or terminate, including at favorable prices) and the potential for market movements which may expose the Fund to gains or losses in excess of the amount shown in the Statement of Assets and Liabilities. The notional amounts of derivative instruments, if applicable, are not recorded in the financial statements.
A derivative instrument may suffer a marked-to-market loss if the value of the contract decreases due to an unfavorable change in the market rates or values of the underlying instrument. Losses can also occur if the counterparty does not perform its obligations under the contract. The Fund’s risk of loss from counterparty credit risk on over-the-counter derivatives is generally limited to the aggregate unrealized gain netted against any collateral held by the Fund and the amount of any variation margin held by the counterparty, plus any replacement costs or related amounts. With exchange-traded or centrally cleared derivatives, there is reduced counterparty credit risk to the Fund since the clearinghouse or central counterparty (CCP) provides some protection in the case of clearing member default. The clearinghouse or CCP stands between the buyer and the seller of the contract; therefore, additional counterparty credit risk is failure of the clearinghouse or CCP. However, credit risk still exists in exchange-traded or centrally cleared derivatives with respect to initial and variation margin that is held in a broker’s customer account. While brokers are required to segregate customer margin from their own assets, in the event that a broker becomes insolvent or goes into bankruptcy and at that time there is a shortfall in the aggregate amount of margin held by the broker for all its clients, U.S. bankruptcy laws will typically allocate that shortfall on a pro-rata basis across all the broker’s customers (including the Fund), potentially resulting in losses to the Fund.
In order to better define its contractual rights and to secure rights that will help the Fund mitigate its counterparty risk, the Fund may enter into an International Swaps and Derivatives Association, Inc. Master Agreement (ISDA Master Agreement) or similar agreement with its derivatives contract counterparties. An ISDA Master Agreement is an agreement between the Fund and a counterparty that governs over-the-counter derivatives and typically contains, among other things, collateral posting terms and netting provisions in the event of a default and/or termination event. Under an ISDA Master Agreement, the Fund may, under certain circumstances, offset with the counterparty certain derivative instrument’s payables and/or receivables with collateral held and/or posted and create one single net payment. The provisions of the ISDA Master Agreement typically permit a single net payment in the event of default (close-out netting), including the bankruptcy or insolvency of the counterparty. Note, however, that bankruptcy or insolvency laws of a particular jurisdiction may impose restrictions on or prohibitions against the right of offset or netting in bankruptcy, insolvency or other events.
Collateral (margin) requirements differ by type of derivative. Margin requirements are established by the clearinghouse or CCP for exchange-traded and centrally cleared derivatives. Brokers can ask for margin in excess of the minimum in certain circumstances. Collateral terms are contract specific for over-the-counter derivatives. For over-the-counter derivatives traded under an ISDA Master Agreement, the collateral requirements are typically calculated by netting the marked-to-market amount for each transaction under such agreement and comparing that amount to the value of any variation margin currently pledged by the Fund and/or the counterparty. Generally, the amount of collateral due from or to a party has to exceed a minimum transfer amount threshold (e.g., $250,000) before a transfer has to be made. To the extent amounts due to the Fund from its counterparties are not fully collateralized, contractually or otherwise, the Fund bears the risk of loss from counterparty nonperformance. The Fund may also pay interest expense on cash collateral received from the broker. Any interest expense paid by the Fund is shown on the Statement of Operations. The Fund attempts to mitigate counterparty risk by only entering into agreements with counterparties that it believes have the financial resources to honor their obligations and by monitoring the financial stability of those counterparties.
Certain ISDA Master Agreements allow counterparties of over-the-counter derivatives transactions to terminate derivatives contracts prior to maturity in the event the Fund’s net asset value declines by a stated percentage over a specified time period or if the Fund fails to meet certain terms of the ISDA Master Agreement, which would cause the Fund to accelerate payment of any net liability owed to the counterparty. The Fund also has termination rights if the counterparty fails to meet certain terms of the ISDA Master Agreement. In determining whether to exercise such termination rights, the Fund would consider, in addition to counterparty credit risk, whether termination would result in a net liability owed from the counterparty.
For financial reporting purposes, the Fund does not offset derivative assets and derivative liabilities that are subject to netting arrangements in the Statement of Assets and Liabilities.
| 42 | Columbia Balanced Fund | Annual Report 2019 |
Notes to Financial Statements (continued)
August 31, 2019
Futures contracts
Futures contracts are exchange-traded and represent commitments for the future purchase or sale of an asset at a specified price on a specified date. The Fund bought and sold futures contracts to manage the duration and yield curve exposure of the Fund versus the benchmark and to manage exposure to movements in interest rates. These instruments may be used for other purposes in future periods. Upon entering into futures contracts, the Fund bears risks that it may not achieve the anticipated benefits of the futures contracts and may realize a loss. Additional risks include counterparty credit risk, the possibility of an illiquid market, and that a change in the value of the contract or option may not correlate with changes in the value of the underlying asset.
Upon entering into a futures contract, the Fund deposits cash or securities with the broker, known as a futures commission merchant (FCM), in an amount sufficient to meet the initial margin requirement. The initial margin deposit must be maintained at an established level over the life of the contract. Cash deposited as initial margin is recorded in the Statement of Assets and Liabilities as margin deposits. Securities deposited as initial margin are designated in the Portfolio of Investments. Subsequent payments (variation margin) are made or received by the Fund each day. The variation margin payments are equal to the daily change in the contract value and are recorded as variation margin receivable or payable and are offset in unrealized gains or losses. The Fund recognizes a realized gain or loss when the contract is closed or expires. Futures contracts involve, to varying degrees, risk of loss in excess of the variation margin disclosed in the Statement of Assets and Liabilities.
Effects of derivative transactions in the financial statements
The following tables are intended to provide additional information about the effect of derivatives on the financial statements of the Fund, including: the fair value of derivatives by risk category and the location of those fair values in the Statement of Assets and Liabilities; and the impact of derivative transactions over the period in the Statement of Operations, including realized and unrealized gains (losses). The derivative instrument schedules following the Portfolio of Investments present additional information regarding derivative instruments outstanding at the end of the period, if any.
The following table is a summary of the fair value of derivative instruments (not considered to be hedging instruments for accounting disclosure purposes) at August 31, 2019:
| | Asset derivatives | |
Risk exposure
category | Statement
of assets and liabilities
location | Fair value ($) |
| Interest rate risk | Component of total distributable earnings (loss) — unrealized appreciation on futures contracts | 1,724,761* |
| | Liability derivatives | |
Risk exposure
category | Statement
of assets and liabilities
location | Fair value ($) |
| Interest rate risk | Component of total distributable earnings (loss) — unrealized depreciation on futures contracts | 38,667* |
| * | Includes cumulative appreciation (depreciation) as reported in the tables following the Portfolio of Investments. Only the current day’s variation margin is reported in receivables or payables in the Statement of Assets and Liabilities. |
Columbia Balanced Fund | Annual Report 2019
| 43 |
Notes to Financial Statements (continued)
August 31, 2019
The following table indicates the effect of derivative instruments (not considered to be hedging instruments for accounting disclosure purposes) in the Statement of Operations for the year ended August 31, 2019:
| Amount of realized gain (loss) on derivatives recognized in income |
| Risk exposure category | Futures
contracts
($) |
| Interest rate risk | 11,648,636 |
| |
| Change in unrealized appreciation (depreciation) on derivatives recognized in income |
| Risk exposure category | Futures
contracts
($) |
| Interest rate risk | 1,772,271 |
The following table is a summary of the average outstanding volume by derivative instrument for the year ended August 31, 2019:
| Derivative instrument | Average notional
amounts ($)* |
| Futures contracts — long | 278,841,422 |
| * | Based on the ending quarterly outstanding amounts for the year ended August 31, 2019. |
Investments in senior loans
The Fund may invest in senior loan assignments. When the Fund purchases an assignment of a senior loan, the Fund typically has direct rights against the borrower; provided, however, that the Fund’s rights may be more limited than the lender from which it acquired the assignment and the Fund may be able to enforce its rights only through an administrative agent. Although certain senior loan assignments are secured by collateral, the Fund could experience delays or limitations in realizing such collateral or have its interest subordinated to other indebtedness of the obligor. In the event that the administrator or collateral agent of a loan becomes insolvent or enters into receivership or bankruptcy, the Fund may incur costs and delays in realizing payment or may suffer a loss of principal and/or interest. The risk of loss is greater for unsecured or subordinated loans. In addition, senior loan assignments are vulnerable to market, economic or other conditions or events that may reduce the demand for senior loan assignments and certain senior loan assignments which were liquid when purchased, may become illiquid.
The Fund may enter into senior loan assignments where all or a portion of the loan may be unfunded. The Fund is obligated to fund these commitments at the borrower’s discretion. These commitments, if any, are generally traded and priced in the same manner as other senior loan securities and are disclosed as unfunded senior loan commitments in the Fund’s Portfolio of Investments with a corresponding payable for investments purchased. The Fund designates cash or liquid securities to cover these commitments.
Asset- and mortgage-backed securities
The Fund may invest in asset-backed and mortgage-backed securities. The maturity dates shown represent the original maturity of the underlying obligation. Actual maturity may vary based upon prepayment activity on these obligations. All, or a portion, of the obligation may be prepaid at any time because the underlying asset may be prepaid. As a result, decreasing market interest rates could result in an increased level of prepayment. An increased prepayment rate will have the effect of shortening the maturity of the security. Unless otherwise noted, the coupon rates presented are fixed rates.
Delayed delivery securities
The Fund may trade securities on other than normal settlement terms, including securities purchased or sold on a “when-issued” or "forward commitment" basis. This may increase risk to the Fund since the other party to the transaction may fail to deliver, which could cause the Fund to subsequently invest at less advantageous prices. The Fund designates cash or liquid securities in an amount equal to the delayed delivery commitment.
| 44 | Columbia Balanced Fund | Annual Report 2019 |
Notes to Financial Statements (continued)
August 31, 2019
To be announced securities
The Fund may trade securities on a To Be Announced (TBA) basis. As with other delayed-delivery transactions, a seller agrees to issue a TBA security at a future date. However, the seller does not specify the particular securities to be delivered. Instead, the Fund agrees to accept any security that meets specified terms.
In some cases, Master Securities Forward Transaction Agreements (MSFTAs) may be used to govern transactions of certain forward-settling agency mortgage-backed securities, such as delayed-delivery and TBAs, between the Fund and counterparty. The MSFTA maintains provisions for, among other things, initiation and confirmation, payment and transfer, events of default, termination, and maintenance of collateral relating to such transactions.
Mortgage dollar roll transactions
The Fund may enter into mortgage “dollar rolls” in which the Fund sells securities for delivery in the current month and simultaneously contracts with the same counterparty to repurchase similar but not identical securities (same type, coupon and maturity) on a specified future date. During the roll period, the Fund loses the right to receive principal and interest paid on the securities sold. However, the Fund will benefit because it receives negotiated amounts in the form of reductions of the purchase price for the future purchase plus the interest earned on the cash proceeds of the securities sold until the settlement date of the forward purchase. The Fund records the incremental difference between the forward purchase and sale of each forward roll as a realized gain or loss. Unless any realized gains exceed the income, capital appreciation, and gain or loss due to mortgage prepayments that would have been realized on the securities sold as part of the mortgage dollar roll, the use of this technique will diminish the investment performance of the Fund compared to what the performance would have been without the use of mortgage dollar rolls. All cash proceeds will be invested in instruments that are permissible investments for the Fund. The Fund identifies cash or liquid securities in an amount equal to the forward purchase price.
For financial reporting and tax purposes, the Fund treats “to be announced” mortgage dollar rolls as two separate transactions, one involving the purchase of a security and a separate transaction involving a sale. These transactions may increase the Fund’s portfolio turnover rate. The Fund does not currently enter into mortgage dollar rolls that are accounted for as financing transactions.
Mortgage dollar rolls involve the risk that the market value of the securities the Fund is obligated to repurchase may decline below the repurchase price, or that the counterparty may default on its obligations.
Treasury inflation protected securities
The Fund may invest in treasury inflation protected securities (TIPS). The principal amount of TIPS is adjusted periodically and is increased for inflation or decreased for deflation based on a monthly published index. These adjustments are recorded as interest income in the Statement of Operations. Coupon payments are based on the adjusted principal at the time the interest is paid.
Security transactions
Security transactions are accounted for on the trade date. Cost is determined and gains (losses) are based upon the specific identification method for both financial statement and federal income tax purposes.
The trade date for senior loans purchased in the primary market is the date on which the loan is allocated. The trade date for senior loans purchased in the secondary market is the date on which the transaction is entered into.
Income recognition
Interest income is recorded on an accrual basis. Market premiums and discounts, including original issue discounts, are amortized and accreted, respectively, over the expected life of the security on all debt securities, unless otherwise noted. The Fund classifies gains and losses realized on prepayments received on mortgage-backed securities as adjustments to interest income.
Columbia Balanced Fund | Annual Report 2019
| 45 |
Notes to Financial Statements (continued)
August 31, 2019
The Fund may place a debt security on non-accrual status and reduce related interest income when it becomes probable that the interest will not be collected and the amount of uncollectible interest can be reasonably estimated. A defaulted debt security is removed from non-accrual status when the issuer resumes interest payments or when collectibility of interest is reasonably assured.
Corporate actions and dividend income are generally recorded net of any non-reclaimable tax withholdings, on the ex-dividend date or upon receipt of ex-dividend notification in the case of certain foreign securities.
The Fund may receive distributions from holdings in equity securities, business development companies (BDCs), exchange-traded funds (ETFs), limited partnerships (LPs), other regulated investment companies (RICs), and real estate investment trusts (REITs), which report information on the tax character of their distributions annually. These distributions are allocated to dividend income, capital gain and return of capital based on actual information reported. Return of capital is recorded as a reduction of the cost basis of securities held. If the Fund no longer owns the applicable securities, return of capital is recorded as a realized gain. With respect to REITs, to the extent actual information has not yet been reported, estimates for return of capital are made by the Fund’s management. Management’s estimates are subsequently adjusted when the actual character of the distributions is disclosed by the REITs, which could result in a proportionate change in return of capital to shareholders.
Awards from class action litigation are recorded as a reduction of cost basis if the Fund still owns the applicable securities on the payment date. If the Fund no longer owns the applicable securities, the proceeds are recorded as realized gains.
The value of additional securities received as an income payment through a payment in kind, if any, is recorded as interest income and increases the cost basis of such securities.
The Fund may receive other income from senior loans, including amendment fees, consent fees and commitment fees. These fees are recorded as income when received by the Fund. These amounts are included in Interest Income in the Statement of Operations.
Expenses
General expenses of the Trust are allocated to the Fund and other funds of the Trust based upon relative net assets or other expense allocation methodologies determined by the nature of the expense. Expenses directly attributable to the Fund are charged to the Fund. Expenses directly attributable to a specific class of shares are charged to that share class.
Determination of class net asset value
All income, expenses (other than class-specific expenses, which are charged to that share class, as shown in the Statement of Operations) and realized and unrealized gains (losses) are allocated to each class of the Fund on a daily basis, based on the relative net assets of each class, for purposes of determining the net asset value of each class.
Federal income tax status
The Fund intends to qualify each year as a regulated investment company under Subchapter M of the Internal Revenue Code, as amended, and will distribute substantially all of its investment company taxable income and net capital gain, if any, for its tax year, and as such will not be subject to federal income taxes. In addition, the Fund intends to distribute in each calendar year substantially all of its ordinary income, capital gain net income and certain other amounts, if any, such that the Fund should not be subject to federal excise tax. Therefore, no federal income or excise tax provision is recorded.
Foreign taxes
The Fund may be subject to foreign taxes on income, gains on investments or currency repatriation, a portion of which may be recoverable. The Fund will accrue such taxes and recoveries, as applicable, based upon its current interpretation of tax rules and regulations that exist in the markets in which it invests.
Realized gains in certain countries may be subject to foreign taxes at the Fund level, based on statutory rates. The Fund accrues for such foreign taxes on realized and unrealized gains at the appropriate rate for each jurisdiction, as applicable. The amount, if any, is disclosed as a liability on the Statement of Assets and Liabilities.
| 46 | Columbia Balanced Fund | Annual Report 2019 |
Notes to Financial Statements (continued)
August 31, 2019
Distributions to shareholders
Distributions from net investment income, if any, are declared and paid each calendar quarter. Net realized capital gains, if any, are distributed at least annually. Income distributions and capital gain distributions are determined in accordance with federal income tax regulations, which may differ from GAAP.
Guarantees and indemnifications
Under the Trust’s organizational documents and, in some cases, by contract, its officers and trustees are indemnified against certain liabilities arising out of the performance of their duties to the Trust or its funds. In addition, certain of the Fund’s contracts with its service providers contain general indemnification clauses. The Fund’s maximum exposure under these arrangements is unknown since the amount of any future claims that may be made against the Fund cannot be determined, and the Fund has no historical basis for predicting the likelihood of any such claims.
Recent accounting pronouncements
Accounting Standards Update 2017-08 Premium Amortization on Purchased Callable Debt Securities
In March 2017, the Financial Accounting Standards Board issued Accounting Standards Update (ASU) No. 2017-08 Premium Amortization on Purchased Callable Debt Securities. ASU No. 2017-08 updates the accounting standards to shorten the amortization period for certain purchased callable debt securities, held at a premium, to be amortized to the earliest call date. The update applies to securities with explicit, noncontingent call features that are callable at fixed prices and on preset dates. The standard is effective for annual periods beginning after December 15, 2018 and interim periods within those fiscal years. Management does not expect the implementation of this guidance to have a material impact on the financial statement amounts and footnote disclosures.
Accounting Standards Update 2018-13 Disclosure Framework - Changes to the Disclosure Requirements for Fair Value Measurement
In August 2018, the Financial Accounting Standards Board issued Accounting Standards Update (ASU) No. 2018-13 Disclosure Framework - Changes to the Disclosure Requirements for Fair Value Measurement. The standard is effective for annual periods beginning after December 15, 2019 and interim periods within those fiscal years, with early adoption permitted. After evaluation, management determined to adopt the ASU effective for the period ended August 31, 2019 and all subsequent periods. As a result of the amendments, management implemented disclosure changes which include removal of the amount and reasons for transfers between Level 1 and Level 2 of the fair value hierarchy, removal of the policy for the timing of transfers between levels, removal of the description of the Level 3 valuation processes, as well as modifications to the measurement uncertainty disclosure.
Disclosure Update and Simplification
In September 2018, the Securities and Exchange Commission (SEC) released Final Rule 33-10532, Disclosure Update and Simplification, which amends certain financial statement disclosure requirements that the SEC determined to be redundant, outdated, or superseded in light of other SEC disclosure requirements, GAAP, or changes in the information environment. As a result of the amendments, management implemented disclosure changes which included removing the components of distributable earnings presented on the Statement of Assets and Liabilities and combining income and gain distributions paid to shareholders as presented on the Statement of Changes in Net Assets. Any values presented to meet prior year requirements were left unchanged. The amendments had no effect on the Fund’s net assets or results of operation.
Note 3. Fees and other transactions with affiliates
Management services fees
The Fund has entered into a Management Agreement with Columbia Management Investment Advisers, LLC (the Investment Manager), a wholly-owned subsidiary of Ameriprise Financial, Inc. (Ameriprise Financial). Under the Management Agreement, the Investment Manager provides the Fund with investment research and advice, as well as administrative and accounting
Columbia Balanced Fund | Annual Report 2019
| 47 |
Notes to Financial Statements (continued)
August 31, 2019
services. The management services fee is an annual fee that is equal to a percentage of the Fund’s daily net assets that declines from 0.72% to 0.52% as the Fund’s net assets increase. The effective management services fee rate for the year ended August 31, 2019 was 0.58% of the Fund’s average daily net assets.
Compensation of board members
Members of the Board of Trustees who are not officers or employees of the Investment Manager or Ameriprise Financial are compensated for their services to the Fund as disclosed in the Statement of Operations. These members of the Board of Trustees may participate in a Deferred Compensation Plan (the Deferred Plan) which may be terminated at any time. Obligations of the Deferred Plan will be paid solely out of the Fund’s assets, and all amounts payable under the Deferred Plan constitute a general unsecured obligation of the Fund.
Compensation of Chief Compliance Officer
The Board of Trustees has appointed a Chief Compliance Officer to the Fund in accordance with federal securities regulations. As disclosed in the Statement of Operations, a portion of the Chief Compliance Officer’s total compensation is allocated to the Fund, along with other allocations to affiliated registered investment companies managed by the Investment Manager and its affiliates, based on relative net assets.
Transfer agency fees
Under a Transfer and Dividend Disbursing Agent Agreement, Columbia Management Investment Services Corp. (the Transfer Agent), an affiliate of the Investment Manager and a wholly-owned subsidiary of Ameriprise Financial, is responsible for providing transfer agency services to the Fund. The Transfer Agent has contracted with DST Asset Manager Solutions, Inc. (DST) to serve as sub-transfer agent. The Transfer Agent pays the fees of DST for services as sub-transfer agent and DST is not entitled to reimbursement for such fees from the Fund (with the exception of out-of-pocket fees).
The Fund pays the Transfer Agent a monthly transfer agency fee based on the number or the average value of accounts, depending on the type of account. In addition, the Fund pays the Transfer Agent a fee for shareholder services based on the number of accounts or on a percentage of the average aggregate value of the Fund’s shares maintained in omnibus accounts up to the lesser of the amount charged by the financial intermediary or a cap established by the Board of Trustees from time to time.
The Transfer Agent also receives compensation from the Fund for various shareholder services and reimbursements for certain out-of-pocket fees. Total transfer agency fees for Institutional 2 Class and Institutional 3 Class shares are subject to an annual limitation of not more than 0.07% and 0.02%, respectively, of the average daily net assets attributable to each share class.
For the year ended August 31, 2019, the Fund’s effective transfer agency fee rates as a percentage of average daily net assets of each class were as follows:
| | Effective rate (%) |
| Class A | 0.11 |
| Advisor Class | 0.11 |
| Class C | 0.11 |
| Institutional Class | 0.11 |
| Institutional 2 Class | 0.06 |
| Institutional 3 Class | 0.01 |
| Class R | 0.11 |
| Class T | 0.04(a) |
The Fund and certain other associated investment companies have severally, but not jointly, guaranteed the performance and observance of all the terms and conditions of a lease entered into by Seligman Data Corp. (SDC), the former transfer agent, including the payment of rent by SDC (the Guaranty). SDC was the legacy Seligman funds’ former transfer agent.
| 48 | Columbia Balanced Fund | Annual Report 2019 |
Notes to Financial Statements (continued)
August 31, 2019
The lease and the Guaranty expired on January 31, 2019. SDC is owned by six associated investment companies, including the Fund. The Fund’s ownership interest in SDC at August 31, 2019 is recorded as a part of other assets in the Statement of Assets and Liabilities at a cost of $3,553, which approximates the fair value of the ownership interest.
An annual minimum account balance fee of $20 may apply to certain accounts with a value below the applicable share class’s initial minimum investment requirements to reduce the impact of small accounts on transfer agency fees. These minimum account balance fees are remitted to the Fund and recorded as part of expense reductions in the Statement of Operations. For the year ended August 31, 2019, no minimum account balance fees were charged by the Fund.
Distribution and service fees
The Fund has entered into an agreement with Columbia Management Investment Distributors, Inc. (the Distributor), an affiliate of the Investment Manager and a wholly-owned subsidiary of Ameriprise Financial, for distribution and shareholder services. The Board of Trustees has approved, and the Fund has adopted, distribution and shareholder service plans (the Plans) applicable to certain share classes, which set the distribution and service fees for the Fund. These fees are calculated daily and are intended to compensate the Distributor and/or eligible selling and/or servicing agents for selling shares of the Fund and providing services to investors.
Under the Plans, the Fund pays a monthly service fee to the Distributor at the maximum annual rate of 0.25% of the average daily net assets attributable to Class A, Class C and Class T shares of the Fund. Also under the Plans, the Fund pays a monthly distribution fee to the Distributor at the maximum annual rates of 0.10%, 0.75%, 0.50% and 0.25% of the average daily net assets attributable to Class A, Class C, Class R and Class T shares of the Fund, respectively. As a result of all Class T shares of the Fund being redeemed or converted to Class A shares, December 14, 2018 was the last day the Fund paid a distribution and shareholder services fee for Class T shares.
Although the Fund may pay distribution and service fees up to a maximum annual rate of 0.35% of the Fund’s average daily net assets attributable to Class A shares (comprised of up to 0.10% for distribution services and up to 0.25% for shareholder liaison services), the Fund currently limits such fees to an aggregate fee of not more than 0.25% of the Fund’s average daily net assets attributable to Class A shares.
Although the Fund may have paid a distribution fee up to 0.25% of the Fund’s average daily net assets attributable to Class T shares and a service fee of up to 0.25% of the Fund’s average daily net assets attributable to Class T shares, the aggregate fee shall not exceed 0.25% of the Fund’s average daily net assets attributable to Class T shares.
Sales charges (unaudited)
Sales charges, including front-end charges and contingent deferred sales charges (CDSC), received by the Distributor for distributing Fund shares for the year ended August 31, 2019, if any, are listed below:
| | Front End (%) | CDSC (%) | Amount ($) |
| Class A | 5.75 | 0.50 - 1.00(a) | 4,148,596 |
| Class C | — | 1.00(b) | 121,840 |
| Class T | 2.50 | — | — |
| (a) | This charge is imposed on certain investments of between $1 million and $50 million redeemed within 18 months after purchase, as follows: 1.00% if redeemed within 12 months after purchase, and 0.50% if redeemed more than 12, but less than 18, months after purchase, with certain limited exceptions. |
| (b) | This charge applies to redemptions within 12 months after purchase, with certain limited exceptions. |
The Fund’s other share classes are not subject to sales charges.
Columbia Balanced Fund | Annual Report 2019
| 49 |
Notes to Financial Statements (continued)
August 31, 2019
Expenses waived/reimbursed by the Investment Manager and its affiliates
The Investment Manager and certain of its affiliates have contractually agreed to waive fees and/or reimburse expenses (excluding certain fees and expenses described below) for the period(s) disclosed below, unless sooner terminated at the sole discretion of the Board of Trustees, so that the Fund’s net operating expenses, after giving effect to fees waived/expenses reimbursed and any balance credits and/or overdraft charges from the Fund’s custodian, do not exceed the following annual rate(s) as a percentage of the class’ average daily net assets:
| | January 1, 2019
through
December 31, 2019 | Prior to
January 1, 2019 |
| Class A | 1.11% | 1.15% |
| Advisor Class | 0.86 | 0.90 |
| Class C | 1.86 | 1.90 |
| Institutional Class | 0.86 | 0.90 |
| Institutional 2 Class | 0.81 | 0.85 |
| Institutional 3 Class | 0.76 | 0.80 |
| Class R | 1.36 | 1.40 |
Under the agreement governing these fee waivers and/or expense reimbursement arrangements, the following fees and expenses are excluded from the waiver/reimbursement commitment, and therefore will be paid by the Fund, if applicable: taxes (including foreign transaction taxes), expenses associated with investments in affiliated and non-affiliated pooled investment vehicles (including mutual funds and exchange-traded funds), transaction costs and brokerage commissions, costs related to any securities lending program, dividend expenses associated with securities sold short, inverse floater program fees and expenses, transaction charges and interest on borrowed money, interest, infrequent and/or unusual expenses and any other expenses the exclusion of which is specifically approved by the Board of Trustees. This agreement may be modified or amended only with approval from the Investment Manager, certain of its affiliates and the Fund. Any fees waived and/or expenses reimbursed under the expense reimbursement arrangements described above are not recoverable by the Investment Manager or its affiliates in future periods.
Note 4. Federal tax information
The timing and character of income and capital gain distributions are determined in accordance with income tax regulations, which may differ from GAAP because of temporary or permanent book to tax differences.
At August 31, 2019, these differences were primarily due to differing treatment for deferral/reversal of wash sale losses, trustees’ deferred compensation, derivative investments, tax straddles, re-characterization of distributions for investments, principal and/or interest of fixed income securities, and foreign currency transactions. To the extent these differences were permanent, reclassifications were made among the components of the Fund’s net assets. Temporary differences do not require reclassifications.
The following reclassifications were made:
Undistributed net
investment
income ($) | Accumulated
net realized
gain ($) | Paid in
capital ($) |
| 158,257 | (158,257) | — |
Net investment income (loss) and net realized gains (losses), as disclosed in the Statement of Operations, and net assets were not affected by this reclassification.
| 50 | Columbia Balanced Fund | Annual Report 2019 |
Notes to Financial Statements (continued)
August 31, 2019
The tax character of distributions paid during the years indicated was as follows:
| Year Ended August 31, 2019 | Year Ended August 31, 2018 |
Ordinary
income ($) | Long-term
capital gains ($) | Total ($) | Ordinary
income ($) | Long-term
capital gains ($) | Total ($) |
| 96,835,419 | 252,987,880 | 349,823,299 | 76,672,698 | 111,477,417 | 188,150,115 |
Short-term capital gain distributions, if any, are considered ordinary income distributions for tax purposes.
At August 31, 2019, the components of distributable earnings on a tax basis were as follows:
Undistributed
ordinary income ($) | Undistributed
long-term
capital gains ($) | Capital loss
carryforwards ($) | Net unrealized
appreciation ($) |
| 25,338,883 | 100,001,123 | — | 1,278,470,814 |
At August 31, 2019, the cost of all investments for federal income tax purposes along with the aggregate gross unrealized appreciation and depreciation based on that cost was:
Federal
tax cost ($) | Gross unrealized
appreciation ($) | Gross unrealized
(depreciation) ($) | Net unrealized
appreciation ($) |
| 5,945,100,382 | 1,353,796,632 | (75,325,818) | 1,278,470,814 |
Tax cost of investments and unrealized appreciation/(depreciation) may also include timing differences that do not constitute adjustments to tax basis.
Management of the Fund has concluded that there are no significant uncertain tax positions in the Fund that would require recognition in the financial statements. However, management’s conclusion may be subject to review and adjustment at a later date based on factors including, but not limited to, new tax laws, regulations, and administrative interpretations (including relevant court decisions). Generally, the Fund’s federal tax returns for the prior three fiscal years remain subject to examination by the Internal Revenue Service.
Note 5. Portfolio information
The cost of purchases and proceeds from sales of securities, excluding short-term investments and derivatives, if any, aggregated to $7,945,995,838 and $8,223,231,025, respectively, for the year ended August 31, 2019, of which $4,297,504,494 and $4,347,104,079, respectively, were U.S. government securities. The amount of purchase and sale activity impacts the portfolio turnover rate reported in the Financial Highlights.
Note 6. Affiliated money market fund
The Fund invests in Columbia Short-Term Cash Fund, an affiliated money market fund established for the exclusive use by the Fund and other affiliated funds (the Affiliated MMF). The income earned by the Fund from such investments is included as Dividends - affiliated issuers in the Statement of Operations. As an investing fund, the Fund indirectly bears its proportionate share of the expenses of the Affiliated MMF. The Affiliated MMF prices its shares with a floating net asset value. In addition, the Board of Trustees of the Affiliated MMF may impose a fee on redemptions (sometimes referred to as a liquidity fee) or temporarily suspend redemptions (sometimes referred to as imposing a redemption gate) in the event its liquidity falls below regulatory limits.
Note 7. Interfund lending
Pursuant to an exemptive order granted by the Securities and Exchange Commission, the Fund participates in a program (the Interfund Program) allowing each participating Columbia Fund (each, a Participating Fund) to lend money directly to and, except for closed-end funds and money market funds, borrow money directly from other Participating Funds for temporary purposes. The amounts eligible for borrowing and lending under the Interfund Program are subject to certain restrictions.
Columbia Balanced Fund | Annual Report 2019
| 51 |
Notes to Financial Statements (continued)
August 31, 2019
Interfund loans are subject to the risk that the borrowing fund could be unable to repay the loan when due, and a delay in repayment to the lending fund could result in lost opportunities and/or additional lending costs. The exemptive order is subject to conditions intended to mitigate conflicts of interest arising from the Investment Manager’s relationship with each Participating Fund.
The Fund’s activity in the Interfund Program during the year ended August 31, 2019 was as follows:
| Borrower or lender | Average loan
balance ($) | Weighted average
interest rate (%) | Days
outstanding |
| Lender | 10,880,000 | 3.02 | 10 |
Interest income earned by the Fund is recorded as Interfund lending in the Statement of Operations. The Fund had no outstanding interfund loans at August 31, 2019.
Note 8. Line of credit
The Fund has access to a revolving credit facility with a syndicate of banks led by Citibank, N.A., HSBC Bank USA, N.A. and JPMorgan Chase Bank, N.A. whereby the Fund may borrow for the temporary funding of shareholder redemptions or for other temporary or emergency purposes. The credit facility, which is a collective agreement between the Fund and certain other funds managed by the Investment Manager or an affiliated investment manager, severally and not jointly, permits collective borrowings up to $1 billion. Interest is charged to each participating fund based on its borrowings at a rate equal to the higher of (i) the federal funds effective rate, (ii) the one-month LIBOR rate and (iii) the overnight bank funding rate, plus in each case, 1.00%. Each borrowing under the credit facility matures no later than 60 days after the date of borrowing. The Fund also pays a commitment fee equal to its pro rata share of the unused amount of the credit facility at a rate of 0.15% per annum. The commitment fee is included in other expenses in the Statement of Operations. This agreement expires annually in December unless extended or renewed.
The Fund had no borrowings during the year ended August 31, 2019.
Note 9. Significant risks
Credit risk
Credit risk is the risk that the value of debt securities in the Fund’s portfolio may decline because the issuer defaults or otherwise becomes unable or unwilling, or is perceived to be unable or unwilling, to honor its financial obligations, such as making payments to the Fund when due. Rating agencies assign credit ratings to certain debt instruments to indicate their credit risk. Lower rated or unrated debt instruments held by the Fund may present increased credit risk as compared to higher-rated debt instruments.
Interest rate risk
Interest rate risk is the risk of losses attributable to changes in interest rates. In general, if prevailing interest rates rise, the values of debt securities tend to fall, and if interest rates fall, the values of debt securities tend to rise. Actions by governments and central banking authorities can result in increases in interest rates. Increasing interest rates may negatively affect the value of debt securities held by the Fund, resulting in a negative impact on the Fund’s performance and net asset value per share. In general, the longer the maturity or duration of a debt security, the greater its sensitivity to changes in interest rates.
Liquidity risk
Liquidity risk is the risk associated with a lack of marketability of investments which may make it difficult to sell the investment at a desirable time or price. Changing regulatory, market or other conditions or environments (for example, the interest rate or credit environments) may adversely affect the liquidity of the Fund’s investments. The Fund may have to accept a lower selling price for the holding, sell other investments, or forego another, more appealing investment opportunity. Generally, the less liquid the market at the time the Fund sells a portfolio investment, the greater the risk of loss or decline of value to the Fund. A less liquid market can lead to an increase in Fund redemptions, which may negatively impact Fund performance and net asset value per share, including, for example, if the Fund is forced to sell securities in a down market.
| 52 | Columbia Balanced Fund | Annual Report 2019 |
Notes to Financial Statements (continued)
August 31, 2019
Shareholder concentration risk
At August 31, 2019, affiliated shareholders of record owned 38.8% of the outstanding shares of the Fund in one or more accounts. Subscription and redemption activity by concentrated accounts may have a significant effect on the operations of the Fund. In the case of a large redemption, the Fund may be forced to sell investments at inopportune times, including its liquid positions, which may result in Fund losses and the Fund holding a higher percentage of less liquid positions. Large redemptions could result in decreased economies of scale and increased operating expenses for non-redeeming Fund shareholders.
Note 10. Subsequent events
Management has evaluated the events and transactions that have occurred through the date the financial statements were issued and noted no items requiring adjustment of the financial statements or additional disclosure.
Note 11. Information regarding pending and settled legal proceedings
Ameriprise Financial and certain of its affiliates have historically been involved in a number of legal, arbitration and regulatory proceedings, including routine litigation, class actions, and governmental actions, concerning matters arising in connection with the conduct of their business activities. Ameriprise Financial believes that the Fund is not currently the subject of, and that neither Ameriprise Financial nor any of its affiliates are the subject of, any pending legal, arbitration or regulatory proceedings that are likely to have a material adverse effect on the Fund or the ability of Ameriprise Financial or its affiliates to perform under their contracts with the Fund. Ameriprise Financial is required to make quarterly (10-Q), annual (10-K) and, as necessary, 8-K filings with the Securities and Exchange Commission (SEC) on legal and regulatory matters that relate to Ameriprise Financial and its affiliates. Copies of these filings may be obtained by accessing the SEC website at www.sec.gov.
There can be no assurance that these matters, or the adverse publicity associated with them, will not result in increased Fund redemptions, reduced sale of Fund shares or other adverse consequences to the Fund. Further, although we believe proceedings are not likely to have a material adverse effect on the Fund or the ability of Ameriprise Financial or its affiliates to perform under their contracts with the Fund, these proceedings are subject to uncertainties and, as such, we are unable to estimate the possible loss or range of loss that may result. An adverse outcome in one or more of these proceedings could result in adverse judgments, settlements, fines, penalties or other relief that could have a material adverse effect on the consolidated financial condition or results of operations of Ameriprise Financial.
Columbia Balanced Fund | Annual Report 2019
| 53 |
Report of Independent Registered Public Accounting Firm
To the Board of Trustees of Columbia Funds Series Trust I and Shareholders of Columbia Balanced Fund
Opinion on the Financial Statements
We have audited the accompanying statement of assets and liabilities, including the portfolio of investments, of Columbia Balanced Fund (one of the funds constituting Columbia Funds Series Trust I, hereafter referred to as the “Fund”) as of August 31, 2019, the related statement of operations for the year ended August 31, 2019, the statement of changes in net assets for each of the two years in the period ended August 31, 2019, including the related notes, and the financial highlights for each of the five years in the period ended August 31, 2019 (collectively referred to as the “financial statements”). In our opinion, the financial statements present fairly, in all material respects, the financial position of the Fund as of August 31, 2019, the results of its operations for the year then ended, the changes in its net assets for each of the two years in the period ended August 31, 2019 and the financial highlights for each of the five years in the period ended August 31, 2019 in conformity with accounting principles generally accepted in the United States of America.
Basis for Opinion
These financial statements are the responsibility of the Fund’s management. Our responsibility is to express an opinion on the Fund’s financial statements based on our audits. We are a public accounting firm registered with the Public Company Accounting Oversight Board (United States) (PCAOB) and are required to be independent with respect to the Fund in accordance with the U.S. federal securities laws and the applicable rules and regulations of the Securities and Exchange Commission and the PCAOB.
We conducted our audits of these financial statements in accordance with the standards of the PCAOB. Those standards require that we plan and perform the audit to obtain reasonable assurance about whether the financial statements are free of material misstatement, whether due to error or fraud.
Our audits included performing procedures to assess the risks of material misstatement of the financial statements, whether due to error or fraud, and performing procedures that respond to those risks. Such procedures included examining, on a test basis, evidence regarding the amounts and disclosures in the financial statements. Our audits also included evaluating the accounting principles used and significant estimates made by management, as well as evaluating the overall presentation of the financial statements. Our procedures included confirmation of securities owned as of August 31, 2019, by correspondence with the custodian, transfer agent, agent banks, and brokers; when replies were not received from brokers, we performed other audit procedures. We believe that our audits provide a reasonable basis for our opinion.
/s/PricewaterhouseCoopers LLP
Minneapolis, Minnesota
October 24, 2019
We have served as the auditor of one or more investment companies within the Columbia Funds Complex since 1977.
| 54 | Columbia Balanced Fund | Annual Report 2019 |
Federal Income Tax Information
(Unaudited)
The Fund hereby designates the following tax attributes for the fiscal year ended August 31, 2019. Shareholders will be notified in early 2020 of the amounts for use in preparing 2019 income tax returns.
Qualified
dividend
income | Dividends
received
deduction | Capital
gain
dividend |
| 78.88% | 73.31% | $146,190,287 |
Qualified dividend income. For taxable, non-corporate shareholders, the percentage of ordinary income distributed during the fiscal year that represents qualified dividend income subject to reduced tax rates.
Dividends received deduction. The percentage of ordinary income distributed during the fiscal year that qualifies for the corporate dividends received deduction.
Capital gain dividend. The Fund designates as a capital gain dividend the amount reflected above, or if subsequently determined to be different, the net capital gain of such fiscal period.
TRUSTEES AND OFFICERS
The Board oversees the Fund’s operations and appoints officers who are responsible for day-to-day business decisions based on policies set by the Board. The following table provides basic biographical information about the Fund’s Trustees as of the printing of this report, including their principal occupations during the past five years, although specific titles for individuals may have varied over the period. The year set forth beneath Length of Service in the table below is the year in which the Trustee was first appointed or elected as Trustee to any Fund currently in the Columbia Funds Complex or a predecessor thereof. Under current Board policy, members serve terms of indefinite duration.
Independent trustees
| Name, address, year of birth | Position held with the Trust and length of service | Principal occupation(s) during the past five years and other relevant professional experience | Number of Funds in the Columbia Fund Complex overseen | Other directorships held by Trustee during the past five years |
Janet Langford Carrig
c/o Columbia Management
Investment Advisers, LLC
225 Franklin Street
Mail Drop BX32 05228
Boston, MA 02110
1957 | Trustee
1996 | Senior Vice President, General Counsel and Corporate Secretary, ConocoPhillips (independent energy company), September 2007-October 2018 | 70 | None |
Douglas A. Hacker
c/o Columbia Management
Investment Advisers, LLC
225 Franklin Street
Mail Drop BX32 05228
Boston, MA 02110
1955 | Trustee and Chairman of the Board
1996 | Independent business executive since May 2006; Executive Vice President — Strategy of United Airlines, December 2002-May 2006; President of UAL Loyalty Services (airline marketing company), September 2001-December 2002; Executive Vice President and Chief Financial Officer of United Airlines, July 1999-September 2001 | 70 | Spartan Nash Company, (food distributor); former Director, Nash Finch Company (food distributor), 2005-2013; Aircastle Limited (aircraft leasing); former Director, SeaCube Container Leasing Ltd. (container leasing), 2010-2013; and Travelport Worldwide Limited (travel information technology) |
Columbia Balanced Fund | Annual Report 2019
| 55 |
TRUSTEES AND OFFICERS (continued)
Independent trustees (continued)
| Name, address, year of birth | Position held with the Trust and length of service | Principal occupation(s) during the past five years and other relevant professional experience | Number of Funds in the Columbia Fund Complex overseen | Other directorships held by Trustee during the past five years |
Nancy T. Lukitsh
c/o Columbia Management
Investment Advisers, LLC
225 Franklin Street
Mail Drop BX32 05228
Boston, MA 02110
1956 | Trustee
2011 | Senior Vice President, Partner and Director of Marketing, Wellington Management Company, LLP (investment adviser), 1997-2010; Chair, Wellington Management Portfolios (commingled non-U.S. investment pools), 2007-2010; Director, Wellington Trust Company, NA and other Wellington affiliates, 1997-2010 | 70 | None |
David M. Moffett
c/o Columbia Management
Investment Advisers, LLC
225 Franklin Street
Mail Drop BX32 05228
Boston, MA 02110
1952 | Trustee
2011 | Retired. Consultant to Bridgewater and Associates | 70 | Director, CSX Corporation (transportation suppliers); Genworth Financial, Inc. (financial and insurance products and services); PayPal Holdings Inc. (payment and data processing services); Trustee, University of Oklahoma Foundation; former Director, eBay Inc. (online trading community), 2007-2015; and former Director, CIT Bank, CIT Group Inc. (commercial and consumer finance), 2010-2016 |
John J. Neuhauser
c/o Columbia Management
Investment Advisers, LLC
225 Franklin Street
Mail Drop BX32 05228
Boston, MA 02110
1943 | Trustee
1984 | President, Saint Michael’s College, August 2007-June 2018; Director or Trustee of several non-profit organizations, including University of Vermont Medical Center; Academic Vice President and Dean of Faculties, Boston College, August 1999-October 2005; University Professor, Boston College, November 2005-August 2007 | 70 | Liberty All-Star Equity Fund and Liberty All- Star Growth Fund (closed-end funds) |
Patrick J. Simpson
c/o Columbia Management
Investment Advisers, LLC
225 Franklin Street
Mail Drop BX32 05228
Boston, MA 02110
1944 | Trustee
2000 | Of Counsel, Perkins Coie LLP (law firm) since 2015; Partner, Perkins Coie LLP, 1988-2014 | 70 | Former Director, M Fund, Inc. (M Funds mutual fund family), July 2018-July 2019 |
Anne-Lee Verville
c/o Columbia Management
Investment Advisers, LLC
225 Franklin Street
Mail Drop BX32 05228
Boston, MA 02110
1945 | Trustee
1998 | Retired. General Manager, Global Education Industry, 1994-1997, President – Application Systems Division, 1991-1994, Chief Financial Officer – US Marketing & Services, 1988-1991, and Chief Information Officer, 1987-1988, IBM Corporation (computer and technology) | 70 | Former Director, Enesco Group, Inc. (producer of giftware and home and garden decor products), 2001-2006 |
| 56 | Columbia Balanced Fund | Annual Report 2019 |
TRUSTEES AND OFFICERS (continued)
Consultants to the Independent Trustees*
| Name, address, year of birth | Position held with the Trust and length of service | Principal occupation(s) during the past five years and other relevant professional experience | Number of Funds in the Columbia Funds complex overseen | Other directorships held by Trustee during the past five years |
J. Kevin Connaughton
c/o Columbia
Management Investment
Advisers, LLC,
225 Franklin Street
Mail Drop BX32 05228,
Boston, MA 02110
1964 | Independent Trustee Consultant
2016 | Independent Trustee Consultant, Columbia Funds since March 2016; Adjunct Professor of Finance, Bentley University since November 2017; Managing Director and General Manager of Mutual Fund Products, Columbia Management Investment Advisers, LLC, May 2010-February 2015; President, Columbia Funds, 2009-2015; and senior officer of Columbia Funds and affiliated funds, 2003-2015 | 70 | Director, The Autism Project since March 2015; former Trustee, New Century Portfolios, March 2015-December 2017; formerly on Board of Governors, Gateway Healthcare, January 2016 – December 2017 |
Olive Darragh
c/o Columbia
Management Investment
Advisers, LLC,
225 Franklin Street,
Mail Drop BX32 05228,
Boston, MA 02110
1962 | Independent Trustee Consultant 2019 | Independent Trustee Consultant, Columbia Funds since June 2019; Managing Director of Darragh Inc. (a strategy and talent management consulting firm) since 2010; Founder and CEO, Zolio (an investment management talent identification platform) since 2004; Partner, Tudor Investments, 2004-2010; Senior Partner, McKinsey & Company, 2001-2004 | 70 | Director, University of Edinburgh Business School; former Director, Boston Public Library Foundation |
Natalie A. Trunow
c/o Columbia
Management Investment
Advisers, LLC,
225 Franklin Street
Mail Drop BX32 05228,
Boston, MA 02110
1967 | Independent Trustee Consultant
2016 | Independent Trustee Consultant, Columbia Funds since September 2016; Chief Executive Officer, Millennial Portfolio Solutions LLC (asset management and consulting services) since January 2016; Director of Investments, Casey Family Programs, April 2016-September 2016; Senior Vice President and Chief Investment Officer, Calvert Investments, August 2008-January 2016; Section Head and Portfolio Manager, General Motors Asset Management, June 1997-August 2008 | 70 | Director, Health Services for Children with Special Needs, Inc.; Director, Consumer Credit Counseling Services (formerly Guidewell Financial Solutions) |
| * | J. Kevin Connaughton was appointed consultant to the Independent Trustees effective March 1, 2016. Olive Darragh was appointed consultant to the Independent Trustees effective June 10, 2019. Natalie A. Trunow was appointed consultant to the Independent Trustees effective September 1, 2016. Shareholders of the Funds are expected to be asked to elect each of Mr. Connaughton, Ms. Darragh and Ms. Trunow as a Trustee at a future shareholder meeting. |
Interested trustee affiliated with Investment Manager*
| Name, address, year of birth | Position held with the Trust and length of service | Principal occupation(s) during the past five years and other relevant professional experience | Number of Funds in the Columbia Funds Complex overseen | Other directorships held by Trustee during the past five years |
William F. Truscott
c/o Columbia Management
Investment Advisers, LLC
225 Franklin Street
Boston, MA 02110
1960 | Trustee
2012 | Chairman of the Board and President, Columbia Management Investment Advisers, LLC since May 2010 and February 2012, respectively; Chief Executive Officer, Global Asset Management, Ameriprise Financial, Inc. since September 2012 (previously Chief Executive Officer, U.S. Asset Management & President, Annuities, May 2010-September 2012); Director and Chief Executive Officer, Columbia Management Investment Distributors, Inc. since May 2010 and February 2012, respectively; Chairman of the Board and Chief Executive Officer, RiverSource Distributors, Inc. since 2006; Director, Threadneedle Asset Management Holdings, SARL since 2014; President and Chief Executive Officer, Ameriprise Certificate Company, 2006-August 2012 | 192 | Chairman of the Board, Columbia Management Investment Advisers, LLC since May 2010; Director, Columbia Management Investment Distributors, Inc. since May 2010; former Director, Ameriprise Certificate Company, August 2006 - January 2013 |
Columbia Balanced Fund | Annual Report 2019
| 57 |
TRUSTEES AND OFFICERS (continued)
| * | Interested person (as defined under the 1940 Act) by reason of being an officer, director, security holder and/or employee of the Investment Manager or Ameriprise Financial. |
The Statement of Additional Information has additional information about the Fund’s Board members and is available, without charge, upon request by calling 800.345.6611, visiting columbiathreadneedleus.com/investor/ or contacting your financial intermediary.
The Board has appointed officers who are responsible for day-to-day business decisions based on policies it has established. The officers serve at the pleasure of the Board. The following table provides basic information about the Officers of the Fund as of the printing of this report, including principal occupations during the past five years, although their specific titles may have varied over the period. In addition to Mr. Truscott, who is Senior Vice President, the Fund’s other officers are:
Fund officers
Name,
address and
year of birth | Position and year
first appointed to
position for any Fund
in the Columbia
Funds complex or a
predecessor thereof | Principal occupation(s) during past five years |
Christopher O. Petersen
5228 Ameriprise
Financial Center
Minneapolis, MN 55474
Born 1970 | President and Principal Executive Officer (2015) | Vice President and Lead Chief Counsel, Ameriprise Financial, Inc. since January 2015 (previously Vice President and Chief Counsel, January 2010 - December 2014; officer of Columbia Funds and affiliated funds since 2007. |
Michael G. Clarke
225 Franklin Street
Boston, MA 02110
Born 1969 | Chief Financial Officer (Principal Financial Officer) (2009) and Senior Vice President (2019) | Vice President, Head of North American Operations, and Co-Head of Global Operations, Columbia Management Investment Advisers, LLC, since June 2019 (previously Vice President – Accounting and Tax, May 2010 - May 2019); senior officer of Columbia Funds and affiliated funds since 2002 (previously Treasurer and Chief Accounting Officer, January 2009 - January 2019 and December 2015 - January 2019, respectively). |
Joseph Beranek
5890 Ameriprise
Financial Center
Minneapolis, MN 55474
Born 1965 | Treasurer and Chief Accounting Officer (Principal Accounting Officer) (2019) | Vice President — Mutual Fund Accounting and Financial Reporting, Columbia Management Investment Advisers, LLC, since December 2018 and March 2017, respectively (previously Vice President — Pricing and Corporate Actions, May 2010 - March 2017). |
Paul B. Goucher
485 Lexington Avenue
New York, NY 10017
Born 1968 | Senior Vice President (2011) and Assistant Secretary (2008) | Senior Vice President and Assistant General Counsel, Ameriprise Financial, Inc. since January 2017 (previously Vice President and Lead Chief Counsel, November 2008 - January 2017 and January 2013 - January 2017, respectively); Vice President, Chief Legal Officer and Assistant Secretary, Columbia Management Investment Advisers, LLC since March 2015 (previously Vice President and Assistant Secretary, May 2010 – March 2015). |
Thomas P. McGuire
225 Franklin Street
Boston, MA 02110
Born 1972 | Senior Vice President and Chief Compliance Officer (2012) | Vice President — Asset Management Compliance, Ameriprise Financial, Inc., since May 2010; Chief Compliance Officer, Ameriprise Certificate Company since September 2010. |
Colin Moore
225 Franklin Street
Boston, MA 02110
Born 1958 | Senior Vice President (2010) | Executive Vice President and Global Chief Investment Officer, Ameriprise Financial, Inc., since July 2013; Executive Vice President and Global Chief Investment Officer, Columbia Management Investment Advisers, LLC since July 2013. |
Ryan C. Larrenaga
225 Franklin Street
Boston, MA 02110
Born 1970 | Senior Vice President (2017), Chief Legal Officer (2017), and Secretary (2015) | Vice President and Chief Counsel, Ameriprise Financial, Inc. since August 2018 (previously Vice President and Group Counsel, August 2011 - August 2018); officer of Columbia Funds and affiliated funds since 2005. |
Michael E. DeFao
225 Franklin Street
Boston, MA 02110
Born 1968 | Vice President (2011) and Assistant Secretary (2010) | Vice President and Chief Counsel, Ameriprise Financial, Inc. since May 2010. |
| 58 | Columbia Balanced Fund | Annual Report 2019 |
TRUSTEES AND OFFICERS (continued)
Fund officers (continued)
Name,
address and
year of birth | Position and year
first appointed to
position for any Fund
in the Columbia
Funds complex or a
predecessor thereof | Principal occupation(s) during past five years |
Lyn Kephart-Strong
5228 Ameriprise
Financial Center
Minneapolis, MN 55474
Born 1960 | Vice President (2015) | President, Columbia Management Investment Services Corp. since October 2014; Vice President & Resolution Officer, Ameriprise Trust Company since August 2009. |
Board Consideration and Approval of Management
Agreement
On June 12, 2019, the Board of Trustees (the Board) and the Trustees who are not interested persons (as defined in the Investment Company Act of 1940) (the Independent Trustees) of Columbia Funds Series Trust I (the Trust) unanimously approved the continuation of the Management Agreement (the Management Agreement) with Columbia Management Investment Advisers, LLC (the Investment Manager) with respect to Columbia Balanced Fund (the Fund), a series of the Trust. As detailed below, the Board’s Advisory Fees and Expenses Committee (the Committee) and the Board met on multiple occasions to review and discuss, among themselves, with the management team of the Investment Manager and with an independent fee consultant, materials provided by the Investment Manager, the independent fee consultant and others before determining to approve the continuation of the Management Agreement.
In connection with their deliberations regarding the continuation of the Management Agreement, the Committee and the Board evaluated materials requested from the Investment Manager regarding the Fund and the Management Agreement, and discussed these materials with representatives of the Investment Manager at Committee meetings held on March 5, 2019, April 25, 2019 and June 11, 2019 and at Board meetings held on March 6, 2019 and June 12, 2019. In addition, the Board and its various committees consider matters bearing on the Management Agreement at other meetings throughout the year and in prior years and meet regularly with senior management of the Trust and the Investment Manager. Through the Board’s Investment Oversight Committees, Trustees also meet with selected portfolio managers of the funds the Trustees oversee and with other investment personnel at various times throughout the year. The Committee and the Board also consulted with the independent fee consultant, Fund counsel and the Independent Trustees’ independent legal counsel, who advised on various matters with respect to the Committee’s and the Board’s considerations and otherwise assisted the Committee and the Board in their deliberations. On June 11, 2019, the Committee recommended that the Board approve the continuation of the Management Agreement. On June 12, 2019, the Board, including the Independent Trustees, voting separately, unanimously approved the continuation of the Management Agreement for the Fund.
The Committee and the Board considered all information that they, their legal counsel or the Investment Manager believed reasonably necessary to evaluate and to determine whether to recommend for approval or approve the continuation of the Management Agreement. The information and factors considered by the Committee and the Board in recommending for approval or approving the continuation of the Management Agreement for the Fund included the following:
| • | Information on the investment performance of the Fund relative to the performance of a group of mutual funds determined to be comparable to the Fund by an independent third-party data provider, as well as performance relative to benchmarks; |
| • | Information on the Fund’s management fees and total expenses, including information comparing the Fund’s expenses to those of a group of comparable mutual funds, as determined by the independent third-party data provider; |
Columbia Balanced Fund | Annual Report 2019
| 59 |
Board Consideration and Approval of Management
Agreement (continued)
| • | The Investment Manager’s agreement to contractually limit or cap total operating expenses for the Fund through December 31, 2020 so that total operating expenses (excluding certain fees and expenses, such as transaction costs and certain other investment related expenses, interest, taxes, acquired fund fees and expenses, and infrequent and/or unusual expenses) would not exceed a specified annual rate, as a percentage of the Fund’s net assets; |
| • | The terms and conditions of the Management Agreement; |
| • | The current and proposed terms and conditions of other agreements and arrangements with affiliates of the Investment Manager relating to the operations of the Fund, including agreements with respect to the provision of distribution, transfer agency and shareholder services to the Fund; |
| • | Descriptions of various functions performed by the Investment Manager under the Management Agreement, including portfolio management and portfolio trading practices; |
| • | Information regarding the management fees of similarly-managed portfolios of other clients of the Investment Manager, including institutional accounts and collective trusts; |
| • | Information regarding the reputation, regulatory history and resources of the Investment Manager, including information regarding senior management, portfolio managers and other personnel; |
| • | Information regarding the capabilities of the Investment Manager with respect to compliance monitoring services, including an assessment of the Investment Manager’s compliance system by the Fund’s Chief Compliance Officer; and |
| • | The profitability to the Investment Manager and its affiliates from their relationships with the Fund. |
Nature, extent and quality of services provided under the Management Agreement
The Committee and the Board considered the nature, extent and quality of services provided to the Fund by the Investment Manager and its affiliates under the Management Agreement and under separate agreements for the provision of transfer agency and shareholder services, and the resources dedicated to the Fund and the other Columbia Funds by the Investment Manager and its affiliates. The Committee and the Board considered, among other things, the Investment Manager’s ability to attract, motivate and retain highly qualified research, advisory and supervisory investment professionals (including compensation programs for personnel involved in fund management, reputation and other attributes), the portfolio management services provided by those investment professionals, and the quality of the Investment Manager’s investment research capabilities and trade execution services. The Committee and the Board also considered the potential benefits to shareholders of investing in a mutual fund that is part of a fund complex offering exposure to a variety of asset classes and investment disciplines and providing a variety of fund and shareholder services.
The Committee and the Board also considered the professional experience and qualifications of the senior personnel of the Investment Manager, which included consideration of the Investment Manager’s experience with funds using an investment strategy similar to that used by the Investment Manager for the Fund. The Committee and the Board noted the compliance programs of and the compliance-related resources provided to the Fund by the Investment Manager and its affiliates and the resources dedicated by the Investment Manager and its affiliates to risk management, and considered the Investment Manager’s ability to provide administrative services to the Fund and coordinate the activities of the Fund’s other service providers. After reviewing these and related factors, the Committee and the Board concluded, within the context of their overall conclusions, that the nature, extent and quality of the services provided to the Fund under the Management Agreement supported the continuation of the Management Agreement.
Investment performance
The Committee and the Board reviewed information about the performance of the Fund over various time periods, including performance information relative to benchmarks, information that compared the performance of the Fund to the performance of a group of comparable mutual funds as determined by the independent third-party data provider, and information and analysis provided by the independent fee consultant. The Committee and the Board also reviewed a description of the third party’s methodology for identifying the Fund’s peer groups for purposes of performance and expense comparisons. Although the Fund’s performance lagged that of a relevant peer group for certain (although not necessarily all) periods, the Committee
| 60 | Columbia Balanced Fund | Annual Report 2019 |
Board Consideration and Approval of Management
Agreement (continued)
and the Board concluded that other factors relevant to performance were sufficient, in light of other considerations, to support continuation of the Management Agreement. Those factors included one or more of the following: (i) that the Fund’s performance, although lagging in certain recent periods, was stronger over the longer term; (ii) that the underperformance was attributable, to a significant extent, to investment decisions that were reasonable and consistent with the Fund’s investment strategy and policies and that the Fund was performing within a reasonable range of expectations, given those investment decisions, market conditions and the Fund’s investment strategy; (iii) that the Fund’s performance was competitive when compared to other relevant performance benchmarks or peer groups; and (iv) that the Investment Manager had taken or was taking steps designed to help improve the Fund’s investment performance, including, but not limited to, replacing portfolio managers, enhancing the resources supporting the portfolio managers, or modifying investment strategies.
The Committee and the Board noted that, through December 31, 2018, the Fund’s performance was in the thirty-third, sixty-ninth and seventeenth percentile (where the best performance would be in the first percentile) of its category selected by the independent third-party data provider for the purposes of performance comparisons for the one-, three- and five-year periods, respectively.
The Committee and the Board also considered the Investment Manager’s performance and reputation generally, the Investment Manager’s historical responsiveness to Board concerns about performance, and the Investment Manager’s willingness to take steps intended to improve performance. After reviewing these and related factors, the Committee and the Board concluded, within the context of their overall conclusions, that the performance of the Fund and the Investment Manager was sufficient, in light of other considerations, to support the continuation of the Management Agreement.
Investment management fee rates and other expenses
The Committee and the Board considered the management fees charged to the Fund under the Management Agreement as well as the total expenses incurred by the Fund. In assessing the reasonableness of the fees under the Management Agreement, the Committee and the Board considered, among other information, the Fund’s total expense ratio as a percentage of average daily net assets. The Committee and the Board considered data provided by the independent third-party data provider and the independent fee consultant. The Committee and the Board noted that, as of December 31, 2018, the Fund’s actual management fee and net total expense ratio were ranked in the third and first quintiles, respectively, (where the lowest fees and expenses would be in the first quintile) against the Fund’s expense universe as determined by the independent third-party data provider for purposes of expense comparison. The Committee and the Board also took into account the fee waiver and expense limitation arrangements agreed to by the Investment Manager, as noted above.
The Committee and the Board also received and considered information about the management fees charged by the Investment Manager to institutional accounts. In considering the fees charged to those accounts, the Committee and the Board took into account, among other things, the Investment Manager’s representations about the differences between managing mutual funds as compared to other types of accounts, including differences in the services provided, differences in the risk profile of such business for the Investment Manager and the additional resources required to manage mutual funds effectively. The Committee and the Board also received and considered information about the fees charged by the Investment Manager for sub-advisory services it provides to comparable unaffiliated funds. In evaluating the Fund’s management fees, the Committee and the Board also took into account the demands, complexity and quality of the investment management of the Fund.
After reviewing these and related factors, the Committee and the Board concluded, within the context of their overall conclusions, that the management fee rates and expenses of the Fund, in light of other considerations, supported the continuation of the Management Agreement.
Costs of services provided and profitability
The Committee and the Board also took note of the costs the Investment Manager and its affiliates incur in connection with the services provided and the profitability to the Investment Manager and its affiliates from their relationships with the Fund, and the efforts undertaken by the Investment Manager and its affiliates to manage efficiently their costs to provide such services.
Columbia Balanced Fund | Annual Report 2019
| 61 |
Board Consideration and Approval of Management
Agreement (continued)
The Committee and the Board also considered the compensation directly or indirectly received by the Investment Manager’s affiliates in connection with their relationships with the Fund. The Committee and the Board reviewed information provided by management as to the profitability to the Investment Manager and its affiliates of their relationships with the Fund, information about the allocation of expenses used to calculate profitability, and comparisons of profitability levels realized in 2018 to profitability levels realized in 2017. When reviewing profitability, the Committee and the Board also considered court cases in which adviser profitability was an issue in whole or in part, the performance of similarly managed funds, the performance of the Fund, and the expense ratio of the Fund. In addition, the Committee and the Board considered information provided by the Investment Manager regarding the Investment Manager’s financial condition and comparing its profitability to that of other asset management firms that are, or are subsidiaries of, publicly traded companies. In this regard, the Committee and the Board also considered data provided by the independent fee consultant.
After reviewing these and related factors, the Committee and the Board concluded, within the context of their overall conclusions, that the costs of services provided and the profitability to the Investment Manager and its affiliates from their relationships with the Fund supported the continuation of the Management Agreement.
Economies of scale
The Committee and the Board considered the potential existence of economies of scale in the provision by the Investment Manager of services to the Fund, to groups of related funds, and to the Investment Manager’s investment advisory clients as a whole, and whether those economies of scale were shared with the Fund through breakpoints in investment management fees or other means, such as expense limitation arrangements and additional investments by the Investment Manager in investment, trading, compliance and other resources. The Committee and the Board noted that the management fee schedules for the Fund contained breakpoints that would reduce the fee rate on assets above specified threshold levels.
In considering these matters, the Committee and the Board also considered the costs of the services provided and the profitability to the Investment Manager and its affiliates from their relationships with the Fund, as noted above. After reviewing these and related factors, the Committee and the Board concluded, within the context of their overall conclusions, that the extent to which any economies of scale were expected to be shared with the Fund supported the continuation of the Management Agreement.
Other benefits to the Investment Manager
The Committee and the Board received and considered information regarding “fall-out” or ancillary benefits received by the Investment Manager and its affiliates as a result of their relationships with the Fund, such as the engagement of the Investment Manager’s affiliates to provide distribution, transfer agency and shareholder services to the Fund. In this regard, among other matters, the Committee and the Board considered that the Fund’s distributor retains a portion of the distribution fees from the Fund and receives a portion of the sales charges on sales or redemptions of certain classes of shares of the Fund. The Committee and the Board also considered the benefits of research made available to the Investment Manager by reason of brokerage commissions generated by the Fund’s securities transactions, and reviewed information about the Investment Manager’s practices with respect to considering brokerage and research services when allocating portfolio transactions. In this connection, the Board also noted that the amount of research made available to the Investment Manager by reason of brokerage commissions had been declining over time, and may decline further. The Committee and the Board recognized that the Investment Manager’s profitability would be somewhat lower without these benefits.
Conclusion
The Committee and the Board reviewed all of the above considerations in reaching their decisions to recommend or approve the continuation of the Management Agreement. In their deliberations, the Trustees did not identify any particular information that was all-important or controlling, and individual Trustees may have attributed different weights to the various factors. Based on their evaluation of all factors that they deemed to be material, including those factors described above, and assisted by the advice of independent legal counsel, the Board, including the Independent Trustees, voting separately, unanimously approved the continuation of the Management Agreement.
| 62 | Columbia Balanced Fund | Annual Report 2019 |
[THIS PAGE INTENTIONALLY LEFT BLANK]
Columbia Balanced Fund
P.O. Box 219104
Kansas City, MO 64121-9104
Please read and consider the investment objectives, risks, charges and expenses for any fund carefully before investing. For a prospectus and summary prospectus, which contains this and other important information about the Fund, go to
columbiathreadneedleus.com/investor/. The Fund is distributed by Columbia Management Investment Distributors, Inc., member FINRA, and managed by Columbia Management Investment Advisers, LLC.
Columbia Threadneedle Investments (Columbia Threadneedle) is the global brand name of the Columbia and Threadneedle group of companies. All rights reserved.
© 2019 Columbia Management Investment Advisers, LLC.
columbiathreadneedleus.com/investor/

Annual Report
August 31, 2019
Multi-Manager Total Return Bond Strategies Fund
Beginning on January 1, 2021, as permitted by regulations adopted by the Securities and Exchange Commission, paper copies of the Fund’s annual and semiannual shareholder reports like this one will no longer be sent by mail, unless you specifically request paper copies of the reports. Instead, the reports will be made available on the Fund’s website (columbiathreadneedleus.com/investor/), and each time a report is posted you will be notified by mail and provided with a website address to access the report.
If you have already elected to receive shareholder reports electronically, you will not be affected by this change and you need not take any action. You may elect to receive shareholder reports and other communications from the Fund electronically at any time by contacting your financial intermediary (such as a broker-dealer or bank) or, for Fund shares held directly with the Fund, by calling 800.345.6611 or by enrolling in “eDelivery” by logging into your account at columbiathreadneedleus.com/investor/.
You may elect to receive all future reports in paper free of charge. If you invest through a financial intermediary, you can contact your financial intermediary to request that you continue receiving paper copies of your shareholder reports. If you invest directly with the Fund, you can call 800.345.6611 to let the Fund know you wish to continue receiving paper copies of your shareholder reports. Your election to receive paper reports will apply to all Columbia Funds held in your account if you invest through a financial intermediary or all Columbia Funds held with the fund complex if you invest directly with the Fund.
Not FDIC Insured • No bank guarantee • May lose value
| 3 |
| 6 |
| 11 |
| 12 |
| 74 |
| 75 |
| 76 |
| 78 |
| 80 |
| 97 |
| 98 |
| 98 |
| 102 |
Multi-Manager Total Return Bond Strategies Fund (the Fund) mails one shareholder report to each shareholder address, unless such shareholder elected to receive shareholder reports from the Fund electronically. If you would like more than one report, please call shareholder services at 800.345.6611 and additional reports will be sent to you.
Proxy voting policies and procedures
The policy of the Board of Trustees is to vote the proxies of the companies in which the Fund holds investments consistent with the procedures as stated in the Statement of Additional Information (SAI). You may obtain a copy of the SAI without charge by calling 800.345.6611; contacting your financial intermediary; visiting columbiathreadneedleus.com/investor/; or searching the website of the Securities and Exchange Commission (SEC) at sec.gov. Information regarding how the Fund voted proxies relating to portfolio securities is filed with the SEC by August 31st for the most recent 12-month period ending June 30th of that year, and is available without charge by visiting columbiathreadneedleus.com/investor/, or searching the website of the SEC at sec.gov.
Quarterly schedule of investments
The Fund files a complete schedule of portfolio holdings with the SEC for the first and third quarters of each fiscal year on Form N-PORT, and for reporting periods ended prior to March 31, 2019, on Form N-Q. The Fund’s Form N-Q and Form N-PORT filings are available on the SEC’s website at sec.gov. The Fund’s complete schedule of portfolio holdings, as filed on Form N-Q or Form N-PORT, can also be obtained without charge, upon request, by calling 800.345.6611.
Additional Fund information
For more information about the Fund, please visit columbiathreadneedleus.com/investor/ or call 800.345.6611. Customer Service Representatives are available to answer your questions Monday through Friday from 8 a.m. to 7 p.m. Eastern time.
Fund investment manager
Columbia Management Investment Advisers, LLC (the Investment Manager)
225 Franklin Street
Boston, MA 02110
Fund distributor
Columbia Management Investment Distributors, Inc.
225 Franklin Street
Boston, MA 02110
Fund transfer agent
Columbia Management Investment Services Corp.
P.O. Box 219104
Kansas City, MO 64121-9104
Multi-Manager Total Return Bond Strategies Fund | Annual Report 2019
Investment objective
The Fund seeks total return, consisting of capital appreciation and current income.
Portfolio management
Loomis, Sayles & Company, L.P.
Christopher Harms
Clifton Rowe, CFA
Kurt Wagner*, CFA, CIC
Daniel Conklin, CFA
* Effective June 30, 2020, Kurt Wagner will no longer serve as a portfolio manager. Mr. Wagner is retiring from Loomis Sayles effective August 30, 2020.
PGIM, Inc.
Michael Collins, CFA
Robert Tipp, CFA
Richard Piccirillo
Gregory Peters
TCW Investment Management Company LLC
Stephen Kane, CFA
Laird Landmann
Tad Rivelle
Bryan Whalen, CFA
Voya Investment Management Co. LLC
Matthew Toms, CFA
Randall Parrish, CFA
David Goodson
| Average annual total returns (%) (for the period ended August 31, 2019) |
| | | Inception | 1 Year | 5 Years | Life |
| Class A | 04/20/12 | 9.06 | 2.93 | 3.05 |
| Institutional Class* | 01/03/17 | 9.33 | 3.09 | 3.15 |
| Bloomberg Barclays U.S. Aggregate Bond Index | | 10.17 | 3.35 | 3.04 |
All results shown assume reinvestment of distributions during the period. Returns do not reflect the deduction of taxes that a shareholder may pay on Fund distributions or on the redemption of Fund shares. Performance results reflect the effect of any fee waivers or reimbursements of Fund expenses by Columbia Management Investment Advisers, LLC and/or any of its affiliates. Absent these fee waivers or expense reimbursement arrangements, performance results would have been lower.
The performance information shown represents past performance and is not a guarantee of future results. The investment return and principal value of your investment will fluctuate so that your shares, when redeemed, may be worth more or less than their original cost. Current performance may be lower or higher than the performance information shown. You may obtain performance information current to the most recent month-end by contacting your financial intermediary, visiting columbiathreadneedleus.com/investor/ or calling 800.345.6611.
| * | The returns shown for periods prior to the share class inception date (including returns for the Life of the Fund, if shown, which are since Fund inception) include the returns of the Fund’s oldest share class. These returns are adjusted to reflect any higher class-related operating expenses of the newer share classes, as applicable. Please visit columbiathreadneedleus.com/investor/investment-products/mutual-funds/appended-performance for more information. |
The Bloomberg Barclays U.S. Aggregate Bond Index is a broad-based benchmark that measures the investment-grade, U.S. dollar-denominated, fixed-rate taxable bond market, including Treasuries, government-related and corporate securities, mortgage-backed securities (agency fixed-rate and hybrid adjustable-rate mortgage passthroughs), asset-backed securities, and commercial mortgage-backed securities.
Indices are not available for investment, are not professionally managed and do not reflect sales charges, fees, brokerage commissions, taxes or other expenses of investing. Securities in the Fund may not match those in an index.
Multi-Manager Total Return Bond Strategies Fund | Annual Report 2019
| 3 |
Fund at a Glance (continued)
Performance of a hypothetical $10,000 investment (April 20, 2012 — August 31, 2019)
The chart above shows the change in value of a hypothetical $10,000 investment in Class A shares of Multi-Manager Total Return Bond Strategies Fund during the stated time period, and does not reflect the deduction of taxes that a shareholder may pay on Fund distributions or on the redemption of Fund shares.
| Portfolio breakdown (%) (at August 31, 2019) |
| Asset-Backed Securities — Non-Agency | 11.4 |
| Commercial Mortgage-Backed Securities - Agency | 2.8 |
| Commercial Mortgage-Backed Securities - Non-Agency | 6.6 |
| Common Stocks | 0.0(a) |
| Corporate Bonds & Notes | 30.7 |
| Foreign Government Obligations | 3.0 |
| Inflation-Indexed Bonds | 0.8 |
| Money Market Funds | 4.0 |
| Municipal Bonds | 0.4 |
| Residential Mortgage-Backed Securities - Agency | 22.4 |
| Residential Mortgage-Backed Securities - Non-Agency | 4.9 |
| Senior Loans | 0.2 |
| Treasury Bills | 1.3 |
| U.S. Government & Agency Obligations | 0.3 |
| U.S. Treasury Obligations | 11.2 |
| Total | 100.0 |
Percentages indicated are based upon total investments excluding investments in derivatives, if any. The Fund’s portfolio composition is subject to change.
| Quality breakdown (%) (at August 31, 2019) |
| AAA rating | 55.3 |
| AA rating | 4.7 |
| A rating | 10.7 |
| BBB rating | 21.2 |
| BB rating | 2.6 |
| B rating | 3.1 |
| CCC rating | 0.6 |
| CC rating | 0.3 |
| C rating | 0.0(a) |
| D rating | 0.2 |
| Not rated | 1.3 |
| Total | 100.0 |
Percentages indicated are based upon total fixed income investments.
Bond ratings apply to the underlying holdings of the Fund and not the Fund itself and are divided into categories ranging from highest to lowest credit quality, determined by using the middle rating of Moody’s, S&P and Fitch, after dropping the highest and lowest available ratings. When ratings are available from only two rating agencies, the lower rating is used. When a rating is available from only one rating agency, that rating is used. When a bond is not rated by any rating agency, it is designated as “Not rated.” Credit quality ratings assigned by a rating agency are subjective opinions, not statements of
| 4 | Multi-Manager Total Return Bond Strategies Fund | Annual Report 2019 |
Fund at a Glance (continued)
fact, and are subject to change, including daily. The ratings assigned by credit rating agencies are but one of the considerations that the Investment Manager and/or Fund’s subadviser incorporates into its credit analysis process, along with such other issuer-specific factors as cash flows, capital structure and leverage ratios, ability to de-leverage (repay) through free cash flow, quality of management, market positioning and access to capital, as well as such security-specific factors as the terms of the security (e.g., interest rate and time to maturity) and the amount and type of any collateral.
| Market exposure through derivatives investments (% of notional exposure) (at August 31, 2019)(a) |
| | Long | Short | Net |
| Fixed Income Derivative Contracts | 407.6 | (307.6) | 100.0 |
| Total Notional Market Value of Derivative Contracts | 407.6 | (307.6) | 100.0 |
(a) The Fund has market exposure (long and/or short) to fixed income through its investments in derivatives. The notional exposure of a financial instrument is the nominal or face amount that is used to calculate payments made on that instrument and/or changes in value for the instrument. The notional exposure is a hypothetical underlying quantity upon which payment obligations are computed. Notional exposures provide a gauge for how the Fund may behave given changes in individual markets. For a description of the Fund’s investments in derivatives, see Investments in derivatives following the Portfolio of Investments, and Note 2 of the Notes to Financial Statements.
Multi-Manager Total Return Bond Strategies Fund | Annual Report 2019
| 5 |
Manager Discussion of Fund Performance
Effective December 6, 2018, Voya Investment Management Co. LLC (Voya) began to manage a portion of the Fund’s assets. The Fund is currently managed by four independent money management firms, and each invests a portion of the portfolio’s assets. As of August 31, 2019, TCW Investment Management Company LLC (TCW), Loomis, Sayles & Company, L.P. (Loomis Sayles), PGIM, Inc. (PGIM) and Voya managed approximately 26.8%, 20.9%, 27.0% and 25.4% of the portfolio, respectively.
For the 12-month period that ended August 31, 2019, the Fund’s Class A shares returned 9.06%. While the Fund posted solid absolute gains, it underperformed its benchmark, the Bloomberg Barclays U.S. Aggregate Bond Index, which returned 10.17% over the same period. The Fund’s performance can be attributed primarily to sector allocation, security selection and duration and yield curve positioning decisions as well as to fees and expenses that unmanaged indices do not incur.
Fixed-income markets gained amid heightened volatility
Global fixed-income markets experienced a volatile 12-month period ended August 31, 2019, dealing with a combination of slowing economic growth, persistently low inflation and the U.S. Federal Reserve’s (Fed’s) increasingly accommodative monetary policy. As recently as the fourth quarter of 2018, the markets generally anticipated the Fed would continue to slowly raise interest rates for at least another 12 months. Increased concerns about trade policy, the yield curve, Brexit (the U.K.’s departure from the European Union), global economic growth and global monetary policy caused spreads, or yield differentials of non-U.S. Treasury securities to duration-equivalent U.S. Treasuries, to widen during the fourth quarter of 2018. However, performance bounced back in the first quarter of 2019 amid reduced fears of a global recession and a more dovish Fed. The change in the outlook for Fed policy fueled a strong, broad-based rally in bonds during the second quarter of 2019. Then, in July 2019, the Fed cut interest rates for the first time since 2008, citing global economic growth concerns and the U.S.-China trade tensions as its reasons. At the end of the period, the market was pricing in more than four interest rate cuts in the U.S. during the next 12 months, should inflation remain low and manufacturing indices around the world continue to weaken.
Further supporting the fixed-income markets were U.S. trade disputes, especially those with China, which dominated headlines for much of the period, putting pressure on risk assets. In August 2019, the ongoing trade dispute between the U.S. and China escalated further, as the U.S. President implemented a timetable for tariffs on the remaining imports not previously targeted. China responded with increased tariffs of their own, which resulted in the U.S. President increasing tariffs even further. The net result was that spreads widened for risk assets and yields plummeted. The yield on the 10-year U.S. Treasury fell below 2% in mid-June 2019 for the first time since late 2016 and ended the period at 1.50%. The yield on the 30-year U.S. Treasury also broke a record, falling to a low of 1.96% at the end of August 2019. All told, the yield on the 10-year U.S. Treasury fell 136 basis points (a basis point is 1/100th of a percentage point) during the period, and the yield on the 30-year U.S. Treasury fell approximately 105 basis points. While rates fell across the spectrum of maturities, the U.S. Treasury yield curve flattened during the period. Notably, the period ended with yield curve inversion in the two-year to 10-year portion of the curve, meaning yields on shorter term maturities were higher than those on longer term maturities.
For the period overall, municipal bonds led among fixed-income sectors. Despite rising trade tensions, weakening global manufacturing indices, slowing business investment and generally sluggish global economic growth, corporate credit held up relatively well. Investment-grade corporate bonds ended the period with performance better than that of U.S. Treasuries. Additionally, the likelihood of further global central bank easing and the attractiveness of corporate yields versus a number of negative and low yielding government bonds benefited the credit sector. While high-yield corporate bonds produced positive returns overall, the sector underperformed both investment-grade corporate bonds and U.S. Treasuries for the period. Securitized assets posted positive returns, with asset-backed securities and commercial mortgage-backed securities (CMBS) outperforming duration-matched U.S. Treasuries. Agency mortgage-backed securities also posted strong returns but trailed duration-matched U.S. Treasuries for the period.
Sector allocations, security selection and duration positioning drove Fund returns
TCW: Our portion of the Fund outperformed the benchmark during the period. Having an underweight to corporate bonds contributed positively, as yield premiums increased, particularly in lower quality bonds and in those industries with more market risk, such as energy and basic industry, while issue selection favoring communications and real estate investment trusts was also beneficial. Within our portion of the Fund’s allocation to securitized assets, non-agency mortgage-backed securities benefited from favorable demand, contributing positively to relative results. CMBS holdings also added value, as
| 6 | Multi-Manager Total Return Bond Strategies Fund | Annual Report 2019 |
Manager Discussion of Fund Performance (continued)
they outpaced the benchmark on a duration-adjusted basis. A modest position in Japanese government bonds, with the yen exposure fully hedged out using a dollar-yen cross currency swap, also boosted relative results. Finally, having a longer duration profile than the benchmark for most of the period benefited returns amid the lower rate environment.
Partially offsetting these positive contributors was our portion of the Fund’s relative underweight to municipal bonds and non-U.S. sovereign bonds, which detracted as yield spreads, or differentials to U.S. Treasuries, compressed in these sectors. Within the allocation to securitized assets, exposure to agency mortgage-backed securities proved to be a drag on Fund performance as well.
Our portion of the Fund’s yield curve positioning had a rather neutral effect on relative results during the period.
Loomis Sayles: Our portion of the Fund outperformed the benchmark, driven primarily by effective security selection, though sector allocation decisions also lifted relative results. Our combined duration and yield curve positioning detracted.
More specifically, security selection in investment-grade industrial, utilities and financials corporate bonds added value. Bond choices within the electric, consumer non-cyclical, banking and technology industries performed especially well during the period. Having an overweight allocation to investment-grade financial and industrial corporate bonds, specifically within the banking, insurance, consumer cyclical and communications market segment, also contributed positively. Having an out-of-benchmark allocation to agency collateralized mortgage obligations (CMOs) proved beneficial as well. An underweight allocation to U.S. Treasuries also aided performance, a position taken as we continued to favor risk assets during the period.
Partially offsetting these positive contributors was security selection among agency CMBS and asset-backed securities, which detracted from performance. Within the asset-backed securities sector, choices among car loan issuers held back performance most. Also, having an overweight allocation to the electric industry within the utilities segment of the investment-grade corporate bond sector hurt, more than offsetting effective security selection within the market segment. Having an underweight allocation to non-U.S. sovereign bonds also weighed on our portion of the Fund’s relative returns.
While our portion of the Fund’s overall duration was near neutral to that of the benchmark throughout the period, we favored mid- to longer duration securities and were underweight securities from the front, or short-term, end of the yield curve. Our portion of the Fund’s duration stance proved modestly positive, but our yield curve positioning detracted from relative results, as interest rates fell and the yield curve flattened and then inverted.
PGIM: Our portion of the Fund outperformed the benchmark, with sector allocation and duration and yield curve positioning contributing positively to relative results, more than offsetting security selection, which detracted.
More specifically, overweighted allocations to CMBS, collateralized loan obligations (CLOs) and high-yield corporate bonds contributed positively to relative results. Issue selection within the CMBS sector also added value, especially our emphasis on high-quality securities with solid structural support and select single-borrower names. Among CLOs, we favored senior tranches. Both CMBS and CLOs enabled our portion of the Fund to capture attractive yield in high-quality assets while diversifying from corporate sector-specific risks. Positioning in non-U.S. sovereign bonds, agency securities, mortgage-backed securities, asset-backed securities and investment-grade corporate bonds were incremental positive contributors as well.
Our portion of the Fund had a longer duration than that of the benchmark, which helped as yields fell during the period. Further, our portion of the Fund maintained a yield curve flattening bias, which boosted results, as the differential in yields between two-year and 10-year maturities narrowed and then inverted slightly. Our portion of the Fund focused on the five-year to 10-year segment of the yield curve.
Security selection among U.S. Treasuries, interest rate swaps and emerging markets debt detracted most. Among U.S. Treasuries, futures positions versus cash bonds accounted for the negative impact, while in interest rate swaps, swap wideners (a position anticipating a tightening of swap yields versus U.S. Treasuries) hurt relative performance. Within the emerging markets debt sector, Argentina was the primary detractor. President Mauricio Macri of Argentina was unexpectedly trounced in the nation’s primary elections. As a result, both equity and bond prices in Argentina plunged, reflecting investor fears of a takeover by populists who many believed would impose generous but fiscally irresponsible social spending programs.
Multi-Manager Total Return Bond Strategies Fund | Annual Report 2019
| 7 |
Manager Discussion of Fund Performance (continued)
Voya: During the period from December 6, 2018, when we assumed management of a portion of the Fund, through August 31, 2019 (the “reporting period”), our portion of the Fund modestly outperformed the benchmark due primarily to effective sector allocation. While our portion of the Fund’s allocation to high-yield corporate bonds was rather modest, it was the most significant positive contributor to relative results during the reporting period. Investment-grade corporate bonds was also a strong positive contributor. Having an underweight to U.S. Treasury securities in favor of higher yielding sectors contributed positively as well. Effective security selection among asset-backed securities also added value.
The main detractor from our portion of the Fund’s relative results was interest rates, caused by the December 2018 implementation period (when we began managing a portion of the Fund’s assets.) Although we kept our portion of the Fund’s duration relatively neutral to that of the benchmark during the reporting period, duration detracted due primarily to rate volatility during our onboarding process. Voya’s policy for investing new accounts is to hedge duration immediately to target, as our investment style de-emphasizes value-add from duration. December 2018 and especially the day of our funding was extremely volatile. Both duration and yield curve positioning outside of December 2018 had a rather neutral affect on performance.
Also, our portion of the Fund was positioned to capitalize on the relative strength of the U.S. consumer by strategically overweighting securitized credit, which added value overall. However, overweight exposure to asset-backed securities and agency mortgage-backed securities detracted, as each of these sectors underperformed the benchmark during the reporting period.
Shifting market conditions drove portfolio changes
The Fund’s portfolio turnover rate for the 12-month period was 219%. A significant portion of the turnover was the result of rolling-maturity mortgage securities, processing of prepayments and opportunistic changes our managers made at the margin in response to valuations or market developments.
TCW: As rates marched higher in 2018, we extended our portion of the Fund’s duration in a disciplined fashion, dollar cost averaging the position to approximately 0.2 years longer than that of the benchmark at the end of December 2018 on the better yield compensation. Similarly, we adjusted the duration position as rates fell during the remainder of the period, moving first to a neutral position and then closing August 2019 at one-tenth of a year shorter than the benchmark, given the low level of interest rates.
In terms of sector allocation, our portion of the Fund’s overall positioning remained defensive, with corporate credit emphasizing regulated financials and industries like communications, consumer non-cyclicals and real estate investment trusts. Of note, as risk premiums increased in the fourth quarter of 2018, our portion of the Fund took advantage of the market volatility by incrementally adding to its credit allocation. Consistent with our value discipline, we subsequently trimmed the exposure as spreads tightened in early 2019. An emphasis on the senior area of the securitized markets remained intact, though we actively sought attractive opportunities to add risk exposure. We trimmed and then exited our portion of the Fund’s position in Japanese government bonds when we felt the relative value proposition no longer existed.
At the end of the period, our portion of the Fund remained committed to a disciplined, value-based approach. Overall, our portion of the Fund remained conservative at the end of the period, emphasizing higher quality and non-cyclical parts of the corporate market and senior areas of securitized markets. In the corporate bond sector, small yield premiums and historically high leverage influenced our preference for defensive and regulated sectors, such as U.S. financials with limited re-leveraging risk and reasonable yield premiums and high-quality, less risk-sensitive industrials. Although positioning reflected some caution, we continued to look for attractive relative value opportunities across a wide variety of sectors as we actively manage our portion of the Fund. Securitized products, which can provide protection from excesses in credit markets and offer, in our view, opportunities for attractive risk-adjusted returns, represented a relative overweight within our portion of the Fund at the end of the period. Exposure to CMBS favored agency issues. An overweight to asset-backed securities was focused on high-quality non-traditional collateral, such as government guaranteed student loan receivables. Finally, non-agency mortgage-backed securities holdings emphasized securities with what we believed to be better relative quality and near-term cash flows. Exposure to agency mortgage-backed securities was slightly overweight the benchmark at the end of the period.
| 8 | Multi-Manager Total Return Bond Strategies Fund | Annual Report 2019 |
Manager Discussion of Fund Performance (continued)
Loomis Sayles: As valuations shifted during the period, our portion of the Fund’s risk posture was slightly reduced, with a decrease in corporate bond risk more than offsetting an increase in agency mortgage-backed securities risk. We also reduced our portion of the Fund’s exposure to asset-backed securities but maintained a rather neutral weighting relative to the benchmark. Among securitized agency securities, we reduced exposure to mortgage-backed securities pass throughs and increased our portion of the Fund’s allocation to CMOs. We have and continue to monitor exposures, position sizes and risk tolerance within our portion of the Fund’s portfolio, closely watching market events and trading levels for potential opportunities. We maintained an overall duration that was neutral to that of the benchmark throughout but tilted partial durations toward mid to longer duration securities, as we anticipated a yield curve flattening, which did indeed materialize.
At the end of the period, our portion of the Fund was overweight relative to the benchmark in investment-grade corporate bonds, particularly the banking, insurance, consumer cyclical, capital goods, transportation and electric industries, as well as CMOs and asset-backed securities, the latter via auto loans. Our portion of the Fund was underweight on a relative basis to U.S. Treasuries, mortgage-backed security passthroughs and government-related securities, such as supranationals and sovereign bonds. We were targeting a neutral duration position at the end of the period.
PGIM: Cognizant of the late stage of the economic and credit cycle and, particularly of the Fed’s bias shift beginning in December 2018 to cutting interest rates, we decreased our portion of the Fund’s overall portfolio risk during the period, both via reducing credit exposure and within our duration and yield curve strategy. For example, within the corporate credit sector, we reduced exposure to longer duration industrial bonds, where leverage and downgrades have been more prominent, in favor of less economically sensitive financials and utilities bonds. Similarly, high-yield corporate bond exposure was reduced. We tactically adjusted duration throughout the period based on short-term market fluctuations, but modestly reduced our portion of the Fund’s longer duration stance than the benchmark from the start to the end of the period. We decreased exposure to U.S. Treasuries and increased our portion of the Fund’s position in cash.
At the end of the period, our portion of the Fund was underweight U.S. Treasuries, mortgage-backed securities and, to a lesser extent, interest rate swaps and was overweight structured products, high-yield corporate bonds, emerging markets debt, municipal bonds and investment-grade corporate bonds relative to the benchmark. Our portion of the Fund was rather neutrally weighted relative to the benchmark in the remaining components of the benchmark. As of August 31, 2019, our portion of the Fund had a duration approximately one-quarter year longer than that of the benchmark.
Voya: In May and June 2019, we added to our portion of the Fund’s exposure to agency mortgage-backed securities based on valuations. The decline in U.S. Treasury yields weighed on the sector due to concerns over rising pre-payment risk. We believed this was an attractive entry point to increase our allocation to the high-quality sector. Also, in line with our view to be strategically overweight securitized credit, we increased allocations to non-agency mortgage-backed securities, attracted by valuations as well as by fundamentals that supported investment in mortgage credit. We also purchased a variety of 2019 vintage AAA-rated CMBS in June 2019. We were attracted by the fundamentals and our belief that the sector is less susceptible to volatility related to the trade tensions between the U.S. and China. In addition, the sector was supported by the decline in financing rates on the heels of the decline in U.S. Treasury yields. We reduced our portion of the Fund’s allocation to high-yield corporate bonds. Having started the reporting period with an overweight allocation to high-yield corporate bonds, the meaningful rally witnessed during the first quarter of 2019 compelled us to take profits, thereby reducing exposure. Also, in February 2019, we reduced our portion of the Fund’s allocation to CLOs based on headwinds related to receding demand for floating rate paper, as market expectations grew that the Fed would soon reverse course and begin to cut interest rates.
At the end of the period, our portion of the Fund was overweight agency mortgage-backed securities, non-agency mortgage-backed securities, asset-backed securities, CMBS and investment-grade corporate bonds relative to the benchmark. Our portion of the Fund also had exposure to high-yield corporate bonds, which are not a component of the benchmark. Our portion of the Fund was underweight U.S. Treasuries and government-related issues relative to the benchmark and was rather neutrally weighted relative to the benchmark in emerging markets debt at the end of the reporting period. As of August 31, 2019, our portion of the Fund had a neutral duration compared to that of the benchmark.
Multi-Manager Total Return Bond Strategies Fund | Annual Report 2019
| 9 |
Manager Discussion of Fund Performance (continued)
Derivative positions in the Fund
Columbia Management Investment Advisers, LLC (CMIA) manages a liquidity sleeve, which may be used to manage portfolio level risks. During the reporting period, this sleeve was used to reduce the overall level of credit risk and duration risk in the Fund. Specifically, CMIA implemented a credit hedge using credit default swaps to reduce the exposure to high-yield corporate bonds held in the Fund’s sleeves managed by the Fund’s independent money management firms. While the hedge did reduce credit risk within the Fund, credit spreads continued to tighten and resulted in a negative impact to the Fund, which offset the positive contribution from the underlying bonds held in the Fund’s other sleeves. In addition, the Fund used interest rate swaps and treasury futures to reduce outright exposure to interest rates. This hedge was put in place during a period of rising interest rates in 2018 to protect against the capital erosion that may occur when interest rates rise causing bond prices to fall. While the Fund initially benefitted from rising rates in the third quarter of 2018, as interest rates shifted from rising to falling in the fourth quarter of 2018, the hedge detracted. In 2019, the hedge was reduced and ultimately fully unwound in light of the weakening economy that resulted in a shift in monetary policy by the Fed. Both hedges were fully closed during the second quarter of 2019. The overall impact of the hedges held in the liquidity sleeve contributed to the Fund’s underperformance relative to its benchmark during the period.
TCW: Our portion of the Fund held U.S. Treasury futures as a method of managing duration. The use of these futures was effectively used to manage duration and contributed positively to performance during the period. Our portion of the Fund also used currency swaps, maintaining a position in Japanese government bonds, with the yen exposure fully hedged out using a U.S. dollar-yen cross currency swap given what we saw as an attractive yield premium. The currency swap position added value during the period. We exited the swap position when the value proposition became, in our view, less attractive.
Loomis Sayles: Our portion of the Fund used U.S. Treasury futures to help manage duration relative to the benchmark. The use of these futures detracted slightly from our portion of the Fund’s results during the period.
PGIM: Our portion of the Fund utilized U.S. Treasury futures, interest rate swaps and overnight indexed swaps to hedge interest rate risk, duration and yield curve positioning and for relative value trading. Overall, positioning in U.S. Treasury futures, interest rate swaps and overnight indexed swaps detracted from our portion of the Fund’s performance during the period.
Voya: Our portion of the Fund used interest rate futures and credit default swaps on a variety of indices, the former to hedge duration and the latter for hedging credit risk and yield enhancement. The use of interest rate futures had a modestly positive effect on relative results, while the use of credit default swaps detracted.
Market risk may affect a single issuer, sector of the economy, industry or the market as a whole.Mortgage- and asset-backed securities are affected by interest rates, financial health of issuers/originators, creditworthiness of entities providing credit enhancements and the value of underlying assets. Fixed-income securities presentissuer default risk.Non-investment-grade (high-yield or junk) securities present greater price volatility and more risk to principal and income than higher rated securities. A rise ininterest rates may result in a price decline of fixed-income instruments held by the Fund, negatively impacting its performance and NAV. Falling rates may result in the Fund investing in lower yielding debt instruments, lowering the Fund’s income and yield. These risks may be heightened for longer maturity and duration securities.Prepayment and extensionrisk exists because the timing of payments on a loan, bond or other investment may accelerate when interest rates fall or decelerate when interest rates rise which may reduce investment opportunities and potential returns. Investing inderivatives is a specialized activity that involves special risks that subject the Fund to significant loss potential, including when used as leverage, and may result in greater fluctuation in fund value. The Fund is managed bymultiple advisers independently of one another, which may result in contradicting trades (i.e., with no net benefit to the Fund), while increasing transaction costs. Market or other (e.g., interest rate) environments may adversely affect theliquidity of fund investments, negatively impacting their price. Generally, the less liquid the market at the time the Fund sells a holding, the greater the risk of loss or decline of value to the Fund. See the Fund’s prospectus for more information on these and other risks.
The views expressed in this report reflect the current views of the respective parties. These views are not guarantees of future performance and involve certain risks, uncertainties and assumptions that are difficult to predict, so actual outcomes and results may differ significantly from the views expressed. These views are subject to change at any time based upon economic, market or other conditions and the respective parties disclaim any responsibility to update such views. These views may not be relied on as investment advice and, because investment decisions for a Columbia fund are based on numerous factors, may not be relied on as an indication of trading intent on behalf of any particular Columbia fund. References to specific securities should not be construed as a recommendation or investment advice.
| 10 | Multi-Manager Total Return Bond Strategies Fund | Annual Report 2019 |
Understanding Your Fund’s Expenses
(Unaudited)
As an investor, you incur two types of costs. There are shareholder transaction costs, which may include redemption fees. There are also ongoing fund costs, which generally include management fees, distribution and/or service fees, and other fund expenses. The following information is intended to help you understand your ongoing costs (in dollars) of investing in the Fund and to help you compare these costs with the ongoing costs of investing in other mutual funds.
Analyzing your Fund’s expenses
To illustrate these ongoing costs, we have provided examples and calculated the expenses paid by investors in each share class of the Fund during the period. The actual and hypothetical information in the table is based on an initial investment of $1,000 at the beginning of the period indicated and held for the entire period. Expense information is calculated two ways and each method provides you with different information. The amount listed in the “Actual” column is calculated using the Fund’s actual operating expenses and total return for the period. You may use the Actual information, together with the amount invested, to estimate the expenses that you paid over the period. Simply divide your account value by $1,000 (for example, an $8,600 account value divided by $1,000 = 8.6), then multiply the results by the expenses paid during the period under the “Actual” column. The amount listed in the “Hypothetical” column assumes a 5% annual rate of return before expenses (which is not the Fund’s actual return) and then applies the Fund’s actual expense ratio for the period to the hypothetical return. You should not use the hypothetical account values and expenses to estimate either your actual account balance at the end of the period or the expenses you paid during the period. See “Compare with other funds” below for details on how to use the hypothetical data.
Compare with other funds
Since all mutual funds are required to include the same hypothetical calculations about expenses in shareholder reports, you can use this information to compare the ongoing cost of investing in the Fund with other funds. To do so, compare the hypothetical example with the 5% hypothetical examples that appear in the shareholder reports of other funds. As you compare hypothetical examples of other funds, it is important to note that hypothetical examples are meant to highlight the ongoing costs of investing in a fund only and do not reflect any transaction costs, such as redemption or exchange fees. Therefore, the hypothetical calculations are useful in comparing ongoing costs only, and will not help you determine the relative total costs of owning different funds. If transaction costs were included in these calculations, your costs would be higher.
| March 1, 2019 — August 31, 2019 |
| | Account value at the
beginning of the
period ($) | Account value at the
end of the
period ($) | Expenses paid during
the period ($) | Fund’s annualized
expense ratio (%) |
| | Actual | Hypothetical | Actual | Hypothetical | Actual | Hypothetical | Actual |
| Class A | 1,000.00 | 1,000.00 | 1,076.70 | 1,021.26 | 3.96 | 3.85 | 0.76 |
| Institutional Class | 1,000.00 | 1,000.00 | 1,079.10 | 1,022.51 | 2.66 | 2.59 | 0.51 |
Expenses paid during the period are equal to the annualized expense ratio for each class as indicated above, multiplied by the average account value over the period and then multiplied by the number of days in the Fund’s most recent fiscal half year and divided by 365.
Expenses do not include fees and expenses incurred indirectly by the Fund from its investment in underlying funds, including affiliated and non-affiliated pooled investment vehicles, such as mutual funds and exchange-traded funds.
Had Columbia Management Investment Advisers, LLC and/or certain of its affiliates not waived/reimbursed certain fees and expenses, account value at the end of the period would have been reduced.
The Fund is offered only through certain wrap fee programs sponsored and/or managed by Ameriprise Financial, Inc. or its affiliates. Participants in wrap fee programs pay other fees that are not included in the above table. Please refer to the wrap program documents for information about the fees charged.
Multi-Manager Total Return Bond Strategies Fund | Annual Report 2019
| 11 |
Portfolio of Investments
August 31, 2019
(Percentages represent value of investments compared to net assets)
Investments in securities
| Asset-Backed Securities — Non-Agency 11.8% |
| Issuer | Coupon
Rate | | Principal
Amount ($) | Value ($) |
| ACC Trust(a) |
| Series 2018-1 Class A |
| 12/21/2020 | 3.700% | | 287,556 | 287,750 |
| Allegro CLO VII Ltd.(a),(b) |
| Series 2018-1A Class A |
3-month USD LIBOR + 1.100%
Floor 1.100%
06/13/2031 | 3.403% | | 7,500,000 | 7,454,452 |
| Americredit Automobile Receivables Trust |
| Series 2019-2 Class B |
| 07/18/2024 | 2.540% | | 6,060,000 | 6,126,395 |
| AmeriCredit Automobile Receivables Trust |
| Series 2017-1 Class B |
| 02/18/2022 | 2.300% | | 730,000 | 729,968 |
| Series 2017-1 Class D |
| 01/18/2023 | 3.130% | | 1,755,000 | 1,779,052 |
| Subordinated, Series 2016-3 Class C |
| 04/08/2022 | 2.240% | | 6,430,000 | 6,433,805 |
| Subordinated, Series 2019-1 Class D |
| 03/18/2025 | 3.620% | | 2,250,000 | 2,338,341 |
| Anchorage Capital CLO 11 Ltd.(a),(b) |
| Series 2019-11A Class A |
3-month USD LIBOR + 1.390%
Floor 1.390%
07/22/2032 | 3.534% | | 11,000,000 | 10,999,989 |
| Anchorage Capital CLO Ltd.(a),(b) |
| Series 2013-1A Class A1R |
3-month USD LIBOR + 1.250%
10/13/2030 | 3.553% | | 5,250,000 | 5,242,939 |
| Series 2015-6A Class AR |
3-month USD LIBOR + 1.270%
07/15/2030 | 3.573% | | 11,500,000 | 11,487,085 |
| Applebee’s Funding LLC/IHOP Funding LLC(a) |
| Series 2019-1A Class A2I |
| 06/07/2049 | 4.194% | | 1,050,000 | 1,090,821 |
| Series 2019-1A Class AII |
| 06/07/2049 | 4.723% | | 500,000 | 520,065 |
| ArrowMark Colorado Holdings(a),(b) |
| Series 2017-6A Class A1 |
3-month USD LIBOR + 1.280%
07/15/2029 | 3.583% | | 2,250,000 | 2,250,097 |
| Atlas Senior Loan Fund Ltd.(a),(b) |
| Series 2017-8A Class A |
3-month USD LIBOR + 1.300%
01/16/2030 | 3.622% | | 5,250,000 | 5,245,947 |
| Asset-Backed Securities — Non-Agency (continued) |
| Issuer | Coupon
Rate | | Principal
Amount ($) | Value ($) |
| Atlas Senior Loan Fund V Ltd.(a),(b) |
| Series 2014-1A Class AR2 |
3-month USD LIBOR + 1.260%
07/16/2029 | 3.582% | | 13,750,000 | 13,754,909 |
| Atrium XII(a),(b) |
| Series 2012A Class AR |
3-month USD LIBOR + 0.830%
04/22/2027 | 3.108% | | 16,975,000 | 16,963,321 |
| Atrium XIII(a),(b) |
| Series 2013A Class A1 |
3-month USD LIBOR + 1.180%
Floor 1.180%
11/21/2030 | 3.439% | | 2,500,000 | 2,497,580 |
| Avis Budget Rental Car Funding AESOP LLC(a) |
| Series 2015-1A Class A |
| 07/20/2021 | 2.500% | | 3,300,000 | 3,303,739 |
| Series 2016-1A Class A |
| 06/20/2022 | 2.990% | | 2,800,000 | 2,834,347 |
| Series 2016-2A Class A |
| 11/20/2022 | 2.720% | | 6,700,000 | 6,773,868 |
| Series 2017-2A Class A |
| 03/20/2024 | 2.970% | | 750,000 | 768,677 |
| Series 2019-2A Class A |
| 09/22/2025 | 3.350% | | 2,175,000 | 2,283,427 |
| Barings CLO Ltd.(a),(b) |
| Series 2018-3A Class A1 |
3-month USD LIBOR + 0.950%
07/20/2029 | 3.228% | | 3,000,000 | 2,987,112 |
| Betony CLO 2 Ltd.(a),(b) |
| Series 2018-1A Class A1 |
3-month USD LIBOR + 1.080%
04/30/2031 | 3.346% | | 3,000,000 | 2,972,181 |
| BlueMountain CLO Ltd.(a),(b),(c) |
| Series 2016-2A Class A1R |
3-month USD LIBOR + 1.310%
Floor 1.310%
08/20/2032 | 3.100% | | 7,000,000 | 7,000,000 |
| Burnham Park CLO Ltd.(a),(b) |
| Series 2016-1A Class A |
3-month USD LIBOR + 1.430%
10/20/2029 | 3.708% | | 9,500,000 | 9,493,084 |
| California Republic Auto Receivables Trust |
| Series 2017-1 Class A4 |
| 06/15/2022 | 2.280% | | 4,038,125 | 4,040,691 |
| Capital Auto Receivables Asset Trust(a) |
| Series 2017-1 Class A3 |
| 08/20/2021 | 2.020% | | 617,885 | 617,360 |
The accompanying Notes to Financial Statements are an integral part of this statement.
| 12 | Multi-Manager Total Return Bond Strategies Fund | Annual Report 2019 |
Portfolio of Investments (continued)
August 31, 2019
| Asset-Backed Securities — Non-Agency (continued) |
| Issuer | Coupon
Rate | | Principal
Amount ($) | Value ($) |
| Carbone CLO Ltd.(a),(b) |
| Series 2017-1A Class A1 |
3-month USD LIBOR + 1.140%
01/20/2031 | 3.418% | | 2,231,000 | 2,220,177 |
| Carlyle Global Market Strategies CLO Ltd.(a),(b) |
| Series 2013-3A Class A1AR |
3-month USD LIBOR + 1.100%
Floor 1.100%
10/15/2030 | 3.403% | | 4,000,000 | 3,977,524 |
| Series 2014-1A Class A1R2 |
3-month USD LIBOR + 0.970%
Floor 0.970%
04/17/2031 | 3.273% | | 7,000,000 | 6,931,414 |
| Series 2014-3RA Class A1A |
3-month USD LIBOR + 1.050%
07/27/2031 | 3.306% | | 21,750,000 | 21,587,027 |
| Carmax Auto Owner Trust |
| Series 2019-2 Class C |
| 02/18/2025 | 3.160% | | 3,270,000 | 3,378,476 |
| Catamaran CLO Ltd.(a),(b) |
| Series 2014-1A Class A1AR |
3-month USD LIBOR + 1.260%
04/22/2030 | 3.538% | | 13,750,000 | 13,725,429 |
| Chancelight, Inc.(a),(b) |
| Series 2012-2 Class A |
1-month USD LIBOR + 0.730%
04/25/2039 | 2.875% | | 928,609 | 927,501 |
| CIFC Funding Ltd.(a),(b) |
| Series 2015-1A Class ARR |
3-month USD LIBOR + 1.110%
Floor 1.110%
01/22/2031 | 3.388% | | 7,000,000 | 6,957,685 |
| Series 2015-3A Class AR |
3-month USD LIBOR + 0.870%
04/19/2029 | 3.173% | | 6,000,000 | 5,955,366 |
| Series 2017-5A Class A1 |
3-month USD LIBOR + 1.180%
11/16/2030 | 3.483% | | 3,000,000 | 2,991,987 |
| Series 2018-1A Class A |
3-month USD LIBOR + 1.000%
04/18/2031 | 3.300% | | 5,000,000 | 4,950,165 |
| Series 2018-2A Class A1 |
3-month USD LIBOR + 1.040%
04/20/2031 | 3.318% | | 12,000,000 | 11,907,024 |
| CIG Auto Receivables Trust(a) |
| Series 2017-1A |
| 05/15/2023 | 2.710% | | 232,843 | 232,966 |
| Asset-Backed Securities — Non-Agency (continued) |
| Issuer | Coupon
Rate | | Principal
Amount ($) | Value ($) |
| CIT Education Loan Trust(a),(b) |
| Series 2007-1 Class B |
3-month USD LIBOR + 0.300%
Floor 0.300%
06/25/2042 | 2.649% | | 673,995 | 616,069 |
| CIT Mortgage Loan Trust(a),(b) |
| Series 2007-1 Class 1A |
1-month USD LIBOR + 1.350%
Floor 1.350%
10/25/2037 | 3.495% | | 7,095,869 | 7,170,709 |
| Commonbond Student Loan Trust(a) |
| Series 2018-CGS Class B |
| 02/25/2046 | 4.250% | | 750,000 | 786,370 |
| CPS Auto Receivables Trust(a) |
| Series 2018-A Class C |
| 12/15/2023 | 3.050% | | 625,000 | 627,921 |
| Subordinated, Series 2017-C Class B |
| 07/15/2021 | 2.300% | | 441,321 | 441,291 |
| Credit Acceptance Auto Loan Trust(a) |
| Series 2017-1A Class A |
| 10/15/2025 | 2.560% | | 259,241 | 259,245 |
| Series 2018-2A Class A |
| 05/17/2027 | 3.470% | | 515,000 | 523,763 |
| DB Master Finance LLC(a) |
| Series 2017-1A Class A2II |
| 11/20/2047 | 4.030% | | 1,228,125 | 1,281,106 |
| Series 2019-1A Class A23 |
| 05/20/2049 | 4.352% | | 1,197,000 | 1,270,726 |
| Series 2019-1A Class A2II |
| 05/20/2049 | 4.021% | | 648,375 | 670,905 |
| Diamond Resorts Owner Trust(a) |
| Series 2018-1 Class A |
| 01/21/2031 | 3.700% | | 2,919,262 | 2,981,716 |
| Domino’s Pizza Master Issuer LLC(a) |
| Series 2017-1A Class A2II |
| 07/25/2047 | 3.082% | | 1,078,000 | 1,082,808 |
| Series 2018-1A Class A2I |
| 07/25/2048 | 4.116% | | 1,481,250 | 1,559,134 |
| Drive Auto Receivables Trust |
| Series 2019-3 Class B |
| 02/15/2024 | 2.650% | | 4,010,000 | 4,039,196 |
| Subordinated, Series 2018-1 Class B |
| 02/15/2022 | 2.880% | | 9,275 | 9,276 |
| Driven Brands Funding LLC(a) |
| Series 2019-1A Class A2 |
| 04/20/2049 | 4.641% | | 1,791,000 | 1,917,980 |
The accompanying Notes to Financial Statements are an integral part of this statement.
Multi-Manager Total Return Bond Strategies Fund | Annual Report 2019
| 13 |
Portfolio of Investments (continued)
August 31, 2019
| Asset-Backed Securities — Non-Agency (continued) |
| Issuer | Coupon
Rate | | Principal
Amount ($) | Value ($) |
| Dryden 33 Senior Loan Fund(a),(b) |
| Series 2014-33A Class AR2 |
3-month USD LIBOR + 1.230%
Floor 1.230%
04/15/2029 | 3.533% | | 5,000,000 | 5,001,150 |
| Dryden 49 Senior Loan Fund(a),(b) |
| Series 2017-49A Class A |
3-month USD LIBOR + 1.210%
07/18/2030 | 3.510% | | 3,150,000 | 3,152,574 |
| Dryden 75 CLO Ltd.(a),(b) |
| Series 2019-75A Class AR |
3-month USD LIBOR + 1.200%
Floor 1.200%
07/15/2030 | 3.534% | | 4,000,000 | 3,998,212 |
| Dryden CLO Ltd.(a),(b) |
| Series 2018-71A Class A |
3-month USD LIBOR + 1.150%
Floor 1.150%
01/15/2029 | 3.453% | | 5,500,000 | 5,500,451 |
| DT Auto Owner Trust(a) |
| Series 2018-2A Class C |
| 03/15/2024 | 3.670% | | 4,120,000 | 4,180,568 |
| Series 2019-1A Class C |
| 11/15/2024 | 3.610% | | 2,490,000 | 2,538,554 |
| Series 2019-2A Class C |
| 02/18/2025 | 3.180% | | 2,250,000 | 2,288,690 |
| Subordinated, Series 2017-1 Class C |
| 11/15/2022 | 2.700% | | 38,350 | 38,350 |
| Earnest Student Loan Program LLC(a),(b) |
| Series 2016-D Class A1 |
1-month USD LIBOR + 1.400%
Floor 1.400%
01/25/2041 | 3.545% | | 194,780 | 194,836 |
| Education Loan Asset-Backed Trust I(a),(b) |
| Series 2013-1 Class A2 |
1-month USD LIBOR + 0.800%
Floor 0.800%
04/26/2032 | 2.945% | | 4,650,000 | 4,615,280 |
| Educational Funding of the South, Inc.(b) |
| Series 2011-1 Class A2 |
3-month USD LIBOR + 0.650%
Floor 0.650%
04/25/2035 | 2.926% | | 1,960,933 | 1,947,481 |
| EFS Volunteer No. 2 LLC(a),(b) |
| Series 2012-1 Class A2 |
1-month USD LIBOR + 1.350%
Floor 1.350%
03/25/2036 | 3.495% | | 2,700,000 | 2,720,279 |
| Asset-Backed Securities — Non-Agency (continued) |
| Issuer | Coupon
Rate | | Principal
Amount ($) | Value ($) |
| Elevation CLO Ltd.(a),(b) |
| Series 2014-2A Class A1R |
3-month USD LIBOR + 1.230%
10/15/2029 | 3.533% | | 13,000,000 | 13,000,559 |
| Series 2017-7A Class A |
3-month USD LIBOR + 1.220%
07/15/2030 | 3.523% | | 4,750,000 | 4,737,669 |
| Ellington CLO II Ltd.(a),(b) |
| Series 2017-2A Class A |
3-month USD LIBOR + 1.700%
Floor 1.700%
02/15/2029 | 3.858% | | 20,000,000 | 20,049,820 |
| Enterprise Fleet Financing LLC(a) |
| Series 2016-2 Class A2 |
| 02/22/2022 | 1.740% | | 16,889 | 16,881 |
| Exeter Automobile Receivables Trust(a) |
| Series 2017-3A Class A |
| 12/15/2021 | 2.050% | | 211,105 | 210,947 |
| Series 2018-1A Class B |
| 04/15/2022 | 2.750% | | 1,962,168 | 1,964,139 |
| Series 2018-2A Class B |
| 05/16/2022 | 3.270% | | 5,400,000 | 5,416,170 |
| Series 2019-2A Class B |
| 05/15/2023 | 3.060% | | 695,000 | 703,391 |
| First Investors Auto Owner Trust(a) |
| Series 2017-1A Class A2 |
| 03/15/2022 | 2.200% | | 1,217,659 | 1,216,994 |
| Flagship Credit Auto Trust(a) |
| Subordinated, Series 2015-3 Class B |
| 03/15/2022 | 3.680% | | 301,920 | 302,325 |
| Subordinated, Series 2016-2 |
| 09/15/2022 | 3.840% | | 1,855,000 | 1,860,999 |
| Subordinated, Series 2016-3 Class B |
| 06/15/2021 | 2.430% | | 326,696 | 326,697 |
| Subordinated, Series 2016-4 Class B |
| 10/15/2021 | 2.410% | | 595,929 | 595,840 |
| Subordinated, Series 2018-2 Class B |
| 05/15/2023 | 3.560% | | 3,869,000 | 3,947,370 |
| Subordinated, Series 2018-4 Class B |
| 10/16/2023 | 3.880% | | 1,600,000 | 1,648,402 |
| Ford Credit Auto Owner Trust(a) |
| Series 2015-2 Class A |
| 01/15/2027 | 2.440% | | 2,655,000 | 2,662,226 |
| Series 2017-2 Class A |
| 03/15/2029 | 2.360% | | 7,075,000 | 7,165,998 |
| Series 2018-1 Class A |
| 07/15/2031 | 3.190% | | 7,110,000 | 7,498,243 |
The accompanying Notes to Financial Statements are an integral part of this statement.
| 14 | Multi-Manager Total Return Bond Strategies Fund | Annual Report 2019 |
Portfolio of Investments (continued)
August 31, 2019
| Asset-Backed Securities — Non-Agency (continued) |
| Issuer | Coupon
Rate | | Principal
Amount ($) | Value ($) |
| Ford Credit Floorplan Master Owner Trust |
| Series 2018-4 Class A |
| 11/15/2030 | 4.060% | | 7,600,000 | 8,542,080 |
| Galaxy XV CLO Ltd.(a),(b) |
| Series 2013-15A Class AR |
3-month USD LIBOR + 1.200%
10/15/2030 | 3.503% | | 2,225,000 | 2,214,227 |
| Global SC Finance II SRL(a) |
| Series 2014-1A Class A2 |
| 07/17/2029 | 3.090% | | 1,885,542 | 1,905,222 |
| GLS Auto Receivables Issuer Trust(a) |
| Series 2019-2A Class A |
| 04/17/2023 | 3.060% | | 2,816,202 | 2,832,937 |
| GLS Auto Receivables Trust(a) |
| Subordinated, Series 2018-3A Class B |
| 08/15/2023 | 3.780% | | 3,705,000 | 3,774,658 |
| Goal Capital Funding Trust(b) |
| Series 2006-1 Class B |
3-month USD LIBOR + 0.450%
Floor 0.450%
08/25/2042 | 2.582% | | 870,894 | 801,330 |
| Greenwood Park CLO Ltd.(a),(b) |
| Series 2018-1A Class A2 |
3-month USD LIBOR + 1.010%
04/15/2031 | 3.313% | | 15,000,000 | 14,856,300 |
| Henderson Receivables LLC(a) |
| Series 2013-3A Class A |
| 01/17/2073 | 4.080% | | 2,044,118 | 2,252,935 |
| Series 2014-2A Class A |
| 01/17/2073 | 3.610% | | 2,537,323 | 2,742,526 |
| Hertz Vehicle Financing II LP(a) |
| Series 2015-3A Class A |
| 09/25/2021 | 2.670% | | 1,390,000 | 1,396,019 |
| Series 2016-2A Class A |
| 03/25/2022 | 2.950% | | 6,270,000 | 6,327,543 |
| Higher Education Funding I(a),(b) |
| Series 2014-1 Class A |
3-month USD LIBOR + 1.050%
Floor 1.050%
05/25/2034 | 3.182% | | 3,818,318 | 3,829,674 |
| ICG US CLO Ltd.(a),(b) |
| Series 2017-2A Class A1 |
3-month USD LIBOR + 1.280%
10/23/2029 | 3.539% | | 1,000,000 | 1,000,385 |
| JG Wentworth XLIII LLC(a) |
| Series 2019-1A Class A |
| 08/17/2071 | 3.820% | | 1,280,037 | 1,397,569 |
| Asset-Backed Securities — Non-Agency (continued) |
| Issuer | Coupon
Rate | | Principal
Amount ($) | Value ($) |
| KKR CLO Ltd.(a),(b) |
| Series 2018 Class A |
3-month USD LIBOR + 1.270%
07/18/2030 | 3.570% | | 9,000,000 | 8,991,252 |
| KVK CLO Ltd.(a),(b) |
| Series 2018-1A Class A |
3-month USD LIBOR + 0.930%
05/20/2029 | 3.066% | | 17,000,000 | 16,934,788 |
| LCM XIII LP(a),(b) |
| Series 2013A Class ARR |
3-month USD LIBOR + 1.140%
07/19/2027 | 3.325% | | 5,500,000 | 5,500,407 |
| LCM XXIV Ltd.(a),(b) |
| Series 2024A Class A |
3-month USD LIBOR + 1.310%
Floor 1.310%
03/20/2030 | 3.588% | | 4,750,000 | 4,757,685 |
| LCM XXV Ltd.(a),(b) |
| Series 2025A Class A |
3-month USD LIBOR + 1.210%
07/20/2030 | 3.488% | | 1,643,000 | 1,640,213 |
| Lendmark Funding Trust(a) |
| Series 2018-1A Class A |
| 12/21/2026 | 3.810% | | 7,200,000 | 7,309,592 |
| Series 2019-1A Class A |
| 12/20/2027 | 3.000% | | 4,000,000 | 4,031,810 |
| Madison Park Funding XIX Ltd.(a),(b) |
| Series 2015-19A Class B1R |
3-month USD LIBOR + 2.300%
Floor 2.300%
01/22/2028 | 4.578% | | 3,000,000 | 2,999,898 |
| Magnetite VII Ltd.(a),(b) |
| Series 2012-7A Class A1R2 |
3-month USD LIBOR + 0.800%
01/15/2028 | 3.103% | | 710,000 | 705,029 |
| Magnetite XVII Ltd.(a),(b) |
| Series 2016-17A Class AR |
3-month USD LIBOR + 1.100%
07/20/2031 | 3.378% | | 1,050,000 | 1,046,827 |
| Mariner CLO 5 Ltd.(a),(b) |
| Series 2018-5A Class A |
3-month USD LIBOR + 1.110%
Floor 1.110%
04/25/2031 | 3.386% | | 5,500,000 | 5,462,589 |
| Mariner Finance Issuance Trust(a) |
| Series 2017-BA Class A |
| 12/20/2029 | 2.920% | | 6,145,000 | 6,158,035 |
| Series 2019-AA Class A |
| 07/20/2032 | 2.960% | | 1,300,000 | 1,311,337 |
The accompanying Notes to Financial Statements are an integral part of this statement.
Multi-Manager Total Return Bond Strategies Fund | Annual Report 2019
| 15 |
Portfolio of Investments (continued)
August 31, 2019
| Asset-Backed Securities — Non-Agency (continued) |
| Issuer | Coupon
Rate | | Principal
Amount ($) | Value ($) |
| Marlette Funding Trust(a) |
| Series 2019-3A Class B |
| 09/17/2029 | 3.070% | | 2,050,000 | 2,073,220 |
| Subordinated Series 2018-4A Class C |
| 12/15/2028 | 4.910% | | 1,000,000 | 1,039,917 |
| Subordinated, Series 2017-3A Class C |
| 12/15/2024 | 4.010% | | 5,000,000 | 5,051,143 |
| Massachusetts Educational Financing Authority |
| Series 2018-A Class A |
| 05/25/2033 | 3.850% | | 4,633,202 | 4,922,669 |
| Merlin Aviation Holdings DAC(a) |
| Series 2016-1 Class A |
| 12/15/2032 | 4.500% | | 853,972 | 874,723 |
| Midocean Credit CLO VIII(a),(b) |
| Series 2018-8A Class A1 |
3-month USD LIBOR + 1.150%
02/20/2031 | 3.286% | | 8,000,000 | 7,981,560 |
| Series 2018-8A Class B |
3-month USD LIBOR + 1.650%
02/20/2031 | 3.786% | | 6,600,000 | 6,499,654 |
| Mid-State Capital Corp. Trust(a) |
| Series 2006-1 Class A |
| 10/15/2040 | 5.787% | | 1,029,949 | 1,144,830 |
| Mid-State Trust VII |
| Series 7 Class A (AMBAC) |
| 12/15/2036 | 6.340% | | 1,138,332 | 1,207,904 |
| Mill City Solar Loan Ltd.(a) |
| Series 2019-1A Class A |
| 03/20/2043 | 4.340% | | 1,986,942 | 2,057,648 |
| Series 2019-2GS Class A |
| 07/20/2043 | 3.690% | | 2,124,239 | 2,169,393 |
| Mosaic Solar Loan Trust(a) |
| Series 2019-1A Class A |
| 12/21/2043 | 4.370% | | 2,388,837 | 2,478,673 |
| Subordinated, Series 2018-2GS Class B |
| 02/22/2044 | 4.740% | | 2,500,000 | 2,557,665 |
| Mosaic Solar Loans LLC(a) |
| Series 2017-2A Class A |
| 06/22/2043 | 3.820% | | 1,192,110 | 1,227,384 |
| Mountain View CLO LLC(a),(b) |
| Series 2017-2A Class A |
3-month USD LIBOR + 1.210%
01/16/2031 | 3.532% | | 6,500,000 | 6,442,715 |
| Navient Student Loan Trust(b) |
| Series 2014-2 Class A |
1-month USD LIBOR + 0.640%
Floor 0.640%
03/25/2083 | 2.785% | | 5,486,451 | 5,429,495 |
| Asset-Backed Securities — Non-Agency (continued) |
| Issuer | Coupon
Rate | | Principal
Amount ($) | Value ($) |
| Series 2014-3 Class A |
1-month USD LIBOR + 0.620%
Floor 0.620%
03/25/2083 | 2.765% | | 5,694,095 | 5,600,537 |
| Series 2014-4 Class A |
1-month USD LIBOR + 0.620%
Floor 0.620%
03/25/2083 | 2.765% | | 2,549,724 | 2,485,561 |
| Navient Student Loan Trust(a),(b) |
| Series 2017-1A Class A3 |
1-month USD LIBOR + 1.150%
07/26/2066 | 3.295% | | 3,530,000 | 3,582,652 |
| Series 2017-3A Class A3 |
1-month USD LIBOR + 1.050%
07/26/2066 | 3.195% | | 13,281,000 | 13,347,244 |
| Nelnet Student Loan Trust(a),(b) |
| Series 2014-4A Class A2 |
1-month USD LIBOR + 0.950%
Floor 0.950%
11/25/2048 | 3.095% | | 4,210,000 | 4,163,645 |
| Series 2019-4A Class A |
1-month USD LIBOR + 0.870%
Floor 0.870%
09/26/2067 | 3.039% | | 5,500,000 | 5,502,473 |
| Neuberger Berman CLO XVII Ltd.(a),(b) |
| Series 2014-17A Class CR |
3-month USD LIBOR + 2.650%
04/22/2029 | 4.928% | | 2,000,000 | 1,991,616 |
| Neuberger Berman CLO XVI-S Ltd.(a),(b) |
| Series 2017-16SA Class A |
3-month USD LIBOR + 0.850%
01/15/2028 | 3.153% | | 7,000,000 | 6,986,714 |
| Neuberger Berman Loan Advisers CLO 33 Ltd.(a),(b),(c),(d),(e) |
| Series 2019-33A Class C |
3-month USD LIBOR + 2.450%
10/16/2032 | 0.000% | | 2,000,000 | 2,000,000 |
| NextGear Floorplan Master Owner Trust(a) |
| Series 2016-2A Class A2 |
| 09/15/2021 | 2.190% | | 1,845,000 | 1,844,655 |
| Series 2017-1A Class A2 |
| 04/18/2022 | 2.540% | | 2,990,000 | 2,993,687 |
| Series 2017-2A Class A2 |
| 10/17/2022 | 2.560% | | 595,000 | 596,566 |
| Series 2018-1A Class A2 |
| 02/15/2023 | 3.220% | | 2,230,000 | 2,256,038 |
| OCP CLO Ltd.(a),(b) |
| Series 2017-13A Class A1A |
3-month USD LIBOR + 1.260%
07/15/2030 | 3.563% | | 4,500,000 | 4,492,566 |
The accompanying Notes to Financial Statements are an integral part of this statement.
| 16 | Multi-Manager Total Return Bond Strategies Fund | Annual Report 2019 |
Portfolio of Investments (continued)
August 31, 2019
| Asset-Backed Securities — Non-Agency (continued) |
| Issuer | Coupon
Rate | | Principal
Amount ($) | Value ($) |
| Octagon Investment Partners 25 Ltd.(a),(b) |
| Series 2015-1A Class AR |
3-month USD LIBOR + 0.800%
Floor 0.800%
10/20/2026 | 3.078% | | 5,000,000 | 4,995,635 |
| Octagon Investment Partners 30 Ltd.(a),(b) |
| Series 2017-1A Class A1 |
3-month USD LIBOR + 1.320%
03/17/2030 | 3.598% | | 5,550,000 | 5,563,953 |
| OneMain Direct Auto Receivables Trust(a) |
| Series 2017-1A Class B |
| 06/15/2021 | 2.880% | | 1,577,908 | 1,577,220 |
| Series 2019-1A Class A |
| 09/14/2027 | 3.630% | | 6,900,000 | 7,267,161 |
| Subordinated, Series 2017-2A Class D |
| 10/15/2024 | 3.420% | | 1,200,000 | 1,208,949 |
| Subordinated, Series 2018-1A Class B |
| 04/14/2025 | 3.710% | | 11,400,000 | 11,720,595 |
| Subordinated, Series 2019-1A Class B |
| 11/14/2028 | 3.950% | | 1,500,000 | 1,588,929 |
| OneMain Financial Issuance Trust(a) |
| Series 2018-1A Class A |
| 03/14/2029 | 3.300% | | 13,075,000 | 13,349,836 |
| Subordinated, Series 2017-1A Class B |
| 09/14/2032 | 2.790% | | 1,000,000 | 1,009,286 |
| Subordinated, Series 2017-1A Class C |
| 09/14/2032 | 3.350% | | 800,000 | 824,576 |
| OZLM Funding IV Ltd.(a),(b) |
| Series 2013-4A |
3-month USD LIBOR + 1.250%
10/22/2030 | 3.528% | | 14,000,000 | 13,945,372 |
| Palmer Square CLO Ltd.(a),(b) |
| Series 2014-1A Class A1R2 |
3-month USD LIBOR + 1.130%
Floor 1.130%
01/17/2031 | 3.433% | | 8,000,000 | 7,949,600 |
| Series 2015-2A Class A1AR |
3-month USD LIBOR + 1.270%
07/20/2030 | 3.548% | | 11,750,000 | 11,744,959 |
| Park Avenue Institutional Advisers CLO Ltd.(a),(b) |
| Series 2017-1A Class A1 |
3-month USD LIBOR + 1.220%
11/14/2029 | 3.395% | | 6,000,000 | 5,993,436 |
| Planet Fitness Master Issuer LLC(a) |
| Series 2018-1A Class A2II |
| 09/05/2048 | 4.666% | | 3,999,775 | 4,217,704 |
| Primose Funding LLC(a) |
| Series 2019-1A Class A2 |
| 07/30/2049 | 4.475% | | 1,500,000 | 1,512,945 |
| Asset-Backed Securities — Non-Agency (continued) |
| Issuer | Coupon
Rate | | Principal
Amount ($) | Value ($) |
| Santander Drive Auto Receivables Trust |
| Series 2019-3 Class C |
| 10/15/2025 | 2.490% | | 850,000 | 854,186 |
| Subordinated, Series 2018-2 Class D |
| 02/15/2024 | 3.880% | | 2,060,000 | 2,117,064 |
| Subordinated, Series 2018-5 Class C |
| 12/16/2024 | 3.810% | | 4,660,000 | 4,757,436 |
| Subordinated, Series 2019-2 Class C |
| 10/15/2024 | 2.900% | | 3,320,000 | 3,384,674 |
| Subordinated, Series 2019-2 Class D |
| 07/15/2025 | 3.220% | | 1,750,000 | 1,792,576 |
| Subordinated, Series 2019-3 Class D |
| 10/15/2025 | 2.680% | | 2,200,000 | 2,213,197 |
| Santander Retail Auto Lease Trust(a) |
| Series 2019-A Class B |
| 05/22/2023 | 3.010% | | 1,500,000 | 1,530,273 |
| SCF Equipment Leasing LLC(a) |
| Series 2018-1A Class A2 |
| 10/20/2024 | 3.630% | | 4,684,208 | 4,698,413 |
| Scholar Funding Trust(a),(b) |
| Series 2011-A Class A |
3-month USD LIBOR + 0.900%
Floor 0.900%
10/28/2043 | 3.156% | | 597,941 | 598,343 |
| Shackleton VII CLO Ltd.(a),(b) |
| Series 2015-7RA Class A1 |
3-month USD LIBOR + 1.170%
07/15/2031 | 3.473% | | 10,250,000 | 10,199,201 |
| Shackleton VR CLO Ltd.(a),(b) |
| Series 2014-5RA Class A |
3-month USD LIBOR + 1.100%
05/07/2031 | 3.309% | | 11,000,000 | 10,920,426 |
| Sierra Receivables Funding Co., LLC(a) |
| Series 2017-1A Class A |
| 03/20/2034 | 2.910% | | 536,467 | 544,823 |
| S-Jets Ltd.(a) |
| Series 2017-1 Class A |
| 08/15/2042 | 3.970% | | 2,023,667 | 2,076,945 |
| SLM Student Loan Trust(a),(b) |
| Series 2004-3 Class A6A |
3-month USD LIBOR + 0.550%
Floor 0.550%
10/25/2064 | 2.826% | | 5,120,000 | 5,035,900 |
| SLM Student Loan Trust(b) |
| Series 2008-2 Class A3 |
3-month USD LIBOR + 0.750%
04/25/2023 | 3.026% | | 3,991,857 | 3,950,745 |
The accompanying Notes to Financial Statements are an integral part of this statement.
Multi-Manager Total Return Bond Strategies Fund | Annual Report 2019
| 17 |
Portfolio of Investments (continued)
August 31, 2019
| Asset-Backed Securities — Non-Agency (continued) |
| Issuer | Coupon
Rate | | Principal
Amount ($) | Value ($) |
| Series 2008-2 Class B |
3-month USD LIBOR + 1.200%
Floor 1.200%
01/25/2083 | 3.476% | | 1,165,000 | 1,111,867 |
| Series 2008-3 Class B |
3-month USD LIBOR + 1.200%
Floor 1.200%
04/26/2083 | 3.476% | | 1,165,000 | 1,096,834 |
| Series 2008-4 Class B |
3-month USD LIBOR + 1.850%
Floor 1.850%
04/25/2073 | 4.126% | | 1,165,000 | 1,173,869 |
| Series 2008-5 Class B |
3-month USD LIBOR + 1.850%
Floor 1.850%
07/25/2073 | 4.126% | | 4,060,000 | 4,082,618 |
| Series 2008-6 Class A4 |
3-month USD LIBOR + 1.100%
07/25/2023 | 3.376% | | 5,872,758 | 5,849,616 |
| Series 2008-6 Class B |
3-month USD LIBOR + 1.850%
Floor 1.850%
07/26/2083 | 4.126% | | 1,165,000 | 1,162,461 |
| Series 2008-7 Class B |
3-month USD LIBOR + 1.850%
Floor 1.850%
07/26/2083 | 4.126% | | 1,165,000 | 1,161,738 |
| Series 2008-8 Class B |
3-month USD LIBOR + 2.250%
Floor 2.250%
10/25/2075 | 4.526% | | 1,165,000 | 1,170,848 |
| Series 2008-9 Class B |
3-month USD LIBOR + 2.250%
Floor 2.250%
10/25/2083 | 4.526% | | 1,165,000 | 1,191,219 |
| Series 2011-1 Class A2 |
1-month USD LIBOR + 1.150%
Floor 1.150%
10/25/2034 | 3.295% | | 3,285,000 | 3,321,801 |
| Series 2012-2 Class A |
1-month USD LIBOR + 0.700%
Floor 0.700%
01/25/2029 | 2.845% | | 6,532,609 | 6,385,609 |
| Series 2012-7 Class A3 |
1-month USD LIBOR + 0.650%
Floor 0.650%
05/26/2026 | 2.795% | | 3,211,240 | 3,153,772 |
| SoFi Consumer Loan Program LLC(a) |
| Series 2017-3 Class B |
| 05/25/2026 | 3.850% | | 2,800,000 | 2,877,055 |
| Asset-Backed Securities — Non-Agency (continued) |
| Issuer | Coupon
Rate | | Principal
Amount ($) | Value ($) |
| SoFi Consumer Loan Program Trust(a) |
| Series 2018-2 Class A2 |
| 04/26/2027 | 3.350% | | 9,785,000 | 9,876,472 |
| Subordinated, Series 2019-1 Class D |
| 02/25/2028 | 4.420% | | 4,000,000 | 4,137,704 |
| Subordinated, Series 2019-2 Class D |
| 04/25/2028 | 4.200% | | 3,000,000 | 3,111,949 |
| SoFi Professional Loan Program LLC(a) |
| Series 2016-B Class A2B |
| 10/25/2032 | 2.740% | | 1,544,750 | 1,562,298 |
| Series 2016-C Class A2B |
| 12/27/2032 | 2.360% | | 1,049,913 | 1,054,762 |
| Series 2017-A Class A2B |
| 03/26/2040 | 2.400% | | 805,000 | 809,834 |
| Series 2017-D Class A2FX |
| 09/25/2040 | 2.650% | | 1,500,000 | 1,524,325 |
| Series 2017-E Class A2B |
| 11/26/2040 | 2.720% | | 205,000 | 208,419 |
| Series 2018-A Class A2B |
| 02/25/2042 | 2.950% | | 335,000 | 343,766 |
| Series 2019-A Class BFX |
| 06/15/2048 | 4.110% | | 2,500,000 | 2,784,528 |
| Series 2019-C Class BFX |
| 11/16/2048 | 3.050% | | 1,500,000 | 1,523,778 |
| Subordinated, Series 2018-B Class BFX |
| 08/25/2047 | 3.830% | | 2,700,000 | 2,886,451 |
| Subordinated, Series 2019-B Class BFX |
| 08/17/2048 | 3.730% | | 2,500,000 | 2,664,248 |
| SoFi Professional Loan Program LLC(a),(b) |
| Series 2016-D Class A1 |
1-month USD LIBOR + 0.950%
01/25/2039 | 3.095% | | 206,669 | 207,469 |
| Sound Point CLO II Ltd.(a),(b) |
| Series 2013-1A Class A1R |
3-month USD LIBOR + 1.070%
Floor 1.070%
01/26/2031 | 3.337% | | 6,000,000 | 5,938,038 |
| Sound Point CLO XVI Ltd.(a),(b) |
| Series 2017-2A Class A |
3-month USD LIBOR + 1.280%
07/25/2030 | 3.556% | | 6,250,000 | 6,249,875 |
| Springleaf Funding Trust(a) |
| Series 2016-AA Class A |
| 11/15/2029 | 2.900% | | 4,170,633 | 4,174,660 |
| Series 2017-AA Class A |
| 07/15/2030 | 2.680% | | 4,500,000 | 4,505,597 |
| Subordinated, Series 2017-AA Class B |
| 07/15/2030 | 3.100% | | 600,000 | 604,276 |
The accompanying Notes to Financial Statements are an integral part of this statement.
| 18 | Multi-Manager Total Return Bond Strategies Fund | Annual Report 2019 |
Portfolio of Investments (continued)
August 31, 2019
| Asset-Backed Securities — Non-Agency (continued) |
| Issuer | Coupon
Rate | | Principal
Amount ($) | Value ($) |
| Sunrun Athena Issuer LLC(a) |
| Series 2018-1 Class A |
| 04/30/2049 | 5.310% | | 1,945,670 | 2,162,783 |
| Sunrun Callisto Issuer LLC(a),(d),(e) |
| Series 2019-1A Class A |
| 06/30/2054 | 3.980% | | 1,907,277 | 1,980,570 |
| Synchrony Credit Card Master Note Trust |
| Series 2017-2 Class A |
| 10/15/2025 | 2.620% | | 5,400,000 | 5,527,006 |
| Telos CLO Ltd.(a),(b) |
| Series 2013-4A Class AR |
3-month USD LIBOR + 1.240%
01/17/2030 | 3.543% | | 13,000,000 | 12,932,985 |
| Tesla Auto Lease Trust(a) |
| Series 2018-B Class C |
| 10/20/2021 | 4.360% | | 1,800,000 | 1,841,314 |
| THL Credit Wind River CLO Ltd.(b) |
| Series 2016-1A Class CR |
3-month USD LIBOR + 2.100%
07/15/2028 | 4.403% | | 3,350,000 | 3,299,700 |
| TIAA CLO I Ltd.(a),(b) |
| Series 2016-1A Class AR |
3-month USD LIBOR + 1.200%
07/20/2031 | 3.478% | | 6,750,000 | 6,722,750 |
| TICP CLO I Ltd.(a),(b) |
| Series 2015-1A Class BR |
3-month USD LIBOR + 1.300%
07/20/2027 | 3.578% | | 10,000,000 | 9,960,170 |
| TICP CLO IX Ltd.(a),(b) |
| Series 2017-9A Class A |
3-month USD LIBOR + 1.140%
01/20/2031 | 3.418% | | 10,000,000 | 9,931,770 |
| Trinitas CLO VI Ltd.(a),(b) |
| Series 2017-6A Class A |
3-month USD LIBOR + 1.320%
07/25/2029 | 3.596% | | 6,000,000 | 6,000,528 |
| Trinitas CLO VII Ltd.(a),(b) |
| Series 2017-7A Class B |
3-month USD LIBOR + 1.600%
01/25/2031 | 3.876% | | 9,000,000 | 8,858,547 |
| Voya CLO Ltd.(a),(b) |
| Series 2013-1A Class A1AR |
3-month USD LIBOR + 1.210%
10/15/2030 | 3.513% | | 7,500,000 | 7,496,602 |
| Series 2016-1A Class A1R |
3-month USD LIBOR + 1.070%
Floor 1.007%
01/20/2031 | 3.348% | | 10,000,000 | 9,936,050 |
| Asset-Backed Securities — Non-Agency (continued) |
| Issuer | Coupon
Rate | | Principal
Amount ($) | Value ($) |
| Voya Ltd.(a),(b) |
| Series 2012-4A Class A1R |
3-month USD LIBOR + 1.450%
10/15/2028 | 3.753% | | 7,000,000 | 7,006,755 |
| Wachovia Student Loan Trust(a),(b) |
| Series 2006-1 Class A6 |
3-month USD LIBOR + 0.170%
Floor 0.170%
04/25/2040 | 2.446% | | 8,696,756 | 8,399,439 |
| Wellfleet CLO Ltd.(a),(b) |
| Series 2018-1A Class SUB |
3-month USD LIBOR + 1.100%
Floor 1.100%
07/17/2031 | 3.403% | | 17,000,000 | 16,871,888 |
| Wendy’s Funding LLC(a) |
| Series 2018-1A Class A2II |
| 03/15/2048 | 3.884% | | 985,000 | 1,021,543 |
| Series 2019-1A Class A2I |
| 06/15/2049 | 3.783% | | 3,450,000 | 3,565,540 |
| Westlake Automobile Receivables Trust(a) |
| Series 2019-1A Class B |
| 10/17/2022 | 3.260% | | 4,525,000 | 4,580,970 |
| Subordinated, Series 2019-2A Class B |
| 07/15/2024 | 2.620% | | 6,300,000 | 6,337,155 |
| World Financial Network Credit Card Master Trust |
| Series 2015-B Class A |
| 06/17/2024 | 2.550% | | 5,030,000 | 5,052,593 |
| York CLO-6 Ltd.(a),(b) |
| Series 2019-1A Class A1 |
3-month USD LIBOR + 1.350%
07/22/2032 | 3.516% | | 7,000,000 | 6,997,823 |
| Zais CLO 7 Ltd.(a),(b) |
| Series 2017-2A Class A |
3-month USD LIBOR + 1.290%
04/15/2030 | 3.593% | | 4,000,000 | 3,969,600 |
| Zais CLO 8 Ltd.(a),(b) |
| Series 2018-1A Class A |
3-month USD LIBOR + 0.950%
04/15/2029 | 3.253% | | 5,500,000 | 5,447,750 |
| Zais CLO 9 Ltd.(a),(b) |
| Series 2018-2A Class A |
3-month USD LIBOR + 1.200%
07/20/2031 | 3.478% | | 13,000,000 | 12,843,467 |
Total Asset-Backed Securities — Non-Agency
(Cost $989,354,915) | 996,281,879 |
|
| Commercial Mortgage-Backed Securities - Agency 2.9% |
| | | | |
| Federal Home Loan Mortgage Corp. |
| 01/01/2027 | 3.275% | | 2,930,391 | 3,153,891 |
| 08/01/2031 | 3.513% | | 2,754,273 | 3,013,500 |
The accompanying Notes to Financial Statements are an integral part of this statement.
Multi-Manager Total Return Bond Strategies Fund | Annual Report 2019
| 19 |
Portfolio of Investments (continued)
August 31, 2019
| Commercial Mortgage-Backed Securities - Agency (continued) |
| Issuer | Coupon
Rate | | Principal
Amount ($) | Value ($) |
| Federal Home Loan Mortgage Corp. Multifamily Structured Pass-Through Certificates(f),(g) |
| CMO Series K028 Class X1 |
| 02/25/2023 | 0.403% | | 120,198,813 | 989,982 |
| CMO Series K055 Class X1 |
| 03/25/2026 | 1.499% | | 28,425,264 | 2,156,477 |
| CMO Series K057 Class X1 |
| 07/25/2026 | 1.324% | | 2,505,648 | 169,409 |
| CMO Series K059 Class X1 |
| 09/25/2026 | 0.435% | | 7,359,198 | 143,016 |
| CMO Series K060 Class X1 |
| 10/25/2026 | 0.197% | | 26,649,323 | 172,648 |
| CMO Series K152 Class X1 |
| 01/25/2031 | 1.102% | | 4,264,531 | 354,653 |
| CMO Series K718 Class X1 |
| 01/25/2022 | 0.729% | | 21,700,121 | 269,828 |
| Series K069 Class X1 |
| 09/25/2027 | 0.496% | | 39,464,106 | 1,100,042 |
| Series K091 Class X1 |
| 03/25/2029 | 0.704% | | 39,987,614 | 1,938,963 |
| Series K095 Class X1 |
| 06/25/2029 | 1.083% | | 53,325,000 | 4,249,229 |
| Series K728 Class X1 |
| 08/25/2024 | 0.531% | | 289,142,859 | 5,143,765 |
| Series K729 Class X1 |
| 10/25/2024 | 0.491% | | 182,238,573 | 2,922,141 |
| Series K735 Class X1 |
| 05/25/2026 | 1.103% | | 13,598,969 | 779,419 |
| Federal Home Loan Mortgage Corp. Multifamily Structured Pass-Through Certificates |
| Series K056 Class A2 |
| 05/25/2026 | 2.525% | | 6,137,000 | 6,371,605 |
| Series K074 Class A2 |
| 01/25/2028 | 3.600% | | 8,660,000 | 9,687,099 |
| Series K155 Class A3 |
| 04/25/2033 | 3.750% | | 6,935,000 | 8,041,552 |
| Series KJ18 Class A1 |
| 03/25/2022 | 2.455% | | 1,918,909 | 1,930,862 |
| Federal Home Loan Mortgage Corp. Multifamily Structured Pass-Through Certificates(f) |
| Series K157 Class A3 |
| 08/25/2033 | 3.990% | | 6,145,000 | 7,297,483 |
| Series K158 Class A3 |
| 10/25/2033 | 3.900% | | 4,385,000 | 5,160,020 |
| Federal National Mortgage Association |
| 04/01/2027 | 3.320% | | 3,771,000 | 4,113,228 |
| 03/01/2028 | 3.690% | | 4,103,050 | 4,545,567 |
| 05/01/2028 | 2.780% | | 2,106,912 | 2,223,599 |
| 05/01/2028 | 3.010% | | 3,067,257 | 3,284,339 |
| 11/01/2028 | 2.810% | | 1,736,000 | 1,839,716 |
| Commercial Mortgage-Backed Securities - Agency (continued) |
| Issuer | Coupon
Rate | | Principal
Amount ($) | Value ($) |
| 02/01/2029 | 4.140% | | 6,432,004 | 7,497,617 |
| 06/01/2029 | 3.210% | | 10,500,000 | 11,442,822 |
| 08/01/2029 | 3.245% | | 10,775,539 | 11,810,609 |
| 09/01/2029 | 3.180% | | 14,365,000 | 15,654,898 |
| 10/01/2029 | 3.200% | | 8,490,025 | 9,283,974 |
| 11/01/2029 | 3.100% | | 7,940,000 | 8,643,540 |
| 12/01/2029 | 3.090% | | 2,968,689 | 3,223,694 |
| 02/01/2030 | 3.370% | | 11,908,521 | 13,139,123 |
| 06/01/2030 | 3.710% | | 6,650,000 | 7,548,079 |
| 11/01/2030 | 3.820% | | 9,109,000 | 10,504,481 |
| 11/01/2031 | 2.770% | | 5,262,350 | 5,563,890 |
| 11/01/2031 | 3.400% | | 1,500,000 | 1,626,973 |
| 10/01/2032 | 3.180% | | 6,016,921 | 6,630,987 |
| 01/01/2037 | 3.610% | | 4,490,391 | 5,057,797 |
| 11/01/2037 | 3.210% | | 7,144,836 | 7,758,218 |
| Federal National Mortgage Association(f) |
| Series 2013-M6 Class 1AC |
| 02/25/2043 | 3.670% | | 5,225,000 | 5,685,899 |
| Government National Mortgage Association(f),(g) |
| CMO Series 2011-38 Class IO |
| 04/16/2053 | 0.099% | | 8,858,155 | 171,815 |
| CMO Series 2013-162 Class IO |
| 09/16/2046 | 0.717% | | 80,473,116 | 2,310,649 |
| CMO Series 2014-134 Class IA |
| 01/16/2055 | 0.584% | | 23,748,346 | 519,398 |
| CMO Series 2015-101 Class IO |
| 03/16/2052 | 0.824% | | 15,837,349 | 813,371 |
| CMO Series 2015-114 |
| 03/15/2057 | 0.935% | | 4,307,307 | 247,088 |
| CMO Series 2015-120 Class IO |
| 03/16/2057 | 0.855% | | 18,567,424 | 1,018,874 |
| CMO Series 2015-125 Class IB |
| 01/16/2055 | 1.285% | | 59,258,759 | 3,262,894 |
| CMO Series 2015-125 Class IO |
| 07/16/2055 | 0.782% | | 46,183,347 | 2,029,001 |
| CMO Series 2015-146 Class IC |
| 07/16/2055 | 0.844% | | 38,090,308 | 1,693,548 |
| CMO Series 2015-171 Class IO |
| 11/16/2055 | 0.869% | | 12,907,546 | 709,594 |
| CMO Series 2015-174 Class IO |
| 11/16/2055 | 0.939% | | 51,966,333 | 2,659,003 |
| CMO Series 2015-21 Class IO |
| 07/16/2056 | 0.928% | | 12,404,166 | 660,464 |
| CMO Series 2015-29 Class EI |
| 09/16/2049 | 0.750% | | 34,093,376 | 1,568,912 |
| CMO Series 2015-41 Class IO |
| 09/16/2056 | 0.622% | | 5,335,793 | 235,899 |
| CMO Series 2015-6 Class IO |
| 02/16/2051 | 0.719% | | 14,608,532 | 674,150 |
The accompanying Notes to Financial Statements are an integral part of this statement.
| 20 | Multi-Manager Total Return Bond Strategies Fund | Annual Report 2019 |
Portfolio of Investments (continued)
August 31, 2019
| Commercial Mortgage-Backed Securities - Agency (continued) |
| Issuer | Coupon
Rate | | Principal
Amount ($) | Value ($) |
| CMO Series 2015-70 Class IO |
| 12/16/2049 | 1.030% | | 20,830,230 | 1,263,772 |
| CMO Series 2016-39 Class IO |
| 01/16/2056 | 0.828% | | 7,134,696 | 386,396 |
| Series 2014-101 Class IO |
| 04/16/2056 | 0.817% | | 45,799,528 | 2,193,765 |
| Series 2016-152 Class IO |
| 08/15/2058 | 0.915% | | 21,540,913 | 1,569,428 |
| Series 2017-168 Class IO |
| 12/16/2059 | 0.657% | | 34,161,500 | 2,001,867 |
| Series 2018-110 Class IA |
| 11/16/2059 | 0.737% | | 50,258,061 | 3,004,397 |
| Series 2018-2 Class IO |
| 12/16/2059 | 0.786% | | 17,234,265 | 1,178,931 |
| Government National Mortgage Association(b) |
| CMO Series 2013-H08 Class FA |
1-month USD LIBOR + 0.350%
Floor 0.350%, Cap 10.550%
03/20/2063 | 2.730% | | 586,454 | 585,000 |
| Government National Mortgage Association(f) |
| Series 2003-88 Class Z |
| 03/16/2046 | 4.498% | | 692,198 | 730,153 |
Total Commercial Mortgage-Backed Securities - Agency
(Cost $231,290,747) | 243,613,003 |
|
| Commercial Mortgage-Backed Securities - Non-Agency 6.9% |
| | | | |
| 1211 Avenue of the Americas Trust(a) |
| Series 2015-1211 Class A1A2 |
| 08/10/2035 | 3.901% | | 2,130,000 | 2,335,027 |
| Banc of America Merrill Lynch Commercial Mortgage, Inc.(f),(g) |
| Series 2019-BN18 Class XA |
| 05/15/2062 | 1.052% | | 60,558,556 | 4,472,522 |
| BANK(f),(g) |
| Series 2017-BNK8 Class XA |
| 11/15/2050 | 0.881% | | 32,503,058 | 1,674,496 |
| BANK |
| Series 2019-BN17 Class A4 |
| 04/15/2052 | 3.714% | | 2,260,000 | 2,534,399 |
| BANK(a) |
| Subordinated, Series 2017-BNK6 Class D |
| 07/15/2060 | 3.100% | | 2,380,000 | 2,213,891 |
| BBCMS Mortgage Trust(a) |
| Series 2013-TYSN Class A2 |
| 09/05/2032 | 3.756% | | 2,000,000 | 2,021,207 |
| Subordinated, Series 2016-ETC Class A |
| 08/14/2036 | 2.937% | | 13,500,000 | 14,024,452 |
| Subordinated, Series 2016-ETC Class B |
| 08/14/2036 | 3.189% | | 900,000 | 923,392 |
| Commercial Mortgage-Backed Securities - Non-Agency (continued) |
| Issuer | Coupon
Rate | | Principal
Amount ($) | Value ($) |
| Subordinated, Series 2016-ETC Class C |
| 08/14/2036 | 3.391% | | 770,000 | 790,047 |
| BBCMS Mortgage Trust(a),(f) |
| Series 2016-ETC Class D |
| 08/14/2036 | 3.729% | | 2,790,000 | 2,857,189 |
| BBCMS Mortgage Trust(f),(g) |
| Series 2018-C2 Class XA |
| 12/15/2051 | 0.938% | | 61,894,182 | 3,759,186 |
| BB-UBS Trust(a) |
| Series 2012-TFT Class A |
| 06/05/2030 | 2.892% | | 6,260,000 | 6,258,481 |
| Benchmark Mortgage Trust |
| Series 2018-B2 Class A4 |
| 02/15/2051 | 3.615% | | 27,000,000 | 29,639,812 |
| Series 2018-B8 Class A5 |
| 01/15/2052 | 4.232% | | 3,500,000 | 4,055,704 |
| Series 2019-B11 Class A5 |
| 05/15/2052 | 3.542% | | 2,320,000 | 2,573,776 |
| Benchmark Mortgage Trust(f),(g) |
| Series 2019-B10 Class XA |
| 03/15/2062 | 1.395% | | 30,088,446 | 2,849,487 |
| Benchmark Mortgage Trust(f) |
| Subordinated, Series 2018-B8 Class C |
| 01/15/2052 | 5.037% | | 3,000,000 | 3,472,646 |
| BXP Trust(a),(f) |
| Subordinated, Series 2017-GM Class D |
| 06/13/2039 | 3.539% | | 2,500,000 | 2,627,440 |
| CALI Mortgage Trust(a) |
| Series 2019-101C Class A |
| 03/10/2039 | 3.957% | | 2,380,000 | 2,710,680 |
| CD Mortgage Trust |
| Series 2016-CD1 Class A3 |
| 08/10/2049 | 2.459% | | 17,000,000 | 17,312,926 |
| Series 2017-CD6 Class A3 |
| 11/13/2050 | 3.104% | | 10,000,000 | 10,478,201 |
| Series 2017-CD6 Class A4 |
| 11/13/2050 | 3.190% | | 20,000,000 | 21,427,758 |
| CD Mortgage Trust(f) |
| Series 2019-CD8 Class XA |
| 08/15/2057 | 1.554% | | 69,479,000 | 8,071,834 |
| CFCRE Commercial Mortgage Trust |
| Series 2016-C4 Class A4 |
| 05/10/2058 | 3.283% | | 5,900,000 | 6,255,580 |
| CFCRE Commercial Mortgage Trust(f),(g) |
| Series 2016-C4 Class XA |
| 05/10/2058 | 1.878% | | 63,195,474 | 5,657,979 |
| CGRBS Commercial Mortgage Trust(a) |
| Series 2013-VNO5 Class A |
| 03/13/2035 | 3.369% | | 2,020,000 | 2,132,095 |
The accompanying Notes to Financial Statements are an integral part of this statement.
Multi-Manager Total Return Bond Strategies Fund | Annual Report 2019
| 21 |
Portfolio of Investments (continued)
August 31, 2019
| Commercial Mortgage-Backed Securities - Non-Agency (continued) |
| Issuer | Coupon
Rate | | Principal
Amount ($) | Value ($) |
| Citigroup Commercial Mortgage Trust |
| Series 2015-GC35 Class A3 |
| 11/10/2048 | 3.549% | | 10,000,000 | 10,710,056 |
| Series 2016-GC37 Class A4 |
| 04/10/2049 | 3.314% | | 8,000,000 | 8,558,142 |
| Citigroup Commercial Mortgage Trust(a) |
| Subordinated, Series 2016-C2 Class E |
| 08/10/2049 | 4.594% | | 2,420,000 | 2,141,757 |
| Citigroup Commercial Mortgage Trust(f) |
| Subordinated, Series 2016-P5 Class C |
| 10/10/2049 | 4.464% | | 2,610,000 | 2,763,962 |
| Citigroup Commercial Mortgage Trust(a),(f) |
| Subordinated, Series 2018-C6 Class D |
| 11/10/2051 | 5.067% | | 1,240,000 | 1,363,289 |
| CityLine Commercial Mortgage Trust(a),(f) |
| Subordinated, Series 2016-CLNE Class B |
| 11/10/2031 | 2.871% | | 3,600,000 | 3,654,216 |
| Subordinated, Series 2016-CLNE Class C |
| 11/10/2031 | 2.871% | | 1,350,000 | 1,355,392 |
| COMM Mortgage Trust(a) |
| Series 2013-CR7 Class AM |
| 03/10/2046 | 3.314% | | 4,250,000 | 4,404,717 |
| COMM Mortgage Trust |
| Series 2013-CR8 Class A4 |
| 06/10/2046 | 3.334% | | 1,681,997 | 1,747,596 |
| Series 2018-COR3 Class A3 |
| 05/10/2051 | 4.228% | | 3,870,000 | 4,445,293 |
| Commercial Mortgage Pass-Through Certificates(a) |
| Series 2012-LTRT Class A2 |
| 10/05/2030 | 3.400% | | 3,793,000 | 3,870,093 |
| Commercial Mortgage Trust |
| Series 2013-CR13 Class A3 |
| 11/12/2046 | 3.928% | | 2,651,784 | 2,846,165 |
| Series 2014-UBS2 Class A5 |
| 03/10/2047 | 3.961% | | 1,165,000 | 1,255,524 |
| Series 2014-UBS4 Class A5 |
| 08/10/2047 | 3.694% | | 5,000,000 | 5,375,919 |
| Series 2014-UBS6 Class A4 |
| 12/10/2047 | 3.378% | | 3,605,000 | 3,828,228 |
| Series 2015-CR26 Class A4 |
| 10/10/2048 | 3.630% | | 1,600,000 | 1,733,939 |
| Series 2015-DC1 Class A5 |
| 02/10/2048 | 3.350% | | 18,924,000 | 20,078,909 |
| Series 2015-LC19 Class A4 |
| 02/10/2048 | 3.183% | | 835,000 | 881,591 |
| Series 2015-PC1 Class A5 |
| 07/10/2050 | 3.902% | | 2,755,000 | 3,009,901 |
| Commercial Mortgage-Backed Securities - Non-Agency (continued) |
| Issuer | Coupon
Rate | | Principal
Amount ($) | Value ($) |
| Series 2016-COR1 Class A3 |
| 10/10/2049 | 2.826% | | 8,500,000 | 8,811,099 |
| Series 2016-DC2 Class A5 |
| 02/10/2049 | 3.765% | | 4,832,000 | 5,279,167 |
| Commercial Mortgage Trust(f) |
| Series 2013-CR9 Class A4 |
| 07/10/2045 | 4.373% | | 2,427,625 | 2,618,074 |
| Commercial Mortgage Trust(a),(f) |
| Series 2016-667M Class C |
| 10/10/2036 | 3.285% | | 6,770,000 | 6,885,980 |
| Commercial Mortgage Trust(a) |
| Series 2016-787S Class A |
| 02/10/2036 | 3.545% | | 2,115,000 | 2,276,260 |
| Core Industrial Trust(a),(f) |
| Subordinated, Series 2015-TEXW Class E |
| 02/10/2034 | 3.977% | | 1,000,000 | 1,032,583 |
| CoreVest American Finance Trust(a) |
| Series 2017-1 Class A |
| 10/15/2049 | 2.968% | | 1,659,456 | 1,685,920 |
| Credit Suisse Mortgage Capital Certificates(a),(b) |
| Series 2019-ICE4 Class F |
1-month USD LIBOR + 2.650%
Floor 2.650%
05/15/2036 | 4.845% | | 3,660,000 | 3,671,429 |
| Credit Suisse Mortgage Capital Trust(a) |
| Series 2014-USA Class A2 |
| 09/15/2037 | 3.953% | | 13,780,000 | 14,920,812 |
| CSAIL Commercial Mortgage Trust(f) |
| Series 2017-CX9 Class A5 |
| 09/15/2050 | 3.446% | | 3,270,000 | 3,535,973 |
| Subordinated, Series 2017-C8 Class C |
| 06/15/2050 | 4.465% | | 3,960,000 | 4,194,114 |
| CSAIL Commercial Mortgage Trust |
| Series 2018-CX11 Class A5 |
| 04/15/2051 | 4.033% | | 5,940,000 | 6,722,109 |
| Series 2019-C15 Class A4 |
| 03/15/2052 | 4.053% | | 2,324,000 | 2,647,437 |
| DBGS Mortgage Trust(a),(b) |
| Series 2018-BIOD Class E |
1-month USD LIBOR + 1.700%
Floor 1.700%
05/15/2035 | 3.895% | | 2,784,417 | 2,781,925 |
| Series 2018-BIOD Class F |
1-month USD LIBOR + 2.000%
Floor 2.000%
05/15/2035 | 4.195% | | 10,952,039 | 10,942,039 |
| DBUBS Mortgage Trust(a) |
| Series 2017-BRBK Class A |
| 10/10/2034 | 3.452% | | 2,800,000 | 2,970,178 |
The accompanying Notes to Financial Statements are an integral part of this statement.
| 22 | Multi-Manager Total Return Bond Strategies Fund | Annual Report 2019 |
Portfolio of Investments (continued)
August 31, 2019
| Commercial Mortgage-Backed Securities - Non-Agency (continued) |
| Issuer | Coupon
Rate | | Principal
Amount ($) | Value ($) |
| DBUBS Mortgage Trust(a),(f) |
| Subordinated, Series 2011-LC2A Class E |
| 07/10/2044 | 5.714% | | 1,900,000 | 1,930,833 |
| DBWF Mortgage Trust(a),(f) |
| Series 2016-85T Class D |
| 12/10/2036 | 3.935% | | 2,000,000 | 2,097,950 |
| Series 2016-85T Class E |
| 12/10/2036 | 3.935% | | 2,000,000 | 2,015,306 |
| GS Mortgage Securities Trust |
| Series 2016-GS2 Class A3 |
| 05/10/2049 | 2.791% | | 4,500,000 | 4,666,792 |
| Series 2017-GS7 Class A3 |
| 08/10/2050 | 3.167% | | 10,000,000 | 10,677,256 |
| Series 2017-GS8 Class A3 |
| 11/10/2050 | 3.205% | | 20,000,000 | 21,354,058 |
| GS Mortgage Securities Trust(a),(f) |
| Subordinated, Series 2019-GC40 Class DBD |
| 07/10/2052 | 3.668% | | 4,090,000 | 4,153,904 |
| Subordinated, Series 2019-GC40 Class DBE |
| 07/10/2052 | 3.668% | | 3,132,000 | 3,106,314 |
| Hudson Yards Mortgage Trust(a) |
| Series 2019-30HY Class A |
| 07/10/2039 | 3.228% | | 2,160,000 | 2,318,195 |
| Hudsons Bay Simon JV Trust(a) |
| Series 2015-HB10 Class A10 |
| 08/05/2034 | 4.155% | | 1,820,000 | 1,922,814 |
| Series 2015-HB7 Class A7 |
| 08/05/2034 | 3.914% | | 2,520,000 | 2,584,741 |
| IMT Trust(a) |
| Series 2017-APTS Class AFX |
| 06/15/2034 | 3.478% | | 5,410,000 | 5,716,532 |
| Irvine Core Office Trust(a) |
| Series 2013-IRV Class A1 |
| 05/15/2048 | 2.068% | | 1,046,798 | 1,047,259 |
| JPMBB Commercial Mortgage Securities Trust |
| Series 2013-C14 Class A4 |
| 08/15/2046 | 4.133% | | 3,430,000 | 3,695,067 |
| Series 2014-C26 Class A3 |
| 01/15/2048 | 3.231% | | 360,000 | 379,917 |
| JPMBB Commercial Mortgage Securities Trust(a) |
| Subordinated, Series 2014-C26 Class E |
| 01/15/2048 | 4.000% | | 2,480,000 | 2,129,519 |
| JPMCC Commercial Mortgage Securities Trust |
| Series 2019-COR4 Class A5 |
| 03/10/2052 | 4.029% | | 3,870,000 | 4,417,925 |
| JPMDB Commercial Mortgage Securities Trust |
| Series 2016-C4 Class A2 |
| 12/15/2049 | 2.882% | | 8,500,000 | 8,896,820 |
| Commercial Mortgage-Backed Securities - Non-Agency (continued) |
| Issuer | Coupon
Rate | | Principal
Amount ($) | Value ($) |
| JPMDB Commercial Mortgage Securities Trust(f) |
| Subordinated, Series 2016-C4 Class C |
| 12/15/2049 | 3.220% | | 1,436,000 | 1,441,893 |
| JPMorgan Chase Commercial Mortgage Securities Trust(a),(f) |
| Series 2011-C5 Class E |
| 08/15/2046 | 4.000% | | 1,611,000 | 1,576,949 |
| Series 2016-NINE Class A |
| 10/06/2038 | 2.854% | | 3,235,000 | 3,377,418 |
| JPMorgan Chase Commercial Mortgage Securities Trust(a) |
| Series 2012-HSBC Class A |
| 07/05/2032 | 3.093% | | 484,991 | 500,548 |
| Series 2019-OSB Class A |
| 06/05/2039 | 3.397% | | 2,110,000 | 2,310,822 |
| JPMorgan Chase Commercial Mortgage Securities Trust |
| Series 2013-C13 Class A4 |
| 01/15/2046 | 3.991% | | 4,254,882 | 4,534,524 |
| JPMorgan Chase Commercial Mortgage Securities Trust(f) |
| Subordinated, Series 2014-C20 Class B |
| 07/15/2047 | 4.399% | | 2,000,000 | 2,142,780 |
| Ladder Capital Commercial Mortgage(a) |
| Series 2017-LC26 Class A4 |
| 07/12/2050 | 3.551% | | 4,500,000 | 4,847,768 |
| LSTAR Commercial Mortgage Trust(a) |
| Series 2017-5 Class A4 |
| 03/10/2050 | 3.390% | | 800,000 | 841,119 |
| Madison Avenue Trust(a) |
| Series 2013-650M Class A |
| 10/12/2032 | 3.843% | | 2,705,000 | 2,738,684 |
| Morgan Stanley Bank of America Merrill Lynch Trust |
| Series 2013-C12 Class A4 |
| 10/15/2046 | 4.259% | | 1,885,000 | 2,039,824 |
| Series 2015-C21 Class A3 |
| 03/15/2048 | 3.077% | | 525,000 | 549,209 |
| Series 2016-C29 Class ASB |
| 05/15/2049 | 3.140% | | 1,000,000 | 1,039,488 |
| Morgan Stanley Bank of America Merrill Lynch Trust(a),(f) |
| Subordinated, Series 2013-C13 Class E |
| 11/15/2046 | 5.071% | | 1,000,000 | 938,994 |
| Subordinated, Series 2014-C14 Class D |
| 02/15/2047 | 5.100% | | 2,890,600 | 2,974,794 |
| Morgan Stanley Bank of America Merrill Lynch Trust(a) |
| Subordinated, Series 2014-C18 Class D |
| 10/15/2047 | 3.389% | | 5,670,000 | 5,308,062 |
| Morgan Stanley Bank of America Merrill Lynch Trust(f) |
| Subordinated, Series 2017-C34 Class C |
| 11/15/2052 | 4.325% | | 2,840,000 | 3,044,750 |
| Morgan Stanley Capital I Trust |
| Series 2016-UB11 Class A3 |
| 08/15/2049 | 2.531% | | 8,500,000 | 8,719,185 |
The accompanying Notes to Financial Statements are an integral part of this statement.
Multi-Manager Total Return Bond Strategies Fund | Annual Report 2019
| 23 |
Portfolio of Investments (continued)
August 31, 2019
| Commercial Mortgage-Backed Securities - Non-Agency (continued) |
| Issuer | Coupon
Rate | | Principal
Amount ($) | Value ($) |
| Series 2019-H6 Class A4 |
| 06/15/2052 | 3.417% | | 2,324,000 | 2,540,979 |
| Morgan Stanley Capital I Trust(a),(f) |
| Subordinated, Series 2016-BNK2 Class E |
| 11/15/2049 | 4.037% | | 1,870,000 | 1,557,134 |
| Morgan Stanley Capital I Trust(f) |
| Subordinated, Series 2017-HR2 Class C |
| 12/15/2050 | 4.367% | | 2,750,000 | 2,982,686 |
| Prima Capital CRE Securitization(a) |
| Series 2019-RK1 Class BD |
| 04/15/2038 | 3.500% | | 5,000,000 | 4,984,011 |
| Subordinated, Series 2019-RK1 Class CD |
| 04/15/2038 | 3.500% | | 3,900,000 | 3,830,468 |
| RBS Commercial Funding, Inc., Trust(a),(f) |
| Series 2013-GSP Class A |
| 01/15/2032 | 3.961% | | 2,420,000 | 2,566,664 |
| SG Commercial Mortgage Securities Trust |
| Series 2016-C5 Class A4 |
| 10/10/2048 | 3.055% | | 5,120,000 | 5,388,996 |
| SLIDE(a),(b) |
| Series 2018-FUN Class F |
1-month USD LIBOR + 3.000%
Floor 3.000%
06/15/2031 | 5.195% | | 2,438,479 | 2,450,669 |
| Starwood Retail Property Trust(a),(b) |
| Series 2014-STAR Class A |
1-month USD LIBOR + 1.220%
Floor 1.220%
11/15/2027 | 3.666% | | 2,473,381 | 2,468,075 |
| UBS Commercial Mortgage Trust |
| Series 2018-C10 Class A3 |
| 05/15/2051 | 4.048% | | 5,500,000 | 6,266,984 |
| Series 2018-C8 Class A3 |
| 02/15/2051 | 3.720% | | 27,000,000 | 29,974,747 |
| UBS-Barclays Commercial Mortgage Trust |
| Series 2012-C4 Class A5 |
| 12/10/2045 | 2.850% | | 2,583,582 | 2,650,079 |
| Series 2013-C5 Class A4 |
| 03/10/2046 | 3.185% | | 2,740,000 | 2,841,002 |
| Series 2013-C6 Class A4 |
| 04/10/2046 | 3.244% | | 1,935,000 | 2,013,204 |
| UBS-Barclays Commercial Mortgage Trust(a),(f) |
| Subordinated, Series 2013-C5 Class C |
| 03/10/2046 | 4.211% | | 5,000,000 | 5,155,846 |
| Wells Fargo Commercial Mortgage Trust |
| Series 2015-LC20 Class A4 |
| 04/15/2050 | 2.925% | | 1,965,000 | 2,041,686 |
| Series 2018-C44 Class A5 |
| 05/15/2051 | 4.212% | | 2,700,000 | 3,092,260 |
| Commercial Mortgage-Backed Securities - Non-Agency (continued) |
| Issuer | Coupon
Rate | | Principal
Amount ($) | Value ($) |
| Series 2018-C45 Class A3 |
| 06/15/2051 | 3.920% | | 20,000,000 | 22,488,124 |
| Wells Fargo Commercial Mortgage Trust(a),(b) |
| Subordinated, Series 2018-BXI Class F |
1-month USD LIBOR + 2.457%
Floor 2.457%
12/15/2036 | 4.652% | | 5,371,811 | 5,398,685 |
| WF-RBS Commercial Mortgage Trust |
| Series 2013-C18 Class A2 |
| 12/15/2046 | 3.027% | | 8,973 | 9,050 |
| Series 2014-C24 Class A3 |
| 11/15/2047 | 3.428% | | 1,345,000 | 1,365,081 |
| WF-RBS Commercial Mortgage Trust(a),(f) |
| Subordinated, Series 2014-LC14 Class D |
| 03/15/2047 | 4.586% | | 4,350,000 | 4,277,444 |
Total Commercial Mortgage-Backed Securities - Non-Agency
(Cost $551,536,828) | 576,511,882 |
| Common Stocks 0.0% |
| Issuer | Shares | Value ($) |
| Energy 0.0% |
| Oil, Gas & Consumable Fuels 0.0% |
| Prairie Provident Resources, Inc.(e),(h) | 1,728 | 80 |
| Total Energy | 80 |
Total Common Stocks
(Cost $7,496) | 80 |
| Corporate Bonds & Notes 31.8% |
| Issuer | Coupon
Rate | | Principal
Amount ($) | Value ($) |
| Aerospace & Defense 0.4% |
| Airbus Finance BV(a) |
| 04/17/2023 | 2.700% | | 1,548,000 | 1,584,742 |
| Boeing Co. (The) |
| 03/01/2039 | 3.500% | | 350,000 | 374,919 |
| 02/01/2050 | 3.750% | | 5,905,000 | 6,562,652 |
| Bombardier, Inc.(a) |
| 12/01/2021 | 8.750% | | 130,000 | 141,215 |
| 12/01/2024 | 7.500% | | 2,850,000 | 2,840,871 |
| 03/15/2025 | 7.500% | | 3,275,000 | 3,195,342 |
| 04/15/2027 | 7.875% | | 2,575,000 | 2,492,059 |
| Embraer Netherlands Finance BV |
| 06/15/2025 | 5.050% | | 1,550,000 | 1,698,242 |
| General Dynamics Corp. |
| 05/11/2021 | 3.000% | | 9,065,000 | 9,237,761 |
| L3Harris Technologies, Inc.(a) |
| 06/15/2028 | 4.400% | | 4,990,000 | 5,656,070 |
The accompanying Notes to Financial Statements are an integral part of this statement.
| 24 | Multi-Manager Total Return Bond Strategies Fund | Annual Report 2019 |
Portfolio of Investments (continued)
August 31, 2019
| Corporate Bonds & Notes (continued) |
| Issuer | Coupon
Rate | | Principal
Amount ($) | Value ($) |
| Northrop Grumman Corp. |
| 10/15/2047 | 4.030% | | 435,000 | 503,591 |
| Spirit AeroSystems, Inc. |
| 06/15/2028 | 4.600% | | 852,000 | 934,869 |
| Textron, Inc. |
| 03/01/2024 | 4.300% | | 690,000 | 741,905 |
| 03/01/2025 | 3.875% | | 300,000 | 318,362 |
| TransDigm, Inc. |
| 05/15/2025 | 6.500% | | 175,000 | 182,507 |
| Total | 36,465,107 |
| Agencies 0.0% |
| Israel Government AID Bond(i) |
| 03/15/2022 | 0.000% | | 2,025,000 | 1,923,902 |
| 11/15/2025 | 0.000% | | 1,600,000 | 1,412,760 |
| Total | 3,336,662 |
| Airlines 0.3% |
| American Airlines Pass-Through Trust |
| 01/15/2023 | 4.950% | | 516,473 | 543,801 |
| Series 2015-2 Class B |
| 09/22/2023 | 4.400% | | 2,432,995 | 2,487,117 |
| Series 2016-1 Class B |
| 01/15/2024 | 5.250% | | 318,417 | 340,385 |
| Series 2016-2 Class AA |
| 06/15/2028 | 3.200% | | 973,470 | 1,007,053 |
| Series 2019-1 Class A |
| 02/15/2032 | 3.500% | | 350,000 | 360,606 |
| Series 2019-1 Class B |
| 02/15/2028 | 3.850% | | 250,000 | 253,622 |
| Continental Airlines Pass-Through Trust |
| 04/19/2022 | 5.983% | | 2,576,007 | 2,732,917 |
| 10/29/2024 | 4.000% | | 1,808,889 | 1,919,207 |
| Delta Air Lines Pass-Through Trust |
| 01/02/2023 | 6.718% | | 2,480,101 | 2,637,945 |
| Delta Air Lines, Inc. |
| 04/19/2023 | 3.800% | | 1,750,000 | 1,819,379 |
| 04/19/2028 | 4.375% | | 1,044,000 | 1,125,071 |
| Southwest Airlines Co. |
| 11/16/2027 | 3.450% | | 533,000 | 562,805 |
| U.S. Airways Pass-Through Trust |
| 10/01/2024 | 5.900% | | 495,670 | 553,903 |
| 06/03/2025 | 4.625% | | 2,752,474 | 2,988,694 |
| United Airlines, Inc. Pass-Through Trust |
| 09/03/2022 | 4.625% | | 525,924 | 541,026 |
| Series 2016-1 Class AA |
| 07/07/2028 | 3.100% | | 6,404,383 | 6,518,189 |
| Corporate Bonds & Notes (continued) |
| Issuer | Coupon
Rate | | Principal
Amount ($) | Value ($) |
| Series 2016-1 Class B |
| 01/07/2026 | 3.650% | | 166,462 | 169,824 |
| Series 2016-2 Class B |
| 04/07/2027 | 3.650% | | 291,962 | 293,509 |
| Total | 26,855,053 |
| Apartment REIT 0.1% |
| ERP Operating LP |
| 07/01/2029 | 3.000% | | 1,760,000 | 1,844,700 |
| Essex Portfolio LP |
| 05/01/2023 | 3.250% | | 514,000 | 529,334 |
| 01/15/2030 | 3.000% | | 1,235,000 | 1,267,204 |
| Mid-America Apartments LP |
| 03/15/2029 | 3.950% | | 1,520,000 | 1,678,261 |
| UDR, Inc. |
| 08/15/2031 | 3.000% | | 1,990,000 | 2,029,261 |
| Total | 7,348,760 |
| Automotive 1.5% |
| Adient Global Holdings Ltd.(a) |
| 08/15/2026 | 4.875% | | 2,700,000 | 2,091,704 |
| American Axle & Manufacturing, Inc. |
| 03/15/2026 | 6.250% | | 2,250,000 | 2,081,171 |
| American Honda Finance Corp. |
| 10/10/2023 | 3.625% | | 2,375,000 | 2,528,074 |
| BMW Finance NV(a) |
| 08/14/2029 | 2.850% | | 5,955,000 | 6,043,467 |
| BMW US Capital LLC(a),(b) |
3-month USD LIBOR + 0.410%
04/12/2021 | 2.750% | | 1,030,000 | 1,030,179 |
| BMW US Capital LLC(a) |
| 04/12/2021 | 3.100% | | 1,370,000 | 1,390,888 |
| 04/12/2023 | 3.450% | | 1,623,000 | 1,692,609 |
| Cooper-Standard Automotive, Inc.(a) |
| 11/15/2026 | 5.625% | | 2,225,000 | 1,919,603 |
| Daimler Finance North America LLC(a) |
| 03/02/2020 | 2.250% | | 1,500,000 | 1,498,748 |
| 05/04/2020 | 3.100% | | 2,135,000 | 2,147,118 |
| 02/12/2021 | 2.300% | | 1,126,000 | 1,126,070 |
| 05/04/2021 | 3.350% | | 3,555,000 | 3,613,334 |
| 08/15/2029 | 3.100% | | 4,145,000 | 4,217,666 |
| Daimler Finance North America LLC(a),(b) |
3-month USD LIBOR + 0.900%
02/15/2022 | 3.058% | | 4,000,000 | 4,015,900 |
| Dana Financing Luxembourg Sarl(a) |
| 06/01/2026 | 6.500% | | 10,000 | 10,476 |
| Dana Holding Corp. |
| 12/15/2024 | 5.500% | | 790,000 | 806,480 |
The accompanying Notes to Financial Statements are an integral part of this statement.
Multi-Manager Total Return Bond Strategies Fund | Annual Report 2019
| 25 |
Portfolio of Investments (continued)
August 31, 2019
| Corporate Bonds & Notes (continued) |
| Issuer | Coupon
Rate | | Principal
Amount ($) | Value ($) |
| Delphi Technologies PLC(a) |
| 10/01/2025 | 5.000% | | 126,000 | 108,694 |
| Ford Motor Co. |
| 02/01/2029 | 6.375% | | 740,000 | 828,151 |
| 01/15/2043 | 4.750% | | 1,250,000 | 1,125,019 |
| 12/08/2046 | 5.291% | | 500,000 | 479,715 |
| Ford Motor Credit Co. LLC |
| 11/04/2019 | 2.597% | | 1,827,000 | 1,826,560 |
| 01/15/2020 | 8.125% | | 800,000 | 816,022 |
| 06/12/2020 | 2.425% | | 1,485,000 | 1,482,805 |
| 11/02/2020 | 2.343% | | 6,075,000 | 6,054,691 |
| 01/07/2022 | 5.596% | | 3,900,000 | 4,120,432 |
| 08/03/2022 | 2.979% | | 3,995,000 | 3,979,827 |
| 09/20/2022 | 4.250% | | 1,100,000 | 1,133,866 |
| 11/01/2022 | 3.350% | | 6,065,000 | 6,088,484 |
| 01/09/2024 | 3.810% | | 2,585,000 | 2,602,203 |
| 09/08/2024 | 3.664% | | 894,000 | 890,359 |
| 08/01/2026 | 4.542% | | 3,910,000 | 3,983,614 |
| Ford Motor Credit Co. LLC(b) |
3-month USD LIBOR + 0.880%
10/12/2021 | 3.220% | | 3,610,000 | 3,566,290 |
3-month USD LIBOR + 1.080%
08/03/2022 | 3.367% | | 880,000 | 865,463 |
| General Motors Co. |
| 04/01/2025 | 4.000% | | 1,060,000 | 1,093,812 |
| 10/02/2043 | 6.250% | | 1,925,000 | 2,161,623 |
| General Motors Financial Co., Inc. |
| 07/13/2020 | 3.200% | | 1,200,000 | 1,206,539 |
| 04/09/2021 | 3.550% | | 7,235,000 | 7,359,276 |
| 03/01/2026 | 5.250% | | 2,345,000 | 2,563,019 |
| General Motors Financial Co., Inc.(b) |
3-month USD LIBOR + 0.850%
04/09/2021 | 3.161% | | 3,690,000 | 3,687,978 |
| Harley-Davidson Financial Services, Inc.(a) |
| 02/04/2022 | 4.050% | | 535,000 | 554,127 |
| 02/15/2023 | 3.350% | | 3,935,000 | 4,022,062 |
| Hyundai Capital America(a) |
| 03/19/2020 | 2.600% | | 680,000 | 680,870 |
| 09/18/2020 | 2.750% | | 6,291,000 | 6,312,823 |
| IHO Verwaltungs GmbH PIK(a) |
| 09/15/2026 | 4.750% | | 2,925,000 | 2,833,565 |
| Magna International, Inc. |
| 06/15/2024 | 3.625% | | 1,100,000 | 1,160,350 |
| Toyota Motor Credit Corp. |
| 04/13/2021 | 2.950% | | 1,107,000 | 1,126,170 |
| Volkswagen Group of America Finance LLC(a) |
| 05/22/2020 | 2.400% | | 640,000 | 640,545 |
| 11/13/2020 | 3.875% | | 2,125,000 | 2,163,072 |
| 11/12/2021 | 4.000% | | 2,965,000 | 3,071,651 |
| 11/13/2028 | 4.750% | | 4,595,000 | 5,150,545 |
| Total | 121,953,709 |
| Corporate Bonds & Notes (continued) |
| Issuer | Coupon
Rate | | Principal
Amount ($) | Value ($) |
| Banking 7.9% |
| American Express Co. |
| 08/03/2023 | 3.700% | | 1,195,000 | 1,266,369 |
| 07/30/2024 | 2.500% | | 5,015,000 | 5,103,404 |
| Banco Santander SA(a) |
| 11/09/2022 | 4.125% | | 150,000 | 155,550 |
| Banco Santander SA |
| 02/23/2023 | 3.125% | | 800,000 | 817,809 |
| 04/12/2023 | 3.848% | | 2,000,000 | 2,090,374 |
| Banco Santander SA(b) |
3-month USD LIBOR + 1.120%
04/12/2023 | 3.460% | | 1,400,000 | 1,397,822 |
| Bank of America Corp. |
| 10/19/2020 | 2.625% | | 1,600,000 | 1,611,741 |
| 01/11/2023 | 3.300% | | 2,000,000 | 2,078,688 |
| 01/22/2024 | 4.125% | | 3,000,000 | 3,250,395 |
| Subordinated |
| 01/22/2025 | 4.000% | | 795,000 | 849,407 |
| 04/21/2025 | 3.950% | | 2,500,000 | 2,666,802 |
| 03/03/2026 | 4.450% | | 2,000,000 | 2,199,586 |
| Bank of America Corp.(j) |
| 07/21/2021 | 2.369% | | 2,470,000 | 2,473,584 |
| 12/20/2023 | 3.004% | | 1,294,000 | 1,327,685 |
| 03/05/2024 | 3.550% | | 4,318,000 | 4,513,908 |
| 03/05/2029 | 3.970% | | 4,687,000 | 5,147,127 |
| 07/23/2029 | 4.271% | | 7,800,000 | 8,798,291 |
| 04/23/2040 | 4.078% | | 4,725,000 | 5,431,662 |
| 03/15/2050 | 4.330% | | 4,062,000 | 4,964,824 |
| Junior Subordinated |
| 12/31/2049 | 6.100% | | 5,000,000 | 5,491,145 |
| Bank of Ireland Group PLC(a) |
| 11/25/2023 | 4.500% | | 3,780,000 | 3,978,851 |
| Bank of Montreal |
| 04/13/2021 | 3.100% | | 622,000 | 633,407 |
| 08/27/2021 | 1.900% | | 5,400,000 | 5,398,996 |
| 03/26/2022 | 2.900% | | 2,980,000 | 3,043,948 |
| Bank of Montreal(j) |
| Subordinated |
| 12/15/2032 | 3.803% | | 1,068,000 | 1,118,749 |
| Bank of New York Mellon Corp. (The) |
| 01/29/2023 | 2.950% | | 995,000 | 1,025,951 |
| 08/16/2023 | 2.200% | | 3,185,000 | 3,207,550 |
| Bank of Nova Scotia (The) |
| 04/20/2021 | 3.125% | | 2,016,000 | 2,053,441 |
| Subordinated |
| 12/16/2025 | 4.500% | | 1,500,000 | 1,645,362 |
| Banque Federative du Credit Mutuel SA(a) |
| 07/20/2023 | 3.750% | | 3,185,000 | 3,364,933 |
The accompanying Notes to Financial Statements are an integral part of this statement.
| 26 | Multi-Manager Total Return Bond Strategies Fund | Annual Report 2019 |
Portfolio of Investments (continued)
August 31, 2019
| Corporate Bonds & Notes (continued) |
| Issuer | Coupon
Rate | | Principal
Amount ($) | Value ($) |
| Barclays PLC |
| 01/10/2023 | 3.684% | | 4,045,000 | 4,110,691 |
| 03/16/2025 | 3.650% | | 270,000 | 275,141 |
| 01/10/2028 | 4.337% | | 3,713,000 | 3,911,905 |
| Barclays PLC(j) |
| 02/15/2023 | 4.610% | | 4,300,000 | 4,454,469 |
| 05/07/2025 | 3.932% | | 4,002,000 | 4,113,952 |
| 05/16/2029 | 4.972% | | 1,400,000 | 1,536,811 |
| BB&T Corp. |
| 06/20/2022 | 3.050% | | 6,825,000 | 6,999,822 |
| 08/01/2024 | 2.500% | | 5,885,000 | 5,977,124 |
| BB&T Corp.(j) |
| 12/31/2049 | 4.800% | | 4,700,000 | 4,708,178 |
| BBVA Bancomer SA(a) |
| Junior Subordinated |
| 04/22/2020 | 7.250% | | 200,000 | 205,262 |
| BNP Paribas SA(a) |
| 03/01/2023 | 3.500% | | 3,435,000 | 3,565,454 |
| 08/14/2028 | 4.400% | | 345,000 | 385,211 |
| BNZ International Funding Ltd.(a) |
| 02/21/2020 | 2.400% | | 4,325,000 | 4,330,082 |
| BPCE SA(a) |
| 01/11/2028 | 3.250% | | 460,000 | 484,280 |
| Subordinated |
| 10/22/2023 | 5.700% | | 545,000 | 602,604 |
| 07/11/2024 | 4.625% | | 4,200,000 | 4,485,982 |
| 07/21/2024 | 5.150% | | 3,578,000 | 3,917,695 |
| Canadian Imperial Bank of Commerce |
| 04/02/2024 | 3.100% | | 2,000,000 | 2,074,704 |
| Capital One Financial Corp. |
| 05/12/2020 | 2.500% | | 1,915,000 | 1,916,352 |
| 04/30/2021 | 3.450% | | 10,575,000 | 10,798,196 |
| 03/09/2027 | 3.750% | | 1,145,000 | 1,212,555 |
| Capital One NA |
| 01/31/2020 | 2.350% | | 2,430,000 | 2,430,226 |
| 07/23/2021 | 2.950% | | 1,050,000 | 1,063,201 |
| Citibank NA |
| 05/01/2020 | 3.050% | | 14,260,000 | 14,339,685 |
| 07/23/2021 | 3.400% | | 995,000 | 1,019,683 |
| Citibank NA(j) |
| 05/20/2022 | 2.844% | | 4,700,000 | 4,751,145 |
| Citigroup, Inc. |
| 08/09/2020 | 5.375% | | 5,000,000 | 5,153,455 |
| 03/30/2021 | 2.700% | | 4,340,000 | 4,383,391 |
| 05/01/2026 | 3.400% | | 1,300,000 | 1,376,509 |
| Subordinated |
| 06/10/2025 | 4.400% | | 4,250,000 | 4,611,841 |
| 09/13/2025 | 5.500% | | 1,500,000 | 1,717,497 |
| 05/18/2046 | 4.750% | | 2,910,000 | 3,495,245 |
| Corporate Bonds & Notes (continued) |
| Issuer | Coupon
Rate | | Principal
Amount ($) | Value ($) |
| Citigroup, Inc.(j) |
| 01/24/2023 | 3.142% | | 4,155,000 | 4,247,765 |
| 07/24/2023 | 2.876% | | 4,564,000 | 4,645,011 |
| Junior Subordinated |
| 12/31/2049 | 5.950% | | 5,000,000 | 5,357,570 |
| Comerica Bank |
| 07/23/2024 | 2.500% | | 4,990,000 | 5,087,989 |
| Comerica, Inc. |
| 07/31/2023 | 3.700% | | 2,250,000 | 2,377,213 |
| Subordinated |
| 07/22/2026 | 3.800% | | 900,000 | 959,359 |
| Cooperatieve Rabobank UA |
| 01/10/2023 | 2.750% | | 4,580,000 | 4,694,527 |
| Subordinated |
| 08/04/2025 | 4.375% | | 1,506,000 | 1,627,647 |
| Credit Agricole SA(a) |
| 07/01/2021 | 2.375% | | 817,000 | 820,650 |
| 04/24/2023 | 3.750% | | 5,105,000 | 5,344,256 |
| Credit Suisse AG(a) |
| Subordinated |
| 08/08/2023 | 6.500% | | 1,030,000 | 1,149,818 |
| Credit Suisse Group AG(a),(j) |
| 12/14/2023 | 2.997% | | 4,500,000 | 4,564,489 |
| 01/12/2029 | 3.869% | | 638,000 | 680,572 |
| Credit Suisse Group Funding Guernsey Ltd. |
| 06/09/2023 | 3.800% | | 4,890,000 | 5,132,637 |
| Danske Bank A/S(a) |
| 03/02/2020 | 2.200% | | 1,845,000 | 1,842,507 |
| 09/12/2023 | 3.875% | | 3,995,000 | 4,158,771 |
| Deutsche Bank AG |
| 01/22/2021 | 3.150% | | 2,705,000 | 2,693,020 |
| 05/12/2021 | 3.375% | | 1,988,000 | 1,987,666 |
| 02/14/2022 | 5.000% | | 6,300,000 | 6,524,097 |
| Discover Bank |
| 08/08/2023 | 4.200% | | 4,000,000 | 4,291,320 |
| Discover Financial Services |
| 04/27/2022 | 5.200% | | 2,697,000 | 2,894,728 |
| 11/21/2022 | 3.850% | | 1,000,000 | 1,049,057 |
| 01/30/2026 | 4.500% | | 3,915,000 | 4,322,626 |
| Fifth Third Bancorp |
| 06/15/2022 | 2.600% | | 1,595,000 | 1,616,257 |
| Global Bank Corp.(a) |
| 10/20/2021 | 4.500% | | 400,000 | 411,588 |
| Goldman Sachs Group, Inc. (The) |
| 06/15/2020 | 6.000% | | 2,030,000 | 2,088,911 |
| 01/24/2022 | 5.750% | | 3,800,000 | 4,113,591 |
| 07/08/2024 | 3.850% | | 1,275,000 | 1,358,699 |
| 01/23/2025 | 3.500% | | 4,375,000 | 4,601,074 |
| 01/26/2027 | 3.850% | | 2,855,000 | 3,050,382 |
The accompanying Notes to Financial Statements are an integral part of this statement.
Multi-Manager Total Return Bond Strategies Fund | Annual Report 2019
| 27 |
Portfolio of Investments (continued)
August 31, 2019
| Corporate Bonds & Notes (continued) |
| Issuer | Coupon
Rate | | Principal
Amount ($) | Value ($) |
| Subordinated |
| 10/21/2025 | 4.250% | | 3,644,000 | 3,936,835 |
| 05/22/2045 | 5.150% | | 2,410,000 | 2,928,683 |
| Goldman Sachs Group, Inc. (The)(j) |
| 10/31/2022 | 2.876% | | 3,005,000 | 3,044,371 |
| 09/29/2025 | 3.272% | | 1,610,000 | 1,671,185 |
| 04/23/2029 | 3.814% | | 2,795,000 | 3,005,106 |
| Goldman Sachs Group, Inc. (The)(b) |
3-month USD LIBOR + 0.750%
02/23/2023 | 2.898% | | 2,152,000 | 2,149,613 |
| Junior Subordinated |
3-month USD LIBOR + 3.884%
12/31/2049 | 6.065% | | 3,652,000 | 3,659,801 |
| HSBC Holdings PLC |
| 03/08/2021 | 3.400% | | 1,584,000 | 1,609,285 |
| 03/08/2026 | 4.300% | | 2,500,000 | 2,725,740 |
| HSBC Holdings PLC(b) |
3-month USD LIBOR + 0.600%
05/18/2021 | 2.724% | | 4,415,000 | 4,417,128 |
| HSBC Holdings PLC(j) |
| 03/11/2025 | 3.803% | | 1,140,000 | 1,190,892 |
| 09/12/2026 | 4.292% | | 4,415,000 | 4,756,416 |
| 05/22/2030 | 3.973% | | 1,243,000 | 1,331,968 |
| Junior Subordinated |
| 12/31/2049 | 6.000% | | 877,000 | 880,239 |
| ING Groep NV |
| 04/09/2024 | 3.550% | | 1,512,000 | 1,585,096 |
| ING Groep NV(a) |
| 01/06/2026 | 4.625% | | 4,435,000 | 4,945,872 |
| JPMorgan Chase & Co. |
| 10/15/2020 | 4.250% | | 2,000,000 | 2,048,682 |
| 01/24/2022 | 4.500% | | 1,000,000 | 1,057,370 |
| 07/15/2025 | 3.900% | | 4,000,000 | 4,340,828 |
| 10/01/2026 | 2.950% | | 1,180,000 | 1,219,889 |
| Subordinated |
| 05/01/2023 | 3.375% | | 1,000,000 | 1,037,371 |
| 09/10/2024 | 3.875% | | 8,940,000 | 9,552,569 |
| JPMorgan Chase & Co.(j) |
| 06/18/2022 | 3.514% | | 6,090,000 | 6,235,855 |
| 04/01/2023 | 3.207% | | 4,190,000 | 4,304,802 |
| 04/23/2024 | 3.559% | | 8,541,000 | 8,961,849 |
| 07/23/2024 | 3.797% | | 675,000 | 716,023 |
| 12/05/2024 | 4.023% | | 3,995,000 | 4,293,830 |
| 01/23/2029 | 3.509% | | 3,570,000 | 3,824,734 |
| 04/23/2029 | 4.005% | | 3,180,000 | 3,532,001 |
| 12/05/2029 | 4.452% | | 1,127,000 | 1,294,932 |
| 05/06/2030 | 3.702% | | 973,000 | 1,062,206 |
| 11/15/2048 | 3.964% | | 2,475,000 | 2,863,439 |
| 01/23/2049 | 3.897% | | 3,269,000 | 3,759,451 |
| 12/31/2049 | 5.000% | | 2,572,000 | 2,671,367 |
| Corporate Bonds & Notes (continued) |
| Issuer | Coupon
Rate | | Principal
Amount ($) | Value ($) |
| Junior Subordinated |
| 12/31/2049 | 5.300% | | 5,905,000 | 5,989,388 |
| 12/31/2049 | 6.100% | | 5,000,000 | 5,407,430 |
| JPMorgan Chase Bank NA(j) |
| 04/26/2021 | 3.086% | | 2,750,000 | 2,766,112 |
| Lloyds Bank PLC |
| 05/07/2021 | 3.300% | | 3,200,000 | 3,253,613 |
| 08/14/2022 | 2.250% | | 6,340,000 | 6,346,575 |
| Lloyds Banking Group PLC |
| 08/16/2023 | 4.050% | | 6,195,000 | 6,501,962 |
| 03/22/2028 | 4.375% | | 1,975,000 | 2,150,605 |
| Subordinated |
| 11/04/2024 | 4.500% | | 5,560,000 | 5,824,978 |
| Lloyds Banking Group PLC(j) |
| 11/07/2023 | 2.907% | | 3,463,000 | 3,474,009 |
| Mitsubishi UFJ Financial Group, Inc. |
| 07/26/2023 | 3.761% | | 2,968,000 | 3,136,404 |
| 07/18/2029 | 3.195% | | 8,425,000 | 8,826,022 |
| 07/18/2039 | 3.751% | | 1,255,000 | 1,372,792 |
| Mizuho Financial Group, Inc.(j) |
| 09/11/2024 | 3.922% | | 2,668,000 | 2,823,656 |
| Morgan Stanley(b) |
3-month USD LIBOR + 0.930%
07/22/2022 | 3.208% | | 3,240,000 | 3,260,979 |
| Junior Subordinated |
3-month USD LIBOR + 3.610%
12/31/2049 | 5.913% | | 5,000,000 | 5,007,595 |
| Morgan Stanley |
| 10/23/2024 | 3.700% | | 5,500,000 | 5,871,772 |
| 07/23/2025 | 4.000% | | 1,725,000 | 1,871,149 |
| 01/27/2026 | 3.875% | | 3,665,000 | 3,962,635 |
| Subordinated |
| 11/24/2025 | 5.000% | | 4,950,000 | 5,584,689 |
| Morgan Stanley(j) |
| 07/22/2028 | 3.591% | | 7,245,000 | 7,711,462 |
| 01/24/2029 | 3.772% | | 4,315,000 | 4,654,552 |
| 01/23/2030 | 4.431% | | 2,885,000 | 3,293,311 |
| 04/22/2039 | 4.457% | | 310,000 | 367,064 |
| National Australia Bank Ltd. |
| 11/04/2021 | 3.700% | | 5,655,000 | 5,859,451 |
| National Australia Bank Ltd.(a),(j) |
| Subordinated |
| 08/02/2034 | 3.933% | | 925,000 | 960,106 |
| Nationwide Building Society(a),(j) |
| 04/26/2023 | 3.622% | | 1,540,000 | 1,572,887 |
| 08/01/2024 | 4.363% | | 4,595,000 | 4,833,154 |
| 07/18/2030 | 3.960% | | 2,485,000 | 2,611,305 |
| NatWest Markets PLC(a) |
| 09/29/2022 | 3.625% | | 6,225,000 | 6,376,815 |
The accompanying Notes to Financial Statements are an integral part of this statement.
| 28 | Multi-Manager Total Return Bond Strategies Fund | Annual Report 2019 |
Portfolio of Investments (continued)
August 31, 2019
| Corporate Bonds & Notes (continued) |
| Issuer | Coupon
Rate | | Principal
Amount ($) | Value ($) |
| Northern Trust Corp.(j) |
| Junior Subordinated |
| 05/08/2032 | 3.375% | | 2,005,000 | 2,088,877 |
| PNC Bank NA |
| 04/29/2021 | 2.150% | | 2,050,000 | 2,054,174 |
| PNC Financial Services Group, Inc. (The) |
| 07/23/2026 | 2.600% | | 6,075,000 | 6,203,152 |
| Royal Bank of Canada(b) |
3-month USD LIBOR + 0.390%
04/30/2021 | 2.656% | | 4,710,000 | 4,723,617 |
| Royal Bank of Canada |
| 04/30/2021 | 3.200% | | 12,775,000 | 13,044,335 |
| 10/05/2023 | 3.700% | | 2,698,000 | 2,868,009 |
| Royal Bank of Scotland Group PLC |
| 09/12/2023 | 3.875% | | 3,000,000 | 3,090,936 |
| Royal Bank of Scotland Group PLC(j) |
| 03/22/2025 | 4.269% | | 2,126,000 | 2,218,032 |
| Santander Holdings U.S.A., Inc. |
| 03/28/2022 | 3.700% | | 3,920,000 | 4,021,356 |
| Santander Holdings USA, Inc. |
| 06/07/2024 | 3.500% | | 5,270,000 | 5,446,603 |
| Santander UK Group Holdings PLC |
| 08/05/2021 | 2.875% | | 3,675,000 | 3,690,439 |
| Santander UK Group Holdings PLC(a) |
| Subordinated |
| 09/15/2025 | 4.750% | | 4,777,000 | 4,993,527 |
| Santander UK PLC |
| 01/05/2021 | 2.500% | | 1,790,000 | 1,793,030 |
| 06/01/2021 | 3.400% | | 4,377,000 | 4,465,306 |
| 06/18/2024 | 2.875% | | 4,250,000 | 4,326,283 |
| Santander UK PLC(b) |
3-month USD LIBOR + 0.620%
06/01/2021 | 2.758% | | 3,415,000 | 3,417,356 |
| Societe Generale SA(a) |
| 03/28/2024 | 3.875% | | 5,055,000 | 5,322,475 |
| Standard Chartered PLC(a),(j) |
| 05/21/2025 | 3.785% | | 3,340,000 | 3,452,652 |
| Sumitomo Mitsui Financial Group, Inc. |
| 10/19/2021 | 2.442% | | 515,000 | 517,739 |
| 07/12/2022 | 2.784% | | 1,720,000 | 1,750,738 |
| 07/16/2029 | 3.040% | | 6,815,000 | 7,056,844 |
| SunTrust Banks, Inc. |
| 03/03/2021 | 2.900% | | 920,000 | 930,200 |
| Svenska Handelsbanken AB |
| 09/07/2021 | 1.875% | | 6,215,000 | 6,185,162 |
| Corporate Bonds & Notes (continued) |
| Issuer | Coupon
Rate | | Principal
Amount ($) | Value ($) |
| Toronto-Dominion Bank (The) |
| 07/19/2023 | 3.500% | | 3,868,000 | 4,100,622 |
| 03/11/2024 | 3.250% | | 2,000,000 | 2,101,624 |
| 06/12/2024 | 2.650% | | 1,632,000 | 1,674,520 |
| U.S. Bancorp(j) |
| Junior Subordinated |
| 12/31/2049 | 5.300% | | 2,980,000 | 3,169,737 |
| UBS AG(a) |
| 12/01/2020 | 2.450% | | 1,841,000 | 1,850,536 |
| UBS Group AG(a),(j) |
| 08/13/2030 | 3.126% | | 1,405,000 | 1,441,508 |
| UBS Group Funding Switzerland AG(a) |
| 05/23/2023 | 3.491% | | 5,580,000 | 5,752,662 |
| UniCredit SpA(a) |
| 04/12/2022 | 3.750% | | 3,125,000 | 3,200,219 |
| Wells Fargo & Co. |
| 07/22/2022 | 2.625% | | 5,465,000 | 5,552,844 |
| 01/24/2024 | 3.750% | | 2,500,000 | 2,661,767 |
| 04/22/2026 | 3.000% | | 3,700,000 | 3,834,188 |
| 12/07/2046 | 4.750% | | 609,000 | 744,998 |
| Subordinated |
| 08/15/2023 | 4.125% | | 4,000,000 | 4,266,332 |
| Wells Fargo Bank NA |
| 10/22/2021 | 3.625% | | 2,996,000 | 3,090,955 |
| Westpac Banking Corp. |
| 01/11/2022 | 2.800% | | 1,961,000 | 2,001,587 |
| Zions Bancorp NA |
| 08/27/2021 | 3.500% | | 2,096,000 | 2,144,258 |
| Total | 664,746,605 |
| Brokerage/Asset Managers/Exchanges 0.1% |
| Charles Schwab Corp. (The) |
| 03/10/2025 | 3.000% | | 1,560,000 | 1,621,915 |
| 01/25/2028 | 3.200% | | 2,000,000 | 2,122,690 |
| 05/22/2029 | 3.250% | | 630,000 | 676,252 |
| Jefferies Group LLC |
| 01/20/2043 | 6.500% | | 600,000 | 700,401 |
| Jefferies Group LLC/Capital Finance, Inc. |
| 01/23/2030 | 4.150% | | 678,000 | 685,560 |
| Nuveen Finance LLC(a) |
| 11/01/2024 | 4.125% | | 1,050,000 | 1,141,405 |
| Raymond James Financial, Inc. |
| 07/15/2046 | 4.950% | | 1,745,000 | 2,122,354 |
| Stifel Financial Corp. |
| 12/01/2020 | 3.500% | | 980,000 | 991,706 |
| 07/18/2024 | 4.250% | | 750,000 | 797,310 |
| Total | 10,859,593 |
The accompanying Notes to Financial Statements are an integral part of this statement.
Multi-Manager Total Return Bond Strategies Fund | Annual Report 2019
| 29 |
Portfolio of Investments (continued)
August 31, 2019
| Corporate Bonds & Notes (continued) |
| Issuer | Coupon
Rate | | Principal
Amount ($) | Value ($) |
| Building Materials 0.2% |
| Beacon Roofing Supply, Inc. |
| 10/01/2023 | 6.375% | | 367,000 | 379,869 |
| CRH America Finance, Inc.(a) |
| 04/04/2048 | 4.500% | | 2,670,000 | 2,908,428 |
| Standard Industries, Inc.(a) |
| 10/15/2025 | 6.000% | | 1,853,000 | 1,953,957 |
| 02/15/2027 | 5.000% | | 1,000,000 | 1,025,784 |
| Stanley Black & Decker, Inc. |
| 11/01/2022 | 2.900% | | 1,335,000 | 1,366,131 |
| Summit Materials LLC/Finance Corp.(a) |
| 06/01/2025 | 5.125% | | 960,000 | 983,912 |
| U.S. Concrete, Inc. |
| 06/01/2024 | 6.375% | | 2,925,000 | 3,066,508 |
| Vulcan Materials Co. |
| 06/15/2047 | 4.500% | | 2,610,000 | 2,826,372 |
| Total | 14,510,961 |
| Cable and Satellite 0.8% |
| CCO Holdings LLC/Capital Corp. |
| 09/30/2022 | 5.250% | | 4,050,000 | 4,098,122 |
| CCO Holdings LLC/Capital Corp.(a) |
| 05/01/2025 | 5.375% | | 225,000 | 233,829 |
| 06/01/2029 | 5.375% | | 1,384,000 | 1,480,153 |
| Charter Communications Operating LLC/Capital |
| 07/23/2022 | 4.464% | | 2,065,000 | 2,178,453 |
| 07/23/2025 | 4.908% | | 988,000 | 1,089,974 |
| 10/23/2045 | 6.484% | | 4,170,000 | 5,170,558 |
| Comcast Corp. |
| 10/01/2021 | 3.450% | | 2,283,000 | 2,351,529 |
| 10/15/2025 | 3.950% | | 3,212,000 | 3,520,204 |
| 10/15/2028 | 4.150% | | 4,695,000 | 5,328,248 |
| 10/15/2038 | 4.600% | | 1,250,000 | 1,520,601 |
| 03/01/2048 | 4.000% | | 2,000,000 | 2,257,224 |
| 11/01/2049 | 3.999% | | 3,000,000 | 3,392,727 |
| Cox Communications, Inc.(a) |
| 12/15/2022 | 3.250% | | 500,000 | 514,264 |
| 08/15/2024 | 3.150% | | 2,265,000 | 2,335,301 |
| CSC Holdings LLC(a) |
| 12/15/2021 | 5.125% | | 1,300,000 | 1,300,802 |
| 05/15/2026 | 5.500% | | 2,584,000 | 2,732,058 |
| 02/01/2028 | 5.375% | | 1,193,000 | 1,274,707 |
| 04/01/2028 | 7.500% | | 1,000,000 | 1,120,070 |
| CSC Holdings LLC |
| 06/01/2024 | 5.250% | | 2,180,000 | 2,332,622 |
| DISH DBS Corp. |
| 05/01/2020 | 5.125% | | 1,400,000 | 1,418,654 |
| 11/15/2024 | 5.875% | | 745,000 | 709,533 |
| 07/01/2026 | 7.750% | | 3,489,000 | 3,429,212 |
| Corporate Bonds & Notes (continued) |
| Issuer | Coupon
Rate | | Principal
Amount ($) | Value ($) |
| Intelsat Jackson Holdings SA |
| 08/01/2023 | 5.500% | | 832,000 | 756,578 |
| Intelsat Jackson Holdings SA(a) |
| 07/15/2025 | 9.750% | | 2,202,000 | 2,259,921 |
| NBCUniversal Media LLC |
| 01/15/2023 | 2.875% | | 720,000 | 741,996 |
| Sirius XM Radio, Inc.(a) |
| 07/01/2029 | 5.500% | | 960,000 | 1,045,439 |
| Time Warner Cable LLC |
| 02/01/2020 | 5.000% | | 1,500,000 | 1,515,015 |
| 09/01/2021 | 4.000% | | 1,500,000 | 1,537,766 |
| 07/01/2038 | 7.300% | | 215,000 | 274,905 |
| 09/01/2041 | 5.500% | | 5,371,000 | 5,765,747 |
| Time Warner Entertainment Co. LP |
| 07/15/2033 | 8.375% | | 1,455,000 | 2,036,197 |
| Videotron Ltd. |
| 07/15/2022 | 5.000% | | 2,750,000 | 2,887,060 |
| Virgin Media Secured Finance PLC(a) |
| 01/15/2026 | 5.250% | | 313,000 | 322,127 |
| 08/15/2026 | 5.500% | | 244,000 | 255,580 |
| Total | 69,187,176 |
| Chemicals 0.4% |
| Atotech U.S.A., Inc.(a) |
| 02/01/2025 | 6.250% | | 219,000 | 217,699 |
| Cabot Corp. |
| 07/01/2029 | 4.000% | | 4,010,000 | 4,211,515 |
| Celanese U.S. Holdings LLC |
| 11/15/2022 | 4.625% | | 100,000 | 106,438 |
| CF Industries, Inc. |
| 03/15/2044 | 5.375% | | 1,350,000 | 1,367,460 |
| Dow Chemical Co. (The) |
| 10/01/2024 | 3.500% | | 1,763,000 | 1,847,952 |
| Dow Chemical Co. (The)(a) |
| 11/30/2028 | 4.800% | | 1,733,000 | 1,983,859 |
| 11/30/2048 | 5.550% | | 1,086,000 | 1,351,127 |
| Eastman Chemical Co. |
| 10/15/2044 | 4.650% | | 2,511,000 | 2,724,201 |
| Ecolab, Inc. |
| 12/08/2021 | 4.350% | | 766,000 | 804,822 |
| Huntsman International LLC |
| 05/01/2029 | 4.500% | | 219,000 | 233,737 |
| Incitec Pivot Finance LLC(a) |
| 12/10/2019 | 6.000% | | 1,000,000 | 1,009,042 |
| International Flavors & Fragrances, Inc. |
| 09/25/2020 | 3.400% | | 497,000 | 503,405 |
| 09/26/2048 | 5.000% | | 4,030,000 | 4,528,712 |
The accompanying Notes to Financial Statements are an integral part of this statement.
| 30 | Multi-Manager Total Return Bond Strategies Fund | Annual Report 2019 |
Portfolio of Investments (continued)
August 31, 2019
| Corporate Bonds & Notes (continued) |
| Issuer | Coupon
Rate | | Principal
Amount ($) | Value ($) |
| LyondellBasell Industries NV |
| 04/15/2024 | 5.750% | | 1,778,000 | 2,015,457 |
| Mexichem SAB de CV(a) |
| 01/15/2048 | 5.500% | | 4,250,000 | 4,356,484 |
| Mosaic Co. (The) |
| 11/15/2033 | 5.450% | | 506,000 | 580,733 |
| 11/15/2043 | 5.625% | | 985,000 | 1,092,735 |
| Platform Specialty Products Corp.(a) |
| 12/01/2025 | 5.875% | | 88,000 | 91,583 |
| PPG Industries, Inc. |
| 08/15/2024 | 2.400% | | 2,190,000 | 2,203,020 |
| PQ Corp.(a) |
| 11/15/2022 | 6.750% | | 279,000 | 289,411 |
| Sasol Financing International Ltd. |
| 11/14/2022 | 4.500% | | 3,800,000 | 3,902,767 |
| Sasol Financing USA LLC |
| 03/27/2024 | 5.875% | | 645,000 | 695,849 |
| Total | 36,118,008 |
| Construction Machinery 0.3% |
| Caterpillar Financial Services Corp. |
| 09/07/2021 | 3.150% | | 999,000 | 1,023,054 |
| 10/01/2021 | 1.931% | | 4,655,000 | 4,646,002 |
| 12/07/2023 | 3.650% | | 4,530,000 | 4,840,364 |
| John Deere Capital Corp. |
| 09/10/2021 | 3.125% | | 800,000 | 818,209 |
| 03/07/2024 | 2.600% | | 1,105,000 | 1,132,799 |
| 07/18/2029 | 2.800% | | 4,465,000 | 4,644,024 |
| United Rentals North America, Inc. |
| 07/15/2025 | 5.500% | | 5,300,000 | 5,541,076 |
| 09/15/2026 | 5.875% | | 65,000 | 69,698 |
| 05/15/2027 | 5.500% | | 278,000 | 298,266 |
| 01/15/2028 | 4.875% | | 825,000 | 866,668 |
| Vinci SA(a) |
| 04/10/2029 | 3.750% | | 513,000 | 568,385 |
| Total | 24,448,545 |
| Consumer Cyclical Services 0.2% |
| Amazon.com, Inc. |
| 02/22/2023 | 2.400% | | 3,635,000 | 3,704,850 |
| 08/22/2047 | 4.050% | | 723,000 | 882,423 |
| Experian Finance PLC(a) |
| 02/01/2029 | 4.250% | | 1,560,000 | 1,774,118 |
| IHS Markit Ltd.(a) |
| 11/01/2022 | 5.000% | | 1,000,000 | 1,067,344 |
| 02/15/2025 | 4.750% | | 500,000 | 545,367 |
| 03/01/2026 | 4.000% | | 1,350,000 | 1,439,932 |
| Corporate Bonds & Notes (continued) |
| Issuer | Coupon
Rate | | Principal
Amount ($) | Value ($) |
| IHS Markit Ltd. |
| 08/01/2028 | 4.750% | | 1,875,000 | 2,115,926 |
| 05/01/2029 | 4.250% | | 486,000 | 526,773 |
| Western Union Co. (The) |
| 06/09/2023 | 4.250% | | 5,260,000 | 5,578,993 |
| Total | 17,635,726 |
| Consumer Products 0.1% |
| Mead Johnson Nutrition Co. |
| 11/15/2025 | 4.125% | | 640,000 | 703,868 |
| Newell, Inc. |
| 04/01/2026 | 4.200% | | 4,150,000 | 4,303,334 |
| SC Johnson & Son, Inc.(a) |
| 10/15/2046 | 4.750% | | 750,000 | 947,795 |
| Scotts Miracle-Gro Co. (The) |
| 10/15/2023 | 6.000% | | 52,000 | 53,839 |
| 12/15/2026 | 5.250% | | 235,000 | 243,991 |
| Unilever Capital Corp. |
| 03/07/2022 | 3.000% | | 4,030,000 | 4,140,672 |
| Total | 10,393,499 |
| Diversified Manufacturing 0.6% |
| 3M Co. |
| 08/26/2049 | 3.250% | | 925,000 | 935,387 |
| EnerSys(a) |
| 04/30/2023 | 5.000% | | 200,000 | 205,602 |
| FXI Holdings, Inc.(a) |
| 11/01/2024 | 7.875% | | 650,000 | 576,867 |
| General Electric Co. |
| 01/08/2020 | 5.500% | | 1,870,000 | 1,885,521 |
| 01/09/2020 | 2.200% | | 7,300,000 | 7,280,823 |
| 10/17/2021 | 4.650% | | 853,000 | 882,687 |
| 01/09/2023 | 3.100% | | 1,007,000 | 1,009,679 |
| 03/15/2032 | 6.750% | | 655,000 | 804,831 |
| 01/14/2038 | 5.875% | | 2,009,000 | 2,317,146 |
| 03/11/2044 | 4.500% | | 1,750,000 | 1,772,013 |
| General Electric Co.(b) |
3-month USD LIBOR + 0.480%
08/15/2036 | 2.638% | | 5,380,000 | 3,791,889 |
| Illinois Tool Works, Inc. |
| 09/15/2021 | 3.375% | | 615,000 | 630,483 |
| Johnson Controls International PLC |
| 07/02/2064 | 4.950% | | 1,530,000 | 1,657,825 |
| Kennametal, Inc. |
| 06/15/2028 | 4.625% | | 6,345,000 | 6,811,973 |
| Nvent Finance Sarl |
| 04/15/2028 | 4.550% | | 3,535,000 | 3,724,663 |
| Roper Technologies, Inc. |
| 09/15/2023 | 3.650% | | 209,000 | 220,267 |
The accompanying Notes to Financial Statements are an integral part of this statement.
Multi-Manager Total Return Bond Strategies Fund | Annual Report 2019
| 31 |
Portfolio of Investments (continued)
August 31, 2019
| Corporate Bonds & Notes (continued) |
| Issuer | Coupon
Rate | | Principal
Amount ($) | Value ($) |
| Timken Co. (The) |
| 12/15/2028 | 4.500% | | 3,685,000 | 4,009,387 |
| United Technologies Corp. |
| 08/16/2023 | 3.650% | | 1,503,000 | 1,594,567 |
| 05/01/2035 | 5.400% | | 128,000 | 163,796 |
| 07/15/2038 | 6.125% | | 188,000 | 263,486 |
| 05/04/2047 | 4.050% | | 560,000 | 645,908 |
| Valmont Industries, Inc. |
| 10/01/2054 | 5.250% | | 2,050,000 | 2,194,138 |
| Wabtec Corp.(b) |
3-month USD LIBOR + 1.050%
09/15/2021 | 3.710% | | 1,775,000 | 1,771,246 |
| Wabtec Corp. |
| 09/15/2028 | 4.700% | | 3,190,000 | 3,559,373 |
| Total | 48,709,557 |
| Electric 2.8% |
| AEP Texas Central Co.(a) |
| 10/01/2025 | 3.850% | | 880,000 | 937,134 |
| AEP Texas Central Co. |
| 02/15/2033 | 6.650% | | 1,385,000 | 1,928,108 |
| AES Corp. (The) |
| 09/01/2027 | 5.125% | | 118,000 | 126,666 |
| Alabama Power Co. |
| 12/01/2023 | 3.550% | | 1,000,000 | 1,060,595 |
| Alliant Energy Finance LLC(a) |
| 06/15/2028 | 4.250% | | 5,250,000 | 5,744,335 |
| Ameren Corp. |
| 02/15/2026 | 3.650% | | 590,000 | 625,866 |
| American Electric Power Co., Inc. |
| 12/15/2022 | 2.950% | | 750,000 | 766,240 |
| American Transmission Systems, Inc.(a) |
| 09/01/2044 | 5.000% | | 1,411,000 | 1,799,056 |
| Arizona Public Service Co. |
| 08/15/2048 | 4.200% | | 605,000 | 705,848 |
| Avangrid, Inc. |
| 06/01/2029 | 3.800% | | 4,449,000 | 4,837,349 |
| Baltimore Gas & Electric Co. |
| 07/01/2023 | 3.350% | | 3,590,000 | 3,753,492 |
| Black Hills Corp. |
| 11/30/2023 | 4.250% | | 297,000 | 318,102 |
| Calpine Corp.(a) |
| 01/15/2024 | 5.875% | | 75,000 | 76,565 |
| Calpine Corp. |
| 01/15/2025 | 5.750% | | 5,632,000 | 5,716,322 |
| CenterPoint Energy, Inc. |
| 03/01/2030 | 2.950% | | 2,680,000 | 2,714,041 |
| Corporate Bonds & Notes (continued) |
| Issuer | Coupon
Rate | | Principal
Amount ($) | Value ($) |
| Cleveland Electric Illuminating Co. (The)(a) |
| 04/01/2028 | 3.500% | | 3,331,000 | 3,528,898 |
| Cleveland Electric Illuminating Co. (The) |
| 12/15/2036 | 5.950% | | 1,279,000 | 1,654,922 |
| CMS Energy Corp. |
| 03/01/2024 | 3.875% | | 1,020,000 | 1,081,026 |
| 02/15/2027 | 2.950% | | 80,000 | 81,389 |
| Commonwealth Edison Co. |
| 08/15/2047 | 3.750% | | 860,000 | 971,514 |
| Consolidated Edison Co. of New York, Inc. |
| 03/01/2035 | 5.300% | | 178,000 | 225,606 |
| 06/15/2046 | 3.850% | | 1,310,000 | 1,455,648 |
| 06/15/2047 | 3.875% | | 1,640,000 | 1,834,099 |
| 12/01/2054 | 4.625% | | 510,000 | 625,513 |
| 11/15/2057 | 4.000% | | 577,000 | 645,234 |
| Consumers Energy Co.(c) |
| 08/15/2050 | 3.100% | | 751,000 | 768,730 |
| Dominion Energy, Inc.(a) |
| 01/15/2023 | 2.450% | | 5,000,000 | 5,006,080 |
| Dominion Energy, Inc. |
| 08/15/2026 | 2.850% | | 750,000 | 761,800 |
| Jr. Subordinated |
| 08/15/2024 | 3.071% | | 3,505,000 | 3,607,889 |
| Dominion Resources, Inc. |
| 01/15/2022 | 2.750% | | 2,509,000 | 2,540,340 |
| DPL, Inc.(a) |
| 04/15/2029 | 4.350% | | 1,656,000 | 1,658,920 |
| DTE Electric Co. |
| 05/15/2048 | 4.050% | | 210,000 | 250,991 |
| 03/01/2049 | 3.950% | | 305,000 | 361,944 |
| DTE Energy Co. |
| 10/01/2024 | 2.529% | | 4,885,000 | 4,930,211 |
| 10/01/2026 | 2.850% | | 10,155,000 | 10,397,400 |
| Duke Energy Carolinas LLC |
| 12/01/2047 | 3.700% | | 1,678,000 | 1,871,450 |
| Duke Energy Corp. |
| 09/01/2026 | 2.650% | | 6,770,000 | 6,854,056 |
| Duke Energy Progress LLC |
| 05/15/2042 | 4.100% | | 1,748,000 | 2,033,660 |
| 03/15/2043 | 4.100% | | 955,000 | 1,112,021 |
| 03/30/2044 | 4.375% | | 770,000 | 934,397 |
| 08/15/2045 | 4.200% | | 1,425,000 | 1,691,340 |
| 09/15/2047 | 3.600% | | 940,000 | 1,021,620 |
| Duquesne Light Holdings, Inc.(a) |
| 09/15/2020 | 6.400% | | 5,000,000 | 5,186,735 |
| Enel Finance International NV(a) |
| 04/06/2028 | 3.500% | | 2,370,000 | 2,411,115 |
The accompanying Notes to Financial Statements are an integral part of this statement.
| 32 | Multi-Manager Total Return Bond Strategies Fund | Annual Report 2019 |
Portfolio of Investments (continued)
August 31, 2019
| Corporate Bonds & Notes (continued) |
| Issuer | Coupon
Rate | | Principal
Amount ($) | Value ($) |
| Entergy Louisiana LLC |
| 10/01/2026 | 2.400% | | 2,500,000 | 2,515,483 |
| 09/01/2048 | 4.200% | | 1,000,000 | 1,211,352 |
| Entergy Mississippi LLC |
| 06/01/2049 | 3.850% | | 5,745,000 | 6,565,064 |
| Entergy Mississippi, Inc. |
| 07/01/2023 | 3.100% | | 1,600,000 | 1,651,054 |
| Entergy Texas, Inc. |
| 12/01/2027 | 3.450% | | 2,510,000 | 2,626,211 |
| 03/30/2029 | 4.000% | | 362,000 | 405,543 |
| Eversource Energy |
| 10/01/2024 | 2.900% | | 2,469,000 | 2,546,640 |
| Exelon Corp. |
| 06/15/2025 | 3.950% | | 1,300,000 | 1,400,526 |
| 04/15/2046 | 4.450% | | 1,050,000 | 1,223,336 |
| Exelon Corp.(j) |
| Junior Subordinated |
| 06/01/2022 | 3.497% | | 6,780,000 | 6,966,640 |
| Exelon Generation Co. LLC |
| 10/01/2041 | 5.750% | | 2,000,000 | 2,405,668 |
| FirstEnergy Corp. |
| 03/15/2023 | 4.250% | | 2,983,000 | 3,169,136 |
| FirstEnergy Transmission LLC(a) |
| 04/01/2049 | 4.550% | | 675,000 | 811,143 |
| Fortis, Inc. |
| 10/04/2021 | 2.100% | | 2,420,000 | 2,409,708 |
| 10/04/2026 | 3.055% | | 477,000 | 488,188 |
| Georgia Power Co. |
| 09/08/2020 | 2.000% | | 1,250,000 | 1,247,845 |
| Gulf Power Co. |
| 10/01/2044 | 4.550% | | 1,350,000 | 1,636,663 |
| Interstate Power & Light Co. |
| 12/01/2024 | 3.250% | | 821,000 | 862,263 |
| ITC Holdings Corp. |
| 06/15/2024 | 3.650% | | 3,050,000 | 3,215,276 |
| Jersey Central Power & Light Co.(a) |
| 04/01/2024 | 4.700% | | 1,600,000 | 1,757,411 |
| Jersey Central Power & Light Co. |
| 06/01/2037 | 6.150% | | 1,985,000 | 2,592,108 |
| Kansas City Power & Light Co. |
| 08/15/2025 | 3.650% | | 665,000 | 713,401 |
| LG&E & KU Energy LLC |
| 11/15/2020 | 3.750% | | 597,000 | 605,813 |
| Metropolitan Edison Co.(a) |
| 01/15/2029 | 4.300% | | 2,000,000 | 2,271,526 |
| Mississippi Power Co. |
| 03/15/2042 | 4.250% | | 475,000 | 526,092 |
| Corporate Bonds & Notes (continued) |
| Issuer | Coupon
Rate | | Principal
Amount ($) | Value ($) |
| National Rural Utilities Cooperative Finance Corp. |
| 02/07/2024 | 2.950% | | 3,765,000 | 3,907,012 |
| 03/15/2049 | 4.300% | | 2,175,000 | 2,677,351 |
| National Rural Utilities Cooperative Finance Corp.(j) |
| 04/30/2043 | 4.750% | | 1,587,000 | 1,607,466 |
| Subordinated |
| 04/20/2046 | 5.250% | | 1,750,000 | 1,850,520 |
| NextEra Energy Capital Holdings, Inc.(b) |
3-month USD LIBOR + 0.480%
05/04/2021 | 2.767% | | 11,075,000 | 11,087,282 |
| NextEra Energy Capital Holdings, Inc. |
| 09/01/2021 | 2.403% | | 6,995,000 | 7,029,982 |
| 06/15/2023 | 3.625% | | 3,000,000 | 3,140,742 |
| 04/01/2024 | 3.150% | | 1,164,000 | 1,211,020 |
| NRG Energy, Inc. |
| 01/15/2028 | 5.750% | | 750,000 | 808,466 |
| Ohio Power Co. |
| 06/01/2049 | 4.000% | | 1,685,000 | 1,970,715 |
| Oncor Electric Delivery Co. LLC |
| 09/30/2040 | 5.250% | | 1,600,000 | 2,139,506 |
| Pennsylvania Electric Co.(a) |
| 03/15/2028 | 3.250% | | 1,990,000 | 2,076,645 |
| PNM Resources, Inc. |
| 03/09/2021 | 3.250% | | 3,315,000 | 3,356,520 |
| PPL Capital Funding, Inc. |
| 06/15/2022 | 4.200% | | 603,000 | 632,473 |
| 03/15/2024 | 3.950% | | 1,200,000 | 1,273,454 |
| PSEG Power LLC |
| 06/01/2023 | 3.850% | | 2,770,000 | 2,921,300 |
| Public Service Co. of Oklahoma |
| 02/01/2021 | 4.400% | | 2,800,000 | 2,887,500 |
| Public Service Electric & Gas Co. |
| 09/01/2023 | 3.250% | | 1,300,000 | 1,363,635 |
| Public Service Enterprise Group, Inc. |
| 11/15/2022 | 2.650% | | 1,316,000 | 1,334,667 |
| Puget Sound Energy, Inc. |
| 09/15/2049 | 3.250% | | 463,000 | 476,357 |
| Sierra Pacific Power Co. |
| 05/01/2026 | 2.600% | | 758,000 | 775,757 |
| South Carolina Electric & Gas Co. |
| 05/15/2033 | 5.300% | | 1,000,000 | 1,260,827 |
| Southern Co. (The) |
| 07/01/2036 | 4.250% | | 595,000 | 658,294 |
| Southwestern Electric Power Co. |
| 10/01/2026 | 2.750% | | 6,450,000 | 6,555,399 |
| 09/15/2028 | 4.100% | | 1,500,000 | 1,685,987 |
The accompanying Notes to Financial Statements are an integral part of this statement.
Multi-Manager Total Return Bond Strategies Fund | Annual Report 2019
| 33 |
Portfolio of Investments (continued)
August 31, 2019
| Corporate Bonds & Notes (continued) |
| Issuer | Coupon
Rate | | Principal
Amount ($) | Value ($) |
| Tampa Electric Co. |
| 09/15/2022 | 2.600% | | 2,000,000 | 2,020,422 |
| Toledo Edison Co. (The) |
| 05/15/2037 | 6.150% | | 951,000 | 1,310,448 |
| Tucson Electric Power Co. |
| 03/15/2023 | 3.850% | | 2,480,000 | 2,575,902 |
| 12/01/2048 | 4.850% | | 485,000 | 626,584 |
| Union Electric Co. |
| 03/15/2029 | 3.500% | | 1,225,000 | 1,351,875 |
| Virginia Electric & Power Co. |
| 09/01/2022 | 3.450% | | 1,500,000 | 1,554,542 |
| 03/15/2027 | 3.500% | | 1,500,000 | 1,615,550 |
| 04/01/2028 | 3.800% | | 1,000,000 | 1,105,040 |
| Vistra Operations Co. LLC(a) |
| 07/15/2029 | 4.300% | | 8,330,000 | 8,504,030 |
| Westar Energy, Inc. |
| 09/01/2049 | 3.250% | | 1,126,000 | 1,161,528 |
| Xcel Energy, Inc. |
| 06/01/2025 | 3.300% | | 2,030,000 | 2,127,631 |
| Total | 237,080,786 |
| Finance Companies 0.8% |
| AerCap Ireland Capital DAC/Global Aviation Trust |
| 05/15/2021 | 4.500% | | 3,505,000 | 3,621,159 |
| 10/01/2021 | 5.000% | | 6,000,000 | 6,305,562 |
| 08/14/2024 | 2.875% | | 6,000,000 | 6,005,556 |
| Air Lease Corp. |
| 03/01/2020 | 4.750% | | 3,625,000 | 3,666,213 |
| 01/15/2022 | 3.500% | | 6,002,000 | 6,173,009 |
| Ares Capital Corp. |
| 06/10/2024 | 4.200% | | 5,105,000 | 5,293,696 |
| Aviation Capital Group LLC(a) |
| 05/01/2023 | 3.875% | | 3,120,000 | 3,263,517 |
| Avolon Holdings Funding Ltd.(a) |
| 05/01/2022 | 3.625% | | 3,110,000 | 3,158,790 |
| 01/15/2023 | 5.500% | | 4,000,000 | 4,280,028 |
| GE Capital International Funding Co. Unlimited Co. |
| 11/15/2020 | 2.342% | | 8,137,000 | 8,081,408 |
| 11/15/2025 | 3.373% | | 750,000 | 759,614 |
| 11/15/2035 | 4.418% | | 13,006,000 | 13,217,282 |
| Park Aerospace Holdings Ltd.(a) |
| 03/15/2023 | 4.500% | | 3,915,000 | 4,064,115 |
| Quicken Loans, Inc.(a) |
| 01/15/2028 | 5.250% | | 850,000 | 884,687 |
| Total | 68,774,636 |
| Corporate Bonds & Notes (continued) |
| Issuer | Coupon
Rate | | Principal
Amount ($) | Value ($) |
| Food and Beverage 1.2% |
| Anheuser-Busch Companies LLC/InBev Worldwide, Inc. |
| 02/01/2036 | 4.700% | | 809,000 | 941,164 |
| 02/01/2046 | 4.900% | | 9,527,000 | 11,355,003 |
| Anheuser-Busch InBev Finance, Inc. |
| 02/01/2026 | 3.650% | | 1,735,000 | 1,860,444 |
| Anheuser-Busch InBev Worldwide, Inc. |
| 01/23/2039 | 5.450% | | 365,000 | 465,021 |
| 04/15/2048 | 4.600% | | 1,930,000 | 2,240,446 |
| Bacardi Ltd.(a) |
| 05/15/2028 | 4.700% | | 885,000 | 974,887 |
| 05/15/2048 | 5.300% | | 5,815,000 | 6,672,695 |
| Brown-Forman Corp. |
| 04/15/2025 | 3.500% | | 1,645,000 | 1,754,823 |
| Bunge Ltd. Finance Corp. |
| 03/15/2024 | 4.350% | | 5,170,000 | 5,502,586 |
| Campbell Soup Co. |
| 03/15/2021 | 3.300% | | 3,315,000 | 3,364,672 |
| Cargill, Inc.(a) |
| 05/23/2049 | 3.875% | | 1,140,000 | 1,341,486 |
| Central America Botling Corp.(a) |
| 01/31/2027 | 5.750% | | 1,600,000 | 1,694,157 |
| General Mills, Inc. |
| 04/17/2025 | 4.000% | | 2,524,000 | 2,736,256 |
| JBS U.S.A. Lux SA/Finance, Inc.(a) |
| 06/15/2025 | 5.750% | | 100,000 | 104,410 |
| JBS U.S.A. LUX SA/Finance, Inc.(a) |
| 07/15/2024 | 5.875% | | 4,000,000 | 4,121,060 |
| Keurig Dr Pepper, Inc. |
| 05/25/2021 | 3.551% | | 2,405,000 | 2,460,183 |
| 05/25/2023 | 4.057% | | 3,411,000 | 3,622,011 |
| Kraft Heinz Co. (The)(a) |
| 02/15/2025 | 4.875% | | 984,000 | 1,013,851 |
| Kraft Heinz Foods Co. (The) |
| 02/10/2020 | 5.375% | | 800,000 | 809,560 |
| 06/15/2023 | 4.000% | | 3,585,000 | 3,725,059 |
| 07/15/2025 | 3.950% | | 3,200,000 | 3,321,789 |
| 06/01/2026 | 3.000% | | 2,490,000 | 2,449,450 |
| 06/04/2042 | 5.000% | | 1,476,000 | 1,519,685 |
| 07/15/2045 | 5.200% | | 650,000 | 691,436 |
| 06/01/2046 | 4.375% | | 3,381,000 | 3,244,786 |
| Mars, Inc.(a) |
| 04/01/2030 | 3.200% | | 1,709,000 | 1,829,156 |
| 04/01/2039 | 3.875% | | 709,000 | 810,837 |
| Mondelez International, Inc.(a) |
| 10/28/2019 | 1.625% | | 4,800,000 | 4,794,875 |
| Mondelez International, Inc. |
| 05/07/2020 | 3.000% | | 3,870,000 | 3,888,591 |
The accompanying Notes to Financial Statements are an integral part of this statement.
| 34 | Multi-Manager Total Return Bond Strategies Fund | Annual Report 2019 |
Portfolio of Investments (continued)
August 31, 2019
| Corporate Bonds & Notes (continued) |
| Issuer | Coupon
Rate | | Principal
Amount ($) | Value ($) |
| PepsiCo, Inc. |
| 04/30/2025 | 2.750% | | 1,300,000 | 1,359,205 |
| 07/29/2029 | 2.625% | | 825,000 | 856,443 |
| 04/14/2046 | 4.450% | | 476,000 | 602,943 |
| 07/29/2049 | 3.375% | | 4,365,000 | 4,792,006 |
| Pilgrim’s Pride Corp.(a) |
| 09/30/2027 | 5.875% | | 1,194,000 | 1,286,476 |
| Post Holdings, Inc.(a) |
| 12/15/2029 | 5.500% | | 2,937,000 | 3,104,001 |
| Smithfield Foods, Inc.(a) |
| 02/01/2022 | 3.350% | | 1,110,000 | 1,114,359 |
| Sysco Corp. |
| 03/15/2025 | 3.550% | | 3,165,000 | 3,368,747 |
| Tyson Foods, Inc.(b) |
3-month USD LIBOR + 0.450%
Floor 0.450%
08/21/2020 | 2.602% | | 2,015,000 | 2,015,629 |
| Tyson Foods, Inc. |
| 08/15/2044 | 5.150% | | 200,000 | 242,945 |
| Total | 98,053,133 |
| Gaming 0.2% |
| Caesars Resort Collection LLC/CRC Finco, Inc.(a) |
| 10/15/2025 | 5.250% | | 1,513,000 | 1,538,940 |
| Churchill Downs, Inc.(a) |
| 04/01/2027 | 5.500% | | 1,364,000 | 1,449,627 |
| 01/15/2028 | 4.750% | | 200,000 | 205,880 |
| GLP Capital LP/Financing II, Inc. |
| 11/01/2023 | 5.375% | | 125,000 | 135,576 |
| 06/01/2025 | 5.250% | | 1,609,000 | 1,771,178 |
| 04/15/2026 | 5.375% | | 3,410,000 | 3,744,998 |
| 01/15/2029 | 5.300% | | 2,190,000 | 2,444,485 |
| 01/15/2030 | 4.000% | | 1,670,000 | 1,683,407 |
| MGM Growth Properties Operating Partnership LP/Finance Co-Issuer, Inc. |
| 05/01/2024 | 5.625% | | 950,000 | 1,037,685 |
| 09/01/2026 | 4.500% | | 1,915,000 | 2,006,414 |
| MGM Resorts International |
| 09/01/2026 | 4.625% | | 1,070,000 | 1,108,605 |
| Scientific Games International, Inc. |
| 12/01/2022 | 10.000% | | 1,850,000 | 1,922,431 |
| Studio City Co., Ltd.(a) |
| 11/30/2021 | 7.250% | | 600,000 | 614,883 |
| Total | 19,664,109 |
| Health Care 1.8% |
| Abbott Laboratories |
| 11/30/2021 | 2.900% | | 649,000 | 661,158 |
| 11/30/2023 | 3.400% | | 2,733,000 | 2,880,071 |
| 11/30/2036 | 4.750% | | 1,500,000 | 1,879,158 |
| 11/30/2046 | 4.900% | | 818,000 | 1,089,295 |
| Corporate Bonds & Notes (continued) |
| Issuer | Coupon
Rate | | Principal
Amount ($) | Value ($) |
| AmerisourceBergen Corp. |
| 12/15/2027 | 3.450% | | 873,000 | 910,901 |
| Ascension Health Alliance |
| 11/15/2046 | 3.945% | | 375,000 | 445,666 |
| Barnabas Health, Inc. |
| 07/01/2028 | 4.000% | | 3,200,000 | 3,347,786 |
| Becton Dickinson and Co.(b) |
3-month USD LIBOR + 0.875%
12/29/2020 | 3.194% | | 1,199,000 | 1,199,261 |
3-month USD LIBOR + 1.030%
06/06/2022 | 3.504% | | 2,963,000 | 2,976,120 |
| Becton Dickinson and Co. |
| 06/06/2022 | 2.894% | | 3,600,000 | 3,659,004 |
| 12/15/2024 | 3.734% | | 158,000 | 168,210 |
| 05/15/2044 | 4.875% | | 1,555,000 | 1,833,143 |
| Change Healthcare Holdings LLC/Finance, Inc.(a) |
| 03/01/2025 | 5.750% | | 650,000 | 653,780 |
| CHS/Community Health Systems, Inc.(a) |
| 01/15/2024 | 8.625% | | 399,000 | 402,957 |
| 06/30/2024 | 8.125% | | 4,393,000 | 3,338,680 |
| 03/15/2026 | 8.000% | | 464,000 | 447,478 |
| Cigna Corp. |
| 09/17/2020 | 3.200% | | 3,006,000 | 3,037,085 |
| 07/15/2023 | 3.750% | | 3,858,000 | 4,057,779 |
| 11/15/2025 | 4.125% | | 3,649,000 | 3,956,724 |
| 10/15/2028 | 4.375% | | 2,000,000 | 2,230,360 |
| 08/15/2038 | 4.800% | | 1,959,000 | 2,263,241 |
| 12/15/2048 | 4.900% | | 7,819,000 | 9,249,151 |
| CVS Health Corp. |
| 03/09/2023 | 3.700% | | 497,000 | 519,555 |
| 12/05/2023 | 4.000% | | 515,000 | 546,794 |
| 08/15/2024 | 2.625% | | 1,250,000 | 1,258,536 |
| 03/25/2025 | 4.100% | | 319,000 | 341,231 |
| 07/20/2025 | 3.875% | | 877,000 | 930,152 |
| 06/01/2026 | 2.875% | | 2,320,000 | 2,331,957 |
| 03/25/2028 | 4.300% | | 2,508,000 | 2,735,272 |
| 03/25/2038 | 4.780% | | 1,870,000 | 2,097,487 |
| 07/20/2045 | 5.125% | | 525,000 | 608,425 |
| 03/25/2048 | 5.050% | | 15,856,000 | 18,501,383 |
| Duke University Health System, Inc. |
| 06/01/2047 | 3.920% | | 875,000 | 1,055,766 |
| Express Scripts Holding Co. |
| 11/15/2021 | 4.750% | | 825,000 | 870,004 |
| 02/25/2026 | 4.500% | | 587,000 | 648,808 |
| 03/01/2027 | 3.400% | | 2,190,000 | 2,279,464 |
| Fresenius Medical Care US Finance III, Inc.(a) |
| 06/15/2029 | 3.750% | | 3,597,000 | 3,658,279 |
The accompanying Notes to Financial Statements are an integral part of this statement.
Multi-Manager Total Return Bond Strategies Fund | Annual Report 2019
| 35 |
Portfolio of Investments (continued)
August 31, 2019
| Corporate Bonds & Notes (continued) |
| Issuer | Coupon
Rate | | Principal
Amount ($) | Value ($) |
| HCA, Inc. |
| 05/01/2023 | 4.750% | | 175,000 | 188,059 |
| 02/01/2025 | 5.375% | | 5,275,000 | 5,859,285 |
| 04/15/2025 | 5.250% | | 3,199,000 | 3,577,669 |
| 02/15/2027 | 4.500% | | 705,000 | 764,710 |
| 06/15/2039 | 5.125% | | 2,000,000 | 2,208,060 |
| 06/15/2047 | 5.500% | | 1,088,000 | 1,255,984 |
| 06/15/2049 | 5.250% | | 7,497,000 | 8,419,896 |
| IQVIA, Inc.(a) |
| 05/15/2027 | 5.000% | | 662,000 | 697,288 |
| Mayo Clinic |
| 11/15/2052 | 4.128% | | 750,000 | 928,460 |
| MEDNAX, Inc.(a) |
| 01/15/2027 | 6.250% | | 2,059,000 | 2,028,329 |
| Medtronic, Inc. |
| 03/15/2045 | 4.625% | | 95,000 | 123,341 |
| Memorial Sloan-Kettering Cancer Center |
| 07/01/2052 | 4.125% | | 4,630,000 | 5,757,160 |
| New York and Presbyterian Hospital (The) |
| 08/01/2116 | 4.763% | | 1,050,000 | 1,328,150 |
| NYU Langone Hospitals |
| 07/01/2042 | 4.428% | | 2,807,000 | 3,419,897 |
| 07/01/2043 | 5.750% | | 705,000 | 1,025,475 |
| Polaris Intermediate Corp. PIK(a) |
| 12/01/2022 | 8.500% | | 69,000 | 58,006 |
| Quest Diagnostics, Inc. |
| 06/01/2026 | 3.450% | | 3,255,000 | 3,435,106 |
| RegionalCare Hospital Partners Holdings, Inc./LifePoint Health, Inc.(a) |
| 12/01/2026 | 9.750% | | 3,400,000 | 3,634,923 |
| Surgery Center Holdings, Inc.(a) |
| 07/01/2025 | 6.750% | | 43,000 | 36,903 |
| Sutter Health |
| 08/15/2053 | 2.286% | | 2,300,000 | 2,304,170 |
| Teleflex, Inc. |
| 11/15/2027 | 4.625% | | 572,000 | 604,296 |
| Tenet Healthcare Corp. |
| 04/01/2021 | 4.500% | | 1,809,000 | 1,874,567 |
| 10/01/2021 | 4.375% | | 25,000 | 26,178 |
| 07/15/2024 | 4.625% | | 1,301,000 | 1,338,147 |
| 05/01/2025 | 5.125% | | 106,000 | 106,164 |
| 08/01/2025 | 7.000% | | 2,025,000 | 2,045,414 |
| Tenet Healthcare Corp.(a) |
| 01/01/2026 | 4.875% | | 910,000 | 935,272 |
| 11/01/2027 | 5.125% | | 3,076,000 | 3,178,440 |
| Texas Health Resources |
| 11/15/2055 | 4.330% | | 700,000 | 877,103 |
| Thermo Fisher Scientific, Inc. |
| 01/15/2023 | 3.150% | | 711,000 | 732,877 |
| Corporate Bonds & Notes (continued) |
| Issuer | Coupon
Rate | | Principal
Amount ($) | Value ($) |
| Zimmer Biomet Holdings, Inc.(b) |
3-month USD LIBOR + 0.750%
03/19/2021 | 3.169% | | 3,315,000 | 3,311,118 |
| Zimmer Biomet Holdings, Inc. |
| 04/01/2025 | 3.550% | | 985,000 | 1,035,800 |
| Total | 152,186,368 |
| Healthcare Insurance 0.3% |
| Aetna, Inc. |
| 05/15/2042 | 4.500% | | 429,000 | 463,882 |
| Anthem, Inc. |
| 01/15/2043 | 4.650% | | 2,600,000 | 2,955,904 |
| 01/15/2044 | 5.100% | | 1,185,000 | 1,430,886 |
| Centene Corp.(a) |
| 06/01/2026 | 5.375% | | 600,000 | 640,109 |
| Cigna Corp. |
| 10/15/2027 | 3.050% | | 2,410,000 | 2,454,932 |
| Humana, Inc. |
| 08/15/2049 | 3.950% | | 3,145,000 | 3,281,446 |
| Molina Healthcare, Inc. |
| 11/15/2022 | 5.375% | | 1,231,000 | 1,315,032 |
| UnitedHealth Group, Inc. |
| 08/15/2029 | 2.875% | | 1,696,000 | 1,767,620 |
| 08/15/2039 | 3.500% | | 641,000 | 684,142 |
| 07/15/2045 | 4.750% | | 2,060,000 | 2,570,588 |
| 01/15/2047 | 4.200% | | 503,000 | 586,848 |
| 08/15/2059 | 3.875% | | 448,000 | 493,804 |
| WellCare Health Plans, Inc. |
| 04/01/2025 | 5.250% | | 11,000 | 11,530 |
| WellCare Health Plans, Inc.(a) |
| 08/15/2026 | 5.375% | | 400,000 | 426,213 |
| Wellpoint, Inc. |
| 08/15/2024 | 3.500% | | 2,089,000 | 2,189,911 |
| Total | 21,272,847 |
| Healthcare REIT 0.2% |
| HCP, Inc. |
| 11/15/2023 | 4.250% | | 1,934,000 | 2,077,455 |
| 08/15/2024 | 3.875% | | 627,000 | 673,575 |
| Healthcare Realty Trust, Inc. |
| 05/01/2025 | 3.875% | | 440,000 | 462,650 |
| Healthcare Trust of America Holdings LP |
| 07/15/2021 | 3.375% | | 2,765,000 | 2,813,473 |
| Omega Healthcare Investors, Inc. |
| 01/15/2025 | 4.500% | | 975,000 | 1,030,073 |
| Sabra Health Care LP/Capital Corp. |
| 06/01/2024 | 4.800% | | 1,610,000 | 1,691,798 |
The accompanying Notes to Financial Statements are an integral part of this statement.
| 36 | Multi-Manager Total Return Bond Strategies Fund | Annual Report 2019 |
Portfolio of Investments (continued)
August 31, 2019
| Corporate Bonds & Notes (continued) |
| Issuer | Coupon
Rate | | Principal
Amount ($) | Value ($) |
| Ventas Realty LP |
| 04/15/2049 | 4.875% | | 2,260,000 | 2,758,671 |
| Welltower, Inc. |
| 01/15/2030 | 3.100% | | 4,175,000 | 4,243,650 |
| Total | 15,751,345 |
| Home Construction 0.2% |
| Mattamy Group Corp.(a) |
| 12/15/2023 | 6.875% | | 4,037,000 | 4,201,249 |
| PulteGroup, Inc. |
| 03/01/2026 | 5.500% | | 1,700,000 | 1,858,926 |
| 01/15/2027 | 5.000% | | 1,425,000 | 1,532,901 |
| Taylor Morrison Communities, Inc./Holdings II(a) |
| 04/15/2023 | 5.875% | | 3,446,000 | 3,650,141 |
| William Lyon Homes, Inc. |
| 01/31/2025 | 5.875% | | 3,100,000 | 3,116,970 |
| Total | 14,360,187 |
| Independent Energy 0.5% |
| Afren PLC(a),(k) |
| 12/09/2020 | 0.000% | | 195,167 | 279 |
| Anadarko Petroleum Corp.(i) |
| 10/10/2036 | 0.000% | | 3,000,000 | 1,466,718 |
| Apache Corp. |
| 01/15/2044 | 4.250% | | 715,000 | 646,697 |
| 07/01/2049 | 5.350% | | 4,120,000 | 4,303,266 |
| Ascent Resources Utica Holdings LLC/ARU Finance Corp.(a) |
| 04/01/2022 | 10.000% | | 425,000 | 426,020 |
| 11/01/2026 | 7.000% | | 600,000 | 492,458 |
| Canadian Natural Resources Ltd. |
| 06/30/2033 | 6.450% | | 730,000 | 944,396 |
| Centennial Resource Production LLC(a) |
| 04/01/2027 | 6.875% | | 395,000 | 394,971 |
| Cimarex Energy Co. |
| 06/01/2024 | 4.375% | | 209,000 | 220,503 |
| 05/15/2027 | 3.900% | | 831,000 | 849,083 |
| 03/15/2029 | 4.375% | | 228,000 | 241,920 |
| Conoco Funding Co. |
| 10/15/2031 | 7.250% | | 2,000,000 | 2,879,928 |
| Continental Resources, Inc. |
| 04/15/2023 | 4.500% | | 385,000 | 398,546 |
| 06/01/2024 | 3.800% | | 4,052,000 | 4,109,705 |
| CrownRock LP/Finance, Inc.(a) |
| 10/15/2025 | 5.625% | | 187,000 | 184,713 |
| Devon Energy Corp. |
| 07/15/2041 | 5.600% | | 1,875,000 | 2,307,030 |
| EOG Resources, Inc. |
| 03/15/2023 | 2.625% | | 2,340,000 | 2,390,656 |
| Corporate Bonds & Notes (continued) |
| Issuer | Coupon
Rate | | Principal
Amount ($) | Value ($) |
| EQT Corp. |
| 10/01/2027 | 3.900% | | 2,000,000 | 1,735,584 |
| Extraction Oil & Gas, Inc.(a) |
| 05/15/2024 | 7.375% | | 99,000 | 73,983 |
| Gulfport Energy Corp. |
| 05/15/2025 | 6.375% | | 175,000 | 128,153 |
| Matador Resources Co. |
| 09/15/2026 | 5.875% | | 550,000 | 534,731 |
| MEG Energy Corp.(a) |
| 03/31/2024 | 7.000% | | 3,000,000 | 2,856,999 |
| Newfield Exploration Co. |
| 07/01/2024 | 5.625% | | 6,305,000 | 6,949,560 |
| Occidental Petroleum Corp. |
| 08/15/2022 | 2.700% | | 4,500,000 | 4,542,282 |
| 08/15/2024 | 2.900% | | 1,153,000 | 1,162,897 |
| 04/15/2026 | 3.400% | | 775,000 | 787,987 |
| Parsley Energy LLC/Finance Corp.(a) |
| 01/15/2025 | 5.375% | | 1,000,000 | 1,019,476 |
| 08/15/2025 | 5.250% | | 312,000 | 316,846 |
| WPX Energy, Inc. |
| 01/15/2022 | 6.000% | | 161,000 | 166,233 |
| 09/15/2024 | 5.250% | | 78,000 | 79,339 |
| 06/01/2026 | 5.750% | | 2,175,000 | 2,255,501 |
| Total | 44,866,460 |
| Integrated Energy 0.3% |
| BP Capital Markets America, Inc. |
| 05/06/2022 | 3.245% | | 1,875,000 | 1,935,651 |
| 05/10/2023 | 2.750% | | 1,500,000 | 1,536,783 |
| 04/14/2024 | 3.224% | | 989,000 | 1,033,697 |
| Cenovus Energy, Inc. |
| 09/15/2023 | 3.800% | | 726,000 | 750,197 |
| 11/15/2039 | 6.750% | | 2,500,000 | 3,072,592 |
| 06/15/2047 | 5.400% | | 337,000 | 381,105 |
| Chevron Corp. |
| 06/24/2023 | 3.191% | | 700,000 | 733,454 |
| 05/16/2026 | 2.954% | | 1,875,000 | 1,982,314 |
| Exxon Mobil Corp. |
| 03/01/2023 | 2.726% | | 715,000 | 736,887 |
| 08/16/2039 | 2.995% | | 585,000 | 603,227 |
| 08/16/2049 | 3.095% | | 6,608,000 | 6,855,364 |
| Husky Energy, Inc. |
| 04/15/2022 | 3.950% | | 3,000,000 | 3,104,451 |
| Shell International Finance BV |
| 05/11/2025 | 3.250% | | 821,000 | 872,817 |
| Total Capital Canada Ltd. |
| 07/15/2023 | 2.750% | | 717,000 | 738,326 |
The accompanying Notes to Financial Statements are an integral part of this statement.
Multi-Manager Total Return Bond Strategies Fund | Annual Report 2019
| 37 |
Portfolio of Investments (continued)
August 31, 2019
| Corporate Bonds & Notes (continued) |
| Issuer | Coupon
Rate | | Principal
Amount ($) | Value ($) |
| Total Capital International SA |
| 07/12/2049 | 3.461% | | 1,277,000 | 1,377,543 |
| Total | 25,714,408 |
| Leisure 0.1% |
| AMC Entertainment Holdings, Inc. |
| 11/15/2026 | 5.875% | | 3,400,000 | 3,120,397 |
| Six Flags Entertainment Corp.(a) |
| 04/15/2027 | 5.500% | | 2,145,000 | 2,304,599 |
| Total | 5,424,996 |
| Life Insurance 0.6% |
| Aflac, Inc. |
| 01/15/2049 | 4.750% | | 1,555,000 | 1,952,041 |
| AIG Global Funding(a) |
| 07/02/2020 | 2.150% | | 590,000 | 590,309 |
| American International Group, Inc. |
| 02/15/2024 | 4.125% | | 1,600,000 | 1,722,946 |
| 07/16/2044 | 4.500% | | 554,000 | 632,438 |
| 04/01/2048 | 4.750% | | 1,364,000 | 1,623,277 |
| American International Group, Inc.(j) |
| 04/01/2048 | 5.750% | | 616,000 | 648,663 |
| Athene Global Funding(a) |
| 04/20/2020 | 2.750% | | 2,385,000 | 2,392,847 |
| 07/01/2022 | 3.000% | | 1,270,000 | 1,293,877 |
| Athene Holding Ltd. |
| 01/12/2028 | 4.125% | | 2,435,000 | 2,501,132 |
| Brighthouse Financial, Inc. |
| 06/22/2027 | 3.700% | | 1,385,000 | 1,367,858 |
| 06/22/2047 | 4.700% | | 5,995,000 | 5,400,632 |
| Guardian Life Global Funding(a) |
| 04/26/2021 | 2.000% | | 3,465,000 | 3,456,854 |
| Harborwalk Funding Trust(a),(j) |
| Subordinated |
| 02/15/2069 | 5.077% | | 1,190,000 | 1,479,241 |
| Lincoln National Corp. |
| 01/15/2030 | 3.050% | | 4,530,000 | 4,592,809 |
| 06/15/2040 | 7.000% | | 930,000 | 1,337,402 |
| Pine Street Trust II(a) |
| 02/15/2049 | 5.568% | | 1,890,000 | 2,165,424 |
| Pricoa Global Funding I(a) |
| 09/13/2019 | 1.450% | | 2,825,000 | 2,823,977 |
| Principal Financial Group, Inc. |
| 09/15/2022 | 3.300% | | 1,510,000 | 1,561,221 |
| 05/15/2023 | 3.125% | | 667,000 | 689,635 |
| Reliance Standard Life Global Funding II(a) |
| 09/19/2023 | 3.850% | | 6,155,000 | 6,482,452 |
| Corporate Bonds & Notes (continued) |
| Issuer | Coupon
Rate | | Principal
Amount ($) | Value ($) |
| Teachers Insurance & Annuity Association of America(a) |
| Subordinated |
| 09/15/2044 | 4.900% | | 1,500,000 | 1,882,092 |
| 05/15/2047 | 4.270% | | 4,575,000 | 5,322,276 |
| Unum Group |
| 05/15/2021 | 3.000% | | 1,250,000 | 1,263,360 |
| 06/15/2029 | 4.000% | | 1,315,000 | 1,378,565 |
| Total | 54,561,328 |
| Lodging 0.1% |
| Marriott International, Inc. |
| 12/01/2023 | 4.150% | | 3,885,000 | 4,161,165 |
| 06/15/2026 | 3.125% | | 1,460,000 | 1,492,942 |
| Total | 5,654,107 |
| Media and Entertainment 0.6% |
| Activision Blizzard, Inc. |
| 09/15/2021 | 2.300% | | 795,000 | 795,553 |
| AMC Networks, Inc. |
| 04/01/2024 | 5.000% | | 2,050,000 | 2,117,572 |
| CBS Corp. |
| 06/01/2023 | 2.900% | | 3,330,000 | 3,394,669 |
| 05/15/2033 | 5.500% | | 1,500,000 | 1,807,230 |
| Clear Channel International BV(a) |
| 12/15/2020 | 8.750% | | 537,000 | 548,744 |
| Clear Channel Worldwide Holdings, Inc. |
| 11/15/2022 | 6.500% | | 1,625,000 | 1,660,214 |
| 11/15/2022 | 6.500% | | 1,045,000 | 1,067,645 |
| Discovery Communications LLC |
| 06/15/2022 | 3.500% | | 3,739,000 | 3,848,964 |
| 03/20/2023 | 2.950% | | 940,000 | 959,705 |
| 09/20/2037 | 5.000% | | 1,067,000 | 1,177,463 |
| 09/20/2047 | 5.200% | | 759,000 | 858,948 |
| Electronic Arts, Inc. |
| 03/01/2021 | 3.700% | | 3,086,000 | 3,151,346 |
| Gray Television, Inc.(a) |
| 05/15/2027 | 7.000% | | 2,125,000 | 2,324,340 |
| Interpublic Group of Companies, Inc. (The) |
| 10/01/2020 | 3.500% | | 1,770,000 | 1,794,821 |
| 10/01/2021 | 3.750% | | 891,000 | 916,270 |
| Nielsen Finance Co. SARL(a) |
| 10/01/2021 | 5.500% | | 75,000 | 75,200 |
| Nielsen Finance LLC/Co.(a) |
| 04/15/2022 | 5.000% | | 2,750,000 | 2,773,997 |
| RELX Capital, Inc. |
| 10/15/2022 | 3.125% | | 628,000 | 643,833 |
| Sinclair Television Group, Inc. |
| 10/01/2022 | 6.125% | | 75,000 | 76,287 |
The accompanying Notes to Financial Statements are an integral part of this statement.
| 38 | Multi-Manager Total Return Bond Strategies Fund | Annual Report 2019 |
Portfolio of Investments (continued)
August 31, 2019
| Corporate Bonds & Notes (continued) |
| Issuer | Coupon
Rate | | Principal
Amount ($) | Value ($) |
| Sinclair Television Group, Inc.(a) |
| 02/15/2027 | 5.125% | | 2,275,000 | 2,280,940 |
| Viacom, Inc. |
| 09/01/2023 | 4.250% | | 2,410,000 | 2,569,561 |
| 04/30/2036 | 6.875% | | 4,450,000 | 5,983,755 |
| 03/15/2043 | 4.375% | | 965,000 | 1,026,983 |
| 04/01/2044 | 5.250% | | 2,312,000 | 2,733,679 |
| Walt Disney Co. (The) |
| 09/17/2020 | 2.150% | | 1,500,000 | 1,504,850 |
| Walt Disney Co. (The)(a) |
| 03/15/2033 | 6.550% | | 1,000,000 | 1,434,969 |
| 11/15/2046 | 4.750% | | 935,000 | 1,231,605 |
| Warner Media LLC |
| 02/15/2027 | 3.800% | | 735,000 | 767,353 |
| Total | 49,526,496 |
| Metals and Mining 0.2% |
| Anglo American Capital PLC(a) |
| 05/14/2025 | 4.875% | | 505,000 | 548,162 |
| ArcelorMittal(j) |
| 03/01/2021 | 5.500% | | 1,248,000 | 1,301,936 |
| ArcelorMittal |
| 07/16/2024 | 3.600% | | 6,825,000 | 6,929,320 |
| 07/16/2029 | 4.250% | | 1,283,000 | 1,292,830 |
| Glencore Funding LLC(a) |
| 03/12/2024 | 4.125% | | 2,750,000 | 2,890,110 |
| Novelis Corp.(a) |
| 09/30/2026 | 5.875% | | 1,425,000 | 1,505,581 |
| Southern Copper Corp. |
| 11/08/2022 | 3.500% | | 130,000 | 133,480 |
| 04/23/2025 | 3.875% | | 600,000 | 628,208 |
| Teck Resources Ltd. |
| 08/15/2040 | 6.000% | | 1,150,000 | 1,265,519 |
| Vale Overseas Ltd. |
| 01/11/2022 | 4.375% | | 36,000 | 37,228 |
| Volcan Cia Minera SAA(a) |
| 02/02/2022 | 5.375% | | 100,000 | 103,530 |
| Total | 16,635,904 |
| Midstream 1.2% |
| Colonial Pipeline Co.(a) |
| 10/15/2020 | 3.500% | | 1,519,000 | 1,535,033 |
| Colorado Interstate Gas Co. LLC/Issuing Corp.(a) |
| 08/15/2026 | 4.150% | | 2,290,000 | 2,432,131 |
| Enbridge, Inc.(j) |
| Subordinated |
| 03/01/2078 | 6.250% | | 601,000 | 629,820 |
| Corporate Bonds & Notes (continued) |
| Issuer | Coupon
Rate | | Principal
Amount ($) | Value ($) |
| Energy Transfer Operating LP |
| 06/01/2021 | 4.650% | | 395,000 | 407,928 |
| 03/15/2023 | 4.250% | | 1,890,000 | 1,983,387 |
| 01/15/2024 | 5.875% | | 3,575,000 | 3,999,331 |
| 06/01/2027 | 5.500% | | 1,758,000 | 2,010,338 |
| 04/15/2047 | 5.300% | | 1,656,000 | 1,818,169 |
| Energy Transfer Partners LP |
| 10/01/2043 | 5.950% | | 280,000 | 322,684 |
| 03/15/2045 | 5.150% | | 2,220,000 | 2,370,096 |
| Energy Transfer Partners LP/Regency Finance Corp. |
| 11/01/2023 | 4.500% | | 2,500,000 | 2,659,965 |
| Enterprise Products Operating LLC |
| 02/01/2022 | 3.500% | | 802,000 | 829,293 |
| 02/15/2024 | 3.900% | | 500,000 | 534,819 |
| 02/15/2025 | 3.750% | | 600,000 | 642,865 |
| 05/15/2046 | 4.900% | | 1,809,000 | 2,139,689 |
| 01/31/2050 | 4.200% | | 269,000 | 292,744 |
| Enterprise Products Operating LLC(j) |
| 08/16/2077 | 4.875% | | 673,000 | 644,055 |
| 02/15/2078 | 5.375% | | 5,795,000 | 5,600,676 |
| EQT Midstream Partners LP |
| 07/15/2028 | 5.500% | | 1,360,000 | 1,374,880 |
| Ferrellgas Partners LP/Finance Corp. |
| 05/01/2021 | 6.500% | | 350,000 | 300,759 |
| 01/15/2022 | 6.750% | | 150,000 | 128,232 |
| 06/15/2023 | 6.750% | | 200,000 | 168,213 |
| Hess Infrastructure Partners LP/Finance Corp.(a) |
| 02/15/2026 | 5.625% | | 775,000 | 801,703 |
| Kinder Morgan Energy Partners LP |
| 09/01/2024 | 4.250% | | 500,000 | 537,844 |
| 03/15/2032 | 7.750% | | 635,000 | 880,800 |
| 09/01/2039 | 6.500% | | 1,000,000 | 1,282,446 |
| 11/15/2040 | 7.500% | | 730,000 | 1,008,797 |
| 09/01/2044 | 5.400% | | 826,000 | 961,990 |
| Magellan Midstream Partners LP |
| 09/15/2046 | 4.250% | | 320,000 | 348,212 |
| Midwest Connector Capital Co., LLC(a) |
| 04/01/2022 | 3.625% | | 3,900,000 | 4,008,221 |
| MPLX LP |
| 12/01/2024 | 4.875% | | 325,000 | 356,709 |
| 06/01/2025 | 4.875% | | 200,000 | 220,794 |
| 03/01/2027 | 4.125% | | 1,147,000 | 1,206,759 |
| 03/01/2047 | 5.200% | | 1,500,000 | 1,638,189 |
| NGPL PipeCo LLC(a) |
| 08/15/2022 | 4.375% | | 151,000 | 156,031 |
| 08/15/2027 | 4.875% | | 412,000 | 438,650 |
| ONEOK Partners LP |
| 10/01/2022 | 3.375% | | 1,131,000 | 1,158,627 |
The accompanying Notes to Financial Statements are an integral part of this statement.
Multi-Manager Total Return Bond Strategies Fund | Annual Report 2019
| 39 |
Portfolio of Investments (continued)
August 31, 2019
| Corporate Bonds & Notes (continued) |
| Issuer | Coupon
Rate | | Principal
Amount ($) | Value ($) |
| ONEOK, Inc. |
| 07/13/2047 | 4.950% | | 2,050,000 | 2,212,044 |
| 09/01/2049 | 4.450% | | 6,030,000 | 6,127,517 |
| Peru LNG Srl(a) |
| 03/22/2030 | 5.375% | | 450,000 | 485,102 |
| Phillips 66 Partners LP |
| 02/15/2045 | 4.680% | | 1,300,000 | 1,403,198 |
| Plains All American Pipeline LP/Finance Corp. |
| 10/15/2025 | 4.650% | | 3,375,000 | 3,613,778 |
| 06/01/2042 | 5.150% | | 2,185,000 | 2,276,420 |
| Rockies Express Pipeline LLC(a) |
| 04/15/2020 | 5.625% | | 2,868,000 | 2,912,821 |
| Ruby Pipeline LLC(a) |
| 04/01/2022 | 6.000% | | 2,363,636 | 2,458,274 |
| Southern Natural Gas Co. LLC |
| 02/15/2031 | 7.350% | | 2,910,000 | 3,835,979 |
| Spectra Energy Partners LP |
| 09/25/2043 | 5.950% | | 514,000 | 671,060 |
| Suburban Propane Partners LP/Energy Finance Corp. |
| 03/01/2025 | 5.750% | | 225,000 | 228,912 |
| Sunoco Logistics Partners Operations LP |
| 10/01/2047 | 5.400% | | 1,100,000 | 1,226,712 |
| Tallgrass Energy Partners LP/Finance Corp.(a) |
| 01/15/2028 | 5.500% | | 942,000 | 886,195 |
| Targa Pipeline Partners LP/Finance Corp. |
| 08/01/2023 | 5.875% | | 100,000 | 100,606 |
| Targa Resources Partners LP/Finance Corp. |
| 02/01/2027 | 5.375% | | 512,000 | 528,675 |
| Tennessee Gas Pipeline Co. LLC |
| 06/15/2032 | 8.375% | | 1,970,000 | 2,776,813 |
| 04/01/2037 | 7.625% | | 550,000 | 762,048 |
| Texas Eastern Transmission LP(a) |
| 10/15/2022 | 2.800% | | 1,000,000 | 1,009,426 |
| Transcontinental Gas Pipe Line Co. LLC |
| 03/15/2048 | 4.600% | | 4,875,000 | 5,491,093 |
| Western Gas Partners LP |
| 07/01/2022 | 4.000% | | 296,000 | 301,535 |
| Williams Companies, Inc. (The) |
| 11/15/2020 | 4.125% | | 1,000,000 | 1,017,006 |
| 01/15/2025 | 3.900% | | 1,050,000 | 1,105,667 |
| 09/15/2025 | 4.000% | | 1,332,000 | 1,414,747 |
| 06/15/2027 | 3.750% | | 366,000 | 382,394 |
| 04/15/2040 | 6.300% | | 2,520,000 | 3,159,059 |
| Williams Partners LP |
| 03/04/2024 | 4.300% | | 2,787,000 | 2,982,240 |
| Total | 97,200,200 |
| Corporate Bonds & Notes (continued) |
| Issuer | Coupon
Rate | | Principal
Amount ($) | Value ($) |
| Natural Gas 0.2% |
| Atmos Energy Corp. |
| 10/15/2044 | 4.125% | | 2,045,000 | 2,423,480 |
| Boston Gas Co.(a) |
| 08/01/2027 | 3.150% | | 1,472,000 | 1,546,276 |
| KeySpan Corp. |
| 11/15/2030 | 8.000% | | 670,000 | 948,368 |
| NiSource, Inc. |
| 02/15/2023 | 3.850% | | 1,175,000 | 1,228,972 |
| 06/15/2041 | 5.950% | | 535,000 | 704,268 |
| Sempra Energy |
| 02/01/2038 | 3.800% | | 1,020,000 | 1,070,956 |
| 02/01/2048 | 4.000% | | 1,420,000 | 1,533,154 |
| Southern California Gas Co. |
| 02/15/2050 | 3.950% | | 4,495,000 | 5,221,869 |
| Southern Co. Gas Capital Corp. |
| 05/30/2047 | 4.400% | | 752,000 | 858,762 |
| Total | 15,536,105 |
| Office REIT 0.2% |
| Boston Properties LP |
| 02/01/2023 | 3.850% | | 2,500,000 | 2,632,478 |
| 06/21/2029 | 3.400% | | 4,110,000 | 4,357,956 |
| Highwoods Realty LP |
| 06/15/2021 | 3.200% | | 1,820,000 | 1,841,347 |
| Kilroy Realty LP |
| 12/15/2024 | 3.450% | | 721,000 | 755,814 |
| Select Income REIT |
| 05/15/2024 | 4.250% | | 1,865,000 | 1,906,401 |
| SL Green Operating Partnership LP |
| 10/15/2022 | 3.250% | | 2,260,000 | 2,310,870 |
| Total | 13,804,866 |
| Oil Field Services 0.1% |
| Baker Hughes, a GE Co. LLC/Co-Obligor, Inc. |
| 12/15/2047 | 4.080% | | 2,250,000 | 2,204,539 |
| Halliburton Co. |
| 08/01/2023 | 3.500% | | 1,308,000 | 1,363,589 |
| Schlumberger Holdings Corp.(a) |
| 12/21/2025 | 4.000% | | 135,000 | 144,463 |
| 05/17/2028 | 3.900% | | 2,053,000 | 2,180,756 |
| Schlumberger Investment SA(a) |
| 08/01/2022 | 2.400% | | 850,000 | 857,994 |
| Schlumberger Norge AS(a) |
| 01/15/2021 | 4.200% | | 681,000 | 696,795 |
| Transocean Pontus Ltd.(a) |
| 08/01/2025 | 6.125% | | 1,134,750 | 1,151,540 |
The accompanying Notes to Financial Statements are an integral part of this statement.
| 40 | Multi-Manager Total Return Bond Strategies Fund | Annual Report 2019 |
Portfolio of Investments (continued)
August 31, 2019
| Corporate Bonds & Notes (continued) |
| Issuer | Coupon
Rate | | Principal
Amount ($) | Value ($) |
| Transocean Poseidon Ltd.(a) |
| 02/01/2027 | 6.875% | | 318,000 | 330,924 |
| Transocean Proteus Ltd.(a) |
| 12/01/2024 | 6.250% | | 417,000 | 426,451 |
| USA Compression Partners LP/Finance Corp.(a) |
| 09/01/2027 | 6.875% | | 549,000 | 563,475 |
| Total | 9,920,526 |
| Other Financial Institutions 0.1% |
| Mitsubishi UFJ Lease & Finance Co., Ltd.(a) |
| 09/19/2022 | 2.652% | | 3,905,000 | 3,934,119 |
| Nationstar Mortgage Holdings, Inc.(a) |
| 07/15/2023 | 8.125% | | 2,575,000 | 2,665,586 |
| ORIX Corp. |
| 12/04/2024 | 3.250% | | 1,560,000 | 1,629,144 |
| Total | 8,228,849 |
| Other Industry 0.3% |
| AECOM |
| 03/15/2027 | 5.125% | | 800,000 | 836,267 |
| Anixter, Inc. |
| 03/01/2023 | 5.500% | | 75,000 | 80,546 |
| Five Point Operating Co. LP/Capital Corp.(a) |
| 11/15/2025 | 7.875% | | 2,350,000 | 2,360,998 |
| Greystar Real Estate Partners LLC(a) |
| 12/01/2025 | 5.750% | | 2,175,000 | 2,228,733 |
| Massachusetts Institute of Technology |
| 07/01/2114 | 4.678% | | 1,768,000 | 2,634,596 |
| 07/01/2116 | 3.885% | | 1,850,000 | 2,307,733 |
| Northwestern University |
| 12/01/2057 | 3.662% | | 1,350,000 | 1,636,284 |
| President and Fellows of Harvard College |
| 07/15/2046 | 3.150% | | 3,031,000 | 3,346,924 |
| 07/15/2056 | 3.300% | | 2,230,000 | 2,481,847 |
| Trustees of the University of Pennsylvania (The) |
| 09/01/2112 | 4.674% | | 1,620,000 | 2,258,205 |
| University of Southern California |
| 10/01/2039 | 3.028% | | 4,525,000 | 4,825,406 |
| Total | 24,997,539 |
| Other REIT 0.3% |
| American Campus Communities Operating Partnership LP |
| 10/01/2020 | 3.350% | | 2,556,000 | 2,586,470 |
| 04/15/2023 | 3.750% | | 2,400,000 | 2,513,518 |
| Duke Realty LP |
| 02/15/2021 | 3.875% | | 2,520,000 | 2,573,242 |
| EPR Properties |
| 08/15/2029 | 3.750% | | 4,280,000 | 4,309,776 |
| Corporate Bonds & Notes (continued) |
| Issuer | Coupon
Rate | | Principal
Amount ($) | Value ($) |
| ESH Hospitality, Inc.(a) |
| 05/01/2025 | 5.250% | | 805,000 | 831,744 |
| Host Hotels & Resorts LP |
| 06/15/2025 | 4.000% | | 1,050,000 | 1,114,588 |
| 02/01/2026 | 4.500% | | 520,000 | 568,751 |
| Liberty Property LP |
| 06/15/2023 | 3.375% | | 2,500,000 | 2,591,707 |
| Life Storage LP |
| 12/15/2027 | 3.875% | | 2,000,000 | 2,137,542 |
| ProLogis LP |
| 08/15/2023 | 4.250% | | 1,600,000 | 1,730,861 |
| Total | 20,958,199 |
| Packaging 0.2% |
| Amcor Finance USA, Inc.(a) |
| 04/28/2026 | 3.625% | | 1,000,000 | 1,036,639 |
| 05/15/2028 | 4.500% | | 1,600,000 | 1,756,397 |
| Ball Corp. |
| 11/15/2023 | 4.000% | | 300,000 | 316,186 |
| 03/15/2026 | 4.875% | | 600,000 | 657,704 |
| Berry Global Escrow Corp.(a) |
| 07/15/2026 | 4.875% | | 580,000 | 610,562 |
| Berry Global, Inc. |
| 07/15/2023 | 5.125% | | 168,000 | 172,243 |
| OI European Group BV(a) |
| 03/15/2023 | 4.000% | | 134,000 | 135,384 |
| Owens-Brockway Glass Container, Inc.(a) |
| 01/15/2022 | 5.000% | | 50,000 | 51,314 |
| 08/15/2023 | 5.875% | | 600,000 | 639,040 |
| 01/15/2025 | 5.375% | | 150,000 | 154,582 |
| Reynolds Group Issuer, Inc./LLC |
| 10/15/2020 | 5.750% | | 8,219,972 | 8,242,240 |
| Total | 13,772,291 |
| Paper 0.1% |
| Celulosa Arauco y Constitucion SA(a) |
| 04/30/2029 | 4.250% | | 500,000 | 526,785 |
| Georgia-Pacific LLC(a) |
| 11/15/2021 | 3.163% | | 1,000,000 | 1,018,765 |
| Plum Creek Timberlands LP |
| 03/15/2023 | 3.250% | | 1,630,000 | 1,674,537 |
| Rayonier AM Products, Inc.(a) |
| 06/01/2024 | 5.500% | | 310,000 | 206,141 |
| Suzano Austria GmbH |
| 01/15/2030 | 5.000% | | 825,000 | 850,362 |
The accompanying Notes to Financial Statements are an integral part of this statement.
Multi-Manager Total Return Bond Strategies Fund | Annual Report 2019
| 41 |
Portfolio of Investments (continued)
August 31, 2019
| Corporate Bonds & Notes (continued) |
| Issuer | Coupon
Rate | | Principal
Amount ($) | Value ($) |
| WRKCo, Inc. |
| 03/15/2026 | 4.650% | | 4,825,000 | 5,335,147 |
| 03/15/2029 | 4.900% | | 2,130,000 | 2,429,727 |
| 06/01/2032 | 4.200% | | 250,000 | 276,114 |
| Total | 12,317,578 |
| Pharmaceuticals 1.3% |
| AbbVie, Inc. |
| 05/14/2020 | 2.500% | | 1,200,000 | 1,202,185 |
| 11/06/2022 | 2.900% | | 3,758,000 | 3,827,779 |
| 05/14/2025 | 3.600% | | 4,995,000 | 5,206,693 |
| 05/14/2035 | 4.500% | | 1,956,000 | 2,124,498 |
| 11/06/2042 | 4.400% | | 1,650,000 | 1,736,211 |
| 05/14/2046 | 4.450% | | 632,000 | 667,712 |
| 11/14/2048 | 4.875% | | 600,000 | 673,861 |
| Allergan Finance LLC |
| 10/01/2022 | 3.250% | | 3,600,000 | 3,683,268 |
| 10/01/2042 | 4.625% | | 1,000,000 | 1,070,435 |
| Allergan Funding SCS |
| 03/15/2025 | 3.800% | | 2,980,000 | 3,133,780 |
| 03/15/2035 | 4.550% | | 4,329,000 | 4,632,731 |
| Amgen, Inc. |
| 05/01/2020 | 2.125% | | 609,000 | 608,641 |
| 05/01/2045 | 4.400% | | 2,190,000 | 2,491,594 |
| 06/15/2048 | 4.563% | | 751,000 | 875,897 |
| 06/15/2051 | 4.663% | | 1,633,000 | 1,941,127 |
| AstraZeneca PLC |
| 11/16/2020 | 2.375% | | 1,020,000 | 1,022,751 |
| Bausch Health Companies, Inc.(a) |
| 04/15/2025 | 6.125% | | 2,825,000 | 2,919,440 |
| Bayer US Finance II LLC(a),(b) |
3-month USD LIBOR + 0.630%
06/25/2021 | 2.979% | | 1,825,000 | 1,824,876 |
3-month USD LIBOR + 1.010%
12/15/2023 | 3.420% | | 1,000,000 | 999,097 |
| Bayer US Finance II LLC(a) |
| 06/25/2021 | 3.500% | | 800,000 | 816,122 |
| 07/15/2024 | 3.375% | | 3,555,000 | 3,652,133 |
| 12/15/2028 | 4.375% | | 4,500,000 | 4,910,107 |
| 06/25/2038 | 4.625% | | 1,000,000 | 1,100,985 |
| 06/25/2048 | 4.875% | | 1,250,000 | 1,405,362 |
| Bayer US Finance LLC(a) |
| 10/08/2019 | 2.375% | | 1,310,000 | 1,309,280 |
| 10/08/2024 | 3.375% | | 520,000 | 535,128 |
| Bristol-Myers Squibb Co.(a) |
| 07/26/2029 | 3.400% | | 2,995,000 | 3,241,402 |
| 06/15/2039 | 4.125% | | 1,372,000 | 1,597,262 |
| 10/26/2049 | 4.250% | | 2,080,000 | 2,494,407 |
| Corporate Bonds & Notes (continued) |
| Issuer | Coupon
Rate | | Principal
Amount ($) | Value ($) |
| Celgene Corp. |
| 08/15/2025 | 3.875% | | 1,578,000 | 1,710,767 |
| 05/15/2044 | 4.625% | | 555,000 | 670,104 |
| 08/15/2045 | 5.000% | | 3,200,000 | 4,116,659 |
| 11/15/2047 | 4.350% | | 2,060,000 | 2,488,766 |
| 02/20/2048 | 4.550% | | 2,719,000 | 3,363,765 |
| Eli Lilly & Co. |
| 03/15/2049 | 3.950% | | 972,000 | 1,135,640 |
| Gilead Sciences, Inc. |
| 12/01/2021 | 4.400% | | 1,364,000 | 1,427,238 |
| Johnson & Johnson |
| 12/05/2033 | 4.375% | | 2,350,000 | 2,864,206 |
| 03/03/2037 | 3.625% | | 2,280,000 | 2,567,369 |
| 01/15/2038 | 3.400% | | 2,790,000 | 3,064,444 |
| Mallinckrodt International Finance SA/CB LLC(a) |
| 04/15/2025 | 5.500% | | 200,000 | 92,039 |
| Mylan NV |
| 12/15/2020 | 3.750% | | 492,000 | 499,784 |
| Mylan, Inc.(a) |
| 01/15/2023 | 3.125% | | 2,480,000 | 2,510,611 |
| Pfizer, Inc. |
| 09/15/2023 | 3.200% | | 799,000 | 840,809 |
| Shire Acquisitions Investments Ireland DAC |
| 09/23/2021 | 2.400% | | 9,850,000 | 9,876,753 |
| 09/23/2023 | 2.875% | | 2,640,000 | 2,698,019 |
| 09/23/2026 | 3.200% | | 2,310,000 | 2,400,734 |
| Takeda Pharmaceutical Co., Ltd.(a) |
| 11/26/2021 | 4.000% | | 1,293,000 | 1,339,735 |
| Total | 105,372,206 |
| Property & Casualty 0.7% |
| American Financial Group, Inc. |
| 08/15/2026 | 3.500% | | 2,675,000 | 2,779,296 |
| Arch Capital Finance LLC |
| 12/15/2046 | 5.031% | | 970,000 | 1,241,693 |
| Assurant, Inc. |
| 09/27/2023 | 4.200% | | 2,360,000 | 2,481,316 |
| 02/22/2030 | 3.700% | | 3,767,000 | 3,798,684 |
| AXIS Specialty Finance LLC |
| 07/15/2029 | 3.900% | | 2,100,000 | 2,220,662 |
| Berkshire Hathaway Finance Corp. |
| 01/15/2049 | 4.250% | | 2,290,000 | 2,788,201 |
| Berkshire Hathaway, Inc. |
| 03/15/2023 | 2.750% | | 680,000 | 701,493 |
| 03/15/2026 | 3.125% | | 4,850,000 | 5,139,356 |
| Chubb INA Holdings, Inc. |
| 05/15/2024 | 3.350% | | 910,000 | 966,928 |
The accompanying Notes to Financial Statements are an integral part of this statement.
| 42 | Multi-Manager Total Return Bond Strategies Fund | Annual Report 2019 |
Portfolio of Investments (continued)
August 31, 2019
| Corporate Bonds & Notes (continued) |
| Issuer | Coupon
Rate | | Principal
Amount ($) | Value ($) |
| CNA Financial Corp. |
| 08/15/2021 | 5.750% | | 925,000 | 985,323 |
| 08/15/2027 | 3.450% | | 3,828,000 | 4,012,222 |
| Enstar Group Ltd. |
| 06/01/2029 | 4.950% | | 3,232,000 | 3,424,876 |
| Fairfax Financial Holdings Ltd. |
| 04/17/2028 | 4.850% | | 529,000 | 576,727 |
| Fairfax US, Inc.(a) |
| 08/13/2024 | 4.875% | | 663,000 | 712,329 |
| Farmers Exchange Capital(a) |
| Subordinated |
| 07/15/2028 | 7.050% | | 800,000 | 998,820 |
| 07/15/2048 | 7.200% | | 1,290,000 | 1,846,599 |
| Farmers Exchange Capital II(a),(j) |
| Subordinated |
| 11/01/2053 | 6.151% | | 2,700,000 | 3,362,458 |
| Farmers Insurance Exchange(a) |
| 05/01/2024 | 8.625% | | 1,165,000 | 1,418,738 |
| Liberty Mutual Group, Inc.(a) |
| 05/01/2022 | 4.950% | | 2,570,000 | 2,732,527 |
| 06/15/2023 | 4.250% | | 275,000 | 293,006 |
| 05/01/2042 | 6.500% | | 1,080,000 | 1,537,071 |
| 08/01/2044 | 4.850% | | 1,000,000 | 1,202,390 |
| 06/15/2049 | 4.500% | | 925,000 | 1,061,549 |
| Markel Corp. |
| 05/20/2049 | 5.000% | | 5,095,000 | 6,175,349 |
| Nationwide Mutual Insurance Co.(a),(b) |
| Subordinated |
3-month USD LIBOR + 2.290%
12/15/2024 | 4.700% | | 1,725,000 | 1,725,742 |
| PartnerRe Finance B LLC |
| 07/02/2029 | 3.700% | | 5,860,000 | 6,192,825 |
| XLIT Ltd. |
| 03/31/2045 | 5.500% | | 670,000 | 865,607 |
| Total | 61,241,787 |
| Railroads 0.2% |
| Burlington Northern Santa Fe LLC |
| 09/15/2021 | 3.450% | | 295,000 | 302,757 |
| 09/01/2022 | 3.050% | | 475,000 | 488,377 |
| 09/01/2043 | 5.150% | | 989,000 | 1,284,773 |
| 08/01/2046 | 3.900% | | 1,440,000 | 1,643,710 |
| 02/15/2050 | 3.550% | | 2,580,000 | 2,827,995 |
| Canadian Pacific Railway Ltd. |
| 01/15/2022 | 4.500% | | 600,000 | 632,542 |
| CSX Corp. |
| 05/30/2042 | 4.750% | | 500,000 | 598,704 |
| 11/01/2066 | 4.250% | | 2,500,000 | 2,722,780 |
| Norfolk Southern Corp. |
| 08/01/2025 | 3.650% | | 795,000 | 858,061 |
| Corporate Bonds & Notes (continued) |
| Issuer | Coupon
Rate | | Principal
Amount ($) | Value ($) |
| Union Pacific Corp. |
| 08/15/2059 | 3.950% | | 4,215,000 | 4,658,199 |
| Total | 16,017,898 |
| Refining 0.0% |
| Marathon Petroleum Corp. |
| 03/01/2021 | 5.125% | | 1,000,000 | 1,040,412 |
| 04/01/2024 | 5.125% | | 225,000 | 230,566 |
| 09/15/2054 | 5.000% | | 328,000 | 350,721 |
| Total | 1,621,699 |
| Restaurants 0.1% |
| 1011778 BC ULC/New Red Finance, Inc.(a) |
| 10/15/2025 | 5.000% | | 2,250,000 | 2,323,667 |
| Brinker International, Inc.(a) |
| 10/01/2024 | 5.000% | | 1,425,000 | 1,469,229 |
| KFC Holding Co./Pizza Hut Holdings LLC/Taco Bell of America LLC(a) |
| 06/01/2026 | 5.250% | | 188,000 | 199,726 |
| McDonald’s Corp. |
| 09/01/2048 | 4.450% | | 740,000 | 875,374 |
| Total | 4,867,996 |
| Retail REIT 0.2% |
| Brixmor Operating Partnership LP |
| 06/15/2024 | 3.650% | | 2,065,000 | 2,155,513 |
| Kimco Realty Corp. |
| 11/01/2022 | 3.400% | | 290,000 | 300,165 |
| 03/01/2024 | 2.700% | | 2,158,000 | 2,194,878 |
| 10/01/2049 | 3.700% | | 7,153,000 | 7,115,783 |
| Regency Centers LP |
| 09/15/2029 | 2.950% | | 1,845,000 | 1,868,370 |
| Total | 13,634,709 |
| Retailers 0.4% |
| Alimentation Couche-Tard, Inc.(a) |
| 07/26/2022 | 2.700% | | 2,100,000 | 2,124,209 |
| 07/26/2027 | 3.550% | | 2,000,000 | 2,106,680 |
| AutoNation, Inc. |
| 01/15/2021 | 3.350% | | 660,000 | 666,265 |
| 11/15/2024 | 3.500% | | 2,185,000 | 2,228,954 |
| 10/01/2025 | 4.500% | | 2,465,000 | 2,626,344 |
| AutoZone, Inc. |
| 04/21/2026 | 3.125% | | 415,000 | 432,391 |
| Best Buy Co., Inc. |
| 10/01/2028 | 4.450% | | 4,280,000 | 4,670,323 |
| eG Global Finance PLC(a) |
| 02/07/2025 | 6.750% | | 1,092,000 | 1,052,336 |
| Home Depot, Inc. (The) |
| 12/06/2048 | 4.500% | | 784,000 | 997,114 |
The accompanying Notes to Financial Statements are an integral part of this statement.
Multi-Manager Total Return Bond Strategies Fund | Annual Report 2019
| 43 |
Portfolio of Investments (continued)
August 31, 2019
| Corporate Bonds & Notes (continued) |
| Issuer | Coupon
Rate | | Principal
Amount ($) | Value ($) |
| L Brands, Inc. |
| 02/15/2022 | 5.625% | | 4,150,000 | 4,354,047 |
| 10/15/2023 | 5.625% | | 400,000 | 420,241 |
| 11/01/2035 | 6.875% | | 141,000 | 119,582 |
| Lowe’s Companies, Inc. |
| 04/15/2046 | 3.700% | | 685,000 | 698,716 |
| Macy’s Retail Holdings, Inc. |
| 02/15/2043 | 4.300% | | 1,888,000 | 1,564,250 |
| O’Reilly Automotive, Inc. |
| 03/15/2026 | 3.550% | | 680,000 | 720,254 |
| PetSmart, Inc.(a) |
| 06/01/2025 | 5.875% | | 768,000 | 752,694 |
| Ralph Lauren Corp. |
| 09/15/2025 | 3.750% | | 2,455,000 | 2,640,028 |
| Rite Aid Corp.(a) |
| 04/01/2023 | 6.125% | | 2,157,000 | 1,736,732 |
| Walgreens Boots Alliance, Inc. |
| 11/18/2024 | 3.800% | | 2,440,000 | 2,587,115 |
| 11/18/2044 | 4.800% | | 1,560,000 | 1,651,321 |
| Walmart, Inc. |
| 04/22/2024 | 3.300% | | 3,150,000 | 3,343,618 |
| Total | 37,493,214 |
| Supermarkets 0.1% |
| Ahold Finance U.S.A. LLC |
| 05/01/2029 | 6.875% | | 1,800,000 | 2,333,187 |
| Kroger Co. (The) |
| 04/15/2042 | 5.000% | | 969,000 | 1,056,218 |
| 01/15/2048 | 4.650% | | 3,161,000 | 3,380,000 |
| Total | 6,769,405 |
| Supranational 0.2% |
| Corporación Andina de Fomento |
| 09/27/2021 | 2.125% | | 4,640,000 | 4,629,365 |
| 06/15/2022 | 4.375% | | 400,000 | 423,043 |
| 01/06/2023 | 2.750% | | 3,000,000 | 3,047,661 |
| Inter-American Development Bank |
| 10/15/2025 | 6.800% | | 2,500,000 | 3,192,695 |
| 07/15/2027 | 6.750% | | 4,000,000 | 5,365,992 |
| International Bank for Reconstruction & Development(i) |
| 09/17/2030 | 0.000% | | 1,550,000 | 1,212,736 |
| North American Development Bank |
| 10/26/2022 | 2.400% | | 1,950,000 | 1,971,781 |
| Total | 19,843,273 |
| Technology 1.2% |
| Amphenol Corp. |
| 04/01/2024 | 3.200% | | 416,000 | 432,043 |
| Corporate Bonds & Notes (continued) |
| Issuer | Coupon
Rate | | Principal
Amount ($) | Value ($) |
| Analog Devices, Inc. |
| 12/05/2026 | 3.500% | | 363,000 | 383,971 |
| Apple, Inc. |
| 02/09/2022 | 2.150% | | 3,460,000 | 3,491,085 |
| 02/09/2022 | 2.500% | | 540,000 | 549,076 |
| 01/13/2023 | 2.400% | | 3,464,000 | 3,530,838 |
| 05/11/2027 | 3.200% | | 3,025,000 | 3,242,234 |
| 09/12/2047 | 3.750% | | 1,849,000 | 2,102,849 |
| Broadcom Corp./Cayman Finance Ltd. |
| 01/15/2020 | 2.375% | | 2,240,000 | 2,238,316 |
| Broadcom, Inc.(a) |
| 10/15/2022 | 3.125% | | 6,175,000 | 6,254,003 |
| CommScope Finance LLC(a) |
| 03/01/2026 | 6.000% | | 675,000 | 686,187 |
| CommScope Technologies LLC(a) |
| 06/15/2025 | 6.000% | | 3,200,000 | 2,867,232 |
| 03/15/2027 | 5.000% | | 1,625,000 | 1,357,899 |
| CommScope, Inc.(a) |
| 06/15/2024 | 5.500% | | 250,000 | 236,009 |
| Corning, Inc. |
| 11/15/2057 | 4.375% | | 1,970,000 | 2,043,950 |
| Dell International LLC/EMC Corp.(a) |
| 06/15/2023 | 5.450% | | 1,750,000 | 1,904,079 |
| 06/15/2026 | 6.020% | | 870,000 | 982,267 |
| Everi Payments, Inc.(a) |
| 12/15/2025 | 7.500% | | 1,500,000 | 1,577,121 |
| Fidelity National Information Services, Inc. |
| 04/15/2023 | 3.500% | | 2,500,000 | 2,611,647 |
| Fiserv, Inc. |
| 07/01/2026 | 3.200% | | 1,249,000 | 1,304,586 |
| Flex Ltd. |
| 06/15/2029 | 4.875% | | 6,280,000 | 6,678,585 |
| Flextronics International Ltd. |
| 06/15/2025 | 4.750% | | 385,000 | 412,132 |
| Genpact Luxembourg SARL |
| 04/01/2022 | 3.700% | | 3,425,000 | 3,469,566 |
| Global Payments, Inc. |
| 02/15/2025 | 2.650% | | 890,000 | 894,406 |
| 08/15/2029 | 3.200% | | 820,000 | 840,006 |
| 08/15/2049 | 4.150% | | 2,125,000 | 2,245,791 |
| Hewlett Packard Enterprise Co.(a) |
| 10/04/2019 | 2.100% | | 3,275,000 | 3,273,369 |
| Hewlett Packard Enterprise Co.(j) |
| 10/15/2020 | 3.600% | | 690,000 | 699,621 |
| Hewlett-Packard Enterprise Co. |
| 10/05/2021 | 3.500% | | 155,000 | 158,591 |
| HP, Inc. |
| 06/01/2021 | 4.300% | | 1,671,000 | 1,731,631 |
The accompanying Notes to Financial Statements are an integral part of this statement.
| 44 | Multi-Manager Total Return Bond Strategies Fund | Annual Report 2019 |
Portfolio of Investments (continued)
August 31, 2019
| Corporate Bonds & Notes (continued) |
| Issuer | Coupon
Rate | | Principal
Amount ($) | Value ($) |
| IBM Credit LLC |
| 02/06/2023 | 3.000% | | 1,226,000 | 1,267,194 |
| Infor US, Inc. |
| 05/15/2022 | 6.500% | | 350,000 | 355,689 |
| International Business Machines Corp. |
| 05/15/2026 | 3.300% | | 4,430,000 | 4,701,400 |
| Jabil, Inc. |
| 12/15/2020 | 5.625% | | 1,000,000 | 1,038,680 |
| Juniper Networks, Inc. |
| 08/15/2029 | 3.750% | | 4,155,000 | 4,195,291 |
| Marvell Technology Group Ltd. |
| 06/22/2023 | 4.200% | | 3,740,000 | 3,944,062 |
| Microchip Technology, Inc. |
| 06/01/2021 | 3.922% | | 1,845,000 | 1,883,437 |
| Microsoft Corp. |
| 11/03/2045 | 4.450% | | 1,443,000 | 1,874,773 |
| 08/08/2046 | 3.700% | | 3,157,000 | 3,708,184 |
| 02/12/2055 | 4.000% | | 960,000 | 1,179,773 |
| 02/06/2057 | 4.500% | | 3,330,000 | 4,462,976 |
| NXP BV/Funding LLC(a) |
| 06/01/2021 | 4.125% | | 850,000 | 872,423 |
| Oracle Corp. |
| 11/15/2047 | 4.000% | | 1,557,000 | 1,785,742 |
| Panasonic Corp.(a) |
| 07/19/2022 | 2.536% | | 3,975,000 | 4,013,577 |
| Seagate HDD Cayman |
| 03/01/2024 | 4.875% | | 2,305,000 | 2,403,216 |
| Sensata Technologies UK Financing Co. PLC(a) |
| 02/15/2026 | 6.250% | | 2,825,000 | 3,006,153 |
| SS&C Technologies, Inc.(a) |
| 09/30/2027 | 5.500% | | 2,184,000 | 2,292,754 |
| Texas Instruments, Inc.(c) |
| 09/04/2029 | 2.250% | | 985,000 | 988,007 |
| Texas Instruments, Inc. |
| 03/15/2039 | 3.875% | | 675,000 | 791,848 |
| Trimble, Inc. |
| 06/15/2023 | 4.150% | | 345,000 | 362,919 |
| Total | 103,327,188 |
| Tobacco 0.1% |
| Altria Group, Inc. |
| 02/14/2029 | 4.800% | | 500,000 | 565,144 |
| 02/14/2039 | 5.800% | | 310,000 | 382,239 |
| 02/14/2049 | 5.950% | | 308,000 | 396,274 |
| BAT Capital Corp. |
| 08/15/2037 | 4.390% | | 700,000 | 703,474 |
| 08/15/2047 | 4.540% | | 1,705,000 | 1,707,737 |
| Corporate Bonds & Notes (continued) |
| Issuer | Coupon
Rate | | Principal
Amount ($) | Value ($) |
| Imperial Brands Finance PLC(a) |
| 07/21/2022 | 3.750% | | 1,007,000 | 1,041,008 |
| Philip Morris International, Inc. |
| 08/21/2042 | 3.875% | | 569,000 | 588,233 |
| Reynolds American, Inc. |
| 06/12/2025 | 4.450% | | 1,325,000 | 1,433,870 |
| 08/04/2041 | 7.000% | | 1,170,000 | 1,465,935 |
| 09/15/2043 | 6.150% | | 520,000 | 609,133 |
| 08/15/2045 | 5.850% | | 2,950,000 | 3,328,093 |
| Total | 12,221,140 |
| Transportation Services 0.5% |
| ERAC U.S.A. Finance LLC(a) |
| 10/01/2020 | 5.250% | | 2,500,000 | 2,575,760 |
| 11/15/2024 | 3.850% | | 2,500,000 | 2,677,250 |
| 12/01/2026 | 3.300% | | 3,435,000 | 3,579,689 |
| 03/15/2042 | 5.625% | | 1,689,000 | 2,158,555 |
| 11/01/2046 | 4.200% | | 1,041,000 | 1,144,211 |
| FedEx Corp. |
| 08/05/2029 | 3.100% | | 6,060,000 | 6,129,551 |
| 02/15/2048 | 4.050% | | 1,257,000 | 1,287,338 |
| Penske Truck Leasing Co., LP/Finance Corp.(a) |
| 04/01/2021 | 3.300% | | 2,000,000 | 2,028,370 |
| 02/01/2022 | 3.375% | | 1,200,000 | 1,227,683 |
| 08/01/2023 | 4.125% | | 5,245,000 | 5,570,022 |
| 01/29/2026 | 4.450% | | 1,120,000 | 1,222,848 |
| Ryder System, Inc. |
| 06/01/2021 | 3.500% | | 802,000 | 821,464 |
| 06/09/2023 | 3.750% | | 2,365,000 | 2,491,710 |
| 12/01/2023 | 3.875% | | 2,315,000 | 2,465,364 |
| TTX Co.(a) |
| 01/15/2025 | 3.600% | | 1,620,000 | 1,727,325 |
| United Parcel Service, Inc. |
| 04/01/2023 | 2.500% | | 1,857,000 | 1,888,385 |
| 09/01/2029 | 2.500% | | 2,505,000 | 2,532,169 |
| 09/01/2049 | 3.400% | | 935,000 | 976,908 |
| Total | 42,504,602 |
| Wireless 0.4% |
| America Movil SAB de CV |
| 03/30/2020 | 5.000% | | 87,000 | 88,387 |
| 07/16/2022 | 3.125% | | 200,000 | 205,876 |
| American Tower Corp. |
| 02/15/2024 | 5.000% | | 665,000 | 738,423 |
| Digicel Group One Ltd.(a) |
| 12/30/2022 | 8.250% | | 308,000 | 172,943 |
| Digicel Group Two Ltd.(a) |
| 09/30/2022 | 8.250% | | 292,000 | 56,224 |
| SK Telecom Co., Ltd.(a) |
| 04/16/2023 | 3.750% | | 2,490,000 | 2,612,637 |
The accompanying Notes to Financial Statements are an integral part of this statement.
Multi-Manager Total Return Bond Strategies Fund | Annual Report 2019
| 45 |
Portfolio of Investments (continued)
August 31, 2019
| Corporate Bonds & Notes (continued) |
| Issuer | Coupon
Rate | | Principal
Amount ($) | Value ($) |
| Sprint Capital Corp. |
| 11/15/2028 | 6.875% | | 700,000 | 779,582 |
| 03/15/2032 | 8.750% | | 325,000 | 406,934 |
| Sprint Communications, Inc.(a) |
| 03/01/2020 | 7.000% | | 1,805,000 | 1,842,001 |
| Sprint Corp. |
| 09/15/2023 | 7.875% | | 525,000 | 590,670 |
| 06/15/2024 | 7.125% | | 425,000 | 469,550 |
| 02/15/2025 | 7.625% | | 462,000 | 518,499 |
| 03/01/2026 | 7.625% | | 198,000 | 223,758 |
| Sprint Spectrum Co. I/II/III LLC(a) |
| 09/20/2021 | 3.360% | | 6,013,125 | 6,036,720 |
| 03/20/2025 | 4.738% | | 6,340,000 | 6,746,445 |
| T-Mobile U.S.A., Inc. |
| 03/01/2023 | 6.000% | | 524,000 | 533,286 |
| 01/15/2024 | 6.500% | | 925,000 | 963,878 |
| 01/15/2026 | 6.500% | | 591,000 | 635,722 |
| 02/01/2028 | 4.750% | | 961,000 | 1,011,629 |
| Vodafone Group PLC |
| 01/16/2024 | 3.750% | | 2,185,000 | 2,307,100 |
| 05/30/2025 | 4.125% | | 2,000,000 | 2,170,584 |
| 05/30/2048 | 5.250% | | 500,000 | 599,968 |
| 06/19/2049 | 4.875% | | 1,620,000 | 1,869,498 |
| Total | 31,580,314 |
| Wirelines 0.9% |
| AT&T, Inc. |
| 06/01/2024 | 3.550% | | 895,000 | 941,411 |
| 02/15/2030 | 4.300% | | 4,102,000 | 4,552,711 |
| 03/01/2037 | 5.250% | | 7,735,000 | 9,181,136 |
| 03/01/2039 | 4.850% | | 5,326,000 | 6,122,764 |
| 06/15/2044 | 4.800% | | 4,630,000 | 5,164,932 |
| 11/15/2046 | 5.150% | | 2,390,000 | 2,801,235 |
| 03/01/2047 | 5.450% | | 175,000 | 214,785 |
| 03/09/2049 | 4.550% | | 7,850,000 | 8,579,077 |
| 02/15/2050 | 5.150% | | 2,300,000 | 2,732,842 |
| AT&T, Inc.(b) |
3-month USD LIBOR + 1.180%
06/12/2024 | 3.616% | | 3,285,000 | 3,334,935 |
| C&W Senior Financing DAC(a) |
| 09/15/2027 | 6.875% | | 385,000 | 409,811 |
| CenturyLink, Inc. |
| 04/01/2020 | 5.625% | | 2,500,000 | 2,530,435 |
| Deutsche Telekom International Finance BV(a) |
| 06/21/2038 | 4.750% | | 4,405,000 | 5,110,721 |
| Level 3 Financing, Inc. |
| 01/15/2024 | 5.375% | | 50,000 | 51,027 |
| Qwest Corp. |
| 09/15/2025 | 7.250% | | 3,978,000 | 4,483,584 |
| Telecom Italia Capital SA |
| 06/04/2038 | 7.721% | | 755,000 | 869,212 |
| Corporate Bonds & Notes (continued) |
| Issuer | Coupon
Rate | | Principal
Amount ($) | Value ($) |
| Verizon Communications, Inc. |
| 02/15/2025 | 3.376% | | 622,000 | 659,935 |
| 03/16/2027 | 4.125% | | 2,733,000 | 3,048,142 |
| 08/10/2033 | 4.500% | | 3,875,000 | 4,568,431 |
| 11/01/2034 | 4.400% | | 2,000,000 | 2,320,798 |
| 08/21/2046 | 4.862% | | 3,480,000 | 4,333,703 |
| 09/15/2048 | 4.522% | | 1,570,000 | 1,883,408 |
| 04/15/2049 | 5.012% | | 2,000,000 | 2,562,554 |
| Verizon Communications, Inc.(a) |
| 12/03/2029 | 4.016% | | 530,000 | 597,806 |
| Total | 77,055,395 |
Total Corporate Bonds & Notes
(Cost $2,525,705,717) | 2,672,383,050 |
|
| Foreign Government Obligations(l) 3.1% |
| | | | |
| Argentina 0.1% |
| Argentine Republic Government International Bond |
| 04/22/2021 | 6.875% | | 3,950,000 | 1,659,462 |
| 01/26/2022 | 5.625% | | 550,000 | 218,674 |
| 01/11/2023 | 4.625% | | 3,875,000 | 1,512,990 |
| 04/22/2026 | 7.500% | | 2,000,000 | 771,048 |
| 01/26/2027 | 6.875% | | 700,000 | 266,124 |
| Argentine Republic Government International Bond(k) |
| 12/31/2033 | 0.000% | | 2,537,689 | 1,041,338 |
| Argentine Republic Government International Bond(j) |
| 12/31/2033 | 8.280% | | 1,934,812 | 773,072 |
| Provincia de Buenos Aires(a) |
| 06/09/2021 | 9.950% | | 3,370,000 | 1,299,179 |
| 02/15/2023 | 6.500% | | 1,070,000 | 379,806 |
| YPF SA(a) |
| 03/23/2021 | 8.500% | | 350,000 | 269,601 |
| Total | 8,191,294 |
| Bahrain 0.0% |
| Bahrain Government International Bond(a) |
| 10/12/2028 | 7.000% | | 700,000 | 803,513 |
| Brazil 0.1% |
| Brazil Minas SPE via State of Minas Gerais(a) |
| 02/15/2028 | 5.333% | | 2,610,000 | 2,779,199 |
| Brazilian Government International Bond |
| 04/07/2026 | 6.000% | | 750,000 | 878,384 |
| 01/13/2028 | 4.625% | | 2,575,000 | 2,776,942 |
| 01/20/2034 | 8.250% | | 150,000 | 209,439 |
| 01/07/2041 | 5.625% | | 800,000 | 916,239 |
| Petrobras Global Finance BV |
| 01/17/2027 | 7.375% | | 3,950,000 | 4,689,092 |
| Total | 12,249,295 |
The accompanying Notes to Financial Statements are an integral part of this statement.
| 46 | Multi-Manager Total Return Bond Strategies Fund | Annual Report 2019 |
Portfolio of Investments (continued)
August 31, 2019
| Foreign Government Obligations(l) (continued) |
| Issuer | Coupon
Rate | | Principal
Amount ($) | Value ($) |
| Canada 0.4% |
| CDP Financial, Inc.(a) |
| 11/25/2019 | 4.400% | | 10,000,000 | 10,049,780 |
| NOVA Chemicals Corp.(a) |
| 06/01/2024 | 4.875% | | 120,000 | 123,154 |
| 06/01/2027 | 5.250% | | 2,200,000 | 2,302,619 |
| Ontario Teachers’ Finance Trust(a) |
| 04/16/2021 | 2.750% | | 1,250,000 | 1,270,711 |
| Province of Alberta |
| 03/15/2028 | 3.300% | | 3,000,000 | 3,350,598 |
| Province of British Columbia |
| 09/01/2036 | 7.250% | | 2,000,000 | 3,375,774 |
| Province of Manitoba |
| 11/30/2020 | 2.050% | | 2,500,000 | 2,509,210 |
| 06/22/2026 | 2.125% | | 300,000 | 306,191 |
| Province of Ontario |
| 04/14/2020 | 4.400% | | 600,000 | 608,832 |
| 10/17/2023 | 3.400% | | 1,985,000 | 2,122,535 |
| Province of Quebec(j) |
| 02/27/2026 | 7.140% | | 1,230,000 | 1,603,723 |
| 03/02/2026 | 7.485% | | 2,000,000 | 2,648,574 |
| Total | 30,271,701 |
| Chile 0.0% |
| Corporación Nacional del Cobre de Chile(a) |
| 09/16/2025 | 4.500% | | 500,000 | 553,876 |
| 08/01/2027 | 3.625% | | 740,000 | 792,246 |
| 11/04/2044 | 4.875% | | 200,000 | 245,638 |
| Empresa Nacional del Petroleo(a) |
| 08/05/2026 | 3.750% | | 750,000 | 783,841 |
| 11/06/2029 | 5.250% | | 450,000 | 522,485 |
| Total | 2,898,086 |
| China 0.0% |
| Industrial & Commercial Bank of China Ltd.(a),(j) |
| Junior Subordinated |
| 12/31/2049 | 6.000% | | 200,000 | 201,425 |
| Colombia 0.0% |
| Colombia Government International Bond |
| 01/28/2026 | 4.500% | | 1,105,000 | 1,224,476 |
| 04/25/2027 | 3.875% | | 1,300,000 | 1,404,938 |
| 03/15/2029 | 4.500% | | 250,000 | 284,513 |
| 06/15/2045 | 5.000% | | 600,000 | 724,522 |
| Total | 3,638,449 |
| Foreign Government Obligations(l) (continued) |
| Issuer | Coupon
Rate | | Principal
Amount ($) | Value ($) |
| Croatia 0.0% |
| Croatia Government International Bond(a) |
| 04/04/2023 | 5.500% | | 500,000 | 556,264 |
| 01/26/2024 | 6.000% | | 500,000 | 578,922 |
| 01/26/2024 | 6.000% | | 300,000 | 347,354 |
| Total | 1,482,540 |
| Dominican Republic 0.1% |
| Dominican Republic International Bond(a) |
| 05/06/2021 | 7.500% | | 2,666,667 | 2,808,064 |
| 05/06/2021 | 7.500% | | 66,667 | 70,202 |
| 01/28/2024 | 6.600% | | 785,000 | 873,678 |
| 01/27/2025 | 5.500% | | 100,000 | 107,168 |
| 01/27/2025 | 5.500% | | 100,000 | 107,168 |
| 01/29/2026 | 6.875% | | 1,000,000 | 1,144,071 |
| 01/25/2027 | 5.950% | | 450,000 | 494,560 |
| 07/19/2028 | 6.000% | | 1,400,000 | 1,548,432 |
| 07/19/2028 | 6.000% | | 275,000 | 304,156 |
| Total | 7,457,499 |
| Ecuador 0.0% |
| Ecuador Government International Bond(a) |
| 03/24/2020 | 10.500% | | 267,000 | 274,360 |
| Egypt 0.1% |
| Egypt Government International Bond(a) |
| 02/21/2023 | 5.577% | | 350,000 | 360,736 |
| 06/11/2025 | 5.875% | | 250,000 | 258,468 |
| 02/21/2028 | 6.588% | | 3,900,000 | 4,001,634 |
| Total | 4,620,838 |
| El Salvador 0.0% |
| El Salvador Government International Bond(a) |
| 12/01/2019 | 7.375% | | 1,195,000 | 1,200,710 |
| Finland 0.0% |
| Republic of Finland |
| 02/15/2026 | 6.950% | | 1,500,000 | 1,941,821 |
| France 0.1% |
| Dexia Credit Local SA(a) |
| 09/15/2021 | 1.875% | | 1,750,000 | 1,753,323 |
| 01/29/2022 | 2.875% | | 750,000 | 770,278 |
| 09/26/2023 | 3.250% | | 1,500,000 | 1,587,325 |
| Total | 4,110,926 |
| Hong Kong 0.0% |
| CNAC HK Finbridge Co., Ltd(a) |
| 03/14/2028 | 5.125% | | 1,850,000 | 2,107,818 |
The accompanying Notes to Financial Statements are an integral part of this statement.
Multi-Manager Total Return Bond Strategies Fund | Annual Report 2019
| 47 |
Portfolio of Investments (continued)
August 31, 2019
| Foreign Government Obligations(l) (continued) |
| Issuer | Coupon
Rate | | Principal
Amount ($) | Value ($) |
| Hungary 0.0% |
| Hungary Government International Bond |
| 03/29/2021 | 6.375% | | 546,000 | 580,615 |
| 11/22/2023 | 5.750% | | 2,000,000 | 2,277,956 |
| Total | 2,858,571 |
| India 0.0% |
| Export-Import Bank of India(a) |
| 08/05/2026 | 3.375% | | 860,000 | 888,901 |
| 02/01/2028 | 3.875% | | 1,025,000 | 1,094,488 |
| Total | 1,983,389 |
| Indonesia 0.2% |
| Indonesia Government International Bond(a) |
| 01/17/2038 | 7.750% | | 1,000,000 | 1,536,507 |
| Perusahaan Penerbit SBSN Indonesia III(a) |
| 03/01/2028 | 4.400% | | 500,000 | 552,006 |
| 02/20/2029 | 4.450% | | 1,400,000 | 1,563,708 |
| PT Indonesia Asahan Aluminium Persero(a) |
| 11/15/2028 | 6.530% | | 770,000 | 955,801 |
| PT Pertamina Persero(a) |
| 05/20/2043 | 5.625% | | 250,000 | 301,037 |
| PT Perusahaan Gas Negara Persero Tbk(a) |
| 05/16/2024 | 5.125% | | 925,000 | 1,012,545 |
| PT Perusahaan Listrik Negara(a) |
| 05/15/2027 | 4.125% | | 5,000,000 | 5,337,175 |
| 05/21/2028 | 5.450% | | 2,000,000 | 2,342,574 |
| 05/21/2028 | 5.450% | | 500,000 | 585,644 |
| 01/25/2029 | 5.375% | | 200,000 | 235,181 |
| Total | 14,422,178 |
| Iraq 0.0% |
| Iraq International Bond(a) |
| 03/09/2023 | 6.752% | | 1,300,000 | 1,332,210 |
| 01/15/2028 | 5.800% | | 750,000 | 733,906 |
| Total | 2,066,116 |
| Israel 0.0% |
| Israel Electric Corp., Ltd.(a) |
| 08/14/2028 | 4.250% | | 3,100,000 | 3,407,520 |
| Italy 0.3% |
| Republic of Italy |
| 09/27/2023 | 6.875% | | 15,850,000 | 18,284,481 |
| Republic of Italy Government International Bond |
| 06/15/2033 | 5.375% | | 8,205,000 | 9,600,916 |
| Total | 27,885,397 |
| Foreign Government Obligations(l) (continued) |
| Issuer | Coupon
Rate | | Principal
Amount ($) | Value ($) |
| Ivory Coast 0.0% |
| Ivory Coast Government International Bond(a),(j) |
| 12/31/2032 | 5.750% | | 880,000 | 871,655 |
| Japan 0.1% |
| Japan Bank for International Cooperation |
| 02/24/2020 | 2.250% | | 1,400,000 | 1,401,011 |
| 05/23/2024 | 2.500% | | 600,000 | 621,388 |
| Japan Finance Organization for Municipalities(a) |
| 04/20/2022 | 2.625% | | 1,600,000 | 1,633,630 |
| 03/12/2024 | 3.000% | | 400,000 | 421,094 |
| Total | 4,077,123 |
| Kazakhstan 0.1% |
| KazMunayGas National Co. JSC(a) |
| 04/24/2025 | 4.750% | | 950,000 | 1,036,688 |
| 04/19/2027 | 4.750% | | 1,725,000 | 1,890,029 |
| 04/19/2027 | 4.750% | | 300,000 | 328,701 |
| 04/24/2030 | 5.375% | | 2,050,000 | 2,376,370 |
| 04/24/2030 | 5.375% | | 500,000 | 579,603 |
| Total | 6,211,391 |
| Kenya 0.0% |
| Kenya Government International Bond(a) |
| 05/22/2027 | 7.000% | | 400,000 | 422,496 |
| Mexico 0.6% |
| Banco Nacional de Comercio Exterior SNC(a),(j) |
| Subordinated |
| 08/11/2026 | 3.800% | | 400,000 | 405,390 |
| Mexico City Airport Trust(a) |
| 10/31/2026 | 4.250% | | 1,435,000 | 1,439,304 |
| 07/31/2047 | 5.500% | | 2,150,000 | 2,153,758 |
| Mexico Government International Bond |
| 01/11/2028 | 3.750% | | 400,000 | 418,243 |
| 04/22/2029 | 4.500% | | 2,515,000 | 2,780,956 |
| Pemex Project Funding Master Trust |
| 03/05/2020 | 6.000% | | 3,000,000 | 3,037,230 |
| 01/21/2021 | 5.500% | | 1,600,000 | 1,633,206 |
| 06/15/2038 | 6.625% | | 50,000 | 46,836 |
| Petroleos Mexicanos |
| 02/04/2021 | 6.375% | | 2,625,000 | 2,708,407 |
| 03/13/2022 | 5.375% | | 5,650,000 | 5,784,267 |
| 12/20/2022 | 1.700% | | 358,750 | 354,817 |
| 01/15/2025 | 4.250% | | 300,000 | 287,729 |
| 08/04/2026 | 6.875% | | 4,810,000 | 5,052,895 |
| 03/13/2027 | 6.500% | | 10,823,000 | 11,090,198 |
| 02/12/2028 | 5.350% | | 625,000 | 592,547 |
| 01/23/2029 | 6.500% | | 5,420,000 | 5,502,059 |
| 01/23/2045 | 6.375% | | 940,000 | 866,945 |
| 01/23/2046 | 5.625% | | 300,000 | 256,567 |
| 09/21/2047 | 6.750% | | 7,669,000 | 7,263,203 |
The accompanying Notes to Financial Statements are an integral part of this statement.
| 48 | Multi-Manager Total Return Bond Strategies Fund | Annual Report 2019 |
Portfolio of Investments (continued)
August 31, 2019
| Foreign Government Obligations(l) (continued) |
| Issuer | Coupon
Rate | | Principal
Amount ($) | Value ($) |
| 02/12/2048 | 6.350% | | 770,000 | 708,475 |
| Total | 52,383,032 |
| Netherlands 0.1% |
| Petrobras Global Finance BV |
| 02/01/2029 | 5.750% | | 1,700,000 | 1,842,214 |
| 03/19/2049 | 6.900% | | 1,955,000 | 2,220,659 |
| Total | 4,062,873 |
| Oman 0.0% |
| Oman Government International Bond(a) |
| 01/17/2028 | 5.625% | | 942,000 | 927,908 |
| Panama 0.0% |
| Panama Government International Bond |
| 09/22/2024 | 4.000% | | 400,000 | 432,723 |
| 03/16/2025 | 3.750% | | 200,000 | 214,739 |
| 01/26/2036 | 6.700% | | 840,000 | 1,227,759 |
| Total | 1,875,221 |
| Paraguay 0.0% |
| Paraguay Government International Bond(a) |
| 01/25/2023 | 4.625% | | 400,000 | 423,787 |
| Peru 0.1% |
| Corporación Financiera de Desarrollo SA(a) |
| 07/15/2025 | 4.750% | | 1,070,000 | 1,174,815 |
| Peruvian Government International Bond |
| 03/14/2037 | 6.550% | | 1,785,000 | 2,712,665 |
| 11/18/2050 | 5.625% | | 150,000 | 229,403 |
| Petroleos del Peru SA(a) |
| 06/19/2032 | 4.750% | | 3,150,000 | 3,554,652 |
| Total | 7,671,535 |
| Philippines 0.0% |
| Philippine Government International Bond |
| 01/15/2032 | 6.375% | | 400,000 | 563,142 |
| 10/23/2034 | 6.375% | | 275,000 | 404,665 |
| Total | 967,807 |
| Poland 0.0% |
| Poland Government International Bond |
| 03/17/2023 | 3.000% | | 300,000 | 311,910 |
| Qatar 0.1% |
| Nakilat, Inc.(a) |
| 12/31/2033 | 6.067% | | 1,164,000 | 1,428,314 |
| Qatar Government International Bond(a) |
| 04/23/2028 | 4.500% | | 840,000 | 985,486 |
| 04/23/2048 | 5.103% | | 1,910,000 | 2,556,172 |
| Foreign Government Obligations(l) (continued) |
| Issuer | Coupon
Rate | | Principal
Amount ($) | Value ($) |
| Ras Laffan Liquefied Natural Gas Co., Ltd. II(a) |
| 09/30/2020 | 5.298% | | 273,552 | 277,682 |
| Total | 5,247,654 |
| Romania 0.1% |
| Romanian Government International Bond(a) |
| 08/22/2023 | 4.375% | | 150,000 | 160,462 |
| 06/15/2048 | 5.125% | | 4,400,000 | 5,136,767 |
| Total | 5,297,229 |
| Russian Federation 0.1% |
| Russian Foreign Bond - Eurobond(a) |
| 09/16/2023 | 4.875% | | 200,000 | 218,706 |
| 05/27/2026 | 4.750% | | 1,600,000 | 1,750,261 |
| 06/23/2027 | 4.250% | | 1,000,000 | 1,065,880 |
| 04/04/2042 | 5.625% | | 800,000 | 989,391 |
| Total | 4,024,238 |
| Saudi Arabia 0.1% |
| Saudi Arabia Government International Bond(a) |
| 04/17/2025 | 4.000% | | 2,530,000 | 2,760,354 |
| Saudi Government International Bond(a) |
| 04/17/2030 | 4.500% | | 750,000 | 876,395 |
| 10/26/2046 | 4.500% | | 230,000 | 267,936 |
| 01/16/2050 | 5.250% | | 1,977,000 | 2,556,330 |
| Total | 6,461,015 |
| South Africa 0.1% |
| Eskom Holdings SOC Ltd.(a) |
| 01/26/2021 | 5.750% | | 2,300,000 | 2,307,335 |
| 08/06/2023 | 6.750% | | 200,000 | 205,286 |
| 02/11/2025 | 7.125% | | 950,000 | 978,155 |
| 08/10/2028 | 6.350% | | 1,400,000 | 1,517,015 |
| Republic of South Africa Government International Bond |
| 10/12/2028 | 4.300% | | 1,225,000 | 1,222,004 |
| South Africa Government International Bond |
| 01/17/2024 | 4.665% | | 640,000 | 674,220 |
| Total | 6,904,015 |
| South Korea 0.0% |
| Export-Import Bank of Korea |
| 12/30/2020 | 2.625% | | 400,000 | 403,063 |
| Korea Development Bank (The) |
| 03/11/2020 | 2.500% | | 300,000 | 300,741 |
| 09/14/2022 | 3.000% | | 200,000 | 205,731 |
| Total | 909,535 |
The accompanying Notes to Financial Statements are an integral part of this statement.
Multi-Manager Total Return Bond Strategies Fund | Annual Report 2019
| 49 |
Portfolio of Investments (continued)
August 31, 2019
| Foreign Government Obligations(l) (continued) |
| Issuer | Coupon
Rate | | Principal
Amount ($) | Value ($) |
| Turkey 0.1% |
| Turkey Government International Bond |
| 03/30/2021 | 5.625% | | 3,400,000 | 3,440,664 |
| 03/23/2023 | 3.250% | | 680,000 | 620,517 |
| 02/05/2025 | 7.375% | | 1,479,000 | 1,533,127 |
| Total | 5,594,308 |
| Ukraine 0.1% |
| Ukraine Government International Bond(a) |
| 09/01/2020 | 7.750% | | 595,000 | 611,363 |
| 09/01/2021 | 7.750% | | 2,710,000 | 2,825,638 |
| 09/01/2022 | 7.750% | | 2,410,000 | 2,552,870 |
| 02/01/2024 | 8.994% | | 1,400,000 | 1,548,382 |
| Total | 7,538,253 |
| United Arab Emirates 0.0% |
| DP World Crescent Ltd.(a) |
| 09/26/2028 | 4.848% | | 540,000 | 600,574 |
| DP World Ltd.(a) |
| 07/02/2037 | 6.850% | | 300,000 | 405,367 |
| Total | 1,005,941 |
| United States 0.0% |
| Citgo Holding, Inc.(a) |
| 08/01/2024 | 9.250% | | 375,000 | 396,556 |
| Uruguay 0.0% |
| Uruguay Government International Bond |
| 10/27/2027 | 4.375% | | 615,000 | 683,770 |
| Virgin Islands 0.0% |
| CNPC General Capital Ltd.(a) |
| 11/25/2019 | 2.700% | | 300,000 | 300,335 |
| Sinopec Group Overseas Development Ltd.(a) |
| 04/28/2025 | 3.250% | | 400,000 | 416,394 |
| 04/28/2025 | 3.250% | | 300,000 | 312,295 |
| Total | 1,029,024 |
Total Foreign Government Obligations
(Cost $256,192,089) | 259,371,722 |
|
| Inflation-Indexed Bonds 0.9% |
| Issuer | Coupon
Rate | | Principal
Amount ($) | Value ($) |
| United States 0.9% |
| U.S. Treasury Inflation-Indexed Bond |
| 04/15/2024 | 0.500% | | 19,499,328 | 19,906,530 |
| 07/15/2024 | 0.125% | | 3,478,937 | 3,507,866 |
| 07/15/2029 | 0.250% | | 21,833,653 | 22,478,659 |
| 02/15/2049 | 1.000% | | 23,475,040 | 27,791,191 |
| Total | 73,684,246 |
Total Inflation-Indexed Bonds
(Cost $70,746,145) | 73,684,246 |
|
| Municipal Bonds 0.4% |
| Issue Description | Coupon
Rate | | Principal
Amount ($) | Value ($) |
| Airport 0.1% |
| Chicago O’Hare International Airport |
| Refunding Revenue Bonds |
| Taxable Senior Lien |
| Series 2018C |
| 01/01/2049 | 4.472% | | 1,630,000 | 2,114,697 |
| 01/01/2054 | 4.572% | | 1,630,000 | 2,151,078 |
| Total | 4,265,775 |
| Higher Education 0.1% |
| University of California |
| Refunding Revenue Bonds |
| Taxable General |
| Series 2017AX |
| 07/01/2025 | 3.063% | | 5,700,000 | 6,031,626 |
| University of Texas System (The) |
| Revenue Bonds |
| Taxable Permanent University Fund |
| Series 2017 |
| 07/01/2047 | 3.376% | | 3,025,000 | 3,383,856 |
| University of Virginia |
| Revenue Bonds |
| Taxable |
| Series 2017C |
| 09/01/2117 | 4.179% | | 725,000 | 936,584 |
| Total | 10,352,066 |
| Local General Obligation 0.1% |
| City of New York |
| Unlimited General Obligation Bonds |
| Series 2010 (BAM) |
| 03/01/2036 | 5.968% | | 3,100,000 | 4,298,212 |
The accompanying Notes to Financial Statements are an integral part of this statement.
| 50 | Multi-Manager Total Return Bond Strategies Fund | Annual Report 2019 |
Portfolio of Investments (continued)
August 31, 2019
| Municipal Bonds (continued) |
| Issue Description | Coupon
Rate | | Principal
Amount ($) | Value ($) |
| Los Angeles Unified School District |
| Unlimited General Obligation Bonds |
| Taxable Build America Bonds |
| Series 2009 |
| 07/01/2034 | 5.750% | | 2,685,000 | 3,591,698 |
| Total | 7,889,910 |
| Municipal Power 0.0% |
| Los Angeles Department of Water & Power System |
| Revenue Bonds |
| Series 2010 (BAM) |
| 07/01/2045 | 6.574% | | 1,595,000 | 2,630,490 |
| Sales Tax 0.0% |
| Puerto Rico Sales Tax Financing Corp. Sales Tax(m) |
| Revenue Bonds |
| Series 2019A-1 |
| 07/01/2058 | 5.000% | | 1,100,000 | 1,146,926 |
| Special Non Property Tax 0.0% |
| State of Illinois |
| Revenue Bonds |
| Taxable Sales Tax |
| Series 2013 |
| 06/15/2028 | 3.350% | | 2,500,000 | 2,557,625 |
| State General Obligation 0.0% |
| State of California |
| Unlimited General Obligation Bonds |
| Build America Bonds |
| Series 2010 |
| 03/01/2040 | 7.625% | | 800,000 | 1,334,576 |
| Turnpike / Bridge / Toll Road 0.1% |
| Bay Area Toll Authority |
| Revenue Bonds |
| Series 2009 (BAM) |
| 04/01/2049 | 6.263% | | 1,920,000 | 3,149,318 |
| Pennsylvania Turnpike Commission |
| Revenue Bonds |
| Build America Bonds |
| Series 2009 |
| 12/01/2039 | 6.105% | | 1,620,000 | 2,320,164 |
| Total | 5,469,482 |
Total Municipal Bonds
(Cost $31,624,254) | 35,646,850 |
|
| Residential Mortgage-Backed Securities - Agency 23.2% |
| Issuer | Coupon
Rate | | Principal
Amount ($) | Value ($) |
| Federal Home Loan Mortgage Corp. |
| 04/01/2021 | 9.000% | | 16 | 16 |
03/01/2022-
08/01/2022 | 8.500% | | 2,768 | 2,864 |
08/01/2024-
02/01/2025 | 8.000% | | 15,276 | 16,387 |
10/01/2028-
07/01/2032 | 7.000% | | 212,158 | 245,840 |
03/01/2031-
03/01/2047 | 3.000% | | 54,712,505 | 56,253,210 |
10/01/2031-
07/01/2037 | 6.000% | | 709,244 | 815,886 |
| 02/01/2032 | 2.500% | | 21,064,566 | 21,426,176 |
04/01/2033-
09/01/2039 | 5.500% | | 1,328,750 | 1,493,601 |
05/01/2033-
05/01/2049 | 3.500% | | 165,696,500 | 173,155,540 |
10/01/2039-
08/01/2048 | 5.000% | | 3,683,068 | 3,955,209 |
09/01/2040-
01/01/2049 | 4.000% | | 34,123,233 | 36,312,891 |
09/01/2040-
10/01/2048 | 4.500% | | 17,870,535 | 18,938,574 |
| CMO Series 2060 Class Z |
| 05/15/2028 | 6.500% | | 171,943 | 192,751 |
| CMO Series 2310 Class Z |
| 04/15/2031 | 6.000% | | 131,273 | 147,413 |
| CMO Series 2725 Class TA |
| 12/15/2033 | 4.500% | | 1,525,000 | 1,785,715 |
| CMO Series 2882 Class ZC |
| 11/15/2034 | 6.000% | | 4,942,292 | 5,702,844 |
| CMO Series 2953 Class LZ |
| 03/15/2035 | 6.000% | | 2,369,893 | 3,036,702 |
| CMO Series 3028 Class ZE |
| 09/15/2035 | 5.500% | | 122,326 | 157,572 |
| CMO Series 3032 Class PZ |
| 09/15/2035 | 5.800% | | 290,835 | 410,120 |
| CMO Series 3071 Class ZP |
| 11/15/2035 | 5.500% | | 6,422,318 | 8,200,299 |
| CMO Series 3121 Class EZ |
| 03/15/2036 | 6.000% | | 142,962 | 163,190 |
| CMO Series 3181 Class AZ |
| 07/15/2036 | 6.500% | | 93,682 | 106,813 |
| CMO Series 353 Class 300 |
| 12/15/2046 | 3.000% | | 12,723,987 | 13,218,728 |
| CMO Series 3740 Class BA |
| 10/15/2040 | 4.000% | | 3,000,000 | 3,399,207 |
| CMO Series 3741 Class PD |
| 10/15/2040 | 4.000% | | 1,855,000 | 2,116,632 |
The accompanying Notes to Financial Statements are an integral part of this statement.
Multi-Manager Total Return Bond Strategies Fund | Annual Report 2019
| 51 |
Portfolio of Investments (continued)
August 31, 2019
| Residential Mortgage-Backed Securities - Agency (continued) |
| Issuer | Coupon
Rate | | Principal
Amount ($) | Value ($) |
| CMO Series 3747 Class HY |
| 10/15/2040 | 4.500% | | 2,991,000 | 3,528,109 |
| CMO Series 3753 Class KZ |
| 11/15/2040 | 4.500% | | 6,048,713 | 7,146,759 |
| CMO Series 3769 Class ZC |
| 12/15/2040 | 4.500% | | 7,174,369 | 7,950,023 |
| CMO Series 3809 Class HZ |
| 02/15/2041 | 4.000% | | 2,476,175 | 2,758,102 |
| CMO Series 3841 Class JZ |
| 04/15/2041 | 5.000% | | 746,425 | 878,716 |
| CMO Series 3888 Class ZG |
| 07/15/2041 | 4.000% | | 1,596,374 | 1,731,388 |
| CMO Series 3926 Class NY |
| 09/15/2041 | 4.000% | | 1,000,000 | 1,089,122 |
| CMO Series 3928 Class MB |
| 09/15/2041 | 4.500% | | 2,435,000 | 2,755,561 |
| CMO Series 3934 Class CB |
| 10/15/2041 | 4.000% | | 6,000,000 | 6,611,102 |
| CMO Series 3963 Class JB |
| 11/15/2041 | 4.500% | | 7,142,422 | 8,420,306 |
| CMO Series 3982 Class TZ |
| 01/15/2042 | 4.000% | | 1,353,683 | 1,526,838 |
| CMO Series 4013 Class PL |
| 03/15/2042 | 3.500% | | 1,281,000 | 1,488,652 |
| CMO Series 4027 Class AB |
| 12/15/2040 | 4.000% | | 4,140,763 | 4,438,962 |
| CMO Series 4034 Class PB |
| 04/15/2042 | 4.500% | | 730,566 | 926,583 |
| CMO Series 4057 Class ZB |
| 06/15/2042 | 3.500% | | 5,138,507 | 5,545,734 |
| CMO Series 4057 Class ZL |
| 06/15/2042 | 3.500% | | 9,830,699 | 10,807,109 |
| CMO Series 4059 Class DY |
| 06/15/2042 | 3.500% | | 5,074,000 | 5,642,808 |
| CMO Series 4077 Class KM |
| 11/15/2041 | 3.500% | | 840,482 | 876,206 |
| CMO Series 4091 Class KB |
| 08/15/2042 | 3.000% | | 6,500,000 | 6,872,523 |
| CMO Series 4182 Class QN |
| 02/15/2033 | 3.000% | | 4,421,423 | 4,516,184 |
| CMO Series 4247 Class AY |
| 09/15/2043 | 4.500% | | 1,500,000 | 1,828,452 |
| CMO Series 4361 Class VB |
| 02/15/2038 | 3.000% | | 6,183,756 | 6,281,423 |
| CMO Series 4396 Class PZ |
| 06/15/2037 | 3.000% | | 714,449 | 750,870 |
| Residential Mortgage-Backed Securities - Agency (continued) |
| Issuer | Coupon
Rate | | Principal
Amount ($) | Value ($) |
| CMO Series 4421 Class PB |
| 12/15/2044 | 4.000% | | 5,941,237 | 6,761,354 |
| CMO Series 4440 Class ZX |
| 01/15/2045 | 4.000% | | 10,771,731 | 12,520,397 |
| CMO Series 4463 Class ZA |
| 04/15/2045 | 4.000% | | 4,755,679 | 5,475,467 |
| CMO Series 4495 Class PA |
| 09/15/2043 | 3.500% | | 484,923 | 503,855 |
| CMO Series 4496 Class PZ |
| 07/15/2045 | 2.500% | | 634,516 | 626,072 |
| CMO Series 4627 Class PL |
| 10/15/2046 | 3.000% | | 2,541,000 | 2,748,930 |
| CMO Series 4649 Class BP |
| 01/15/2047 | 3.500% | | 2,286,452 | 2,476,091 |
| CMO Series 4745 Class VD |
| 01/15/2040 | 4.000% | | 5,493,630 | 6,026,706 |
| CMO Series 4758 Class HA |
| 06/15/2045 | 4.000% | | 3,986,861 | 4,098,248 |
| CMO Series 4767 Class HN |
| 03/15/2048 | 3.500% | | 4,621,584 | 4,922,865 |
| CMO Series 4771 Class HZ |
| 03/15/2048 | 3.500% | | 8,430,576 | 9,075,738 |
| CMO Series 4774 Class KA |
| 12/15/2045 | 4.500% | | 7,509,707 | 7,760,681 |
| CMO Series 4776 Class DW |
| 09/15/2044 | 4.000% | | 10,000,000 | 10,468,280 |
| CMO Series 4793 Class CD |
| 06/15/2048 | 3.000% | | 4,920,983 | 4,979,724 |
| CMO Series 4800 Class KG |
| 11/15/2045 | 3.500% | | 5,000,000 | 5,190,548 |
| CMO Series 4830 Class AP |
| 02/15/2047 | 4.000% | | 8,995,683 | 9,658,089 |
| CMO Series 4839 Class A |
| 04/15/2051 | 4.000% | | 6,126,399 | 6,556,239 |
| CMO Series 4846 Class MC |
| 06/15/2046 | 4.000% | | 18,677,709 | 19,001,039 |
| Federal Home Loan Mortgage Corp.(b) |
| CMO Series 1486 Class FA |
1-month USD LIBOR + 1.300%
Floor 1.300%, Cap 10.000%
04/15/2023 | 3.495% | | 251,887 | 255,821 |
| CMO Series 2380 Class F |
1-month USD LIBOR + 0.450%
Floor 0.450%, Cap 8.500%
11/15/2031 | 2.645% | | 288,161 | 289,280 |
The accompanying Notes to Financial Statements are an integral part of this statement.
| 52 | Multi-Manager Total Return Bond Strategies Fund | Annual Report 2019 |
Portfolio of Investments (continued)
August 31, 2019
| Residential Mortgage-Backed Securities - Agency (continued) |
| Issuer | Coupon
Rate | | Principal
Amount ($) | Value ($) |
| CMO Series 2557 Class FG |
1-month USD LIBOR + 0.400%
Floor 0.400%, Cap 8.000%
01/15/2033 | 2.595% | | 626,711 | 628,209 |
| CMO Series 2962 Class PF |
1-month USD LIBOR + 0.250%
Floor 0.250%, Cap 7.000%
03/15/2035 | 2.445% | | 307,256 | 304,636 |
| CMO Series 2981 Class FU |
1-month USD LIBOR + 0.200%
Floor 0.200%, Cap 8.000%
05/15/2030 | 2.395% | | 480,481 | 478,512 |
| CMO Series 3065 Class EB |
-3.0 x 1-month USD LIBOR + 19.890%
Cap 19.890%
11/15/2035 | 13.305% | | 583,917 | 866,915 |
| CMO Series 3081 Class GC |
-3.7 x 1-month USD LIBOR + 23.833%
Cap 23.833%
12/15/2035 | 15.785% | | 1,017,961 | 1,621,584 |
| CMO Series 3085 Class FV |
1-month USD LIBOR + 0.700%
Floor 0.700%, Cap 8.000%
08/15/2035 | 2.895% | | 1,092,195 | 1,108,581 |
| CMO Series 3564 Class FC |
1-month USD LIBOR + 1.250%
Floor 1.250%, Cap 6.500%
01/15/2037 | 3.480% | | 398,352 | 412,455 |
| CMO Series 3785 Class LS |
-2.0 x 1-month USD LIBOR + 9.900%
Cap 9.900%
01/15/2041 | 5.510% | | 2,032,007 | 2,418,511 |
| CMO Series 3852 Class QN |
-3.6 x 1-month USD LIBOR + 27.211%
Cap 5.500%
05/15/2041 | 5.500% | | 65,011 | 69,387 |
| CMO Series 3973 Class FP |
1-month USD LIBOR + 0.300%
Floor 0.300%, Cap 7.000%
12/15/2026 | 2.495% | | 802,982 | 804,501 |
| CMO Series 4048 Class FJ |
1-month USD LIBOR + 0.400%
Floor 0.400%, Cap 9,999.000%
07/15/2037 | 2.802% | | 443,466 | 442,961 |
| CMO Series 4203 Class QF |
1-month USD LIBOR + 0.250%
Floor 0.250%, Cap 6.500%
05/15/2043 | 2.445% | | 4,828,244 | 4,823,378 |
| Residential Mortgage-Backed Securities - Agency (continued) |
| Issuer | Coupon
Rate | | Principal
Amount ($) | Value ($) |
| CMO Series 4238 Class FD |
1-month USD LIBOR + 0.300%
Floor 0.300%, Cap 7.000%
02/15/2042 | 2.495% | | 2,187,467 | 2,190,521 |
| CMO Series 4311 Class PF |
1-month USD LIBOR + 0.350%
Floor 0.350%, Cap 6.500%
06/15/2042 | 2.545% | | 275,844 | 276,241 |
| CMO Series 4364 Class FE |
1-month USD LIBOR + 0.300%
Floor 0.300%, Cap 7.000%
12/15/2039 | 2.495% | | 419,175 | 419,601 |
| Federal Home Loan Mortgage Corp.(b),(g) |
| CMO Series 2014-4313 Class MS |
-1.0 x 1-month USD LIBOR + 6.150%
Cap 6.150%
04/15/2039 | 3.955% | | 11,341,057 | 1,592,090 |
| CMO Series 3404 Class AS |
-1.0 x 1-month USD LIBOR + 5.895%
Cap 5.895%
01/15/2038 | 3.700% | | 3,367,119 | 607,576 |
| CMO Series 3578 Class DI |
-1.0 x 1-month USD LIBOR + 6.650%
Cap 6.650%
04/15/2036 | 4.455% | | 5,209,332 | 961,140 |
| CMO Series 3892 Class SC |
-1.0 x 1-month USD LIBOR + 5.950%
Cap 5.950%
07/15/2041 | 3.755% | | 7,969,394 | 1,385,773 |
| CMO Series 4087 Class SC |
-1.0 x 1-month USD LIBOR + 5.550%
Cap 5.550%
07/15/2042 | 3.355% | | 10,707,065 | 1,562,426 |
| Federal Home Loan Mortgage Corp.(f),(g) |
| CMO Series 3833 Class LI |
| 10/15/2040 | 1.898% | | 14,988,361 | 745,837 |
| Federal Home Loan Mortgage Corp.(g) |
| CMO Series 4698 Class BI |
| 07/15/2047 | 5.000% | | 30,100,382 | 5,212,847 |
| Federal Home Loan Mortgage Corp.(b),(d),(e) |
| CMO Series 4910 Class SG |
1-month LIBID + 6.050%
Cap 6.050%
09/25/2049 | 3.884% | | 36,495,749 | 7,561,919 |
The accompanying Notes to Financial Statements are an integral part of this statement.
Multi-Manager Total Return Bond Strategies Fund | Annual Report 2019
| 53 |
Portfolio of Investments (continued)
August 31, 2019
| Residential Mortgage-Backed Securities - Agency (continued) |
| Issuer | Coupon
Rate | | Principal
Amount ($) | Value ($) |
| Federal Home Loan Mortgage Corp. Multifamily Structured Pass-Through Certificates(f),(g) |
| CMO Series K051 Class X1 |
| 09/25/2025 | 0.681% | | 18,830,019 | 540,113 |
| CMO Series K058 Class X1 |
| 08/25/2026 | 1.056% | | 2,460,555 | 137,577 |
| CMO Series KW02 Class X1 |
| 12/25/2026 | 0.443% | | 11,583,135 | 176,192 |
| Federal National Mortgage Association |
| 04/01/2023 | 8.500% | | 163 | 164 |
| 06/01/2024 | 9.000% | | 1,889 | 1,905 |
02/01/2025-
08/01/2027 | 8.000% | | 32,940 | 36,252 |
03/01/2026-
07/01/2038 | 7.000% | | 727,416 | 855,881 |
04/01/2027-
06/01/2032 | 7.500% | | 61,059 | 69,003 |
05/01/2029-
10/01/2040 | 6.000% | | 2,434,813 | 2,779,467 |
08/01/2029-
02/01/2048 | 3.000% | | 102,742,209 | 105,592,172 |
| 06/01/2030 | 4.960% | | 1,043,475 | 1,233,839 |
01/01/2031-
11/01/2046 | 2.500% | | 5,593,438 | 5,663,594 |
03/01/2033-
04/01/2041 | 5.500% | | 1,213,081 | 1,359,827 |
10/01/2033-
06/01/2049 | 3.500% | | 236,003,100 | 245,648,221 |
07/01/2039-
10/01/2041 | 5.000% | | 4,681,985 | 5,150,210 |
10/01/2040-
12/01/2048 | 4.500% | | 23,132,642 | 24,572,905 |
02/01/2041-
06/01/2049 | 4.000% | | 101,717,166 | 108,151,584 |
| CMO Series 2003-22 Class Z |
| 04/25/2033 | 6.000% | | 171,773 | 195,309 |
| CMO Series 2003-33 Class PT |
| 05/25/2033 | 4.500% | | 12,183 | 13,363 |
| CMO Series 2003-82 Class Z |
| 08/25/2033 | 5.500% | | 171,954 | 195,031 |
| CMO Series 2005-110 Class GL |
| 12/25/2035 | 5.500% | | 2,002,371 | 2,295,263 |
| CMO Series 2005-68 Class KZ |
| 08/25/2035 | 5.750% | | 16,364,566 | 18,815,586 |
| CMO Series 2007-50 Class DZ |
| 06/25/2037 | 5.500% | | 981,117 | 1,117,789 |
| CMO Series 2009-100 Class PL |
| 12/25/2039 | 5.000% | | 770,652 | 940,181 |
| CMO Series 2009-111 Class DA |
| 12/25/2039 | 5.000% | | 57,947 | 58,718 |
| Residential Mortgage-Backed Securities - Agency (continued) |
| Issuer | Coupon
Rate | | Principal
Amount ($) | Value ($) |
| CMO Series 2010-134 Class DB |
| 12/25/2040 | 4.500% | | 10,000,000 | 11,595,897 |
| CMO Series 2010-139 Class HA |
| 11/25/2040 | 4.000% | | 2,000,000 | 2,232,059 |
| CMO Series 2010-37 Class A1 |
| 05/25/2035 | 5.410% | | 906,947 | 948,487 |
| CMO Series 2010-81 Class PB |
| 08/25/2040 | 5.000% | | 829,499 | 1,000,542 |
| CMO Series 2011-18 Class ZK |
| 03/25/2041 | 4.000% | | 7,610,297 | 8,260,202 |
| CMO Series 2011-53 Class WT |
| 06/25/2041 | 4.500% | | 702,036 | 776,583 |
| CMO Series 2012-103 Class PY |
| 09/25/2042 | 3.000% | | 1,000,000 | 1,070,055 |
| CMO Series 2012-112 Class DA |
| 10/25/2042 | 3.000% | | 19,209,963 | 19,780,413 |
| CMO Series 2012-121 Class GZ |
| 11/25/2042 | 3.500% | | 11,808,658 | 13,080,450 |
| CMO Series 2012-68 Class ZA |
| 07/25/2042 | 3.500% | | 8,441,712 | 9,335,458 |
| CMO Series 2013-106 Class LA |
| 08/25/2041 | 4.000% | | 3,944,491 | 4,210,077 |
| CMO Series 2013-126 Class ZA |
| 07/25/2032 | 4.000% | | 14,153,835 | 15,223,425 |
| CMO Series 2013-15 Class BL |
| 03/25/2043 | 2.500% | | 2,323,879 | 2,337,901 |
| CMO Series 2013-16 Class GD |
| 03/25/2033 | 3.000% | | 9,511,589 | 9,601,957 |
| CMO Series 2013-17 Class JP |
| 03/25/2043 | 3.000% | | 650,000 | 686,079 |
| CMO Series 2013-66 Class AP |
| 05/25/2043 | 6.000% | | 1,441,954 | 1,620,826 |
| CMO Series 2015-18 Class NB |
| 04/25/2045 | 3.000% | | 2,002,796 | 2,128,288 |
| CMO Series 2016-25 Class LB |
| 05/25/2046 | 3.000% | | 5,000,000 | 5,344,668 |
| CMO Series 2016-9 Class A |
| 09/25/2043 | 3.000% | | 661,962 | 673,644 |
| CMO Series 2017-107 Class JM |
| 01/25/2048 | 3.000% | | 6,445,481 | 6,724,344 |
| CMO Series 2017-82 Class ML |
| 10/25/2047 | 4.000% | | 546,948 | 639,526 |
| CMO Series 2017-82 Class PL |
| 10/25/2047 | 3.000% | | 1,062,000 | 1,092,746 |
| CMO Series 2017-89 Class CY |
| 11/25/2047 | 3.000% | | 2,377,511 | 2,556,221 |
The accompanying Notes to Financial Statements are an integral part of this statement.
| 54 | Multi-Manager Total Return Bond Strategies Fund | Annual Report 2019 |
Portfolio of Investments (continued)
August 31, 2019
| Residential Mortgage-Backed Securities - Agency (continued) |
| Issuer | Coupon
Rate | | Principal
Amount ($) | Value ($) |
| CMO Series 2018-38 Class PA |
| 06/25/2047 | 3.500% | | 3,295,700 | 3,389,365 |
| CMO Series 2018-55 Class PA |
| 01/25/2047 | 3.500% | | 12,319,156 | 12,744,608 |
| CMO Series 2018-64 Class ET |
| 09/25/2048 | 3.000% | | 9,206,839 | 9,392,349 |
| CMO Series 2018-94D Class KD |
| 12/25/2048 | 3.500% | | 6,890,912 | 6,997,878 |
| CMO Series 98-17 Class Z |
| 04/18/2028 | 6.500% | | 152,053 | 168,370 |
| Federal National Mortgage Association(c) |
10/16/2033-
09/12/2049 | 3.000% | | 50,531,000 | 51,571,527 |
| 09/12/2043 | 2.500% | | 11,225,000 | 11,292,673 |
| 09/12/2049 | 3.500% | | 25,250,000 | 25,952,266 |
| 09/12/2049 | 4.500% | | 34,652,000 | 36,482,059 |
| 09/12/2049 | 5.000% | | 8,000,000 | 8,542,500 |
| Federal National Mortgage Association(b) |
6-month USD LIBOR + 1.445%
Floor 1.445%, Cap 9.863%
04/01/2034 | 3.986% | | 94,492 | 97,185 |
| CMO Series 2002-59 Class HF |
1-month USD LIBOR + 0.350%
Floor 0.350%, Cap 8.000%
08/17/2032 | 2.532% | | 239,106 | 239,287 |
| CMO Series 2003-134 Class FC |
1-month USD LIBOR + 0.600%
Floor 0.600%, Cap 9.500%
12/25/2032 | 2.745% | | 1,693,057 | 1,711,891 |
| CMO Series 2004-93 Class FC |
1-month USD LIBOR + 0.200%
Floor 0.200%, Cap 8.000%
12/25/2034 | 2.345% | | 887,236 | 883,975 |
| CMO Series 2006-71 Class SH |
-2.6 x 1-month USD LIBOR + 15.738%
Cap 15.738%
05/25/2035 | 10.111% | | 248,515 | 321,868 |
| CMO Series 2007-90 Class F |
1-month USD LIBOR + 0.490%
Floor 0.490%, Cap 7.000%
09/25/2037 | 2.635% | | 562,700 | 565,529 |
| CMO Series 2007-W7 Class 1A4 |
-6.0 x 1-month USD LIBOR + 39.180%
Cap 39.180%
07/25/2037 | 26.309% | | 111,635 | 196,575 |
| Residential Mortgage-Backed Securities - Agency (continued) |
| Issuer | Coupon
Rate | | Principal
Amount ($) | Value ($) |
| CMO Series 2008-15 Class AS |
-5.0 x 1-month USD LIBOR + 33.000%
Cap 33.000%
08/25/2036 | 22.274% | | 552,129 | 951,808 |
| CMO Series 2010-135 Class FD |
1-month USD LIBOR + 0.500%
Floor 0.500%, Cap 6.500%
06/25/2039 | 2.645% | | 1,613,987 | 1,617,471 |
| CMO Series 2010-142 Class HS |
-2.0 x 1-month USD LIBOR + 10.000%
Cap 10.000%
12/25/2040 | 5.541% | | 1,124,332 | 1,323,460 |
| CMO Series 2010-150 Class FL |
1-month USD LIBOR + 0.550%
Floor 0.550%, Cap 7.000%
10/25/2040 | 2.695% | | 512,564 | 515,798 |
| CMO Series 2010-74 Class WF |
1-month USD LIBOR + 0.600%
Floor 0.600%, Cap 7.000%
07/25/2034 | 2.745% | | 908,449 | 917,450 |
| CMO Series 2010-86 Class FE |
1-month USD LIBOR + 0.450%
Floor 0.450%, Cap 6.500%
08/25/2025 | 2.595% | | 699,163 | 699,763 |
| CMO Series 2011-99 Class KF |
1-month USD LIBOR + 0.300%
Floor 0.300%, Cap 7.000%
10/25/2026 | 2.445% | | 774,412 | 774,834 |
| CMO Series 2012-1 Class FA |
1-month USD LIBOR + 0.500%
Floor 0.500%, Cap 6.500%
02/25/2042 | 2.645% | | 2,284,039 | 2,293,443 |
| CMO Series 2012-115 Class MT |
-3.0 x 1-month USD LIBOR + 13.500%
Cap 4.500%
10/25/2042 | 4.500% | | 2,011,880 | 2,065,778 |
| CMO Series 2012-14 Class FB |
1-month USD LIBOR + 0.450%
Floor 0.450%, Cap 7.000%
08/25/2037 | 2.595% | | 146,108 | 146,545 |
| CMO Series 2012-47 Class HF |
1-month USD LIBOR + 0.400%
Floor 0.400%, Cap 6.500%
05/25/2027 | 2.545% | | 1,223,477 | 1,229,593 |
| CMO Series 2012-73 Class LF |
1-month USD LIBOR + 0.450%
Floor 0.450%, Cap 6.500%
06/25/2039 | 2.595% | | 1,286,170 | 1,288,520 |
The accompanying Notes to Financial Statements are an integral part of this statement.
Multi-Manager Total Return Bond Strategies Fund | Annual Report 2019
| 55 |
Portfolio of Investments (continued)
August 31, 2019
| Residential Mortgage-Backed Securities - Agency (continued) |
| Issuer | Coupon
Rate | | Principal
Amount ($) | Value ($) |
| CMO Series 2016-32 Class GT |
-4.5 x 1-month USD LIBOR + 18.000%
Cap 4.500%
01/25/2043 | 4.500% | | 1,928,491 | 1,999,810 |
| CMO Series 2017-82 Class FG |
1-month USD LIBOR + 0.250%
Floor 0.250%, Cap 6.500%
11/25/2032 | 2.395% | | 2,195,414 | 2,184,119 |
| Federal National Mortgage Association(b),(g) |
| CMO Series 2004-29 Class PS |
-1.0 x 1-month USD LIBOR + 7.600%
Cap 7.600%
05/25/2034 | 5.455% | | 2,199,656 | 383,491 |
| CMO Series 2006-43 Class SJ |
-1.0 x 1-month USD LIBOR + 6.590%
Cap 6.590%
06/25/2036 | 4.445% | | 1,741,078 | 261,806 |
| CMO Series 2009-100 Class SA |
-1.0 x 1-month USD LIBOR + 6.200%
Cap 6.200%
12/25/2039 | 4.055% | | 5,634,936 | 861,042 |
| CMO Series 2009-87 Class NS |
-1.0 x 1-month USD LIBOR + 6.250%
Cap 6.250%
11/25/2039 | 4.105% | | 9,118,026 | 1,442,485 |
| CMO Series 2010-131 Class SA |
-1.0 x 1-month USD LIBOR + 6.600%
Cap 6.600%
11/25/2040 | 4.455% | | 6,945,086 | 1,486,770 |
| CMO Series 2010-21 Class SA |
-1.0 x 1-month USD LIBOR + 6.250%
Cap 6.250%
03/25/2040 | 4.105% | | 13,422,783 | 2,470,136 |
| CMO Series 2010-57 Class SA |
-1.0 x 1-month USD LIBOR + 6.450%
Cap 6.450%
06/25/2040 | 4.305% | | 3,272,617 | 478,626 |
| CMO Series 2011-47 Class GS |
-1.0 x 1-month USD LIBOR + 5.930%
Cap 5.930%
06/25/2041 | 3.785% | | 11,247,836 | 1,290,447 |
| Residential Mortgage-Backed Securities - Agency (continued) |
| Issuer | Coupon
Rate | | Principal
Amount ($) | Value ($) |
| CMO Series 2012-17 Class MS |
-1.0 x 1-month USD LIBOR + 6.700%
Cap 6.700%
03/25/2027 | 4.555% | | 7,511,014 | 774,587 |
| CMO Series 2013-10 Class SJ |
-1.0 x 1-month USD LIBOR + 6.150%
Cap 6.150%
02/25/2043 | 4.005% | | 10,242,813 | 1,818,787 |
| CMO Series 2014-40 Class HS |
-1.0 x 1-month USD LIBOR + 6.700%
Cap 6.700%
07/25/2044 | 4.555% | | 6,883,233 | 1,529,123 |
| CMO Series 2014-52 Class SL |
-1.0 x 1-month USD LIBOR + 6.100%
Cap 6.100%
09/25/2044 | 3.955% | | 12,801,234 | 2,107,431 |
| CMO Series 2016-19 Class SA |
-1.0 x 1-month USD LIBOR + 6.100%
Cap 6.100%
04/25/2046 | 3.955% | | 10,857,654 | 1,408,594 |
| CMO Series 2016-32 Class SA |
-1.0 x 1-month USD LIBOR + 6.100%
Cap 6.100%
10/25/2034 | 3.955% | | 4,969,881 | 693,789 |
| CMO Series 2016-60 Class QS |
-1.0 x 1-month USD LIBOR + 6.100%
Cap 6.100%
09/25/2046 | 3.955% | | 14,122,235 | 2,380,748 |
| CMO Series 2016-60 Class SE |
-1.0 x 1-month USD LIBOR + 6.250%
Cap 6.250%
09/25/2046 | 4.105% | | 13,751,203 | 2,325,539 |
| CMO Series 2016-82 Class SG |
-1.0 x 1-month USD LIBOR + 6.100%
Cap 6.100%
11/25/2046 | 3.955% | | 17,822,768 | 3,175,237 |
| CMO Series 2016-93 Class SL |
-1.0 x 1-month USD LIBOR + 6.650%
Cap 6.650%
12/25/2046 | 4.505% | | 8,948,544 | 1,664,964 |
The accompanying Notes to Financial Statements are an integral part of this statement.
| 56 | Multi-Manager Total Return Bond Strategies Fund | Annual Report 2019 |
Portfolio of Investments (continued)
August 31, 2019
| Residential Mortgage-Backed Securities - Agency (continued) |
| Issuer | Coupon
Rate | | Principal
Amount ($) | Value ($) |
| CMO Series 2017-26 Class SA |
-1.0 x 1-month USD LIBOR + 6.150%
Cap 6.150%
04/25/2047 | 4.005% | | 12,569,129 | 2,131,071 |
| CMO Series 2017-57 Class SD |
-1.0 x 1-month USD LIBOR + 3.950%
Cap 2.750%
08/25/2047 | 1.805% | | 16,775,932 | 1,368,292 |
| CMO Series 2018-61 Class SA |
1-month USD LIBOR + 6.200%
Cap 6.200%
08/25/2048 | 4.055% | | 7,214,480 | 1,255,456 |
| CMO Series 2019-35 Class SH |
-1.0 x 1-month USD LIBOR + 6.150%
Cap 6.150%
07/25/2049 | 4.005% | | 31,561,847 | 4,829,670 |
| CMO Series 2019-39 Class SB |
-1.0 x 1-month USD LIBOR + 6.100%
Cap 6.100%
08/25/2049 | 3.955% | | 34,121,197 | 5,527,395 |
| Federal National Mortgage Association(g) |
| CMO Series 2013-16 Class MI |
| 03/25/2043 | 4.000% | | 9,435,572 | 1,170,142 |
| CMO Series 2013-23 Class AI |
| 03/25/2043 | 5.000% | | 13,974,858 | 2,340,912 |
| Federal National Mortgage Association(f) |
| CMO Series 2016-40 Class GA |
| 07/25/2046 | 4.610% | | 5,106,642 | 5,333,346 |
| Federal National Mortgage Association(n) |
| CMO Series G93-28 Class E |
| 07/25/2022 | 0.000% | | 126,577 | 122,800 |
| Government National Mortgage Association |
05/15/2040-
10/20/2048 | 5.000% | | 10,917,688 | 11,667,068 |
05/20/2041-
08/20/2048 | 4.500% | | 24,124,565 | 25,341,846 |
02/15/2042-
10/20/2048 | 4.000% | | 30,817,133 | 32,243,399 |
03/20/2046-
09/20/2047 | 3.500% | | 43,029,024 | 44,908,665 |
09/20/2046-
11/20/2047 | 3.000% | | 25,081,424 | 25,963,373 |
| 01/20/2061 | 5.304% | | 26,975 | 27,120 |
| 04/20/2061 | 4.310% | | 2,225 | 2,424 |
| 01/20/2062 | 4.391% | | 4,943 | 5,037 |
| 03/20/2062 | 4.314% | | 28,728 | 28,837 |
| 05/20/2062 | 4.295% | | 36,355 | 36,685 |
| 05/20/2062 | 4.331% | | 31,368 | 31,918 |
| 06/20/2062 | 4.416% | | 26,359 | 26,464 |
| Residential Mortgage-Backed Securities - Agency (continued) |
| Issuer | Coupon
Rate | | Principal
Amount ($) | Value ($) |
| 07/20/2062 | 4.635% | | 15,172 | 15,316 |
| 08/20/2062 | 4.450% | | 77,166 | 77,623 |
| 10/20/2062 | 4.398% | | 21,777 | 22,083 |
| 03/20/2063 | 4.453% | | 52,776 | 53,462 |
| 04/20/2063 | 4.525% | | 53,553 | 54,375 |
| 04/20/2063 | 5.037% | | 1,136 | 1,154 |
| 06/20/2063 | 4.365% | | 3,203,394 | 3,265,497 |
| 01/20/2064 | 4.506% | | 17,021 | 17,264 |
| 01/20/2064 | 4.671% | | 315,650 | 336,702 |
| 02/20/2064 | 4.615% | | 419,197 | 457,252 |
| 05/20/2064 | 4.670% | | 301,247 | 324,486 |
| 06/20/2064 | 4.215% | | 423,730 | 450,289 |
| 12/20/2064 | 4.624% | | 4,057,191 | 4,449,187 |
| 02/20/2065 | 4.576% | | 328,008 | 357,148 |
| 01/20/2066 | 4.519% | | 2,789,558 | 3,064,496 |
| 01/20/2066 | 4.548% | | 809,801 | 891,220 |
| 01/20/2066 | 4.577% | | 984,540 | 1,079,978 |
| 02/20/2066 | 4.469% | | 3,443,974 | 3,823,529 |
| 02/20/2066 | 4.531% | | 2,396,202 | 2,640,175 |
| 04/20/2066 | 4.565% | | 2,463,668 | 2,715,575 |
| 07/20/2066 | 4.649% | | 507,750 | 551,621 |
| 08/20/2066 | 4.607% | | 1,050,245 | 1,175,270 |
| 12/20/2066 | 4.427% | | 510,606 | 569,820 |
| 12/20/2066 | 4.534% | | 662,321 | 738,408 |
| 12/20/2066 | 4.567% | | 2,000,139 | 2,176,224 |
| 01/20/2067 | 4.597% | | 388,116 | 422,031 |
| 04/20/2067 | 4.555% | | 2,771,119 | 3,095,763 |
| 04/20/2067 | 4.563% | | 440,337 | 477,986 |
| 06/20/2067 | 4.454% | | 1,942,046 | 2,164,781 |
| 06/20/2067 | 4.627% | | 803,359 | 906,644 |
| 08/20/2067 | 4.620% | | 775,143 | 832,232 |
| 08/20/2067 | 4.641% | | 2,258,208 | 2,561,650 |
| 08/20/2067 | 4.663% | | 962,336 | 1,089,308 |
| CMO Series 2005-45 Class ZA |
| 06/16/2035 | 6.000% | | 1,284,083 | 1,813,843 |
| CMO Series 2009-104 Class YD |
| 11/20/2039 | 5.000% | | 3,639,593 | 4,047,499 |
| CMO Series 2009-55 Class LX |
| 07/20/2039 | 5.000% | | 3,918,677 | 4,354,648 |
| CMO Series 2009-67 Class DB |
| 08/20/2039 | 5.000% | | 4,496,695 | 4,927,512 |
| CMO Series 2010-120 Class AY |
| 09/20/2040 | 4.000% | | 4,755,301 | 5,168,075 |
| CMO Series 2010-135 Class PE |
| 10/16/2040 | 4.000% | | 11,742,973 | 12,736,155 |
| CMO Series 2011-22 Class PL |
| 02/20/2041 | 5.000% | | 1,935,000 | 2,379,387 |
| CMO Series 2013-116 Class BY |
| 08/16/2043 | 4.000% | | 3,648,396 | 4,260,794 |
| CMO Series 2013-170 Class WZ |
| 11/16/2043 | 3.000% | | 790,888 | 835,367 |
The accompanying Notes to Financial Statements are an integral part of this statement.
Multi-Manager Total Return Bond Strategies Fund | Annual Report 2019
| 57 |
Portfolio of Investments (continued)
August 31, 2019
| Residential Mortgage-Backed Securities - Agency (continued) |
| Issuer | Coupon
Rate | | Principal
Amount ($) | Value ($) |
| CMO Series 2013-H07 Class JA |
| 03/20/2063 | 1.750% | | 422,115 | 420,261 |
| CMO Series 2014-3 Class EP |
| 02/16/2043 | 2.750% | | 15,588,562 | 15,959,557 |
| CMO Series 2018-115 Class DE |
| 08/20/2048 | 3.500% | | 6,064,110 | 6,221,897 |
| CMO Series 2018-53 Class AL |
| 11/20/2045 | 3.500% | | 733,755 | 778,862 |
| CMO Series 2019-H04 Class NA |
| 09/20/2068 | 3.500% | | 962,848 | 1,036,391 |
| Government National Mortgage Association(c) |
| 10/23/2047 | 4.000% | | 36,300,000 | 37,815,100 |
| 09/20/2048 | 5.000% | | 2,550,000 | 2,678,695 |
10/18/2048-
09/19/2049 | 3.000% | | 63,416,000 | 65,302,346 |
| Government National Mortgage Association(b) |
1-year CMT + 1.136%
03/20/2066 | 3.496% | | 560,812 | 570,096 |
1-year CMT + 0.689%
04/20/2066 | 3.030% | | 685,443 | 693,200 |
| CMO Series 2003-60 Class GS |
-1.7 x 1-month USD LIBOR + 12.417%
Cap 12.417%
05/16/2033 | 8.754% | | 243,558 | 264,087 |
| CMO Series 2006-37 Class AS |
-6.0 x 1-month USD LIBOR + 39.660%
Cap 39.660%
07/20/2036 | 26.627% | | 1,091,590 | 2,041,400 |
| CMO Series 2010-H03 Class FA |
1-month USD LIBOR + 0.550%
Floor 0.550%, Cap 10.690%
03/20/2060 | 2.954% | | 918,064 | 919,631 |
| CMO Series 2010-H26 Class LF |
1-month USD LIBOR + 0.350%
Floor 0.350%, Cap 13.898%
08/20/2058 | 2.730% | | 348,957 | 348,084 |
| CMO Series 2011-114 Class KF |
1-month USD LIBOR + 0.450%
Floor 0.450%, Cap 6.500%
03/20/2041 | 2.622% | | 382,571 | 382,877 |
| CMO Series 2011-H03 Class FA |
1-month USD LIBOR + 0.500%
Floor 0.500%, Cap 10.650%
01/20/2061 | 2.880% | | 1,225,484 | 1,226,337 |
| CMO Series 2012-H20 Class BA |
1-month USD LIBOR + 0.560%
Floor 0.560%
09/20/2062 | 2.940% | | 315,149 | 315,719 |
| Residential Mortgage-Backed Securities - Agency (continued) |
| Issuer | Coupon
Rate | | Principal
Amount ($) | Value ($) |
| CMO Series 2012-H21 Class CF |
1-month USD LIBOR + 0.700%
Floor 0.700%
05/20/2061 | 3.080% | | 13,777 | 13,826 |
| CMO Series 2012-H21 Class DF |
1-month USD LIBOR + 0.650%
Floor 0.650%
05/20/2061 | 3.030% | | 12,284 | 12,319 |
| CMO Series 2012-H22 Class FD |
1-month USD LIBOR + 0.470%
Floor 0.470%, Cap 5.290%
01/20/2061 | 2.850% | | 64,079 | 64,085 |
| CMO Series 2012-H25 Class FA |
1-month USD LIBOR + 0.700%
Floor 0.700%
12/20/2061 | 3.080% | | 198,196 | 198,559 |
| CMO Series 2013-115 Class EF |
1-month USD LIBOR + 0.250%
Floor 0.250%, Cap 6.500%
04/16/2028 | 2.447% | | 461,837 | 461,143 |
| CMO Series 2013-135 Class FH |
1-month USD LIBOR + 0.150%
Floor 0.150%, Cap 7.500%
09/16/2043 | 2.347% | | 1,603,230 | 1,601,810 |
| CMO Series 2013-H02 Class FD |
1-month USD LIBOR + 0.340%
Floor 0.340%, Cap 10.500%
12/20/2062 | 2.720% | | 413,738 | 412,606 |
| CMO Series 2013-H05 Class FB |
1-month USD LIBOR + 0.400%
Floor 0.400%
02/20/2062 | 2.780% | | 45,092 | 44,965 |
| CMO Series 2013-H08 Class BF |
1-month USD LIBOR + 0.400%
Floor 0.400%, Cap 10.000%
03/20/2063 | 2.780% | | 2,272,896 | 2,267,549 |
| CMO Series 2013-H14 Class FD |
1-month USD LIBOR + 0.470%
Floor 0.470%, Cap 11.000%
06/20/2063 | 2.850% | | 1,922,513 | 1,922,519 |
| CMO Series 2013-H17 Class FA |
1-month USD LIBOR + 0.550%
Floor 0.550%, Cap 11.000%
07/20/2063 | 2.930% | | 684,448 | 685,587 |
| CMO Series 2013-H18 Class EA |
1-month USD LIBOR + 0.500%
Floor 0.500%, Cap 10.190%
07/20/2063 | 2.880% | | 684,264 | 684,726 |
The accompanying Notes to Financial Statements are an integral part of this statement.
| 58 | Multi-Manager Total Return Bond Strategies Fund | Annual Report 2019 |
Portfolio of Investments (continued)
August 31, 2019
| Residential Mortgage-Backed Securities - Agency (continued) |
| Issuer | Coupon
Rate | | Principal
Amount ($) | Value ($) |
| CMO Series 2013-H19 Class FC |
1-month USD LIBOR + 0.600%
Floor 0.600%, Cap 11.000%
08/20/2063 | 2.980% | | 4,669,427 | 4,680,998 |
| CMO Series 2015-H26 Class FC |
1-month USD LIBOR + 0.600%
Floor 0.600%, Cap 11.000%
08/20/2065 | 2.980% | | 507,542 | 508,619 |
| CMO Series 2015-H31 Class FT |
1-month USD LIBOR + 0.650%
Floor 0.650%
11/20/2065 | 3.030% | | 4,680,370 | 4,701,030 |
| CMO Series 2016-H04 Class FG |
1-month USD LIBOR + 0.700%
Floor 0.700%, Cap 999.000%
12/20/2061 | 3.080% | | 77,217 | 77,415 |
| CMO Series 2016-H13 Class FT |
1-month USD LIBOR + 0.580%
Floor 0.580%, Cap 11.000%
05/20/2066 | 2.960% | | 7,458,455 | 7,470,723 |
| CMO Series 2017-H03 Class FB |
1-month USD LIBOR + 0.650%
Floor 0.650%
06/20/2066 | 3.030% | | 4,994,656 | 5,012,698 |
| CMO Series 2017-H19 Class FA |
1-month USD LIBOR + 0.450%
Floor 0.450%, Cap 11.000%
08/20/2067 | 2.830% | | 22,486,580 | 22,479,164 |
| CMO Series 2018-H04 Class FM |
1-month USD LIBOR + 0.300%
Floor 0.300%, Cap 11.000%
03/20/2068 | 2.680% | | 4,337,396 | 4,314,404 |
| CMO Series 2019-H01 Class FL |
1-month USD LIBOR + 0.450%
Floor 0.450%, Cap 11.000%
12/20/2068 | 2.830% | | 942,776 | 942,024 |
| CMO Series 2019-H05 Class FT |
1-year CMT + 0.430%
Floor 0.430%, Cap 12.000%
04/20/2069 | 2.830% | | 12,425,097 | 12,406,438 |
| CMO Series 2019-H10 Class FM |
1-month USD LIBOR + 0.400%
Floor 0.400%, Cap 11.000%
05/20/2069 | 2.780% | | 3,762,614 | 3,760,983 |
| Government National Mortgage Association(b),(g) |
| CMO Series 2010-31 Class ES |
-1.0 x 1-month USD LIBOR + 5.000%
Cap 5.000%
03/20/2040 | 2.828% | | 19,638,946 | 1,895,969 |
| Residential Mortgage-Backed Securities - Agency (continued) |
| Issuer | Coupon
Rate | | Principal
Amount ($) | Value ($) |
| CMO Series 2011-13 Class S |
1-month LIBID + 5.950%
Cap 5.950%
01/16/2041 | 3.753% | | 9,627,400 | 1,756,235 |
| CMO Series 2011-30 Class SB |
1-month LIBID + 6.600%
Cap 6.600%
02/20/2041 | 4.428% | | 5,649,559 | 1,175,158 |
| CMO Series 2015-155 Class SA |
-1.0 x 1-month USD LIBOR + 5.700%
Cap 5.700%
10/20/2045 | 3.528% | | 10,614,180 | 1,236,158 |
| CMO Series 2019-86 Class SG |
-1.0 x 1-month USD LIBOR + 5.600%
Cap 5.600%
07/20/2049 | 3.428% | | 11,425,601 | 1,559,765 |
| Government National Mortgage Association(f) |
| CMO Series 2010-H17 Class XQ |
| 07/20/2060 | 5.212% | | 250,984 | 259,534 |
| CMO Series 2017-H04 Class DA |
| 12/20/2066 | 4.609% | | 35,392 | 35,695 |
| Series 2003-72 Class Z |
| 11/16/2045 | 5.288% | | 476,411 | 512,631 |
| Government National Mortgage Association(f),(g) |
| CMO Series 2014-150 Class IO |
| 07/16/2056 | 0.743% | | 33,716,844 | 1,394,943 |
| CMO Series 2014-H05 Class AI |
| 02/20/2064 | 1.351% | | 5,856,355 | 412,166 |
| CMO Series 2014-H14 Class BI |
| 06/20/2064 | 1.660% | | 7,773,856 | 647,029 |
| CMO Series 2014-H15 Class HI |
| 05/20/2064 | 1.428% | | 10,145,006 | 601,461 |
| CMO Series 2014-H20 Class HI |
| 10/20/2064 | 1.225% | | 3,576,104 | 199,700 |
| CMO Series 2015-163 Class IO |
| 12/16/2057 | 0.772% | | 4,797,609 | 260,163 |
| CMO Series 2015-189 Class IG |
| 01/16/2057 | 0.918% | | 29,494,124 | 1,806,692 |
| CMO Series 2015-30 Class IO |
| 07/16/2056 | 1.020% | | 7,379,188 | 468,980 |
| CMO Series 2015-32 Class IO |
| 09/16/2049 | 0.838% | | 11,238,553 | 533,020 |
| CMO Series 2015-73 Class IO |
| 11/16/2055 | 0.795% | | 7,810,376 | 401,544 |
| CMO Series 2015-9 Class IO |
| 02/16/2049 | 0.963% | | 22,592,797 | 1,201,842 |
The accompanying Notes to Financial Statements are an integral part of this statement.
Multi-Manager Total Return Bond Strategies Fund | Annual Report 2019
| 59 |
Portfolio of Investments (continued)
August 31, 2019
| Residential Mortgage-Backed Securities - Agency (continued) |
| Issuer | Coupon
Rate | | Principal
Amount ($) | Value ($) |
| CMO Series 2015-H22 Class BI |
| 09/20/2065 | 1.797% | | 3,014,195 | 231,558 |
| CMO Series 2016-72 Class IO |
| 12/16/2055 | 0.885% | | 16,789,010 | 1,064,472 |
| Government National Mortgage Association(g) |
| CMO Series 2016-88 Class PI |
| 07/20/2046 | 4.000% | | 13,531,091 | 2,166,712 |
| CMO Series 2017-52 Class AI |
| 04/20/2047 | 6.000% | | 8,115,260 | 1,525,608 |
| CMO Series 2017-68 Class TI |
| 05/20/2047 | 5.500% | | 3,469,042 | 627,721 |
| CMO Series 2019-108 Class MI |
| 07/20/2049 | 3.500% | | 17,916,714 | 2,684,454 |
| CMO Series 2019-99 Class AI |
| 08/16/2049 | 4.000% | | 6,962,986 | 1,725,305 |
| Seasoned Credit Risk Transfer Trust |
| CMO Series 2018-2 Class MV (FHLMC) |
| 11/25/2057 | 3.500% | | 4,776,727 | 5,206,848 |
Total Residential Mortgage-Backed Securities - Agency
(Cost $1,907,224,894) | 1,952,182,472 |
|
| Residential Mortgage-Backed Securities - Non-Agency 5.1% |
| | | | |
| Ajax Mortgage Loan Trust(a) |
| CMO Series 2017-A Class A |
| 04/25/2057 | 3.470% | | 2,337,037 | 2,334,163 |
| ASG Resecuritization Trust(a),(f) |
| CMO Series 2009-2 Class G75 |
| 05/24/2036 | 3.606% | | 1,358,340 | 1,358,819 |
| Banc of America Funding Trust |
| CMO Series 2006-3 Class 4A14 |
| 03/25/2036 | 6.000% | | 1,116,461 | 1,139,298 |
| CMO Series 2006-3 Class 5A3 |
| 03/25/2036 | 5.500% | | 875,958 | 835,109 |
| Banc of America Funding Trust(o) |
| CMO Series 2006-D Class 3A1 |
| 05/20/2036 | 4.254% | | 1,453,461 | 1,416,627 |
| Banc of America Funding Trust(b) |
| CMO Series 2007-C Class 7A1 |
1-month USD LIBOR + 0.210%
Floor 0.210%
05/20/2047 | 2.382% | | 2,960,519 | 2,859,231 |
| Bayview Opportunity Master Fund IVa Trust(a) |
| CMO Series 2016-SPL1 Class A |
| 04/28/2055 | 4.000% | | 1,939,320 | 1,987,734 |
| Carrington Mortgage Loan Trust(b) |
| CMO Series 2006-NC3 Class A3 |
1-month USD LIBOR + 0.150%
Floor 0.150%, Cap 12.500%
08/25/2036 | 2.295% | | 3,149,575 | 2,784,437 |
| Residential Mortgage-Backed Securities - Non-Agency (continued) |
| Issuer | Coupon
Rate | | Principal
Amount ($) | Value ($) |
| Chase Home Lending Mortgage Trust(a),(f) |
| CMO Series 2019-ATR1 Class A3 |
| 04/25/2049 | 4.000% | | 1,967,270 | 2,022,592 |
| Chase Mortgage Finance Corp.(a),(f) |
| Subordinated, Series 2016-SH1 Class M2 |
| 04/25/2045 | 3.750% | | 539,952 | 559,435 |
| CIM Trust(a),(b) |
| CMO Series 2017-3 Class A1 |
1-month USD LIBOR + 2.000%
01/25/2057 | 4.100% | | 6,390,744 | 6,500,498 |
| CMO Series 2018-R6 Class A1 |
1-month USD LIBOR + 1.076%
Floor 1.080%
09/25/2058 | 3.176% | | 9,294,353 | 9,229,595 |
| CIM Trust(a) |
| CMO Series 2017-6 Class A1 |
| 06/25/2057 | 3.015% | | 12,823,236 | 12,940,301 |
| Citicorp Mortgage Securities Trust |
| CMO Series 2007-8 Class 1A3 |
| 09/25/2037 | 6.000% | | 752,049 | 809,220 |
| Citigroup Commercial Mortgage Trust(a),(f),(g) |
| CMO Series 2017-1500 Class XCP |
| 07/15/2032 | 0.000% | | 153,533,000 | 154 |
| Citigroup Mortgage Loan Trust, Inc.(a),(f) |
| CMO Series 2014-12 Class 3A1 |
| 10/25/2035 | 4.527% | | 918,437 | 934,846 |
| CMO Series 2015-A Class A4 |
| 06/25/2058 | 4.250% | | 588,955 | 617,338 |
| COLT Mortgage Loan Trust(a),(f) |
| CMO Series 2018-1 Class M1 |
| 02/25/2048 | 3.661% | | 4,000,000 | 4,006,889 |
| CMO Series 2019-1 Class M1 |
| 03/25/2049 | 4.518% | | 2,000,000 | 2,019,802 |
| Connecticut Avenue Securities Trust(a),(b) |
| CMO Series 2019-R01 Class 2M2 |
1-month USD LIBOR + 2.450%
07/25/2031 | 4.595% | | 1,000,000 | 1,011,162 |
| CMO Series 2019-R02 Class 1M2 |
1-month USD LIBOR + 2.300%
Floor 2.300%
08/25/2031 | 4.445% | | 2,000,000 | 2,017,549 |
| Subordinated, CMO Series 2018-R07 Class 1M2 |
1-month USD LIBOR + 2.400%
04/25/2031 | 4.545% | | 4,100,000 | 4,138,233 |
| Countrywide Home Loan Mortgage Pass-Through Trust(f) |
| CMO Series 2007-HY5 Class 1A1 |
| 09/25/2047 | 4.434% | | 583,422 | 574,437 |
| Credit Suisse Mortgage Capital Certificates(a),(f) |
| CMO Series 2009-14R Class 4A9 |
| 10/26/2035 | 4.815% | | 801,626 | 817,100 |
The accompanying Notes to Financial Statements are an integral part of this statement.
| 60 | Multi-Manager Total Return Bond Strategies Fund | Annual Report 2019 |
Portfolio of Investments (continued)
August 31, 2019
| Residential Mortgage-Backed Securities - Non-Agency (continued) |
| Issuer | Coupon
Rate | | Principal
Amount ($) | Value ($) |
| CMO Series 2011-12R Class 3A1 |
| 07/27/2036 | 3.852% | | 891,722 | 893,566 |
| Credit Suisse Mortgage Capital Certificates(a),(b) |
| CMO Series 2016-RPL1 Class A1 |
1-month USD LIBOR + 3.150%
Floor 3.150%
12/26/2046 | 5.380% | | 4,516,250 | 4,522,498 |
| Credit-Based Asset Servicing & Securitization LLC(f) |
| CMO Series 2007-CB1 Class AF3 |
| 01/25/2037 | 5.737% | | 4,098,314 | 1,923,327 |
| CSMC Trust(a) |
| CMO Series 2018-RPL8 Class A1 |
| 07/25/2058 | 4.125% | | 5,963,147 | 6,024,158 |
| CSMC Trust(a),(f) |
| CMO Series 2018-RPL9 Class A |
| 09/25/2057 | 3.850% | | 12,049,003 | 12,591,554 |
| CSMCM Trust Certificates(a),(f) |
| CMO Series 2018-RPL4 Class CERT |
| 07/25/2050 | 3.735% | | 3,615,986 | 3,708,759 |
| Deephaven Residential Mortgage Trust(a),(f) |
| CMO Series 2019-1A Class M1 |
| 01/25/2059 | 4.402% | | 2,500,000 | 2,558,361 |
| Domino’s Pizza Master Issuer LLC(a) |
| CMO Series 2015-1A Class A2II |
| 10/25/2045 | 4.474% | | 1,935,000 | 2,043,167 |
| Downey Savings & Loan Association Mortgage Loan Trust(b) |
| CMO Series 2005-AR6 Class 2A1A |
1-month USD LIBOR + 0.290%
Floor 0.290%, Cap 11.000%
10/19/2045 | 2.472% | | 1,810,208 | 1,747,317 |
| CMO Series 2006-AR2 Class 2A1A |
1-month USD LIBOR + 0.200%
Floor 0.200%
10/19/2036 | 2.382% | | 2,595,409 | 2,439,412 |
| Eagle RE Ltd.(a),(b) |
| CMO Series 2019-1 Class M1A |
1-month USD LIBOR + 1.250%
04/25/2029 | 3.395% | | 900,000 | 899,677 |
| CMO Series 2019-1 Class M1B |
1-month USD LIBOR + 1.800%
04/25/2029 | 3.945% | | 600,000 | 597,624 |
| Ellington Financial Mortgage Trust(a),(f) |
| CMO Series 2019-1 Class M1 |
| 06/25/2059 | 3.587% | | 1,000,000 | 1,013,345 |
| Fannie Mae Connecticut Avenue Securities(b) |
| CMO Series 2015-C02 Class 1M2 |
1-month USD LIBOR + 4.000%
05/25/2025 | 6.145% | | 3,329,064 | 3,507,050 |
| Residential Mortgage-Backed Securities - Non-Agency (continued) |
| Issuer | Coupon
Rate | | Principal
Amount ($) | Value ($) |
| CMO Series 2015-C03 Class 1M2 |
1-month USD LIBOR + 5.000%
Floor 5.000%
07/25/2025 | 7.145% | | 641,315 | 688,468 |
| CMO Series 2015-C03 Class 2M2 |
1-month USD LIBOR + 5.000%
07/25/2025 | 7.145% | | 1,769,709 | 1,851,386 |
| CMO Series 2015-C04 Class 1M2 |
1-month USD LIBOR + 5.700%
04/25/2028 | 7.845% | | 2,756,229 | 2,990,517 |
| CMO Series 2015-C04 Class 2M2 |
1-month USD LIBOR + 5.550%
04/25/2028 | 7.695% | | 2,946,387 | 3,130,121 |
| CMO Series 2016-C04 Class 1M2 |
1-month USD LIBOR + 4.250%
01/25/2029 | 6.395% | | 3,300,000 | 3,475,411 |
| CMO Series 2016-C05 Class 2M2 |
1-month USD LIBOR + 4.450%
Floor 4.450%
01/25/2029 | 6.595% | | 3,988,185 | 4,181,148 |
| CMO Series 2016-C07 Class 2M2 |
1-month USD LIBOR + 4.350%
05/25/2029 | 6.495% | | 2,769,417 | 2,901,651 |
| CMO Series 2017-C02 Class 2M2 |
1-month USD LIBOR + 3.650%
09/25/2029 | 5.795% | | 2,300,000 | 2,411,656 |
| CMO Series 2017-C03 Class 1M2 |
1-month USD LIBOR + 3.000%
10/25/2029 | 5.145% | | 2,700,000 | 2,802,316 |
| CMO Series 2017-C04 Class 2M2 |
1-month USD LIBOR + 2.850%
11/25/2029 | 4.995% | | 3,809,641 | 3,905,708 |
| CMO Series 2017-C05 Class 1M2 |
1-month USD LIBOR + 2.200%
01/25/2030 | 4.345% | | 3,085,105 | 3,125,143 |
| CMO Series 2017-C06 Class 1M2 |
1-month USD LIBOR + 2.650%
Floor 2.650%
02/25/2030 | 4.795% | | 200,000 | 204,057 |
| CMO Series 2017-C07 Class 1M2 |
1-month USD LIBOR + 2.400%
Floor 2.400%
05/25/2030 | 4.545% | | 3,000,000 | 3,030,079 |
| CMO Series 2017-C07 Class 2M2 |
1-month USD LIBOR + 2.500%
Floor 2.500%
05/25/2030 | 4.645% | | 3,580,000 | 3,619,347 |
The accompanying Notes to Financial Statements are an integral part of this statement.
Multi-Manager Total Return Bond Strategies Fund | Annual Report 2019
| 61 |
Portfolio of Investments (continued)
August 31, 2019
| Residential Mortgage-Backed Securities - Non-Agency (continued) |
| Issuer | Coupon
Rate | | Principal
Amount ($) | Value ($) |
| CMO Series 2018-C01 Class 1M2 |
1-month USD LIBOR + 2.250%
Floor 2.250%
07/25/2030 | 4.395% | | 4,400,000 | 4,441,621 |
| CMO Series 2018-C02 Class 2M2 |
1-month USD LIBOR + 2.200%
Floor 2.200%
08/25/2030 | 4.345% | | 4,945,000 | 4,979,857 |
| CMO Series 2018-C05 Class 1M2 |
1-month USD LIBOR + 2.350%
Floor 2.350%
01/25/2031 | 4.495% | | 4,092,949 | 4,142,338 |
| CMO Series 2018-C06 Class 1M2 |
1-month USD LIBOR + 2.000%
Floor 2.000%
03/25/2031 | 4.145% | | 4,000,000 | 4,008,763 |
| CMO Series 2018-C06 Class 2M2 |
1-month USD LIBOR + 2.100%
Floor 2.100%
03/25/2031 | 4.245% | | 5,900,000 | 5,909,200 |
| Subordinated, CMO Series 2018-C03 Class 1M2 |
1-month USD LIBOR + 2.150%
Floor 2.150%
10/25/2030 | 4.295% | | 6,500,000 | 6,531,085 |
| Federal Home Loan Mortgage Corp. Structured Agency Credit Risk Debt Notes(b) |
| CMO Series 2014-DN3 Class M3 |
1-month USD LIBOR + 4.000%
08/25/2024 | 6.145% | | 4,556,364 | 4,783,674 |
| CMO Series 2016-DNA1 Class M3 |
1-month USD LIBOR + 5.550%
07/25/2028 | 7.695% | | 5,200,000 | 5,731,393 |
| CMO Series 2017-DNA2 Class M2 |
1-month USD LIBOR + 3.450%
10/25/2029 | 5.595% | | 1,500,000 | 1,574,981 |
| CMO Series 2017-DNA3 Class M2 |
1-month USD LIBOR + 2.500%
03/25/2030 | 4.645% | | 3,000,000 | 3,036,314 |
| CMO Series 2017-HQA2 Class M2 |
1-month USD LIBOR + 2.650%
12/25/2029 | 4.795% | | 1,250,000 | 1,272,067 |
| CMO Series 2017-HQA3 Class M2 |
1-month USD LIBOR + 2.350%
04/25/2030 | 4.495% | | 1,000,000 | 1,005,691 |
| CMO Series 2018-HQA1 Class M2 |
1-month USD LIBOR + 2.300%
09/25/2030 | 4.445% | | 2,000,000 | 2,014,352 |
| Series 2016-HQA2 Class M3 |
1-month USD LIBOR + 5.150%
11/25/2028 | 7.295% | | 2,300,000 | 2,509,034 |
| Residential Mortgage-Backed Securities - Non-Agency (continued) |
| Issuer | Coupon
Rate | | Principal
Amount ($) | Value ($) |
| Federal Home Loan Mortgage Corp. Structured Agency Credit Risk Trust(a),(b) |
| CMO Series 2019-DNA1 Class M2 |
1-month USD LIBOR + 2.650%
01/25/2049 | 4.795% | | 1,000,000 | 1,010,425 |
| CMO Series 2019-HQA2 Class M2 |
1-month USD LIBOR + 2.050%
Floor 2.050%
04/25/2049 | 4.195% | | 1,500,000 | 1,499,996 |
| First Franklin Mortgage Loan Trust(b) |
| CMO Series 2006-FF18 Class A2D |
1-month USD LIBOR + 0.210%
Floor 0.210%
12/25/2037 | 2.355% | | 2,084,888 | 1,960,079 |
| CMO Series 2007-FF2 Class A2B |
1-month USD LIBOR + 0.100%
Floor 0.100%
03/25/2037 | 2.245% | | 4,435,869 | 2,879,393 |
| First Horizon Mortgage Pass-Through Trust(f) |
| CMO Series 2007-AR1 Class 1A1 |
| 05/25/2037 | 4.805% | | 437,830 | 341,046 |
| Freddie Mac Structured Agency Credit Risk Debt Notes(b) |
1-month USD LIBOR + 3.900%
12/25/2027 | 6.045% | | 3,000,000 | 3,098,724 |
| CMO Series 2014-DN2 Class M2 |
1-month USD LIBOR + 1.650%
04/25/2024 | 3.795% | | 941,111 | 944,392 |
| Galton Funding Mortgage Trust(a),(f) |
| CMO Series 2019-1 Class A21 |
| 02/25/2059 | 4.500% | | 2,242,509 | 2,321,031 |
| CMO Series 2019-1 Class B1 |
| 02/25/2059 | 4.250% | | 1,689,109 | 1,827,608 |
| CMO Series 2019-1 Class B2 |
| 02/25/2059 | 4.500% | | 946,398 | 1,025,857 |
| GS Mortgage-Backed Securities Corp.(a),(f) |
| CMO Series 2019-PJ1 Class A1 |
| 08/25/2049 | 4.000% | | 1,152,561 | 1,184,307 |
| GSAMP Trust(b) |
| CMO Series 2004-OPT Class M1 |
1-month USD LIBOR + 0.870%
Floor 0.870%
11/25/2034 | 3.015% | | 1,946,903 | 1,943,461 |
| GSR Mortgage Loan Trust(f) |
| CMO Series 2006-AR2 Class 2A1 |
| 04/25/2036 | 4.153% | | 1,574,180 | 1,399,136 |
| HarborView Mortgage Loan Trust(b) |
| CMO Series 2006-10 Class 1A1A |
1-month USD LIBOR + 0.200%
Floor 0.200%
11/19/2036 | 2.382% | | 8,807,323 | 8,114,705 |
The accompanying Notes to Financial Statements are an integral part of this statement.
| 62 | Multi-Manager Total Return Bond Strategies Fund | Annual Report 2019 |
Portfolio of Investments (continued)
August 31, 2019
| Residential Mortgage-Backed Securities - Non-Agency (continued) |
| Issuer | Coupon
Rate | | Principal
Amount ($) | Value ($) |
| Homeward Opportunities Fund Trust(a),(f) |
| CMO Series 2019-2 Class A3 |
| 09/25/2059 | 3.007% | | 1,000,000 | 1,001,890 |
| HSI Asset Securitization Corp. Trust(b) |
| CMO Series 2006-OPT1 Class M1 |
1-month USD LIBOR + 0.360%
Floor 0.360%
12/25/2035 | 2.505% | | 5,920,000 | 5,897,815 |
| JPMorgan Alternative Loan Trust(b) |
| CMO Series 2007-S1 Class A1 |
1-month USD LIBOR + 0.280%
Floor 0.280%, Cap 11.500%
04/25/2047 | 2.425% | | 6,284,713 | 6,009,451 |
| JPMorgan Mortgage Trust |
| CMO Series 2006-S2 Class 2A2 |
| 06/25/2021 | 5.875% | | 324,605 | 304,548 |
| CMO Series 2007-S1 Class 1A2 |
| 03/25/2022 | 5.500% | | 122,648 | 119,571 |
| JPMorgan Mortgage Trust(a),(f) |
| CMO Series 2017-3 Class 1A13 |
| 08/25/2047 | 3.500% | | 4,239,434 | 4,292,574 |
| CMO Series 2017-4 Class A7 |
| 11/25/2048 | 3.500% | | 500,000 | 522,733 |
| CMO Series 2019-1 Class A3 |
| 05/25/2049 | 4.000% | | 5,164,089 | 5,302,183 |
| CMO Series 2019-2 Class A3 |
| 08/25/2049 | 4.000% | | 2,425,746 | 2,484,080 |
| CMO Series 2019-3 Class A3 |
| 09/25/2049 | 4.000% | | 803,174 | 823,130 |
| CMO Series 2019-5 Class A3 |
| 11/25/2049 | 4.000% | | 4,599,428 | 4,744,778 |
| CMO Series 2019-LTV1 Class A3 |
| 06/25/2049 | 4.000% | | 2,881,156 | 2,975,280 |
| CMO Series 2019-LTV2 Class A18 |
| 12/25/2049 | 4.000% | | 978,708 | 1,003,140 |
| Subordinated, CMO Series 2017-3 Class B1 |
| 08/25/2047 | 3.867% | | 1,427,083 | 1,536,179 |
| Subordinated, CMO Series 2017-6 Class B2 |
| 12/25/2048 | 3.838% | | 580,199 | 615,947 |
| Subordinated, CMO Series 2018-8 Class B1 |
| 01/25/2049 | 4.224% | | 1,178,089 | 1,298,123 |
| Subordinated, CMO Series 2018-8 Class B2 |
| 01/25/2049 | 4.224% | | 981,741 | 1,048,353 |
| Subordinated, CMO Series 2019-2 Class B2 |
| 08/25/2049 | 4.673% | | 2,282,785 | 2,500,779 |
| Subordinated, CMO Series 2019-LTV1 Class B1 |
| 06/25/2049 | 4.908% | | 2,440,724 | 2,808,864 |
| Residential Mortgage-Backed Securities - Non-Agency (continued) |
| Issuer | Coupon
Rate | | Principal
Amount ($) | Value ($) |
| Subordinated, CMO Series 2019-LTV1 Class B2 |
| 06/25/2049 | 4.908% | | 2,094,104 | 2,375,605 |
| Subordinated, CMO Series 2019-LTV2 Class B2 |
| 12/25/2049 | 4.842% | | 998,572 | 1,128,281 |
| Subordinated, CMO Series 2019-LTV2 Class B3 |
| 12/25/2049 | 4.842% | | 998,572 | 1,111,252 |
| JPMorgan Mortgage Trust(a),(b) |
| CMO Series 2018-7FRB Class A1 |
1-month USD LIBOR + 0.750%
04/25/2046 | 3.016% | | 2,021,117 | 2,029,391 |
| JPMorgan Resecuritization Trust(a) |
| CMO Series 2014-5 Class 6A |
| 09/27/2036 | 4.000% | | 232,631 | 233,995 |
| Legacy Mortgage Asset Trust(a) |
| CMO Series 2017-GS1 Class A1 |
| 01/25/2057 | 3.500% | | 3,888,725 | 3,891,841 |
| CMO Series 2019-GS1 Class A1 |
| 01/25/2059 | 4.000% | | 2,284,413 | 2,310,455 |
| CMO Series 2019-GS3 Class A1 |
| 04/25/2059 | 3.750% | | 964,825 | 982,416 |
| Legacy Mortgage Asset Trust(a),(f) |
| CMO Series 2019-GS2 Class A1 |
| 01/25/2059 | 3.750% | | 1,965,162 | 1,984,602 |
| CMO Series 2019-GS4 Class A1 |
| 05/25/2059 | 3.438% | | 3,024,487 | 3,046,110 |
| CMO Series 2019-SL1 Class A |
| 12/28/2054 | 4.000% | | 1,291,710 | 1,294,776 |
| Lehman XS Trust(b) |
| CMO Series 2005-4 Class 1A3 |
1-month USD LIBOR + 0.800%
Floor 0.800%
10/25/2035 | 3.066% | | 963,908 | 959,253 |
| CMO Series 2005-5N Class 3A1A |
1-month USD LIBOR + 0.300%
Floor 0.300%
11/25/2035 | 2.445% | | 2,466,941 | 2,452,757 |
| CMO Series 2006-2N Class 1A1 |
1-month USD LIBOR + 0.260%
Floor 0.260%
02/25/2046 | 2.665% | | 2,152,663 | 1,982,140 |
| Long Beach Mortgage Loan Trust(b) |
| CMO Series 2005-1 Class M3 |
1-month USD LIBOR + 0.870%
Floor 0.870%
02/25/2035 | 3.015% | | 3,671,081 | 3,691,556 |
| LSTAR Securities Investment Trust(a),(b) |
| CMO Series 2019-2 Class A1 |
1-month USD LIBOR + 1.500%
04/01/2024 | 3.902% | | 1,494,015 | 1,493,405 |
The accompanying Notes to Financial Statements are an integral part of this statement.
Multi-Manager Total Return Bond Strategies Fund | Annual Report 2019
| 63 |
Portfolio of Investments (continued)
August 31, 2019
| Residential Mortgage-Backed Securities - Non-Agency (continued) |
| Issuer | Coupon
Rate | | Principal
Amount ($) | Value ($) |
| MASTR Alternative Loan Trust |
| CMO Series 2004-12 Class 4A1 |
| 12/25/2034 | 5.500% | | 805,047 | 872,373 |
| Merrill Lynch First Franklin Mortgage Loan Trust(b) |
| CMO Series 2007-1 Class A2D |
1-month USD LIBOR + 0.340%
Floor 0.340%
04/25/2037 | 2.485% | | 21,697,165 | 12,626,665 |
| Mill City Mortgage Loan Trust(a) |
| CMO Series 2016-1 Class A1 |
| 04/25/2057 | 2.500% | | 841,537 | 840,210 |
| Morgan Stanley Resecuritization Trust(a),(f) |
| CMO Series 2015-R4 Class 4B1 |
| 08/26/2047 | 4.026% | | 6,245,945 | 6,311,480 |
| MortgageIT Trust(b) |
| CMO Series 2005-5 Class A1 |
1-month USD LIBOR + 0.260%
Floor 0.260%, Cap 11.500%
12/25/2035 | 2.665% | | 1,503,328 | 1,487,290 |
| Nationstar Home Equity Loan Trust(b) |
| CMO Series 2007-B Class 2AV3 |
1-month USD LIBOR + 0.250%
Floor 0.250%
04/25/2037 | 2.395% | | 3,475,034 | 3,470,023 |
| New Residential Mortgage Loan Trust(a),(b) |
| CMO Series 2018-4A Class A1S |
1-month USD LIBOR + 0.750%
Floor 0.750%
01/25/2048 | 2.895% | | 3,225,441 | 3,216,964 |
| New Residential Mortgage Loan Trust(a),(f) |
| CMO Series 2019-NQM2 Class A2 |
| 04/25/2049 | 3.701% | | 2,896,327 | 2,988,570 |
| CMO Series 2019-NQM3 Class A3 |
| 07/25/2049 | 3.086% | | 1,940,272 | 1,956,556 |
| Nomura Resecuritization Trust(a),(b) |
| CMO Series 2014-6R Class 3A1 |
1-month USD LIBOR + 0.260%
Floor 0.260%, Cap 11.500%
01/26/2036 | 2.786% | | 158,189 | 157,864 |
| Oaktown Re II Ltd.(a),(b) |
| CMO Series 2018-1A Class M1 |
1-month USD LIBOR + 1.550%
07/25/2028 | 3.695% | | 1,080,907 | 1,083,093 |
| Oaktown Re III Ltd.(a),(b) |
| CMO Series 2019-1A Class M1A |
1-month USD LIBOR + 1.400%
Floor 1.400%
07/25/2029 | 3.666% | | 1,840,000 | 1,839,997 |
| OBX Trust(a),(f) |
| CMO Series 2019-EXP1 Class 1A3 |
| 01/25/2059 | 4.000% | | 1,208,353 | 1,235,928 |
| Residential Mortgage-Backed Securities - Non-Agency (continued) |
| Issuer | Coupon
Rate | | Principal
Amount ($) | Value ($) |
| CMO Series 2019-INV2 Class A25 |
| 05/27/2049 | 4.000% | | 941,186 | 971,146 |
| PSMC Trust(a),(f) |
| CMO Series 2019-1 Class A1 |
| 07/25/2049 | 4.000% | | 4,129,403 | 4,257,368 |
| RALI Trust(f) |
| CMO Series 2005-QA4 Class A41 |
| 04/25/2035 | 4.509% | | 444,114 | 413,688 |
| RALI Trust(f),(g) |
| CMO Series 2006-QS18 Class 1AV |
| 12/25/2036 | 0.437% | | 42,183,778 | 587,861 |
| CMO Series 2006-QS9 Class 1AV |
| 07/25/2036 | 0.583% | | 21,252,885 | 572,621 |
| CMO Series 2007-QS1 Class 2AV |
| 01/25/2037 | 0.177% | | 42,807,704 | 317,603 |
| Residential Asset Mortgage Products Trust(b) |
| CMO Series 2006-RZ3 Class A3 |
1-month USD LIBOR + 0.290%
Floor 0.290%, Cap 14.000%
08/25/2036 | 2.435% | | 1,307,483 | 1,307,023 |
| RFMSI Trust(f) |
| CMO Series 2005-SA5 Class 1A |
| 11/25/2035 | 4.126% | | 1,441,762 | 1,160,060 |
| CMO Series 2006-SA4 Class 2A1 |
| 11/25/2036 | 5.354% | | 449,108 | 431,073 |
| Seasoned Credit Risk Transfer Trust |
| CMO Series 2017-4 Class M45T |
| 06/25/2057 | 4.500% | | 935,473 | 997,337 |
| Securitized Asset-Backed Receivables LLC Trust(b) |
| Subordinated, CMO Series 2006-OP1 Class M2 |
1-month USD LIBOR + 0.390%
Floor 0.390%
10/25/2035 | 2.730% | | 6,167,750 | 6,147,156 |
| Sequoia Mortgage Trust(a),(f) |
| CMO Series 2019-1 Class A1 |
| 02/25/2049 | 4.000% | | 1,888,445 | 1,955,916 |
| CMO Series 2019-3 Class A2 |
| 09/25/2049 | 3.500% | | 2,000,000 | 2,032,340 |
| CMO Series 2019-CH1 Class A1 |
| 03/25/2049 | 4.500% | | 2,963,201 | 3,070,965 |
| CMO Series 2019-CH1 Class B1B |
| 03/25/2049 | 5.084% | | 2,975,775 | 3,426,947 |
| CMO Series 2019-CH2 Class A1 |
| 08/25/2049 | 4.500% | | 1,936,115 | 1,997,140 |
| Subordinated, CMO Series 2015-1 Class B1 |
| 01/25/2045 | 3.879% | | 887,504 | 930,333 |
| Subordinated, CMO Series 2018-6 Class B1 |
| 07/25/2048 | 4.208% | | 1,218,926 | 1,301,783 |
The accompanying Notes to Financial Statements are an integral part of this statement.
| 64 | Multi-Manager Total Return Bond Strategies Fund | Annual Report 2019 |
Portfolio of Investments (continued)
August 31, 2019
| Residential Mortgage-Backed Securities - Non-Agency (continued) |
| Issuer | Coupon
Rate | | Principal
Amount ($) | Value ($) |
| Subordinated, CMO Series 2019-2 Class B2 |
| 06/25/2049 | 4.273% | | 1,987,750 | 2,122,306 |
| Sequoia Mortgage Trust(f) |
| Subordinated, CMO Series 2013-3 Class B3 |
| 03/25/2043 | 3.518% | | 1,389,434 | 1,419,533 |
| Starwood Mortgage Residential Trust(a),(f) |
| CMO Series 2019-1 Class A3 |
| 06/25/2049 | 3.299% | | 1,506,656 | 1,514,048 |
| Structured Adjustable Rate Mortgage Loan Trust(f) |
| CMO Series 2004-20 Class 1A2 |
| 01/25/2035 | 4.117% | | 838,248 | 836,220 |
| CMO Series 2006-5 Class 1A1 |
| 06/25/2036 | 4.523% | | 1,611,803 | 1,564,600 |
| Structured Asset Securities Corp. Mortgage Loan Trust(a),(b) |
| CMO Series 2006-GEL4 Class A3 |
1-month USD LIBOR + 0.300%
Floor 0.300%
10/25/2036 | 2.445% | | 1,639,411 | 1,638,583 |
| Towd Point Mortgage Trust(a) |
| CMO Series 2017-1 Class A1 |
| 10/25/2056 | 2.750% | | 3,495,881 | 3,512,681 |
| Towd Point Mortgage Trust(a),(f) |
| CMO Series 2017-6 Class A1 |
| 10/25/2057 | 2.750% | | 4,625,095 | 4,647,246 |
| CMO Series 2017-6 Class A2 |
| 10/25/2057 | 3.000% | | 2,500,000 | 2,556,585 |
| Vericrest Opportunity Loan Transferee LXII LLC(a) |
| CMO Series 2017-NPL9 Class A1 |
| 09/25/2047 | 3.125% | | 1,076,087 | 1,075,043 |
| Verus Securitization Trust(a),(f) |
| CMO Series 2019-1 Class A2 |
| 02/25/2059 | 3.938% | | 2,970,774 | 3,013,594 |
| WaMu Asset-Backed Certificates Trust(b) |
| CMO Series 2007-HE1 Class 2A3 |
1-month USD LIBOR + 0.150%
Floor 0.150%
01/25/2037 | 2.295% | | 4,504,557 | 2,755,365 |
| WaMu Mortgage Pass-Through Certificates Trust(f) |
| CMO Series 2003-AR8 Class A |
| 08/25/2033 | 4.401% | | 526,058 | 541,978 |
| CMO Series 2004-AR4 Class A6 |
| 06/25/2034 | 4.520% | | 4,399,126 | 4,458,647 |
| CMO Series 2004-AR7 Class A6 |
| 07/25/2034 | 4.572% | | 1,901,079 | 1,950,580 |
| CMO Series 2007-HY1 Class 3A3 |
| 02/25/2037 | 3.928% | | 4,543,475 | 4,319,828 |
| CMO Series 2007-HY3 Class 1A1 |
| 03/25/2037 | 3.547% | | 681,776 | 639,439 |
| Residential Mortgage-Backed Securities - Non-Agency (continued) |
| Issuer | Coupon
Rate | | Principal
Amount ($) | Value ($) |
| WaMu Mortgage Pass-Through Certificates Trust(b) |
| CMO Series 2005-AR11 Class A1A |
1-month USD LIBOR + 0.320%
Floor 0.320%, Cap 10.500%
08/25/2045 | 2.785% | | 1,457,325 | 1,451,822 |
| CMO Series 2005-AR17 Class A1A1 |
1-month USD LIBOR + 0.270%
12/25/2045 | 2.685% | | 4,084,274 | 3,871,181 |
| CMO Series 2005-AR2 Class 2A1A |
1-month USD LIBOR + 0.310%
Floor 0.310%, Cap 10.500%
01/25/2045 | 2.765% | | 1,613,781 | 1,603,238 |
| CMO Series 2005-AR8 Class 2A1A |
1-month USD LIBOR + 0.290%
Floor 0.290%, Cap 10.500%
07/25/2045 | 2.725% | | 1,266,622 | 1,256,901 |
| CMO Series 2005-AR9 Class A1A |
1-month USD LIBOR + 0.640%
Floor 0.640%, Cap 10.500%
07/25/2045 | 2.785% | | 1,108,936 | 1,097,208 |
| CMO Series 2006-AR4 Class 1A1A |
1-year MTA + 0.940%
Floor 0.940%
05/25/2046 | 3.387% | | 2,331,108 | 2,380,314 |
| CMO Series 2006-AR5 Class A12A |
1-year MTA + 0.980%
Floor 0.980%
06/25/2046 | 3.427% | | 716,591 | 713,285 |
| CMO Series 2007-OC2 Class A3 |
1-month USD LIBOR + 0.310%
Floor 0.310%
06/25/2037 | 2.455% | | 3,053,689 | 2,897,924 |
| Wells Fargo Mortgage Backed Securities Trust(a),(f) |
| CMO Series 2019-1 Class A1 |
| 11/25/2048 | 4.000% | | 2,140,985 | 2,188,815 |
| CMO Series 2019-2 Class A1 |
| 04/25/2049 | 4.000% | | 1,305,732 | 1,330,113 |
Total Residential Mortgage-Backed Securities - Non-Agency
(Cost $418,904,481) | 430,771,625 |
|
| Senior Loans 0.2% |
| Borrower | Coupon
Rate | | Principal
Amount ($) | Value ($) |
| Aerospace & Defense 0.0% |
| TransDigm, Inc.(b),(p) |
| Tranche E Term Loan |
3-month USD LIBOR + 2.500%
05/30/2025 | 4.830% | | 497,481 | 492,079 |
The accompanying Notes to Financial Statements are an integral part of this statement.
Multi-Manager Total Return Bond Strategies Fund | Annual Report 2019
| 65 |
Portfolio of Investments (continued)
August 31, 2019
| Senior Loans (continued) |
| Borrower | Coupon
Rate | | Principal
Amount ($) | Value ($) |
| Automotive 0.0% |
| Panther BF Aggregator 2 LP(b),(p) |
| 1st Lien Term Loan |
3-month USD LIBOR + 3.500%
04/30/2026 | 5.612% | | 500,000 | 492,500 |
| Cable and Satellite 0.1% |
| CSC Holdings LLC(b),(p) |
| Term Loan |
3-month USD LIBOR + 2.250%
01/15/2026 | 4.445% | | 1,393,000 | 1,384,879 |
| Telenet Financing LLC(b),(p) |
| Term Loan |
3-month USD LIBOR + 2.250%
08/15/2026 | 4.445% | | 750,000 | 747,562 |
| Total | 2,132,441 |
| Electric 0.0% |
| Vistra Operations Co. LLC(b),(p) |
| Term Loan |
3-month USD LIBOR + 2.000%
08/04/2023 | 4.112% | | 473,803 | 474,068 |
| Environmental 0.0% |
| Clean Harbors, Inc.(b),(p) |
| Term Loan |
3-month USD LIBOR + 1.750%
06/28/2024 | 3.862% | | 395,960 | 396,752 |
| Finance Companies 0.0% |
| Avolon Borrower 1 LLC(b),(p) |
| Tranche B3 Term Loan |
3-month USD LIBOR + 1.750%
Floor 0.750%
01/15/2025 | 3.922% | | 317,025 | 317,488 |
| Delos Finance SARL(b),(p) |
| Term Loan |
3-month USD LIBOR + 1.750%
10/06/2023 | 4.080% | | 416,667 | 417,112 |
| Total | 734,600 |
| Gaming 0.0% |
| Caesars Entertainment Operating Co., LLC(b),(p) |
| Tranche B Term Loan |
3-month USD LIBOR + 2.000%
10/07/2024 | 4.112% | | 415,779 | 414,935 |
| Churchill Downs, Inc.(b),(e),(p) |
| Tranche B Term Loan |
3-month USD LIBOR + 2.000%
12/27/2024 | 4.120% | | 395,980 | 395,980 |
| Senior Loans (continued) |
| Borrower | Coupon
Rate | | Principal
Amount ($) | Value ($) |
| MGM Growth Properties Operating Partnership LP(b),(p) |
| Tranche B Term Loan |
3-month USD LIBOR + 2.000%
Floor 0.750%
03/21/2025 | 4.112% | | 248,714 | 248,637 |
| Total | 1,059,552 |
| Health Care 0.1% |
| Gentiva Health Services, Inc.(b),(p) |
| 1st Lien Term Loan |
3-month USD LIBOR + 3.750%
07/02/2025 | 5.875% | | 248,125 | 247,971 |
| IQVIA, Inc./Quintiles IMS(b),(p) |
| Tranche B2 Term Loan |
3-month USD LIBOR + 2.000%
01/17/2025 | 4.330% | | 593,954 | 594,572 |
| MPH Acquisition Holdings LLC(b),(p) |
| Term Loan |
3-month USD LIBOR + 2.750%
Floor 1.000%
06/07/2023 | 5.080% | | 1,960,553 | 1,820,864 |
| Total | 2,663,407 |
| Integrated Energy 0.0% |
| PowerTeam Services, LLC(b),(p) |
| 1st Lien Term Loan |
3-month USD LIBOR + 3.250%
Floor 1.000%
03/06/2025 | 5.580% | | 1,458,435 | 1,312,591 |
| Oil Field Services 0.0% |
| EMG Utica LLC(b),(p) |
| Term Loan |
3-month USD LIBOR + 3.750%
Floor 1.000%
03/27/2020 | 6.080% | | 758,374 | 753,634 |
| Packaging 0.0% |
| Berry Global, Inc.(b),(p) |
| Tranche U Term Loan |
3-month USD LIBOR + 2.500%
07/01/2026 | 4.701% | | 750,000 | 749,588 |
| Reynolds Group Holdings, Inc.(b),(p) |
| Term Loan |
3-month USD LIBOR + 2.750%
Floor 1.000%
02/05/2023 | 4.862% | | 568,949 | 568,340 |
| Total | 1,317,928 |
The accompanying Notes to Financial Statements are an integral part of this statement.
| 66 | Multi-Manager Total Return Bond Strategies Fund | Annual Report 2019 |
Portfolio of Investments (continued)
August 31, 2019
| Senior Loans (continued) |
| Borrower | Coupon
Rate | | Principal
Amount ($) | Value ($) |
| Pharmaceuticals 0.0% |
| Bausch Health Companies, Inc.(b),(p) |
| Term Loan |
3-month USD LIBOR + 3.000%
06/02/2025 | 5.201% | | 1,406,084 | 1,407,673 |
| Restaurants 0.0% |
| New Red Finance, Inc./Burger King/Tim Hortons(b),(p) |
| Tranche B3 Term Loan |
3-month USD LIBOR + 2.250%
Floor 1.000%
02/16/2024 | 4.362% | | 614,338 | 613,134 |
| Technology 0.0% |
| CommScope, Inc.(b),(p) |
| Term Loan |
3-month USD LIBOR + 3.250%
04/06/2026 | 5.362% | | 750,000 | 745,627 |
| SS&C Technologies Holdings, Inc.(b),(p) |
| Tranche B3 Term Loan |
3-month USD LIBOR + 2.250%
04/16/2025 | 4.362% | | 171,053 | 171,224 |
| Tranche B4 Term Loan |
3-month USD LIBOR + 2.250%
04/16/2025 | 4.362% | | 117,197 | 117,315 |
| Total | 1,034,166 |
| Wireless 0.0% |
| SBA Senior Finance II LLC(b),(p) |
| Term Loan |
3-month USD LIBOR + 2.000%
04/11/2025 | 4.120% | | 737,550 | 732,867 |
| Sprint Communications, Inc.(b),(p) |
| Term Loan |
3-month USD LIBOR + 2.500%
Floor 0.750%
02/02/2024 | 4.625% | | 470,190 | 466,809 |
| Total | 1,199,676 |
Total Senior Loans
(Cost $16,300,550) | 16,084,201 |
|
| Treasury Bills 1.3% |
| Issuer | Effective
Yield | | Principal
Amount ($) | Value ($) |
| United States 1.3% |
| U.S. Treasury |
| 06/30/2021 | 1.560% | | 21,720,000 | 21,746,302 |
| U.S. Treasury(c) |
| 08/31/2021 | 1.510% | | 74,115,000 | 74,103,965 |
| Treasury Bills (continued) |
| Issuer | Effective
Yield | | Principal
Amount ($) | Value ($) |
| U.S. Treasury Bills |
| 09/12/2019 | 1.940% | | 4,855,000 | 4,851,647 |
| 11/07/2019 | 1.860% | | 5,435,000 | 5,415,942 |
| U.S. Treasury Bills(q) |
| 09/26/2019 | 2.030% | | 3,210,000 | 3,205,192 |
| Total | 109,323,048 |
Total Treasury Bills
(Cost $109,169,144) | 109,323,048 |
|
| U.S. Government & Agency Obligations 0.3% |
| Issuer | Coupon
Rate | | Principal
Amount ($) | Value ($) |
| Federal Home Loan Mortgage Corp.(i),(q) |
| 12/11/2025 | 0.000% | | 6,135,000 | 5,433,052 |
| Federal National Mortgage Association(q) |
| 10/05/2022 | 2.000% | | 4,030,000 | 4,094,407 |
| Federal National Mortgage Association(i) |
| STRIPS |
| 05/15/2030 | 0.000% | | 1,000,000 | 807,875 |
| Residual Funding Corp.(i) |
| STRIPS |
| 01/15/2030 | 0.000% | | 7,351,000 | 6,008,149 |
| Resolution Funding Corp.(i) |
| STRIPS |
| 01/15/2029 | 0.000% | | 1,935,000 | 1,592,770 |
| 04/15/2029 | 0.000% | | 1,220,000 | 992,350 |
| 04/15/2030 | 0.000% | | 3,000,000 | 2,405,796 |
| Tennessee Valley Authority Principal STRIP(i) |
| 09/15/2024 | 0.000% | | 530,000 | 484,660 |
Total U.S. Government & Agency Obligations
(Cost $19,908,598) | 21,819,059 |
|
| U.S. Treasury Obligations 11.6% |
| | | | |
| U.S. Treasury |
| 01/31/2021 | 2.500% | | 2,385,000 | 2,412,297 |
| 05/31/2021 | 2.125% | | 21,885,000 | 22,089,317 |
| 07/31/2021 | 1.750% | | 65,680,000 | 65,951,956 |
| 02/15/2022 | 2.500% | | 1,585,000 | 1,624,006 |
| 08/15/2022 | 1.500% | | 28,166,000 | 28,221,012 |
| 05/31/2024 | 2.000% | | 6,745,000 | 6,929,434 |
| 06/30/2024 | 1.750% | | 63,455,000 | 64,471,272 |
| 06/30/2024 | 2.000% | | 16,840,000 | 17,299,153 |
| 07/31/2024 | 1.750% | | 206,121,000 | 209,550,983 |
| 07/31/2026 | 1.875% | | 81,315,000 | 83,538,457 |
| 05/15/2029 | 2.375% | | 14,440,000 | 15,561,356 |
| 08/15/2029 | 1.625% | | 44,177,000 | 44,660,186 |
| 02/15/2039 | 3.500% | | 18,050,000 | 23,112,461 |
| 05/15/2039 | 4.250% | | 24,695,000 | 34,754,354 |
| 05/15/2045 | 3.000% | | 6,500,000 | 7,870,078 |
| 02/15/2049 | 3.000% | | 29,790,000 | 36,655,664 |
| 05/15/2049 | 2.875% | | 117,566,000 | 141,483,333 |
The accompanying Notes to Financial Statements are an integral part of this statement.
Multi-Manager Total Return Bond Strategies Fund | Annual Report 2019
| 67 |
Portfolio of Investments (continued)
August 31, 2019
| U.S. Treasury Obligations (continued) |
| Issuer | Coupon
Rate | | Principal
Amount ($) | Value ($) |
| 08/15/2049 | 2.250% | | 62,850,000 | 66,768,305 |
| U.S. Treasury(q) |
| 08/15/2021 | 2.125% | | 10,800,000 | 10,919,812 |
| 08/15/2043 | 3.625% | | 4,750,000 | 6,292,266 |
| 11/15/2043 | 3.750% | | 2,535,000 | 3,425,419 |
| U.S. Treasury(c) |
| 08/31/2024 | 1.250% | | 58,305,000 | 57,915,124 |
| U.S. Treasury(i) |
| STRIPS |
| 05/15/2043 | 0.000% | | 18,157,000 | 11,364,438 |
| U.S. Treasury(i),(q) |
| STRIPS |
| 11/15/2043 | 0.000% | | 7,025,000 | 4,349,188 |
| 02/15/2045 | 0.000% | | 19,275,000 | 11,588,341 |
Total U.S. Treasury Obligations
(Cost $936,823,254) | 978,808,212 |
| Money Market Funds 4.2% |
| | Shares | Value ($) |
| Columbia Short-Term Cash Fund, 2.208%(r),(s) | 352,403,791 | 352,368,551 |
Total Money Market Funds
(Cost $352,368,551) | 352,368,551 |
Total Investments in Securities
(Cost: $8,417,157,663) | 8,718,849,880 |
| Other Assets & Liabilities, Net | | (308,804,235) |
| Net Assets | 8,410,045,645 |
At August 31, 2019, securities and/or cash totaling $48,712,341 were pledged as collateral.
Investments in derivatives
| Long futures contracts |
| Description | Number of
contracts | Expiration
date | Trading
currency | Notional
amount | Value/Unrealized
appreciation ($) | Value/Unrealized
depreciation ($) |
| U.S. Long Bond | 319 | 12/2019 | USD | 52,714,750 | 297,677 | — |
| U.S. Long Bond | 376 | 12/2019 | USD | 62,134,000 | — | (137,754) |
| U.S. Treasury 10-Year Note | 1,152 | 12/2019 | USD | 151,740,000 | 458,468 | — |
| U.S. Treasury 2-Year Note | 769 | 12/2019 | USD | 166,194,118 | 68,842 | — |
| U.S. Treasury 5-Year Note | 7,935 | 12/2019 | USD | 952,014,027 | 1,712,740 | — |
| U.S. Treasury 5-Year Note | 1,409 | 12/2019 | USD | 169,046,977 | 774,013 | — |
| U.S. Treasury 5-Year Note | 486 | 12/2019 | USD | 58,308,610 | 90,230 | — |
| U.S. Ultra Bond 10-Year Note | 82 | 12/2019 | USD | 11,843,875 | 74,174 | — |
| U.S. Ultra Bond 10-Year Note | 263 | 12/2019 | USD | 37,987,063 | 26,878 | — |
| U.S. Ultra Treasury Bond | 1,023 | 12/2019 | USD | 201,978,563 | 2,391,213 | — |
| U.S. Ultra Treasury Bond | 110 | 12/2019 | USD | 21,718,125 | 498,079 | — |
| U.S. Ultra Treasury Bond | 339 | 12/2019 | USD | 66,931,313 | — | (148,920) |
| Total | | | | | 6,392,314 | (286,674) |
| Short futures contracts |
| Description | Number of
contracts | Expiration
date | Trading
currency | Notional
amount | Value/Unrealized
appreciation ($) | Value/Unrealized
depreciation ($) |
| U.S. Treasury 10-Year Note | (246) | 12/2019 | USD | (32,402,813) | 18,722 | — |
| U.S. Treasury 10-Year Note | (381) | 12/2019 | USD | (50,184,844) | — | (88,335) |
| U.S. Treasury 2-Year Note | (495) | 12/2019 | USD | (106,978,008) | — | (58,933) |
| U.S. Treasury 2-Year Note | (1,684) | 12/2019 | USD | (363,941,345) | — | (157,276) |
| U.S. Treasury 5-Year Note | (588) | 12/2019 | USD | (70,546,219) | — | (102,174) |
| U.S. Ultra Bond 10-Year Note | (511) | 12/2019 | USD | (73,807,563) | 94,780 | — |
| U.S. Ultra Bond 10-Year Note | (886) | 12/2019 | USD | (127,971,625) | — | (261,634) |
| Total | | | | | 113,502 | (668,352) |
The accompanying Notes to Financial Statements are an integral part of this statement.
| 68 | Multi-Manager Total Return Bond Strategies Fund | Annual Report 2019 |
Portfolio of Investments (continued)
August 31, 2019
| Cleared interest rate swap contracts |
| Fund receives | Fund pays | Payment
frequency | Counterparty | Maturity
date | Notional
currency | Notional
amount | Value
($) | Upfront
payments
($) | Upfront
receipts
($) | Unrealized
appreciation
($) | Unrealized
depreciation
($) |
| Fixed rate of 2.405% | 1-Day Overnight Fed Funds Effective Rate | Receives Annually, Pays Annually | JPMorgan | 03/12/2020 | USD | 52,900,000 | 210,794 | — | — | 210,794 | — |
| Fixed rate of 2.328% | 1-Day Overnight Fed Funds Effective Rate | Receives Annually, Pays Annually | JPMorgan | 04/25/2020 | USD | 126,280,000 | 575,472 | — | — | 575,472 | — |
| Fixed rate of 2.173% | 1-Day Overnight Fed Funds Effective Rate | Receives Annually, Pays Annually | JPMorgan | 03/31/2021 | USD | 31,454,000 | 418,008 | — | — | 418,008 | — |
| Fixed rate of 1.830% | 3-Month USD LIBOR | Receives Semi-annually, Pays Quarterly | JPMorgan | 06/15/2021 | USD | 348,785,000 | 1,862,824 | — | — | 1,862,824 | — |
| 3-Month USD LIBOR | Fixed rate of 1.898% | Receives Quarterly, Pays Semi-annually | JPMorgan | 07/18/2021 | USD | 56,010,000 | (341,901) | — | — | — | (341,901) |
| 1-Day Overnight Fed Funds Effective Rate | Fixed rate of 2.353% | Receives Annually, Pays Annually | JPMorgan | 05/31/2022 | USD | 38,295,000 | (1,271,556) | — | — | — | (1,271,556) |
| 1-Day Overnight Fed Funds Effective Rate | Fixed rate of 2.360% | Receives Annually, Pays Annually | JPMorgan | 09/27/2022 | USD | 148,540,000 | (5,673,979) | — | — | — | (5,673,979) |
| 3-Month USD LIBOR | Fixed rate of 2.167% | Receives Quarterly, Pays Semi-annually | JPMorgan | 02/15/2024 | USD | 42,560,000 | (1,384,678) | — | — | — | (1,384,678) |
| 3-Month USD LIBOR | Fixed rate of 1.956% | Receives Quarterly, Pays Semi-annually | JPMorgan | 05/15/2024 | USD | 69,165,000 | (2,467,602) | — | — | — | (2,467,602) |
| 3-Month USD LIBOR | Fixed rate of 2.176% | Receives Quarterly, Pays Semi-annually | JPMorgan | 08/15/2024 | USD | 41,140,000 | (1,815,796) | — | — | — | (1,815,796) |
| 3-Month USD LIBOR | Fixed rate of 2.170% | Receives Quarterly, Pays Semi-annually | JPMorgan | 08/15/2024 | USD | 140,200,000 | (6,067,319) | — | — | — | (6,067,319) |
| 3-Month USD LIBOR | Fixed rate of 2.334% | Receives Quarterly, Pays Semi-annually | JPMorgan | 11/15/2024 | USD | 165,925,000 | (9,927,401) | — | — | — | (9,927,401) |
| 3-Month USD LIBOR | Fixed rate of 3.019% | Receives Quarterly, Pays Semi-annually | JPMorgan | 02/28/2025 | USD | 22,215,000 | (2,009,286) | — | — | — | (2,009,286) |
| 1-Day Overnight Fed Funds Effective Rate | Fixed rate of 2.454% | Receives Annually, Pays Annually | JPMorgan | 02/28/2025 | USD | 41,250,000 | (3,175,877) | — | — | — | (3,175,877) |
| 3-Month USD LIBOR | Fixed rate of 2.998% | Receives Quarterly, Pays Semi-annually | JPMorgan | 05/31/2025 | USD | 67,233,000 | (6,737,642) | — | — | — | (6,737,642) |
| 3-Month USD LIBOR | Fixed rate of 3.105% | Receives Quarterly, Pays Semi-annually | JPMorgan | 07/31/2025 | USD | 5,975,000 | (616,189) | — | — | — | (616,189) |
| 3-Month USD LIBOR | Fixed rate of 3.109% | Receives Quarterly, Pays Semi-annually | JPMorgan | 07/31/2025 | USD | 54,830,000 | (5,634,277) | — | — | — | (5,634,277) |
| 1-Day Overnight Fed Funds Effective Rate | Fixed rate of 2.269% | Receives Annually, Pays Annually | JPMorgan | 01/31/2026 | USD | 38,890,000 | (2,836,388) | — | — | — | (2,836,388) |
| 1-Day Overnight Fed Funds Effective Rate | Fixed rate of 2.290% | Receives Annually, Pays Annually | JPMorgan | 03/12/2026 | USD | 7,935,000 | (617,895) | — | — | — | (617,895) |
| 3-Month USD LIBOR | Fixed rate of 1.876% | Receives Quarterly, Pays Semi-annually | JPMorgan | 04/30/2026 | USD | 26,802,000 | (853,533) | — | — | — | (853,533) |
| 1-Day Overnight Fed Funds Effective Rate | Fixed rate of 1.965% | Receives Annually, Pays Annually | JPMorgan | 02/15/2027 | USD | 8,075,000 | (504,050) | — | — | — | (504,050) |
| 1-Day Overnight Fed Funds Effective Rate | Fixed rate of 1.824% | Receives Annually, Pays Annually | JPMorgan | 02/15/2027 | USD | 14,238,000 | (858,265) | — | — | — | (858,265) |
| 1-Day Overnight Fed Funds Effective Rate | Fixed rate of 2.067% | Receives Annually, Pays Annually | JPMorgan | 02/15/2027 | USD | 15,490,000 | (1,083,329) | — | — | — | (1,083,329) |
The accompanying Notes to Financial Statements are an integral part of this statement.
Multi-Manager Total Return Bond Strategies Fund | Annual Report 2019
| 69 |
Portfolio of Investments (continued)
August 31, 2019
| Cleared interest rate swap contracts (continued) |
| Fund receives | Fund pays | Payment
frequency | Counterparty | Maturity
date | Notional
currency | Notional
amount | Value
($) | Upfront
payments
($) | Upfront
receipts
($) | Unrealized
appreciation
($) | Unrealized
depreciation
($) |
| 1-Day Overnight Fed Funds Effective Rate | Fixed rate of 1.823% | Receives Annually, Pays Annually | JPMorgan | 05/15/2027 | USD | 5,535,000 | (300,386) | — | — | — | (300,386) |
| 1-Day Overnight Fed Funds Effective Rate | Fixed rate of 2.579% | Receives Annually, Pays Annually | JPMorgan | 08/15/2028 | USD | 27,835,000 | (3,120,882) | — | — | — | (3,120,882) |
| 1-Day Overnight Fed Funds Effective Rate | Fixed rate of 1.369% | Receives Annually, Pays Annually | JPMorgan | 02/15/2042 | USD | 4,280,000 | (42,756) | — | — | — | (42,756) |
| 1-Day Overnight Fed Funds Effective Rate | Fixed rate of 1.380% | Receives Annually, Pays Annually | JPMorgan | 09/27/2046 | USD | 2,780,000 | (24,735) | — | — | — | (24,735) |
| Total | | | | | | | (54,298,624) | — | — | 3,067,098 | (57,365,722) |
| Cleared credit default swap contracts - buy protection |
Reference
entity | Counterparty | Maturity
date | Pay
fixed
rate
(%) | Payment
frequency | Notional
currency | Notional
amount | Value
($) | Upfront
payments
($) | Upfront
receipts
($) | Unrealized
appreciation
($) | Unrealized
depreciation
($) |
| Markit iTraxx Europe Crossover Index, Series 31 | Morgan Stanley | 06/20/2024 | 5.000 | Quarterly | EUR | 92,500,000 | (1,073,853) | — | — | — | (1,073,853) |
| Cleared credit default swap contracts - sell protection |
Reference
entity | Counterparty | Maturity
date | Receive
fixed
rate
(%) | Payment
frequency | Implied
credit
spread
(%)* | Notional
currency | Notional
amount | Value
($) | Upfront
payments
($) | Upfront
receipts
($) | Unrealized
appreciation
($) | Unrealized
depreciation
($) |
| Markit CDX North America High Yield Index, Series 32 | Morgan Stanley | 06/20/2024 | 5.000 | Quarterly | 3.396 | USD | 101,970,000 | (125,892) | — | — | — | (125,892) |
| * | Implied credit spreads, represented in absolute terms, utilized in determining the market value of credit default swap agreements on corporate or sovereign issues as of period end serve as an indicator of the current status of the payment/performance risk and represent the likelihood or risk of default for the credit derivative. The implied credit spread of a particular referenced entity reflects the cost of buying/selling protection and may include upfront payments required to be made to enter into the agreement. Wider credit spreads represent a deterioration of the referenced entity’s credit soundness and a greater likelihood or risk of default or other credit event occurring as defined under the terms of the agreement. |
| Reference index and values for swap contracts as of period end |
| Reference index | | Reference rate |
| 1-Day Overnight Fed Funds Effective Rate | Overnight Federal Funds Effective Rate | 2.120% |
| 3-Month USD LIBOR | London Interbank Offered Rate | 2.138% |
Notes to Portfolio of Investments
| (a) | Represents privately placed and other securities and instruments exempt from Securities and Exchange Commission registration (collectively, private placements), such as Section 4(a)(2) and Rule 144A eligible securities, which are often sold only to qualified institutional buyers. The Fund may invest in private placements determined to be liquid as well as those determined to be illiquid. Private placements may be determined to be liquid under guidelines established by the Fund’s Board of Trustees. At August 31, 2019, the total value of these securities amounted to $1,951,549,180, which represents 23.20% of total net assets. |
| (b) | Variable rate security. The interest rate shown was the current rate as of August 31, 2019. |
| (c) | Represents a security purchased on a when-issued basis. |
| (d) | Represents fair value as determined in good faith under procedures approved by the Board of Trustees. At August 31, 2019, the total value of these securities amounted to $11,542,489, which represents 0.14% of total net assets. |
| (e) | Valuation based on significant unobservable inputs. |
| (f) | Variable or floating rate security, the interest rate of which adjusts periodically based on changes in current interest rates and prepayments on the underlying pool of assets. The interest rate shown was the current rate as of August 31, 2019. |
| (g) | Represents interest only securities which have the right to receive the monthly interest payments on an underlying pool of mortgage loans. |
The accompanying Notes to Financial Statements are an integral part of this statement.
| 70 | Multi-Manager Total Return Bond Strategies Fund | Annual Report 2019 |
Portfolio of Investments (continued)
August 31, 2019
Notes to Portfolio of Investments (continued)
| (h) | Non-income producing investment. |
| (i) | Zero coupon bond. |
| (j) | Represents a variable rate security with a step coupon where the rate adjusts according to a schedule for a series of periods, typically lower for an initial period and then increasing to a higher coupon rate thereafter. The interest rate shown was the current rate as of August 31, 2019. |
| (k) | Represents securities that have defaulted on payment of interest. The Fund has stopped accruing interest on these securities. At August 31, 2019, the total value of these securities amounted to $1,041,617, which represents 0.01% of total net assets. |
| (l) | Principal and interest may not be guaranteed by the government. |
| (m) | Municipal obligations include debt obligations issued by or on behalf of territories, possessions, or sovereign nations within the territorial boundaries of the United States. At August 31, 2019, the total value of these securities amounted to $1,146,926, which represents 0.01% of total net assets. |
| (n) | Represents principal only securities which have the right to receive the principal portion only on an underlying pool of mortgage loans. |
| (o) | Represents a variable rate security where the coupon adjusts periodically through an auction process. |
| (p) | The stated interest rate represents the weighted average interest rate at August 31, 2019 of contracts within the senior loan facility. Interest rates on contracts are primarily determined either weekly, monthly or quarterly by reference to the indicated base lending rate and spread and the reset period. These base lending rates are primarily the London Interbank Offered Rate (“LIBOR”) and other short-term rates. Base lending rates may be subject to a floor or minimum rate. The interest rate for senior loans purchased on a when-issued or delayed delivery basis will be determined upon settlement, therefore no interest rate is disclosed. Senior loans often require prepayments from excess cash flows or permit the borrowers to repay at their election. The degree to which borrowers repay, cannot be predicted with accuracy. As a result, remaining maturities of senior loans may be less than the stated maturities. |
| (q) | This security or a portion of this security has been pledged as collateral in connection with derivative contracts. |
| (r) | The rate shown is the seven-day current annualized yield at August 31, 2019. |
| (s) | As defined in the Investment Company Act of 1940, an affiliated company is one in which the Fund owns 5% or more of the company’s outstanding voting securities, or a company which is under common ownership or control with the Fund. Holdings and transactions in these affiliated companies during the year ended August 31, 2019 are as follows: |
| Issuer | Beginning
shares | Shares
purchased | Shares
sold | Ending
shares | Realized gain
(loss) —
affiliated
issuers ($) | Net change in
unrealized
appreciation
(depreciation) —
affiliated
issuers ($) | Dividends —
affiliated
issuers ($) | Value —
affiliated
issuers
at end of
period ($) |
| Columbia Short-Term Cash Fund, 2.208% |
| | 214,471,894 | 8,515,778,267 | (8,377,846,370) | 352,403,791 | (1,340) | 3,331 | 6,430,112 | 352,368,551 |
Abbreviation Legend
| AID | Agency for International Development |
| AMBAC | Ambac Assurance Corporation |
| BAM | Build America Mutual Assurance Co. |
| CMO | Collateralized Mortgage Obligation |
| FHLMC | Federal Home Loan Mortgage Corporation |
| PIK | Payment In Kind |
| STRIPS | Separate Trading of Registered Interest and Principal Securities |
Currency Legend
Fair value measurements
The Fund categorizes its fair value measurements according to a three-level hierarchy that maximizes the use of observable inputs and minimizes the use of unobservable inputs by prioritizing that the most observable input be used when available. Observable inputs are those that market participants would use in pricing an investment based on market data obtained from sources independent of the reporting entity. Unobservable inputs are those that reflect the Fund’s assumptions about the information market participants would use in pricing an investment. An investment’s level within the fair value hierarchy is based on the lowest level of any input that is deemed significant to the asset’s or liability’s fair value measurement. The input levels are not necessarily an indication of the risk or liquidity associated with investments at that level. For example, certain U.S. government securities are generally high quality and liquid, however, they are reflected as Level 2 because the inputs used to determine fair value may not always be quoted prices in an active market.
Fair value inputs are summarized in the three broad levels listed below:
The accompanying Notes to Financial Statements are an integral part of this statement.
Multi-Manager Total Return Bond Strategies Fund | Annual Report 2019
| 71 |
Portfolio of Investments (continued)
August 31, 2019
Fair value measurements (continued)
| ■ | Level 1 — Valuations based on quoted prices for investments in active markets that the Fund has the ability to access at the measurement date. Valuation adjustments are not applied to Level 1 investments. |
| ■ | Level 2 — Valuations based on other significant observable inputs (including quoted prices for similar securities, interest rates, prepayment speeds, credit risks, etc.). |
| ■ | Level 3 — Valuations based on significant unobservable inputs (including the Fund’s own assumptions and judgment in determining the fair value of investments). |
Inputs that are used in determining fair value of an investment may include price information, credit data, volatility statistics, and other factors. These inputs can be either observable or unobservable. The availability of observable inputs can vary between investments, and is affected by various factors such as the type of investment, and the volume and level of activity for that investment or similar investments in the marketplace. The inputs will be considered by the Investment Manager, along with any other relevant factors in the calculation of an investment’s fair value. The Fund uses prices and inputs that are current as of the measurement date, which may include periods of market dislocations. During these periods, the availability of prices and inputs may be reduced for many investments. This condition could cause an investment to be reclassified between the various levels within the hierarchy.
Investments falling into the Level 3 category are primarily supported by quoted prices from brokers and dealers participating in the market for those investments. However, these may be classified as Level 3 investments due to lack of market transparency and corroboration to support these quoted prices. Additionally, valuation models may be used as the pricing source for any remaining investments classified as Level 3. These models may rely on one or more significant unobservable inputs and/or significant assumptions by the Investment Manager. Inputs used in valuations may include, but are not limited to, financial statement analysis, capital account balances, discount rates and estimated cash flows, and comparable company data.
Under the direction of the Fund’s Board of Trustees (the Board), the Investment Manager’s Valuation Committee (the Committee) is responsible for overseeing the valuation procedures approved by the Board. The Committee consists of voting and non-voting members from various groups within the Investment Manager’s organization, including operations and accounting, trading and investments, compliance, risk management and legal.
The Committee meets at least monthly to review and approve valuation matters, which may include a description of specific valuation determinations, data regarding pricing information received from approved pricing vendors and brokers and the results of Board-approved valuation control policies and procedures (the Policies). The Policies address, among other things, instances when market quotations are or are not readily available, including recommendations of third party pricing vendors and a determination of appropriate pricing methodologies; events that require specific valuation determinations and assessment of fair value techniques; securities with a potential for stale pricing, including those that are illiquid, restricted, or in default; and the effectiveness of third party pricing vendors, including periodic reviews of vendors. The Committee meets more frequently, as needed, to discuss additional valuation matters, which may include the need to review back-testing results, review time-sensitive information or approve related valuation actions. The Committee reports to the Board, with members of the Committee meeting with the Board at each of its regularly scheduled meetings to discuss valuation matters and actions during the period, similar to those described earlier.
The following table is a summary of the inputs used to value the Fund’s investments at August 31, 2019:
| | Level 1 ($) | Level 2 ($) | Level 3 ($) | Total ($) |
| Investments in Securities | | | | |
| Asset-Backed Securities — Non-Agency | — | 992,301,309 | 3,980,570 | 996,281,879 |
| Commercial Mortgage-Backed Securities - Agency | — | 243,613,003 | — | 243,613,003 |
| Commercial Mortgage-Backed Securities - Non-Agency | — | 576,511,882 | — | 576,511,882 |
| Common Stocks | | | | |
| Energy | — | — | 80 | 80 |
| Total Common Stocks | — | — | 80 | 80 |
| Corporate Bonds & Notes | — | 2,672,383,050 | — | 2,672,383,050 |
| Foreign Government Obligations | — | 259,371,722 | — | 259,371,722 |
| Inflation-Indexed Bonds | — | 73,684,246 | — | 73,684,246 |
| Municipal Bonds | — | 35,646,850 | — | 35,646,850 |
| Residential Mortgage-Backed Securities - Agency | — | 1,944,620,553 | 7,561,919 | 1,952,182,472 |
| Residential Mortgage-Backed Securities - Non-Agency | — | 430,771,625 | — | 430,771,625 |
| Senior Loans | — | 15,688,221 | 395,980 | 16,084,201 |
| Treasury Bills | 109,323,048 | — | — | 109,323,048 |
| U.S. Government & Agency Obligations | — | 21,819,059 | — | 21,819,059 |
| U.S. Treasury Obligations | 951,506,245 | 27,301,967 | — | 978,808,212 |
| Money Market Funds | 352,368,551 | — | — | 352,368,551 |
| Total Investments in Securities | 1,413,197,844 | 7,293,713,487 | 11,938,549 | 8,718,849,880 |
| Investments in Derivatives | | | | |
| Asset | | | | |
| Futures Contracts | 6,505,816 | — | — | 6,505,816 |
| Swap Contracts | — | 3,067,098 | — | 3,067,098 |
| Liability | | | | |
| Futures Contracts | (955,026) | — | — | (955,026) |
| Swap Contracts | — | (58,565,467) | — | (58,565,467) |
| Total | 1,418,748,634 | 7,238,215,118 | 11,938,549 | 8,668,902,301 |
See the Portfolio of Investments for all investment classifications not indicated in the table.
The Fund’s assets assigned to the Level 2 input category are generally valued using the market approach, in which a security’s value is determined through reference to prices and information from market transactions for similar or identical assets.
The accompanying Notes to Financial Statements are an integral part of this statement.
| 72 | Multi-Manager Total Return Bond Strategies Fund | Annual Report 2019 |
Portfolio of Investments (continued)
August 31, 2019
Fair value measurements (continued)
Derivative instruments are valued at unrealized appreciation (depreciation).
The Fund does not hold any significant investments (greater than one percent of net assets) categorized as Level 3.
The accompanying Notes to Financial Statements are an integral part of this statement.
Multi-Manager Total Return Bond Strategies Fund | Annual Report 2019
| 73 |
Statement of Assets and Liabilities
August 31, 2019
| Assets | |
| Investments in securities, at value | |
| Unaffiliated issuers (cost $8,064,789,112) | $8,366,481,329 |
| Affiliated issuers (cost $352,368,551) | 352,368,551 |
| Cash collateral held at broker for: | |
| TBA | 69,000 |
| Margin deposits on: | |
| Futures contracts | 3,366,959 |
| Swap contracts | 4,950,000 |
| Receivable for: | |
| Investments sold | 30,427,847 |
| Investments sold on a delayed delivery basis | 266,764,620 |
| Capital shares sold | 40,057,378 |
| Dividends | 462,632 |
| Interest | 45,774,353 |
| Foreign tax reclaims | 253,840 |
| Variation margin for futures contracts | 1,459,600 |
| Variation margin for swap contracts | 235,136 |
| Expense reimbursement due from Investment Manager | 7,039 |
| Prepaid expenses | 52,105 |
| Trustees’ deferred compensation plan | 240,816 |
| Total assets | 9,112,971,205 |
| Liabilities | |
| Due to custodian | 8,271,304 |
| Payable for: | |
| Investments purchased | 24,115,018 |
| Investments purchased on a delayed delivery basis | 634,784,831 |
| Capital shares purchased | 9,563,040 |
| Distributions to shareholders | 23,341,338 |
| Variation margin for futures contracts | 492,991 |
| Variation margin for swap contracts | 1,464,600 |
| Management services fees | 104,004 |
| Distribution and/or service fees | 79 |
| Transfer agent fees | 282,741 |
| Compensation of chief compliance officer | 512 |
| Other expenses | 264,286 |
| Trustees’ deferred compensation plan | 240,816 |
| Total liabilities | 702,925,560 |
| Net assets applicable to outstanding capital stock | $8,410,045,645 |
| Represented by | |
| Paid in capital | 8,152,691,669 |
| Total distributable earnings (loss) (Note 2) | 257,353,976 |
| Total - representing net assets applicable to outstanding capital stock | $8,410,045,645 |
| Class A | |
| Net assets | $11,537,415 |
| Shares outstanding | 1,112,095 |
| Net asset value per share | $10.37 |
| Institutional Class | |
| Net assets | $8,398,508,230 |
| Shares outstanding | 809,243,041 |
| Net asset value per share | $10.38 |
The accompanying Notes to Financial Statements are an integral part of this statement.
| 74 | Multi-Manager Total Return Bond Strategies Fund | Annual Report 2019 |
Statement of Operations
Year Ended August 31, 2019
| Net investment income | |
| Income: | |
| Dividends — affiliated issuers | $6,430,112 |
| Interest | 274,573,585 |
| Total income | 281,003,697 |
| Expenses: | |
| Management services fees | 35,866,449 |
| Distribution and/or service fees | |
| Class A | 30,859 |
| Transfer agent fees | |
| Class A | 6,103 |
| Institutional Class | 3,885,485 |
| Compensation of board members | 128,060 |
| Custodian fees | 168,141 |
| Printing and postage fees | 392,848 |
| Registration fees | 232,740 |
| Audit fees | 55,199 |
| Legal fees | 161,055 |
| Interest on interfund lending | 201 |
| Compensation of chief compliance officer | 3,101 |
| Other | 207,781 |
| Total expenses | 41,138,022 |
| Fees waived or expenses reimbursed by Investment Manager and its affiliates | (468,552) |
| Total net expenses | 40,669,470 |
| Net investment income | 240,334,227 |
| Realized and unrealized gain (loss) — net | |
| Net realized gain (loss) on: | |
| Investments — unaffiliated issuers | 83,826,131 |
| Investments — affiliated issuers | (1,340) |
| Foreign currency translations | (17,088) |
| Forward foreign currency exchange contracts | (959,763) |
| Futures contracts | 124,287,967 |
| Swap contracts | (77,947,881) |
| Net realized gain | 129,188,026 |
| Net change in unrealized appreciation (depreciation) on: | |
| Investments — unaffiliated issuers | 397,416,094 |
| Investments — affiliated issuers | 3,331 |
| Foreign currency translations | 9,556 |
| Forward foreign currency exchange contracts | 85,686 |
| Futures contracts | 6,012,854 |
| Swap contracts | (60,455,345) |
| Net change in unrealized appreciation (depreciation) | 343,072,176 |
| Net realized and unrealized gain | 472,260,202 |
| Net increase in net assets resulting from operations | $712,594,429 |
The accompanying Notes to Financial Statements are an integral part of this statement.
Multi-Manager Total Return Bond Strategies Fund | Annual Report 2019
| 75 |
Statement of Changes in Net Assets
| | Year Ended
August 31, 2019 | Year Ended
August 31, 2018 |
| Operations | | |
| Net investment income | $240,334,227 | $207,423,404 |
| Net realized gain (loss) | 129,188,026 | (115,670,038) |
| Net change in unrealized appreciation (depreciation) | 343,072,176 | (180,505,948) |
| Net increase (decrease) in net assets resulting from operations | 712,594,429 | (88,752,582) |
| Distributions to shareholders | | |
| Net investment income and net realized gains | | |
| Class A | (362,615) | |
| Institutional Class | (250,729,973) | |
| Net investment income | | |
| Class A | | (378,682) |
| Institutional Class | | (195,325,065) |
| Net realized gains | | |
| Class A | | (7,581) |
| Institutional Class | | (3,047,967) |
| Total distributions to shareholders (Note 2) | (251,092,588) | (198,759,295) |
| Increase (decrease) in net assets from capital stock activity | (35,474,121) | 701,288,464 |
| Total increase in net assets | 426,027,720 | 413,776,587 |
| Net assets at beginning of year | 7,984,017,925 | 7,570,241,338 |
| Net assets at end of year | $8,410,045,645 | $7,984,017,925 |
| Undistributed net investment income | $5,377,828 | $13,653,976 |
| | Year Ended | Year Ended |
| | August 31, 2019 | August 31, 2018 |
| | Shares | Dollars ($) | Shares | Dollars ($) |
| Capital stock activity |
| Class A | | | | |
| Subscriptions | 3 | 31 | 685 | 6,764 |
| Distributions reinvested | 36,680 | 362,320 | 38,932 | 386,032 |
| Redemptions | (367,958) | (3,616,940) | (663,842) | (6,600,929) |
| Net decrease | (331,275) | (3,254,589) | (624,225) | (6,208,133) |
| Institutional Class | | | | |
| Subscriptions | 147,758,591 | 1,459,502,750 | 198,219,874 | 1,965,645,540 |
| Distributions reinvested | 25,340,321 | 250,729,752 | 20,032,838 | 198,372,778 |
| Redemptions | (177,405,207) | (1,742,452,034) | (146,978,253) | (1,456,521,721) |
| Net increase (decrease) | (4,306,295) | (32,219,532) | 71,274,459 | 707,496,597 |
| Total net increase (decrease) | (4,637,570) | (35,474,121) | 70,650,234 | 701,288,464 |
The accompanying Notes to Financial Statements are an integral part of this statement.
| 76 | Multi-Manager Total Return Bond Strategies Fund | Annual Report 2019 |
[THIS PAGE INTENTIONALLY LEFT BLANK]
Multi-Manager Total Return Bond Strategies Fund | Annual Report 2019
| 77 |
The following table is intended to help you understand the Fund’s financial performance. Certain information reflects financial results for a single share of a class held for the periods shown. Per share net investment income (loss) amounts are calculated based on average shares outstanding during the period. Total return assumes reinvestment of all dividends and distributions, if any. Total return does not reflect payment of sales charges, if any. Total return and portfolio turnover are not annualized for periods of less than one year. The portfolio turnover rate is calculated without regard to purchase and sales transactions of short-term instruments and certain derivatives, if any. If such transactions were included, the Fund’s portfolio turnover rate may be higher.
| | Net asset value,
beginning of
period | Net
investment
income | Net
realized
and
unrealized
gain (loss) | Total from
investment
operations | Distributions
from net
investment
income | Distributions
from net
realized
gains | Total
distributions to
shareholders |
| Class A |
| Year Ended 8/31/2019 | $9.79 | 0.28 | 0.59 | 0.87 | (0.29) | — | (0.29) |
| Year Ended 8/31/2018 | $10.17 | 0.24 | (0.39) | (0.15) | (0.23) | (0.00)(d) | (0.23) |
| Year Ended 8/31/2017 | $10.41 | 0.22 | (0.11) | 0.11 | (0.21) | (0.14) | (0.35) |
| Year Ended 8/31/2016 | $10.06 | 0.20 | 0.38 | 0.58 | (0.19) | (0.04) | (0.23) |
| Year Ended 8/31/2015 | $10.21 | 0.19 | (0.14) | 0.05 | (0.20) | — | (0.20) |
| Institutional Class |
| Year Ended 8/31/2019 | $9.80 | 0.30 | 0.59 | 0.89 | (0.31) | — | (0.31) |
| Year Ended 8/31/2018 | $10.17 | 0.26 | (0.38) | (0.12) | (0.25) | (0.00)(d) | (0.25) |
| Year Ended 8/31/2017(e) | $9.91 | 0.16 | 0.26(f) | 0.42 | (0.16) | — | (0.16) |
| Notes to Financial Highlights |
| (a) | In addition to the fees and expenses that the Fund bears directly, the Fund indirectly bears a pro rata share of the fees and expenses of any other funds in which it invests. Such indirect expenses are not included in the Fund’s reported expense ratios. |
| (b) | Total net expenses include the impact of certain fee waivers/expense reimbursements made by the Investment Manager and certain of its affiliates, if applicable. |
| (c) | Ratios include interfund lending expense which is less than 0.01%. |
| (d) | Rounds to zero. |
| (e) | Institutional Class shares commenced operations on January 3, 2017. Per share data and total return reflect activity from that date. |
| (f) | Calculation of the net gain (loss) per share (both realized and unrealized) does not correlate to the aggregate realized and unrealized gain (loss) presented in the Statement of Operations due to the timing of subscriptions and redemptions of Fund shares in relation to fluctuations in the market value of the portfolio. |
| (g) | Annualized. |
The accompanying Notes to Financial Statements are an integral part of this statement.
| 78 | Multi-Manager Total Return Bond Strategies Fund | Annual Report 2019 |
Financial Highlights (continued)
| | Net
asset
value,
end of
period | Total
return | Total gross
expense
ratio to
average
net assets(a) | Total net
expense
ratio to
average
net assets(a),(b) | Net investment
income
ratio to
average
net assets | Portfolio
turnover | Net
assets,
end of
period
(000’s) |
| Class A |
| Year Ended 8/31/2019 | $10.37 | 9.06% | 0.77%(c) | 0.77%(c) | 2.81% | 219% | $11,537 |
| Year Ended 8/31/2018 | $9.79 | (1.51%) | 0.77% | 0.77% | 2.37% | 228% | $14,135 |
| Year Ended 8/31/2017 | $10.17 | 1.14% | 0.79% | 0.78% | 2.14% | 345% | $21,021 |
| Year Ended 8/31/2016 | $10.41 | 5.82% | 0.80% | 0.80% | 2.01% | 289% | $6,614,680 |
| Year Ended 8/31/2015 | $10.06 | 0.49% | 0.80% | 0.80% | 1.86% | 269% | $5,097,458 |
| Institutional Class |
| Year Ended 8/31/2019 | $10.38 | 9.33% | 0.52%(c) | 0.52%(c) | 3.05% | 219% | $8,398,508 |
| Year Ended 8/31/2018 | $9.80 | (1.16%) | 0.52% | 0.52% | 2.66% | 228% | $7,969,883 |
| Year Ended 8/31/2017(e) | $10.17 | 4.28% | 0.54%(g) | 0.53%(g) | 2.48%(g) | 345% | $7,549,220 |
The accompanying Notes to Financial Statements are an integral part of this statement.
Multi-Manager Total Return Bond Strategies Fund | Annual Report 2019
| 79 |
Notes to Financial Statements
August 31, 2019
Note 1. Organization
Multi-Manager Total Return Bond Strategies Fund (the Fund), a series of Columbia Funds Series Trust I (the Trust), is a diversified fund. The Trust is registered under the Investment Company Act of 1940, as amended (the 1940 Act), as an open-end management investment company organized as a Massachusetts business trust.
Fund shares
The Trust may issue an unlimited number of shares (without par value). The Fund is offered only through certain wrap fee programs sponsored and/or managed by Ameriprise Financial, Inc. (Ameriprise Financial) or its affiliates. The Fund offers each of the share classes listed in the Statement of Assets and Liabilities which are not subject to any front-end sales charge or contingent deferred sales charge.
Note 2. Summary of significant accounting policies
Basis of preparation
The Fund is an investment company that applies the accounting and reporting guidance in the Financial Accounting Standards Board (FASB) Accounting Standards Codification Topic 946,Financial Services - Investment Companies (ASC 946). The financial statements are prepared in accordance with U.S. generally accepted accounting principles (GAAP), which requires management to make certain estimates and assumptions that affect the reported amounts of assets and liabilities, the disclosure of contingent assets and liabilities at the date of the financial statements and the reported amounts of income and expenses during the reporting period. Actual results could differ from those estimates.
The following is a summary of significant accounting policies followed by the Fund in the preparation of its financial statements.
Security valuation
Debt securities generally are valued by pricing services approved by the Board of Trustees based upon market transactions for normal, institutional-size trading units of similar securities. The services may use various pricing techniques that take into account, as applicable, factors such as yield, quality, coupon rate, maturity, type of issue, trading characteristics and other data, as well as approved independent broker-dealer quotes. Debt securities for which quotations are not readily available or not believed to be reflective of market value may also be valued based upon a bid quote from an approved independent broker-dealer. Debt securities maturing in 60 days or less are valued primarily at amortized cost value, unless this method results in a valuation that management believes does not approximate market value.
Asset- and mortgage-backed securities are generally valued by pricing services, which utilize pricing models that incorporate the securities’ cash flow and loan performance data. These models also take into account available market data, including trades, market quotations, and benchmark yield curves for identical or similar securities. Factors used to identify similar securities may include, but are not limited to, issuer, collateral type, vintage, prepayment speeds, collateral performance, credit ratings, credit enhancement and expected life. Asset-backed securities for which quotations are readily available may also be valued based upon an over-the-counter or exchange bid quote from an approved independent broker-dealer.
Senior loan securities for which reliable market quotations are readily available are generally valued by pricing services at the average of the bids received.
Foreign equity securities are valued based on the closing price on the foreign exchange in which such securities are primarily traded. If any foreign equity security closing prices are not readily available, the securities are valued at the mean of the latest quoted bid and ask prices on such exchanges or markets. Foreign currency exchange rates are determined at the scheduled closing time of the New York Stock Exchange. Many securities markets and exchanges outside the U.S. close prior to the close of the New York Stock Exchange; therefore, the closing prices for securities in such markets or on such exchanges may not fully reflect events that occur after such close but before the close of the New York Stock Exchange. In those situations, foreign securities will be fair valued pursuant to a policy adopted by the Board of Trustees. Under the policy, the Fund may utilize a third party pricing service to determine these fair values. The third-party pricing service takes into account multiple factors, including, but not limited to, movements in the U.S. securities markets, certain depositary receipts, futures contracts
| 80 | Multi-Manager Total Return Bond Strategies Fund | Annual Report 2019 |
Notes to Financial Statements (continued)
August 31, 2019
and foreign exchange rates that have occurred subsequent to the close of the foreign exchange or market, to determine a good faith estimate that reasonably reflects the current market conditions as of the close of the New York Stock Exchange. The fair value of a security is likely to be different from the quoted or published price, if available.
Investments in open-end investment companies, including money market funds, are valued at their latest net asset value.
Futures and options on futures contracts are valued based upon the settlement price at the close of regular trading on their principal exchanges or, in the absence of transactions, at the mean of the latest quoted bid and ask prices.
Swap transactions are valued through an independent pricing service or broker, or if neither is available, through an internal model based upon observable inputs.
Investments for which market quotations are not readily available, or that have quotations which management believes are not reflective of market value or reliable, are valued at fair value as determined in good faith under procedures approved by and under the general supervision of the Board of Trustees. If a security or class of securities (such as foreign securities) is valued at fair value, such value is likely to be different from the quoted or published price for the security.
The determination of fair value often requires significant judgment. To determine fair value, management may use assumptions including but not limited to future cash flows and estimated risk premiums. Multiple inputs from various sources may be used to determine fair value.
GAAP requires disclosure regarding the inputs and valuation techniques used to measure fair value and any changes in valuation inputs or techniques. In addition, investments shall be disclosed by major category. This information is disclosed following the Fund’s Portfolio of Investments.
Foreign currency transactions and translations
The values of all assets and liabilities denominated in foreign currencies are generally translated into U.S. dollars at exchange rates determined at the close of regular trading on the New York Stock Exchange. Net realized and unrealized gains (losses) on foreign currency transactions and translations include gains (losses) arising from the fluctuation in exchange rates between trade and settlement dates on securities transactions, gains (losses) arising from the disposition of foreign currency and currency gains (losses) between the accrual and payment dates on dividends, interest income and foreign withholding taxes.
For financial statement purposes, the Fund does not distinguish that portion of gains (losses) on investments which is due to changes in foreign exchange rates from that which is due to changes in market prices of the investments. Such fluctuations are included with the net realized and unrealized gains (losses) on investments in the Statement of Operations.
Derivative instruments
The Fund invests in certain derivative instruments, as detailed below, to meet its investment objectives. Derivatives are instruments whose values depend on, or are derived from, in whole or in part, the value of one or more securities, currencies, commodities, indices, or other assets or instruments. Derivatives may be used to increase investment flexibility (including to maintain cash reserves while maintaining desired exposure to certain assets), for risk management (hedging) purposes, to facilitate trading, to reduce transaction costs and to pursue higher investment returns. The Fund may also use derivative instruments to mitigate certain investment risks, such as foreign currency exchange rate risk, interest rate risk and credit risk. Derivatives may involve various risks, including the potential inability of the counterparty to fulfill its obligations under the terms of the contract, the potential for an illiquid secondary market (making it difficult for the Fund to sell or terminate, including at favorable prices) and the potential for market movements which may expose the Fund to gains or losses in excess of the amount shown in the Statement of Assets and Liabilities. The notional amounts of derivative instruments, if applicable, are not recorded in the financial statements.
A derivative instrument may suffer a marked-to-market loss if the value of the contract decreases due to an unfavorable change in the market rates or values of the underlying instrument. Losses can also occur if the counterparty does not perform its obligations under the contract. The Fund’s risk of loss from counterparty credit risk on over-the-counter derivatives is generally limited to the aggregate unrealized gain netted against any collateral held by the Fund and the amount of any
Multi-Manager Total Return Bond Strategies Fund | Annual Report 2019
| 81 |
Notes to Financial Statements (continued)
August 31, 2019
variation margin held by the counterparty, plus any replacement costs or related amounts. With exchange-traded or centrally cleared derivatives, there is reduced counterparty credit risk to the Fund since the clearinghouse or central counterparty (CCP) provides some protection in the case of clearing member default. The clearinghouse or CCP stands between the buyer and the seller of the contract; therefore, additional counterparty credit risk is failure of the clearinghouse or CCP. However, credit risk still exists in exchange-traded or centrally cleared derivatives with respect to initial and variation margin that is held in a broker’s customer account. While brokers are required to segregate customer margin from their own assets, in the event that a broker becomes insolvent or goes into bankruptcy and at that time there is a shortfall in the aggregate amount of margin held by the broker for all its clients, U.S. bankruptcy laws will typically allocate that shortfall on a pro-rata basis across all the broker’s customers (including the Fund), potentially resulting in losses to the Fund.
In order to better define its contractual rights and to secure rights that will help the Fund mitigate its counterparty risk, the Fund may enter into an International Swaps and Derivatives Association, Inc. Master Agreement (ISDA Master Agreement) or similar agreement with its derivatives contract counterparties. An ISDA Master Agreement is an agreement between the Fund and a counterparty that governs over-the-counter derivatives and typically contains, among other things, collateral posting terms and netting provisions in the event of a default and/or termination event. Under an ISDA Master Agreement, the Fund may, under certain circumstances, offset with the counterparty certain derivative instrument’s payables and/or receivables with collateral held and/or posted and create one single net payment. The provisions of the ISDA Master Agreement typically permit a single net payment in the event of default (close-out netting), including the bankruptcy or insolvency of the counterparty. Note, however, that bankruptcy or insolvency laws of a particular jurisdiction may impose restrictions on or prohibitions against the right of offset or netting in bankruptcy, insolvency or other events.
Collateral (margin) requirements differ by type of derivative. Margin requirements are established by the clearinghouse or CCP for exchange-traded and centrally cleared derivatives. Brokers can ask for margin in excess of the minimum in certain circumstances. Collateral terms are contract specific for over-the-counter derivatives. For over-the-counter derivatives traded under an ISDA Master Agreement, the collateral requirements are typically calculated by netting the marked-to-market amount for each transaction under such agreement and comparing that amount to the value of any variation margin currently pledged by the Fund and/or the counterparty. Generally, the amount of collateral due from or to a party has to exceed a minimum transfer amount threshold (e.g., $250,000) before a transfer has to be made. To the extent amounts due to the Fund from its counterparties are not fully collateralized, contractually or otherwise, the Fund bears the risk of loss from counterparty nonperformance. The Fund may also pay interest expense on cash collateral received from the broker. Any interest expense paid by the Fund is shown on the Statement of Operations. The Fund attempts to mitigate counterparty risk by only entering into agreements with counterparties that it believes have the financial resources to honor their obligations and by monitoring the financial stability of those counterparties.
Certain ISDA Master Agreements allow counterparties of over-the-counter derivatives transactions to terminate derivatives contracts prior to maturity in the event the Fund’s net asset value declines by a stated percentage over a specified time period or if the Fund fails to meet certain terms of the ISDA Master Agreement, which would cause the Fund to accelerate payment of any net liability owed to the counterparty. The Fund also has termination rights if the counterparty fails to meet certain terms of the ISDA Master Agreement. In determining whether to exercise such termination rights, the Fund would consider, in addition to counterparty credit risk, whether termination would result in a net liability owed from the counterparty.
For financial reporting purposes, the Fund does not offset derivative assets and derivative liabilities that are subject to netting arrangements in the Statement of Assets and Liabilities.
Forward foreign currency exchange contracts
Forward foreign currency exchange contracts are over-the-counter agreements between two parties to buy and sell a currency at a set price on a future date. The Fund utilized forward foreign currency exchange contracts to hedge the currency exposure associated with some or all of the Fund’s securities and to shift foreign currency exposure back to U.S. dollars. These instruments may be used for other purposes in future periods.
| 82 | Multi-Manager Total Return Bond Strategies Fund | Annual Report 2019 |
Notes to Financial Statements (continued)
August 31, 2019
The values of forward foreign currency exchange contracts fluctuate daily with changes in foreign currency exchange rates. Changes in the value of these contracts are recorded as unrealized appreciation or depreciation until the contract is exercised or has expired. The Fund will realize a gain or loss when the forward foreign currency exchange contract is closed or expires. Non-deliverable forward foreign currency exchange contracts are settled with the counterparty in U.S. dollars without delivery of foreign currency.
The use of forward foreign currency exchange contracts does not eliminate fluctuations in the prices of the Fund’s portfolio securities. The risks of forward foreign currency exchange contracts include movement in the values of the foreign currencies relative to the U.S. dollar (or other foreign currencies) and the possibility that counterparties will not complete their contractual obligations, which may be in excess of the amount reflected, if any, in the Statement of Assets and Liabilities.
Futures contracts
Futures contracts are exchange-traded and represent commitments for the future purchase or sale of an asset at a specified price on a specified date. The Fund bought and sold futures contracts to produce incremental earnings, to manage the duration and yield curve exposure of the Fund versus the benchmark and to manage exposure to movements in interest rates. These instruments may be used for other purposes in future periods. Upon entering into futures contracts, the Fund bears risks that it may not achieve the anticipated benefits of the futures contracts and may realize a loss. Additional risks include counterparty credit risk, the possibility of an illiquid market, and that a change in the value of the contract or option may not correlate with changes in the value of the underlying asset.
Upon entering into a futures contract, the Fund deposits cash or securities with the broker, known as a futures commission merchant (FCM), in an amount sufficient to meet the initial margin requirement. The initial margin deposit must be maintained at an established level over the life of the contract. Cash deposited as initial margin is recorded in the Statement of Assets and Liabilities as margin deposits. Securities deposited as initial margin are designated in the Portfolio of Investments. Subsequent payments (variation margin) are made or received by the Fund each day. The variation margin payments are equal to the daily change in the contract value and are recorded as variation margin receivable or payable and are offset in unrealized gains or losses. The Fund recognizes a realized gain or loss when the contract is closed or expires. Futures contracts involve, to varying degrees, risk of loss in excess of the variation margin disclosed in the Statement of Assets and Liabilities.
Swap contracts
Swap contracts are negotiated in the over-the-counter market and may be entered into as a bilateral contract or centrally cleared (centrally cleared swap contract). In a centrally cleared swap contract, immediately following execution of the swap contract with a broker, the swap contract is novated to a central counterparty (the CCP) and the CCP becomes the Fund’s counterparty to the centrally cleared swap contract. The Fund is required to deposit initial margin with the futures commission merchant (FCM), which pledges it through to the CCP in the form of cash or securities in an amount that varies depending on the size and risk profile of the particular swap contract. Securities deposited as initial margin are designated in the Portfolio of Investments and cash deposited is recorded in the Statement of Assets and Liabilities as margin deposits. Unlike a bilateral swap contract, for centrally cleared swap contracts, the Fund has minimal credit exposure to the FCM because the CCP stands between the Fund and the relevant buyer/seller on the other side of the contract. Swap contracts are marked-to-market daily and changes in value are recorded as unrealized appreciation (depreciation). The daily change in valuation of centrally cleared swap contracts, if any, is recorded as a receivable or payable for variation margin in the Statement of Assets and Liabilities.
Entering into these contracts involves, to varying degrees, elements of interest, liquidity and counterparty credit risk in excess of the amounts recognized in the Statement of Assets and Liabilities. Such risks involve the possibility that there may be unfavorable changes in interest rates, market conditions or other conditions, that it may be difficult to initiate a swap transaction or liquidate a position at an advantageous time or price which may result in significant losses, and that the FCM or CCP may not fulfill its obligation under the contract.
Multi-Manager Total Return Bond Strategies Fund | Annual Report 2019
| 83 |
Notes to Financial Statements (continued)
August 31, 2019
Credit default swap contracts
The Fund entered into credit default swap contracts to increase or decrease its credit exposure to an index, to manage credit risk exposure, increase or decrease its credit exposure to a specific debt security or a basket of debt securities and as a protection buyer to reduce overall credit exposure. These instruments may be used for other purposes in future periods. Credit default swap contracts are agreements in which one party pays fixed periodic payments to a counterparty in consideration for an agreement from the counterparty to make a specific payment should a specified credit event(s) take place. Although specified credit events are contract specific, credit events are generally defined as bankruptcy, failure to pay, restructuring, obligation acceleration, obligation default, or repudiation/moratorium.
As the purchaser of a credit default swap contract, the Fund purchases protection by paying a periodic interest rate on the notional amount to the counterparty. The interest amount is accrued daily as a component of unrealized appreciation (depreciation) and is recorded as a realized loss upon payment. If a credit event as specified in the contract occurs, the Fund may have the option either to deliver the reference obligation to the seller in exchange for a cash payment of its par amount, or to receive a net cash settlement equal to the par amount less an agreed-upon value of the reference obligation as of the date of the credit event. The difference between the value of the obligation or cash delivered and the notional amount received will be recorded as a realized gain (loss).
As the seller of a credit default swap contract, the Fund sells protection to a buyer and will generally receive a periodic interest rate on a notional amount. The interest amount is accrued daily as a component of unrealized appreciation (depreciation) and is recorded as a realized gain upon receipt of the payment. If a credit event as specified in the contract with the counterparty occurs, the Fund may either be required to accept the reference obligation from the buyer in exchange for a cash payment of its notional amount, or to pay the buyer a net cash settlement equal to the notional amount less an agreed-upon value of the reference obligation (recovery value) as of the date of the credit event. The difference between the value of the obligation or cash received and the notional amount paid will be recorded as a realized gain (loss). The maximum potential amount of undiscounted future payments the Fund could be required to make as the seller of protection under a credit default swap contract is equal to the notional amount of the reference obligation. These potential amounts may be partially offset by any recovery values of the respective reference obligations or upfront receipts upon entering into the agreement. The notional amounts and market values of all credit default swap contracts in which the Fund is the seller of protection, if any, are disclosed in the Credit Default Swap Contracts Outstanding schedule following the Portfolio of Investments.
As a protection seller, the Fund bears the risk of loss from the credit events specified in the contract with the counterparty. For credit default swap contracts on credit indices, quoted market prices and resulting market values serve as an indicator of the current status of the payment/performance risk. Increasing market values, in absolute terms when compared to the notional amount of the swap, represent a deterioration of the reference entity’s credit soundness and a greater likelihood or risk of default or other credit event occurring as defined under the terms of the contract.
Any upfront payments or receipts by the Fund upon entering into a credit default swap contract is recorded as an asset or liability, respectively, and amortized daily as a component of realized gain (loss) in the Statement of Operations. Credit default swap contracts are valued daily, and the change in value is recorded as unrealized appreciation (depreciation) until the termination of the swap, at which time a realized gain (loss) is recorded.
Credit default swap contracts can involve greater risks than if a fund had invested in the reference obligation directly since, in addition to general market risks, credit default swaps are subject to counterparty credit risk, leverage risk, hedging risk, correlation risk and liquidity risk.
Interest rate swap contracts
The Fund entered into interest rate swap transactions which may include inflation rate swap contracts to produce incremental earnings, to manage interest rate and market risk exposure to produce incremental earnings, to gain exposure to or protect itself from market rate changes and to hedge the portfolio risk associated with some or all of the Fund’s securities. These instruments may be used for other purposes in future periods. An interest rate swap is an agreement between two parties where there are two flows and payments are made between the two counterparties and the payments are dependent upon changes in an interest rate, inflation rate or inflation index calculated on a nominal amount. Interest rate swaps are
| 84 | Multi-Manager Total Return Bond Strategies Fund | Annual Report 2019 |
Notes to Financial Statements (continued)
August 31, 2019
agreements between two parties that involve the exchange of one type of interest rate for another type of interest rate cash flow on specified dates in the future, based on a predetermined, specified notional amount. Certain interest rate swaps are considered forward-starting, whereby the accrual for the exchange of cash flows does not begin until a specified date in the future. The net cash flow for a standard interest rate swap transaction is generally the difference between a floating market interest rate versus a fixed interest rate.
Interest rate swaps are valued daily and unrealized appreciation (depreciation) is recorded. Certain interest rate swaps may accrue periodic interest on a daily basis as a component of unrealized appreciation (depreciation); the Fund will realize a gain or loss upon the payment or receipt of accrued interest. The Fund will realize a gain or a loss when the interest rate swap is terminated.
Effects of derivative transactions in the financial statements
The following tables are intended to provide additional information about the effect of derivatives on the financial statements of the Fund, including: the fair value of derivatives by risk category and the location of those fair values in the Statement of Assets and Liabilities; and the impact of derivative transactions over the period in the Statement of Operations, including realized and unrealized gains (losses). The derivative instrument schedules following the Portfolio of Investments present additional information regarding derivative instruments outstanding at the end of the period, if any.
The following table is a summary of the fair value of derivative instruments (not considered to be hedging instruments for accounting disclosure purposes) at August 31, 2019:
| | Asset derivatives | |
Risk exposure
category | Statement
of assets and liabilities
location | Fair value ($) |
| Interest rate risk | Component of total distributable earnings (loss) — unrealized appreciation on futures contracts | 6,505,816* |
| Interest rate risk | Component of total distributable earnings (loss) — unrealized appreciation on swap contracts | 3,067,098* |
| Total | | 9,572,914 |
| | Liability derivatives | |
Risk exposure
category | Statement
of assets and liabilities
location | Fair value ($) |
| Credit risk | Component of total distributable earnings (loss) — unrealized depreciation on swap contracts | 1,199,745* |
| Interest rate risk | Component of total distributable earnings (loss) — unrealized depreciation on futures contracts | 955,026* |
| Interest rate risk | Component of total distributable earnings (loss) — unrealized depreciation on swap contracts | 57,365,722* |
| Total | | 59,520,493 |
| * | Includes cumulative appreciation (depreciation) as reported in the tables following the Portfolio of Investments. Only the current day’s variation margin is reported in receivables or payables in the Statement of Assets and Liabilities. |
Multi-Manager Total Return Bond Strategies Fund | Annual Report 2019
| 85 |
Notes to Financial Statements (continued)
August 31, 2019
The following table indicates the effect of derivative instruments (not considered to be hedging instruments for accounting disclosure purposes) in the Statement of Operations for the year ended August 31, 2019:
| Amount of realized gain (loss) on derivatives recognized in income |
| Risk exposure category | Forward
foreign
currency
exchange
contracts
($) | Futures
contracts
($) | Swap
contracts
($) | Total
($) |
| Credit risk | — | — | (21,457,708) | (21,457,708) |
| Foreign exchange risk | (959,763) | — | — | (959,763) |
| Interest rate risk | — | 124,287,967 | (56,490,173) | 67,797,794 |
| Total | (959,763) | 124,287,967 | (77,947,881) | 45,380,323 |
| |
| Change in unrealized appreciation (depreciation) on derivatives recognized in income |
| Risk exposure category | Forward
foreign
currency
exchange
contracts
($) | Futures
contracts
($) | Swap
contracts
($) | Total
($) |
| Credit risk | — | — | 5,687,358 | 5,687,358 |
| Foreign exchange risk | 85,686 | — | — | 85,686 |
| Interest rate risk | — | 6,012,854 | (66,142,703) | (60,129,849) |
| Total | 85,686 | 6,012,854 | (60,455,345) | (54,356,805) |
The following table is a summary of the average outstanding volume by derivative instrument for the year ended August 31, 2019:
| Derivative instrument | Average notional
amounts ($) |
| Futures contracts — long | 2,281,504,924* |
| Futures contracts — short | 599,673,023* |
| Credit default swap contracts — buy protection | 201,890,523* |
| Credit default swap contracts — sell protection | 8,404,121** |
| Derivative instrument | Average unrealized
appreciation ($) | Average unrealized
depreciation ($) |
| Forward foreign currency exchange contracts | 73,318** | (195,604)** |
| Interest rate swap contracts | 12,718,434* | (33,343,402)* |
| * | Based on the ending quarterly outstanding amounts for the year ended August 31, 2019. |
| ** | Based on the ending daily outstanding amounts for the year ended August 31, 2019. |
Investments in senior loans
The Fund may invest in senior loan assignments. When the Fund purchases an assignment of a senior loan, the Fund typically has direct rights against the borrower; provided, however, that the Fund’s rights may be more limited than the lender from which it acquired the assignment and the Fund may be able to enforce its rights only through an administrative agent. Although certain senior loan assignments are secured by collateral, the Fund could experience delays or limitations in realizing such collateral or have its interest subordinated to other indebtedness of the obligor. In the event that the administrator or collateral agent of a loan becomes insolvent or enters into receivership or bankruptcy, the Fund may incur costs and delays in realizing payment or may suffer a loss of principal and/or interest. The risk of loss is greater for unsecured or subordinated loans. In addition, senior loan assignments are vulnerable to market, economic or other conditions or events that may reduce the demand for senior loan assignments and certain senior loan assignments which were liquid when purchased, may become illiquid.
| 86 | Multi-Manager Total Return Bond Strategies Fund | Annual Report 2019 |
Notes to Financial Statements (continued)
August 31, 2019
The Fund may enter into senior loan assignments where all or a portion of the loan may be unfunded. The Fund is obligated to fund these commitments at the borrower’s discretion. These commitments, if any, are generally traded and priced in the same manner as other senior loan securities and are disclosed as unfunded senior loan commitments in the Fund’s Portfolio of Investments with a corresponding payable for investments purchased. The Fund designates cash or liquid securities to cover these commitments.
Asset- and mortgage-backed securities
The Fund may invest in asset-backed and mortgage-backed securities. The maturity dates shown represent the original maturity of the underlying obligation. Actual maturity may vary based upon prepayment activity on these obligations. All, or a portion, of the obligation may be prepaid at any time because the underlying asset may be prepaid. As a result, decreasing market interest rates could result in an increased level of prepayment. An increased prepayment rate will have the effect of shortening the maturity of the security. Unless otherwise noted, the coupon rates presented are fixed rates.
Delayed delivery securities
The Fund may trade securities on other than normal settlement terms, including securities purchased or sold on a “when-issued” or "forward commitment" basis. This may increase risk to the Fund since the other party to the transaction may fail to deliver, which could cause the Fund to subsequently invest at less advantageous prices. The Fund designates cash or liquid securities in an amount equal to the delayed delivery commitment.
To be announced securities
The Fund may trade securities on a To Be Announced (TBA) basis. As with other delayed-delivery transactions, a seller agrees to issue a TBA security at a future date. However, the seller does not specify the particular securities to be delivered. Instead, the Fund agrees to accept any security that meets specified terms.
In some cases, Master Securities Forward Transaction Agreements (MSFTAs) may be used to govern transactions of certain forward-settling agency mortgage-backed securities, such as delayed-delivery and TBAs, between the Fund and counterparty. The MSFTA maintains provisions for, among other things, initiation and confirmation, payment and transfer, events of default, termination, and maintenance of collateral relating to such transactions.
Mortgage dollar roll transactions
The Fund may enter into mortgage “dollar rolls” in which the Fund sells securities for delivery in the current month and simultaneously contracts with the same counterparty to repurchase similar but not identical securities (same type, coupon and maturity) on a specified future date. During the roll period, the Fund loses the right to receive principal and interest paid on the securities sold. However, the Fund will benefit because it receives negotiated amounts in the form of reductions of the purchase price for the future purchase plus the interest earned on the cash proceeds of the securities sold until the settlement date of the forward purchase. The Fund records the incremental difference between the forward purchase and sale of each forward roll as a realized gain or loss. Unless any realized gains exceed the income, capital appreciation, and gain or loss due to mortgage prepayments that would have been realized on the securities sold as part of the mortgage dollar roll, the use of this technique will diminish the investment performance of the Fund compared to what the performance would have been without the use of mortgage dollar rolls. All cash proceeds will be invested in instruments that are permissible investments for the Fund. The Fund identifies cash or liquid securities in an amount equal to the forward purchase price.
For financial reporting and tax purposes, the Fund treats “to be announced” mortgage dollar rolls as two separate transactions, one involving the purchase of a security and a separate transaction involving a sale. These transactions may increase the Fund’s portfolio turnover rate. The Fund does not currently enter into mortgage dollar rolls that are accounted for as financing transactions.
Mortgage dollar rolls involve the risk that the market value of the securities the Fund is obligated to repurchase may decline below the repurchase price, or that the counterparty may default on its obligations.
Multi-Manager Total Return Bond Strategies Fund | Annual Report 2019
| 87 |
Notes to Financial Statements (continued)
August 31, 2019
Treasury inflation protected securities
The Fund may invest in treasury inflation protected securities (TIPS). The principal amount of TIPS is adjusted periodically and is increased for inflation or decreased for deflation based on a monthly published index. These adjustments are recorded as interest income in the Statement of Operations. Coupon payments are based on the adjusted principal at the time the interest is paid.
Interest only and principal only securities
The Fund may invest in Interest Only (IO) or Principal Only (PO) securities. IOs are stripped securities entitled to receive all of the security’s interest, but none of its principal. IOs are particularly sensitive to changes in interest rates and therefore subject to greater fluctuations in price than typical interest bearing debt securities. IOs are also subject to credit risk because the Fund may not receive all or part of the interest payments if the issuer, obligor, guarantor or counterparty defaults on its obligation. Payments received for IOs are included in interest income on the Statement of Operations. Because no principal will be received at the maturity of an IO, adjustments are made to the cost of the security on a monthly basis until maturity. These adjustments are included in interest income on the Statement of Operations. POs are stripped securities entitled to receive the principal from the underlying obligation, but not the interest. POs are particularly sensitive to changes in interest rates and therefore are subject to fluctuations in price. POs are also subject to credit risk because the Fund may not receive all or part of its principal if the issuer, obligor, guarantor or counterparty defaults on its obligation. The Fund may also invest in IO or PO stripped mortgage-backed securities. Payments received for POs are treated as reductions to the cost and par value of the securities.
Offsetting of assets and liabilities
The following table presents the Fund’s gross and net amount of assets and liabilities available for offset under netting arrangements as well as any related collateral received or pledged by the Fund as of August 31, 2019:
| | JPMorgan ($) | Morgan
Stanley ($) | Total ($) |
| Assets | | | |
| Centrally cleared credit default swap contracts(a) | - | 47,258 | 47,258 |
| Centrally cleared interest rate swap contracts(a) | 187,878 | - | 187,878 |
| Total assets | 187,878 | 47,258 | 235,136 |
| Liabilities | | | |
| Centrally cleared credit default swap contracts(a) | - | 60,917 | 60,917 |
| Centrally cleared interest rate swap contracts(a) | 1,403,683 | - | 1,403,683 |
| Total liabilities | 1,403,683 | 60,917 | 1,464,600 |
| Total financial and derivative net assets | (1,215,805) | (13,659) | (1,229,464) |
| Total collateral received (pledged)(b) | (1,215,805) | (13,659) | (1,229,464) |
| Net amount(c) | - | - | - |
| (a) | Centrally cleared swaps are included within payable/receivable for variation margin on the Statement of Assets and Liabilities. |
| (b) | In some instances, the actual collateral received and/or pledged may be more than the amount shown due to overcollateralization. |
| (c) | Represents the net amount due from/(to) counterparties in the event of default. |
Security transactions
Security transactions are accounted for on the trade date. Cost is determined and gains (losses) are based upon the specific identification method for both financial statement and federal income tax purposes.
The trade date for senior loans purchased in the primary market is the date on which the loan is allocated. The trade date for senior loans purchased in the secondary market is the date on which the transaction is entered into.
| 88 | Multi-Manager Total Return Bond Strategies Fund | Annual Report 2019 |
Notes to Financial Statements (continued)
August 31, 2019
Income recognition
Interest income is recorded on an accrual basis. Market premiums and discounts, including original issue discounts, are amortized and accreted, respectively, over the expected life of the security on all debt securities, unless otherwise noted. The Fund classifies gains and losses realized on prepayments received on mortgage-backed securities as adjustments to interest income.
The Fund may place a debt security on non-accrual status and reduce related interest income when it becomes probable that the interest will not be collected and the amount of uncollectible interest can be reasonably estimated. A defaulted debt security is removed from non-accrual status when the issuer resumes interest payments or when collectibility of interest is reasonably assured.
Dividend income is recorded on the ex-dividend date.
Corporate actions and dividend income are generally recorded net of any non-reclaimable tax withholdings, on the ex-dividend date or upon receipt of ex-dividend notification in the case of certain foreign securities.
Awards from class action litigation are recorded as a reduction of cost basis if the Fund still owns the applicable securities on the payment date. If the Fund no longer owns the applicable securities, the proceeds are recorded as realized gains.
The value of additional securities received as an income payment through a payment in kind, if any, is recorded as interest income and increases the cost basis of such securities.
The Fund may receive other income from senior loans, including amendment fees, consent fees and commitment fees. These fees are recorded as income when received by the Fund. These amounts are included in Interest Income in the Statement of Operations.
Expenses
General expenses of the Trust are allocated to the Fund and other funds of the Trust based upon relative net assets or other expense allocation methodologies determined by the nature of the expense. Expenses directly attributable to the Fund are charged to the Fund. Expenses directly attributable to a specific class of shares are charged to that share class.
Determination of class net asset value
All income, expenses (other than class-specific expenses, which are charged to that share class, as shown in the Statement of Operations) and realized and unrealized gains (losses) are allocated to each class of the Fund on a daily basis, based on the relative net assets of each class, for purposes of determining the net asset value of each class.
Federal income tax status
The Fund intends to qualify each year as a regulated investment company under Subchapter M of the Internal Revenue Code, as amended, and will distribute substantially all of its investment company taxable income and net capital gain, if any, for its tax year, and as such will not be subject to federal income taxes. In addition, the Fund intends to distribute in each calendar year substantially all of its ordinary income, capital gain net income and certain other amounts, if any, such that the Fund should not be subject to federal excise tax. Therefore, no federal income or excise tax provision is recorded.
Foreign taxes
The Fund may be subject to foreign taxes on income, gains on investments or currency repatriation, a portion of which may be recoverable. The Fund will accrue such taxes and recoveries, as applicable, based upon its current interpretation of tax rules and regulations that exist in the markets in which it invests.
Realized gains in certain countries may be subject to foreign taxes at the Fund level, based on statutory rates. The Fund accrues for such foreign taxes on realized and unrealized gains at the appropriate rate for each jurisdiction, as applicable. The amount, if any, is disclosed as a liability on the Statement of Assets and Liabilities.
Multi-Manager Total Return Bond Strategies Fund | Annual Report 2019
| 89 |
Notes to Financial Statements (continued)
August 31, 2019
Distributions to shareholders
Distributions from net investment income, if any, are declared daily and paid monthly. Net realized capital gains, if any, are distributed at least annually. Income distributions and capital gain distributions are determined in accordance with federal income tax regulations, which may differ from GAAP.
Guarantees and indemnifications
Under the Trust’s organizational documents and, in some cases, by contract, its officers and trustees are indemnified against certain liabilities arising out of the performance of their duties to the Trust or its funds. In addition, certain of the Fund’s contracts with its service providers contain general indemnification clauses. The Fund’s maximum exposure under these arrangements is unknown since the amount of any future claims that may be made against the Fund cannot be determined, and the Fund has no historical basis for predicting the likelihood of any such claims.
Recent accounting pronouncements
Accounting Standards Update 2017-08 Premium Amortization on Purchased Callable Debt Securities
In March 2017, the Financial Accounting Standards Board issued Accounting Standards Update (ASU) No. 2017-08 Premium Amortization on Purchased Callable Debt Securities. ASU No. 2017-08 updates the accounting standards to shorten the amortization period for certain purchased callable debt securities, held at a premium, to be amortized to the earliest call date. The update applies to securities with explicit, noncontingent call features that are callable at fixed prices and on preset dates. The standard is effective for annual periods beginning after December 15, 2018 and interim periods within those fiscal years. Management does not expect the implementation of this guidance to have a material impact on the financial statement amounts and footnote disclosures.
Accounting Standards Update 2018-13 Disclosure Framework - Changes to the Disclosure Requirements for Fair Value Measurement
In August 2018, the Financial Accounting Standards Board issued Accounting Standards Update (ASU) No. 2018-13 Disclosure Framework - Changes to the Disclosure Requirements for Fair Value Measurement. The standard is effective for annual periods beginning after December 15, 2019 and interim periods within those fiscal years, with early adoption permitted. After evaluation, management determined to adopt the ASU effective for the period ended August 31, 2019 and all subsequent periods. As a result of the amendments, management implemented disclosure changes which include removal of the amount and reasons for transfers between Level 1 and Level 2 of the fair value hierarchy, removal of the policy for the timing of transfers between levels, removal of the description of the Level 3 valuation processes, as well as modifications to the measurement uncertainty disclosure.
Disclosure Update and Simplification
In September 2018, the Securities and Exchange Commission (SEC) released Final Rule 33-10532, Disclosure Update and Simplification, which amends certain financial statement disclosure requirements that the SEC determined to be redundant, outdated, or superseded in light of other SEC disclosure requirements, GAAP, or changes in the information environment. As a result of the amendments, management implemented disclosure changes which included removing the components of distributable earnings presented on the Statement of Assets and Liabilities and combining income and gain distributions paid to shareholders as presented on the Statement of Changes in Net Assets. Any values presented to meet prior year requirements were left unchanged. The amendments had no effect on the Fund’s net assets or results of operation.
Note 3. Fees and other transactions with affiliates
Management services fees
The Fund has entered into a Management Agreement with Columbia Management Investment Advisers, LLC (the Investment Manager), a wholly-owned subsidiary of Ameriprise Financial, Inc. (Ameriprise Financial). Under the Management Agreement, the Investment Manager provides the Fund with investment research and advice, as well as administrative and accounting services. The Investment Manager is responsible for the ultimate oversight of investments made by the Fund. The Fund’s subadvisers (see Subadvisory agreements below) have the primary responsibility for the day-to-day portfolio management of
| 90 | Multi-Manager Total Return Bond Strategies Fund | Annual Report 2019 |
Notes to Financial Statements (continued)
August 31, 2019
their portion of the Fund. The management services fee is an annual fee that is equal to a percentage of the Fund’s daily net assets that declines from 0.50% to 0.34% as the Fund’s net assets increase. The effective management services fee rate for the year ended August 31, 2019 was 0.46% of the Fund’s average daily net assets.
The Investment Manager has voluntarily agreed to waive a portion of the management services fee on Fund assets that are invested in affiliated mutual funds, exchange-traded funds and closed-end funds that pay a management services fee, or where applicable, an advisory fee to the Investment Manager. The Investment Manager, in its discretion, may revise or discontinue this arrangement at any time.
Subadvisory agreements
The Investment Manager has entered into Subadvisory Agreements with Loomis Sayles & Company, L.P., PGIM, Inc., the asset management arm of Prudential Financial, TCW Investment Management Company, LLC, and, effective December 6, 2018, Voya Investment Management Co. LLC each of which manage a portion of the assets of the Fund. New investments in the Fund, net of any redemptions, are allocated in accordance with the Investment Manager’s determination, subject to the oversight of the Fund’s Board of Trustees. Each subadviser’s proportionate share of investments in the Fund may also vary due to market fluctuations. The Investment Manager compensates each subadviser to manage the investment of the Fund’s assets.
Compensation of board members
Members of the Board of Trustees who are not officers or employees of the Investment Manager or Ameriprise Financial are compensated for their services to the Fund as disclosed in the Statement of Operations. These members of the Board of Trustees may participate in a Deferred Compensation Plan (the Deferred Plan) which may be terminated at any time. Obligations of the Deferred Plan will be paid solely out of the Fund’s assets, and all amounts payable under the Deferred Plan constitute a general unsecured obligation of the Fund.
Compensation of Chief Compliance Officer
The Board of Trustees has appointed a Chief Compliance Officer to the Fund in accordance with federal securities regulations. As disclosed in the Statement of Operations, a portion of the Chief Compliance Officer’s total compensation is allocated to the Fund, along with other allocations to affiliated registered investment companies managed by the Investment Manager and its affiliates, based on relative net assets.
Transfer agency fees
Under a Transfer and Dividend Disbursing Agent Agreement, Columbia Management Investment Services Corp. (the Transfer Agent), an affiliate of the Investment Manager and a wholly-owned subsidiary of Ameriprise Financial, is responsible for providing transfer agency services to the Fund. The Transfer Agent has contracted with DST Asset Manager Solutions, Inc. (DST) to serve as sub-transfer agent. The Transfer Agent pays the fees of DST for services as sub-transfer agent and DST is not entitled to reimbursement for such fees from the Fund (with the exception of out-of-pocket fees).
The Fund pays the Transfer Agent a monthly transfer agency fee based on the number or the average value of accounts, depending on the type of account. In addition, the Fund pays the Transfer Agent a fee for shareholder services based on the number of accounts or on a percentage of the average aggregate value of the Fund’s shares maintained in omnibus accounts up to the lesser of the amount charged by the financial intermediary or a cap established by the Board of Trustees from time to time.
The Transfer Agent also receives compensation from the Fund for various shareholder services and reimbursements for certain out-of-pocket fees.
For the year ended August 31, 2019, the Fund’s effective transfer agency fee rates as a percentage of average daily net assets of each class were as follows:
| | Effective rate (%) |
| Class A | 0.05 |
| Institutional Class | 0.05 |
Multi-Manager Total Return Bond Strategies Fund | Annual Report 2019
| 91 |
Notes to Financial Statements (continued)
August 31, 2019
Distribution and service fees
The Fund has entered into an agreement with Columbia Management Investment Distributors, Inc. (the Distributor), an affiliate of the Investment Manager and a wholly-owned subsidiary of Ameriprise Financial, for distribution and shareholder services. The Board of Trustees has approved, and the Fund has adopted, distribution and shareholder service plans (the Plans) applicable to certain share classes, which set the distribution and service fees for the Fund. These fees are calculated daily and are intended to compensate the Distributor and/or eligible selling and/or servicing agents for selling shares of the Fund and providing services to investors.
The Fund may pay distribution fee of up to 0.25% of the Fund’s average daily net assets attributable to Class A shares and a service fee of up to 0.25% of the Fund’s average daily net assets attributable to Class A shares, provided that the aggregate fee shall not exceed 0.25% of the Fund’s average daily net assets attributable to Class A shares.
Expenses waived/reimbursed by the Investment Manager and its affiliates
The Investment Manager and certain of its affiliates have contractually agreed to waive fees and/or reimburse expenses (excluding certain fees and expenses described below) for the period(s) disclosed below, unless sooner terminated at the sole discretion of the Board of Trustees, so that the Fund’s net operating expenses, after giving effect to fees waived/expenses reimbursed and any balance credits and/or overdraft charges from the Fund’s custodian, do not exceed the following annual rate(s) as a percentage of the class’ average daily net assets:
| | July 1, 2019
through
December 31, 2020 | January 1, 2019
through
June 30, 2019 | Prior to
January 1, 2019 |
| Class A | 0.74% | 0.82% | 0.86% |
| Institutional Class | 0.49 | 0.57 | 0.61 |
Under the agreement governing these fee waivers and/or expense reimbursement arrangements, the following fees and expenses are excluded from the waiver/reimbursement commitment, and therefore will be paid by the Fund, if applicable: taxes (including foreign transaction taxes), expenses associated with investments in affiliated and non-affiliated pooled investment vehicles (including mutual funds and exchange-traded funds), transaction costs and brokerage commissions, costs related to any securities lending program, dividend expenses associated with securities sold short, inverse floater program fees and expenses, transaction charges and interest on borrowed money, interest, infrequent and/or unusual expenses and any other expenses the exclusion of which is specifically approved by the Board of Trustees. This agreement may be modified or amended only with approval from the Investment Manager, certain of its affiliates and the Fund. In addition to the contractual agreement, the Investment Manager and certain of its affiliates have voluntarily agreed to waive fees and/or reimburse Fund expenses (excluding certain fees and expenses described above) so that Fund level expenses (expenses directly attributable to the Fund and not to a specific share class) are waived proportionately across all share classes, but the Fund’s net operating expenses shall not exceed the contractual annual rates listed in the table above. This arrangement may be revised or discontinued at any time. Any fees waived and/or expenses reimbursed under the expense reimbursement arrangements described above are not recoverable by the Investment Manager or its affiliates in future periods.
Note 4. Federal tax information
The timing and character of income and capital gain distributions are determined in accordance with income tax regulations, which may differ from GAAP because of temporary or permanent book to tax differences.
At August 31, 2019, these differences were primarily due to differing treatment for deferral/reversal of wash sale losses, trustees’ deferred compensation, derivative investments, tax straddles, distributions, non-deductible expenses, swap investments, principal and/or interest of fixed income securities, and foreign currency transactions. To the extent these differences were permanent, reclassifications were made among the components of the Fund’s net assets. Temporary differences do not require reclassifications.
| 92 | Multi-Manager Total Return Bond Strategies Fund | Annual Report 2019 |
Notes to Financial Statements (continued)
August 31, 2019
The following reclassifications were made:
Undistributed net
investment
income ($) | Accumulated
net realized
gain ($) | Paid in
capital ($) |
| 2,482,213 | (2,482,213) | — |
Net investment income (loss) and net realized gains (losses), as disclosed in the Statement of Operations, and net assets were not affected by this reclassification.
The tax character of distributions paid during the years indicated was as follows:
| Year Ended August 31, 2019 | Year Ended August 31, 2018 |
Ordinary
income ($) | Long-term
capital gains ($) | Total ($) | Ordinary
income ($) | Long-term
capital gains ($) | Total ($) |
| 251,092,588 | — | 251,092,588 | 195,850,785 | 2,908,510 | 198,759,295 |
Short-term capital gain distributions, if any, are considered ordinary income distributions for tax purposes.
At August 31, 2019, the components of distributable earnings on a tax basis were as follows:
Undistributed
ordinary income ($) | Undistributed
long-term
capital gains ($) | Capital loss
carryforwards ($) | Net unrealized
appreciation ($) |
| 26,202,605 | 24,940,728 | — | 229,787,561 |
At August 31, 2019, the cost of all investments for federal income tax purposes along with the aggregate gross unrealized appreciation and depreciation based on that cost was:
Federal
tax cost ($) | Gross unrealized
appreciation ($) | Gross unrealized
(depreciation) ($) | Net unrealized
appreciation ($) |
| 8,439,114,740 | 274,606,395 | (44,818,834) | 229,787,561 |
Tax cost of investments and unrealized appreciation/(depreciation) may also include timing differences that do not constitute adjustments to tax basis.
The following capital loss carryforwards, determined at August 31, 2019, may be available to reduce taxable income arising from future net realized gains on investments, if any, to the extent permitted by the Internal Revenue Code. Capital loss carryforwards with no expiration are required to be utilized prior to any capital losses which carry an expiration date. As a result of this ordering rule, capital loss carryforwards which carry an expiration date may be more likely to expire unused. In addition, for the year ended August 31, 2019, capital loss carryforwards utilized and expired unused, if any, were as follows:
No expiration
short-term ($) | No expiration
long-term ($) | Total ($) | Utilized ($) | Expired ($) |
| — | — | — | 120,451,960 | — |
Management of the Fund has concluded that there are no significant uncertain tax positions in the Fund that would require recognition in the financial statements. However, management’s conclusion may be subject to review and adjustment at a later date based on factors including, but not limited to, new tax laws, regulations, and administrative interpretations (including relevant court decisions). Generally, the Fund’s federal tax returns for the prior three fiscal years remain subject to examination by the Internal Revenue Service.
Note 5. Portfolio information
The cost of purchases and proceeds from sales of securities, excluding short-term investments and derivatives, if any, aggregated to $17,223,686,208 and $17,055,605,214, respectively, for the year ended August 31, 2019, of which $13,596,630,093 and $13,167,507,744, respectively, were U.S. government securities. The amount of purchase and sale activity impacts the portfolio turnover rate reported in the Financial Highlights.
Multi-Manager Total Return Bond Strategies Fund | Annual Report 2019
| 93 |
Notes to Financial Statements (continued)
August 31, 2019
Note 6. Affiliated money market fund
The Fund invests in Columbia Short-Term Cash Fund, an affiliated money market fund established for the exclusive use by the Fund and other affiliated funds (the Affiliated MMF). The income earned by the Fund from such investments is included as Dividends - affiliated issuers in the Statement of Operations. As an investing fund, the Fund indirectly bears its proportionate share of the expenses of the Affiliated MMF. The Affiliated MMF prices its shares with a floating net asset value. In addition, the Board of Trustees of the Affiliated MMF may impose a fee on redemptions (sometimes referred to as a liquidity fee) or temporarily suspend redemptions (sometimes referred to as imposing a redemption gate) in the event its liquidity falls below regulatory limits.
Note 7. Interfund lending
Pursuant to an exemptive order granted by the Securities and Exchange Commission, the Fund participates in a program (the Interfund Program) allowing each participating Columbia Fund (each, a Participating Fund) to lend money directly to and, except for closed-end funds and money market funds, borrow money directly from other Participating Funds for temporary purposes. The amounts eligible for borrowing and lending under the Interfund Program are subject to certain restrictions.
Interfund loans are subject to the risk that the borrowing fund could be unable to repay the loan when due, and a delay in repayment to the lending fund could result in lost opportunities and/or additional lending costs. The exemptive order is subject to conditions intended to mitigate conflicts of interest arising from the Investment Manager’s relationship with each Participating Fund.
The Fund’s activity in the Interfund Program during the year ended August 31, 2019 was as follows:
| Borrower or lender | Average loan
balance ($) | Weighted average
interest rate (%) | Days
outstanding |
| Borrower | 1,300,000 | 2.83 | 2 |
Interest expense incurred by the Fund is recorded as Interfund lending in the Statement of Operations. The Fund had no outstanding interfund loans at August 31, 2019.
Note 8. Line of credit
The Fund has access to a revolving credit facility with a syndicate of banks led by Citibank, N.A., HSBC Bank USA, N.A. and JPMorgan Chase Bank, N.A. whereby the Fund may borrow for the temporary funding of shareholder redemptions or for other temporary or emergency purposes. The credit facility, which is a collective agreement between the Fund and certain other funds managed by the Investment Manager or an affiliated investment manager, severally and not jointly, permits collective borrowings up to $1 billion. Interest is charged to each participating fund based on its borrowings at a rate equal to the higher of (i) the federal funds effective rate, (ii) the one-month LIBOR rate and (iii) the overnight bank funding rate, plus in each case, 1.00%. Each borrowing under the credit facility matures no later than 60 days after the date of borrowing. The Fund also pays a commitment fee equal to its pro rata share of the unused amount of the credit facility at a rate of 0.15% per annum. The commitment fee is included in other expenses in the Statement of Operations. This agreement expires annually in December unless extended or renewed.
The Fund had no borrowings during the year ended August 31, 2019.
Note 9. Significant risks
Credit risk
Credit risk is the risk that the value of debt securities in the Fund’s portfolio may decline because the issuer defaults or otherwise becomes unable or unwilling, or is perceived to be unable or unwilling, to honor its financial obligations, such as making payments to the Fund when due. Rating agencies assign credit ratings to certain debt instruments to indicate their credit risk. Lower rated or unrated debt instruments held by the Fund may present increased credit risk as compared to higher-rated debt instruments.
| 94 | Multi-Manager Total Return Bond Strategies Fund | Annual Report 2019 |
Notes to Financial Statements (continued)
August 31, 2019
Derivatives risk
Losses involving derivative instruments may be substantial, because a relatively small movement in the underlying reference (which is generally the price, rate or other economic indicator associated with a security(ies), commodity, currency or index or other instrument or asset) may result in a substantial loss for the Fund. In addition to the potential for increased losses, the use of derivative instruments may lead to increased volatility within the Fund. Derivatives will typically increase the Fund’s exposure to principal risks to which it is otherwise exposed, and may expose the Fund to additional risks, including correlation risk, counterparty risk, hedging risk, leverage risk, liquidity risk and pricing risk.
Interest rate risk
Interest rate risk is the risk of losses attributable to changes in interest rates. In general, if prevailing interest rates rise, the values of debt securities tend to fall, and if interest rates fall, the values of debt securities tend to rise. Actions by governments and central banking authorities can result in increases in interest rates. Increasing interest rates may negatively affect the value of debt securities held by the Fund, resulting in a negative impact on the Fund’s performance and net asset value per share. In general, the longer the maturity or duration of a debt security, the greater its sensitivity to changes in interest rates.
Liquidity risk
Liquidity risk is the risk associated with a lack of marketability of investments which may make it difficult to sell the investment at a desirable time or price. Changing regulatory, market or other conditions or environments (for example, the interest rate or credit environments) may adversely affect the liquidity of the Fund’s investments. The Fund may have to accept a lower selling price for the holding, sell other investments, or forego another, more appealing investment opportunity. Generally, the less liquid the market at the time the Fund sells a portfolio investment, the greater the risk of loss or decline of value to the Fund. A less liquid market can lead to an increase in Fund redemptions, which may negatively impact Fund performance and net asset value per share, including, for example, if the Fund is forced to sell securities in a down market.
Mortgage- and other asset-backed securities risk
The value of any mortgage-backed and other asset-backed securities held by the Fund may be affected by, among other things, changes or perceived changes in: interest rates; factors concerning the interests in and structure of the issuer or the originator of the mortgages or other assets; the creditworthiness of the entities that provide any supporting letters of credit, surety bonds or other credit enhancements; or the market’s assessment of the quality of underlying assets. Payment of principal and interest on some mortgage-backed securities (but not the market value of the securities themselves) may be guaranteed by the full faith and credit of a particular U.S. Government agency, authority, enterprise or instrumentality, and some, but not all, are also insured or guaranteed by the U.S. Government. Mortgage-backed securities issued by non-governmental issuers (such as commercial banks, savings and loan institutions, private mortgage insurance companies, mortgage bankers and other secondary market issuers) may entail greater risk than obligations guaranteed by the U.S. Government. Mortgage- and other asset-backed securities are subject to liquidity risk and prepayment risk. A decline or flattening of housing values may cause delinquencies in the mortgages (especially sub-prime or non-prime mortgages) underlying mortgage-backed securities and thereby adversely affect the ability of the mortgage-backed securities issuer to make principal and/or interest payments to mortgage-backed securities holders, including the Fund. Rising or high interest rates tend to extend the duration of mortgage- and other asset-backed securities, making their prices more volatile and more sensitive to changes in interest rates.
Shareholder concentration risk
At August 31, 2019, affiliated shareholders of record owned 100.0% of the outstanding shares of the Fund in one or more accounts. Subscription and redemption activity by concentrated accounts may have a significant effect on the operations of the Fund. In the case of a large redemption, the Fund may be forced to sell investments at inopportune times, including its liquid positions, which may result in Fund losses and the Fund holding a higher percentage of less liquid positions. Large redemptions could result in decreased economies of scale and increased operating expenses for non-redeeming Fund shareholders.
Multi-Manager Total Return Bond Strategies Fund | Annual Report 2019
| 95 |
Notes to Financial Statements (continued)
August 31, 2019
Note 10. Subsequent events
Management has evaluated the events and transactions that have occurred through the date the financial statements were issued and noted no items requiring adjustment of the financial statements or additional disclosure.
Note 11. Information regarding pending and settled legal proceedings
Ameriprise Financial and certain of its affiliates have historically been involved in a number of legal, arbitration and regulatory proceedings, including routine litigation, class actions, and governmental actions, concerning matters arising in connection with the conduct of their business activities. Ameriprise Financial believes that the Fund is not currently the subject of, and that neither Ameriprise Financial nor any of its affiliates are the subject of, any pending legal, arbitration or regulatory proceedings that are likely to have a material adverse effect on the Fund or the ability of Ameriprise Financial or its affiliates to perform under their contracts with the Fund. Ameriprise Financial is required to make quarterly (10-Q), annual (10-K) and, as necessary, 8-K filings with the Securities and Exchange Commission (SEC) on legal and regulatory matters that relate to Ameriprise Financial and its affiliates. Copies of these filings may be obtained by accessing the SEC website at www.sec.gov.
There can be no assurance that these matters, or the adverse publicity associated with them, will not result in increased Fund redemptions, reduced sale of Fund shares or other adverse consequences to the Fund. Further, although we believe proceedings are not likely to have a material adverse effect on the Fund or the ability of Ameriprise Financial or its affiliates to perform under their contracts with the Fund, these proceedings are subject to uncertainties and, as such, we are unable to estimate the possible loss or range of loss that may result. An adverse outcome in one or more of these proceedings could result in adverse judgments, settlements, fines, penalties or other relief that could have a material adverse effect on the consolidated financial condition or results of operations of Ameriprise Financial.
| 96 | Multi-Manager Total Return Bond Strategies Fund | Annual Report 2019 |
Report of Independent Registered Public Accounting Firm
To the Board of Trustees of Columbia Funds Series Trust I and Shareholders of Multi-Manager Total Return Bond Strategies Fund
Opinion on the Financial Statements
We have audited the accompanying statement of assets and liabilities, including the portfolio of investments, of Multi-Manager Total Return Bond Strategies Fund (one of the funds constituting Columbia Funds Series Trust I, hereafter referred to as the “Fund”) as of August 31, 2019, the related statement of operations for the year ended August 31, 2019, the statement of changes in net assets for each of the two years in the period ended August 31, 2019, including the related notes, and the financial highlights for each of the periods indicated therein (collectively referred to as the “financial statements”). In our opinion, the financial statements present fairly, in all material respects, the financial position of the Fund as of August 31, 2019, the results of its operations for the year then ended, the changes in its net assets for each of the two years in the period ended August 31, 2019 and the financial highlights for each of the periods indicated therein in conformity with accounting principles generally accepted in the United States of America.
Basis for Opinion
These financial statements are the responsibility of the Fund’s management. Our responsibility is to express an opinion on the Fund’s financial statements based on our audits. We are a public accounting firm registered with the Public Company Accounting Oversight Board (United States) (PCAOB) and are required to be independent with respect to the Fund in accordance with the U.S. federal securities laws and the applicable rules and regulations of the Securities and Exchange Commission and the PCAOB.
We conducted our audits of these financial statements in accordance with the standards of the PCAOB. Those standards require that we plan and perform the audit to obtain reasonable assurance about whether the financial statements are free of material misstatement, whether due to error or fraud.
Our audits included performing procedures to assess the risks of material misstatement of the financial statements, whether due to error or fraud, and performing procedures that respond to those risks. Such procedures included examining, on a test basis, evidence regarding the amounts and disclosures in the financial statements. Our audits also included evaluating the accounting principles used and significant estimates made by management, as well as evaluating the overall presentation of the financial statements. Our procedures included confirmation of securities owned as of August 31, 2019, by correspondence with the custodian, transfer agent, agent banks, and brokers; when replies were not received from brokers, we performed other audit procedures. We believe that our audits provide a reasonable basis for our opinion.
/s/PricewaterhouseCoopers LLP
Minneapolis, Minnesota
October 24, 2019
We have served as the auditor of one or more investment companies within the Columbia Funds Complex since 1977.
Multi-Manager Total Return Bond Strategies Fund | Annual Report 2019
| 97 |
Federal Income Tax Information
(Unaudited)
The Fund hereby designates the following tax attributes for the fiscal year ended August 31, 2019. Shareholders will be notified in early 2020 of the amounts for use in preparing 2019 income tax returns.
Capital
gain
dividend | |
| $26,187,764 | |
Capital gain dividend. The Fund designates as a capital gain dividend the amount reflected above, or if subsequently determined to be different, the net capital gain of such fiscal period.
TRUSTEES AND OFFICERS
The Board oversees the Fund’s operations and appoints officers who are responsible for day-to-day business decisions based on policies set by the Board. The following table provides basic biographical information about the Fund’s Trustees as of the printing of this report, including their principal occupations during the past five years, although specific titles for individuals may have varied over the period. The year set forth beneath Length of Service in the table below is the year in which the Trustee was first appointed or elected as Trustee to any Fund currently in the Columbia Funds Complex or a predecessor thereof. Under current Board policy, members serve terms of indefinite duration.
Independent trustees
| Name, address, year of birth | Position held with the Trust and length of service | Principal occupation(s) during the past five years and other relevant professional experience | Number of Funds in the Columbia Fund Complex overseen | Other directorships held by Trustee during the past five years |
Janet Langford Carrig
c/o Columbia Management
Investment Advisers, LLC
225 Franklin Street
Mail Drop BX32 05228
Boston, MA 02110
1957 | Trustee
1996 | Senior Vice President, General Counsel and Corporate Secretary, ConocoPhillips (independent energy company), September 2007-October 2018 | 70 | None |
Douglas A. Hacker
c/o Columbia Management
Investment Advisers, LLC
225 Franklin Street
Mail Drop BX32 05228
Boston, MA 02110
1955 | Trustee and Chairman of the Board
1996 | Independent business executive since May 2006; Executive Vice President — Strategy of United Airlines, December 2002-May 2006; President of UAL Loyalty Services (airline marketing company), September 2001-December 2002; Executive Vice President and Chief Financial Officer of United Airlines, July 1999-September 2001 | 70 | Spartan Nash Company, (food distributor); former Director, Nash Finch Company (food distributor), 2005-2013; Aircastle Limited (aircraft leasing); former Director, SeaCube Container Leasing Ltd. (container leasing), 2010-2013; and Travelport Worldwide Limited (travel information technology) |
Nancy T. Lukitsh
c/o Columbia Management
Investment Advisers, LLC
225 Franklin Street
Mail Drop BX32 05228
Boston, MA 02110
1956 | Trustee
2011 | Senior Vice President, Partner and Director of Marketing, Wellington Management Company, LLP (investment adviser), 1997-2010; Chair, Wellington Management Portfolios (commingled non-U.S. investment pools), 2007-2010; Director, Wellington Trust Company, NA and other Wellington affiliates, 1997-2010 | 70 | None |
| 98 | Multi-Manager Total Return Bond Strategies Fund | Annual Report 2019 |
TRUSTEES AND OFFICERS (continued)
Independent trustees (continued)
| Name, address, year of birth | Position held with the Trust and length of service | Principal occupation(s) during the past five years and other relevant professional experience | Number of Funds in the Columbia Fund Complex overseen | Other directorships held by Trustee during the past five years |
David M. Moffett
c/o Columbia Management
Investment Advisers, LLC
225 Franklin Street
Mail Drop BX32 05228
Boston, MA 02110
1952 | Trustee
2011 | Retired. Consultant to Bridgewater and Associates | 70 | Director, CSX Corporation (transportation suppliers); Genworth Financial, Inc. (financial and insurance products and services); PayPal Holdings Inc. (payment and data processing services); Trustee, University of Oklahoma Foundation; former Director, eBay Inc. (online trading community), 2007-2015; and former Director, CIT Bank, CIT Group Inc. (commercial and consumer finance), 2010-2016 |
John J. Neuhauser
c/o Columbia Management
Investment Advisers, LLC
225 Franklin Street
Mail Drop BX32 05228
Boston, MA 02110
1943 | Trustee
1984 | President, Saint Michael’s College, August 2007-June 2018; Director or Trustee of several non-profit organizations, including University of Vermont Medical Center; Academic Vice President and Dean of Faculties, Boston College, August 1999-October 2005; University Professor, Boston College, November 2005-August 2007 | 70 | Liberty All-Star Equity Fund and Liberty All- Star Growth Fund (closed-end funds) |
Patrick J. Simpson
c/o Columbia Management
Investment Advisers, LLC
225 Franklin Street
Mail Drop BX32 05228
Boston, MA 02110
1944 | Trustee
2000 | Of Counsel, Perkins Coie LLP (law firm) since 2015; Partner, Perkins Coie LLP, 1988-2014 | 70 | Former Director, M Fund, Inc. (M Funds mutual fund family), July 2018-July 2019 |
Anne-Lee Verville
c/o Columbia Management
Investment Advisers, LLC
225 Franklin Street
Mail Drop BX32 05228
Boston, MA 02110
1945 | Trustee
1998 | Retired. General Manager, Global Education Industry, 1994-1997, President – Application Systems Division, 1991-1994, Chief Financial Officer – US Marketing & Services, 1988-1991, and Chief Information Officer, 1987-1988, IBM Corporation (computer and technology) | 70 | Former Director, Enesco Group, Inc. (producer of giftware and home and garden decor products), 2001-2006 |
Consultants to the Independent Trustees*
| Name, address, year of birth | Position held with the Trust and length of service | Principal occupation(s) during the past five years and other relevant professional experience | Number of Funds in the Columbia Funds complex overseen | Other directorships held by Trustee during the past five years |
J. Kevin Connaughton
c/o Columbia
Management Investment
Advisers, LLC,
225 Franklin Street
Mail Drop BX32 05228,
Boston, MA 02110
1964 | Independent Trustee Consultant
2016 | Independent Trustee Consultant, Columbia Funds since March 2016; Adjunct Professor of Finance, Bentley University since November 2017; Managing Director and General Manager of Mutual Fund Products, Columbia Management Investment Advisers, LLC, May 2010-February 2015; President, Columbia Funds, 2009-2015; and senior officer of Columbia Funds and affiliated funds, 2003-2015 | 70 | Director, The Autism Project since March 2015; former Trustee, New Century Portfolios, March 2015-December 2017; formerly on Board of Governors, Gateway Healthcare, January 2016 – December 2017 |
Multi-Manager Total Return Bond Strategies Fund | Annual Report 2019
| 99 |
TRUSTEES AND OFFICERS (continued)
Consultants to the Independent Trustees* (continued)
| Name, address, year of birth | Position held with the Trust and length of service | Principal occupation(s) during the past five years and other relevant professional experience | Number of Funds in the Columbia Funds complex overseen | Other directorships held by Trustee during the past five years |
Olive Darragh
c/o Columbia
Management Investment
Advisers, LLC,
225 Franklin Street,
Mail Drop BX32 05228,
Boston, MA 02110
1962 | Independent Trustee Consultant 2019 | Independent Trustee Consultant, Columbia Funds since June 2019; Managing Director of Darragh Inc. (a strategy and talent management consulting firm) since 2010; Founder and CEO, Zolio (an investment management talent identification platform) since 2004; Partner, Tudor Investments, 2004-2010; Senior Partner, McKinsey & Company, 2001-2004 | 70 | Director, University of Edinburgh Business School; former Director, Boston Public Library Foundation |
Natalie A. Trunow
c/o Columbia
Management Investment
Advisers, LLC,
225 Franklin Street
Mail Drop BX32 05228,
Boston, MA 02110
1967 | Independent Trustee Consultant
2016 | Independent Trustee Consultant, Columbia Funds since September 2016; Chief Executive Officer, Millennial Portfolio Solutions LLC (asset management and consulting services) since January 2016; Director of Investments, Casey Family Programs, April 2016-September 2016; Senior Vice President and Chief Investment Officer, Calvert Investments, August 2008-January 2016; Section Head and Portfolio Manager, General Motors Asset Management, June 1997-August 2008 | 70 | Director, Health Services for Children with Special Needs, Inc.; Director, Consumer Credit Counseling Services (formerly Guidewell Financial Solutions) |
| * | J. Kevin Connaughton was appointed consultant to the Independent Trustees effective March 1, 2016. Olive Darragh was appointed consultant to the Independent Trustees effective June 10, 2019. Natalie A. Trunow was appointed consultant to the Independent Trustees effective September 1, 2016. Shareholders of the Funds are expected to be asked to elect each of Mr. Connaughton, Ms. Darragh and Ms. Trunow as a Trustee at a future shareholder meeting. |
Interested trustee affiliated with Investment Manager*
| Name, address, year of birth | Position held with the Trust and length of service | Principal occupation(s) during the past five years and other relevant professional experience | Number of Funds in the Columbia Funds Complex overseen | Other directorships held by Trustee during the past five years |
William F. Truscott
c/o Columbia Management
Investment Advisers, LLC
225 Franklin Street
Boston, MA 02110
1960 | Trustee
2012 | Chairman of the Board and President, Columbia Management Investment Advisers, LLC since May 2010 and February 2012, respectively; Chief Executive Officer, Global Asset Management, Ameriprise Financial, Inc. since September 2012 (previously Chief Executive Officer, U.S. Asset Management & President, Annuities, May 2010-September 2012); Director and Chief Executive Officer, Columbia Management Investment Distributors, Inc. since May 2010 and February 2012, respectively; Chairman of the Board and Chief Executive Officer, RiverSource Distributors, Inc. since 2006; Director, Threadneedle Asset Management Holdings, SARL since 2014; President and Chief Executive Officer, Ameriprise Certificate Company, 2006-August 2012 | 192 | Chairman of the Board, Columbia Management Investment Advisers, LLC since May 2010; Director, Columbia Management Investment Distributors, Inc. since May 2010; former Director, Ameriprise Certificate Company, August 2006 - January 2013 |
| * | Interested person (as defined under the 1940 Act) by reason of being an officer, director, security holder and/or employee of the Investment Manager or Ameriprise Financial. |
The Statement of Additional Information has additional information about the Fund’s Board members and is available, without charge, upon request by calling 800.345.6611, visiting columbiathreadneedleus.com/investor/ or contacting your financial intermediary.
| 100 | Multi-Manager Total Return Bond Strategies Fund | Annual Report 2019 |
TRUSTEES AND OFFICERS (continued)
The Board has appointed officers who are responsible for day-to-day business decisions based on policies it has established. The officers serve at the pleasure of the Board. The following table provides basic information about the Officers of the Fund as of the printing of this report, including principal occupations during the past five years, although their specific titles may have varied over the period. In addition to Mr. Truscott, who is Senior Vice President, the Fund’s other officers are:
Name,
address and
year of birth | Position and year
first appointed to
position for any Fund
in the Columbia
Funds complex or a
predecessor thereof | Principal occupation(s) during past five years |
Christopher O. Petersen
5228 Ameriprise
Financial Center
Minneapolis, MN 55474
Born 1970 | President and Principal Executive Officer (2015) | Vice President and Lead Chief Counsel, Ameriprise Financial, Inc. since January 2015 (previously Vice President and Chief Counsel, January 2010 - December 2014; officer of Columbia Funds and affiliated funds since 2007. |
Michael G. Clarke
225 Franklin Street
Boston, MA 02110
Born 1969 | Chief Financial Officer (Principal Financial Officer) (2009) and Senior Vice President (2019) | Vice President, Head of North American Operations, and Co-Head of Global Operations, Columbia Management Investment Advisers, LLC, since June 2019 (previously Vice President – Accounting and Tax, May 2010 - May 2019); senior officer of Columbia Funds and affiliated funds since 2002 (previously Treasurer and Chief Accounting Officer, January 2009 - January 2019 and December 2015 - January 2019, respectively). |
Joseph Beranek
5890 Ameriprise
Financial Center
Minneapolis, MN 55474
Born 1965 | Treasurer and Chief Accounting Officer (Principal Accounting Officer) (2019) | Vice President — Mutual Fund Accounting and Financial Reporting, Columbia Management Investment Advisers, LLC, since December 2018 and March 2017, respectively (previously Vice President — Pricing and Corporate Actions, May 2010 - March 2017). |
Paul B. Goucher
485 Lexington Avenue
New York, NY 10017
Born 1968 | Senior Vice President (2011) and Assistant Secretary (2008) | Senior Vice President and Assistant General Counsel, Ameriprise Financial, Inc. since January 2017 (previously Vice President and Lead Chief Counsel, November 2008 - January 2017 and January 2013 - January 2017, respectively); Vice President, Chief Legal Officer and Assistant Secretary, Columbia Management Investment Advisers, LLC since March 2015 (previously Vice President and Assistant Secretary, May 2010 – March 2015). |
Thomas P. McGuire
225 Franklin Street
Boston, MA 02110
Born 1972 | Senior Vice President and Chief Compliance Officer (2012) | Vice President — Asset Management Compliance, Ameriprise Financial, Inc., since May 2010; Chief Compliance Officer, Ameriprise Certificate Company since September 2010. |
Colin Moore
225 Franklin Street
Boston, MA 02110
Born 1958 | Senior Vice President (2010) | Executive Vice President and Global Chief Investment Officer, Ameriprise Financial, Inc., since July 2013; Executive Vice President and Global Chief Investment Officer, Columbia Management Investment Advisers, LLC since July 2013. |
Ryan C. Larrenaga
225 Franklin Street
Boston, MA 02110
Born 1970 | Senior Vice President (2017), Chief Legal Officer (2017), and Secretary (2015) | Vice President and Chief Counsel, Ameriprise Financial, Inc. since August 2018 (previously Vice President and Group Counsel, August 2011 - August 2018); officer of Columbia Funds and affiliated funds since 2005. |
Michael E. DeFao
225 Franklin Street
Boston, MA 02110
Born 1968 | Vice President (2011) and Assistant Secretary (2010) | Vice President and Chief Counsel, Ameriprise Financial, Inc. since May 2010. |
Lyn Kephart-Strong
5228 Ameriprise
Financial Center
Minneapolis, MN 55474
Born 1960 | Vice President (2015) | President, Columbia Management Investment Services Corp. since October 2014; Vice President & Resolution Officer, Ameriprise Trust Company since August 2009. |
Multi-Manager Total Return Bond Strategies Fund | Annual Report 2019
| 101 |
Board Consideration and Approval of Management
and Subadvisory Agreements
On June 12, 2019, the Board of Trustees (the Board) and the Trustees who are not interested persons (as defined in the Investment Company Act of 1940) (the Independent Trustees) of Columbia Funds Series Trust I (the Trust) unanimously approved the continuation of the Management Agreement (the Management Agreement) with Columbia Management Investment Advisers, LLC (the Investment Manager) and the Subadvisory Agreements (the Subadvisory Agreements) between the Investment Manager and Loomis, Sayles & Company, L.P., PGIM, Inc., TCW Investment Management Company LLC and Voya Investment Management Co. LLC (the Subadvisers) with respect to Multi-Manager Total Return Bond Strategies Fund (the Fund), a series of the Trust. As detailed below, the Board’s Advisory Fees and Expenses Committee (the Committee) and the Board met on multiple occasions to review and discuss, among themselves, with the management team of the Investment Manager and with an independent fee consultant, materials provided by the Investment Manager, the independent fee consultant and others before determining to approve the continuation of the Management Agreement and the Subadvisory Agreements (collectively, the Agreements).
In connection with their deliberations regarding the continuation of the Management Agreement and the Subadvisory Agreements, the Committee and the Board evaluated materials requested from the Investment Manager regarding the Fund and the Agreements, and discussed these materials with representatives of the Investment Manager at Committee meetings held on March 5, 2019, April 25, 2019 and June 11, 2019 and at Board meetings held on March 6, 2019 and June 12, 2019. In addition, the Board and its various committees consider matters bearing on the Agreements at other meetings throughout the year and in prior years and meet regularly with senior management of the Trust and the Investment Manager. Through the Board’s Investment Oversight Committees, Trustees also meet with selected portfolio managers of the funds the Trustees oversee and with other investment personnel at various times throughout the year. The Committee and the Board also consulted with the independent fee consultant, Fund counsel and the Independent Trustees’ independent legal counsel, who advised on various matters with respect to the Committee’s and the Board’s considerations and otherwise assisted the Committee and the Board in their deliberations. On June 11, 2019, the Committee recommended that the Board approve the continuation of the Management Agreement and the Subadvisory Agreements. On June 12, 2019, the Board, including the Independent Trustees, voting separately, unanimously approved the continuation of the Management Agreement and the Subadvisory Agreements for the Fund.
The Committee and the Board considered all information that they, their legal counsel or the Investment Manager believed reasonably necessary to evaluate and to determine whether to recommend for approval or approve the continuation of the Management Agreement and the Subadvisory Agreements. The information and factors considered by the Committee and the Board in recommending for approval or approving the continuation of the Management Agreement and the Subadvisory Agreements for the Fund included the following:
| • | Information on the investment performance of the Fund relative to the performance of a group of mutual funds determined to be comparable to the Fund by an independent third-party data provider, as well as performance relative to benchmarks; |
| • | Information on the Fund’s management fees and total expenses, including information comparing the Fund’s expenses to those of a group of comparable mutual funds, as determined by the independent third-party data provider; |
| • | The Investment Manager’s agreement to contractually limit or cap total operating expenses for the Fund through December 31, 2020 so that total operating expenses (excluding certain fees and expenses, such as transaction costs and certain other investment related expenses, interest, taxes, acquired fund fees and expenses, and infrequent and/or unusual expenses) would not exceed a specified annual rate, as a percentage of the Fund’s net assets; |
| • | The terms and conditions of the Agreements; |
| • | The subadvisory fees payable by the Investment Manager under the Subadvisory Agreements; |
| • | The current and proposed terms and conditions of other agreements and arrangements with affiliates of the Investment Manager relating to the operations of the Fund, including agreements with respect to the provision of distribution, transfer agency and shareholder services to the Fund; |
| • | Descriptions of various functions performed by the Investment Manager and the Subadvisers under the Agreements, including portfolio management and portfolio trading practices; |
| 102 | Multi-Manager Total Return Bond Strategies Fund | Annual Report 2019 |
Board Consideration and Approval of Management
and Subadvisory Agreements (continued)
| • | Information regarding the management fees of similarly-managed portfolios of other clients of the Investment Manager, including institutional accounts and collective trusts; |
| • | Information regarding the reputation, regulatory history and resources of the Investment Manager and Subadvisers, including information regarding senior management, portfolio managers and other personnel; |
| • | Information regarding the capabilities of the Investment Manager and the Subadvisers with respect to compliance monitoring services, including an assessment of the Investment Manager’s and the Subadvisers’ compliance systems by the Fund’s Chief Compliance Officer; and |
| • | The profitability to the Investment Manager and its affiliates from their relationships with the Fund. |
Nature, extent and quality of services provided under the Agreements
The Committee and the Board considered the nature, extent and quality of services provided to the Fund by the Investment Manager, the Subadvisers and the Investment Manager’s affiliates under the Agreements and under separate agreements for the provision of transfer agency and shareholder services, and the resources dedicated to the Fund and the other Columbia Funds by the Investment Manager, the Subadvisers and the Investment Manager’s affiliates. The Committee and the Board considered, among other things, the Investment Manager’s ability to attract, motivate and retain highly qualified research, advisory and supervisory investment professionals (including compensation programs for personnel involved in fund management, reputation and other attributes), the portfolio management services provided by those investment professionals, and the quality of the Investment Manager’s and the Subadvisers’ investment research capabilities and trade execution services. The Committee and the Board also considered the potential benefits to shareholders of investing in a mutual fund that is part of a fund complex offering exposure to a variety of asset classes and investment disciplines and providing a variety of fund and shareholder services.
The Committee and the Board also considered the professional experience and qualifications of the senior personnel of the Investment Manager and the Subadvisers, which included consideration of the Subadvisers’ experience with funds using an investment strategy similar to that used by the Subadvisers for the Fund. The Committee and the Board noted the compliance programs of and the compliance-related resources provided to the Fund by the Investment Manager and its affiliates and the resources dedicated by the Investment Manager and its affiliates to risk management, and considered the Investment Manager’s ability to provide administrative services to the Fund and coordinate the activities of the Fund’s other service providers. The Board also noted that, based on information provided by the Investment Manager, the Board had approved each Subadviser’s code of ethics and compliance program, and that the Chief Compliance Officer of the Funds reports to the Trustees on each Subadviser’s compliance program.
The Committee and the Board considered the diligence and selection process undertaken by the Investment Manager to select each Subadviser, including the Investment Manager’s rationale for recommending the continuation of the Subadvisory Agreements, and the process for monitoring each Subadviser’s ongoing performance of services for the Fund. As part of these deliberations, the Committee and the Board considered the ability of the Investment Manager, subject to the approval of the Board, to modify or enter into new subadvisory agreements without a shareholder vote pursuant to an exemptive order of the Securities and Exchange Commission. The Committee and the Board also considered the scope of services provided to the Fund by the Investment Manager that are distinct from and in addition to those provided by the Subadvisers, including cash flow management, treasury services, risk oversight, investment oversight and Subadviser selection, oversight and transition management. After reviewing these and related factors, the Committee and the Board concluded, within the context of their overall conclusions, that the nature, extent and quality of the services provided to the Fund under the Agreements supported the continuation of the Management Agreement and the Subadvisory Agreements.
Investment performance
The Committee and the Board reviewed information about the performance of the Fund over various time periods, including performance information relative to benchmarks, information that compared the performance of the Fund to the performance of a group of comparable mutual funds as determined by the independent third-party data provider, and information and analysis provided by the independent fee consultant. The Committee and the Board also reviewed a description of the third party’s methodology for identifying the Fund’s peer groups for purposes of performance and expense comparisons. Although
Multi-Manager Total Return Bond Strategies Fund | Annual Report 2019
| 103 |
Board Consideration and Approval of Management
and Subadvisory Agreements (continued)
the Fund’s performance lagged that of a relevant peer group for certain (although not necessarily all) periods, the Committee and the Board concluded that other factors relevant to performance were sufficient, in light of other considerations, to support continuation of the Management Agreement and the Subadvisory Agreement. Those factors included one or more of the following: (i) that the Fund’s performance, although lagging in certain recent periods, was stronger over the longer term; (ii) that the underperformance was attributable, to a significant extent, to investment decisions that were reasonable and consistent with the Fund’s investment strategy and policies and that the Fund was performing within a reasonable range of expectations, given those investment decisions, market conditions and the Fund’s investment strategy; (iii) that the Fund’s performance was competitive when compared to other relevant performance benchmarks or peer groups; and (iv) that the Investment Manager had taken or was taking steps designed to help improve the Fund’s investment performance, including, but not limited to, replacing portfolio managers, enhancing the resources supporting the portfolio managers, or modifying investment strategies.
The Committee and the Board noted that, through December 31, 2018, the Fund’s performance was in the eighty-fourth, fifty-sixty and sixty-first percentile (where the best performance would be in the first percentile) of its category selected by the independent third-party data provider for the purposes of performance comparisons for the one-, three- and five-year periods, respectively.
The Committee and the Board also considered the Investment Manager’s and Subadvisers’ performance and reputation generally, the Investment Manager’s evaluation of each Subadviser’s contribution to the Fund’s broader investment mandate, the Investment Manager’s historical responsiveness to Board concerns about performance, and the Investment Manager’s willingness to take steps intended to improve performance. After reviewing these and related factors, the Committee and the Board concluded, within the context of their overall conclusions, that the performance of the Fund, the Investment Manager and the Subadvisers were sufficient, in light of other considerations, to support the continuation of the Management Agreement and the Subadvisory Agreements.
Investment management fee rates and other expenses
The Committee and the Board considered the management fees charged to the Fund under the Management Agreement and the Subadvisory Agreements, as well as the total expenses incurred by the Fund. In assessing the reasonableness of the fees under the Management Agreement, the Committee and the Board considered, among other information, the Fund’s total expense ratio as a percentage of average daily net assets. The Committee and the Board considered data provided by the independent third-party data provider and the independent fee consultant. The Committee and the Board noted that, as of December 31, 2018, the Fund’s actual management fee and net total expense ratio were ranked in the fifth and second quintiles, respectively, (where the lowest fees and expenses would be in the first quintile) against the Fund’s expense universe as determined by the independent third-party data provider for purposes of expense comparison. The Committee and the Board also considered the fees that the Subadvisers charge to their other clients and noted that the Investment Manager pays the fees of the Subadvisers. The Committee and the Board also took into account the fee waiver and expense limitation arrangements agreed to by the Investment Manager, as noted above.
The Committee and the Board also received and considered information about the management fees charged by the Investment Manager to institutional accounts. In considering the fees charged to those accounts, the Committee and the Board took into account, among other things, the Investment Manager’s representations about the differences between managing mutual funds as compared to other types of accounts, including differences in the services provided, differences in the risk profile of such business for the Investment Manager and the additional resources required to manage mutual funds effectively. The Committee and the Board also received and considered information about the fees charged by the Investment Manager for sub-advisory services it provides to comparable unaffiliated funds. In evaluating the Fund’s management fees, the Committee and the Board also took into account the demands, complexity and quality of the investment management of the Fund.
After reviewing these and related factors, the Committee and the Board concluded, within the context of their overall conclusions, that the management fee rates and expenses of the Fund, in light of other considerations, supported the continuation of the Management Agreement and the Subadvisory Agreements.
| 104 | Multi-Manager Total Return Bond Strategies Fund | Annual Report 2019 |
Board Consideration and Approval of Management
and Subadvisory Agreements (continued)
Costs of services provided and profitability
The Committee and the Board also took note of the costs the Investment Manager and its affiliates incur in connection with the services provided and the profitability to the Investment Manager and its affiliates from their relationships with the Fund, and the efforts undertaken by the Investment Manager and its affiliates to manage efficiently their costs to provide such services.
The Committee and the Board also considered the compensation directly or indirectly received by the Investment Manager’s affiliates in connection with their relationships with the Fund. The Committee and the Board reviewed information provided by management as to the profitability to the Investment Manager and its affiliates of their relationships with the Fund, including with respect to funds for which unaffiliated subadvisers provide services, information about changes in profitability in connection with a change in the Fund’s subadviser, information about the allocation of expenses used to calculate profitability, and comparisons of profitability levels realized in 2018 to profitability levels realized in 2017. When reviewing profitability, the Committee and the Board also considered court cases in which adviser profitability was an issue in whole or in part, the performance of similarly managed funds, the performance of the Fund, and the expense ratio of the Fund. In addition, the Committee and the Board considered information provided by the Investment Manager regarding the Investment Manager’s financial condition and comparing its profitability to that of other asset management firms that are, or are subsidiaries of, publicly traded companies. In this regard, the Committee and the Board also considered data provided by the independent fee consultant. Because the Subadvisory Agreements were negotiated at arms-length by the Investment Manager, which is responsible for payments to the Subadvisers thereunder, the Committee and the Board did not consider the profitability to each Subadviser from its relationship with the Fund.
After reviewing these and related factors, the Committee and the Board concluded, within the context of their overall conclusions, that the costs of services provided and the profitability to the Investment Manager and its affiliates from their relationships with the Fund supported the continuation of the Management Agreement and the Subadvisory Agreements.
Economies of scale
The Committee and the Board considered the potential existence of economies of scale in the provision by the Investment Manager of services to the Fund, to groups of related funds, and to the Investment Manager’s investment advisory clients as a whole, and whether those economies of scale were shared with the Fund through breakpoints in investment management fees or other means, such as expense limitation arrangements and additional investments by the Investment Manager in investment, trading, compliance and other resources. The Committee and the Board noted that the management fee schedules for the Fund contained breakpoints that would reduce the fee rate on assets above specified threshold levels.
The Committee and the Board noted that the breakpoints in the Subadvisory Agreements did not occur at the same levels as the breakpoints in the Management Agreement. The Committee and the Board noted that absent a shareholder vote, the Investment Manager would bear any increase in fees payable under the Subadvisory Agreements. The Committee and the Board also noted the potential challenges of seeking to tailor the Management Agreement breakpoints to those of a subadvisory agreement in this context, and the effect that capacity constraints on a subadviser’s ability to manage assets could potentially have on the ability of the Investment Manager to achieve economies of scale, as new subadvisers may need to be added as the Fund grows, increasing the Investment Manager’s cost of compensating and overseeing the Fund’s subadvisers.
In considering these matters, the Committee and the Board also considered the costs of the services provided and the profitability to the Investment Manager and its affiliates from their relationships with the Fund, as noted above. After reviewing these and related factors, the Committee and the Board concluded, within the context of their overall conclusions, that the extent to which any economies of scale were expected to be shared with the Fund supported the continuation of the Management Agreement and the Subadvisory Agreements.
Other benefits to the Investment Manager and Subadvisers
The Committee and the Board received and considered information regarding “fall-out” or ancillary benefits received by the Investment Manager and its affiliates as a result of their relationships with the Fund, such as the engagement of the Investment Manager’s affiliates to provide distribution, transfer agency and shareholder services to the Fund. In this regard,
Multi-Manager Total Return Bond Strategies Fund | Annual Report 2019
| 105 |
Board Consideration and Approval of Management
and Subadvisory Agreements (continued)
among other matters, the Committee and the Board considered that the Fund’s distributor retains a portion of the distribution fees from the Fund and receives a portion of the sales charges on sales or redemptions of certain classes of shares of the Fund. The Committee and the Board also considered the benefits of research made available to the Subadvisers by reason of brokerage commissions generated by the Fund’s securities transactions, and reviewed information about the Investment Manager’s practices with respect to considering brokerage and research services when allocating portfolio transactions. In this connection, the Board also noted that the amount of research made available to the Investment Manager by reason of brokerage commissions had been declining over time, and may decline further. The Committee and the Board recognized that the Investment Manager’s profitability would be somewhat lower without these benefits.
Conclusion
The Committee and the Board reviewed all of the above considerations in reaching their decisions to recommend or approve the continuation of the Management Agreement and the Subadvisory Agreements. In their deliberations, the Trustees did not identify any particular information that was all-important or controlling, and individual Trustees may have attributed different weights to the various factors. Based on their evaluation of all factors that they deemed to be material, including those factors described above, and assisted by the advice of independent legal counsel, the Board, including the Independent Trustees, voting separately, unanimously approved the continuation of the Management Agreement and the Subadvisory Agreements.
| 106 | Multi-Manager Total Return Bond Strategies Fund | Annual Report 2019 |
[THIS PAGE INTENTIONALLY LEFT BLANK]
Multi-Manager Total Return Bond Strategies Fund
P.O. Box 219104
Kansas City, MO 64121-9104
Please read and consider the investment objectives, risks, charges and expenses for any fund carefully before investing. For a prospectus and summary prospectus, which contains this and other important information about the Fund, go to
columbiathreadneedleus.com/investor/. The Fund is distributed by Columbia Management Investment Distributors, Inc., member FINRA, and managed by Columbia Management Investment Advisers, LLC.
Columbia Threadneedle Investments (Columbia Threadneedle) is the global brand name of the Columbia and Threadneedle group of companies. All rights reserved.
© 2019 Columbia Management Investment Advisers, LLC.
columbiathreadneedleus.com/investor/

Annual Report
August 31, 2019
Multi-Manager Small Cap Equity Strategies Fund
Beginning on January 1, 2021, as permitted by regulations adopted by the Securities and Exchange Commission, paper copies of the Fund’s annual and semiannual shareholder reports like this one will no longer be sent by mail, unless you specifically request paper copies of the reports. Instead, the reports will be made available on the Fund’s website (columbiathreadneedleus.com/investor/), and each time a report is posted you will be notified by mail and provided with a website address to access the report.
If you have already elected to receive shareholder reports electronically, you will not be affected by this change and you need not take any action. You may elect to receive shareholder reports and other communications from the Fund electronically at any time by contacting your financial intermediary (such as a broker-dealer or bank) or, for Fund shares held directly with the Fund, by calling 800.345.6611 or by enrolling in “eDelivery” by logging into your account at columbiathreadneedleus.com/investor/.
You may elect to receive all future reports in paper free of charge. If you invest through a financial intermediary, you can contact your financial intermediary to request that you continue receiving paper copies of your shareholder reports. If you invest directly with the Fund, you can call 800.345.6611 to let the Fund know you wish to continue receiving paper copies of your shareholder reports. Your election to receive paper reports will apply to all Columbia Funds held in your account if you invest through a financial intermediary or all Columbia Funds held with the fund complex if you invest directly with the Fund.
Not FDIC Insured • No bank guarantee • May lose value
Multi-Manager Small Cap Equity Strategies Fund (the Fund) mails one shareholder report to each shareholder address, unless such shareholder elected to receive shareholder reports from the Fund electronically. If you would like more than one report, please call shareholder services at 800.345.6611 and additional reports will be sent to you.
Proxy voting policies and procedures
The policy of the Board of Trustees is to vote the proxies of the companies in which the Fund holds investments consistent with the procedures as stated in the Statement of Additional Information (SAI). You may obtain a copy of the SAI without charge by calling 800.345.6611; contacting your financial intermediary; visiting columbiathreadneedleus.com/investor/; or searching the website of the Securities and Exchange Commission (SEC) at sec.gov. Information regarding how the Fund voted proxies relating to portfolio securities is filed with the SEC by August 31st for the most recent 12-month period ending June 30th of that year, and is available without charge by visiting columbiathreadneedleus.com/investor/, or searching the website of the SEC at sec.gov.
Quarterly schedule of investments
The Fund files a complete schedule of portfolio holdings with the SEC for the first and third quarters of each fiscal year on Form N-PORT, and for reporting periods ended prior to March 31, 2019, on Form N-Q. The Fund’s Form N-Q and Form N-PORT filings are available on the SEC’s website at sec.gov. The Fund’s complete schedule of portfolio holdings, as filed on Form N-Q or Form N-PORT, can also be obtained without charge, upon request, by calling 800.345.6611.
Additional Fund information
For more information about the Fund, please visit columbiathreadneedleus.com/investor/ or call 800.345.6611. Customer Service Representatives are available to answer your questions Monday through Friday from 8 a.m. to 7 p.m. Eastern time.
Fund investment manager
Columbia Management Investment Advisers, LLC (the Investment Manager)
225 Franklin Street
Boston, MA 02110
Fund distributor
Columbia Management Investment Distributors, Inc.
225 Franklin Street
Boston, MA 02110
Fund transfer agent
Columbia Management Investment Services Corp.
P.O. Box 219104
Kansas City, MO 64121-9104
Multi-Manager Small Cap Equity Strategies Fund | Annual Report 2019
Investment objective
The Fund seeks long-term capital appreciation.
Portfolio management
BMO Asset Management Corp.
David Corris, CFA
Thomas Lettenberger, CFA
Columbia Management Investment Advisers, LLC
Christian Stadlinger, Ph.D, CFA
Jarl Ginsberg, CFA, CAIA
Conestoga Capital Advisors, LLC
Robert Mitchell
Joseph Monahan, CFA
Hotchkis and Wiley Capital Management, LLC
Judd Peters, CFA
Ryan Thomes, CFA
J.P. Morgan Investment Management Inc.
Eytan Shapiro, CFA
Felise Agranoff, CFA
Matthew Cohen
Morningstar style boxTM
The Morningstar Style Box is based on a fund’s portfolio holdings. For equity funds, the vertical axis shows the market capitalization of the stocks owned, and the horizontal axis shows investment style (value, blend, or growth). Information shown is based on the most recent data provided by Morningstar.
© 2019 Morningstar, Inc. All rights reserved. The Morningstar information contained herein: (1) is proprietary to Morningstar and/or its content providers; (2) may not be copied or distributed; and (3) is not warranted to be accurate, complete or timely. Neither Morningstar nor its content providers are responsible for any damages or losses arising from any use of this information.
| Average annual total returns (%) (for the period ended August 31, 2019) |
| | | Inception | 1 Year | 5 Years | Life |
| Class A | 04/20/12 | -13.04 | 6.54 | 9.93 |
| Institutional Class* | 01/03/17 | -12.85 | 6.69 | 10.03 |
| Russell 2000 Index | | -12.89 | 6.41 | 10.30 |
All results shown assume reinvestment of distributions during the period. Returns do not reflect the deduction of taxes that a shareholder may pay on Fund distributions or on the redemption of Fund shares. Performance results reflect the effect of any fee waivers or reimbursements of Fund expenses by Columbia Management Investment Advisers, LLC and/or any of its affiliates. Absent these fee waivers or expense reimbursement arrangements, performance results would have been lower.
The performance information shown represents past performance and is not a guarantee of future results. The investment return and principal value of your investment will fluctuate so that your shares, when redeemed, may be worth more or less than their original cost. Current performance may be lower or higher than the performance information shown. You may obtain performance information current to the most recent month-end by contacting your financial intermediary, visiting columbiathreadneedleus.com/investor/ or calling 800.345.6611.
| * | The returns shown for periods prior to the share class inception date (including returns for the Life of the Fund, if shown, which are since Fund inception) include the returns of the Fund’s oldest share class. These returns are adjusted to reflect any higher class-related operating expenses of the newer share classes, as applicable. Please visit columbiathreadneedleus.com/investor/investment-products/mutual-funds/appended-performance for more information. |
The Russell 2000 Index measures the performance of the small-cap segment of the U.S. equity universe. The Russell 2000 is a subset of the Russell 3000 Index representing approximately 10% of the total market capitalization of that index. It includes the securities of approximately 2,000 of the smallest companies in the Russell 3000 Index based on a combination of their market capitalization and current index membership.
Indices are not available for investment, are not professionally managed and do not reflect sales charges, fees, brokerage commissions, taxes or other expenses of investing. Securities in the Fund may not match those in an index.
Multi-Manager Small Cap Equity Strategies Fund | Annual Report 2019
| 3 |
Fund at a Glance (continued)
Performance of a hypothetical $10,000 investment (April 20, 2012 — August 31, 2019)
The chart above shows the change in value of a hypothetical $10,000 investment in Class A shares of Multi-Manager Small Cap Equity Strategies Fund during the stated time period, and does not reflect the deduction of taxes that a shareholder may pay on Fund distributions or on the redemption of Fund shares.
| Top 10 holdings (%) (at August 31, 2019) |
| Exponent, Inc. | 1.0 |
| Trex Company, Inc. | 1.0 |
| Simpson Manufacturing Co., Inc. | 0.9 |
| Cantel Medical Corp. | 0.9 |
| Fox Factory Holding Corp. | 0.9 |
| Descartes Systems Group, Inc. (The) | 0.7 |
| SiteOne Landscape Supply, Inc. | 0.7 |
| PROS Holdings, Inc. | 0.7 |
| Repligen Corp. | 0.7 |
| Omnicell, Inc. | 0.7 |
Percentages indicated are based upon total investments excluding Money Market Funds and investments in derivatives, if any.
For further detail about these holdings, please refer to the section entitled “Portfolio of Investments.”
Fund holdings are as of the date given, are subject to change at any time, and are not recommendations to buy or sell any security.
| Portfolio breakdown (%) (at August 31, 2019) |
| Common Stocks | 97.7 |
| Limited Partnerships | 0.2 |
| Money Market Funds | 2.1 |
| Total | 100.0 |
Percentages indicated are based upon total investments excluding investments in derivatives, if any. The Fund’s portfolio composition is subject to change.
| Equity sector breakdown (%) (at August 31, 2019) |
| Communication Services | 1.5 |
| Consumer Discretionary | 10.9 |
| Consumer Staples | 2.8 |
| Energy | 3.5 |
| Financials | 18.2 |
| Health Care | 13.1 |
| Industrials | 20.4 |
| Information Technology | 17.1 |
| Materials | 3.1 |
| Real Estate | 5.9 |
| Utilities | 3.5 |
| Total | 100.0 |
Percentages indicated are based upon total equity investments. The Fund’s portfolio composition is subject to change.
| 4 | Multi-Manager Small Cap Equity Strategies Fund | Annual Report 2019 |
Manager Discussion of Fund Performance
Effective February 12, 2019, Dalton, Greiner, Harman, Maher & Co. (DGHM) no longer manages a portion of the Fund, and effective February 22, 2019, EAM Investors, LLC (EAM) no longer manages a portion of the Fund. Effective December 19, 2018, J.P. Morgan Investment Management Inc. (JPMIM) began managing a portion of the Fund’s assets, and effective February 13, 2019, Hotchkis and Wiley Capital Management, LLC (Hotchkis & Wiley) began managing a portion of the Fund’s assets. The Fund is currently managed by four independent money management firms and by Columbia Management Investment Advisers, LLC (CMIA) and each invests a portion of the portfolio’s assets. As of August 31, 2019, BMO Asset Management Corp. (BMO), CMIA, Conestoga Capital Advisors, LLC (Conestoga), Hotchkis & Wiley, and JPMIM managed approximately 19%, 19%, 22%, 19% and 21% of the portfolio, respectively.
For the 12-month period that ended August 31, 2019, the Fund’s Class A shares returned -13.04%. The Fund closely matched the performance of its benchmark, the Russell 2000 Index, which returned -12.89% over the same period. Individual stock selection and sector allocation among the Fund’s managers generally accounted for the relative results.
Small-cap equities underperformed larger cap counterparts amid rising volatility
Small-cap equities, particularly those of value-oriented companies, struggled during the period, as the positive effects of tax reform faded and the negative effects of trade tensions bled into most segments of the U.S. equity market. Volatility also increased, as the U.S. and China alternated threats with more optimistic outlooks for a trade deal. Central bank policy also left investors guessing. Following interest rate hikes through 2018, the U.S. Federal Reserve pivoted to a more dovish tone to start 2019, but then characterized its July 2019 interest rate cut as a “mid-cycle adjustment” rather than the start of an easing cycle. These factors, along with a combination of modest U.S. economic growth and the flattening and eventual inverting U.S. Treasury yield curve, led U.S. equity investors to favor segments of the market perceived as safer. As a result, small-cap equities underperformed large-cap equities, and cyclical sectors underperformed non-cyclical sectors without regard to valuation.
Within the small-cap universe, as across the capitalization spectrum, growth stocks sharply outperformed value stocks. For the period as a whole, there was also a wide dispersion of returns across sectors of the benchmark. Indeed, sector performance reflected investors’ increasing aversion to risk, with utilities the only sector in the benchmark to deliver a positive absolute return for the period. Energy and materials were among the weakest performers, as crude oil prices fell well off the highs reached in October 2018 and tariffs continued to threaten profit margins and supply chains.
Individual stock selection impacted Fund performance most
DGHM: We managed a portion of the Fund from September 1, 2018 through February 12, 2019 (the “reporting period”). Our portion of the Fund underperformed the benchmark, attributable primarily to stock selection. Sector allocation decisions overall contributed positively as did having a modest cash balance during a reporting period when the benchmark declined. More specifically, stock selection in the retail/apparel, technology and consumer staples market segments detracted most from our portion of the Fund’s results. Allocation positioning in technology also hurt. These detractors were partially offset by effective stock selection in the consumer durables and transportation market segments, which contributed positively. Having an underweight allocation to health care, which underperformed the benchmark during the reporting period, also helped.
Individual positions that disappointed most during the reporting period were Invacare, WPX Energy and Greenbrier Companies, each posting a double-digit negative absolute return that underperformed the benchmark. We sold the Fund’s position in Invacare but maintained its positions in WPX Energy and Greenbrier Companies through the reporting period.
The individual positions in our portion of the Fund’s portfolio that contributed most positively were Ciena, Moog and The Ensign Group.
EAM: We managed a portion of the Fund from September 1, 2018 through February 22, 2019 (the “reporting period”). Our portion of the Fund underperformed the benchmark during the reporting period due to a combination of stock selection and sector allocation decisions. Stock selection in consumer discretionary, industrials and consumer staples detracted most. Having an overweight to health care, the second-weakest performing sector in the benchmark during the reporting period, also hurt. These detractors were partially offset by effective stock selection in the financials, information technology and real
Multi-Manager Small Cap Equity Strategies Fund | Annual Report 2019
| 5 |
Manager Discussion of Fund Performance (continued)
estate sectors, which contributed positively. Having an overweight in information technology, the second-strongest performing sector in the benchmark during the reporting period, and an underweight to energy, the weakest performing sector in the benchmark during the reporting period, also helped.
From a risk attribution perspective, our portion of the Fund’s underperformance of the benchmark can be explained mostly by negative effects from factors, most notably medium-term momentum and volatility. The balance was due to negative effects from stock specific risk, particularly in health care.
The biggest individual detractors from our portion of the Fund’s results during the reporting period were Proteostasis Therapeutics, Natural Grocers by Vitamin Cottage and CURO Group Holdings. Positions in eHealth, K12 and MongoDB were top contributors to our portion of the Fund’s results.
Conestoga: Our portion of the Fund outperformed the benchmark during the 12-month period ended August 31, 2019 due primarily to stock selection. Sector allocation also added to relative returns, albeit more modestly. Equity factor exposures also added to relative returns, notably our portion of the Fund’s exposures toward the profitability factor and away from the earnings variability factor. During the period, growth-oriented stocks outperformed value-oriented stocks within the benchmark, which further benefited our strategy.
Stock selection was strongest in the industrials and health care sectors. Having overweights in the industrials and information technology sectors, which outperformed the benchmark during the period, also helped. Only partially offsetting these positive contributors was the detracting effect of our portion of the Fund’s underweights in the utilities, financials and real estate sectors, each of which outpaced the benchmark during the period. We typically underweight each of these sectors in our portion of the Fund given that the benchmark constituents struggle to meet our growth-oriented purchase criteria. Our portion of the Fund held no position in either the utilities or real estate sectors during the period and held only two positions in the financials sector.
The biggest individual contributors to our portion of the Fund’s results were price optimization software company PROS Holdings, biotechnology industry tools and materials provider Repligen and science and engineering consulting firm Exponent. PROS Holdings delivered strong results driven by substantial subscription revenue growth. Repligen saw its shares rise as first calendar quarter revenue and earnings per share exceeded market expectations. The momentum of Repligen’s business appeared strong, as all three of its segments — chromatography, filtration and proteins — experienced growth. Its management also announced the acquisition of C Technologies, a deal that adds a fourth platform of process analytics to the company’s growing bioprocessing franchise. Exponent outperformed the benchmark, as numerous tailwinds helped its organic growth accelerate. Complexities around autonomous driving and electric powered cars drove demand for Exponent’s scientific expertise.
Positions in Ligand Pharmaceuticals, Stamps.com and Bottomline Technologies detracted most from our portion of the Fund’s results. Drug developer Ligand Pharmaceuticals underperformed the benchmark during the period, as investors remained skeptical it could reinvest the $827 million in gross proceeds it received for its economic interest in Promacta royalties. Stamps.com is the leading provider of internet-based mailing and shipping solutions, primarily used by high volume shippers. Its stock sold off significantly after the company, in a surprising move, ended its exclusive relationship with the U.S. Postal Service (USPS). Software provider Bottomline Technologies underperformed the benchmark during the period on its management’s announcement it would seek to increase investment and maintain margins at current levels for the next several years. We sold our portion of the Fund’s position in Stamps.com but maintained positions in Ligand Pharmaceuticals and Bottomline Technologies at the end of the period.
During the period, we established a new position in our portion of the Fund in Axon Enterprise, a provider of law enforcement technology solutions, including TASER stun guns and on-officer body cameras. Axon Enterprise has experienced rapid growth and margin expansion as it gains leverage on its investments. We initiated a position in Paylocity Holding, a cloud-based provider of payroll and human capital management software solutions. Fourth quarter 2018 market volatility caused a decline in Paylocity Holding’s share price, which we believe provided a compelling entry point for a stock we have been monitoring for some time. We think the company has an attractive business model featuring recurring revenue and margin expansion opportunity. Conversely, in addition to the sale of Stamps.com, we sold our portion of the Fund’s position in Healthcare Services Group, as we believed financial challenges in its underlying customer base would persist and remain a significant headwind to growth for the company.
| 6 | Multi-Manager Small Cap Equity Strategies Fund | Annual Report 2019 |
Manager Discussion of Fund Performance (continued)
Sector allocations were driven more by our bottom-up stock selection process than by any top-down or sector level research. That said, our portion of the Fund’s sector weightings relative to the benchmark increased in industrials, information technology and financials and decreased in consumer discretionary, health care and consumer staples during the period. At the end of August 2019, our portion of the Fund was overweight relative to the benchmark in industrials and consumer staples and was underweight in financials, real estate, utilities, consumer discretionary, energy, materials and communication services.
BMO: Our portion of the Fund underperformed the benchmark due primarily to stock selection during the 12-month period ended August 31, 2019. Our stock selection model is designed to identify fundamentally strong, attractively valued stocks with positive investor sentiment. While investor sentiment was a positive contributor to performance, fundamentals and valuation detracted from returns during the period. In addition, our strategy’s style, i.e. its emphasis on attractively valued securities, detracted, as the Russell 2000 Value Index underperformed the broad Russell 2000 Index for the period. Sector allocation overall contributed positively to relative results during the period.
More specifically, stock selection in the consumer discretionary and information technology sectors detracted most from our portion of the Fund’s relative results. Having an underweight to information technology, which was the second-strongest performing sector in the benchmark during the period, and having an overweight to energy, the weakest performing sector in the benchmark during the period, also hurt. Partially offsetting these detractors was effective stock selection in the utilities and communication services sectors, which contributed positively. Having an overweight to utilities, the only sector in the benchmark to generate a positive absolute return during the period as investors became increasingly risk averse, also helped. Having an overweight to communication services, which outperformed the benchmark during the period, and having an underweight to health care, which underperformed the benchmark during the period, added value as well.
From an individual holdings perspective, the biggest detractors from our portion of the Fund’s results included Cooper-Standard Holdings, Realogy Holdings and Phibro Animal Health. Cooper-Standard Holdings manufactures and distributes automotive systems and components. During the annual period, its attractive valuation was overshadowed by macroeconomic cycle concerns in the automotive market. Realogy Holdings, a real estate services provider, faced competitive pressure to its stock’s fundamentals from other brokerage platforms and new entrants to the industry. Shares of Phibro Animal Health, which is an animal health and mineral nutrition company, declined significantly during the annual period, as the company reported weaker than expected quarterly results in August. Investors focused both on weakness in the U.S. dairy market and on an outbreak of African swine fever in China, limiting the need for animal feed additives in the region.
Conversely, individual positive contributors included Sinclair Broadcast Group, Ciena and Black Hills. Sinclair Broadcast Group, a television broadcasting company, outperformed the benchmark during the period, as a result of strong investor interest in its acquisition of 21 regional sports networks from Walt Disney, which divested the networks as a result of its acquisition of Twenty-First Century Fox. We exited our portion of the Fund’s position in Sinclair Broadcast Group following the announcement of the deal. Ciena develops and markets communications network platforms and software. During the period, the company saw improving growth and profitability, as it excelled in its web-scale and telecommunications business segments ahead of its 5G rollout. We trimmed the position, as the stock grew outside of our small cap market cap range, but we continued to view the company as attractive and maintained a position. Utilities company Black Hills contributed positively to our portion of the Fund’s results, driven by improving investor interest around several regulatory victories, increasing visibility on its near- to medium-term fundamentals. We trimmed the position due to deterioration in Black Hills’ growth metrics and to reduce our portion of the Fund’s utilities exposure following strong performance by the sector during the period.
We established a position in our portion of the Fund in Darling Ingredients, a developer and producer of natural ingredients from edible and inedible bio-nutrients. The purchase was based on improving investor sentiment and strong company fundamentals. What we believed to be the company’s strong free cash flow trajectory may well continue, driven in part by its joint venture with Valero, which should enable Darling Ingredients to invest profits back into its core business. We initiated a position in BMC Stock Holdings, a provider of building products and services in the residential construction industry, following an increase in the stock’s ranking within our stock selection model based on strong investor interest, improving fundamentals and attractive valuations. Conversely, we sold our portion of the Fund’s position in Banner, a bank holding company. We
Multi-Manager Small Cap Equity Strategies Fund | Annual Report 2019
| 7 |
Manager Discussion of Fund Performance (continued)
exited the position following Banner’s acquisition of Skagit Bancorp and deterioration in its company fundamentals. We exited our portion of the Fund’s position in El Paso Electric, a utility company, after it agreed to be acquired by the Infrastructure Investments Fund.
As a result of our bottom-up stock attractiveness strategy, our portion of the Fund’s weights to real estate, industrials and financials increased and its weights in energy, consumer discretionary and materials decreased. As of August 31, 2019, our portion of the Fund was overweight relative to the benchmark in financials, real estate, energy, utilities and materials and was underweight relative to the benchmark in health care, consumer discretionary, information technology, consumer staples and communication services. Our portion of the Fund was rather neutrally weighted compared to the benchmark in industrials at the end of August 2019.
JPMIM: During the period from December 19, 2018, when we assumed management of a portion of the Fund, through August 31, 2019 (the “reporting period”), our portion of the Fund outperformed the benchmark. While growth as a style was generally rewarded, buoying our investment approach, strong stock selection was the primary driver of our portion of the Fund’s relative outperformance during the reporting period. More specifically, stock selection proved most effective in the health care, information technology and consumer staples sectors. Having an overweight in information technology, which significantly outpaced the benchmark during the reporting period, also helped. Only partially offsetting these positive contributors was weaker stock selection in the consumer discretionary and financials sectors, which detracted. Having an underweight to the strongly performing utilities sectors, also hurt.
From an individual holdings perspective, the top positive contributors to our portion of the Fund’s results were medical device company Insulet, biotechnology company Spark Therapeutics and semiconductor components provider Inphi. Insulet specializes in devices and supplies for diabetic patients. Its shares traded higher following reports of its fiscal first and second quarter results, both of which were highlighted by better than expected revenues and a raise in guidance. Spark Therapeutics focuses on gene therapies for retinal sickness and neurodegenerative diseases. Its shares rose after it was announced in early 2019 that the company would be acquired by Roche for a substantial premium. Inphi provides semiconductor components for communications and data center end-markets. Its earnings results in 2019 were positive, highlighting the company’s strong competitive position despite concerns around its relationship with controversial Chinese technology company Huawei. We trimmed our portion of the Fund’s positions in each of these three holdings during the reporting period.
Among the biggest individual detractors from our portion of the Fund’s results were Evolent Health, Farfetch and Hudson. Evolent Health provides health system consulting services and has been a leading participant in the ongoing industry shift toward a more value-based model of health care delivery. Its stock declined due to concerns around the solvency of a key health plan customer, weaker guidance for 2019 and its acquisition of a majority stake in a large customer, which was not well received by investors. Farfetch is a technology platform for the luxury fashion industry. Much of its stock’s weak performance came in August 2019 when the company lowered guidance for the remainder of 2019. The company also made an acquisition that was not viewed to be core to its primary business, which was not well received by the market. Hudson is an operator of quick-service food, convenience and travel essentials stores. Its stock came under pressure after the company’s Chief Executive Officer was unexpectedly replaced by its former Chief Operating Officer. The company’s duty-free business was also a source of weakness during the reporting period. Our portion of the Fund maintained a position in each of these three companies at the end of the reporting period.
We established a position in Simpson Manufacturing, a provider of wood, concrete and masonry structural connectors. Simpson Manufacturing is the dominant player with 70% market share in residential construction given its significant manufacturing scale and strong builder relationships. Building code mandates and construction in storm-prone areas have increased the company’s penetration and drove, in our view, its secular growth opportunity. Further, we believed the company has a well-tenured management team, strong pricing power and superior free cash flow generation. We initiated a position in our portion of the Fund in Semtech, a semiconductor company that we believed was, well positioned to take advantage of the early opportunity in LoRa, which is a long range, low power wireless communication technology. Conversely, we sold our portion of the Fund’s position in enterprise cloud platform developer Nutanix given our confidence in its management had been waning and its customer pipeline appeared lackluster in the near to intermediate term. Additionally, the company paused hiring in sales roles late in 2018 after a notable hiring push earlier in the year, thereby, in our view, reducing its growth trajectory.
| 8 | Multi-Manager Small Cap Equity Strategies Fund | Annual Report 2019 |
Manager Discussion of Fund Performance (continued)
We exited our portion of the Fund’s position in online education technology provider Instructure, as we believed the company’s shift toward corporate learning and away from the slowing higher education market may take longer than expected. Further, a newly appointed Chief Executive Officer increased potential challenges from an execution perspective, in our view.
There were no significant shifts in sector weightings within our portion of the Fund during the reporting period, though we modestly increased exposure to the consumer discretionary sector and modestly decreased exposure to the information technology sector. Our portion of the Fund’s largest overweights relative to the benchmark at the end of the reporting period were information technology and consumer discretionary, and its largest underweights relative to the benchmark were financials and health care.
Hotchkis & Wiley: During the period from February 13, 2019, when we assumed management of a portion of the Fund, through August 31, 2019 (the “reporting period”), our portion of the Fund underperformed the benchmark as well as the Russell 2000 Value Index, against which we measure our portion of the Fund. There were two stylistic factors that served as headwinds to our relative performance — value and size. Small-cap value equities significantly underperformed small-cap growth equities, which hurt, as our portion of the Fund exhibits valuation characteristics that are at a discount to the Russell 2000 Value Index. Further, our portion of Fund’s average weight in stocks with a market capitalization below $1 billion was substantially higher than that of the benchmark, but, during the reporting period, the smallest capitalization stocks in the benchmark significantly underperformed the benchmark as a whole.
More specifically, sector allocation positioning detracted most from relative results. Utilities, real estate and information technology were the best performing sectors in the Russell 2000 Value Index during the reporting period, and our portion of the Fund was underweight in each. Energy was the weakest performing in the Russell 2000 Value Index during the reporting period amid volatile oil prices, and thus our portion of the Fund’s overweight position hurt. Stock selection in information technology, real estate and energy also detracted, with positions in communications equipment companies and energy services companies disappointing most. Only partially offsetting these detractors was the positive contributions made by having an underweight to health care, the second-weakest sector in the Russell 2000 Value Index during the reporting period, and by effective stock selection in the health care, consumer discretionary and materials sectors.
Among the biggest individual detractors from our portion of the Fund’s results were Nautilus, Mammoth Energy Services and Whiting Petroleum. Nautilus, which makes home fitness equipment, faced heightened competitive pressures during the reporting period. Mammoth Energy Services is an energy services company that provides proppant sand, pressure pumping, equipment rental and other related services. This industry overall was hit hard during the reporting period, as exploration and production companies exhibited more disciplined capital spending. Whiting Petroleum is an oil and gas exploration and production company. Because its operations are focused in the Bakken shale region in North Dakota, which is higher on the cost curve compared to Permian Basin operators, Whiting Petroleum was disproportionately exposed to changes in oil prices. At the end of the reporting period, we maintained positions in each of these companies within our portion of the Fund.
From an individual holdings perspective, the top positive contributors to our portion of the Fund’s results were Sonic Automotive, Rev Group and Vectrus. Sonic Automotive has more than 100 dealerships across the southern U.S., in addition to collision repair centers. During the reporting period, it announced a positive earnings surprise driven by strong used car margins and cost cutting efforts, signaling positive steps and effective execution by its management. Rev Group manufactures specialty vehicles, like ambulances, fire trucks, street sweepers and more. Its shares declined in late 2018 after missing earnings due to rising input costs, which can take time to pass on to customers. Subsequently, its stock rebounded when the company reported results that were better than market expectations. Vectrus provides logistics and supply chain support for U.S. government agencies. Its shares rose significantly during the reporting period on the company’s win of a major new contract with the U.S. Army. We trimmed our portion of the Fund’s positions in each of these companies but maintained positions in each at the end of the reporting period.
We rebalance our portion of the Fund twice per year, triggering many buys and sells. Among those purchases made during the reporting period was Goodyear Tire. In our view, the company possesses a good brand and was trading at an attractive level with secular tailwind opportunities from high value-added tires. We initiated a position in AAR, a company that supplies aftermarket products to the global aviation market, a niche industry in which it is, in our view, competitively well positioned. We believe AAR has a strong balance sheet and an attractive valuation. We established a position in GrafTech International,
Multi-Manager Small Cap Equity Strategies Fund | Annual Report 2019
| 9 |
Manager Discussion of Fund Performance (continued)
which makes graphite and carbon-based products, including graphite electrodes. It was trading, at the time of purchase, at what we felt was an attractive valuation, and we liked what we saw as a reasonable balance sheet and good competitive dynamics for the company. Conversely, we sold our portion of the Fund’s position in auction house Sotheby’s during the reporting period. The company announced it was to be acquired at a large premium, and we exited the position. Similarly, we eliminated our portion of the Fund’s position in Quantenna Communication upon its announcement it was to be acquired at a significant premium. We also exited our portion of the Fund’s position in Portland General Electric. The utility company’s market capitalization rose to well above $4 billion, so we sold the position to stay within the strategy’s small cap parameters.
During the reporting period, we increased our portion of the Fund’s relative weighting in financials, primarily though increasing the allocation to banks, which, in our view, represented the most compelling industry from both a risk/return and valuation perspective. We also modestly increased our portion of the Fund’s weighting in industrials. We reduced our portion of the Fund’s relative weight in energy, primarily by decreasing positions in energy services companies. We also reduced the weight in information technology. At the end of the reporting period, our portion of the Fund was overweight relative to the benchmark in financials, energy, industrials and consumer discretionary, and was underweight relative to the benchmark in health care, real estate, information technology, communication services and consumer staples. Our portion of the Fund had rather neutral weightings relative to the benchmark in the utilities and materials sectors at the end of August 2019.
CMIA: Our portion of the Fund closely matched the performance of the Russell 2000 Value Index, against which our portion of the Fund is managed, with stock selection modestly detracting from relative performance and sector allocation overall contributing modestly positively during the 12-month period ended August 31, 2019.
Stock selection in financials, materials, energy, utilities and industrial hurt most. Allocation positioning in real estate, health care, materials and financials also dampened relative results. Virtually evenly offsetting these detractors was effective stock selection in the health care, consumer discretionary, communication services, consumer staples and real estate sectors, which contributed most positively. Having an underweighted allocation to energy, which was the weakest sector in the Russell 2000 Value Index during the period, and having a position in cash during an period when the Russell 2000 Value Index declined substantially, also added value.
Among the biggest individual detractors from our portion of the Fund’s results was Orion Engineered Carbons, a specialty and rubber carbon blacks supplier. Its shares fell during the period on lower volumes and on its Chief Executive Officer’s comments about softening demand. Two oil and gas exploration and production companies — Carrizo Oil & Gas and Oasis Petroleum — also detracted, with each experiencing significant share price declines during the fourth quarter of 2018 when energy prices sharply fell. A position in truckload carrier Covenant Transportation Group was another notable detractor. Its shares declined due to a difficult operating environment for trucking as well as some weather-related issues during the period. We maintained our portion of the Fund’s positions in Orion Engineered Carbons, Oasis Petroleum and Covenant Transportation Group at the end of the period but sold its position in Carrizo Oil & Gas.
From an individual holdings perspective, the top positive contributors to our portion of the Fund’s results were industrials company Armstrong World Industries, real estate investment trust PS Business Parks and industrials company MasTec. Shares of Armstrong World Industries, which designs and manufactures ceilings and walls, rose substantially as investors rewarded its growth and margins. The company also acquired a smaller architectural specialties business that many investors felt should help expand the company’s offerings. PS Business Parks, which invests in office buildings and industrial properties, saw its shares rise on consecutive reports of strong quarterly results and on its acquisition of a new industrial property in Virginia. Also helping PS Business Parks was relative strength in the real estate sector broadly, as investors favored the sector’s defensive qualities. Infrastructure engineering and construction company MasTec saw its shares jump after reporting strong quarterly results that beat consensus expectations and raising forward guidance, with such results driven by momentum across its businesses. During the period, we slightly trimmed our portion of the Fund’s position in Armstrong World Industries on its strength but maintained positions in each of these holdings at the end of August 2019.
During the period, we established positions in TopBuild, a homebuilding company, and Lumentum, a technology firm that manufactures optical and photonic products. We purchased these names as, in our view, each met our valuation criteria, were exhibiting upward inflection and had strong fundamentals. Each performed well from their respective purchase dates
| 10 | Multi-Manager Small Cap Equity Strategies Fund | Annual Report 2019 |
Manager Discussion of Fund Performance (continued)
through the end of the period. In addition to the sale of Carrizo Oil & Gas, already mentioned, we exited our portion of the Fund’s position in Electronics for Imaging, which designs and markets products that support printing on a variety of peripheral devices, after it was announced the company was being acquired.
In general, changes in sector weights are a function of the number of opportunities we can find for undervalued companies with what we view as strong underlying earnings prospects and evidence of upward inflection points. Based on our individual fundamental, bottom-up stock selection process, notable sector shifts in our portion of the Fund during the period included increased allocations to information technology and utilities and decreased exposure to financials, materials and health care. At the end of the period, our portion of the Fund was overweight relative to the Russell 2000 Value Index in information technology, industrials and utilities. Our portion of the Fund was underweight relative to the Russell 2000 Value Index in financials, energy and real estate at the end of August 2019.
The Russell 2000 Value Index is an unmanaged index that tracks the performance of those Russell 2000 Index companies with lower price-to-book ratios and lower forecasted growth values.
It is not possible to invest directly in an index.
Marketrisk may affect a single issuer, sector of the economy, industry or the market as a whole.Foreign investments subject the Fund to risks, including political, economic, market, social and others within a particular country, as well as to currency instabilities and less stringent financial and accounting standards generally applicable to U.S. issuers. Investments insmall-cap companies involve risks and volatility greater than investments in larger, more established companies. The Fund may invest significantly in issuers within a particularsector, which may be negatively affected by market, economic or other conditions, making the Fund more vulnerable to unfavorable developments in the sector. The Fund is managed bymultiple advisersindependently of one another, which may result in contradicting trades (i.e., with no net benefit to the Fund), while increasing transaction costs. Market or other (e.g., interest rate) environments may adversely affect the liquidity of fund investments, negatively impacting their price. Generally, the less liquid the market at the time the Fund sells a holding, the greater the risk of loss or decline of value to the Fund. See the Fund’s prospectus for more information on these and other risks.
The views expressed in this report reflect the current views of the respective parties. These views are not guarantees of future performance and involve certain risks, uncertainties and assumptions that are difficult to predict, so actual outcomes and results may differ significantly from the views expressed. These views are subject to change at any time based upon economic, market or other conditions and the respective parties disclaim any responsibility to update such views. These views may not be relied on as investment advice and, because investment decisions for a Columbia fund are based on numerous factors, may not be relied on as an indication of trading intent on behalf of any particular Columbia fund. References to specific securities should not be construed as a recommendation or investment advice.
Multi-Manager Small Cap Equity Strategies Fund | Annual Report 2019
| 11 |
Understanding Your Fund’s Expenses
(Unaudited)
As an investor, you incur two types of costs. There are shareholder transaction costs, which may include redemption fees. There are also ongoing fund costs, which generally include management fees, distribution and/or service fees, and other fund expenses. The following information is intended to help you understand your ongoing costs (in dollars) of investing in the Fund and to help you compare these costs with the ongoing costs of investing in other mutual funds.
Analyzing your Fund’s expenses
To illustrate these ongoing costs, we have provided examples and calculated the expenses paid by investors in each share class of the Fund during the period. The actual and hypothetical information in the table is based on an initial investment of $1,000 at the beginning of the period indicated and held for the entire period. Expense information is calculated two ways and each method provides you with different information. The amount listed in the “Actual” column is calculated using the Fund’s actual operating expenses and total return for the period. You may use the Actual information, together with the amount invested, to estimate the expenses that you paid over the period. Simply divide your account value by $1,000 (for example, an $8,600 account value divided by $1,000 = 8.6), then multiply the results by the expenses paid during the period under the “Actual” column. The amount listed in the “Hypothetical” column assumes a 5% annual rate of return before expenses (which is not the Fund’s actual return) and then applies the Fund’s actual expense ratio for the period to the hypothetical return. You should not use the hypothetical account values and expenses to estimate either your actual account balance at the end of the period or the expenses you paid during the period. See “Compare with other funds” below for details on how to use the hypothetical data.
Compare with other funds
Since all mutual funds are required to include the same hypothetical calculations about expenses in shareholder reports, you can use this information to compare the ongoing cost of investing in the Fund with other funds. To do so, compare the hypothetical example with the 5% hypothetical examples that appear in the shareholder reports of other funds. As you compare hypothetical examples of other funds, it is important to note that hypothetical examples are meant to highlight the ongoing costs of investing in a fund only and do not reflect any transaction costs, such as redemption or exchange fees. Therefore, the hypothetical calculations are useful in comparing ongoing costs only, and will not help you determine the relative total costs of owning different funds. If transaction costs were included in these calculations, your costs would be higher.
| March 1, 2019 — August 31, 2019 |
| | Account value at the
beginning of the
period ($) | Account value at the
end of the
period ($) | Expenses paid during
the period ($) | Fund’s annualized
expense ratio (%) |
| | Actual | Hypothetical | Actual | Hypothetical | Actual | Hypothetical | Actual |
| Class A | 1,000.00 | 1,000.00 | 964.50 | 1,018.65 | 6.30 | 6.48 | 1.28 |
| Institutional Class | 1,000.00 | 1,000.00 | 965.10 | 1,019.90 | 5.07 | 5.22 | 1.03 |
Expenses paid during the period are equal to the annualized expense ratio for each class as indicated above, multiplied by the average account value over the period and then multiplied by the number of days in the Fund’s most recent fiscal half year and divided by 365.
Expenses do not include fees and expenses incurred indirectly by the Fund from its investment in underlying funds, including affiliated and non-affiliated pooled investment vehicles, such as mutual funds and exchange-traded funds.
Had Columbia Management Investment Advisers, LLC and/or certain of its affiliates not waived/reimbursed certain fees and expenses, account value at the end of the period would have been reduced.
The Fund is offered only through certain wrap fee programs sponsored and/or managed by Ameriprise Financial, Inc. or its affiliates. Participants in wrap fee programs pay other fees that are not included in the above table. Please refer to the wrap program documents for information about the fees charged.
| 12 | Multi-Manager Small Cap Equity Strategies Fund | Annual Report 2019 |
Portfolio of Investments
August 31, 2019
(Percentages represent value of investments compared to net assets)
Investments in securities
| Common Stocks 98.0% |
| Issuer | Shares | Value ($) |
| Communication Services 1.4% |
| Diversified Telecommunication Services 0.2% |
| Vonage Holdings Corp.(a) | 300,000 | 3,966,000 |
| Entertainment 0.3% |
| Glu Mobile, Inc.(a) | 236,972 | 1,052,156 |
| Sciplay Corp., Class A(a) | 95,199 | 905,342 |
| World Wrestling Entertainment, Inc., Class A | 51,665 | 3,690,431 |
| Total | | 5,647,929 |
| Media 0.9% |
| Emerald Expositions Events, Inc. | 59,500 | 568,820 |
| Entravision Communications Corp., Class A | 202,400 | 619,344 |
| MDC Partners, Inc., Class A(a) | 299,400 | 703,590 |
| Meredith Corp. | 12,600 | 551,628 |
| MSG Networks, Inc., Class A(a) | 172,592 | 2,830,509 |
| New York Times Co. (The), Class A | 142,499 | 4,160,971 |
| Nexstar Media Group, Inc., Class A | 44,000 | 4,351,160 |
| TEGNA, Inc. | 26,600 | 380,646 |
| Total | | 14,166,668 |
| Total Communication Services | 23,780,597 |
| Consumer Discretionary 10.7% |
| Auto Components 2.2% |
| Adient PLC | 59,400 | 1,198,098 |
| American Axle & Manufacturing Holdings, Inc.(a) | 78,641 | 498,584 |
| Cooper Tire & Rubber Co. | 51,800 | 1,216,782 |
| Cooper-Standard Holding, Inc.(a) | 51,267 | 1,919,436 |
| Dana, Inc. | 171,423 | 2,182,215 |
| Delphi Technologies PLC | 93,100 | 1,231,713 |
| Dorman Products, Inc.(a) | 80,825 | 5,745,041 |
| Fox Factory Holding Corp.(a) | 198,671 | 14,312,259 |
| Goodyear Tire & Rubber Co. (The) | 106,500 | 1,221,555 |
| Motorcar Parts of America, Inc.(a) | 58,900 | 855,817 |
| Stoneridge, Inc.(a) | 82,838 | 2,543,955 |
| Tower International, Inc. | 42,700 | 1,320,711 |
| Visteon Corp.(a) | 36,300 | 2,503,611 |
| Total | | 36,749,777 |
| Common Stocks (continued) |
| Issuer | Shares | Value ($) |
| Automobiles 0.3% |
| Thor Industries, Inc. | 26,600 | 1,221,206 |
| Winnebago Industries, Inc. | 95,397 | 3,054,612 |
| Total | | 4,275,818 |
| Distributors 0.3% |
| Pool Corp. | 21,597 | 4,241,219 |
| Diversified Consumer Services 1.4% |
| Adtalem Global Education, Inc.(a) | 82,400 | 3,520,128 |
| Bright Horizons Family Solutions, Inc.(a) | 31,331 | 5,171,182 |
| Grand Canyon Education, Inc.(a) | 77,200 | 9,696,320 |
| Sotheby’s(a) | 90,550 | 5,229,262 |
| Weight Watchers International, Inc.(a) | 10,100 | 302,899 |
| Total | | 23,919,791 |
| Hotels, Restaurants & Leisure 1.4% |
| Boyd Gaming Corp. | 187,807 | 4,514,880 |
| Brinker International, Inc. | 89,200 | 3,389,600 |
| Dine Brands Global, Inc. | 30,000 | 2,116,500 |
| Hilton Grand Vacations, Inc.(a) | 37,000 | 1,249,490 |
| Planet Fitness, Inc., Class A(a) | 50,710 | 3,580,633 |
| Red Rock Resorts, Inc., Class A | 135,142 | 2,817,711 |
| Texas Roadhouse, Inc. | 75,607 | 3,890,736 |
| Twin River Worldwide Holdings, Inc. | 27,500 | 622,875 |
| Wyndham Destinations, Inc. | 30,500 | 1,352,370 |
| Total | | 23,534,795 |
| Household Durables 1.5% |
| Century Communities, Inc.(a) | 36,200 | 1,020,116 |
| Ethan Allen Interiors, Inc. | 35,200 | 605,440 |
| Flexsteel Industries, Inc. | 20,100 | 304,314 |
| Green Brick Partners, Inc.(a) | 38,600 | 354,734 |
| Hooker Furniture Corp. | 49,200 | 878,712 |
| KB Home | 266,183 | 7,477,080 |
| La-Z-Boy, Inc. | 52,147 | 1,661,925 |
| LGI Homes, Inc.(a) | 13,300 | 1,084,083 |
| M/I Homes, Inc.(a) | 11,400 | 411,996 |
| Meritage Homes Corp.(a) | 15,900 | 1,038,906 |
| Taylor Morrison Home Corp., Class A(a) | 52,000 | 1,240,720 |
The accompanying Notes to Financial Statements are an integral part of this statement.
Multi-Manager Small Cap Equity Strategies Fund | Annual Report 2019
| 13 |
Portfolio of Investments (continued)
August 31, 2019
| Common Stocks (continued) |
| Issuer | Shares | Value ($) |
| TopBuild Corp.(a) | 30,900 | 2,861,958 |
| TRI Pointe Group, Inc.(a) | 246,234 | 3,447,276 |
| Tupperware Brands Corp. | 65,500 | 852,155 |
| Zagg, Inc.(a) | 188,300 | 1,207,003 |
| Total | | 24,446,418 |
| Internet & Direct Marketing Retail 0.1% |
| Farfetch Ltd., Class A(a) | 150,141 | 1,468,379 |
| PetMed Express, Inc. | 40,700 | 643,060 |
| RealReal, Inc. (The)(a) | 32,469 | 424,370 |
| Total | | 2,535,809 |
| Leisure Products 0.1% |
| Johnson Outdoors, Inc., Class A | 24,630 | 1,379,280 |
| Nautilus, Inc.(a) | 329,100 | 457,449 |
| Total | | 1,836,729 |
| Multiline Retail 0.2% |
| Dillard’s, Inc., Class A | 5,500 | 321,860 |
| Ollie’s Bargain Outlet Holdings, Inc.(a) | 46,484 | 2,577,538 |
| Total | | 2,899,398 |
| Specialty Retail 2.7% |
| Aaron’s, Inc. | 77,200 | 4,949,292 |
| American Eagle Outfitters, Inc. | 362,401 | 6,095,585 |
| Asbury Automotive Group, Inc.(a) | 10,500 | 990,150 |
| AutoNation, Inc.(a) | 27,000 | 1,281,420 |
| Bed Bath & Beyond, Inc. | 90,920 | 879,196 |
| Buckle, Inc. (The) | 19,800 | 388,080 |
| Camping World Holdings, Inc., Class A | 77,100 | 585,960 |
| Children’s Place, Inc. (The) | 37,000 | 3,228,250 |
| Genesco, Inc.(a) | 85,822 | 3,062,129 |
| Group 1 Automotive, Inc. | 15,700 | 1,173,104 |
| Haverty Furniture Companies, Inc. | 38,400 | 735,360 |
| Hibbett Sports, Inc.(a) | 162,105 | 2,681,217 |
| Hudson Ltd., Class A(a) | 258,508 | 2,804,812 |
| Lithia Motors, Inc., Class A | 42,817 | 5,612,024 |
| National Vision Holdings, Inc.(a) | 196,631 | 5,576,455 |
| Office Depot, Inc. | 639,700 | 831,610 |
| Penske Automotive Group, Inc. | 21,000 | 898,380 |
| Sally Beauty Holdings, Inc.(a) | 78,500 | 960,055 |
| Sonic Automotive, Inc., Class A | 47,000 | 1,264,770 |
| Common Stocks (continued) |
| Issuer | Shares | Value ($) |
| Sportsman’s Warehouse Holdings, Inc.(a) | 78,700 | 332,114 |
| Urban Outfitters, Inc.(a) | 28,000 | 655,480 |
| Zumiez, Inc.(a) | 13,700 | 355,926 |
| Total | | 45,341,369 |
| Textiles, Apparel & Luxury Goods 0.5% |
| Deckers Outdoor Corp.(a) | 14,929 | 2,201,281 |
| G-III Apparel Group Ltd.(a) | 29,100 | 596,841 |
| Movado Group, Inc. | 45,700 | 983,464 |
| Unifi, Inc.(a) | 15,000 | 288,600 |
| Vera Bradley, Inc.(a) | 109,938 | 1,164,244 |
| Wolverine World Wide, Inc. | 143,114 | 3,713,808 |
| Total | | 8,948,238 |
| Total Consumer Discretionary | 178,729,361 |
| Consumer Staples 2.8% |
| Beverages 0.3% |
| MGP Ingredients, Inc. | 121,350 | 5,845,429 |
| Food & Staples Retailing 1.2% |
| BJ’s Wholesale Club Holdings, Inc.(a) | 160,900 | 4,225,234 |
| Grocery Outlet Holding Corp.(a) | 43,359 | 1,753,872 |
| Performance Food Group Co.(a) | 169,832 | 7,946,439 |
| SpartanNash Co. | 52,343 | 563,734 |
| The Chefs’ Warehouse(a) | 129,500 | 4,996,110 |
| Village Super Market, Inc., Class A | 24,900 | 621,753 |
| Total | | 20,107,142 |
| Food Products 0.5% |
| Freshpet, Inc.(a) | 91,583 | 4,494,894 |
| TreeHouse Foods, Inc.(a) | 73,100 | 3,702,515 |
| Total | | 8,197,409 |
| Household Products 0.5% |
| Central Garden & Pet Co., Class A(a) | 88,831 | 2,137,274 |
| Energizer Holdings, Inc. | 32,300 | 1,243,550 |
| WD-40 Co. | 27,000 | 4,922,100 |
| Total | | 8,302,924 |
| Personal Products 0.2% |
| Nu Skin Enterprises, Inc., Class A | 33,000 | 1,340,460 |
| Usana Health Sciences, Inc.(a) | 19,800 | 1,345,806 |
| Total | | 2,686,266 |
The accompanying Notes to Financial Statements are an integral part of this statement.
| 14 | Multi-Manager Small Cap Equity Strategies Fund | Annual Report 2019 |
Portfolio of Investments (continued)
August 31, 2019
| Common Stocks (continued) |
| Issuer | Shares | Value ($) |
| Tobacco 0.1% |
| Universal Corp. | 24,600 | 1,231,476 |
| Total Consumer Staples | 46,370,646 |
| Energy 3.3% |
| Energy Equipment & Services 1.0% |
| C&J Energy Services, Inc.(a) | 133,022 | 1,271,690 |
| Cactus, Inc., Class A(a) | 24,200 | 616,374 |
| Frank’s International NV(a) | 280,200 | 1,218,870 |
| FTS International, Inc.(a) | 427,876 | 1,073,969 |
| Keane Group, Inc.(a) | 168,100 | 890,930 |
| Liberty Oilfield Services, Inc., Class A | 86,900 | 935,913 |
| Mammoth Energy Services, Inc. | 165,300 | 601,692 |
| Matrix Service Co.(a) | 95,682 | 1,901,201 |
| Newpark Resources, Inc.(a) | 347,533 | 2,297,193 |
| Nine Energy Service, Inc.(a) | 54,000 | 295,920 |
| Patterson-UTI Energy, Inc. | 246,600 | 2,133,090 |
| ProPetro Holding Corp.(a) | 201,441 | 2,145,347 |
| Solaris Oilfield Infrastructure, Inc., Class A | 96,400 | 1,325,500 |
| Total | | 16,707,689 |
| Oil, Gas & Consumable Fuels 2.3% |
| Altus Midstream Co., Class A(a) | 262,300 | 605,913 |
| Amplify Energy Corp.(a) | 83,592 | 498,208 |
| Antero Resources Corp.(a) | 155,900 | 494,203 |
| Arch Coal, Inc. | 49,000 | 3,751,440 |
| Berry Petroleum Corp. | 140,800 | 1,124,992 |
| Bonanza Creek Energy, Inc.(a) | 61,200 | 1,380,672 |
| Callon Petroleum Co.(a) | 580,000 | 2,383,800 |
| Centennial Resource Development, Inc., Class A(a) | 135,781 | 654,464 |
| Contango Oil & Gas Co.(a) | 124,000 | 121,520 |
| Delek U.S. Holdings, Inc. | 198,601 | 6,504,183 |
| Earthstone Energy, Inc., Class A(a) | 234,300 | 805,992 |
| Hoegh LNG Partners LP | 18,800 | 274,856 |
| Kosmos Energy Ltd. | 195,500 | 1,235,560 |
| Laredo Petroleum, Inc.(a) | 314,736 | 780,545 |
| Matador Resources Co.(a) | 124,800 | 1,953,120 |
| Oasis Petroleum, Inc.(a) | 358,000 | 1,116,960 |
| Par Pacific Holdings, Inc.(a) | 32,500 | 706,550 |
| PBF Energy, Inc., Class A | 38,700 | 917,190 |
| Common Stocks (continued) |
| Issuer | Shares | Value ($) |
| Range Resources Corp. | 245,300 | 873,268 |
| Renewable Energy Group, Inc.(a) | 52,000 | 632,840 |
| REX American Resources Corp.(a) | 13,800 | 947,784 |
| SM Energy Co. | 134,000 | 1,270,320 |
| Southwestern Energy Co.(a) | 412,000 | 650,960 |
| SRC Energy, Inc.(a) | 550,371 | 2,762,863 |
| Talos Energy, Inc.(a) | 15,500 | 295,120 |
| W&T Offshore, Inc.(a) | 256,668 | 1,124,206 |
| Whiting Petroleum Corp.(a) | 82,600 | 547,638 |
| World Fuel Services Corp. | 93,224 | 3,579,802 |
| Total | | 37,994,969 |
| Total Energy | 54,702,658 |
| Financials 17.8% |
| Banks 10.1% |
| 1st Source Corp. | 46,470 | 2,061,874 |
| Amalgamated Bank, Class A | 37,500 | 601,875 |
| Ameris Bancorp | 95,300 | 3,353,607 |
| Associated Banc-Corp. | 60,508 | 1,164,174 |
| Atlantic Capital Bancshares, Inc.(a) | 66,504 | 1,084,015 |
| Atlantic Union Bankshares Corp. | 153,200 | 5,532,052 |
| BankUnited, Inc. | 38,900 | 1,235,464 |
| Bar Harbor Bankshares | 28,100 | 620,167 |
| Boston Private Financial Holdings, Inc. | 285,544 | 3,032,477 |
| Bridge Bancorp, Inc. | 21,400 | 575,874 |
| Brookline Bancorp, Inc. | 65,900 | 925,236 |
| Bryn Mawr Bank Corp. | 8,800 | 300,080 |
| Camden National Corp. | 15,900 | 659,214 |
| Carolina Financial Corp. | 27,600 | 942,540 |
| Cathay General Bancorp | 265,943 | 8,826,648 |
| Central Pacific Financial Corp. | 91,597 | 2,548,229 |
| City Holding Co. | 9,100 | 676,585 |
| Community Bank System, Inc. | 88,800 | 5,415,912 |
| Community Trust Bancorp, Inc. | 49,714 | 1,933,875 |
| ConnectOne Bancorp, Inc. | 44,300 | 907,264 |
| Customers Bancorp, Inc.(a) | 62,300 | 1,176,847 |
| Eagle Bancorp, Inc. | 16,700 | 680,358 |
| Enterprise Financial Services Corp. | 40,420 | 1,593,356 |
| Equity Bancshares, Inc., Class A(a) | 36,600 | 925,980 |
| Financial Institutions, Inc. | 59,859 | 1,739,503 |
The accompanying Notes to Financial Statements are an integral part of this statement.
Multi-Manager Small Cap Equity Strategies Fund | Annual Report 2019
| 15 |
Portfolio of Investments (continued)
August 31, 2019
| Common Stocks (continued) |
| Issuer | Shares | Value ($) |
| First BanCorp | 123,100 | 1,179,298 |
| First BanCorp | 36,492 | 1,285,248 |
| First Business Financial Services, Inc. | 15,800 | 356,290 |
| First Commonwealth Financial Corp. | 168,058 | 2,078,878 |
| First Financial Bancorp | 41,500 | 971,930 |
| First Financial Bankshares, Inc. | 89,667 | 2,745,604 |
| First Financial Corp. | 21,900 | 889,140 |
| First Hawaiian, Inc. | 51,000 | 1,310,700 |
| First Internet Bancorp | 36,700 | 742,074 |
| First Mid Bancshares, Inc. | 9,900 | 317,691 |
| First of Long Island Corp. (The) | 45,200 | 983,552 |
| Flushing Financial Corp. | 45,400 | 875,766 |
| FNB Corp. | 86,100 | 925,575 |
| Franklin Financial Network, Inc. | 42,800 | 1,238,204 |
| Fulton Financial Corp. | 82,254 | 1,311,951 |
| Great Southern Bancorp, Inc. | 35,350 | 1,991,619 |
| Great Western Bancorp, Inc. | 153,496 | 4,578,786 |
| Hancock Whitney Corp. | 218,658 | 7,677,082 |
| Hanmi Financial Corp. | 174,492 | 3,125,152 |
| Heritage Commerce Corp. | 138,300 | 1,602,897 |
| Heritage Financial Corp. | 101,700 | 2,662,506 |
| Hilltop Holdings, Inc. | 183,354 | 4,354,658 |
| Home Bancshares, Inc. | 35,400 | 627,288 |
| HomeTrust Bancshares, Inc. | 12,700 | 320,294 |
| Hope Bancorp, Inc. | 94,100 | 1,261,881 |
| Horizon Bancorp, Inc. | 40,600 | 660,156 |
| Iberiabank Corp. | 63,737 | 4,397,216 |
| Independent Bank Corp. | 64,000 | 4,327,040 |
| International Bancshares Corp. | 121,439 | 4,322,014 |
| Investors Bancorp, Inc. | 219,304 | 2,434,274 |
| Lakeland Bancorp, Inc. | 84,300 | 1,254,384 |
| Live Oak Bancshares, Inc. | 66,700 | 1,196,598 |
| Metropolitan Bank Holding Corp.(a) | 7,600 | 275,120 |
| Midland States Bancorp, Inc. | 49,300 | 1,270,461 |
| MidWestOne Financial Group, Inc. | 11,600 | 336,052 |
| Northrim BanCorp, Inc. | 9,000 | 325,800 |
| Old National Bancorp | 20,169 | 338,839 |
| Opus Bank | 31,800 | 660,168 |
| Orrstown Financial Services, Inc. | 16,800 | 358,512 |
| Common Stocks (continued) |
| Issuer | Shares | Value ($) |
| Pacific Premier Bancorp, Inc. | 141,000 | 4,153,860 |
| Park National Corp. | 3,500 | 315,280 |
| Peapack Gladstone Financial Corp. | 82,393 | 2,317,715 |
| Peoples Bancorp, Inc. | 24,038 | 738,207 |
| Preferred Bank | 29,268 | 1,462,229 |
| RBB Bancorp | 15,900 | 293,037 |
| Renasant Corp. | 126,200 | 4,138,098 |
| Republic Bancorp, Inc. | 12,900 | 547,605 |
| Sandy Spring Bancorp, Inc. | 225,515 | 7,550,242 |
| Signature Bank | 20,299 | 2,367,878 |
| Simmons First National Corp., Class A | 28,800 | 691,200 |
| South State Corp. | 9,000 | 662,220 |
| Southern National Bancorp of Virginia, Inc. | 43,400 | 634,508 |
| TCF Financial Corp. | 190,495 | 7,345,487 |
| Texas Capital Bancshares, Inc.(a) | 56,663 | 3,053,002 |
| Towne Bank | 12,700 | 333,629 |
| Trico Bancshares | 17,900 | 632,944 |
| Triumph Bancorp, Inc.(a) | 21,200 | 635,788 |
| Trustmark Corp. | 30,600 | 1,000,008 |
| UMB Financial Corp. | 69,000 | 4,300,080 |
| Umpqua Holdings Corp. | 19,900 | 312,629 |
| Univest Corporation of Pennsylvania | 55,583 | 1,406,806 |
| Valley National Bancorp | 130,000 | 1,366,300 |
| Webster Financial Corp. | 37,274 | 1,668,384 |
| WesBanco, Inc. | 8,700 | 297,714 |
| West Bancorporation, Inc. | 15,000 | 312,600 |
| Wintrust Financial Corp. | 55,982 | 3,517,349 |
| Total | | 168,138,703 |
| Capital Markets 1.8% |
| Artisan Partners Asset Management, Inc., Class A | 23,900 | 636,696 |
| Bright sphere Investment Group, Inc. | 59,200 | 538,128 |
| Cowen, Inc.(a) | 149,731 | 2,337,301 |
| Evercore, Inc., Class A | 50,042 | 3,991,350 |
| GAIN Capital Holdings, Inc. | 72,300 | 328,965 |
| GAMCO Investors, Inc., Class A | 16,600 | 293,322 |
| Greenhill & Co., Inc. | 73,234 | 1,028,205 |
| Houlihan Lokey, Inc. | 87,500 | 3,865,750 |
| INTL FCStone, Inc.(a) | 17,000 | 666,570 |
| Legg Mason, Inc. | 35,300 | 1,298,687 |
The accompanying Notes to Financial Statements are an integral part of this statement.
| 16 | Multi-Manager Small Cap Equity Strategies Fund | Annual Report 2019 |
Portfolio of Investments (continued)
August 31, 2019
| Common Stocks (continued) |
| Issuer | Shares | Value ($) |
| Moelis & Co., ADR, Class A | 46,300 | 1,552,439 |
| Och-Ziff Capital Management Group, Inc., Class A | 28,800 | 648,000 |
| Oppenheimer Holdings, Inc., Class A | 38,500 | 1,068,760 |
| PennantPark Investment Corp. | 158,896 | 1,002,634 |
| Stifel Financial Corp. | 83,003 | 4,434,020 |
| Victory Capital Holdings, Inc., Class A(a) | 57,300 | 915,081 |
| Virtu Financial, Inc. Class A | 77,200 | 1,451,360 |
| Virtus Investment Partners, Inc. | 8,600 | 917,534 |
| Waddell & Reed Financial, Inc., Class A | 179,894 | 2,908,886 |
| Westwood Holdings Group, Inc. | 33,000 | 905,850 |
| Total | | 30,789,538 |
| Consumer Finance 0.3% |
| Navient Corp. | 100,100 | 1,275,274 |
| Nelnet, Inc., Class A | 33,787 | 2,265,419 |
| SLM Corp. | 252,100 | 2,127,724 |
| Total | | 5,668,417 |
| Diversified Financial Services 0.1% |
| FGL Holdings | 118,300 | 944,034 |
| Insurance 2.4% |
| Ambac Financial Group, Inc.(a) | 67,800 | 1,223,112 |
| American Equity Investment Life Holding Co. | 225,997 | 4,870,235 |
| AMERISAFE, Inc. | 60,500 | 4,156,350 |
| Argo Group International Holdings Ltd. | 118,501 | 7,787,886 |
| CNO Financial Group, Inc. | 78,763 | 1,140,488 |
| eHealth, Inc.(a) | 10,664 | 888,418 |
| Employers Holdings, Inc. | 105,518 | 4,550,991 |
| Enstar Group Ltd.(a) | 7,700 | 1,375,374 |
| Global Indemnity Ltd | 21,000 | 540,750 |
| Horace Mann Educators Corp. | 30,704 | 1,346,985 |
| MBIA, Inc.(a) | 411,300 | 3,701,700 |
| National General Holdings Corp. | 64,069 | 1,510,747 |
| National Western Life Group, Inc., Class A | 5,100 | 1,314,882 |
| ProAssurance Corp. | 34,400 | 1,344,008 |
| Safety Insurance Group, Inc. | 23,568 | 2,272,898 |
| Stewart Information Services Corp. | 23,500 | 841,770 |
| Third Point Reinsurance Ltd.(a) | 92,500 | 871,350 |
| United Fire Group, Inc. | 13,400 | 605,144 |
| Total | | 40,343,088 |
| Common Stocks (continued) |
| Issuer | Shares | Value ($) |
| Mortgage Real Estate Investment Trusts (REITS) 0.6% |
| Blackstone Mortgage Trust, Inc. | 91,900 | 3,198,120 |
| Colony Credit Real Estate, Inc. | 98,500 | 1,234,205 |
| Ellington Financial, Inc. | 71,200 | 1,243,864 |
| Exantas Capital Corp. | 117,100 | 1,312,691 |
| Great Ajax Corp. | 49,400 | 720,252 |
| Invesco Mortgage Capital, Inc. | 77,200 | 1,160,316 |
| Ready Capital Corp. | 64,603 | 948,372 |
| Total | | 9,817,820 |
| Thrifts & Mortgage Finance 2.5% |
| Axos Financial, Inc.(a) | 170,487 | 4,417,318 |
| Capitol Federal Financial, Inc. | 52,800 | 711,216 |
| Dime Community Bancshares, Inc. | 69,100 | 1,370,253 |
| Essent Group Ltd.(a) | 59,671 | 2,894,044 |
| First Defiance Financial Corp. | 45,618 | 1,192,911 |
| FS Bancorp, Inc. | 6,700 | 324,280 |
| Hingham Institution for Savings | 3,300 | 594,330 |
| HomeStreet, Inc.(a) | 46,800 | 1,234,116 |
| Luther Burbank Corp. | 67,800 | 709,188 |
| Merchants Bancorp | 34,500 | 547,170 |
| Meridian Bancorp, Inc. | 37,200 | 650,256 |
| MGIC Investment Corp. | 334,000 | 4,225,100 |
| NMI Holdings, Inc., Class A(a) | 101,633 | 2,880,279 |
| Northfield Bancorp, Inc. | 70,300 | 1,091,056 |
| OceanFirst Financial Corp. | 122,300 | 2,570,746 |
| Oritani Financial Corp. | 80,400 | 1,377,252 |
| Southern Missouri Bancorp, Inc. | 9,500 | 317,300 |
| Sterling Bancorp, Inc. | 66,400 | 619,512 |
| Territorial Bancorp, Inc. | 12,700 | 347,345 |
| TrustCo Bank Corp. | 362,140 | 2,777,614 |
| United Financial Bancorp, Inc. | 72,000 | 900,000 |
| Walker & Dunlop, Inc. | 66,133 | 3,694,189 |
| Washington Federal, Inc. | 38,844 | 1,382,846 |
| Waterstone Financial, Inc. | 38,900 | 645,351 |
| WSFS Financial Corp. | 101,700 | 4,192,074 |
| Total | | 41,665,746 |
| Total Financials | 297,367,346 |
The accompanying Notes to Financial Statements are an integral part of this statement.
Multi-Manager Small Cap Equity Strategies Fund | Annual Report 2019
| 17 |
Portfolio of Investments (continued)
August 31, 2019
| Common Stocks (continued) |
| Issuer | Shares | Value ($) |
| Health Care 12.9% |
| Biotechnology 3.6% |
| ACADIA Pharmaceuticals, Inc.(a) | 62,002 | 1,714,975 |
| Adverum Biotechnologies, Inc.(a) | 70,304 | 726,240 |
| Alder Biopharmaceuticals, Inc.(a) | 92,900 | 831,455 |
| Atara Biotherapeutics, Inc.(a) | 107,743 | 1,454,531 |
| Avrobio, Inc.(a) | 98,216 | 1,913,248 |
| Biohaven Pharmaceutical Holding Co., Ltd.(a) | 72,143 | 2,827,284 |
| BridgeBio Pharma, Inc.(a) | 27,544 | 839,541 |
| CareDx, Inc.(a) | 20,471 | 467,148 |
| Clementia Pharmaceuticals, Inc.(a),(b),(c),(d) | 134,864 | 0 |
| Coherus Biosciences, Inc.(a) | 181,340 | 4,023,935 |
| Emergent Biosolutions, Inc.(a) | 32,982 | 1,444,612 |
| FibroGen, Inc.(a) | 87,879 | 3,924,676 |
| G1 Therapeutics, Inc.(a) | 81,944 | 2,974,567 |
| Global Blood Therapeutics, Inc.(a) | 20,026 | 920,795 |
| Halozyme Therapeutics, Inc.(a) | 237,173 | 3,918,098 |
| Heron Therapeutics, Inc.(a) | 94,097 | 1,742,676 |
| Homology Medicines, Inc.(a) | 101,559 | 1,920,481 |
| Immunomedics, Inc.(a) | 90,000 | 1,152,000 |
| Intercept Pharmaceuticals, Inc.(a) | 30,725 | 1,971,931 |
| Ligand Pharmaceuticals, Inc.(a) | 62,150 | 5,650,057 |
| Myriad Genetics, Inc.(a) | 41,663 | 980,330 |
| REGENXBIO, Inc.(a) | 53,737 | 1,853,389 |
| Repligen Corp.(a) | 117,100 | 10,868,051 |
| Rubius Therapeutics, Inc.(a) | 52,335 | 485,669 |
| Sage Therapeutics, Inc.(a) | 11,175 | 1,918,412 |
| Spark Therapeutics, Inc.(a) | 5,154 | 502,051 |
| Twist Bioscience Corp.(a) | 105,101 | 3,051,082 |
| Total | | 60,077,234 |
| Health Care Equipment & Supplies 4.4% |
| Cantel Medical Corp. | 159,000 | 14,616,870 |
| CONMED Corp. | 33,968 | 3,422,955 |
| Insulet Corp.(a) | 33,047 | 5,094,856 |
| Integer Holdings Corp.(a) | 23,820 | 1,724,568 |
| iRhythm Technologies, Inc.(a) | 51,888 | 3,949,714 |
| Lantheus Holdings, Inc.(a) | 98,918 | 2,152,456 |
| LeMaitre Vascular, Inc. | 172,400 | 5,458,184 |
| Meridian Bioscience, Inc. | 117,490 | 1,084,433 |
| Common Stocks (continued) |
| Issuer | Shares | Value ($) |
| Merit Medical Systems, Inc.(a) | 168,550 | 5,862,169 |
| Mesa Laboratories, Inc. | 43,600 | 9,645,628 |
| Natus Medical, Inc.(a) | 46,667 | 1,291,743 |
| Neogen Corp.(a) | 151,450 | 10,680,254 |
| Nevro Corp.(a) | 55,145 | 4,617,291 |
| Orthofix Medical, Inc.(a) | 48,948 | 2,488,516 |
| Shockwave Medical, Inc.(a) | 21,319 | 892,200 |
| Total | | 72,981,837 |
| Health Care Providers & Services 1.3% |
| Acadia Healthcare Co., Inc.(a) | 82,755 | 2,189,697 |
| Amedisys, Inc.(a) | 41,036 | 5,281,744 |
| Hanger, Inc.(a) | 64,600 | 1,219,648 |
| LHC Group, Inc.(a) | 31,400 | 3,720,900 |
| Magellan Health, Inc.(a) | 19,200 | 1,209,792 |
| Mednax, Inc.(a) | 54,900 | 1,157,292 |
| National Research Corp., Class A | 58,950 | 3,774,568 |
| Patterson Companies, Inc. | 76,000 | 1,270,720 |
| R1 RCM, Inc.(a) | 164,000 | 1,912,240 |
| Total | | 21,736,601 |
| Health Care Technology 1.7% |
| Computer Programs & Systems, Inc. | 61,500 | 1,300,725 |
| Evolent Health, Inc., Class A(a) | 173,157 | 1,189,589 |
| HMS Holdings Corp.(a) | 84,090 | 3,071,808 |
| Omnicell, Inc.(a) | 149,850 | 10,759,230 |
| Teladoc Health, Inc.(a) | 89,863 | 5,201,270 |
| Vocera Communications, Inc.(a) | 291,675 | 6,693,941 |
| Total | | 28,216,563 |
| Life Sciences Tools & Services 0.7% |
| Adaptive Biotechnologies Corp.(a) | 21,666 | 1,101,716 |
| Bio-Techne Corp. | 30,125 | 5,771,047 |
| Luminex Corp. | 101,574 | 2,082,267 |
| Medpace Holdings, Inc.(a) | 11,200 | 906,192 |
| Personalis, Inc.(a) | 37,246 | 720,710 |
| Syneos Health, Inc.(a) | 31,200 | 1,638,936 |
| Total | | 12,220,868 |
The accompanying Notes to Financial Statements are an integral part of this statement.
| 18 | Multi-Manager Small Cap Equity Strategies Fund | Annual Report 2019 |
Portfolio of Investments (continued)
August 31, 2019
| Common Stocks (continued) |
| Issuer | Shares | Value ($) |
| Pharmaceuticals 1.2% |
| Assertio Therapeutics, Inc.(a) | 203,660 | 293,270 |
| Horizon Therapeutics PLC(a) | 319,294 | 8,822,093 |
| Optinose, Inc.(a) | 129,427 | 991,411 |
| Phibro Animal Health Corp., Class A | 85,927 | 1,774,393 |
| Revance Therapeutics, Inc.(a) | 125,428 | 1,329,537 |
| Taro Pharmaceutical Industries Ltd. | 15,100 | 1,160,586 |
| TherapeuticsMD, Inc.(a) | 549,168 | 1,587,095 |
| Tricida, Inc.(a) | 85,121 | 2,969,872 |
| Total | | 18,928,257 |
| Total Health Care | 214,161,360 |
| Industrials 20.0% |
| Aerospace & Defense 1.4% |
| AAR Corp. | 31,400 | 1,348,944 |
| Axon Enterprise, Inc.(a) | 74,625 | 4,475,261 |
| Hexcel Corp. | 51,453 | 4,329,770 |
| Mercury Systems, Inc.(a) | 119,600 | 10,241,348 |
| Moog, Inc., Class A | 3,600 | 292,500 |
| National Presto Industries, Inc. | 14,200 | 1,217,082 |
| Vectrus, Inc.(a) | 30,600 | 1,238,076 |
| Total | | 23,142,981 |
| Air Freight & Logistics 0.1% |
| Atlas Air Worldwide Holdings, Inc.(a) | 38,214 | 987,832 |
| Airlines 0.4% |
| Hawaiian Holdings, Inc. | 105,334 | 2,571,203 |
| Skywest, Inc. | 69,500 | 3,979,570 |
| Spirit Airlines, Inc.(a) | 26,300 | 987,302 |
| Total | | 7,538,075 |
| Building Products 3.7% |
| AAON, Inc. | 166,300 | 7,977,411 |
| Advanced Drainage Systems, Inc. | 144,747 | 4,543,608 |
| Apogee Enterprises, Inc. | 67,186 | 2,481,179 |
| Armstrong Flooring, Inc.(a) | 183,100 | 1,239,587 |
| Armstrong World Industries, Inc. | 43,500 | 4,152,945 |
| Builders FirstSource, Inc.(a) | 92,017 | 1,789,731 |
| Caesarstone Ltd. | 84,400 | 1,265,156 |
| Continental Building Product(a) | 26,300 | 661,182 |
| Insteel Industries, Inc. | 46,200 | 863,940 |
| Common Stocks (continued) |
| Issuer | Shares | Value ($) |
| Masonite International Corp.(a) | 68,533 | 3,658,977 |
| Quanex Building Products Corp. | 100,910 | 1,737,670 |
| Simpson Manufacturing Co., Inc. | 234,611 | 15,062,026 |
| Trex Company, Inc.(a) | 182,234 | 15,586,474 |
| Universal Forest Products, Inc. | 8,800 | 344,080 |
| Total | | 61,363,966 |
| Commercial Services & Supplies 1.8% |
| ACCO Brands Corp. | 287,294 | 2,663,215 |
| Brink’s Co. (The) | 28,605 | 2,152,526 |
| Casella Waste Systems, Inc., Class A(a) | 88,000 | 4,004,000 |
| Deluxe Corp. | 23,200 | 1,069,056 |
| Ennis, Inc. | 42,300 | 850,653 |
| Herman Miller, Inc. | 49,424 | 2,089,647 |
| Interface, Inc. | 56,600 | 625,430 |
| Kimball International, Inc., Class B | 62,604 | 1,098,700 |
| Knoll, Inc. | 33,100 | 763,286 |
| MSA Safety, Inc. | 48,528 | 5,126,013 |
| Quad/Graphics, Inc. | 146,600 | 1,317,934 |
| Steelcase, Inc., Class A | 279,120 | 4,334,734 |
| Unifirst Corp. | 23,221 | 4,549,226 |
| Total | | 30,644,420 |
| Construction & Engineering 0.8% |
| Arcosa, Inc. | 8,700 | 282,663 |
| Granite Construction, Inc. | 80,000 | 2,275,200 |
| Great Lakes Dredge & Dock Corp.(a) | 199,768 | 2,165,485 |
| MasTec, Inc.(a) | 86,400 | 5,431,968 |
| MYR Group, Inc.(a) | 9,000 | 258,030 |
| Primoris Services Corp. | 49,800 | 973,092 |
| Tutor Perini Corp.(a) | 127,000 | 1,268,730 |
| Valmont Industries, Inc. | 8,000 | 1,084,000 |
| Total | | 13,739,168 |
| Electrical Equipment 1.0% |
| AZZ, Inc. | 22,300 | 920,321 |
| Encore Wire Corp. | 28,878 | 1,559,123 |
| EnerSys | 20,200 | 1,131,200 |
| Generac Holdings, Inc.(a) | 85,430 | 6,662,686 |
| GrafTech International Ltd. | 114,900 | 1,400,631 |
| Preformed Line Products Co. | 10,700 | 548,375 |
The accompanying Notes to Financial Statements are an integral part of this statement.
Multi-Manager Small Cap Equity Strategies Fund | Annual Report 2019
| 19 |
Portfolio of Investments (continued)
August 31, 2019
| Common Stocks (continued) |
| Issuer | Shares | Value ($) |
| Sunrun, Inc.(a) | 240,000 | 3,679,200 |
| Thermon(a) | 14,100 | 306,675 |
| Total | | 16,208,211 |
| Machinery 5.1% |
| Albany International Corp., Class A | 57,900 | 4,760,538 |
| Astec Industries, Inc. | 33,300 | 919,080 |
| Blue Bird Corp.(a) | 65,800 | 1,200,192 |
| Chart Industries, Inc.(a) | 40,332 | 2,534,463 |
| Columbus McKinnon Corp. | 37,879 | 1,226,143 |
| Commercial Vehicle Group, Inc.(a) | 177,100 | 1,124,585 |
| Douglas Dynamics, Inc. | 181,125 | 7,563,780 |
| EnPro Industries, Inc. | 20,100 | 1,251,828 |
| ESCO Technologies, Inc. | 118,350 | 9,009,985 |
| Evoqua Water Technologies Corp.(a) | 192,000 | 2,968,320 |
| Graco, Inc. | 76,585 | 3,489,978 |
| Graham Corp. | 32,100 | 590,961 |
| Greenbrier Companies, Inc. (The) | 54,032 | 1,258,405 |
| Helios Technologies, Inc. | 147,450 | 6,309,386 |
| Hillenbrand, Inc. | 34,100 | 935,704 |
| Hyster-Yale Materials Handling, Inc. | 12,200 | 665,510 |
| ITT, Inc. | 68,810 | 3,916,665 |
| John Bean Technologies Corp. | 103,726 | 10,613,244 |
| Kennametal, Inc. | 58,100 | 1,736,609 |
| Meritor, Inc.(a) | 72,900 | 1,226,178 |
| Miller Industries, Inc. | 21,400 | 669,606 |
| Mueller Water Products, Inc., Class A | 63,800 | 667,348 |
| Navistar International Corp.(a) | 146,500 | 3,369,500 |
| Omega Flex, Inc. | 200 | 16,840 |
| Oshkosh Corp. | 20,027 | 1,407,297 |
| Proto Labs, Inc.(a) | 59,000 | 5,589,660 |
| RBC Bearings, Inc.(a) | 23,150 | 3,693,120 |
| REV Group, Inc. | 47,000 | 605,830 |
| Spartan Motors, Inc. | 30,500 | 384,605 |
| SPX FLOW, Inc.(a) | 57,791 | 1,948,135 |
| Terex Corp. | 50,800 | 1,261,364 |
| Timken Co. (The) | 15,600 | 626,808 |
| Wabash National Corp. | 158,693 | 2,164,573 |
| Total | | 85,706,240 |
| Common Stocks (continued) |
| Issuer | Shares | Value ($) |
| Marine 0.2% |
| Kirby Corp.(a) | 22,545 | 1,659,087 |
| Matson, Inc. | 36,000 | 1,279,080 |
| Total | | 2,938,167 |
| Professional Services 2.1% |
| BG Staffing, Inc. | 29,700 | 556,578 |
| CBIZ, Inc.(a) | 103,153 | 2,304,438 |
| Exponent, Inc. | 233,525 | 16,554,588 |
| GP Strategies Corp.(a) | 41,300 | 531,944 |
| ICF International, Inc. | 50,200 | 4,249,932 |
| InnerWorkings, Inc.(a) | 169,100 | 716,984 |
| Kelly Services, Inc., Class A | 38,500 | 932,085 |
| Kforce, Inc. | 88,100 | 2,866,774 |
| Korn/Ferry International | 86,000 | 3,360,880 |
| Resources Connection, Inc. | 40,000 | 662,000 |
| TrueBlue, Inc.(a) | 107,242 | 2,081,567 |
| Total | | 34,817,770 |
| Road & Rail 1.0% |
| ArcBest Corp. | 56,011 | 1,658,486 |
| Covenant Transportation Group, Inc., Class A(a) | 244,294 | 3,512,948 |
| Hertz Global Holdings, Inc.(a) | 102,246 | 1,238,199 |
| Ryder System, Inc. | 49,556 | 2,387,112 |
| Saia, Inc.(a) | 67,552 | 5,778,398 |
| Schneider National, Inc., Class B | 18,000 | 349,920 |
| Universal Logistics Holdings, Inc. | 29,600 | 620,120 |
| Werner Enterprises, Inc. | 21,500 | 702,620 |
| Total | | 16,247,803 |
| Trading Companies & Distributors 2.4% |
| Aircastle Ltd. | 117,383 | 2,564,818 |
| Applied Industrial Technologies, Inc. | 50,116 | 2,675,693 |
| BMC Stock Holdings, Inc.(a) | 97,118 | 2,469,711 |
| DXP Enterprises, Inc.(a) | 19,800 | 642,510 |
| EVI Industries, Inc. | 49,975 | 1,489,755 |
| Foundation Building Materials, Inc.(a) | 70,998 | 1,216,196 |
| H&E Equipment Services, Inc. | 95,237 | 2,313,307 |
| Herc Holdings Inc(a) | 26,053 | 1,075,468 |
| NOW, Inc.(a) | 169,900 | 2,020,111 |
| Rush Enterprises, Inc., Class A | 203,256 | 7,339,574 |
The accompanying Notes to Financial Statements are an integral part of this statement.
| 20 | Multi-Manager Small Cap Equity Strategies Fund | Annual Report 2019 |
Portfolio of Investments (continued)
August 31, 2019
| Common Stocks (continued) |
| Issuer | Shares | Value ($) |
| SiteOne Landscape Supply, Inc.(a) | 146,279 | 11,439,018 |
| Triton International Ltd. | 74,100 | 2,382,315 |
| WESCO International, Inc.(a) | 69,896 | 3,150,911 |
| Total | | 40,779,387 |
| Total Industrials | 334,114,020 |
| Information Technology 16.8% |
| Communications Equipment 1.2% |
| Casa Systems, Inc.(a) | 117,000 | 673,920 |
| Ciena Corp.(a) | 213,738 | 8,748,296 |
| CommScope Holding Co., Inc.(a) | 57,300 | 615,402 |
| Comtech Telecommunications Corp. | 28,405 | 759,834 |
| Lumentum Holdings, Inc.(a) | 65,500 | 3,652,280 |
| NETGEAR, Inc.(a) | 19,800 | 687,456 |
| Plantronics, Inc. | 31,300 | 972,491 |
| Viavi Solutions, Inc.(a) | 241,900 | 3,359,991 |
| Total | | 19,469,670 |
| Electronic Equipment, Instruments & Components 3.1% |
| Anixter International, Inc.(a) | 22,400 | 1,343,328 |
| AVX Corp. | 90,600 | 1,227,630 |
| Belden, Inc. | 67,153 | 3,062,848 |
| Benchmark Electronics, Inc. | 108,666 | 2,877,476 |
| CTS Corp. | 26,713 | 762,122 |
| ePlus, Inc.(a) | 9,200 | 751,824 |
| Fabrinet(a) | 57,253 | 2,890,704 |
| Insight Enterprises, Inc.(a) | 81,383 | 3,911,267 |
| Kimball Electronics, Inc.(a) | 69,300 | 915,453 |
| Littelfuse, Inc. | 16,329 | 2,548,467 |
| Methode Electronics, Inc. | 38,700 | 1,228,338 |
| MTS Systems Corp. | 33,902 | 1,928,007 |
| Novanta, Inc.(a) | 70,525 | 5,289,375 |
| PC Connection, Inc. | 27,200 | 958,256 |
| Plexus Corp.(a) | 23,800 | 1,361,598 |
| Rogers Corp.(a) | 54,400 | 7,203,648 |
| Sanmina Corp.(a) | 44,000 | 1,271,600 |
| Scansource, Inc.(a) | 30,300 | 856,278 |
| SYNNEX Corp. | 46,000 | 3,855,260 |
| Tech Data Corp.(a) | 46,171 | 4,281,437 |
| Vishay Intertechnology, Inc. | 252,682 | 3,999,956 |
| Total | | 52,524,872 |
| Common Stocks (continued) |
| Issuer | Shares | Value ($) |
| IT Services 1.7% |
| Cass Information Systems, Inc. | 14,200 | 718,520 |
| CSG Systems International, Inc. | 23,100 | 1,244,628 |
| KBR, Inc. | 181,800 | 4,639,536 |
| Mantech International Corp., Class A | 74,924 | 5,265,659 |
| MongoDB, Inc.(a) | 16,552 | 2,521,035 |
| NIC, Inc. | 44,000 | 916,080 |
| Presidio, Inc. | 129,757 | 2,078,707 |
| Science Applications International Corp. | 39,900 | 3,511,599 |
| Sykes Enterprises, Inc.(a) | 93,471 | 2,710,659 |
| Wix.com Ltd.(a) | 32,578 | 4,569,065 |
| Total | | 28,175,488 |
| Semiconductors & Semiconductor Equipment 2.6% |
| Amkor Technology, Inc.(a) | 377,358 | 3,301,883 |
| Cohu, Inc. | 147,000 | 1,752,240 |
| Diodes, Inc.(a) | 121,775 | 4,450,876 |
| Entegris, Inc. | 209,057 | 8,953,911 |
| Inphi Corp.(a) | 92,434 | 5,656,036 |
| Kulicke & Soffa Industries, Inc. | 115,000 | 2,395,450 |
| MKS Instruments, Inc. | 60,672 | 4,750,011 |
| Monolithic Power Systems, Inc. | 37,134 | 5,590,895 |
| Photronics, Inc.(a) | 117,900 | 1,273,320 |
| Rudolph Technologies, Inc.(a) | 87,903 | 1,932,987 |
| Semtech Corp.(a) | 88,337 | 3,707,504 |
| Total | | 43,765,113 |
| Software 8.1% |
| ACI Worldwide, Inc.(a) | 262,175 | 7,807,571 |
| Altair Engineering, Inc., Class A(a) | 98,900 | 3,398,204 |
| Anaplan, Inc.(a) | 78,262 | 4,251,974 |
| Avaya Holdings Corp.(a) | 235,000 | 3,318,200 |
| Blackbaud, Inc. | 100,275 | 9,122,017 |
| Blackline, Inc.(a) | 116,650 | 5,940,985 |
| Bottomline Technologies de, Inc.(a) | 191,150 | 7,883,026 |
| Coupa Software, Inc.(a) | 18,207 | 2,529,499 |
| CyberArk Software Ltd.(a) | 25,551 | 2,870,399 |
| Descartes Systems Group, Inc. (The)(a) | 340,825 | 12,092,471 |
| Dynatrace, Inc.(a) | 59,409 | 1,365,219 |
| Ebix, Inc. | 34,900 | 1,236,158 |
The accompanying Notes to Financial Statements are an integral part of this statement.
Multi-Manager Small Cap Equity Strategies Fund | Annual Report 2019
| 21 |
Portfolio of Investments (continued)
August 31, 2019
| Common Stocks (continued) |
| Issuer | Shares | Value ($) |
| Elastic NV(a) | 33,634 | 2,956,092 |
| Envestnet, Inc.(a) | 86,804 | 4,966,057 |
| Five9, Inc.(a) | 50,825 | 3,212,648 |
| HubSpot, Inc.(a) | 14,093 | 2,814,090 |
| Medallia, Inc.(a) | 20,348 | 724,796 |
| New Relic, Inc.(a) | 16,324 | 936,018 |
| Pagerduty, Inc.(a) | 40,002 | 1,570,879 |
| Paylocity Holding Corp.(a) | 59,525 | 6,501,321 |
| Pluralsight, Inc., Class A(a) | 111,514 | 1,795,375 |
| Proofpoint, Inc.(a) | 37,049 | 4,209,137 |
| PROS Holdings, Inc.(a) | 156,525 | 11,116,405 |
| RingCentral, Inc., Class A(a) | 13,067 | 1,844,146 |
| SailPoint Technologies Holding, Inc.(a) | 152,553 | 3,437,019 |
| Smartsheet, Inc., Class A(a) | 66,633 | 3,238,364 |
| SPS Commerce, Inc.(a) | 124,550 | 6,294,757 |
| Trade Desk, Inc. (The), Class A(a) | 5,642 | 1,386,634 |
| Tyler Technologies, Inc.(a) | 28,575 | 7,330,631 |
| Verint Systems, Inc.(a) | 56,000 | 2,984,240 |
| Zendesk, Inc.(a) | 31,427 | 2,520,445 |
| Zscaler, Inc.(a) | 43,907 | 3,018,167 |
| Total | | 134,672,944 |
| Technology Hardware, Storage & Peripherals 0.1% |
| Super Micro Computer, Inc.(a) | 68,000 | 1,282,140 |
| Total Information Technology | 279,890,227 |
| Materials 3.1% |
| Chemicals 1.6% |
| American Vanguard Corp. | 46,300 | 656,071 |
| Balchem Corp. | 80,475 | 7,145,375 |
| Cabot Corp. | 21,100 | 844,000 |
| Ferro Corp.(a) | 157,475 | 1,604,670 |
| FutureFuel Corp. | 55,700 | 600,446 |
| Innophos Holdings, Inc. | 33,200 | 932,588 |
| Koppers Holdings, Inc.(a) | 13,800 | 365,838 |
| Kraton Performance Polymers, Inc.(a) | 94,123 | 2,582,735 |
| Livent Corp.(a) | 306,500 | 1,884,975 |
| Minerals Technologies, Inc. | 11,900 | 573,580 |
| Orion Engineered Carbons SA | 134,500 | 1,870,895 |
| PolyOne Corp. | 22,200 | 710,622 |
| Stepan Co. | 34,452 | 3,286,377 |
| Common Stocks (continued) |
| Issuer | Shares | Value ($) |
| Trinseo SA | 94,190 | 3,305,127 |
| Valvoline, Inc. | 36,100 | 815,860 |
| Total | | 27,179,159 |
| Containers & Packaging 0.1% |
| Greif, Inc., Class A | 10,400 | 365,976 |
| Silgan Holdings, Inc. | 21,900 | 651,744 |
| Total | | 1,017,720 |
| Metals & Mining 1.0% |
| Allegheny Technologies, Inc.(a) | 88,564 | 1,755,338 |
| Carpenter Technology Corp. | 66,900 | 3,254,016 |
| Century Aluminum Co.(a) | 114,400 | 630,344 |
| Cleveland-Cliffs, Inc. | 450,300 | 3,575,382 |
| Kaiser Aluminum Corp. | 10,147 | 897,299 |
| Materion Corp. | 61,200 | 3,601,008 |
| Schnitzer Steel Industries, Inc., Class A | 55,047 | 1,218,741 |
| Worthington Industries, Inc. | 27,200 | 943,840 |
| Total | | 15,875,968 |
| Paper & Forest Products 0.4% |
| Boise Cascade Co. | 101,028 | 3,172,279 |
| Domtar Corp. | 30,774 | 1,014,003 |
| Louisiana-Pacific Corp. | 92,410 | 2,221,537 |
| Mercer International, Inc. | 51,200 | 616,448 |
| Total | | 7,024,267 |
| Total Materials | 51,097,114 |
| Real Estate 5.8% |
| Equity Real Estate Investment Trusts (REITS) 5.2% |
| Alexander & Baldwin, Inc. | 146,726 | 3,358,558 |
| American Assets Trust, Inc. | 152,652 | 7,153,273 |
| Braemar Hotels & Resorts, Inc. | 115,972 | 1,063,463 |
| Brandywine Realty Trust | 181,200 | 2,600,220 |
| CareTrust REIT, Inc. | 133,306 | 3,171,350 |
| Chesapeake Lodging Trust | 115,930 | 2,985,197 |
| Colony Capital, Inc. | 278,300 | 1,252,350 |
| CoreCivic, Inc. | 94,000 | 1,593,300 |
| CubeSmart | 63,210 | 2,268,607 |
| EastGroup Properties, Inc. | 21,953 | 2,733,588 |
| First Industrial Realty Trust, Inc. | 263,180 | 10,250,861 |
| Getty Realty Corp. | 59,742 | 1,897,406 |
The accompanying Notes to Financial Statements are an integral part of this statement.
| 22 | Multi-Manager Small Cap Equity Strategies Fund | Annual Report 2019 |
Portfolio of Investments (continued)
August 31, 2019
| Common Stocks (continued) |
| Issuer | Shares | Value ($) |
| Hudson Pacific Properties, Inc. | 92,100 | 3,131,400 |
| Lexington Realty Trust | 170,311 | 1,769,531 |
| Mack-Cali Realty Corp. | 153,200 | 3,120,684 |
| National Health Investors, Inc. | 24,822 | 2,059,233 |
| National Storage Affiliates Trust | 103,165 | 3,451,901 |
| Physicians Realty Trust | 155,468 | 2,692,706 |
| Piedmont Office Realty Trust, Inc. | 201,020 | 3,968,135 |
| Preferred Apartment Communities, Inc., Class A | 73,517 | 989,539 |
| PS Business Parks, Inc. | 48,146 | 8,647,503 |
| Saul Centers, Inc. | 23,337 | 1,172,218 |
| Seritage Growth Properties, Class A | 32,400 | 1,266,516 |
| STAG Industrial, Inc. | 42,056 | 1,222,988 |
| Sunstone Hotel Investors, Inc. | 497,075 | 6,531,565 |
| Terreno Realty Corp. | 48,057 | 2,429,762 |
| Xenia Hotels & Resorts, Inc. | 171,347 | 3,462,923 |
| Total | | 86,244,777 |
| Real Estate Management & Development 0.6% |
| Consolidated-Tomoka Land Co. | 16,400 | 1,046,976 |
| FirstService Corp. | 67,825 | 7,046,339 |
| Five Point Holdings LLC, Class A(a) | 88,400 | 620,568 |
| Marcus & Millichap, Inc.(a) | 21,300 | 768,504 |
| Realogy Holdings Corp. | 135,571 | 648,029 |
| Total | | 10,130,416 |
| Total Real Estate | 96,375,193 |
| Utilities 3.4% |
| Electric Utilities 1.6% |
| Allete, Inc. | 15,200 | 1,303,096 |
| El Paso Electric Co. | 19,925 | 1,328,998 |
| IDACORP, Inc. | 32,050 | 3,519,410 |
| Otter Tail Corp. | 25,058 | 1,268,436 |
| PNM Resources, Inc. | 166,158 | 8,475,720 |
| Portland General Electric Co. | 166,242 | 9,457,507 |
| Spark Energy, Inc., Class A | 98,600 | 932,756 |
| Total | | 26,285,923 |
| Common Stocks (continued) |
| Issuer | Shares | Value ($) |
| Gas Utilities 1.2% |
| New Jersey Resources Corp. | 106,900 | 4,889,606 |
| Northwest Natural Holding Co. | 18,900 | 1,348,704 |
| ONE Gas, Inc. | 51,000 | 4,672,110 |
| South Jersey Industries, Inc. | 148,800 | 4,812,192 |
| Southwest Gas Holdings, Inc. | 37,100 | 3,384,633 |
| Spire, Inc. | 14,900 | 1,265,010 |
| Star Group LP | 66,700 | 613,640 |
| Total | | 20,985,895 |
| Multi-Utilities 0.5% |
| Avista Corp. | 29,100 | 1,364,790 |
| Black Hills Corp. | 53,478 | 4,102,297 |
| NorthWestern Corp. | 17,785 | 1,288,346 |
| Unitil Corp. | 21,500 | 1,297,955 |
| Total | | 8,053,388 |
| Water Utilities 0.1% |
| California Water Service Group | 21,800 | 1,230,392 |
| Total Utilities | 56,555,598 |
Total Common Stocks
(Cost $1,610,431,528) | 1,633,144,120 |
|
| Limited Partnerships 0.2% |
| | |
| Energy 0.1% |
| Oil, Gas & Consumable Fuels 0.1% |
| CNX Midstream Partners LP | 45,800 | 648,070 |
| Hess Midstream Partners LP | 31,800 | 603,882 |
| Noble Midstream Partners LP | 21,700 | 527,961 |
| Oasis Midstream Partners LP | 35,600 | 540,052 |
| Total | | 2,319,965 |
| Total Energy | 2,319,965 |
| Utilities 0.1% |
| Gas Utilities 0.1% |
| Suburban Propane Partners LP | 53,700 | 1,252,284 |
| Total Utilities | 1,252,284 |
Total Limited Partnerships
(Cost $3,904,953) | 3,572,249 |
|
The accompanying Notes to Financial Statements are an integral part of this statement.
Multi-Manager Small Cap Equity Strategies Fund | Annual Report 2019
| 23 |
Portfolio of Investments (continued)
August 31, 2019
| Money Market Funds 2.1% |
| | Shares | Value ($) |
| Columbia Short-Term Cash Fund, 2.208%(e),(f) | 34,979,407 | 34,975,909 |
Total Money Market Funds
(Cost $34,975,910) | 34,975,909 |
Total Investments in Securities
(Cost: $1,649,312,391) | 1,671,692,278 |
| Other Assets & Liabilities, Net | | (4,306,613) |
| Net Assets | 1,667,385,665 |
Notes to Portfolio of Investments
| (a) | Non-income producing investment. |
| (b) | Represents fair value as determined in good faith under procedures approved by the Board of Trustees. At August 31, 2019, the total value of these securities amounted to $0, which represents less than 0.01% of total net assets. |
| (c) | Negligible market value. |
| (d) | Valuation based on significant unobservable inputs. |
| (e) | The rate shown is the seven-day current annualized yield at August 31, 2019. |
| (f) | As defined in the Investment Company Act of 1940, an affiliated company is one in which the Fund owns 5% or more of the company’s outstanding voting securities, or a company which is under common ownership or control with the Fund. Holdings and transactions in these affiliated companies during the year ended August 31, 2019 are as follows: |
| Issuer | Beginning
shares | Shares
purchased | Shares
sold | Ending
shares | Realized gain
(loss) —
affiliated
issuers ($) | Net change in
unrealized
appreciation
(depreciation) —
affiliated
issuers ($) | Dividends —
affiliated
issuers ($) | Value —
affiliated
issuers
at end of
period ($) |
| Columbia Short-Term Cash Fund, 2.208% |
| | 52,399,234 | 570,823,291 | (588,243,118) | 34,979,407 | 93 | 79 | 1,030,835 | 34,975,909 |
Abbreviation Legend
| ADR | American Depositary Receipt |
Fair value measurements
The Fund categorizes its fair value measurements according to a three-level hierarchy that maximizes the use of observable inputs and minimizes the use of unobservable inputs by prioritizing that the most observable input be used when available. Observable inputs are those that market participants would use in pricing an investment based on market data obtained from sources independent of the reporting entity. Unobservable inputs are those that reflect the Fund’s assumptions about the information market participants would use in pricing an investment. An investment’s level within the fair value hierarchy is based on the lowest level of any input that is deemed significant to the asset’s or liability’s fair value measurement. The input levels are not necessarily an indication of the risk or liquidity associated with investments at that level. For example, certain U.S. government securities are generally high quality and liquid, however, they are reflected as Level 2 because the inputs used to determine fair value may not always be quoted prices in an active market.
Fair value inputs are summarized in the three broad levels listed below:
| ■ | Level 1 — Valuations based on quoted prices for investments in active markets that the Fund has the ability to access at the measurement date. Valuation adjustments are not applied to Level 1 investments. |
| ■ | Level 2 — Valuations based on other significant observable inputs (including quoted prices for similar securities, interest rates, prepayment speeds, credit risks, etc.). |
| ■ | Level 3 — Valuations based on significant unobservable inputs (including the Fund’s own assumptions and judgment in determining the fair value of investments). |
Inputs that are used in determining fair value of an investment may include price information, credit data, volatility statistics, and other factors. These inputs can be either observable or unobservable. The availability of observable inputs can vary between investments, and is affected by various factors such as the type of investment, and the volume and level of activity for that investment or similar investments in the marketplace. The inputs will be considered by the Investment Manager, along with any other relevant factors in the calculation of an investment’s fair value. The Fund uses prices and inputs that are current as of the measurement date, which may include periods of market dislocations. During these periods, the availability of prices and inputs may be reduced for many investments. This condition could cause an investment to be reclassified between the various levels within the hierarchy.
Investments falling into the Level 3 category are primarily supported by quoted prices from brokers and dealers participating in the market for those investments. However, these may be classified as Level 3 investments due to lack of market transparency and corroboration to support these quoted prices. Additionally, valuation models may be used as the pricing source for any remaining investments classified as Level 3. These models may rely on one or more significant unobservable inputs and/or significant assumptions by the Investment Manager. Inputs used in valuations may include, but are not limited to, financial statement analysis, capital account balances, discount rates and estimated cash flows, and comparable company data.
The accompanying Notes to Financial Statements are an integral part of this statement.
| 24 | Multi-Manager Small Cap Equity Strategies Fund | Annual Report 2019 |
Portfolio of Investments (continued)
August 31, 2019
Fair value measurements (continued)
Under the direction of the Fund’s Board of Trustees (the Board), the Investment Manager’s Valuation Committee (the Committee) is responsible for overseeing the valuation procedures approved by the Board. The Committee consists of voting and non-voting members from various groups within the Investment Manager’s organization, including operations and accounting, trading and investments, compliance, risk management and legal.
The Committee meets at least monthly to review and approve valuation matters, which may include a description of specific valuation determinations, data regarding pricing information received from approved pricing vendors and brokers and the results of Board-approved valuation control policies and procedures (the Policies). The Policies address, among other things, instances when market quotations are or are not readily available, including recommendations of third party pricing vendors and a determination of appropriate pricing methodologies; events that require specific valuation determinations and assessment of fair value techniques; securities with a potential for stale pricing, including those that are illiquid, restricted, or in default; and the effectiveness of third party pricing vendors, including periodic reviews of vendors. The Committee meets more frequently, as needed, to discuss additional valuation matters, which may include the need to review back-testing results, review time-sensitive information or approve related valuation actions. The Committee reports to the Board, with members of the Committee meeting with the Board at each of its regularly scheduled meetings to discuss valuation matters and actions during the period, similar to those described earlier.
The following table is a summary of the inputs used to value the Fund’s investments at August 31, 2019:
| | Level 1 ($) | Level 2 ($) | Level 3 ($) | Total ($) |
| Investments in Securities | | | | |
| Common Stocks | | | | |
| Communication Services | 23,780,597 | — | — | 23,780,597 |
| Consumer Discretionary | 178,729,361 | — | — | 178,729,361 |
| Consumer Staples | 46,370,646 | — | — | 46,370,646 |
| Energy | 54,702,658 | — | — | 54,702,658 |
| Financials | 297,367,346 | — | — | 297,367,346 |
| Health Care | 214,161,360 | — | 0* | 214,161,360 |
| Industrials | 334,114,020 | — | — | 334,114,020 |
| Information Technology | 278,608,087 | 1,282,140 | — | 279,890,227 |
| Materials | 51,097,114 | — | — | 51,097,114 |
| Real Estate | 96,375,193 | — | — | 96,375,193 |
| Utilities | 56,555,598 | — | — | 56,555,598 |
| Total Common Stocks | 1,631,861,980 | 1,282,140 | 0* | 1,633,144,120 |
| Limited Partnerships | | | | |
| Energy | 2,319,965 | — | — | 2,319,965 |
| Utilities | 1,252,284 | — | — | 1,252,284 |
| Total Limited Partnerships | 3,572,249 | — | — | 3,572,249 |
| Money Market Funds | 34,975,909 | — | — | 34,975,909 |
| Total Investments in Securities | 1,670,410,138 | 1,282,140 | 0* | 1,671,692,278 |
See the Portfolio of Investments for all investment classifications not indicated in the table.
The Fund’s assets assigned to the Level 2 input category are generally valued using the market approach, in which a security’s value is determined through reference to prices and information from market transactions for similar or identical assets.
The Fund does not hold any significant investments (greater than one percent of net assets) categorized as Level 3.
The accompanying Notes to Financial Statements are an integral part of this statement.
Multi-Manager Small Cap Equity Strategies Fund | Annual Report 2019
| 25 |
Statement of Assets and Liabilities
August 31, 2019
| Assets | |
| Investments in securities, at value | |
| Unaffiliated issuers (cost $1,614,336,481) | $1,636,716,369 |
| Affiliated issuers (cost $34,975,910) | 34,975,909 |
| Receivable for: | |
| Investments sold | 5,123,587 |
| Capital shares sold | 2,476,243 |
| Dividends | 1,343,411 |
| Foreign tax reclaims | 2,659 |
| Expense reimbursement due from Investment Manager | 3,759 |
| Prepaid expenses | 10,844 |
| Trustees’ deferred compensation plan | 64,987 |
| Total assets | 1,680,717,768 |
| Liabilities | |
| Payable for: | |
| Investments purchased | 10,502,660 |
| Capital shares purchased | 2,262,439 |
| Management services fees | 37,248 |
| Distribution and/or service fees | 21 |
| Transfer agent fees | 280,306 |
| Compensation of chief compliance officer | 117 |
| Other expenses | 184,325 |
| Trustees’ deferred compensation plan | 64,987 |
| Total liabilities | 13,332,103 |
| Net assets applicable to outstanding capital stock | $1,667,385,665 |
| Represented by | |
| Paid in capital | 1,610,060,378 |
| Total distributable earnings (loss) (Note 2) | 57,325,287 |
| Total - representing net assets applicable to outstanding capital stock | $1,667,385,665 |
| Class A | |
| Net assets | $3,035,245 |
| Shares outstanding | 210,957 |
| Net asset value per share | $14.39 |
| Institutional Class | |
| Net assets | $1,664,350,420 |
| Shares outstanding | 115,645,806 |
| Net asset value per share | $14.39 |
The accompanying Notes to Financial Statements are an integral part of this statement.
| 26 | Multi-Manager Small Cap Equity Strategies Fund | Annual Report 2019 |
Statement of Operations
Year Ended August 31, 2019
| Net investment income | |
| Income: | |
| Dividends — unaffiliated issuers | $21,217,767 |
| Dividends — affiliated issuers | 1,030,835 |
| Interfund lending | 337 |
| Foreign taxes withheld | (34,133) |
| Total income | 22,214,806 |
| Expenses: | |
| Management services fees | 14,241,229 |
| Distribution and/or service fees | |
| Class A | 8,742 |
| Transfer agent fees | |
| Class A | 7,249 |
| Institutional Class | 3,599,036 |
| Compensation of board members | 38,379 |
| Custodian fees | 60,945 |
| Printing and postage fees | 380,955 |
| Registration fees | 142,371 |
| Audit fees | 57,013 |
| Legal fees | 36,593 |
| Compensation of chief compliance officer | 709 |
| Other | 47,478 |
| Total expenses | 18,620,699 |
| Fees waived or expenses reimbursed by Investment Manager and its affiliates | (266,244) |
| Total net expenses | 18,354,455 |
| Net investment income | 3,860,351 |
| Realized and unrealized gain (loss) — net | |
| Net realized gain (loss) on: | |
| Investments — unaffiliated issuers | 45,356,314 |
| Investments — affiliated issuers | 93 |
| Net realized gain | 45,356,407 |
| Net change in unrealized appreciation (depreciation) on: | |
| Investments — unaffiliated issuers | (278,000,641) |
| Investments — affiliated issuers | 79 |
| Net change in unrealized appreciation (depreciation) | (278,000,562) |
| Net realized and unrealized loss | (232,644,155) |
| Net decrease in net assets resulting from operations | $(228,783,804) |
The accompanying Notes to Financial Statements are an integral part of this statement.
Multi-Manager Small Cap Equity Strategies Fund | Annual Report 2019
| 27 |
Statement of Changes in Net Assets
| | Year Ended
August 31, 2019 | Year Ended
August 31, 2018 |
| Operations | | |
| Net investment income (loss) | $3,860,351 | $(487,060) |
| Net realized gain | 45,356,407 | 134,891,945 |
| Net change in unrealized appreciation (depreciation) | (278,000,562) | 162,272,949 |
| Net increase (decrease) in net assets resulting from operations | (228,783,804) | 296,677,834 |
| Distributions to shareholders | | |
| Net investment income and net realized gains | | |
| Class A | (236,989) | |
| Institutional Class | (122,843,093) | |
| Net investment income | | |
| Institutional Class | | (690,526) |
| Net realized gains | | |
| Class A | | (382,132) |
| Institutional Class | | (90,388,847) |
| Total distributions to shareholders (Note 2) | (123,080,082) | (91,461,505) |
| Increase in net assets from capital stock activity | 219,818,477 | 624,555,700 |
| Total increase (decrease) in net assets | (132,045,409) | 829,772,029 |
| Net assets at beginning of year | 1,799,431,074 | 969,659,045 |
| Net assets at end of year | $1,667,385,665 | $1,799,431,074 |
| Undistributed (excess of distributions over) net investment income | $1,954,037 | $(49,275) |
| | Year Ended | Year Ended |
| | August 31, 2019 | August 31, 2018 |
| | Shares | Dollars ($) | Shares | Dollars ($) |
| Capital stock activity |
| Class A | | | | |
| Subscriptions | — | — | 48 | 794 |
| Distributions reinvested | 17,334 | 236,782 | 24,862 | 381,884 |
| Redemptions | (62,137) | (934,343) | (115,727) | (1,865,179) |
| Net decrease | (44,803) | (697,561) | (90,817) | (1,482,501) |
| Institutional Class | | | | |
| Subscriptions | 38,644,630 | 587,799,886 | 49,283,161 | 820,047,143 |
| Distributions reinvested | 9,006,079 | 122,842,918 | 5,948,999 | 91,079,165 |
| Redemptions | (33,136,170) | (490,126,766) | (17,613,056) | (285,088,107) |
| Net increase | 14,514,539 | 220,516,038 | 37,619,104 | 626,038,201 |
| Total net increase | 14,469,736 | 219,818,477 | 37,528,287 | 624,555,700 |
The accompanying Notes to Financial Statements are an integral part of this statement.
| 28 | Multi-Manager Small Cap Equity Strategies Fund | Annual Report 2019 |
[THIS PAGE INTENTIONALLY LEFT BLANK]
Multi-Manager Small Cap Equity Strategies Fund | Annual Report 2019
| 29 |
The following table is intended to help you understand the Fund’s financial performance. Certain information reflects financial results for a single share of a class held for the periods shown. Per share net investment income (loss) amounts are calculated based on average shares outstanding during the period. Total return assumes reinvestment of all dividends and distributions, if any. Total return does not reflect payment of sales charges, if any. Total return and portfolio turnover are not annualized for periods of less than one year. The portfolio turnover rate is calculated without regard to purchase and sales transactions of short-term instruments and certain derivatives, if any. If such transactions were included, the Fund’s portfolio turnover rate may be higher.
| | Net asset value,
beginning of
period | Net
investment
income
(loss) | Net
realized
and
unrealized
gain (loss) | Total from
investment
operations | Distributions
from net
investment
income | Distributions
from net
realized
gains | Total
distributions to
shareholders |
| Class A |
| Year Ended 8/31/2019 | $17.77 | (0.01) | (2.36) | (2.37) | (0.01) | (1.00) | (1.01) |
| Year Ended 8/31/2018 | $15.23 | (0.05) | 3.80 | 3.75 | — | (1.21) | (1.21) |
| Year Ended 8/31/2017 | $13.39 | (0.02) | 2.04 | 2.02 | (0.01) | (0.17) | (0.18) |
| Year Ended 8/31/2016 | $12.79 | (0.00)(d) | 0.86 | 0.86 | — | (0.26) | (0.26) |
| Year Ended 8/31/2015 | $13.68 | (0.05) | 0.28(e) | 0.23 | — | (1.12) | (1.12) |
| Institutional Class |
| Year Ended 8/31/2019 | $17.75 | 0.03 | (2.37) | (2.34) | (0.02) | (1.00) | (1.02) |
| Year Ended 8/31/2018 | $15.18 | (0.01) | 3.80 | 3.79 | (0.01) | (1.21) | (1.22) |
| Year Ended 8/31/2017(f) | $14.60 | (0.04) | 0.62 | 0.58 | — | — | — |
| Notes to Financial Highlights |
| (a) | In addition to the fees and expenses that the Fund bears directly, the Fund indirectly bears a pro rata share of the fees and expenses of any other funds in which it invests. Such indirect expenses are not included in the Fund’s reported expense ratios. |
| (b) | Total net expenses include the impact of certain fee waivers/expense reimbursements made by the Investment Manager and certain of its affiliates, if applicable. |
| (c) | Ratios include line of credit interest expense which is less than 0.01%. |
| (d) | Rounds to zero. |
| (e) | Calculation of the net gain (loss) per share (both realized and unrealized) does not correlate to the aggregate realized and unrealized gain (loss) presented in the Statement of Operations due to the timing of subscriptions and redemptions of Fund shares in relation to fluctuations in the market value of the portfolio. |
| (f) | Institutional Class shares commenced operations on January 3, 2017. Per share data and total return reflect activity from that date. |
| (g) | Annualized. |
The accompanying Notes to Financial Statements are an integral part of this statement.
| 30 | Multi-Manager Small Cap Equity Strategies Fund | Annual Report 2019 |
Financial Highlights (continued)
| | Net
asset
value,
end of
period | Total
return | Total gross
expense
ratio to
average
net assets(a) | Total net
expense
ratio to
average
net assets(a),(b) | Net investment
income (loss)
ratio to
average
net assets | Portfolio
turnover | Net
assets,
end of
period
(000’s) |
| Class A |
| Year Ended 8/31/2019 | $14.39 | (13.04%) | 1.31% | 1.30% | (0.04%) | 97% | $3,035 |
| Year Ended 8/31/2018 | $17.77 | 25.88% | 1.42%(c) | 1.34%(c) | (0.29%) | 82% | $4,545 |
| Year Ended 8/31/2017 | $15.23 | 15.12% | 1.59% | 1.36% | (0.12%) | 85% | $5,278 |
| Year Ended 8/31/2016 | $13.39 | 6.91% | 1.52% | 1.38% | 0.00%(d) | 115% | $950,597 |
| Year Ended 8/31/2015 | $12.79 | 1.90% | 1.58%(c) | 1.37%(c) | (0.38%) | 75% | $1,340,275 |
| Institutional Class |
| Year Ended 8/31/2019 | $14.39 | (12.85%) | 1.06% | 1.05% | 0.22% | 97% | $1,664,350 |
| Year Ended 8/31/2018 | $17.75 | 26.26% | 1.17%(c) | 1.09%(c) | (0.04%) | 82% | $1,794,886 |
| Year Ended 8/31/2017(f) | $15.18 | 3.97% | 1.33%(g) | 1.09%(g) | (0.37%)(g) | 85% | $964,381 |
The accompanying Notes to Financial Statements are an integral part of this statement.
Multi-Manager Small Cap Equity Strategies Fund | Annual Report 2019
| 31 |
Notes to Financial Statements
August 31, 2019
Note 1. Organization
Multi-Manager Small Cap Equity Strategies Fund (the Fund), a series of Columbia Funds Series Trust I (the Trust), is a diversified fund. The Trust is registered under the Investment Company Act of 1940, as amended (the 1940 Act), as an open-end management investment company organized as a Massachusetts business trust.
Fund shares
The Trust may issue an unlimited number of shares (without par value). The Fund is offered only through certain wrap fee programs sponsored and/or managed by Ameriprise Financial, Inc. (Ameriprise Financial) or its affiliates. The Fund offers each of the share classes listed in the Statement of Assets and Liabilities which are not subject to any front-end sales charge or contingent deferred sales charge.
Note 2. Summary of significant accounting policies
Basis of preparation
The Fund is an investment company that applies the accounting and reporting guidance in the Financial Accounting Standards Board (FASB) Accounting Standards Codification Topic 946,Financial Services - Investment Companies (ASC 946). The financial statements are prepared in accordance with U.S. generally accepted accounting principles (GAAP), which requires management to make certain estimates and assumptions that affect the reported amounts of assets and liabilities, the disclosure of contingent assets and liabilities at the date of the financial statements and the reported amounts of income and expenses during the reporting period. Actual results could differ from those estimates.
The following is a summary of significant accounting policies followed by the Fund in the preparation of its financial statements.
Security valuation
All equity securities are valued at the close of business of the New York Stock Exchange. Equity securities are valued at the official closing price on the principal exchange or market on which they trade. Unlisted securities or listed securities for which there were no sales during the day are valued at the mean of the latest quoted bid and ask prices on such exchanges or markets.
Foreign equity securities are valued based on the closing price on the foreign exchange in which such securities are primarily traded. If any foreign equity security closing prices are not readily available, the securities are valued at the mean of the latest quoted bid and ask prices on such exchanges or markets. Foreign currency exchange rates are determined at the scheduled closing time of the New York Stock Exchange. Many securities markets and exchanges outside the U.S. close prior to the close of the New York Stock Exchange; therefore, the closing prices for securities in such markets or on such exchanges may not fully reflect events that occur after such close but before the close of the New York Stock Exchange. In those situations, foreign securities will be fair valued pursuant to a policy adopted by the Board of Trustees. Under the policy, the Fund may utilize a third party pricing service to determine these fair values. The third-party pricing service takes into account multiple factors, including, but not limited to, movements in the U.S. securities markets, certain depositary receipts, futures contracts and foreign exchange rates that have occurred subsequent to the close of the foreign exchange or market, to determine a good faith estimate that reasonably reflects the current market conditions as of the close of the New York Stock Exchange. The fair value of a security is likely to be different from the quoted or published price, if available.
Investments in open-end investment companies, including money market funds, are valued at their latest net asset value.
Investments for which market quotations are not readily available, or that have quotations which management believes are not reflective of market value or reliable, are valued at fair value as determined in good faith under procedures approved by and under the general supervision of the Board of Trustees. If a security or class of securities (such as foreign securities) is valued at fair value, such value is likely to be different from the quoted or published price for the security.
The determination of fair value often requires significant judgment. To determine fair value, management may use assumptions including but not limited to future cash flows and estimated risk premiums. Multiple inputs from various sources may be used to determine fair value.
| 32 | Multi-Manager Small Cap Equity Strategies Fund | Annual Report 2019 |
Notes to Financial Statements (continued)
August 31, 2019
GAAP requires disclosure regarding the inputs and valuation techniques used to measure fair value and any changes in valuation inputs or techniques. In addition, investments shall be disclosed by major category. This information is disclosed following the Fund’s Portfolio of Investments.
Security transactions
Security transactions are accounted for on the trade date. Cost is determined and gains (losses) are based upon the specific identification method for both financial statement and federal income tax purposes.
Income recognition
Corporate actions and dividend income are generally recorded net of any non-reclaimable tax withholdings, on the ex-dividend date or upon receipt of ex-dividend notification in the case of certain foreign securities.
The Fund may receive distributions from holdings in equity securities, business development companies (BDCs), exchange-traded funds (ETFs), limited partnerships (LPs), other regulated investment companies (RICs), and real estate investment trusts (REITs), which report information on the tax character of their distributions annually. These distributions are allocated to dividend income, capital gain and return of capital based on actual information reported. Return of capital is recorded as a reduction of the cost basis of securities held. If the Fund no longer owns the applicable securities, return of capital is recorded as a realized gain. With respect to REITs, to the extent actual information has not yet been reported, estimates for return of capital are made by the Fund’s management. Management’s estimates are subsequently adjusted when the actual character of the distributions is disclosed by the REITs, which could result in a proportionate change in return of capital to shareholders.
Awards from class action litigation are recorded as a reduction of cost basis if the Fund still owns the applicable securities on the payment date. If the Fund no longer owns the applicable securities, the proceeds are recorded as realized gains.
Expenses
General expenses of the Trust are allocated to the Fund and other funds of the Trust based upon relative net assets or other expense allocation methodologies determined by the nature of the expense. Expenses directly attributable to the Fund are charged to the Fund. Expenses directly attributable to a specific class of shares are charged to that share class.
Determination of class net asset value
All income, expenses (other than class-specific expenses, which are charged to that share class, as shown in the Statement of Operations) and realized and unrealized gains (losses) are allocated to each class of the Fund on a daily basis, based on the relative net assets of each class, for purposes of determining the net asset value of each class.
Federal income tax status
The Fund intends to qualify each year as a regulated investment company under Subchapter M of the Internal Revenue Code, as amended, and will distribute substantially all of its investment company taxable income and net capital gain, if any, for its tax year, and as such will not be subject to federal income taxes. In addition, the Fund intends to distribute in each calendar year substantially all of its ordinary income, capital gain net income and certain other amounts, if any, such that the Fund should not be subject to federal excise tax. Therefore, no federal income or excise tax provision is recorded.
Foreign taxes
The Fund may be subject to foreign taxes on income, gains on investments or currency repatriation, a portion of which may be recoverable. The Fund will accrue such taxes and recoveries, as applicable, based upon its current interpretation of tax rules and regulations that exist in the markets in which it invests.
Realized gains in certain countries may be subject to foreign taxes at the Fund level, based on statutory rates. The Fund accrues for such foreign taxes on realized and unrealized gains at the appropriate rate for each jurisdiction, as applicable. The amount, if any, is disclosed as a liability on the Statement of Assets and Liabilities.
Multi-Manager Small Cap Equity Strategies Fund | Annual Report 2019
| 33 |
Notes to Financial Statements (continued)
August 31, 2019
Distributions to shareholders
Distributions from net investment income, if any, are declared and paid annually. Net realized capital gains, if any, are distributed at least annually. Income distributions and capital gain distributions are determined in accordance with federal income tax regulations, which may differ from GAAP.
Guarantees and indemnifications
Under the Trust’s organizational documents and, in some cases, by contract, its officers and trustees are indemnified against certain liabilities arising out of the performance of their duties to the Trust or its funds. In addition, certain of the Fund’s contracts with its service providers contain general indemnification clauses. The Fund’s maximum exposure under these arrangements is unknown since the amount of any future claims that may be made against the Fund cannot be determined, and the Fund has no historical basis for predicting the likelihood of any such claims.
Recent accounting pronouncements
Accounting Standards Update 2017-08 Premium Amortization on Purchased Callable Debt Securities
In March 2017, the Financial Accounting Standards Board issued Accounting Standards Update (ASU) No. 2017-08 Premium Amortization on Purchased Callable Debt Securities. ASU No. 2017-08 updates the accounting standards to shorten the amortization period for certain purchased callable debt securities, held at a premium, to be amortized to the earliest call date. The update applies to securities with explicit, noncontingent call features that are callable at fixed prices and on preset dates. The standard is effective for annual periods beginning after December 15, 2018 and interim periods within those fiscal years. Management does not expect the implementation of this guidance to have a material impact on the financial statement amounts and footnote disclosures.
Accounting Standards Update 2018-13 Disclosure Framework - Changes to the Disclosure Requirements for Fair Value Measurement
In August 2018, the Financial Accounting Standards Board issued Accounting Standards Update (ASU) No. 2018-13 Disclosure Framework - Changes to the Disclosure Requirements for Fair Value Measurement. The standard is effective for annual periods beginning after December 15, 2019 and interim periods within those fiscal years, with early adoption permitted. After evaluation, management determined to adopt the ASU effective for the period ended August 31, 2019 and all subsequent periods. As a result of the amendments, management implemented disclosure changes which include removal of the amount and reasons for transfers between Level 1 and Level 2 of the fair value hierarchy, removal of the policy for the timing of transfers between levels, removal of the description of the Level 3 valuation processes, as well as modifications to the measurement uncertainty disclosure.
Disclosure Update and Simplification
In September 2018, the Securities and Exchange Commission (SEC) released Final Rule 33-10532, Disclosure Update and Simplification, which amends certain financial statement disclosure requirements that the SEC determined to be redundant, outdated, or superseded in light of other SEC disclosure requirements, GAAP, or changes in the information environment. As a result of the amendments, management implemented disclosure changes which included removing the components of distributable earnings presented on the Statement of Assets and Liabilities and combining income and gain distributions paid to shareholders as presented on the Statement of Changes in Net Assets. Any values presented to meet prior year requirements were left unchanged. The amendments had no effect on the Fund’s net assets or results of operation.
Note 3. Fees and other transactions with affiliates
Management services fees
The Fund has entered into a Management Agreement with Columbia Management Investment Advisers, LLC (the Investment Manager), a wholly-owned subsidiary of Ameriprise Financial, Inc. (Ameriprise Financial). Under the Management Agreement, the Investment Manager provides the Fund with investment research and advice, as well as administrative and accounting services. The Investment Manager is responsible for the ultimate oversight of investments made by the Fund. The Fund’s subadvisers (see Subadvisory agreements below) have the primary responsibility for the day-to-day portfolio management of
| 34 | Multi-Manager Small Cap Equity Strategies Fund | Annual Report 2019 |
Notes to Financial Statements (continued)
August 31, 2019
their portion of the Fund. The management services fee is an annual fee that is equal to a percentage of the Fund’s daily net assets that declines from 0.87% to 0.75% as the Fund’s net assets increase. The effective management services fee rate for the year ended August 31, 2019 was 0.81% of the Fund’s average daily net assets.
Subadvisory agreements
The Investment Manager has entered into Subadvisory Agreements with BMO Asset Management Corp. and Conestoga Capital Advisors, LLC, with each serving as a subadviser to the Fund. Prior to February 12, 2019 and February 22, 2019, Dalton, Greiner, Hartman, Maher & Co., LLC (DGHM) and EAM Investors, LLC, respectively, served as subadvisers to the Fund. In addition, Real Estate Management Services Group, LLC provided advisory services with respect to REITs in DGHM’s sleeve. Effective December 19, 2018 and February 13, 2019, the Investment Manager has entered into a Subadvisory Agreement with J.P. Morgan Investment Management Inc. and Hotchkis and Wiley Capital Management, LLC, respectively, with each serving as a subadviser to the Fund. New investments in the Fund, net of any redemptions, are allocated in accordance with the Investment Manager’s determination, subject to the oversight of the Fund’s Board of Trustees. Each subadviser’s proportionate share of investments in the Fund will vary due to market fluctuations. The Investment Manager compensates each subadviser to manage the investment of the Fund’s assets.
Compensation of board members
Members of the Board of Trustees who are not officers or employees of the Investment Manager or Ameriprise Financial are compensated for their services to the Fund as disclosed in the Statement of Operations. These members of the Board of Trustees may participate in a Deferred Compensation Plan (the Deferred Plan) which may be terminated at any time. Obligations of the Deferred Plan will be paid solely out of the Fund’s assets, and all amounts payable under the Deferred Plan constitute a general unsecured obligation of the Fund.
Compensation of Chief Compliance Officer
The Board of Trustees has appointed a Chief Compliance Officer to the Fund in accordance with federal securities regulations. As disclosed in the Statement of Operations, a portion of the Chief Compliance Officer’s total compensation is allocated to the Fund, along with other allocations to affiliated registered investment companies managed by the Investment Manager and its affiliates, based on relative net assets.
Transfer agency fees
Under a Transfer and Dividend Disbursing Agent Agreement, Columbia Management Investment Services Corp. (the Transfer Agent), an affiliate of the Investment Manager and a wholly-owned subsidiary of Ameriprise Financial, is responsible for providing transfer agency services to the Fund. The Transfer Agent has contracted with DST Asset Manager Solutions, Inc. (DST) to serve as sub-transfer agent. The Transfer Agent pays the fees of DST for services as sub-transfer agent and DST is not entitled to reimbursement for such fees from the Fund (with the exception of out-of-pocket fees).
The Fund pays the Transfer Agent a monthly transfer agency fee based on the number or the average value of accounts, depending on the type of account. In addition, the Fund pays the Transfer Agent a fee for shareholder services based on the number of accounts or on a percentage of the average aggregate value of the Fund’s shares maintained in omnibus accounts up to the lesser of the amount charged by the financial intermediary or a cap established by the Board of Trustees from time to time.
The Transfer Agent also receives compensation from the Fund for various shareholder services and reimbursements for certain out-of-pocket fees.
For the year ended August 31, 2019, the Fund’s effective transfer agency fee rates as a percentage of average daily net assets of each class were as follows:
| | Effective rate (%) |
| Class A | 0.21 |
| Institutional Class | 0.21 |
Multi-Manager Small Cap Equity Strategies Fund | Annual Report 2019
| 35 |
Notes to Financial Statements (continued)
August 31, 2019
Distribution and service fees
The Fund has entered into an agreement with Columbia Management Investment Distributors, Inc. (the Distributor), an affiliate of the Investment Manager and a wholly-owned subsidiary of Ameriprise Financial, for distribution and shareholder services. The Board of Trustees has approved, and the Fund has adopted, distribution and shareholder service plans (the Plans) applicable to certain share classes, which set the distribution and service fees for the Fund. These fees are calculated daily and are intended to compensate the Distributor and/or eligible selling and/or servicing agents for selling shares of the Fund and providing services to investors.
The Fund may pay distribution fee of up to 0.25% of the Fund’s average daily net assets attributable to Class A shares and a service fee of up to 0.25% of the Fund’s average daily net assets attributable to Class A shares, provided that the aggregate fee shall not exceed 0.25% of the Fund’s average daily net assets attributable to Class A shares.
Expenses waived/reimbursed by the Investment Manager and its affiliates
The Investment Manager and certain of its affiliates have contractually agreed to waive fees and/or reimburse expenses (excluding certain fees and expenses described below) for the period(s) disclosed below, unless sooner terminated at the sole discretion of the Board of Trustees, so that the Fund’s net operating expenses, including indirect expenses of the Underlying Funds, after giving effect to fees waived/expenses reimbursed and any balance credits and/or overdraft charges from the Fund’s custodian, do not exceed the following annual rate(s) as a percentage of the class’ average daily net assets:
| | July 1, 2019
through
December 31, 2020 | Prior to
July 1, 2019 |
| Class A | 1.24% | 1.34% |
| Institutional Class | 0.99 | 1.09 |
Under the agreement governing these fee waivers and/or expense reimbursement arrangements, the following fees and expenses are excluded from the waiver/reimbursement commitment, and therefore will be paid by the Fund, if applicable: taxes (including foreign transaction taxes), transaction costs and brokerage commissions, costs related to any securities lending program, dividend expenses associated with securities sold short, inverse floater program fees and expenses, transaction charges and interest on borrowed money, interest, infrequent and/or unusual expenses and any other expenses the exclusion of which is specifically approved by the Board of Trustees. This agreement may be modified or amended only with approval from the Investment Manager, certain of its affiliates and the Fund. In addition to the contractual agreement, the Investment Manager and certain of its affiliates have voluntarily agreed to waive fees and/or reimburse Fund expenses (excluding certain fees and expenses described above) so that Fund level expenses (expenses directly attributable to the Fund and not to a specific share class) are waived proportionately across all share classes, but the Fund’s net operating expenses shall not exceed the contractual annual rates listed in the table above. This arrangement may be revised or discontinued at any time. Any fees waived and/or expenses reimbursed under the expense reimbursement arrangements described above are not recoverable by the Investment Manager or its affiliates in future periods.
Note 4. Federal tax information
The timing and character of income and capital gain distributions are determined in accordance with income tax regulations, which may differ from GAAP because of temporary or permanent book to tax differences.
At August 31, 2019, these differences were primarily due to differing treatment for deferral/reversal of wash sale losses, trustees’ deferred compensation, non-deductible expenses, re-characterization of distributions for investments, distribution reclassifications, earnings and profits distributed to shareholders on the redemption of shares, investments in partnerships, and PFIC holdings. To the extent these differences were permanent, reclassifications were made among the components of the Fund’s net assets. Temporary differences do not require reclassifications.
| 36 | Multi-Manager Small Cap Equity Strategies Fund | Annual Report 2019 |
Notes to Financial Statements (continued)
August 31, 2019
The following reclassifications were made:
Undistributed net
investment
income ($) | Accumulated
net realized
gain ($) | Paid in
capital ($) |
| 443,946 | (1,174,915) | 730,969 |
Net investment income (loss) and net realized gains (losses), as disclosed in the Statement of Operations, and net assets were not affected by this reclassification.
The tax character of distributions paid during the years indicated was as follows:
| Year Ended August 31, 2019 | Year Ended August 31, 2018 |
Ordinary
income ($) | Long-term
capital gains ($) | Total ($) | Ordinary
income ($) | Long-term
capital gains ($) | Total ($) |
| 42,164,215 | 80,915,867 | 123,080,082 | 24,393,485 | 67,068,020 | 91,461,505 |
Short-term capital gain distributions, if any, are considered ordinary income distributions for tax purposes.
At August 31, 2019, the components of distributable earnings on a tax basis were as follows:
Undistributed
ordinary income ($) | Undistributed
long-term
capital gains ($) | Capital loss
carryforwards ($) | Net unrealized
appreciation ($) |
| 2,287,745 | 45,401,898 | — | 9,703,219 |
At August 31, 2019, the cost of all investments for federal income tax purposes along with the aggregate gross unrealized appreciation and depreciation based on that cost was:
Federal
tax cost ($) | Gross unrealized
appreciation ($) | Gross unrealized
(depreciation) ($) | Net unrealized
appreciation ($) |
| 1,661,989,059 | 185,346,738 | (175,643,519) | 9,703,219 |
Tax cost of investments and unrealized appreciation/(depreciation) may also include timing differences that do not constitute adjustments to tax basis.
Management of the Fund has concluded that there are no significant uncertain tax positions in the Fund that would require recognition in the financial statements. However, management’s conclusion may be subject to review and adjustment at a later date based on factors including, but not limited to, new tax laws, regulations, and administrative interpretations (including relevant court decisions). Generally, the Fund’s federal tax returns for the prior three fiscal years remain subject to examination by the Internal Revenue Service.
Note 5. Portfolio information
The cost of purchases and proceeds from sales of securities, excluding short-term investments and derivatives, if any, aggregated to $1,787,964,649 and $1,666,168,122, respectively, for the year ended August 31, 2019. The amount of purchase and sale activity impacts the portfolio turnover rate reported in the Financial Highlights.
Note 6. Affiliated money market fund
The Fund invests in Columbia Short-Term Cash Fund, an affiliated money market fund established for the exclusive use by the Fund and other affiliated funds (the Affiliated MMF). The income earned by the Fund from such investments is included as Dividends - affiliated issuers in the Statement of Operations. As an investing fund, the Fund indirectly bears its proportionate share of the expenses of the Affiliated MMF. The Affiliated MMF prices its shares with a floating net asset value. In addition, the Board of Trustees of the Affiliated MMF may impose a fee on redemptions (sometimes referred to as a liquidity fee) or temporarily suspend redemptions (sometimes referred to as imposing a redemption gate) in the event its liquidity falls below regulatory limits.
Multi-Manager Small Cap Equity Strategies Fund | Annual Report 2019
| 37 |
Notes to Financial Statements (continued)
August 31, 2019
Note 7. Interfund lending
Pursuant to an exemptive order granted by the Securities and Exchange Commission, the Fund participates in a program (the Interfund Program) allowing each participating Columbia Fund (each, a Participating Fund) to lend money directly to and, except for closed-end funds and money market funds, borrow money directly from other Participating Funds for temporary purposes. The amounts eligible for borrowing and lending under the Interfund Program are subject to certain restrictions.
Interfund loans are subject to the risk that the borrowing fund could be unable to repay the loan when due, and a delay in repayment to the lending fund could result in lost opportunities and/or additional lending costs. The exemptive order is subject to conditions intended to mitigate conflicts of interest arising from the Investment Manager’s relationship with each Participating Fund.
The Fund’s activity in the Interfund Program during the year ended August 31, 2019 was as follows:
| Borrower or lender | Average loan
balance ($) | Weighted average
interest rate (%) | Days
outstanding |
| Lender | 4,400,000 | 2.76 | 1 |
Interest income earned by the Fund is recorded as Interfund lending in the Statement of Operations. The Fund had no outstanding interfund loans at August 31, 2019.
Note 8. Line of credit
The Fund has access to a revolving credit facility with a syndicate of banks led by Citibank, N.A., HSBC Bank USA, N.A. and JPMorgan Chase Bank, N.A. whereby the Fund may borrow for the temporary funding of shareholder redemptions or for other temporary or emergency purposes. The credit facility, which is a collective agreement between the Fund and certain other funds managed by the Investment Manager or an affiliated investment manager, severally and not jointly, permits collective borrowings up to $1 billion. Interest is charged to each participating fund based on its borrowings at a rate equal to the higher of (i) the federal funds effective rate, (ii) the one-month LIBOR rate and (iii) the overnight bank funding rate, plus in each case, 1.00%. Each borrowing under the credit facility matures no later than 60 days after the date of borrowing. The Fund also pays a commitment fee equal to its pro rata share of the unused amount of the credit facility at a rate of 0.15% per annum. The commitment fee is included in other expenses in the Statement of Operations. This agreement expires annually in December unless extended or renewed.
The Fund had no borrowings during the year ended August 31, 2019.
Note 9. Significant risks
Industrials sector risk
The Fund may be more susceptible to the particular risks that may affect companies in the industrials sector than if it were invested in a wider variety of companies in unrelated sectors. Companies in the industrials sector are subject to certain risks, including changes in supply and demand for their specific product or service and for industrial sector products in general, including decline in demand for such products due to rapid technological developments and frequent new product introduction. Performance of such companies may be affected by factors including government regulation, world events and economic conditions and risks for environmental damage and product liability claims.
Shareholder concentration risk
At August 31, 2019, affiliated shareholders of record owned 100.0% of the outstanding shares of the Fund in one or more accounts. Subscription and redemption activity by concentrated accounts may have a significant effect on the operations of the Fund. In the case of a large redemption, the Fund may be forced to sell investments at inopportune times, including its liquid positions, which may result in Fund losses and the Fund holding a higher percentage of less liquid positions. Large redemptions could result in decreased economies of scale and increased operating expenses for non-redeeming Fund shareholders.
| 38 | Multi-Manager Small Cap Equity Strategies Fund | Annual Report 2019 |
Notes to Financial Statements (continued)
August 31, 2019
Note 10. Subsequent events
Management has evaluated the events and transactions that have occurred through the date the financial statements were issued and noted no items requiring adjustment of the financial statements or additional disclosure.
Note 11. Information regarding pending and settled legal proceedings
Ameriprise Financial and certain of its affiliates have historically been involved in a number of legal, arbitration and regulatory proceedings, including routine litigation, class actions, and governmental actions, concerning matters arising in connection with the conduct of their business activities. Ameriprise Financial believes that the Fund is not currently the subject of, and that neither Ameriprise Financial nor any of its affiliates are the subject of, any pending legal, arbitration or regulatory proceedings that are likely to have a material adverse effect on the Fund or the ability of Ameriprise Financial or its affiliates to perform under their contracts with the Fund. Ameriprise Financial is required to make quarterly (10-Q), annual (10-K) and, as necessary, 8-K filings with the Securities and Exchange Commission (SEC) on legal and regulatory matters that relate to Ameriprise Financial and its affiliates. Copies of these filings may be obtained by accessing the SEC website at www.sec.gov.
There can be no assurance that these matters, or the adverse publicity associated with them, will not result in increased Fund redemptions, reduced sale of Fund shares or other adverse consequences to the Fund. Further, although we believe proceedings are not likely to have a material adverse effect on the Fund or the ability of Ameriprise Financial or its affiliates to perform under their contracts with the Fund, these proceedings are subject to uncertainties and, as such, we are unable to estimate the possible loss or range of loss that may result. An adverse outcome in one or more of these proceedings could result in adverse judgments, settlements, fines, penalties or other relief that could have a material adverse effect on the consolidated financial condition or results of operations of Ameriprise Financial.
Multi-Manager Small Cap Equity Strategies Fund | Annual Report 2019
| 39 |
Report of Independent Registered Public Accounting Firm
To the Board of Trustees of Columbia Funds Series Trust I and Shareholders of Multi-Manager Small Cap Equity Strategies Fund
Opinion on the Financial Statements
We have audited the accompanying statement of assets and liabilities, including the portfolio of investments, of Multi-Manager Small Cap Equity Strategies Fund (one of the funds constituting Columbia Funds Series Trust I, hereafter referred to as the “Fund”) as of August 31, 2019, the related statement of operations for the year ended August 31, 2019, the statement of changes in net assets for each of the two years in the period ended August 31, 2019, including the related notes, and the financial highlights for each of the periods indicated therein (collectively referred to as the “financial statements”). In our opinion, the financial statements present fairly, in all material respects, the financial position of the Fund as of August 31, 2019, the results of its operations for the year then ended, the changes in its net assets for each of the two years in the period ended August 31, 2019 and the financial highlights for each of the periods indicated therein in conformity with accounting principles generally accepted in the United States of America.
Basis for Opinion
These financial statements are the responsibility of the Fund’s management. Our responsibility is to express an opinion on the Fund’s financial statements based on our audits. We are a public accounting firm registered with the Public Company Accounting Oversight Board (United States) (PCAOB) and are required to be independent with respect to the Fund in accordance with the U.S. federal securities laws and the applicable rules and regulations of the Securities and Exchange Commission and the PCAOB.
We conducted our audits of these financial statements in accordance with the standards of the PCAOB. Those standards require that we plan and perform the audit to obtain reasonable assurance about whether the financial statements are free of material misstatement, whether due to error or fraud.
Our audits included performing procedures to assess the risks of material misstatement of the financial statements, whether due to error or fraud, and performing procedures that respond to those risks. Such procedures included examining, on a test basis, evidence regarding the amounts and disclosures in the financial statements. Our audits also included evaluating the accounting principles used and significant estimates made by management, as well as evaluating the overall presentation of the financial statements. Our procedures included confirmation of securities owned as of August 31, 2019, by correspondence with the custodian, transfer agent, and brokers; when replies were not received from brokers, we performed other audit procedures. We believe that our audits provide a reasonable basis for our opinion.
/s/PricewaterhouseCoopers LLP
Minneapolis, Minnesota
October 24, 2019
We have served as the auditor of one or more investment companies within the Columbia Funds Complex since 1977.
| 40 | Multi-Manager Small Cap Equity Strategies Fund | Annual Report 2019 |
Federal Income Tax Information
(Unaudited)
The Fund hereby designates the following tax attributes for the fiscal year ended August 31, 2019. Shareholders will be notified in early 2020 of the amounts for use in preparing 2019 income tax returns.
Qualified
dividend
income | Dividends
received
deduction | Capital
gain
dividend |
| 27.89% | 27.49% | $53,624,123 |
Qualified dividend income. For taxable, non-corporate shareholders, the percentage of ordinary income distributed during the fiscal year that represents qualified dividend income subject to reduced tax rates.
Dividends received deduction. The percentage of ordinary income distributed during the fiscal year that qualifies for the corporate dividends received deduction.
Capital gain dividend. The Fund designates as a capital gain dividend the amount reflected above, or if subsequently determined to be different, the net capital gain of such fiscal period.
TRUSTEES AND OFFICERS
The Board oversees the Fund’s operations and appoints officers who are responsible for day-to-day business decisions based on policies set by the Board. The following table provides basic biographical information about the Fund’s Trustees as of the printing of this report, including their principal occupations during the past five years, although specific titles for individuals may have varied over the period. The year set forth beneath Length of Service in the table below is the year in which the Trustee was first appointed or elected as Trustee to any Fund currently in the Columbia Funds Complex or a predecessor thereof. Under current Board policy, members serve terms of indefinite duration.
Independent trustees
| Name, address, year of birth | Position held with the Trust and length of service | Principal occupation(s) during the past five years and other relevant professional experience | Number of Funds in the Columbia Fund Complex overseen | Other directorships held by Trustee during the past five years |
Janet Langford Carrig
c/o Columbia Management
Investment Advisers, LLC
225 Franklin Street
Mail Drop BX32 05228
Boston, MA 02110
1957 | Trustee
1996 | Senior Vice President, General Counsel and Corporate Secretary, ConocoPhillips (independent energy company), September 2007-October 2018 | 70 | None |
Douglas A. Hacker
c/o Columbia Management
Investment Advisers, LLC
225 Franklin Street
Mail Drop BX32 05228
Boston, MA 02110
1955 | Trustee and Chairman of the Board
1996 | Independent business executive since May 2006; Executive Vice President — Strategy of United Airlines, December 2002-May 2006; President of UAL Loyalty Services (airline marketing company), September 2001-December 2002; Executive Vice President and Chief Financial Officer of United Airlines, July 1999-September 2001 | 70 | Spartan Nash Company, (food distributor); former Director, Nash Finch Company (food distributor), 2005-2013; Aircastle Limited (aircraft leasing); former Director, SeaCube Container Leasing Ltd. (container leasing), 2010-2013; and Travelport Worldwide Limited (travel information technology) |
Multi-Manager Small Cap Equity Strategies Fund | Annual Report 2019
| 41 |
TRUSTEES AND OFFICERS (continued)
Independent trustees (continued)
| Name, address, year of birth | Position held with the Trust and length of service | Principal occupation(s) during the past five years and other relevant professional experience | Number of Funds in the Columbia Fund Complex overseen | Other directorships held by Trustee during the past five years |
Nancy T. Lukitsh
c/o Columbia Management
Investment Advisers, LLC
225 Franklin Street
Mail Drop BX32 05228
Boston, MA 02110
1956 | Trustee
2011 | Senior Vice President, Partner and Director of Marketing, Wellington Management Company, LLP (investment adviser), 1997-2010; Chair, Wellington Management Portfolios (commingled non-U.S. investment pools), 2007-2010; Director, Wellington Trust Company, NA and other Wellington affiliates, 1997-2010 | 70 | None |
David M. Moffett
c/o Columbia Management
Investment Advisers, LLC
225 Franklin Street
Mail Drop BX32 05228
Boston, MA 02110
1952 | Trustee
2011 | Retired. Consultant to Bridgewater and Associates | 70 | Director, CSX Corporation (transportation suppliers); Genworth Financial, Inc. (financial and insurance products and services); PayPal Holdings Inc. (payment and data processing services); Trustee, University of Oklahoma Foundation; former Director, eBay Inc. (online trading community), 2007-2015; and former Director, CIT Bank, CIT Group Inc. (commercial and consumer finance), 2010-2016 |
John J. Neuhauser
c/o Columbia Management
Investment Advisers, LLC
225 Franklin Street
Mail Drop BX32 05228
Boston, MA 02110
1943 | Trustee
1984 | President, Saint Michael’s College, August 2007-June 2018; Director or Trustee of several non-profit organizations, including University of Vermont Medical Center; Academic Vice President and Dean of Faculties, Boston College, August 1999-October 2005; University Professor, Boston College, November 2005-August 2007 | 70 | Liberty All-Star Equity Fund and Liberty All- Star Growth Fund (closed-end funds) |
Patrick J. Simpson
c/o Columbia Management
Investment Advisers, LLC
225 Franklin Street
Mail Drop BX32 05228
Boston, MA 02110
1944 | Trustee
2000 | Of Counsel, Perkins Coie LLP (law firm) since 2015; Partner, Perkins Coie LLP, 1988-2014 | 70 | Former Director, M Fund, Inc. (M Funds mutual fund family), July 2018-July 2019 |
Anne-Lee Verville
c/o Columbia Management
Investment Advisers, LLC
225 Franklin Street
Mail Drop BX32 05228
Boston, MA 02110
1945 | Trustee
1998 | Retired. General Manager, Global Education Industry, 1994-1997, President – Application Systems Division, 1991-1994, Chief Financial Officer – US Marketing & Services, 1988-1991, and Chief Information Officer, 1987-1988, IBM Corporation (computer and technology) | 70 | Former Director, Enesco Group, Inc. (producer of giftware and home and garden decor products), 2001-2006 |
| 42 | Multi-Manager Small Cap Equity Strategies Fund | Annual Report 2019 |
TRUSTEES AND OFFICERS (continued)
Consultants to the Independent Trustees*
| Name, address, year of birth | Position held with the Trust and length of service | Principal occupation(s) during the past five years and other relevant professional experience | Number of Funds in the Columbia Funds complex overseen | Other directorships held by Trustee during the past five years |
J. Kevin Connaughton
c/o Columbia
Management Investment
Advisers, LLC,
225 Franklin Street
Mail Drop BX32 05228,
Boston, MA 02110
1964 | Independent Trustee Consultant
2016 | Independent Trustee Consultant, Columbia Funds since March 2016; Adjunct Professor of Finance, Bentley University since November 2017; Managing Director and General Manager of Mutual Fund Products, Columbia Management Investment Advisers, LLC, May 2010-February 2015; President, Columbia Funds, 2009-2015; and senior officer of Columbia Funds and affiliated funds, 2003-2015 | 70 | Director, The Autism Project since March 2015; former Trustee, New Century Portfolios, March 2015-December 2017; formerly on Board of Governors, Gateway Healthcare, January 2016 – December 2017 |
Olive Darragh
c/o Columbia
Management Investment
Advisers, LLC,
225 Franklin Street,
Mail Drop BX32 05228,
Boston, MA 02110
1962 | Independent Trustee Consultant 2019 | Independent Trustee Consultant, Columbia Funds since June 2019; Managing Director of Darragh Inc. (a strategy and talent management consulting firm) since 2010; Founder and CEO, Zolio (an investment management talent identification platform) since 2004; Partner, Tudor Investments, 2004-2010; Senior Partner, McKinsey & Company, 2001-2004 | 70 | Director, University of Edinburgh Business School; former Director, Boston Public Library Foundation |
Natalie A. Trunow
c/o Columbia
Management Investment
Advisers, LLC,
225 Franklin Street
Mail Drop BX32 05228,
Boston, MA 02110
1967 | Independent Trustee Consultant
2016 | Independent Trustee Consultant, Columbia Funds since September 2016; Chief Executive Officer, Millennial Portfolio Solutions LLC (asset management and consulting services) since January 2016; Director of Investments, Casey Family Programs, April 2016-September 2016; Senior Vice President and Chief Investment Officer, Calvert Investments, August 2008-January 2016; Section Head and Portfolio Manager, General Motors Asset Management, June 1997-August 2008 | 70 | Director, Health Services for Children with Special Needs, Inc.; Director, Consumer Credit Counseling Services (formerly Guidewell Financial Solutions) |
| * | J. Kevin Connaughton was appointed consultant to the Independent Trustees effective March 1, 2016. Olive Darragh was appointed consultant to the Independent Trustees effective June 10, 2019. Natalie A. Trunow was appointed consultant to the Independent Trustees effective September 1, 2016. Shareholders of the Funds are expected to be asked to elect each of Mr. Connaughton, Ms. Darragh and Ms. Trunow as a Trustee at a future shareholder meeting. |
Interested trustee affiliated with Investment Manager*
| Name, address, year of birth | Position held with the Trust and length of service | Principal occupation(s) during the past five years and other relevant professional experience | Number of Funds in the Columbia Funds Complex overseen | Other directorships held by Trustee during the past five years |
William F. Truscott
c/o Columbia Management
Investment Advisers, LLC
225 Franklin Street
Boston, MA 02110
1960 | Trustee
2012 | Chairman of the Board and President, Columbia Management Investment Advisers, LLC since May 2010 and February 2012, respectively; Chief Executive Officer, Global Asset Management, Ameriprise Financial, Inc. since September 2012 (previously Chief Executive Officer, U.S. Asset Management & President, Annuities, May 2010-September 2012); Director and Chief Executive Officer, Columbia Management Investment Distributors, Inc. since May 2010 and February 2012, respectively; Chairman of the Board and Chief Executive Officer, RiverSource Distributors, Inc. since 2006; Director, Threadneedle Asset Management Holdings, SARL since 2014; President and Chief Executive Officer, Ameriprise Certificate Company, 2006-August 2012 | 192 | Chairman of the Board, Columbia Management Investment Advisers, LLC since May 2010; Director, Columbia Management Investment Distributors, Inc. since May 2010; former Director, Ameriprise Certificate Company, August 2006 - January 2013 |
Multi-Manager Small Cap Equity Strategies Fund | Annual Report 2019
| 43 |
TRUSTEES AND OFFICERS (continued)
| * | Interested person (as defined under the 1940 Act) by reason of being an officer, director, security holder and/or employee of the Investment Manager or Ameriprise Financial. |
The Statement of Additional Information has additional information about the Fund’s Board members and is available, without charge, upon request by calling 800.345.6611, visiting columbiathreadneedleus.com/investor/ or contacting your financial intermediary.
The Board has appointed officers who are responsible for day-to-day business decisions based on policies it has established. The officers serve at the pleasure of the Board. The following table provides basic information about the Officers of the Fund as of the printing of this report, including principal occupations during the past five years, although their specific titles may have varied over the period. In addition to Mr. Truscott, who is Senior Vice President, the Fund’s other officers are:
Fund officers
Name,
address and
year of birth | Position and year
first appointed to
position for any Fund
in the Columbia
Funds complex or a
predecessor thereof | Principal occupation(s) during past five years |
Christopher O. Petersen
5228 Ameriprise
Financial Center
Minneapolis, MN 55474
Born 1970 | President and Principal Executive Officer (2015) | Vice President and Lead Chief Counsel, Ameriprise Financial, Inc. since January 2015 (previously Vice President and Chief Counsel, January 2010 - December 2014; officer of Columbia Funds and affiliated funds since 2007. |
Michael G. Clarke
225 Franklin Street
Boston, MA 02110
Born 1969 | Chief Financial Officer (Principal Financial Officer) (2009) and Senior Vice President (2019) | Vice President, Head of North American Operations, and Co-Head of Global Operations, Columbia Management Investment Advisers, LLC, since June 2019 (previously Vice President – Accounting and Tax, May 2010 - May 2019); senior officer of Columbia Funds and affiliated funds since 2002 (previously Treasurer and Chief Accounting Officer, January 2009 - January 2019 and December 2015 - January 2019, respectively). |
Joseph Beranek
5890 Ameriprise
Financial Center
Minneapolis, MN 55474
Born 1965 | Treasurer and Chief Accounting Officer (Principal Accounting Officer) (2019) | Vice President — Mutual Fund Accounting and Financial Reporting, Columbia Management Investment Advisers, LLC, since December 2018 and March 2017, respectively (previously Vice President — Pricing and Corporate Actions, May 2010 - March 2017). |
Paul B. Goucher
485 Lexington Avenue
New York, NY 10017
Born 1968 | Senior Vice President (2011) and Assistant Secretary (2008) | Senior Vice President and Assistant General Counsel, Ameriprise Financial, Inc. since January 2017 (previously Vice President and Lead Chief Counsel, November 2008 - January 2017 and January 2013 - January 2017, respectively); Vice President, Chief Legal Officer and Assistant Secretary, Columbia Management Investment Advisers, LLC since March 2015 (previously Vice President and Assistant Secretary, May 2010 – March 2015). |
Thomas P. McGuire
225 Franklin Street
Boston, MA 02110
Born 1972 | Senior Vice President and Chief Compliance Officer (2012) | Vice President — Asset Management Compliance, Ameriprise Financial, Inc., since May 2010; Chief Compliance Officer, Ameriprise Certificate Company since September 2010. |
Colin Moore
225 Franklin Street
Boston, MA 02110
Born 1958 | Senior Vice President (2010) | Executive Vice President and Global Chief Investment Officer, Ameriprise Financial, Inc., since July 2013; Executive Vice President and Global Chief Investment Officer, Columbia Management Investment Advisers, LLC since July 2013. |
Ryan C. Larrenaga
225 Franklin Street
Boston, MA 02110
Born 1970 | Senior Vice President (2017), Chief Legal Officer (2017), and Secretary (2015) | Vice President and Chief Counsel, Ameriprise Financial, Inc. since August 2018 (previously Vice President and Group Counsel, August 2011 - August 2018); officer of Columbia Funds and affiliated funds since 2005. |
Michael E. DeFao
225 Franklin Street
Boston, MA 02110
Born 1968 | Vice President (2011) and Assistant Secretary (2010) | Vice President and Chief Counsel, Ameriprise Financial, Inc. since May 2010. |
| 44 | Multi-Manager Small Cap Equity Strategies Fund | Annual Report 2019 |
TRUSTEES AND OFFICERS (continued)
Fund officers (continued)
Name,
address and
year of birth | Position and year
first appointed to
position for any Fund
in the Columbia
Funds complex or a
predecessor thereof | Principal occupation(s) during past five years |
Lyn Kephart-Strong
5228 Ameriprise
Financial Center
Minneapolis, MN 55474
Born 1960 | Vice President (2015) | President, Columbia Management Investment Services Corp. since October 2014; Vice President & Resolution Officer, Ameriprise Trust Company since August 2009. |
Board Consideration and Approval of Management
and Subadvisory Agreements
On June 12, 2019, the Board of Trustees (the Board) and the Trustees who are not interested persons (as defined in the Investment Company Act of 1940) (the Independent Trustees) of Columbia Funds Series Trust I (the Trust) unanimously approved the continuation of the Management Agreement (the Management Agreement) with Columbia Management Investment Advisers, LLC (the Investment Manager) and the Subadvisory Agreements (the Subadvisory Agreements) between the Investment Manager and BMO Asset Management Corp., Conestoga Capital Advisors, LLC, Hotchkis and Wiley Capital Management, LLC and J.P. Morgan Investment Management Inc. (the Subadvisers) with respect to Multi-Manager Small Cap Equity Strategies Fund (the Fund), a series of the Trust. As detailed below, the Board’s Advisory Fees and Expenses Committee (the Committee) and the Board met on multiple occasions to review and discuss, among themselves, with the management team of the Investment Manager and with an independent fee consultant, materials provided by the Investment Manager, the independent fee consultant and others before determining to approve the continuation of the Management Agreement and the Subadvisory Agreements (collectively, the Agreements).
In connection with their deliberations regarding the continuation of the Management Agreement and the Subadvisory Agreements, the Committee and the Board evaluated materials requested from the Investment Manager regarding the Fund and the Agreements, and discussed these materials with representatives of the Investment Manager at Committee meetings held on March 5, 2019, April 25, 2019 and June 11, 2019 and at Board meetings held on March 6, 2019 and June 12, 2019. In addition, the Board and its various committees consider matters bearing on the Agreements at other meetings throughout the year and in prior years and meet regularly with senior management of the Trust and the Investment Manager. Through the Board’s Investment Oversight Committees, Trustees also meet with selected portfolio managers of the funds the Trustees oversee and with other investment personnel at various times throughout the year. The Committee and the Board also consulted with the independent fee consultant, Fund counsel and the Independent Trustees’ independent legal counsel, who advised on various matters with respect to the Committee’s and the Board’s considerations and otherwise assisted the Committee and the Board in their deliberations. On June 11, 2019, the Committee recommended that the Board approve the continuation of the Management Agreement and the Subadvisory Agreements. On June 12, 2019, the Board, including the Independent Trustees, voting separately, unanimously approved the continuation of the Management Agreement and the Subadvisory Agreements for the Fund.
The Committee and the Board considered all information that they, their legal counsel or the Investment Manager believed reasonably necessary to evaluate and to determine whether to recommend for approval or approve the continuation of the Management Agreement and the Subadvisory Agreements. The information and factors considered by the Committee and the Board in recommending for approval or approving the continuation of the Management Agreement and the Subadvisory Agreements for the Fund included the following:
| • | Information on the investment performance of the Fund relative to the performance of a group of mutual funds determined to be comparable to the Fund by an independent third-party data provider, as well as performance relative to benchmarks; |
Multi-Manager Small Cap Equity Strategies Fund | Annual Report 2019
| 45 |
Board Consideration and Approval of Management
and Subadvisory Agreements (continued)
| • | Information on the Fund’s management fees and total expenses, including information comparing the Fund’s expenses to those of a group of comparable mutual funds, as determined by the independent third-party data provider; |
| • | The Investment Manager’s agreement to contractually limit or cap total operating expenses for the Fund through December 31, 2020 so that total operating expenses (excluding certain fees and expenses, such as transaction costs and certain other investment related expenses, interest, taxes, and infrequent and/or unusual expenses) would not exceed a specified annual rate, as a percentage of the Fund’s net assets; |
| • | The terms and conditions of the Agreements; |
| • | The subadvisory fees payable by the Investment Manager under the Subadvisory Agreements; |
| • | The current and proposed terms and conditions of other agreements and arrangements with affiliates of the Investment Manager relating to the operations of the Fund, including agreements with respect to the provision of distribution, transfer agency and shareholder services to the Fund; |
| • | Descriptions of various functions performed by the Investment Manager and the Subadvisers under the Agreements, including portfolio management and portfolio trading practices; |
| • | Information regarding the management fees of similarly-managed portfolios of other clients of the Investment Manager, including institutional accounts and collective trusts; |
| • | Information regarding the reputation, regulatory history and resources of the Investment Manager and Subadvisers, including information regarding senior management, portfolio managers and other personnel; |
| • | Information regarding the capabilities of the Investment Manager and the Subadvisers with respect to compliance monitoring services, including an assessment of the Investment Manager’s and the Subadvisers’ compliance systems by the Fund’s Chief Compliance Officer; and |
| • | The profitability to the Investment Manager and its affiliates from their relationships with the Fund. |
Nature, extent and quality of services provided under the Agreements
The Committee and the Board considered the nature, extent and quality of services provided to the Fund by the Investment Manager, the Subadvisers and the Investment Manager’s affiliates under the Agreements and under separate agreements for the provision of transfer agency and shareholder services, and the resources dedicated to the Fund and the other Columbia Funds by the Investment Manager, the Subadvisers and the Investment Manager’s affiliates. The Committee and the Board considered, among other things, the Investment Manager’s ability to attract, motivate and retain highly qualified research, advisory and supervisory investment professionals (including compensation programs for personnel involved in fund management, reputation and other attributes), the portfolio management services provided by those investment professionals, and the quality of the Investment Manager’s and the Subadvisers’ investment research capabilities and trade execution services. The Committee and the Board also considered the potential benefits to shareholders of investing in a mutual fund that is part of a fund complex offering exposure to a variety of asset classes and investment disciplines and providing a variety of fund and shareholder services.
The Committee and the Board also considered the professional experience and qualifications of the senior personnel of the Investment Manager and the Subadvisers, which included consideration of the Investment Manager’s and the Subadvisers’ experience with funds using an investment strategy similar to that used by the Investment Manager and the Subadvisers for the Fund. The Committee and the Board noted the compliance programs of and the compliance-related resources provided to the Fund by the Investment Manager and its affiliates and the resources dedicated by the Investment Manager and its affiliates to risk management, and considered the Investment Manager’s ability to provide administrative services to the Fund and coordinate the activities of the Fund’s other service providers. The Board also noted that, based on information provided by the Investment Manager, the Board had approved each Subadviser’s code of ethics and compliance program, and that the Chief Compliance Officer of the Funds reports to the Trustees on each Subadviser’s compliance program.
| 46 | Multi-Manager Small Cap Equity Strategies Fund | Annual Report 2019 |
Board Consideration and Approval of Management
and Subadvisory Agreements (continued)
The Committee and the Board considered the diligence and selection process undertaken by the Investment Manager to select each Subadviser, including the Investment Manager’s rationale for recommending the continuation of the Subadvisory Agreements, and the process for monitoring each Subadviser’s ongoing performance of services for the Fund. As part of these deliberations, the Committee and the Board considered the ability of the Investment Manager, subject to the approval of the Board, to modify or enter into new subadvisory agreements without a shareholder vote pursuant to an exemptive order of the Securities and Exchange Commission. The Committee and the Board also considered the scope of services provided to the Fund by the Investment Manager that are distinct from and in addition to those provided by the Subadvisers, including cash flow management, treasury services, risk oversight, investment oversight and Subadviser selection, oversight and transition management. After reviewing these and related factors, the Committee and the Board concluded, within the context of their overall conclusions, that the nature, extent and quality of the services provided to the Fund under the Agreements supported the continuation of the Management Agreement and the Subadvisory Agreements.
Investment performance
The Committee and the Board reviewed information about the performance of the Fund over various time periods, including performance information relative to benchmarks, information that compared the performance of the Fund to the performance of a group of comparable mutual funds as determined by the independent third-party data provider, and information and analysis provided by the independent fee consultant. The Committee and the Board also reviewed a description of the third party’s methodology for identifying the Fund’s peer groups for purposes of performance and expense comparisons.
The Committee and the Board noted that, through December 31, 2018, the Fund’s performance was in the thirty-first, twenty-ninth and thirty-ninth percentile (where the best performance would be in the first percentile) of its category selected by the independent third-party data provider for the purposes of performance comparisons for the one-, three- and five-year periods, respectively.
The Committee and the Board also considered the Investment Manager’s and Subadvisers’ performance and reputation generally, the Investment Manager’s evaluation of each Subadviser’s contribution to the Fund’s broader investment mandate, the Investment Manager’s historical responsiveness to Board concerns about performance, and the Investment Manager’s willingness to take steps intended to improve performance. After reviewing these and related factors, the Committee and the Board concluded, within the context of their overall conclusions, that the performance of the Fund, the Investment Manager and the Subadvisers were sufficient, in light of other considerations, to support the continuation of the Management Agreement and the Subadvisory Agreements.
Investment management fee rates and other expenses
The Committee and the Board considered the management fees charged to the Fund under the Management Agreement and the Subadvisory Agreements, as well as the total expenses incurred by the Fund. In assessing the reasonableness of the fees under the Management Agreement, the Committee and the Board considered, among other information, the Fund’s total expense ratio as a percentage of average daily net assets. The Committee and the Board considered data provided by the independent third-party data provider and the independent fee consultant. The Committee and the Board noted that, as of December 31, 2018, the Fund’s actual management fee and net total expense ratio were both ranked in the third quintile (where the lowest fees and expenses would be in the first quintile) against the Fund’s expense universe as determined by the independent third-party data provider for purposes of expense comparison. The Committee and the Board also considered the fees that the Subadvisers charge to their other clients, to the extent publicly available, and noted that the Investment Manager pays the fees of the Subadvisers. The Committee and the Board also took into account the fee waiver and expense limitation arrangements agreed to by the Investment Manager, as noted above.
The Committee and the Board also received and considered information about the management fees charged by the Investment Manager to institutional accounts. In considering the fees charged to those accounts, the Committee and the Board took into account, among other things, the Investment Manager’s representations about the differences between managing mutual funds as compared to other types of accounts, including differences in the services provided, differences in the risk profile of such business for the Investment Manager and the additional resources required to manage mutual funds
Multi-Manager Small Cap Equity Strategies Fund | Annual Report 2019
| 47 |
Board Consideration and Approval of Management
and Subadvisory Agreements (continued)
effectively. The Committee and the Board also received and considered information about the fees charged by the Investment Manager for sub-advisory services it provides to comparable unaffiliated funds. In evaluating the Fund’s management fees, the Committee and the Board also took into account the demands, complexity and quality of the investment management of the Fund.
After reviewing these and related factors, the Committee and the Board concluded, within the context of their overall conclusions, that the management fee rates and expenses of the Fund, in light of other considerations, supported the continuation of the Management Agreement and the Subadvisory Agreements.
Costs of services provided and profitability
The Committee and the Board also took note of the costs the Investment Manager and its affiliates incur in connection with the services provided and the profitability to the Investment Manager and its affiliates from their relationships with the Fund, and the efforts undertaken by the Investment Manager and its affiliates to manage efficiently their costs to provide such services.
The Committee and the Board also considered the compensation directly or indirectly received by the Investment Manager’s affiliates in connection with their relationships with the Fund. The Committee and the Board reviewed information provided by management as to the profitability to the Investment Manager and its affiliates of their relationships with the Fund, including with respect to funds for which unaffiliated subadvisers provide services, information about changes in profitability in connection with a change in the Fund’s subadviser, information about the allocation of expenses used to calculate profitability, and comparisons of profitability levels realized in 2018 to profitability levels realized in 2017. When reviewing profitability, the Committee and the Board also considered court cases in which adviser profitability was an issue in whole or in part, the performance of similarly managed funds, the performance of the Fund, and the expense ratio of the Fund. In addition, the Committee and the Board considered information provided by the Investment Manager regarding the Investment Manager’s financial condition and comparing its profitability to that of other asset management firms that are, or are subsidiaries of, publicly traded companies. In this regard, the Committee and the Board also considered data provided by the independent fee consultant. Because the Subadvisory Agreements were negotiated at arms-length by the Investment Manager, which is responsible for payments to the Subadvisers thereunder, the Committee and the Board did not consider the profitability to each Subadviser from its relationship with the Fund.
After reviewing these and related factors, the Committee and the Board concluded, within the context of their overall conclusions, that the costs of services provided and the profitability to the Investment Manager and its affiliates from their relationships with the Fund supported the continuation of the Management Agreement and the Subadvisory Agreements.
Economies of scale
The Committee and the Board considered the potential existence of economies of scale in the provision by the Investment Manager of services to the Fund, to groups of related funds, and to the Investment Manager’s investment advisory clients as a whole, and whether those economies of scale were shared with the Fund through breakpoints in investment management fees or other means, such as expense limitation arrangements and additional investments by the Investment Manager in investment, trading, compliance and other resources. The Committee and the Board noted that the management fee schedules for the Fund contained breakpoints that would reduce the fee rate on assets above specified threshold levels.
The Committee and the Board noted that the breakpoints, if any, in the Subadvisory Agreements did not occur at the same levels as the breakpoints in the Management Agreement. The Committee and the Board noted that absent a shareholder vote, the Investment Manager would bear any increase in fees payable under the Subadvisory Agreements. The Committee and the Board also noted the potential challenges of seeking to tailor the Management Agreement breakpoints to those of a subadvisory agreement in this context, and the effect that capacity constraints on a subadviser’s ability to manage assets could potentially have on the ability of the Investment Manager to achieve economies of scale, as new subadvisers may need to be added as the Fund grows, increasing the Investment Manager’s cost of compensating and overseeing the Fund’s subadvisers.
| 48 | Multi-Manager Small Cap Equity Strategies Fund | Annual Report 2019 |
Board Consideration and Approval of Management
and Subadvisory Agreements (continued)
In considering these matters, the Committee and the Board also considered the costs of the services provided and the profitability to the Investment Manager and its affiliates from their relationships with the Fund, as noted above. After reviewing these and related factors, the Committee and the Board concluded, within the context of their overall conclusions, that the extent to which any economies of scale were expected to be shared with the Fund supported the continuation of the Management Agreement and the Subadvisory Agreements.
Other benefits to the Investment Manager and Subadvisers
The Committee and the Board received and considered information regarding “fall-out” or ancillary benefits received by the Investment Manager and its affiliates as a result of their relationships with the Fund, such as the engagement of the Investment Manager’s affiliates to provide distribution, transfer agency and shareholder services to the Fund. In this regard, among other matters, the Committee and the Board considered that the Fund’s distributor retains a portion of the distribution fees from the Fund and receives a portion of the sales charges on sales or redemptions of certain classes of shares of the Fund. The Committee and the Board also considered the benefits of research made available to the Investment Manager and the Subadvisers by reason of brokerage commissions generated by the Fund’s securities transactions, and reviewed information about the Investment Manager’s practices with respect to considering brokerage and research services when allocating portfolio transactions. In this connection, the Board also noted that the amount of research made available to the Investment Manager by reason of brokerage commissions had been declining over time, and may decline further. The Committee and the Board recognized that the Investment Manager’s profitability would be somewhat lower without these benefits.
Conclusion
The Committee and the Board reviewed all of the above considerations in reaching their decisions to recommend or approve the continuation of the Management Agreement and the Subadvisory Agreements. In their deliberations, the Trustees did not identify any particular information that was all-important or controlling, and individual Trustees may have attributed different weights to the various factors. Based on their evaluation of all factors that they deemed to be material, including those factors described above, and assisted by the advice of independent legal counsel, the Board, including the Independent Trustees, voting separately, unanimously approved the continuation of the Management Agreement and the Subadvisory Agreements.
Multi-Manager Small Cap Equity Strategies Fund | Annual Report 2019
| 49 |
[THIS PAGE INTENTIONALLY LEFT BLANK]
[THIS PAGE INTENTIONALLY LEFT BLANK]
Multi-Manager Small Cap Equity Strategies Fund
P.O. Box 219104
Kansas City, MO 64121-9104
Please read and consider the investment objectives, risks, charges and expenses for any fund carefully before investing. For a prospectus and summary prospectus, which contains this and other important information about the Fund, go to
columbiathreadneedleus.com/investor/. The Fund is distributed by Columbia Management Investment Distributors, Inc., member FINRA, and managed by Columbia Management Investment Advisers, LLC.
Columbia Threadneedle Investments (Columbia Threadneedle) is the global brand name of the Columbia and Threadneedle group of companies. All rights reserved.
© 2019 Columbia Management Investment Advisers, LLC.
columbiathreadneedleus.com/investor/

Annual Report
August 31, 2019
Multi-Manager Alternative Strategies Fund
Beginning on January 1, 2021, as permitted by regulations adopted by the Securities and Exchange Commission, paper copies of the Fund’s annual and semiannual shareholder reports like this one will no longer be sent by mail, unless you specifically request paper copies of the reports. Instead, the reports will be made available on the Fund’s website (columbiathreadneedleus.com/investor/), and each time a report is posted you will be notified by mail and provided with a website address to access the report.
If you have already elected to receive shareholder reports electronically, you will not be affected by this change and you need not take any action. You may elect to receive shareholder reports and other communications from the Fund electronically at any time by contacting your financial intermediary (such as a broker-dealer or bank) or, for Fund shares held directly with the Fund, by calling 800.345.6611 or by enrolling in “eDelivery” by logging into your account at columbiathreadneedleus.com/investor/.
You may elect to receive all future reports in paper free of charge. If you invest through a financial intermediary, you can contact your financial intermediary to request that you continue receiving paper copies of your shareholder reports. If you invest directly with the Fund, you can call 800.345.6611 to let the Fund know you wish to continue receiving paper copies of your shareholder reports. Your election to receive paper reports will apply to all Columbia Funds held in your account if you invest through a financial intermediary or all Columbia Funds held with the fund complex if you invest directly with the Fund.
Not FDIC Insured • No bank guarantee • May lose value
Multi-Manager Alternative Strategies Fund (the Fund) mails one shareholder report to each shareholder address, unless such shareholder elected to receive shareholder reports from the Fund electronically. If you would like more than one report, please call shareholder services at 800.345.6611 and additional reports will be sent to you.
Proxy voting policies and procedures
The policy of the Board of Trustees is to vote the proxies of the companies in which the Fund holds investments consistent with the procedures as stated in the Statement of Additional Information (SAI). You may obtain a copy of the SAI without charge by calling 800.345.6611; contacting your financial intermediary; visiting columbiathreadneedleus.com/investor/; or searching the website of the Securities and Exchange Commission (SEC) at sec.gov. Information regarding how the Fund voted proxies relating to portfolio securities is filed with the SEC by August 31st for the most recent 12-month period ending June 30th of that year, and is available without charge by visiting columbiathreadneedleus.com/investor/, or searching the website of the SEC at sec.gov.
Quarterly schedule of investments
The Fund files a complete schedule of portfolio holdings with the SEC for the first and third quarters of each fiscal year on Form N-Q or Form N-PORT (available for filings after March 31, 2019). The Fund’s Form N-Q or Form N-PORT is available on the SEC’s website at sec.gov. The Fund’s complete schedule of portfolio holdings, as filed on Form N-Q or Form N-PORT, can also be obtained without charge, upon request, by calling 800.345.6611.
Additional Fund information
For more information about the Fund, please visit columbiathreadneedleus.com/investor/ or call 800.345.6611. Customer Service Representatives are available to answer your questions Monday through Friday from 8 a.m. to 7 p.m. Eastern time.
You may obtain the current net asset value (NAV) of Fund shares at no cost by calling 800.345.6611 or by sending an e-mail to serviceinquiries@columbiathreadneedle.com.
Fund investment manager
Columbia Management Investment Advisers, LLC (the Investment Manager)
225 Franklin Street
Boston, MA 02110
Fund distributor
Columbia Management Investment Distributors, Inc.
225 Franklin Street
Boston, MA 02110
Fund transfer agent
Columbia Management Investment Services Corp.
P.O. Box 219104
Kansas City, MO 64121-9104
Multi-Manager Alternative Strategies Fund | Annual Report 2019
Investment objective
The Fund seeks capital appreciation with an emphasis on absolute (positive) returns.
Portfolio management
AlphaSimplex Group, LLC
Alexander Healy, Ph.D.
Kathryn Kaminski, Ph.D., CAIA
Philippe Lüdi, Ph.D., CFA
John Perry, Ph.D.
Robert Rickard
AQR Capital Management, LLC
Clifford Asness, Ph.D., M.B.A.
Brian Hurst
John Liew, Ph.D., M.B.A.
Yao Hua Ooi
Ari Levine, M.S.
Manulife Investment Management (US) LLC
Daniel Janis III
Christopher Chapman, CFA
Thomas Goggins
Kisoo Park
TCW Investment Management Company LLC
Stephen Kane, CFA
Laird Landmann
Tad Rivelle
Bryan Whalen, CFA
Water Island Capital, LLC
Edward Chen
Roger Foltynowicz, CFA, CAIA
Gregg Loprete
Todd Munn
| Average annual total returns (%) (for the period ended August 31, 2019) |
| | | Inception | 1 Year | 5 Years | Life |
| Class A | 04/23/12 | 4.36 | -0.32 | 1.38 |
| Institutional Class* | 01/03/17 | 4.62 | -0.14 | 1.50 |
| FTSE Three-Month U.S. Treasury Bill Index | | 2.36 | 0.92 | 0.64 |
All results shown assume reinvestment of distributions during the period. Returns do not reflect the deduction of taxes that a shareholder may pay on Fund distributions or on the redemption of Fund shares. Performance results reflect the effect of any fee waivers or reimbursements of Fund expenses by Columbia Management Investment Advisers, LLC and/or any of its affiliates. Absent these fee waivers or expense reimbursement arrangements, performance results would have been lower.
The performance information shown represents past performance and is not a guarantee of future results. The investment return and principal value of your investment will fluctuate so that your shares, when redeemed, may be worth more or less than their original cost. Current performance may be lower or higher than the performance information shown. You may obtain performance information current to the most recent month-end by contacting your financial intermediary, visiting columbiathreadneedleus.com/investor/ or calling 800.345.6611.
| * | The returns shown for periods prior to the share class inception date (including returns for the Life of the Fund, if shown, which are since Fund inception) include the returns of the Fund’s oldest share class. These returns are adjusted to reflect any higher class-related operating expenses of the newer share classes, as applicable. Please visit columbiathreadneedleus.com/investor/investment-products/mutual-funds/appended-performance for more information. |
The FTSE Three-Month U.S. Treasury Bill Index, an unmanaged index, is representative of the performance of three-month Treasury bills.
Indices are not available for investment, are not professionally managed and do not reflect sales charges, fees, brokerage commissions, taxes or other expenses of investing. Securities in the Fund may not match those in an index.
Multi-Manager Alternative Strategies Fund | Annual Report 2019
| 3 |
Fund at a Glance (continued)
Performance of a hypothetical $10,000 investment (April 23, 2012 — August 31, 2019)
The chart above shows the change in value of a hypothetical $10,000 investment in Class A shares of Multi-Manager Alternative Strategies Fund during the stated time period, and does not reflect the deduction of taxes that a shareholder may pay on Fund distributions or on the redemption of Fund shares.
| Portfolio breakdown — long positions (%) (at August 31, 2019) |
| Asset-Backed Securities — Non-Agency | 5.2 |
| Commercial Mortgage-Backed Securities - Agency | 3.5 |
| Commercial Mortgage-Backed Securities - Non-Agency | 2.4 |
| Common Stocks | 18.3 |
| Convertible Bonds | 0.9 |
| Convertible Preferred Stocks | 0.6 |
| Corporate Bonds & Notes | 20.5 |
| Foreign Government Obligations | 6.9 |
| Limited Partnerships | 2.0 |
| Municipal Bonds | 0.4 |
| Options Purchased Calls | 0.0(a) |
| Options Purchased Puts | 0.1 |
| Preferred Debt | 0.0(a) |
| Preferred Stocks | 0.2 |
| Residential Mortgage-Backed Securities - Agency | 0.6 |
| Residential Mortgage-Backed Securities - Non-Agency | 8.6 |
| Treasury Bills | 5.8 |
| U.S. Government & Agency Obligations | 0.2 |
| U.S. Treasury Obligations | 2.4 |
| Warrants | 0.0(a) |
| Short-Term Investments Segregated in Connection with Open Derivatives Contracts(b) | 26.0 |
| Total | 104.6 |
| (a) | Rounds to zero. |
| (b) | Includes investments in Money Market Funds (amounting to $122.9 million) which have been segregated to cover obligations relating to the Fund’s investment in derivatives which provide exposure to multiple markets. For a description of the Fund’s investments in derivatives, see Investments in derivatives following the Consolidated Portfolio of Investments and Note 2 to the Notes to Consolidated Financial Statements. |
Percentages indicated are based upon total investments including options purchased, net of investments sold short and excluding all other investments in derivatives, if any. The Fund’s portfolio composition is subject to change.
| 4 | Multi-Manager Alternative Strategies Fund | Annual Report 2019 |
Fund at a Glance (continued)
| Portfolio breakdown — short positions (%) (at August 31, 2019) |
| Common Stocks | (4.3) |
| Exchange-Traded Funds | (0.3) |
| Rights | (0.0)(a) |
| Total | (4.6) |
Percentages indicated are based upon total investments including options purchased, net of investments sold short and excluding all other investments in derivatives, if any. The Fund’s portfolio composition is subject to change.
| Market exposure through derivatives investments (% of notional exposure) (at August 31, 2019)(a) |
| | Long | Short | Net |
| Fixed Income Derivative Contracts | 127.7 | (6.8) | 120.9 |
| Commodities Derivative Contracts | 3.3 | (7.4) | (4.1) |
| Equity Derivative Contracts | 7.8 | (4.1) | 3.7 |
| Foreign Currency Derivative Contracts | 34.6 | (55.1) | (20.5) |
| Total Notional Market Value of Derivative Contracts | 173.4 | (73.4) | 100.0 |
(a) The Fund has market exposure (long and/or short) to fixed income, commodity and equity asset classes and foreign currency through its investments in derivatives. The notional exposure of a financial instrument is the nominal or face amount that is used to calculate payments made on that instrument and/or changes in value for the instrument. The notional exposure is a hypothetical underlying quantity upon which payment obligations are computed. Notional exposures provide a gauge for how the Fund may behave given changes in individual markets. For a description of the Fund’s investments in derivatives, see Investments in derivatives following the Consolidated Portfolio of Investments, and Note 2 of the Notes to Consolidated Financial Statements.
Multi-Manager Alternative Strategies Fund | Annual Report 2019
| 5 |
Manager Discussion of Fund Performance
Multi-Manager Alternative Strategies Fund is currently managed by five independent money management firms and each invests a portion of the portfolio’s assets. As of August 31, 2019, AQR Capital Management, LLC (AQR), Water Island Capital, LLC (Water Island), TCW Investment Management Company, LLC (TCW), Manulife Investment Management (US) LLC (Manulife) and AlphaSimplex Group, LLC (AlphaSimplex) managed approximately 12.0%, 24.9%, 30.4%, 19.8% and 12.9% of the portfolio, respectively.
For the 12-month period that ended August 31, 2019, the Fund’s Class A shares returned 4.36%. The Fund outperformed its benchmark, the FTSE Three-Month U.S. Treasury Bill Index, which returned 2.36% over the same period. The Fund’s outperformance can be attributed primarily to implementation of various alternative strategies.
Capital markets were resilient amid heightened volatility and uncertainty
During the latter months of 2018, capital markets were weighed down by expectations for Federal Reserve (Fed) tightening and concerns about the U.S.-China trade war. Markets reversed course to start 2019 on the dovish pivot by the Fed, as the Fed’s softened rhetoric suppressed volatility and provided cover for higher valuations. In July 2019, the Fed cut interest rates — by 25 basis points — for the first time since 2008, the impetus being weak global economic data, especially in manufacturing, and persistently low cost pressures. (A basis point is 1/100th of a percentage point.) Nevertheless, with the implementation of tariffs between the world’s two largest economies and a worsening outlook in trade negotiations, the period ended with heightened volatility, exacerbated by global recessionary concerns. A bid for safety pushed U.S. Treasury yields lower, and the yield curve, or spectrum of maturities, inverted, notably between the three-month and 10-year segments, the part of the curve whose inversion has presaged multiple recessions. (An inverted yield curve is one wherein yields on shorter term maturities are higher than yields on longer term maturities.) Global sovereign yields also plummeted, many into negative territory, with a three-month/10-year inversion occurring in a host of other countries.
Somewhat remarkably, U.S. equities were able to withstand the concerns of trade uncertainty and disappointing manufacturing metrics to post positive returns for the period, with the S&P 500 Index advancing an impressive 18.34% on a year-to-date basis through August 31, 2019 and 2.92% for the period overall. Fixed-income markets, too, were fueled by renewed expectations for Fed support, and the Bloomberg Barclays U.S. Aggregate Bond Index posted a total return of 10.17% for the period, as U.S. Treasury yields fell significantly. Municipal bonds led among fixed-income sectors, while corporate credit also performed strongly. Securitized products also fared well, including commercial mortgage-backed securities. Agency mortgage-backed securities also posted strong returns but trailed duration-matched U.S. Treasuries for the period.
Money management firms delivered results based on variety of alternative strategies
AQR: Our portion of the Fund, which pursues an active managed futures strategy, outperformed the benchmark during the annual period. We invest in a diverse portfolio of futures and forward contracts, both long and short, across the global equity, fixed-income, commodity and currency markets. In implementing our strategy, we utilize both short-term and long-term trend-following signals to attempt to profit from different types of trends that occur in each of these markets. Trend following can be simply described as taking long positions in markets that are rising in price and taking short positions in markets that are falling in price. In addition to trend-following signals, we also incorporate signals that seek to identify over-extended trends and seek to reduce risk when the chance of a reversal is perceived as higher than normal, since market reversals generally cause losses for trend-following strategies. A resurgence of trends in 2019 through August drove strong gains for our portion of the Fund during the period, enabling our portion of the Fund to recoup losses generated in late 2018. In late 2018, changing expectations for economic growth, rising global political and trade risks, shifting tones in monetary policy rhetoric, and changing global energy dynamics caused reversals across asset classes. Notably, our portion of the Fund generated a positive return in December 2018 from the significant sell-off in global equities, as our positioning was net short in light of weakness in equity markets from earlier in the year, especially in emerging markets and Europe. As headwinds to global economic growth intensified and the Fed pivoted to a dovish stance in early 2019, global bonds staged a significant rally through August 2019.
By asset class, fixed income contributed positively to our portion of the Fund’s results, while commodities, equities and currencies detracted. By signal, short-term trend following signals contributed most positively, with additional gains from long-term trend following signals. Over-extended trend signals, which attempt to identify trends that have gone too far and are due for reversals, detracted.
| 6 | Multi-Manager Alternative Strategies Fund | Annual Report 2019 |
Manager Discussion of Fund Performance (continued)
TCW: Our portion of the Fund, which implements an unconstrained bond strategy, outperformed the benchmark during the period, largely due to its duration positioning of approximately two years, which was rewarded amid a falling rate backdrop. During the period, two-year, intermediate (five- to ten-year) and 30-year U.S. Treasury yields fell approximately 112, 135 and 105 basis points, respectively. Another significant driver of our portion of the Fund’s outperformance during the period was its exposure to investment-grade and high-yield corporate credit, with the biggest contributions coming from the communications, consumer non-cyclicals and banking industries. A modest exposure to emerging markets debt also added value, despite spread, or yield differentials to U.S. Treasuries, widening toward the end of the period. Finally, notwithstanding a modest headwind from exposure to agency mortgage-backed securities and asset-backed securities, our portion of the Fund’s allocation to securitized products benefited returns given strong performance from legacy non-agency residential mortgage-backed securities and commercial mortgage-backed securities holdings.
In addition to the modest drag from its agency mortgage-backed securities exposure, our portion of the Fund’s student loan asset-backed securities holdings weighed on our portion of the Fund’s performance during the period, largely due to their floating rate nature amid a falling rate environment. There was also drag from certain independent energy names within the corporate credit sector, as the commodity complex came under pressure.
Water Island: Our portion of the Fund, which employs a variety of alternative strategies, outperformed the benchmark during the period. Two of the three sub-strategies we employ — merger arbitrage and credit opportunities — contributed positively to our portion of the Fund’s results during the period, while equity special situations detracted.
The sectors that contributed most to returns were communication services and consumer discretionary. Performance in communication services was driven primarily by two competitive bidding situations, both involving Twenty-First Century Fox and Comcast. In the consumer discretionary sector, performance was driven primarily by private equity firm Vintage Capital Management’s attempted acquisition of Rent-a-Center and by an investment, via our credit opportunities strategy, in GameStop bonds, which was predicated on a speculative merger and acquisition scenario. On an individual event or deal basis, the largest contributors during the period were merger arbitrage positions in the bidding wars for Anadarko Petroleum between Chevron and Occidental Petroleum and for Twenty-First Century Fox between Walt Disney and Comcast as well as the aforementioned attempted acquisition of Rent-a-Center by Vintage Capital. The countries that made the strongest positive contributions to performance during the period were the U.S. and the U.K.
The sectors that detracted most from returns were consumer staples and information technology. The performance in consumer staples was driven primarily by our investment in Hain Celestial Group via our equity special situations strategy. In information technology, the biggest detractor was our merger arbitrage position in NVIDIA’s bid for Mellanox Technologies. In addition to these two deals, another significant detractor from our portion of the Fund’s results was our merger arbitrage position in the Pacific Biosciences of California/Illumina deal. The country that detracted most from our portion of the Fund’s performance was Israel, as a result of the losses experienced in our investment in NVIDIA’s bid for Israel-based Mellanox Technologies.
Manulife: Our portion of the Fund outperformed the benchmark during the period. Our portion of the Fund, employing a strategic fixed-income opportunity strategy, primarily seeks to add alpha, or value, through security selection, sector rotation, regional allocation and opportunistic currency investments. During the period, we sought opportunities to balance income and stability and looked to position the portfolio more defensively from a credit, currency and liquidity standpoint, while also focusing on portfolio liquidity to minimize the impact of market volatility and an uncertain economic growth outlook.
Relative to the benchmark, the single largest driver of our portion of the Fund’s performance during the period was our long duration profile, which helped as central banks shifted to a more dovish policy stance and yields moved sharply lower globally. From a sector perspective, our portion of the Fund’s allocation to emerging markets sovereign debt contributed positively, as local yields remained attractive relative to developed markets. Sector allocations to convertibles and high-yield corporate bonds also added value during the period. Within the high-yield corporate bond sector, our portion of the Fund was defensively positioned in both industry allocation and overall quality, favoring issues within the communications, energy and capital goods industries. The largest contributors to performance from a non-U.S. country perspective were the eurozone, Brazil and the Philippines. Our portion of the Fund’s euro-denominated government holdings, including supranationals, benefited from high prices and lower long-term yields throughout the region. In Brazil, progress on pension reform was viewed positively and supported demand for assets in the country, sending yields lower.
Multi-Manager Alternative Strategies Fund | Annual Report 2019
| 7 |
Manager Discussion of Fund Performance (continued)
Only partially offsetting these positive contributors was currency management overall, which detracted, as the U.S. dollar strengthened during the period. Within the currency allocation, overweights to the euro and the Colombian peso were the primary detractors. Developed market currencies were under pressure, as subdued economic growth and negative rates dampened demand for these assets. The Colombian peso was somewhat pressured by lower energy prices. Our portion of the Fund’s equity allocation also hurt, with exposure to energy names especially weighing on relative results as the industry came under pressure from slowing global economic growth and lower crude oil prices. Local market positioning in Japan and Mexico were the only two detractors during the period from a country allocation perspective. While the local market in Japan performed poorly, we still found Japanese government bonds attractive on a fully-hedged basis where we could pick up incremental yield over U.S. Treasuries. The local market in Mexico saw a decline in demand for assets in the country following heightened concerns about some of the policy decisions made by its current administration in late 2018.
AlphaSimplex: During the period, our portion of the Fund, which utilizes a managed futures strategy, outperformed the benchmark. Positive returns primarily came from fixed income. In aggregate, equities, commodities and currencies detracted from performance.
In fixed income, the biggest positive contributors were long positions in Australian 10-year notes, German bunds and French government bonds. Some developed market currencies, including the euro, the British pound and Australian dollar, also contributed positively.
Our portion of the Fund’s losses were driven by equities, especially U.S. and international developed market equities. The largest detractors were futures contracts on the U.S. small-cap and mid-cap equity indexes and on the Japanese equity market. Commodities also detracted, especially long positions in energies and short positions in agricultural commodities. Short positions in natural gas and aluminum provided some positive returns. Currency losses came from the Japanese yen, New Zealand dollar and South African rand.
Within the different model types we employ, we saw positive performance across the board, especially from the adaptive models within fixed income. Short-horizon and basic trend approaches also contributed positively.
Changes to the Fund’s portfolio based on strategy implementation
The Fund’s portfolio turnover rate for the 12-month period was 226%. A significant portion of the turnover was the result of rolling-maturity mortgage securities, processing of prepayments and opportunistic changes our managers made at the margin in response to valuations or market developments.
AQR: Our portion of the Fund aims to take a risk-balanced approach to asset classes, allowing for tactical deviation as a result of attractiveness of trends. Overall, the largest positive contributors during the period were trend following in the euro, the Korean won and Eurodollar futures. These positive contributors were only partially offset by trend following in the New Zealand dollar, Canadian dollar and South African rand, which detracted.
By asset class, trend following in fixed income contributed positively. Global fixed-income markets realized significant directional moves, as central banks pivoted toward more accommodative outlooks and policies. Gains were shared among short-term and long-term trend following signals, as fixed-income markets broadly sustained bullish trends during the period. Despite starting the period net short U.S. fixed income, the large reversals in late 2018 caused our portion of the Fund’s positioning to flip long, leading to gains that accounted for nearly half of the overall fixed-income attribution during the period. International bond markets also contributed, as they sustained bullish trends, with meaningful contributions from European and Australian bonds, which also trended higher on accommodative monetary outlooks and policy.
Conversely, trend following in equities detracted from our portion of the Fund’s performance during the period. Global equities reversed long-term trends several times during the period but sustained intermittent short-term trends. Longer term bullish trends from early in the period reversed significantly in October 2018, resulting in overall net equity positioning in our portion of the Fund to flip from long to short. Short positioning helped as the sell-off continued through December 2018 but detracted in early 2019 when global equities reversed and strongly rallied, re-establishing bullish trends. Those trends reversed again in
| 8 | Multi-Manager Alternative Strategies Fund | Annual Report 2019 |
Manager Discussion of Fund Performance (continued)
May and August 2019, however, on heightened trade tensions between the U.S. and China, leading to losses from net long exposures. Long-term trend reversals drove losses, while short-term trend following signals contributed positively to performance, as their views changed to align with new equity market trends and contributed positively as those trends persisted.
Trend following in currencies also detracted during the period. Changing risk sentiment and uncertainty around U.S.-China trade negotiations drove reversals and losses during the period. The New Zealand dollar detracted, as it reversed on changing outlooks for trade and interest rate policy. The Japanese yen fluctuated during the period in connection with changes in risk sentiment. The Canadian dollar detracted, as reversals in crude oil and related products weighed on the currency. Theses losses were partly offset by gains from sustained trends in other currencies. In particular, sustained longer-term bearish trends in the euro and Korean won contributed positively to performance, as weakness in economic data from those regions, increased trade tensions and slowing global economic growth concerns weighed on the currencies. These dynamics drove losses for short-term signals, while sustained bearish trends in the euro and Korean won drove positive attribution to long-term signals. Over-extended signals detracted, as they viewed the U.S. dollar as expensive, but the currency broadly appreciated during the period.
Trend following in commodities detracted from our portion of the Fund’s results during the period. Several reversals in crude oil and related commodities drove most of the losses. First, the U.S. offered sanction waivers allowing trade partners to import Iranian oil in November 2018, causing a significant reversal and sell-off. Other reversals took place around heightened concerns about global economic growth, trade tensions and geopolitical events later in the period, leading to a lack of clear market direction. Sustained bearish trends in the soy complex contributed positively and offset some of the losses, as did a sustained bearish trend in natural gas. Long-term signals drove losses, mainly due to the significant directional shifts in energies during the period. Over-extended signals also detracted, as they viewed crude oil and related commodities as cheap, but these commodities overall declined.
At the end of the period, equity positioning within our portion of the Fund was net neutral. Within fixed income, our portion of the Fund ended the period broadly long across geographies on continued agreement between short-term and long-term trend following signals. Within currencies, our portion of the Fund ended the period net long U.S. dollar and Japanese yen crosses and net short European and emerging market crosses. (Currency crosses are transactions consisting of a pair of currencies traded in foreign exchanges.) Within commodities, our portion of the Fund ended the period net long precious metals and net short energies, base metals and agricultural products.
TCW: As U.S. Treasury yields marched higher in 2018, we extended our portion of the Fund’s duration in a disciplined fashion, dollar cost averaging the position to approximately 2.2 years at the end of December 2018. Similarly, we adjusted the duration position as rates fell during the remainder of the period, moving slightly shorter to close August 2019 at 1.8 years.
In terms of sector allocation, our portion of the Fund’s overall positioning remained defensive, with our corporate credit exposure emphasizing regulated financials and industries like communications, consumer non-cyclicals and banking. Of note, as risk premiums increased in the fourth quarter of 2018, our portion of the Fund took advantage of the market volatility by incrementally adding to its credit allocation across a variety of industries, including autos and manufacturing. Indiscriminate selling in the high-yield corporate bond and emerging markets debt markets also provided opportunities, we felt, to expand our portion of the Fund’s risk exposure in a disciplined fashion. Consistent with our value discipline, we subsequently trimmed these exposures, as spreads tightened in early 2019. Finally, an emphasis on the senior area of the securitized markets remained intact, though we actively sought attractive opportunities to add risk exposure.
Water Island: During the period, we established a merger arbitrage position in the acquisition of WellCare Health Plans, a U.S.-based provider of managed care services, by Centene, a local managed care organization, for $15.9 billion in cash and stock. The spread subsequently widened on news an activist investor was attempting to push Centene to cancel the transaction with WellCare Health Plans and instead sell itself. We viewed the volatility as an opportunity to increase our portion of the Fund’s position, and we were rewarded when Centene’s Chief Executive Officer publicly stated he would complete the acquisition. This led to spread tightening gains for our portion of the Fund. The companies subsequently held successful shareholder votes in late June 2019, and the transaction is expected to close in the first half of 2020 pending required regulatory approvals. We also initiated a merger arbitrage position in the transaction between Tribune Media and
Multi-Manager Alternative Strategies Fund | Annual Report 2019
| 9 |
Manager Discussion of Fund Performance (continued)
Nexstar Media Group. During the first quarter of 2019, the companies announced they had reached agreements to sell 19 stations in 15 markets as part of an effort to comply with FCC ownership restrictions and antitrust concerns. In July 2019, the merger received Department of Justice approval, leaving FCC approval as the final hurdle. We expect the transaction to close during the third quarter of 2019. Conversely, upon a successful deal closing, our portion of the Fund no longer held a position in the acquisition of Red Hat by IBM. Similarly, upon the successful closing of the transaction to merge L3 Technologies and Harris to create the newly formed L3Harris Technologies, our portion of the Fund exited the position.
Any shifts in sector exposure are largely the result of the available opportunity set in terms of corporate activity and the subset of events that meet our risk/reward criteria. That said, the sectors in which we saw the highest levels of corporate activity during the period included industrials, information technology, health care and consumer discretionary. While there were no changes to our portion of the Fund’s credit portfolio with regard to quality emphasis, yield curve or duration positioning, it is worth noting that we focused on maintaining a short duration in the portfolio’s credit sleeve. We maintained this focus not only from the perspective of effective duration but also when viewed through the lens of “duration to catalyst” — our proprietary metric that takes into account the potential for a shortened timeline should a particular expected corporate event come to fruition. As always, we seek returns driven by the outcomes of specific, idiosyncratic corporate events, rather than by the overall market. Our strategy is agnostic in terms of capitalization, style, sector or country weighting.
Manulife: Among sector and quality allocations, we positioned our portion of the Fund more defensively given headwinds to global economic growth mounting and central banks shifting policy direction. As it became clear that rates were headed lower globally, we looked to extend duration, buying U.S. Treasuries and exiting bank loans. Overall portfolio duration moved from 1.6 years at the end of August 2018 to about 3.9 years at the end of August 2019. In addition, we reduced positions in equities, convertibles and high-yield corporate bonds and added to our portion of the Fund’s investment-grade corporate bond allocation.
From a regional and country allocation perspective, we increased exposure to the U.S. and reduced non-U.S. developed market and supranational allocations, as economic growth and inflation came in below expectations and yields moved lower. We favored higher quality emerging markets, where fundamentals are strong or improving and that have less volatile currency profiles. Within the sector, we exited all positions in Mexico on concerns about the policy direction of its current administration and added to positions in Brazil and Colombia. In addition, we initiated positions in Saudi Arabia and Qatar, where we were finding attractive yields on what we saw as stable, high-quality issues. We also added high quality, defensive positions in both U.S. Treasuries and Japanese government bonds to add liquidity and dampen the effect of potential short-term market volatility.
At the end of the period, our portion of the Fund was balanced rather evenly between high-yield and investment-grade corporate bonds. Additionally, our portion of the Fund ended the period with allocations to U.S. Treasuries, emerging markets sovereign debt, asset-backed securities, convertibles, non-agency mortgage-backed securities, commercial mortgage-backed securities and equities. From a regional/country perspective, our portion of the Fund held its primary exposure to the U.S. but also held core developed market positions in Canada, Ireland and Norway. In emerging markets, our portion of the Fund favored investment grade countries, such as Indonesia, the Philippines and Brazil.
AlphaSimplex: Our team focuses on developing quantitative and automated investment processes rather than employing discretion in managing portfolios. All aspects of our trading — which typically includes 18 to 25 securities per day — are governed by systematic algorithms. That said, shifts in positioning were made over the course of the period, as the algorithms mandated. For example, overall, long positions in equities decreased, and long positions in bonds increased. Our portion of the Fund maintained short positions in currencies and commodities overall throughout the period, but we moderately reduced the short positions in each asset class. Our portion of the Fund shifted from a short position in interest rates at the start of the period to a long exposure overall.
At the end of the annual period, as a whole, our portion of the Fund had long exposures, all via futures contracts, to bonds, interest rates and equities, and short exposures, all via futures contracts, to currencies and commodities.
| 10 | Multi-Manager Alternative Strategies Fund | Annual Report 2019 |
Manager Discussion of Fund Performance (continued)
Derivative positions in the Fund
AQR: Our portion of the Fund invests mostly via derivatives, primarily futures contracts and futures-related instruments. These include global developed and emerging market equity index futures; global developed and emerging market currency forwards; commodity futures and swaps on commodity futures; and global developed market bonds and interest rate futures as well as swaps on bond futures. The overall impact of derivatives on performance was varied and linked to the strategies within which they are implemented.
TCW: Our portion of the Fund held U.S. Treasury futures as a method of managing duration. The use of these futures was effectively used to manage duration but detracted from performance on a total return basis during the period. Our portion of the Fund also used currency swaps, maintaining a position in Japanese government bonds, with the yen exposure fully hedged out using a U.S. dollar-yen cross currency swap given what we saw as an attractive yield premium. The currency swap position added value during the period. We exited the swap position when the value proposition became, in our view, less attractive.
Water Island: During the period, our portion of the Fund employed total return equity swaps, equity options and currency forwards for four core purposes: to hedge currency risk, to invest outside the U.S. more efficiently, to create income and optionality, and to limit volatility and correlation. During the period, derivatives contributed positively to our portion of the Fund’s performance.
Manulife: During the period, our portion of the Fund used interest rate futures and currency forwards to manage risk, provide diversification and enhance returns. The impact of currency forwards was mixed, as it also reflects hedging effects. However, overall, currency-related investments, including derivatives, detracted. U.S. Treasury futures were used to hedge some of the rate exposure associated with our portion of the Fund’s U.S. Treasury position, which, as a whole, contributed positively.
AlphaSimplex: Our portion of the Fund invests mostly via derivatives, primarily futures contracts and futures-related instruments. The derivatives employed are primarily exchange-traded futures contracts, which are used to gain liquid exposure to and rotate among a broad array of markets. We used these derivatives in pursuit of our portion of the Fund’s investment objective, to manage overall market exposure, and for alpha, or value, generation. Derivatives may be used to obtain long or short exposure to a particular asset class, region, currency, commodity or index. With the exception of returns generated by our portion of the Fund’s short-term cash portfolio, the overall impact of derivatives on performance was varied and linked to the asset class, region, currency, commodity or index within which they are implemented.
Market risk may affect a single issuer, sector of the economy, industry or the market as a whole. Investing inderivatives is a specialized activity that involves special risks that subject the Fund to significant loss potential, including when used as leverage, and may result in greater fluctuation in fund value.Commodity investments may be affected by the overall market and industry- and commodity-specific factors, and may be more volatile and less liquid than other investments. Fixed-income securities presentissuer default risk.Non-investment-grade (high-yield or junk) securities present greater price volatility and more risk to principal and income than higher rated securities. A rise ininterest rates may result in a price decline of fixed-income instruments held by the Fund, negatively impacting its performance and NAV. Falling rates may result in the Fund investing in lower yielding debt instruments, lowering the Fund’s income and yield. These risks may be heightened for longer maturity and duration securities.Prepayment and extension risk exists because the timing of payments on a loan, bond or other investment may accelerate when interest rates fall or decelerate when interest rates rise which may reduce investment opportunities and potential returns.International investing involves certain risks and volatility due to potential political, economic or currency instabilities and different financial and accounting standards. Certainissuer events, including initial public offerings, business consolidation or restructuring, may present heightened risks to securities from the high degree of uncertainty associated with such events.Short positions (where the underlying asset is not owned) can create unlimited risk. Risks are enhanced foremerging market andsovereigndebt issuers. The Fund is managed bymultiple advisers independently of one another, which may result in contradicting trades (i.e., with no net benefit to the fund), while increasing transaction costs. As anon-diversified fund, fewer investments could have a greater effect on performance. Market or other (e.g., interest rate) environments may adversely affect theliquidity of fund investments, negatively impacting their price. Generally, the less liquid the market at the time the fund sells a holding, the greater the risk of loss or decline of value to the Fund. See the Fund’s prospectus for more information on these and other risks.
The views expressed in this report reflect the current views of the respective parties. These views are not guarantees of future performance and involve certain risks, uncertainties and assumptions that are difficult to predict, so actual outcomes and results may differ significantly from the views expressed. These views are subject to change at any time based upon economic, market or other conditions and the respective parties disclaim any responsibility to
Multi-Manager Alternative Strategies Fund | Annual Report 2019
| 11 |
Manager Discussion of Fund Performance (continued)
update such views. These views may not be relied on as investment advice and, because investment decisions for a Columbia fund are based on numerous factors, may not be relied on as an indication of trading intent on behalf of any particular Columbia fund. References to specific securities should not be construed as a recommendation or investment advice.
| 12 | Multi-Manager Alternative Strategies Fund | Annual Report 2019 |
Understanding Your Fund’s Expenses
(Unaudited)
As an investor, you incur two types of costs. There are shareholder transaction costs, which may include redemption fees. There are also ongoing fund costs, which generally include management fees, distribution and/or service fees, and other fund expenses. The following information is intended to help you understand your ongoing costs (in dollars) of investing in the Fund and to help you compare these costs with the ongoing costs of investing in other mutual funds.
Analyzing your Fund’s expenses
To illustrate these ongoing costs, we have provided examples and calculated the expenses paid by investors in each share class of the Fund during the period. The actual and hypothetical information in the table is based on an initial investment of $1,000 at the beginning of the period indicated and held for the entire period. Expense information is calculated two ways and each method provides you with different information. The amount listed in the “Actual” column is calculated using the Fund’s actual operating expenses and total return for the period. You may use the Actual information, together with the amount invested, to estimate the expenses that you paid over the period. Simply divide your account value by $1,000 (for example, an $8,600 account value divided by $1,000 = 8.6), then multiply the results by the expenses paid during the period under the “Actual” column. The amount listed in the “Hypothetical” column assumes a 5% annual rate of return before expenses (which is not the Fund’s actual return) and then applies the Fund’s actual expense ratio for the period to the hypothetical return. You should not use the hypothetical account values and expenses to estimate either your actual account balance at the end of the period or the expenses you paid during the period. See “Compare with other funds” below for details on how to use the hypothetical data.
Compare with other funds
Since all mutual funds are required to include the same hypothetical calculations about expenses in shareholder reports, you can use this information to compare the ongoing cost of investing in the Fund with other funds. To do so, compare the hypothetical example with the 5% hypothetical examples that appear in the shareholder reports of other funds. As you compare hypothetical examples of other funds, it is important to note that hypothetical examples are meant to highlight the ongoing costs of investing in a fund only and do not reflect any transaction costs, such as redemption or exchange fees. Therefore, the hypothetical calculations are useful in comparing ongoing costs only, and will not help you determine the relative total costs of owning different funds. If transaction costs were included in these calculations, your costs would be higher.
| March 1, 2019 — August 31, 2019 |
| | Account value at the
beginning of the
period ($) | Account value at the
end of the
period ($) | Expenses paid during
the period ($) | Fund’s annualized
expense ratio (%) |
| | Actual | Hypothetical | Actual | Hypothetical | Actual | Hypothetical | Actual |
| Class A | 1,000.00 | 1,000.00 | 1,060.20 | 1,017.55 | 7.75 | 7.59 | 1.50 |
| Institutional Class | 1,000.00 | 1,000.00 | 1,061.20 | 1,018.80 | 6.46 | 6.33 | 1.25 |
Expenses paid during the period are equal to the annualized expense ratio for each class as indicated above, multiplied by the average account value over the period and then multiplied by the number of days in the Fund’s most recent fiscal half year and divided by 365.
Expenses do not include fees and expenses incurred indirectly by the Fund from its investment in underlying funds, including affiliated and non-affiliated pooled investment vehicles, such as mutual funds and exchange-traded funds.
The Fund is offered only through certain wrap fee programs sponsored and/or managed by Ameriprise Financial, Inc. or its affiliates. Participants in wrap fee programs pay other fees that are not included in the above table. Please refer to the wrap program documents for information about the fees charged.
Multi-Manager Alternative Strategies Fund | Annual Report 2019
| 13 |
Consolidated Portfolio of Investments
August 31, 2019
(Percentages represent value of investments compared to net assets)
Investments in securities
| Asset-Backed Securities — Non-Agency 4.9% |
| Issuer | Coupon
Rate | | Principal
Amount ($) | Value ($) |
| American Express Credit Account Master Trust |
| Series 2019-1 Class A |
| 10/15/2024 | 2.870% | | 160,000 | 164,902 |
| Barings CLO Ltd.(a),(b) |
| Series 2013-IA Class AR |
3-month USD LIBOR + 0.800%
Floor 0.800%
01/20/2028 | 3.078% | | 120,000 | 119,605 |
| Series 2018-3A Class A1 |
3-month USD LIBOR + 0.950%
07/20/2029 | 3.228% | | 450,000 | 448,067 |
| BlueMountain CLO Ltd.(a),(b) |
| Series 2013-1A Class A1R2 |
3-month USD LIBOR + 1.230%
Floor 1.230%
01/20/2029 | 3.508% | | 400,000 | 400,223 |
| Series 2015-2A Class A1R |
3-month USD LIBOR + 0.930%
Floor 0.930%
07/18/2027 | 3.230% | | 425,000 | 423,639 |
| Cedar Funding II CLO Ltd.(a),(b) |
| Series 2013-1A Class A1R |
3-month USD LIBOR + 1.230%
06/09/2030 | 3.683% | | 750,000 | 750,031 |
| Coinstar Funding LLC(a) |
| CMO Series 2017-1 Class A2 |
| 04/25/2047 | 5.216% | | 337,237 | 348,920 |
| Conseco Finance Corp.(c) |
| Series 2096-9 Class M1 |
| 08/15/2027 | 7.630% | | 622,645 | 679,151 |
| DB Master Finance LLC(a) |
| CMO Series 2017-1A Class A2I |
| 11/20/2047 | 3.629% | | 98,250 | 101,476 |
| Series 2019-1A Class A2I |
| 05/20/2049 | 3.787% | | 189,525 | 198,540 |
| Series 2019-1A Class A2II |
| 05/20/2049 | 4.021% | | 99,750 | 103,216 |
| Discover Card Execution Note Trust |
| Series 2016-A4 Class A4 |
| 03/15/2022 | 1.390% | | 575,000 | 574,837 |
| Series 2019-A1 Class A1 |
| 07/15/2024 | 3.040% | | 150,000 | 154,743 |
| Domino’s Pizza Master Issuer LLC(a),(b) |
| CMO Series 2017-1A Class A2I |
3-month USD LIBOR + 1.250%
07/25/2047 | 3.526% | | 367,500 | 365,905 |
| Asset-Backed Securities — Non-Agency (continued) |
| Issuer | Coupon
Rate | | Principal
Amount ($) | Value ($) |
| Dryden 30 Senior Loan Fund(a),(b) |
| Series 2013-30A Class AR |
3-month USD LIBOR + 0.820%
11/15/2028 | 2.978% | | 260,000 | 258,397 |
| Eaton Vance CLO Ltd.(a),(b) |
| Series 2013-1A Class A1RR |
3-month USD LIBOR + 1.160%
01/15/2028 | 3.377% | | 310,000 | 310,000 |
| Education Loan Asset-Backed Trust I(a),(b) |
| Series 2013-1 Class A2 |
1-month USD LIBOR + 0.800%
Floor 0.800%
04/26/2032 | 2.945% | | 436,000 | 432,745 |
| EFS Volunteer No. 2 LLC(a),(b) |
| Series 2012-1 Class A2 |
1-month USD LIBOR + 1.350%
Floor 1.350%
03/25/2036 | 3.495% | | 555,000 | 559,168 |
| FOCUS Brands Funding LLC(a) |
| CMO Series 2017-1 Class A2II |
| 04/30/2047 | 5.093% | | 161,287 | 170,287 |
| Ford Credit Auto Owner Trust |
| Series 2016-C Class A3 |
| 03/15/2021 | 1.220% | | 82,793 | 82,607 |
| GoldenTree Loan Opportunities IX Ltd.(a),(b) |
| Series 2014-9A Class AR2 |
3-month USD LIBOR + 1.110%
Floor 1.110%
10/29/2029 | 3.366% | | 190,000 | 189,997 |
| Jack In The Box Funding LLC(a) |
| Series 2019-1A Class A2II |
| 08/25/2049 | 4.476% | | 125,000 | 128,120 |
| JG Wentworth XXII LLC(a) |
| Series 2010-3A Class A |
| 12/15/2048 | 3.820% | | 609,060 | 633,236 |
| LCM(a),(b) |
| Series 2019A Class AR |
3-month USD LIBOR + 1.240%
Floor 1.240%
07/15/2027 | 3.543% | | 200,000 | 200,003 |
| LCM XXI LP(a),(b) |
| Series 20 18-21A Class AR |
3-month USD LIBOR + 0.880%
04/20/2028 | 3.158% | | 450,000 | 447,849 |
| Madison Park Funding XXX Ltd.(a),(b) |
| Series 2018-30A Class A |
3-month USD LIBOR + 0.750%
Floor 0.750%
04/15/2029 | 3.053% | | 400,000 | 395,168 |
The accompanying Notes to Consolidated Financial Statements are an integral part of this statement.
| 14 | Multi-Manager Alternative Strategies Fund | Annual Report 2019 |
Consolidated Portfolio of Investments (continued)
August 31, 2019
| Asset-Backed Securities — Non-Agency (continued) |
| Issuer | Coupon
Rate | | Principal
Amount ($) | Value ($) |
| Magnetite VII Ltd.(a),(b) |
| Series 2012-7A Class A1R2 |
3-month USD LIBOR + 0.800%
01/15/2028 | 3.103% | | 425,000 | 422,024 |
| MVW Owner Trust(a) |
| Series 2018-1A Class A |
| 01/21/2036 | 3.450% | | 112,381 | 116,429 |
| Navient Student Loan Trust(b) |
| Series 2014-1 Class A3 |
1-month USD LIBOR + 0.510%
Floor 0.510%
06/25/2031 | 2.655% | | 597,688 | 593,073 |
| Navient Student Loan Trust(a),(b) |
| Series 2016-1A Class A |
1-month USD LIBOR + 0.700%
02/25/2070 | 2.845% | | 525,817 | 523,870 |
| Series 2016-2 Class A3 |
1-month USD LIBOR + 1.500%
06/25/2065 | 3.645% | | 729,000 | 754,469 |
| Series 2017-3A Class A3 |
1-month USD LIBOR + 1.050%
07/26/2066 | 3.195% | | 750,000 | 753,741 |
| Series 2018-3A Class A3 |
1-month USD LIBOR + 0.800%
03/25/2067 | 2.945% | | 900,000 | 896,111 |
| Nelnet Student Loan Trust(a),(b) |
| Series 2012-1A Class A |
1-month USD LIBOR + 0.800%
Floor 0.800%
12/27/2039 | 2.945% | | 476,599 | 475,230 |
| NextGear Floorplan Master Owner Trust(a) |
| Series 2018-2A Class A2 |
| 10/16/2023 | 3.690% | | 175,000 | 181,883 |
| Recette CLO Ltd.(a),(b) |
| Series 2015-1A Class AR |
3-month USD LIBOR + 0.920%
10/20/2027 | 3.198% | | 215,000 | 214,784 |
| SLC Student Loan Trust(b) |
| Series 2006-1 Class A6 |
3-month USD LIBOR + 0.160%
Floor 0.160%
03/15/2055 | 2.570% | | 841,000 | 793,550 |
| SLM Student Loan Trust(a),(b) |
| Series 2003-10A Class A3 |
3-month USD LIBOR + 0.470%
12/15/2027 | 2.880% | | 365,377 | 365,423 |
| Series 2004-3 Class A6A |
3-month USD LIBOR + 0.550%
Floor 0.550%
10/25/2064 | 2.826% | | 900,000 | 885,217 |
| Asset-Backed Securities — Non-Agency (continued) |
| Issuer | Coupon
Rate | | Principal
Amount ($) | Value ($) |
| SLM Student Loan Trust(b) |
| Series 2007-3 Class A4 |
3-month USD LIBOR + 0.060%
Floor 0.060%
01/25/2022 | 2.336% | | 801,174 | 778,075 |
| Series 2007-6 Class A4 |
3-month USD LIBOR + 0.380%
Floor 0.380%
10/25/2024 | 2.656% | | 294,485 | 294,211 |
| Series 2008-2 Class B |
3-month USD LIBOR + 1.200%
Floor 1.200%
01/25/2083 | 3.476% | | 740,000 | 706,250 |
| Series 2008-4 Class A4 |
3-month USD LIBOR + 1.650%
Floor 1.650%
07/25/2022 | 3.926% | | 441,399 | 445,922 |
| Series 2008-5 Class A4 |
3-month USD LIBOR + 1.700%
Floor 1.700%
07/25/2023 | 3.976% | | 301,770 | 304,738 |
| Series 2008-6 Class A4 |
3-month USD LIBOR + 1.100%
07/25/2023 | 3.376% | | 363,184 | 361,753 |
| Series 2008-7 Class B |
3-month USD LIBOR + 1.850%
Floor 1.850%
07/26/2083 | 4.126% | | 500,000 | 498,600 |
| Series 2008-9 Class A |
3-month USD LIBOR + 1.500%
Floor 1.500%
04/25/2023 | 3.776% | | 266,897 | 269,203 |
| Series 2011-2 Class A2 |
1-month USD LIBOR + 1.200%
Floor 1.200%
10/25/2034 | 3.345% | | 1,040,000 | 1,055,668 |
| Series 2012-1 Class A3 |
1-month USD LIBOR + 0.950%
Floor 0.950%
09/25/2028 | 3.095% | | 538,347 | 530,525 |
| Series 2014-2 Class A3 |
1-month USD LIBOR + 0.590%
Floor 0.590%
03/25/2055 | 2.735% | | 451,635 | 445,409 |
| Subordinated Series 2004-10 Class B |
3-month USD LIBOR + 0.370%
Floor 0.370%
01/25/2040 | 2.646% | | 445,297 | 408,020 |
| Subordinated Series 2007-2 Class B |
3-month USD LIBOR + 0.170%
07/25/2025 | 2.446% | | 700,000 | 638,365 |
The accompanying Notes to Consolidated Financial Statements are an integral part of this statement.
Multi-Manager Alternative Strategies Fund | Annual Report 2019
| 15 |
Consolidated Portfolio of Investments (continued)
August 31, 2019
| Asset-Backed Securities — Non-Agency (continued) |
| Issuer | Coupon
Rate | | Principal
Amount ($) | Value ($) |
| Subordinated Series 2007-3 Class B |
3-month USD LIBOR + 0.150%
Floor 0.150%
01/25/2028 | 2.426% | | 700,000 | 638,830 |
| Subordinated Series 2012-7 Class B |
1-month USD LIBOR + 1.800%
Floor 1.800%
09/25/2043 | 3.945% | | 550,000 | 538,261 |
| Taco Bell Funding LLC(a) |
| Series 2016-1A Class A23 |
| 05/25/2046 | 4.970% | | 376,337 | 401,977 |
| Treman Park CLO Ltd.(a),(b) |
| Series 2015-1A Class ARR |
3-month USD LIBOR + 1.070%
Floor 1.070%
10/20/2028 | 3.348% | | 850,000 | 849,992 |
Total Asset-Backed Securities — Non-Agency
(Cost $24,607,027) | 24,782,435 |
|
| Commercial Mortgage-Backed Securities - Agency 3.3% |
| | | | |
| Federal Home Loan Mortgage Corp. Multifamily Structured Pass-Through Certificates(c),(d) |
| CMO Series K014 Class X1 |
| 04/25/2021 | 1.324% | | 5,092,561 | 80,562 |
| CMO Series K057 Class X1 |
| 07/25/2026 | 1.324% | | 3,961,499 | 267,841 |
| Series 2016-KIR1 Class X |
| 03/25/2026 | 1.213% | | 2,550,547 | 152,419 |
| Series 2018-K732 Class X3 |
| 05/25/2046 | 2.247% | | 1,350,000 | 152,588 |
| Series 2019-K093 Class XAM |
| 05/25/2029 | 1.331% | | 1,770,000 | 185,158 |
| Series K006 Class AX1 |
| 01/25/2020 | 1.064% | | 6,998,086 | 8,528 |
| Series K015 Class X3 |
| 08/25/2039 | 2.896% | | 2,000,000 | 103,020 |
| Series K021 Class X3 |
| 07/25/2040 | 2.034% | | 1,550,000 | 81,605 |
| Series K022 Class X3 |
| 08/25/2040 | 1.875% | | 1,550,000 | 78,459 |
| Series K025 Class X3 |
| 11/25/2040 | 1.811% | | 2,400,000 | 127,139 |
| Series K035 Class X3 |
| 12/25/2041 | 1.852% | | 3,000,000 | 200,185 |
| Series K043 Class X3 |
| 02/25/2043 | 1.691% | | 3,951,044 | 312,993 |
| Series K0728 Class X3 |
| 11/25/2045 | 2.016% | | 1,975,000 | 172,470 |
| Commercial Mortgage-Backed Securities - Agency (continued) |
| Issuer | Coupon
Rate | | Principal
Amount ($) | Value ($) |
| Series K712 Class X1 |
| 11/25/2019 | 1.379% | | 2,998,316 | 1,433 |
| Series K712 Class X3 |
| 05/25/2040 | 1.461% | | 6,500,000 | 22,327 |
| Series K714 Class X1 |
| 10/25/2020 | 0.793% | | 6,002,179 | 31,424 |
| Series K717 Class X3 |
| 11/25/2042 | 1.681% | | 3,500,000 | 114,934 |
| Series K734 Class X1 |
| 02/25/2026 | 0.787% | | 4,148,819 | 152,749 |
| Series Q004 Class XFL |
| 10/25/2021 | 1.096% | | 4,994,229 | 138,416 |
| Federal Home Loan Mortgage Corp. Multifamily Structured Pass-Through Certificates |
| CMO Series K151 Class A3 |
| 04/25/2030 | 3.511% | | 710,000 | 785,864 |
| Series KJ05 Class A1 |
| 05/25/2021 | 1.418% | | 18,110 | 18,036 |
| Series KJ13 |
| 09/25/2021 | 2.055% | | 136,354 | 135,915 |
| Series Q007 Class APT2 |
| 10/25/2047 | 3.325% | | 736,762 | 795,107 |
| Federal Home Loan Mortgage Corp. Multifamily Structured Pass-Through Certificates(c) |
| Series Q004 Class A2H |
| 01/25/2021 | 3.054% | | 683,978 | 687,766 |
| Series Q006 Class APT1 |
| 07/25/2026 | 2.620% | | 879,430 | 903,280 |
| Series Q010 Class APT1 |
| 04/25/2046 | 2.934% | | 750,662 | 759,578 |
| Series Q010 Class APT2 |
| 12/25/2047 | 2.950% | | 380,000 | 385,641 |
| Federal National Mortgage Association |
| 12/01/2020 | 3.270% | | 15,956 | 16,208 |
| 12/01/2021 | 3.300% | | 781,452 | 805,293 |
| 09/01/2025 | 3.420% | | 375,000 | 396,544 |
| 08/01/2027 | 3.980% | | 544,148 | 612,424 |
| 04/01/2028 | 3.050% | | 390,000 | 419,804 |
| 12/01/2028 | 3.950% | | 200,000 | 228,944 |
| 05/01/2029 | 3.580% | | 196,914 | 219,247 |
| 05/01/2029 | 3.970% | | 190,549 | 221,129 |
| 01/01/2030 | 3.370% | | 439,679 | 486,634 |
| 02/01/2030 | 3.130% | | 100,000 | 108,536 |
| 11/01/2030 | 3.820% | | 400,000 | 461,279 |
| 03/01/2031 | 3.030% | | 394,804 | 425,955 |
| 07/01/2032 | 3.010% | | 303,437 | 329,597 |
| 04/01/2033 | 3.430% | | 250,000 | 281,498 |
| 11/01/2033 | 4.030% | | 95,000 | 113,399 |
| 11/01/2033 | 4.095% | | 75,000 | 88,639 |
| 01/01/2034 | 3.900% | | 150,000 | 173,478 |
| 01/01/2034 | 4.170% | | 105,000 | 125,131 |
| 05/01/2034 | 3.450% | | 610,000 | 692,348 |
The accompanying Notes to Consolidated Financial Statements are an integral part of this statement.
| 16 | Multi-Manager Alternative Strategies Fund | Annual Report 2019 |
Consolidated Portfolio of Investments (continued)
August 31, 2019
| Commercial Mortgage-Backed Securities - Agency (continued) |
| Issuer | Coupon
Rate | | Principal
Amount ($) | Value ($) |
| 11/01/2037 | 3.210% | | 853,115 | 926,354 |
| 12/01/2037 | 3.260% | | 500,000 | 551,932 |
| 04/01/2043 | 4.100% | | 392,096 | 432,556 |
| Series 2012-M1 Class A2 |
| 10/25/2021 | 2.729% | | 683,053 | 692,099 |
| Federal National Mortgage Association(b),(d) |
| Series 2011-M9 Class SA |
-1.0 x 1-month USD LIBOR + 6.350%
Cap 6.350%
01/25/2021 | 4.084% | | 1,184,594 | 32,042 |
| Federal National Mortgage Association(c),(d) |
| Series 2012-M14 Class X2 |
| 09/25/2022 | 0.485% | | 6,130,371 | 65,122 |
| Series 2016-M11B Class X2 |
| 07/25/2039 | 2.705% | | 2,854,400 | 103,010 |
| Series 2016-M4 Class X2 |
| 01/25/2039 | 2.671% | | 870,441 | 73,414 |
| Government National Mortgage Association(c),(d) |
| CMO Series 2014-103 Class IO |
| 05/16/2055 | 0.592% | | 2,945,483 | 85,826 |
| Series 2011-53 Class IO |
| 05/16/2051 | 0.000% | | 2,804,047 | 5,750 |
| Series 2012-4 Class IO |
| 05/16/2052 | 0.168% | | 6,789,850 | 47,790 |
| Series 2014-88 Class IE |
| 03/16/2055 | 0.323% | | 4,171,044 | 96,571 |
| Government National Mortgage Association(c) |
| Series 2011-65 |
| 09/16/2050 | 4.043% | | 441,941 | 450,454 |
Total Commercial Mortgage-Backed Securities - Agency
(Cost $16,668,182) | 16,624,444 |
|
| Commercial Mortgage-Backed Securities - Non-Agency 2.3% |
| | | | |
| BBCMS Mortgage Trust(a),(b) |
| Subordinated Series 2018-TALL Class E |
1-month USD LIBOR + 2.437%
03/15/2037 | 4.633% | | 160,000 | 160,500 |
| BB-UBS Trust(a) |
| Series 2012-SHOW Class A |
| 11/05/2036 | 3.430% | | 190,000 | 201,873 |
| BHMS Mortgage Trust(a),(b) |
| Series 2018-ATLS Class C |
1-month USD LIBOR + 1.900%
Floor 1.900%
07/15/2035 | 4.095% | | 140,000 | 140,130 |
| BX Commercial Mortgage Trust(a),(b) |
| Series 2018-BIOA Class E |
1-month USD LIBOR + 1.951%
Floor 1.978%
03/15/2037 | 4.145% | | 305,000 | 305,289 |
| Commercial Mortgage-Backed Securities - Non-Agency (continued) |
| Issuer | Coupon
Rate | | Principal
Amount ($) | Value ($) |
| CALI Mortgage Trust(a) |
| Series 2019-101C Class A |
| 03/10/2039 | 3.957% | | 395,000 | 449,882 |
| Citigroup Commercial Mortgage Trust(c),(d) |
| Series 2013-GC15 Class XA |
| 09/10/2046 | 1.085% | | 6,347,551 | 201,976 |
| Citigroup Commercial Mortgage Trust |
| Series 2015-GC33 Class A4 |
| 09/10/2058 | 3.778% | | 750,000 | 819,552 |
| CLNS Trust(a),(b) |
| Subordinated Series 2017-IKPR Class C |
1-month USD LIBOR + 1.100%
Floor 1.100%
06/11/2032 | 3.323% | | 100,000 | 99,842 |
| COMM Mortgage Trust(a),(c),(d) |
| Series 2013-LC6 Class XB |
| 01/10/2046 | 0.474% | | 11,750,000 | 142,685 |
| Commercial Mortgage Pass-Through Certificates(c),(d) |
| Series 2012-CR3 Class XA |
| 10/15/2045 | 2.022% | | 1,724,284 | 81,972 |
| Commercial Mortgage Trust(c),(d) |
| Series 2012-CR4 Class XA |
| 10/15/2045 | 1.913% | | 3,746,428 | 153,653 |
| Series 2013-CR13 Class XA |
| 11/12/2046 | 0.955% | | 2,715,982 | 78,120 |
| Series 2013-LC6 Class XA |
| 01/10/2046 | 1.491% | | 1,956,558 | 73,360 |
| Commercial Mortgage Trust(a),(c),(d) |
| Series 2012-LC4 Class XA |
| 12/10/2044 | 2.289% | | 2,877,141 | 118,481 |
| Commercial Mortgage Trust(a),(c) |
| Series 2014-277P Class A |
| 08/10/2049 | 3.732% | | 165,000 | 177,660 |
| Commercial Mortgage Trust |
| Series 2014-UBS4 Class A2 |
| 08/10/2047 | 2.963% | | 21,636 | 21,705 |
| Series 2014-UBS6 Class A5 |
| 12/10/2047 | 3.644% | | 300,000 | 322,523 |
| Core Industrial Trust(a) |
| Series 2015-CALW Class A |
| 02/10/2034 | 3.040% | | 232,424 | 238,408 |
| Series 2015-TEXW Class A |
| 02/10/2034 | 3.077% | | 277,899 | 286,165 |
| Subordinated Series 2015-WEST Class B |
| 02/10/2037 | 3.574% | | 60,000 | 66,001 |
| Corevest American Finance Trust(a),(c),(d) |
| Series 2019-1 Class XA |
| 03/15/2052 | 2.165% | | 1,091,439 | 102,529 |
The accompanying Notes to Consolidated Financial Statements are an integral part of this statement.
Multi-Manager Alternative Strategies Fund | Annual Report 2019
| 17 |
Consolidated Portfolio of Investments (continued)
August 31, 2019
| Commercial Mortgage-Backed Securities - Non-Agency (continued) |
| Issuer | Coupon
Rate | | Principal
Amount ($) | Value ($) |
| Credit Suisse First Boston Mortgage Securities Corp.(c),(d) |
| Series 98-C1 Class AX |
| 05/17/2040 | 2.029% | | 324,061 | 3,622 |
| Credit Suisse Mortgage Capital Certificates(a),(b) |
| Series 2019-ICE4 Class D |
1-month USD LIBOR + 1.600%
Floor 1.600%
05/15/2036 | 3.994% | | 180,000 | 180,224 |
| CSAIL Commercial Mortgage Trust(c),(d) |
| Series 2015-C3 Class XA |
| 08/15/2048 | 0.947% | | 11,432,950 | 361,849 |
| CSAIL Commercial Mortgage Trust |
| Series 2016-C6 Class A3 |
| 01/15/2049 | 2.956% | | 750,000 | 774,511 |
| DBGS Mortgage Trust(a),(b) |
| Series 2018-BIOD Class B |
1-month USD LIBOR + 0.888%
Floor 0.888%
05/15/2035 | 3.083% | | 143,862 | 143,139 |
| Eleven Madison Trust Mortgage Trust(a),(c) |
| Series 2015-11MD Class A |
| 09/10/2035 | 3.673% | | 300,000 | 325,432 |
| GS Mortgage Securities Trust(a),(c),(d) |
| 08/10/2043 | 1.473% | | 6,728,901 | 55,466 |
| Series 2012-GC6 Class XB |
| 01/10/2045 | 0.257% | | 10,648,392 | 56,967 |
| GS Mortgage Securities Trust(a),(b) |
| Series 2018-TWR Class A |
1-month USD LIBOR + 0.900%
Floor 0.850%
07/15/2031 | 3.095% | | 135,000 | 135,044 |
| Home Partners of America Trust(a) |
| Series 2019-1 Class B |
| 09/17/2039 | 3.157% | | 100,000 | 103,411 |
| Home Partners of America Trust(a),(b) |
| Subordinated Series 2018-1 Class D |
1-month USD LIBOR + 1.450%
Floor 1.450%
07/17/2037 | 3.632% | | 120,000 | 119,216 |
| JPMBB Commercial Mortgage Securities Trust(c),(d) |
| Series 2014-C21 Class XA |
| 08/15/2047 | 1.163% | | 1,064,185 | 41,731 |
| Series 2014-C23 Class XA |
| 09/15/2047 | 0.835% | | 3,369,701 | 85,751 |
| Series 2014-C26 Class XA |
| 01/15/2048 | 1.159% | | 3,310,815 | 127,830 |
| JPMorgan Chase Commercial Mortgage Securities Trust(a) |
| Series 2009-IWST Class A2 |
| 12/05/2027 | 5.633% | | 650,000 | 654,688 |
| Commercial Mortgage-Backed Securities - Non-Agency (continued) |
| Issuer | Coupon
Rate | | Principal
Amount ($) | Value ($) |
| Series 2019-OSB Class A |
| 06/05/2039 | 3.397% | | 375,000 | 410,691 |
| JPMorgan Chase Commercial Mortgage Securities Trust(c),(d) |
| Series 2012-LC9 Class XA |
| 12/15/2047 | 1.656% | | 3,468,510 | 139,641 |
| JPMorgan Chase Commercial Mortgage Securities Trust(a),(c) |
| Series 2018-AON Class D |
| 07/05/2031 | 4.767% | | 55,000 | 58,893 |
| JPMorgan Chase Commercial Mortgage Securities Trust(a),(b) |
| Series 2018-PHH Class C |
1-month USD LIBOR + 1.360%
Floor 1.410%
06/15/2035 | 3.555% | | 55,000 | 55,017 |
| Madison Avenue Trust(a) |
| Series 2013-650M Class A |
| 10/12/2032 | 3.843% | | 155,000 | 156,930 |
| Morgan Stanley Bank of America Merrill Lynch Trust |
| Series 2015-C23 Class A3 |
| 07/15/2050 | 3.451% | | 300,000 | 321,236 |
| Series 2016-C28 Class A3 |
| 01/15/2049 | 3.272% | | 700,000 | 742,052 |
| Morgan Stanley Capital I Trust(a),(c),(d) |
| Series 2012-C4 Class XA |
| 03/15/2045 | 2.257% | | 3,378,043 | 138,070 |
| Morgan Stanley Capital I Trust |
| Series 2019-H6 Class A2 |
| 06/15/2052 | 3.228% | | 235,000 | 246,527 |
| One Bryant Park Trust(a) |
| Series 2019-OBP Class A |
| 09/13/2049 | 2.516% | | 245,000 | 248,662 |
| RBS Commercial Funding, Inc., Trust(a),(c) |
| Series 2013-GSP Class A |
| 01/15/2032 | 3.961% | | 165,000 | 175,000 |
| SFAVE Commercial Mortgage Securities Trust(a),(c) |
| Subordinated Series 2015-5AVE Class D |
| 01/05/2043 | 4.534% | | 200,000 | 193,778 |
| UBS Commercial Mortgage Trust(a),(c),(d) |
| Series 2012-C1 Class XA |
| 05/10/2045 | 2.243% | | 2,372,268 | 100,817 |
| VNDO Mortgage Trust(a) |
| Series 2012-6AVE Class A |
| 11/15/2030 | 2.996% | | 170,000 | 175,467 |
| Vornado DP LLC Trust(a) |
| Series 2010-VNO Class A2FX |
| 09/13/2028 | 4.004% | | 335,000 | 338,440 |
| WF-RBS Commercial Mortgage Trust(a),(c),(d) |
| Series 2012-C8 Class XA |
| 08/15/2045 | 1.979% | | 1,645,268 | 71,623 |
The accompanying Notes to Consolidated Financial Statements are an integral part of this statement.
| 18 | Multi-Manager Alternative Strategies Fund | Annual Report 2019 |
Consolidated Portfolio of Investments (continued)
August 31, 2019
| Commercial Mortgage-Backed Securities - Non-Agency (continued) |
| Issuer | Coupon
Rate | | Principal
Amount ($) | Value ($) |
| Series 2012-C9 Class XA |
| 11/15/2045 | 2.062% | | 1,636,029 | 80,642 |
| WF-RBS Commercial Mortgage Trust(c),(d) |
| Series 2014-C24 Class XA |
| 11/15/2047 | 1.005% | | 2,711,312 | 89,285 |
| Series 2014-LC14 Class XA |
| 03/15/2047 | 1.397% | | 1,980,889 | 83,645 |
| Worldwide Plaza Trust(a),(c) |
| Series 2017-WWP Class D |
| 11/10/2036 | 3.715% | | 120,000 | 125,688 |
Total Commercial Mortgage-Backed Securities - Non-Agency
(Cost $11,258,769) | 11,363,291 |
| Common Stocks 17.2% |
| Issuer | Shares | Value ($) |
| Communication Services 1.6% |
| Diversified Telecommunication Services 0.3% |
| Inmarsat PLC | 160,216 | 1,175,986 |
| Entertainment 0.0% |
| Entertainment One Ltd. | 23,562 | 167,957 |
| Media 1.3% |
| Axel Springer SE(e) | 27,158 | 1,865,499 |
| Discovery, Inc., Class C(e) | 11,622 | 302,521 |
| Gannett Co., Inc. | 67,422 | 709,279 |
| Tribune Media Co. | 79,560 | 3,705,905 |
| Total | | 6,583,204 |
| Total Communication Services | 7,927,147 |
| Consumer Discretionary 3.1% |
| Auto Components 0.4% |
| Tower International, Inc. | 62,596 | 1,936,094 |
| Diversified Consumer Services 0.4% |
| Sotheby’s(e) | 34,444 | 1,989,141 |
| Hotels, Restaurants & Leisure 1.2% |
| Caesars Entertainment Corp.(e),(f),(g) | 122,809 | 1,413,531 |
| Greene King PLC | 85,604 | 877,949 |
| International Speedway Corp., Class A | 54,482 | 2,452,780 |
| Parques Reunidos Servicios Centrales SAU(a) | 50,694 | 765,527 |
| Wyndham Hotels & Resorts, Inc. | 6,568 | 337,464 |
| Total | | 5,847,251 |
| Common Stocks (continued) |
| Issuer | Shares | Value ($) |
| Internet & Direct Marketing Retail 0.7% |
| Shutterfly, Inc.(e) | 74,081 | 3,769,241 |
| Specialty Retail 0.4% |
| BCA Marketplace PLC | 209,753 | 616,629 |
| GrandVision NV(a) | 11,679 | 352,612 |
| Lowe’s Companies, Inc. | 7,799 | 875,048 |
| Rent-A-Center, Inc.(e) | 1,200 | 30,636 |
| Total | | 1,874,925 |
| Total Consumer Discretionary | 15,416,652 |
| Consumer Staples 0.1% |
| Food Products 0.1% |
| Dole Food Co., Inc.(e),(h),(i) | 96,900 | 31,764 |
| Pioneer Foods Group Ltd. | 65,366 | 454,626 |
| Total | | 486,390 |
| Total Consumer Staples | 486,390 |
| Financials 0.2% |
| Banks 0.2% |
| JPMorgan Chase & Co. | 2,590 | 284,537 |
| Royal Bank of Canada | 3,314 | 247,755 |
| U.S. Bancorp | 4,845 | 255,283 |
| Total | | 787,575 |
| Total Financials | 787,575 |
| Health Care 6.6% |
| Biotechnology 2.1% |
| Celgene Corp.(e),(f),(g) | 90,886 | 8,797,765 |
| Genomic Health, Inc.(e) | 19,929 | 1,527,757 |
| Spark Therapeutics, Inc.(e) | 800 | 77,928 |
| Total | | 10,403,450 |
| Health Care Equipment & Supplies 0.3% |
| Corindus Vascular Robotics, Inc.(e) | 294,206 | 1,250,376 |
| Health Care Providers & Services 1.6% |
| Avaya, Inc. Escrow(e),(h),(i) | 6,409,000 | 6 |
| Avaya, Inc. Escrow(e),(h),(i) | 2,397,000 | 2 |
| WellCare Health Plans, Inc.(e),(f),(g) | 29,667 | 8,032,044 |
| Total | | 8,032,052 |
| Health Care Technology 1.1% |
| Medidata Solutions, Inc.(e),(f),(g) | 62,541 | 5,727,505 |
The accompanying Notes to Consolidated Financial Statements are an integral part of this statement.
Multi-Manager Alternative Strategies Fund | Annual Report 2019
| 19 |
Consolidated Portfolio of Investments (continued)
August 31, 2019
| Common Stocks (continued) |
| Issuer | Shares | Value ($) |
| Life Sciences Tools & Services 0.6% |
| Cambrex Corp.(e) | 23,412 | 1,403,081 |
| Pacific Biosciences of California, Inc.(e),(f),(g) | 313,666 | 1,740,846 |
| Total | | 3,143,927 |
| Pharmaceuticals 0.9% |
| Allergan PLC(f),(g) | 28,053 | 4,480,625 |
| Paratek Pharmaceuticals, Inc.(e),(f),(g) | 49,710 | 185,916 |
| Total | | 4,666,541 |
| Total Health Care | 33,223,851 |
| Industrials 1.9% |
| Aerospace & Defense 0.3% |
| Cobham PLC(e) | 413,792 | 815,193 |
| Wesco Aircraft Holdings, Inc.(e) | 65,564 | 721,204 |
| Total | | 1,536,397 |
| Building Products 0.1% |
| Masco Corp. | 14,746 | 600,605 |
| Commercial Services & Supplies 0.1% |
| Quad/Graphics, Inc. | 40,597 | 364,967 |
| Construction & Engineering 0.0% |
| HC2 Holdings, Inc.(e) | 11,950 | 23,900 |
| Machinery 0.9% |
| Milacron Holdings Corp.(e) | 109,525 | 1,735,971 |
| WABCO Holdings, Inc.(e),(f),(g) | 19,213 | 2,565,128 |
| Total | | 4,301,099 |
| Professional Services 0.4% |
| Navigant Consulting, Inc. | 71,476 | 1,992,036 |
| Trading Companies & Distributors 0.1% |
| Herc Holdings Inc(e),(f),(g) | 13,953 | 575,980 |
| Total Industrials | 9,394,984 |
| Information Technology 3.5% |
| Communications Equipment 0.3% |
| Acacia Communications, Inc.(e) | 22,995 | 1,449,835 |
| Common Stocks (continued) |
| Issuer | Shares | Value ($) |
| IT Services 0.4% |
| Altran Technologies SA | 34,208 | 544,484 |
| LiveRamp Holdings, Inc.(e) | 9,152 | 387,679 |
| Presidio, Inc. | 75,190 | 1,204,544 |
| Total System Services, Inc. | 20 | 2,684 |
| Total | | 2,139,391 |
| Semiconductors & Semiconductor Equipment 1.3% |
| Cypress Semiconductor Corp.(f),(g) | 21,543 | 495,704 |
| Mellanox Technologies Ltd.(e),(f),(g) | 55,175 | 5,906,484 |
| Total | | 6,402,188 |
| Software 1.5% |
| Avaya Holdings Corp.(e),(f),(g) | 65,200 | 920,624 |
| Carbon Black, Inc.(e) | 84,687 | 2,210,330 |
| LogMeIn, Inc. | 8,619 | 576,094 |
| MINDBODY, Inc., Class A(e),(h),(i) | 47,120 | 1,719,880 |
| Monotype Imaging Holdings, Inc. | 76,779 | 1,516,385 |
| Pivotal Software, Inc., Class A(e) | 45,170 | 673,485 |
| Symantec Corp. | 6,400 | 148,800 |
| Total | | 7,765,598 |
| Technology Hardware, Storage & Peripherals 0.0% |
| Cray, Inc.(e) | 4,529 | 158,198 |
| Total Information Technology | 17,915,210 |
| Materials 0.1% |
| Chemicals 0.1% |
| Omnova Solutions, Inc.(e) | 60,952 | 612,568 |
| Total Materials | 612,568 |
| Real Estate 0.0% |
| Real Estate Management & Development 0.0% |
| Atrium European Real Estate Ltd.(e) | 57,497 | 230,651 |
| Total Real Estate | 230,651 |
| Utilities 0.1% |
| Electric Utilities 0.1% |
| El Paso Electric Co.(f),(g) | 9,171 | 611,706 |
| Total Utilities | 611,706 |
Total Common Stocks
(Cost $88,285,172) | 86,606,734 |
The accompanying Notes to Consolidated Financial Statements are an integral part of this statement.
| 20 | Multi-Manager Alternative Strategies Fund | Annual Report 2019 |
Consolidated Portfolio of Investments (continued)
August 31, 2019
| Convertible Bonds 0.8% |
| Issuer | Coupon
Rate | | Principal
Amount ($) | Value ($) |
| Aerospace & Defense 0.5% |
| RTI International Metals, Inc. |
| 10/15/2019 | 1.625% | | 2,588,000 | 2,584,871 |
| Cable and Satellite 0.0% |
| DISH Network Corp. |
| 08/15/2026 | 3.375% | | 80,000 | 73,620 |
| Electric 0.0% |
| NRG Energy, Inc. |
| 06/01/2048 | 2.750% | | 200,000 | 218,210 |
| Healthcare Insurance 0.0% |
| Anthem, Inc. |
| 10/15/2042 | 2.750% | | 51,000 | 184,763 |
| Technology 0.2% |
| Avaya Holdings Corp. |
| 06/15/2023 | 2.250% | | 210,000 | 195,767 |
| IAC Financeco 2, Inc.(a) |
| 06/15/2026 | 0.875% | | 250,000 | 279,210 |
| Sony Corp.(j) |
| 09/30/2022 | 0.000% | JPY | 26,000,000 | 330,262 |
| Total | 805,239 |
| Wirelines 0.1% |
| GCI Liberty, Inc.(a) |
| 09/30/2046 | 1.750% | | 325,000 | 394,672 |
Total Convertible Bonds
(Cost $4,074,240) | 4,261,375 |
| Convertible Preferred Stocks 0.6% |
| Issuer | | Shares | Value ($) |
| Health Care 0.1% |
| Health Care Equipment & Supplies 0.1% |
| Becton Dickinson and Co. | 6.125% | 7,700 | 477,169 |
| Total Health Care | 477,169 |
| Industrials 0.1% |
| Machinery 0.1% |
| Fortive Corp. | 5.000% | 700 | 655,856 |
| Total Industrials | 655,856 |
| Real Estate 0.1% |
| Equity Real Estate Investment Trusts (REITS) 0.1% |
| Crown Castle International Corp. | 6.875% | 260 | 338,026 |
| Total Real Estate | 338,026 |
| Convertible Preferred Stocks (continued) |
| Issuer | | Shares | Value ($) |
| Utilities 0.3% |
| Electric Utilities 0.2% |
| American Electric Power Co., Inc. | 6.125% | 7,750 | 434,804 |
| Southern Co. (The) | 6.750% | 8,350 | 433,866 |
| Total | | | 868,670 |
| Gas Utilities 0.0% |
| South Jersey Industries, Inc. | 7.250% | 3,350 | 174,703 |
| Multi-Utilities 0.1% |
| Dominion Energy, Inc. | 7.250% | 5,400 | 549,828 |
| Total Utilities | 1,593,201 |
Total Convertible Preferred Stocks
(Cost $2,965,740) | 3,064,252 |
| Corporate Bonds & Notes(k) 19.2% |
| Issuer | Coupon
Rate | | Principal
Amount ($) | Value ($) |
| Aerospace & Defense 0.2% |
| Boeing Co. (The) |
| 02/01/2027 | 2.700% | | 225,000 | 231,234 |
| L3Harris Technologies, Inc.(a) |
| 06/15/2028 | 4.400% | | 260,000 | 294,705 |
| Northrop Grumman Corp. |
| 01/15/2025 | 2.930% | | 355,000 | 367,866 |
| Total | 893,805 |
| Airlines 0.1% |
| American Airlines Pass-Through Trust |
| Series 2016-2 Class AA |
| 06/15/2028 | 3.200% | | 219,250 | 226,814 |
| Continental Airlines Pass-Through Trust |
| 04/19/2022 | 5.983% | | 113,304 | 120,206 |
| U.S. Airways Pass-Through Trust |
| 04/22/2023 | 6.250% | | 241,764 | 264,811 |
| Total | 611,831 |
| Apartment REIT 0.1% |
| Mid-America Apartments LP |
| 10/15/2023 | 4.300% | | 325,000 | 348,790 |
| Automotive 0.6% |
| Daimler Finance North America LLC(a),(b) |
3-month USD LIBOR + 0.900%
02/15/2022 | 3.058% | | 385,000 | 386,530 |
The accompanying Notes to Consolidated Financial Statements are an integral part of this statement.
Multi-Manager Alternative Strategies Fund | Annual Report 2019
| 21 |
Consolidated Portfolio of Investments (continued)
August 31, 2019
| Corporate Bonds & Notes(k) (continued) |
| Issuer | Coupon
Rate | | Principal
Amount ($) | Value ($) |
| Ford Motor Credit Co. LLC |
| 01/15/2020 | 8.125% | | 600,000 | 612,017 |
| 11/02/2020 | 2.343% | | 260,000 | 259,131 |
| 01/15/2021 | 3.200% | | 380,000 | 381,851 |
| 03/28/2022 | 3.339% | | 200,000 | 201,237 |
| Ford Motor Credit Co. LLC(b) |
3-month USD LIBOR + 0.880%
10/12/2021 | 3.220% | | 200,000 | 197,578 |
3-month USD LIBOR + 1.080%
08/03/2022 | 3.367% | | 255,000 | 250,788 |
| General Motors Financial Co., Inc. |
| 04/13/2020 | 2.650% | | 370,000 | 370,283 |
| 07/13/2020 | 3.200% | | 200,000 | 201,090 |
| Total | 2,860,505 |
| Banking 2.4% |
| Bank of America Corp.(l) |
| 12/20/2023 | 3.004% | | 1,159,000 | 1,189,171 |
| 12/20/2028 | 3.419% | | 345,000 | 364,668 |
| 07/23/2029 | 4.271% | | 270,000 | 304,556 |
| Bank of Ireland Group PLC(a) |
| 11/25/2023 | 4.500% | | 200,000 | 210,521 |
| Citigroup, Inc.(b) |
3-month AUD BBR + 1.550%
05/04/2021 | 2.539% | AUD | 280,000 | 191,151 |
| Citigroup, Inc.(a),(b) |
3-month Euribor + 0.500%
03/21/2023 | 0.164% | EUR | 190,000 | 209,470 |
| Goldman Sachs Group, Inc. (The)(b) |
3-month USD LIBOR + 0.750%
02/23/2023 | 2.898% | | 280,000 | 279,689 |
| Goldman Sachs Group, Inc. (The)(a) |
| 05/15/2024 | 1.375% | EUR | 186,000 | 213,908 |
| Goldman Sachs Group, Inc. (The) |
| 01/23/2025 | 3.500% | | 500,000 | 525,837 |
| 05/22/2025 | 3.750% | | 400,000 | 426,586 |
| Goldman Sachs Group, Inc. (The)(l) |
| 09/29/2025 | 3.272% | | 260,000 | 269,881 |
| JPMorgan Chase & Co. |
| 06/15/2026 | 3.200% | | 145,000 | 151,792 |
| JPMorgan Chase & Co.(l) |
| 01/29/2027 | 3.960% | | 750,000 | 816,732 |
| 01/23/2029 | 3.509% | | 450,000 | 482,109 |
| 05/06/2030 | 3.702% | | 170,000 | 185,586 |
| JPMorgan Chase & Co., Subordinated |
| 12/15/2026 | 4.125% | | 90,000 | 99,058 |
| 12/01/2027 | 3.625% | | 165,000 | 175,446 |
| Lloyds Banking Group PLC(l) |
| 11/07/2023 | 2.907% | | 200,000 | 200,636 |
| Corporate Bonds & Notes(k) (continued) |
| Issuer | Coupon
Rate | | Principal
Amount ($) | Value ($) |
| Lloyds Banking Group PLC |
| 03/12/2024 | 3.900% | | 200,000 | 209,588 |
| Morgan Stanley(b) |
3-month USD LIBOR + 0.930%
07/22/2022 | 3.208% | | 800,000 | 805,180 |
| Nationwide Building Society(a),(l) |
| 08/01/2024 | 4.363% | | 100,000 | 105,183 |
| Popular, Inc. |
| 09/14/2023 | 6.125% | | 320,000 | 345,811 |
| Santander UK Group Holdings PLC |
| 10/16/2020 | 2.875% | | 500,000 | 502,232 |
| Santander UK PLC |
| 06/01/2021 | 3.400% | | 370,000 | 377,465 |
| Synovus Financial Corp.(l) |
| Subordinated |
| 12/15/2025 | 5.750% | | 335,000 | 340,286 |
| U.S. Bancorp |
| 06/07/2024 | 0.850% | EUR | 100,000 | 115,046 |
| 04/27/2027 | 3.150% | | 195,000 | 208,854 |
| Subordinated |
| 09/11/2024 | 3.600% | | 62,000 | 66,325 |
| U.S. Bancorp, Subordinated |
| 07/30/2029 | 3.000% | | 155,000 | 162,407 |
| U.S. Bank NA |
| 01/27/2025 | 2.800% | | 250,000 | 259,255 |
| US Bancorp |
| 02/05/2024 | 3.375% | | 103,000 | 108,979 |
| US Bank NA |
| 02/04/2021 | 3.000% | | 310,000 | 314,172 |
| 05/23/2022 | 2.650% | | 185,000 | 188,471 |
| Wells Fargo & Co.(b) |
3-month AUD BBR + 1.320%
07/27/2021 | 2.348% | AUD | 300,000 | 204,350 |
| Wells Fargo & Co. |
| 04/27/2022 | 3.250% | AUD | 300,000 | 211,084 |
| 07/22/2022 | 2.625% | | 80,000 | 81,286 |
| 04/22/2026 | 3.000% | | 260,000 | 269,429 |
| Wells Fargo Bank NA(b) |
SOFR + 0.480%
03/25/2020 | 2.600% | | 750,000 | 750,883 |
| Westpac Banking Corp.(a) |
| 10/21/2019 | 5.000% | GBP | 150,000 | 183,545 |
| Zions Bancorp(l) |
| Junior Subordinated |
| 12/31/2049 | 5.800% | | 99,000 | 98,275 |
| Total | 12,204,903 |
The accompanying Notes to Consolidated Financial Statements are an integral part of this statement.
| 22 | Multi-Manager Alternative Strategies Fund | Annual Report 2019 |
Consolidated Portfolio of Investments (continued)
August 31, 2019
| Corporate Bonds & Notes(k) (continued) |
| Issuer | Coupon
Rate | | Principal
Amount ($) | Value ($) |
| Brokerage/Asset Managers/Exchanges 0.1% |
| Raymond James Financial, Inc. |
| 07/15/2046 | 4.950% | | 200,000 | 243,250 |
| Building Materials 0.0% |
| Owens Corning |
| 08/15/2029 | 3.950% | | 110,000 | 113,849 |
| Cable and Satellite 0.8% |
| Cablevision Systems Corp. |
| 09/15/2022 | 5.875% | | 120,000 | 128,326 |
| CCO Holdings LLC/Capital Corp.(a) |
| 05/01/2027 | 5.125% | | 285,000 | 301,692 |
| 02/01/2028 | 5.000% | | 240,000 | 251,876 |
| 06/01/2029 | 5.375% | | 165,000 | 176,463 |
| Charter Communications Operating LLC/Capital |
| 07/23/2025 | 4.908% | | 210,000 | 231,675 |
| 07/01/2049 | 5.125% | | 380,000 | 413,757 |
| Comcast Corp. |
| 02/15/2028 | 3.150% | | 150,000 | 157,971 |
| CSC Holdings LLC(a) |
| 05/15/2026 | 5.500% | | 250,000 | 264,325 |
| 04/15/2027 | 5.500% | | 200,000 | 214,001 |
| 02/01/2028 | 5.375% | | 485,000 | 518,217 |
| 01/15/2030 | 5.750% | | 305,000 | 318,695 |
| Intelsat Jackson Holdings SA |
| 08/01/2023 | 5.500% | | 208,000 | 189,144 |
| Intelsat Jackson Holdings SA(a) |
| 07/15/2025 | 9.750% | | 173,000 | 177,551 |
| Sirius XM Radio, Inc.(a) |
| 05/15/2023 | 4.625% | | 220,000 | 224,149 |
| 07/15/2026 | 5.375% | | 215,000 | 227,588 |
| 08/01/2027 | 5.000% | | 115,000 | 121,446 |
| Time Warner Cable LLC |
| 09/01/2041 | 5.500% | | 200,000 | 214,699 |
| Total | 4,131,575 |
| Chemicals 0.0% |
| International Flavors & Fragrances, Inc. |
| 09/26/2048 | 5.000% | | 160,000 | 179,800 |
| Construction Machinery 0.1% |
| United Rentals North America, Inc. |
| 05/15/2027 | 5.500% | | 225,000 | 241,402 |
| 01/15/2028 | 4.875% | | 225,000 | 236,364 |
| Total | 477,766 |
| Consumer Cyclical Services 0.4% |
| Amazon.com, Inc. |
| 08/22/2027 | 3.150% | | 405,000 | 435,121 |
| Corporate Bonds & Notes(k) (continued) |
| Issuer | Coupon
Rate | | Principal
Amount ($) | Value ($) |
| Cimpress NV(a) |
| 06/15/2026 | 7.000% | | 165,000 | 173,140 |
| Expedia Group, Inc. |
| 02/15/2026 | 5.000% | | 275,000 | 311,491 |
| 02/15/2028 | 3.800% | | 250,000 | 265,383 |
| IHS Markit Ltd. |
| 08/01/2028 | 4.750% | | 515,000 | 581,174 |
| Matthews International Corp.(a) |
| 12/01/2025 | 5.250% | | 85,000 | 81,609 |
| Service Corp. International |
| 06/01/2029 | 5.125% | | 15,000 | 16,045 |
| Uber Technologies, Inc.(a) |
| 11/01/2026 | 8.000% | | 275,000 | 288,762 |
| Total | 2,152,725 |
| Consumer Products 0.3% |
| Avon International Operations, Inc.(a) |
| 08/15/2022 | 7.875% | | 878,000 | 916,291 |
| First Quality Finance Co., Inc.(a) |
| 07/01/2025 | 5.000% | | 30,000 | 31,154 |
| Natura Cosmeticos SA(a) |
| 02/01/2023 | 5.375% | | 200,000 | 209,278 |
| Walnut Bidco PLC(a) |
| 08/01/2024 | 6.750% | EUR | 110,000 | 126,138 |
| 08/01/2024 | 9.125% | | 200,000 | 206,695 |
| Total | 1,489,556 |
| Diversified Manufacturing 0.2% |
| General Electric Co. |
| 05/04/2020 | 5.550% | | 350,000 | 356,344 |
| 03/15/2032 | 6.750% | | 50,000 | 61,437 |
| Vertiv Group Corp.(a) |
| 10/15/2024 | 9.250% | | 848,000 | 805,823 |
| Total | 1,223,604 |
| Electric 0.8% |
| Adani Green Energy UP Ltd./Prayatna Developers Pvt Ltd./Parampujya Solar Energy Pvt Ltd.(a) |
| 12/10/2024 | 6.250% | | 200,000 | 205,447 |
| AES Corp. (The) |
| 09/01/2027 | 5.125% | | 10,000 | 10,734 |
| Covanta Holding Corp. |
| 01/01/2027 | 6.000% | | 49,000 | 50,926 |
| Duke Energy Progress LLC |
| 12/01/2044 | 4.150% | | 425,000 | 500,218 |
| Indiana Michigan Power Co. |
| 03/15/2023 | 3.200% | | 300,000 | 311,110 |
The accompanying Notes to Consolidated Financial Statements are an integral part of this statement.
Multi-Manager Alternative Strategies Fund | Annual Report 2019
| 23 |
Consolidated Portfolio of Investments (continued)
August 31, 2019
| Corporate Bonds & Notes(k) (continued) |
| Issuer | Coupon
Rate | | Principal
Amount ($) | Value ($) |
| ITC Holdings Corp. |
| 11/15/2027 | 3.350% | | 150,000 | 159,562 |
| MidAmerican Energy Co. |
| 05/01/2046 | 4.250% | | 400,000 | 485,667 |
| NextEra Energy Capital Holdings, Inc.(b) |
3-month USD LIBOR + 0.480%
05/04/2021 | 2.767% | | 520,000 | 520,577 |
| NRG Energy, Inc. |
| 01/15/2027 | 6.625% | | 220,000 | 239,088 |
| NRG Energy, Inc.(a) |
| 06/15/2029 | 5.250% | | 15,000 | 15,990 |
| NSTAR Electric Co. |
| 05/15/2027 | 3.200% | | 520,000 | 551,789 |
| Tucson Electric Power Co. |
| 11/15/2021 | 5.150% | | 450,000 | 470,948 |
| Vistra Operations Co. LLC(a) |
| 07/15/2024 | 3.550% | | 415,000 | 419,720 |
| 09/01/2026 | 5.500% | | 95,000 | 100,018 |
| 02/15/2027 | 5.625% | | 65,000 | 68,881 |
| 07/31/2027 | 5.000% | | 65,000 | 67,375 |
| Total | 4,178,050 |
| Environmental 0.0% |
| GFL Environmental, Inc.(a) |
| 03/01/2023 | 5.375% | | 100,000 | 100,566 |
| Finance Companies 0.6% |
| AerCap Ireland Capital DAC/Global Aviation Trust |
| 05/15/2021 | 4.500% | | 250,000 | 258,285 |
| Air Lease Corp. |
| 01/15/2020 | 2.125% | | 400,000 | 399,716 |
| Avolon Holdings Funding Ltd.(a) |
| 10/01/2023 | 5.125% | | 104,000 | 110,837 |
| CIT Group, Inc. |
| 03/07/2025 | 5.250% | | 10,000 | 11,184 |
| GE Capital International Funding Co. Unlimited Co. |
| 11/15/2020 | 2.342% | | 1,200,000 | 1,191,802 |
| 11/15/2035 | 4.418% | | 815,000 | 828,240 |
| Park Aerospace Holdings Ltd.(a) |
| 02/15/2024 | 5.500% | | 160,000 | 173,785 |
| Total | 2,973,849 |
| Food and Beverage 0.7% |
| Anheuser-Busch Companies LLC/InBev Worldwide, Inc. |
| 02/01/2046 | 4.900% | | 120,000 | 143,025 |
| Anheuser-Busch InBev Worldwide, Inc. |
| 01/23/2029 | 4.750% | | 360,000 | 420,053 |
| Corporate Bonds & Notes(k) (continued) |
| Issuer | Coupon
Rate | | Principal
Amount ($) | Value ($) |
| Aramark Services, Inc.(a) |
| 04/01/2025 | 5.000% | | 126,000 | 130,123 |
| Bacardi Ltd.(a) |
| 05/15/2028 | 4.700% | | 165,000 | 181,759 |
| Darling Ingredients, Inc.(a) |
| 04/15/2027 | 5.250% | | 10,000 | 10,668 |
| Kraft Heinz Foods Co. (The) |
| 07/15/2025 | 3.950% | | 110,000 | 114,187 |
| 06/01/2026 | 3.000% | | 50,000 | 49,186 |
| 01/30/2029 | 4.625% | | 275,000 | 296,888 |
| 06/04/2042 | 5.000% | | 25,000 | 25,740 |
| 07/15/2045 | 5.200% | | 50,000 | 53,187 |
| 06/01/2046 | 4.375% | | 200,000 | 191,942 |
| Molson Coors Brewing Co. |
| 07/15/2024 | 1.250% | EUR | 200,000 | 230,147 |
| Pilgrim’s Pride Corp.(a) |
| 09/30/2027 | 5.875% | | 45,000 | 48,485 |
| Post Holdings, Inc.(a) |
| 08/15/2026 | 5.000% | | 445,000 | 463,903 |
| 03/01/2027 | 5.750% | | 410,000 | 436,822 |
| 01/15/2028 | 5.625% | | 250,000 | 264,482 |
| 12/15/2029 | 5.500% | | 150,000 | 158,529 |
| Tyson Foods, Inc. |
| 03/01/2026 | 4.000% | | 75,000 | 81,749 |
| Total | 3,300,875 |
| Gaming 0.7% |
| Churchill Downs, Inc.(a) |
| 04/01/2027 | 5.500% | | 190,000 | 201,927 |
| 01/15/2028 | 4.750% | | 30,000 | 30,882 |
| GLP Capital LP/Financing II, Inc. |
| 06/01/2025 | 5.250% | | 130,000 | 143,103 |
| 04/15/2026 | 5.375% | | 230,000 | 252,595 |
| 06/01/2028 | 5.750% | | 5,000 | 5,700 |
| 01/15/2029 | 5.300% | | 130,000 | 145,106 |
| 01/15/2030 | 4.000% | | 110,000 | 110,883 |
| Jack Ohio Finance LLC/1 Corp.(a) |
| 11/15/2021 | 6.750% | | 2,278,000 | 2,332,289 |
| MGM Growth Properties Operating Partnership LP/Finance Co-Issuer, Inc. |
| 05/01/2024 | 5.625% | | 75,000 | 81,923 |
| Twin River Worldwide Holdings, Inc.(a) |
| 06/01/2027 | 6.750% | | 50,000 | 52,666 |
| Total | 3,357,074 |
| Health Care 1.1% |
| Baylor Scott & White Holdings |
| 11/15/2026 | 2.650% | | 500,000 | 497,249 |
| Becton Dickinson and Co. |
| 12/15/2019 | 2.675% | | 106,000 | 106,024 |
The accompanying Notes to Consolidated Financial Statements are an integral part of this statement.
| 24 | Multi-Manager Alternative Strategies Fund | Annual Report 2019 |
Consolidated Portfolio of Investments (continued)
August 31, 2019
| Corporate Bonds & Notes(k) (continued) |
| Issuer | Coupon
Rate | | Principal
Amount ($) | Value ($) |
| Becton Dickinson Euro Finance Sarl |
| 06/04/2026 | 1.208% | EUR | 155,000 | 178,436 |
| CHS/Community Health Systems, Inc.(a) |
| 03/15/2026 | 8.000% | | 34,000 | 32,789 |
| Cigna Corp. |
| 11/15/2025 | 4.125% | | 850,000 | 921,681 |
| CommonSpirit Health |
| 10/01/2029 | 3.347% | | 120,000 | 123,449 |
| CVS Health Corp. |
| 03/25/2048 | 5.050% | | 435,000 | 507,574 |
| Hackensack Meridian Health, Inc. |
| 07/01/2057 | 4.500% | | 300,000 | 378,984 |
| HCA Healthcare, Inc. |
| Junior Subordinated |
| 02/15/2021 | 6.250% | | 320,000 | 336,864 |
| HCA, Inc. |
| 05/01/2023 | 4.750% | | 84,000 | 90,268 |
| 03/15/2024 | 5.000% | | 215,000 | 235,427 |
| 02/01/2025 | 5.375% | | 270,000 | 299,907 |
| 06/15/2049 | 5.250% | | 275,000 | 308,853 |
| IQVIA, Inc.(a) |
| 05/15/2027 | 5.000% | | 200,000 | 210,661 |
| New York and Presbyterian Hospital (The) |
| 08/01/2036 | 3.563% | | 390,000 | 424,489 |
| Tenet Healthcare Corp. |
| 06/01/2020 | 4.750% | | 175,000 | 178,036 |
| 10/01/2020 | 6.000% | | 5,000 | 5,196 |
| 10/01/2021 | 4.375% | | 75,000 | 78,535 |
| 07/15/2024 | 4.625% | | 54,000 | 55,542 |
| Thermo Fisher Scientific, Inc. |
| 09/12/2024 | 0.750% | EUR | 100,000 | 113,894 |
| Zimmer Biomet Holdings, Inc.(b) |
3-month USD LIBOR + 0.750%
03/19/2021 | 3.169% | | 200,000 | 199,766 |
| Total | 5,283,624 |
| Healthcare Insurance 0.2% |
| Centene Corp. |
| 02/15/2021 | 5.625% | | 155,000 | 156,874 |
| Cigna Corp. |
| 04/15/2025 | 3.250% | | 150,000 | 155,201 |
| 10/15/2027 | 3.050% | | 200,000 | 203,729 |
| 10/15/2047 | 3.875% | | 75,000 | 76,767 |
| Molina Healthcare, Inc.(a) |
| 06/15/2025 | 4.875% | | 112,000 | 114,526 |
| WellCare Health Plans, Inc.(a) |
| 08/15/2026 | 5.375% | | 102,000 | 108,684 |
| Total | 815,781 |
| Corporate Bonds & Notes(k) (continued) |
| Issuer | Coupon
Rate | | Principal
Amount ($) | Value ($) |
| Healthcare REIT 0.2% |
| Healthcare Realty Trust, Inc. |
| 04/15/2023 | 3.750% | | 600,000 | 621,854 |
| Ventas Realty LP |
| 04/01/2027 | 3.850% | | 300,000 | 321,742 |
| Total | 943,596 |
| Home Construction 0.1% |
| Lennar Corp. |
| 11/29/2027 | 4.750% | | 400,000 | 434,911 |
| Independent Energy 1.3% |
| Aker BP ASA(a) |
| 06/15/2024 | 4.750% | | 155,000 | 159,332 |
| Antero Resources Corp. |
| 12/01/2022 | 5.125% | | 69,000 | 63,777 |
| 03/01/2025 | 5.000% | | 266,000 | 231,409 |
| Centennial Resource Production LLC(a) |
| 01/15/2026 | 5.375% | | 50,000 | 47,727 |
| 04/01/2027 | 6.875% | | 15,000 | 14,999 |
| Concho Resources, Inc. |
| 08/15/2028 | 4.300% | | 670,000 | 727,875 |
| Continental Resources, Inc. |
| 01/15/2028 | 4.375% | | 380,000 | 390,792 |
| CrownRock LP/Finance, Inc.(a) |
| 10/15/2025 | 5.625% | | 43,000 | 42,474 |
| Diamondback Energy, Inc. |
| 11/01/2024 | 4.750% | | 160,000 | 165,576 |
| 05/31/2025 | 5.375% | | 415,000 | 437,083 |
| Endeavor Energy Resources LP/Finance, Inc.(a) |
| 01/30/2026 | 5.500% | | 35,000 | 36,454 |
| EOG Resources, Inc. |
| 01/15/2026 | 4.150% | | 90,000 | 100,324 |
| EQT Corp. |
| 10/01/2027 | 3.900% | | 370,000 | 321,083 |
| Gulfport Energy Corp. |
| 05/15/2025 | 6.375% | | 21,000 | 15,378 |
| Marathon Oil Corp. |
| 07/15/2027 | 4.400% | | 460,000 | 494,543 |
| Matador Resources Co. |
| 09/15/2026 | 5.875% | | 79,000 | 76,807 |
| Medco Oak Tree Pte Ltd.(a) |
| 05/14/2026 | 7.375% | | 240,000 | 238,985 |
| Murphy Oil Corp.(l) |
| 12/01/2022 | 4.200% | | 15,000 | 15,155 |
| Occidental Petroleum Corp. |
| 08/15/2022 | 2.700% | | 300,000 | 302,819 |
The accompanying Notes to Consolidated Financial Statements are an integral part of this statement.
Multi-Manager Alternative Strategies Fund | Annual Report 2019
| 25 |
Consolidated Portfolio of Investments (continued)
August 31, 2019
| Corporate Bonds & Notes(k) (continued) |
| Issuer | Coupon
Rate | | Principal
Amount ($) | Value ($) |
| Parsley Energy LLC/Finance Corp.(a) |
| 01/15/2025 | 5.375% | | 455,000 | 463,862 |
| 08/15/2025 | 5.250% | | 60,000 | 60,932 |
| 10/15/2027 | 5.625% | | 453,000 | 467,929 |
| QEP Resources, Inc. |
| 03/01/2021 | 6.875% | | 977,000 | 969,763 |
| Range Resources Corp. |
| 05/15/2025 | 4.875% | | 85,000 | 70,488 |
| WPX Energy, Inc. |
| 06/01/2026 | 5.750% | | 449,000 | 465,618 |
| Total | 6,381,184 |
| Media and Entertainment 1.2% |
| Clear Channel International BV(a) |
| 12/15/2020 | 8.750% | | 58,000 | 59,268 |
| Diamond Sports Group LLC/Finance Co.(a) |
| 08/15/2026 | 5.375% | | 265,000 | 278,204 |
| 08/15/2027 | 6.625% | | 330,000 | 345,113 |
| Graham Holdings Co.(a) |
| 06/01/2026 | 5.750% | | 175,000 | 187,611 |
| Lions Gate Capital Holdings LLC(a) |
| 02/01/2024 | 6.375% | | 285,000 | 300,696 |
| 11/01/2024 | 5.875% | | 105,000 | 108,534 |
| McGraw-Hill Global Education Holdings LLC/Finance(a) |
| 05/15/2024 | 7.875% | | 97,000 | 87,615 |
| Netflix, Inc. |
| 11/15/2026 | 4.375% | | 20,000 | 20,602 |
| Netflix, Inc.(a) |
| 11/15/2029 | 5.375% | | 230,000 | 250,067 |
| Nielsen Finance Co. SARL(a) |
| 10/01/2021 | 5.500% | | 1,949,000 | 1,954,206 |
| Tribune Media Co. |
| 07/15/2022 | 5.875% | | 1,954,000 | 1,982,704 |
| Viacom, Inc. |
| 03/15/2043 | 4.375% | | 100,000 | 106,423 |
| Viacom, Inc.(l) |
| Junior Subordinated |
| 02/28/2057 | 6.250% | | 350,000 | 375,486 |
| WMG Acquisition Corp.(a) |
| 04/15/2026 | 5.500% | | 220,000 | 229,511 |
| Total | 6,286,040 |
| Metals and Mining 0.0% |
| Indika Energy Capital III Pte, Ltd.(a) |
| 11/09/2024 | 5.875% | | 200,000 | 190,138 |
| Corporate Bonds & Notes(k) (continued) |
| Issuer | Coupon
Rate | | Principal
Amount ($) | Value ($) |
| Midstream 1.2% |
| Cheniere Corpus Christi Holdings LLC |
| 06/30/2027 | 5.125% | | 20,000 | 22,151 |
| Cheniere Energy Partners LP |
| 10/01/2026 | 5.625% | | 20,000 | 21,133 |
| DCP Midstream Operating LP |
| 03/15/2023 | 3.875% | | 15,000 | 15,142 |
| 07/15/2025 | 5.375% | | 410,000 | 435,643 |
| 05/15/2029 | 5.125% | | 210,000 | 214,938 |
| Enbridge, Inc. |
| 12/01/2026 | 4.250% | | 500,000 | 550,875 |
| Enbridge, Inc.(l) |
| 01/15/2077 | 6.000% | | 269,000 | 278,410 |
| Energy Transfer Operating LP |
| 01/15/2024 | 5.875% | | 92,000 | 102,920 |
| 06/01/2027 | 5.500% | | 175,000 | 200,119 |
| Energy Transfer Partners LP |
| 03/15/2045 | 5.150% | | 370,000 | 395,016 |
| Enterprise Products Operating LLC |
| 07/31/2029 | 3.125% | | 500,000 | 518,066 |
| EQT Midstream Partners LP |
| 07/15/2028 | 5.500% | | 160,000 | 161,751 |
| Kinder Morgan Energy Partners LP |
| 09/01/2023 | 3.500% | | 200,000 | 207,844 |
| Kinder Morgan, Inc. |
| 06/01/2025 | 4.300% | | 90,000 | 97,689 |
| MPLX LP |
| 04/15/2048 | 4.700% | | 495,000 | 507,452 |
| NGPL PipeCo LLC(a) |
| 08/15/2022 | 4.375% | | 95,000 | 98,165 |
| Rockies Express Pipeline LLC(a) |
| 04/15/2020 | 5.625% | | 343,000 | 348,360 |
| Sabine Pass Liquefaction LLC |
| 03/15/2027 | 5.000% | | 90,000 | 99,444 |
| Sunoco Logistics Partners Operations LP |
| 10/01/2047 | 5.400% | | 111,000 | 123,786 |
| Targa Resources Partners LP/Finance Corp. |
| 04/15/2026 | 5.875% | | 165,000 | 173,163 |
| 01/15/2028 | 5.000% | | 15,000 | 15,069 |
| Targa Resources Partners LP/Finance Corp.(a) |
| 07/15/2027 | 6.500% | | 15,000 | 16,259 |
| Texas Eastern Transmission LP(a) |
| 10/15/2022 | 2.800% | | 250,000 | 252,356 |
| TransCanada PipeLines Ltd. |
| 05/15/2028 | 4.250% | | 90,000 | 100,420 |
| TransMontaigne Partners LP/TLP Finance Corp. |
| 02/15/2026 | 6.125% | | 64,000 | 61,854 |
The accompanying Notes to Consolidated Financial Statements are an integral part of this statement.
| 26 | Multi-Manager Alternative Strategies Fund | Annual Report 2019 |
Consolidated Portfolio of Investments (continued)
August 31, 2019
| Corporate Bonds & Notes(k) (continued) |
| Issuer | Coupon
Rate | | Principal
Amount ($) | Value ($) |
| Williams Companies, Inc. (The) |
| 03/15/2022 | 3.600% | | 250,000 | 257,352 |
| 06/24/2024 | 4.550% | | 378,000 | 409,177 |
| 09/15/2025 | 4.000% | | 225,000 | 238,977 |
| Williams Partners LP |
| 03/04/2024 | 4.300% | | 90,000 | 96,305 |
| Total | 6,019,836 |
| Natural Gas 0.1% |
| NiSource, Inc. |
| 11/17/2022 | 2.650% | | 250,000 | 253,554 |
| Office REIT 0.2% |
| Boston Properties LP |
| 02/01/2024 | 3.800% | | 500,000 | 530,987 |
| Hudson Pacific Properties LP |
| 11/01/2027 | 3.950% | | 160,000 | 170,645 |
| SL Green Operating Partnership LP |
| 10/15/2022 | 3.250% | | 260,000 | 265,853 |
| Total | 967,485 |
| Oil Field Services 0.2% |
| Schlumberger Holdings Corp.(a) |
| 05/17/2028 | 3.900% | | 350,000 | 371,780 |
| Transocean Pontus Ltd.(a) |
| 08/01/2025 | 6.125% | | 46,280 | 46,965 |
| Transocean Poseidon Ltd.(a) |
| 02/01/2027 | 6.875% | | 111,000 | 115,511 |
| Transocean Proteus Ltd.(a) |
| 12/01/2024 | 6.250% | | 75,000 | 76,700 |
| USA Compression Partners LP/Finance Corp. |
| 04/01/2026 | 6.875% | | 212,000 | 217,518 |
| USA Compression Partners LP/Finance Corp.(a) |
| 09/01/2027 | 6.875% | | 19,000 | 19,501 |
| Total | 847,975 |
| Other Financial Institutions 0.1% |
| Icahn Enterprises LP/Finance Corp.(a) |
| 05/15/2026 | 6.250% | | 15,000 | 15,693 |
| Swiss Insured Brazil Power Finance SARL(a) |
| 07/16/2032 | 9.850% | BRL | 2,230,000 | 606,120 |
| Total | 621,813 |
| Other Industry 0.1% |
| AECOM |
| 10/15/2024 | 5.875% | | 255,000 | 275,387 |
| 03/15/2027 | 5.125% | | 415,000 | 433,814 |
| Total | 709,201 |
| Corporate Bonds & Notes(k) (continued) |
| Issuer | Coupon
Rate | | Principal
Amount ($) | Value ($) |
| Other REIT 0.1% |
| American Campus Communities Operating Partnership LP |
| 04/15/2023 | 3.750% | | 500,000 | 523,649 |
| ESH Hospitality, Inc.(a) |
| 05/01/2025 | 5.250% | | 175,000 | 180,814 |
| Total | 704,463 |
| Other Utility 0.0% |
| American Water Capital Corp. |
| 06/01/2029 | 3.450% | | 200,000 | 215,773 |
| Packaging 0.6% |
| Ardagh Packaging Finance PLC/Holdings U.S.A., Inc.(a) |
| 09/15/2022 | 4.250% | | 200,000 | 203,258 |
| Ball Corp. |
| 12/15/2020 | 4.375% | | 170,000 | 174,254 |
| 11/15/2023 | 4.000% | | 380,000 | 400,503 |
| 07/01/2025 | 5.250% | | 275,000 | 308,568 |
| 03/15/2026 | 4.875% | | 365,000 | 400,103 |
| Berry Global Escrow Corp.(a) |
| 07/15/2026 | 4.875% | | 51,000 | 53,687 |
| 07/15/2027 | 5.625% | | 10,000 | 10,515 |
| Crown Americas LLC/Capital Corp. IV |
| 01/15/2023 | 4.500% | | 325,000 | 341,503 |
| Crown Americas LLC/Capital Corp. V |
| 09/30/2026 | 4.250% | | 10,000 | 10,437 |
| Crown Cork & Seal Co., Inc. |
| 12/15/2026 | 7.375% | | 195,000 | 237,703 |
| Reynolds Group Issuer, Inc./LLC |
| 10/15/2020 | 5.750% | | 314,960 | 315,813 |
| Sealed Air Corp.(a) |
| 12/01/2024 | 5.125% | | 213,000 | 228,198 |
| 09/15/2025 | 5.500% | | 90,000 | 97,926 |
| Total | 2,782,468 |
| Paper 0.1% |
| Graphic Packaging International LLC(a) |
| 07/15/2027 | 4.750% | | 75,000 | 78,901 |
| Graphic Packaging International, Inc. |
| 11/15/2022 | 4.875% | | 150,000 | 158,003 |
| Klabin Austria GmbH(a) |
| 04/03/2029 | 5.750% | | 200,000 | 209,648 |
| WRKCo, Inc. |
| 03/15/2026 | 4.650% | | 165,000 | 182,446 |
| Total | 628,998 |
The accompanying Notes to Consolidated Financial Statements are an integral part of this statement.
Multi-Manager Alternative Strategies Fund | Annual Report 2019
| 27 |
Consolidated Portfolio of Investments (continued)
August 31, 2019
| Corporate Bonds & Notes(k) (continued) |
| Issuer | Coupon
Rate | | Principal
Amount ($) | Value ($) |
| Pharmaceuticals 0.5% |
| AbbVie, Inc. |
| 11/14/2028 | 4.250% | | 125,000 | 136,168 |
| Allergan Funding SCS |
| 06/01/2024 | 1.250% | EUR | 100,000 | 115,074 |
| 03/15/2035 | 4.550% | | 110,000 | 117,718 |
| Amgen, Inc. |
| 05/01/2045 | 4.400% | | 200,000 | 227,543 |
| AstraZeneca PLC |
| 11/16/2025 | 3.375% | | 300,000 | 318,390 |
| Bausch Health Companies, Inc.(a) |
| 04/15/2025 | 6.125% | | 20,000 | 20,669 |
| 12/15/2025 | 9.000% | | 20,000 | 22,482 |
| Bayer US Finance II LLC(a),(b) |
3-month USD LIBOR + 1.010%
12/15/2023 | 3.420% | | 400,000 | 399,639 |
| Bayer US Finance II LLC(a) |
| 12/15/2028 | 4.375% | | 345,000 | 376,442 |
| Celgene Corp. |
| 08/15/2045 | 5.000% | | 200,000 | 257,291 |
| Elanco Animal Health, Inc. |
| 08/28/2023 | 4.272% | | 345,000 | 360,734 |
| Total | 2,352,150 |
| Property & Casualty 0.3% |
| Berkshire Hathaway Finance Corp. |
| 06/19/2039 | 2.375% | GBP | 125,000 | 164,590 |
| Farmers Exchange Capital III(a),(l) |
| Subordinated |
| 10/15/2054 | 5.454% | | 500,000 | 593,962 |
| MGIC Investment Corp. |
| 08/15/2023 | 5.750% | | 175,000 | 191,090 |
| Nationwide Mutual Insurance Co.(a),(b) |
| Subordinated |
3-month USD LIBOR + 2.290%
12/15/2024 | 4.700% | | 450,000 | 450,194 |
| Total | 1,399,836 |
| Railroads 0.0% |
| Union Pacific Corp. |
| 09/10/2028 | 3.950% | | 175,000 | 196,725 |
| Refining 0.1% |
| Marathon Petroleum Corp. |
| 12/15/2026 | 5.125% | | 150,000 | 167,900 |
| PBF Holding Co., LLC/Finance Corp. |
| 06/15/2025 | 7.250% | | 415,000 | 429,644 |
| Corporate Bonds & Notes(k) (continued) |
| Issuer | Coupon
Rate | | Principal
Amount ($) | Value ($) |
| Valero Energy Corp. |
| 09/15/2026 | 3.400% | | 95,000 | 98,203 |
| Total | 695,747 |
| Restaurants 0.3% |
| 1011778 BC ULC/New Red Finance, Inc.(a) |
| 01/15/2022 | 4.625% | | 280,000 | 280,924 |
| 05/15/2024 | 4.250% | | 285,000 | 294,584 |
| 10/15/2025 | 5.000% | | 265,000 | 273,676 |
| KFC Holding Co./Pizza Hut Holdings LLC/Taco Bell of America LLC(a) |
| 06/01/2024 | 5.000% | | 130,000 | 135,013 |
| 06/01/2026 | 5.250% | | 290,000 | 308,089 |
| 06/01/2027 | 4.750% | | 160,000 | 168,024 |
| Total | 1,460,310 |
| Retailers 0.1% |
| Alimentation Couche-Tard, Inc.(a) |
| 07/26/2022 | 2.700% | | 80,000 | 80,922 |
| Cumberland Farms, Inc.(a) |
| 05/01/2025 | 6.750% | | 120,000 | 129,657 |
| eG Global Finance PLC(a) |
| 02/07/2025 | 6.750% | | 158,000 | 152,261 |
| Rite Aid Corp.(a) |
| 04/01/2023 | 6.125% | | 317,000 | 255,236 |
| Total | 618,076 |
| Supermarkets 0.0% |
| Kroger Co. (The) |
| 01/15/2049 | 5.400% | | 86,000 | 102,320 |
| Supranational 0.5% |
| Asian Development Bank |
| 03/09/2022 | 5.000% | AUD | 165,000 | 122,076 |
| European Financial Stability Facility(a) |
| 01/20/2023 | 0.500% | EUR | 135,000 | 154,273 |
| 05/23/2023 | 1.875% | EUR | 190,000 | 228,911 |
| 10/17/2023 | 0.125% | EUR | 350,000 | 397,302 |
| European Investment Bank(a) |
| 05/12/2022 | 1.500% | NOK | 2,060,000 | 227,020 |
| International Bank for Reconstruction & Development |
| 03/12/2020 | 2.500% | AUD | 355,000 | 240,863 |
| 01/13/2021 | 2.800% | AUD | 190,000 | 131,000 |
| 01/22/2021 | 3.500% | NZD | 190,000 | 123,607 |
| 08/20/2021 | 7.450% | IDR | 3,250,000,000 | 231,992 |
| 10/06/2021 | 4.625% | NZD | 230,000 | 155,340 |
| 01/25/2022 | 3.375% | NZD | 385,000 | 255,278 |
| Nordic Investment Bank |
| 03/19/2020 | 4.125% | NZD | 300,000 | 192,025 |
| Total | 2,459,687 |
The accompanying Notes to Consolidated Financial Statements are an integral part of this statement.
| 28 | Multi-Manager Alternative Strategies Fund | Annual Report 2019 |
Consolidated Portfolio of Investments (continued)
August 31, 2019
| Corporate Bonds & Notes(k) (continued) |
| Issuer | Coupon
Rate | | Principal
Amount ($) | Value ($) |
| Technology 0.9% |
| Apple, Inc. |
| 05/24/2025 | 0.875% | EUR | 200,000 | 234,476 |
| Banff Merger Sub, Inc.(a) |
| 09/01/2026 | 9.750% | | 175,000 | 159,723 |
| Broadcom, Inc.(a) |
| 04/15/2029 | 4.750% | | 339,000 | 357,251 |
| CDK Global, Inc.(l) |
| 10/15/2024 | 5.000% | | 10,000 | 10,530 |
| Dell International LLC/EMC Corp.(a) |
| 10/01/2029 | 5.300% | | 450,000 | 486,919 |
| 07/15/2046 | 8.350% | | 465,000 | 612,256 |
| Diamond 1 Finance Corp./Diamond 2 Finance Corp.(a) |
| 07/15/2036 | 8.100% | | 155,000 | 196,953 |
| Fidelity National Information Services, Inc. |
| 05/21/2027 | 1.500% | EUR | 105,000 | 125,855 |
| Fiserv, Inc. |
| 07/01/2027 | 1.125% | EUR | 100,000 | 115,618 |
| 07/01/2029 | 3.500% | | 135,000 | 143,365 |
| 07/01/2049 | 4.400% | | 202,000 | 232,694 |
| KLA-Tencor Corp. |
| 03/15/2029 | 4.100% | | 344,000 | 381,425 |
| Micron Technology, Inc. |
| 02/06/2029 | 5.327% | | 275,000 | 303,347 |
| 02/15/2030 | 4.663% | | 256,000 | 266,716 |
| Microsoft Corp. |
| 11/03/2022 | 2.650% | | 95,000 | 97,723 |
| 08/08/2026 | 2.400% | | 330,000 | 340,863 |
| NXP BV/Funding LLC/USA, Inc.(a) |
| 06/18/2026 | 3.875% | | 270,000 | 283,814 |
| SS&C Technologies, Inc.(a) |
| 09/30/2027 | 5.500% | | 167,000 | 175,316 |
| Total | 4,524,844 |
| Tobacco 0.1% |
| BAT Capital Corp. |
| 08/15/2047 | 4.540% | | 100,000 | 100,161 |
| Reynolds American, Inc. |
| 08/15/2045 | 5.850% | | 180,000 | 203,070 |
| Total | 303,231 |
| Wireless 0.5% |
| American Tower Corp. |
| 06/15/2023 | 3.000% | | 140,000 | 143,764 |
| 05/22/2026 | 1.950% | EUR | 100,000 | 120,844 |
| Crown Castle International Corp. |
| 02/15/2028 | 3.800% | | 185,000 | 198,191 |
| Corporate Bonds & Notes(k) (continued) |
| Issuer | Coupon
Rate | | Principal
Amount ($) | Value ($) |
| SBA Communications Corp. |
| 09/01/2024 | 4.875% | | 160,000 | 166,198 |
| Sprint Communications, Inc.(a) |
| 03/01/2020 | 7.000% | | 62,000 | 63,271 |
| Sprint Corp. |
| 03/01/2026 | 7.625% | | 27,000 | 30,513 |
| Sprint Spectrum Co. I/II/III LLC(a) |
| 09/20/2021 | 3.360% | | 293,625 | 294,777 |
| 03/20/2025 | 4.738% | | 345,000 | 367,117 |
| T-Mobile U.S.A., Inc. |
| 03/01/2023 | 6.000% | | 4,000 | 4,071 |
| 01/15/2024 | 6.500% | | 41,000 | 42,723 |
| 04/15/2024 | 6.000% | | 100,000 | 104,403 |
| 03/01/2025 | 6.375% | | 100,000 | 103,545 |
| 04/15/2025 | 5.125% | | 100,000 | 104,242 |
| 01/15/2026 | 6.500% | | 400,000 | 430,268 |
| 02/01/2026 | 4.500% | | 169,000 | 175,378 |
| 02/01/2028 | 4.750% | | 138,000 | 145,270 |
| Vodafone Group PLC |
| 06/19/2049 | 4.875% | | 90,000 | 103,861 |
| Total | 2,598,436 |
| Wirelines 1.0% |
| AT&T, Inc. |
| 03/01/2037 | 5.250% | | 145,000 | 172,109 |
| 06/15/2044 | 4.800% | | 700,000 | 780,875 |
| C&W Senior Financing DAC(a) |
| 09/15/2027 | 6.875% | | 200,000 | 212,889 |
| GCI LLC(a) |
| 06/15/2024 | 6.625% | | 315,000 | 336,098 |
| HC2 Holdings, Inc.(a) |
| 12/01/2021 | 11.500% | | 145,000 | 126,827 |
| Koninklijke KPN NV |
| 10/01/2030 | 8.375% | | 200,000 | 274,291 |
| Level 3 Financing, Inc. |
| 02/01/2023 | 5.625% | | 100,000 | 101,690 |
| 01/15/2024 | 5.375% | | 45,000 | 45,925 |
| 05/01/2025 | 5.375% | | 95,000 | 98,944 |
| Qwest Corp. |
| 12/01/2021 | 6.750% | | 90,000 | 97,091 |
| Verizon Communications, Inc. |
| 02/15/2025 | 3.376% | | 150,000 | 159,148 |
| 09/21/2028 | 4.329% | | 186,000 | 213,431 |
| 08/21/2046 | 4.862% | | 285,000 | 354,915 |
| Zayo Group LLC/Capital, Inc. |
| 04/01/2023 | 6.000% | | 1,317,000 | 1,354,068 |
The accompanying Notes to Consolidated Financial Statements are an integral part of this statement.
Multi-Manager Alternative Strategies Fund | Annual Report 2019
| 29 |
Consolidated Portfolio of Investments (continued)
August 31, 2019
| Corporate Bonds & Notes(k) (continued) |
| Issuer | Coupon
Rate | | Principal
Amount ($) | Value ($) |
| Zayo Group LLC/Capital, Inc.(a) |
| 01/15/2027 | 5.750% | | 779,000 | 799,453 |
| Total | 5,127,754 |
Total Corporate Bonds & Notes
(Cost $93,762,400) | 96,768,329 |
|
| Foreign Government Obligations(k),(m) 6.5% |
| | | | |
| Australia 0.1% |
| Queensland Treasury Corp.(a) |
| 02/21/2020 | 6.250% | AUD | 325,000 | 224,233 |
| Austria 0.1% |
| Republic of Austria Government Bond(a) |
| 02/20/2029 | 0.500% | EUR | 220,000 | 264,063 |
| Brazil 0.5% |
| Brazil Notas do Tesouro Nacional |
| 01/01/2021 | 10.000% | BRL | 2,185,000 | 564,838 |
| Brazil Notas do Tesouro Nacional Series F |
| 01/01/2023 | 10.000% | BRL | 4,725,000 | 1,272,144 |
| Brazilian Government International Bond |
| 01/13/2028 | 4.625% | | 275,000 | 296,567 |
| Petrobras Global Finance BV |
| 05/23/2026 | 8.750% | | 110,000 | 137,902 |
| 01/17/2027 | 7.375% | | 260,000 | 308,649 |
| Total | 2,580,100 |
| Canada 0.5% |
| Canadian Government Bond |
| 09/01/2020 | 0.750% | CAD | 895,000 | 666,943 |
| 03/01/2024 | 2.250% | CAD | 1,343,000 | 1,054,010 |
| Province of Alberta |
| 12/01/2023 | 3.400% | CAD | 120,000 | 96,528 |
| Province of British Columbia(a) |
| 01/09/2020 | 6.600% | INR | 11,000,000 | 153,536 |
| Province of Ontario |
| 06/02/2024 | 3.500% | CAD | 910,000 | 740,833 |
| Total | 2,711,850 |
| Chile 0.1% |
| Corporación Nacional del Cobre de Chile(a) |
| 08/01/2027 | 3.625% | | 300,000 | 321,181 |
| Colombia 0.3% |
| Colombia Government International Bond |
| 01/28/2026 | 4.500% | | 625,000 | 692,577 |
| Foreign Government Obligations(k),(m) (continued) |
| Issuer | Coupon
Rate | | Principal
Amount ($) | Value ($) |
| Colombian TES |
| 09/11/2019 | 7.000% | COP | 661,100,000 | 192,196 |
| 07/24/2020 | 11.000% | COP | 1,187,900,000 | 364,707 |
| 05/04/2022 | 7.000% | COP | 1,389,000,000 | 424,103 |
| Total | 1,673,583 |
| Dominican Republic 0.0% |
| Dominican Republic International Bond(a) |
| 01/28/2024 | 6.600% | | 100,000 | 111,297 |
| Finland 0.1% |
| Finland Government Bond(a) |
| 09/15/2028 | 0.500% | EUR | 215,000 | 258,173 |
| Germany 0.2% |
| Kreditanstalt fuer Wiederaufbau |
| 08/20/2020 | 6.000% | AUD | 435,000 | 306,863 |
| 03/15/2023 | 0.375% | EUR | 160,000 | 182,668 |
| 08/15/2023 | 2.125% | EUR | 280,000 | 342,698 |
| Kreditanstalt fuer Wiederaufbau(j) |
| 09/15/2023 | 0.000% | EUR | 80,000 | 90,434 |
| Total | 922,663 |
| Hungary 0.2% |
| Hungary Government International Bond |
| 01/29/2020 | 6.250% | | 385,000 | 391,736 |
| 03/29/2021 | 6.375% | | 438,000 | 465,768 |
| Total | 857,504 |
| India 0.1% |
| NTPC Ltd.(a) |
| 05/03/2022 | 7.250% | INR | 20,000,000 | 280,159 |
| Indonesia 0.8% |
| Indonesia Government International Bond(a) |
| 06/14/2023 | 2.625% | EUR | 225,000 | 269,851 |
| 07/18/2024 | 2.150% | EUR | 200,000 | 236,296 |
| Indonesia Treasury Bond |
| 07/15/2021 | 8.250% | IDR | 260,000,000 | 18,903 |
| 05/15/2023 | 5.625% | IDR | 289,000,000 | 19,665 |
| 03/15/2024 | 8.375% | IDR | 2,201,000,000 | 164,532 |
| 06/15/2025 | 6.500% | IDR | 1,604,000,000 | 111,426 |
| 09/15/2026 | 8.375% | IDR | 1,782,000,000 | 133,188 |
| 05/15/2027 | 7.000% | IDR | 2,047,000,000 | 141,798 |
| 05/15/2028 | 6.125% | IDR | 3,489,000,000 | 226,268 |
| 03/15/2029 | 9.000% | IDR | 2,112,000,000 | 163,414 |
| 05/15/2029 | 8.250% | IDR | 1,034,000,000 | 77,559 |
| 09/15/2030 | 7.000% | IDR | 2,128,000,000 | 146,122 |
| 05/15/2031 | 8.750% | IDR | 3,900,000,000 | 297,557 |
| 08/15/2032 | 7.500% | IDR | 340,000,000 | 23,496 |
| 05/15/2033 | 6.625% | IDR | 509,000,000 | 32,530 |
| 06/15/2035 | 7.500% | IDR | 1,095,000,000 | 75,879 |
| 05/15/2038 | 7.500% | IDR | 1,751,000,000 | 119,239 |
The accompanying Notes to Consolidated Financial Statements are an integral part of this statement.
| 30 | Multi-Manager Alternative Strategies Fund | Annual Report 2019 |
Consolidated Portfolio of Investments (continued)
August 31, 2019
| Foreign Government Obligations(k),(m) (continued) |
| Issuer | Coupon
Rate | | Principal
Amount ($) | Value ($) |
| Pelabuhan Indonesia II PT(a) |
| 05/05/2025 | 4.250% | | 225,000 | 239,288 |
| Perusahaan Penerbit SBSN Indonesia III(a) |
| 03/29/2027 | 4.150% | | 270,000 | 292,798 |
| PT Indonesia Asahan Aluminium Persero(a) |
| 11/15/2028 | 6.530% | | 400,000 | 496,520 |
| PT Jasa Marga Persero Tbk(a) |
| 12/11/2020 | 7.500% | IDR | 2,000,000,000 | 136,959 |
| PT Pertamina Persero(a) |
| 05/20/2023 | 4.300% | | 270,000 | 285,185 |
| PT Perusahaan Listrik Negara(a) |
| 05/15/2027 | 4.125% | | 280,000 | 298,882 |
| Total | 4,007,355 |
| Ireland 0.4% |
| Ireland Government Bond(a) |
| 03/20/2023 | 3.900% | EUR | 770,000 | 984,495 |
| 03/18/2024 | 3.400% | EUR | 675,000 | 877,251 |
| Total | 1,861,746 |
| Israel 0.1% |
| Israel Electric Corp., Ltd.(a) |
| 06/21/2023 | 6.875% | | 200,000 | 230,196 |
| 11/12/2024 | 5.000% | | 200,000 | 222,030 |
| Total | 452,226 |
| Japan 0.2% |
| Japan Government Five-Year Bond |
| 12/20/2023 | 0.100% | JPY | 111,800,000 | 1,073,049 |
| Kazakhstan 0.1% |
| KazMunayGas National Co. JSC(a) |
| 04/24/2030 | 5.375% | | 215,000 | 249,229 |
| Malaysia 0.3% |
| Malaysia Government Bond |
| 07/15/2021 | 4.160% | MYR | 1,300,000 | 315,045 |
| 11/30/2021 | 3.620% | MYR | 450,000 | 108,191 |
| 09/30/2024 | 4.059% | MYR | 975,000 | 240,627 |
| 03/14/2025 | 3.882% | MYR | 545,000 | 133,557 |
| 11/16/2027 | 3.899% | MYR | 650,000 | 160,597 |
| 06/15/2028 | 3.733% | MYR | 375,000 | 91,785 |
| 04/15/2033 | 3.844% | MYR | 1,223,000 | 300,632 |
| Total | 1,350,434 |
| Mauritius 0.0% |
| Greenko Solar Mauritius Ltd.(a) |
| 01/29/2025 | 5.550% | | 200,000 | 198,507 |
| Foreign Government Obligations(k),(m) (continued) |
| Issuer | Coupon
Rate | | Principal
Amount ($) | Value ($) |
| Mexico 0.2% |
| Banco Nacional de Comercio Exterior SNC(a),(l) |
| Subordinated |
| 08/11/2026 | 3.800% | | 200,000 | 202,695 |
| Petroleos Mexicanos |
| 03/13/2022 | 5.375% | | 320,000 | 327,604 |
| 01/23/2029 | 6.500% | | 175,000 | 177,650 |
| 06/15/2035 | 6.625% | | 115,000 | 112,217 |
| 09/21/2047 | 6.750% | | 150,000 | 142,063 |
| Total | 962,229 |
| Netherlands 0.2% |
| BNG Bank NV(a) |
| 02/22/2023 | 0.250% | EUR | 160,000 | 181,560 |
| 06/07/2024 | 0.250% | EUR | 155,000 | 177,683 |
| Greenko Dutch BV(a) |
| 07/24/2024 | 5.250% | | 225,000 | 225,440 |
| Petrobras Global Finance BV |
| 02/01/2029 | 5.750% | | 345,000 | 373,861 |
| 03/19/2049 | 6.900% | | 160,000 | 181,742 |
| Total | 1,140,286 |
| Norway 0.3% |
| Nordea Eiendomskreditt AS(b) |
3-month NIBOR + 0.300%
06/21/2023 | 1.820% | NOK | 2,000,000 | 220,496 |
3-month NIBOR + 0.340%
06/19/2024 | 1.860% | NOK | 2,000,000 | 220,422 |
| Norway Government Bond(a) |
| 05/25/2021 | 3.750% | NOK | 6,480,000 | 742,951 |
| 05/24/2023 | 2.000% | NOK | 3,675,000 | 416,433 |
| Total | 1,600,302 |
| Oman 0.0% |
| Oman Government International Bond(a) |
| 01/17/2028 | 5.625% | | 200,000 | 197,008 |
| Peru 0.1% |
| Corporación Financiera de Desarrollo SA(a) |
| 07/15/2025 | 4.750% | | 220,000 | 241,551 |
| Petroleos del Peru SA(a) |
| 06/19/2047 | 5.625% | | 215,000 | 261,304 |
| Total | 502,855 |
| Philippines 0.5% |
| Philippine Government Bond |
| 11/22/2019 | 3.875% | PHP | 6,290,000 | 120,849 |
| 01/12/2020 | 3.375% | PHP | 2,190,000 | 42,004 |
| 04/11/2020 | 4.250% | PHP | 3,645,000 | 70,209 |
| 08/20/2020 | 3.375% | PHP | 1,550,000 | 29,652 |
| 03/20/2021 | 3.500% | PHP | 8,160,000 | 155,953 |
The accompanying Notes to Consolidated Financial Statements are an integral part of this statement.
Multi-Manager Alternative Strategies Fund | Annual Report 2019
| 31 |
Consolidated Portfolio of Investments (continued)
August 31, 2019
| Foreign Government Obligations(k),(m) (continued) |
| Issuer | Coupon
Rate | | Principal
Amount ($) | Value ($) |
| 04/28/2021 | 6.500% | PHP | 1,220,000 | 24,422 |
| 03/08/2023 | 5.500% | PHP | 4,650,000 | 93,532 |
| 04/21/2023 | 3.500% | PHP | 15,650,000 | 294,659 |
| 03/12/2024 | 6.250% | PHP | 7,955,000 | 166,194 |
| 07/19/2031 | 8.000% | PHP | 18,000,000 | 455,788 |
| Philippine Government International Bond |
| 01/15/2021 | 4.950% | PHP | 12,000,000 | 233,252 |
| 05/17/2027 | 0.875% | EUR | 305,000 | 347,781 |
| 01/14/2036 | 6.250% | PHP | 20,000,000 | 459,192 |
| Total | 2,493,487 |
| Portugal 0.2% |
| Portugal Government International Bond(a) |
| 10/15/2024 | 5.125% | | 375,000 | 429,897 |
| Portugal Obrigacoes do Tesouro OT(a) |
| 04/15/2021 | 3.850% | EUR | 395,000 | 465,919 |
| Total | 895,816 |
| Qatar 0.2% |
| Qatar Government International Bond(a) |
| 03/14/2029 | 4.000% | | 425,000 | 486,098 |
| 03/14/2049 | 4.817% | | 200,000 | 258,042 |
| Total | 744,140 |
| Russian Federation 0.0% |
| Russian Foreign Bond - Eurobond(a) |
| 03/21/2029 | 4.375% | | 200,000 | 215,411 |
| Saudi Arabia 0.2% |
| Saudi Arabian Oil Co.(a) |
| 04/16/2029 | 3.500% | | 445,000 | 474,800 |
| 04/16/2039 | 4.250% | | 200,000 | 226,604 |
| 04/16/2049 | 4.375% | | 200,000 | 228,058 |
| Saudi Government International Bond(a) |
| 03/04/2028 | 3.625% | | 200,000 | 217,201 |
| Total | 1,146,663 |
| Singapore 0.3% |
| BOC Aviation Ltd.(a),(b) |
3-month USD LIBOR + 1.050%
05/02/2021 | 3.316% | | 200,000 | 200,987 |
| BOC Aviation Ltd.(a) |
| 09/18/2022 | 2.750% | | 200,000 | 200,805 |
| Singapore Government Bond |
| 09/01/2020 | 3.250% | SGD | 1,295,000 | 947,439 |
| 04/01/2022 | 1.750% | SGD | 425,000 | 306,890 |
| Total | 1,656,121 |
| South Africa 0.0% |
| South Africa Government International Bond |
| 01/17/2024 | 4.665% | | 100,000 | 105,347 |
| Foreign Government Obligations(k),(m) (continued) |
| Issuer | Coupon
Rate | | Principal
Amount ($) | Value ($) |
| Sweden 0.1% |
| Sweden Government International Bond(a) |
| 04/24/2023 | 0.125% | EUR | 480,000 | 544,457 |
| Turkey 0.0% |
| Turkey Government International Bond |
| 03/23/2023 | 3.250% | | 240,000 | 219,006 |
| United Arab Emirates 0.0% |
| DP World Crescent Ltd.(a) |
| 09/26/2028 | 4.848% | | 200,000 | 222,435 |
| United Kingdom 0.0% |
| United Kingdom Gilt(a) |
| 09/07/2020 | 3.750% | GBP | 90,000 | 113,116 |
| United States 0.1% |
| Colombian TES |
| 07/24/2024 | 10.000% | COP | 1,270,600,000 | 443,506 |
| Uruguay 0.0% |
| Uruguay Government International Bond |
| 10/27/2027 | 4.375% | | 125,000 | 138,978 |
Total Foreign Government Obligations
(Cost $33,202,841) | 32,738,515 |
| Limited Partnerships 1.9% |
| Issuer | Shares | Value ($) |
| Energy 1.4% |
| Oil, Gas & Consumable Fuels 1.4% |
| Buckeye Partners LP(f),(g) | 167,044 | 6,853,815 |
| Total Energy | 6,853,815 |
| Financials 0.5% |
| Capital Markets 0.5% |
| Oaktree Capital Group LLC | 47,405 | 2,475,963 |
| Total Financials | 2,475,963 |
Total Limited Partnerships
(Cost $9,408,717) | 9,329,778 |
The accompanying Notes to Consolidated Financial Statements are an integral part of this statement.
| 32 | Multi-Manager Alternative Strategies Fund | Annual Report 2019 |
Consolidated Portfolio of Investments (continued)
August 31, 2019
| Municipal Bonds 0.4% |
| Issue Description | Coupon
Rate | | Principal
Amount ($) | Value ($) |
| Local General Obligation 0.0% |
| Los Angeles Unified School District |
| Unlimited General Obligation Bonds |
| Build America Bonds -Taxable |
| Series 2009 |
| 07/01/2029 | 5.755% | | 250,000 | 313,068 |
| Sales Tax 0.1% |
| Santa Clara Valley Transportation Authority |
| Revenue Bonds |
| Build America Bonds |
| Series 2010 |
| 04/01/2032 | 5.876% | | 250,000 | 319,307 |
| State General Obligation 0.1% |
| State of California |
| Unlimited General Obligation Bonds |
| Taxable High Speed Passenger Train |
| Series 2017 |
| 04/01/2047 | 2.193% | | 500,000 | 500,165 |
| Transportation 0.1% |
| Metropolitan Transportation Authority |
| Revenue Bonds |
| Build America Bonds |
| Series 2010 |
| 11/15/2031 | 6.548% | | 250,000 | 337,970 |
| Water & Sewer 0.1% |
| Metropolitan Water District of Southern California |
| Revenue Bonds |
| Build America Bonds |
| Subordinated Series 2010 |
| 07/01/2040 | 6.947% | | 400,000 | 416,844 |
Total Municipal Bonds
(Cost $1,824,419) | 1,887,354 |
| Preferred Debt 0.0% |
| Issuer | Coupon
Rate | | Shares | Value ($) |
| Banking 0.0% |
| Wells Fargo & Co.(l) |
| 12/31/2049 | 5.850% | | 8,485 | 224,004 |
Total Preferred Debt
(Cost $230,368) | 224,004 |
| Preferred Stocks 0.2% |
| Issuer | | Shares | Value ($) |
| Financials 0.2% |
| Banks 0.2% |
| U.S. Bancorp(l) | 3.617% | 480 | 410,400 |
| U.S. Bancorp | 5.500% | 8,300 | 225,926 |
| Valley National Bancorp(l) | 5.500% | 6,350 | 164,275 |
| Total | | | 800,601 |
| Total Financials | 800,601 |
Total Preferred Stocks
(Cost $812,639) | 800,601 |
| Residential Mortgage-Backed Securities - Agency 0.5% |
| Issuer | Coupon
Rate | | Principal
Amount ($) | Value ($) |
| Federal Home Loan Mortgage Corp.(b) |
| CMO Series 4638 Class UF |
1-month USD LIBOR + 1.000%
Floor 1.000%, Cap 6.000%
09/15/2044 | 3.230% | | 550,788 | 555,456 |
| Federal National Mortgage Association(b) |
| CMO Series 2013-5 Class GF |
1-month USD LIBOR + 1.100%
Floor 1.100%, Cap 5.000%
10/25/2042 | 3.245% | | 571,265 | 564,502 |
| Government National Mortgage Association(n) |
| 11/19/2048 | 4.500% | | 750,000 | 783,926 |
| Government National Mortgage Association(d) |
| CMO Series 2017-136 Class IO |
| 09/20/2047 | 5.000% | | 2,062,343 | 310,664 |
| CMO Series 2018-63 Class IO |
| 09/20/2047 | 4.000% | | 2,347,519 | 337,840 |
| Government National Mortgage Association(b) |
| CMO Series 2018-91 Class WF |
1-month USD LIBOR + 1.000%
Floor 1.000%, Cap 5.000%
07/20/2048 | 3.230% | | 51,225 | 51,079 |
Total Residential Mortgage-Backed Securities - Agency
(Cost $2,783,383) | 2,603,467 |
|
| Residential Mortgage-Backed Securities - Non-Agency 8.0% |
| | | | |
| Adjustable Rate Mortgage Trust(b) |
| CMO Series 2005-9 Class 5A3 |
1-month USD LIBOR + 0.640%
Floor 0.640%, Cap 11.000%
11/25/2035 | 2.785% | | 441,063 | 438,796 |
| Alternative Loan Trust(c) |
| CMO Series 2005-43 Class 1A |
| 10/25/2035 | 3.984% | | 410,589 | 398,017 |
The accompanying Notes to Consolidated Financial Statements are an integral part of this statement.
Multi-Manager Alternative Strategies Fund | Annual Report 2019
| 33 |
Consolidated Portfolio of Investments (continued)
August 31, 2019
| Residential Mortgage-Backed Securities - Non-Agency (continued) |
| Issuer | Coupon
Rate | | Principal
Amount ($) | Value ($) |
| American Home Mortgage Investment Trust(b) |
| CMO Series 2005-1 Class 6A |
6-month USD LIBOR + 2.000%
Floor 2.000%
06/25/2045 | 4.031% | | 403,008 | 410,390 |
| Ameriquest Mortgage Securities, Inc. Asset Backed Pass-Through Certificates(b) |
| CMO Series 2005-R11 Class M1 |
1-month USD LIBOR + 0.450%
Floor 0.450%
01/25/2036 | 2.595% | | 352,771 | 353,060 |
| Arroyo Mortgage Trust(a),(c) |
| CMO Series 2018-1 Class A1 |
| 04/25/2048 | 3.763% | | 194,310 | 198,900 |
| CMO Series 2019-1 Class A1 |
| 01/25/2049 | 3.805% | | 242,340 | 248,428 |
| CMO Series 2019-2 Class A1 |
| 04/25/2049 | 3.347% | | 339,349 | 347,319 |
| CMO Series 2019-3 Class A1 |
| 10/25/2048 | 2.962% | | 189,330 | 189,653 |
| Asset-Backed Securities Corp. Home Equity Loan Trust(b) |
| CMO Series 2004-HE6 Class M1 |
1-month USD LIBOR + 0.945%
Floor 0.945%
09/25/2034 | 3.090% | | 398,507 | 401,884 |
| Banc of America Funding Trust(b) |
| CMO Series 2006-G Class 2A1 |
1-month USD LIBOR + 0.220%
Floor 0.220%, Cap 10.500%
07/20/2036 | 2.612% | | 368,398 | 367,047 |
| Banc of America Funding Trust(a),(c) |
| CMO Series 2016-R1 Class A1 |
| 03/25/2040 | 2.500% | | 302,673 | 302,072 |
| Subordinated CMO Series 2014-R6 Class 2A13 |
| 07/26/2036 | 2.526% | | 925,000 | 896,099 |
| BCAP LLC Trust(a),(b) |
| CMO Series 2014-RR2 Class 6A1 |
1-month USD LIBOR + 0.240%
Floor 0.240%
10/26/2036 | 2.506% | | 364,265 | 362,070 |
| CMO Series 2014-RR5 Class 1A4 |
1-month USD LIBOR + 0.225%
Floor 0.220%, Cap 14.000%
01/26/2036 | 2.716% | | 849,000 | 832,908 |
| Bear Stearns Alt-A Trust(b) |
| CMO Series 2004-6 Class M1 |
1-month USD LIBOR + 0.825%
Floor 0.825%, Cap 11.500%
07/25/2034 | 2.970% | | 788,770 | 774,344 |
| Residential Mortgage-Backed Securities - Non-Agency (continued) |
| Issuer | Coupon
Rate | | Principal
Amount ($) | Value ($) |
| Bear Stearns Mortgage Funding Trust(b) |
| CMO Series 2006-AR3 Class 1A1 |
1-month USD LIBOR + 0.180%
Floor 0.180%, Cap 10.500%
10/25/2036 | 2.325% | | 668,318 | 636,854 |
| CMO Series 2006-AR4 Class A1 |
1-month USD LIBOR + 0.210%
Floor 0.210%, Cap 10.500%
12/25/2036 | 2.355% | | 461,991 | 471,078 |
| CMO Series 2007-AR3 Class 21A1 |
1-month USD LIBOR + 0.150%
Floor 0.150%, Cap 10.500%
04/25/2037 | 2.295% | | 684,887 | 676,871 |
| Bear Stearns Trust(b) |
| CMO Series 2005-1 Class A1 |
1-month USD LIBOR + 0.560%
Floor 0.560%, Cap 11.500%
01/25/2035 | 2.705% | | 75,079 | 75,157 |
| Centex Home Equity Loan Trust(b) |
| CMO Series 2005-A Class M1 |
1-month USD LIBOR + 0.720%
Floor 0.480%
01/25/2035 | 2.865% | | 523,672 | 523,791 |
| CMO Series 2005-D Class M3 |
1-month USD LIBOR + 0.480%
Floor 0.480%
10/25/2035 | 2.865% | | 900,000 | 902,825 |
| CIM Trust(a),(c) |
| CMO Series 2017-5 Class A1 |
| 05/25/2057 | 2.300% | | 12,025 | 11,999 |
| CMO Series 2018-R2 Class A1 |
| 08/27/2057 | 3.690% | | 712,967 | 718,036 |
| CMO Series 2018-R4 Class A1 |
| 12/26/2057 | 4.070% | | 707,518 | 717,381 |
| CIM Trust(a) |
| CMO Series 2017-7 Class A |
| 04/25/2057 | 3.000% | | 622,319 | 625,633 |
| Citigroup Mortgage Loan Trust, Inc.(c) |
| CMO Series 2006-AR2 Class 1A1 |
| 03/25/2036 | 4.743% | | 436,575 | 408,106 |
| Citigroup Mortgage Loan Trust, Inc.(b) |
| CMO Series 2006-HE1 Class M2 |
1-month USD LIBOR + 0.340%
Floor 0.340%
01/25/2036 | 2.655% | | 33,465 | 33,470 |
| CMO Series 2006-HE1 Class M3 |
1-month USD LIBOR + 0.360%
Floor 0.360%
01/25/2036 | 2.685% | | 750,000 | 751,013 |
The accompanying Notes to Consolidated Financial Statements are an integral part of this statement.
| 34 | Multi-Manager Alternative Strategies Fund | Annual Report 2019 |
Consolidated Portfolio of Investments (continued)
August 31, 2019
| Residential Mortgage-Backed Securities - Non-Agency (continued) |
| Issuer | Coupon
Rate | | Principal
Amount ($) | Value ($) |
| Connecticut Avenue Securities Trust(a),(b) |
| CMO Series 2019-R04 Class 2M2 |
1-month USD LIBOR + 2.100%
06/25/2039 | 4.245% | | 200,000 | 200,505 |
| Countrywide Asset-Backed Certificates(b) |
| CMO Series 2004-AB2 Class M2 |
1-month USD LIBOR + 0.855%
Floor 0.855%
05/25/2036 | 3.000% | | 535,256 | 536,673 |
| CMO Series 2007-13 Class 2A1 |
1-month USD LIBOR + 0.900%
Floor 0.900%
10/25/2047 | 3.045% | | 238,415 | 232,384 |
| CMO Series 2007-13 Class 2A2 |
1-month USD LIBOR + 0.800%
Floor 0.800%
10/25/2047 | 2.945% | | 473,940 | 459,119 |
| Credit Suisse Mortgage Capital Trust(a) |
| CMO Series 2015-2R Class 1A1 |
| 08/27/2037 | 3.000% | | 388,841 | 393,280 |
| CMO Series 20154R Class 5A1 |
| 10/27/2036 | 3.000% | | 299,588 | 301,842 |
| Credit-Based Asset Servicing & Securitization LLC(b) |
| CMO Series 2005-CB4 Class M2 |
1-month USD LIBOR + 0.450%
Floor 0.450%
07/25/2035 | 2.595% | | 451,477 | 453,016 |
| CSMC Trust(a),(c) |
| CMO Series 2011-5R Class 6A9 |
| 11/27/2037 | 3.949% | | 539,341 | 552,147 |
| CWABS Asset-Backed Certificates Trust(b) |
| CMO Series 2005-14 Class M2 |
1-month USD LIBOR + 0.470%
Floor 0.470%
04/25/2036 | 2.615% | | 880,000 | 880,924 |
| CMO Series 2005-17 Class MV1 |
1-month USD LIBOR + 0.460%
Floor 0.460%
05/25/2036 | 2.605% | | 850,000 | 838,002 |
| Deephaven Residential Mortgage Trust(a),(c) |
| CMO Series 2017-1A Class A1 |
| 12/26/2046 | 2.725% | | 134,444 | 133,999 |
| CMO Series 2019-3A Class A1 |
| 07/25/2059 | 2.964% | | 726,190 | 728,500 |
| Fannie Mae Connecticut Avenue Securities(b) |
| CMO Series 2016-C06 Class 1M1 |
1-month USD LIBOR + 1.300%
04/25/2029 | 3.445% | | 132,607 | 132,944 |
| CMO Series 2017-C03 Class 1M1 |
1-month USD LIBOR + 0.950%
10/25/2029 | 3.095% | | 333,023 | 333,591 |
| Residential Mortgage-Backed Securities - Non-Agency (continued) |
| Issuer | Coupon
Rate | | Principal
Amount ($) | Value ($) |
| CMO Series 2017-C04 Class 2M1 |
1-month USD LIBOR + 0.850%
Floor 0.850%
11/25/2029 | 2.995% | | 178,828 | 178,927 |
| CMO Series 2017-C05 Class 1M1 |
1-month USD LIBOR + 0.550%
Floor 0.550%
01/25/2030 | 2.695% | | 16,402 | 16,398 |
| First Franklin Mortgage Loan Trust(b) |
| CMO Series 2004-FF11 Class M3 |
1-month USD LIBOR + 0.900%
Floor 0.900%
01/25/2035 | 3.045% | | 747,906 | 752,058 |
| CMO Series 2006-FF4 Class A3 |
1-month USD LIBOR + 0.280%
Floor 0.280%
03/25/2036 | 2.425% | | 700,000 | 694,681 |
| First Horizon Mortgage Pass-Through Trust(c) |
| CMO Series 2005-AR4 Class 2A1 |
| 10/25/2035 | 4.163% | | 419,249 | 406,815 |
| First NLC Trust(b) |
| CMO Series 2005-4 Class A4 |
1-month USD LIBOR + 0.390%
Floor 0.390%, Cap 14.000%
02/25/2036 | 2.535% | | 726,004 | 726,108 |
| Freddie Mac Structured Agency Credit Risk Debt Notes(b) |
| CMO Series 2016-DNA2 Class M2 |
1-month USD LIBOR + 2.200%
10/25/2028 | 4.345% | | 36,982 | 37,026 |
| CMO Series 2017-DNA2 Class M1 |
1-month USD LIBOR + 1.200%
10/25/2029 | 3.345% | | 168,749 | 169,307 |
| CMO Series 2017-DNA3 Class M1 |
1-month USD LIBOR + 0.750%
03/25/2030 | 2.895% | | 403,182 | 403,384 |
| GE-WMC Asset-Backed Pass-Through Certificates(b) |
| CMO Series 2005-1 Class M1 |
1-month USD LIBOR + 0.660%
Floor 0.660%
10/25/2035 | 2.805% | | 692,695 | 690,097 |
| GMACM Mortgage Loan Trust(c) |
| CMO Series 2006-AR1 Class 1A1 |
| 04/19/2036 | 4.182% | | 725,038 | 676,254 |
| GSAMP Trust(b) |
| CMO Series 2005-WMC3 Class A2C |
1-month USD LIBOR + 0.330%
Floor 0.330%
12/25/2035 | 2.805% | | 810,000 | 790,648 |
The accompanying Notes to Consolidated Financial Statements are an integral part of this statement.
Multi-Manager Alternative Strategies Fund | Annual Report 2019
| 35 |
Consolidated Portfolio of Investments (continued)
August 31, 2019
| Residential Mortgage-Backed Securities - Non-Agency (continued) |
| Issuer | Coupon
Rate | | Principal
Amount ($) | Value ($) |
| HarborView Mortgage Loan Trust(b) |
| CMO Series 2007-6 Class 1A1A |
1-month USD LIBOR + 0.200%
Floor 0.200%, Cap 10.500%
08/19/2037 | 2.382% | | 629,946 | 585,090 |
| Home Equity Mortgage Loan Asset-Backed Trust(b) |
| CMO Series 2005-D Class AII4 |
1-month USD LIBOR + 0.350%
Floor 0.350%
03/25/2036 | 2.495% | | 486,449 | 486,869 |
| Impac CMB Trust(b) |
| CMO Series 2004-8 Class 2A1 (FGIC) |
1-month USD LIBOR + 0.700%
Floor 0.700%, Cap 11.000%
10/25/2034 | 2.845% | | 612,871 | 609,062 |
| JPMorgan Alternative Loan Trust(b) |
| CMO Series 2007-S1 Class A2 |
1-month USD LIBOR + 0.340%
Floor 0.340%, Cap 11.500%
04/25/2047 | 2.485% | | 411,797 | 390,618 |
| JPMorgan Mortgage Acquisition Trust(b) |
| CMO Series 2006-FRE1 Class M1 |
1-month USD LIBOR + 0.390%
Floor 0.390%
05/25/2035 | 2.535% | | 600,000 | 597,856 |
| CMO Series 2007-CH2 Class AV5 |
1-month USD LIBOR + 0.260%
Floor 0.260%
01/25/2037 | 2.405% | | 630,000 | 599,064 |
| CMO Series 2007-CH3 Class A5 |
1-month USD LIBOR + 0.260%
Floor 0.260%
03/25/2037 | 2.405% | | 895,000 | 884,860 |
| CMO Series 2007-HE1 Class AV4 |
1-month USD LIBOR + 0.280%
Floor 0.280%
03/25/2047 | 2.425% | | 1,103,000 | 995,849 |
| Lehman XS Trust(b) |
| CMO Series 2007-16N Class 2A2 |
1-month USD LIBOR + 0.850%
Floor 0.850%
09/25/2047 | 2.995% | | 734,277 | 731,556 |
| Mill City Mortgage Loan Trust(a) |
| CMO Series 2018-3 Class A1 |
| 08/25/2058 | 3.500% | | 347,586 | 356,571 |
| Morgan Stanley Mortgage Loan Trust(b) |
| CMO Series 2005-6AR Class 1A1 |
1-month USD LIBOR + 0.280%
Floor 0.280%
11/25/2035 | 2.705% | | 77,401 | 77,357 |
| Residential Mortgage-Backed Securities - Non-Agency (continued) |
| Issuer | Coupon
Rate | | Principal
Amount ($) | Value ($) |
| MortgageIT Trust(b) |
| CMO Series 2005-4 Class A1 |
1-month USD LIBOR + 0.280%
Floor 0.280%, Cap 11.500%
10/25/2035 | 2.425% | | 420,177 | 418,537 |
| Nomura Resecuritization Trust(a),(c) |
| CMO Series 2014-3R Class 3A9 |
| 11/26/2035 | 2.786% | | 498,000 | 494,959 |
| CMO Series 2015-6R Class 2A1 |
| 01/26/2037 | 4.000% | | 80,176 | 80,145 |
| Nomura Resecuritization Trust(a),(b) |
| CMO Series 2014-6R Class 2A1 |
1-month USD LIBOR + 0.160%
Floor 0.160%
03/26/2037 | 2.137% | | 247,904 | 246,093 |
| Option One Mortgage Loan Trust(b) |
| CMO Series 2005-2 Class M1 |
1-month USD LIBOR + 0.660%
Floor 0.660%
05/25/2035 | 2.926% | | 410,110 | 410,534 |
| CMO Series 2006-1 Class 1A1 |
1-month USD LIBOR + 0.220%
Floor 0.220%
01/25/2036 | 2.365% | | 436,098 | 427,375 |
| RALI Series Trust(b) |
| CMO Series 2006-QA6 Class A3 |
1-month USD LIBOR + 0.190%
Floor 0.190%
07/25/2036 | 2.335% | | 641,584 | 600,942 |
| CMO Series 2007-QH6 Class A1 |
1-month USD LIBOR + 0.190%
Floor 0.190%
07/25/2037 | 2.335% | | 605,532 | 574,994 |
| RAMP Trust(b) |
| CMO Series 2005-RS4 Class M4 |
1-month USD LIBOR + 0.640%
Floor 0.640%
04/25/2035 | 3.105% | | 745,000 | 742,712 |
| CMO Series 2005-RZ3 Class M3 |
1-month USD LIBOR + 0.550%
Floor 0.550%, Cap 11.000%
09/25/2035 | 2.970% | | 850,000 | 853,043 |
| Soundview Home Loan Trust(b) |
| CMO Series 2006-OPT5 Class 1A1 |
1-month USD LIBOR + 0.140%
Floor 0.140%
07/25/2036 | 2.285% | | 741,481 | 721,423 |
| Structured Adjustable Rate Mortgage Loan Trust(b) |
| CMO Series 2005-19XS Class 2A1 |
1-month USD LIBOR + 0.300%
Floor 0.300%
10/25/2035 | 2.445% | | 615,504 | 618,087 |
The accompanying Notes to Consolidated Financial Statements are an integral part of this statement.
| 36 | Multi-Manager Alternative Strategies Fund | Annual Report 2019 |
Consolidated Portfolio of Investments (continued)
August 31, 2019
| Residential Mortgage-Backed Securities - Non-Agency (continued) |
| Issuer | Coupon
Rate | | Principal
Amount ($) | Value ($) |
| Series 2007-4 Class 1A2 |
1-month USD LIBOR + 0.220%
Floor 0.220%
05/25/2037 | 2.365% | | 736,144 | 705,457 |
| Structured Asset Investment Loan Trust(b) |
| CMO Series 2004-6 Class A3 |
1-month USD LIBOR + 0.800%
Floor 0.800%
07/25/2034 | 2.945% | | 671,836 | 664,583 |
| Towd Point Mortgage Trust(a) |
| CMO Series 2017-3 Class A1 |
| 07/25/2057 | 2.750% | | 64,120 | 64,411 |
| Towd Point Mortgage Trust(a),(b) |
| CMO Series 2017-5 Class A1 |
1-month USD LIBOR + 0.600%
02/25/2057 | 2.745% | | 485,632 | 483,723 |
| Towd Point Mortgage Trust(a),(c) |
| CMO Series 2018-3 Class A1 |
| 05/25/2058 | 3.750% | | 124,580 | 129,201 |
| CMO Series 2018-4 Class A1 |
| 06/25/2058 | 3.000% | | 282,963 | 288,166 |
| CMO Series 2019-1 Class A1 |
| 03/25/2058 | 3.750% | | 194,706 | 203,837 |
| Verus Securitization Trust(a) |
| CMO Series 2018-1 Class A1 |
| 02/25/2048 | 2.929% | | 59,368 | 59,424 |
| Washington Mutual Mortgage Pass-Through Certificates WMALT Trust(b) |
| CMO Series 2006-AR2 Class A1A |
1-year MTA + 0.940%
Floor 0.940%
04/25/2046 | 3.387% | | 394,674 | 366,498 |
| Wells Fargo Alternative Loan Trust(b) |
| CMO Series 2005-2 Class M1 |
1-month USD LIBOR + 0.675%
Floor 0.675%
10/25/2035 | 2.820% | | 289,683 | 290,909 |
Total Residential Mortgage-Backed Securities - Non-Agency
(Cost $39,829,241) | 40,551,635 |
|
| Treasury Bills 5.4% |
| Issuer | Effective
Yield | | Principal
Amount ($) | Value ($) |
| United States 5.4% |
| U.S. Treasury Bills |
| 09/05/2019 | 2.110% | | 1,962,000 | 1,961,321 |
| 10/08/2019 | 2.040% | | 2,195,000 | 2,190,220 |
| 10/10/2019 | 1.920% | | 5,267,000 | 5,255,674 |
| 10/15/2019 | 1.940% | | 1,640,000 | 1,635,995 |
| 10/22/2019 | 2.000% | | 1,225,000 | 1,221,446 |
| 11/29/2019 | 1.890% | | 295,000 | 293,618 |
| 12/12/2019 | 1.840% | | 362,000 | 360,108 |
| Treasury Bills (continued) |
| Issuer | Effective
Yield | | Principal
Amount ($) | Value ($) |
| 12/19/2019 | 1.850% | | 366,000 | 363,948 |
| 12/26/2019 | 1.870% | | 137,000 | 136,178 |
| 01/16/2020 | 1.830% | | 495,000 | 491,578 |
| 01/23/2020 | 1.830% | | 1,854,000 | 1,840,515 |
| 01/30/2020 | 1.830% | | 4,255,000 | 4,222,695 |
| 02/06/2020 | 1.830% | | 3,098,000 | 3,073,354 |
| 02/13/2020 | 1.830% | | 2,224,000 | 2,205,536 |
| 02/20/2020 | 1.830% | | 1,891,000 | 1,874,668 |
| U.S. Treasury Bills(f) |
| 09/26/2019 | 2.010% | | 174,000 | 173,742 |
| Total | 27,300,596 |
Total Treasury Bills
(Cost $27,287,686) | 27,300,596 |
|
| U.S. Government & Agency Obligations 0.2% |
| Issuer | Coupon
Rate | | Principal
Amount ($) | Value ($) |
| Federal Home Loan Banks |
| 09/20/2033 | 4.090% | | 855,000 | 855,949 |
Total U.S. Government & Agency Obligations
(Cost $853,130) | 855,949 |
|
| U.S. Treasury Obligations 2.2% |
| | | | |
| U.S. Treasury |
| 02/15/2022 | 2.500% | | 365,000 | 373,982 |
| 01/31/2024 | 2.500% | | 510,000 | 533,428 |
| 02/29/2024 | 2.375% | | 800,000 | 833,500 |
| 04/30/2026 | 2.375% | | 740,000 | 782,897 |
| 11/15/2026 | 2.000% | | 640,000 | 663,800 |
| 02/15/2029 | 2.625% | | 365,000 | 400,759 |
| 05/15/2029 | 2.375% | | 1,335,000 | 1,438,671 |
| 02/15/2038 | 4.375% | | 905,000 | 1,280,999 |
| 11/15/2042 | 2.750% | | 1,315,000 | 1,515,948 |
| 02/15/2043 | 3.125% | | 1,270,000 | 1,555,552 |
| 02/15/2049 | 3.000% | | 1,535,000 | 1,888,770 |
Total U.S. Treasury Obligations
(Cost $9,948,863) | 11,268,306 |
| Warrants 0.0% |
| Issuer | Shares | Value ($) |
| Information Technology 0.0% |
| Software 0.0% |
| Avaya Holdings Corp.(e),(h),(i) | 8,745 | 17,490 |
| Total Information Technology | 17,490 |
Total Warrants
(Cost $—) | 17,490 |
The accompanying Notes to Consolidated Financial Statements are an integral part of this statement.
Multi-Manager Alternative Strategies Fund | Annual Report 2019
| 37 |
Consolidated Portfolio of Investments (continued)
August 31, 2019
| Options Purchased Calls 0.0% |
| | | | | Value ($) |
| (Cost $92,838) | 13,523 |
|
| Options Purchased Puts 0.1% |
| | | | |
| (Cost $423,326) | 419,719 |
| Money Market Funds 24.4% |
| | Shares | Value ($) |
| Columbia Short-Term Cash Fund, 2.208%(o),(p) | 122,886,475 | 122,874,186 |
Total Money Market Funds
(Cost $122,874,715) | 122,874,186 |
Total Investments in Securities
(Cost $491,193,696) | 494,355,983 |
|
| Investments in securities sold short |
| |
| Common Stocks (4.0)% |
| Issuer | Shares | Value ($) |
| Communication Services (0.2)% |
| Diversified Telecommunication Services (0.1)% |
| Zayo Group Holdings, Inc.(e) | (5,631) | (189,539) |
| Media (0.1)% |
| Discovery, Inc., Class A(e) | (10,692) | (295,099) |
| New Media Investment Group, Inc. | (36,582) | (321,190) |
| Total | | (616,289) |
| Total Communication Services | (805,828) |
| Consumer Discretionary (0.4)% |
| Hotels, Restaurants & Leisure (0.2)% |
| Aramark | (19,861) | (811,521) |
| Eldorado Resorts, Inc.(e) | (11,040) | (425,150) |
| Total | | (1,236,671) |
| Specialty Retail (0.2)% |
| Home Depot, Inc. (The) | (3,518) | (801,787) |
| Total Consumer Discretionary | (2,038,458) |
| Consumer Staples (0.0)% |
| Personal Products (0.0)% |
| Avon Products, Inc.(e) | (32,925) | (143,224) |
| Total Consumer Staples | (143,224) |
| Financials (0.3)% |
| Capital Markets (0.3)% |
| Brookfield Asset Management, Inc., Class A | (25,521) | (1,317,139) |
| Total Financials | (1,317,139) |
|
| Common Stocks (continued) |
| Issuer | Shares | Value ($) |
| Health Care (2.4)% |
| Biotechnology (0.4)% |
| AbbVie, Inc. | (24,294) | (1,597,087) |
| Exact Sciences Corp.(e) | (5,098) | (607,784) |
| Total | | (2,204,871) |
| Health Care Providers & Services (1.1)% |
| Centene Corp.(e) | (100,266) | (4,674,401) |
| DaVita, Inc.(e) | (15,500) | (873,735) |
| Total | | (5,548,136) |
| Pharmaceuticals (0.9)% |
| Bristol-Myers Squibb Co. | (90,886) | (4,368,890) |
| Total Health Care | (12,121,897) |
| Industrials (0.2)% |
| Building Products (0.0)% |
| Fortune Brands Home & Security, Inc. | (1,055) | (53,868) |
| JELD-WEN Holding, Inc.(e) | (2,280) | (39,353) |
| Masonite International Corp.(e) | (874) | (46,663) |
| Total | | (139,884) |
| Machinery (0.1)% |
| Hillenbrand, Inc. | (17,656) | (484,480) |
| Professional Services (0.0)% |
| Nielsen Holdings PLC | (8,501) | (176,481) |
| Trading Companies & Distributors (0.1)% |
| United Rentals, Inc.(e) | (2,057) | (231,536) |
| Total Industrials | (1,032,381) |
| Information Technology (0.5)% |
| IT Services (0.0)% |
| Global Payments, Inc. | (17) | (2,822) |
| Semiconductors & Semiconductor Equipment (0.5)% |
| Versum Materials, Inc. | (50,154) | (2,608,008) |
| Total Information Technology | (2,610,830) |
| Materials (0.0)% |
| Chemicals (0.0)% |
| PPG Industries, Inc. | (811) | (89,851) |
| Total Materials | (89,851) |
Total Common Stocks
(Proceeds $20,838,060) | (20,159,608) |
|
The accompanying Notes to Consolidated Financial Statements are an integral part of this statement.
| 38 | Multi-Manager Alternative Strategies Fund | Annual Report 2019 |
Consolidated Portfolio of Investments (continued)
August 31, 2019
| Exchange-Traded Funds (0.3)% |
| | Shares | Value ($) |
| Invesco QQQ Trust | (8,147) | (1,527,318) |
Total Exchange-Traded Funds
(Proceeds $1,363,109) | (1,527,318) |
|
| Rights (0.0)% |
| Issuer | Shares | Value ($) |
| Health Care (0.0)% |
| Biotechnology (0.0)% |
| Celgene Corp. CVR(e),(h),(i) | (45,985) | (91,970) |
| Total Health Care | (91,970) |
Total Rights
(Proceeds $107,393) | (91,970) |
Total Investments in Securities Sold Short
(Proceeds $22,308,562) | (21,778,896) |
| Total Investments in Securities, Net of Securities Sold Short | 472,577,087 |
| Other Assets & Liabilities, Net | | 31,205,472 |
| Net Assets | 503,782,559 |
At August 31, 2019, securities and/or cash totaling $54,081,237 were pledged as collateral.
Investments in derivatives
| Forward foreign currency exchange contracts |
Currency to
be sold | Currency to
be purchased | Counterparty | Settlement
date | Unrealized
appreciation ($) | Unrealized
depreciation ($) |
| 1,172,900 AUD | 1,233,997 NZD | ANZ Securities | 09/18/2019 | — | (12,376) |
| 2,728,942 AUD | 1,913,548 USD | ANZ Securities | 09/18/2019 | 74,939 | — |
| 48,233,105 JPY | 458,011 USD | ANZ Securities | 09/18/2019 | 3,511 | — |
| 687,836 NZD | 656,535 AUD | ANZ Securities | 09/18/2019 | 8,755 | — |
| 1,559,264 NZD | 1,034,485 USD | ANZ Securities | 09/18/2019 | 51,592 | — |
| 678,001 USD | 985,907 AUD | ANZ Securities | 09/18/2019 | — | (13,752) |
| 683,664 USD | 72,266,728 JPY | ANZ Securities | 09/18/2019 | — | (2,697) |
| 355,574 USD | 488,924 SGD | ANZ Securities | 09/18/2019 | — | (3,202) |
| 1,355,574 NZD | 1,295,000 AUD | BMO | 09/18/2019 | 18,004 | — |
| 3,440,767 CAD | 2,572,709 USD | Canadian Imperial Bank of Commerce | 09/18/2019 | — | (12,202) |
| 1,260,000 USD | 1,681,744 CAD | Canadian Imperial Bank of Commerce | 09/18/2019 | 3,428 | — |
| 1,464,500 AUD | 1,014,997 USD | Citi | 09/18/2019 | 28,299 | — |
| 6,686,504 BRL | 1,686,756 USD | Citi | 09/18/2019 | 73,572 | — |
| 315,000 CAD | 2,052,958 NOK | Citi | 09/18/2019 | — | (11,268) |
| 295,890 CAD | 224,963 USD | Citi | 09/18/2019 | 2,673 | — |
| 996,398 CAD | 743,111 USD | Citi | 09/18/2019 | — | (5,444) |
| 3,275,475 CHF | 3,336,365 USD | Citi | 09/18/2019 | 22,666 | — |
| 41,602 CHF | 41,992 USD | Citi | 09/18/2019 | — | (95) |
| 604,183,040 COP | 183,265 USD | Citi | 09/18/2019 | 7,860 | — |
| 9,905,500 COP | 2,850 USD | Citi | 09/18/2019 | — | (26) |
| 11,794,022 EUR | 13,346,632 USD | Citi | 09/18/2019 | 370,048 | — |
| 1,614,490 GBP | 2,042,356 USD | Citi | 09/18/2019 | 76,610 | — |
| 458,500 GBP | 555,298 USD | Citi | 09/18/2019 | — | (2,956) |
| 313,500 HKD | 40,015 USD | Citi | 09/18/2019 | 31 | — |
| 246,481,996 HUF | 852,055 USD | Citi | 09/18/2019 | 33,549 | — |
The accompanying Notes to Consolidated Financial Statements are an integral part of this statement.
Multi-Manager Alternative Strategies Fund | Annual Report 2019
| 39 |
Consolidated Portfolio of Investments (continued)
August 31, 2019
| Forward foreign currency exchange contracts (continued) |
Currency to
be sold | Currency to
be purchased | Counterparty | Settlement
date | Unrealized
appreciation ($) | Unrealized
depreciation ($) |
| 2,346,742,000 IDR | 166,890 USD | Citi | 09/18/2019 | 1,814 | — |
| 10,386,420,465 IDR | 723,813 USD | Citi | 09/18/2019 | — | (6,799) |
| 542,748 ILS | 154,287 USD | Citi | 09/18/2019 | 599 | — |
| 213,003 ILS | 59,687 USD | Citi | 09/18/2019 | — | (628) |
| 37,272,000 INR | 528,300 USD | Citi | 09/18/2019 | 8,371 | — |
| 17,481,982 INR | 242,668 USD | Citi | 09/18/2019 | — | (1,198) |
| 15,187,005 JPY | 144,073 USD | Citi | 09/18/2019 | 966 | — |
| 56,297,506 JPY | 527,392 USD | Citi | 09/18/2019 | — | (3,098) |
| 6,369,357,480 KRW | 5,409,340 USD | Citi | 09/18/2019 | 147,289 | — |
| 134,916,500 KRW | 111,216 USD | Citi | 09/18/2019 | — | (245) |
| 39,494,198 MXN | 2,022,695 USD | Citi | 09/18/2019 | 56,867 | — |
| 984,000 MXN | 48,862 USD | Citi | 09/18/2019 | — | (116) |
| 4,055,641 NOK | 625,000 CAD | Citi | 09/18/2019 | 24,300 | — |
| 14,815,500 NOK | 1,682,328 USD | Citi | 09/18/2019 | 55,848 | — |
| 831,999 NZD | 545,310 USD | Citi | 09/18/2019 | 20,854 | — |
| 5,631,500 PHP | 109,334 USD | Citi | 09/18/2019 | 1,303 | — |
| 11,385,689 PHP | 217,155 USD | Citi | 09/18/2019 | — | (1,261) |
| 13,161,504 PLN | 3,397,195 USD | Citi | 09/18/2019 | 90,203 | — |
| 18,121,496 SEK | 1,912,374 USD | Citi | 09/18/2019 | 64,230 | — |
| 1,263,500 SGD | 923,549 USD | Citi | 09/18/2019 | 12,933 | — |
| 72,500 SGD | 52,231 USD | Citi | 09/18/2019 | — | (20) |
| 12,811,504 TWD | 412,691 USD | Citi | 09/18/2019 | 3,806 | — |
| 13,423,488 TWD | 426,908 USD | Citi | 09/18/2019 | — | (1,509) |
| 138,177 USD | 205,750 AUD | Citi | 09/18/2019 | 445 | — |
| 587,814 USD | 847,250 AUD | Citi | 09/18/2019 | — | (16,984) |
| 1,736,067 USD | 6,686,504 BRL | Citi | 09/18/2019 | — | (122,883) |
| 349,651 USD | 467,000 CAD | Citi | 09/18/2019 | 1,187 | — |
| 1,586,251 USD | 2,075,492 CAD | Citi | 09/18/2019 | — | (27,016) |
| 751,334 USD | 748,261 CHF | Citi | 09/18/2019 | 5,659 | — |
| 4,329,348 USD | 4,219,878 CHF | Citi | 09/18/2019 | — | (60,225) |
| 6,212 USD | 21,419,500 COP | Citi | 09/18/2019 | 6 | — |
| 175,350 USD | 592,669,040 COP | Citi | 09/18/2019 | — | (3,289) |
| 1,750,609 USD | 1,569,065 EUR | Citi | 09/18/2019 | — | (24,217) |
| 256,219 USD | 211,060 GBP | Citi | 09/18/2019 | 760 | — |
| 1,421,745 USD | 1,149,684 GBP | Citi | 09/18/2019 | — | (21,930) |
| 40,018 USD | 313,500 HKD | Citi | 09/18/2019 | — | (34) |
| 853,292 USD | 246,481,996 HUF | Citi | 09/18/2019 | — | (34,786) |
| 972,319 USD | 14,000,366,620 IDR | Citi | 09/18/2019 | 12,509 | — |
| 13,439 USD | 189,614,000 IDR | Citi | 09/18/2019 | — | (101) |
| 106,958 USD | 380,000 ILS | Citi | 09/18/2019 | 646 | — |
| 155,338 USD | 545,500 ILS | Citi | 09/18/2019 | — | (870) |
| 815,517 USD | 57,251,408 INR | Citi | 09/18/2019 | — | (16,884) |
| 708,841 USD | 76,380,268 JPY | Citi | 09/18/2019 | 10,888 | — |
| 1,935,775 USD | 203,463,479 JPY | Citi | 09/18/2019 | — | (18,543) |
| 2,022,586 USD | 2,454,834,634 KRW | Citi | 09/18/2019 | 5,478 | — |
| 1,677,168 USD | 2,003,743,816 KRW | Citi | 09/18/2019 | — | (21,773) |
| 44,338 USD | 893,717 MXN | Citi | 09/18/2019 | 147 | — |
| 1,978,388 USD | 38,741,155 MXN | Citi | 09/18/2019 | — | (50,043) |
| 953,355 USD | 8,333,936 NOK | Citi | 09/18/2019 | — | (38,436) |
| 576,604 USD | 860,000 NZD | Citi | 09/18/2019 | — | (34,498) |
| 299,010 USD | 15,743,468 PHP | Citi | 09/18/2019 | 3,002 | — |
| 128,093 USD | 6,616,536 PHP | Citi | 09/18/2019 | — | (1,165) |
| 3,949,553 USD | 15,020,010 PLN | Citi | 09/18/2019 | — | (175,588) |
| 1,907,174 USD | 18,121,496 SEK | Citi | 09/18/2019 | — | (59,030) |
| 408,020 USD | 566,500 SGD | Citi | 09/18/2019 | 262 | — |
| 500,678 USD | 683,686 SGD | Citi | 09/18/2019 | — | (7,939) |
| 164,770 USD | 5,176,605 TWD | Citi | 09/18/2019 | 444 | — |
| 407,366 USD | 12,740,710 TWD | Citi | 09/18/2019 | — | (740) |
The accompanying Notes to Consolidated Financial Statements are an integral part of this statement.
| 40 | Multi-Manager Alternative Strategies Fund | Annual Report 2019 |
Consolidated Portfolio of Investments (continued)
August 31, 2019
| Forward foreign currency exchange contracts (continued) |
Currency to
be sold | Currency to
be purchased | Counterparty | Settlement
date | Unrealized
appreciation ($) | Unrealized
depreciation ($) |
| 2,941,236 USD | 41,896,500 ZAR | Citi | 09/18/2019 | — | (184,308) |
| 23,937,500 ZAR | 1,614,814 USD | Citi | 09/18/2019 | 39,647 | — |
| 16,067,875 ZAR | 1,047,646 USD | Citi | 09/18/2019 | — | (9,673) |
| 303,762,008 CLP | 435,778 USD | Citi | 09/23/2019 | 14,737 | — |
| 28,176 USD | 20,385,369 CLP | Citi | 09/23/2019 | 80 | — |
| 271,418 USD | 193,074,425 CLP | Citi | 09/23/2019 | — | (3,800) |
| 205,750 AUD | 139,985 USD | Citi | 12/18/2019 | 1,016 | — |
| 205,750 AUD | 138,520 USD | Citi | 12/18/2019 | — | (449) |
| 13,644 CHF | 14,024 USD | Citi | 12/18/2019 | 108 | — |
| 120,395,420 CLP | 168,578 USD | Citi | 12/18/2019 | 1,470 | — |
| 15,050,368 CLP | 20,833 USD | Citi | 12/18/2019 | — | (57) |
| 469,474,040 COP | 136,764 USD | Citi | 12/18/2019 | 1,222 | — |
| 923,995 EUR | 1,031,992 USD | Citi | 12/18/2019 | 8,301 | — |
| 534,186 GBP | 655,191 USD | Citi | 12/18/2019 | 2,503 | — |
| 178,062 GBP | 216,832 USD | Citi | 12/18/2019 | — | (731) |
| 37,699,496 HUF | 127,910 USD | Citi | 12/18/2019 | 2,070 | — |
| 86,875 JPY | 831 USD | Citi | 12/18/2019 | 8 | — |
| 173,750 JPY | 1,645 USD | Citi | 12/18/2019 | — | (3) |
| 1,227,417,316 KRW | 1,022,078 USD | Citi | 12/18/2019 | 4,956 | — |
| 2,454,834,634 KRW | 2,028,450 USD | Citi | 12/18/2019 | — | (5,793) |
| 3,888,936 NOK | 432,871 USD | Citi | 12/18/2019 | 5,336 | — |
| 8,367,500 SEK | 870,044 USD | Citi | 12/18/2019 | 11,791 | — |
| 566,500 SGD | 408,420 USD | Citi | 12/18/2019 | — | (291) |
| 1,663,536 TWD | 53,525 USD | Citi | 12/18/2019 | 37 | — |
| 13,308,288 TWD | 426,660 USD | Citi | 12/18/2019 | — | (1,238) |
| 130,617 USD | 532,000 BRL | Citi | 12/18/2019 | — | (3,136) |
| 1,930 USD | 2,570 CAD | Citi | 12/18/2019 | 3 | — |
| 5,812 USD | 7,710 CAD | Citi | 12/18/2019 | — | (13) |
| 2,275,396 USD | 2,214,567 CHF | Citi | 12/18/2019 | — | (16,541) |
| 300,947 USD | 4,370,454,468 IDR | Citi | 12/18/2019 | 1,969 | — |
| 145,494 USD | 509,250 ILS | Citi | 12/18/2019 | — | (499) |
| 136,646 USD | 9,989,700 INR | Citi | 12/18/2019 | 600 | — |
| 103,031 USD | 7,492,275 INR | Citi | 12/18/2019 | — | (97) |
| 175,747 USD | 18,567,012 JPY | Citi | 12/18/2019 | 313 | — |
| 88,835 USD | 9,283,506 JPY | Citi | 12/18/2019 | — | (805) |
| 48,139 USD | 984,000 MXN | Citi | 12/18/2019 | 106 | — |
| 97,357 USD | 1,968,000 MXN | Citi | 12/18/2019 | — | (867) |
| 17,938 USD | 28,000 NZD | Citi | 12/18/2019 | — | (250) |
| 60,851 USD | 3,205,689 PHP | Citi | 12/18/2019 | 279 | — |
| 628,951 USD | 2,477,996 PLN | Citi | 12/18/2019 | — | (5,335) |
| 364,714 USD | 5,673,372 ZAR | Citi | 12/18/2019 | 4,360 | — |
| 5,165,700 EUR | 5,859,359 USD | Goldman Sachs | 09/13/2019 | 177,952 | — |
| 1,550,000 GBP | 1,923,427 USD | Goldman Sachs | 09/13/2019 | 36,625 | — |
| 404,300 GBP | 491,359 USD | Goldman Sachs | 09/13/2019 | — | (792) |
| 14,879,000 SEK | 1,584,268 USD | Goldman Sachs | 09/13/2019 | 67,334 | — |
| 1,938,342 USD | 1,732,900 EUR | Goldman Sachs | 09/13/2019 | — | (32,442) |
| 1,606,754 USD | 14,879,000 SEK | Goldman Sachs | 09/13/2019 | — | (89,820) |
| 5,029,600 ZAR | 349,510 USD | Goldman Sachs | 09/13/2019 | 18,327 | — |
| 2,282,300 ZAR | 149,378 USD | Goldman Sachs | 09/13/2019 | — | (904) |
| 315,000 CAD | 25,173,855 JPY | Goldman Sachs | 09/18/2019 | 566 | — |
| 1,716,509 EUR | 1,909,208 USD | Goldman Sachs | 09/18/2019 | 20,588 | — |
| 53,818,700 JPY | 500,000 USD | Goldman Sachs | 09/18/2019 | — | (7,132) |
| 14,728,686 MXN | 757,611 USD | Goldman Sachs | 09/18/2019 | 24,489 | — |
| 939,367 USD | 833,119 EUR | Goldman Sachs | 09/18/2019 | — | (22,713) |
| 855,633 USD | 90,974,933 JPY | Goldman Sachs | 09/18/2019 | 1,622 | — |
| 1,106,394 USD | 22,009,350 MXN | Goldman Sachs | 09/18/2019 | — | (10,877) |
| 532,500 AUD | 567,960 NZD | HSBC | 09/18/2019 | — | (751) |
| 650,000 AUD | 441,901 USD | HSBC | 09/18/2019 | 3,967 | — |
The accompanying Notes to Consolidated Financial Statements are an integral part of this statement.
Multi-Manager Alternative Strategies Fund | Annual Report 2019
| 41 |
Consolidated Portfolio of Investments (continued)
August 31, 2019
| Forward foreign currency exchange contracts (continued) |
Currency to
be sold | Currency to
be purchased | Counterparty | Settlement
date | Unrealized
appreciation ($) | Unrealized
depreciation ($) |
| 110,000 EUR | 123,084 USD | HSBC | 09/18/2019 | 2,054 | — |
| 123,044 GBP | 156,773 USD | HSBC | 09/18/2019 | 6,959 | — |
| 136,399,905 JPY | 1,270,000 USD | HSBC | 09/18/2019 | — | (15,293) |
| 4,430,246 NOK | 688,000 CAD | HSBC | 09/18/2019 | 30,504 | — |
| 1,118,056 NZD | 1,065,540 AUD | HSBC | 09/18/2019 | 13,127 | — |
| 431,190 USD | 389,124 EUR | HSBC | 09/18/2019 | — | (3,050) |
| 500,000 USD | 53,830,365 JPY | HSBC | 09/18/2019 | 7,242 | — |
| 389,428 USD | 530,748 SGD | HSBC | 09/18/2019 | — | (6,913) |
| 1,464,500 AUD | 1,014,996 USD | JPMorgan | 09/18/2019 | 28,298 | — |
| 6,686,496 BRL | 1,686,735 USD | JPMorgan | 09/18/2019 | 73,553 | — |
| 470,708 CAD | 312,500 EUR | JPMorgan | 09/18/2019 | — | (9,790) |
| 293,580 CAD | 1,912,696 NOK | JPMorgan | 09/18/2019 | — | (10,575) |
| 1,132,729 CAD | 854,966 USD | JPMorgan | 09/18/2019 | 3,991 | — |
| 1,835,577 CAD | 1,373,180 USD | JPMorgan | 09/18/2019 | — | (5,817) |
| 3,275,471 CHF | 3,336,357 USD | JPMorgan | 09/18/2019 | 22,662 | — |
| 41,594 CHF | 41,984 USD | JPMorgan | 09/18/2019 | — | (95) |
| 604,183,040 COP | 183,276 USD | JPMorgan | 09/18/2019 | 7,871 | — |
| 9,905,500 COP | 2,850 USD | JPMorgan | 09/18/2019 | — | (26) |
| 2,189,995 EUR | 2,450,888 USD | JPMorgan | 09/18/2019 | 41,307 | — |
| 1,614,510 GBP | 2,042,379 USD | JPMorgan | 09/18/2019 | 76,608 | — |
| 458,500 GBP | 555,297 USD | JPMorgan | 09/18/2019 | — | (2,957) |
| 313,500 HKD | 40,015 USD | JPMorgan | 09/18/2019 | 31 | — |
| 246,481,996 HUF | 852,054 USD | JPMorgan | 09/18/2019 | 33,548 | — |
| 2,346,742,000 IDR | 166,890 USD | JPMorgan | 09/18/2019 | 1,813 | — |
| 10,386,420,465 IDR | 723,812 USD | JPMorgan | 09/18/2019 | — | (6,800) |
| 542,753 ILS | 154,288 USD | JPMorgan | 09/18/2019 | 599 | — |
| 212,996 ILS | 59,689 USD | JPMorgan | 09/18/2019 | — | (624) |
| 37,272,000 INR | 528,300 USD | JPMorgan | 09/18/2019 | 8,371 | — |
| 17,481,962 INR | 242,668 USD | JPMorgan | 09/18/2019 | — | (1,198) |
| 15,187,007 JPY | 144,073 USD | JPMorgan | 09/18/2019 | 966 | — |
| 56,297,518 JPY | 527,392 USD | JPMorgan | 09/18/2019 | — | (3,099) |
| 6,369,357,488 KRW | 5,409,334 USD | JPMorgan | 09/18/2019 | 147,283 | — |
| 134,916,500 KRW | 111,216 USD | JPMorgan | 09/18/2019 | — | (246) |
| 26,496,000 MXN | 1,357,626 USD | JPMorgan | 09/18/2019 | 38,785 | — |
| 984,001 MXN | 48,862 USD | JPMorgan | 09/18/2019 | — | (116) |
| 2,034,559 NOK | 313,731 CAD | JPMorgan | 09/18/2019 | 12,335 | — |
| 14,815,500 NOK | 1,682,326 USD | JPMorgan | 09/18/2019 | 55,846 | — |
| 831,999 NZD | 545,309 USD | JPMorgan | 09/18/2019 | 20,853 | — |
| 5,631,500 PHP | 109,334 USD | JPMorgan | 09/18/2019 | 1,303 | — |
| 11,385,686 PHP | 217,154 USD | JPMorgan | 09/18/2019 | — | (1,261) |
| 13,161,492 PLN | 3,397,188 USD | JPMorgan | 09/18/2019 | 90,199 | — |
| 18,121,504 SEK | 1,912,418 USD | JPMorgan | 09/18/2019 | 64,273 | — |
| 3,852,534 SGD | 2,821,834 USD | JPMorgan | 09/18/2019 | 45,275 | — |
| 72,500 SGD | 52,231 USD | JPMorgan | 09/18/2019 | — | (21) |
| 12,811,504 TWD | 412,690 USD | JPMorgan | 09/18/2019 | 3,805 | — |
| 13,423,504 TWD | 426,908 USD | JPMorgan | 09/18/2019 | — | (1,509) |
| 138,178 USD | 205,750 AUD | JPMorgan | 09/18/2019 | 445 | — |
| 587,815 USD | 847,250 AUD | JPMorgan | 09/18/2019 | — | (16,985) |
| 1,736,067 USD | 6,686,496 BRL | JPMorgan | 09/18/2019 | — | (122,885) |
| 349,652 USD | 467,000 CAD | JPMorgan | 09/18/2019 | 1,187 | — |
| 631,252 USD | 833,000 CAD | JPMorgan | 09/18/2019 | — | (5,452) |
| 751,353 USD | 748,269 CHF | JPMorgan | 09/18/2019 | 5,649 | — |
| 4,329,349 USD | 4,219,874 CHF | JPMorgan | 09/18/2019 | — | (60,230) |
| 6,212 USD | 21,419,500 COP | JPMorgan | 09/18/2019 | 6 | — |
| 175,351 USD | 592,669,040 COP | JPMorgan | 09/18/2019 | — | (3,289) |
| 3,015,054 USD | 2,705,728 EUR | JPMorgan | 09/18/2019 | — | (38,029) |
| 256,223 USD | 211,063 GBP | JPMorgan | 09/18/2019 | 760 | — |
| 1,421,738 USD | 1,149,687 GBP | JPMorgan | 09/18/2019 | — | (21,919) |
The accompanying Notes to Consolidated Financial Statements are an integral part of this statement.
| 42 | Multi-Manager Alternative Strategies Fund | Annual Report 2019 |
Consolidated Portfolio of Investments (continued)
August 31, 2019
| Forward foreign currency exchange contracts (continued) |
Currency to
be sold | Currency to
be purchased | Counterparty | Settlement
date | Unrealized
appreciation ($) | Unrealized
depreciation ($) |
| 40,018 USD | 313,500 HKD | JPMorgan | 09/18/2019 | — | (34) |
| 853,293 USD | 246,481,996 HUF | JPMorgan | 09/18/2019 | — | (34,787) |
| 972,320 USD | 14,000,366,620 IDR | JPMorgan | 09/18/2019 | 12,508 | — |
| 13,439 USD | 189,614,000 IDR | JPMorgan | 09/18/2019 | — | (101) |
| 106,958 USD | 380,000 ILS | JPMorgan | 09/18/2019 | 645 | — |
| 155,338 USD | 545,500 ILS | JPMorgan | 09/18/2019 | — | (871) |
| 815,518 USD | 57,251,386 INR | JPMorgan | 09/18/2019 | — | (16,885) |
| 708,842 USD | 76,380,280 JPY | JPMorgan | 09/18/2019 | 10,887 | — |
| 40,775 USD | 4,300,876 JPY | JPMorgan | 09/18/2019 | — | (248) |
| 2,022,588 USD | 2,454,834,636 KRW | JPMorgan | 09/18/2019 | 5,476 | — |
| 1,677,170 USD | 2,003,743,818 KRW | JPMorgan | 09/18/2019 | — | (21,775) |
| 1,485,880 USD | 29,120,006 MXN | JPMorgan | 09/18/2019 | — | (36,428) |
| 1,126,327 USD | 9,820,528 NOK | JPMorgan | 09/18/2019 | — | (48,206) |
| 1,023,433 USD | 1,540,000 NZD | JPMorgan | 09/18/2019 | — | (52,684) |
| 299,010 USD | 15,743,460 PHP | JPMorgan | 09/18/2019 | 3,002 | — |
| 128,093 USD | 6,616,536 PHP | JPMorgan | 09/18/2019 | — | (1,165) |
| 3,949,547 USD | 15,019,990 PLN | JPMorgan | 09/18/2019 | — | (175,588) |
| 1,907,177 USD | 18,121,504 SEK | JPMorgan | 09/18/2019 | — | (59,032) |
| 408,020 USD | 566,500 SGD | JPMorgan | 09/18/2019 | 262 | — |
| 149,883 USD | 203,000 SGD | JPMorgan | 09/18/2019 | — | (3,579) |
| 164,770 USD | 5,176,608 TWD | JPMorgan | 09/18/2019 | 444 | — |
| 407,366 USD | 12,740,716 TWD | JPMorgan | 09/18/2019 | — | (740) |
| 2,941,240 USD | 41,896,500 ZAR | JPMorgan | 09/18/2019 | — | (184,313) |
| 23,937,500 ZAR | 1,614,812 USD | JPMorgan | 09/18/2019 | 39,645 | — |
| 16,067,875 ZAR | 1,047,645 USD | JPMorgan | 09/18/2019 | — | (9,674) |
| 303,762,000 CLP | 435,788 USD | JPMorgan | 09/23/2019 | 14,747 | — |
| 28,175 USD | 20,385,368 CLP | JPMorgan | 09/23/2019 | 81 | — |
| 271,399 USD | 193,074,419 CLP | JPMorgan | 09/23/2019 | — | (3,781) |
| 205,750 AUD | 139,985 USD | JPMorgan | 12/18/2019 | 1,016 | — |
| 205,750 AUD | 138,520 USD | JPMorgan | 12/18/2019 | — | (450) |
| 13,638 CHF | 14,018 USD | JPMorgan | 12/18/2019 | 107 | — |
| 120,395,424 CLP | 168,560 USD | JPMorgan | 12/18/2019 | 1,451 | — |
| 15,050,369 CLP | 20,833 USD | JPMorgan | 12/18/2019 | — | (57) |
| 469,474,040 COP | 136,764 USD | JPMorgan | 12/18/2019 | 1,222 | — |
| 923,999 EUR | 1,031,995 USD | JPMorgan | 12/18/2019 | 8,300 | — |
| 534,185 GBP | 655,189 USD | JPMorgan | 12/18/2019 | 2,502 | — |
| 178,061 GBP | 216,831 USD | JPMorgan | 12/18/2019 | — | (731) |
| 37,699,496 HUF | 127,910 USD | JPMorgan | 12/18/2019 | 2,070 | — |
| 86,875 JPY | 831 USD | JPMorgan | 12/18/2019 | 8 | — |
| 173,750 JPY | 1,645 USD | JPMorgan | 12/18/2019 | — | (3) |
| 1,227,417,318 KRW | 1,022,077 USD | JPMorgan | 12/18/2019 | 4,955 | — |
| 2,454,834,636 KRW | 2,028,447 USD | JPMorgan | 12/18/2019 | — | (5,796) |
| 3,888,936 NOK | 432,871 USD | JPMorgan | 12/18/2019 | 5,335 | — |
| 8,367,500 SEK | 870,043 USD | JPMorgan | 12/18/2019 | 11,790 | — |
| 566,500 SGD | 408,419 USD | JPMorgan | 12/18/2019 | — | (292) |
| 1,663,535 TWD | 53,524 USD | JPMorgan | 12/18/2019 | 37 | — |
| 13,308,280 TWD | 426,659 USD | JPMorgan | 12/18/2019 | — | (1,239) |
| 130,617 USD | 532,000 BRL | JPMorgan | 12/18/2019 | — | (3,136) |
| 1,932 USD | 2,572 CAD | JPMorgan | 12/18/2019 | 3 | — |
| 5,816 USD | 7,716 CAD | JPMorgan | 12/18/2019 | — | (13) |
| 2,275,407 USD | 2,214,575 CHF | JPMorgan | 12/18/2019 | — | (16,544) |
| 300,948 USD | 4,370,454,462 IDR | JPMorgan | 12/18/2019 | 1,969 | — |
| 145,494 USD | 509,250 ILS | JPMorgan | 12/18/2019 | — | (499) |
| 136,646 USD | 9,989,696 INR | JPMorgan | 12/18/2019 | 599 | — |
| 103,032 USD | 7,492,273 INR | JPMorgan | 12/18/2019 | — | (98) |
| 175,748 USD | 18,567,012 JPY | JPMorgan | 12/18/2019 | 313 | — |
| 88,835 USD | 9,283,506 JPY | JPMorgan | 12/18/2019 | — | (805) |
| 48,139 USD | 984,001 MXN | JPMorgan | 12/18/2019 | 106 | — |
The accompanying Notes to Consolidated Financial Statements are an integral part of this statement.
Multi-Manager Alternative Strategies Fund | Annual Report 2019
| 43 |
Consolidated Portfolio of Investments (continued)
August 31, 2019
| Forward foreign currency exchange contracts (continued) |
Currency to
be sold | Currency to
be purchased | Counterparty | Settlement
date | Unrealized
appreciation ($) | Unrealized
depreciation ($) |
| 97,356 USD | 1,967,994 MXN | JPMorgan | 12/18/2019 | — | (867) |
| 17,937 USD | 27,998 NZD | JPMorgan | 12/18/2019 | — | (250) |
| 60,851 USD | 3,205,686 PHP | JPMorgan | 12/18/2019 | 279 | — |
| 628,953 USD | 2,478,000 PLN | JPMorgan | 12/18/2019 | — | (5,336) |
| 364,715 USD | 5,673,378 ZAR | JPMorgan | 12/18/2019 | 4,360 | — |
| 1,408,757 CAD | 950,000 EUR | Morgan Stanley | 09/18/2019 | — | (13,088) |
| 378,000 CAD | 2,462,961 NOK | Morgan Stanley | 09/18/2019 | — | (13,587) |
| 112,710,761 JPY | 1,049,495 USD | Morgan Stanley | 09/18/2019 | — | (12,575) |
| 7,981,077 NOK | 1,228,580 CAD | Morgan Stanley | 09/18/2019 | 46,802 | — |
| 801,717 USD | 702,605 EUR | Morgan Stanley | 09/18/2019 | — | (28,663) |
| 272,531 USD | 420,071 NZD | Morgan Stanley | 09/18/2019 | — | (7,737) |
| 932,865 CAD | 630,000 EUR | RBC Capital Markets | 09/18/2019 | — | (7,656) |
| 2,838,927 CAD | 2,152,433 USD | RBC Capital Markets | 09/18/2019 | 19,660 | — |
| 617,516 CAD | 462,041 USD | RBC Capital Markets | 09/18/2019 | — | (1,874) |
| 1,580,000 EUR | 2,329,512 CAD | RBC Capital Markets | 09/18/2019 | 11,647 | — |
| 2,662,201 USD | 3,506,953 CAD | RBC Capital Markets | 09/18/2019 | — | (27,567) |
| 25,100,775 JPY | 315,000 CAD | Standard Chartered | 09/18/2019 | 123 | — |
| 100,091,092 JPY | 945,000 USD | Standard Chartered | 09/18/2019 | 1,844 | — |
| 1,905,000 USD | 203,297,362 JPY | Standard Chartered | 09/18/2019 | 10,666 | — |
| 169,626 USD | 232,410 SGD | Standard Chartered | 09/18/2019 | — | (2,126) |
| 468,285 CAD | 315,000 EUR | State Street | 09/18/2019 | — | (5,220) |
| 68,211,700 JPY | 635,000 USD | State Street | 09/18/2019 | — | (7,757) |
| 21,721,728 MXN | 1,107,678 USD | State Street | 09/18/2019 | 26,476 | — |
| 665,326 USD | 13,105,847 MXN | State Street | 09/18/2019 | — | (12,981) |
| 389,428 USD | 532,369 SGD | State Street | 09/18/2019 | — | (5,745) |
| 470,756 CAD | 312,500 EUR | UBS | 09/18/2019 | — | (9,827) |
| 1,870,000 CAD | 12,132,000 NOK | UBS | 09/18/2019 | — | (72,977) |
| 100,066,730 JPY | 950,000 USD | UBS | 09/18/2019 | 7,074 | — |
| 14,247,948 NOK | 1,640,622 USD | UBS | 09/18/2019 | 76,449 | — |
| Total | | | | 2,941,103 | (2,468,749) |
| Long futures contracts |
| Description | Number of
contracts | Expiration
date | Trading
currency | Notional
amount | Value/Unrealized
appreciation ($) | Value/Unrealized
depreciation ($) |
| 3-Month Euro Euribor | 98 | 12/2019 | EUR | 24,638,425 | 16,311 | — |
| 3-Month Euro Euribor | 52 | 12/2019 | EUR | 13,073,450 | 9,609 | — |
| 3-Month Euro Euribor | 52 | 03/2020 | EUR | 13,079,950 | 19,084 | — |
| 3-Month Euro Euribor | 46 | 06/2020 | EUR | 11,575,325 | 23,965 | — |
| 3-Month Euro Euribor | 43 | 09/2020 | EUR | 10,824,175 | 30,431 | — |
| 3-Month Euro Euribor | 43 | 12/2020 | EUR | 10,826,325 | 37,878 | — |
| 3-Month Euro Euribor | 41 | 03/2021 | EUR | 10,321,750 | 33,571 | — |
| 3-Month Euro Euribor | 25 | 06/2021 | EUR | 6,293,125 | 15,816 | — |
| 3-Month Euro Swiss Franc | 5 | 12/2019 | CHF | 1,263,000 | 1,178 | — |
| 3-Month Euro Swiss Franc | 4 | 03/2020 | CHF | 1,010,800 | 1,989 | — |
| 3-Month Euro Swiss Franc | 3 | 06/2020 | CHF | 758,325 | 1,657 | — |
| 90-Day Euro$ | 247 | 12/2019 | USD | 60,601,450 | 80,716 | — |
| 90-Day Sterling | 252 | 12/2019 | GBP | 31,285,800 | 15,092 | — |
| 90-Day Sterling | 55 | 12/2019 | GBP | 6,828,250 | 4,202 | — |
| 90-Day Sterling | 41 | 03/2020 | GBP | 5,094,506 | 3,261 | — |
| 90-Day Sterling | 35 | 06/2020 | GBP | 4,350,719 | 4,332 | — |
| 90-Day Sterling | 34 | 09/2020 | GBP | 4,227,475 | 10,798 | — |
| 90-Day Sterling | 32 | 12/2020 | GBP | 3,978,200 | 13,437 | — |
| 90-Day Sterling | 30 | 03/2021 | GBP | 3,730,875 | 12,561 | — |
| 90-Day Sterling | 29 | 06/2021 | GBP | 3,606,513 | 11,215 | — |
| Amsterdam Index | 4 | 09/2019 | EUR | 446,456 | 17,512 | — |
| Amsterdam Index | 1 | 09/2019 | EUR | 111,614 | 3,285 | — |
| Australian 10-Year Bond | 66 | 09/2019 | AUD | 9,820,032 | 237,603 | — |
The accompanying Notes to Consolidated Financial Statements are an integral part of this statement.
| 44 | Multi-Manager Alternative Strategies Fund | Annual Report 2019 |
Consolidated Portfolio of Investments (continued)
August 31, 2019
| Long futures contracts (continued) |
| Description | Number of
contracts | Expiration
date | Trading
currency | Notional
amount | Value/Unrealized
appreciation ($) | Value/Unrealized
depreciation ($) |
| Australian 10-Year Bond | 10 | 09/2019 | AUD | 1,487,884 | 32,005 | — |
| Australian 3-Year Bond | 300 | 09/2019 | AUD | 34,741,248 | 133,268 | — |
| Australian 3-Year Bond | 184 | 09/2019 | AUD | 21,307,965 | 112,860 | — |
| Banker’s Acceptance | 14 | 12/2019 | CAD | 3,435,600 | — | (536) |
| Banker’s Acceptance | 10 | 03/2020 | CAD | 2,457,625 | — | (89) |
| CAC40 Index | 9 | 09/2019 | EUR | 493,020 | 20,528 | — |
| CAC40 Index | 16 | 09/2019 | EUR | 876,480 | 14,808 | — |
| Canadian Dollar | 177 | 09/2019 | USD | 13,290,045 | — | (249,624) |
| Canadian Government 10-Year Bond | 49 | 12/2019 | CAD | 7,108,920 | 18,861 | — |
| Canadian Government 10-Year Bond | 4 | 12/2019 | CAD | 580,320 | 3,269 | — |
| DJIA Mini E | 4 | 09/2019 | USD | 528,120 | — | (9,594) |
| DJIA Mini E | 5 | 09/2019 | USD | 660,150 | — | (16,083) |
| EURO STOXX 50 | 14 | 09/2019 | EUR | 478,660 | 4,439 | — |
| EURO STOXX 50 | 15 | 09/2019 | EUR | 512,850 | 670 | — |
| Euro-Bobl | 94 | 09/2019 | EUR | 12,805,620 | 239,662 | — |
| Euro-Bobl | 7 | 12/2019 | EUR | 956,900 | 975 | — |
| Euro-BTP | 11 | 09/2019 | EUR | 1,598,410 | 82,906 | — |
| Euro-Bund | 56 | 09/2019 | EUR | 10,029,600 | 488,074 | — |
| Euro-Buxl 30-Year | 13 | 09/2019 | EUR | 2,915,900 | 322,453 | — |
| Eurodollar 90-Day | 21 | 12/2019 | USD | 5,152,350 | 5,873 | — |
| Eurodollar 90-Day | 11 | 03/2020 | USD | 2,707,375 | 13,141 | — |
| Eurodollar 90-Day | 8 | 06/2020 | USD | 1,972,100 | 12,018 | — |
| Eurodollar 90-Day | 8 | 09/2020 | USD | 1,974,300 | 9,922 | — |
| Eurodollar 90-Day | 9 | 12/2020 | USD | 2,221,650 | 9,999 | — |
| Eurodollar 90-Day | 10 | 03/2021 | USD | 2,470,875 | 12,355 | — |
| Eurodollar 90-Day | 10 | 06/2021 | USD | 2,471,375 | 11,503 | — |
| Euro-OAT | 44 | 12/2019 | EUR | 7,578,120 | 4,047 | — |
| Euro-Schatz | 87 | 12/2019 | EUR | 9,803,595 | 1,572 | — |
| Euro-Schatz | 110 | 12/2019 | EUR | 12,395,350 | 747 | — |
| FTSE 100 Index | 2 | 09/2019 | GBP | 143,610 | — | (5,141) |
| FTSE China A50 Index | 54 | 09/2019 | USD | 731,565 | 4,382 | — |
| FTSE/MIB Index | 2 | 09/2019 | EUR | 213,200 | 2,409 | — |
| FTSE/MIB Index | 2 | 09/2019 | EUR | 213,200 | — | (8,029) |
| Gold 100 oz. | 62 | 12/2019 | USD | 9,482,280 | 511,900 | — |
| Indian Rupee | 11 | 09/2019 | USD | 306,944 | 1,316 | — |
| Japanese Yen | 101 | 09/2019 | USD | 11,894,013 | 96,231 | — |
| Long Gilt | 51 | 12/2019 | GBP | 6,848,280 | 84,786 | — |
| Mexican Peso | 49 | 09/2019 | USD | 1,220,100 | — | (48,674) |
| MSCI Singapore IX ETS | 4 | 09/2019 | SGD | 142,600 | 1,617 | — |
| MSCI Singapore IX ETS | 1 | 09/2019 | SGD | 35,650 | 398 | — |
| MSCI Taiwan Index | 10 | 09/2019 | USD | 390,900 | 9,231 | — |
| NASDAQ 100 E-mini | 4 | 09/2019 | USD | 615,260 | — | (22,820) |
| NASDAQ 100 E-mini | 8 | 09/2019 | USD | 1,230,520 | — | (25,034) |
| New Zealand Dollar | 86 | 09/2019 | USD | 5,413,700 | — | (355,111) |
| Nickel | 6 | 12/2019 | USD | 644,220 | 67,354 | — |
| Nickel | 1 | 12/2019 | USD | 107,370 | 13,185 | — |
| OMXS30 Index | 10 | 09/2019 | SEK | 1,574,750 | 6,363 | — |
| Platinum | 8 | 10/2019 | USD | 372,680 | 21,045 | — |
| S&P 500 E-mini | 4 | 09/2019 | USD | 584,960 | — | (12,245) |
| S&P 500 E-mini | 5 | 09/2019 | USD | 731,200 | — | (23,075) |
| S&P/TSX 60 Index | 4 | 09/2019 | CAD | 785,200 | 2,521 | — |
| S&P/TSX 60 Index | 3 | 09/2019 | CAD | 588,900 | 1,227 | — |
| Short Term Euro-BTP | 58 | 12/2019 | EUR | 6,511,660 | — | (13,151) |
| Silver | 21 | 12/2019 | USD | 1,925,910 | 109,329 | — |
| SPI 200 Index | 24 | 09/2019 | AUD | 3,942,600 | — | (18,284) |
| SPI 200 Index | 9 | 09/2019 | AUD | 1,478,475 | — | (18,670) |
| U.S. Long Bond | 39 | 12/2019 | USD | 6,444,750 | 40,641 | — |
| U.S. Treasury 10-Year Note | 79 | 12/2019 | USD | 10,405,781 | 39,347 | — |
The accompanying Notes to Consolidated Financial Statements are an integral part of this statement.
Multi-Manager Alternative Strategies Fund | Annual Report 2019
| 45 |
Consolidated Portfolio of Investments (continued)
August 31, 2019
| Long futures contracts (continued) |
| Description | Number of
contracts | Expiration
date | Trading
currency | Notional
amount | Value/Unrealized
appreciation ($) | Value/Unrealized
depreciation ($) |
| U.S. Treasury 2-Year Note | 200 | 12/2019 | USD | 43,223,438 | 1,209 | — |
| U.S. Treasury 5-Year Note | 134 | 12/2019 | USD | 16,076,859 | 39,314 | — |
| U.S. Ultra Treasury Bond | 17 | 12/2019 | USD | 3,356,438 | 31,280 | — |
| Total | | | | | 3,246,543 | (826,160) |
| Short futures contracts |
| Description | Number of
contracts | Expiration
date | Trading
currency | Notional
amount | Value/Unrealized
appreciation ($) | Value/Unrealized
depreciation ($) |
| Australian Dollar | (268) | 09/2019 | USD | (18,039,080) | 526,319 | — |
| Brent Crude | (12) | 09/2019 | USD | (711,000) | — | (2,189) |
| Brent Crude | (43) | 09/2019 | USD | (2,547,750) | — | (22,611) |
| British Pound | (173) | 09/2019 | USD | (13,149,081) | 313,884 | — |
| Canadian Dollar | (49) | 09/2019 | USD | (3,679,165) | 9,576 | — |
| Cocoa | (1) | 12/2019 | GBP | (17,090) | 150 | — |
| Cocoa | (12) | 12/2019 | USD | (266,640) | — | (2,005) |
| Coffee | (17) | 12/2019 | USD | (617,419) | 10,828 | — |
| Copper | (2) | 09/2019 | USD | (283,413) | 15,494 | — |
| Copper | (30) | 12/2019 | USD | (1,913,625) | 26,006 | — |
| Corn | (72) | 12/2019 | USD | (1,331,100) | 7,577 | — |
| Cotton | (17) | 12/2019 | USD | (500,055) | 63,879 | — |
| DAX Index | (2) | 09/2019 | EUR | (595,625) | — | (9,052) |
| Euro FX | (230) | 09/2019 | USD | (31,594,813) | 791,694 | — |
| Euro-BTP | (2) | 09/2019 | EUR | (290,620) | — | (6,754) |
| FTSE 100 Index | (2) | 09/2019 | GBP | (143,610) | — | (1,359) |
| FTSE/JSE Top 40 Index | (5) | 09/2019 | ZAR | (2,443,750) | 10,268 | — |
| FTSE/JSE Top 40 Index | (3) | 09/2019 | ZAR | (1,466,250) | — | (445) |
| Gas Oil | (60) | 10/2019 | USD | (3,373,500) | 5,938 | — |
| Gas Oil | (13) | 10/2019 | USD | (730,925) | 5,149 | — |
| Hang Seng Index | (7) | 09/2019 | HKD | (8,963,500) | — | (524) |
| Hang Seng Index | (1) | 09/2019 | HKD | (1,280,500) | — | (2,833) |
| H-Shares Index | (3) | 09/2019 | HKD | (1,511,550) | — | (4,624) |
| H-Shares Index | (14) | 09/2019 | HKD | (7,053,900) | — | (10,426) |
| IBEX 35 Index | (1) | 09/2019 | EUR | (87,965) | — | (1,562) |
| IBEX 35 Index | (1) | 09/2019 | EUR | (87,965) | — | (3,345) |
| KOSPI 200 Index | (12) | 09/2019 | KRW | (777,450,000) | 34,746 | — |
| Lean Hogs | (3) | 10/2019 | USD | (76,230) | 11,202 | — |
| Lean Hogs | (7) | 12/2019 | USD | (177,450) | 5,404 | — |
| Live Cattle | (14) | 12/2019 | USD | (580,580) | 3,736 | — |
| Lme Copper | (3) | 12/2019 | USD | (425,925) | 4,434 | — |
| Lme Copper | (1) | 12/2019 | USD | (141,975) | 725 | — |
| Lme Zinc | (6) | 12/2019 | USD | (330,600) | 4,780 | — |
| Lme Zinc | (2) | 12/2019 | USD | (110,200) | 2,595 | — |
| MSCI EAFE Index Future | (4) | 09/2019 | USD | (368,780) | — | (6,540) |
| MSCI Emerging Markets Index | (10) | 09/2019 | USD | (492,000) | — | (11,335) |
| Natural Gas | (163) | 09/2019 | USD | (3,724,550) | — | (246,422) |
| New Zealand Dollar | (106) | 09/2019 | USD | (6,672,700) | 165,602 | — |
| Nikkei 225 | (1) | 09/2019 | JPY | (20,690,000) | — | (3,308) |
| NY Harbor ULSD | (19) | 09/2019 | USD | (1,466,165) | — | (10,049) |
| OMXS30 Index | (3) | 09/2019 | SEK | (472,425) | — | (1,132) |
| Primary Aluminum | (1) | 09/2019 | USD | (43,313) | 978 | — |
| Primary Aluminum | (28) | 12/2019 | USD | (1,228,675) | 28,608 | — |
| RBOB Gasoline | (10) | 09/2019 | USD | (642,474) | 515 | — |
| Russell 2000 E-mini | (7) | 09/2019 | USD | (522,970) | 17,566 | — |
| Russell 2000 E-mini | (7) | 09/2019 | USD | (522,970) | — | (1,672) |
| S&P Mid 400 E-mini | (1) | 09/2019 | USD | (188,140) | — | (1,622) |
| S&P Mid 400 E-mini | (1) | 09/2019 | USD | (188,140) | — | (3,172) |
| South African Rand | (48) | 09/2019 | USD | (1,578,600) | — | (5,573) |
The accompanying Notes to Consolidated Financial Statements are an integral part of this statement.
| 46 | Multi-Manager Alternative Strategies Fund | Annual Report 2019 |
Consolidated Portfolio of Investments (continued)
August 31, 2019
| Short futures contracts (continued) |
| Description | Number of
contracts | Expiration
date | Trading
currency | Notional
amount | Value/Unrealized
appreciation ($) | Value/Unrealized
depreciation ($) |
| Soybean | (24) | 11/2019 | USD | (1,042,800) | 9,940 | — |
| Soybean Meal | (36) | 12/2019 | USD | (1,063,080) | 40,677 | — |
| Soybean Oil | (19) | 12/2019 | USD | (328,434) | — | (10,859) |
| Sugar #11 | (79) | 09/2019 | USD | (985,667) | 44,991 | — |
| Swiss Franc | (17) | 09/2019 | USD | (2,147,525) | 9,089 | — |
| TOPIX Index | (20) | 09/2019 | JPY | (302,000,000) | 78,147 | — |
| TOPIX Index | (3) | 09/2019 | JPY | (45,300,000) | — | (1,335) |
| U.S. Long Bond | (44) | 12/2019 | USD | (7,271,000) | — | (41,707) |
| U.S. Treasury 10-Year Note | (23) | 12/2019 | USD | (3,029,531) | — | (6,527) |
| U.S. Treasury 5-Year Note | (4) | 12/2019 | USD | (479,906) | — | (760) |
| U.S. Treasury 5-Year Note | (57) | 12/2019 | USD | (6,838,664) | — | (7,240) |
| U.S. Ultra Bond 10-Year Note | (35) | 12/2019 | USD | (5,055,313) | — | (6,465) |
| U.S. Ultra Treasury Bond | (14) | 12/2019 | USD | (2,764,125) | — | (26,280) |
| Wheat | (34) | 12/2019 | USD | (786,250) | 39,065 | — |
| Wheat | (5) | 12/2019 | USD | (99,313) | 6,309 | — |
| WTI Crude | (46) | 09/2019 | USD | (2,534,600) | 33,749 | — |
| Total | | | | | 2,329,620 | (459,727) |
| Call option contracts purchased |
| Description | Counterparty | Trading
currency | Notional
amount | Number of
contracts | Exercise
price/Rate | Expiration
date | Cost ($) | Value ($) |
| AbbVie, Inc. | Goldman Sachs | USD | 1,137,302 | 173 | 80.00 | 11/15/2019 | 19,425 | 1,384 |
| BB&T Corp. | Goldman Sachs | USD | 1,448,560 | 304 | 57.50 | 09/20/2019 | 14,840 | 2,736 |
| DXC Technology Co. | Goldman Sachs | USD | 438,504 | 132 | 55.00 | 09/20/2019 | 41,863 | 330 |
| Nielsen Holdings PLC | Goldman Sachs | USD | 193,068 | 93 | 22.00 | 11/15/2019 | 5,903 | 6,510 |
| Nielsen Holdings PLC | Goldman Sachs | USD | 193,068 | 93 | 24.00 | 11/15/2019 | 7,439 | 2,093 |
| QEP Resources, Inc. | Goldman Sachs | USD | 33,464 | 94 | 6.00 | 09/20/2019 | 3,368 | 470 |
| Total | | | | | | | 92,838 | 13,523 |
| Put option contracts purchased |
| Description | Counterparty | Trading
currency | Notional
amount | Number of
contracts | Exercise
price/Rate | Expiration
date | Cost ($) | Value ($) |
| Avaya Holdings Corp. | Goldman Sachs | USD | 920,624 | 652 | 12.50 | 09/20/2019 | 37,456 | 45,640 |
| Avaya Holdings Corp. | Goldman Sachs | USD | 317,700 | 225 | 10.00 | 09/20/2019 | 11,420 | 6,750 |
| Exact Sciences Corp. | Goldman Sachs | USD | 178,830 | 15 | 100.00 | 10/18/2019 | 5,833 | 1,763 |
| iShares Russell 2000 ETF | Goldman Sachs | USD | 1,845,616 | 124 | 147.00 | 12/20/2019 | 62,275 | 75,454 |
| iShares Russell 2000 ETF | Goldman Sachs | USD | 1,845,616 | 124 | 145.00 | 12/20/2019 | 80,577 | 66,526 |
| LiveRamp Holdings, Inc. | Goldman Sachs | USD | 232,980 | 55 | 45.00 | 09/20/2019 | 9,905 | 17,600 |
| LiveRamp Holdings, Inc. | Goldman Sachs | USD | 84,720 | 20 | 40.00 | 11/15/2019 | 2,869 | 4,000 |
| LogMeIn, Inc. | Goldman Sachs | USD | 588,192 | 88 | 70.00 | 09/20/2019 | 39,394 | 33,440 |
| Masco Corp. | Goldman Sachs | USD | 236,234 | 58 | 38.00 | 10/18/2019 | 4,398 | 4,060 |
| Mellanox Technologies Ltd. | Goldman Sachs | USD | 1,145,435 | 107 | 105.00 | 12/20/2019 | 30,085 | 64,735 |
| Mellanox Technologies Ltd. | Goldman Sachs | USD | 1,338,125 | 125 | 100.00 | 12/20/2019 | 52,869 | 40,000 |
| Perspecta, Inc. | Goldman Sachs | USD | 101,205 | 39 | 22.50 | 09/20/2019 | 2,720 | 488 |
| Quad/Graphics, Inc. | Goldman Sachs | USD | 151,931 | 169 | 10.00 | 10/18/2019 | 11,799 | 22,392 |
| Quad/Graphics, Inc. | Goldman Sachs | USD | 286,781 | 319 | 7.50 | 10/18/2019 | 14,485 | 7,177 |
| Spark Therapeutics, Inc. | Goldman Sachs | USD | 77,928 | 8 | 80.00 | 12/20/2019 | 5,234 | 3,800 |
| Symantec Corp. | Goldman Sachs | USD | 106,950 | 46 | 20.00 | 01/17/2020 | 2,565 | 1,909 |
| WellCare Health Plans, Inc. | Goldman Sachs | USD | 1,055,886 | 39 | 250.00 | 09/20/2019 | 39,885 | 2,535 |
| Wyndham Hotels & Resorts, Inc. | Goldman Sachs | USD | 333,970 | 65 | 52.50 | 11/15/2019 | 9,557 | 21,450 |
| Total | | | | | | | 423,326 | 419,719 |
The accompanying Notes to Consolidated Financial Statements are an integral part of this statement.
Multi-Manager Alternative Strategies Fund | Annual Report 2019
| 47 |
Consolidated Portfolio of Investments (continued)
August 31, 2019
| Call option contracts written |
| Description | Counterparty | Trading
currency | Notional
amount | Number of
contracts | Exercise
price/Rate | Expiration
date | Premium
received ($) | Value ($) |
| Exact Sciences Corp. | Goldman Sachs | USD | (178,830) | (15) | 120.00 | 10/18/2019 | (6,887) | (9,825) |
| LiveRamp Holdings, Inc. | Goldman Sachs | USD | (84,720) | (20) | 50.00 | 9/20/2019 | (2,243) | (100) |
| Mellanox Technologies Ltd. | Goldman Sachs | USD | (267,625) | (25) | 115.00 | 9/20/2019 | (6,272) | (375) |
| Rent-A-Center, Inc. | Goldman Sachs | USD | (30,636) | (12) | 27.00 | 9/20/2019 | (590) | (360) |
| Total | | | | | | | (15,992) | (10,660) |
| Put option contracts written |
| Description | Counterparty | Trading
currency | Notional
amount | Number of
contracts | Exercise
price/Rate | Expiration
date | Premium
received ($) | Value ($) |
| iShares Russell 2000 ETF | Goldman Sachs | USD | (1,845,616) | (124) | 135.00 | 12/20/2019 | (43,473) | (34,162) |
| iShares Russell 2000 ETF | Goldman Sachs | USD | (1,845,616) | (124) | 137.00 | 12/20/2019 | (32,307) | (39,246) |
| Nielsen Holdings PLC | Goldman Sachs | USD | (193,068) | (93) | 20.00 | 11/15/2019 | (6,850) | (7,905) |
| WellCare Health Plans, Inc. | Goldman Sachs | USD | (1,055,886) | (39) | 220.00 | 09/20/2019 | (10,134) | (9,360) |
| Total | | | | | | | (92,764) | (90,673) |
| Total return swap contracts on futures |
| Reference instrument* | Counterparty | Expiration
date | Trading
currency | Notional amount
long(short) | Upfront
payments ($) | Upfront
receipts ($) | Value/Unrealized
appreciation
($) | Value/Unrealized
depreciation
($) |
| Euro-Bobl Dec 19 | Barclays | 12/2019 | EUR | 28,707,000 | — | — | 29,650 | — |
| Euro-Bund Dec 19 | Barclays | 12/2019 | EUR | 3,878,160 | — | — | — | (528) |
| Euro-Schatz Dec 19 | Barclays | 12/2019 | EUR | 47,778,440 | — | — | 4,742 | — |
| Japanese 10-Year Government Bond Sep 19 | Barclays | 09/2019 | JPY | 465,600,000 | — | — | 50,300 | — |
| Long Gilt Dec 19 | Barclays | 12/2019 | GBP | 2,282,760 | — | — | 12,676 | — |
| Coffee Dec 19 | Citi | 12/2019 | USD | (145,275) | — | — | 5,029 | — |
| Corn Dec 19 | Citi | 12/2019 | USD | (55,463) | — | — | 415 | — |
| Cotton Dec 19 | Citi | 12/2019 | USD | (117,660) | — | — | 13,596 | — |
| Primary Aluminum Dec 19 | Citi | 12/2019 | USD | (131,644) | — | — | — | (281) |
| Primary Aluminum Sep 19 | Citi | 09/2019 | USD | (129,938) | — | — | 3,794 | — |
| Soybean Meal Dec 19 | Citi | 12/2019 | USD | (472,480) | — | — | 46,633 | — |
| Soybean Nov 19 | Citi | 11/2019 | USD | (1,042,800) | — | — | 15,516 | — |
| Soybean Oil Dec 19 | Citi | 12/2019 | USD | (51,858) | — | — | — | (234) |
| Swiss Market Index Sep 19 | JPMorgan | 09/2019 | CHF | 592,740 | — | — | — | (3,177) |
| Total | | | | | — | — | 182,351 | (4,220) |
| * | If the notional amount of the swap contract is long and the swap contract’s value is positive (negative), the Fund will receive (pay) the total return. If the notional amount of the swap contract is short and the swap contract’s value is positive (negative), the Fund will pay (receive) the total return. Receipts and payments occur upon termination of the contract. |
Notes to Consolidated Portfolio of Investments
| (a) | Represents privately placed and other securities and instruments exempt from Securities and Exchange Commission registration (collectively, private placements), such as Section 4(a)(2) and Rule 144A eligible securities, which are often sold only to qualified institutional buyers. The Fund may invest in private placements determined to be liquid as well as those determined to be illiquid. Private placements may be determined to be liquid under guidelines established by the Fund’s Board of Trustees. At August 31, 2019, the total value of these securities amounted to $77,194,925, which represents 15.32% of total net assets. |
| (b) | Variable rate security. The interest rate shown was the current rate as of August 31, 2019. |
| (c) | Variable or floating rate security, the interest rate of which adjusts periodically based on changes in current interest rates and prepayments on the underlying pool of assets. The interest rate shown was the current rate as of August 31, 2019. |
| (d) | Represents interest only securities which have the right to receive the monthly interest payments on an underlying pool of mortgage loans. |
| (e) | Non-income producing investment. |
| (f) | This security or a portion of this security has been pledged as collateral in connection with derivative contracts. |
| (g) | This security or a portion of this security has been pledged as collateral in connection with investments sold short. |
| (h) | Represents fair value as determined in good faith under procedures approved by the Board of Trustees. At August 31, 2019, the total value of these securities amounted to $1,677,172, which represents 0.33% of total net assets. |
| (i) | Valuation based on significant unobservable inputs. |
The accompanying Notes to Consolidated Financial Statements are an integral part of this statement.
| 48 | Multi-Manager Alternative Strategies Fund | Annual Report 2019 |
Consolidated Portfolio of Investments (continued)
August 31, 2019
Notes to Consolidated Portfolio of Investments (continued)
| (j) | Zero coupon bond. |
| (k) | Principal amounts are denominated in United States Dollars unless otherwise noted. |
| (l) | Represents a variable rate security with a step coupon where the rate adjusts according to a schedule for a series of periods, typically lower for an initial period and then increasing to a higher coupon rate thereafter. The interest rate shown was the current rate as of August 31, 2019. |
| (m) | Principal and interest may not be guaranteed by the government. |
| (n) | Represents a security purchased on a when-issued basis. |
| (o) | The rate shown is the seven-day current annualized yield at August 31, 2019. |
| (p) | As defined in the Investment Company Act of 1940, an affiliated company is one in which the Fund owns 5% or more of the company’s outstanding voting securities, or a company which is under common ownership or control with the Fund. Holdings and transactions in these affiliated companies during the year ended August 31, 2019 are as follows: |
| Issuer | Beginning
shares | Shares
purchased | Shares
sold | Ending
shares | Realized gain
(loss) —
affiliated
issuers ($) | Net change in
unrealized
appreciation
(depreciation) —
affiliated
issuers ($) | Dividends —
affiliated
issuers ($) | Value —
affiliated
issuers
at end of
period ($) |
| Columbia Short-Term Cash Fund, 2.208% |
| | 129,624,362 | 542,498,823 | (549,236,710) | 122,886,475 | (919) | 965 | 2,716,126 | 122,874,186 |
Abbreviation Legend
| CMO | Collateralized Mortgage Obligation |
| CVR | Contingent Value Rights |
| FGIC | Financial Guaranty Insurance Corporation |
Currency Legend
| AUD | Australian Dollar |
| BRL | Brazilian Real |
| CAD | Canada Dollar |
| CHF | Swiss Franc |
| CLP | Chilean Peso |
| COP | Colombian Peso |
| EUR | Euro |
| GBP | British Pound |
| HKD | Hong Kong Dollar |
| HUF | Hungarian Forint |
| IDR | Indonesian Rupiah |
| ILS | New Israeli Sheqel |
| INR | Indian Rupee |
| JPY | Japanese Yen |
| KRW | South Korean Won |
| MXN | Mexican Peso |
| MYR | Malaysian Ringgit |
| NOK | Norwegian Krone |
| NZD | New Zealand Dollar |
| PHP | Philippine Peso |
| PLN | Polish Zloty |
| SEK | Swedish Krona |
| SGD | Singapore Dollar |
| TWD | New Taiwan Dollar |
| USD | US Dollar |
The accompanying Notes to Consolidated Financial Statements are an integral part of this statement.
Multi-Manager Alternative Strategies Fund | Annual Report 2019
| 49 |
Consolidated Portfolio of Investments (continued)
August 31, 2019
Currency Legend (continued)
Fair value measurements
The Fund categorizes its fair value measurements according to a three-level hierarchy that maximizes the use of observable inputs and minimizes the use of unobservable inputs by prioritizing that the most observable input be used when available. Observable inputs are those that market participants would use in pricing an investment based on market data obtained from sources independent of the reporting entity. Unobservable inputs are those that reflect the Fund’s assumptions about the information market participants would use in pricing an investment. An investment’s level within the fair value hierarchy is based on the lowest level of any input that is deemed significant to the asset’s or liability’s fair value measurement. The input levels are not necessarily an indication of the risk or liquidity associated with investments at that level. For example, certain U.S. government securities are generally high quality and liquid, however, they are reflected as Level 2 because the inputs used to determine fair value may not always be quoted prices in an active market.
Fair value inputs are summarized in the three broad levels listed below:
| ■ | Level 1 — Valuations based on quoted prices for investments in active markets that the Fund has the ability to access at the measurement date. Valuation adjustments are not applied to Level 1 investments. |
| ■ | Level 2 — Valuations based on other significant observable inputs (including quoted prices for similar securities, interest rates, prepayment speeds, credit risks, etc.). |
| ■ | Level 3 — Valuations based on significant unobservable inputs (including the Fund’s own assumptions and judgment in determining the fair value of investments). |
Inputs that are used in determining fair value of an investment may include price information, credit data, volatility statistics, and other factors. These inputs can be either observable or unobservable. The availability of observable inputs can vary between investments, and is affected by various factors such as the type of investment, and the volume and level of activity for that investment or similar investments in the marketplace. The inputs will be considered by the Investment Manager, along with any other relevant factors in the calculation of an investment’s fair value. The Fund uses prices and inputs that are current as of the measurement date, which may include periods of market dislocations. During these periods, the availability of prices and inputs may be reduced for many investments. This condition could cause an investment to be reclassified between the various levels within the hierarchy.
Foreign equity securities actively traded in markets where there is a significant delay in the local close relative to the New York Stock Exchange are classified as Level 2. The values of these securities may include an adjustment to reflect the impact of significant market movements following the close of local trading, as described in Note 2 to the consolidated financial statements – Security valuation.
Investments falling into the Level 3 category are primarily supported by quoted prices from brokers and dealers participating in the market for those investments. However, these may be classified as Level 3 investments due to lack of market transparency and corroboration to support these quoted prices. Additionally, valuation models may be used as the pricing source for any remaining investments classified as Level 3. These models may rely on one or more significant unobservable inputs and/or significant assumptions by the Investment Manager. Inputs used in valuations may include, but are not limited to, financial statement analysis, capital account balances, discount rates and estimated cash flows, and comparable company data.
Under the direction of the Fund’s Board of Trustees (the Board), the Investment Manager’s Valuation Committee (the Committee) is responsible for overseeing the valuation procedures approved by the Board. The Committee consists of voting and non-voting members from various groups within the Investment Manager’s organization, including operations and accounting, trading and investments, compliance, risk management and legal.
The Committee meets at least monthly to review and approve valuation matters, which may include a description of specific valuation determinations, data regarding pricing information received from approved pricing vendors and brokers and the results of Board-approved valuation control policies and procedures (the Policies). The Policies address, among other things, instances when market quotations are or are not readily available, including recommendations of third party pricing vendors and a determination of appropriate pricing methodologies; events that require specific valuation determinations and assessment of fair value techniques; securities with a potential for stale pricing, including those that are illiquid, restricted, or in default; and the effectiveness of third party pricing vendors, including periodic reviews of vendors. The Committee meets more frequently, as needed, to discuss additional valuation matters, which may include the need to review back-testing results, review time-sensitive information or approve related valuation actions. The Committee reports to the Board, with members of the Committee meeting with the Board at each of its regularly scheduled meetings to discuss valuation matters and actions during the period, similar to those described earlier.
The following table is a summary of the inputs used to value the Fund’s investments at August 31, 2019:
| | Level 1 ($) | Level 2 ($) | Level 3 ($) | Total ($) |
| Investments in Securities | | | | |
| Asset-Backed Securities — Non-Agency | — | 24,782,435 | — | 24,782,435 |
| Commercial Mortgage-Backed Securities - Agency | — | 16,624,444 | — | 16,624,444 |
| Commercial Mortgage-Backed Securities - Non-Agency | — | 11,363,291 | — | 11,363,291 |
| Common Stocks | | | | |
| Communication Services | 4,717,705 | 3,209,442 | — | 7,927,147 |
| Consumer Discretionary | 12,803,935 | 2,612,717 | — | 15,416,652 |
| Consumer Staples | — | 454,626 | 31,764 | 486,390 |
| Financials | 787,575 | — | — | 787,575 |
| Health Care | 33,223,843 | — | 8 | 33,223,851 |
| Industrials | 8,579,791 | 815,193 | — | 9,394,984 |
| Information Technology | 15,650,846 | 544,484 | 1,719,880 | 17,915,210 |
| Materials | 612,568 | — | — | 612,568 |
| Real Estate | — | 230,651 | — | 230,651 |
| Utilities | 611,706 | — | — | 611,706 |
| Total Common Stocks | 76,987,969 | 7,867,113 | 1,751,652 | 86,606,734 |
The accompanying Notes to Consolidated Financial Statements are an integral part of this statement.
| 50 | Multi-Manager Alternative Strategies Fund | Annual Report 2019 |
Consolidated Portfolio of Investments (continued)
August 31, 2019
Fair value measurements (continued)
| | Level 1 ($) | Level 2 ($) | Level 3 ($) | Total ($) |
| Convertible Bonds | — | 4,261,375 | — | 4,261,375 |
| Convertible Preferred Stocks | | | | |
| Health Care | — | 477,169 | — | 477,169 |
| Industrials | — | 655,856 | — | 655,856 |
| Real Estate | — | 338,026 | — | 338,026 |
| Utilities | 174,703 | 1,418,498 | — | 1,593,201 |
| Total Convertible Preferred Stocks | 174,703 | 2,889,549 | — | 3,064,252 |
| Corporate Bonds & Notes | — | 96,768,329 | — | 96,768,329 |
| Foreign Government Obligations | — | 32,738,515 | — | 32,738,515 |
| Limited Partnerships | | | | |
| Energy | 6,853,815 | — | — | 6,853,815 |
| Financials | 2,475,963 | — | — | 2,475,963 |
| Total Limited Partnerships | 9,329,778 | — | — | 9,329,778 |
| Municipal Bonds | — | 1,887,354 | — | 1,887,354 |
| Preferred Debt | 224,004 | — | — | 224,004 |
| Preferred Stocks | | | | |
| Financials | 800,601 | — | — | 800,601 |
| Total Preferred Stocks | 800,601 | — | — | 800,601 |
| Residential Mortgage-Backed Securities - Agency | — | 2,603,467 | — | 2,603,467 |
| Residential Mortgage-Backed Securities - Non-Agency | — | 40,551,635 | — | 40,551,635 |
| Treasury Bills | 27,300,596 | — | — | 27,300,596 |
| U.S. Government & Agency Obligations | — | 855,949 | — | 855,949 |
| U.S. Treasury Obligations | 11,268,306 | — | — | 11,268,306 |
| Warrants | | | | |
| Information Technology | — | — | 17,490 | 17,490 |
| Total Warrants | — | — | 17,490 | 17,490 |
| Options Purchased Calls | 13,523 | — | — | 13,523 |
| Options Purchased Puts | 419,719 | — | — | 419,719 |
| Money Market Funds | 122,874,186 | — | — | 122,874,186 |
| Total Investments in Securities | 249,393,385 | 243,193,456 | 1,769,142 | 494,355,983 |
| Investments in securities sold short | | | | |
| Common Stocks | | | | |
| Communication Services | (805,828) | — | — | (805,828) |
| Consumer Discretionary | (2,038,458) | — | — | (2,038,458) |
| Consumer Staples | (143,224) | — | — | (143,224) |
| Financials | (1,317,139) | — | — | (1,317,139) |
| Health Care | (12,121,897) | — | — | (12,121,897) |
| Industrials | (1,032,381) | — | — | (1,032,381) |
| Information Technology | (2,610,830) | — | — | (2,610,830) |
| Materials | (89,851) | — | — | (89,851) |
| Total Common Stocks | (20,159,608) | — | — | (20,159,608) |
| Exchange-Traded Funds | (1,527,318) | — | — | (1,527,318) |
| Rights | | | | |
| Health Care | — | — | (91,970) | (91,970) |
| Total Rights | — | — | (91,970) | (91,970) |
| Total Investments in Securities Sold Short | (21,686,926) | — | (91,970) | (21,778,896) |
| Total Investments in Securities, Net of Securities Sold Short | 227,706,459 | 243,193,456 | 1,677,172 | 472,577,087 |
| Investments in Derivatives | | | | |
| Asset | | | | |
| Forward Foreign Currency Exchange Contracts | — | 2,941,103 | — | 2,941,103 |
| Futures Contracts | 5,576,163 | — | — | 5,576,163 |
| Swap Contracts | — | 182,351 | — | 182,351 |
The accompanying Notes to Consolidated Financial Statements are an integral part of this statement.
Multi-Manager Alternative Strategies Fund | Annual Report 2019
| 51 |
Consolidated Portfolio of Investments (continued)
August 31, 2019
Fair value measurements (continued)
| | Level 1 ($) | Level 2 ($) | Level 3 ($) | Total ($) |
| Liability | | | | |
| Forward Foreign Currency Exchange Contracts | — | (2,468,749) | — | (2,468,749) |
| Futures Contracts | (1,285,887) | — | — | (1,285,887) |
| Options Contracts Written | (101,333) | — | — | (101,333) |
| Swap Contracts | — | (4,220) | — | (4,220) |
| Total | 231,895,402 | 243,843,941 | 1,677,172 | 477,416,515 |
See the Consolidated Portfolio of Investments for all investment classifications not indicated in the table.
The Fund’s assets assigned to the Level 2 input category are generally valued using the market approach, in which a security’s value is determined through reference to prices and information from market transactions for similar or identical assets. These assets include certain foreign securities for which a third party statistical pricing service may be employed for purposes of fair market valuation. The model utilized by such third party statistical pricing service takes into account a security’s correlation to available market data including, but not limited to, intraday index, ADR, and exchange-traded fund movements.
Forward foreign currency exchange contracts, futures contracts and swap contracts are valued at unrealized appreciation (depreciation).
The following table is a reconciliation of Level 3 assets for which significant observable and unobservable inputs were used to determine fair value:
| | Balance
as of
08/31/2018
($) | Increase
(decrease)
in accrued
discounts/
premiums
($) | Realized
gain (loss)
($) | Change
in unrealized
appreciation
(depreciation)(a)
($) | Purchases
($) | Sales
($) | Transfers
into
Level 3
($) | Transfers
out of
Level 3
($) | Balance
as of
08/31/2019
($) |
| Common Stocks | 7,285,304 | — | (7,143,008) | 7,519,783 | 1,750,965 | (7,661,392) | — | — | 1,751,652 |
| Warrants | 43,662 | — | 1,561 | (26,172) | — | (1,561) | — | — | 17,490 |
| Rights | — | — | — | 15,423 | (107,393) | — | — | — | (91,970) |
| Total | 7,328,966 | — | (7,141,447) | 7,509,034 | 1,643,572 | (7,662,953) | — | — | 1,677,172 |
(a) Change in unrealized appreciation (depreciation) relating to securities held at August 31, 2019 was $(30,921), which is comprised of Common Stocks of $(20,172), Warrants of $(26,172) and Rights of $15,423.
The Fund’s assets assigned to the Level 3 category are valued utilizing the valuation technique deemed the most appropriate in the circumstances. Certain common stocks, rights and warrants classified as Level 3 are valued using the market approach. To determine fair value for these securities, management considered various factors which may have included, but were not limited to, estimated cash flows of the securities, observed yields on securities deemed comparable, the subscription price of the security, closing prices of similar securities from the issuer and single market quotations from broker dealers. Significant increases (decreases) to any of these inputs would have resulted in a significantly higher (lower) fair value measurement.
The accompanying Notes to Consolidated Financial Statements are an integral part of this statement.
| 52 | Multi-Manager Alternative Strategies Fund | Annual Report 2019 |
Consolidated Statement of Assets and Liabilities
August 31, 2019
| Assets | |
| Investments in securities, at value | |
| Unaffiliated issuers (cost $367,802,817) | $371,048,555 |
| Affiliated issuers (cost $122,874,715) | 122,874,186 |
| Options purchased (cost $516,164) | 433,242 |
| Foreign currency (cost $444,435) | 441,961 |
| Cash collateral held at broker for: | |
| Forward foreign currency exchange contracts | 330,000 |
| Swap contracts | 140,000 |
| Other(a) | 20,051,536 |
| Margin deposits on: | |
| Futures contracts | 7,089,346 |
| Unrealized appreciation on forward foreign currency exchange contracts | 2,941,103 |
| Unrealized appreciation on swap contracts | 182,351 |
| Receivable for: | |
| Investments sold | 6,234,670 |
| Investments sold on a delayed delivery basis | 1,562,959 |
| Capital shares sold | 435,348 |
| Dividends | 281,211 |
| Interest | 1,882,692 |
| Foreign tax reclaims | 23,903 |
| Variation margin for futures contracts | 1,029,729 |
| Prepaid expenses | 3,254 |
| Trustees’ deferred compensation plan | 55,883 |
| Total assets | 537,041,929 |
| Liabilities | |
| Securities sold short, at value (proceeds $22,308,562) | 21,778,896 |
| Option contracts written, at value (premiums received $108,756) | 101,333 |
| Due to custodian | 27,199 |
| Unrealized depreciation on forward foreign currency exchange contracts | 2,468,749 |
| Unrealized depreciation on swap contracts | 4,220 |
| Cash collateral due to broker for: | |
| Foreign forward currency exchange contracts | 40,000 |
| Swap contracts | 482,088 |
| Payable for: | |
| Investments purchased | 4,487,355 |
| Investments purchased on a delayed delivery basis | 2,344,863 |
| Capital shares purchased | 995,130 |
| Dividends and interest on securities sold short | 6,963 |
| Variation margin for futures contracts | 305,502 |
| Management services fees | 15,166 |
| Distribution and/or service fees | 7 |
| Transfer agent fees | 43,925 |
| Compensation of chief compliance officer | 33 |
| Other expenses | 102,058 |
| Trustees’ deferred compensation plan | 55,883 |
| Total liabilities | 33,259,370 |
| Net assets applicable to outstanding capital stock | $503,782,559 |
| Represented by | |
| Paid in capital | 571,785,939 |
| Total distributable earnings (loss) (Note 2) | (68,003,380) |
| Total - representing net assets applicable to outstanding capital stock | $503,782,559 |
The accompanying Notes to Consolidated Financial Statements are an integral part of this statement.
Multi-Manager Alternative Strategies Fund | Annual Report 2019
| 53 |
Consolidated Statement of Assets and Liabilities (continued)
August 31, 2019
| Class A | |
| Net assets | $1,056,367 |
| Shares outstanding | 113,283 |
| Net asset value per share | $9.33 |
| Institutional Class | |
| Net assets | $502,726,192 |
| Shares outstanding | 53,733,327 |
| Net asset value per share | $9.36 |
| (a) | Includes collateral related to options purchased, options contracts written, forward foreign currency exchange contracts, swap contracts and securities sold short. |
The accompanying Notes to Consolidated Financial Statements are an integral part of this statement.
| 54 | Multi-Manager Alternative Strategies Fund | Annual Report 2019 |
Consolidated Statement of Operations
Year Ended August 31, 2019
| Net investment income | |
| Income: | |
| Dividends — unaffiliated issuers | $4,793,253 |
| Dividends — affiliated issuers | 2,716,126 |
| Interest | 11,774,567 |
| Foreign taxes withheld | (42,498) |
| Total income | 19,241,448 |
| Expenses: | |
| Management services fees | 5,705,412 |
| Distribution and/or service fees | |
| Class A | 2,902 |
| Transfer agent fees | |
| Class A | 1,300 |
| Institutional Class | 580,529 |
| Compensation of board members | 21,192 |
| Custodian fees | 89,041 |
| Printing and postage fees | 73,286 |
| Registration fees | 50,497 |
| Audit fees | 61,066 |
| Legal fees | 10,615 |
| Compensation of chief compliance officer | 206 |
| Other | 30,337 |
| Total expenses | 6,626,383 |
| Net investment income | 12,615,065 |
| Realized and unrealized gain (loss) — net | |
| Net realized gain (loss) on: | |
| Investments — unaffiliated issuers | (3,110,872) |
| Investments — affiliated issuers | (919) |
| Foreign currency translations | (93,244) |
| Forward foreign currency exchange contracts | 561,987 |
| Futures contracts | 2,787,847 |
| Options purchased | (411,154) |
| Options contracts written | 114,486 |
| Securities sold short | 67,993 |
| Swap contracts | 1,600,122 |
| Net realized gain | 1,516,246 |
| Net change in unrealized appreciation (depreciation) on: | |
| Investments — unaffiliated issuers | 6,229,472 |
| Investments — affiliated issuers | 965 |
| Foreign currency translations | (7,192) |
| Forward foreign currency exchange contracts | 24,057 |
| Futures contracts | (1,146,807) |
| Options purchased | 93,528 |
| Options contracts written | (4,652) |
| Securities sold short | 2,275,052 |
| Swap contracts | (357,207) |
| Net change in unrealized appreciation (depreciation) | 7,107,216 |
| Net realized and unrealized gain | 8,623,462 |
| Net increase in net assets resulting from operations | $21,238,527 |
The accompanying Notes to Consolidated Financial Statements are an integral part of this statement.
Multi-Manager Alternative Strategies Fund | Annual Report 2019
| 55 |
Consolidated Statement of Changes in Net Assets
| | Year Ended
August 31, 2019 | Year Ended
August 31, 2018 |
| Operations | | |
| Net investment income | $12,615,065 | $6,815,482 |
| Net realized gain | 1,516,246 | 1,443,499 |
| Net change in unrealized appreciation (depreciation) | 7,107,216 | (5,016,800) |
| Net increase in net assets resulting from operations | 21,238,527 | 3,242,181 |
| Distributions to shareholders | | |
| Net investment income and net realized gains | | |
| Class A | (14,374) | — |
| Institutional Class | (7,632,087) | — |
| Total distributions to shareholders (Note 2) | (7,646,461) | — |
| Decrease in net assets from capital stock activity | (81,974,091) | (11,270,175) |
| Total decrease in net assets | (68,382,025) | (8,027,994) |
| Net assets at beginning of year | 572,164,584 | 580,192,578 |
| Net assets at end of year | $503,782,559 | $572,164,584 |
| Excess of distributions over net investment income | $(37,951,514) | $(47,854,115) |
| | Year Ended | Year Ended |
| | August 31, 2019 | August 31, 2018 |
| | Shares | Dollars ($) | Shares | Dollars ($) |
| Capital stock activity |
| Class A | | | | |
| Subscriptions | 675 | 5,980 | — | — |
| Distributions reinvested | 1,647 | 14,348 | — | — |
| Redemptions | (35,401) | (317,926) | (70,043) | (633,963) |
| Net decrease | (33,079) | (297,598) | (70,043) | (633,963) |
| Institutional Class | | | | |
| Subscriptions | 5,755,311 | 51,641,302 | 10,247,779 | 93,115,640 |
| Distributions reinvested | 875,236 | 7,632,052 | — | — |
| Redemptions | (15,733,365) | (140,949,847) | (11,423,931) | (103,751,852) |
| Net decrease | (9,102,818) | (81,676,493) | (1,176,152) | (10,636,212) |
| Total net decrease | (9,135,897) | (81,974,091) | (1,246,195) | (11,270,175) |
The accompanying Notes to Consolidated Financial Statements are an integral part of this statement.
| 56 | Multi-Manager Alternative Strategies Fund | Annual Report 2019 |
[THIS PAGE INTENTIONALLY LEFT BLANK]
Multi-Manager Alternative Strategies Fund | Annual Report 2019
| 57 |
Consolidated Financial Highlights
The following table is intended to help you understand the Fund’s financial performance. Certain information reflects financial results for a single share of a class held for the periods shown. Per share net investment income (loss) amounts are calculated based on average shares outstanding during the period. Total return assumes reinvestment of all dividends and distributions, if any. Total return does not reflect payment of sales charges, if any. Total return and portfolio turnover are not annualized for periods of less than one year. The portfolio turnover rate is calculated without regard to purchase and sales transactions of short-term instruments and certain derivatives, if any. If such transactions were included, the Fund’s portfolio turnover rate may be higher.
| | Net asset value,
beginning of
period | Net
investment
income
(loss) | Net
realized
and
unrealized
gain (loss) | Total from
investment
operations | Distributions
from net
investment
income | Distributions
from net
realized
gains | Total
distributions to
shareholders |
| Class A |
| Year Ended 8/31/2019 | $9.05 | 0.20 | 0.19 | 0.39 | (0.11) | — | (0.11) |
| Year Ended 8/31/2018 | $9.03 | 0.08 | (0.06) | 0.02 | — | — | — |
| Year Ended 8/31/2017 | $9.45 | (0.07) | (0.35) | (0.42) | — | — | — |
| Year Ended 8/31/2016 | $10.07 | (0.05) | 0.10 | 0.05 | (0.67) | — | (0.67) |
| Year Ended 8/31/2015 | $10.88 | 0.03(d) | (0.26) | (0.23) | (0.10) | (0.48) | (0.58) |
| Institutional Class |
| Year Ended 8/31/2019 | $9.08 | 0.22 | 0.19 | 0.41 | (0.13) | — | (0.13) |
| Year Ended 8/31/2018 | $9.03 | 0.11 | (0.06) | 0.05 | — | — | — |
| Year Ended 8/31/2017(e) | $9.10 | 0.02 | (0.09) | (0.07) | — | — | — |
| Notes to Consolidated Financial Highlights |
| (a) | In addition to the fees and expenses that the Fund bears directly, the Fund indirectly bears a pro rata share of the fees and expenses of any other funds in which it invests. Such indirect expenses are not included in the Fund’s reported expense ratios. |
| (b) | Total net expenses include the impact of certain fee waivers/expense reimbursements made by the Investment Manager and certain of its affiliates, if applicable. |
| (c) | Ratios include dividends and interest on securities sold short. If dividends and interest on securities sold short had been excluded, expenses would have been lower by: |
| Class | 8/31/2019 | 8/31/2018 | 8/31/2017 | 8/31/2016 | 8/31/2015 |
| Class A | —% | 0.07% | 0.28% | 0.32% | 0.35% |
| Institutional Class | —% | 0.07% | 0.15% | —% | —% |
| (d) | Net investment income per share includes special dividends. The effect of these dividends amounted to $0.08 per share. |
| (e) | Institutional Class shares commenced operations on January 3, 2017. Per share data and total return reflect activity from that date. |
| (f) | Annualized. |
The accompanying Notes to Consolidated Financial Statements are an integral part of this statement.
| 58 | Multi-Manager Alternative Strategies Fund | Annual Report 2019 |
Consolidated Financial Highlights (continued)
| | Net
asset
value,
end of
period | Total
return | Total gross
expense
ratio to
average
net assets(a) | Total net
expense
ratio to
average
net assets(a),(b) | Net investment
income (loss)
ratio to
average
net assets | Portfolio
turnover | Net
assets,
end of
period
(000’s) |
| Class A |
| Year Ended 8/31/2019 | $9.33 | 4.36% | 1.52% | 1.52% | 2.19% | 226% | $1,056 |
| Year Ended 8/31/2018 | $9.05 | 0.22% | 1.59%(c) | 1.59%(c) | 0.87% | 256% | $1,325 |
| Year Ended 8/31/2017 | $9.03 | (4.44%) | 1.75%(c) | 1.75%(c) | (0.77%) | 444% | $1,953 |
| Year Ended 8/31/2016 | $9.45 | 0.79% | 1.80%(c) | 1.80%(c) | (0.49%) | 289% | $747,476 |
| Year Ended 8/31/2015 | $10.07 | (2.30%) | 1.83%(c) | 1.83%(c) | 0.27% | 304% | $784,940 |
| Institutional Class |
| Year Ended 8/31/2019 | $9.36 | 4.62% | 1.27% | 1.27% | 2.43% | 226% | $502,726 |
| Year Ended 8/31/2018 | $9.08 | 0.55% | 1.34%(c) | 1.34%(c) | 1.18% | 256% | $570,839 |
| Year Ended 8/31/2017(e) | $9.03 | (0.77%) | 1.45%(c),(f) | 1.45%(c),(f) | 0.34%(f) | 444% | $578,239 |
The accompanying Notes to Consolidated Financial Statements are an integral part of this statement.
Multi-Manager Alternative Strategies Fund | Annual Report 2019
| 59 |
Notes to Consolidated Financial Statements
August 31, 2019
Note 1. Organization
Multi-Manager Alternative Strategies Fund (the Fund), a series of Columbia Funds Series Trust I (the Trust), is a non-diversified fund. The Trust is registered under the Investment Company Act of 1940, as amended (the 1940 Act), as an open-end management investment company organized as a Massachusetts business trust.
Basis for consolidation
ASGM Offshore Fund, Ltd. and ASMF Offshore Fund, Ltd. (each, a Subsidiary) are each a Cayman Islands exempted company and wholly-owned subsidiary of the Fund. Each Subsidiary acts as an investment vehicle in order to effect certain investment strategies consistent with the Fund’s investment objective and policies as stated in its current prospectus and statement of additional information. In accordance with the Memorandum and Articles of Association of the Subsidiary (the Articles), the Fund owns the sole issued share of each Subsidiary and retains all rights associated with such share, including the right to receive notice of, attend and vote at general meetings of the Subsidiaries, rights in a winding-up or repayment of capital and the right to participate in the profits or assets of the Subsidiaries. The consolidated financial statements (financial statements) include the accounts of the consolidated Fund and each respective Subsidiary. Subsequent references to the Fund within the Notes to Consolidated Financial Statements collectively refer to the Fund and each Subsidiary. All intercompany transactions and balances have been eliminated in the consolidation process.
At August 31, 2019, each Subsidiary’s financial statement information is as follows:
| | ASGM Offshore Fund, Ltd. | ASMF Offshore Fund, Ltd. |
| % of consolidated fund net assets | 1.31% | 2.76% |
| Net assets | $6,610,659 | $13,888,684 |
| Net investment income (loss) | 77,628 | 157,020 |
| Net realized gain (loss) | (2,029,170) | (1,921,532) |
| Net change in unrealized appreciation (depreciation) | (744,238) | (1,003,860) |
The financial statements present the portfolio holdings, financial position and results of operations of the Fund and the Subsidiaries on a consolidated basis.
Fund shares
The Trust may issue an unlimited number of shares (without par value). The Fund is offered only through certain wrap fee programs sponsored and/or managed by Ameriprise Financial, Inc. (Ameriprise Financial) or its affiliates. The Fund offers each of the share classes listed in the Statement of Assets and Liabilities which are not subject to any front-end sales charge or contingent deferred sales charge.
Note 2. Summary of significant accounting policies
Basis of preparation
The Fund is an investment company that applies the accounting and reporting guidance in the Financial Accounting Standards Board (FASB) Accounting Standards Codification Topic 946,Financial Services - Investment Companies (ASC 946). The financial statements are prepared in accordance with U.S. generally accepted accounting principles (GAAP), which requires management to make certain estimates and assumptions that affect the reported amounts of assets and liabilities, the disclosure of contingent assets and liabilities at the date of the financial statements and the reported amounts of income and expenses during the reporting period. Actual results could differ from those estimates.
The following is a summary of significant accounting policies followed by the Fund in the preparation of its financial statements.
| 60 | Multi-Manager Alternative Strategies Fund | Annual Report 2019 |
Notes to Consolidated Financial Statements (continued)
August 31, 2019
Security valuation
All equity securities and exchange-traded funds are valued at the close of business of the New York Stock Exchange. Equity securities and exchange-traded funds are valued at the official closing price on the principal exchange or market on which they trade. Unlisted securities or listed securities for which there were no sales during the day are valued at the mean of the latest quoted bid and ask prices on such exchanges or markets.
Debt securities generally are valued by pricing services approved by the Board of Trustees based upon market transactions for normal, institutional-size trading units of similar securities. The services may use various pricing techniques that take into account, as applicable, factors such as yield, quality, coupon rate, maturity, type of issue, trading characteristics and other data, as well as approved independent broker-dealer quotes. Debt securities for which quotations are not readily available or not believed to be reflective of market value may also be valued based upon a bid quote from an approved independent broker-dealer. Debt securities maturing in 60 days or less are valued primarily at amortized cost value, unless this method results in a valuation that management believes does not approximate market value.
Asset- and mortgage-backed securities are generally valued by pricing services, which utilize pricing models that incorporate the securities’ cash flow and loan performance data. These models also take into account available market data, including trades, market quotations, and benchmark yield curves for identical or similar securities. Factors used to identify similar securities may include, but are not limited to, issuer, collateral type, vintage, prepayment speeds, collateral performance, credit ratings, credit enhancement and expected life. Asset-backed securities for which quotations are readily available may also be valued based upon an over-the-counter or exchange bid quote from an approved independent broker-dealer.
Foreign equity securities are valued based on the closing price on the foreign exchange in which such securities are primarily traded. If any foreign equity security closing prices are not readily available, the securities are valued at the mean of the latest quoted bid and ask prices on such exchanges or markets. Foreign currency exchange rates are determined at the scheduled closing time of the New York Stock Exchange. Many securities markets and exchanges outside the U.S. close prior to the close of the New York Stock Exchange; therefore, the closing prices for securities in such markets or on such exchanges may not fully reflect events that occur after such close but before the close of the New York Stock Exchange. In those situations, foreign securities will be fair valued pursuant to a policy adopted by the Board of Trustees. Under the policy, the Fund may utilize a third party pricing service to determine these fair values. The third-party pricing service takes into account multiple factors, including, but not limited to, movements in the U.S. securities markets, certain depositary receipts, futures contracts and foreign exchange rates that have occurred subsequent to the close of the foreign exchange or market, to determine a good faith estimate that reasonably reflects the current market conditions as of the close of the New York Stock Exchange. The fair value of a security is likely to be different from the quoted or published price, if available.
Investments in open-end investment companies, including money market funds, are valued at their latest net asset value.
Forward foreign currency exchange contracts are marked-to-market based upon foreign currency exchange rates provided by a pricing service.
Futures and options on futures contracts are valued based upon the settlement price at the close of regular trading on their principal exchanges or, in the absence of transactions, at the mean of the latest quoted bid and ask prices.
Option contracts are valued at the mean of the latest quoted bid and ask prices on their primary exchanges. Option contracts, including over-the-counter option contracts, with no readily available market quotations are valued using mid-market evaluations from independent third-party vendors.
Swap transactions are valued through an independent pricing service or broker, or if neither is available, through an internal model based upon observable inputs.
Investments for which market quotations are not readily available, or that have quotations which management believes are not reflective of market value or reliable, are valued at fair value as determined in good faith under procedures approved by and under the general supervision of the Board of Trustees. If a security or class of securities (such as foreign securities) is valued at fair value, such value is likely to be different from the quoted or published price for the security.
Multi-Manager Alternative Strategies Fund | Annual Report 2019
| 61 |
Notes to Consolidated Financial Statements (continued)
August 31, 2019
The determination of fair value often requires significant judgment. To determine fair value, management may use assumptions including but not limited to future cash flows and estimated risk premiums. Multiple inputs from various sources may be used to determine fair value.
GAAP requires disclosure regarding the inputs and valuation techniques used to measure fair value and any changes in valuation inputs or techniques. In addition, investments shall be disclosed by major category. This information is disclosed following the Fund’s Consolidated Portfolio of Investments.
Foreign currency transactions and translations
The values of all assets and liabilities denominated in foreign currencies are generally translated into U.S. dollars at exchange rates determined at the close of regular trading on the New York Stock Exchange. Net realized and unrealized gains (losses) on foreign currency transactions and translations include gains (losses) arising from the fluctuation in exchange rates between trade and settlement dates on securities transactions, gains (losses) arising from the disposition of foreign currency and currency gains (losses) between the accrual and payment dates on dividends, interest income and foreign withholding taxes.
For financial statement purposes, the Fund does not distinguish that portion of gains (losses) on investments which is due to changes in foreign exchange rates from that which is due to changes in market prices of the investments. Such fluctuations are included with the net realized and unrealized gains (losses) on investments in the Consolidated Statement of Operations.
Derivative instruments
The Fund invests in certain derivative instruments, as detailed below, to meet its investment objectives. Derivatives are instruments whose values depend on, or are derived from, in whole or in part, the value of one or more securities, currencies, commodities, indices, or other assets or instruments. Derivatives may be used to increase investment flexibility (including to maintain cash reserves while maintaining desired exposure to certain assets), for risk management (hedging) purposes, to facilitate trading, to reduce transaction costs and to pursue higher investment returns. The Fund may also use derivative instruments to mitigate certain investment risks, such as foreign currency exchange rate risk, interest rate risk and credit risk. Derivatives may involve various risks, including the potential inability of the counterparty to fulfill its obligations under the terms of the contract, the potential for an illiquid secondary market (making it difficult for the Fund to sell or terminate, including at favorable prices) and the potential for market movements which may expose the Fund to gains or losses in excess of the amount shown in the Consolidated Statement of Assets and Liabilities. The notional amounts of derivative instruments, if applicable, are not recorded in the financial statements.
A derivative instrument may suffer a marked-to-market loss if the value of the contract decreases due to an unfavorable change in the market rates or values of the underlying instrument. Losses can also occur if the counterparty does not perform its obligations under the contract. The Fund’s risk of loss from counterparty credit risk on over-the-counter derivatives is generally limited to the aggregate unrealized gain netted against any collateral held by the Fund and the amount of any variation margin held by the counterparty, plus any replacement costs or related amounts. With exchange-traded or centrally cleared derivatives, there is reduced counterparty credit risk to the Fund since the clearinghouse or central counterparty (CCP) provides some protection in the case of clearing member default. The clearinghouse or CCP stands between the buyer and the seller of the contract; therefore, additional counterparty credit risk is failure of the clearinghouse or CCP. However, credit risk still exists in exchange-traded or centrally cleared derivatives with respect to initial and variation margin that is held in a broker’s customer account. While brokers are required to segregate customer margin from their own assets, in the event that a broker becomes insolvent or goes into bankruptcy and at that time there is a shortfall in the aggregate amount of margin held by the broker for all its clients, U.S. bankruptcy laws will typically allocate that shortfall on a pro-rata basis across all the broker’s customers (including the Fund), potentially resulting in losses to the Fund.
In order to better define its contractual rights and to secure rights that will help the Fund mitigate its counterparty risk, the Fund may enter into an International Swaps and Derivatives Association, Inc. Master Agreement (ISDA Master Agreement) or similar agreement with its derivatives contract counterparties. An ISDA Master Agreement is an agreement between the Fund and a counterparty that governs over-the-counter derivatives and typically contains, among other things, collateral posting terms and netting provisions in the event of a default and/or termination event. Under an ISDA Master Agreement, the Fund may, under certain circumstances, offset with the counterparty certain derivative instrument’s payables and/or receivables
| 62 | Multi-Manager Alternative Strategies Fund | Annual Report 2019 |
Notes to Consolidated Financial Statements (continued)
August 31, 2019
with collateral held and/or posted and create one single net payment. The provisions of the ISDA Master Agreement typically permit a single net payment in the event of default (close-out netting), including the bankruptcy or insolvency of the counterparty. Note, however, that bankruptcy or insolvency laws of a particular jurisdiction may impose restrictions on or prohibitions against the right of offset or netting in bankruptcy, insolvency or other events.
Collateral (margin) requirements differ by type of derivative. Margin requirements are established by the clearinghouse or CCP for exchange-traded and centrally cleared derivatives. Brokers can ask for margin in excess of the minimum in certain circumstances. Collateral terms are contract specific for over-the-counter derivatives. For over-the-counter derivatives traded under an ISDA Master Agreement, the collateral requirements are typically calculated by netting the marked-to-market amount for each transaction under such agreement and comparing that amount to the value of any variation margin currently pledged by the Fund and/or the counterparty. Generally, the amount of collateral due from or to a party has to exceed a minimum transfer amount threshold (e.g., $250,000) before a transfer has to be made. To the extent amounts due to the Fund from its counterparties are not fully collateralized, contractually or otherwise, the Fund bears the risk of loss from counterparty nonperformance. The Fund may also pay interest expense on cash collateral received from the broker. Any interest expense paid by the Fund is shown on the Consolidated Statement of Operations. The Fund attempts to mitigate counterparty risk by only entering into agreements with counterparties that it believes have the financial resources to honor their obligations and by monitoring the financial stability of those counterparties.
Certain ISDA Master Agreements allow counterparties of over-the-counter derivatives transactions to terminate derivatives contracts prior to maturity in the event the Fund’s net asset value declines by a stated percentage over a specified time period or if the Fund fails to meet certain terms of the ISDA Master Agreement, which would cause the Fund to accelerate payment of any net liability owed to the counterparty. The Fund also has termination rights if the counterparty fails to meet certain terms of the ISDA Master Agreement. In determining whether to exercise such termination rights, the Fund would consider, in addition to counterparty credit risk, whether termination would result in a net liability owed from the counterparty.
For financial reporting purposes, the Fund does not offset derivative assets and derivative liabilities that are subject to netting arrangements in the Consolidated Statement of Assets and Liabilities.
Forward foreign currency exchange contracts
Forward foreign currency exchange contracts are over-the-counter agreements between two parties to buy and sell a currency at a set price on a future date. The Fund utilized forward foreign currency exchange contracts to hedge the currency exposure associated with some or all of the Fund’s securities, to shift foreign currency exposure back to U.S. dollars, to shift investment exposure from one currency to another and to generate total return through long and short positions versus the U.S. dollar. These instruments may be used for other purposes in future periods.
The values of forward foreign currency exchange contracts fluctuate daily with changes in foreign currency exchange rates. Changes in the value of these contracts are recorded as unrealized appreciation or depreciation until the contract is exercised or has expired. The Fund will realize a gain or loss when the forward foreign currency exchange contract is closed or expires. Non-deliverable forward foreign currency exchange contracts are settled with the counterparty in U.S. dollars without delivery of foreign currency.
The use of forward foreign currency exchange contracts does not eliminate fluctuations in the prices of the Fund’s portfolio securities. The risks of forward foreign currency exchange contracts include movement in the values of the foreign currencies relative to the U.S. dollar (or other foreign currencies) and the possibility that counterparties will not complete their contractual obligations, which may be in excess of the amount reflected, if any, in the Consolidated Statement of Assets and Liabilities.
Futures contracts
Futures contracts are exchange-traded and represent commitments for the future purchase or sale of an asset at a specified price on a specified date. The Fund bought and sold futures contracts to produce incremental earnings, to manage the duration and yield curve exposure of the Fund versus the benchmark, to manage exposure to movements in interest rates, to manage exposure to the securities market and to manage commodity, government bond and currency exposure. These instruments may be used for other purposes in future periods. Upon entering into futures contracts, the Fund bears risks that
Multi-Manager Alternative Strategies Fund | Annual Report 2019
| 63 |
Notes to Consolidated Financial Statements (continued)
August 31, 2019
it may not achieve the anticipated benefits of the futures contracts and may realize a loss. Additional risks include counterparty credit risk, the possibility of an illiquid market, and that a change in the value of the contract or option may not correlate with changes in the value of the underlying asset.
Upon entering into a futures contract, the Fund deposits cash or securities with the broker, known as a futures commission merchant (FCM), in an amount sufficient to meet the initial margin requirement. The initial margin deposit must be maintained at an established level over the life of the contract. Cash deposited as initial margin is recorded in the Consolidated Statement of Assets and Liabilities as margin deposits. Securities deposited as initial margin are designated in the Consolidated Portfolio of Investments. Subsequent payments (variation margin) are made or received by the Fund each day. The variation margin payments are equal to the daily change in the contract value and are recorded as variation margin receivable or payable and are offset in unrealized gains or losses. The Fund recognizes a realized gain or loss when the contract is closed or expires. Futures contracts involve, to varying degrees, risk of loss in excess of the variation margin disclosed in the Consolidated Statement of Assets and Liabilities.
Options contracts
Options are contracts which entitle the holder to purchase or sell securities or other identified assets at a specified price, or in the case of index option contracts, to receive or pay the difference between the index value and the strike price of the index option contract. Option contracts can be either exchange-traded or over-the-counter. The Fund purchased and wrote option contracts to decrease the Fund’s exposure to equity market risk and increase return on investments, to protect gains, and to facilitate buying and selling of securities for investments. These instruments may be used for other purposes in future periods. Completion of transactions for option contracts traded in the over-the-counter market depends upon the performance of the other party. Cash collateral may be collected or posted by the Fund to secure certain over-the-counter option contract trades. Cash collateral held or posted by the Fund for such option contract trades must be returned to the broker or the Fund upon closure, exercise or expiration of the contract.
Options contracts purchased are recorded as investments. When the Fund writes an options contract, the premium received is recorded as an asset and an amount equivalent to the premium is recorded as a liability in the Consolidated Statement of Assets and Liabilities and is subsequently adjusted to reflect the current fair value of the option written. Changes in the fair value of the written option are recorded as unrealized appreciation or depreciation until the contract is exercised or has expired. The Fund will realize a gain or loss when the option contract is closed or expires. When option contracts are exercised, the proceeds on sales for a written call or purchased put option contract, or the purchase cost for a written put or purchased call option contract, is adjusted by the amount of premium received or paid.
For over-the-counter options purchased, the Fund bears the risk of loss of the amount of the premiums paid plus the positive change in market values net of any collateral held by the Fund should the counterparty fail to perform under the contracts. Option contracts written by the Fund do not typically give rise to significant counterparty credit risk, as options written generally obligate the Fund and not the counterparty to perform. The risk in writing a call option contract is that the Fund gives up the opportunity for profit if the market price of the security increases above the strike price and the option contract is exercised. The risk in writing a put option contract is that the Fund may incur a loss if the market price of the security decreases below the strike price and the option contract is exercised. Exercise of a written option could result in the Fund purchasing or selling a security or foreign currency when it otherwise would not, or at a price different from the current market value. In purchasing and writing options, the Fund bears the risk of an unfavorable change in the value of the underlying instrument or the risk that the Fund may not be able to enter into a closing transaction due to an illiquid market.
Swap contracts
Swap contracts are negotiated in the over-the-counter market and may be entered into as a bilateral contract or centrally cleared (centrally cleared swap contract). In a centrally cleared swap contract, immediately following execution of the swap contract with a broker, the swap contract is novated to a central counterparty (the CCP) and the CCP becomes the Fund’s counterparty to the centrally cleared swap contract. The Fund is required to deposit initial margin with the futures commission merchant (FCM), which pledges it through to the CCP in the form of cash or securities in an amount that varies depending on the size and risk profile of the particular swap contract. Securities deposited as initial margin are designated in the Consolidated Portfolio of Investments and cash deposited is recorded in the Consolidated Statement of Assets and Liabilities as margin deposits. Unlike a bilateral swap contract, for centrally cleared swap contracts, the Fund has minimal credit
| 64 | Multi-Manager Alternative Strategies Fund | Annual Report 2019 |
Notes to Consolidated Financial Statements (continued)
August 31, 2019
exposure to the FCM because the CCP stands between the Fund and the relevant buyer/seller on the other side of the contract. Swap contracts are marked-to-market daily and changes in value are recorded as unrealized appreciation (depreciation). The daily change in valuation of centrally cleared swap contracts, if any, is recorded as a receivable or payable for variation margin in the Consolidated Statement of Assets and Liabilities.
Entering into these contracts involves, to varying degrees, elements of interest, liquidity and counterparty credit risk in excess of the amounts recognized in the Consolidated Statement of Assets and Liabilities. Such risks involve the possibility that there may be unfavorable changes in interest rates, market conditions or other conditions, that it may be difficult to initiate a swap transaction or liquidate a position at an advantageous time or price which may result in significant losses, and that the FCM or CCP may not fulfill its obligation under the contract.
Total return swap contracts
The Fund entered into total return swap contracts to manage long or short exposure to the total return on a specified reference security in return for periodic payments based on a fixed or variable interest rate, to manage long or short exposure to the total return on a reference security index in return for periodic payments based on a fixed or variable interest rate and to obtain synthetic exposure to bond, commodity and equity index futures. These instruments may be used for other purposes in future periods. Total return swap contracts may be used to obtain exposure to an underlying reference security, instrument, or other asset or index or market without owning, taking physical custody of, or short selling any such security, instrument or asset in a market.
Total return swap contracts are valued daily, and the change in value is recorded as unrealized appreciation (depreciation) until the termination of the swap, at which time the Fund will realize a gain (loss). Periodic payments received (or made) by the Fund over the term of the contract are recorded as realized gains (losses). Total return swap contracts are subject to the risk associated with the investment in the underlying reference security, instrument or asset. The risk in the case of short total return swap contracts is unlimited based on the potential for unlimited increases in the market value of the underlying reference security, instrument or asset. This risk may be offset if the Fund holds any of the underlying reference security, instrument or asset. The risk in the case of long total return swap contracts is limited to the current notional amount of the total return swap contract.
Effects of derivative transactions in the financial statements
The following tables are intended to provide additional information about the effect of derivatives on the financial statements of the Fund, including: the fair value of derivatives by risk category and the location of those fair values in the Consolidated Statement of Assets and Liabilities; and the impact of derivative transactions over the period in the Consolidated Statement of Operations, including realized and unrealized gains (losses). The derivative instrument schedules following the Consolidated Portfolio of Investments present additional information regarding derivative instruments outstanding at the end of the period, if any.
The following table is a summary of the fair value of derivative instruments (not considered to be hedging instruments for accounting disclosure purposes) at August 31, 2019:
| | Asset derivatives | |
Risk exposure
category | Consolidated statement
of assets and liabilities
location | Fair value ($) |
| Equity risk | Component of total distributable earnings (loss) — unrealized appreciation on futures contracts | 231,092* |
| Equity risk | Investments, at value — Options Purchased | 433,242 |
| Foreign exchange risk | Unrealized appreciation on forward foreign currency exchange contracts | 2,941,103 |
| Foreign exchange risk | Component of total distributable earnings (loss) — unrealized appreciation on futures contracts | 1,913,711* |
| Interest rate risk | Component of total distributable earnings (loss) — unrealized appreciation on futures contracts | 2,335,818* |
| Interest rate risk | Component of total distributable earnings (loss) — unrealized appreciation on swap contracts | 97,368* |
| Commodity-related investment risk | Component of total distributable earnings (loss) — unrealized appreciation on futures contracts | 1,095,542* |
| Commodity-related investment risk | Component of total distributable earnings (loss) — unrealized appreciation on swap contracts | 84,983* |
| Total | | 9,132,859 |
Multi-Manager Alternative Strategies Fund | Annual Report 2019
| 65 |
Notes to Consolidated Financial Statements (continued)
August 31, 2019
| | Liability derivatives | |
Risk exposure
category | Consolidated statement
of assets and liabilities
location | Fair value ($) |
| Equity risk | Component of total distributable earnings (loss) — unrealized depreciation on futures contracts | 223,261* |
| Equity risk | Options contracts written, at value | 101,333 |
| Equity risk | Component of total distributable earnings (loss) — unrealized depreciation on swap contracts | 3,177* |
| Foreign exchange risk | Unrealized depreciation on forward foreign currency exchange contracts | 2,468,749 |
| Foreign exchange risk | Component of total distributable earnings (loss) — unrealized depreciation on futures contracts | 658,982* |
| Interest rate risk | Component of total distributable earnings (loss) — unrealized depreciation on futures contracts | 109,509* |
| Interest rate risk | Component of total distributable earnings (loss) — unrealized depreciation on swap contracts | 528* |
| Commodity-related investment risk | Component of total distributable earnings (loss) — unrealized depreciation on futures contracts | 294,135* |
| Commodity-related investment risk | Component of total distributable earnings (loss) — unrealized depreciation on swap contracts | 515* |
| Total | | 3,860,189 |
| * | Includes cumulative appreciation (depreciation) as reported in the tables following the Consolidated Portfolio of Investments. Only the current day’s variation margin is reported in receivables or payables in the Consolidated Statement of Assets and Liabilities. |
The following table indicates the effect of derivative instruments (not considered to be hedging instruments for accounting disclosure purposes) in the Consolidated Statement of Operations for the year ended August 31, 2019:
| Amount of realized gain (loss) on derivatives recognized in income |
| Risk exposure category | Forward
foreign
currency
exchange
contracts
($) | Futures
contracts
($) | Options
contracts
written
($) | Options
contracts
purchased
($) | Swap
contracts
($) | Total
($) |
| Commodity-related investment risk | — | (4,154,842) | — | — | 206,043 | (3,948,799) |
| Equity risk | — | (4,650,081) | 114,486 | (411,154) | 174,313 | (4,772,436) |
| Foreign exchange risk | — | (1,230,016) | — | — | — | (1,230,016) |
| Interest rate risk | 561,987 | 12,822,786 | — | — | 1,219,766 | 14,604,539 |
| Total | 561,987 | 2,787,847 | 114,486 | (411,154) | 1,600,122 | 4,653,288 |
| |
| Change in unrealized appreciation (depreciation) on derivatives recognized in income |
| Risk exposure category | Forward
foreign
currency
exchange
contracts
($) | Futures
contracts
($) | Options
contracts
written
($) | Options
contracts
purchased
($) | Swap
contracts
($) | Total
($) |
| Commodity-related investment risk | — | (1,496,111) | — | — | (254,388) | (1,750,499) |
| Equity risk | — | (2,397,908) | (4,652) | 93,528 | (42,960) | (2,351,992) |
| Foreign exchange risk | 24,057 | 741,057 | — | — | — | 765,114 |
| Interest rate risk | — | 2,006,155 | — | — | (59,859) | 1,946,296 |
| Total | 24,057 | (1,146,807) | (4,652) | 93,528 | (357,207) | (1,391,081) |
The following table is a summary of the average outstanding volume by derivative instrument for the year ended August 31, 2019:
| Derivative instrument | Average notional
amounts ($)* |
| Futures contracts — long | 537,886,306 |
| Futures contracts — short | 241,597,787 |
| 66 | Multi-Manager Alternative Strategies Fund | Annual Report 2019 |
Notes to Consolidated Financial Statements (continued)
August 31, 2019
| Derivative instrument | Average
value ($)* |
| Options contracts — purchased | 398,955 |
| Options contracts — written | (45,093) |
| Derivative instrument | Average unrealized
appreciation ($)* | Average unrealized
depreciation ($)* |
| Forward foreign currency exchange contracts | 3,087,625 | (2,867,404) |
| Total return swap contracts | 144,706 | (119,733) |
| * | Based on the ending quarterly outstanding amounts for the year ended August 31, 2019. |
Asset- and mortgage-backed securities
The Fund may invest in asset-backed and mortgage-backed securities. The maturity dates shown represent the original maturity of the underlying obligation. Actual maturity may vary based upon prepayment activity on these obligations. All, or a portion, of the obligation may be prepaid at any time because the underlying asset may be prepaid. As a result, decreasing market interest rates could result in an increased level of prepayment. An increased prepayment rate will have the effect of shortening the maturity of the security. Unless otherwise noted, the coupon rates presented are fixed rates.
Delayed delivery securities
The Fund may trade securities on other than normal settlement terms, including securities purchased or sold on a “when-issued” or "forward commitment" basis. This may increase risk to the Fund since the other party to the transaction may fail to deliver, which could cause the Fund to subsequently invest at less advantageous prices. The Fund designates cash or liquid securities in an amount equal to the delayed delivery commitment.
Mortgage dollar roll transactions
The Fund may enter into mortgage “dollar rolls” in which the Fund sells securities for delivery in the current month and simultaneously contracts with the same counterparty to repurchase similar but not identical securities (same type, coupon and maturity) on a specified future date. During the roll period, the Fund loses the right to receive principal and interest paid on the securities sold. However, the Fund will benefit because it receives negotiated amounts in the form of reductions of the purchase price for the future purchase plus the interest earned on the cash proceeds of the securities sold until the settlement date of the forward purchase. The Fund records the incremental difference between the forward purchase and sale of each forward roll as a realized gain or loss. Unless any realized gains exceed the income, capital appreciation, and gain or loss due to mortgage prepayments that would have been realized on the securities sold as part of the mortgage dollar roll, the use of this technique will diminish the investment performance of the Fund compared to what the performance would have been without the use of mortgage dollar rolls. All cash proceeds will be invested in instruments that are permissible investments for the Fund. The Fund identifies cash or liquid securities in an amount equal to the forward purchase price.
For financial reporting and tax purposes, the Fund treats “to be announced” mortgage dollar rolls as two separate transactions, one involving the purchase of a security and a separate transaction involving a sale. These transactions may increase the Fund’s portfolio turnover rate. The Fund does not currently enter into mortgage dollar rolls that are accounted for as financing transactions.
Mortgage dollar rolls involve the risk that the market value of the securities the Fund is obligated to repurchase may decline below the repurchase price, or that the counterparty may default on its obligations.
Interest only and principal only securities
The Fund may invest in Interest Only (IO) or Principal Only (PO) securities. IOs are stripped securities entitled to receive all of the security’s interest, but none of its principal. IOs are particularly sensitive to changes in interest rates and therefore subject to greater fluctuations in price than typical interest bearing debt securities. IOs are also subject to credit risk because the Fund may not receive all or part of the interest payments if the issuer, obligor, guarantor or counterparty defaults on its obligation. Payments received for IOs are included in interest income on the Consolidated Statement of Operations. Because no principal will be received at the maturity of an IO, adjustments are made to the cost of the security on a monthly basis until maturity. These adjustments are included in interest income on the Consolidated Statement of Operations. POs are
Multi-Manager Alternative Strategies Fund | Annual Report 2019
| 67 |
Notes to Consolidated Financial Statements (continued)
August 31, 2019
stripped securities entitled to receive the principal from the underlying obligation, but not the interest. POs are particularly sensitive to changes in interest rates and therefore are subject to fluctuations in price. POs are also subject to credit risk because the Fund may not receive all or part of its principal if the issuer, obligor, guarantor or counterparty defaults on its obligation. The Fund may also invest in IO or PO stripped mortgage-backed securities. Payments received for POs are treated as reductions to the cost and par value of the securities.
Short sales
The Fund may sell a security it does not own in anticipation of a decline in the fair value of the security. When the Fund sells a security short, it must borrow the security sold short and deliver it to the broker-dealer through which it made the short sale. The Fund is required to maintain a margin account with the broker and to pledge assets to the broker as collateral for the borrowed security. Securities pledged as collateral are designated in the Consolidated Portfolio of Investments. In addition, the collateral is recorded as cash collateral held at broker in the Consolidated Statement of Assets and Liabilities. The Fund can purchase the same security at the current market price and deliver it to the broker to close out the short sale. The Fund is obligated to pay the broker a fee for borrowing the security and may receive rebate income from the investment of collateral. The net amount of income or fees is included in “Interest income” (for net income received) or “Dividends and interest on securities sold short” (for net expense) in the Consolidated Statement of Operations. A short position is reported as a liability at fair value in the Consolidated Statement of Assets and Liabilities. The Fund must also pay the broker for any dividends accrued (recognized on ex-date) on the borrowed security. This amount is recorded as an expense in the Consolidated Statement of Operations. The Fund will record a gain if the security declines in value, and will realize a loss if the security appreciates. Such gain, limited to the price at which the Fund sold the security short, or such loss, potentially unlimited in size because the short position loses value as the market price of the security sold short increases, will be recognized upon the termination of a short sale.
| 68 | Multi-Manager Alternative Strategies Fund | Annual Report 2019 |
Notes to Consolidated Financial Statements (continued)
August 31, 2019
Offsetting of assets and liabilities
The following table presents the Fund’s gross and net amount of assets and liabilities available for offset under netting arrangements as well as any related collateral received or pledged by the Fund as of August 31, 2019:
| | ANZ
($) | Barclays
($) | BMO
($) | Citi
($)(a) | Citi
($)(a) | Citi
($)(a) | CIBC
($) | Goldman
Sachs
($)(a) | Goldman
Sachs
($)(a) | HSBC
($) | JPMorgan
($)(a) | JPMorgan
($)(a) | Morgan
Stanley
($) | RBC
Capital
Markets
($) | Standard
Chartered
($) | State
Street
($) | UBS
($) | Total
($) |
| Assets | | | | | | | | | | | | | | | | | | |
| Forward foreign currency exchange contracts | 138,797 | - | 18,004 | 875,770 | 371,266 | | 3,428 | 300,238 | 47,265 | 63,853 | 875,743 | 45,998 | 46,802 | 31,307 | 12,633 | 26,476 | 83,523 | 2,941,103 |
| Options purchased calls | - | - | - | - | | | - | 13,523 | - | - | - | - | - | - | - | - | - | 13,523 |
| Options purchased puts | - | - | - | - | | | - | 419,719 | - | - | - | - | - | - | - | - | - | 419,719 |
| OTC total return swap contracts on futures(b) | - | 97,368 | - | - | | 84,983 | - | - | - | - | - | - | - | - | - | - | - | 182,351 |
| Total assets | 138,797 | 97,368 | 18,004 | 875,770 | 371,266 | 84,983 | 3,428 | 733,480 | 47,265 | 63,853 | 875,743 | 45,998 | 46,802 | 31,307 | 12,633 | 26,476 | 83,523 | 3,556,696 |
| Liabilities | | | | | | | | | | | | | | | | | | |
| Forward foreign currency exchange contracts | 32,027 | - | - | 934,435 | 71,088 | | 12,202 | 123,958 | 40,722 | 26,007 | 934,208 | 64,722 | 75,650 | 37,097 | 2,126 | 31,703 | 82,804 | 2,468,749 |
| Options contracts written | - | - | - | - | | | - | 101,333 | - | - | - | - | - | - | - | - | - | 101,333 |
| OTC total return swap contracts on futures(b) | - | 528 | - | - | | 515 | - | - | - | - | 3,177 | - | - | - | - | - | - | 4,220 |
| Securities borrowed | - | - | - | - | | | - | 21,778,896 | - | - | - | - | - | - | - | - | - | 21,778,896 |
| Total liabilities | 32,027 | 528 | - | 934,435 | 71,088 | 515 | 12,202 | 22,004,187 | 40,722 | 26,007 | 937,385 | 64,722 | 75,650 | 37,097 | 2,126 | 31,703 | 82,804 | 24,353,198 |
| Total financial and derivative net assets | 106,770 | 96,840 | 18,004 | (58,665) | 300,178 | 84,468 | (8,774) | (21,270,707) | 6,543 | 37,846 | (61,642) | (18,724) | (28,848) | (5,790) | 10,507 | (5,227) | 719 | (20,796,502) |
| Total collateral received (pledged)(c) | - | 96,840 | - | (58,665) | - | - | - | (21,270,707) | - | - | (61,642) | - | - | - | - | - | - | (21,294,174) |
| Net amount(d) | 106,770 | - | 18,004 | - | 300,178 | 84,468 | (8,774) | - | 6,543 | 37,846 | - | (18,724) | (28,848) | (5,790) | 10,507 | (5,227) | 719 | 497,672 |
| (a) | Exposure can only be netted across transactions governed under the same master agreement with the same legal entity. |
| (b) | Over-the-Counter (OTC) Swap Contracts are presented at market value plus periodic payments receivable (payable), which is comprised of unrealized appreciation, unrealized depreciation, upfront payments and upfront receipts. |
| (c) | In some instances, the actual collateral received and/or pledged may be more than the amount shown due to overcollateralization. |
| (d) | Represents the net amount due from/(to) counterparties in the event of default. |
Multi-Manager Alternative Strategies Fund | Annual Report 2019
| 69 |
Notes to Consolidated Financial Statements (continued)
August 31, 2019
Security transactions
Security transactions are accounted for on the trade date. Cost is determined and gains (losses) are based upon the specific identification method for both financial statement and federal income tax purposes.
Income recognition
Interest income is recorded on an accrual basis. Market premiums and discounts, including original issue discounts, are amortized and accreted, respectively, over the expected life of the security on all debt securities, unless otherwise noted. The Fund classifies gains and losses realized on prepayments received on mortgage-backed securities as adjustments to interest income.
The Fund may place a debt security on non-accrual status and reduce related interest income when it becomes probable that the interest will not be collected and the amount of uncollectible interest can be reasonably estimated. A defaulted debt security is removed from non-accrual status when the issuer resumes interest payments or when collectibility of interest is reasonably assured.
Corporate actions and dividend income are generally recorded net of any non-reclaimable tax withholdings, on the ex-dividend date or upon receipt of ex-dividend notification in the case of certain foreign securities.
The Fund may receive distributions from holdings in equity securities, business development companies (BDCs), exchange-traded funds (ETFs), limited partnerships (LPs), other regulated investment companies (RICs), and real estate investment trusts (REITs), which report information on the tax character of their distributions annually. These distributions are allocated to dividend income, capital gain and return of capital based on actual information reported. Return of capital is recorded as a reduction of the cost basis of securities held. If the Fund no longer owns the applicable securities, return of capital is recorded as a realized gain. With respect to REITs, to the extent actual information has not yet been reported, estimates for return of capital are made by the Fund’s management. Management’s estimates are subsequently adjusted when the actual character of the distributions is disclosed by the REITs, which could result in a proportionate change in return of capital to shareholders.
Awards from class action litigation are recorded as a reduction of cost basis if the Fund still owns the applicable securities on the payment date. If the Fund no longer owns the applicable securities, the proceeds are recorded as realized gains.
The Fund may receive other income from senior loans, including amendment fees, consent fees and commitment fees. These fees are recorded as income when received by the Fund. These amounts are included in Interest Income in the Statement of Operations.
Expenses
General expenses of the Trust are allocated to the Fund and other funds of the Trust based upon relative net assets or other expense allocation methodologies determined by the nature of the expense. Expenses directly attributable to the Fund are charged to the Fund. Expenses directly attributable to a specific class of shares are charged to that share class.
Determination of class net asset value
All income, expenses (other than class-specific expenses, which are charged to that share class, as shown in the Consolidated Statement of Operations) and realized and unrealized gains (losses) are allocated to each class of the Fund on a daily basis, based on the relative net assets of each class, for purposes of determining the net asset value of each class.
Federal income tax status
The Fund intends to qualify each year as a regulated investment company under Subchapter M of the Internal Revenue Code, as amended, and will distribute substantially all of its investment company taxable income and net capital gain, if any, for its tax year, and as such will not be subject to federal income taxes. In addition, the Fund intends to distribute in each calendar year substantially all of its ordinary income, capital gain net income and certain other amounts, if any, such that the Fund should not be subject to federal excise tax. Therefore, no federal income or excise tax provision is recorded.
| 70 | Multi-Manager Alternative Strategies Fund | Annual Report 2019 |
Notes to Consolidated Financial Statements (continued)
August 31, 2019
Foreign taxes
The Fund may be subject to foreign taxes on income, gains on investments or currency repatriation, a portion of which may be recoverable. The Fund will accrue such taxes and recoveries, as applicable, based upon its current interpretation of tax rules and regulations that exist in the markets in which it invests.
Realized gains in certain countries may be subject to foreign taxes at the Fund level, based on statutory rates. The Fund accrues for such foreign taxes on realized and unrealized gains at the appropriate rate for each jurisdiction, as applicable. The amount, if any, is disclosed as a liability on the Consolidated Statement of Assets and Liabilities.
Distributions to shareholders
Distributions from net investment income, if any, are declared and paid annually. Net realized capital gains, if any, are distributed at least annually. Income distributions and capital gain distributions are determined in accordance with federal income tax regulations, which may differ from GAAP.
Guarantees and indemnifications
Under the Trust’s organizational documents and, in some cases, by contract, its officers and trustees are indemnified against certain liabilities arising out of the performance of their duties to the Trust or its funds. In addition, certain of the Fund’s contracts with its service providers contain general indemnification clauses. The Fund’s maximum exposure under these arrangements is unknown since the amount of any future claims that may be made against the Fund cannot be determined, and the Fund has no historical basis for predicting the likelihood of any such claims.
Recent accounting pronouncements
Accounting Standards Update 2017-08 Premium Amortization on Purchased Callable Debt Securities
In March 2017, the Financial Accounting Standards Board issued Accounting Standards Update (ASU) No. 2017-08 Premium Amortization on Purchased Callable Debt Securities. ASU No. 2017-08 updates the accounting standards to shorten the amortization period for certain purchased callable debt securities, held at a premium, to be amortized to the earliest call date. The update applies to securities with explicit, noncontingent call features that are callable at fixed prices and on preset dates. The standard is effective for annual periods beginning after December 15, 2018 and interim periods within those fiscal years. Management does not expect the implementation of this guidance to have a material impact on the financial statement amounts and footnote disclosures.
Accounting Standards Update 2018-13 Disclosure Framework - Changes to the Disclosure Requirements for Fair Value Measurement
In August 2018, the Financial Accounting Standards Board issued Accounting Standards Update (ASU) No. 2018-13 Disclosure Framework - Changes to the Disclosure Requirements for Fair Value Measurement. The standard is effective for annual periods beginning after December 15, 2019 and interim periods within those fiscal years, with early adoption permitted. After evaluation, management determined to adopt the ASU effective for the period ended August 31, 2019 and all subsequent periods. As a result of the amendments, management implemented disclosure changes which include removal of the amount and reasons for transfers between Level 1 and Level 2 of the fair value hierarchy, removal of the policy for the timing of transfers between levels, removal of the description of the Level 3 valuation processes, as well as modifications to the measurement uncertainty disclosure.
Disclosure Update and Simplification
In September 2018, the Securities and Exchange Commission (SEC) released Final Rule 33-10532, Disclosure Update and Simplification, which amends certain financial statement disclosure requirements that the SEC determined to be redundant, outdated, or superseded in light of other SEC disclosure requirements, GAAP, or changes in the information environment. As a result of the amendments, management implemented disclosure changes which included removing the components of distributable earnings presented on the Consolidated Statement of Assets and Liabilities and combining income and gain
Multi-Manager Alternative Strategies Fund | Annual Report 2019
| 71 |
Notes to Consolidated Financial Statements (continued)
August 31, 2019
distributions paid to shareholders as presented on the Consolidated Statement of Changes in Net Assets. Any values presented to meet prior year requirements were left unchanged. The amendments had no effect on the Fund’s net assets or results of operation.
Note 3. Fees and other transactions with affiliates
Management services fees
The Fund has entered into a Management Agreement with Columbia Management Investment Advisers, LLC (the Investment Manager), a wholly-owned subsidiary of Ameriprise Financial, Inc. (Ameriprise Financial). Under the Management Agreement, the Investment Manager provides the Fund with investment research and advice, as well as administrative and accounting services. The Investment Manager is responsible for the ultimate oversight of investments made by the Fund. The Fund’s subadvisers (see Subadvisory agreements below) have the primary responsibility for the day-to-day portfolio management of their portion of the Fund. The management services fee is an annual fee that is equal to a percentage of the Fund’s daily net assets that declines from 1.10% to 0.95% as the Fund’s net assets increase. The effective management services fee rate for the year ended August 31, 2019 was 1.10% of the Fund’s average daily net assets.
Subadvisory agreements
The Investment Manager has entered into Subadvisory Agreements with AlphaSimplex Group, LLC, AQR Capital Management, LLC, Manulife Investment Management (US) LLC, TCW Investment Management Company LLC and Water Island Capital, LLC, each of which subadvises a portion of the assets of the Fund. Effective May 7, 2019, Manulife Asset Management US) LLC has changed its name to Manulife Investment Management (US) LLC. New investments in the Fund, net of any redemptions, are allocated in accordance with the Investment Manager’s determination, subject to the oversight of the Fund’s Board of Trustees. Each subadviser’s proportionate share of investments in the Fund will vary due to market fluctuations. The Investment Manager compensates each subadviser to manage the investment of the Fund’s assets.
Compensation of board members
Members of the Board of Trustees who are not officers or employees of the Investment Manager or Ameriprise Financial are compensated for their services to the Fund as disclosed in the Consolidated Statement of Operations. These members of the Board of Trustees may participate in a Deferred Compensation Plan (the Deferred Plan) which may be terminated at any time. Obligations of the Deferred Plan will be paid solely out of the Fund’s assets, and all amounts payable under the Deferred Plan constitute a general unsecured obligation of the Fund.
Compensation of Chief Compliance Officer
The Board of Trustees has appointed a Chief Compliance Officer to the Fund in accordance with federal securities regulations. As disclosed in the Consolidated Statement of Operations, a portion of the Chief Compliance Officer’s total compensation is allocated to the Fund, along with other allocations to affiliated registered investment companies managed by the Investment Manager and its affiliates, based on relative net assets.
Transfer agency fees
Under a Transfer and Dividend Disbursing Agent Agreement, Columbia Management Investment Services Corp. (the Transfer Agent), an affiliate of the Investment Manager and a wholly-owned subsidiary of Ameriprise Financial, is responsible for providing transfer agency services to the Fund. The Transfer Agent has contracted with DST Asset Manager Solutions, Inc. (DST) to serve as sub-transfer agent. The Transfer Agent pays the fees of DST for services as sub-transfer agent and DST is not entitled to reimbursement for such fees from the Fund (with the exception of out-of-pocket fees).
The Fund pays the Transfer Agent a monthly transfer agency fee based on the number or the average value of accounts, depending on the type of account. In addition, the Fund pays the Transfer Agent a fee for shareholder services based on the number of accounts or on a percentage of the average aggregate value of the Fund’s shares maintained in omnibus accounts up to the lesser of the amount charged by the financial intermediary or a cap established by the Board of Trustees from time to time.
| 72 | Multi-Manager Alternative Strategies Fund | Annual Report 2019 |
Notes to Consolidated Financial Statements (continued)
August 31, 2019
The Transfer Agent also receives compensation from the Fund for various shareholder services and reimbursements for certain out-of-pocket fees.
For the year ended August 31, 2019, the Fund’s effective transfer agency fee rates as a percentage of average daily net assets of each class were as follows:
| | Effective rate (%) |
| Class A | 0.11 |
| Institutional Class | 0.11 |
Distribution and service fees
The Fund has entered into an agreement with Columbia Management Investment Distributors, Inc. (the Distributor), an affiliate of the Investment Manager and a wholly-owned subsidiary of Ameriprise Financial, for distribution and shareholder services. The Board of Trustees has approved, and the Fund has adopted, distribution and shareholder service plans (the Plans) applicable to certain share classes, which set the distribution and service fees for the Fund. These fees are calculated daily and are intended to compensate the Distributor and/or eligible selling and/or servicing agents for selling shares of the Fund and providing services to investors.
The Fund may pay distribution fee of up to 0.25% of the Fund’s average daily net assets attributable to Class A shares and a service fee of up to 0.25% of the Fund’s average daily net assets attributable to Class A shares, provided that the aggregate fee shall not exceed 0.25% of the Fund’s average daily net assets attributable to Class A shares.
Expenses waived/reimbursed by the Investment Manager and its affiliates
The Investment Manager and certain of its affiliates have contractually agreed to waive fees and/or reimburse expenses (excluding certain fees and expenses described below) for the period(s) disclosed below, unless sooner terminated at the sole discretion of the Board of Trustees, so that the Fund’s net operating expenses, after giving effect to fees waived/expenses reimbursed and any balance credits and/or overdraft charges from the Fund’s custodian, do not exceed the following annual rate(s) as a percentage of the class’ average daily net assets:
| | January 1, 2019
through
December 31, 2019 | Prior to
January 1, 2019 |
| Class A | 1.81% | 1.88% |
| Institutional Class | 1.56 | 1.63 |
Under the agreement governing these fee waivers and/or expense reimbursement arrangements, the following fees and expenses are excluded from the waiver/reimbursement commitment, and therefore will be paid by the Fund, if applicable: taxes (including foreign transaction taxes), expenses associated with investments in affiliated and non-affiliated pooled investment vehicles (including mutual funds and exchange-traded funds), transaction costs and brokerage commissions, costs related to any securities lending program, dividend expenses associated with securities sold short, inverse floater program fees and expenses, transaction charges and interest on borrowed money, interest, infrequent and/or unusual expenses and any other expenses the exclusion of which is specifically approved by the Board of Trustees. This agreement may be modified or amended only with approval from the Investment Manager, certain of its affiliates and the Fund. Any fees waived and/or expenses reimbursed under the expense reimbursement arrangements described above are not recoverable by the Investment Manager or its affiliates in future periods.
Note 4. Federal tax information
The timing and character of income and capital gain distributions are determined in accordance with income tax regulations, which may differ from GAAP because of temporary or permanent book to tax differences.
At August 31, 2019, these differences were primarily due to differing treatment for deferral/reversal of wash sale losses, trustees’ deferred compensation, tax straddles, non-deductible expenses, capital loss carryforward, deemed distributions, derivative investments, re-characterization of distributions for investments, swap investments, principal and/or interest of fixed income securities, foreign capital gains tax, investments in partnerships, foreign currency transactions, passive foreign
Multi-Manager Alternative Strategies Fund | Annual Report 2019
| 73 |
Notes to Consolidated Financial Statements (continued)
August 31, 2019
investment company (PFIC) holdings, and investments in commodity subsidiaries. To the extent these differences were permanent, reclassifications were made among the components of the Fund’s net assets. Temporary differences do not require reclassifications.
The following reclassifications were made:
Excess of distributions
over net investment
income ($) | Accumulated
net realized
(loss) ($) | Paid in
capital ($) |
| 4,933,997 | (3,436,325) | (1,497,672) |
Net investment income (loss) and net realized gains (losses), as disclosed in the Consolidated Statement of Operations, and net assets were not affected by this reclassification.
The tax character of distributions paid during the years indicated was as follows:
| Year Ended August 31, 2019 | Year Ended August 31, 2018 |
Ordinary
income ($) | Long-term
capital gains ($) | Total ($) | Ordinary
income ($) | Long-term
capital gains ($) | Total ($) |
| 7,646,461 | — | 7,646,461 | — | — | — |
Short-term capital gain distributions, if any, are considered ordinary income distributions for tax purposes.
At August 31, 2019, the components of distributable earnings on a tax basis were as follows:
Undistributed
ordinary income ($) | Undistributed
long-term
capital gains ($) | Capital loss
carryforwards ($) | Net unrealized
(depreciation) ($) |
| 10,085,293 | — | (43,015,205) | (26,307,552) |
At August 31, 2019, the cost of all investments for federal income tax purposes along with the aggregate gross unrealized appreciation and depreciation based on that cost was:
Federal
tax cost ($) | Gross unrealized
appreciation ($) | Gross unrealized
(depreciation) ($) | Net unrealized
(depreciation) ($) |
| 523,337,534 | 3,924,567 | (30,232,119) | (26,307,552) |
Tax cost of investments and unrealized appreciation/(depreciation) may also include timing differences that do not constitute adjustments to tax basis.
The following capital loss carryforwards, determined at August 31, 2019, may be available to reduce taxable income arising from future net realized gains on investments, if any, to the extent permitted by the Internal Revenue Code. Capital loss carryforwards with no expiration are required to be utilized prior to any capital losses which carry an expiration date. As a result of this ordering rule, capital loss carryforwards which carry an expiration date may be more likely to expire unused. In addition, for the year ended August 31, 2019, capital loss carryforwards utilized and expired unused, if any, were as follows:
No expiration
short-term ($) | No expiration
long-term ($) | Total ($) | Utilized ($) | Expired ($) |
| (12,164,980) | (30,850,225) | (43,015,205) | 819,407 | — |
Management of the Fund has concluded that there are no significant uncertain tax positions in the Fund that would require recognition in the financial statements. However, management’s conclusion may be subject to review and adjustment at a later date based on factors including, but not limited to, new tax laws, regulations, and administrative interpretations (including relevant court decisions). Generally, the Fund’s federal tax returns for the prior three fiscal years remain subject to examination by the Internal Revenue Service.
| 74 | Multi-Manager Alternative Strategies Fund | Annual Report 2019 |
Notes to Consolidated Financial Statements (continued)
August 31, 2019
Note 5. Portfolio information
The cost of purchases and proceeds from sales of securities, excluding short-term investments and derivatives, if any, aggregated to $901,628,465 and $923,053,371, respectively, for the year ended August 31, 2019, of which $28,039,694 and $18,899,734, respectively, were U.S. government securities. The amount of purchase and sale activity impacts the portfolio turnover rate reported in the Consolidated Financial Highlights.
Note 6. Affiliated money market fund
The Fund invests in Columbia Short-Term Cash Fund, an affiliated money market fund established for the exclusive use by the Fund and other affiliated funds (the Affiliated MMF). The income earned by the Fund from such investments is included as Dividends - affiliated issuers in the Consolidated Statement of Operations. As an investing fund, the Fund indirectly bears its proportionate share of the expenses of the Affiliated MMF. The Affiliated MMF prices its shares with a floating net asset value. In addition, the Board of Trustees of the Affiliated MMF may impose a fee on redemptions (sometimes referred to as a liquidity fee) or temporarily suspend redemptions (sometimes referred to as imposing a redemption gate) in the event its liquidity falls below regulatory limits.
Note 7. Interfund lending
Pursuant to an exemptive order granted by the Securities and Exchange Commission, the Fund participates in a program (the Interfund Program) allowing each participating Columbia Fund (each, a Participating Fund) to lend money directly to and, except for closed-end funds and money market funds, borrow money directly from other Participating Funds for temporary purposes. The amounts eligible for borrowing and lending under the Interfund Program are subject to certain restrictions.
Interfund loans are subject to the risk that the borrowing fund could be unable to repay the loan when due, and a delay in repayment to the lending fund could result in lost opportunities and/or additional lending costs. The exemptive order is subject to conditions intended to mitigate conflicts of interest arising from the Investment Manager’s relationship with each Participating Fund.
The Fund did not borrow or lend money under the Interfund Program during the year ended August 31, 2019.
Note 8. Line of credit
The Fund has access to a revolving credit facility with a syndicate of banks led by Citibank, N.A., HSBC Bank USA, N.A. and JPMorgan Chase Bank, N.A. whereby the Fund may borrow for the temporary funding of shareholder redemptions or for other temporary or emergency purposes. The credit facility, which is a collective agreement between the Fund and certain other funds managed by the Investment Manager or an affiliated investment manager, severally and not jointly, permits collective borrowings up to $1 billion. Interest is charged to each participating fund based on its borrowings at a rate equal to the higher of (i) the federal funds effective rate, (ii) the one-month LIBOR rate and (iii) the overnight bank funding rate, plus in each case, 1.00%. Each borrowing under the credit facility matures no later than 60 days after the date of borrowing. The Fund also pays a commitment fee equal to its pro rata share of the unused amount of the credit facility at a rate of 0.15% per annum. The commitment fee is included in other expenses in the Consolidated Statement of Operations. This agreement expires annually in December unless extended or renewed.
The Fund had no borrowings during the year ended August 31, 2019.
Note 9. Significant risks
Shareholder concentration risk
At August 31, 2019, affiliated shareholders of record owned 100.0% of the outstanding shares of the Fund in one or more accounts. Subscription and redemption activity by concentrated accounts may have a significant effect on the operations of the Fund. In the case of a large redemption, the Fund may be forced to sell investments at inopportune times, including its liquid positions, which may result in Fund losses and the Fund holding a higher percentage of less liquid positions. Large redemptions could result in decreased economies of scale and increased operating expenses for non-redeeming Fund shareholders.
Multi-Manager Alternative Strategies Fund | Annual Report 2019
| 75 |
Notes to Consolidated Financial Statements (continued)
August 31, 2019
Credit risk
Credit risk is the risk that the value of debt securities in the Fund’s portfolio may decline because the issuer defaults or otherwise becomes unable or unwilling, or is perceived to be unable or unwilling, to honor its financial obligations, such as making payments to the Fund when due. Rating agencies assign credit ratings to certain debt instruments to indicate their credit risk. Lower rated or unrated debt instruments held by the Fund may present increased credit risk as compared to higher-rated debt instruments.
Derivatives risk
Losses involving derivative instruments may be substantial, because a relatively small movement in the underlying reference (which is generally the price, rate or other economic indicator associated with a security(ies), commodity, currency or index or other instrument or asset) may result in a substantial loss for the Fund. In addition to the potential for increased losses, the use of derivative instruments may lead to increased volatility within the Fund. Derivatives will typically increase the Fund’s exposure to principal risks to which it is otherwise exposed, and may expose the Fund to additional risks, including correlation risk, counterparty risk, hedging risk, leverage risk, liquidity risk and pricing risk.
Interest rate risk
Interest rate risk is the risk of losses attributable to changes in interest rates. In general, if prevailing interest rates rise, the values of debt securities tend to fall, and if interest rates fall, the values of debt securities tend to rise. Actions by governments and central banking authorities can result in increases in interest rates. Increasing interest rates may negatively affect the value of debt securities held by the Fund, resulting in a negative impact on the Fund’s performance and net asset value per share. In general, the longer the maturity or duration of a debt security, the greater its sensitivity to changes in interest rates.
Liquidity risk
Liquidity risk is the risk associated with a lack of marketability of investments which may make it difficult to sell the investment at a desirable time or price. Changing regulatory, market or other conditions or environments (for example, the interest rate or credit environments) may adversely affect the liquidity of the Fund’s investments. The Fund may have to accept a lower selling price for the holding, sell other investments, or forego another, more appealing investment opportunity. Generally, the less liquid the market at the time the Fund sells a portfolio investment, the greater the risk of loss or decline of value to the Fund. A less liquid market can lead to an increase in Fund redemptions, which may negatively impact Fund performance and net asset value per share, including, for example, if the Fund is forced to sell securities in a down market.
Non-diversification risk
A non-diversified fund is permitted to invest a greater percentage of its total assets in fewer issuers than a diversified fund. This increases the risk that a change in the value of any one investment held by the Fund could affect the overall value of the Fund more than it would affect that of a diversified fund holding a greater number of investments. Accordingly, the Fund’s value will likely be more volatile than the value of a more diversified fund.
Short selling risk
Leverage occurs when the Fund increases its assets available for investment using borrowings, short sales, derivatives, or similar instruments or techniques. Because short sales involve borrowing securities and then selling them, the Fund’s short sales effectively leverage the Fund’s assets. The Fund’s assets that are used as collateral to secure the Fund’s obligations to return the securities sold short may decrease in value while the short positions are outstanding, which may force the Fund to use its other assets to increase the collateral. Leverage can create an interest expense that may lower the Fund’s overall returns. Leverage presents the opportunity for increased net income and capital gains, but may also exaggerate the Fund’s volatility and risk of loss. There can be no guarantee that a leveraging strategy will be successful.
Note 10. Subsequent events
Management has evaluated the events and transactions that have occurred through the date the financial statements were issued and noted no items requiring adjustment of the financial statements or additional disclosure.
| 76 | Multi-Manager Alternative Strategies Fund | Annual Report 2019 |
Notes to Consolidated Financial Statements (continued)
August 31, 2019
Note 11. Information regarding pending and settled legal proceedings
Ameriprise Financial and certain of its affiliates have historically been involved in a number of legal, arbitration and regulatory proceedings, including routine litigation, class actions, and governmental actions, concerning matters arising in connection with the conduct of their business activities. Ameriprise Financial believes that the Fund is not currently the subject of, and that neither Ameriprise Financial nor any of its affiliates are the subject of, any pending legal, arbitration or regulatory proceedings that are likely to have a material adverse effect on the Fund or the ability of Ameriprise Financial or its affiliates to perform under their contracts with the Fund. Ameriprise Financial is required to make quarterly (10-Q), annual (10-K) and, as necessary, 8-K filings with the Securities and Exchange Commission (SEC) on legal and regulatory matters that relate to Ameriprise Financial and its affiliates. Copies of these filings may be obtained by accessing the SEC website at www.sec.gov.
There can be no assurance that these matters, or the adverse publicity associated with them, will not result in increased Fund redemptions, reduced sale of Fund shares or other adverse consequences to the Fund. Further, although we believe proceedings are not likely to have a material adverse effect on the Fund or the ability of Ameriprise Financial or its affiliates to perform under their contracts with the Fund, these proceedings are subject to uncertainties and, as such, we are unable to estimate the possible loss or range of loss that may result. An adverse outcome in one or more of these proceedings could result in adverse judgments, settlements, fines, penalties or other relief that could have a material adverse effect on the consolidated financial condition or results of operations of Ameriprise Financial.
Multi-Manager Alternative Strategies Fund | Annual Report 2019
| 77 |
Report of Independent Registered Public Accounting Firm
To the Board of Trustees of Columbia Funds Series Trust I and Shareholders of Multi-Manager Alternative Strategies Fund
Opinion on the Financial Statements
We have audited the accompanying consolidated statement of assets and liabilities, including the consolidated portfolio of investments, of Multi-Manager Alternative Strategies Fund (one of the funds constituting Columbia Funds Series Trust I, hereafter referred to as the “Fund”) as of August 31, 2019, the related consolidated statement of operations for the year ended August 31, 2019, the consolidated statement of changes in net assets for each of the two years in the period ended August 31, 2019, including the related notes, and the financial highlights for each of the periods indicated therein (collectively referred to as the “consolidated financial statements”). In our opinion, the financial statements present fairly, in all material respects, the financial position of the Fund as of August 31, 2019, the results of its operations for the year then ended, the changes in its net assets for each of the two years in the period ended August 31, 2019 and the financial highlights for each of the periods indicated therein in conformity with accounting principles generally accepted in the United States of America.
Basis for Opinion
These consolidated financial statements are the responsibility of the Fund’s management. Our responsibility is to express an opinion on the Fund’s consolidated financial statements based on our audits. We are a public accounting firm registered with the Public Company Accounting Oversight Board (United States) (PCAOB) and are required to be independent with respect to the Fund in accordance with the U.S. federal securities laws and the applicable rules and regulations of the Securities and Exchange Commission and the PCAOB.
We conducted our audits of these consolidated financial statements in accordance with the standards of the PCAOB. Those standards require that we plan and perform the audit to obtain reasonable assurance about whether the financial statements are free of material misstatement, whether due to error or fraud.
Our audits included performing procedures to assess the risks of material misstatement of the consolidated financial statements, whether due to error or fraud, and performing procedures that respond to those risks. Such procedures included examining, on a test basis, evidence regarding the amounts and disclosures in the consolidated financial statements. Our audits also included evaluating the accounting principles used and significant estimates made by management, as well as evaluating the overall presentation of the consolidated financial statements. Our procedures included confirmation of securities owned as of August 31, 2019, by correspondence with the custodian, transfer agent and brokers; when replies were not received from brokers, we performed other audit procedures. We believe that our audits provide a reasonable basis for our opinion.
/s/PricewaterhouseCoopers LLP
Minneapolis, Minnesota
October 24, 2019
We have served as the auditor of one or more investment companies within the Columbia Funds Complex since 1977.
| 78 | Multi-Manager Alternative Strategies Fund | Annual Report 2019 |
Federal Income Tax Information
(Unaudited)
The Fund hereby designates the following tax attributes for the fiscal year ended August 31, 2019. Shareholders will be notified in early 2020 of the amounts for use in preparing 2019 income tax returns.
Qualified
dividend
income | Dividends
received
deduction |
| 26.02% | 26.21% |
Qualified dividend income. For taxable, non-corporate shareholders, the percentage of ordinary income distributed during the fiscal year that represents qualified dividend income subject to reduced tax rates.
Dividends received deduction. The percentage of ordinary income distributed during the fiscal year that qualifies for the corporate dividends received deduction.
TRUSTEES AND OFFICERS
The Board oversees the Fund’s operations and appoints officers who are responsible for day-to-day business decisions based on policies set by the Board. The following table provides basic biographical information about the Fund’s Trustees as of the printing of this report, including their principal occupations during the past five years, although specific titles for individuals may have varied over the period. The year set forth beneath Length of Service in the table below is the year in which the Trustee was first appointed or elected as Trustee to any Fund currently in the Columbia Funds Complex or a predecessor thereof. Under current Board policy, members serve terms of indefinite duration.
Independent trustees
| Name, address, year of birth | Position held with the Trust and length of service | Principal occupation(s) during the past five years and other relevant professional experience | Number of Funds in the Columbia Fund Complex overseen | Other directorships held by Trustee during the past five years |
Janet Langford Carrig
c/o Columbia Management
Investment Advisers, LLC
225 Franklin Street
Mail Drop BX32 05228
Boston, MA 02110
1957 | Trustee
1996 | Senior Vice President, General Counsel and Corporate Secretary, ConocoPhillips (independent energy company), September 2007-October 2018 | 70 | None |
Douglas A. Hacker
c/o Columbia Management
Investment Advisers, LLC
225 Franklin Street
Mail Drop BX32 05228
Boston, MA 02110
1955 | Trustee and Chairman of the Board
1996 | Independent business executive since May 2006; Executive Vice President — Strategy of United Airlines, December 2002-May 2006; President of UAL Loyalty Services (airline marketing company), September 2001-December 2002; Executive Vice President and Chief Financial Officer of United Airlines, July 1999-September 2001 | 70 | Spartan Nash Company, (food distributor); former Director, Nash Finch Company (food distributor), 2005-2013; Aircastle Limited (aircraft leasing); former Director, SeaCube Container Leasing Ltd. (container leasing), 2010-2013; and Travelport Worldwide Limited (travel information technology) |
Nancy T. Lukitsh
c/o Columbia Management
Investment Advisers, LLC
225 Franklin Street
Mail Drop BX32 05228
Boston, MA 02110
1956 | Trustee
2011 | Senior Vice President, Partner and Director of Marketing, Wellington Management Company, LLP (investment adviser), 1997-2010; Chair, Wellington Management Portfolios (commingled non-U.S. investment pools), 2007-2010; Director, Wellington Trust Company, NA and other Wellington affiliates, 1997-2010 | 70 | None |
Multi-Manager Alternative Strategies Fund | Annual Report 2019
| 79 |
TRUSTEES AND OFFICERS (continued)
Independent trustees (continued)
| Name, address, year of birth | Position held with the Trust and length of service | Principal occupation(s) during the past five years and other relevant professional experience | Number of Funds in the Columbia Fund Complex overseen | Other directorships held by Trustee during the past five years |
David M. Moffett
c/o Columbia Management
Investment Advisers, LLC
225 Franklin Street
Mail Drop BX32 05228
Boston, MA 02110
1952 | Trustee
2011 | Retired. Consultant to Bridgewater and Associates | 70 | Director, CSX Corporation (transportation suppliers); Genworth Financial, Inc. (financial and insurance products and services); PayPal Holdings Inc. (payment and data processing services); Trustee, University of Oklahoma Foundation; former Director, eBay Inc. (online trading community), 2007-2015; and former Director, CIT Bank, CIT Group Inc. (commercial and consumer finance), 2010-2016 |
John J. Neuhauser
c/o Columbia Management
Investment Advisers, LLC
225 Franklin Street
Mail Drop BX32 05228
Boston, MA 02110
1943 | Trustee
1984 | President, Saint Michael’s College, August 2007-June 2018; Director or Trustee of several non-profit organizations, including University of Vermont Medical Center; Academic Vice President and Dean of Faculties, Boston College, August 1999-October 2005; University Professor, Boston College, November 2005-August 2007 | 70 | Liberty All-Star Equity Fund and Liberty All- Star Growth Fund (closed-end funds) |
Patrick J. Simpson
c/o Columbia Management
Investment Advisers, LLC
225 Franklin Street
Mail Drop BX32 05228
Boston, MA 02110
1944 | Trustee
2000 | Of Counsel, Perkins Coie LLP (law firm) since 2015; Partner, Perkins Coie LLP, 1988-2014 | 70 | Former Director, M Fund, Inc. (M Funds mutual fund family), July 2018-July 2019 |
Anne-Lee Verville
c/o Columbia Management
Investment Advisers, LLC
225 Franklin Street
Mail Drop BX32 05228
Boston, MA 02110
1945 | Trustee
1998 | Retired. General Manager, Global Education Industry, 1994-1997, President – Application Systems Division, 1991-1994, Chief Financial Officer – US Marketing & Services, 1988-1991, and Chief Information Officer, 1987-1988, IBM Corporation (computer and technology) | 70 | Former Director, Enesco Group, Inc. (producer of giftware and home and garden decor products), 2001-2006 |
Consultants to the Independent Trustees*
| Name, address, year of birth | Position held with the Trust and length of service | Principal occupation(s) during the past five years and other relevant professional experience | Number of Funds in the Columbia Funds complex overseen | Other directorships held by Trustee during the past five years |
J. Kevin Connaughton
c/o Columbia
Management Investment
Advisers, LLC,
225 Franklin Street
Mail Drop BX32 05228,
Boston, MA 02110
1964 | Independent Trustee Consultant
2016 | Independent Trustee Consultant, Columbia Funds since March 2016; Adjunct Professor of Finance, Bentley University since November 2017; Managing Director and General Manager of Mutual Fund Products, Columbia Management Investment Advisers, LLC, May 2010-February 2015; President, Columbia Funds, 2009-2015; and senior officer of Columbia Funds and affiliated funds, 2003-2015 | 70 | Director, The Autism Project since March 2015; former Trustee, New Century Portfolios, March 2015-December 2017; formerly on Board of Governors, Gateway Healthcare, January 2016 – December 2017 |
| 80 | Multi-Manager Alternative Strategies Fund | Annual Report 2019 |
TRUSTEES AND OFFICERS (continued)
Consultants to the Independent Trustees* (continued)
| Name, address, year of birth | Position held with the Trust and length of service | Principal occupation(s) during the past five years and other relevant professional experience | Number of Funds in the Columbia Funds complex overseen | Other directorships held by Trustee during the past five years |
Olive Darragh
c/o Columbia
Management Investment
Advisers, LLC,
225 Franklin Street,
Mail Drop BX32 05228,
Boston, MA 02110
1962 | Independent Trustee Consultant 2019 | Independent Trustee Consultant, Columbia Funds since June 2019; Managing Director of Darragh Inc. (a strategy and talent management consulting firm) since 2010; Founder and CEO, Zolio (an investment management talent identification platform) since 2004; Partner, Tudor Investments, 2004-2010; Senior Partner, McKinsey & Company, 2001-2004 | 70 | Director, University of Edinburgh Business School; former Director, Boston Public Library Foundation |
Natalie A. Trunow
c/o Columbia
Management Investment
Advisers, LLC,
225 Franklin Street
Mail Drop BX32 05228,
Boston, MA 02110
1967 | Independent Trustee Consultant
2016 | Independent Trustee Consultant, Columbia Funds since September 2016; Chief Executive Officer, Millennial Portfolio Solutions LLC (asset management and consulting services) since January 2016; Director of Investments, Casey Family Programs, April 2016-September 2016; Senior Vice President and Chief Investment Officer, Calvert Investments, August 2008-January 2016; Section Head and Portfolio Manager, General Motors Asset Management, June 1997-August 2008 | 70 | Director, Health Services for Children with Special Needs, Inc.; Director, Consumer Credit Counseling Services (formerly Guidewell Financial Solutions) |
| * | J. Kevin Connaughton was appointed consultant to the Independent Trustees effective March 1, 2016. Olive Darragh was appointed consultant to the Independent Trustees effective June 10, 2019. Natalie A. Trunow was appointed consultant to the Independent Trustees effective September 1, 2016. Shareholders of the Funds are expected to be asked to elect each of Mr. Connaughton, Ms. Darragh and Ms. Trunow as a Trustee at a future shareholder meeting. |
Interested trustee affiliated with Investment Manager*
| Name, address, year of birth | Position held with the Trust and length of service | Principal occupation(s) during the past five years and other relevant professional experience | Number of Funds in the Columbia Funds Complex overseen | Other directorships held by Trustee during the past five years |
William F. Truscott
c/o Columbia Management
Investment Advisers, LLC
225 Franklin Street
Boston, MA 02110
1960 | Trustee
2012 | Chairman of the Board and President, Columbia Management Investment Advisers, LLC since May 2010 and February 2012, respectively; Chief Executive Officer, Global Asset Management, Ameriprise Financial, Inc. since September 2012 (previously Chief Executive Officer, U.S. Asset Management & President, Annuities, May 2010-September 2012); Director and Chief Executive Officer, Columbia Management Investment Distributors, Inc. since May 2010 and February 2012, respectively; Chairman of the Board and Chief Executive Officer, RiverSource Distributors, Inc. since 2006; Director, Threadneedle Asset Management Holdings, SARL since 2014; President and Chief Executive Officer, Ameriprise Certificate Company, 2006-August 2012 | 192 | Chairman of the Board, Columbia Management Investment Advisers, LLC since May 2010; Director, Columbia Management Investment Distributors, Inc. since May 2010; former Director, Ameriprise Certificate Company, August 2006 - January 2013 |
| * | Interested person (as defined under the 1940 Act) by reason of being an officer, director, security holder and/or employee of the Investment Manager or Ameriprise Financial. |
The Statement of Additional Information has additional information about the Fund’s Board members and is available, without charge, upon request by calling 800.345.6611, visiting columbiathreadneedleus.com/investor/ or contacting your financial intermediary.
Multi-Manager Alternative Strategies Fund | Annual Report 2019
| 81 |
TRUSTEES AND OFFICERS (continued)
The Board has appointed officers who are responsible for day-to-day business decisions based on policies it has established. The officers serve at the pleasure of the Board. The following table provides basic information about the Officers of the Fund as of the printing of this report, including principal occupations during the past five years, although their specific titles may have varied over the period. In addition to Mr. Truscott, who is Senior Vice President, the Fund’s other officers are:
Fund officers
Name,
address and
year of birth | Position and year
first appointed to
position for any Fund
in the Columbia
Funds complex or a
predecessor thereof | Principal occupation(s) during past five years |
Christopher O. Petersen
5228 Ameriprise
Financial Center
Minneapolis, MN 55474
Born 1970 | President and Principal Executive Officer (2015) | Vice President and Lead Chief Counsel, Ameriprise Financial, Inc. since January 2015 (previously Vice President and Chief Counsel, January 2010 - December 2014; officer of Columbia Funds and affiliated funds since 2007. |
Michael G. Clarke
225 Franklin Street
Boston, MA 02110
Born 1969 | Chief Financial Officer (Principal Financial Officer) (2009) and Senior Vice President (2019) | Vice President, Head of North American Operations, and Co-Head of Global Operations, Columbia Management Investment Advisers, LLC, since June 2019 (previously Vice President – Accounting and Tax, May 2010 - May 2019); senior officer of Columbia Funds and affiliated funds since 2002 (previously Treasurer and Chief Accounting Officer, January 2009 - January 2019 and December 2015 - January 2019, respectively). |
Joseph Beranek
5890 Ameriprise
Financial Center
Minneapolis, MN 55474
Born 1965 | Treasurer and Chief Accounting Officer (Principal Accounting Officer) (2019) | Vice President — Mutual Fund Accounting and Financial Reporting, Columbia Management Investment Advisers, LLC, since December 2018 and March 2017, respectively (previously Vice President — Pricing and Corporate Actions, May 2010 - March 2017). |
Paul B. Goucher
485 Lexington Avenue
New York, NY 10017
Born 1968 | Senior Vice President (2011) and Assistant Secretary (2008) | Senior Vice President and Assistant General Counsel, Ameriprise Financial, Inc. since January 2017 (previously Vice President and Lead Chief Counsel, November 2008 - January 2017 and January 2013 - January 2017, respectively); Vice President, Chief Legal Officer and Assistant Secretary, Columbia Management Investment Advisers, LLC since March 2015 (previously Vice President and Assistant Secretary, May 2010 – March 2015). |
Thomas P. McGuire
225 Franklin Street
Boston, MA 02110
Born 1972 | Senior Vice President and Chief Compliance Officer (2012) | Vice President — Asset Management Compliance, Ameriprise Financial, Inc., since May 2010; Chief Compliance Officer, Ameriprise Certificate Company since September 2010. |
Colin Moore
225 Franklin Street
Boston, MA 02110
Born 1958 | Senior Vice President (2010) | Executive Vice President and Global Chief Investment Officer, Ameriprise Financial, Inc., since July 2013; Executive Vice President and Global Chief Investment Officer, Columbia Management Investment Advisers, LLC since July 2013. |
Ryan C. Larrenaga
225 Franklin Street
Boston, MA 02110
Born 1970 | Senior Vice President (2017), Chief Legal Officer (2017), and Secretary (2015) | Vice President and Chief Counsel, Ameriprise Financial, Inc. since August 2018 (previously Vice President and Group Counsel, August 2011 - August 2018); officer of Columbia Funds and affiliated funds since 2005. |
Michael E. DeFao
225 Franklin Street
Boston, MA 02110
Born 1968 | Vice President (2011) and Assistant Secretary (2010) | Vice President and Chief Counsel, Ameriprise Financial, Inc. since May 2010. |
Lyn Kephart-Strong
5228 Ameriprise
Financial Center
Minneapolis, MN 55474
Born 1960 | Vice President (2015) | President, Columbia Management Investment Services Corp. since October 2014; Vice President & Resolution Officer, Ameriprise Trust Company since August 2009. |
| 82 | Multi-Manager Alternative Strategies Fund | Annual Report 2019 |
Board Consideration and Approval of Management
and Subadvisory Agreements
On June 12, 2019, the Board of Trustees (the Board) and the Trustees who are not interested persons (as defined in the Investment Company Act of 1940) (the Independent Trustees) of Columbia Funds Series Trust I (the Trust) unanimously approved the continuation of the Management Agreement (the Management Agreement) with Columbia Management Investment Advisers, LLC (the Investment Manager) and the Subadvisory Agreements (the Subadvisory Agreements) between the Investment Manager and AlphaSimplex Group, LLC, AQR Capital Management, LLC, Manulife Investment Management (US) LLC, TCW Investment Management Company LLC and Water Island Capital, LLC (the Subadvisers) with respect to Multi-Manager Alternative Strategies Fund (the Fund), a series of the Trust. As detailed below, the Board’s Advisory Fees and Expenses Committee (the Committee) and the Board met on multiple occasions to review and discuss, among themselves, with the management team of the Investment Manager and with an independent fee consultant, materials provided by the Investment Manager, the independent fee consultant and others before determining to approve the continuation of the Management Agreement and the Subadvisory Agreements (collectively, the Agreements).
In connection with their deliberations regarding the continuation of the Management Agreement and the Subadvisory Agreements, the Committee and the Board evaluated materials requested from the Investment Manager regarding the Fund and the Agreements, and discussed these materials with representatives of the Investment Manager at Committee meetings held on March 5, 2019, April 25, 2019 and June 11, 2019 and at Board meetings held on March 6, 2019 and June 12, 2019. In addition, the Board and its various committees consider matters bearing on the Agreements at other meetings throughout the year and in prior years and meet regularly with senior management of the Trust and the Investment Manager. Through the Board’s Investment Oversight Committees, Trustees also meet with selected portfolio managers of the funds the Trustees oversee and with other investment personnel at various times throughout the year. The Committee and the Board also consulted with the independent fee consultant, Fund counsel and the Independent Trustees’ independent legal counsel, who advised on various matters with respect to the Committee’s and the Board’s considerations and otherwise assisted the Committee and the Board in their deliberations. On June 11, 2019, the Committee recommended that the Board approve the continuation of the Management Agreement and the Subadvisory Agreements. On June 12, 2019, the Board, including the Independent Trustees, voting separately, unanimously approved the continuation of the Management Agreement and the Subadvisory Agreements for the Fund.
The Committee and the Board considered all information that they, their legal counsel or the Investment Manager believed reasonably necessary to evaluate and to determine whether to recommend for approval or approve the continuation of the Management Agreement and the Subadvisory Agreements. The information and factors considered by the Committee and the Board in recommending for approval or approving the continuation of the Management Agreement and the Subadvisory Agreements for the Fund included the following:
| • | Information on the investment performance of the Fund relative to the performance of a group of mutual funds determined to be comparable to the Fund by an independent third-party data provider, as well as performance relative to benchmarks; |
| • | Information on the Fund’s management fees and total expenses, including information comparing the Fund’s expenses to those of a group of comparable mutual funds, as determined by the independent third-party data provider; |
| • | The Investment Manager’s agreement to contractually limit or cap total operating expenses for the Fund through December 31, 2020 so that total operating expenses (excluding certain fees and expenses, such as transaction costs and certain other investment related expenses, interest, taxes, acquired fund fees and expenses, and infrequent and/or unusual expenses) would not exceed a specified annual rate, as a percentage of the Fund’s net assets; |
| • | The terms and conditions of the Agreements; |
| • | The subadvisory fees payable by the Investment Manager under the Subadvisory Agreements; |
| • | The current and proposed terms and conditions of other agreements and arrangements with affiliates of the Investment Manager relating to the operations of the Fund, including agreements with respect to the provision of distribution, transfer agency and shareholder services to the Fund; |
| • | Descriptions of various functions performed by the Investment Manager and the Subadvisers under the Agreements, including portfolio management and portfolio trading practices; |
Multi-Manager Alternative Strategies Fund | Annual Report 2019
| 83 |
Board Consideration and Approval of Management
and Subadvisory Agreements (continued)
| • | Information regarding the management fees of similarly-managed portfolios of other clients of the Investment Manager, including institutional accounts and collective trusts; |
| • | Information regarding the reputation, regulatory history and resources of the Investment Manager and Subadvisers, including information regarding senior management, portfolio managers and other personnel; |
| • | Information regarding the capabilities of the Investment Manager and the Subadvisers with respect to compliance monitoring services, including an assessment of the Investment Manager’s and the Subadvisers’ compliance systems by the Fund’s Chief Compliance Officer; and |
| • | The profitability to the Investment Manager and its affiliates from their relationships with the Fund. |
Nature, extent and quality of services provided under the Agreements
The Committee and the Board considered the nature, extent and quality of services provided to the Fund by the Investment Manager, the Subadvisers and the Investment Manager’s affiliates under the Agreements and under separate agreements for the provision of transfer agency and shareholder services, and the resources dedicated to the Fund and the other Columbia Funds by the Investment Manager, the Subadvisers and the Investment Manager’s affiliates. The Committee and the Board considered, among other things, the Investment Manager’s ability to attract, motivate and retain highly qualified research, advisory and supervisory investment professionals (including compensation programs for personnel involved in fund management, reputation and other attributes), the portfolio management services provided by those investment professionals, and the quality of the Investment Manager’s and the Subadvisers’ investment research capabilities and trade execution services. The Committee and the Board also considered the potential benefits to shareholders of investing in a mutual fund that is part of a fund complex offering exposure to a variety of asset classes and investment disciplines and providing a variety of fund and shareholder services.
The Committee and the Board also considered the professional experience and qualifications of the senior personnel of the Investment Manager and the Subadvisers, which included consideration of the Subadvisers’ experience with funds using an investment strategy similar to that used by the Subadvisers for the Fund. The Committee and the Board noted the compliance programs of and the compliance-related resources provided to the Fund by the Investment Manager and its affiliates and the resources dedicated by the Investment Manager and its affiliates to risk management, and considered the Investment Manager’s ability to provide administrative services to the Fund and coordinate the activities of the Fund’s other service providers. The Board also noted that, based on information provided by the Investment Manager, the Board had approved each Subadviser’s code of ethics and compliance program, and that the Chief Compliance Officer of the Funds reports to the Trustees on each Subadviser’s compliance program.
The Committee and the Board considered the diligence and selection process undertaken by the Investment Manager to select each Subadviser, including the Investment Manager’s rationale for recommending the continuation of the Subadvisory Agreements, and the process for monitoring each Subadviser’s ongoing performance of services for the Fund. As part of these deliberations, the Committee and the Board considered the ability of the Investment Manager, subject to the approval of the Board, to modify or enter into new subadvisory agreements without a shareholder vote pursuant to an exemptive order of the Securities and Exchange Commission. The Committee and the Board also considered the scope of services provided to the Fund by the Investment Manager that are distinct from and in addition to those provided by the Subadvisers, including cash flow management, treasury services, risk oversight, investment oversight and Subadviser selection, oversight and transition management. After reviewing these and related factors, the Committee and the Board concluded, within the context of their overall conclusions, that the nature, extent and quality of the services provided to the Fund under the Agreements supported the continuation of the Management Agreement and the Subadvisory Agreements.
Investment performance
The Committee and the Board reviewed information about the performance of the Fund over various time periods, including performance information relative to benchmarks, information that compared the performance of the Fund to the performance of a group of comparable mutual funds as determined by the independent third-party data provider, and information and analysis provided by the independent fee consultant. The Committee and the Board also reviewed a description of the third party’s methodology for identifying the Fund’s peer groups for purposes of performance and expense comparisons. Although
| 84 | Multi-Manager Alternative Strategies Fund | Annual Report 2019 |
Board Consideration and Approval of Management
and Subadvisory Agreements (continued)
��
the Fund’s performance lagged that of a relevant peer group for certain (although not necessarily all) periods, the Committee and the Board concluded that other factors relevant to performance were sufficient, in light of other considerations, to support continuation of the Management Agreement and the Subadvisory Agreement. Those factors included one or more of the following: (i) that the Fund’s performance, although lagging in certain recent periods, was stronger over the longer term; (ii) that the underperformance was attributable, to a significant extent, to investment decisions that were reasonable and consistent with the Fund’s investment strategy and policies and that the Fund was performing within a reasonable range of expectations, given those investment decisions, market conditions and the Fund’s investment strategy; (iii) that the Fund’s performance was competitive when compared to other relevant performance benchmarks or peer groups; and (iv) that the Investment Manager had taken or was taking steps designed to help improve the Fund’s investment performance, including, but not limited to, replacing portfolio managers, enhancing the resources supporting the portfolio managers, or modifying investment strategies.
The Committee and the Board noted that, through December 31, 2018, the Fund’s performance was in the twenty-third, eighty-third and ninety-sixth percentile (where the best performance would be in the first percentile) of its category selected by the independent third-party data provider for the purposes of performance comparisons for the one-, three- and five-year periods, respectively.
The Committee and the Board also considered the Investment Manager’s and Subadvisers’ performance and reputation generally, the Investment Manager’s evaluation of each Subadviser’s contribution to the Fund’s broader investment mandate, the Investment Manager’s historical responsiveness to Board concerns about performance, and the Investment Manager’s willingness to take steps intended to improve performance. After reviewing these and related factors, the Committee and the Board concluded, within the context of their overall conclusions, that the performance of the Fund, the Investment Manager and the Subadvisers were sufficient, in light of other considerations, to support the continuation of the Management Agreement and the Subadvisory Agreements.
Investment management fee rates and other expenses
The Committee and the Board considered the management fees charged to the Fund under the Management Agreement and the Subadvisory Agreements, as well as the total expenses incurred by the Fund. In assessing the reasonableness of the fees under the Management Agreement, the Committee and the Board considered, among other information, the Fund’s total expense ratio as a percentage of average daily net assets. The Committee and the Board considered data provided by the independent third-party data provider and the independent fee consultant. The Committee and the Board noted that, as of December 31, 2018, the Fund’s actual management fee and net total expense ratio were ranked in the third and second quintiles, respectively, (where the lowest fees and expenses would be in the first quintile) against the Fund’s expense universe as determined by the independent third-party data provider for purposes of expense comparison. The Committee and the Board also considered the fees that the Subadvisers charge to their other clients and noted that the Investment Manager pays the fees of the Subadvisers. The Committee and the Board also took into account the fee waiver and expense limitation arrangements agreed to by the Investment Manager, as noted above.
The Committee and the Board also received and considered information about the management fees charged by the Investment Manager to institutional accounts. In considering the fees charged to those accounts, the Committee and the Board took into account, among other things, the Investment Manager’s representations about the differences between managing mutual funds as compared to other types of accounts, including differences in the services provided, differences in the risk profile of such business for the Investment Manager and the additional resources required to manage mutual funds effectively. The Committee and the Board also received and considered information about the fees charged by the Investment Manager for sub-advisory services it provides to comparable unaffiliated funds. In evaluating the Fund’s management fees, the Committee and the Board also took into account the demands, complexity and quality of the investment management of the Fund.
After reviewing these and related factors, the Committee and the Board concluded, within the context of their overall conclusions, that the management fee rates and expenses of the Fund, in light of other considerations, supported the continuation of the Management Agreement and the Subadvisory Agreements.
Multi-Manager Alternative Strategies Fund | Annual Report 2019
| 85 |
Board Consideration and Approval of Management
and Subadvisory Agreements (continued)
Costs of services provided and profitability
The Committee and the Board also took note of the costs the Investment Manager and its affiliates incur in connection with the services provided and the profitability to the Investment Manager and its affiliates from their relationships with the Fund, and the efforts undertaken by the Investment Manager and its affiliates to manage efficiently their costs to provide such services.
The Committee and the Board also considered the compensation directly or indirectly received by the Investment Manager’s affiliates in connection with their relationships with the Fund. The Committee and the Board reviewed information provided by management as to the profitability to the Investment Manager and its affiliates of their relationships with the Fund, including with respect to funds for which unaffiliated subadvisers provide services, information about changes in profitability in connection with a change in the Fund’s subadviser, information about the allocation of expenses used to calculate profitability, and comparisons of profitability levels realized in 2018 to profitability levels realized in 2017. When reviewing profitability, the Committee and the Board also considered court cases in which adviser profitability was an issue in whole or in part, the performance of similarly managed funds, the performance of the Fund, and the expense ratio of the Fund. In addition, the Committee and the Board considered information provided by the Investment Manager regarding the Investment Manager’s financial condition and comparing its profitability to that of other asset management firms that are, or are subsidiaries of, publicly traded companies. In this regard, the Committee and the Board also considered data provided by the independent fee consultant. Because the Subadvisory Agreements were negotiated at arms-length by the Investment Manager, which is responsible for payments to the Subadvisers thereunder, the Committee and the Board did not consider the profitability to each Subadviser from its relationship with the Fund.
After reviewing these and related factors, the Committee and the Board concluded, within the context of their overall conclusions, that the costs of services provided and the profitability to the Investment Manager and its affiliates from their relationships with the Fund supported the continuation of the Management Agreement and the Subadvisory Agreements.
Economies of scale
The Committee and the Board considered the potential existence of economies of scale in the provision by the Investment Manager of services to the Fund, to groups of related funds, and to the Investment Manager’s investment advisory clients as a whole, and whether those economies of scale were shared with the Fund through breakpoints in investment management fees or other means, such as expense limitation arrangements and additional investments by the Investment Manager in investment, trading, compliance and other resources. The Committee and the Board noted that the management fee schedules for the Fund contained breakpoints that would reduce the fee rate on assets above specified threshold levels.
The Committee and the Board noted that the breakpoints in the Subadvisory Agreements did not occur at the same levels as the breakpoints in the Management Agreement. The Committee and the Board noted that absent a shareholder vote, the Investment Manager would bear any increase in fees payable under the Subadvisory Agreements. The Committee and the Board also noted the potential challenges of seeking to tailor the Management Agreement breakpoints to those of a subadvisory agreement in this context, and the effect that capacity constraints on a subadviser’s ability to manage assets could potentially have on the ability of the Investment Manager to achieve economies of scale, as new subadvisers may need to be added as the Fund grows, increasing the Investment Manager’s cost of compensating and overseeing the Fund’s subadvisers.
In considering these matters, the Committee and the Board also considered the costs of the services provided and the profitability to the Investment Manager and its affiliates from their relationships with the Fund, as noted above. After reviewing these and related factors, the Committee and the Board concluded, within the context of their overall conclusions, that the extent to which any economies of scale were expected to be shared with the Fund supported the continuation of the Management Agreement and the Subadvisory Agreements.
Other benefits to the Investment Manager and Subadvisers
The Committee and the Board received and considered information regarding “fall-out” or ancillary benefits received by the Investment Manager and its affiliates as a result of their relationships with the Fund, such as the engagement of the Investment Manager’s affiliates to provide distribution, transfer agency and shareholder services to the Fund. In this regard,
| 86 | Multi-Manager Alternative Strategies Fund | Annual Report 2019 |
Board Consideration and Approval of Management
and Subadvisory Agreements (continued)
among other matters, the Committee and the Board considered that the Fund’s distributor retains a portion of the distribution fees from the Fund and receives a portion of the sales charges on sales or redemptions of certain classes of shares of the Fund. The Committee and the Board also considered the benefits of research made available to the Subadvisers by reason of brokerage commissions generated by the Fund’s securities transactions, and reviewed information about the Investment Manager’s practices with respect to considering brokerage and research services when allocating portfolio transactions. In this connection, the Board also noted that the amount of research made available to the Investment Manager by reason of brokerage commissions had been declining over time, and may decline further. The Committee and the Board recognized that the Investment Manager’s profitability would be somewhat lower without these benefits.
Conclusion
The Committee and the Board reviewed all of the above considerations in reaching their decisions to recommend or approve the continuation of the Management Agreement and the Subadvisory Agreements. In their deliberations, the Trustees did not identify any particular information that was all-important or controlling, and individual Trustees may have attributed different weights to the various factors. Based on their evaluation of all factors that they deemed to be material, including those factors described above, and assisted by the advice of independent legal counsel, the Board, including the Independent Trustees, voting separately, unanimously approved the continuation of the Management Agreement and the Subadvisory Agreements.
Multi-Manager Alternative Strategies Fund | Annual Report 2019
| 87 |
Multi-Manager Alternative Strategies Fund
P.O. Box 219104
Kansas City, MO 64121-9104
Please read and consider the investment objectives, risks, charges and expenses for any fund carefully before investing. For a prospectus and summary prospectus, which contains this and other important information about the Fund, go to
columbiathreadneedleus.com/investor/. The Fund is distributed by Columbia Management Investment Distributors, Inc., member FINRA, and managed by Columbia Management Investment Advisers, LLC.
Columbia Threadneedle Investments (Columbia Threadneedle) is the global brand name of the Columbia and Threadneedle group of companies. All rights reserved.
© 2019 Columbia Management Investment Advisers, LLC.
columbiathreadneedleus.com/investor/

Annual Report
August 31, 2019
Columbia Global Energy and Natural Resources Fund
Beginning on January 1, 2021, as permitted by regulations adopted by the Securities and Exchange Commission, paper copies of the Fund’s annual and semiannual shareholder reports like this one will no longer be sent by mail, unless you specifically request paper copies of the reports. Instead, the reports will be made available on the Fund’s website (columbiathreadneedleus.com/investor/), and each time a report is posted you will be notified by mail and provided with a website address to access the report.
If you have already elected to receive shareholder reports electronically, you will not be affected by this change and you need not take any action. You may elect to receive shareholder reports and other communications from the Fund electronically at any time by contacting your financial intermediary (such as a broker-dealer or bank) or, for Fund shares held directly with the Fund, by calling 800.345.6611 or by enrolling in “eDelivery” by logging into your account at columbiathreadneedleus.com/investor/.
You may elect to receive all future reports in paper free of charge. If you invest through a financial intermediary, you can contact your financial intermediary to request that you continue receiving paper copies of your shareholder reports. If you invest directly with the Fund, you can call 800.345.6611 to let the Fund know you wish to continue receiving paper copies of your shareholder reports. Your election to receive paper reports will apply to all Columbia Funds held in your account if you invest through a financial intermediary or all Columbia Funds held with the fund complex if you invest directly with the Fund.
Not FDIC Insured • No bank guarantee • May lose value
Columbia Global Energy and Natural Resources Fund (the Fund) mails one shareholder report to each shareholder address, unless such shareholder elected to receive shareholder reports from the Fund electronically. If you would like more than one report, please call shareholder services at 800.345.6611 and additional reports will be sent to you.
Proxy voting policies and procedures
The policy of the Board of Trustees is to vote the proxies of the companies in which the Fund holds investments consistent with the procedures as stated in the Statement of Additional Information (SAI). You may obtain a copy of the SAI without charge by calling 800.345.6611; contacting your financial intermediary; visiting columbiathreadneedleus.com/investor/; or searching the website of the Securities and Exchange Commission (SEC) at sec.gov. Information regarding how the Fund voted proxies relating to portfolio securities is filed with the SEC by August 31st for the most recent 12-month period ending June 30th of that year, and is available without charge by visiting columbiathreadneedleus.com/investor/, or searching the website of the SEC at sec.gov.
Quarterly schedule of investments
The Fund files a complete schedule of portfolio holdings with the SEC for the first and third quarters of each fiscal year on Form N-PORT, and for reporting periods ended prior to March 31, 2019, on Form N-Q. The Fund’s Form N-Q and Form N-PORT filings are available on the SEC’s website at sec.gov. The Fund’s complete schedule of portfolio holdings, as filed on Form N-Q or Form N-PORT, can also be obtained without charge, upon request, by calling 800.345.6611.
Additional Fund information
For more information about the Fund, please visit columbiathreadneedleus.com/investor/ or call 800.345.6611. Customer Service Representatives are available to answer your questions Monday through Friday from 8 a.m. to 7 p.m. Eastern time.
Fund investment manager
Columbia Management Investment Advisers, LLC (the Investment Manager)
225 Franklin Street
Boston, MA 02110
Fund distributor
Columbia Management Investment Distributors, Inc.
225 Franklin Street
Boston, MA 02110
Fund transfer agent
Columbia Management Investment Services Corp.
P.O. Box 219104
Kansas City, MO 64121-9104
Columbia Global Energy and Natural Resources Fund | Annual Report 2019
Investment objective
The Fund seeks long-term capital appreciation.
Portfolio management
Josh Kapp, CFA
Portfolio Manager
Managed Fund since 2011
Morningstar style boxTM
The Morningstar Style Box is based on a fund’s portfolio holdings. For equity funds, the vertical axis shows the market capitalization of the stocks owned, and the horizontal axis shows investment style (value, blend, or growth). Information shown is based on the most recent data provided by Morningstar.
© 2019 Morningstar, Inc. All rights reserved. The Morningstar information contained herein: (1) is proprietary to Morningstar and/or its content providers; (2) may not be copied or distributed; and (3) is not warranted to be accurate, complete or timely. Neither Morningstar nor its content providers are responsible for any damages or losses arising from any use of this information.
| Average annual total returns (%) (for the period ended August 31, 2019) |
| | | Inception | 1 Year | 5 Years | 10 Years |
| Class A | Excluding sales charges | 09/28/07 | -18.32 | -6.05 | 0.97 |
| | Including sales charges | | -23.01 | -7.15 | 0.37 |
| Advisor Class* | 11/08/12 | -18.09 | -5.81 | 1.23 |
| Class C | Excluding sales charges | 09/28/07 | -18.92 | -6.75 | 0.22 |
| | Including sales charges | | -19.72 | -6.75 | 0.22 |
| Institutional Class | 12/31/92 | -18.06 | -5.80 | 1.23 |
| Institutional 2 Class* | 11/08/12 | -17.97 | -5.66 | 1.34 |
| Institutional 3 Class* | 03/01/17 | -17.94 | -5.72 | 1.28 |
| Class R* | 09/27/10 | -18.53 | -6.28 | 0.72 |
| Blended Benchmark | | -12.78 | -3.35 | 2.80 |
| S&P North American Natural Resources Sector Index | | -18.00 | -7.95 | 1.83 |
Returns for Class A shares are shown with and without the maximum initial sales charge of 5.75%. Returns for Class C shares are shown with and without the 1.00% contingent deferred sales charge for the first year only. The Fund’s other share classes are not subject to sales charges and have limited eligibility. Please see the Fund’s prospectus for details. Performance for different share classes will vary based on differences in sales charges and fees associated with each share class. All results shown assume reinvestment of distributions during the period. Returns do not reflect the deduction of taxes that a shareholder may pay on Fund distributions or on the redemption of Fund shares. Performance results reflect the effect of any fee waivers or reimbursements of Fund expenses by Columbia Management Investment Advisers, LLC and/or any of its affiliates. Absent these fee waivers or expense reimbursement arrangements, performance results would have been lower.
The performance information shown represents past performance and is not a guarantee of future results. The investment return and principal value of your investment will fluctuate so that your shares, when redeemed, may be worth more or less than their original cost. Current performance may be lower or higher than the performance information shown. You may obtain performance information current to the most recent month-end by contacting your financial intermediary, visiting columbiathreadneedleus.com/investor/ or calling 800.345.6611.
| * | The returns shown for periods prior to the share class inception date (including returns for the Life of the Fund, if shown, which are since Fund inception) include the returns of the Fund’s oldest share class. These returns are adjusted to reflect any higher class-related operating expenses of the newer share classes, as applicable. Please visit columbiathreadneedleus.com/investor/investment-products/mutual-funds/appended-performance for more information. |
The Fund’s performance prior to August 2013 reflects returns achieved pursuant to different principal investment strategies. If the Fund’s current strategies had been in place for the prior periods, results shown may have been different.
The Blended Benchmark, a weighted custom composite, established by the Investment Manager, consists of a 60% weighting in the MSCI World Energy Sector Index (Net) and a 40% weighting in the MSCI World Materials Sector Index (Net). The MSCI World Energy Sector Index (Net) is a free float-adjusted market capitalization weighted index that represents the energy segment in global developed market equity performance. The MSCI World Materials Sector Index (Net) is a free float-adjusted market capitalization weighted index that represents the materials segment in global developed-market equity performance.
The S&P North American Natural Resources Sector Index is a modified market capitalization-weighted equity index designed as a benchmark for U.S. traded securities in the natural resources sector. The index includes companies involved in the following categories: extractive industries, energy companies, owners and operators of timber tracts, forestry services, producers of pulp and paper and owners of plantations.
Indices are not available for investment, are not professionally managed and do not reflect sales charges, fees, brokerage commissions, taxes (except the MSCI World Energy Sector Index (Net) and the MSCI World Materials Sector Index (Net), which reflect reinvested dividends net of withholding taxes) or other expenses of investing. Securities in the Fund may not match those in an index.
Columbia Global Energy and Natural Resources Fund | Annual Report 2019
| 3 |
Fund at a Glance (continued)
Performance of a hypothetical $10,000 investment (August 31, 2009 — August 31, 2019)
The chart above shows the change in value of a hypothetical $10,000 investment in Class A shares of Columbia Global Energy and Natural Resources Fund during the stated time period, and does not reflect the deduction of taxes that a shareholder may pay on Fund distributions or on the redemption of Fund shares.
| Top 10 holdings (%) (at August 31, 2019) |
| Chevron Corp. (United States) | 8.3 |
| Exxon Mobil Corp. (United States) | 7.5 |
| BP PLC (United Kingdom) | 6.2 |
| Royal Dutch Shell PLC, Class A (United Kingdom) | 5.8 |
| Rio Tinto PLC (United Kingdom) | 5.2 |
| VanEck Vectors Gold Miners ETF (United States) | 4.3 |
| ConocoPhillips Co. (United States) | 3.9 |
| Total SA (France) | 3.5 |
| Suncor Energy, Inc. (Canada) | 3.2 |
| TC Energy Corp. (Canada) | 2.8 |
Percentages indicated are based upon total investments excluding Money Market Funds and investments in derivatives, if any.
For further detail about these holdings, please refer to the section entitled “Portfolio of Investments.”
Fund holdings are as of the date given, are subject to change at any time, and are not recommendations to buy or sell any security.
| Equity sector breakdown (%) (at August 31, 2019) |
| Energy | 63.5 |
| Materials | 36.5 |
| Total | 100.0 |
Percentages indicated are based upon total equity investments. The Fund’s portfolio composition is subject to change.
| Country breakdown (%) (at August 31, 2019) |
| Australia | 0.8 |
| Canada | 7.9 |
| France | 6.3 |
| Germany | 3.3 |
| Japan | 2.9 |
| Netherlands | 0.5 |
| Switzerland | 1.0 |
| United Kingdom | 18.0 |
| United States(a) | 59.3 |
| Total | 100.0 |
| (a) | Includes investments in Money Market Funds. |
Country breakdown is based primarily on issuer’s place of organization/incorporation. Percentages indicated are based upon total investments excluding investments in derivatives, if any. The Fund’s portfolio composition is subject to change.
The Fund may use place of organization/incorporation or other factors in determining whether an issuer is domestic (U.S.) or foreign for purposes of its investment policies. At August 31, 2019, the Fund invested at least 40% of its net assets in foreign companies in accordance with its principal investment strategy.
| 4 | Columbia Global Energy and Natural Resources Fund | Annual Report 2019 |
Fund at a Glance (continued)
Summary of investments in securities by industry (%)
(at August 31, 2019) |
| Chemicals | 21.1 |
| Containers & Packaging | 2.5 |
| Energy Equipment & Services | 3.2 |
| Metals & Mining | 15.0 |
| Oil, Gas & Consumable Fuels | 56.8 |
| Money Market Funds | 0.2 |
| Total | 98.8 |
Percentages indicated are based upon net assets. The Fund’s portfolio composition is subject to change.
Columbia Global Energy and Natural Resources Fund | Annual Report 2019
| 5 |
Manager Discussion of Fund Performance
For the 12-month period that ended August 31, 2019, the Fund’s Class A shares returned -18.32% excluding sales charges. During the same 12-month period, the Fund’s Blended Benchmark returned -12.78% and the S&P North American Natural Resources Sector Index returned -18.00%. The Fund’s overall value/cyclical orientation was out of favor during the period, as investors favored momentum-driven stocks. Stock selection in the materials sector was an additional drag on performance relative to the Fund’s Blended Benchmark.
Market overview
The price of oil and many other commodities fell during the period, driving stock prices in both the energy and materials sectors downward. The price of domestic oil declined 21% over the 12-month period. Most of that decline occurred in the fourth quarter of 2018, as global demand weakened and U.S. supply forecasts were revised upward. During the fourth quarter, the Trump administration surprised the markets by temporarily lifting sanctions on Iranian oil. Positioning in the futures market further pressured prices. Natural gas prices declined 22% over the same period, as new production resulted in an oversupply in the U.S. natural gas market for most of the period.
On the materials side of the portfolio, new supply growth, which had been stimulated by growing demand in 2017 and early 2018, met weakened demand in late 2018 and 2019, driving prices on copper, aluminum and steel downward. Iron ore prices were the exception, rising 42% largely on supply disruptions out of Brazil and typhoon-related disruptions in Australia. In a generally “risk-off” environment, the price of gold rose 27% for the period.
Contributors and detractors
Within the energy sector, the Fund’s defensive positioning and stock selection within integrated oils aided performance and helped offset the impact of an overweight in the exploration and production (E&P) industry and an underweight in pipeline companies, both of which detracted from relative results.
Within the energy sector, the Fund’s lack of exposure to Occidental, Schlumberger and EOG Resources, aided relative returns as all three declined sharply during the period. Investors took a dim view of Occidental’s bid to acquire Anadarko Petroleum at a significant premium. Occidental secured expensive financing for the deal from Warren Buffet, which raised questions about corporate governance when it raised the cash portion of its offer in order to sidestep a shareholder vote on the deal. Schlumberger shares declined along with the general industry downdraft for energy service stocks. Disappointing free cash flow generation and weaker-than-expected margins further weighed on Schlumberger. Falling crude oil prices and a higher-than-expected capital budget were a drag on EOG Resources. We passed on the stock because of valuation concerns and were rewarded for our decision. An overweight in TC Energy also aided performance for the period. Shares of the midstream Canadian pipeline company had been discounted because of concerns about balance sheet leverage, which we believed were overblown. The company’s cash flow is largely driven by regulated assets and long-term contracts, which offer a significant degree of stability. TC Energy also pays an attractive dividend.
TechnipFMC, Continental Resources and WPX Energy were among the biggest detractors from relative performance within the energy sector. Overweights in all three amplified the impact of their negative returns on relative results. TechnipFMC, an oil service company, was dragged down by overall weakness in the industry, disappointing free cash flow generation and weaker-than-expected subsea margins. Continental Resources and WPX Energy, E&P companies with more balance sheet leverage than their competitors, underperformed as oil prices collapsed. However, we remained confident in their long-term potential and continued to own both stocks.
In the materials sector, a position in VanEck Vectors Gold Miners ETF and an overweight in Rio Tinto, one of the world’s largest metals and mining corporations, made significant contributions to Fund returns. These gains helped offset losses from Steel Dynamics and Alcoa, which lost ground on falling commodity prices. Even though the Fund logged above-benchmark results from positions in FMC and Celanese, chemicals were the biggest drag on relative returns. The Fund had no exposure to some of the best performing names for the period. In addition, it lost ground with Livent, which manufactures and sells lithium compounds used in a variety of applications, as shares and lithium prices were pressured by supply/demand issues. An overweight in DuPont also hurt relative returns as the company failed to win investor confidence after Corteva Agriscience separated from DowDuPont, leaving DuPont as the remaining entity.
| 6 | Columbia Global Energy and Natural Resources Fund | Annual Report 2019 |
Manager Discussion of Fund Performance (continued)
At period’s end
During the period, we trimmed positions where our outlook had changed. We lowered the Fund’s energy holdings to bring the Fund closer to its neutral 60/40 mix of energy and materials, and we continued to emphasize large-cap integrated companies because their free cash flow and return on capital employed (ROCE) has increased compared to prior cycles. The Fund remained underweight in oil service companies, which tend to have the lowest ROCE within the energy sector and the weakest shareholder distribution programs. We made no significant changes in materials, where we continued to focus on value and identifying value-oriented opportunities for the Fund.
Market risk may affect a single issuer, sector of the economy, industry or the market as a whole.Foreigninvestments subject the Fund to risks, including political, economic, market, social and others within a particular country, as well as to currency instabilities and less stringent financial and accounting standards generally applicable to U.S. issuers. Investing inderivatives is a specialized activity that involves special risks that subject the Fund to significant loss potential, including when used as leverage, and may result in greater fluctuation in fund value. Issuers engaged in theenergy and natural resources industry may be subject to legislative or regulatory changes, adverse market conditions and/or increased competition. The values of natural resources are affected by numerous factors including naturally occurring events, demand, inflation, interest rates, and local and international politics. As anon-diversified fund, fewer investments could have a greater effect on performance. See the Fund’s prospectus for more information on these and other risks.
The views expressed in this report reflect the current views of the respective parties. These views are not guarantees of future performance and involve certain risks, uncertainties and assumptions that are difficult to predict, so actual outcomes and results may differ significantly from the views expressed. These views are subject to change at any time based upon economic, market or other conditions and the respective parties disclaim any responsibility to update such views. These views may not be relied on as investment advice and, because investment decisions for a Columbia fund are based on numerous factors, may not be relied on as an indication of trading intent on behalf of any particular Columbia fund. References to specific securities should not be construed as a recommendation or investment advice.
Columbia Global Energy and Natural Resources Fund | Annual Report 2019
| 7 |
Understanding Your Fund’s Expenses
(Unaudited)
As an investor, you incur two types of costs. There are shareholder transaction costs, which generally include sales charges on purchases and may include redemption fees. There are also ongoing fund costs, which generally include management fees, distribution and/or service fees, and other fund expenses. The following information is intended to help you understand your ongoing costs (in dollars) of investing in the Fund and to help you compare these costs with the ongoing costs of investing in other mutual funds.
Analyzing your Fund’s expenses
To illustrate these ongoing costs, we have provided examples and calculated the expenses paid by investors in each share class of the Fund during the period. The actual and hypothetical information in the table is based on an initial investment of $1,000 at the beginning of the period indicated and held for the entire period. Expense information is calculated two ways and each method provides you with different information. The amount listed in the “Actual” column is calculated using the Fund’s actual operating expenses and total return for the period. You may use the Actual information, together with the amount invested, to estimate the expenses that you paid over the period. Simply divide your account value by $1,000 (for example, an $8,600 account value divided by $1,000 = 8.6), then multiply the results by the expenses paid during the period under the “Actual” column. The amount listed in the “Hypothetical” column assumes a 5% annual rate of return before expenses (which is not the Fund’s actual return) and then applies the Fund’s actual expense ratio for the period to the hypothetical return. You should not use the hypothetical account values and expenses to estimate either your actual account balance at the end of the period or the expenses you paid during the period. See “Compare with other funds” below for details on how to use the hypothetical data.
Compare with other funds
Since all mutual funds are required to include the same hypothetical calculations about expenses in shareholder reports, you can use this information to compare the ongoing cost of investing in the Fund with other funds. To do so, compare the hypothetical example with the 5% hypothetical examples that appear in the shareholder reports of other funds. As you compare hypothetical examples of other funds, it is important to note that hypothetical examples are meant to highlight the ongoing costs of investing in a fund only and do not reflect any transaction costs, such as sales charges, or redemption or exchange fees. Therefore, the hypothetical calculations are useful in comparing ongoing costs only, and will not help you determine the relative total costs of owning different funds. If transaction costs were included in these calculations, your costs would be higher.
| March 1, 2019 — August 31, 2019 |
| | Account value at the
beginning of the
period ($) | Account value at the
end of the
period ($) | Expenses paid during
the period ($) | Fund’s annualized
expense ratio (%) |
| | Actual | Hypothetical | Actual | Hypothetical | Actual | Hypothetical | Actual |
| Class A | 1,000.00 | 1,000.00 | 906.20 | 1,018.40 | 6.36 | 6.73 | 1.33 |
| Advisor Class | 1,000.00 | 1,000.00 | 907.30 | 1,019.65 | 5.16 | 5.47 | 1.08 |
| Class C | 1,000.00 | 1,000.00 | 902.50 | 1,014.64 | 9.92 | 10.50 | 2.08 |
| Institutional Class | 1,000.00 | 1,000.00 | 907.90 | 1,019.65 | 5.17 | 5.47 | 1.08 |
| Institutional 2 Class | 1,000.00 | 1,000.00 | 908.30 | 1,020.36 | 4.50 | 4.76 | 0.94 |
| Institutional 3 Class | 1,000.00 | 1,000.00 | 908.20 | 1,020.66 | 4.21 | 4.46 | 0.88 |
| Class R | 1,000.00 | 1,000.00 | 905.00 | 1,017.15 | 7.55 | 7.99 | 1.58 |
Expenses paid during the period are equal to the annualized expense ratio for each class as indicated above, multiplied by the average account value over the period and then multiplied by the number of days in the Fund’s most recent fiscal half year and divided by 365.
Expenses do not include fees and expenses incurred indirectly by the Fund from its investment in underlying funds, including affiliated and non-affiliated pooled investment vehicles, such as mutual funds and exchange-traded funds.
| 8 | Columbia Global Energy and Natural Resources Fund | Annual Report 2019 |
Portfolio of Investments
August 31, 2019
(Percentages represent value of investments compared to net assets)
Investments in securities
| Common Stocks 92.6% |
| Issuer | Shares | Value ($) |
| Australia 0.8% |
| BHP Group Ltd. | 51,346 | 1,260,410 |
| Canada 7.8% |
| Canadian Natural Resources Ltd. | 95,052 | 2,270,996 |
| First Quantum Minerals Ltd. | 137,031 | 839,847 |
| Suncor Energy, Inc. | 174,799 | 5,112,418 |
| TC Energy Corp. | 89,310 | 4,576,182 |
| Total | 12,799,443 |
| France 6.2% |
| Air Liquide SA | 19,209 | 2,676,400 |
| Arkema SA | 20,453 | 1,796,652 |
| Total SA | 112,916 | 5,638,876 |
| Total | 10,111,928 |
| Germany 3.3% |
| BASF SE | 63,144 | 4,178,047 |
| Covestro AG | 24,940 | 1,133,360 |
| Total | 5,311,407 |
| Japan 2.8% |
| Mitsubishi Chemical Holdings Corp. | 336,700 | 2,307,888 |
| Mitsui Chemicals, Inc. | 53,400 | 1,139,242 |
| Teijin Ltd. | 63,900 | 1,147,386 |
| Total | 4,594,516 |
| Netherlands 0.5% |
| LyondellBasell Industries NV, Class A | 11,443 | 885,459 |
| Switzerland 1.0% |
| Clariant AG, Registered Shares(a) | 88,253 | 1,630,159 |
| United Kingdom 17.8% |
| BP PLC | 1,634,881 | 9,956,842 |
| Rio Tinto PLC | 166,217 | 8,424,841 |
| Royal Dutch Shell PLC, Class A | 333,468 | 9,264,811 |
| TechnipFMC PLC | 56,661 | 1,407,459 |
| Total | 29,053,953 |
| Common Stocks (continued) |
| Issuer | Shares | Value ($) |
| United States 52.4% |
| Albemarle Corp. | 20,086 | 1,239,909 |
| Alcoa Corp.(a) | 37,250 | 667,892 |
| Avery Dennison Corp. | 23,100 | 2,669,667 |
| Baker Hughes, Inc. | 65,352 | 1,417,485 |
| Celanese Corp., Class A | 28,844 | 3,270,044 |
| Chevron Corp. | 113,328 | 13,340,972 |
| Cimarex Energy Co. | 29,881 | 1,278,309 |
| ConocoPhillips Co. | 119,687 | 6,245,268 |
| Continental Resources, Inc.(a) | 58,233 | 1,700,404 |
| Delek U.S. Holdings, Inc. | 26,481 | 867,253 |
| Diamondback Energy, Inc. | 32,933 | 3,230,069 |
| Dow, Inc. | 67,272 | 2,867,805 |
| DuPont de Nemours, Inc. | 49,675 | 3,374,423 |
| Eastman Chemical Co. | 32,906 | 2,151,065 |
| Exxon Mobil Corp. | 176,619 | 12,094,869 |
| FMC Corp. | 44,601 | 3,850,404 |
| Freeport-McMoRan, Inc. | 185,092 | 1,700,995 |
| Halliburton Co. | 80,965 | 1,525,381 |
| Livent Corp.(a) | 102,172 | 628,358 |
| Marathon Petroleum Corp. | 68,815 | 3,386,386 |
| Noble Energy, Inc. | 94,551 | 2,134,962 |
| Nucor Corp. | 30,665 | 1,501,972 |
| Olympic Steel, Inc. | 58,330 | 627,047 |
| Owens-Illinois, Inc. | 109,522 | 1,113,839 |
| Patterson-UTI Energy, Inc. | 93,441 | 808,265 |
| Steel Dynamics, Inc. | 102,953 | 2,779,731 |
| Valero Energy Corp. | 45,791 | 3,447,146 |
| WestRock Co. | 10,860 | 371,195 |
| Williams Companies, Inc. (The) | 151,730 | 3,580,828 |
| WPX Energy, Inc.(a) | 148,656 | 1,599,538 |
| Total | 85,471,481 |
Total Common Stocks
(Cost $157,223,126) | 151,118,756 |
|
The accompanying Notes to Financial Statements are an integral part of this statement.
Columbia Global Energy and Natural Resources Fund | Annual Report 2019
| 9 |
Portfolio of Investments (continued)
August 31, 2019
| Exchange-Traded Funds 4.2% |
| | Shares | Value ($) |
| United States 4.2% |
| VanEck Vectors Gold Miners ETF | 228,799 | 6,831,938 |
Total Exchange-Traded Funds
(Cost $4,079,847) | 6,831,938 |
|
| Limited Partnerships 1.8% |
| Issuer | Shares | Value ($) |
| United States 1.8% |
| Enterprise Products Partners LP | 75,313 | 2,147,173 |
| Rattler Midstream LP(a) | 39,170 | 717,203 |
| Total | 2,864,376 |
Total Limited Partnerships
(Cost $2,951,531) | 2,864,376 |
|
| Money Market Funds 0.2% |
| | Shares | Value ($) |
| Columbia Short-Term Cash Fund, 2.208%(b),(c) | 367,159 | 367,123 |
Total Money Market Funds
(Cost $367,123) | 367,123 |
Total Investments in Securities
(Cost $164,621,627) | 161,182,193 |
| Other Assets & Liabilities, Net | | 2,027,893 |
| Net Assets | $163,210,086 |
Notes to Portfolio of Investments
| (a) | Non-income producing investment. |
| (b) | The rate shown is the seven-day current annualized yield at August 31, 2019. |
| (c) | As defined in the Investment Company Act of 1940, an affiliated company is one in which the Fund owns 5% or more of the company’s outstanding voting securities, or a company which is under common ownership or control with the Fund. Holdings and transactions in these affiliated companies during the year ended August 31, 2019 are as follows: |
| Issuer | Beginning
shares | Shares
purchased | Shares
sold | Ending
shares | Realized gain
(loss) —
affiliated
issuers ($) | Net change in
unrealized
appreciation
(depreciation) —
affiliated
issuers ($) | Dividends —
affiliated
issuers ($) | Value —
affiliated
issuers
at end of
period ($) |
| Columbia Short-Term Cash Fund, 2.208% |
| | 494,066 | 27,348,870 | (27,475,777) | 367,159 | 49 | — | 36,277 | 367,123 |
Fair value measurements
The Fund categorizes its fair value measurements according to a three-level hierarchy that maximizes the use of observable inputs and minimizes the use of unobservable inputs by prioritizing that the most observable input be used when available. Observable inputs are those that market participants would use in pricing an investment based on market data obtained from sources independent of the reporting entity. Unobservable inputs are those that reflect the Fund’s assumptions about the information market participants would use in pricing an investment. An investment’s level within the fair value hierarchy is based on the lowest level of any input that is deemed significant to the asset’s or liability’s fair value measurement. The input levels are not necessarily an indication of the risk or liquidity associated with investments at that level. For example, certain U.S. government securities are generally high quality and liquid, however, they are reflected as Level 2 because the inputs used to determine fair value may not always be quoted prices in an active market.
Fair value inputs are summarized in the three broad levels listed below:
| ■ | Level 1 — Valuations based on quoted prices for investments in active markets that the Fund has the ability to access at the measurement date. Valuation adjustments are not applied to Level 1 investments. |
| ■ | Level 2 — Valuations based on other significant observable inputs (including quoted prices for similar securities, interest rates, prepayment speeds, credit risks, etc.). |
| ■ | Level 3 — Valuations based on significant unobservable inputs (including the Fund’s own assumptions and judgment in determining the fair value of investments). |
Inputs that are used in determining fair value of an investment may include price information, credit data, volatility statistics, and other factors. These inputs can be either observable or unobservable. The availability of observable inputs can vary between investments, and is affected by various factors such as the type of investment, and the volume and level of activity for that investment or similar investments in the marketplace. The inputs will be considered by the Investment Manager, along with any other relevant factors in the calculation of an investment’s fair value. The Fund uses prices and inputs that are current as of the measurement date, which may include periods of market dislocations. During these periods, the availability of prices and inputs may be reduced for many investments. This condition could cause an investment to be reclassified between the various levels within the hierarchy.
Foreign equity securities actively traded in markets where there is a significant delay in the local close relative to the New York Stock Exchange are classified as Level 2. The values of these securities may include an adjustment to reflect the impact of significant market movements following the close of local trading, as described in Note 2 to the financial statements – Security valuation.
The accompanying Notes to Financial Statements are an integral part of this statement.
| 10 | Columbia Global Energy and Natural Resources Fund | Annual Report 2019 |
Portfolio of Investments (continued)
August 31, 2019
Fair value measurements (continued)
Investments falling into the Level 3 category are primarily supported by quoted prices from brokers and dealers participating in the market for those investments. However, these may be classified as Level 3 investments due to lack of market transparency and corroboration to support these quoted prices. Additionally, valuation models may be used as the pricing source for any remaining investments classified as Level 3. These models may rely on one or more significant unobservable inputs and/or significant assumptions by the Investment Manager. Inputs used in valuations may include, but are not limited to, financial statement analysis, capital account balances, discount rates and estimated cash flows, and comparable company data.
Under the direction of the Fund’s Board of Trustees (the Board), the Investment Manager’s Valuation Committee (the Committee) is responsible for overseeing the valuation procedures approved by the Board. The Committee consists of voting and non-voting members from various groups within the Investment Manager’s organization, including operations and accounting, trading and investments, compliance, risk management and legal.
The Committee meets at least monthly to review and approve valuation matters, which may include a description of specific valuation determinations, data regarding pricing information received from approved pricing vendors and brokers and the results of Board-approved valuation control policies and procedures (the Policies). The Policies address, among other things, instances when market quotations are or are not readily available, including recommendations of third party pricing vendors and a determination of appropriate pricing methodologies; events that require specific valuation determinations and assessment of fair value techniques; securities with a potential for stale pricing, including those that are illiquid, restricted, or in default; and the effectiveness of third party pricing vendors, including periodic reviews of vendors. The Committee meets more frequently, as needed, to discuss additional valuation matters, which may include the need to review back-testing results, review time-sensitive information or approve related valuation actions. The Committee reports to the Board, with members of the Committee meeting with the Board at each of its regularly scheduled meetings to discuss valuation matters and actions during the period, similar to those described earlier.
The following table is a summary of the inputs used to value the Fund’s investments at August 31, 2019:
| | Level 1 ($) | Level 2 ($) | Level 3 ($) | Total ($) |
| Investments in Securities | | | | |
| Common Stocks | | | | |
| Australia | — | 1,260,410 | — | 1,260,410 |
| Canada | 12,799,443 | — | — | 12,799,443 |
| France | — | 10,111,928 | — | 10,111,928 |
| Germany | — | 5,311,407 | — | 5,311,407 |
| Japan | — | 4,594,516 | — | 4,594,516 |
| Netherlands | 885,459 | — | — | 885,459 |
| Switzerland | — | 1,630,159 | — | 1,630,159 |
| United Kingdom | 1,407,459 | 27,646,494 | — | 29,053,953 |
| United States | 85,471,481 | — | — | 85,471,481 |
| Total Common Stocks | 100,563,842 | 50,554,914 | — | 151,118,756 |
| Exchange-Traded Funds | 6,831,938 | — | — | 6,831,938 |
| Limited Partnerships | | | | |
| United States | 2,864,376 | — | — | 2,864,376 |
| Total Limited Partnerships | 2,864,376 | — | — | 2,864,376 |
| Money Market Funds | 367,123 | — | — | 367,123 |
| Total Investments in Securities | 110,627,279 | 50,554,914 | — | 161,182,193 |
See the Portfolio of Investments for all investment classifications not indicated in the table.
The Fund’s assets assigned to the Level 2 input category are generally valued using the market approach, in which a security’s value is determined through reference to prices and information from market transactions for similar or identical assets. These assets include certain foreign securities for which a third party statistical pricing service may be employed for purposes of fair market valuation. The model utilized by such third party statistical pricing service takes into account a security’s correlation to available market data including, but not limited to, intraday index, ADR, and exchange-traded fund movements.
The accompanying Notes to Financial Statements are an integral part of this statement.
Columbia Global Energy and Natural Resources Fund | Annual Report 2019
| 11 |
Statement of Assets and Liabilities
August 31, 2019
| Assets | |
| Investments in securities, at value | |
| Unaffiliated issuers (cost $164,254,504) | $160,815,070 |
| Affiliated issuers (cost $367,123) | 367,123 |
| Receivable for: | |
| Investments sold | 981,936 |
| Capital shares sold | 140,596 |
| Dividends | 1,133,548 |
| Foreign tax reclaims | 114,656 |
| Prepaid expenses | 1,155 |
| Trustees’ deferred compensation plan | 67,789 |
| Total assets | 163,621,873 |
| Liabilities | |
| Due to custodian | 36 |
| Payable for: | |
| Capital shares purchased | 275,985 |
| Management services fees | 3,344 |
| Distribution and/or service fees | 687 |
| Transfer agent fees | 29,733 |
| Compensation of chief compliance officer | 12 |
| Other expenses | 34,201 |
| Trustees’ deferred compensation plan | 67,789 |
| Total liabilities | 411,787 |
| Net assets applicable to outstanding capital stock | $163,210,086 |
| Represented by | |
| Paid in capital | 189,315,522 |
| Total distributable earnings (loss) (Note 2) | (26,105,436) |
| Total - representing net assets applicable to outstanding capital stock | $163,210,086 |
The accompanying Notes to Financial Statements are an integral part of this statement.
| 12 | Columbia Global Energy and Natural Resources Fund | Annual Report 2019 |
Statement of Assets and Liabilities (continued)
August 31, 2019
| Class A | |
| Net assets | $56,583,807 |
| Shares outstanding | 3,527,911 |
| Net asset value per share | $16.04 |
| Maximum sales charge | 5.75% |
| Maximum offering price per share (calculated by dividing the net asset value per share by 1.0 minus the maximum sales charge for Class A shares) | $17.02 |
| Advisor Class | |
| Net assets | $6,730,595 |
| Shares outstanding | 406,715 |
| Net asset value per share | $16.55 |
| Class C | |
| Net assets | $5,670,441 |
| Shares outstanding | 375,919 |
| Net asset value per share | $15.08 |
| Institutional Class | |
| Net assets | $55,881,303 |
| Shares outstanding | 3,437,689 |
| Net asset value per share | $16.26 |
| Institutional 2 Class | |
| Net assets | $10,239,495 |
| Shares outstanding | 615,366 |
| Net asset value per share | $16.64 |
| Institutional 3 Class | |
| Net assets | $17,437,688 |
| Shares outstanding | 1,081,157 |
| Net asset value per share | $16.13 |
| Class R | |
| Net assets | $10,666,757 |
| Shares outstanding | 670,416 |
| Net asset value per share | $15.91 |
The accompanying Notes to Financial Statements are an integral part of this statement.
Columbia Global Energy and Natural Resources Fund | Annual Report 2019
| 13 |
Statement of Operations
Year Ended August 31, 2019
| Net investment income | |
| Income: | |
| Dividends — unaffiliated issuers | $7,449,842 |
| Dividends — affiliated issuers | 36,277 |
| Foreign taxes withheld | (310,021) |
| Total income | 7,176,098 |
| Expenses: | |
| Management services fees | 1,447,280 |
| Distribution and/or service fees | |
| Class A | 166,984 |
| Class C | 84,807 |
| Class R | 59,573 |
| Transfer agent fees | |
| Class A | 140,084 |
| Advisor Class | 17,739 |
| Class C | 17,734 |
| Institutional Class | 142,653 |
| Institutional 2 Class | 7,231 |
| Institutional 3 Class | 1,823 |
| Class R | 24,996 |
| Compensation of board members | 16,405 |
| Custodian fees | 10,545 |
| Printing and postage fees | 35,142 |
| Registration fees | 99,676 |
| Audit fees | 43,980 |
| Legal fees | 3,917 |
| Compensation of chief compliance officer | 77 |
| Other | 16,043 |
| Total expenses | 2,336,689 |
| Net investment income | 4,839,409 |
| Realized and unrealized gain (loss) — net | |
| Net realized gain (loss) on: | |
| Investments — unaffiliated issuers | 184,495 |
| Investments — affiliated issuers | 49 |
| Foreign currency translations | 20,043 |
| Net realized gain | 204,587 |
| Net change in unrealized appreciation (depreciation) on: | |
| Investments — unaffiliated issuers | (45,386,489) |
| Foreign currency translations | (13,748) |
| Net change in unrealized appreciation (depreciation) | (45,400,237) |
| Net realized and unrealized loss | (45,195,650) |
| Net decrease in net assets resulting from operations | $(40,356,241) |
The accompanying Notes to Financial Statements are an integral part of this statement.
| 14 | Columbia Global Energy and Natural Resources Fund | Annual Report 2019 |
Statement of Changes in Net Assets
| | Year Ended
August 31, 2019 | Year Ended
August 31, 2018 |
| Operations | | |
| Net investment income | $4,839,409 | $4,042,894 |
| Net realized gain | 204,587 | 11,768,475 |
| Net change in unrealized appreciation (depreciation) | (45,400,237) | 19,085,916 |
| Net increase (decrease) in net assets resulting from operations | (40,356,241) | 34,897,285 |
| Distributions to shareholders | | |
| Net investment income and net realized gains | | |
| Class A | (1,266,323) | |
| Advisor Class | (202,520) | |
| Class C | (122,130) | |
| Institutional Class | (1,474,379) | |
| Institutional 2 Class | (224,773) | |
| Institutional 3 Class | (414,025) | |
| Class R | (189,261) | |
| Net investment income | | |
| Class A | | (1,445,024) |
| Advisor Class | | (156,587) |
| Class C | | (151,980) |
| Institutional Class | | (1,793,917) |
| Institutional 2 Class | | (229,536) |
| Institutional 3 Class | | (403,655) |
| Class K | | (98) |
| Class R | | (193,694) |
| Total distributions to shareholders (Note 2) | (3,893,411) | (4,374,491) |
| Decrease in net assets from capital stock activity | (25,397,479) | (20,534,140) |
| Total increase (decrease) in net assets | (69,647,131) | 9,988,654 |
| Net assets at beginning of year | 232,857,217 | 222,868,563 |
| Net assets at end of year | $163,210,086 | $232,857,217 |
| Undistributed net investment income | $2,231,915 | $1,265,833 |
The accompanying Notes to Financial Statements are an integral part of this statement.
Columbia Global Energy and Natural Resources Fund | Annual Report 2019
| 15 |
Statement of Changes in Net Assets (continued)
| | Year Ended | Year Ended |
| | August 31, 2019 | August 31, 2018 |
| | Shares | Dollars ($) | Shares | Dollars ($) |
| Capital stock activity |
| Class A | | | | |
| Subscriptions | 418,346 | 7,301,600 | 661,572 | 13,031,482 |
| Distributions reinvested | 74,565 | 1,242,117 | 75,390 | 1,416,276 |
| Redemptions | (995,393) | (17,344,863) | (1,076,584) | (21,067,423) |
| Net decrease | (502,482) | (8,801,146) | (339,622) | (6,619,665) |
| Advisor Class | | | | |
| Subscriptions | 125,448 | 2,201,859 | 247,632 | 5,035,646 |
| Distributions reinvested | 10,781 | 187,570 | 7,344 | 141,815 |
| Redemptions | (279,851) | (4,758,503) | (112,516) | (2,281,118) |
| Net increase (decrease) | (143,622) | (2,369,074) | 142,460 | 2,896,343 |
| Class C | | | | |
| Subscriptions | 26,154 | 427,775 | 102,273 | 1,912,046 |
| Distributions reinvested | 7,500 | 113,102 | 7,877 | 141,468 |
| Redemptions | (297,327) | (4,874,993) | (242,794) | (4,519,588) |
| Net decrease | (263,673) | (4,334,116) | (132,644) | (2,466,074) |
| Institutional Class | | | | |
| Subscriptions | 375,149 | 6,564,337 | 620,373 | 12,368,220 |
| Distributions reinvested | 83,779 | 1,433,269 | 91,583 | 1,737,180 |
| Redemptions | (1,166,158) | (20,716,100) | (1,496,768) | (29,448,966) |
| Net decrease | (707,230) | (12,718,494) | (784,812) | (15,343,566) |
| Institutional 2 Class | | | | |
| Subscriptions | 293,398 | 5,435,417 | 198,787 | 4,061,233 |
| Distributions reinvested | 12,810 | 224,730 | 11,842 | 229,492 |
| Redemptions | (234,543) | (4,375,282) | (217,629) | (4,491,709) |
| Net increase (decrease) | 71,665 | 1,284,865 | (7,000) | (200,984) |
| Institutional 3 Class | | | | |
| Subscriptions | 156,097 | 2,785,296 | 130,544 | 2,602,046 |
| Distributions reinvested | 24,336 | 413,968 | 21,478 | 403,598 |
| Redemptions | (73,720) | (1,302,033) | (149,392) | (3,000,245) |
| Net increase | 106,713 | 1,897,231 | 2,630 | 5,399 |
| Class K | | | | |
| Distributions reinvested | — | — | 3 | 59 |
| Redemptions | — | — | (276) | (5,362) |
| Net decrease | — | — | (273) | (5,303) |
| Class R | | | | |
| Subscriptions | 288,676 | 5,120,162 | 405,386 | 7,851,994 |
| Distributions reinvested | 11,647 | 189,185 | 10,352 | 193,694 |
| Redemptions | (323,931) | (5,666,092) | (354,008) | (6,845,978) |
| Net increase (decrease) | (23,608) | (356,745) | 61,730 | 1,199,710 |
| Total net decrease | (1,462,237) | (25,397,479) | (1,057,531) | (20,534,140) |
The accompanying Notes to Financial Statements are an integral part of this statement.
| 16 | Columbia Global Energy and Natural Resources Fund | Annual Report 2019 |
[THIS PAGE INTENTIONALLY LEFT BLANK]
Columbia Global Energy and Natural Resources Fund | Annual Report 2019
| 17 |
The following table is intended to help you understand the Fund’s financial performance. Certain information reflects financial results for a single share of a class held for the periods shown. Per share net investment income (loss) amounts are calculated based on average shares outstanding during the period. Total return assumes reinvestment of all dividends and distributions, if any. Total return does not reflect payment of sales charges, if any. Total return and portfolio turnover are not annualized for periods of less than one year. The portfolio turnover rate is calculated without regard to purchase and sales transactions of short-term instruments and certain derivatives, if any. If such transactions were included, the Fund’s portfolio turnover rate may be higher.
| | Net asset value,
beginning of
period | Net
investment
income | Net
realized
and
unrealized
gain (loss) | Total from
investment
operations | Distributions
from net
investment
income | Distributions
from net
realized
gains | Total
distributions to
shareholders |
| Class A |
| Year Ended 8/31/2019 | $20.02 | 0.42 | (4.08) | (3.66) | (0.32) | — | (0.32) |
| Year Ended 8/31/2018 | $17.57 | 0.31 | 2.48 | 2.79 | (0.34) | — | (0.34) |
| Year Ended 8/31/2017 | $16.77 | 0.30 | 0.77 | 1.07 | (0.27) | — | (0.27) |
| Year Ended 8/31/2016 | $15.89 | 0.32 | 0.56 | 0.88 | — | — | — |
| Year Ended 8/31/2015 | $24.98 | 0.29 | (7.95) | (7.66) | — | (1.43) | (1.43) |
| Advisor Class |
| Year Ended 8/31/2019 | $20.64 | 0.47 | (4.19) | (3.72) | (0.37) | — | (0.37) |
| Year Ended 8/31/2018 | $18.10 | 0.38 | 2.54 | 2.92 | (0.38) | — | (0.38) |
| Year Ended 8/31/2017 | $17.26 | 0.36 | 0.77 | 1.13 | (0.29) | — | (0.29) |
| Year Ended 8/31/2016 | $16.30 | 0.37 | 0.59 | 0.96 | — | — | — |
| Year Ended 8/31/2015 | $25.52 | 0.34 | (8.13) | (7.79) | — | (1.43) | (1.43) |
| Class C |
| Year Ended 8/31/2019 | $18.86 | 0.26 | (3.83) | (3.57) | (0.21) | — | (0.21) |
| Year Ended 8/31/2018 | $16.57 | 0.15 | 2.34 | 2.49 | (0.20) | — | (0.20) |
| Year Ended 8/31/2017 | $15.89 | 0.16 | 0.72 | 0.88 | (0.20) | — | (0.20) |
| Year Ended 8/31/2016 | $15.17 | 0.20 | 0.52 | 0.72 | — | — | — |
| Year Ended 8/31/2015 | $24.10 | 0.14 | (7.64) | (7.50) | — | (1.43) | (1.43) |
| Institutional Class |
| Year Ended 8/31/2019 | $20.28 | 0.47 | (4.12) | (3.65) | (0.37) | — | (0.37) |
| Year Ended 8/31/2018 | $17.79 | 0.36 | 2.51 | 2.87 | (0.38) | — | (0.38) |
| Year Ended 8/31/2017 | $16.97 | 0.35 | 0.76 | 1.11 | (0.29) | — | (0.29) |
| Year Ended 8/31/2016 | $16.03 | 0.37 | 0.57 | 0.94 | — | — | — |
| Year Ended 8/31/2015 | $25.12 | 0.33 | (7.99) | (7.66) | — | (1.43) | (1.43) |
| Institutional 2 Class |
| Year Ended 8/31/2019 | $20.75 | 0.52 | (4.23) | (3.71) | (0.40) | — | (0.40) |
| Year Ended 8/31/2018 | $18.20 | 0.40 | 2.56 | 2.96 | (0.41) | — | (0.41) |
| Year Ended 8/31/2017 | $17.33 | 0.40 | 0.77 | 1.17 | (0.30) | — | (0.30) |
| Year Ended 8/31/2016 | $16.35 | 0.41 | 0.57 | 0.98 | — | — | — |
| Year Ended 8/31/2015 | $25.54 | 0.39 | (8.15) | (7.76) | — | (1.43) | (1.43) |
| Institutional 3 Class |
| Year Ended 8/31/2019 | $20.13 | 0.51 | (4.10) | (3.59) | (0.41) | — | (0.41) |
| Year Ended 8/31/2018 | $17.66 | 0.40 | 2.48 | 2.88 | (0.41) | — | (0.41) |
| Year Ended 8/31/2017(d) | $18.04 | 0.23 | (0.61)(e) | (0.38) | — | — | — |
The accompanying Notes to Financial Statements are an integral part of this statement.
| 18 | Columbia Global Energy and Natural Resources Fund | Annual Report 2019 |
Financial Highlights (continued)
| | Net
asset
value,
end of
period | Total
return | Total gross
expense
ratio to
average
net assets(a) | Total net
expense
ratio to
average
net assets(a),(b) | Net investment
income
ratio to
average
net assets | Portfolio
turnover | Net
assets,
end of
period
(000’s) |
| Class A |
| Year Ended 8/31/2019 | $16.04 | (18.32%) | 1.33% | 1.33% | 2.39% | 13% | $56,584 |
| Year Ended 8/31/2018 | $20.02 | 15.99% | 1.30% | 1.30%(c) | 1.59% | 37% | $80,675 |
| Year Ended 8/31/2017 | $17.57 | 6.34% | 1.34% | 1.34%(c) | 1.70% | 19% | $76,763 |
| Year Ended 8/31/2016 | $16.77 | 5.54% | 1.33% | 1.33%(c) | 2.06% | 45% | $98,566 |
| Year Ended 8/31/2015 | $15.89 | (31.16%) | 1.32% | 1.32%(c) | 1.48% | 51% | $86,133 |
| Advisor Class |
| Year Ended 8/31/2019 | $16.55 | (18.09%) | 1.08% | 1.08% | 2.57% | 13% | $6,731 |
| Year Ended 8/31/2018 | $20.64 | 16.28% | 1.05% | 1.05%(c) | 1.89% | 37% | $11,360 |
| Year Ended 8/31/2017 | $18.10 | 6.52% | 1.10% | 1.10%(c) | 1.98% | 19% | $7,383 |
| Year Ended 8/31/2016 | $17.26 | 5.89% | 1.09% | 1.09%(c) | 2.30% | 45% | $7,890 |
| Year Ended 8/31/2015 | $16.30 | (31.00%) | 1.07% | 1.07%(c) | 1.69% | 51% | $7,191 |
| Class C |
| Year Ended 8/31/2019 | $15.08 | (18.92%) | 2.07% | 2.07% | 1.56% | 13% | $5,670 |
| Year Ended 8/31/2018 | $18.86 | 15.10% | 2.05% | 2.05%(c) | 0.83% | 37% | $12,065 |
| Year Ended 8/31/2017 | $16.57 | 5.52% | 2.09% | 2.09%(c) | 0.96% | 19% | $12,796 |
| Year Ended 8/31/2016 | $15.89 | 4.75% | 2.09% | 2.09%(c) | 1.34% | 45% | $15,457 |
| Year Ended 8/31/2015 | $15.17 | (31.66%) | 2.07% | 2.07%(c) | 0.77% | 51% | $14,428 |
| Institutional Class |
| Year Ended 8/31/2019 | $16.26 | (18.06%) | 1.08% | 1.08% | 2.63% | 13% | $55,881 |
| Year Ended 8/31/2018 | $20.28 | 16.29% | 1.05% | 1.05%(c) | 1.83% | 37% | $84,078 |
| Year Ended 8/31/2017 | $17.79 | 6.51% | 1.10% | 1.10%(c) | 1.98% | 19% | $87,719 |
| Year Ended 8/31/2016 | $16.97 | 5.86% | 1.09% | 1.09%(c) | 2.35% | 45% | $92,245 |
| Year Ended 8/31/2015 | $16.03 | (30.97%) | 1.07% | 1.07%(c) | 1.68% | 51% | $98,857 |
| Institutional 2 Class |
| Year Ended 8/31/2019 | $16.64 | (17.97%) | 0.94% | 0.94% | 2.86% | 13% | $10,239 |
| Year Ended 8/31/2018 | $20.75 | 16.42% | 0.92% | 0.92% | 1.97% | 37% | $11,283 |
| Year Ended 8/31/2017 | $18.20 | 6.76% | 0.94% | 0.94% | 2.22% | 19% | $10,022 |
| Year Ended 8/31/2016 | $17.33 | 5.99% | 0.91% | 0.91% | 2.53% | 45% | $6,558 |
| Year Ended 8/31/2015 | $16.35 | (30.85%) | 0.89% | 0.89% | 1.97% | 51% | $4,978 |
| Institutional 3 Class |
| Year Ended 8/31/2019 | $16.13 | (17.94%) | 0.88% | 0.88% | 2.90% | 13% | $17,438 |
| Year Ended 8/31/2018 | $20.13 | 16.51% | 0.87% | 0.87% | 2.04% | 37% | $19,615 |
| Year Ended 8/31/2017(d) | $17.66 | (2.11%) | 0.91%(f) | 0.91%(f) | 2.66%(f) | 19% | $17,163 |
The accompanying Notes to Financial Statements are an integral part of this statement.
Columbia Global Energy and Natural Resources Fund | Annual Report 2019
| 19 |
Financial Highlights (continued)
| | Net asset value,
beginning of
period | Net
investment
income | Net
realized
and
unrealized
gain (loss) | Total from
investment
operations | Distributions
from net
investment
income | Distributions
from net
realized
gains | Total
distributions to
shareholders |
| Class R |
| Year Ended 8/31/2019 | $19.86 | 0.37 | (4.05) | (3.68) | (0.27) | — | (0.27) |
| Year Ended 8/31/2018 | $17.43 | 0.26 | 2.46 | 2.72 | (0.29) | — | (0.29) |
| Year Ended 8/31/2017 | $16.66 | 0.27 | 0.75 | 1.02 | (0.25) | — | (0.25) |
| Year Ended 8/31/2016 | $15.83 | 0.29 | 0.54 | 0.83 | — | — | — |
| Year Ended 8/31/2015 | $24.94 | 0.25 | (7.93) | (7.68) | — | (1.43) | (1.43) |
| Notes to Financial Highlights |
| (a) | In addition to the fees and expenses that the Fund bears directly, the Fund indirectly bears a pro rata share of the fees and expenses of any other funds in which it invests. Such indirect expenses are not included in the Fund’s reported expense ratios. |
| (b) | Total net expenses include the impact of certain fee waivers/expense reimbursements made by the Investment Manager and certain of its affiliates, if applicable. |
| (c) | The benefits derived from expense reductions had an impact of less than 0.01%. |
| (d) | Institutional 3 Class shares commenced operations on March 1, 2017. Per share data and total return reflect activity from that date. |
| (e) | Calculation of the net gain (loss) per share (both realized and unrealized) does not correlate to the aggregate realized and unrealized gain (loss) presented in the Statement of Operations due to the timing of subscriptions and redemptions of Fund shares in relation to fluctuations in the market value of the portfolio. |
| (f) | Annualized. |
The accompanying Notes to Financial Statements are an integral part of this statement.
| 20 | Columbia Global Energy and Natural Resources Fund | Annual Report 2019 |
Financial Highlights (continued)
| | Net
asset
value,
end of
period | Total
return | Total gross
expense
ratio to
average
net assets(a) | Total net
expense
ratio to
average
net assets(a),(b) | Net investment
income
ratio to
average
net assets | Portfolio
turnover | Net
assets,
end of
period
(000’s) |
| Class R |
| Year Ended 8/31/2019 | $15.91 | (18.53%) | 1.58% | 1.58% | 2.15% | 13% | $10,667 |
| Year Ended 8/31/2018 | $19.86 | 15.71% | 1.55% | 1.55%(c) | 1.35% | 37% | $13,780 |
| Year Ended 8/31/2017 | $17.43 | 6.07% | 1.60% | 1.60%(c) | 1.53% | 19% | $11,019 |
| Year Ended 8/31/2016 | $16.66 | 5.24% | 1.59% | 1.59%(c) | 1.84% | 45% | $7,031 |
| Year Ended 8/31/2015 | $15.83 | (31.29%) | 1.57% | 1.57%(c) | 1.30% | 51% | $3,045 |
The accompanying Notes to Financial Statements are an integral part of this statement.
Columbia Global Energy and Natural Resources Fund | Annual Report 2019
| 21 |
Notes to Financial Statements
August 31, 2019
Note 1. Organization
Columbia Global Energy and Natural Resources Fund (the Fund), a series of Columbia Funds Series Trust I (the Trust), is a non-diversified fund. The Trust is registered under the Investment Company Act of 1940, as amended (the 1940 Act), as an open-end management investment company organized as a Massachusetts business trust.
Fund shares
The Trust may issue an unlimited number of shares (without par value). The Fund offers each of the share classes listed in the Statement of Assets and Liabilities. Although all share classes generally have identical voting, dividend and liquidation rights, each share class votes separately when required by the Trust’s organizational documents or by law. Each share class has its own expense and sales charge structure. Different share classes may have different minimum initial investment amounts and pay different distribution amounts to the extent the expenses of distributing such share classes vary. Distributions to shareholders in a liquidation will be proportional to the net asset value of each share class.
As described in the Fund’s prospectus, Class A and Class C shares are offered to the general public for investment. Advisor Class, Institutional Class, Institutional 2 Class, Institutional 3 Class and Class R shares are available for purchase through authorized investment professionals to omnibus retirement plans or to institutional and to certain other investors as also described in the Fund’s prospectus. Class C shares automatically convert to Class A shares after 10 years.
Note 2. Summary of significant accounting policies
Basis of preparation
The Fund is an investment company that applies the accounting and reporting guidance in the Financial Accounting Standards Board (FASB) Accounting Standards Codification Topic 946,Financial Services - Investment Companies (ASC 946). The financial statements are prepared in accordance with U.S. generally accepted accounting principles (GAAP), which requires management to make certain estimates and assumptions that affect the reported amounts of assets and liabilities, the disclosure of contingent assets and liabilities at the date of the financial statements and the reported amounts of income and expenses during the reporting period. Actual results could differ from those estimates.
The following is a summary of significant accounting policies followed by the Fund in the preparation of its financial statements.
Security valuation
All equity securities and exchange-traded funds are valued at the close of business of the New York Stock Exchange. Equity securities and exchange-traded funds are valued at the official closing price on the principal exchange or market on which they trade. Unlisted securities or listed securities for which there were no sales during the day are valued at the mean of the latest quoted bid and ask prices on such exchanges or markets.
Foreign equity securities are valued based on the closing price on the foreign exchange in which such securities are primarily traded. If any foreign equity security closing prices are not readily available, the securities are valued at the mean of the latest quoted bid and ask prices on such exchanges or markets. Foreign currency exchange rates are determined at the scheduled closing time of the New York Stock Exchange. Many securities markets and exchanges outside the U.S. close prior to the close of the New York Stock Exchange; therefore, the closing prices for securities in such markets or on such exchanges may not fully reflect events that occur after such close but before the close of the New York Stock Exchange. In those situations, foreign securities will be fair valued pursuant to a policy adopted by the Board of Trustees. Under the policy, the Fund may utilize a third party pricing service to determine these fair values. The third-party pricing service takes into account multiple factors, including, but not limited to, movements in the U.S. securities markets, certain depositary receipts, futures contracts and foreign exchange rates that have occurred subsequent to the close of the foreign exchange or market, to determine a good faith estimate that reasonably reflects the current market conditions as of the close of the New York Stock Exchange. The fair value of a security is likely to be different from the quoted or published price, if available.
Investments in open-end investment companies, including money market funds, are valued at their latest net asset value.
| 22 | Columbia Global Energy and Natural Resources Fund | Annual Report 2019 |
Notes to Financial Statements (continued)
August 31, 2019
Investments for which market quotations are not readily available, or that have quotations which management believes are not reflective of market value or reliable, are valued at fair value as determined in good faith under procedures approved by and under the general supervision of the Board of Trustees. If a security or class of securities (such as foreign securities) is valued at fair value, such value is likely to be different from the quoted or published price for the security.
The determination of fair value often requires significant judgment. To determine fair value, management may use assumptions including but not limited to future cash flows and estimated risk premiums. Multiple inputs from various sources may be used to determine fair value.
GAAP requires disclosure regarding the inputs and valuation techniques used to measure fair value and any changes in valuation inputs or techniques. In addition, investments shall be disclosed by major category. This information is disclosed following the Fund’s Portfolio of Investments.
Foreign currency transactions and translations
The values of all assets and liabilities denominated in foreign currencies are generally translated into U.S. dollars at exchange rates determined at the close of regular trading on the New York Stock Exchange. Net realized and unrealized gains (losses) on foreign currency transactions and translations include gains (losses) arising from the fluctuation in exchange rates between trade and settlement dates on securities transactions, gains (losses) arising from the disposition of foreign currency and currency gains (losses) between the accrual and payment dates on dividends, interest income and foreign withholding taxes.
For financial statement purposes, the Fund does not distinguish that portion of gains (losses) on investments which is due to changes in foreign exchange rates from that which is due to changes in market prices of the investments. Such fluctuations are included with the net realized and unrealized gains (losses) on investments in the Statement of Operations.
Security transactions
Security transactions are accounted for on the trade date. Cost is determined and gains (losses) are based upon the specific identification method for both financial statement and federal income tax purposes.
Income recognition
Corporate actions and dividend income are generally recorded net of any non-reclaimable tax withholdings, on the ex-dividend date or upon receipt of ex-dividend notification in the case of certain foreign securities.
The Fund may receive distributions from holdings in equity securities, business development companies (BDCs), exchange-traded funds (ETFs), limited partnerships (LPs), other regulated investment companies (RICs), and real estate investment trusts (REITs), which report information on the tax character of their distributions annually. These distributions are allocated to dividend income, capital gain and return of capital based on actual information reported. Return of capital is recorded as a reduction of the cost basis of securities held. If the Fund no longer owns the applicable securities, return of capital is recorded as a realized gain. With respect to REITs, to the extent actual information has not yet been reported, estimates for return of capital are made by the Fund’s management. Management’s estimates are subsequently adjusted when the actual character of the distributions is disclosed by the REITs, which could result in a proportionate change in return of capital to shareholders.
Awards from class action litigation are recorded as a reduction of cost basis if the Fund still owns the applicable securities on the payment date. If the Fund no longer owns the applicable securities, the proceeds are recorded as realized gains.
Expenses
General expenses of the Trust are allocated to the Fund and other funds of the Trust based upon relative net assets or other expense allocation methodologies determined by the nature of the expense. Expenses directly attributable to the Fund are charged to the Fund. Expenses directly attributable to a specific class of shares are charged to that share class.
Columbia Global Energy and Natural Resources Fund | Annual Report 2019
| 23 |
Notes to Financial Statements (continued)
August 31, 2019
Determination of class net asset value
All income, expenses (other than class-specific expenses, which are charged to that share class, as shown in the Statement of Operations) and realized and unrealized gains (losses) are allocated to each class of the Fund on a daily basis, based on the relative net assets of each class, for purposes of determining the net asset value of each class.
Federal income tax status
The Fund intends to qualify each year as a regulated investment company under Subchapter M of the Internal Revenue Code, as amended, and will distribute substantially all of its investment company taxable income and net capital gain, if any, for its tax year, and as such will not be subject to federal income taxes. In addition, the Fund intends to distribute in each calendar year substantially all of its ordinary income, capital gain net income and certain other amounts, if any, such that the Fund should not be subject to federal excise tax. Therefore, no federal income or excise tax provision is recorded.
Foreign taxes
The Fund may be subject to foreign taxes on income, gains on investments or currency repatriation, a portion of which may be recoverable. The Fund will accrue such taxes and recoveries, as applicable, based upon its current interpretation of tax rules and regulations that exist in the markets in which it invests.
Realized gains in certain countries may be subject to foreign taxes at the Fund level, based on statutory rates. The Fund accrues for such foreign taxes on realized and unrealized gains at the appropriate rate for each jurisdiction, as applicable. The amount, if any, is disclosed as a liability on the Statement of Assets and Liabilities.
Distributions to shareholders
Distributions from net investment income, if any, are declared and paid each calendar quarter. Net realized capital gains, if any, are distributed at least annually. Income distributions and capital gain distributions are determined in accordance with federal income tax regulations, which may differ from GAAP.
Guarantees and indemnifications
Under the Trust’s organizational documents and, in some cases, by contract, its officers and trustees are indemnified against certain liabilities arising out of the performance of their duties to the Trust or its funds. In addition, certain of the Fund’s contracts with its service providers contain general indemnification clauses. The Fund’s maximum exposure under these arrangements is unknown since the amount of any future claims that may be made against the Fund cannot be determined, and the Fund has no historical basis for predicting the likelihood of any such claims.
Recent accounting pronouncements
Accounting Standards Update 2017-08 Premium Amortization on Purchased Callable Debt Securities
In March 2017, the Financial Accounting Standards Board issued Accounting Standards Update (ASU) No. 2017-08 Premium Amortization on Purchased Callable Debt Securities. ASU No. 2017-08 updates the accounting standards to shorten the amortization period for certain purchased callable debt securities, held at a premium, to be amortized to the earliest call date. The update applies to securities with explicit, noncontingent call features that are callable at fixed prices and on preset dates. The standard is effective for annual periods beginning after December 15, 2018 and interim periods within those fiscal years. Management does not expect the implementation of this guidance to have a material impact on the financial statement amounts and footnote disclosures.
Accounting Standards Update 2018-13 Disclosure Framework - Changes to the Disclosure Requirements for Fair Value Measurement
In August 2018, the Financial Accounting Standards Board issued Accounting Standards Update (ASU) No. 2018-13 Disclosure Framework - Changes to the Disclosure Requirements for Fair Value Measurement. The standard is effective for annual periods beginning after December 15, 2019 and interim periods within those fiscal years, with early adoption permitted. After evaluation, management determined to adopt the ASU effective for the period ended August 31, 2019 and all subsequent periods. As a result of the amendments, management implemented disclosure changes which include removal
| 24 | Columbia Global Energy and Natural Resources Fund | Annual Report 2019 |
Notes to Financial Statements (continued)
August 31, 2019
of the amount and reasons for transfers between Level 1 and Level 2 of the fair value hierarchy, removal of the policy for the timing of transfers between levels, removal of the description of the Level 3 valuation processes, as well as modifications to the measurement uncertainty disclosure.
Disclosure Update and Simplification
In September 2018, the Securities and Exchange Commission (SEC) released Final Rule 33-10532, Disclosure Update and Simplification, which amends certain financial statement disclosure requirements that the SEC determined to be redundant, outdated, or superseded in light of other SEC disclosure requirements, GAAP, or changes in the information environment. As a result of the amendments, management implemented disclosure changes which included removing the components of distributable earnings presented on the Statement of Assets and Liabilities and combining income and gain distributions paid to shareholders as presented on the Statement of Changes in Net Assets. Any values presented to meet prior year requirements were left unchanged. The amendments had no effect on the Fund’s net assets or results of operation.
Note 3. Fees and other transactions with affiliates
Management services fees
The Fund has entered into a Management Agreement with Columbia Management Investment Advisers, LLC (the Investment Manager), a wholly-owned subsidiary of Ameriprise Financial, Inc. (Ameriprise Financial). Under the Management Agreement, the Investment Manager provides the Fund with investment research and advice, as well as administrative and accounting services. The management services fee is an annual fee that is equal to a percentage of the Fund’s daily net assets that declines from 0.75% to 0.58% as the Fund’s net assets increase. The effective management services fee rate for the year ended August 31, 2019 was 0.75% of the Fund’s average daily net assets.
Compensation of board members
Members of the Board of Trustees who are not officers or employees of the Investment Manager or Ameriprise Financial are compensated for their services to the Fund as disclosed in the Statement of Operations. These members of the Board of Trustees may participate in a Deferred Compensation Plan (the Deferred Plan) which may be terminated at any time. Obligations of the Deferred Plan will be paid solely out of the Fund’s assets, and all amounts payable under the Deferred Plan constitute a general unsecured obligation of the Fund.
Compensation of Chief Compliance Officer
The Board of Trustees has appointed a Chief Compliance Officer to the Fund in accordance with federal securities regulations. As disclosed in the Statement of Operations, a portion of the Chief Compliance Officer’s total compensation is allocated to the Fund, along with other allocations to affiliated registered investment companies managed by the Investment Manager and its affiliates, based on relative net assets.
Transfer agency fees
Under a Transfer and Dividend Disbursing Agent Agreement, Columbia Management Investment Services Corp. (the Transfer Agent), an affiliate of the Investment Manager and a wholly-owned subsidiary of Ameriprise Financial, is responsible for providing transfer agency services to the Fund. The Transfer Agent has contracted with DST Asset Manager Solutions, Inc. (DST) to serve as sub-transfer agent. The Transfer Agent pays the fees of DST for services as sub-transfer agent and DST is not entitled to reimbursement for such fees from the Fund (with the exception of out-of-pocket fees).
The Fund pays the Transfer Agent a monthly transfer agency fee based on the number or the average value of accounts, depending on the type of account. In addition, the Fund pays the Transfer Agent a fee for shareholder services based on the number of accounts or on a percentage of the average aggregate value of the Fund’s shares maintained in omnibus accounts up to the lesser of the amount charged by the financial intermediary or a cap established by the Board of Trustees from time to time.
Columbia Global Energy and Natural Resources Fund | Annual Report 2019
| 25 |
Notes to Financial Statements (continued)
August 31, 2019
The Transfer Agent also receives compensation from the Fund for various shareholder services and reimbursements for certain out-of-pocket fees. Total transfer agency fees for Institutional 2 Class and Institutional 3 Class shares are subject to an annual limitation of not more than 0.07% and 0.02%, respectively, of the average daily net assets attributable to each share class.
For the year ended August 31, 2019, the Fund’s effective transfer agency fee rates as a percentage of average daily net assets of each class were as follows:
| | Effective rate (%) |
| Class A | 0.21 |
| Advisor Class | 0.21 |
| Class C | 0.21 |
| Institutional Class | 0.21 |
| Institutional 2 Class | 0.07 |
| Institutional 3 Class | 0.01 |
| Class R | 0.21 |
An annual minimum account balance fee of $20 may apply to certain accounts with a value below the applicable share class’s initial minimum investment requirements to reduce the impact of small accounts on transfer agency fees. These minimum account balance fees are remitted to the Fund and recorded as part of expense reductions in the Statement of Operations. For the year ended August 31, 2019, no minimum account balance fees were charged by the Fund.
Distribution and service fees
The Fund has entered into an agreement with Columbia Management Investment Distributors, Inc. (the Distributor), an affiliate of the Investment Manager and a wholly-owned subsidiary of Ameriprise Financial, for distribution and shareholder services. The Board of Trustees has approved, and the Fund has adopted, distribution and shareholder service plans (the Plans) applicable to certain share classes, which set the distribution and service fees for the Fund. These fees are calculated daily and are intended to compensate the Distributor and/or eligible selling and/or servicing agents for selling shares of the Fund and providing services to investors.
Under the Plans, the Fund pays a monthly service fee to the Distributor at the maximum annual rate of 0.25% of the average daily net assets attributable to Class A and Class C shares of the Fund. Also under the Plans, the Fund pays a monthly distribution fee to the Distributor at the maximum annual rates of 0.75% and 0.50% of the average daily net assets attributable to Class C and Class R shares of the Fund, respectively.
Sales charges (unaudited)
Sales charges, including front-end charges and contingent deferred sales charges (CDSC), received by the Distributor for distributing Fund shares for the year ended August 31, 2019, if any, are listed below:
| | Front End (%) | CDSC (%) | Amount ($) |
| Class A | 5.75 | 0.50 - 1.00(a) | 41,972 |
| Class C | — | 1.00(b) | 444 |
| (a) | This charge is imposed on certain investments of between $1 million and $50 million redeemed within 18 months after purchase, as follows: 1.00% if redeemed within 12 months after purchase, and 0.50% if redeemed more than 12, but less than 18, months after purchase, with certain limited exceptions. |
| (b) | This charge applies to redemptions within 12 months after purchase, with certain limited exceptions. |
The Fund’s other share classes are not subject to sales charges.
| 26 | Columbia Global Energy and Natural Resources Fund | Annual Report 2019 |
Notes to Financial Statements (continued)
August 31, 2019
Expenses waived/reimbursed by the Investment Manager and its affiliates
The Investment Manager and certain of its affiliates have contractually agreed to waive fees and/or reimburse expenses (excluding certain fees and expenses described below) for the period(s) disclosed below, unless sooner terminated at the sole discretion of the Board of Trustees, so that the Fund’s net operating expenses, after giving effect to fees waived/expenses reimbursed and any balance credits and/or overdraft charges from the Fund’s custodian, do not exceed the following annual rate(s) as a percentage of the class’ average daily net assets:
| | January 1, 2019
through
December 31, 2019 | Prior to
January 1, 2019 |
| Class A | 1.40% | 1.42% |
| Advisor Class | 1.15 | 1.17 |
| Class C | 2.15 | 2.17 |
| Institutional Class | 1.15 | 1.17 |
| Institutional 2 Class | 1.01 | 1.03 |
| Institutional 3 Class | 0.96 | 0.98 |
| Class R | 1.65 | 1.67 |
Under the agreement governing these fee waivers and/or expense reimbursement arrangements, the following fees and expenses are excluded from the waiver/reimbursement commitment, and therefore will be paid by the Fund, if applicable: taxes (including foreign transaction taxes), expenses associated with investments in affiliated and non-affiliated pooled investment vehicles (including mutual funds and exchange-traded funds), transaction costs and brokerage commissions, costs related to any securities lending program, dividend expenses associated with securities sold short, inverse floater program fees and expenses, transaction charges and interest on borrowed money, interest, infrequent and/or unusual expenses and any other expenses the exclusion of which is specifically approved by the Board of Trustees. This agreement may be modified or amended only with approval from the Investment Manager, certain of its affiliates and the Fund. Any fees waived and/or expenses reimbursed under the expense reimbursement arrangements described above are not recoverable by the Investment Manager or its affiliates in future periods.
Note 4. Federal tax information
The timing and character of income and capital gain distributions are determined in accordance with income tax regulations, which may differ from GAAP because of temporary or permanent book to tax differences.
At August 31, 2019, these differences were primarily due to differing treatment for deferral/reversal of wash sale losses, trustees’ deferred compensation, investments in partnerships, capital loss carryforward, non-deductible expenses, and foreign currency transactions. To the extent these differences were permanent, reclassifications were made among the components of the Fund’s net assets. Temporary differences do not require reclassifications.
The following reclassifications were made:
Undistributed net
investment
income ($) | Accumulated
net realized
(loss) ($) | Paid in
capital ($) |
| 20,084 | (20,043) | (41) |
Net investment income (loss) and net realized gains (losses), as disclosed in the Statement of Operations, and net assets were not affected by this reclassification.
The tax character of distributions paid during the years indicated was as follows:
| Year Ended August 31, 2019 | Year Ended August 31, 2018 |
Ordinary
income ($) | Long-term
capital gains ($) | Total ($) | Ordinary
income ($) | Long-term
capital gains ($) | Total ($) |
| 3,893,411 | — | 3,893,411 | 4,374,491 | — | 4,374,491 |
Columbia Global Energy and Natural Resources Fund | Annual Report 2019
| 27 |
Notes to Financial Statements (continued)
August 31, 2019
Short-term capital gain distributions, if any, are considered ordinary income distributions for tax purposes.
At August 31, 2019, the components of distributable earnings on a tax basis were as follows:
Undistributed
ordinary income ($) | Undistributed
long-term
capital gains ($) | Capital loss
carryforwards ($) | Net unrealized
(depreciation) ($) |
| 1,784,218 | — | (23,681,995) | (4,137,155) |
At August 31, 2019, the cost of all investments for federal income tax purposes along with the aggregate gross unrealized appreciation and depreciation based on that cost was:
Federal
tax cost ($) | Gross unrealized
appreciation ($) | Gross unrealized
(depreciation) ($) | Net unrealized
(depreciation) ($) |
| 165,319,348 | 16,659,589 | (20,796,744) | (4,137,155) |
Tax cost of investments and unrealized appreciation/(depreciation) may also include timing differences that do not constitute adjustments to tax basis.
The following capital loss carryforwards, determined at August 31, 2019, may be available to reduce taxable income arising from future net realized gains on investments, if any, to the extent permitted by the Internal Revenue Code. Capital loss carryforwards with no expiration are required to be utilized prior to any capital losses which carry an expiration date. As a result of this ordering rule, capital loss carryforwards which carry an expiration date may be more likely to expire unused. In addition, for the year ended August 31, 2019, capital loss carryforwards utilized and expired unused, if any, were as follows:
No expiration
short-term ($) | No expiration
long-term ($) | Total ($) | Utilized ($) | Expired ($) |
| (1,596,299) | (22,085,696) | (23,681,995) | — | — |
Management of the Fund has concluded that there are no significant uncertain tax positions in the Fund that would require recognition in the financial statements. However, management’s conclusion may be subject to review and adjustment at a later date based on factors including, but not limited to, new tax laws, regulations, and administrative interpretations (including relevant court decisions). Generally, the Fund’s federal tax returns for the prior three fiscal years remain subject to examination by the Internal Revenue Service.
Note 5. Portfolio information
The cost of purchases and proceeds from sales of securities, excluding short-term investments and derivatives, if any, aggregated to $24,547,645 and $47,545,787, respectively, for the year ended August 31, 2019. The amount of purchase and sale activity impacts the portfolio turnover rate reported in the Financial Highlights.
Note 6. Affiliated money market fund
The Fund invests in Columbia Short-Term Cash Fund, an affiliated money market fund established for the exclusive use by the Fund and other affiliated funds (the Affiliated MMF). The income earned by the Fund from such investments is included as Dividends - affiliated issuers in the Statement of Operations. As an investing fund, the Fund indirectly bears its proportionate share of the expenses of the Affiliated MMF. The Affiliated MMF prices its shares with a floating net asset value. In addition, the Board of Trustees of the Affiliated MMF may impose a fee on redemptions (sometimes referred to as a liquidity fee) or temporarily suspend redemptions (sometimes referred to as imposing a redemption gate) in the event its liquidity falls below regulatory limits.
Note 7. Interfund lending
Pursuant to an exemptive order granted by the Securities and Exchange Commission, the Fund participates in a program (the Interfund Program) allowing each participating Columbia Fund (each, a Participating Fund) to lend money directly to and, except for closed-end funds and money market funds, borrow money directly from other Participating Funds for temporary purposes. The amounts eligible for borrowing and lending under the Interfund Program are subject to certain restrictions.
| 28 | Columbia Global Energy and Natural Resources Fund | Annual Report 2019 |
Notes to Financial Statements (continued)
August 31, 2019
Interfund loans are subject to the risk that the borrowing fund could be unable to repay the loan when due, and a delay in repayment to the lending fund could result in lost opportunities and/or additional lending costs. The exemptive order is subject to conditions intended to mitigate conflicts of interest arising from the Investment Manager’s relationship with each Participating Fund.
The Fund did not borrow or lend money under the Interfund Program during the year ended August 31, 2019.
Note 8. Line of credit
The Fund has access to a revolving credit facility with a syndicate of banks led by Citibank, N.A., HSBC Bank USA, N.A. and JPMorgan Chase Bank, N.A. whereby the Fund may borrow for the temporary funding of shareholder redemptions or for other temporary or emergency purposes. The credit facility, which is a collective agreement between the Fund and certain other funds managed by the Investment Manager or an affiliated investment manager, severally and not jointly, permits collective borrowings up to $1 billion. Interest is charged to each participating fund based on its borrowings at a rate equal to the higher of (i) the federal funds effective rate, (ii) the one-month LIBOR rate and (iii) the overnight bank funding rate, plus in each case, 1.00%. Each borrowing under the credit facility matures no later than 60 days after the date of borrowing. The Fund also pays a commitment fee equal to its pro rata share of the unused amount of the credit facility at a rate of 0.15% per annum. The commitment fee is included in other expenses in the Statement of Operations. This agreement expires annually in December unless extended or renewed.
The Fund had no borrowings during the year ended August 31, 2019.
Note 9. Significant risks
Energy sector risk
The Fund may be more susceptible to the particular risks that may affect companies in the energy sector than if it were invested in a wider variety of companies in unrelated sectors. Companies in the energy sector are subject to certain risks, including legislative or regulatory changes, adverse market conditions and increased competition. Performance of such companies may be affected by factors including, among others, fluctuations in energy prices and supply and demand of energy fuels, energy conservation, the success of exploration projects, local and international politics, and events occurring in nature. The energy sector may also be affected by economic cycles, rising interest rates, high inflation, technical progress, labor relations, legislative or regulatory changes, local and international politics, and adverse market conditions.
Foreign securities and emerging market countries risk
Investing in foreign securities may involve certain risks not typically associated with investing in U.S. securities, such as increased currency volatility and risks associated with political, regulatory, economic, social, diplomatic and other conditions or events occurring in the country or region, which may result in significant market volatility. In addition, certain foreign securities may not be as liquid as U.S. securities. Investing in emerging markets may increase these risks and expose the Fund to elevated risks associated with increased inflation, deflation or currency devaluation. To the extent that the Fund concentrates its investment exposure to any one or a few specific countries, the Fund will be particularly susceptible to the risks associated with the conditions, events or other factors impacting those countries or regions and may, therefore, have a greater risk than that of a fund that is more geographically diversified.
Materials sector risk
The Fund may be more susceptible to the particular risks that may affect companies in the materials sector than if it were invested in a wider variety of companies in unrelated sectors. Companies in the materials sector are subject to certain risks, including that many materials companies are significantly affected by the level and volatility of commodity prices, exchange rates, import controls, increased competition, environmental policies, consumer demand, and events occurring in nature. For instance, natural events (such as earthquakes, hurricanes or fires in prime natural resources) can affect the value of companies involved in business activities in the materials sector . Performance of such companies may be affected by factors including, among others, that at times worldwide production of industrial materials has exceeded demand as a result of over-building or economic downturns, leading to poor investment returns or losses. Other risks may include liabilities for
Columbia Global Energy and Natural Resources Fund | Annual Report 2019
| 29 |
Notes to Financial Statements (continued)
August 31, 2019
environmental damage and general civil liabilities, depletion of resources, and mandated expenditures for safety and pollution control. The materials sector may also be affected by economic cycles, rising interest rates, high inflation, technical progress, labor relations, legislative or regulatory changes, local and international policies and adverse market conditions.
Non-diversification risk
A non-diversified fund is permitted to invest a greater percentage of its total assets in fewer issuers than a diversified fund. This increases the risk that a change in the value of any one investment held by the Fund could affect the overall value of the Fund more than it would affect that of a diversified fund holding a greater number of investments. Accordingly, the Fund’s value will likely be more volatile than the value of a more diversified fund.
Shareholder concentration risk
At August 31, 2019, one unaffiliated shareholder of record owned 11.4% of the outstanding shares of the Fund in one or more accounts. The Fund has no knowledge about whether any portion of those shares was owned beneficially. Affiliated shareholders of record owned 33.5% of the outstanding shares of the Fund in one or more accounts. Subscription and redemption activity by concentrated accounts may have a significant effect on the operations of the Fund. In the case of a large redemption, the Fund may be forced to sell investments at inopportune times, including its liquid positions, which may result in Fund losses and the Fund holding a higher percentage of less liquid positions. Large redemptions could result in decreased economies of scale and increased operating expenses for non-redeeming Fund shareholders.
Note 10. Subsequent events
Management has evaluated the events and transactions that have occurred through the date the financial statements were issued and noted no items requiring adjustment of the financial statements or additional disclosure.
Note 11. Information regarding pending and settled legal proceedings
Ameriprise Financial and certain of its affiliates have historically been involved in a number of legal, arbitration and regulatory proceedings, including routine litigation, class actions, and governmental actions, concerning matters arising in connection with the conduct of their business activities. Ameriprise Financial believes that the Fund is not currently the subject of, and that neither Ameriprise Financial nor any of its affiliates are the subject of, any pending legal, arbitration or regulatory proceedings that are likely to have a material adverse effect on the Fund or the ability of Ameriprise Financial or its affiliates to perform under their contracts with the Fund. Ameriprise Financial is required to make quarterly (10-Q), annual (10-K) and, as necessary, 8-K filings with the Securities and Exchange Commission (SEC) on legal and regulatory matters that relate to Ameriprise Financial and its affiliates. Copies of these filings may be obtained by accessing the SEC website at www.sec.gov.
There can be no assurance that these matters, or the adverse publicity associated with them, will not result in increased Fund redemptions, reduced sale of Fund shares or other adverse consequences to the Fund. Further, although we believe proceedings are not likely to have a material adverse effect on the Fund or the ability of Ameriprise Financial or its affiliates to perform under their contracts with the Fund, these proceedings are subject to uncertainties and, as such, we are unable to estimate the possible loss or range of loss that may result. An adverse outcome in one or more of these proceedings could result in adverse judgments, settlements, fines, penalties or other relief that could have a material adverse effect on the consolidated financial condition or results of operations of Ameriprise Financial.
| 30 | Columbia Global Energy and Natural Resources Fund | Annual Report 2019 |
Report of Independent Registered Public Accounting Firm
To the Board of Trustees of Columbia Funds Series Trust I and Shareholders of Columbia Global Energy and Natural Resources Fund
Opinion on the Financial Statements
We have audited the accompanying statement of assets and liabilities, including the portfolio of investments, of Columbia Global Energy and Natural Resources Fund (one of the funds constituting Columbia Funds Series Trust I, hereafter referred to as the “Fund”) as of August 31, 2019, the related statement of operations for the year ended August 31, 2019, the statement of changes in net assets for each of the two years in the period ended August 31, 2019, including the related notes, and the financial highlights for each of the periods indicated therein (collectively referred to as the “financial statements”). In our opinion, the financial statements present fairly, in all material respects, the financial position of the Fund as of August 31, 2019, the results of its operations for the year then ended, the changes in its net assets for each of the two years in the period ended August 31, 2019 and the financial highlights for each of the periods indicated therein in conformity with accounting principles generally accepted in the United States of America.
Basis for Opinion
These financial statements are the responsibility of the Fund’s management. Our responsibility is to express an opinion on the Fund’s financial statements based on our audits. We are a public accounting firm registered with the Public Company Accounting Oversight Board (United States) (PCAOB) and are required to be independent with respect to the Fund in accordance with the U.S. federal securities laws and the applicable rules and regulations of the Securities and Exchange Commission and the PCAOB.
We conducted our audits of these financial statements in accordance with the standards of the PCAOB. Those standards require that we plan and perform the audit to obtain reasonable assurance about whether the financial statements are free of material misstatement, whether due to error or fraud.
Our audits included performing procedures to assess the risks of material misstatement of the financial statements, whether due to error or fraud, and performing procedures that respond to those risks. Such procedures included examining, on a test basis, evidence regarding the amounts and disclosures in the financial statements. Our audits also included evaluating the accounting principles used and significant estimates made by management, as well as evaluating the overall presentation of the financial statements. Our procedures included confirmation of securities owned as of August 31, 2019, by correspondence with the custodian, transfer agent, and brokers; when replies were not received from brokers, we performed other audit procedures. We believe that our audits provide a reasonable basis for our opinion.
/s/PricewaterhouseCoopers LLP
Minneapolis, Minnesota
October 24, 2019
We have served as the auditor of one or more investment companies within the Columbia Funds Complex since 1977.
Columbia Global Energy and Natural Resources Fund | Annual Report 2019
| 31 |
Federal Income Tax Information
(Unaudited)
The Fund hereby designates the following tax attributes for the fiscal year ended August 31, 2019. Shareholders will be notified in early 2020 of the amounts for use in preparing 2019 income tax returns.
Qualified
dividend
income | Dividends
received
deduction |
| 100.00% | 65.19% |
Qualified dividend income. For taxable, non-corporate shareholders, the percentage of ordinary income distributed during the fiscal year that represents qualified dividend income subject to reduced tax rates.
Dividends received deduction. The percentage of ordinary income distributed during the fiscal year that qualifies for the corporate dividends received deduction.
TRUSTEES AND OFFICERS
The Board oversees the Fund’s operations and appoints officers who are responsible for day-to-day business decisions based on policies set by the Board. The following table provides basic biographical information about the Fund’s Trustees as of the printing of this report, including their principal occupations during the past five years, although specific titles for individuals may have varied over the period. The year set forth beneath Length of Service in the table below is the year in which the Trustee was first appointed or elected as Trustee to any Fund currently in the Columbia Funds Complex or a predecessor thereof. Under current Board policy, members serve terms of indefinite duration.
Independent trustees
| Name, address, year of birth | Position held with the Trust and length of service | Principal occupation(s) during the past five years and other relevant professional experience | Number of Funds in the Columbia Fund Complex overseen | Other directorships held by Trustee during the past five years |
Janet Langford Carrig
c/o Columbia Management
Investment Advisers, LLC
225 Franklin Street
Mail Drop BX32 05228
Boston, MA 02110
1957 | Trustee
1996 | Senior Vice President, General Counsel and Corporate Secretary, ConocoPhillips (independent energy company), September 2007-October 2018 | 70 | None |
Douglas A. Hacker
c/o Columbia Management
Investment Advisers, LLC
225 Franklin Street
Mail Drop BX32 05228
Boston, MA 02110
1955 | Trustee and Chairman of the Board
1996 | Independent business executive since May 2006; Executive Vice President — Strategy of United Airlines, December 2002-May 2006; President of UAL Loyalty Services (airline marketing company), September 2001-December 2002; Executive Vice President and Chief Financial Officer of United Airlines, July 1999-September 2001 | 70 | Spartan Nash Company, (food distributor); former Director, Nash Finch Company (food distributor), 2005-2013; Aircastle Limited (aircraft leasing); former Director, SeaCube Container Leasing Ltd. (container leasing), 2010-2013; and Travelport Worldwide Limited (travel information technology) |
Nancy T. Lukitsh
c/o Columbia Management
Investment Advisers, LLC
225 Franklin Street
Mail Drop BX32 05228
Boston, MA 02110
1956 | Trustee
2011 | Senior Vice President, Partner and Director of Marketing, Wellington Management Company, LLP (investment adviser), 1997-2010; Chair, Wellington Management Portfolios (commingled non-U.S. investment pools), 2007-2010; Director, Wellington Trust Company, NA and other Wellington affiliates, 1997-2010 | 70 | None |
| 32 | Columbia Global Energy and Natural Resources Fund | Annual Report 2019 |
TRUSTEES AND OFFICERS (continued)
Independent trustees (continued)
| Name, address, year of birth | Position held with the Trust and length of service | Principal occupation(s) during the past five years and other relevant professional experience | Number of Funds in the Columbia Fund Complex overseen | Other directorships held by Trustee during the past five years |
David M. Moffett
c/o Columbia Management
Investment Advisers, LLC
225 Franklin Street
Mail Drop BX32 05228
Boston, MA 02110
1952 | Trustee
2011 | Retired. Consultant to Bridgewater and Associates | 70 | Director, CSX Corporation (transportation suppliers); Genworth Financial, Inc. (financial and insurance products and services); PayPal Holdings Inc. (payment and data processing services); Trustee, University of Oklahoma Foundation; former Director, eBay Inc. (online trading community), 2007-2015; and former Director, CIT Bank, CIT Group Inc. (commercial and consumer finance), 2010-2016 |
John J. Neuhauser
c/o Columbia Management
Investment Advisers, LLC
225 Franklin Street
Mail Drop BX32 05228
Boston, MA 02110
1943 | Trustee
1984 | President, Saint Michael’s College, August 2007-June 2018; Director or Trustee of several non-profit organizations, including University of Vermont Medical Center; Academic Vice President and Dean of Faculties, Boston College, August 1999-October 2005; University Professor, Boston College, November 2005-August 2007 | 70 | Liberty All-Star Equity Fund and Liberty All- Star Growth Fund (closed-end funds) |
Patrick J. Simpson
c/o Columbia Management
Investment Advisers, LLC
225 Franklin Street
Mail Drop BX32 05228
Boston, MA 02110
1944 | Trustee
2000 | Of Counsel, Perkins Coie LLP (law firm) since 2015; Partner, Perkins Coie LLP, 1988-2014 | 70 | Former Director, M Fund, Inc. (M Funds mutual fund family), July 2018-July 2019 |
Anne-Lee Verville
c/o Columbia Management
Investment Advisers, LLC
225 Franklin Street
Mail Drop BX32 05228
Boston, MA 02110
1945 | Trustee
1998 | Retired. General Manager, Global Education Industry, 1994-1997, President – Application Systems Division, 1991-1994, Chief Financial Officer – US Marketing & Services, 1988-1991, and Chief Information Officer, 1987-1988, IBM Corporation (computer and technology) | 70 | Former Director, Enesco Group, Inc. (producer of giftware and home and garden decor products), 2001-2006 |
Consultants to the Independent Trustees*
| Name, address, year of birth | Position held with the Trust and length of service | Principal occupation(s) during the past five years and other relevant professional experience | Number of Funds in the Columbia Funds complex overseen | Other directorships held by Trustee during the past five years |
J. Kevin Connaughton
c/o Columbia
Management Investment
Advisers, LLC,
225 Franklin Street
Mail Drop BX32 05228,
Boston, MA 02110
1964 | Independent Trustee Consultant
2016 | Independent Trustee Consultant, Columbia Funds since March 2016; Adjunct Professor of Finance, Bentley University since November 2017; Managing Director and General Manager of Mutual Fund Products, Columbia Management Investment Advisers, LLC, May 2010-February 2015; President, Columbia Funds, 2009-2015; and senior officer of Columbia Funds and affiliated funds, 2003-2015 | 70 | Director, The Autism Project since March 2015; former Trustee, New Century Portfolios, March 2015-December 2017; formerly on Board of Governors, Gateway Healthcare, January 2016 – December 2017 |
Columbia Global Energy and Natural Resources Fund | Annual Report 2019
| 33 |
TRUSTEES AND OFFICERS (continued)
Consultants to the Independent Trustees* (continued)
| Name, address, year of birth | Position held with the Trust and length of service | Principal occupation(s) during the past five years and other relevant professional experience | Number of Funds in the Columbia Funds complex overseen | Other directorships held by Trustee during the past five years |
Olive Darragh
c/o Columbia
Management Investment
Advisers, LLC,
225 Franklin Street,
Mail Drop BX32 05228,
Boston, MA 02110
1962 | Independent Trustee Consultant 2019 | Independent Trustee Consultant, Columbia Funds since June 2019; Managing Director of Darragh Inc. (a strategy and talent management consulting firm) since 2010; Founder and CEO, Zolio (an investment management talent identification platform) since 2004; Partner, Tudor Investments, 2004-2010; Senior Partner, McKinsey & Company, 2001-2004 | 70 | Director, University of Edinburgh Business School; former Director, Boston Public Library Foundation |
Natalie A. Trunow
c/o Columbia
Management Investment
Advisers, LLC,
225 Franklin Street
Mail Drop BX32 05228,
Boston, MA 02110
1967 | Independent Trustee Consultant
2016 | Independent Trustee Consultant, Columbia Funds since September 2016; Chief Executive Officer, Millennial Portfolio Solutions LLC (asset management and consulting services) since January 2016; Director of Investments, Casey Family Programs, April 2016-September 2016; Senior Vice President and Chief Investment Officer, Calvert Investments, August 2008-January 2016; Section Head and Portfolio Manager, General Motors Asset Management, June 1997-August 2008 | 70 | Director, Health Services for Children with Special Needs, Inc.; Director, Consumer Credit Counseling Services (formerly Guidewell Financial Solutions) |
| * | J. Kevin Connaughton was appointed consultant to the Independent Trustees effective March 1, 2016. Olive Darragh was appointed consultant to the Independent Trustees effective June 10, 2019. Natalie A. Trunow was appointed consultant to the Independent Trustees effective September 1, 2016. Shareholders of the Funds are expected to be asked to elect each of Mr. Connaughton, Ms. Darragh and Ms. Trunow as a Trustee at a future shareholder meeting. |
Interested trustee affiliated with Investment Manager*
| Name, address, year of birth | Position held with the Trust and length of service | Principal occupation(s) during the past five years and other relevant professional experience | Number of Funds in the Columbia Funds Complex overseen | Other directorships held by Trustee during the past five years |
William F. Truscott
c/o Columbia Management
Investment Advisers, LLC
225 Franklin Street
Boston, MA 02110
1960 | Trustee
2012 | Chairman of the Board and President, Columbia Management Investment Advisers, LLC since May 2010 and February 2012, respectively; Chief Executive Officer, Global Asset Management, Ameriprise Financial, Inc. since September 2012 (previously Chief Executive Officer, U.S. Asset Management & President, Annuities, May 2010-September 2012); Director and Chief Executive Officer, Columbia Management Investment Distributors, Inc. since May 2010 and February 2012, respectively; Chairman of the Board and Chief Executive Officer, RiverSource Distributors, Inc. since 2006; Director, Threadneedle Asset Management Holdings, SARL since 2014; President and Chief Executive Officer, Ameriprise Certificate Company, 2006-August 2012 | 192 | Chairman of the Board, Columbia Management Investment Advisers, LLC since May 2010; Director, Columbia Management Investment Distributors, Inc. since May 2010; former Director, Ameriprise Certificate Company, August 2006 - January 2013 |
| * | Interested person (as defined under the 1940 Act) by reason of being an officer, director, security holder and/or employee of the Investment Manager or Ameriprise Financial. |
The Statement of Additional Information has additional information about the Fund’s Board members and is available, without charge, upon request by calling 800.345.6611, visiting columbiathreadneedleus.com/investor/ or contacting your financial intermediary.
| 34 | Columbia Global Energy and Natural Resources Fund | Annual Report 2019 |
TRUSTEES AND OFFICERS (continued)
The Board has appointed officers who are responsible for day-to-day business decisions based on policies it has established. The officers serve at the pleasure of the Board. The following table provides basic information about the Officers of the Fund as of the printing of this report, including principal occupations during the past five years, although their specific titles may have varied over the period. In addition to Mr. Truscott, who is Senior Vice President, the Fund’s other officers are:
Fund officers
Name,
address and
year of birth | Position and year
first appointed to
position for any Fund
in the Columbia
Funds complex or a
predecessor thereof | Principal occupation(s) during past five years |
Christopher O. Petersen
5228 Ameriprise
Financial Center
Minneapolis, MN 55474
Born 1970 | President and Principal Executive Officer (2015) | Vice President and Lead Chief Counsel, Ameriprise Financial, Inc. since January 2015 (previously Vice President and Chief Counsel, January 2010 - December 2014; officer of Columbia Funds and affiliated funds since 2007. |
Michael G. Clarke
225 Franklin Street
Boston, MA 02110
Born 1969 | Chief Financial Officer (Principal Financial Officer) (2009) and Senior Vice President (2019) | Vice President, Head of North American Operations, and Co-Head of Global Operations, Columbia Management Investment Advisers, LLC, since June 2019 (previously Vice President – Accounting and Tax, May 2010 - May 2019); senior officer of Columbia Funds and affiliated funds since 2002 (previously Treasurer and Chief Accounting Officer, January 2009 - January 2019 and December 2015 - January 2019, respectively). |
Joseph Beranek
5890 Ameriprise
Financial Center
Minneapolis, MN 55474
Born 1965 | Treasurer and Chief Accounting Officer (Principal Accounting Officer) (2019) | Vice President — Mutual Fund Accounting and Financial Reporting, Columbia Management Investment Advisers, LLC, since December 2018 and March 2017, respectively (previously Vice President — Pricing and Corporate Actions, May 2010 - March 2017). |
Paul B. Goucher
485 Lexington Avenue
New York, NY 10017
Born 1968 | Senior Vice President (2011) and Assistant Secretary (2008) | Senior Vice President and Assistant General Counsel, Ameriprise Financial, Inc. since January 2017 (previously Vice President and Lead Chief Counsel, November 2008 - January 2017 and January 2013 - January 2017, respectively); Vice President, Chief Legal Officer and Assistant Secretary, Columbia Management Investment Advisers, LLC since March 2015 (previously Vice President and Assistant Secretary, May 2010 – March 2015). |
Thomas P. McGuire
225 Franklin Street
Boston, MA 02110
Born 1972 | Senior Vice President and Chief Compliance Officer (2012) | Vice President — Asset Management Compliance, Ameriprise Financial, Inc., since May 2010; Chief Compliance Officer, Ameriprise Certificate Company since September 2010. |
Colin Moore
225 Franklin Street
Boston, MA 02110
Born 1958 | Senior Vice President (2010) | Executive Vice President and Global Chief Investment Officer, Ameriprise Financial, Inc., since July 2013; Executive Vice President and Global Chief Investment Officer, Columbia Management Investment Advisers, LLC since July 2013. |
Ryan C. Larrenaga
225 Franklin Street
Boston, MA 02110
Born 1970 | Senior Vice President (2017), Chief Legal Officer (2017), and Secretary (2015) | Vice President and Chief Counsel, Ameriprise Financial, Inc. since August 2018 (previously Vice President and Group Counsel, August 2011 - August 2018); officer of Columbia Funds and affiliated funds since 2005. |
Michael E. DeFao
225 Franklin Street
Boston, MA 02110
Born 1968 | Vice President (2011) and Assistant Secretary (2010) | Vice President and Chief Counsel, Ameriprise Financial, Inc. since May 2010. |
Lyn Kephart-Strong
5228 Ameriprise
Financial Center
Minneapolis, MN 55474
Born 1960 | Vice President (2015) | President, Columbia Management Investment Services Corp. since October 2014; Vice President & Resolution Officer, Ameriprise Trust Company since August 2009. |
Columbia Global Energy and Natural Resources Fund | Annual Report 2019
| 35 |
Board Consideration and Approval of Management
Agreement
On June 12, 2019, the Board of Trustees (the Board) and the Trustees who are not interested persons (as defined in the Investment Company Act of 1940) (the Independent Trustees) of Columbia Funds Series Trust I (the Trust) unanimously approved the continuation of the Management Agreement (the Management Agreement) with Columbia Management Investment Advisers, LLC (the Investment Manager) with respect to Columbia Global Energy and Natural Resources Fund (the Fund), a series of the Trust. As detailed below, the Board’s Advisory Fees and Expenses Committee (the Committee) and the Board met on multiple occasions to review and discuss, among themselves, with the management team of the Investment Manager and with an independent fee consultant, materials provided by the Investment Manager, the independent fee consultant and others before determining to approve the continuation of the Management Agreement.
In connection with their deliberations regarding the continuation of the Management Agreement, the Committee and the Board evaluated materials requested from the Investment Manager regarding the Fund and the Management Agreement, and discussed these materials with representatives of the Investment Manager at Committee meetings held on March 5, 2019, April 25, 2019 and June 11, 2019 and at Board meetings held on March 6, 2019 and June 12, 2019. In addition, the Board and its various committees consider matters bearing on the Management Agreement at other meetings throughout the year and in prior years and meet regularly with senior management of the Trust and the Investment Manager. Through the Board’s Investment Oversight Committees, Trustees also meet with selected portfolio managers of the funds the Trustees oversee and with other investment personnel at various times throughout the year. The Committee and the Board also consulted with the independent fee consultant, Fund counsel and the Independent Trustees’ independent legal counsel, who advised on various matters with respect to the Committee’s and the Board’s considerations and otherwise assisted the Committee and the Board in their deliberations. On June 11, 2019, the Committee recommended that the Board approve the continuation of the Management Agreement. On June 12, 2019, the Board, including the Independent Trustees, voting separately, unanimously approved the continuation of the Management Agreement for the Fund.
The Committee and the Board considered all information that they, their legal counsel or the Investment Manager believed reasonably necessary to evaluate and to determine whether to recommend for approval or approve the continuation of the Management Agreement. The information and factors considered by the Committee and the Board in recommending for approval or approving the continuation of the Management Agreement for the Fund included the following:
| • | Information on the investment performance of the Fund relative to the performance of a group of mutual funds determined to be comparable to the Fund by an independent third-party data provider, as well as performance relative to benchmarks; |
| • | Information on the Fund’s management fees and total expenses, including information comparing the Fund’s expenses to those of a group of comparable mutual funds, as determined by the independent third-party data provider; |
| • | The Investment Manager’s agreement to contractually limit or cap total operating expenses for the Fund through December 31, 2020 so that total operating expenses (excluding certain fees and expenses, such as transaction costs and certain other investment related expenses, interest, taxes, acquired fund fees and expenses, and infrequent and/or unusual expenses) would not exceed a specified annual rate, as a percentage of the Fund’s net assets; |
| • | The terms and conditions of the Management Agreement; |
| • | The current and proposed terms and conditions of other agreements and arrangements with affiliates of the Investment Manager relating to the operations of the Fund, including agreements with respect to the provision of distribution, transfer agency and shareholder services to the Fund; |
| • | Descriptions of various functions performed by the Investment Manager under the Management Agreement, including portfolio management and portfolio trading practices; |
| • | Information regarding the management fees of similarly-managed portfolios of other clients of the Investment Manager, including institutional accounts and collective trusts; |
| • | Information regarding the reputation, regulatory history and resources of the Investment Manager, including information regarding senior management, portfolio managers and other personnel; |
| 36 | Columbia Global Energy and Natural Resources Fund | Annual Report 2019 |
Board Consideration and Approval of Management
Agreement (continued)
| • | Information regarding the capabilities of the Investment Manager with respect to compliance monitoring services, including an assessment of the Investment Manager’s compliance system by the Fund’s Chief Compliance Officer; and |
| • | The profitability to the Investment Manager and its affiliates from their relationships with the Fund. |
Nature, extent and quality of services provided under the Management Agreement
The Committee and the Board considered the nature, extent and quality of services provided to the Fund by the Investment Manager and its affiliates under the Management Agreement and under separate agreements for the provision of transfer agency and shareholder services, and the resources dedicated to the Fund and the other Columbia Funds by the Investment Manager and its affiliates. The Committee and the Board considered, among other things, the Investment Manager’s ability to attract, motivate and retain highly qualified research, advisory and supervisory investment professionals (including compensation programs for personnel involved in fund management, reputation and other attributes), the portfolio management services provided by those investment professionals, and the quality of the Investment Manager’s investment research capabilities and trade execution services. The Committee and the Board also considered the potential benefits to shareholders of investing in a mutual fund that is part of a fund complex offering exposure to a variety of asset classes and investment disciplines and providing a variety of fund and shareholder services.
The Committee and the Board also considered the professional experience and qualifications of the senior personnel of the Investment Manager, which included consideration of the Investment Manager’s experience with funds using an investment strategy similar to that used by the Investment Manager for the Fund. The Committee and the Board noted the compliance programs of and the compliance-related resources provided to the Fund by the Investment Manager and its affiliates and the resources dedicated by the Investment Manager and its affiliates to risk management, and considered the Investment Manager’s ability to provide administrative services to the Fund and coordinate the activities of the Fund’s other service providers. After reviewing these and related factors, the Committee and the Board concluded, within the context of their overall conclusions, that the nature, extent and quality of the services provided to the Fund under the Management Agreement supported the continuation of the Management Agreement.
Investment performance
The Committee and the Board reviewed information about the performance of the Fund over various time periods, including performance information relative to benchmarks, information that compared the performance of the Fund to the performance of a group of comparable mutual funds as determined by the independent third-party data provider, and information and analysis provided by the independent fee consultant. The Committee and the Board also reviewed a description of the third party’s methodology for identifying the Fund’s peer groups for purposes of performance and expense comparisons.
The Committee and the Board noted that, through December 31, 2018, the Fund’s performance was in the forty-fifth, twenty-fifth and thirty-fifth percentile (where the best performance would be in the first percentile) of its category selected by the independent third-party data provider for the purposes of performance comparisons for the one-, three- and five-year periods, respectively.
The Committee and the Board also considered the Investment Manager’s performance and reputation generally, the Investment Manager’s historical responsiveness to Board concerns about performance, and the Investment Manager’s willingness to take steps intended to improve performance. After reviewing these and related factors, the Committee and the Board concluded, within the context of their overall conclusions, that the performance of the Fund and the Investment Manager was sufficient, in light of other considerations, to support the continuation of the Management Agreement.
Investment management fee rates and other expenses
The Committee and the Board considered the management fees charged to the Fund under the Management Agreement as well as the total expenses incurred by the Fund. In assessing the reasonableness of the fees under the Management Agreement, the Committee and the Board considered, among other information, the Fund’s total expense ratio as a percentage of average daily net assets. The Committee and the Board considered data provided by the independent third-party data provider and the independent fee consultant. The Committee and the Board noted that, as of December 31, 2018, the Fund’s actual management fee and net total expense ratio were ranked in the fourth and second quintiles,
Columbia Global Energy and Natural Resources Fund | Annual Report 2019
| 37 |
Board Consideration and Approval of Management
Agreement (continued)
respectively, (where the lowest fees and expenses would be in the first quintile) against the Fund’s expense universe as determined by the independent third-party data provider for purposes of expense comparison. The Committee and the Board also took into account the fee waiver and expense limitation arrangements agreed to by the Investment Manager, as noted above.
The Committee and the Board also received and considered information about the management fees charged by the Investment Manager to institutional accounts. In considering the fees charged to those accounts, the Committee and the Board took into account, among other things, the Investment Manager’s representations about the differences between managing mutual funds as compared to other types of accounts, including differences in the services provided, differences in the risk profile of such business for the Investment Manager and the additional resources required to manage mutual funds effectively. The Committee and the Board also received and considered information about the fees charged by the Investment Manager for sub-advisory services it provides to comparable unaffiliated funds. In evaluating the Fund’s management fees, the Committee and the Board also took into account the demands, complexity and quality of the investment management of the Fund.
After reviewing these and related factors, the Committee and the Board concluded, within the context of their overall conclusions, that the management fee rates and expenses of the Fund, in light of other considerations, supported the continuation of the Management Agreement.
Costs of services provided and profitability
The Committee and the Board also took note of the costs the Investment Manager and its affiliates incur in connection with the services provided and the profitability to the Investment Manager and its affiliates from their relationships with the Fund, and the efforts undertaken by the Investment Manager and its affiliates to manage efficiently their costs to provide such services.
The Committee and the Board also considered the compensation directly or indirectly received by the Investment Manager’s affiliates in connection with their relationships with the Fund. The Committee and the Board reviewed information provided by management as to the profitability to the Investment Manager and its affiliates of their relationships with the Fund, information about the allocation of expenses used to calculate profitability, and comparisons of profitability levels realized in 2018 to profitability levels realized in 2017. When reviewing profitability, the Committee and the Board also considered court cases in which adviser profitability was an issue in whole or in part, the performance of similarly managed funds, the performance of the Fund, and the expense ratio of the Fund. In addition, the Committee and the Board considered information provided by the Investment Manager regarding the Investment Manager’s financial condition and comparing its profitability to that of other asset management firms that are, or are subsidiaries of, publicly traded companies. In this regard, the Committee and the Board also considered data provided by the independent fee consultant.
After reviewing these and related factors, the Committee and the Board concluded, within the context of their overall conclusions, that the costs of services provided and the profitability to the Investment Manager and its affiliates from their relationships with the Fund supported the continuation of the Management Agreement.
Economies of scale
The Committee and the Board considered the potential existence of economies of scale in the provision by the Investment Manager of services to the Fund, to groups of related funds, and to the Investment Manager’s investment advisory clients as a whole, and whether those economies of scale were shared with the Fund through breakpoints in investment management fees or other means, such as expense limitation arrangements and additional investments by the Investment Manager in investment, trading, compliance and other resources. The Committee and the Board noted that the management fee schedules for the Fund contained breakpoints that would reduce the fee rate on assets above specified threshold levels.
In considering these matters, the Committee and the Board also considered the costs of the services provided and the profitability to the Investment Manager and its affiliates from their relationships with the Fund, as noted above. After reviewing these and related factors, the Committee and the Board concluded, within the context of their overall conclusions, that the extent to which any economies of scale were expected to be shared with the Fund supported the continuation of the Management Agreement.
| 38 | Columbia Global Energy and Natural Resources Fund | Annual Report 2019 |
Board Consideration and Approval of Management
Agreement (continued)
Other benefits to the Investment Manager
The Committee and the Board received and considered information regarding “fall-out” or ancillary benefits received by the Investment Manager and its affiliates as a result of their relationships with the Fund, such as the engagement of the Investment Manager’s affiliates to provide distribution, transfer agency and shareholder services to the Fund. In this regard, among other matters, the Committee and the Board considered that the Fund’s distributor retains a portion of the distribution fees from the Fund and receives a portion of the sales charges on sales or redemptions of certain classes of shares of the Fund. The Committee and the Board also considered the benefits of research made available to the Investment Manager by reason of brokerage commissions generated by the Fund’s securities transactions, and reviewed information about the Investment Manager’s practices with respect to considering brokerage and research services when allocating portfolio transactions. In this connection, the Board also noted that the amount of research made available to the Investment Manager by reason of brokerage commissions had been declining over time, and may decline further. The Committee and the Board recognized that the Investment Manager’s profitability would be somewhat lower without these benefits.
Conclusion
The Committee and the Board reviewed all of the above considerations in reaching their decisions to recommend or approve the continuation of the Management Agreement. In their deliberations, the Trustees did not identify any particular information that was all-important or controlling, and individual Trustees may have attributed different weights to the various factors. Based on their evaluation of all factors that they deemed to be material, including those factors described above, and assisted by the advice of independent legal counsel, the Board, including the Independent Trustees, voting separately, unanimously approved the continuation of the Management Agreement.
Columbia Global Energy and Natural Resources Fund | Annual Report 2019
| 39 |
Columbia Global Energy and Natural Resources Fund
P.O. Box 219104
Kansas City, MO 64121-9104
Please read and consider the investment objectives, risks, charges and expenses for any fund carefully before investing. For a prospectus and summary prospectus, which contains this and other important information about the Fund, go to
columbiathreadneedleus.com/investor/. The Fund is distributed by Columbia Management Investment Distributors, Inc., member FINRA, and managed by Columbia Management Investment Advisers, LLC.
Columbia Threadneedle Investments (Columbia Threadneedle) is the global brand name of the Columbia and Threadneedle group of companies. All rights reserved.
© 2019 Columbia Management Investment Advisers, LLC.
columbiathreadneedleus.com/investor/

Annual Report
August 31, 2019
Columbia Strategic Income Fund
Beginning on January 1, 2021, as permitted by regulations adopted by the Securities and Exchange Commission, paper copies of the Fund’s annual and semiannual shareholder reports like this one will no longer be sent by mail, unless you specifically request paper copies of the reports. Instead, the reports will be made available on the Fund’s website (columbiathreadneedleus.com/investor/), and each time a report is posted you will be notified by mail and provided with a website address to access the report.
If you have already elected to receive shareholder reports electronically, you will not be affected by this change and you need not take any action. You may elect to receive shareholder reports and other communications from the Fund electronically at any time by contacting your financial intermediary (such as a broker-dealer or bank) or, for Fund shares held directly with the Fund, by calling 800.345.6611 or by enrolling in “eDelivery” by logging into your account at columbiathreadneedleus.com/investor/.
You may elect to receive all future reports in paper free of charge. If you invest through a financial intermediary, you can contact your financial intermediary to request that you continue receiving paper copies of your shareholder reports. If you invest directly with the Fund, you can call 800.345.6611 to let the Fund know you wish to continue receiving paper copies of your shareholder reports. Your election to receive paper reports will apply to all Columbia Funds held in your account if you invest through a financial intermediary or all Columbia Funds held with the fund complex if you invest directly with the Fund.
Not FDIC Insured • No bank guarantee • May lose value
Columbia Strategic Income Fund (the Fund) mails one shareholder report to each shareholder address, unless such shareholder elected to receive shareholder reports from the Fund electronically. If you would like more than one report, please call shareholder services at 800.345.6611 and additional reports will be sent to you.
Proxy voting policies and procedures
The policy of the Board of Trustees is to vote the proxies of the companies in which the Fund holds investments consistent with the procedures as stated in the Statement of Additional Information (SAI). You may obtain a copy of the SAI without charge by calling 800.345.6611; contacting your financial intermediary; visiting columbiathreadneedleus.com/investor/; or searching the website of the Securities and Exchange Commission (SEC) at sec.gov. Information regarding how the Fund voted proxies relating to portfolio securities is filed with the SEC by August 31st for the most recent 12-month period ending June 30th of that year, and is available without charge by visiting columbiathreadneedleus.com/investor/, or searching the website of the SEC at sec.gov.
Quarterly schedule of investments
The Fund files a complete schedule of portfolio holdings with the SEC for the first and third quarters of each fiscal year on Form N-PORT, and for reporting periods ended prior to March 31, 2019, on Form N-Q. The Fund’s Form N-Q and Form N-PORT filings are available on the SEC’s website at sec.gov. The Fund’s complete schedule of portfolio holdings, as filed on Form N-Q or Form N-PORT, can also be obtained without charge, upon request, by calling 800.345.6611.
Additional Fund information
For more information about the Fund, please visit columbiathreadneedleus.com/investor/ or call 800.345.6611. Customer Service Representatives are available to answer your questions Monday through Friday from 8 a.m. to 7 p.m. Eastern time.
Fund investment manager
Columbia Management Investment Advisers, LLC (the Investment Manager)
225 Franklin Street
Boston, MA 02110
Fund distributor
Columbia Management Investment Distributors, Inc.
225 Franklin Street
Boston, MA 02110
Fund transfer agent
Columbia Management Investment Services Corp.
P.O. Box 219104
Kansas City, MO 64121-9104
Columbia Strategic Income Fund | Annual Report 2019
Investment objective
The Fund seeks total return, consisting of current income and capital appreciation.
Portfolio management
Gene Tannuzzo, CFA
Co-Portfolio Manager
Managed Fund since 2010
Colin Lundgren, CFA
Co-Portfolio Manager
Managed Fund since 2010
Jason Callan
Co-Portfolio Manager
Managed Fund since 2017
| Average annual total returns (%) (for the period ended August 31, 2019) |
| | | Inception | 1 Year | 5 Years | 10 Years |
| Class A | Excluding sales charges | 04/21/77 | 6.75 | 3.66 | 5.67 |
| | Including sales charges | | 1.74 | 2.65 | 5.16 |
| Advisor Class* | 11/08/12 | 6.96 | 3.91 | 5.84 |
| Class C | Excluding sales charges | 07/01/97 | 5.97 | 2.86 | 4.95 |
| | Including sales charges | | 4.97 | 2.86 | 4.95 |
| Institutional Class | 01/29/99 | 6.96 | 3.91 | 5.94 |
| Institutional 2 Class* | 03/07/11 | 7.00 | 3.99 | 5.98 |
| Institutional 3 Class* | 06/13/13 | 7.08 | 4.02 | 5.92 |
| Class R* | 09/27/10 | 6.62 | 3.41 | 5.48 |
| Bloomberg Barclays U.S. Aggregate Bond Index | | 10.17 | 3.35 | 3.91 |
| ICE BofAML US Cash Pay High Yield Constrained Index | | 6.62 | 4.86 | 8.39 |
| FTSE Non-U.S. World Government Bond (All Maturities) Index - Unhedged | | 7.33 | 0.70 | 1.58 |
| JPMorgan Emerging Markets Bond Index - Global | | 13.11 | 4.66 | 7.06 |
Returns for Class A shares are shown with and without the maximum initial sales charge of 4.75%. Returns for Class C shares are shown with and without the 1.00% contingent deferred sales charge for the first year only. The Fund’s other share classes are not subject to sales charges and have limited eligibility. Please see the Fund’s prospectus for details. Performance for different share classes will vary based on differences in sales charges and fees associated with each share class. All results shown assume reinvestment of distributions during the period. Returns do not reflect the deduction of taxes that a shareholder may pay on Fund distributions or on the redemption of Fund shares. Performance results reflect the effect of any fee waivers or reimbursements of Fund expenses by Columbia Management Investment Advisers, LLC and/or any of its affiliates. Absent these fee waivers or expense reimbursement arrangements, performance results would have been lower.
The performance information shown represents past performance and is not a guarantee of future results. The investment return and principal value of your investment will fluctuate so that your shares, when redeemed, may be worth more or less than their original cost. Current performance may be lower or higher than the performance information shown. You may obtain performance information current to the most recent month-end by contacting your financial intermediary, visiting columbiathreadneedleus.com/investor/ or calling 800.345.6611.
| * | The returns shown for periods prior to the share class inception date (including returns for the Life of the Fund, if shown, which are since Fund inception) include the returns of the Fund’s oldest share class. These returns are adjusted to reflect any higher class-related operating expenses of the newer share classes, as applicable. Please visit columbiathreadneedleus.com/investor/investment-products/mutual-funds/appended-performance for more information. |
The Fund’s performance prior to August 29, 2014 reflects returns achieved pursuant to different principal investment strategies.
The Bloomberg Barclays U.S. Aggregate Bond Index is a market value-weighted index that tracks the daily price, coupon, pay-downs and total return performance of fixed-rate, publicly placed, dollar-denominated and non-convertible investment-grade debt issues with at least $250 million par amount outstanding and with at least one year to final maturity.
The ICE BofAML US Cash Pay High Yield Constrained Index tracks the performance of U.S. dollar-denominated below investment-grade corporate debt, currently in a coupon paying period, that is publicly issued in the U.S. domestic market.
The FTSE Non-U.S. World Government Bond (All Maturities) Index — Unhedged is calculated on a market-weighted basis and includes all fixed-rate bonds with a remaining maturity of one year or longer and with amounts outstanding of at least the equivalent of U.S. $25 million, while excluding floating or variable rate bonds.
The JPMorgan Emerging Markets Bond Index — Global is based on U.S. dollar-denominated debt instruments issued by emerging market sovereign and quasi-sovereign entities, such as Brady bonds, Eurobonds and loans, and reflects reinvestment of all distributions and changes in market prices.
Columbia Strategic Income Fund | Annual Report 2019
| 3 |
Fund at a Glance (continued)
Indices are not available for investment, are not professionally managed and do not reflect sales charges, fees, brokerage commissions, taxes or other expenses of investing. Securities in the Fund may not match those in an index.
Performance of a hypothetical $10,000 investment (August 31, 2009 — August 31, 2019)
The chart above shows the change in value of a hypothetical $10,000 investment in Class A shares of Columbia Strategic Income Fund during the stated time period, and does not reflect the deduction of taxes that a shareholder may pay on Fund distributions or on the redemption of Fund shares.
| Portfolio breakdown (%) (at August 31, 2019) |
| Asset-Backed Securities — Non-Agency | 10.1 |
| Commercial Mortgage-Backed Securities - Non-Agency | 3.6 |
| Common Stocks | 0.0(a) |
| Corporate Bonds & Notes | 34.3 |
| Foreign Government Obligations | 7.4 |
| Inflation-Indexed Bonds | 0.6 |
| Money Market Funds | 4.5 |
| Residential Mortgage-Backed Securities - Agency | 14.9 |
| Residential Mortgage-Backed Securities - Non-Agency | 18.0 |
| Senior Loans | 6.3 |
| Treasury Bills | 0.1 |
| U.S. Treasury Obligations | 0.2 |
| Warrants | 0.0(a) |
| Total | 100.0 |
Percentages indicated are based upon total investments excluding investments in derivatives, if any. The Fund’s portfolio composition is subject to change.
| Quality breakdown (%) (at August 31, 2019) |
| AAA rating | 17.2 |
| AA rating | 7.2 |
| A rating | 6.2 |
| BBB rating | 22.6 |
| BB rating | 12.8 |
| B rating | 15.0 |
| CCC rating | 2.7 |
| Not rated | 16.3 |
| Total | 100.0 |
Percentages indicated are based upon total fixed income investments.
Bond ratings apply to the underlying holdings of the Fund and not the Fund itself and are divided into categories ranging from highest to lowest credit quality, determined by using the middle rating of Moody’s, S&P and Fitch, after dropping the highest and lowest available ratings. When ratings are available from only two rating agencies, the lower rating is used. When a rating is available from only one rating agency, that rating is used. When a bond is not rated by any rating agency, it is designated as “Not rated.” Credit quality ratings assigned by a rating agency are subjective opinions, not statements of fact, and are subject to change, including daily. The ratings assigned by credit rating agencies are but one of the considerations that the Investment Manager and/or Fund’s subadviser incorporates into its credit analysis process, along with such other issuer-specific factors as cash flows, capital structure and leverage ratios, ability to de-leverage (repay) through free cash flow, quality of management, market positioning and access to capital, as well as such security-specific factors as the terms of the security (e.g., interest rate and time to maturity) and the amount and type of any collateral.
| 4 | Columbia Strategic Income Fund | Annual Report 2019 |
Manager Discussion of Fund Performance
For the 12-month period that ended August 31, 2019, the Fund’s Class A shares returned 6.75% excluding sales charges. While posting solid absolute gains, the Fund underperformed its benchmark, the Bloomberg Barclays U.S. Aggregate Bond Index, which returned 10.17% for the same period. Duration positioning and exposure to emerging markets debt detracted most from relative results, more than offsetting the positive contributions of allocation positioning and issue selection within structured credit sectors.
Bond markets gained amid heightened economic growth and trade uncertainty
Uncertainty was a dominant theme for fixed-income markets during the period. Fixed-income investors grappled with the extent to which U.S. and global economic growth was slowing as well as with how much of the deceleration was due to an increase in trade tensions. After hiking interest rates four times in 2018, the U.S. Federal Reserve (Fed) paused interest rate hikes beginning in early 2019 and then cut interest rates for the first time since 2008 at the end of July 2019. The market’s anticipation of more accommodative Fed monetary policy led to lower U.S. Treasury yields and provided an uplift to credit sectors, especially after a significant sell-off and tightening of financial conditions at the end of 2018. Broadly speaking, higher quality sectors outperformed. U.S. Treasuries and investment-grade corporate bonds were among the best performing fixed-income sectors. The weakest performing fixed-income sectors were lower quality, such as high-yield corporate bonds, and those sectors that typically perform poorly when interest rates fall, including agency mortgage-backed securities and bank loans.
All told, the bellwether 10-year U.S. Treasury yield fell 136 basis points during the period as a result of the pivot by the Fed, slowing global economic growth and strong demand for U.S. dollar-denominated assets amid trade uncertainty. (A basis point is 1/100th of a percentage point.) Elsewhere, more pronounced slowing of economic activity, namely in Germany and China, led to the share of global bonds trading with negative yields to rise to all-time highs. The U.S. Treasury yield curve (a line that plots yields of U.S Treasury bonds of equal credit quality but different maturities), flattened and then ended the period inverted for the first time since the 2008 financial crisis, meaning shorter term yields were higher than longer term yields. The yield curve inversion was driven by the market’s downgraded expectations of economic growth and inflation, and the market’s more pronounced view that the Fed was late in realizing its policy stance was too tight.
Duration positioning and emerging market bond exposure detracted from Fund results
Duration positioning contributed most to the Fund’s absolute performance during the period. The U.S. economy was beginning to slow in the autumn of 2018, yet the 10-year U.S. Treasury yield was above 3% and the Fed was still hiking interest rates. Thus, allocating to interest rate risk was attractive relative to other factors. As the Fed pivoted to be more accommodative and the economy decelerated during the first half of 2019, U.S. Treasury yields fell significantly. Relative to the benchmark, the Fund maintained a shorter duration stance throughout the period in line with our process to follow a risk-balanced framework. Such positioning proved a detractor from relative results as yields fell. Duration is a measure of the Fund’s sensitivity to changes in interest rates.
The two sectors that hurt the Fund’s relative performance most were emerging markets debt and Treasury inflation-protected securities (TIPS). Within emerging markets debt, security selection among Argentinian U.S. dollar-denominated bonds detracted most. Argentinean assets were negatively impacted by results of an August 2019 primary presidential election that surprised market participants. The size of the win by left-wing Peronistas indicated they would win the presidency, and this party has a history of non-market friendly or international creditor-friendly policies. Exposure to Argentinean assets was only partially offset by diverse exposures across other emerging market debt credits, which contributed positively. Further, as interest rates rallied in the summer of 2019 and the market-based probability of a recession rose, the Fund’s modest inflation exposure via TIPS was negatively affected.
Structured credit sector positioning boosted Fund results
Relative to the benchmark, overweighted exposure to U.S. credit spread, or non-U.S. Treasury, sectors boosted the Fund’s results most. The strongest performance was generated by structured credit sectors, specifically, non-agency mortgage-backed securities, asset-backed securities and commercial mortgage-backed securities, with both allocation positioning and issue selection adding value. The Fund’s allocation to corporate credit — both high yield and investment grade — also
Columbia Strategic Income Fund | Annual Report 2019
| 5 |
Manager Discussion of Fund Performance (continued)
contributed positively to its relative results. Within high yield, an increased allocation to the sector near the end of 2018 at what we considered to be attractive valuations relative to fundamentals helped most. Issue selection among investment-grade corporate bonds, especially within non-cyclical sectors and among BBB-rated bonds, was especially beneficial.
To a lesser degree, the Fund also benefited from its yield curve positioning. The Fund favored the long-term segment of the U.S. Treasury yield curve for most of the annual period but began moving exposure to be more balanced across the yield curve beginning in the spring of 2019, which helped as the yield curve flattened and then inverted. At the end of the annual period, the Fund’s positioning favored the short-term and long-term segments of the yield curve with little exposure to the intermediate-segment.
Shifting market conditions drove portfolio changes
The Fund began the period positioned rather conservatively on credit risk. Allocations to high-yield corporate bonds and emerging markets debt were quite modest by historical measure. As markets fell into the end of 2018 and valuations became attractive relative to the underlying fundamentals, in our view, we increased the Fund’s allocations to both of these sectors and, to a lesser extent, to investment-grade corporate bonds. Then, through the first eight months of 2019, we reduced allocations to lower quality credit risk, including high-yield corporate bonds and emerging markets debt. The Fund ended the period with a conservative stance on credit risk, similar to its stance at the start of its fiscal year.
From a duration perspective, the Fund made tactical shifts in positioning throughout the period. While maintaining a shorter duration than that of the benchmark throughout, we lengthened the Fund’s duration into the fourth quarter of 2018, moving to its highest level in the last five years as interest rates rose despite a slowing economy. The Fed at that time was signaling further interest rate hikes in 2019 that, based on fundamentals, did not appear to be realistic. As interest rates then fell during 2019 and the Fed pivoted away from hikes and eventually to cuts, we gradually but significantly reduced the Fund’s duration position. We also, as mentioned above, gradually began shifting exposure on the yield curve to shorter segments, as the yield curve inverted and the Fed moved to cut interest rates.
Currency exposure was relatively modest outside of the U.S. dollar, although we did hold small positions in the Fund in select currencies, particularly in emerging markets, that we believed offered attractive risk/reward propositions. We increased inflation exposure during the period but maintained only a modest allocation to TIPS.
Overall, the Fund’s portfolio turnover rate for the 12-month period was 179%. A significant portion of the turnover was the result of rolling-maturity mortgage securities, processing of prepayments and opportunistic changes our managers made at the margin in response to valuations or market developments.
Derivative positions in the Fund
The Fund utilized derivatives as a means to hedge exposures to better balance risks among four risk factors — credit, duration, currency and inflation. We used U.S. Treasury futures, credit default swap indices, options on interest rate swaps and agency mortgage-backed securities futures. On a stand-alone basis, the use of these derivative instruments had an negative impact on Fund performance during the period.
Marketrisk may affect a single issuer, sector of the economy, industry or the market as a whole.Mortgage- and asset-backed securities are affected by interest rates, financial health of issuers/originators, creditworthiness of entities providing credit enhancements and the value of underlying assets. Fixed-income securities presentissuer default risk.Non-investment-grade (high-yield or junk) securities present greater price volatility and more risk to principal and income than higher rated securities. A rise ininterest rates may result in a price decline of fixed-income instruments held by the Fund, negatively impacting its performance and NAV. Falling rates may result in the Fund investing in lower yielding debt instruments, lowering the Fund’s income and yield. These risks may be heightened for longer maturity and duration securities.Floating rate loans typically present greater risk than other fixed-income investments as they are generally subject to legal or contractual resale restrictions, may trade less frequently and experience value impairments during liquidation.Prepayment and extension risk exists because the timing of payments on a loan, bond or other investment may accelerate when interest rates fall or decelerate when interest rates rise which may reduce investment opportunities and potential returns.Foreigninvestments subject the Fund to risks, including political, economic, market, social and others within a particular country, as well as to currency instabilities and less stringent financial and accounting standards generally applicable to U.S. issuers. Risks are enhanced foremerging market andsovereign debt issuers. Investing inderivativesis a
| 6 | Columbia Strategic Income Fund | Annual Report 2019 |
Manager Discussion of Fund Performance (continued)
specialized activity that involves special risks that subject the Fund to significant loss potential, including when used as leverage, and may result in greater fluctuation in Fund value.Liquidityrisk is associated with the difficulty of selling underlying investments at a desirable time or price. See the Fund’s prospectus for more information on these and other risks.
The views expressed in this report reflect the current views of the respective parties. These views are not guarantees of future performance and involve certain risks, uncertainties and assumptions that are difficult to predict, so actual outcomes and results may differ significantly from the views expressed. These views are subject to change at any time based upon economic, market or other conditions and the respective parties disclaim any responsibility to update such views. These views may not be relied on as investment advice and, because investment decisions for a Columbia fund are based on numerous factors, may not be relied on as an indication of trading intent on behalf of any particular Columbia fund. References to specific securities should not be construed as a recommendation or investment advice.
Columbia Strategic Income Fund | Annual Report 2019
| 7 |
Understanding Your Fund’s Expenses
(Unaudited)
As an investor, you incur two types of costs. There are shareholder transaction costs, which generally include sales charges on purchases and may include redemption fees. There are also ongoing fund costs, which generally include management fees, distribution and/or service fees, and other fund expenses. The following information is intended to help you understand your ongoing costs (in dollars) of investing in the Fund and to help you compare these costs with the ongoing costs of investing in other mutual funds.
Analyzing your Fund’s expenses
To illustrate these ongoing costs, we have provided examples and calculated the expenses paid by investors in each share class of the Fund during the period. The actual and hypothetical information in the table is based on an initial investment of $1,000 at the beginning of the period indicated and held for the entire period. Expense information is calculated two ways and each method provides you with different information. The amount listed in the “Actual” column is calculated using the Fund’s actual operating expenses and total return for the period. You may use the Actual information, together with the amount invested, to estimate the expenses that you paid over the period. Simply divide your account value by $1,000 (for example, an $8,600 account value divided by $1,000 = 8.6), then multiply the results by the expenses paid during the period under the “Actual” column. The amount listed in the “Hypothetical” column assumes a 5% annual rate of return before expenses (which is not the Fund’s actual return) and then applies the Fund’s actual expense ratio for the period to the hypothetical return. You should not use the hypothetical account values and expenses to estimate either your actual account balance at the end of the period or the expenses you paid during the period. See “Compare with other funds” below for details on how to use the hypothetical data.
Compare with other funds
Since all mutual funds are required to include the same hypothetical calculations about expenses in shareholder reports, you can use this information to compare the ongoing cost of investing in the Fund with other funds. To do so, compare the hypothetical example with the 5% hypothetical examples that appear in the shareholder reports of other funds. As you compare hypothetical examples of other funds, it is important to note that hypothetical examples are meant to highlight the ongoing costs of investing in a fund only and do not reflect any transaction costs, such as sales charges, or redemption or exchange fees. Therefore, the hypothetical calculations are useful in comparing ongoing costs only, and will not help you determine the relative total costs of owning different funds. If transaction costs were included in these calculations, your costs would be higher.
| March 1, 2019 — August 31, 2019 |
| | Account value at the
beginning of the
period ($) | Account value at the
end of the
period ($) | Expenses paid during
the period ($) | Fund’s annualized
expense ratio (%) |
| | Actual | Hypothetical | Actual | Hypothetical | Actual | Hypothetical | Actual |
| Class A | 1,000.00 | 1,000.00 | 1,038.20 | 1,020.31 | 4.85 | 4.81 | 0.95 |
| Advisor Class | 1,000.00 | 1,000.00 | 1,040.20 | 1,021.56 | 3.58 | 3.55 | 0.70 |
| Class C | 1,000.00 | 1,000.00 | 1,034.30 | 1,016.55 | 8.67 | 8.59 | 1.70 |
| Institutional Class | 1,000.00 | 1,000.00 | 1,040.20 | 1,021.56 | 3.58 | 3.55 | 0.70 |
| Institutional 2 Class | 1,000.00 | 1,000.00 | 1,040.40 | 1,021.76 | 3.38 | 3.35 | 0.66 |
| Institutional 3 Class | 1,000.00 | 1,000.00 | 1,040.80 | 1,022.01 | 3.12 | 3.09 | 0.61 |
| Class R | 1,000.00 | 1,000.00 | 1,038.40 | 1,019.05 | 6.13 | 6.07 | 1.20 |
Expenses paid during the period are equal to the annualized expense ratio for each class as indicated above, multiplied by the average account value over the period and then multiplied by the number of days in the Fund’s most recent fiscal half year and divided by 365.
Expenses do not include fees and expenses incurred indirectly by the Fund from its investment in underlying funds, including affiliated and non-affiliated pooled investment vehicles, such as mutual funds and exchange-traded funds.
| 8 | Columbia Strategic Income Fund | Annual Report 2019 |
Portfolio of Investments
August 31, 2019
(Percentages represent value of investments compared to net assets)
Investments in securities
| Asset-Backed Securities — Non-Agency 11.2% |
| Issuer | Coupon
Rate | | Principal
Amount ($) | Value ($) |
| Apidos CLO XXVIII(a),(b) |
| Series 2017-28A Class A1B |
3-month USD LIBOR + 1.150%
Floor 1.150%
01/20/2031 | 3.428% | | 20,750,000 | 20,153,583 |
| ARES XLIV CLO Ltd.(a),(b) |
| Series 2017-44A Class D |
3-month USD LIBOR + 6.550%
10/15/2029 | 8.853% | | 12,000,000 | 11,449,008 |
| ARES XLVII CLO Ltd.(a),(b) |
| Series 2018-47A Class B |
3-month USD LIBOR + 1.450%
Floor 1.450%
04/15/2030 | 3.753% | | 11,200,000 | 11,043,648 |
| ARES XXXVII CLO Ltd.(a),(b) |
| Series 2015-4A Class A3R |
3-month USD LIBOR + 1.500%
10/15/2030 | 3.803% | | 25,250,000 | 24,869,684 |
| Atrium XIII(a),(b) |
| Series 2013A Class B |
3-month USD LIBOR + 1.500%
11/21/2030 | 3.759% | | 32,414,000 | 32,090,152 |
| Avant Loans Funding Trust(a) |
| Series 2019-A Class B |
| 12/15/2022 | 3.800% | | 9,600,000 | 9,750,418 |
| Babson CLO Ltd.(a),(b) |
| Series 2015-2A Class B2R |
3-month USD LIBOR + 1.590%
10/20/2030 | 3.868% | | 38,425,000 | 38,036,062 |
| Ballyrock CLO Ltd.(a),(b) |
| Series 2018-1A Class A2 |
3-month USD LIBOR + 1.600%
04/20/2031 | 3.878% | | 8,686,000 | 8,565,013 |
| Carlyle Global Market Strategies CLO Ltd.(a),(b) |
| Series 2013-4A Class BRR |
3-month USD LIBOR + 1.420%
Floor 1.420%
01/15/2031 | 3.723% | | 11,725,000 | 11,506,340 |
| Series 2015-4A Class A2R |
3-month USD LIBOR + 1.800%
07/20/2032 | 4.078% | | 14,400,000 | 14,378,170 |
| CLUB Credit Trust(a) |
| Series 2018-NP1 Class C |
| 05/15/2024 | 4.740% | | 9,035,480 | 9,103,774 |
| Conn’s Receivables Funding LLC(a) |
| Series 2019-A Class A |
| 10/16/2023 | 3.400% | | 9,815,391 | 9,858,905 |
| Series 2019-A Class B |
| 10/16/2023 | 4.360% | | 7,700,000 | 7,779,974 |
| Asset-Backed Securities — Non-Agency (continued) |
| Issuer | Coupon
Rate | | Principal
Amount ($) | Value ($) |
| Consumer Lending Receivables Trust(a) |
| Series 2019-A Class A |
| 04/15/2026 | 3.520% | | 18,450,208 | 18,572,241 |
| Credit Suisse ABS Trust(a) |
| Series 2018-LD1 Class B |
| 07/25/2024 | 4.280% | | 10,560,000 | 10,606,405 |
| Dryden XXVIII Senior Loan Fund(a),(b) |
| Series 2013-28A Class A2LR |
3-month USD LIBOR + 1.650%
08/15/2030 | 3.808% | | 23,650,000 | 23,432,444 |
| LendingClub Receivables Trust(a) |
| Series 2019-1 Class A |
| 07/17/2045 | 4.000% | | 19,384,252 | 19,427,694 |
| Series 2019-2 Class A |
| 08/15/2025 | 4.000% | | 25,274,574 | 25,318,473 |
| Madison Park Funding XXIV Ltd.(a),(b) |
| Series 2016-24A Class BR |
3-month USD LIBOR + 1.750%
10/20/2029 | 3.926% | | 14,000,000 | 14,000,490 |
| Madison Park Funding XXXII Ltd.(a),(b) |
| Series 2018-32A Class C |
3-month USD LIBOR + 2.900%
Floor 2.900%
01/22/2031 | 5.178% | | 6,000,000 | 6,017,292 |
| Series 2018-32A Class D |
3-month USD LIBOR + 4.100%
Floor 4.100%
01/22/2031 | 6.378% | | 9,500,000 | 9,483,907 |
| Morgan Stanley Resecuritization Pass-Through Trust(a),(c),(d) |
| Series 2018-SC1 Class B |
| 09/18/2023 | 1.000% | | 8,939,978 | 8,671,778 |
| OHA Credit Partners XIV Ltd.(a),(b) |
| Series 2017-14A Class B |
3-month USD LIBOR + 1.500%
01/21/2030 | 3.778% | | 24,000,000 | 23,675,280 |
| OZLM XI Ltd.(a),(b) |
| Series 2015-11A Class A2R |
3-month USD LIBOR + 1.750%
10/30/2030 | 4.016% | | 14,700,000 | 14,550,913 |
| OZLM XXI(a),(b) |
| Series 2017-21A Class A2 |
3-month USD LIBOR + 1.450%
01/20/2031 | 3.728% | | 18,500,000 | 18,251,119 |
| Pagaya AI Debt Selection Trust(a),(d) |
| Series 2019-1 Class A |
| 06/15/2026 | 3.690% | | 28,713,255 | 28,910,658 |
The accompanying Notes to Financial Statements are an integral part of this statement.
Columbia Strategic Income Fund | Annual Report 2019
| 9 |
Portfolio of Investments (continued)
August 31, 2019
| Asset-Backed Securities — Non-Agency (continued) |
| Issuer | Coupon
Rate | | Principal
Amount ($) | Value ($) |
| Pagaya AI Debt Selection Trust(a) |
| Series 2019-2 Class A2A |
| 09/15/2026 | 3.929% | | 11,700,000 | 11,799,627 |
| Palmer Square Loan Funding Ltd.(a),(b) |
| Series 2019-2A Class A2 |
3-month USD LIBOR + 1.600%
Floor 1.600%
04/20/2027 | 4.123% | | 22,000,000 | 21,998,504 |
| Prosper Marketplace Issuance Trust(a) |
| Series 2018-1A Class B |
| 06/17/2024 | 3.900% | | 15,000,000 | 15,058,219 |
| Series 2018-1A Class C |
| 06/17/2024 | 4.870% | | 12,900,000 | 13,108,512 |
| Series 2019-3A Class A |
| 07/15/2025 | 3.190% | | 9,003,599 | 9,049,915 |
| Subordinated Series 2017-2A Class C |
| 09/15/2023 | 5.370% | | 9,748,193 | 9,855,445 |
| RR 1 LLC(a),(b) |
| Series 2017-1A Class A2R |
3-month USD LIBOR + 1.700%
07/15/2029 | 4.003% | | 14,200,000 | 14,110,526 |
| Series 2017-1A Class DR |
3-month USD LIBOR + 6.500%
07/15/2029 | 8.803% | | 5,000,000 | 4,758,750 |
| SoFi Professional Loan Program LLC(a),(c),(d),(e),(f) |
| Series 2015-D Class RC |
| 10/26/2037 | 0.000% | | 25 | 6,693,349 |
| Series 2016-A Class RIO |
| 01/25/2038 | 0.000% | | 20 | 3,200,000 |
| Series 2016-A Class RPO |
| 01/25/2038 | 0.000% | | 20 | 6,000,000 |
| Voya CLO Ltd.(a),(b) |
| Series 2017-4A Class B |
3-month USD LIBOR + 1.450%
10/15/2030 | 3.753% | | 14,400,000 | 14,085,518 |
Total Asset-Backed Securities — Non-Agency
(Cost $582,043,695) | 559,221,790 |
|
| Commercial Mortgage-Backed Securities - Non-Agency 4.0% |
| | | | |
| BBCMS Trust(a),(b) |
| Subordinated Series 2018-BXH Class F |
1-month USD LIBOR + 2.950%
Floor 2.950%
10/15/2037 | 5.145% | | 9,200,000 | 9,202,854 |
| BHMS Mortgage Trust(a),(b) |
| Series 2018-ATLS Class D |
1-month USD LIBOR + 2.250%
Floor 2.250%
07/15/2035 | 4.445% | | 10,000,000 | 10,012,659 |
| Commercial Mortgage-Backed Securities - Non-Agency (continued) |
| Issuer | Coupon
Rate | | Principal
Amount ($) | Value ($) |
| Braemar Hotels & Resorts Trust(a),(b) |
| Series 2018-PRME Class F |
1-month USD LIBOR + 2.900%
Floor 2.900%
06/15/2035 | 5.095% | | 18,350,000 | 18,419,592 |
| CALI Mortgage Trust(a),(g) |
| Series 2019-101C Class F |
| 03/10/2039 | 4.469% | | 4,700,000 | 4,964,944 |
| CHT 2017-COSMO Mortgage Trust(a),(b) |
| Series 2017-CSMO Class B |
1-month USD LIBOR + 1.400%
Floor 1.200%
11/15/2036 | 3.595% | | 12,970,000 | 12,970,202 |
| Series 2017-CSMO Class E |
1-month USD LIBOR + 3.000%
Floor 3.000%
11/15/2036 | 5.195% | | 4,000,000 | 4,005,053 |
| Credit Suisse Mortgage Capital Certificates OA LLC(a) |
| Subordinated Series 2014-USA Class D |
| 09/15/2037 | 4.373% | | 4,000,000 | 4,003,785 |
| Subordinated Series 2014-USA Class F |
| 09/15/2037 | 4.373% | | 9,920,000 | 9,093,070 |
| Hilton U.S.A. Trust(a),(g) |
| Series 2016-HHV Class F |
| 11/05/2038 | 4.333% | | 28,590,000 | 29,385,777 |
| Hilton U.S.A. Trust(a) |
| Subordinated, Series 2016-SFP Class E |
| 11/05/2035 | 5.519% | | 9,700,000 | 9,843,960 |
| Invitation Homes Trust(a),(b) |
| Series 2017-SFR2 Class E |
1-month USD LIBOR + 2.250%
Floor 2.250%
12/17/2036 | 4.446% | | 4,498,307 | 4,498,290 |
| Progress Residential Trust(a) |
| Series 2019-SFR1 Class E |
| 08/17/2035 | 4.466% | | 13,000,000 | 13,544,059 |
| Subordinated Series 2019-SFR2 Class F |
| 05/17/2036 | 4.837% | | 9,500,000 | 9,877,637 |
| RETL(a),(b) |
| Subordinated Series 2019-RVP Class C |
1-month USD LIBOR + 2.100%
Floor 2.100%
03/15/2036 | 4.584% | | 15,600,000 | 15,668,436 |
| UBS Commercial Mortgage Trust(a),(b) |
| Series 2018-NYCH Class C |
1-month USD LIBOR + 1.500%
Floor 1.500%
02/15/2032 | 3.695% | | 10,941,000 | 10,941,918 |
The accompanying Notes to Financial Statements are an integral part of this statement.
| 10 | Columbia Strategic Income Fund | Annual Report 2019 |
Portfolio of Investments (continued)
August 31, 2019
| Commercial Mortgage-Backed Securities - Non-Agency (continued) |
| Issuer | Coupon
Rate | | Principal
Amount ($) | Value ($) |
| Series 2018-NYCH Class E |
1-month USD LIBOR + 2.900%
Floor 3.200%
02/15/2032 | 5.095% | | 13,795,000 | 13,865,724 |
| Series 2018-NYCH Class F |
1-month USD LIBOR + 3.821%
Floor 3.821%
02/15/2032 | 6.016% | | 11,783,000 | 11,829,260 |
| Wells Fargo Commercial Mortgage Trust(a),(b) |
| Subordinated Series 2017-SMP Class D |
1-month USD LIBOR + 1.650%
Floor 1.650%
12/15/2034 | 3.846% | | 9,790,000 | 9,751,358 |
Total Commercial Mortgage-Backed Securities - Non-Agency
(Cost $191,956,935) | 201,878,578 |
| Common Stocks 0.0% |
| Issuer | Shares | Value ($) |
| Communication Services 0.0% |
| Diversified Telecommunication Services 0.0% |
| Cincinnati Bell, Inc.(h) | 300 | 1,629 |
| Media 0.0% |
| Cumulus Media, Inc., Class A(h) | 9,225 | 125,460 |
| Tribune Media Co. | 1,338 | 62,324 |
| Total | | 187,784 |
| Total Communication Services | 189,413 |
| Consumer Discretionary 0.0% |
| Specialty Retail 0.0% |
| David’s Bridal, Inc.(h) | 11,031 | 69,859 |
| Total Consumer Discretionary | 69,859 |
| Energy 0.0% |
| Energy Equipment & Services 0.0% |
| Fieldwood Energy LLC(h) | 8,596 | 249,284 |
| Total Energy | 249,284 |
| Materials 0.0% |
| Metals & Mining 0.0% |
| Aleris International, Inc.(d),(h) | 3,721 | 83,722 |
| Total Materials | 83,722 |
| Common Stocks (continued) |
| Issuer | Shares | Value ($) |
| Utilities 0.0% |
| Independent Power and Renewable Electricity Producers 0.0% |
| Vistra Energy Corp.(d),(h) | 21,925 | 17,979 |
| Total Utilities | 17,979 |
Total Common Stocks
(Cost $717,148) | 610,257 |
| Corporate Bonds & Notes(i) 38.1% |
| Issuer | Coupon
Rate | | Principal
Amount ($) | Value ($) |
| Aerospace & Defense 0.4% |
| Bombardier, Inc.(a) |
| 10/15/2022 | 6.000% | | 536,000 | 531,880 |
| 12/01/2024 | 7.500% | | 927,000 | 924,031 |
| 03/15/2025 | 7.500% | | 1,795,000 | 1,751,340 |
| 04/15/2027 | 7.875% | | 441,000 | 426,795 |
| TransDigm, Inc. |
| 07/15/2024 | 6.500% | | 4,172,000 | 4,320,632 |
| 05/15/2025 | 6.500% | | 579,000 | 603,839 |
| 06/15/2026 | 6.375% | | 2,747,000 | 2,883,548 |
| TransDigm, Inc.(a) |
| 03/15/2026 | 6.250% | | 7,162,000 | 7,728,822 |
| 03/15/2027 | 7.500% | | 2,361,000 | 2,538,025 |
| Total | 21,708,912 |
| Automotive 0.3% |
| Ford Motor Co. |
| 01/15/2043 | 4.750% | | 2,750,000 | 2,475,041 |
| Ford Motor Credit Co. LLC |
| 11/02/2020 | 2.343% | | 8,310,000 | 8,282,220 |
| IAA Spinco, Inc.(a) |
| 06/15/2027 | 5.500% | | 482,000 | 516,979 |
| Panther BF Aggregator 2 LP/Finance Co., Inc.(a) |
| 05/15/2026 | 6.250% | | 1,820,000 | 1,887,347 |
| 05/15/2027 | 8.500% | | 1,331,000 | 1,297,781 |
| Total | 14,459,368 |
| Banking 2.7% |
| Ally Financial, Inc. |
| 11/01/2031 | 8.000% | | 3,940,000 | 5,519,530 |
| Bank of America Corp.(j) |
| 01/20/2028 | 3.824% | | 23,840,000 | 25,795,667 |
| Capital One Financial Corp. |
| 01/31/2028 | 3.800% | | 11,421,000 | 12,184,403 |
| Citigroup, Inc.(j) |
| 03/20/2030 | 3.980% | | 5,175,000 | 5,716,233 |
| Goldman Sachs Group, Inc. (The)(j) |
| 05/01/2029 | 4.223% | | 27,860,000 | 30,821,239 |
The accompanying Notes to Financial Statements are an integral part of this statement.
Columbia Strategic Income Fund | Annual Report 2019
| 11 |
Portfolio of Investments (continued)
August 31, 2019
| Corporate Bonds & Notes(i) (continued) |
| Issuer | Coupon
Rate | | Principal
Amount ($) | Value ($) |
| JPMorgan Chase & Co.(j) |
| 05/06/2030 | 3.702% | | 20,445,000 | 22,319,418 |
| Morgan Stanley(j) |
| 01/23/2030 | 4.431% | | 9,039,000 | 10,318,281 |
| Wells Fargo & Co. |
| 10/23/2026 | 3.000% | | 17,435,000 | 18,089,318 |
| 01/24/2029 | 4.150% | | 2,680,000 | 3,005,073 |
| Total | 133,769,162 |
| Brokerage/Asset Managers/Exchanges 0.1% |
| NFP Corp.(a) |
| 07/15/2025 | 6.875% | | 3,297,000 | 3,271,837 |
| VFH Parent LLC/Orchestra Co-Issuer, Inc.(a) |
| 06/15/2022 | 6.750% | | 383,000 | 396,513 |
| Total | 3,668,350 |
| Building Materials 0.4% |
| American Builders & Contractors Supply Co., Inc.(a) |
| 12/15/2023 | 5.750% | | 4,171,000 | 4,324,856 |
| 05/15/2026 | 5.875% | | 2,602,000 | 2,768,804 |
| Beacon Roofing Supply, Inc. |
| 10/01/2023 | 6.375% | | 2,207,000 | 2,284,388 |
| Beacon Roofing Supply, Inc.(a) |
| 11/01/2025 | 4.875% | | 4,613,000 | 4,549,299 |
| Cemex SAB de CV(a) |
| 05/05/2025 | 6.125% | | 3,300,000 | 3,422,810 |
| Core & Main LP(a) |
| 08/15/2025 | 6.125% | | 2,178,000 | 2,218,461 |
| James Hardie International Finance DAC(a) |
| 01/15/2025 | 4.750% | | 798,000 | 821,109 |
| 01/15/2028 | 5.000% | | 773,000 | 793,564 |
| Total | 21,183,291 |
| Cable and Satellite 2.5% |
| CCO Holdings LLC/Capital Corp.(a) |
| 05/01/2025 | 5.375% | | 613,000 | 637,054 |
| 02/15/2026 | 5.750% | | 3,586,000 | 3,796,416 |
| 05/01/2026 | 5.500% | | 80,000 | 84,401 |
| 05/01/2027 | 5.125% | | 5,385,000 | 5,700,383 |
| 05/01/2027 | 5.875% | | 766,000 | 816,311 |
| 02/01/2028 | 5.000% | | 2,860,000 | 3,001,524 |
| 06/01/2029 | 5.375% | | 2,314,000 | 2,474,765 |
| Charter Communications Operating LLC/Capital |
| 07/01/2049 | 5.125% | | 6,195,000 | 6,745,327 |
| Comcast Corp. |
| 08/15/2047 | 4.000% | | 7,413,000 | 8,352,702 |
| Corporate Bonds & Notes(i) (continued) |
| Issuer | Coupon
Rate | | Principal
Amount ($) | Value ($) |
| CSC Holdings LLC(a) |
| 12/15/2021 | 5.125% | | 1,569,000 | 1,569,968 |
| 07/15/2023 | 5.375% | | 4,057,000 | 4,165,484 |
| 10/15/2025 | 6.625% | | 404,000 | 432,434 |
| 10/15/2025 | 10.875% | | 2,105,000 | 2,404,933 |
| 02/01/2028 | 5.375% | | 7,072,000 | 7,556,354 |
| 04/01/2028 | 7.500% | | 5,244,000 | 5,873,647 |
| 02/01/2029 | 6.500% | | 1,559,000 | 1,743,126 |
| 01/15/2030 | 5.750% | | 1,363,000 | 1,424,200 |
| DISH DBS Corp. |
| 11/15/2024 | 5.875% | | 3,171,000 | 3,020,038 |
| 07/01/2026 | 7.750% | | 6,748,000 | 6,632,366 |
| Intelsat Jackson Holdings SA(a) |
| 10/15/2024 | 8.500% | | 2,585,000 | 2,561,792 |
| Quebecor Media, Inc. |
| 01/15/2023 | 5.750% | | 4,930,000 | 5,342,523 |
| Radiate HoldCo LLC/Finance, Inc.(a) |
| 02/15/2023 | 6.875% | | 612,000 | 620,448 |
| 02/15/2025 | 6.625% | | 2,610,000 | 2,589,770 |
| Sirius XM Radio, Inc.(a) |
| 07/15/2024 | 4.625% | | 981,000 | 1,026,089 |
| 04/15/2025 | 5.375% | | 599,000 | 622,851 |
| 07/15/2026 | 5.375% | | 1,521,000 | 1,610,056 |
| 08/01/2027 | 5.000% | | 574,000 | 606,173 |
| 07/01/2029 | 5.500% | | 1,093,000 | 1,190,276 |
| Sky PLC(a) |
| 09/16/2024 | 3.750% | | 12,889,000 | 13,846,575 |
| Unitymedia GmbH(a) |
| 01/15/2025 | 6.125% | | 1,264,000 | 1,319,127 |
| Unitymedia Hessen GmbH & Co. KG NRW(a) |
| 01/15/2025 | 5.000% | | 6,801,000 | 7,033,751 |
| Viasat, Inc.(a) |
| 04/15/2027 | 5.625% | | 796,000 | 845,850 |
| Virgin Media Secured Finance PLC(a) |
| 01/15/2026 | 5.250% | | 4,300,000 | 4,425,392 |
| 08/15/2026 | 5.500% | | 1,878,000 | 1,967,124 |
| 05/15/2029 | 5.500% | | 3,859,000 | 4,032,223 |
| Ziggo Bond Finance BV(a) |
| 01/15/2027 | 6.000% | | 5,305,000 | 5,549,502 |
| Ziggo BV(a) |
| 01/15/2027 | 5.500% | | 5,961,000 | 6,256,624 |
| Total | 127,877,579 |
| Chemicals 0.9% |
| Alpha 2 BV PIK(a) |
| 06/01/2023 | 8.750% | | 2,125,000 | 2,051,785 |
| Angus Chemical Co.(a) |
| 02/15/2023 | 8.750% | | 2,564,000 | 2,528,117 |
| Atotech U.S.A., Inc.(a) |
| 02/01/2025 | 6.250% | | 2,759,000 | 2,742,614 |
The accompanying Notes to Financial Statements are an integral part of this statement.
| 12 | Columbia Strategic Income Fund | Annual Report 2019 |
Portfolio of Investments (continued)
August 31, 2019
| Corporate Bonds & Notes(i) (continued) |
| Issuer | Coupon
Rate | | Principal
Amount ($) | Value ($) |
| Axalta Coating Systems LLC(a) |
| 08/15/2024 | 4.875% | | 2,475,000 | 2,562,316 |
| Chemours Co. (The) |
| 05/15/2023 | 6.625% | | 335,000 | 340,314 |
| 05/15/2027 | 5.375% | | 462,000 | 417,193 |
| INEOS Group Holdings SA(a) |
| 08/01/2024 | 5.625% | | 2,853,000 | 2,905,592 |
| Platform Specialty Products Corp.(a) |
| 12/01/2025 | 5.875% | | 5,877,000 | 6,116,288 |
| PQ Corp.(a) |
| 11/15/2022 | 6.750% | | 5,633,000 | 5,843,195 |
| 12/15/2025 | 5.750% | | 2,815,000 | 2,884,688 |
| Sasol Financing International Ltd. |
| 11/14/2022 | 4.500% | | 2,166,000 | 2,224,577 |
| Sasol Financing USA LLC |
| 03/27/2024 | 5.875% | | 4,742,000 | 5,115,836 |
| SPCM SA(a) |
| 09/15/2025 | 4.875% | | 1,621,000 | 1,647,680 |
| Starfruit Finco BV/US Holdco LLC(a) |
| 10/01/2026 | 8.000% | | 5,797,000 | 5,656,220 |
| Total | 43,036,415 |
| Construction Machinery 0.3% |
| H&E Equipment Services, Inc. |
| 09/01/2025 | 5.625% | | 3,247,000 | 3,400,677 |
| Herc Holdings, Inc.(a) |
| 07/15/2027 | 5.500% | | 1,939,000 | 2,004,003 |
| Ritchie Bros. Auctioneers, Inc.(a) |
| 01/15/2025 | 5.375% | | 1,849,000 | 1,923,513 |
| United Rentals North America, Inc. |
| 07/15/2025 | 5.500% | | 1,376,000 | 1,438,589 |
| 09/15/2026 | 5.875% | | 3,303,000 | 3,541,731 |
| 12/15/2026 | 6.500% | | 2,510,000 | 2,741,306 |
| Total | 15,049,819 |
| Consumer Cyclical Services 0.2% |
| APX Group, Inc. |
| 12/01/2020 | 8.750% | | 1,637,000 | 1,554,384 |
| 12/01/2022 | 7.875% | | 5,906,000 | 5,620,616 |
| 09/01/2023 | 7.625% | | 1,055,000 | 791,360 |
| APX Group, Inc.(a) |
| 11/01/2024 | 8.500% | | 1,464,000 | 1,364,849 |
| frontdoor, Inc.(a) |
| 08/15/2026 | 6.750% | | 808,000 | 875,539 |
| Total | 10,206,748 |
| Corporate Bonds & Notes(i) (continued) |
| Issuer | Coupon
Rate | | Principal
Amount ($) | Value ($) |
| Consumer Products 0.4% |
| Energizer Holdings, Inc.(a) |
| 07/15/2026 | 6.375% | | 882,000 | 928,064 |
| 01/15/2027 | 7.750% | | 1,795,000 | 1,964,506 |
| Mattel, Inc.(a) |
| 12/31/2025 | 6.750% | | 1,730,000 | 1,781,431 |
| Prestige Brands, Inc.(a) |
| 03/01/2024 | 6.375% | | 4,790,000 | 5,014,579 |
| Scotts Miracle-Gro Co. (The) |
| 10/15/2023 | 6.000% | | 2,204,000 | 2,281,942 |
| Spectrum Brands, Inc. |
| 07/15/2025 | 5.750% | | 2,845,000 | 2,967,039 |
| Valvoline, Inc. |
| 07/15/2024 | 5.500% | | 885,000 | 920,765 |
| 08/15/2025 | 4.375% | | 2,603,000 | 2,644,497 |
| Total | 18,502,823 |
| Diversified Manufacturing 0.5% |
| BWX Technologies, Inc.(a) |
| 07/15/2026 | 5.375% | | 629,000 | 663,723 |
| CFX Escrow Corp.(a) |
| 02/15/2024 | 6.000% | | 563,000 | 600,509 |
| 02/15/2026 | 6.375% | | 1,310,000 | 1,420,616 |
| Gates Global LLC/Co.(a) |
| 07/15/2022 | 6.000% | | 1,407,000 | 1,404,890 |
| MTS Systems Corp.(a) |
| 08/15/2027 | 5.750% | | 1,413,000 | 1,476,608 |
| Resideo Funding, Inc.(a) |
| 11/01/2026 | 6.125% | | 914,000 | 971,340 |
| Stevens Holding Co., Inc.(a) |
| 10/01/2026 | 6.125% | | 532,000 | 554,952 |
| TriMas Corp.(a) |
| 10/15/2025 | 4.875% | | 1,887,000 | 1,901,977 |
| United Technologies Corp. |
| 11/16/2028 | 4.125% | | 13,500,000 | 15,435,130 |
| WESCO Distribution, Inc. |
| 06/15/2024 | 5.375% | | 1,398,000 | 1,447,663 |
| Zekelman Industries, Inc.(a) |
| 06/15/2023 | 9.875% | | 1,118,000 | 1,178,648 |
| Total | 27,056,056 |
| Electric 4.5% |
| AES Corp. (The) |
| 03/15/2023 | 4.500% | | 549,000 | 563,872 |
| 05/15/2023 | 4.875% | | 1,152,000 | 1,171,141 |
| 05/15/2026 | 6.000% | | 2,171,000 | 2,323,254 |
| 09/01/2027 | 5.125% | | 1,783,000 | 1,913,938 |
The accompanying Notes to Financial Statements are an integral part of this statement.
Columbia Strategic Income Fund | Annual Report 2019
| 13 |
Portfolio of Investments (continued)
August 31, 2019
| Corporate Bonds & Notes(i) (continued) |
| Issuer | Coupon
Rate | | Principal
Amount ($) | Value ($) |
| Calpine Corp. |
| 01/15/2023 | 5.375% | | 944,000 | 954,583 |
| 01/15/2025 | 5.750% | | 1,601,000 | 1,624,970 |
| Calpine Corp.(a) |
| 06/01/2026 | 5.250% | | 1,333,000 | 1,353,227 |
| Clearway Energy Operating LLC |
| 08/15/2024 | 5.375% | | 4,194,000 | 4,305,015 |
| 09/15/2026 | 5.000% | | 2,926,000 | 2,965,296 |
| Clearway Energy Operating LLC(a) |
| 10/15/2025 | 5.750% | | 860,000 | 896,404 |
| CMS Energy Corp. |
| 03/01/2024 | 3.875% | | 7,500,000 | 7,948,718 |
| 02/15/2027 | 2.950% | | 5,675,000 | 5,773,507 |
| 03/31/2043 | 4.700% | | 3,979,000 | 4,650,711 |
| DTE Energy Co. |
| 06/01/2024 | 3.500% | | 6,660,000 | 6,999,280 |
| 10/01/2026 | 2.850% | | 27,095,000 | 27,741,758 |
| Duke Energy Corp. |
| 10/15/2023 | 3.950% | | 6,925,000 | 7,382,251 |
| 09/01/2026 | 2.650% | | 2,185,000 | 2,212,129 |
| 08/15/2027 | 3.150% | | 6,000 | 6,298 |
| 09/01/2046 | 3.750% | | 9,273,000 | 9,781,448 |
| 06/15/2049 | 4.200% | | 11,395,000 | 13,005,945 |
| Emera U.S. Finance LP |
| 06/15/2046 | 4.750% | | 15,730,000 | 18,589,683 |
| Indiana Michigan Power Co. |
| 07/01/2047 | 3.750% | | 7,010,000 | 7,793,052 |
| NextEra Energy Operating Partners LP(a) |
| 07/15/2024 | 4.250% | | 1,227,000 | 1,271,053 |
| 09/15/2027 | 4.500% | | 8,076,000 | 8,282,826 |
| NRG Energy, Inc. |
| 05/15/2026 | 7.250% | | 1,696,000 | 1,860,685 |
| 01/15/2027 | 6.625% | | 3,130,000 | 3,401,574 |
| 01/15/2028 | 5.750% | | 419,000 | 451,663 |
| NRG Energy, Inc.(a) |
| 06/15/2029 | 5.250% | | 1,831,000 | 1,951,775 |
| Pattern Energy Group, Inc.(a) |
| 02/01/2024 | 5.875% | | 3,103,000 | 3,246,148 |
| PPL Capital Funding, Inc. |
| 05/15/2026 | 3.100% | | 5,700,000 | 5,843,463 |
| Progress Energy, Inc. |
| 04/01/2022 | 3.150% | | 8,094,000 | 8,276,002 |
| Southern Co. (The) |
| 07/01/2046 | 4.400% | | 19,385,000 | 21,856,316 |
| TerraForm Power Operating LLC(a) |
| 01/31/2028 | 5.000% | | 5,143,000 | 5,352,783 |
| Corporate Bonds & Notes(i) (continued) |
| Issuer | Coupon
Rate | | Principal
Amount ($) | Value ($) |
| Vistra Operations Co. LLC(a) |
| 09/01/2026 | 5.500% | | 887,000 | 933,853 |
| 02/15/2027 | 5.625% | | 3,017,000 | 3,197,151 |
| 07/31/2027 | 5.000% | | 2,818,000 | 2,920,964 |
| WEC Energy Group, Inc. |
| 06/15/2025 | 3.550% | | 4,810,000 | 5,151,169 |
| Xcel Energy, Inc. |
| 12/01/2026 | 3.350% | | 4,600,000 | 4,883,291 |
| 06/15/2028 | 4.000% | | 14,060,000 | 15,660,225 |
| Total | 224,497,421 |
| Environmental 0.1% |
| Clean Harbors, Inc.(a) |
| 07/15/2027 | 4.875% | | 646,000 | 682,594 |
| 07/15/2029 | 5.125% | | 453,000 | 482,225 |
| GFL Environmental, Inc.(a) |
| 03/01/2023 | 5.375% | | 599,000 | 602,389 |
| 05/01/2027 | 8.500% | | 1,335,000 | 1,458,355 |
| Hulk Finance Corp.(a) |
| 06/01/2026 | 7.000% | | 426,000 | 441,721 |
| Total | 3,667,284 |
| Finance Companies 1.5% |
| GE Capital International Funding Co. Unlimited Co. |
| 11/15/2020 | 2.342% | | 9,440,000 | 9,375,506 |
| 11/15/2035 | 4.418% | | 35,435,000 | 36,010,642 |
| Global Aircraft Leasing Co., Ltd. PIK(a) |
| 09/15/2024 | 6.500% | | 2,283,000 | 2,271,866 |
| iStar, Inc. |
| 04/01/2022 | 6.000% | | 2,394,000 | 2,465,695 |
| Navient Corp. |
| 03/25/2021 | 5.875% | | 913,000 | 956,722 |
| 01/25/2022 | 7.250% | | 1,039,000 | 1,138,943 |
| 06/15/2022 | 6.500% | | 1,411,000 | 1,525,634 |
| 01/25/2023 | 5.500% | | 1,000,000 | 1,050,629 |
| 09/25/2023 | 7.250% | | 1,311,000 | 1,454,398 |
| 03/25/2024 | 6.125% | | 664,000 | 708,628 |
| Provident Funding Associates LP/Finance Corp.(a) |
| 06/15/2025 | 6.375% | | 2,955,000 | 2,872,381 |
| Quicken Loans, Inc.(a) |
| 05/01/2025 | 5.750% | | 6,581,000 | 6,860,028 |
| Springleaf Finance Corp. |
| 03/15/2023 | 5.625% | | 1,892,000 | 2,035,860 |
| 03/15/2024 | 6.125% | | 3,299,000 | 3,601,944 |
| 03/15/2025 | 6.875% | | 852,000 | 965,564 |
| Total | 73,294,440 |
| Food and Beverage 2.3% |
| Anheuser-Busch Companies LLC/InBev Worldwide, Inc. |
| 02/01/2046 | 4.900% | | 23,867,000 | 28,446,505 |
The accompanying Notes to Financial Statements are an integral part of this statement.
| 14 | Columbia Strategic Income Fund | Annual Report 2019 |
Portfolio of Investments (continued)
August 31, 2019
| Corporate Bonds & Notes(i) (continued) |
| Issuer | Coupon
Rate | | Principal
Amount ($) | Value ($) |
| B&G Foods, Inc. |
| 06/01/2021 | 4.625% | | 1,814,000 | 1,818,566 |
| 04/01/2025 | 5.250% | | 3,003,000 | 3,046,405 |
| Bacardi Ltd.(a) |
| 05/15/2048 | 5.300% | | 26,230,000 | 30,098,846 |
| Conagra Brands, Inc. |
| 11/01/2048 | 5.400% | | 8,215,000 | 9,767,208 |
| Darling Ingredients, Inc.(a) |
| 04/15/2027 | 5.250% | | 330,000 | 352,059 |
| FAGE International SA/U.S.A. Dairy Industry, Inc.(a) |
| 08/15/2026 | 5.625% | | 1,449,000 | 1,270,782 |
| Grupo Bimbo SAB de CV(a) |
| 06/27/2024 | 3.875% | | 2,166,000 | 2,271,090 |
| Kraft Heinz Foods Co. (The) |
| 06/01/2046 | 4.375% | | 22,334,000 | 21,434,208 |
| Lamb Weston Holdings, Inc.(a) |
| 11/01/2024 | 4.625% | | 727,000 | 759,948 |
| 11/01/2026 | 4.875% | | 3,211,000 | 3,352,393 |
| Post Holdings, Inc.(a) |
| 03/01/2025 | 5.500% | | 742,000 | 777,146 |
| 08/15/2026 | 5.000% | | 3,107,000 | 3,238,979 |
| 03/01/2027 | 5.750% | | 5,851,000 | 6,233,767 |
| 01/15/2028 | 5.625% | | 1,161,000 | 1,228,254 |
| 12/15/2029 | 5.500% | | 340,000 | 359,333 |
| Total | 114,455,489 |
| Gaming 0.8% |
| Boyd Gaming Corp. |
| 04/01/2026 | 6.375% | | 1,350,000 | 1,430,542 |
| 08/15/2026 | 6.000% | | 448,000 | 473,169 |
| Caesars Resort Collection LLC/CRC Finco, Inc.(a) |
| 10/15/2025 | 5.250% | | 1,239,000 | 1,260,243 |
| Eldorado Resorts, Inc. |
| 04/01/2025 | 6.000% | | 4,115,000 | 4,358,620 |
| 09/15/2026 | 6.000% | | 1,304,000 | 1,426,117 |
| International Game Technology PLC(a) |
| 02/15/2022 | 6.250% | | 1,298,000 | 1,372,440 |
| 02/15/2025 | 6.500% | | 2,637,000 | 2,892,913 |
| 01/15/2027 | 6.250% | | 887,000 | 973,483 |
| Jack Ohio Finance LLC/1 Corp.(a) |
| 11/15/2021 | 6.750% | | 2,230,000 | 2,283,145 |
| MGM Growth Properties Operating Partnership LP/Finance Co-Issuer, Inc. |
| 05/01/2024 | 5.625% | | 899,000 | 981,978 |
| 09/01/2026 | 4.500% | | 3,056,000 | 3,201,881 |
| 01/15/2028 | 4.500% | | 1,287,000 | 1,317,480 |
| MGM Growth Properties Operating Partnership LP/Finance Co-Issuer, Inc.(a) |
| 02/01/2027 | 5.750% | | 1,530,000 | 1,691,088 |
| MGM Resorts International |
| 12/15/2021 | 6.625% | | 2,043,000 | 2,220,725 |
| Corporate Bonds & Notes(i) (continued) |
| Issuer | Coupon
Rate | | Principal
Amount ($) | Value ($) |
| Scientific Games International, Inc. |
| 12/01/2022 | 10.000% | | 1,932,000 | 2,007,642 |
| Scientific Games International, Inc.(a) |
| 10/15/2025 | 5.000% | | 4,966,000 | 5,128,145 |
| 03/15/2026 | 8.250% | | 2,394,000 | 2,526,685 |
| Stars Group Holdings BV/Co-Borrower LLC(a) |
| 07/15/2026 | 7.000% | | 2,150,000 | 2,280,382 |
| Wynn Las Vegas LLC/Capital Corp.(a) |
| 03/01/2025 | 5.500% | | 2,695,000 | 2,841,524 |
| Total | 40,668,202 |
| Health Care 2.3% |
| Acadia Healthcare Co., Inc. |
| 07/01/2022 | 5.125% | | 972,000 | 978,996 |
| 03/01/2024 | 6.500% | | 2,077,000 | 2,145,720 |
| Avantor, Inc.(a) |
| 10/01/2025 | 9.000% | | 3,915,000 | 4,411,633 |
| Becton Dickinson and Co. |
| 06/06/2027 | 3.700% | | 7,881,000 | 8,450,166 |
| Cardinal Health, Inc. |
| 06/15/2047 | 4.368% | | 14,400,000 | 13,876,906 |
| Change Healthcare Holdings LLC/Finance, Inc.(a) |
| 03/01/2025 | 5.750% | | 2,929,000 | 2,946,032 |
| Charles River Laboratories International, Inc.(a) |
| 04/01/2026 | 5.500% | | 1,779,000 | 1,903,580 |
| CHS/Community Health Systems, Inc. |
| 03/31/2023 | 6.250% | | 1,937,000 | 1,868,372 |
| Cigna Corp. |
| 12/15/2048 | 4.900% | | 5,910,000 | 6,990,981 |
| CVS Health Corp. |
| 03/25/2048 | 5.050% | | 19,540,000 | 22,800,015 |
| DaVita, Inc. |
| 08/15/2022 | 5.750% | | 1,747,000 | 1,764,428 |
| HCA, Inc. |
| 02/15/2022 | 7.500% | | 3,328,000 | 3,717,842 |
| 09/01/2028 | 5.625% | | 3,225,000 | 3,673,833 |
| 02/01/2029 | 5.875% | | 2,554,000 | 2,933,238 |
| Hologic, Inc.(a) |
| 10/15/2025 | 4.375% | | 2,189,000 | 2,241,516 |
| 02/01/2028 | 4.625% | | 2,416,000 | 2,489,686 |
| IQVIA, Inc.(a) |
| 05/15/2027 | 5.000% | | 2,792,000 | 2,940,828 |
| MPH Acquisition Holdings LLC(a) |
| 06/01/2024 | 7.125% | | 1,657,000 | 1,478,935 |
| Select Medical Corp.(a) |
| 08/15/2026 | 6.250% | | 1,169,000 | 1,212,086 |
| Sotera Health Holdings LLC(a) |
| 05/15/2023 | 6.500% | | 4,280,000 | 4,355,041 |
The accompanying Notes to Financial Statements are an integral part of this statement.
Columbia Strategic Income Fund | Annual Report 2019
| 15 |
Portfolio of Investments (continued)
August 31, 2019
| Corporate Bonds & Notes(i) (continued) |
| Issuer | Coupon
Rate | | Principal
Amount ($) | Value ($) |
| Surgery Center Holdings, Inc.(a) |
| 04/15/2027 | 10.000% | | 870,000 | 830,501 |
| Teleflex, Inc. |
| 06/01/2026 | 4.875% | | 539,000 | 567,788 |
| 11/15/2027 | 4.625% | | 1,903,000 | 2,010,447 |
| Tenet Healthcare Corp. |
| 04/01/2022 | 8.125% | | 826,000 | 889,908 |
| 06/15/2023 | 6.750% | | 761,000 | 784,541 |
| 07/15/2024 | 4.625% | | 3,428,000 | 3,525,880 |
| 05/01/2025 | 5.125% | | 1,317,000 | 1,319,039 |
| 08/01/2025 | 7.000% | | 1,768,000 | 1,785,823 |
| Tenet Healthcare Corp.(a) |
| 01/01/2026 | 4.875% | | 3,230,000 | 3,319,700 |
| 02/01/2027 | 6.250% | | 3,648,000 | 3,794,405 |
| 11/01/2027 | 5.125% | | 5,754,000 | 5,945,625 |
| Total | 117,953,491 |
| Healthcare Insurance 0.3% |
| Centene Corp. |
| 01/15/2025 | 4.750% | | 2,202,000 | 2,283,648 |
| Centene Corp.(a) |
| 06/01/2026 | 5.375% | | 4,546,000 | 4,849,896 |
| WellCare Health Plans, Inc. |
| 04/01/2025 | 5.250% | | 4,087,000 | 4,283,989 |
| WellCare Health Plans, Inc.(a) |
| 08/15/2026 | 5.375% | | 3,154,000 | 3,360,691 |
| Total | 14,778,224 |
| Home Construction 0.2% |
| Lennar Corp. |
| 11/15/2024 | 5.875% | | 1,191,000 | 1,331,514 |
| 06/01/2026 | 5.250% | | 2,550,000 | 2,773,071 |
| 06/15/2027 | 5.000% | | 2,745,000 | 2,966,464 |
| Meritage Homes Corp. |
| 04/01/2022 | 7.000% | | 673,000 | 739,624 |
| Taylor Morrison Communities, Inc.(a) |
| 01/15/2028 | 5.750% | | 1,294,000 | 1,375,961 |
| Taylor Morrison Communities, Inc./Holdings II(a) |
| 04/15/2023 | 5.875% | | 1,265,000 | 1,339,939 |
| 03/01/2024 | 5.625% | | 695,000 | 730,793 |
| TRI Pointe Group, Inc./Homes |
| 06/15/2024 | 5.875% | | 854,000 | 915,673 |
| Total | 12,173,039 |
| Independent Energy 1.2% |
| Callon Petroleum Co. |
| 10/01/2024 | 6.125% | | 532,000 | 515,864 |
| 07/01/2026 | 6.375% | | 4,223,000 | 4,088,236 |
| Corporate Bonds & Notes(i) (continued) |
| Issuer | Coupon
Rate | | Principal
Amount ($) | Value ($) |
| Carrizo Oil & Gas, Inc. |
| 04/15/2023 | 6.250% | | 3,132,000 | 2,982,701 |
| Centennial Resource Production LLC(a) |
| 01/15/2026 | 5.375% | | 1,776,000 | 1,695,281 |
| 04/01/2027 | 6.875% | | 1,776,000 | 1,775,869 |
| Chesapeake Energy Corp. |
| 10/01/2026 | 7.500% | | 2,570,000 | 1,776,019 |
| CrownRock LP/Finance, Inc.(a) |
| 10/15/2025 | 5.625% | | 7,082,000 | 6,995,373 |
| Indigo Natural Resources LLC(a) |
| 02/15/2026 | 6.875% | | 1,369,000 | 1,129,280 |
| Jagged Peak Energy LLC |
| 05/01/2026 | 5.875% | | 2,615,000 | 2,625,436 |
| Matador Resources Co. |
| 09/15/2026 | 5.875% | | 3,001,000 | 2,917,689 |
| MEG Energy Corp.(a) |
| 01/15/2025 | 6.500% | | 2,185,000 | 2,198,678 |
| Noble Energy, Inc. |
| 11/15/2043 | 5.250% | | 2,725,000 | 3,076,964 |
| Parsley Energy LLC/Finance Corp.(a) |
| 06/01/2024 | 6.250% | | 1,271,000 | 1,316,065 |
| 08/15/2025 | 5.250% | | 2,621,000 | 2,661,709 |
| 10/15/2027 | 5.625% | | 6,910,000 | 7,137,726 |
| QEP Resources, Inc. |
| 03/01/2026 | 5.625% | | 883,000 | 723,085 |
| SM Energy Co. |
| 06/01/2025 | 5.625% | | 642,000 | 545,586 |
| 09/15/2026 | 6.750% | | 2,458,000 | 2,104,608 |
| 01/15/2027 | 6.625% | | 2,160,000 | 1,837,238 |
| Tullow Oil PLC(a) |
| 03/01/2025 | 7.000% | | 3,550,000 | 3,525,082 |
| WPX Energy, Inc. |
| 01/15/2022 | 6.000% | | 1,014,000 | 1,046,958 |
| 09/15/2024 | 5.250% | | 2,400,000 | 2,441,184 |
| 06/01/2026 | 5.750% | | 4,393,000 | 4,555,594 |
| Total | 59,672,225 |
| Integrated Energy 0.0% |
| Lukoil International Finance BV(a) |
| 04/24/2023 | 4.563% | | 2,166,000 | 2,289,215 |
| Leisure 0.1% |
| Cedar Fair LP(a) |
| 07/15/2029 | 5.250% | | 923,000 | 1,000,472 |
| Live Nation Entertainment, Inc.(a) |
| 11/01/2024 | 4.875% | | 1,163,000 | 1,205,264 |
| 03/15/2026 | 5.625% | | 724,000 | 772,084 |
The accompanying Notes to Financial Statements are an integral part of this statement.
| 16 | Columbia Strategic Income Fund | Annual Report 2019 |
Portfolio of Investments (continued)
August 31, 2019
| Corporate Bonds & Notes(i) (continued) |
| Issuer | Coupon
Rate | | Principal
Amount ($) | Value ($) |
| Viking Cruises Ltd.(a) |
| 09/15/2027 | 5.875% | | 1,779,000 | 1,853,686 |
| Total | 4,831,506 |
| Life Insurance 2.1% |
| Assicurazioni Generali SpA(a),(j) |
| Subordinated |
| 06/08/2048 | 5.000% | EUR | 8,600,000 | 11,104,592 |
| Brighthouse Financial, Inc. |
| 06/22/2047 | 4.700% | | 85,000 | 76,573 |
| Five Corners Funding Trust(a) |
| 11/15/2023 | 4.419% | | 22,756,000 | 24,668,482 |
| Guardian Life Insurance Co. of America (The)(a) |
| Subordinated |
| 06/19/2064 | 4.875% | | 9,685,000 | 12,513,311 |
| Massachusetts Mutual Life Insurance Co.(a) |
| Subordinated |
| 04/01/2077 | 4.900% | | 6,700,000 | 8,751,949 |
| Peachtree Corners Funding Trust(a) |
| 02/15/2025 | 3.976% | | 25,683,000 | 27,164,447 |
| Teachers Insurance & Annuity Association of America(a) |
| Subordinated |
| 09/15/2044 | 4.900% | | 8,875,000 | 11,135,711 |
| 05/15/2047 | 4.270% | | 2,739,000 | 3,186,385 |
| Voya Financial, Inc. |
| 06/15/2046 | 4.800% | | 5,875,000 | 6,959,525 |
| Total | 105,560,975 |
| Lodging 0.0% |
| Hilton Domestic Operating Co., Inc. |
| 05/01/2026 | 5.125% | | 1,139,000 | 1,200,779 |
| Media and Entertainment 0.9% |
| Clear Channel Worldwide Holdings, Inc.(a) |
| 02/15/2024 | 9.250% | | 4,262,000 | 4,675,815 |
| 08/15/2027 | 5.125% | | 2,764,000 | 2,892,606 |
| Diamond Sports Group LLC/Finance Co.(a) |
| 08/15/2026 | 5.375% | | 1,793,000 | 1,882,338 |
| 08/15/2027 | 6.625% | | 1,877,000 | 1,962,963 |
| Discovery Communications LLC |
| 05/15/2049 | 5.300% | | 1,616,000 | 1,853,904 |
| iHeartCommunications, Inc. |
| 05/01/2026 | 6.375% | | 1,250,936 | 1,357,405 |
| 05/01/2027 | 8.375% | | 5,432,666 | 5,870,202 |
| iHeartCommunications, Inc.(a) |
| 08/15/2027 | 5.250% | | 698,000 | 733,570 |
| Match Group, Inc. |
| 06/01/2024 | 6.375% | | 1,949,000 | 2,054,692 |
| Corporate Bonds & Notes(i) (continued) |
| Issuer | Coupon
Rate | | Principal
Amount ($) | Value ($) |
| Netflix, Inc. |
| 04/15/2028 | 4.875% | | 4,534,000 | 4,743,897 |
| 11/15/2028 | 5.875% | | 3,566,000 | 3,997,611 |
| Netflix, Inc.(a) |
| 05/15/2029 | 6.375% | | 1,817,000 | 2,101,326 |
| 11/15/2029 | 5.375% | | 2,599,000 | 2,825,755 |
| Outfront Media Capital LLC/Corp. |
| 03/15/2025 | 5.875% | | 5,024,000 | 5,196,715 |
| Outfront Media Capital LLC/Corp.(a) |
| 08/15/2027 | 5.000% | | 2,511,000 | 2,604,231 |
| Scripps Escrow, Inc.(a) |
| 07/15/2027 | 5.875% | | 734,000 | 740,057 |
| Total | 45,493,087 |
| Metals and Mining 0.7% |
| Alcoa Nederland Holding BV(a) |
| 09/30/2024 | 6.750% | | 876,000 | 920,119 |
| 09/30/2026 | 7.000% | | 2,209,000 | 2,383,202 |
| Big River Steel LLC/Finance Corp.(a) |
| 09/01/2025 | 7.250% | | 3,343,000 | 3,532,033 |
| Constellium NV(a) |
| 05/15/2024 | 5.750% | | 929,000 | 957,103 |
| 03/01/2025 | 6.625% | | 1,472,000 | 1,540,129 |
| 02/15/2026 | 5.875% | | 5,123,000 | 5,342,561 |
| Freeport-McMoRan, Inc. |
| 09/01/2029 | 5.250% | | 1,369,000 | 1,356,393 |
| 03/15/2043 | 5.450% | | 6,336,000 | 5,759,924 |
| HudBay Minerals, Inc.(a) |
| 01/15/2023 | 7.250% | | 818,000 | 843,566 |
| 01/15/2025 | 7.625% | | 5,122,000 | 5,210,022 |
| Novelis Corp.(a) |
| 08/15/2024 | 6.250% | | 910,000 | 953,553 |
| 09/30/2026 | 5.875% | | 5,211,000 | 5,505,672 |
| Total | 34,304,277 |
| Midstream 2.9% |
| Antero Midstream Partners LP/Finance Corp.(a) |
| 03/01/2027 | 5.750% | | 1,581,000 | 1,449,962 |
| Cheniere Corpus Christi Holdings LLC |
| 06/30/2027 | 5.125% | | 1,793,000 | 1,985,796 |
| Cheniere Energy Partners LP |
| 10/01/2026 | 5.625% | | 2,322,000 | 2,453,486 |
| DCP Midstream Operating LP |
| 05/15/2029 | 5.125% | | 2,326,000 | 2,380,694 |
| 04/01/2044 | 5.600% | | 7,581,000 | 7,156,184 |
| Delek Logistics Partners LP/Finance Corp. |
| 05/15/2025 | 6.750% | | 1,539,000 | 1,530,386 |
| Enterprise Products Operating LLC |
| 01/31/2050 | 4.200% | | 10,160,000 | 11,056,803 |
The accompanying Notes to Financial Statements are an integral part of this statement.
Columbia Strategic Income Fund | Annual Report 2019
| 17 |
Portfolio of Investments (continued)
August 31, 2019
| Corporate Bonds & Notes(i) (continued) |
| Issuer | Coupon
Rate | | Principal
Amount ($) | Value ($) |
| Holly Energy Partners LP/Finance Corp.(a) |
| 08/01/2024 | 6.000% | | 3,977,000 | 4,165,923 |
| Kinder Morgan Energy Partners LP |
| 03/01/2043 | 5.000% | | 20,248,000 | 22,505,996 |
| Kinder Morgan, Inc. |
| 02/15/2046 | 5.050% | | 8,725,000 | 9,847,908 |
| MPLX LP |
| 04/15/2048 | 4.700% | | 5,970,000 | 6,120,175 |
| NuStar Logistics LP |
| 06/01/2026 | 6.000% | | 988,000 | 1,062,452 |
| 04/28/2027 | 5.625% | | 2,219,000 | 2,307,358 |
| Plains All American Pipeline LP/Finance Corp. |
| 06/15/2044 | 4.700% | | 21,154,000 | 21,286,868 |
| Rockpoint Gas Storage Canada Ltd.(a) |
| 03/31/2023 | 7.000% | | 2,320,000 | 2,346,689 |
| Sunoco LP/Finance Corp. |
| 01/15/2023 | 4.875% | | 732,000 | 748,859 |
| 02/15/2026 | 5.500% | | 2,023,000 | 2,101,691 |
| Tallgrass Energy Partners LP/Finance Corp.(a) |
| 09/15/2024 | 5.500% | | 459,000 | 447,934 |
| 01/15/2028 | 5.500% | | 1,239,000 | 1,165,600 |
| Targa Resources Partners LP/Finance Corp. |
| 02/01/2027 | 5.375% | | 2,654,000 | 2,740,438 |
| 01/15/2028 | 5.000% | | 8,531,000 | 8,569,978 |
| Targa Resources Partners LP/Finance Corp.(a) |
| 07/15/2027 | 6.500% | | 482,000 | 522,467 |
| 01/15/2029 | 6.875% | | 418,000 | 461,933 |
| TransMontaigne Partners LP/TLP Finance Corp. |
| 02/15/2026 | 6.125% | | 2,330,000 | 2,251,856 |
| Western Gas Partners LP |
| 08/15/2048 | 5.500% | | 3,460,000 | 3,228,796 |
| Williams Companies, Inc. (The) |
| 09/15/2045 | 5.100% | | 20,809,000 | 23,267,646 |
| Total | 143,163,878 |
| Natural Gas 0.7% |
| NiSource, Inc. |
| 02/15/2043 | 5.250% | | 4,755,000 | 5,879,819 |
| 05/15/2047 | 4.375% | | 9,098,000 | 10,514,968 |
| Sempra Energy |
| 06/15/2024 | 3.550% | | 6,059,000 | 6,354,158 |
| 06/15/2027 | 3.250% | | 10,850,000 | 11,227,005 |
| Total | 33,975,950 |
| Oil Field Services 0.2% |
| Apergy Corp. |
| 05/01/2026 | 6.375% | | 3,274,000 | 3,300,045 |
| Corporate Bonds & Notes(i) (continued) |
| Issuer | Coupon
Rate | | Principal
Amount ($) | Value ($) |
| Calfrac Holdings LP(a) |
| 06/15/2026 | 8.500% | | 1,154,000 | 726,196 |
| Nabors Industries, Inc. |
| 02/01/2025 | 5.750% | | 3,077,000 | 2,455,126 |
| Rowan Companies, Inc. |
| 01/15/2024 | 4.750% | | 1,109,000 | 715,859 |
| SESI LLC |
| 09/15/2024 | 7.750% | | 797,000 | 487,650 |
| Transocean Guardian Ltd.(a) |
| 01/15/2024 | 5.875% | | 1,035,960 | 1,043,992 |
| Transocean Sentry Ltd.(a) |
| 05/15/2023 | 5.375% | | 2,457,000 | 2,432,430 |
| Total | 11,161,298 |
| Other Industry 0.1% |
| KAR Auction Services, Inc.(a) |
| 06/01/2025 | 5.125% | | 3,148,000 | 3,242,147 |
| Other REIT 0.1% |
| CyrusOne LP/Finance Corp. |
| 03/15/2024 | 5.000% | | 1,043,000 | 1,077,080 |
| 03/15/2027 | 5.375% | | 4,505,000 | 4,804,961 |
| Total | 5,882,041 |
| Packaging 0.9% |
| ARD Finance SA PIK |
| 09/15/2023 | 7.125% | | 1,208,000 | 1,243,789 |
| Ardagh Packaging Finance PLC/Holdings U.S.A., Inc.(a) |
| 05/15/2023 | 4.625% | | 2,310,000 | 2,363,336 |
| 02/15/2025 | 6.000% | | 5,086,000 | 5,319,061 |
| Ardagh Packaging Finance PLC/Holdings USA, Inc.(a) |
| 08/15/2026 | 4.125% | | 1,675,000 | 1,697,541 |
| 08/15/2027 | 5.250% | | 1,996,000 | 2,013,727 |
| Berry Global Escrow Corp.(a) |
| 07/15/2026 | 4.875% | | 1,245,000 | 1,310,603 |
| 07/15/2027 | 5.625% | | 1,143,000 | 1,201,831 |
| Berry Global, Inc. |
| 07/15/2023 | 5.125% | | 4,020,000 | 4,121,517 |
| BWAY Holding Co.(a) |
| 04/15/2024 | 5.500% | | 4,229,000 | 4,365,356 |
| Flex Acquisition Co., Inc.(a) |
| 07/15/2026 | 7.875% | | 1,435,000 | 1,298,686 |
| Novolex(a) |
| 01/15/2025 | 6.875% | | 654,000 | 588,645 |
| Owens-Brockway Glass Container, Inc.(a) |
| 08/15/2023 | 5.875% | | 2,193,000 | 2,335,692 |
| Reynolds Group Issuer, Inc./LLC |
| 10/15/2020 | 5.750% | | 5,964,858 | 5,981,017 |
The accompanying Notes to Financial Statements are an integral part of this statement.
| 18 | Columbia Strategic Income Fund | Annual Report 2019 |
Portfolio of Investments (continued)
August 31, 2019
| Corporate Bonds & Notes(i) (continued) |
| Issuer | Coupon
Rate | | Principal
Amount ($) | Value ($) |
| Reynolds Group Issuer, Inc./LLC(a) |
| 07/15/2023 | 5.125% | | 2,299,000 | 2,361,926 |
| 07/15/2024 | 7.000% | | 3,073,000 | 3,185,407 |
| Trivium Packaging Finance BV(a) |
| 08/15/2026 | 5.500% | | 2,818,000 | 2,983,856 |
| 08/15/2027 | 8.500% | | 678,000 | 730,864 |
| Total | 43,102,854 |
| Pharmaceuticals 1.0% |
| AbbVie, Inc. |
| 11/14/2048 | 4.875% | | 8,220,000 | 9,231,890 |
| Allergan Funding SCS |
| 06/15/2044 | 4.850% | | 4,120,000 | 4,517,634 |
| Amgen, Inc. |
| 06/15/2051 | 4.663% | | 7,245,000 | 8,612,045 |
| Bausch Health Companies, Inc.(a) |
| 05/15/2023 | 5.875% | | 2,306,000 | 2,336,580 |
| 03/15/2024 | 7.000% | | 881,000 | 929,592 |
| 04/15/2025 | 6.125% | | 1,504,000 | 1,554,279 |
| 11/01/2025 | 5.500% | | 1,973,000 | 2,071,976 |
| 04/01/2026 | 9.250% | | 3,605,000 | 4,089,461 |
| 01/31/2027 | 8.500% | | 2,535,000 | 2,811,513 |
| 01/15/2028 | 7.000% | | 1,333,000 | 1,398,534 |
| Bristol-Myers Squibb Co.(a) |
| 10/26/2049 | 4.250% | | 1,777,000 | 2,131,039 |
| Catalent Pharma Solutions, Inc.(a) |
| 01/15/2026 | 4.875% | | 2,289,000 | 2,337,351 |
| 07/15/2027 | 5.000% | | 342,000 | 358,005 |
| Eagle Holding Co. II LLC PIK(a) |
| 05/15/2022 | 7.750% | | 1,692,000 | 1,711,035 |
| Horizon Pharma USA, Inc.(a) |
| 08/01/2027 | 5.500% | | 1,594,000 | 1,662,143 |
| Jaguar Holding Co. II/Pharmaceutical Product Development LLC(a) |
| 08/01/2023 | 6.375% | | 3,612,000 | 3,733,067 |
| Par Pharmaceutical, Inc.(a) |
| 04/01/2027 | 7.500% | | 1,695,000 | 1,582,633 |
| Total | 51,068,777 |
| Property & Casualty 0.1% |
| Acrisure LLC/Finance, Inc.(a) |
| 02/15/2024 | 8.125% | | 612,000 | 660,690 |
| Alliant Holdings Intermediate LLC/Co-Issuer(a) |
| 08/01/2023 | 8.250% | | 1,324,000 | 1,352,116 |
| HUB International Ltd.(a) |
| 05/01/2026 | 7.000% | | 2,096,000 | 2,126,568 |
| USI, Inc.(a) |
| 05/01/2025 | 6.875% | | 243,000 | 243,119 |
| Total | 4,382,493 |
| Corporate Bonds & Notes(i) (continued) |
| Issuer | Coupon
Rate | | Principal
Amount ($) | Value ($) |
| Railroads 0.4% |
| CSX Corp. |
| 03/01/2048 | 4.300% | | 7,380,000 | 8,570,851 |
| Union Pacific Corp. |
| 09/10/2058 | 4.800% | | 6,720,000 | 8,390,431 |
| 08/15/2059 | 3.950% | | 1,224,000 | 1,352,701 |
| Total | 18,313,983 |
| Restaurants 0.2% |
| 1011778 BC ULC/New Red Finance, Inc.(a) |
| 10/15/2025 | 5.000% | | 5,277,000 | 5,449,774 |
| IRB Holding Corp.(a) |
| 02/15/2026 | 6.750% | | 3,301,000 | 3,333,746 |
| KFC Holding Co./Pizza Hut Holdings LLC/Taco Bell of America LLC(a) |
| 06/01/2027 | 4.750% | | 1,566,000 | 1,644,537 |
| Total | 10,428,057 |
| Retailers 0.2% |
| L Brands, Inc. |
| 06/15/2029 | 7.500% | | 897,000 | 879,953 |
| 11/01/2035 | 6.875% | | 884,000 | 749,722 |
| Lowe’s Companies, Inc. |
| 04/05/2049 | 4.550% | | 4,161,000 | 4,871,079 |
| PetSmart, Inc.(a) |
| 03/15/2023 | 7.125% | | 1,842,000 | 1,715,757 |
| 06/01/2025 | 5.875% | | 2,806,000 | 2,750,076 |
| Total | 10,966,587 |
| Supermarkets 0.5% |
| Albertsons Companies LLC/Safeway, Inc.(a) |
| 03/15/2026 | 7.500% | | 1,085,000 | 1,207,983 |
| Albertsons Companies LLC/Safeway, Inc./New Albertsons LP |
| 03/15/2025 | 5.750% | | 2,387,000 | 2,452,779 |
| Albertsons Companies LLC/Safeway, Inc./New Albertsons LP(a) |
| 02/15/2028 | 5.875% | | 1,248,000 | 1,314,571 |
| Kroger Co. (The) |
| 02/01/2047 | 4.450% | | 18,578,000 | 19,385,641 |
| 01/15/2048 | 4.650% | | 1,640,000 | 1,753,622 |
| Total | 26,114,596 |
| Technology 2.0% |
| Ascend Learning LLC(a) |
| 08/01/2025 | 6.875% | | 2,272,000 | 2,356,977 |
| 08/01/2025 | 6.875% | | 1,345,000 | 1,394,148 |
| Broadcom Corp./Cayman Finance Ltd. |
| 01/15/2027 | 3.875% | | 21,890,000 | 21,897,946 |
| Camelot Finance SA(a) |
| 10/15/2024 | 7.875% | | 4,227,000 | 4,389,820 |
The accompanying Notes to Financial Statements are an integral part of this statement.
Columbia Strategic Income Fund | Annual Report 2019
| 19 |
Portfolio of Investments (continued)
August 31, 2019
| Corporate Bonds & Notes(i) (continued) |
| Issuer | Coupon
Rate | | Principal
Amount ($) | Value ($) |
| CDK Global, Inc. |
| 06/01/2027 | 4.875% | | 3,104,000 | 3,208,437 |
| CommScope Finance LLC(a) |
| 03/01/2024 | 5.500% | | 1,321,000 | 1,343,655 |
| 03/01/2026 | 6.000% | | 1,567,000 | 1,592,970 |
| CommScope Technologies LLC(a) |
| 06/15/2025 | 6.000% | | 2,229,000 | 1,997,206 |
| Ensemble S Merger Sub, Inc.(a) |
| 09/30/2023 | 9.000% | | 646,000 | 663,545 |
| Equinix, Inc. |
| 05/15/2027 | 5.375% | | 3,849,000 | 4,172,920 |
| Gartner, Inc.(a) |
| 04/01/2025 | 5.125% | | 4,384,000 | 4,594,756 |
| Genesys Telecommunications Laboratories, Inc./Greeneden Lux 3 Sarl/U.S. Holdings I LLC(a) |
| 11/30/2024 | 10.000% | | 1,683,000 | 1,818,057 |
| Informatica LLC(a) |
| 07/15/2023 | 7.125% | | 2,348,000 | 2,386,925 |
| Iron Mountain, Inc. |
| 08/15/2024 | 5.750% | | 3,307,000 | 3,339,392 |
| Lenovo Perpetual Securities Ltd.(a),(j) |
| 12/31/2049 | 5.375% | | 4,870,000 | 4,705,852 |
| MSCI, Inc.(a) |
| 08/15/2025 | 5.750% | | 1,566,000 | 1,643,370 |
| NCR Corp. |
| 07/15/2022 | 5.000% | | 1,342,000 | 1,353,528 |
| 12/15/2023 | 6.375% | | 3,654,000 | 3,766,752 |
| NCR Corp.(a) |
| 09/01/2027 | 5.750% | | 1,354,000 | 1,428,882 |
| 09/01/2029 | 6.125% | | 1,692,000 | 1,794,904 |
| PTC, Inc. |
| 05/15/2024 | 6.000% | | 2,399,000 | 2,512,938 |
| Qualitytech LP/QTS Finance Corp.(a) |
| 11/15/2025 | 4.750% | | 4,530,000 | 4,595,545 |
| Refinitiv US Holdings, Inc.(a) |
| 05/15/2026 | 6.250% | | 5,055,000 | 5,503,884 |
| 11/15/2026 | 8.250% | | 3,468,000 | 3,910,482 |
| Symantec Corp.(a) |
| 04/15/2025 | 5.000% | | 1,422,000 | 1,428,612 |
| Tempo Acquisition LLC/Finance Corp.(a) |
| 06/01/2025 | 6.750% | | 2,445,000 | 2,510,531 |
| Tencent Holdings Ltd.(a) |
| 01/19/2028 | 3.595% | | 7,000,000 | 7,372,183 |
| VeriSign, Inc. |
| 05/01/2023 | 4.625% | | 1,734,000 | 1,761,513 |
| Corporate Bonds & Notes(i) (continued) |
| Issuer | Coupon
Rate | | Principal
Amount ($) | Value ($) |
| Verscend Escrow Corp.(a) |
| 08/15/2026 | 9.750% | | 2,633,000 | 2,818,292 |
| Total | 102,264,022 |
| Transportation Services 0.7% |
| Avis Budget Car Rental LLC/Finance, Inc. |
| 04/01/2023 | 5.500% | | 524,000 | 534,612 |
| Avis Budget Car Rental LLC/Finance, Inc.(a) |
| 03/15/2025 | 5.250% | | 2,671,000 | 2,715,611 |
| ERAC U.S.A. Finance LLC(a) |
| 11/01/2046 | 4.200% | | 6,550,000 | 7,199,406 |
| FedEx Corp. |
| 04/01/2046 | 4.550% | | 16,560,000 | 18,045,415 |
| Hertz Corp. (The)(a) |
| 06/01/2022 | 7.625% | | 3,423,000 | 3,561,707 |
| 10/15/2024 | 5.500% | | 1,703,000 | 1,674,761 |
| 08/01/2026 | 7.125% | | 1,430,000 | 1,459,718 |
| XPO Logistics, Inc.(a) |
| 06/15/2022 | 6.500% | | 1,237,000 | 1,261,734 |
| Total | 36,452,964 |
| Wireless 0.9% |
| Altice France SA(a) |
| 05/01/2026 | 7.375% | | 6,096,000 | 6,501,299 |
| 02/01/2027 | 8.125% | | 1,705,000 | 1,879,275 |
| Altice Luxembourg SA(a) |
| 05/15/2022 | 7.750% | | 291,000 | 298,223 |
| 05/15/2027 | 10.500% | | 2,585,000 | 2,804,092 |
| Millicom International Cellular SA(a) |
| 03/25/2029 | 6.250% | | 1,700,000 | 1,852,470 |
| SBA Communications Corp. |
| 09/01/2024 | 4.875% | | 7,614,000 | 7,908,951 |
| Sprint Capital Corp. |
| 11/15/2028 | 6.875% | | 4,785,000 | 5,328,997 |
| Sprint Corp. |
| 02/15/2025 | 7.625% | | 846,000 | 949,460 |
| 03/01/2026 | 7.625% | | 2,280,000 | 2,576,607 |
| T-Mobile U.S.A., Inc. |
| 01/15/2026 | 6.500% | | 7,774,000 | 8,362,266 |
| 02/01/2026 | 4.500% | | 1,047,000 | 1,086,516 |
| 02/01/2028 | 4.750% | | 3,299,000 | 3,472,804 |
| Total | 43,020,960 |
| Wirelines 1.5% |
| AT&T, Inc. |
| 03/01/2029 | 4.350% | | 7,766,000 | 8,672,580 |
| 06/15/2045 | 4.350% | | 18,935,000 | 20,184,199 |
The accompanying Notes to Financial Statements are an integral part of this statement.
| 20 | Columbia Strategic Income Fund | Annual Report 2019 |
Portfolio of Investments (continued)
August 31, 2019
| Corporate Bonds & Notes(i) (continued) |
| Issuer | Coupon
Rate | | Principal
Amount ($) | Value ($) |
| CenturyLink, Inc. |
| 03/15/2022 | 5.800% | | 6,347,000 | 6,663,944 |
| 04/01/2024 | 7.500% | | 3,898,000 | 4,327,150 |
| Frontier Communications Corp. |
| 01/15/2023 | 7.125% | | 2,965,000 | 1,521,679 |
| Frontier Communications Corp.(a) |
| 04/01/2026 | 8.500% | | 941,000 | 913,878 |
| Liquid Telecommunications Financing PLC(a) |
| 07/13/2022 | 8.500% | | 4,850,000 | 4,742,374 |
| Telecom Italia Capital SA |
| 09/30/2034 | 6.000% | | 832,000 | 848,057 |
| Verizon Communications, Inc. |
| 09/21/2028 | 4.329% | | 10,626,000 | 12,193,112 |
| 03/15/2055 | 4.672% | | 6,220,000 | 7,629,551 |
| Zayo Group LLC/Capital, Inc.(a) |
| 01/15/2027 | 5.750% | | 5,503,000 | 5,647,481 |
| Total | 73,344,005 |
Total Corporate Bonds & Notes
(Cost $1,787,367,554) | 1,908,242,789 |
|
| Foreign Government Obligations(i),(k) 8.2% |
| | | | |
| Argentina 0.5% |
| Argentine Republic Government International Bond |
| 01/11/2023 | 4.625% | | 14,128,000 | 5,516,263 |
| 04/22/2026 | 7.500% | | 14,643,000 | 5,645,228 |
| 01/26/2027 | 6.875% | | 9,998,000 | 3,801,020 |
| 01/11/2028 | 5.875% | | 14,400,000 | 5,434,906 |
| 07/06/2036 | 7.125% | | 6,900,000 | 2,561,142 |
| 04/22/2046 | 7.625% | | 1,100,000 | 418,042 |
| 01/11/2048 | 6.875% | | 5,100,000 | 1,928,330 |
| Total | 25,304,931 |
| Belarus 0.1% |
| Republic of Belarus International Bond(a) |
| 02/28/2023 | 6.875% | | 2,200,000 | 2,366,687 |
| 02/28/2030 | 6.200% | | 4,400,000 | 4,694,334 |
| Total | 7,061,021 |
| Brazil 0.4% |
| Brazilian Government International Bond |
| 01/07/2041 | 5.625% | | 12,300,000 | 14,087,178 |
| Petrobras Global Finance BV |
| 01/27/2028 | 5.999% | | 5,963,000 | 6,563,217 |
| Total | 20,650,395 |
| Canada 0.0% |
| NOVA Chemicals Corp.(a) |
| 06/01/2027 | 5.250% | | 518,000 | 542,162 |
| Foreign Government Obligations(i),(k) (continued) |
| Issuer | Coupon
Rate | | Principal
Amount ($) | Value ($) |
| China 0.5% |
| Sinopec Group Overseas Development 2018 Ltd.(a) |
| 09/12/2025 | 4.125% | | 4,400,000 | 4,805,812 |
| Syngenta Finance NV(a) |
| 04/24/2028 | 5.182% | | 17,650,000 | 18,920,394 |
| Total | 23,726,206 |
| Croatia 0.2% |
| Croatia Government International Bond(a) |
| 01/26/2024 | 6.000% | | 8,500,000 | 9,841,682 |
| Dominican Republic 0.8% |
| Dominican Republic Bond(a) |
| 02/05/2027 | 11.250% | DOP | 400,000,000 | 8,584,568 |
| Dominican Republic International Bond(a) |
| 01/08/2021 | 14.000% | DOP | 44,440,000 | 922,594 |
| 03/04/2022 | 10.375% | DOP | 397,000,000 | 8,074,517 |
| 02/10/2023 | 14.500% | DOP | 25,000,000 | 559,053 |
| 02/15/2023 | 8.900% | DOP | 42,000,000 | 825,096 |
| 01/25/2027 | 5.950% | | 4,475,000 | 4,918,128 |
| 04/30/2044 | 7.450% | | 7,900,000 | 9,574,642 |
| 01/27/2045 | 6.850% | | 4,881,000 | 5,609,221 |
| Total | 39,067,819 |
| Egypt 0.5% |
| Egypt Government International Bond(a) |
| 03/01/2024 | 6.200% | | 900,000 | 948,129 |
| 04/16/2026 | 4.750% | EUR | 2,100,000 | 2,377,244 |
| 01/31/2027 | 7.500% | | 3,900,000 | 4,235,256 |
| 02/21/2028 | 6.588% | | 3,850,000 | 3,950,331 |
| 03/01/2029 | 7.600% | | 1,250,000 | 1,350,937 |
| 01/31/2047 | 8.500% | | 5,700,000 | 6,191,631 |
| 02/21/2048 | 7.903% | | 2,800,000 | 2,890,975 |
| 03/01/2049 | 8.700% | | 965,000 | 1,058,190 |
| Total | 23,002,693 |
| El Salvador 0.0% |
| El Salvador Government International Bond(a) |
| 12/01/2019 | 7.375% | | 2,166,000 | 2,176,349 |
| Honduras 0.4% |
| Honduras Government International Bond(a) |
| 03/15/2024 | 7.500% | | 3,468,000 | 3,873,441 |
| 03/15/2024 | 7.500% | | 2,166,000 | 2,419,225 |
| 01/19/2027 | 6.250% | | 10,905,000 | 11,873,320 |
| Total | 18,165,986 |
| Indonesia 0.5% |
| Indonesia Government International Bond(a) |
| 04/25/2022 | 3.750% | | 900,000 | 929,445 |
| 01/15/2045 | 5.125% | | 3,600,000 | 4,431,125 |
The accompanying Notes to Financial Statements are an integral part of this statement.
Columbia Strategic Income Fund | Annual Report 2019
| 21 |
Portfolio of Investments (continued)
August 31, 2019
| Foreign Government Obligations(i),(k) (continued) |
| Issuer | Coupon
Rate | | Principal
Amount ($) | Value ($) |
| PT Indonesia Asahan Aluminium Persero(a) |
| 11/15/2028 | 6.530% | | 1,700,000 | 2,110,210 |
| PT Pertamina Persero(a) |
| 05/30/2044 | 6.450% | | 10,600,000 | 14,085,386 |
| Saka Energi Indonesia PT(a) |
| 05/05/2024 | 4.450% | | 3,000,000 | 3,017,727 |
| Total | 24,573,893 |
| Ivory Coast 0.1% |
| Ivory Coast Government International Bond(a) |
| 03/03/2028 | 6.375% | | 1,572,000 | 1,589,611 |
| 06/15/2033 | 6.125% | | 3,847,000 | 3,641,432 |
| Ivory Coast Government International Bond(a),(j) |
| 12/31/2032 | 5.750% | | 821,920 | 814,126 |
| Total | 6,045,169 |
| Kazakhstan 0.4% |
| Kazakhstan Government International Bond(a) |
| 07/21/2045 | 6.500% | | 1,500,000 | 2,194,287 |
| KazMunayGas National Co. JSC(a) |
| 04/24/2030 | 5.375% | | 14,600,000 | 16,924,393 |
| Total | 19,118,680 |
| Mexico 0.9% |
| Mexican Bonos |
| 06/10/2021 | 6.500% | MXN | 50,000 | 2,475 |
| Mexico Government International Bond |
| 05/29/2031 | 7.750% | MXN | 140,000,000 | 7,356,589 |
| Petroleos Mexicanos(a) |
| 11/24/2021 | 7.650% | MXN | 18,600,000 | 893,038 |
| 09/12/2024 | 7.190% | MXN | 3,800,000 | 162,373 |
| Petroleos Mexicanos |
| 11/12/2026 | 7.470% | MXN | 23,700,000 | 952,646 |
| 03/13/2027 | 6.500% | | 9,302,000 | 9,531,648 |
| 06/02/2041 | 6.500% | | 2,500,000 | 2,344,262 |
| 01/23/2045 | 6.375% | | 4,000,000 | 3,689,128 |
| 09/21/2047 | 6.750% | | 20,950,000 | 19,841,452 |
| Total | 44,773,611 |
| Morocco 0.1% |
| OCP SA(a) |
| 04/25/2024 | 5.625% | | 6,900,000 | 7,608,016 |
| Netherlands 0.1% |
| Equate Petrochemical BV(a) |
| 03/03/2022 | 3.000% | | 2,166,000 | 2,186,436 |
| Kazakhstan Temir Zholy Finance BV(a) |
| 07/10/2042 | 6.950% | | 2,200,000 | 3,009,376 |
| Foreign Government Obligations(i),(k) (continued) |
| Issuer | Coupon
Rate | | Principal
Amount ($) | Value ($) |
| Petrobras Global Finance BV |
| 02/01/2029 | 5.750% | | 482,000 | 522,322 |
| Total | 5,718,134 |
| Nigeria 0.1% |
| Nigeria Government International Bond(a) |
| 02/16/2032 | 7.875% | | 5,300,000 | 5,461,332 |
| Oman 0.3% |
| Oman Government International Bond(a) |
| 06/15/2021 | 3.625% | | 2,166,000 | 2,150,428 |
| 01/17/2028 | 5.625% | | 10,943,000 | 10,779,293 |
| Total | 12,929,721 |
| Paraguay 0.2% |
| Paraguay Government International Bond(a) |
| 03/27/2027 | 4.700% | | 2,000,000 | 2,205,872 |
| 08/11/2044 | 6.100% | | 4,939,000 | 6,205,103 |
| Total | 8,410,975 |
| Qatar 0.3% |
| Qatar Government International Bond(a) |
| 03/14/2029 | 4.000% | | 900,000 | 1,029,383 |
| 03/14/2049 | 4.817% | | 12,750,000 | 16,450,203 |
| Total | 17,479,586 |
| Russian Federation 0.6% |
| Gazprom Neft OAO Via GPN Capital SA(a) |
| 09/19/2022 | 4.375% | | 3,800,000 | 3,933,004 |
| Gazprom OAO Via Gaz Capital SA(a) |
| 02/06/2028 | 4.950% | | 2,000,000 | 2,167,668 |
| 08/16/2037 | 7.288% | | 300,000 | 390,505 |
| Russian Federal Bond - OFZ |
| 05/23/2029 | 6.900% | RUB | 1,542,400,000 | 22,965,252 |
| Total | 29,456,429 |
| Saudi Arabia 0.2% |
| Saudi Arabian Oil Co.(a) |
| 04/16/2049 | 4.375% | | 10,114,000 | 11,532,893 |
| Senegal 0.2% |
| Senegal Government International Bond(a) |
| 05/23/2033 | 6.250% | | 8,508,000 | 8,428,229 |
| Serbia 0.1% |
| Serbia International Bond(a) |
| 09/28/2021 | 7.250% | | 3,320,000 | 3,635,413 |
| South Africa 0.6% |
| Eskom Holdings SOC Ltd.(a) |
| 01/26/2021 | 5.750% | | 6,700,000 | 6,721,366 |
The accompanying Notes to Financial Statements are an integral part of this statement.
| 22 | Columbia Strategic Income Fund | Annual Report 2019 |
Portfolio of Investments (continued)
August 31, 2019
| Foreign Government Obligations(i),(k) (continued) |
| Issuer | Coupon
Rate | | Principal
Amount ($) | Value ($) |
| Republic of South Africa Government Bond |
| 01/31/2030 | 8.000% | ZAR | 345,600,000 | 21,373,397 |
| Total | 28,094,763 |
| Ukraine 0.1% |
| Ukraine Government International Bond(a) |
| 09/01/2024 | 7.750% | | 500,000 | 535,455 |
| 09/25/2032 | 7.375% | | 6,900,000 | 7,111,340 |
| Total | 7,646,795 |
| United Arab Emirates 0.0% |
| Abu Dhabi National Energy Co. PJSC(a) |
| 01/12/2023 | 3.625% | | 2,166,000 | 2,241,145 |
Total Foreign Government Obligations
(Cost $424,844,590) | 412,694,028 |
|
| Inflation-Indexed Bonds(i) 0.7% |
| | | | |
| Mexico 0.1% |
| Mexican Udibonos |
| 11/15/2040 | 4.000% | MXN | 113,178,438 | 6,115,865 |
| United States 0.6% |
| U.S. Treasury Inflation-Indexed Bond |
| 02/15/2049 | 1.000% | | 22,597,602 | 26,752,426 |
Total Inflation-Indexed Bonds
(Cost $31,411,952) | 32,868,291 |
|
| Residential Mortgage-Backed Securities - Agency 16.5% |
| | | | |
| Federal Home Loan Mortgage Corp.(l) |
| CMO Series 304 Class C69 |
| 12/15/2042 | 4.000% | | 8,099,313 | 1,287,002 |
| CMO Series 4120 Class AI |
| 11/15/2039 | 3.500% | | 5,530,014 | 311,372 |
| CMO Series 4121 Class IA |
| 01/15/2041 | 3.500% | | 6,242,405 | 434,655 |
| CMO Series 4147 Class CI |
| 01/15/2041 | 3.500% | | 13,759,012 | 1,220,340 |
| CMO Series 4213 Class DI |
| 06/15/2038 | 3.500% | | 8,534,943 | 378,276 |
| Federal Home Loan Mortgage Corp.(b),(l) |
| CMO Series 318 Class S1 |
-1.0 x 1-month USD LIBOR + 5.950%
Cap 5.950%
11/15/2043 | 3.755% | | 7,531,338 | 1,698,456 |
| Residential Mortgage-Backed Securities - Agency (continued) |
| Issuer | Coupon
Rate | | Principal
Amount ($) | Value ($) |
| CMO Series 326 Class S2 |
-1.0 x 1-month USD LIBOR + 5.950%
Cap 5.950%
03/15/2044 | 3.755% | | 23,567,916 | 4,070,767 |
| CMO Series 4174 Class SB |
-1.0 x 1-month USD LIBOR + 6.200%
Cap 6.200%
05/15/2039 | 4.005% | | 7,364,403 | 540,125 |
| CMO Series 4903 Class SA |
-1.0 x 1-month USD LIBOR + 6.050%
Cap 6.050%
08/25/2049 | 3.905% | | 57,805,843 | 11,008,163 |
| CMO STRIPS Series 326 Class S1 |
-1.0 x 1-month USD LIBOR + 6.000%
Cap 6.000%
03/15/2044 | 3.805% | | 2,561,730 | 436,870 |
| Federal Home Loan Mortgage Corp.(g),(l) |
| CMO Series 4515 Class SA |
| 08/15/2038 | 1.916% | | 9,708,199 | 580,050 |
| CMO Series 4620 Class AS |
| 11/15/2042 | 1.827% | | 24,612,336 | 1,280,678 |
| Federal National Mortgage Association(m) |
09/17/2034-
09/12/2049 | 3.000% | | 461,500,000 | 470,728,342 |
| 09/12/2049 | 5.000% | | 63,000,000 | 67,272,188 |
| Federal National Mortgage Association |
| 05/01/2041 | 4.000% | | 2,163,496 | 2,241,140 |
| Federal National Mortgage Association(g),(l) |
| CMO Series 2006-5 Class N1 |
| 08/25/2034 | 0.000% | | 7,527,485 | 1 |
| Federal National Mortgage Association(l) |
| CMO Series 2012-118 Class BI |
| 12/25/2039 | 3.500% | | 8,608,860 | 568,113 |
| CMO Series 2012-121 Class GI |
| 08/25/2039 | 3.500% | | 5,821,207 | 311,470 |
| CMO Series 2012-129 Class IC |
| 01/25/2041 | 3.500% | | 6,547,300 | 613,086 |
| CMO Series 2012-131 Class MI |
| 01/25/2040 | 3.500% | | 9,335,538 | 883,325 |
| CMO Series 2012-133 Class EI |
| 07/25/2031 | 3.500% | | 3,299,915 | 218,641 |
| CMO Series 2012-139 Class IL |
| 04/25/2040 | 3.500% | | 4,704,145 | 335,542 |
| CMO Series 2013-1 Class AI |
| 02/25/2043 | 3.500% | | 4,364,445 | 748,764 |
The accompanying Notes to Financial Statements are an integral part of this statement.
Columbia Strategic Income Fund | Annual Report 2019
| 23 |
Portfolio of Investments (continued)
August 31, 2019
| Residential Mortgage-Backed Securities - Agency (continued) |
| Issuer | Coupon
Rate | | Principal
Amount ($) | Value ($) |
| CMO Series 2013-6 Class MI |
| 02/25/2040 | 3.500% | | 6,116,200 | 439,026 |
| Federal National Mortgage Association(b),(l) |
| CMO Series 2013-101 Class CS |
-1.0 x 1-month USD LIBOR + 5.900%
Cap 5.900%
10/25/2043 | 3.755% | | 15,494,039 | 3,430,247 |
| CMO Series 2014-93 Class ES |
-1.0 x 1-month USD LIBOR + 6.150%
Cap 6.150%
01/25/2045 | 4.005% | | 25,239,920 | 3,638,592 |
| CMO Series 2016-31 Class VS |
-1.0 x 1-month USD LIBOR + 6.000%
Cap 6.000%
06/25/2046 | 3.855% | | 17,689,400 | 3,174,230 |
| CMO Series 2016-42 Class SB |
-1.0 x 1-month USD LIBOR + 6.000%
Cap 6.000%
07/25/2046 | 3.855% | | 49,614,655 | 10,454,770 |
| CMO Series 2017-47 Class SE |
-1.0 x 1-month USD LIBOR + 6.100%
Cap 6.100%
06/25/2047 | 3.955% | | 16,436,731 | 3,652,858 |
| CMO Series 2017-56 Class SB |
-1.0 x 1-month USD LIBOR + 6.150%
Cap 6.150%
07/25/2047 | 4.005% | | 55,326,222 | 11,354,097 |
| CMO Series 2018-76 Class SN |
-1.0 x 1-month USD LIBOR + 6.150%
Cap 6.150%
10/25/2048 | 4.005% | | 19,486,779 | 3,757,332 |
| CMO Series 2019-33 Class SB |
-1.0 x 1-month USD LIBOR + 6.050%
Cap 6.050%
07/25/2049 | 3.905% | | 60,128,399 | 12,118,843 |
| CMO Series 2019-8 Class SG |
-1.0 x 1-month USD LIBOR + 6.000%
Cap 6.000%
03/25/2049 | 3.855% | | 56,924,305 | 12,261,182 |
| Government National Mortgage Association(m) |
| 09/19/2049 | 3.000% | | 32,000,000 | 32,993,125 |
| 09/19/2049 | 4.500% | | 30,000,000 | 31,387,500 |
| Residential Mortgage-Backed Securities - Agency (continued) |
| Issuer | Coupon
Rate | | Principal
Amount ($) | Value ($) |
| Government National Mortgage Association(l) |
| CMO Series 2014-190 Class AI |
| 12/20/2038 | 3.500% | | 15,881,973 | 1,699,033 |
| Government National Mortgage Association(b),(l) |
| CMO Series 2016-20 Class SQ |
-1.0 x 1-month USD LIBOR + 6.100%
Cap 6.100%
02/20/2046 | 3.928% | | 24,039,580 | 4,374,797 |
| CMO Series 2017-129 Class SA |
-1.0 x 1-month USD LIBOR + 6.200%
Cap 6.200%
08/20/2047 | 4.028% | | 22,035,924 | 4,688,899 |
| CMO Series 2017-133 Class SM |
-1.0 x 1-month USD LIBOR + 6.250%
Cap 6.250%
09/20/2047 | 4.078% | | 26,892,072 | 4,764,525 |
| CMO Series 2018-124 Class SA |
-1.0 x 1-month USD LIBOR + 6.200%
Cap 6.200%
09/20/2048 | 4.028% | | 57,853,621 | 9,592,466 |
| CMO Series 2018-125 Class SU |
-1.0 x 1-month USD LIBOR + 6.200%
Cap 6.200%
09/20/2048 | 4.028% | | 44,174,679 | 8,885,392 |
| CMO Series 2018-155 Class ES |
-1.0 x 1-month USD LIBOR + 6.100%
Cap 6.100%
11/20/2048 | 3.928% | | 37,166,282 | 7,176,828 |
| CMO Series 2018-168 Class SA |
-1.0 x 1-month USD LIBOR + 6.100%
Cap 6.100%
12/20/2048 | 3.928% | | 29,247,056 | 5,358,654 |
| CMO Series 2018-67 Class SP |
-1.0 x 1-month USD LIBOR + 6.200%
Cap 6.200%
05/20/2048 | 4.028% | | 21,644,912 | 4,656,911 |
| CMO Series 2019-23 Class LS |
-1.0 x 1-month USD LIBOR + 6.050%
Cap 6.050%
02/20/2049 | 3.878% | | 17,959,456 | 3,585,307 |
The accompanying Notes to Financial Statements are an integral part of this statement.
| 24 | Columbia Strategic Income Fund | Annual Report 2019 |
Portfolio of Investments (continued)
August 31, 2019
| Residential Mortgage-Backed Securities - Agency (continued) |
| Issuer | Coupon
Rate | | Principal
Amount ($) | Value ($) |
| CMO Series 2019-23 Class QS |
-1.0 x 1-month USD LIBOR + 6.050%
Cap 6.050%
02/20/2049 | 3.878% | | 61,863,314 | 11,075,476 |
| CMO Series 2019-29 Class DS |
-1.0 x 1-month USD LIBOR + 6.050%
Cap 6.050%
03/20/2049 | 3.878% | | 49,584,556 | 9,192,451 |
| CMO Series 2019-30 Class SH |
-1.0 x 1-month USD LIBOR + 6.050%
Cap 6.050%
03/20/2049 | 3.878% | | 51,411,141 | 8,230,255 |
| CMO Series 2019-36 Class SA |
-1.0 x 1-month USD LIBOR + 6.050%
Cap 6.050%
03/20/2049 | 3.878% | | 37,722,206 | 5,954,311 |
| CMO Series 2019-4 Class SJ |
-1.0 x 1-month USD LIBOR + 6.050%
Cap 6.050%
01/20/2049 | 3.878% | | 47,089,399 | 7,960,689 |
| CMO Series 2019-41 Class AS |
-1.0 x 1-month USD LIBOR + 6.050%
Cap 6.050%
03/20/2049 | 3.878% | | 42,943,858 | 8,591,464 |
| CMO Series 2019-5 Class SH |
-1.0 x 1-month USD LIBOR + 6.150%
Cap 6.150%
01/20/2049 | 3.978% | | 28,495,360 | 5,676,356 |
| CMO Series 2019-59 Class JS |
-1.0 x 1-month USD LIBOR + 6.150%
Cap 6.150%
05/20/2049 | 3.978% | | 27,314,213 | 4,975,325 |
| Government National Mortgage Association(b),(d),(l) |
| CMO Series 2019-97 Class GS |
1-month LIBID + 6.100%
Cap 6.100%
08/20/2049 | 3.905% | | 82,637,180 | 14,668,100 |
Total Residential Mortgage-Backed Securities - Agency
(Cost $812,526,144) | 826,936,407 |
|
| Residential Mortgage-Backed Securities - Non-Agency 20.0% |
| | | | |
| Angel Oak Mortgage Trust I LLC(a) |
| CMO Series 2016-1 Class A1 |
| 07/25/2046 | 3.500% | | 3,228,257 | 3,335,255 |
| Residential Mortgage-Backed Securities - Non-Agency (continued) |
| Issuer | Coupon
Rate | | Principal
Amount ($) | Value ($) |
| CMO Series 2016-1 Class A2 |
| 07/25/2046 | 5.000% | | 695,956 | 712,169 |
| Angel Oak Mortgage Trust LLC(a),(g) |
| CMO Series 2017-3 Class M1 |
| 11/25/2047 | 3.900% | | 7,444,000 | 7,572,912 |
| Arroyo Mortgage Trust(a) |
| CMO Series 2018-1 Class A3 |
| 04/25/2048 | 4.218% | | 16,155,282 | 16,563,741 |
| Arroyo Mortgage Trust(a),(g) |
| CMO Series 2019-2 Class A3 |
| 04/25/2049 | 3.800% | | 13,798,725 | 14,117,958 |
| Banc of America Funding Trust(a),(d),(g) |
| CMO Series 2016-R1 Class M2 |
| 03/25/2040 | 3.500% | | 12,763,517 | 12,549,090 |
| Bayview Opportunity Master Fund IVa Trust(a) |
| CMO Series 2018-RN6 Class A1 |
| 07/25/2033 | 4.090% | | 3,328,021 | 3,337,334 |
| Bayview Opportunity Master Fund IVa Trust(a),(g) |
| CMO Series 2019-RN2 Class A1 |
| 03/28/2034 | 3.967% | | 8,696,326 | 8,727,663 |
| Bayview Opportunity Master Fund Trust(a) |
| CMO Series 2018-RN8 Class A1 |
| 09/28/2033 | 4.066% | | 1,491,738 | 1,495,202 |
| Bayview Opportunity Master Fund Trust IVb(a) |
| CMO Series 2019-RN1 Class A1 |
| 02/28/2034 | 4.090% | | 11,292,880 | 11,382,505 |
| BCAP LLC Trust(a),(g) |
| CMO Series 2013-RR5 Class 4A1 |
| 09/26/2036 | 3.000% | | 1,019,878 | 999,850 |
| Bellemeade Re Ltd.(a),(b) |
| CMO Series 2018-2A Class M1C |
1-month USD LIBOR + 1.600%
08/25/2028 | 4.004% | | 10,400,000 | 10,452,989 |
| CMO Series 2019-1A Class M1A |
1-month USD LIBOR + 1.300%
Floor 1.300%
03/25/2029 | 3.445% | | 10,692,906 | 10,692,906 |
| CMO Series 2019-1A Class M1B |
1-month USD LIBOR + 1.750%
Floor 1.750%
03/25/2029 | 3.895% | | 18,300,000 | 18,278,315 |
| CMO Series 2019-2A Class M1B |
1-month USD LIBOR + 1.450%
Floor 1.450%
04/25/2029 | 3.595% | | 18,900,000 | 18,941,442 |
| CMO Series 2019-3A Class M1B |
1-month USD LIBOR + 1.600%
Floor 1.600%
07/25/2029 | 3.990% | | 30,000,000 | 29,999,940 |
The accompanying Notes to Financial Statements are an integral part of this statement.
Columbia Strategic Income Fund | Annual Report 2019
| 25 |
Portfolio of Investments (continued)
August 31, 2019
| Residential Mortgage-Backed Securities - Non-Agency (continued) |
| Issuer | Coupon
Rate | | Principal
Amount ($) | Value ($) |
| Bunker Hill Loan Depositary Trust(a),(g) |
| CMO Series 2019-2 Class A1 |
| 07/25/2049 | 2.880% | | 14,671,935 | 14,699,677 |
| CHL GMSR Issuer Trust(a),(b) |
| CMO Series 2018-GT1 Class A |
1-month USD LIBOR + 1.000%
05/25/2023 | 4.895% | | 13,500,000 | 13,542,167 |
| CIM Trust(a) |
| CMO Series 2017-8 Class A1 |
| 12/25/2065 | 3.000% | | 10,000,985 | 9,986,062 |
| CIM Trust(a),(b) |
| CMO Series 2018-R6 Class A1 |
1-month USD LIBOR + 1.076%
Floor 1.080%
09/25/2058 | 3.176% | | 8,449,412 | 8,390,541 |
| Citigroup Mortgage Loan Trust, Inc.(a),(g) |
| CMO Series 2009-4 Class 9A2 |
| 03/25/2036 | 4.954% | | 987,704 | 955,822 |
| CMO Series 2010-6 Class 2A2 |
| 09/25/2035 | 4.931% | | 976,750 | 999,840 |
| CMO Series 2013-11 Class 3A3 |
| 09/25/2034 | 4.154% | | 3,459,951 | 3,465,703 |
| Citigroup Mortgage Loan Trust, Inc.(a) |
| Subordinated, CMO Series 2014-C Class B1 |
| 02/25/2054 | 4.250% | | 5,250,000 | 5,413,049 |
| COLT Mortgage Loan Trust(a),(g) |
| CMO Series 2017-2 Class M1 |
| 10/25/2047 | 3.510% | | 5,000,000 | 4,988,549 |
| CMO Series 2019-1 Class M1 |
| 03/25/2049 | 4.518% | | 13,238,000 | 13,369,071 |
| Credit Suisse Mortgage Capital Certificates(a),(g) |
| CMO Series 2008-4R Class 3A4 |
| 01/26/2038 | 4.179% | | 582,231 | 581,750 |
| Credit Suisse Mortgage Capital Certificates(a) |
| CMO Series 2014-2R Class 18A1 |
| 01/27/2037 | 3.000% | | 1,709,845 | 1,703,757 |
| CMO Series 2014-2R Class 19A1 |
| 05/27/2036 | 3.000% | | 1,062,052 | 1,057,928 |
| Credit Suisse Mortgage Trust(a) |
| CMO Series 2018-RPL2 Class A1 |
| 08/25/2062 | 4.030% | | 4,777,891 | 4,790,185 |
| CSMC Trust(a) |
| CMO Series 2018-RPL8 Class A1 |
| 07/25/2058 | 4.125% | | 17,800,439 | 17,982,562 |
| CTS Corp.(a) |
| CMO Series 2015-6R Class 3A2 |
| 02/27/2036 | 3.750% | | 5,177,623 | 5,088,600 |
| Residential Mortgage-Backed Securities - Non-Agency (continued) |
| Issuer | Coupon
Rate | | Principal
Amount ($) | Value ($) |
| Deutsche Mortgage Securities, Inc. Mortgage Loan Trust |
| CMO Series 2003-1 Class 1A7 |
| 04/25/2033 | 5.500% | | 539,127 | 551,229 |
| Eagle RE Ltd.(a),(b) |
| CMO Series 2019-1 Class M1B |
1-month USD LIBOR + 1.800%
04/25/2029 | 3.945% | | 20,000,000 | 19,920,790 |
| FMC GMSR Issuer Trust(a),(g) |
| CMO Series 2019-GT1 Class A |
| 05/25/2024 | 5.070% | | 29,000,000 | 30,196,128 |
| GCAT LLC(a) |
| CMO Series 2018-1 Class A1 |
| 06/25/2048 | 3.844% | | 8,537,446 | 8,556,061 |
| GCAT LLC(a),(g) |
| CMO Series 2019-2 Class A1 |
| 06/25/2024 | 3.475% | | 15,224,527 | 15,229,064 |
| Grand Avenue Mortgage Loan Trust(a) |
| CMO Series 2017-RPL1 Class A1 |
| 08/25/2064 | 3.250% | | 17,634,360 | 17,725,581 |
| Homeward Opportunities Fund I Trust(a) |
| CMO Series 2018-1 Class M1 |
| 06/25/2048 | 4.548% | | 8,700,000 | 8,964,185 |
| Legacy Mortgage Asset Trust(a) |
| CMO Series 2017-GS1 Class A1 |
| 01/25/2057 | 3.500% | | 17,259,717 | 17,273,547 |
| Legacy Mortgage Asset Trust(a),(g) |
| CMO Series 2019-GS5 Class A1 |
| 05/25/2059 | 3.200% | | 12,432,903 | 12,457,237 |
| New Residential Mortgage LLC(a) |
| CMO Series 2018-FNT1 Class F |
| 05/25/2023 | 5.570% | | 21,284,962 | 21,609,922 |
| CMO Series 2018-FNT2 Class F |
| 07/25/2054 | 5.950% | | 8,846,497 | 8,846,444 |
| Subordinated CMO Series 2018-FNT1 Class D |
| 05/25/2023 | 4.690% | | 12,101,280 | 12,093,717 |
| New Residential Mortgage Loan Trust(a),(g) |
| CMO Series 2019-RPL1 Class A1 |
| 02/26/2024 | 4.335% | | 27,718,721 | 27,953,640 |
| NRZ Excess Spread-Collateralized Notes(a) |
| Series 2018-PLS1 Class C |
| 01/25/2023 | 3.981% | | 6,223,874 | 6,257,103 |
| Series 2018-PLS1 Class D |
| 01/25/2023 | 4.374% | | 12,447,748 | 12,527,784 |
| Subordinated CMO Series 2018-PLS2 Class D |
| 02/25/2023 | 4.593% | | 11,547,279 | 11,655,171 |
| Subordinated, CMO Series 2018-PLS2 Class C |
| 02/25/2023 | 4.102% | | 8,490,646 | 8,570,452 |
The accompanying Notes to Financial Statements are an integral part of this statement.
| 26 | Columbia Strategic Income Fund | Annual Report 2019 |
Portfolio of Investments (continued)
August 31, 2019
| Residential Mortgage-Backed Securities - Non-Agency (continued) |
| Issuer | Coupon
Rate | | Principal
Amount ($) | Value ($) |
| Oak Hill Advisors Residential Loan Trust(a) |
| CMO Series 2017-NPL1 Class A1 |
| 06/25/2057 | 3.000% | | 808,418 | 808,647 |
| CMO Series 2017-NPL2 Class A1 |
| 07/25/2057 | 3.000% | | 2,330,842 | 2,327,318 |
| Oaktown Re III Ltd.(a),(b) |
| CMO Series 2019-1A Class M1A |
1-month USD LIBOR + 1.400%
Floor 1.400%
07/25/2029 | 3.666% | | 5,577,000 | 5,576,990 |
| CMO Series 2019-1A Class M1B |
1-month USD LIBOR + 1.950%
Floor 1.950%
07/25/2029 | 4.095% | | 14,700,000 | 14,700,615 |
| PMT Credit Risk Transfer Trust(a),(b) |
| CMO Series 2019-1R Class A |
1-month USD LIBOR + 2.000%
Floor 2.000%
03/27/2024 | 4.241% | | 22,293,481 | 22,230,738 |
| Series 2019-2R Class A |
1-month USD LIBOR + 2.750%
Floor 2.750%
05/27/2023 | 4.991% | | 9,636,068 | 9,654,232 |
| PNMAC GMSR Issuer Trust(a),(b),(l) |
| CMO Series 2018-GT1 Class A |
1-month USD LIBOR + 2.850%
Floor 2.850%
02/25/2023 | 4.995% | | 35,000,000 | 35,030,748 |
| PNMAC GMSR Issuer Trust(a),(b) |
| CMO Series 2018-GT2 Class A |
1-month USD LIBOR + 2.650%
08/25/2025 | 4.795% | | 25,000,000 | 25,089,675 |
| Preston Ridge Partners Mortgage LLC(a) |
| CMO Series 2017-2A Class A1 |
| 09/25/2022 | 3.470% | | 13,613,181 | 13,642,938 |
| CMO Series 2019-2A Class A1 |
| 04/25/2024 | 3.967% | | 16,681,419 | 16,835,607 |
| Preston Ridge Partners Mortgage LLC(a),(g) |
| CMO Series 2017-3A Class A1 |
| 11/25/2022 | 3.470% | | 14,715,252 | 14,725,719 |
| CMO Series 2018-3A Class A1 |
| 10/25/2023 | 4.483% | | 18,047,247 | 18,222,452 |
| CMO Series 2019-1A Class A1 |
| 01/25/2024 | 4.500% | | 27,533,778 | 27,702,819 |
| PRPM LLC(a),(g) |
| CMO Series 2019-3A Class A1 |
| 07/25/2024 | 3.351% | | 24,729,862 | 24,762,466 |
| CMO Series 2019-3A Class A2 |
| 07/25/2024 | 4.458% | | 17,000,000 | 16,998,312 |
| Residential Mortgage-Backed Securities - Non-Agency (continued) |
| Issuer | Coupon
Rate | | Principal
Amount ($) | Value ($) |
| Radnor Re Ltd.(a),(b) |
| CMO Series 2019-1 Class M1B |
1-month USD LIBOR + 1.950%
Floor 1.950%
02/25/2029 | 4.095% | | 17,750,000 | 17,802,888 |
| Radnor RE Ltd.(a),(b) |
| CMO Series 2019-2 Class M1B |
1-month USD LIBOR + 1.750%
Floor 1.750%
06/25/2029 | 3.895% | | 10,000,000 | 9,999,978 |
| RBSSP Resecuritization Trust(a),(g) |
| CMO Series 2010-1 Class 3A2 |
| 08/26/2035 | 4.635% | | 5,971,788 | 6,074,273 |
| RCO V Mortgage LLC(a) |
| CMO Series 2018-1 Class A1 |
| 05/25/2023 | 4.000% | | 7,617,426 | 7,643,504 |
| CMO Series 2019-1 Class A1 |
| 05/24/2024 | 3.721% | | 24,356,376 | 24,474,312 |
| RCO V Mortgage LLC(a),(g) |
| CMO Series 2018-2 Class A1 |
| 10/25/2023 | 4.458% | | 9,806,336 | 9,849,484 |
| Toorak Mortgage Corp., Ltd.(a),(g) |
| CMO Series 2019-1 Class A1 |
| 03/25/2022 | 4.458% | | 8,500,000 | 8,569,208 |
| VCAT LLC(a) |
| CMO Series 2019-NPL1 Class A1 |
| 02/25/2049 | 4.360% | | 11,365,498 | 11,462,747 |
| Vericrest Opportunity Loan Transferee LXII LLC(a) |
| CMO Series 2017-NPL9 Class A1 |
| 09/25/2047 | 3.125% | | 5,153,889 | 5,148,889 |
| Vericrest Opportunity Loan Transferee LXX LLC(a),(g) |
| CMO Series 2018-NPL6 Class A1A |
| 09/25/2048 | 4.115% | | 14,722,225 | 14,790,621 |
| Vericrest Opportunity Loan Transferee LXXI LLC(a) |
| CMO Series 2018-NPL7 Class A1A |
| 09/25/2048 | 3.967% | | 7,537,081 | 7,583,525 |
| Vericrest Opportunity Loan Transferee LXXII LLC(a) |
| CMO Series 2018-NPL8 Class A1B |
| 10/26/2048 | 4.655% | | 7,200,000 | 7,272,561 |
| Vericrest Opportunity Loan Transferee LXXV LLC(a) |
| CMO Series 2019-NPL1 Class A1A |
| 01/25/2049 | 4.336% | | 21,841,277 | 21,967,958 |
| Vericrest Opportunity Loan Trust(a),(g) |
| CMO Series 2019-NPL5 Class A1A |
| 09/25/2049 | 3.352% | | 15,000,000 | 14,999,991 |
| Verus Securitization Trust(a) |
| CMO Series 2018-1 Class A3 |
| 02/25/2048 | 3.205% | | 7,197,690 | 7,206,625 |
The accompanying Notes to Financial Statements are an integral part of this statement.
Columbia Strategic Income Fund | Annual Report 2019
| 27 |
Portfolio of Investments (continued)
August 31, 2019
| Residential Mortgage-Backed Securities - Non-Agency (continued) |
| Issuer | Coupon
Rate | | Principal
Amount ($) | Value ($) |
| Verus Securitization Trust(a),(g) |
| CMO Series 2019-1 Class A1 |
| 02/25/2059 | 3.836% | | 5,780,246 | 5,863,736 |
| CMO Series 2019-2 Class A2 |
| 04/25/2059 | 3.345% | | 5,050,956 | 5,123,341 |
| CMO Series 2019-2 Class A3 |
| 04/25/2059 | 3.448% | | 4,862,785 | 4,932,512 |
| CMO Series 2019-2 Class M1 |
| 04/25/2059 | 3.781% | | 10,722,000 | 10,813,871 |
| CMO Series 2019-3 Class M1 |
| 07/25/2059 | 3.139% | | 11,490,000 | 11,555,981 |
| CMO Series 2019-INV1 Class A3 |
| 12/25/2059 | 3.658% | | 10,169,503 | 10,473,696 |
| Visio Trust(a),(g) |
| CMO Series 2019-1 Class A2 |
| 06/25/2054 | 3.673% | | 5,702,332 | 5,756,772 |
| CMO Series 2019-1 Class A3 |
| 06/25/2054 | 3.825% | | 4,882,465 | 4,928,860 |
Total Residential Mortgage-Backed Securities - Non-Agency
(Cost $991,546,012) | 999,167,198 |
|
| Senior Loans 7.0% |
| Borrower | Coupon
Rate | | Principal
Amount ($) | Value ($) |
| Aerospace & Defense 0.1% |
| Doncasters US Finance LLC(b),(n) |
| Tranche B Term Loan |
3-month USD LIBOR + 3.500%
Floor 1.000%
04/09/2020 | 5.830% | | 940,892 | 643,165 |
| TransDigm, Inc.(b),(n) |
| Tranche E Term Loan |
3-month USD LIBOR + 2.500%
05/30/2025 | 4.830% | | 1,592,434 | 1,575,140 |
| Tranche F Term Loan |
3-month USD LIBOR + 2.500%
06/09/2023 | 4.830% | | 967,747 | 960,131 |
| Wesco Aircraft Hardware Corp.(b),(n) |
| Tranche B Term Loan |
3-month USD LIBOR + 2.500%
Floor 0.750%
02/28/2021 | 4.620% | | 500,000 | 499,530 |
| Total | 3,677,966 |
| Airlines 0.0% |
| American Airlines, Inc.(b),(n) |
| Term Loan |
3-month USD LIBOR + 2.000%
10/10/2021 | 4.201% | | 969,697 | 968,078 |
| Senior Loans (continued) |
| Borrower | Coupon
Rate | | Principal
Amount ($) | Value ($) |
| United AirLines, Inc.(b),(n) |
| Term Loan |
3-month USD LIBOR + 1.750%
04/01/2024 | 3.862% | | 997,449 | 995,205 |
| WestJet Airlines Ltd.(b),(n),(o) |
| Tranche B Term Loan |
3-month USD LIBOR + 3.000%
Floor 1.000%
08/07/2026 | | | 475,000 | 476,040 |
| Total | 2,439,323 |
| Automotive 0.1% |
| Dayco Products LLC/Mark IV Industries, Inc.(b),(n) |
| Term Loan |
3-month USD LIBOR + 4.250%
05/19/2023 | 6.374% | | 757,563 | 707,374 |
| DexKo Global Inc.(b),(n) |
| Tranche B 1st Lien Term Loan |
3-month USD LIBOR + 3.500%
Floor 1.000%
07/24/2024 | 5.612% | | 986,852 | 971,230 |
| Horizon Global Corp.(b),(d),(n) |
| Term Loan |
3-month USD LIBOR + 6.000%
Floor 1.000%
06/30/2021 | 8.330% | | 152,405 | 156,978 |
| Navistar, Inc.(b),(n) |
| Tranche B Term Loan |
3-month USD LIBOR + 3.500%
11/06/2024 | 5.700% | | 687,025 | 684,023 |
| Panther BF Aggregator 2 LP(b),(n) |
| 1st Lien Term Loan |
3-month USD LIBOR + 3.500%
04/30/2026 | 5.612% | | 1,000,000 | 985,000 |
| Total | 3,504,605 |
| Brokerage/Asset Managers/Exchanges 0.1% |
| AlixPartners LLP(b),(n) |
| Term Loan |
3-month USD LIBOR + 2.750%
Floor 1.000%
04/04/2024 | 4.862% | | 1,000,000 | 1,000,540 |
| Blackstone CQP Holdco LP(b),(n) |
| Term Loan |
3-month USD LIBOR + 3.500%
09/30/2024 | 5.887% | | 1,500,000 | 1,499,535 |
| Greenhill & Co., Inc.(b),(n) |
| Term Loan |
3-month USD LIBOR + 3.250%
04/12/2024 | 5.445% | | 500,000 | 494,790 |
The accompanying Notes to Financial Statements are an integral part of this statement.
| 28 | Columbia Strategic Income Fund | Annual Report 2019 |
Portfolio of Investments (continued)
August 31, 2019
| Senior Loans (continued) |
| Borrower | Coupon
Rate | | Principal
Amount ($) | Value ($) |
| Victory Capital Holdings, Inc.(b),(n) |
| Term Loan |
3-month USD LIBOR + 3.250%
07/01/2026 | 5.569% | | 1,167,273 | 1,165,452 |
| Total | 4,160,317 |
| Building Materials 0.1% |
| Apex Tool Group LLC(b),(n) |
| Term Loan |
3-month USD LIBOR + 5.500%
Floor 1.250%
08/01/2024 | 7.612% | | 766,235 | 750,335 |
| Covia Holdings Corp.(b),(n) |
| Term Loan |
3-month USD LIBOR + 4.000%
Floor 1.000%
06/01/2025 | 6.313% | | 1,495,000 | 1,228,800 |
| Ply Gem Midco, Inc.(b),(n) |
| Term Loan |
3-month USD LIBOR + 3.750%
04/12/2025 | 5.951% | | 1,591,481 | 1,543,243 |
| QUIKRETE Holdings, Inc.(b),(n) |
| 1st Lien Term Loan |
3-month USD LIBOR + 2.750%
11/15/2023 | 4.862% | | 1,255,651 | 1,241,789 |
| SRS Distribution, Inc.(b),(n) |
| Term Loan |
3-month USD LIBOR + 3.250%
05/23/2025 | 5.362% | | 495,000 | 479,779 |
| TAMKO Building Products, Inc.(b),(n) |
| Term Loan |
3-month USD LIBOR + 3.250%
05/29/2026 | 5.546% | | 500,000 | 500,000 |
| US Silica Co.(b),(n) |
| Term Loan |
3-month USD LIBOR + 4.000%
Floor 1.000%
05/01/2025 | 6.125% | | 938,125 | 879,999 |
| Wilsonart LLC(b),(n) |
| Tranche D Term Loan |
3-month USD LIBOR + 3.250%
Floor 1.000%
12/19/2023 | 5.580% | | 997,456 | 970,654 |
| Total | 7,594,599 |
| Cable and Satellite 0.2% |
| Charter Communications Operating LLC/Safari LLC(b),(n) |
| Tranche B Term Loan |
3-month USD LIBOR + 2.000%
04/30/2025 | 4.330% | | 687,025 | 688,433 |
| Senior Loans (continued) |
| Borrower | Coupon
Rate | | Principal
Amount ($) | Value ($) |
| Cogeco Communications (U.S.A.) II LP(b),(n) |
| Tranche B Term Loan |
3-month USD LIBOR + 2.250%
01/03/2025 | 4.362% | | 1,412,784 | 1,406,483 |
| CSC Holdings LLC(b),(n) |
| Term Loan |
3-month USD LIBOR + 2.250%
01/15/2026 | 4.445% | | 497,500 | 494,600 |
3-month USD LIBOR + 2.500%
01/25/2026 | 4.695% | | 518,438 | 517,572 |
3-month USD LIBOR + 3.000%
04/15/2027 | 5.195% | | 498,750 | 500,246 |
| MCC Iowa LLC(b),(n) |
| Tranche M Term Loan |
3-month USD LIBOR + 2.000%
01/15/2025 | 4.140% | | 1,245,565 | 1,246,736 |
| Telesat Canada(b),(n) |
| Tranche B4 Term Loan |
3-month USD LIBOR + 2.500%
Floor 0.750%
11/17/2023 | 4.830% | | 1,452,267 | 1,450,060 |
| Virgin Media Bristol LLC(b),(n) |
| Tranche K Term Loan |
3-month USD LIBOR + 2.500%
01/15/2026 | 4.695% | | 2,175,000 | 2,173,325 |
| Total | 8,477,455 |
| Chemicals 0.5% |
| Alpha 3 BV/Atotech(b),(n) |
| Tranche B1 Term Loan |
3-month USD LIBOR + 3.000%
Floor 1.000%
01/31/2024 | 5.330% | | 573,512 | 555,951 |
| Aruba Investments, Inc./ANGUS Chemical Co.(b),(n) |
| Tranche B1 Term Loan |
3-month USD LIBOR + 3.250%
Floor 1.000%
02/02/2022 | 5.580% | | 972,152 | 961,215 |
| Ascend Performance Materials Operations LLC(b),(n),(o) |
| Tranche B Term Loan |
3-month USD LIBOR + 5.250%
Floor 1.000%
08/14/2026 | | | 950,000 | 948,812 |
| Axalta Coating Systems Dutch Holding BBV/U.S. Holdings, Inc.(b),(n) |
| Tranche B3 Term Loan |
3-month USD LIBOR + 1.750%
06/01/2024 | 4.080% | | 1,672,610 | 1,661,638 |
| Chemours Co. (The)(b),(n) |
| Tranche B2 Term Loan |
3-month USD LIBOR + 1.750%
04/03/2025 | 3.870% | | 1,753,731 | 1,691,264 |
The accompanying Notes to Financial Statements are an integral part of this statement.
Columbia Strategic Income Fund | Annual Report 2019
| 29 |
Portfolio of Investments (continued)
August 31, 2019
| Senior Loans (continued) |
| Borrower | Coupon
Rate | | Principal
Amount ($) | Value ($) |
| ColourOz Investment 1 GmbH(b),(d),(n) |
| Tranche C 1st Lien Term Loan |
3-month USD LIBOR + 3.000%
Floor 1.000%
09/07/2021 | 5.283% | | 162,466 | 128,348 |
| ColourOz Investment 2 LLC(b),(d),(n) |
| Tranche B2 1st Lien Term Loan |
3-month USD LIBOR + 3.000%
Floor 1.000%
09/07/2021 | 5.283% | | 982,784 | 776,399 |
| Element Solutions, Inc./MacDermid, Inc.(b),(n),(o) |
| Term Loan |
3-month USD LIBOR + 2.250%
01/30/2026 | 4.362% | | 1,746,250 | 1,744,067 |
| Hexion, Inc.(b),(n) |
| Term Loan |
3-month USD LIBOR + 3.500%
07/01/2026 | 5.820% | | 1,725,000 | 1,720,687 |
| Ineos US Finance LLC(b),(n) |
| Term Loan |
3-month USD LIBOR + 2.000%
04/01/2024 | 4.258% | | 1,760,900 | 1,727,690 |
| Invictus U.S. Newco LLC/SK Intermediate II SARL(b),(n) |
| 2nd Lien Term Loan |
3-month USD LIBOR + 6.750%
03/30/2026 | 8.896% | | 425,000 | 421,281 |
| Kraton Polymers LLC(b),(n) |
| Term Loan |
3-month USD LIBOR + 2.500%
Floor 1.000%
03/08/2025 | 4.612% | | 582,089 | 579,906 |
| Messer Industries GmbH(b),(n) |
| Tranche B1 Term Loan |
3-month USD LIBOR + 2.500%
03/01/2026 | 4.830% | | 1,995,000 | 1,980,756 |
| Minerals Technologies, Inc.(b),(n) |
| Tranche B1 Term Loan |
3-month USD LIBOR + 2.250%
Floor 0.750%
02/14/2024 | 4.455% | | 750,000 | 750,622 |
| Momentive Performance Materials, Inc.(b),(n) |
| 1st Lien Term Loan |
3-month USD LIBOR + 3.250%
05/15/2024 | 5.590% | | 1,500,000 | 1,468,125 |
| OCI Partners LP(b),(d),(n) |
| Term Loan |
3-month USD LIBOR + 4.000%
03/13/2025 | 6.330% | | 987,500 | 983,797 |
| PQ Corp.(b),(n) |
| Tranche B1 Term Loan |
3-month USD LIBOR + 2.500%
02/08/2025 | 4.756% | | 588,144 | 587,515 |
| Senior Loans (continued) |
| Borrower | Coupon
Rate | | Principal
Amount ($) | Value ($) |
| Ravago Holdings America, Inc.(b),(d),(n) |
| Term Loan |
3-month USD LIBOR + 2.750%
07/13/2023 | 4.870% | | 141,184 | 139,949 |
| Schenectady International Group, Inc.(b),(d),(n) |
| Term Loan |
3-month USD LIBOR + 4.750%
10/15/2025 | 7.063% | | 696,500 | 666,899 |
| Solenis Holdings LLC(b),(n) |
| 1st Lien Term Loan |
3-month USD LIBOR + 4.000%
06/26/2025 | 6.522% | | 715,938 | 693,264 |
| Starfruit Finco BV/US Holdco LLC/AzkoNobel(b),(n) |
| Term Loan |
3-month USD LIBOR + 3.250%
10/01/2025 | 5.463% | | 1,995,000 | 1,924,337 |
| Trinseo Materials Operating SCA(b),(n) |
| Term Loan |
3-month USD LIBOR + 2.000%
09/06/2024 | 4.112% | | 536,663 | 527,674 |
| Tronox Finance LLC(b),(n) |
| 1st Lien Term Loan |
3-month USD LIBOR + 2.750%
09/23/2024 | 4.947% | | 603,750 | 598,751 |
| Univar U.S.A., Inc.(b),(n) |
| Tranche B3 Term Loan |
3-month USD LIBOR + 2.250%
07/01/2024 | 4.362% | | 500,127 | 499,857 |
| Vantage Specialty Chemicals, Inc.(b),(d),(n) |
| 1st Lien Term Loan |
3-month USD LIBOR + 3.500%
Floor 1.000%
10/28/2024 | 5.618% | | 496,222 | 473,892 |
| 2nd Lien Term Loan |
3-month USD LIBOR + 8.250%
Floor 1.000%
10/27/2025 | 10.580% | | 600,000 | 570,000 |
| Total | 24,782,696 |
| Construction Machinery 0.1% |
| Altra Industrial Motion Corp.(b),(n) |
| Term Loan |
3-month USD LIBOR + 2.000%
10/01/2025 | 4.112% | | 694,030 | 690,851 |
| Columbus McKinnon Corp.(b),(n),(o) |
| Term Loan |
3-month USD LIBOR + 2.500%
Floor 1.000%
01/31/2024 | | | 1,000,000 | 998,750 |
The accompanying Notes to Financial Statements are an integral part of this statement.
| 30 | Columbia Strategic Income Fund | Annual Report 2019 |
Portfolio of Investments (continued)
August 31, 2019
| Senior Loans (continued) |
| Borrower | Coupon
Rate | | Principal
Amount ($) | Value ($) |
| Douglas Dynamics LLC(b),(n) |
| Term Loan |
3-month USD LIBOR + 3.000%
Floor 1.000%
12/31/2021 | 5.120% | | 234,433 | 233,847 |
| DXP Enterprises, Inc.(b),(n) |
| Term Loan |
3-month USD LIBOR + 4.750%
Floor 1.000%
08/29/2023 | 6.862% | | 786,000 | 786,983 |
| North American Lifting Holdings, Inc./TNT Crane & Rigging, Inc.(b),(n) |
| 1st Lien Term Loan |
3-month USD LIBOR + 4.500%
Floor 1.000%
11/27/2020 | 6.830% | | 908,456 | 842,029 |
| United Rentals, Inc.(b),(n) |
| Term Loan |
3-month USD LIBOR + 1.750%
10/31/2025 | 3.862% | | 496,250 | 497,104 |
| Vertiv Group Corp.(b),(n) |
| Tranche B Term Loan |
3-month USD LIBOR + 4.000%
Floor 1.000%
11/30/2023 | 6.330% | | 927,155 | 870,756 |
| Total | 4,920,320 |
| Consumer Cyclical Services 0.2% |
| Allied Universal Holdco LLC(b),(n),(o),(p) |
| Delayed Draw Term Loan |
3-month USD LIBOR + 4.250%
07/10/2026 | 6.507% | | 38,288 | 38,202 |
| Allied Universal Holdco LLC(b),(n) |
| Term Loan |
3-month USD LIBOR + 4.250%
07/10/2026 | 6.507% | | 386,712 | 385,842 |
| Cast & Crew Payroll LLC(b),(n) |
| 1st Lien Term Loan |
3-month USD LIBOR + 4.000%
02/09/2026 | 6.120% | | 1,000,000 | 1,002,810 |
| Creative Artists Agency LLC(b),(n) |
| Term Loan |
3-month USD LIBOR + 3.000%
02/15/2024 | 5.112% | | 997,468 | 996,720 |
| DTZ U.S. Borrower LLC/Cushman & Wakefield(b),(n) |
| Term Loan |
3-month USD LIBOR + 3.250%
08/21/2025 | 5.362% | | 1,117,806 | 1,116,700 |
| GoDaddy Operating Co., LLC/Finance Co., Inc.(b),(n) |
| Tranche B1 Term Loan |
3-month USD LIBOR + 2.000%
02/15/2024 | 4.112% | | 1,003,813 | 1,005,318 |
| Senior Loans (continued) |
| Borrower | Coupon
Rate | | Principal
Amount ($) | Value ($) |
| Staples, Inc.(b),(n) |
| Tranche B1 Term Loan |
3-month USD LIBOR + 5.000%
04/16/2026 | 7.197% | | 748,125 | 718,200 |
| Trans Union LLC(b),(n) |
| Tranche B3 Term Loan |
3-month USD LIBOR + 2.000%
04/10/2023 | 4.112% | | 1,314,166 | 1,314,876 |
| Uber Technologies, Inc.(b),(n) |
| Term Loan |
3-month USD LIBOR + 3.500%
07/13/2023 | 5.645% | | 2,251,132 | 2,242,285 |
| USS Ultimate Holdings, Inc./United Site Services, Inc.(b),(n) |
| 1st Lien Term Loan |
3-month USD LIBOR + 3.750%
Floor 1.000%
08/25/2024 | 5.950% | | 445,466 | 444,076 |
| Waterbridge Operating LLC(b),(n) |
| Term Loan |
3-month USD LIBOR + 5.750%
Floor 1.000%
06/22/2026 | 8.136% | | 1,200,000 | 1,146,000 |
| Web.com Group, Inc.(b),(n) |
| 1st Lien Term Loan |
3-month USD LIBOR + 3.750%
10/10/2025 | 5.945% | | 500,000 | 493,020 |
| 2nd Lien Term Loan |
3-month USD LIBOR + 7.750%
10/09/2026 | 9.945% | | 731,809 | 713,514 |
| West Corp.(b),(n) |
| Tranche B Term Loan |
3-month USD LIBOR + 4.000%
Floor 1.000%
10/10/2024 | 6.112% | | 904,543 | 806,336 |
| Total | 12,423,899 |
| Consumer Products 0.1% |
| Serta Simmons Bedding LLC(b),(n) |
| 1st Lien Term Loan |
3-month USD LIBOR + 3.500%
Floor 1.000%
11/08/2023 | 5.697% | | 1,162,576 | 771,823 |
| SIWF Holdings, Inc.(b),(n) |
| 1st Lien Term Loan |
3-month USD LIBOR + 4.250%
06/15/2025 | 6.395% | | 544,500 | 537,013 |
| Steinway Musical Instruments, Inc.(b),(n) |
| 1st Lien Term Loan |
3-month USD LIBOR + 3.750%
Floor 1.000%
02/14/2025 | 5.947% | | 1,481,250 | 1,453,476 |
The accompanying Notes to Financial Statements are an integral part of this statement.
Columbia Strategic Income Fund | Annual Report 2019
| 31 |
Portfolio of Investments (continued)
August 31, 2019
| Senior Loans (continued) |
| Borrower | Coupon
Rate | | Principal
Amount ($) | Value ($) |
| Weight Watchers International, Inc.(b),(n) |
| Term Loan |
3-month USD LIBOR + 4.750%
Floor 0.750%
11/29/2024 | 7.045% | | 546,390 | 545,538 |
| Total | 3,307,850 |
| Diversified Manufacturing 0.2% |
| Allnex & Cy SCA(b),(n) |
| Tranche B2 Term Loan |
3-month USD LIBOR + 3.250%
Floor 0.750%
09/13/2023 | 5.394% | | 534,468 | 515,762 |
| Tranche B3 Term Loan |
3-month USD LIBOR + 3.250%
Floor 0.750%
09/13/2023 | 5.394% | | 402,690 | 388,596 |
| Bright Bidco BV/Lumileds LLC(b),(n) |
| Tranche B Term Loan |
3-month USD LIBOR + 3.500%
Floor 1.000%
06/30/2024 | 5.759% | | 1,200,520 | 713,565 |
| Brookfield WEC Holdings, Inc./Westinghouse Electric Co., LLC(b),(n) |
| 1st Lien Term Loan |
3-month USD LIBOR + 3.500%
Floor 0.750%
08/01/2025 | 5.612% | | 1,723,875 | 1,724,496 |
| EWT Holdings III Corp.(b),(n) |
| 1st Lien Term Loan |
3-month USD LIBOR + 3.000%
Floor 1.000%
12/20/2024 | 5.112% | | 932,971 | 931,804 |
| Gardner Denver, Inc.(b),(n) |
| Tranche B1 Term Loan |
3-month USD LIBOR + 2.750%
07/30/2024 | 4.862% | | 1,518,497 | 1,521,822 |
| Gates Global LLC(b),(n) |
| Tranche B2 Term Loan |
3-month USD LIBOR + 2.750%
Floor 1.000%
04/01/2024 | 4.862% | | 1,715,755 | 1,671,334 |
| Welbilt, Inc.(b),(n) |
| Tranche B Term Loan |
3-month USD LIBOR + 2.500%
10/23/2025 | 4.612% | | 500,000 | 494,790 |
| Zekelman Industries, Inc.(b),(n) |
| Term Loan |
3-month USD LIBOR + 2.250%
Floor 1.000%
06/14/2021 | 4.362% | | 960,472 | 959,272 |
| Total | 8,921,441 |
| Senior Loans (continued) |
| Borrower | Coupon
Rate | | Principal
Amount ($) | Value ($) |
| Electric 0.4% |
| AES Corp. (The)(b),(n) |
| Term Loan |
3-month USD LIBOR + 1.750%
05/31/2022 | 3.874% | | 432,444 | 432,336 |
| Astoria Energy LLC(b),(n) |
| Tranche B Term Loan |
3-month USD LIBOR + 4.000%
Floor 1.000%
12/24/2021 | 6.120% | | 740,013 | 738,629 |
| Calpine Construction Finance Co., LP(b),(n) |
| Tranche B Term Loan |
3-month USD LIBOR + 2.500%
01/15/2025 | 4.612% | | 1,496,203 | 1,491,130 |
| Calpine Corp.(b),(n) |
| Term Loan |
3-month USD LIBOR + 2.500%
Floor 0.750%
01/15/2024 | 4.830% | | 528,859 | 527,981 |
| Carroll County Energy LLC(b),(n) |
| Term Loan |
3-month USD LIBOR + 3.500%
02/16/2026 | 5.830% | | 492,178 | 491,770 |
| CPV Shore Holdings LLC(b),(n) |
| Tranche B Term Loan |
3-month USD LIBOR + 3.750%
12/29/2025 | 5.870% | | 479,982 | 479,085 |
| Eastern Power LLC/Covert Midco LLC/TPF II LC LLC(b),(n) |
| Term Loan |
3-month USD LIBOR + 3.750%
Floor 1.000%
10/02/2023 | 5.862% | | 1,913,195 | 1,917,270 |
| Edgewater Generation LLC(b),(n) |
| Term Loan |
3-month USD LIBOR + 3.750%
12/13/2025 | 5.862% | | 1,743,744 | 1,719,767 |
| EFS Cogen Holdings I LLC(b),(n) |
| Tranche B Term Loan |
3-month USD LIBOR + 3.250%
Floor 1.000%
06/28/2023 | 5.521% | | 993,489 | 988,770 |
| Exgen Renewables IV LLC(b),(n) |
| Term Loan |
3-month USD LIBOR + 3.000%
Floor 1.000%
11/28/2024 | 5.130% | | 977,543 | 940,885 |
| Frontera Generation Holdings LLC(b),(n) |
| Term Loan |
3-month USD LIBOR + 4.250%
Floor 1.000%
05/02/2025 | 6.451% | | 816,750 | 773,871 |
The accompanying Notes to Financial Statements are an integral part of this statement.
| 32 | Columbia Strategic Income Fund | Annual Report 2019 |
Portfolio of Investments (continued)
August 31, 2019
| Senior Loans (continued) |
| Borrower | Coupon
Rate | | Principal
Amount ($) | Value ($) |
| Helix Gen Funding LLC(b),(n) |
| Term Loan |
3-month USD LIBOR + 3.750%
Floor 1.000%
06/03/2024 | 5.862% | | 750,000 | 716,093 |
| LMBE-MC Holdco II LLC(b),(d),(n) |
| Term Loan |
3-month USD LIBOR + 4.000%
Floor 1.000%
12/03/2025 | 6.330% | | 708,051 | 708,051 |
| MRP Generation Holdings LLC(b),(n) |
| Term Loan |
3-month USD LIBOR + 7.000%
Floor 1.000%
10/18/2022 | 9.330% | | 982,172 | 967,439 |
| Nautilus Power LLC(b),(n) |
| Term Loan |
3-month USD LIBOR + 4.250%
Floor 1.000%
05/16/2024 | 6.362% | | 1,697,884 | 1,690,668 |
| Oregon Clean Energy LLC(b),(n) |
| Tranche B Term Loan |
3-month USD LIBOR + 3.750%
Floor 1.000%
03/01/2026 | 5.862% | | 722,500 | 721,597 |
| Vistra Operations Co. LLC(b),(n) |
| Term Loan |
3-month USD LIBOR + 2.000%
08/04/2023 | 4.112% | | 257,399 | 257,543 |
3-month USD LIBOR + 2.000%
12/31/2025 | 4.147% | | 1,401,763 | 1,402,927 |
| West Deptford Energy LLC(b),(n) |
| Tranche B Term Loan |
3-month USD LIBOR + 3.750%
08/03/2026 | 6.003% | | 525,000 | 523,031 |
| WG Partners Acquisition LLC(b),(d),(n) |
| Tranche B Term Loan |
3-month USD LIBOR + 3.500%
11/15/2023 | 5.830% | | 616,431 | 604,102 |
| Total | 18,092,945 |
| Environmental 0.1% |
| Advanced Disposal Services, Inc.(b),(n) |
| Term Loan |
3-month USD LIBOR + 2.250%
Floor 0.750%
11/10/2023 | 4.385% | | 1,028,113 | 1,028,760 |
| EnergySolutions LLC/Envirocare of Utah LLC(b),(n) |
| Term Loan |
3-month USD LIBOR + 3.750%
Floor 1.000%
05/09/2025 | 6.080% | | 792,000 | 744,480 |
| Senior Loans (continued) |
| Borrower | Coupon
Rate | | Principal
Amount ($) | Value ($) |
| GFL Environmental, Inc.(b),(n) |
| Term Loan |
3-month USD LIBOR + 3.000%
Floor 1.000%
05/30/2025 | 5.112% | | 992,481 | 982,556 |
| NRC US Holding Co., LLC(b),(n) |
| Term Loan |
3-month USD LIBOR + 5.250%
Floor 1.000%
06/11/2024 | 7.580% | | 990,000 | 983,813 |
| US Ecology, Inc.(b),(n),(o) |
| Term Loan |
3-month USD LIBOR + 2.500%
08/14/2026 | | | 1,000,000 | 1,003,750 |
| Total | 4,743,359 |
| Finance Companies 0.1% |
| Avolon Borrower 1 LLC(b),(n) |
| Tranche B3 Term Loan |
3-month USD LIBOR + 1.750%
Floor 0.750%
01/15/2025 | 3.922% | | 1,948,697 | 1,951,542 |
| Ellie Mae, Inc.(b),(n) |
| 1st Lien Term Loan |
3-month USD LIBOR + 4.000%
04/17/2026 | 6.172% | | 1,000,000 | 995,630 |
| FinCo I LLC/Fortress Investment Group(b),(n) |
| Term Loan |
3-month USD LIBOR + 2.000%
12/27/2022 | 4.112% | | 1,702,100 | 1,704,755 |
| Total | 4,651,927 |
| Food and Beverage 0.2% |
| 8th Avenue Food & Provisions, Inc.(b),(n) |
| 1st Lien Term Loan |
3-month USD LIBOR + 3.750%
10/01/2025 | 5.963% | | 906,805 | 907,377 |
| 2nd Lien Term Loan |
3-month USD LIBOR + 7.750%
10/01/2026 | 9.963% | | 1,686,397 | 1,661,101 |
| Aramark Intermediate HoldCo Corp.(b),(n) |
| Tranche B2 Term Loan |
3-month USD LIBOR + 1.750%
03/28/2024 | 4.080% | | 750,000 | 748,875 |
| Dole Food Co., Inc.(b),(n) |
| Tranche B Term Loan |
3-month USD LIBOR + 2.750%
Floor 1.000%
04/06/2024 | 4.898% | | 1,610,964 | 1,589,490 |
The accompanying Notes to Financial Statements are an integral part of this statement.
Columbia Strategic Income Fund | Annual Report 2019
| 33 |
Portfolio of Investments (continued)
August 31, 2019
| Senior Loans (continued) |
| Borrower | Coupon
Rate | | Principal
Amount ($) | Value ($) |
| Hostess Brands LLC(b),(n) |
| Tranche B Term Loan |
3-month USD LIBOR + 2.250%
Floor 0.750%
08/03/2022 | 4.448% | | 388,112 | 387,142 |
| JBS U.S.A. Lux SA(b),(n) |
| Term Loan |
3-month USD LIBOR + 2.500%
05/01/2026 | 4.612% | | 1,770,563 | 1,772,776 |
| Post Holdings, Inc.(b),(n) |
| Tranche A Term Loan |
3-month USD LIBOR + 2.000%
05/24/2024 | 4.150% | | 1,000,000 | 999,860 |
| United Natural Foods, Inc.(b),(n) |
| Term Loan |
3-month USD LIBOR + 4.250%
10/22/2025 | 6.362% | | 796,000 | 658,029 |
| US Foods, Inc./US Foodservice, Inc.(b),(n) |
| Term Loan |
3-month USD LIBOR + 2.000%
Floor 0.750%
06/27/2023 | 4.112% | | 1,704,045 | 1,705,118 |
| Whatabrands LLC(b),(n) |
| Tranche B Term Loan |
3-month USD LIBOR + 3.250%
08/02/2026 | 3.250% | | 1,500,000 | 1,505,160 |
| Total | 11,934,928 |
| Foreign Agencies 0.0% |
| Oxea Holding Vier GmbH(b),(n) |
| Tranche B2 Term Loan |
3-month USD LIBOR + 3.500%
10/14/2024 | 5.750% | | 563,417 | 559,191 |
| Gaming 0.3% |
| Affinity Gaming(b),(n) |
| 2nd Lien Term Loan |
3-month USD LIBOR + 8.250%
Floor 1.000%
01/31/2025 | 10.362% | | 400,000 | 381,332 |
| Aristocrat Leisure Ltd.(b),(n) |
| Tranche B3 Term Loan |
3-month USD LIBOR + 1.750%
10/19/2024 | 4.028% | | 1,595,840 | 1,595,840 |
| Caesars Resort Collection LLC(b),(n) |
| Tranche B Term Loan |
3-month USD LIBOR + 2.750%
12/23/2024 | 4.862% | | 1,561,369 | 1,537,058 |
| CBAC Borrower LLC(b),(n) |
| Tranche B Term Loan |
3-month USD LIBOR + 4.000%
07/08/2024 | 6.112% | | 558,719 | 548,595 |
| Senior Loans (continued) |
| Borrower | Coupon
Rate | | Principal
Amount ($) | Value ($) |
| CCM Merger, Inc./MotorCity Casino Hotel(b),(n) |
| Term Loan |
3-month USD LIBOR + 2.250%
Floor 0.750%
08/06/2021 | 4.362% | | 1,143,837 | 1,143,838 |
| CityCenter Holdings LLC(b),(n) |
| Tranche B Term Loan |
3-month USD LIBOR + 2.250%
Floor 0.750%
04/18/2024 | 4.362% | | 708,513 | 707,960 |
| Eldorado Resorts, Inc.(b),(n) |
| Term Loan |
3-month USD LIBOR + 2.250%
04/17/2024 | 4.419% | | 1,885,027 | 1,878,543 |
| Gateway Casinos & Entertainment Ltd.(b),(n) |
| Term Loan |
3-month USD LIBOR + 3.000%
12/01/2023 | 5.330% | | 544,500 | 537,013 |
| Golden Nugget, Inc./Landry’s, Inc.(b),(n) |
| Tranche B Term Loan |
3-month USD LIBOR + 2.750%
Floor 0.750%
10/04/2023 | 4.893% | | 1,128,075 | 1,127,252 |
| Mohegan Tribal Gaming Authority(b),(n) |
| Tranche B Term Loan |
3-month USD LIBOR + 4.000%
Floor 1.000%
10/13/2023 | 6.112% | | 997,204 | 922,414 |
| PCI Gaming Authority(b),(n) |
| Tranche B Term Loan |
3-month USD LIBOR + 3.000%
05/29/2026 | 5.112% | | 525,000 | 527,378 |
| Scientific Games International, Inc.(b),(n) |
| Tranche B5 Term Loan |
3-month USD LIBOR + 2.750%
08/14/2024 | 4.889% | | 2,343,838 | 2,313,884 |
| Stars Group Holdings BV(b),(n) |
| Term Loan |
3-month USD LIBOR + 3.500%
07/10/2025 | 5.830% | | 1,995,424 | 2,000,293 |
| Wynn Resorts Ltd.(b),(n) |
| Term Loan |
3-month USD LIBOR + 2.250%
10/30/2024 | 4.370% | | 997,494 | 997,284 |
| Total | 16,218,684 |
| Health Care 0.4% |
| Acadia Healthcare Co., Inc.(b),(n) |
| Tranche B4 Term Loan |
3-month USD LIBOR + 2.500%
02/16/2023 | 4.612% | | 997,447 | 997,447 |
The accompanying Notes to Financial Statements are an integral part of this statement.
| 34 | Columbia Strategic Income Fund | Annual Report 2019 |
Portfolio of Investments (continued)
August 31, 2019
| Senior Loans (continued) |
| Borrower | Coupon
Rate | | Principal
Amount ($) | Value ($) |
| Air Methods Corp.(b),(n) |
| Term Loan |
3-month USD LIBOR + 3.500%
Floor 1.000%
04/22/2024 | 5.830% | | 661,500 | 544,362 |
| athenahealth, Inc.(b),(n) |
| Tranche B 1st Lien Term Loan |
3-month USD LIBOR + 4.500%
02/11/2026 | 6.681% | | 498,750 | 495,947 |
| Avantor Funding, Inc.(b),(n) |
| Tranche B2 Term Loan |
3-month USD LIBOR + 3.000%
Floor 1.000%
11/21/2024 | 5.112% | | 238,305 | 240,193 |
| Carestream Health, Inc.(b),(n) |
| 1st Lien Term Loan |
3-month USD LIBOR + 5.750%
Floor 1.000%
02/28/2021 | 7.862% | | 638,739 | 607,600 |
| Change Healthcare Holdings, Inc.(b),(n) |
| Term Loan |
3-month USD LIBOR + 2.500%
Floor 1.000%
03/01/2024 | 4.612% | | 1,007,063 | 995,310 |
| Davita, Inc.(b),(n),(o) |
| Tranche B Term Loan |
3-month USD LIBOR + 2.250%
08/12/2026 | | | 1,000,000 | 1,001,060 |
| Diplomat Pharmacy, Inc.(b),(n) |
| Tranche B Term Loan |
3-month USD LIBOR + 4.500%
Floor 1.000%
12/20/2024 | 6.620% | | 800,000 | 740,000 |
| Envision Healthcare Corp.(b),(n) |
| Term Loan |
3-month USD LIBOR + 3.750%
10/10/2025 | 5.862% | | 1,169,125 | 902,342 |
| Gentiva Health Services, Inc.(b),(n) |
| 1st Lien Term Loan |
3-month USD LIBOR + 3.750%
07/02/2025 | 5.875% | | 1,076,036 | 1,075,369 |
| HCA, Inc.(b),(n) |
| Tranche B10 Term Loan |
3-month USD LIBOR + 2.000%
03/13/2025 | 4.330% | | 739,388 | 741,354 |
| IQVIA, Inc./Quintiles IMS(b),(n) |
| Tranche B3 Term Loan |
3-month USD LIBOR + 1.750%
06/11/2025 | 4.008% | | 495,000 | 493,916 |
| Senior Loans (continued) |
| Borrower | Coupon
Rate | | Principal
Amount ($) | Value ($) |
| MPH Acquisition Holdings LLC(b),(n) |
| Term Loan |
3-month USD LIBOR + 2.750%
Floor 1.000%
06/07/2023 | 5.080% | | 1,101,441 | 1,022,963 |
| National Mentor Holdings, Inc./Civitas Solutions, Inc.(b),(n) |
| 1st Lien Term Loan |
3-month USD LIBOR + 4.250%
03/09/2026 | 6.370% | | 469,583 | 467,531 |
| Tranche C 1st Lien Term Loan |
3-month USD LIBOR + 4.250%
03/09/2026 | 6.370% | | 29,240 | 29,112 |
| Ortho-Clinical Diagnostics, Inc.(b),(n) |
| Term Loan |
3-month USD LIBOR + 3.250%
06/30/2025 | 5.563% | | 1,078,648 | 1,015,277 |
| Owens & Minor, Inc.(b),(n) |
| Tranche B Term Loan |
3-month USD LIBOR + 4.500%
04/30/2025 | 6.730% | | 1,014,750 | 858,479 |
| PAREXEL International Corp.(b),(n) |
| Term Loan |
3-month USD LIBOR + 2.750%
09/27/2024 | 4.862% | | 699,220 | 656,142 |
| Phoenix Guarantor, Inc./BrightSpring(b),(n) |
| 1st Lien Term Loan |
3-month USD LIBOR + 4.500%
03/05/2026 | 6.744% | | 500,000 | 497,375 |
| Pluto Acquisition I, Inc.(b),(n) |
| 1st Lien Term Loan |
3-month USD LIBOR + 5.000%
06/22/2026 | 7.278% | | 1,000,000 | 985,000 |
| RegionalCare Hospital Partners Holdings, Inc.(b),(n) |
| Tranche B 1st Lien Term Loan |
3-month USD LIBOR + 4.500%
11/16/2025 | 6.645% | | 1,995,000 | 1,987,519 |
| Select Medical Corp.(b),(n),(o) |
| Tranche B Term Loan |
3-month USD LIBOR + 2.500%
03/06/2025 | 4.850% | | 1,554,334 | 1,545,273 |
| Sterigenics-Nordion Holdings LLC(b),(n) |
| Term Loan |
3-month USD LIBOR + 3.000%
Floor 1.000%
05/15/2022 | 5.112% | | 1,091,634 | 1,069,801 |
| Team Health Holdings, Inc.(b),(n) |
| Term Loan |
3-month USD LIBOR + 2.750%
Floor 1.000%
02/06/2024 | 4.862% | | 488,750 | 392,344 |
| Total | 19,361,716 |
The accompanying Notes to Financial Statements are an integral part of this statement.
Columbia Strategic Income Fund | Annual Report 2019
| 35 |
Portfolio of Investments (continued)
August 31, 2019
| Senior Loans (continued) |
| Borrower | Coupon
Rate | | Principal
Amount ($) | Value ($) |
| Leisure 0.2% |
| Crown Finance US, Inc./Cineworld Group PLC(b),(n) |
| Term Loan |
3-month USD LIBOR + 2.250%
02/28/2025 | 4.362% | | 1,986,504 | 1,970,572 |
| Formula One Management Ltd.(b),(n) |
| Tranche B3 Term Loan |
3-month USD LIBOR + 2.500%
Floor 1.000%
02/01/2024 | 4.612% | | 1,098,574 | 1,074,548 |
| Life Time Fitness, Inc.(b),(n) |
| Term Loan |
3-month USD LIBOR + 2.750%
Floor 1.000%
06/10/2022 | 4.874% | | 1,602,634 | 1,593,947 |
| Metro-Goldwyn-Mayer, Inc.(b),(d),(n) |
| 1st Lien Term Loan |
3-month USD LIBOR + 2.500%
07/03/2025 | 4.620% | | 719,562 | 716,864 |
| Metro-Goldwyn-Mayer, Inc.(b),(n) |
| 2nd Lien Term Loan |
3-month USD LIBOR + 4.500%
Floor 1.000%
07/03/2026 | 6.620% | | 550,000 | 534,875 |
| NAI Entertainment Holdings LLC(b),(d),(n) |
| Tranche B Term Loan |
3-month USD LIBOR + 2.500%
Floor 1.000%
05/08/2025 | 4.620% | | 620,313 | 620,313 |
| Six Flags Theme Parks, Inc.(b),(n) |
| Tranche B Term Loan |
3-month USD LIBOR + 2.000%
04/17/2026 | 4.120% | | 500,000 | 500,315 |
| William Morris Endeavor Entertainment LLC/IMG Worldwide Holdings LLC(b),(n) |
| Tranche B1 1st Lien Term Loan |
3-month USD LIBOR + 2.750%
05/18/2025 | 4.870% | | 1,698,036 | 1,647,095 |
| Total | 8,658,529 |
| Lodging 0.0% |
| Four Seasons Holdings, Inc.(b),(n) |
| 1st Lien Term Loan |
3-month USD LIBOR + 2.000%
Floor 0.750%
11/30/2023 | 4.112% | | 997,442 | 998,270 |
| Hilton Worldwide Finance LLC(b),(n),(o) |
| Tranche B2 Term Loan |
3-month USD LIBOR + 1.750%
06/22/2026 | 3.895% | | 887,699 | 889,403 |
| Senior Loans (continued) |
| Borrower | Coupon
Rate | | Principal
Amount ($) | Value ($) |
| RHP Hotel Properties LP(b),(n) |
| Tranche B Term Loan |
3-month USD LIBOR + 2.000%
05/11/2024 | 4.330% | | 586,500 | 586,870 |
| Total | 2,474,543 |
| Media and Entertainment 0.5% |
| Cengage Learning, Inc.(b),(n) |
| Term Loan |
3-month USD LIBOR + 4.250%
Floor 1.000%
06/07/2023 | 6.362% | | 1,408,571 | 1,347,425 |
| Clear Channel Outdoor Holdings, Inc.(b),(n),(o) |
| Tranche B Term Loan |
3-month USD LIBOR + 3.500%
08/21/2026 | | | 1,000,000 | 998,750 |
| Cumulus Media New Holdings, Inc.(b),(n) |
| Term Loan |
3-month USD LIBOR + 4.500%
Floor 2.000%
05/13/2022 | 0.000% | | 1,000,000 | 1,002,500 |
| Diamond Sports Group LLC(b),(n) |
| Term Loan |
3-month USD LIBOR + 3.250%
08/24/2026 | 5.420% | | 1,750,000 | 1,750,000 |
| Emerald Expositions Holding, Inc.(b),(n) |
| Term Loan |
3-month USD LIBOR + 2.750%
05/22/2024 | 4.862% | | 1,684,836 | 1,642,715 |
| Entravision Communications Corp.(b),(n) |
| Tranche B Term Loan |
3-month USD LIBOR + 2.750%
11/29/2024 | 5.080% | | 547,605 | 533,230 |
| Gray Television, Inc.(b),(n) |
| Tranche C Term Loan |
3-month USD LIBOR + 2.500%
01/02/2026 | 4.832% | | 1,992,494 | 1,992,075 |
| iHeartCommunications, Inc.(b),(n) |
| Term Loan |
3-month USD LIBOR + 4.000%
05/01/2026 | 6.230% | | 234,001 | 234,528 |
| ION Media Networks, Inc.(b),(n) |
| Tranche B4 Term Loan |
3-month USD LIBOR + 3.000%
12/18/2024 | 5.125% | | 1,549,109 | 1,545,623 |
| Learfield Communications LLC(b),(n) |
| 1st Lien Term Loan |
3-month USD LIBOR + 3.250%
Floor 1.000%
12/01/2023 | 5.370% | | 1,179,960 | 1,181,801 |
The accompanying Notes to Financial Statements are an integral part of this statement.
| 36 | Columbia Strategic Income Fund | Annual Report 2019 |
Portfolio of Investments (continued)
August 31, 2019
| Senior Loans (continued) |
| Borrower | Coupon
Rate | | Principal
Amount ($) | Value ($) |
| Lions Gate Capital Holdings LLC(b),(n) |
| Tranche B Term Loan |
3-month USD LIBOR + 2.250%
03/24/2025 | 4.362% | | 1,703,978 | 1,697,588 |
| Meredith Corp.(b),(n) |
| Tranche B1 Term Loan |
3-month USD LIBOR + 2.750%
01/31/2025 | 4.862% | | 1,477,880 | 1,479,550 |
| Mission Broadcasting, Inc.(b),(n) |
| Tranche B3 Term Loan |
3-month USD LIBOR + 2.250%
01/17/2024 | 4.480% | | 106,077 | 105,584 |
| Montreign Operating Co., LLC(b),(n) |
| Tranche B Term Loan |
3-month USD LIBOR + 8.250%
Floor 1.000%
01/24/2023 | 10.374% | | 1,333,343 | 1,173,342 |
| Nascar Holdings, Inc.(b),(n),(o) |
| Term Loan |
3-month USD LIBOR + 2.750%
07/27/2026 | | | 750,000 | 753,593 |
| NEP Group, Inc.(b),(n) |
| 1st Lien Term Loan |
3-month USD LIBOR + 3.250%
10/20/2025 | 5.362% | | 997,494 | 971,559 |
| Nexstar Broadcasting, Inc.(b),(n),(o) |
| Tranche B Term Loan |
3-month USD LIBOR + 2.750%
06/19/2026 | | | 1,000,000 | 1,000,000 |
| Nexstar Broadcasting, Inc.(b),(n) |
| Tranche B3 Term Loan |
3-month USD LIBOR + 2.250%
01/17/2024 | 4.366% | | 532,494 | 530,023 |
| Nielsen Finance LLC/VNU, Inc.(b),(n) |
| Tranche B4 Term Loan |
3-month USD LIBOR + 2.000%
10/04/2023 | 4.211% | | 1,951,955 | 1,941,376 |
| Radio One, Inc.(b),(n) |
| Term Loan |
3-month USD LIBOR + 4.000%
Floor 1.000%
04/18/2023 | 6.120% | | 1,335,149 | 1,291,757 |
| Sinclair Television Group, Inc.(b),(n) |
| Tranche B Term Loan |
3-month USD LIBOR + 2.250%
01/03/2024 | 4.370% | | 1,496,164 | 1,491,301 |
| Tribune Media Co.(b),(n) |
| Tranche B Term Loan |
3-month USD LIBOR + 3.000%
Floor 0.750%
12/27/2020 | 5.112% | | 60,422 | 60,347 |
| Senior Loans (continued) |
| Borrower | Coupon
Rate | | Principal
Amount ($) | Value ($) |
| Tranche C Term Loan |
3-month USD LIBOR + 3.000%
Floor 0.750%
01/26/2024 | 5.112% | | 836,734 | 835,128 |
| Univision Communications, Inc.(b),(n) |
| 1st Lien Term Loan |
3-month USD LIBOR + 2.750%
Floor 1.000%
03/15/2024 | 4.862% | | 988,655 | 943,988 |
| Total | 26,503,783 |
| Metals and Mining 0.0% |
| Big River Steel LLC(b),(n) |
| Term Loan |
3-month USD LIBOR + 5.000%
Floor 1.000%
08/23/2023 | 7.330% | | 405,154 | 405,154 |
| Harsco Corp.(b),(n) |
| Tranche B2 Term Loan |
3-month USD LIBOR + 2.250%
Floor 1.000%
12/06/2024 | 4.375% | | 479,181 | 479,574 |
| Total | 884,728 |
| Midstream 0.1% |
| Equitrans Midstream Corp.(b),(n) |
| Term Loan |
3-month USD LIBOR + 4.500%
01/31/2024 | 6.612% | | 497,500 | 495,759 |
| GIP III Stetson I/II LP(b),(n) |
| Term Loan |
3-month USD LIBOR + 4.250%
07/18/2025 | 6.432% | | 1,693,242 | 1,614,405 |
| Lower Cadence Holdings LLC(b),(n) |
| Term Loan |
3-month USD LIBOR + 4.000%
05/22/2026 | 6.145% | | 650,000 | 632,534 |
| Prairie ECI Acquiror LP(b),(n) |
| Term Loan |
3-month USD LIBOR + 4.750%
03/11/2026 | 7.080% | | 1,496,250 | 1,458,096 |
| Southcross Energy Partners LP(b),(n),(q) |
| Debtor in Possession Letter of Credit Term Loan |
3-month USD LIBOR + 9.000%
10/01/2019 | 0.000% | | 216,240 | 218,402 |
| Debtor in Possession Term Loan |
3-month USD LIBOR + 10.000%
Floor 1.000%
10/01/2019 | 12.250% | | 117,949 | 119,129 |
The accompanying Notes to Financial Statements are an integral part of this statement.
Columbia Strategic Income Fund | Annual Report 2019
| 37 |
Portfolio of Investments (continued)
August 31, 2019
| Senior Loans (continued) |
| Borrower | Coupon
Rate | | Principal
Amount ($) | Value ($) |
| Delayed Draw Debtor in Possession Term Loan |
3-month USD LIBOR + 10.000%
10/01/2019 | 12.200% | | 116,960 | 118,130 |
| Southcross Energy Partners LP(b),(n) |
| Term Loan |
3-month USD LIBOR + 5.250%
10/01/2019 | 10.500% | | 200,207 | 191,197 |
3-month USD LIBOR + 5.250%
Floor 1.000%
10/01/2019 | 10.500% | | 72,056 | 68,814 |
3-month USD LIBOR + 6.250%
10/01/2019 | 10.500% | | 236,983 | 177,737 |
| Total | 5,094,203 |
| Oil Field Services 0.1% |
| Apergy Corp.(b),(n) |
| Term Loan |
3-month USD LIBOR + 2.500%
05/09/2025 | 4.625% | | 1,443,373 | 1,440,674 |
| Fieldwood Energy LLC(b),(n) |
| 1st Lien Term Loan |
3-month USD LIBOR + 5.250%
Floor 1.000%
04/11/2022 | 7.506% | | 275,952 | 241,803 |
| 2nd Lien Term Loan |
3-month USD LIBOR + 7.250%
Floor 1.000%
04/11/2023 | 9.506% | | 372,536 | 279,137 |
| MRC Global, Inc.(b),(n) |
| Term Loan |
3-month USD LIBOR + 3.000%
09/20/2024 | 5.112% | | 1,055,163 | 1,055,163 |
| Traverse Midstream Partners LLC(b),(n) |
| Term Loan |
3-month USD LIBOR + 4.000%
Floor 1.000%
09/27/2024 | 6.260% | | 1,717,050 | 1,616,895 |
| Total | 4,633,672 |
| Other Financial Institutions 0.1% |
| IRI Holdings, Inc.(b),(n) |
| 1st Lien Term Loan |
3-month USD LIBOR + 4.500%
12/01/2025 | 6.624% | | 1,246,250 | 1,186,530 |
| Lifescan Global Corp.(b),(n) |
| 1st Lien Term Loan |
3-month USD LIBOR + 6.000%
10/01/2024 | 8.660% | | 1,278,625 | 1,199,989 |
| Senior Loans (continued) |
| Borrower | Coupon
Rate | | Principal
Amount ($) | Value ($) |
| UFC Holdings LLC(b),(n) |
| 1st Lien Term Loan |
3-month USD LIBOR + 3.250%
Floor 1.000%
04/29/2026 | 5.370% | | 1,573,494 | 1,573,116 |
| Total | 3,959,635 |
| Other Industry 0.2% |
| Filtration Group Corp.(b),(n) |
| Term Loan |
3-month USD LIBOR + 3.000%
03/29/2025 | 5.112% | | 855,268 | 854,738 |
| Hamilton Holdco LLC/Reece International Pty Ltd.(b),(n) |
| Term Loan |
3-month USD LIBOR + 2.000%
07/02/2025 | 4.330% | | 997,481 | 997,481 |
| Harland Clarke Holdings Corp.(b),(n) |
| Term Loan |
3-month USD LIBOR + 4.750%
Floor 1.000%
11/03/2023 | 7.080% | | 1,207,284 | 935,645 |
| Hillman Group, Inc. (The)(b),(n) |
| Term Loan |
3-month USD LIBOR + 4.000%
05/30/2025 | 6.112% | | 668,250 | 646,866 |
| II-VI, Inc.(b),(n),(o) |
| Tranche B Term Loan |
3-month USD LIBOR + 3.500%
05/08/2026 | | | 1,500,000 | 1,492,500 |
| Interior Logic Group Holdings IV LLC(b),(n) |
| Term Loan |
3-month USD LIBOR + 4.000%
05/30/2025 | 6.330% | | 843,625 | 829,916 |
| Lightstone Holdco LLC(b),(n) |
| Tranche B Term Loan |
3-month USD LIBOR + 3.750%
Floor 1.000%
01/30/2024 | 5.862% | | 1,289,449 | 1,241,094 |
| Tranche C Term Loan |
3-month USD LIBOR + 3.750%
Floor 1.000%
01/30/2024 | 5.862% | | 72,727 | 70,000 |
| RBS Global, Inc./Rexnord LLC(b),(n) |
| Term Loan |
3-month USD LIBOR + 2.000%
08/21/2024 | 4.112% | | 1,000,000 | 1,003,380 |
| Titan Acquisition Ltd./Husky IMS International Ltd.(b),(n) |
| Term Loan |
3-month USD LIBOR + 3.000%
03/28/2025 | 5.112% | | 640,637 | 613,590 |
| Total | 8,685,210 |
The accompanying Notes to Financial Statements are an integral part of this statement.
| 38 | Columbia Strategic Income Fund | Annual Report 2019 |
Portfolio of Investments (continued)
August 31, 2019
| Senior Loans (continued) |
| Borrower | Coupon
Rate | | Principal
Amount ($) | Value ($) |
| Other REIT 0.1% |
| ESH Hospitality, Inc.(b),(n) |
| Term Loan |
3-month USD LIBOR + 2.000%
08/30/2023 | 4.112% | | 1,745,614 | 1,745,893 |
| VICI Properties 1 LLC(b),(n) |
| Tranche B Term Loan |
3-month USD LIBOR + 2.000%
12/20/2024 | 4.170% | | 1,811,364 | 1,813,954 |
| Total | 3,559,847 |
| Packaging 0.3% |
| Anchor Glass Container Corp.(b),(n) |
| 1st Lien Term Loan |
3-month USD LIBOR + 2.750%
Floor 1.000%
12/07/2023 | 4.967% | | 821,435 | 712,086 |
| Berry Global, Inc.(b),(n) |
| Tranche R Term Loan |
3-month USD LIBOR + 2.250%
01/19/2024 | 4.451% | | 1,202,721 | 1,201,651 |
| Tranche T Term Loan |
3-month USD LIBOR + 2.000%
01/06/2021 | 4.201% | | 91,328 | 91,328 |
| Consolidated Container Co., LLC(b),(n) |
| 1st Lien Term Loan |
3-month USD LIBOR + 2.750%
Floor 1.000%
05/22/2024 | 4.862% | | 442,142 | 435,143 |
| Flex Acquisition Co., Inc./Novolex(b),(n) |
| Term Loan |
3-month USD LIBOR + 3.000%
Floor 1.000%
12/29/2023 | 5.319% | | 1,232,494 | 1,171,830 |
| LABL, Inc.(b),(n) |
| Term Loan |
3-month USD LIBOR + 4.500%
07/01/2026 | 6.730% | | 775,000 | 772,822 |
| Packaging Coordinators Midco, Inc.(b),(n) |
| 1st Lien Term Loan |
3-month USD LIBOR + 4.000%
06/30/2023 | 6.330% | | 694,505 | 691,609 |
| Plastipak Holdings, Inc.(b),(n) |
| Tranche B Term Loan |
3-month USD LIBOR + 2.500%
10/14/2024 | 4.620% | | 1,726,912 | 1,720,005 |
| Printpack Holdings, Inc.(b),(n) |
| Term Loan |
3-month USD LIBOR + 3.000%
Floor 1.000%
07/26/2023 | 5.125% | | 750,630 | 744,061 |
| Senior Loans (continued) |
| Borrower | Coupon
Rate | | Principal
Amount ($) | Value ($) |
| ProAmpac PG Borrower LLC(b),(n) |
| 1st Lien Term Loan |
3-month USD LIBOR + 3.500%
Floor 1.000%
11/20/2023 | 5.703% | | 874,386 | 835,765 |
| 2nd Lien Term Loan |
3-month USD LIBOR + 8.500%
Floor 1.000%
11/18/2024 | 10.624% | | 700,000 | 663,831 |
| Reynolds Group Holdings, Inc.(b),(n) |
| Term Loan |
3-month USD LIBOR + 2.750%
Floor 1.000%
02/05/2023 | 4.862% | | 2,246,606 | 2,244,202 |
| Spectrum Holdings III Corp.(b),(d),(n) |
| 2nd Lien Term Loan |
3-month USD LIBOR + 7.000%
Floor 1.000%
01/31/2026 | 9.112% | | 425,000 | 388,875 |
| Tricorbraun Holdings, Inc.(b),(n) |
| 1st Lien Term Loan |
3-month USD LIBOR + 3.750%
Floor 1.000%
11/30/2023 | 6.018% | | 439,057 | 426,983 |
| Trident TPI Holdings, Inc.(b),(n) |
| Tranche B1 Term Loan |
3-month USD LIBOR + 3.250%
Floor 1.000%
10/17/2024 | 5.362% | | 709,175 | 676,376 |
| Twist Beauty International Holdings S.A.(b),(n) |
| Tranche B2 Term Loan |
3-month USD LIBOR + 3.000%
Floor 1.000%
04/22/2024 | 5.524% | | 591,263 | 573,524 |
| Total | 13,350,091 |
| Pharmaceuticals 0.2% |
| Bausch Health Companies, Inc.(b),(n) |
| Term Loan |
3-month USD LIBOR + 3.000%
06/02/2025 | 5.201% | | 1,553,773 | 1,555,529 |
3-month USD LIBOR + 2.750%
11/27/2025 | 4.951% | | 208,125 | 207,917 |
| Catalent Pharma Solutions, Inc.(b),(n) |
| Tranche B2 Term Loan |
3-month USD LIBOR + 2.250%
05/18/2026 | 4.362% | | 997,500 | 1,000,413 |
| Endo Finance Co. I SARL(b),(n) |
| Term Loan |
3-month USD LIBOR + 4.250%
Floor 0.750%
04/29/2024 | 6.375% | | 1,458,592 | 1,329,142 |
The accompanying Notes to Financial Statements are an integral part of this statement.
Columbia Strategic Income Fund | Annual Report 2019
| 39 |
Portfolio of Investments (continued)
August 31, 2019
| Senior Loans (continued) |
| Borrower | Coupon
Rate | | Principal
Amount ($) | Value ($) |
| Grifols Worldwide Operations Ltd.(b),(n) |
| Tranche B Term Loan |
3-month USD LIBOR + 2.250%
01/31/2025 | 4.385% | | 726,938 | 727,345 |
| Jaguar Holding Co. I LLC/Pharmaceutical Product Development LLC(b),(n) |
| Term Loan |
3-month USD LIBOR + 2.500%
Floor 1.000%
08/18/2022 | 4.612% | | 1,248,000 | 1,240,025 |
| Mallinckrodt International Finance SA(b),(n) |
| Term Loan |
3-month USD LIBOR + 3.000%
Floor 0.750%
02/24/2025 | 5.175% | | 969,938 | 742,002 |
| Nestlé Skin Health(b),(n),(o) |
| Term Loan |
3-month USD LIBOR + 4.250%
Floor 1.000% | 6.593% | | 600,000 | 599,550 |
| RPI Finance Trust(b),(n) |
| Tranche B6 Term Loan |
3-month USD LIBOR + 2.000%
03/27/2023 | 4.112% | | 1,397,260 | 1,399,202 |
| Total | 8,801,125 |
| Property & Casualty 0.2% |
| Alliant Holdings Intermediate LLC(b),(n) |
| Term Loan |
3-month USD LIBOR + 3.000%
05/09/2025 | 5.145% | | 573,138 | 556,351 |
| Asurion LLC(b),(n) |
| Tranche B2 2nd Lien Term Loan |
3-month USD LIBOR + 6.500%
08/04/2025 | 8.612% | | 725,000 | 735,012 |
| Tranche B4 Term Loan |
3-month USD LIBOR + 3.000%
08/04/2022 | 5.112% | | 1,211,529 | 1,211,747 |
| Tranche B6 Term Loan |
3-month USD LIBOR + 3.000%
11/03/2023 | 5.112% | | 405,041 | 405,114 |
| Tranche B7 Term Loan |
3-month USD LIBOR + 3.000%
11/03/2024 | 5.112% | | 997,481 | 997,481 |
| HUB International Ltd.(b),(n) |
| Term Loan |
3-month USD LIBOR + 3.000%
04/25/2025 | 5.267% | | 1,469,500 | 1,438,832 |
| Sedgwick Claims Management Services, Inc./Lightning Cayman Merger Sub, Ltd.(b),(n) |
| Term Loan |
3-month USD LIBOR + 3.250%
12/31/2025 | 5.362% | | 995,000 | 963,906 |
| Senior Loans (continued) |
| Borrower | Coupon
Rate | | Principal
Amount ($) | Value ($) |
| USI, Inc.(b),(n) |
| Term Loan |
3-month USD LIBOR + 3.000%
05/16/2024 | 5.330% | | 1,761,438 | 1,718,142 |
| Total | 8,026,585 |
| Restaurants 0.1% |
| Carrols Restaurant Group, Inc.(b),(n) |
| Term Loan |
3-month USD LIBOR + 3.250%
04/30/2026 | 5.400% | | 500,000 | 483,125 |
| IRB Holding Corp./Arby’s/Buffalo Wild Wings(b),(n) |
| Tranche B Term Loan |
3-month USD LIBOR + 3.250%
Floor 1.000%
02/05/2025 | 5.550% | | 618,056 | 613,229 |
| KFC Holding Co./Yum! Brands(b),(n) |
| Tranche B Term Loan |
3-month USD LIBOR + 1.750%
04/03/2025 | 3.932% | | 1,654,387 | 1,649,903 |
| New Red Finance, Inc./Burger King/Tim Hortons(b),(n) |
| Tranche B3 Term Loan |
3-month USD LIBOR + 2.250%
Floor 1.000%
02/16/2024 | 4.362% | | 2,952,949 | 2,947,162 |
| Total | 5,693,419 |
| Retailers 0.2% |
| Academy Ltd.(b),(n) |
| Term Loan |
3-month USD LIBOR + 4.000%
Floor 1.000%
07/01/2022 | 6.235% | | 479,418 | 319,014 |
| AI Aqua Merger Sub, Inc.(b),(n) |
| 1st Lien Term Loan |
3-month USD LIBOR + 3.250%
Floor 1.000%
12/13/2023 | 5.362% | | 343,875 | 327,111 |
| Tranche B1 1st Lien Term Loan |
3-month USD LIBOR + 3.250%
Floor 1.000%
12/13/2023 | 5.362% | | 634,863 | 605,901 |
| ASP Unifrax Holdings, Inc.(b),(n) |
| 1st Lien Term Loan |
3-month USD LIBOR + 3.750%
12/12/2025 | 6.080% | | 497,500 | 478,844 |
| Bass Pro Group LLC(b),(n) |
| Term Loan |
3-month USD LIBOR + 5.000%
Floor 0.750%
09/25/2024 | 7.112% | | 485,032 | 460,479 |
The accompanying Notes to Financial Statements are an integral part of this statement.
| 40 | Columbia Strategic Income Fund | Annual Report 2019 |
Portfolio of Investments (continued)
August 31, 2019
| Senior Loans (continued) |
| Borrower | Coupon
Rate | | Principal
Amount ($) | Value ($) |
| Belk, Inc.(b),(n) |
| 1st Lien Term Loan |
3-month USD LIBOR + 4.750%
Floor 1.000%
12/12/2022 | 6.944% | | 530,607 | 412,250 |
| BJ’s Wholesale Club, Inc.(b),(n) |
| Tranche B 1st Lien Term Loan |
3-month USD LIBOR + 2.750%
Floor 1.000%
02/03/2024 | 4.944% | | 842,009 | 842,186 |
| Burlington Coat Factory Warehouse Corp.(b),(n) |
| Tranche B5 Term Loan |
3-month USD LIBOR + 2.000%
Floor 0.750%
11/17/2024 | 4.200% | | 721,423 | 723,003 |
| Harbor Freight Tools U.S.A., Inc.(b),(n) |
| Term Loan |
3-month USD LIBOR + 2.500%
Floor 0.750%
08/18/2023 | 4.612% | | 1,929,828 | 1,854,449 |
| J.Crew Group, Inc.(b),(n) |
| Term Loan |
3-month USD LIBOR + 3.220%
Floor 1.000%
03/05/2021 | 5.405% | | 500,122 | 431,495 |
| JC Penney Corp., Inc.(b),(n) |
| Term Loan |
3-month USD LIBOR + 4.250%
Floor 1.000%
06/23/2023 | 6.394% | | 740,000 | 631,376 |
| Michaels Stores, Inc.(b),(n) |
| Tranche B Term Loan |
3-month USD LIBOR + 2.500%
Floor 1.000%
01/30/2023 | 4.626% | | 994,360 | 942,156 |
| Party City Holdings, Inc.(b),(n) |
| Term Loan |
3-month USD LIBOR + 2.500%
Floor 0.750%
08/19/2022 | 4.620% | | 1,144,845 | 1,129,996 |
| Total | 9,158,260 |
| Supermarkets 0.0% |
| Albertsons LLC(b),(n) |
| Tranche B7 Term Loan |
3-month USD LIBOR + 2.750%
Floor 0.750%
11/17/2025 | 4.862% | | 489,936 | 491,469 |
| Senior Loans (continued) |
| Borrower | Coupon
Rate | | Principal
Amount ($) | Value ($) |
| Tranche B8 Term Loan |
3-month USD LIBOR + 2.750%
Floor 0.750%
08/17/2026 | 4.862% | | 833,226 | 836,351 |
| Total | 1,327,820 |
| Technology 1.3% |
| Applied Systems, Inc.(b),(n) |
| 1st Lien Term Loan |
3-month USD LIBOR + 3.000%
Floor 1.000%
09/19/2024 | 5.330% | | 1,381,153 | 1,375,974 |
| Ascend Learning LLC(b),(n) |
| Term Loan |
3-month USD LIBOR + 3.000%
Floor 1.000%
07/12/2024 | 5.112% | | 1,368,016 | 1,354,336 |
| Avaya, Inc.(b),(n) |
| Tranche B Term Loan |
3-month USD LIBOR + 4.250%
12/15/2024 | 6.439% | | 2,005,913 | 1,968,302 |
| Boxer Parent Co., Inc./BMC Software, Inc.(b),(n) |
| Term Loan |
3-month USD LIBOR + 4.250%
10/02/2025 | 6.580% | | 996,247 | 939,521 |
| CDS US Intermediate Holdings, Inc.(b),(n) |
| 2nd Lien Term Loan |
3-month USD LIBOR + 8.250%
Floor 1.000%
07/10/2023 | 10.580% | | 1,000,000 | 905,000 |
| Celestica, Inc.(b),(n) |
| Tranche B Term Loan |
3-month USD LIBOR + 2.125%
06/27/2025 | 4.270% | | 993,741 | 963,928 |
| CommScope, Inc.(b),(n) |
| Term Loan |
3-month USD LIBOR + 3.250%
04/06/2026 | 5.362% | | 1,500,000 | 1,491,255 |
| Cyxtera DC Holdings, Inc.(b),(n) |
| 1st Lien Term Loan |
3-month USD LIBOR + 3.000%
Floor 1.000%
05/01/2024 | 5.210% | | 997,455 | 933,120 |
| Dawn Acquisition LLC(b),(n) |
| Term Loan |
3-month USD LIBOR + 3.750%
12/31/2025 | 6.080% | | 870,625 | 851,036 |
| Dell International LLC/EMC Corp.(b),(n) |
| Tranche B Term Loan |
3-month USD LIBOR + 2.000%
Floor 0.750%
09/07/2023 | 4.120% | | 2,882,497 | 2,888,175 |
The accompanying Notes to Financial Statements are an integral part of this statement.
Columbia Strategic Income Fund | Annual Report 2019
| 41 |
Portfolio of Investments (continued)
August 31, 2019
| Senior Loans (continued) |
| Borrower | Coupon
Rate | | Principal
Amount ($) | Value ($) |
| DigiCert Holdings, Inc.(b),(n),(o) |
| Tranche B Term Loan |
3-month USD LIBOR + 4.000%
08/07/2026 | | | 650,000 | 647,289 |
| DigiCert, Inc.(b),(n) |
| 1st Lien Term Loan |
3-month USD LIBOR + 4.000%
Floor 1.000%
10/31/2024 | 6.112% | | 668,263 | 668,263 |
| DigiCert, Inc.(b),(d),(n) |
| 2nd Lien Term Loan |
3-month USD LIBOR + 8.000%
Floor 1.000%
10/31/2025 | 10.112% | | 420,000 | 419,475 |
| Dun & Bradstreet Corp. (The)(b),(n) |
| Term Loan |
3-month USD LIBOR + 5.000%
02/06/2026 | 7.145% | | 750,000 | 751,560 |
| Evertec Group LLC(b),(n) |
| Tranche B Term Loan |
3-month USD LIBOR + 3.500%
11/27/2024 | 5.612% | | 1,497,500 | 1,500,315 |
| Greeneden US Holdings I LLC/Genesys Telecommunications Laboratories, Inc.(b),(n) |
| Tranche B3 Term Loan |
3-month USD LIBOR + 3.250%
12/01/2023 | 5.362% | | 1,839,629 | 1,817,094 |
| Hyland Software, Inc.(b),(n) |
| 1st Lien Term Loan |
3-month USD LIBOR + 3.250%
Floor 0.750%
07/01/2024 | 5.362% | | 688,986 | 685,975 |
| Infor US, Inc.(b),(n) |
| Tranche B6 Term Loan |
3-month USD LIBOR + 2.750%
Floor 1.000%
02/01/2022 | 5.080% | | 886,582 | 885,660 |
| Informatica LLC(b),(n) |
| Tranche B1 Term Loan |
3-month USD LIBOR + 3.250%
08/05/2022 | 5.362% | | 823,301 | 823,474 |
| ION Trading Technologies SARL(b),(n) |
| 1st Lien Term Loan |
3-month USD LIBOR + 4.000%
Floor 1.000%
11/21/2024 | 6.651% | | 1,493,978 | 1,432,979 |
| Leidos, Inc.(b),(n) |
| Tranche B Term Loan |
3-month USD LIBOR + 1.750%
08/22/2025 | 3.875% | | 785,714 | 786,555 |
| Senior Loans (continued) |
| Borrower | Coupon
Rate | | Principal
Amount ($) | Value ($) |
| MA FinanceCo LLC/Micro Focus International PLC(b),(n) |
| Tranche B2 Term Loan |
3-month USD LIBOR + 2.250%
11/19/2021 | 4.362% | | 342,594 | 339,473 |
| Tranche B3 Term Loan |
3-month USD LIBOR + 2.500%
06/21/2024 | 4.612% | | 212,735 | 206,353 |
| Maxar Technologies Ltd.(b),(n) |
| Tranche B Term Loan |
3-month USD LIBOR + 2.750%
10/04/2024 | 4.870% | | 985,000 | 860,644 |
| McAfee LLC(b),(n) |
| Tranche B Term Loan |
3-month USD LIBOR + 3.750%
09/30/2024 | 5.866% | | 1,020,148 | 1,020,403 |
| McDermott International, Inc.(b),(n) |
| Term Loan |
3-month USD LIBOR + 5.000%
Floor 1.000%
05/12/2025 | 7.112% | | 666,562 | 610,325 |
| Microchip Technology, Inc.(b),(n) |
| Term Loan |
3-month USD LIBOR + 2.000%
05/29/2025 | 4.120% | | 1,542,264 | 1,540,814 |
| Misys Ltd./Almonde/Tahoe/Finastra USA(b),(n) |
| 1st Lien Term Loan |
3-month USD LIBOR + 3.500%
Floor 1.000%
06/13/2024 | 5.696% | | 675,009 | 650,445 |
| MYOB US Borrower LLC(b),(n) |
| 1st Lien Term Loan |
3-month USD LIBOR + 4.000%
05/06/2026 | 6.112% | | 1,300,000 | 1,299,194 |
| Natel Engineering Co., Inc.(b),(n) |
| Term Loan |
3-month USD LIBOR + 5.000%
Floor 1.000%
04/30/2026 | 7.116% | | 598,500 | 598,500 |
| Neustar, Inc.(b),(n) |
| Tranche B4 1st Lien Term Loan |
3-month USD LIBOR + 3.500%
08/08/2024 | 5.612% | | 996,199 | 964,819 |
| Oberthur Technologies Holding SAS(b),(n) |
| Tranche B1 Term Loan |
3-month USD LIBOR + 3.750%
01/10/2024 | 6.080% | | 827,138 | 798,536 |
| ON Semiconductor Corp.(b),(n) |
| Tranche B3 Term Loan |
3-month USD LIBOR + 1.750%
03/31/2023 | 3.862% | | 2,000,000 | 1,994,580 |
The accompanying Notes to Financial Statements are an integral part of this statement.
| 42 | Columbia Strategic Income Fund | Annual Report 2019 |
Portfolio of Investments (continued)
August 31, 2019
| Senior Loans (continued) |
| Borrower | Coupon
Rate | | Principal
Amount ($) | Value ($) |
| Perspecta, Inc.(b),(n) |
| Tranche B Term Loan |
3-month USD LIBOR + 2.250%
05/30/2025 | 4.362% | | 816,750 | 816,750 |
| Plantronics, Inc.(b),(n) |
| Tranche B Term Loan |
3-month USD LIBOR + 2.500%
07/02/2025 | 4.612% | | 1,669,069 | 1,660,723 |
| Project Alpha Intermediate Holding, Inc.(b),(n) |
| Term Loan |
3-month USD LIBOR + 3.500%
Floor 1.000%
04/26/2024 | 5.810% | | 481,082 | 474,169 |
3-month USD LIBOR + 4.250%
04/26/2024 | 6.560% | | 1,472,776 | 1,468,181 |
| Rackspace Hosting, Inc.(b),(n),(o) |
| Tranche B 1st Lien Term Loan |
3-month USD LIBOR + 3.000%
Floor 1.000%
11/03/2023 | 5.287% | | 1,437,353 | 1,329,997 |
| Refinitiv US Holdings, Inc.(a),(b),(n) |
| Term Loan |
3-month USD LIBOR + 3.750%
10/01/2025 | 5.862% | | 1,992,494 | 2,001,340 |
| Riverbed Technology, Inc.(b),(n) |
| Term Loan |
3-month USD LIBOR + 3.250%
Floor 1.000%
04/24/2022 | 5.370% | | 909,378 | 755,165 |
| Rovi Solutions Corp./Guides, Inc.(b),(n) |
| Tranche B Term Loan |
3-month USD LIBOR + 2.500%
Floor 0.750%
07/02/2021 | 4.620% | | 750,000 | 739,372 |
| RP Crown Parent LLC(b),(n) |
| Term Loan |
3-month USD LIBOR + 2.750%
Floor 1.000%
10/12/2023 | 4.862% | | 498,721 | 497,225 |
| Sabre GLBL, Inc.(b),(n) |
| Tranche B Term Loan |
3-month USD LIBOR + 2.000%
02/22/2024 | 4.112% | | 1,872,147 | 1,873,195 |
| Science Applications International Corp.(b),(n) |
| Tranche B Term Loan |
3-month USD LIBOR + 1.750%
10/31/2025 | 3.862% | | 992,500 | 988,778 |
| SCS Holdings I, Inc.(b),(n) |
| Term Loan |
3-month USD LIBOR + 4.250%
07/01/2026 | 6.569% | | 875,000 | 874,177 |
| Senior Loans (continued) |
| Borrower | Coupon
Rate | | Principal
Amount ($) | Value ($) |
| Seattle SpinCo, Inc./Micro Focus International PLC(b),(n) |
| Term Loan |
3-month USD LIBOR + 2.500%
06/21/2024 | 4.612% | | 1,190,788 | 1,155,065 |
| Shutterfly, Inc.(b),(n) |
| Term Loan |
3-month USD LIBOR + 2.750%
08/17/2024 | 4.870% | | 355,691 | 355,321 |
| SS&C Technologies Holdings, Inc.(b),(n) |
| Tranche B3 Term Loan |
3-month USD LIBOR + 2.250%
04/16/2025 | 4.362% | | 315,226 | 315,541 |
| Tranche B4 Term Loan |
3-month USD LIBOR + 2.250%
04/16/2025 | 4.362% | | 213,013 | 213,226 |
| Tranche B5 Term Loan |
3-month USD LIBOR + 2.250%
04/16/2025 | 4.362% | | 1,994,945 | 1,994,666 |
| Tempo Acquisition LLC(b),(n) |
| Term Loan |
3-month USD LIBOR + 3.000%
05/01/2024 | 5.112% | | 1,928,455 | 1,926,855 |
| TIBCO Software, Inc.(b),(n) |
| Term Loan |
3-month USD LIBOR + 4.000%
06/30/2026 | 6.250% | | 1,000,000 | 999,060 |
| TTM Technologies, Inc.(b),(n) |
| Tranche B Term Loan |
3-month USD LIBOR + 2.500%
09/28/2024 | 4.730% | | 1,885,898 | 1,880,391 |
| Ultimate Software Group, Inc. (The)(b),(n) |
| 1st Lien Term Loan |
3-month USD LIBOR + 3.750%
05/04/2026 | 6.080% | | 2,000,000 | 2,003,580 |
| Verint Systems, Inc.(b),(n) |
| Term Loan |
3-month USD LIBOR + 2.000%
06/28/2024 | 4.230% | | 580,313 | 582,130 |
| Veritas US, Inc.(b),(n) |
| Tranche B Term Loan |
3-month USD LIBOR + 4.500%
Floor 1.000%
01/27/2023 | 6.648% | | 719,957 | 682,519 |
| Verscend Holding Corp.(b),(n) |
| Tranche B Term Loan |
3-month USD LIBOR + 4.500%
08/27/2025 | 6.612% | | 1,070,678 | 1,072,348 |
| Western Digital Corp.(b),(n) |
| Tranche B4 Term Loan |
3-month USD LIBOR + 1.750%
04/29/2023 | 3.862% | | 1,994,949 | 1,987,468 |
The accompanying Notes to Financial Statements are an integral part of this statement.
Columbia Strategic Income Fund | Annual Report 2019
| 43 |
Portfolio of Investments (continued)
August 31, 2019
| Senior Loans (continued) |
| Borrower | Coupon
Rate | | Principal
Amount ($) | Value ($) |
| Xperi Corp.(b),(n) |
| Tranche B1 Term Loan |
3-month USD LIBOR + 2.500%
Floor 0.750%
12/01/2023 | 4.612% | | 405,764 | 400,185 |
| Total | 64,020,799 |
| Transportation Services 0.0% |
| HFOTCO LLC(b),(n) |
| Tranche B Term Loan |
3-month USD LIBOR + 2.750%
06/26/2025 | 4.870% | | 1,497,487 | 1,489,072 |
| Wireless 0.1% |
| Cellular South, Inc.(b),(n) |
| Tranche B Term Loan |
3-month USD LIBOR + 2.250%
05/17/2024 | 4.508% | | 494,949 | 490,930 |
| Numericable US LLC(b),(n) |
| Tranche B11 Term Loan |
3-month USD LIBOR + 2.750%
07/31/2025 | 4.862% | | 977,500 | 942,242 |
| SBA Senior Finance II LLC(b),(n) |
| Term Loan |
3-month USD LIBOR + 2.000%
04/11/2025 | 4.120% | | 2,496,222 | 2,480,371 |
| Sprint Communications, Inc.(b),(n) |
| Term Loan |
3-month USD LIBOR + 2.500%
Floor 0.750%
02/02/2024 | 4.625% | | 1,031,659 | 1,024,241 |
3-month USD LIBOR + 3.000%
Floor 0.750%
02/02/2024 | 5.125% | | 997,494 | 994,691 |
| Switch Ltd.(b),(n) |
| Tranche B1 Term Loan |
3-month USD LIBOR + 2.250%
06/27/2024 | 4.362% | | 563,500 | 563,500 |
| Total | 6,495,975 |
| Wirelines 0.1% |
| CenturyLink, Inc.(b),(n) |
| Tranche B Term Loan |
3-month USD LIBOR + 2.750%
01/31/2025 | 4.862% | | 1,315,074 | 1,295,348 |
| Level 3 Financing, Inc.(b),(n) |
| Tranche B Term Loan |
3-month USD LIBOR + 2.250%
02/22/2024 | 4.362% | | 1,250,000 | 1,250,525 |
| Senior Loans (continued) |
| Borrower | Coupon
Rate | | Principal
Amount ($) | Value ($) |
| Southwire Co., LLC(b),(n) |
| Term Loan |
3-month USD LIBOR + 1.750%
05/19/2025 | 3.862% | | 990,000 | 985,357 |
| Windstream Services LLC(b),(n),(q) |
| Debtor in Possession Term Loan |
3-month USD LIBOR + 2.500%
02/26/2021 | 4.620% | | 1,000,000 | 1,002,500 |
| Windstream Services LLC(b),(n) |
| Tranche B6 Term Loan |
3-month USD LIBOR + 6.000%
Floor 0.750%
03/29/2021 | 10.250% | | 599,908 | 608,427 |
| Total | 5,142,157 |
Total Senior Loans
(Cost $354,536,273) | 347,732,674 |
|
| Treasury Bills(i) 0.1% |
| Issuer | Effective
Yield | | Principal
Amount ($) | Value ($) |
| Nigeria 0.1% |
| Nigeria OMO Bill |
| 02/20/2020 | 13.860% | NGN | 2,000,000,000 | 5,169,244 |
| Nigeria Treasury Bill |
| 01/16/2020 | 13.500% | NGN | 889,000,000 | 2,329,838 |
| Total | 7,499,082 |
Total Treasury Bills
(Cost $7,491,103) | 7,499,082 |
|
| U.S. Treasury Obligations 0.2% |
| Issuer | Coupon
Rate | | Principal
Amount ($) | Value ($) |
| U.S. Treasury |
| 08/15/2048 | 3.000% | | 8,265,000 | 10,134,956 |
Total U.S. Treasury Obligations
(Cost $8,197,847) | 10,134,956 |
| Warrants 0.0% |
| Issuer | Shares | Value ($) |
| Communication Services 0.0% |
| Media 0.0% |
| iHeartCommunications, Inc.(h) | 11,995 | 160,217 |
| Total Communication Services | 160,217 |
Total Warrants
(Cost $203,915) | 160,217 |
|
The accompanying Notes to Financial Statements are an integral part of this statement.
| 44 | Columbia Strategic Income Fund | Annual Report 2019 |
Portfolio of Investments (continued)
August 31, 2019
| Money Market Funds 5.0% |
| | Shares | Value ($) |
| Columbia Short-Term Cash Fund, 2.208%(r),(s) | 247,839,387 | 247,814,603 |
Total Money Market Funds
(Cost $247,826,407) | 247,814,603 |
Total Investments in Securities
(Cost: $5,440,669,575) | 5,554,960,870 |
| Other Assets & Liabilities, Net | | (551,817,548) |
| Net Assets | 5,003,143,322 |
At August 31, 2019, securities and/or cash totaling $43,406,053 were pledged as collateral.
Investments in derivatives
| Forward foreign currency exchange contracts |
Currency to
be sold | Currency to
be purchased | Counterparty | Settlement
date | Unrealized
appreciation ($) | Unrealized
depreciation ($) |
| 230,031,878 MXN | 11,979,579 USD | Morgan Stanley | 09/10/2019 | 513,766 | — |
| 18,480,458 EUR | 20,677,785 USD | UBS | 09/10/2019 | 357,195 | — |
| Total | | | | 870,961 | — |
| Long futures contracts |
| Description | Number of
contracts | Expiration
date | Trading
currency | Notional
amount | Value/Unrealized
appreciation ($) | Value/Unrealized
depreciation ($) |
| U.S. Treasury 2-Year Note | 8,374 | 12/2019 | USD | 1,809,765,332 | 898,748 | — |
| Short futures contracts |
| Description | Number of
contracts | Expiration
date | Trading
currency | Notional
amount | Value/Unrealized
appreciation ($) | Value/Unrealized
depreciation ($) |
| Euro-Bobl | (2,049) | 09/2019 | EUR | (279,135,270) | — | (5,548,306) |
| U.S. Treasury 10-Year Note | (2,738) | 12/2019 | USD | (360,645,938) | — | (775,949) |
| U.S. Treasury 5-Year Note | (848) | 12/2019 | USD | (101,740,125) | — | (160,739) |
| U.S. Ultra Treasury Bond | (641) | 12/2019 | USD | (126,557,438) | — | (1,418,653) |
| Total | | | | | — | (7,903,647) |
| Call option contracts written |
| Description | Counterparty | Trading
currency | Notional
amount | Number of
contracts | Exercise
price/Rate | Expiration
date | Premium
received ($) | Value ($) |
| 10-Year OTC interest rate swap with Citi to receive 3-Month USD LIBOR BBA and pay exercise rate | Citi | USD | (380,000,000) | (380,000,000) | 1.65 | 11/04/2019 | (2,698,000) | (11,229,304) |
| 10-Year OTC interest rate swap with Citi to receive 3-Month USD LIBOR BBA and pay exercise rate | Citi | USD | (210,000,000) | (210,000,000) | 1.15 | 11/29/2019 | (1,701,000) | (1,543,605) |
| 10-Year OTC interest rate swap with Morgan Stanley to receive 3-Month USD LIBOR BBA and pay exercise rate | Morgan Stanley | USD | (210,000,000) | (210,000,000) | 1.15 | 11/29/2019 | (1,785,000) | (1,543,605) |
| Total | | | | | | | (6,184,000) | (14,316,514) |
The accompanying Notes to Financial Statements are an integral part of this statement.
Columbia Strategic Income Fund | Annual Report 2019
| 45 |
Portfolio of Investments (continued)
August 31, 2019
| Interest rate swap contracts |
| Fund receives | Fund pays | Payment
frequency | Counterparty | Maturity
date | Notional
currency | Notional
amount | Value
($) | Periodic
payments
receivable
(payable)
($) | Upfront
payments
($) | Upfront
receipts
($) | Unrealized
appreciation
($) | Unrealized
depreciation
($) |
| U.S. CPI Urban Consumers NSA | Fixed rate of 2.193% | Receives at Maturity, Pays at Maturity | Goldman Sachs International | 11/23/2028 | USD | 45,300,000 | (1,935,042) | — | — | — | — | (1,935,042) |
| U.S. CPI Urban Consumers NSA | Fixed rate of 2.017% | Receives at Maturity, Pays at Maturity | Goldman Sachs International | 07/18/2029 | USD | 48,500,000 | (1,085,078) | — | — | — | — | (1,085,078) |
| U.S. CPI Urban Consumers NSA | Fixed rate of 2.017% | Receives at Maturity, Pays at Maturity | JPMorgan | 12/21/2028 | USD | 41,750,000 | (1,029,132) | — | — | — | — | (1,029,132) |
| U.S. CPI Urban Consumers NSA | Fixed rate of 1.953% | Receives at Maturity, Pays at Maturity | JPMorgan | 01/08/2029 | USD | 42,000,000 | (745,808) | — | — | — | — | (745,808) |
| U.S. CPI Urban Consumers NSA | Fixed rate of 1.900% | Receives at Maturity, Pays at Maturity | JPMorgan | 06/27/2029 | USD | 47,700,000 | (468,103) | — | — | — | — | (468,103) |
| U.S. CPI Urban Consumers NSA | Fixed rate of 2.193% | Receives at Maturity, Pays at Maturity | Morgan Stanley | 12/07/2028 | USD | 45,300,000 | (1,945,971) | — | — | — | — | (1,945,971) |
| Total | | | | | | | (7,209,134) | — | — | — | — | (7,209,134) |
| Cleared interest rate swap contracts |
| Fund receives | Fund pays | Payment
frequency | Counterparty | Maturity
date | Notional
currency | Notional
amount | Value
($) | Upfront
payments
($) | Upfront
receipts
($) | Unrealized
appreciation
($) | Unrealized
depreciation
($) |
| 28-Day MXN TIIE-Banxico | Fixed rate of 8.100% | Receives at Maturity, Pays at Maturity | Morgan Stanley | 05/31/2021 | MXN | 1,993,000,000 | (1,632,161) | — | — | — | (1,632,161) |
| 28-Day MXN TIIE-Banxico | Fixed rate of 8.130% | Receives at Maturity, Pays at Maturity | Morgan Stanley | 06/01/2021 | MXN | 1,540,987,865 | (1,304,435) | — | — | — | (1,304,435) |
| Fixed rate of 6.230% | 28-Day MXN TIIE-Banxico | Receives Monthly, Pays Monthly | Morgan Stanley | 01/09/2026 | MXN | 580,000,000 | (809,776) | — | — | — | (809,776) |
| Fixed rate of 5.985% | 28-Day MXN TIIE-Banxico | Receives Monthly, Pays Monthly | Morgan Stanley | 01/21/2026 | MXN | 211,000,000 | (446,140) | — | — | — | (446,140) |
| 3-Month USD LIBOR | Fixed rate of 1.781% | Receives Quarterly, Pays Semi-annually | Morgan Stanley | 08/09/2049 | USD | 53,500,000 | (3,026,658) | — | — | — | (3,026,658) |
| Total | | | | | | | (7,219,170) | — | — | — | (7,219,170) |
| Credit default swap contracts - buy protection |
Reference
entity | Counterparty | Maturity
date | Pay
fixed
rate
(%) | Payment
frequency | Notional
currency | Notional
amount | Value
($) | Periodic
payments
receivable
(payable)
($) | Upfront
payments
($) | Upfront
receipts
($) | Unrealized
appreciation
($) | Unrealized
depreciation
($) |
| Markit CMBX North America Index, Series 10 BBB- | Citi | 11/17/2059 | 3.000 | Monthly | USD | 13,000,000 | 438,750 | (6,500) | 553,808 | — | — | (121,558) |
| Markit CMBX North America Index, Series 10 BBB- | Citi | 11/17/2059 | 3.000 | Monthly | USD | 24,000,000 | 810,000 | (12,000) | 1,396,276 | — | — | (598,276) |
| Markit CMBX North America Index, Series 10 BBB- | Citi | 11/17/2059 | 3.000 | Monthly | USD | 24,000,000 | 810,000 | (12,000) | 1,438,297 | — | — | (640,297) |
| Markit CMBX North America Index, Series 11 BBB- | Citi | 11/18/2054 | 3.000 | Monthly | USD | 10,500,000 | 567,656 | (5,250) | 599,590 | — | — | (37,184) |
The accompanying Notes to Financial Statements are an integral part of this statement.
| 46 | Columbia Strategic Income Fund | Annual Report 2019 |
Portfolio of Investments (continued)
August 31, 2019
| Credit default swap contracts - buy protection (continued) |
Reference
entity | Counterparty | Maturity
date | Pay
fixed
rate
(%) | Payment
frequency | Notional
currency | Notional
amount | Value
($) | Periodic
payments
receivable
(payable)
($) | Upfront
payments
($) | Upfront
receipts
($) | Unrealized
appreciation
($) | Unrealized
depreciation
($) |
| Markit CMBX North America Index, Series 11 BBB- | Citi | 11/18/2054 | 3.000 | Monthly | USD | 24,000,000 | 1,297,500 | (12,000) | 1,353,206 | — | — | (67,706) |
| Markit CMBX North America Index, Series 11 BBB- | JPMorgan | 11/18/2054 | 3.000 | Monthly | USD | 24,000,000 | 1,297,500 | (12,000) | 1,258,059 | — | 27,441 | — |
| Total | | | | | | | 5,221,406 | (59,750) | 6,599,236 | — | 27,441 | (1,465,021) |
| Cleared credit default swap contracts - buy protection |
Reference
entity | Counterparty | Maturity
date | Pay
fixed
rate
(%) | Payment
frequency | Notional
currency | Notional
amount | Value
($) | Upfront
payments
($) | Upfront
receipts
($) | Unrealized
appreciation
($) | Unrealized
depreciation
($) |
| Markit CDX North America High Yield Index, Series 32 | Morgan Stanley | 06/20/2024 | 5.000 | Quarterly | USD | 331,471,800 | (7,460,075) | — | — | — | (7,460,075) |
| Reference index and values for swap contracts as of period end |
| Reference index | | Reference rate |
| 28-Day MXN TIIE-Banxico | Interbank Equilibrium Interest Rate | 8.260% |
| 3-Month USD LIBOR | London Interbank Offered Rate | 2.138% |
| U.S. CPI Urban Consumers NSA | United States Consumer Price All Urban Non-Seasonally Adjusted Index | 1.750% |
Notes to Portfolio of Investments
| (a) | Represents privately placed and other securities and instruments exempt from Securities and Exchange Commission registration (collectively, private placements), such as Section 4(a)(2) and Rule 144A eligible securities, which are often sold only to qualified institutional buyers. The Fund may invest in private placements determined to be liquid as well as those determined to be illiquid. Private placements may be determined to be liquid under guidelines established by the Fund’s Board of Trustees. At August 31, 2019, the total value of these securities amounted to $2,791,315,418, which represents 55.79% of total net assets. |
| (b) | Variable rate security. The interest rate shown was the current rate as of August 31, 2019. |
| (c) | Represents fair value as determined in good faith under procedures approved by the Board of Trustees. At August 31, 2019, the total value of these securities amounted to $24,565,127, which represents 0.49% of total net assets. |
| (d) | Valuation based on significant unobservable inputs. |
| (e) | Represents shares owned in the residual interest of an asset-backed securitization. |
| (f) | Zero coupon bond. |
| (g) | Variable or floating rate security, the interest rate of which adjusts periodically based on changes in current interest rates and prepayments on the underlying pool of assets. The interest rate shown was the current rate as of August 31, 2019. |
| (h) | Non-income producing investment. |
| (i) | Principal amounts are denominated in United States Dollars unless otherwise noted. |
| (j) | Represents a variable rate security with a step coupon where the rate adjusts according to a schedule for a series of periods, typically lower for an initial period and then increasing to a higher coupon rate thereafter. The interest rate shown was the current rate as of August 31, 2019. |
| (k) | Principal and interest may not be guaranteed by the government. |
| (l) | Represents interest only securities which have the right to receive the monthly interest payments on an underlying pool of mortgage loans. |
| (m) | Represents a security purchased on a when-issued basis. |
| (n) | The stated interest rate represents the weighted average interest rate at August 31, 2019 of contracts within the senior loan facility. Interest rates on contracts are primarily determined either weekly, monthly or quarterly by reference to the indicated base lending rate and spread and the reset period. These base lending rates are primarily the London Interbank Offered Rate (“LIBOR”) and other short-term rates. Base lending rates may be subject to a floor or minimum rate. The interest rate for senior loans purchased on a when-issued or delayed delivery basis will be determined upon settlement, therefore no interest rate is disclosed. Senior loans often require prepayments from excess cash flows or permit the borrowers to repay at their election. The degree to which borrowers repay, cannot be predicted with accuracy. As a result, remaining maturities of senior loans may be less than the stated maturities. |
| (o) | Represents a security purchased on a forward commitment basis. |
The accompanying Notes to Financial Statements are an integral part of this statement.
Columbia Strategic Income Fund | Annual Report 2019
| 47 |
Portfolio of Investments (continued)
August 31, 2019
Notes to Portfolio of Investments (continued)
| (p) | At August 31, 2019, the Fund had unfunded senior loan commitments pursuant to the terms of the loan agreement. The Fund receives a stated coupon rate until the borrower draws on the loan commitment, at which time the rate will become the stated rate in the loan agreement. |
| Borrower | Unfunded Commitment ($) |
Allied Universal Holdco LLC
Delayed Draw Term Loan
07/10/2026 6.507% | 37,905 |
| (q) | The borrower filed for protection under Chapter 11 of the U.S. Federal Bankruptcy Code. |
| (r) | The rate shown is the seven-day current annualized yield at August 31, 2019. |
| (s) | As defined in the Investment Company Act of 1940, an affiliated company is one in which the Fund owns 5% or more of the company’s outstanding voting securities, or a company which is under common ownership or control with the Fund. Holdings and transactions in these affiliated companies during the year ended August 31, 2019 are as follows: |
| Issuer | Beginning
shares | Shares
purchased | Shares
sold | Ending
shares | Realized gain
(loss) —
affiliated
issuers ($) | Net change in
unrealized
appreciation
(depreciation) —
affiliated
issuers ($) | Dividends —
affiliated
issuers ($) | Value —
affiliated
issuers
at end of
period ($) |
| Columbia Short-Term Cash Fund, 2.208% |
| | 266,189,567 | 1,676,462,534 | (1,694,812,714) | 247,839,387 | (9,748) | 6,359 | 4,724,468 | 247,814,603 |
Abbreviation Legend
| CMO | Collateralized Mortgage Obligation |
| PIK | Payment In Kind |
| STRIPS | Separate Trading of Registered Interest and Principal Securities |
Currency Legend
| DOP | Dominican Republic Peso |
| EUR | Euro |
| MXN | Mexican Peso |
| NGN | Nigerian Naira |
| RUB | Russian Ruble |
| USD | US Dollar |
| ZAR | South African Rand |
Fair value measurements
The Fund categorizes its fair value measurements according to a three-level hierarchy that maximizes the use of observable inputs and minimizes the use of unobservable inputs by prioritizing that the most observable input be used when available. Observable inputs are those that market participants would use in pricing an investment based on market data obtained from sources independent of the reporting entity. Unobservable inputs are those that reflect the Fund’s assumptions about the information market participants would use in pricing an investment. An investment’s level within the fair value hierarchy is based on the lowest level of any input that is deemed significant to the asset’s or liability’s fair value measurement. The input levels are not necessarily an indication of the risk or liquidity associated with investments at that level. For example, certain U.S. government securities are generally high quality and liquid, however, they are reflected as Level 2 because the inputs used to determine fair value may not always be quoted prices in an active market.
Fair value inputs are summarized in the three broad levels listed below:
| ■ | Level 1 — Valuations based on quoted prices for investments in active markets that the Fund has the ability to access at the measurement date. Valuation adjustments are not applied to Level 1 investments. |
| ■ | Level 2 — Valuations based on other significant observable inputs (including quoted prices for similar securities, interest rates, prepayment speeds, credit risks, etc.). |
| ■ | Level 3 — Valuations based on significant unobservable inputs (including the Fund’s own assumptions and judgment in determining the fair value of investments). |
Inputs that are used in determining fair value of an investment may include price information, credit data, volatility statistics, and other factors. These inputs can be either observable or unobservable. The availability of observable inputs can vary between investments, and is affected by various factors such as the type of investment, and the volume and level of activity for that investment or similar investments in the marketplace. The inputs will be considered by the Investment Manager, along with any other relevant factors in the calculation of an investment’s fair value. The Fund uses prices and inputs that are current as of the measurement date, which may include periods of market dislocations. During these periods, the availability of prices and inputs may be reduced for many investments. This condition could cause an investment to be reclassified between the various levels within the hierarchy.
The accompanying Notes to Financial Statements are an integral part of this statement.
| 48 | Columbia Strategic Income Fund | Annual Report 2019 |
Portfolio of Investments (continued)
August 31, 2019
Fair value measurements (continued)
Investments falling into the Level 3 category are primarily supported by quoted prices from brokers and dealers participating in the market for those investments. However, these may be classified as Level 3 investments due to lack of market transparency and corroboration to support these quoted prices. Additionally, valuation models may be used as the pricing source for any remaining investments classified as Level 3. These models may rely on one or more significant unobservable inputs and/or significant assumptions by the Investment Manager. Inputs used in valuations may include, but are not limited to, financial statement analysis, capital account balances, discount rates and estimated cash flows, and comparable company data.
Under the direction of the Fund’s Board of Trustees (the Board), the Investment Manager’s Valuation Committee (the Committee) is responsible for overseeing the valuation procedures approved by the Board. The Committee consists of voting and non-voting members from various groups within the Investment Manager’s organization, including operations and accounting, trading and investments, compliance, risk management and legal.
The Committee meets at least monthly to review and approve valuation matters, which may include a description of specific valuation determinations, data regarding pricing information received from approved pricing vendors and brokers and the results of Board-approved valuation control policies and procedures (the Policies). The Policies address, among other things, instances when market quotations are or are not readily available, including recommendations of third party pricing vendors and a determination of appropriate pricing methodologies; events that require specific valuation determinations and assessment of fair value techniques; securities with a potential for stale pricing, including those that are illiquid, restricted, or in default; and the effectiveness of third party pricing vendors, including periodic reviews of vendors. The Committee meets more frequently, as needed, to discuss additional valuation matters, which may include the need to review back-testing results, review time-sensitive information or approve related valuation actions. The Committee reports to the Board, with members of the Committee meeting with the Board at each of its regularly scheduled meetings to discuss valuation matters and actions during the period, similar to those described earlier.
The following table is a summary of the inputs used to value the Fund’s investments at August 31, 2019:
| | Level 1 ($) | Level 2 ($) | Level 3 ($) | Total ($) |
| Investments in Securities | | | | |
| Asset-Backed Securities — Non-Agency | — | 505,746,005 | 53,475,785 | 559,221,790 |
| Commercial Mortgage-Backed Securities - Non-Agency | — | 201,878,578 | — | 201,878,578 |
| Common Stocks | | | | |
| Communication Services | 189,413 | — | — | 189,413 |
| Consumer Discretionary | — | 69,859 | — | 69,859 |
| Energy | — | 249,284 | — | 249,284 |
| Materials | — | — | 83,722 | 83,722 |
| Utilities | — | — | 17,979 | 17,979 |
| Total Common Stocks | 189,413 | 319,143 | 101,701 | 610,257 |
| Corporate Bonds & Notes | — | 1,908,242,789 | — | 1,908,242,789 |
| Foreign Government Obligations | — | 412,694,028 | — | 412,694,028 |
| Inflation-Indexed Bonds | — | 32,868,291 | — | 32,868,291 |
| Residential Mortgage-Backed Securities - Agency | — | 812,268,307 | 14,668,100 | 826,936,407 |
| Residential Mortgage-Backed Securities - Non-Agency | — | 986,618,108 | 12,549,090 | 999,167,198 |
| Senior Loans | — | 340,378,732 | 7,353,942 | 347,732,674 |
| Treasury Bills | — | 7,499,082 | — | 7,499,082 |
| U.S. Treasury Obligations | 10,134,956 | — | — | 10,134,956 |
| Warrants | | | | |
| Communication Services | — | 160,217 | — | 160,217 |
| Total Warrants | — | 160,217 | — | 160,217 |
| Money Market Funds | 247,814,603 | — | — | 247,814,603 |
| Total Investments in Securities | 258,138,972 | 5,208,673,280 | 88,148,618 | 5,554,960,870 |
| Investments in Derivatives | | | | |
| Asset | | | | |
| Forward Foreign Currency Exchange Contracts | — | 870,961 | — | 870,961 |
| Futures Contracts | 898,748 | — | — | 898,748 |
| Swap Contracts | — | 27,441 | — | 27,441 |
| Liability | | | | |
| Futures Contracts | (7,903,647) | — | — | (7,903,647) |
| Options Contracts Written | — | (14,316,514) | — | (14,316,514) |
| Swap Contracts | — | (23,353,400) | — | (23,353,400) |
| Total | 251,134,073 | 5,171,901,768 | 88,148,618 | 5,511,184,459 |
See the Portfolio of Investments for all investment classifications not indicated in the table.
The Fund’s assets assigned to the Level 2 input category are generally valued using the market approach, in which a security’s value is determined through reference to prices and information from market transactions for similar or identical assets.
Forward foreign currency exchange contracts, futures contracts and swap contracts are valued at unrealized appreciation (depreciation).
The accompanying Notes to Financial Statements are an integral part of this statement.
Columbia Strategic Income Fund | Annual Report 2019
| 49 |
Portfolio of Investments (continued)
August 31, 2019
Fair value measurements (continued)
The following table is a reconciliation of Level 3 assets for which significant observable and unobservable inputs were used to determine fair value:
| | Balance
as of
08/31/2018
($) | Increase
(decrease)
in accrued
discounts/
premiums
($) | Realized
gain (loss)
($) | Change
in unrealized
appreciation
(depreciation)(a)
($) | Purchases
($) | Sales
($) | Transfers
into
Level 3
($) | Transfers
out of
Level 3
($) | Balance
as of
08/31/2019
($) |
| Asset-Backed Securities — Non-Agency | 35,696,430 | 127,817 | (1,237,500) | (7,736,693) | 29,800,000 | (3,174,269) | — | — | 53,475,785 |
| Common Stocks | 81,862 | — | — | 4,217 | — | — | 15,622 | — | 101,701 |
| Residential Mortgage-Backed Securities — Agency | — | (8,964) | — | (249,277) | 14,926,341 | — | — | — | 14,668,100 |
| Residential Mortgage-Backed Securities — Non-Agency | 18,443,124 | 17,214 | — | 224,016 | — | (77,039) | — | (6,058,225) | 12,549,090 |
| Senior Loans | 9,188,944 | 1,718 | 24,790 | (321,340) | 1,235,018 | (2,532,576) | 5,915,387 | (6,157,999) | 7,353,942 |
| Total | 63,410,360 | 137,785 | (1,212,710) | (8,079,077) | 45,961,359 | (5,783,884) | 5,931,009 | (12,216,224) | 88,148,618 |
(a) Change in unrealized appreciation (depreciation) relating to securities held at August 31, 2019 was $(8,947,014), which is comprised of Asset-Backed Securities — Non-Agency of $(8,636,693), Common Stocks of $4,217, Residential Mortgage-Backed Securities — Agency of $(249,277), Residential Mortgage-Backed Securities — Non-Agency of $224,016 and Senior Loans of $(289,277).
The Fund’s assets assigned to the Level 3 category are valued utilizing the valuation technique deemed the most appropriate in the circumstances. Certain common stocks, residential mortgage backed securities, asset backed securities and senior loans classified as Level 3 securities are valued using the market approach and utilize single market quotations from broker dealers which may have included, but were not limited to, observable transactions for identical or similar assets in the market and the distressed nature of the security. The appropriateness of fair values for these securities is monitored on an ongoing basis which may include results of back testing, manual price reviews and other control procedures. Significant increases (decreases) to any of these inputs would have resulted in a significantly higher (lower) fair value measurement.
Financial assets were transferred from Level 2 to Level 3 due to utilizing a single market quotation from a broker dealer. As a result, management concluded that the market input(s) were generally unobservable.
Financial assets were transferred from Level 3 to Level 2 as observable market inputs were utilized and management determined that there was sufficient, reliable and observable market data to value these assets as of period end.
The accompanying Notes to Financial Statements are an integral part of this statement.
| 50 | Columbia Strategic Income Fund | Annual Report 2019 |
Statement of Assets and Liabilities
August 31, 2019
| Assets | |
| Investments in securities, at value | |
| Unaffiliated issuers (cost $5,192,843,168) | $5,307,146,267 |
| Affiliated issuers (cost $247,826,407) | 247,814,603 |
| Cash | 4,487,056 |
| Foreign currency (cost $882,434) | 860,894 |
| Cash collateral held at broker for: | |
| Swap contracts | 5,130,000 |
| Options contracts written | 10,316,000 |
| TBA | 67,000 |
| Other(a) | 1,624,000 |
| Margin deposits on: | |
| Futures contracts | 7,860,813 |
| Swap contracts | 18,408,240 |
| Unrealized appreciation on forward foreign currency exchange contracts | 870,961 |
| Unrealized appreciation on swap contracts | 27,441 |
| Upfront payments on swap contracts | 6,599,236 |
| Receivable for: | |
| Investments sold | 5,215,521 |
| Investments sold on a delayed delivery basis | 1,370,164 |
| Capital shares sold | 9,682,451 |
| Dividends | 399,861 |
| Interest | 38,276,591 |
| Foreign tax reclaims | 242,498 |
| Variation margin for futures contracts | 785,062 |
| Variation margin for swap contracts | 268,977 |
| Prepaid expenses | 30,486 |
| Trustees’ deferred compensation plan | 328,735 |
| Total assets | 5,667,812,857 |
| Liabilities | |
| Option contracts written, at value (premiums received $6,184,000) | 14,316,514 |
| Unrealized depreciation on swap contracts | 8,674,155 |
| Payable for: | |
| Investments purchased | 272,675,730 |
| Investments purchased on a delayed delivery basis | 358,414,650 |
| Capital shares purchased | 8,308,318 |
| Variation margin for futures contracts | 679,082 |
| Variation margin for swap contracts | 413,904 |
| Foreign capital gains taxes deferred | 10,947 |
| Management services fees | 76,391 |
| Distribution and/or service fees | 15,419 |
| Transfer agent fees | 424,757 |
| Compensation of board members | 57,022 |
| Compensation of chief compliance officer | 297 |
| Other expenses | 273,614 |
| Trustees’ deferred compensation plan | 328,735 |
| Total liabilities | 664,669,535 |
| Net assets applicable to outstanding capital stock | $5,003,143,322 |
| Represented by | |
| Paid in capital | 4,956,541,532 |
| Total distributable earnings (loss) (Note 2) | 46,601,790 |
| Total - representing net assets applicable to outstanding capital stock | $5,003,143,322 |
The accompanying Notes to Financial Statements are an integral part of this statement.
Columbia Strategic Income Fund | Annual Report 2019
| 51 |
Statement of Assets and Liabilities (continued)
August 31, 2019
| Class A | |
| Net assets | $1,101,846,703 |
| Shares outstanding | 183,191,990 |
| Net asset value per share | $6.01 |
| Maximum sales charge | 4.75% |
| Maximum offering price per share (calculated by dividing the net asset value per share by 1.0 minus the maximum sales charge for Class A shares) | $6.31 |
| Advisor Class | |
| Net assets | $285,982,942 |
| Shares outstanding | 48,437,063 |
| Net asset value per share | $5.90 |
| Class C | |
| Net assets | $282,017,938 |
| Shares outstanding | 46,887,591 |
| Net asset value per share | $6.01 |
| Institutional Class | |
| Net assets | $2,843,762,286 |
| Shares outstanding | 481,075,302 |
| Net asset value per share | $5.91 |
| Institutional 2 Class | |
| Net assets | $287,752,684 |
| Shares outstanding | 48,650,493 |
| Net asset value per share | $5.91 |
| Institutional 3 Class | |
| Net assets | $192,494,032 |
| Shares outstanding | 32,660,615 |
| Net asset value per share | $5.89 |
| Class R | |
| Net assets | $9,286,737 |
| Shares outstanding | 1,533,347 |
| Net asset value per share | $6.06 |
| (a) | Includes collateral related to options contracts written and swap contracts. |
The accompanying Notes to Financial Statements are an integral part of this statement.
| 52 | Columbia Strategic Income Fund | Annual Report 2019 |
Statement of Operations
Year Ended August 31, 2019
| Net investment income | |
| Income: | |
| Dividends — unaffiliated issuers | $9,866,267 |
| Dividends — affiliated issuers | 4,724,468 |
| Interest | 214,782,843 |
| Total income | 229,373,578 |
| Expenses: | |
| Management services fees | 24,981,150 |
| Distribution and/or service fees | |
| Class A | 2,624,834 |
| Class C | 2,831,325 |
| Class R | 40,782 |
| Class T | 7 |
| Transfer agent fees | |
| Class A | 1,068,171 |
| Advisor Class | 212,717 |
| Class C | 287,717 |
| Institutional Class | 2,493,597 |
| Institutional 2 Class | 155,354 |
| Institutional 3 Class | 17,994 |
| Class R | 8,307 |
| Class T | 2 |
| Compensation of board members | 79,219 |
| Custodian fees | 171,184 |
| Printing and postage fees | 333,737 |
| Registration fees | 435,690 |
| Audit fees | 59,591 |
| Legal fees | 90,970 |
| Interest on collateral | 214,569 |
| Compensation of chief compliance officer | 1,746 |
| Other | 207,217 |
| Total expenses | 36,315,880 |
| Net investment income | 193,057,698 |
| Realized and unrealized gain (loss) — net | |
| Net realized gain (loss) on: | |
| Investments — unaffiliated issuers | (17,406,293) |
| Investments — affiliated issuers | (9,748) |
| Foreign currency translations | (363,699) |
| Forward foreign currency exchange contracts | 3,385,268 |
| Futures contracts | (69,829,744) |
| Options purchased | 29,974,001 |
| Options contracts written | (18,592,329) |
| Swap contracts | 7,212,145 |
| Net realized loss | (65,630,399) |
| Net change in unrealized appreciation (depreciation) on: | |
| Investments — unaffiliated issuers | 196,109,535 |
| Investments — affiliated issuers | 6,359 |
| Foreign currency translations | (99,621) |
| Forward foreign currency exchange contracts | (209,491) |
| Futures contracts | (4,734,345) |
| Options contracts written | (8,277,134) |
| Swap contracts | (12,087,924) |
| Foreign capital gains tax | (10,947) |
| Net change in unrealized appreciation (depreciation) | 170,696,432 |
| Net realized and unrealized gain | 105,066,033 |
| Net increase in net assets resulting from operations | $298,123,731 |
The accompanying Notes to Financial Statements are an integral part of this statement.
Columbia Strategic Income Fund | Annual Report 2019
| 53 |
Statement of Changes in Net Assets
| | Year Ended
August 31, 2019 | Year Ended
August 31, 2018 |
| Operations | | |
| Net investment income | $193,057,698 | $166,682,609 |
| Net realized gain (loss) | (65,630,399) | 35,506,185 |
| Net change in unrealized appreciation (depreciation) | 170,696,432 | (156,479,237) |
| Net increase in net assets resulting from operations | 298,123,731 | 45,709,557 |
| Distributions to shareholders | | |
| Net investment income and net realized gains | | |
| Class A | (47,250,310) | |
| Advisor Class | (9,668,574) | |
| Class C | (10,684,840) | |
| Institutional Class | (118,178,693) | |
| Institutional 2 Class | (12,730,039) | |
| Institutional 3 Class | (9,937,476) | |
| Class R | (346,766) | |
| Class T | (188) | |
| Net investment income | | |
| Class A | | (36,783,334) |
| Advisor Class | | (4,542,419) |
| Class C | | (8,829,242) |
| Institutional Class | | (80,040,757) |
| Institutional 2 Class | | (8,090,127) |
| Institutional 3 Class | | (6,090,722) |
| Class K | | (1,541) |
| Class R | | (218,449) |
| Class T | | (333) |
| Net realized gains | | |
| Class A | | (10,886,907) |
| Advisor Class | | (1,096,130) |
| Class C | | (3,422,323) |
| Institutional Class | | (20,637,145) |
| Institutional 2 Class | | (1,834,492) |
| Institutional 3 Class | | (1,513,560) |
| Class K | | (868) |
| Class R | | (67,029) |
| Class T | | (99) |
| Total distributions to shareholders (Note 2) | (208,796,886) | (184,055,477) |
| Increase in net assets from capital stock activity | 550,922,268 | 822,626,469 |
| Total increase in net assets | 640,249,113 | 684,280,549 |
| Net assets at beginning of year | 4,362,894,209 | 3,678,613,660 |
| Net assets at end of year | $5,003,143,322 | $4,362,894,209 |
| Undistributed net investment income | $11,986,691 | $29,869,724 |
The accompanying Notes to Financial Statements are an integral part of this statement.
| 54 | Columbia Strategic Income Fund | Annual Report 2019 |
Statement of Changes in Net Assets (continued)
| | Year Ended | Year Ended |
| | August 31, 2019 | August 31, 2018 |
| | Shares | Dollars ($) | Shares | Dollars ($) |
| Capital stock activity |
| Class A | | | | |
| Subscriptions | 44,350,234 | 262,412,358 | 44,188,454 | 265,433,665 |
| Distributions reinvested | 7,512,413 | 44,142,069 | 7,388,374 | 44,254,936 |
| Redemptions | (48,550,801) | (286,234,016) | (52,463,421) | (314,442,008) |
| Net increase (decrease) | 3,311,846 | 20,320,411 | (886,593) | (4,753,407) |
| Advisor Class | | | | |
| Subscriptions | 35,349,014 | 203,562,249 | 15,537,079 | 91,567,323 |
| Distributions reinvested | 1,601,003 | 9,282,730 | 951,595 | 5,592,213 |
| Redemptions | (13,383,029) | (77,324,048) | (8,305,133) | (48,991,987) |
| Net increase | 23,566,988 | 135,520,931 | 8,183,541 | 48,167,549 |
| Class C | | | | |
| Subscriptions | 10,306,167 | 61,056,449 | 13,698,047 | 82,517,615 |
| Distributions reinvested | 1,681,431 | 9,872,515 | 1,903,299 | 11,407,704 |
| Redemptions | (17,079,334) | (100,554,314) | (18,608,161) | (111,201,437) |
| Net decrease | (5,091,736) | (29,625,350) | (3,006,815) | (17,276,118) |
| Institutional Class | | | | |
| Subscriptions | 223,732,861 | 1,301,702,712 | 225,430,309 | 1,330,678,843 |
| Distributions reinvested | 17,394,922 | 100,586,426 | 15,128,358 | 89,046,746 |
| Redemptions | (173,915,513) | (1,003,305,003) | (140,624,281) | (828,503,098) |
| Net increase | 67,212,270 | 398,984,135 | 99,934,386 | 591,222,491 |
| Institutional 2 Class | | | | |
| Subscriptions | 29,247,093 | 169,706,819 | 28,917,724 | 170,670,100 |
| Distributions reinvested | 2,200,304 | 12,723,813 | 1,686,660 | 9,917,976 |
| Redemptions | (27,282,567) | (157,876,474) | (12,031,893) | (70,620,557) |
| Net increase | 4,164,830 | 24,554,158 | 18,572,491 | 109,967,519 |
| Institutional 3 Class | | | | |
| Subscriptions | 18,464,680 | 106,337,046 | 25,895,863 | 152,998,263 |
| Distributions reinvested | 1,037,298 | 5,976,380 | 645,851 | 3,784,883 |
| Redemptions | (19,579,020) | (113,163,229) | (10,563,193) | (62,268,549) |
| Net increase (decrease) | (77,042) | (849,803) | 15,978,521 | 94,514,597 |
| Class K | | | | |
| Distributions reinvested | — | — | 359 | 2,162 |
| Redemptions | — | — | (14,711) | (86,354) |
| Net decrease | — | — | (14,352) | (84,192) |
| Class R | | | | |
| Subscriptions | 901,819 | 5,365,305 | 728,790 | 4,392,048 |
| Distributions reinvested | 48,569 | 287,426 | 36,709 | 221,196 |
| Redemptions | (609,863) | (3,625,480) | (624,078) | (3,745,214) |
| Net increase | 340,525 | 2,027,251 | 141,421 | 868,030 |
| Class T | | | | |
| Redemptions | (1,650) | (9,465) | — | — |
| Net decrease | (1,650) | (9,465) | — | — |
| Total net increase | 93,426,031 | 550,922,268 | 138,902,600 | 822,626,469 |
The accompanying Notes to Financial Statements are an integral part of this statement.
Columbia Strategic Income Fund | Annual Report 2019
| 55 |
The following table is intended to help you understand the Fund’s financial performance. Certain information reflects financial results for a single share of a class held for the periods shown. Per share net investment income (loss) amounts are calculated based on average shares outstanding during the period. Total return assumes reinvestment of all dividends and distributions, if any. Total return does not reflect payment of sales charges, if any. Total return and portfolio turnover are not annualized for periods of less than one year. The portfolio turnover rate is calculated without regard to purchase and sales transactions of short-term instruments and certain derivatives, if any. If such transactions were included, the Fund’s portfolio turnover rate may be higher.
| | Net asset value,
beginning of
period | Net
investment
income | Net
realized
and
unrealized
gain (loss) | Total from
investment
operations | Distributions
from net
investment
income | Distributions
from net
realized
gains | Total
distributions to
shareholders |
| Class A |
| Year Ended 8/31/2019 | $5.89 | 0.25 | 0.14 | 0.39 | (0.23) | (0.04) | (0.27) |
| Year Ended 8/31/2018 | $6.09 | 0.24 | (0.18) | 0.06 | (0.20) | (0.06) | (0.26) |
| Year Ended 8/31/2017(e) | $5.97 | 0.20 | 0.06 | 0.26 | (0.14) | — | (0.14) |
| Year Ended 10/31/2016 | $5.79 | 0.22 | 0.15 | 0.37 | (0.19) | — | (0.19) |
| Year Ended 10/31/2015 | $6.13 | 0.23 | (0.22) | 0.01 | (0.25) | (0.10) | (0.35) |
| Year Ended 10/31/2014 | $6.27 | 0.25 | 0.03 | 0.28 | (0.25) | (0.17) | (0.42) |
| Advisor Class |
| Year Ended 8/31/2019 | $5.79 | 0.26 | 0.13 | 0.39 | (0.24) | (0.04) | (0.28) |
| Year Ended 8/31/2018 | $5.99 | 0.25 | (0.17) | 0.08 | (0.22) | (0.06) | (0.28) |
| Year Ended 8/31/2017(e) | $5.88 | 0.21 | 0.05 | 0.26 | (0.15) | — | (0.15) |
| Year Ended 10/31/2016 | $5.70 | 0.23 | 0.16 | 0.39 | (0.21) | — | (0.21) |
| Year Ended 10/31/2015 | $6.04 | 0.24 | (0.21) | 0.03 | (0.27) | (0.10) | (0.37) |
| Year Ended 10/31/2014 | $6.18 | 0.26 | 0.03 | 0.29 | (0.26) | (0.17) | (0.43) |
| Class C |
| Year Ended 8/31/2019 | $5.89 | 0.20 | 0.14 | 0.34 | (0.18) | (0.04) | (0.22) |
| Year Ended 8/31/2018 | $6.09 | 0.19 | (0.17) | 0.02 | (0.16) | (0.06) | (0.22) |
| Year Ended 8/31/2017(e) | $5.97 | 0.17 | 0.05 | 0.22 | (0.10) | — | (0.10) |
| Year Ended 10/31/2016 | $5.79 | 0.18 | 0.15 | 0.33 | (0.15) | — | (0.15) |
| Year Ended 10/31/2015 | $6.13 | 0.19 | (0.22) | (0.03) | (0.21) | (0.10) | (0.31) |
| Year Ended 10/31/2014 | $6.27 | 0.22 | 0.02 | 0.24 | (0.21) | (0.17) | (0.38) |
| Institutional Class |
| Year Ended 8/31/2019 | $5.80 | 0.26 | 0.13 | 0.39 | (0.24) | (0.04) | (0.28) |
| Year Ended 8/31/2018 | $5.99 | 0.25 | (0.16) | 0.09 | (0.22) | (0.06) | (0.28) |
| Year Ended 8/31/2017(e) | $5.88 | 0.22 | 0.04 | 0.26 | (0.15) | — | (0.15) |
| Year Ended 10/31/2016 | $5.70 | 0.23 | 0.16 | 0.39 | (0.21) | — | (0.21) |
| Year Ended 10/31/2015 | $6.04 | 0.24 | (0.21) | 0.03 | (0.27) | (0.10) | (0.37) |
| Year Ended 10/31/2014 | $6.18 | 0.27 | 0.02 | 0.29 | (0.26) | (0.17) | (0.43) |
| Institutional 2 Class |
| Year Ended 8/31/2019 | $5.80 | 0.26 | 0.13 | 0.39 | (0.24) | (0.04) | (0.28) |
| Year Ended 8/31/2018 | $6.00 | 0.25 | (0.17) | 0.08 | (0.22) | (0.06) | (0.28) |
| Year Ended 8/31/2017(e) | $5.88 | 0.22 | 0.06 | 0.28 | (0.16) | — | (0.16) |
| Year Ended 10/31/2016 | $5.71 | 0.24 | 0.14 | 0.38 | (0.21) | — | (0.21) |
| Year Ended 10/31/2015 | $6.04 | 0.25 | (0.21) | 0.04 | (0.27) | (0.10) | (0.37) |
| Year Ended 10/31/2014 | $6.19 | 0.27 | 0.02 | 0.29 | (0.27) | (0.17) | (0.44) |
The accompanying Notes to Financial Statements are an integral part of this statement.
| 56 | Columbia Strategic Income Fund | Annual Report 2019 |
Financial Highlights (continued)
| | Net
asset
value,
end of
period | Total
Return | Total gross
expense
ratio to
average
net assets(a) | Total net
expense
ratio to
average
net assets(a),(b) | Net investment
income
ratio to
average
net assets | Portfolio
turnover | Net
assets,
end of
period
(000’s) |
| Class A |
| Year Ended 8/31/2019 | $6.01 | 6.75% | 0.95%(c) | 0.95%(c) | 4.20% | 179% | $1,101,847 |
| Year Ended 8/31/2018 | $5.89 | 1.03% | 0.94%(c) | 0.94%(c),(d) | 3.94% | 152% | $1,059,907 |
| Year Ended 8/31/2017(e) | $6.09 | 4.42% | 0.95%(f),(g) | 0.95%(d),(f),(g) | 4.00%(f) | 110% | $1,100,585 |
| Year Ended 10/31/2016 | $5.97 | 6.57% | 1.03% | 1.02%(d) | 3.81% | 168% | $1,770,085 |
| Year Ended 10/31/2015 | $5.79 | 0.25% | 1.06% | 1.03%(d) | 3.94% | 169% | $1,461,248 |
| Year Ended 10/31/2014 | $6.13 | 4.64% | 1.04% | 1.04%(d) | 4.14% | 124% | $1,313,683 |
| Advisor Class |
| Year Ended 8/31/2019 | $5.90 | 6.96% | 0.70%(c) | 0.70%(c) | 4.42% | 179% | $285,983 |
| Year Ended 8/31/2018 | $5.79 | 1.30% | 0.69%(c) | 0.69%(c),(d) | 4.21% | 152% | $143,983 |
| Year Ended 8/31/2017(e) | $5.99 | 4.53% | 0.71%(f),(g) | 0.71%(d),(f),(g) | 4.38%(f) | 110% | $99,896 |
| Year Ended 10/31/2016 | $5.88 | 6.95% | 0.77% | 0.77%(d) | 4.02% | 168% | $53,447 |
| Year Ended 10/31/2015 | $5.70 | 0.52% | 0.82% | 0.78%(d) | 4.20% | 169% | $18,630 |
| Year Ended 10/31/2014 | $6.04 | 4.98% | 0.79% | 0.79%(d) | 4.36% | 124% | $5,683 |
| Class C |
| Year Ended 8/31/2019 | $6.01 | 5.97% | 1.70%(c) | 1.70%(c) | 3.45% | 179% | $282,018 |
| Year Ended 8/31/2018 | $5.89 | 0.28% | 1.69%(c) | 1.69%(c),(d) | 3.19% | 152% | $306,303 |
| Year Ended 8/31/2017(e) | $6.09 | 3.78% | 1.71%(f),(g) | 1.71%(d),(f),(g) | 3.33%(f) | 110% | $334,829 |
| Year Ended 10/31/2016 | $5.97 | 5.78% | 1.78% | 1.77%(d) | 3.05% | 168% | $316,346 |
| Year Ended 10/31/2015 | $5.79 | (0.49%) | 1.81% | 1.78%(d) | 3.19% | 169% | $219,782 |
| Year Ended 10/31/2014 | $6.13 | 4.00% | 1.79% | 1.66%(d) | 3.52% | 124% | $186,746 |
| Institutional Class |
| Year Ended 8/31/2019 | $5.91 | 6.96% | 0.70%(c) | 0.70%(c) | 4.44% | 179% | $2,843,762 |
| Year Ended 8/31/2018 | $5.80 | 1.47% | 0.69%(c) | 0.69%(c),(d) | 4.20% | 152% | $2,398,468 |
| Year Ended 8/31/2017(e) | $5.99 | 4.53% | 0.71%(f),(g) | 0.71%(d),(f),(g) | 4.42%(f) | 110% | $1,881,221 |
| Year Ended 10/31/2016 | $5.88 | 6.95% | 0.78% | 0.77%(d) | 4.05% | 168% | $910,452 |
| Year Ended 10/31/2015 | $5.70 | 0.51% | 0.81% | 0.78%(d) | 4.19% | 169% | $574,482 |
| Year Ended 10/31/2014 | $6.04 | 4.97% | 0.79% | 0.79%(d) | 4.39% | 124% | $663,669 |
| Institutional 2 Class |
| Year Ended 8/31/2019 | $5.91 | 7.00% | 0.66%(c) | 0.66%(c) | 4.49% | 179% | $287,753 |
| Year Ended 8/31/2018 | $5.80 | 1.35% | 0.65%(c) | 0.65%(c) | 4.26% | 152% | $257,953 |
| Year Ended 8/31/2017(e) | $6.00 | 4.77% | 0.66%(f),(g) | 0.65%(f),(g) | 4.41%(f) | 110% | $155,372 |
| Year Ended 10/31/2016 | $5.88 | 6.87% | 0.67% | 0.67% | 4.11% | 168% | $103,204 |
| Year Ended 10/31/2015 | $5.71 | 0.80% | 0.68% | 0.68% | 4.32% | 169% | $12,231 |
| Year Ended 10/31/2014 | $6.04 | 4.92% | 0.67% | 0.67% | 4.47% | 124% | $4,193 |
The accompanying Notes to Financial Statements are an integral part of this statement.
Columbia Strategic Income Fund | Annual Report 2019
| 57 |
Financial Highlights (continued)
| | Net asset value,
beginning of
period | Net
investment
income | Net
realized
and
unrealized
gain (loss) | Total from
investment
operations | Distributions
from net
investment
income | Distributions
from net
realized
gains | Total
distributions to
shareholders |
| Institutional 3 Class |
| Year Ended 8/31/2019 | $5.78 | 0.26 | 0.14 | 0.40 | (0.25) | (0.04) | (0.29) |
| Year Ended 8/31/2018 | $5.98 | 0.25 | (0.17) | 0.08 | (0.22) | (0.06) | (0.28) |
| Year Ended 8/31/2017(e) | $5.87 | 0.22 | 0.05 | 0.27 | (0.16) | — | (0.16) |
| Year Ended 10/31/2016 | $5.69 | 0.24 | 0.15 | 0.39 | (0.21) | — | (0.21) |
| Year Ended 10/31/2015 | $6.03 | 0.25 | (0.21) | 0.04 | (0.28) | (0.10) | (0.38) |
| Year Ended 10/31/2014 | $6.17 | 0.27 | 0.03 | 0.30 | (0.27) | (0.17) | (0.44) |
| Class R |
| Year Ended 8/31/2019 | $5.93 | 0.23 | 0.15 | 0.38 | (0.21) | (0.04) | (0.25) |
| Year Ended 8/31/2018 | $6.13 | 0.22 | (0.17) | 0.05 | (0.19) | (0.06) | (0.25) |
| Year Ended 8/31/2017(e) | $6.01 | 0.19 | 0.06 | 0.25 | (0.13) | — | (0.13) |
| Year Ended 10/31/2016 | $5.82 | 0.21 | 0.16 | 0.37 | (0.18) | — | (0.18) |
| Year Ended 10/31/2015 | $6.16 | 0.22 | (0.22) | 0.00(h) | (0.24) | (0.10) | (0.34) |
| Year Ended 10/31/2014 | $6.30 | 0.24 | 0.02 | 0.26 | (0.23) | (0.17) | (0.40) |
| Notes to Financial Highlights |
| (a) | In addition to the fees and expenses that the Fund bears directly, the Fund indirectly bears a pro rata share of the fees and expenses of any other funds in which it invests. Such indirect expenses are not included in the Fund’s reported expense ratios. |
| (b) | Total net expenses include the impact of certain fee waivers/expense reimbursements made by the Investment Manager and certain of its affiliates, if applicable. |
| (c) | Ratios include interest on collateral expense. For the periods indicated below, if interest on collateral expense had been excluded, expenses would have been lower by: |
| Class | 8/31/2019 | 8/31/2018 |
| Class A | less than 0.01% | less than 0.01% |
| Advisor Class | 0.01% | less than 0.01% |
| Class C | less than 0.01% | less than 0.01% |
| Institutional Class | less than 0.01% | less than 0.01% |
| Institutional 2 Class | less than 0.01% | less than 0.01% |
| Institutional 3 Class | less than 0.01% | less than 0.01% |
| Class R | less than 0.01% | less than 0.01% |
| (d) | The benefits derived from expense reductions had an impact of less than 0.01%. |
| (e) | For the period from November 1, 2016 to August 31, 2017. During the period, the Fund’s fiscal year end was changed from October 31 to August 31. |
| (f) | Annualized. |
| (g) | Expenses have been reduced due to a reimbursement of expenses overbilled by a third party. If the reimbursement had been excluded, the expense ratios would have been higher by the percentages shown for each class in the table below. All fee waivers and expense reimbursements by the Investment Manager and its affiliates were applied before giving effect to this third party reimbursement. |
| Year Ended | Class A | Advisor
Class | Class C | Institutional
Class | Institutional 2
Class | Institutional 3
Class | Class R |
| 08/31/2017 | 0.01% | 0.01% | 0.01% | 0.01% | 0.01% | 0.01% | 0.01% |
The accompanying Notes to Financial Statements are an integral part of this statement.
| 58 | Columbia Strategic Income Fund | Annual Report 2019 |
Financial Highlights (continued)
| | Net
asset
value,
end of
period | Total
Return | Total gross
expense
ratio to
average
net assets(a) | Total net
expense
ratio to
average
net assets(a),(b) | Net investment
income
ratio to
average
net assets | Portfolio
turnover | Net
assets,
end of
period
(000’s) |
| Institutional 3 Class |
| Year Ended 8/31/2019 | $5.89 | 7.08% | 0.60%(c) | 0.60%(c) | 4.55% | 179% | $192,494 |
| Year Ended 8/31/2018 | $5.78 | 1.40% | 0.60%(c) | 0.60%(c) | 4.31% | 152% | $189,195 |
| Year Ended 8/31/2017(e) | $5.98 | 4.65% | 0.64%(f),(g) | 0.63%(f),(g) | 4.75%(f) | 110% | $100,173 |
| Year Ended 10/31/2016 | $5.87 | 7.13% | 0.62% | 0.62% | 4.24% | 168% | $10,642 |
| Year Ended 10/31/2015 | $5.69 | 0.68% | 0.64% | 0.64% | 4.35% | 169% | $10,704 |
| Year Ended 10/31/2014 | $6.03 | 5.15% | 0.63% | 0.63% | 4.50% | 124% | $1,582 |
| Class R |
| Year Ended 8/31/2019 | $6.06 | 6.62% | 1.20%(c) | 1.20%(c) | 3.95% | 179% | $9,287 |
| Year Ended 8/31/2018 | $5.93 | 0.77% | 1.19%(c) | 1.19%(c),(d) | 3.70% | 152% | $7,075 |
| Year Ended 8/31/2017(e) | $6.13 | 4.18% | 1.21%(f),(g) | 1.21%(d),(f),(g) | 3.83%(f) | 110% | $6,443 |
| Year Ended 10/31/2016 | $6.01 | 6.45% | 1.28% | 1.27%(d) | 3.54% | 168% | $5,687 |
| Year Ended 10/31/2015 | $5.82 | 0.00%(h) | 1.31% | 1.28%(d) | 3.69% | 169% | $2,439 |
| Year Ended 10/31/2014 | $6.16 | 4.35% | 1.29% | 1.29%(d) | 3.88% | 124% | $1,629 |
The accompanying Notes to Financial Statements are an integral part of this statement.
Columbia Strategic Income Fund | Annual Report 2019
| 59 |
Notes to Financial Statements
August 31, 2019
Note 1. Organization
Columbia Strategic Income Fund (the Fund), a series of Columbia Funds Series Trust I (the Trust), is a diversified fund. The Trust is registered under the Investment Company Act of 1940, as amended (the 1940 Act), as an open-end management investment company organized as a Massachusetts business trust.
Fund shares
The Trust may issue an unlimited number of shares (without par value). The Fund offers each of the share classes listed in the Statement of Assets and Liabilities. Although all share classes generally have identical voting, dividend and liquidation rights, each share class votes separately when required by the Trust’s organizational documents or by law. Each share class has its own expense and sales charge structure. Different share classes may have different minimum initial investment amounts and pay different distribution amounts to the extent the expenses of distributing such share classes vary. Distributions to shareholders in a liquidation will be proportional to the net asset value of each share class.
As described in the Fund’s prospectus, Class A and Class C shares are offered to the general public for investment. Advisor Class, Institutional Class, Institutional 2 Class, Institutional 3 Class and Class R shares are available for purchase through authorized investment professionals to omnibus retirement plans or to institutional and to certain other investors as also described in the Fund’s prospectus. Class C shares automatically convert to Class A shares after 10 years. Effective December 14, 2018, Class T shares merged, in a tax-free transaction, into Class A shares of the Fund and are no longer offered for sale.
Note 2. Summary of significant accounting policies
Basis of preparation
The Fund is an investment company that applies the accounting and reporting guidance in the Financial Accounting Standards Board (FASB) Accounting Standards Codification Topic 946,Financial Services - Investment Companies (ASC 946). The financial statements are prepared in accordance with U.S. generally accepted accounting principles (GAAP), which requires management to make certain estimates and assumptions that affect the reported amounts of assets and liabilities, the disclosure of contingent assets and liabilities at the date of the financial statements and the reported amounts of income and expenses during the reporting period. Actual results could differ from those estimates.
The following is a summary of significant accounting policies followed by the Fund in the preparation of its financial statements.
Security valuation
All equity securities are valued at the close of business of the New York Stock Exchange. Equity securities are valued at the official closing price on the principal exchange or market on which they trade. Unlisted securities or listed securities for which there were no sales during the day are valued at the mean of the latest quoted bid and ask prices on such exchanges or markets.
Debt securities generally are valued by pricing services approved by the Board of Trustees based upon market transactions for normal, institutional-size trading units of similar securities. The services may use various pricing techniques that take into account, as applicable, factors such as yield, quality, coupon rate, maturity, type of issue, trading characteristics and other data, as well as approved independent broker-dealer quotes. Debt securities for which quotations are not readily available or not believed to be reflective of market value may also be valued based upon a bid quote from an approved independent broker-dealer. Debt securities maturing in 60 days or less are valued primarily at amortized cost value, unless this method results in a valuation that management believes does not approximate market value.
Asset- and mortgage-backed securities are generally valued by pricing services, which utilize pricing models that incorporate the securities’ cash flow and loan performance data. These models also take into account available market data, including trades, market quotations, and benchmark yield curves for identical or similar securities. Factors used to identify similar securities may include, but are not limited to, issuer, collateral type, vintage, prepayment speeds, collateral performance, credit ratings, credit enhancement and expected life. Asset-backed securities for which quotations are readily available may also be valued based upon an over-the-counter or exchange bid quote from an approved independent broker-dealer.
| 60 | Columbia Strategic Income Fund | Annual Report 2019 |
Notes to Financial Statements (continued)
August 31, 2019
Senior loan securities for which reliable market quotations are readily available are generally valued by pricing services at the average of the bids received.
Foreign equity securities are valued based on the closing price on the foreign exchange in which such securities are primarily traded. If any foreign equity security closing prices are not readily available, the securities are valued at the mean of the latest quoted bid and ask prices on such exchanges or markets. Foreign currency exchange rates are determined at the scheduled closing time of the New York Stock Exchange. Many securities markets and exchanges outside the U.S. close prior to the close of the New York Stock Exchange; therefore, the closing prices for securities in such markets or on such exchanges may not fully reflect events that occur after such close but before the close of the New York Stock Exchange. In those situations, foreign securities will be fair valued pursuant to a policy adopted by the Board of Trustees. Under the policy, the Fund may utilize a third party pricing service to determine these fair values. The third-party pricing service takes into account multiple factors, including, but not limited to, movements in the U.S. securities markets, certain depositary receipts, futures contracts and foreign exchange rates that have occurred subsequent to the close of the foreign exchange or market, to determine a good faith estimate that reasonably reflects the current market conditions as of the close of the New York Stock Exchange. The fair value of a security is likely to be different from the quoted or published price, if available.
Investments in open-end investment companies, including money market funds, are valued at their latest net asset value.
Forward foreign currency exchange contracts are marked-to-market based upon foreign currency exchange rates provided by a pricing service.
Futures and options on futures contracts are valued based upon the settlement price at the close of regular trading on their principal exchanges or, in the absence of transactions, at the mean of the latest quoted bid and ask prices.
Option contracts are valued at the mean of the latest quoted bid and ask prices on their primary exchanges. Option contracts, including over-the-counter option contracts, with no readily available market quotations are valued using mid-market evaluations from independent third-party vendors.
Swap transactions are valued through an independent pricing service or broker, or if neither is available, through an internal model based upon observable inputs.
Investments for which market quotations are not readily available, or that have quotations which management believes are not reflective of market value or reliable, are valued at fair value as determined in good faith under procedures approved by and under the general supervision of the Board of Trustees. If a security or class of securities (such as foreign securities) is valued at fair value, such value is likely to be different from the quoted or published price for the security.
The determination of fair value often requires significant judgment. To determine fair value, management may use assumptions including but not limited to future cash flows and estimated risk premiums. Multiple inputs from various sources may be used to determine fair value.
GAAP requires disclosure regarding the inputs and valuation techniques used to measure fair value and any changes in valuation inputs or techniques. In addition, investments shall be disclosed by major category. This information is disclosed following the Fund’s Portfolio of Investments.
Foreign currency transactions and translations
The values of all assets and liabilities denominated in foreign currencies are generally translated into U.S. dollars at exchange rates determined at the close of regular trading on the New York Stock Exchange. Net realized and unrealized gains (losses) on foreign currency transactions and translations include gains (losses) arising from the fluctuation in exchange rates between trade and settlement dates on securities transactions, gains (losses) arising from the disposition of foreign currency and currency gains (losses) between the accrual and payment dates on dividends, interest income and foreign withholding taxes.
For financial statement purposes, the Fund does not distinguish that portion of gains (losses) on investments which is due to changes in foreign exchange rates from that which is due to changes in market prices of the investments. Such fluctuations are included with the net realized and unrealized gains (losses) on investments in the Statement of Operations.
Columbia Strategic Income Fund | Annual Report 2019
| 61 |
Notes to Financial Statements (continued)
August 31, 2019
Derivative instruments
The Fund invests in certain derivative instruments, as detailed below, to meet its investment objectives. Derivatives are instruments whose values depend on, or are derived from, in whole or in part, the value of one or more securities, currencies, commodities, indices, or other assets or instruments. Derivatives may be used to increase investment flexibility (including to maintain cash reserves while maintaining desired exposure to certain assets), for risk management (hedging) purposes, to facilitate trading, to reduce transaction costs and to pursue higher investment returns. The Fund may also use derivative instruments to mitigate certain investment risks, such as foreign currency exchange rate risk, interest rate risk and credit risk. Derivatives may involve various risks, including the potential inability of the counterparty to fulfill its obligations under the terms of the contract, the potential for an illiquid secondary market (making it difficult for the Fund to sell or terminate, including at favorable prices) and the potential for market movements which may expose the Fund to gains or losses in excess of the amount shown in the Statement of Assets and Liabilities. The notional amounts of derivative instruments, if applicable, are not recorded in the financial statements.
A derivative instrument may suffer a marked-to-market loss if the value of the contract decreases due to an unfavorable change in the market rates or values of the underlying instrument. Losses can also occur if the counterparty does not perform its obligations under the contract. The Fund’s risk of loss from counterparty credit risk on over-the-counter derivatives is generally limited to the aggregate unrealized gain netted against any collateral held by the Fund and the amount of any variation margin held by the counterparty, plus any replacement costs or related amounts. With exchange-traded or centrally cleared derivatives, there is reduced counterparty credit risk to the Fund since the clearinghouse or central counterparty (CCP) provides some protection in the case of clearing member default. The clearinghouse or CCP stands between the buyer and the seller of the contract; therefore, additional counterparty credit risk is failure of the clearinghouse or CCP. However, credit risk still exists in exchange-traded or centrally cleared derivatives with respect to initial and variation margin that is held in a broker’s customer account. While brokers are required to segregate customer margin from their own assets, in the event that a broker becomes insolvent or goes into bankruptcy and at that time there is a shortfall in the aggregate amount of margin held by the broker for all its clients, U.S. bankruptcy laws will typically allocate that shortfall on a pro-rata basis across all the broker’s customers (including the Fund), potentially resulting in losses to the Fund.
In order to better define its contractual rights and to secure rights that will help the Fund mitigate its counterparty risk, the Fund may enter into an International Swaps and Derivatives Association, Inc. Master Agreement (ISDA Master Agreement) or similar agreement with its derivatives contract counterparties. An ISDA Master Agreement is an agreement between the Fund and a counterparty that governs over-the-counter derivatives and typically contains, among other things, collateral posting terms and netting provisions in the event of a default and/or termination event. Under an ISDA Master Agreement, the Fund may, under certain circumstances, offset with the counterparty certain derivative instrument’s payables and/or receivables with collateral held and/or posted and create one single net payment. The provisions of the ISDA Master Agreement typically permit a single net payment in the event of default (close-out netting), including the bankruptcy or insolvency of the counterparty. Note, however, that bankruptcy or insolvency laws of a particular jurisdiction may impose restrictions on or prohibitions against the right of offset or netting in bankruptcy, insolvency or other events.
Collateral (margin) requirements differ by type of derivative. Margin requirements are established by the clearinghouse or CCP for exchange-traded and centrally cleared derivatives. Brokers can ask for margin in excess of the minimum in certain circumstances. Collateral terms are contract specific for over-the-counter derivatives. For over-the-counter derivatives traded under an ISDA Master Agreement, the collateral requirements are typically calculated by netting the marked-to-market amount for each transaction under such agreement and comparing that amount to the value of any variation margin currently pledged by the Fund and/or the counterparty. Generally, the amount of collateral due from or to a party has to exceed a minimum transfer amount threshold (e.g., $250,000) before a transfer has to be made. To the extent amounts due to the Fund from its counterparties are not fully collateralized, contractually or otherwise, the Fund bears the risk of loss from counterparty nonperformance. The Fund may also pay interest expense on cash collateral received from the broker. Any interest expense paid by the Fund is shown on the Statement of Operations. The Fund attempts to mitigate counterparty risk by only entering into agreements with counterparties that it believes have the financial resources to honor their obligations and by monitoring the financial stability of those counterparties.
| 62 | Columbia Strategic Income Fund | Annual Report 2019 |
Notes to Financial Statements (continued)
August 31, 2019
Certain ISDA Master Agreements allow counterparties of over-the-counter derivatives transactions to terminate derivatives contracts prior to maturity in the event the Fund’s net asset value declines by a stated percentage over a specified time period or if the Fund fails to meet certain terms of the ISDA Master Agreement, which would cause the Fund to accelerate payment of any net liability owed to the counterparty. The Fund also has termination rights if the counterparty fails to meet certain terms of the ISDA Master Agreement. In determining whether to exercise such termination rights, the Fund would consider, in addition to counterparty credit risk, whether termination would result in a net liability owed from the counterparty.
For financial reporting purposes, the Fund does not offset derivative assets and derivative liabilities that are subject to netting arrangements in the Statement of Assets and Liabilities.
Forward foreign currency exchange contracts
Forward foreign currency exchange contracts are over-the-counter agreements between two parties to buy and sell a currency at a set price on a future date. The Fund utilized forward foreign currency exchange contracts to hedge the currency exposure associated with some or all of the Fund’s securities. These instruments may be used for other purposes in future periods.
The values of forward foreign currency exchange contracts fluctuate daily with changes in foreign currency exchange rates. Changes in the value of these contracts are recorded as unrealized appreciation or depreciation until the contract is exercised or has expired. The Fund will realize a gain or loss when the forward foreign currency exchange contract is closed or expires. Non-deliverable forward foreign currency exchange contracts are settled with the counterparty in U.S. dollars without delivery of foreign currency.
The use of forward foreign currency exchange contracts does not eliminate fluctuations in the prices of the Fund’s portfolio securities. The risks of forward foreign currency exchange contracts include movement in the values of the foreign currencies relative to the U.S. dollar (or other foreign currencies) and the possibility that counterparties will not complete their contractual obligations, which may be in excess of the amount reflected, if any, in the Statement of Assets and Liabilities.
Futures contracts
Futures contracts are exchange-traded and represent commitments for the future purchase or sale of an asset at a specified price on a specified date. The Fund bought and sold futures contracts to manage the duration and yield curve exposure of the Fund versus the benchmark. These instruments may be used for other purposes in future periods. Upon entering into futures contracts, the Fund bears risks that it may not achieve the anticipated benefits of the futures contracts and may realize a loss. Additional risks include counterparty credit risk, the possibility of an illiquid market, and that a change in the value of the contract or option may not correlate with changes in the value of the underlying asset.
Upon entering into a futures contract, the Fund deposits cash or securities with the broker, known as a futures commission merchant (FCM), in an amount sufficient to meet the initial margin requirement. The initial margin deposit must be maintained at an established level over the life of the contract. Cash deposited as initial margin is recorded in the Statement of Assets and Liabilities as margin deposits. Securities deposited as initial margin are designated in the Portfolio of Investments. Subsequent payments (variation margin) are made or received by the Fund each day. The variation margin payments are equal to the daily change in the contract value and are recorded as variation margin receivable or payable and are offset in unrealized gains or losses. The Fund recognizes a realized gain or loss when the contract is closed or expires. Futures contracts involve, to varying degrees, risk of loss in excess of the variation margin disclosed in the Statement of Assets and Liabilities.
Options contracts
Options are contracts which entitle the holder to purchase or sell securities or other identified assets at a specified price, or in the case of index option contracts, to receive or pay the difference between the index value and the strike price of the index option contract. Option contracts can be either exchange-traded or over-the-counter. The Fund purchased and wrote option contracts to manage exposure to fluctuations in interest rates. These instruments may be used for other purposes in future periods. Completion of transactions for option contracts traded in the over-the-counter market depends upon the performance of the other party. Cash collateral may be collected or posted by the Fund to secure certain over-the-counter option contract trades. Cash collateral held or posted by the Fund for such option contract trades must be returned to the broker or the Fund upon closure, exercise or expiration of the contract.
Columbia Strategic Income Fund | Annual Report 2019
| 63 |
Notes to Financial Statements (continued)
August 31, 2019
Options contracts purchased are recorded as investments. When the Fund writes an options contract, the premium received is recorded as an asset and an amount equivalent to the premium is recorded as a liability in the Statement of Assets and Liabilities and is subsequently adjusted to reflect the current fair value of the option written. Changes in the fair value of the written option are recorded as unrealized appreciation or depreciation until the contract is exercised or has expired. The Fund will realize a gain or loss when the option contract is closed or expires. When option contracts are exercised, the proceeds on sales for a written call or purchased put option contract, or the purchase cost for a written put or purchased call option contract, is adjusted by the amount of premium received or paid.
For over-the-counter options purchased, the Fund bears the risk of loss of the amount of the premiums paid plus the positive change in market values net of any collateral held by the Fund should the counterparty fail to perform under the contracts. Option contracts written by the Fund do not typically give rise to significant counterparty credit risk, as options written generally obligate the Fund and not the counterparty to perform. The risk in writing a call option contract is that the Fund gives up the opportunity for profit if the market price of the security increases above the strike price and the option contract is exercised. The risk in writing a put option contract is that the Fund may incur a loss if the market price of the security decreases below the strike price and the option contract is exercised. Exercise of a written option could result in the Fund purchasing or selling a security or foreign currency when it otherwise would not, or at a price different from the current market value. In purchasing and writing options, the Fund bears the risk of an unfavorable change in the value of the underlying instrument or the risk that the Fund may not be able to enter into a closing transaction due to an illiquid market.
Interest rate swaption contracts
Interest rate swaption contracts entered into by the Fund typically represent an option that gives the purchaser the right, but not the obligation, to enter into an interest rate swap contract on a future date. Each interest rate swaption agreement will specify if the buyer is entitled to receive the fixed or floating rate if the interest rate is exercised. Changes in the value of a purchased interest rate swaption contracts are reported as unrealized appreciation or depreciation on options in the Statement of Assets and Liabilities. Gain or loss is recognized in the Statement of Operations when the interest rate swaption contract is closed or expires.
When the Fund writes an interest rate swaption contract, the premium received is recorded as an asset and an amount equivalent to the premium is recorded as a liability in the Statement of Assets and Liabilities and is subsequently adjusted to reflect the current fair value of the interest rate swaption contract written. Premiums received from writing interest rate swaption contracts that expire unexercised are recorded by the Fund on the expiration date as realized gains from options written in the Statement of Operations. The difference between the premium and the amount paid on effecting a closing purchase transaction, including brokerage commissions, is also recorded as realized gain, or if the premium is less than the amount paid for the closing purchase, as realized loss. These amounts are reflected as net realized gain (loss) on options written in the Statement of Operations.
Swap contracts
Swap contracts are negotiated in the over-the-counter market and may be entered into as a bilateral contract or centrally cleared (centrally cleared swap contract). In a centrally cleared swap contract, immediately following execution of the swap contract with a broker, the swap contract is novated to a central counterparty (the CCP) and the CCP becomes the Fund’s counterparty to the centrally cleared swap contract. The Fund is required to deposit initial margin with the futures commission merchant (FCM), which pledges it through to the CCP in the form of cash or securities in an amount that varies depending on the size and risk profile of the particular swap contract. Securities deposited as initial margin are designated in the Portfolio of Investments and cash deposited is recorded in the Statement of Assets and Liabilities as margin deposits. Unlike a bilateral swap contract, for centrally cleared swap contracts, the Fund has minimal credit exposure to the FCM because the CCP stands between the Fund and the relevant buyer/seller on the other side of the contract. Swap contracts are marked-to-market daily and changes in value are recorded as unrealized appreciation (depreciation). The daily change in valuation of centrally cleared swap contracts, if any, is recorded as a receivable or payable for variation margin in the Statement of Assets and Liabilities.
| 64 | Columbia Strategic Income Fund | Annual Report 2019 |
Notes to Financial Statements (continued)
August 31, 2019
Entering into these contracts involves, to varying degrees, elements of interest, liquidity and counterparty credit risk in excess of the amounts recognized in the Statement of Assets and Liabilities. Such risks involve the possibility that there may be unfavorable changes in interest rates, market conditions or other conditions, that it may be difficult to initiate a swap transaction or liquidate a position at an advantageous time or price which may result in significant losses, and that the FCM or CCP may not fulfill its obligation under the contract.
Credit default swap contracts
The Fund entered into credit default swap contracts to increase or decrease its credit exposure to an index. These instruments may be used for other purposes in future periods. Credit default swap contracts are agreements in which one party pays fixed periodic payments to a counterparty in consideration for an agreement from the counterparty to make a specific payment should a specified credit event(s) take place. Although specified credit events are contract specific, credit events are generally defined as bankruptcy, failure to pay, restructuring, obligation acceleration, obligation default, or repudiation/moratorium.
As the purchaser of a credit default swap contract, the Fund purchases protection by paying a periodic interest rate on the notional amount to the counterparty. The interest amount is accrued daily as a component of unrealized appreciation (depreciation) and is recorded as a realized loss upon payment. If a credit event as specified in the contract occurs, the Fund may have the option either to deliver the reference obligation to the seller in exchange for a cash payment of its par amount, or to receive a net cash settlement equal to the par amount less an agreed-upon value of the reference obligation as of the date of the credit event. The difference between the value of the obligation or cash delivered and the notional amount received will be recorded as a realized gain (loss).
As the seller of a credit default swap contract, the Fund sells protection to a buyer and will generally receive a periodic interest rate on a notional amount. The interest amount is accrued daily as a component of unrealized appreciation (depreciation) and is recorded as a realized gain upon receipt of the payment. If a credit event as specified in the contract with the counterparty occurs, the Fund may either be required to accept the reference obligation from the buyer in exchange for a cash payment of its notional amount, or to pay the buyer a net cash settlement equal to the notional amount less an agreed-upon value of the reference obligation (recovery value) as of the date of the credit event. The difference between the value of the obligation or cash received and the notional amount paid will be recorded as a realized gain (loss). The maximum potential amount of undiscounted future payments the Fund could be required to make as the seller of protection under a credit default swap contract is equal to the notional amount of the reference obligation. These potential amounts may be partially offset by any recovery values of the respective reference obligations or upfront receipts upon entering into the agreement. The notional amounts and market values of all credit default swap contracts in which the Fund is the seller of protection, if any, are disclosed in the Credit Default Swap Contracts Outstanding schedule following the Portfolio of Investments.
As a protection seller, the Fund bears the risk of loss from the credit events specified in the contract with the counterparty. For credit default swap contracts on credit indices, quoted market prices and resulting market values serve as an indicator of the current status of the payment/performance risk. Increasing market values, in absolute terms when compared to the notional amount of the swap, represent a deterioration of the reference entity’s credit soundness and a greater likelihood or risk of default or other credit event occurring as defined under the terms of the contract.
Any upfront payments or receipts by the Fund upon entering into a credit default swap contract is recorded as an asset or liability, respectively, and amortized daily as a component of realized gain (loss) in the Statement of Operations. Credit default swap contracts are valued daily, and the change in value is recorded as unrealized appreciation (depreciation) until the termination of the swap, at which time a realized gain (loss) is recorded.
Credit default swap contracts can involve greater risks than if a fund had invested in the reference obligation directly since, in addition to general market risks, credit default swaps are subject to counterparty credit risk, leverage risk, hedging risk, correlation risk and liquidity risk.
Columbia Strategic Income Fund | Annual Report 2019
| 65 |
Notes to Financial Statements (continued)
August 31, 2019
Interest rate swap contracts
The Fund entered into interest rate swap transactions which may include inflation rate swap contracts to manage long or short exposure to an inflation index and to hedge the portfolio risk associated with some or all of the Fund’s securities. These instruments may be used for other purposes in future periods. An interest rate swap is an agreement between two parties where there are two flows and payments are made between the two counterparties and the payments are dependent upon changes in an interest rate, inflation rate or inflation index calculated on a nominal amount. Interest rate swaps are agreements between two parties that involve the exchange of one type of interest rate for another type of interest rate cash flow on specified dates in the future, based on a predetermined, specified notional amount. Certain interest rate swaps are considered forward-starting, whereby the accrual for the exchange of cash flows does not begin until a specified date in the future. The net cash flow for a standard interest rate swap transaction is generally the difference between a floating market interest rate versus a fixed interest rate.
Interest rate swaps are valued daily and unrealized appreciation (depreciation) is recorded. Certain interest rate swaps may accrue periodic interest on a daily basis as a component of unrealized appreciation (depreciation); the Fund will realize a gain or loss upon the payment or receipt of accrued interest. The Fund will realize a gain or a loss when the interest rate swap is terminated.
Effects of derivative transactions in the financial statements
The following tables are intended to provide additional information about the effect of derivatives on the financial statements of the Fund, including: the fair value of derivatives by risk category and the location of those fair values in the Statement of Assets and Liabilities; and the impact of derivative transactions over the period in the Statement of Operations, including realized and unrealized gains (losses). The derivative instrument schedules following the Portfolio of Investments present additional information regarding derivative instruments outstanding at the end of the period, if any.
The following table is a summary of the fair value of derivative instruments (not considered to be hedging instruments for accounting disclosure purposes) at August 31, 2019:
| | Asset derivatives | |
Risk exposure
category | Statement
of assets and liabilities
location | Fair value ($) |
| Credit risk | Component of total distributable earnings (loss) — unrealized appreciation on swap contracts | 27,441* |
| Credit risk | Upfront payments on swap contracts | 6,599,236 |
| Foreign exchange risk | Unrealized appreciation on forward foreign currency exchange contracts | 870,961 |
| Interest rate risk | Component of total distributable earnings (loss) — unrealized appreciation on futures contracts | 898,748* |
| Total | | 8,396,386 |
| | Liability derivatives | |
Risk exposure
category | Statement
of assets and liabilities
location | Fair value ($) |
| Credit risk | Component of total distributable earnings (loss) — unrealized depreciation on swap contracts | 8,925,096* |
| Interest rate risk | Component of total distributable earnings (loss) — unrealized depreciation on futures contracts | 7,903,647* |
| Interest rate risk | Options contracts written, at value | 14,316,514 |
| Interest rate risk | Component of total distributable earnings (loss) — unrealized depreciation on swap contracts | 14,428,304* |
| Total | | 45,573,561 |
| * | Includes cumulative appreciation (depreciation) as reported in the tables following the Portfolio of Investments. Only the current day’s variation margin is reported in receivables or payables in the Statement of Assets and Liabilities. |
| 66 | Columbia Strategic Income Fund | Annual Report 2019 |
Notes to Financial Statements (continued)
August 31, 2019
The following table indicates the effect of derivative instruments (not considered to be hedging instruments for accounting disclosure purposes) in the Statement of Operations for the year ended August 31, 2019:
| Amount of realized gain (loss) on derivatives recognized in income |
| Risk exposure category | Forward
foreign
currency
exchange
contracts
($) | Futures
contracts
($) | Options
contracts
written
($) | Options
contracts
purchased
($) | Swap
contracts
($) | Total
($) |
| Credit risk | — | — | — | — | 2,885,927 | 2,885,927 |
| Foreign exchange risk | 3,385,268 | — | — | — | — | 3,385,268 |
| Interest rate risk | — | (69,829,744) | (18,592,329) | 29,974,001 | 4,326,218 | (54,121,854) |
| Total | 3,385,268 | (69,829,744) | (18,592,329) | 29,974,001 | 7,212,145 | (47,850,659) |
| Change in unrealized appreciation (depreciation) on derivatives recognized in income |
| Risk exposure category | Forward
foreign
currency
exchange
contracts
($) | Futures
contracts
($) | Options
contracts
written
($) | Swap
contracts
($) | Total
($) |
| Credit risk | — | — | — | (4,199,103) | (4,199,103) |
| Foreign exchange risk | (209,491) | — | — | — | (209,491) |
| Interest rate risk | — | (4,734,345) | (8,277,134) | (7,888,821) | (20,900,300) |
| Total | (209,491) | (4,734,345) | (8,277,134) | (12,087,924) | (25,308,894) |
The following table is a summary of the average outstanding volume by derivative instrument for the year ended August 31, 2019:
| Derivative instrument | Average notional
amounts ($)* |
| Futures contracts — long | 639,458,403 |
| Futures contracts — short | 1,713,757,642 |
| Credit default swap contracts — buy protection | 337,488,350 |
| Credit default swap contracts — sell protection | 5,000,000 |
| Derivative instrument | Average
value ($)* |
| Options contracts — purchased | 7,240,395 |
| Options contracts — written | (8,167,416) |
| Derivative instrument | Average unrealized
appreciation ($)* | Average unrealized
depreciation ($)* |
| Forward foreign currency exchange contracts | 833,850 | (300,988) |
| Interest rate swap contracts | 886,879 | (8,206,982) |
| * | Based on the ending quarterly outstanding amounts for the year ended August 31, 2019. |
Investments in senior loans
The Fund may invest in senior loan assignments. When the Fund purchases an assignment of a senior loan, the Fund typically has direct rights against the borrower; provided, however, that the Fund’s rights may be more limited than the lender from which it acquired the assignment and the Fund may be able to enforce its rights only through an administrative agent. Although certain senior loan assignments are secured by collateral, the Fund could experience delays or limitations in realizing such collateral or have its interest subordinated to other indebtedness of the obligor. In the event that the administrator or collateral agent of a loan becomes insolvent or enters into receivership or bankruptcy, the Fund may incur costs and delays in realizing payment or may suffer a loss of principal and/or interest. The risk of loss is greater for
Columbia Strategic Income Fund | Annual Report 2019
| 67 |
Notes to Financial Statements (continued)
August 31, 2019
unsecured or subordinated loans. In addition, senior loan assignments are vulnerable to market, economic or other conditions or events that may reduce the demand for senior loan assignments and certain senior loan assignments which were liquid when purchased, may become illiquid.
The Fund may enter into senior loan assignments where all or a portion of the loan may be unfunded. The Fund is obligated to fund these commitments at the borrower’s discretion. These commitments, if any, are generally traded and priced in the same manner as other senior loan securities and are disclosed as unfunded senior loan commitments in the Fund’s Portfolio of Investments with a corresponding payable for investments purchased. The Fund designates cash or liquid securities to cover these commitments.
Asset- and mortgage-backed securities
The Fund may invest in asset-backed and mortgage-backed securities. The maturity dates shown represent the original maturity of the underlying obligation. Actual maturity may vary based upon prepayment activity on these obligations. All, or a portion, of the obligation may be prepaid at any time because the underlying asset may be prepaid. As a result, decreasing market interest rates could result in an increased level of prepayment. An increased prepayment rate will have the effect of shortening the maturity of the security. Unless otherwise noted, the coupon rates presented are fixed rates.
Delayed delivery securities
The Fund may trade securities on other than normal settlement terms, including securities purchased or sold on a “when-issued” or "forward commitment" basis. This may increase risk to the Fund since the other party to the transaction may fail to deliver, which could cause the Fund to subsequently invest at less advantageous prices. The Fund designates cash or liquid securities in an amount equal to the delayed delivery commitment.
To be announced securities
The Fund may trade securities on a To Be Announced (TBA) basis. As with other delayed-delivery transactions, a seller agrees to issue a TBA security at a future date. However, the seller does not specify the particular securities to be delivered. Instead, the Fund agrees to accept any security that meets specified terms.
In some cases, Master Securities Forward Transaction Agreements (MSFTAs) may be used to govern transactions of certain forward-settling agency mortgage-backed securities, such as delayed-delivery and TBAs, between the Fund and counterparty. The MSFTA maintains provisions for, among other things, initiation and confirmation, payment and transfer, events of default, termination, and maintenance of collateral relating to such transactions.
Mortgage dollar roll transactions
The Fund may enter into mortgage “dollar rolls” in which the Fund sells securities for delivery in the current month and simultaneously contracts with the same counterparty to repurchase similar but not identical securities (same type, coupon and maturity) on a specified future date. During the roll period, the Fund loses the right to receive principal and interest paid on the securities sold. However, the Fund will benefit because it receives negotiated amounts in the form of reductions of the purchase price for the future purchase plus the interest earned on the cash proceeds of the securities sold until the settlement date of the forward purchase. The Fund records the incremental difference between the forward purchase and sale of each forward roll as a realized gain or loss. Unless any realized gains exceed the income, capital appreciation, and gain or loss due to mortgage prepayments that would have been realized on the securities sold as part of the mortgage dollar roll, the use of this technique will diminish the investment performance of the Fund compared to what the performance would have been without the use of mortgage dollar rolls. All cash proceeds will be invested in instruments that are permissible investments for the Fund. The Fund identifies cash or liquid securities in an amount equal to the forward purchase price.
For financial reporting and tax purposes, the Fund treats “to be announced” mortgage dollar rolls as two separate transactions, one involving the purchase of a security and a separate transaction involving a sale. These transactions may increase the Fund’s portfolio turnover rate. The Fund does not currently enter into mortgage dollar rolls that are accounted for as financing transactions.
Mortgage dollar rolls involve the risk that the market value of the securities the Fund is obligated to repurchase may decline below the repurchase price, or that the counterparty may default on its obligations.
| 68 | Columbia Strategic Income Fund | Annual Report 2019 |
Notes to Financial Statements (continued)
August 31, 2019
Treasury inflation protected securities
The Fund may invest in treasury inflation protected securities (TIPS). The principal amount of TIPS is adjusted periodically and is increased for inflation or decreased for deflation based on a monthly published index. These adjustments are recorded as interest income in the Statement of Operations. Coupon payments are based on the adjusted principal at the time the interest is paid.
Interest only and principal only securities
The Fund may invest in Interest Only (IO) or Principal Only (PO) securities. IOs are stripped securities entitled to receive all of the security’s interest, but none of its principal. IOs are particularly sensitive to changes in interest rates and therefore subject to greater fluctuations in price than typical interest bearing debt securities. IOs are also subject to credit risk because the Fund may not receive all or part of the interest payments if the issuer, obligor, guarantor or counterparty defaults on its obligation. Payments received for IOs are included in interest income on the Statement of Operations. Because no principal will be received at the maturity of an IO, adjustments are made to the cost of the security on a monthly basis until maturity. These adjustments are included in interest income on the Statement of Operations. POs are stripped securities entitled to receive the principal from the underlying obligation, but not the interest. POs are particularly sensitive to changes in interest rates and therefore are subject to fluctuations in price. POs are also subject to credit risk because the Fund may not receive all or part of its principal if the issuer, obligor, guarantor or counterparty defaults on its obligation. The Fund may also invest in IO or PO stripped mortgage-backed securities. Payments received for POs are treated as reductions to the cost and par value of the securities.
Offsetting of assets and liabilities
The following table presents the Fund’s gross and net amount of assets and liabilities available for offset under netting arrangements as well as any related collateral received or pledged by the Fund as of August 31, 2019:
| | Citi ($)(a) | Citi ($)(a) | Goldman
Sachs
International ($) | JPMorgan ($)(a) | JPMorgan ($)(a) | Morgan
Stanley ($)(a) | Morgan
Stanley ($)(a) | UBS ($) | Total ($) |
| Assets | | | | | | | | | |
| Centrally cleared credit default swap contracts(b) | - | - | - | - | - | - | 198,022 | - | 198,022 |
| Centrally cleared interest rate swap contracts(b) | - | - | - | - | - | - | 70,955 | - | 70,955 |
| Forward foreign currency exchange contracts | - | - | - | - | - | 513,766 | - | 357,195 | 870,961 |
| OTC credit default swap contracts(c) | 3,876,156 | - | - | 1,285,500 | - | - | - | - | 5,161,656 |
| Total assets | 3,876,156 | - | - | 1,285,500 | - | 513,766 | 268,977 | 357,195 | 6,301,594 |
| Liabilities | | | | | | | | | |
| Centrally cleared interest rate swap contracts(b) | - | - | - | - | - | - | 413,904 | - | 413,904 |
| Options contracts written | - | 12,772,909 | - | - | - | 1,543,605 | - | - | 14,316,514 |
| OTC interest rate swap contracts(c) | - | - | 3,020,120 | - | 2,243,043 | 1,945,971 | - | - | 7,209,134 |
| Total liabilities | - | 12,772,909 | 3,020,120 | - | 2,243,043 | 3,489,576 | 413,904 | - | 21,939,552 |
| Total financial and derivative net assets | 3,876,156 | (12,772,909) | (3,020,120) | 1,285,500 | (2,243,043) | (2,975,810) | (144,927) | 357,195 | (15,637,958) |
| Total collateral received (pledged)(d) | 3,432,000 | (10,316,000) | (2,940,000) | 1,285,500 | (2,190,000) | (1,624,000) | (144,927) | - | (12,497,427) |
| Net amount(e) | 444,156 | (2,456,909) | (80,120) | - | (53,043) | (1,351,810) | - | 357,195 | (3,140,531) |
Columbia Strategic Income Fund | Annual Report 2019
| 69 |
Notes to Financial Statements (continued)
August 31, 2019
| (a) | Exposure can only be netted across transactions governed under the same master agreement with the same legal entity. |
| (b) | Centrally cleared swaps are included within payable/receivable for variation margin on the Statement of Assets and Liabilities. |
| (c) | Over-the-Counter (OTC) swap contracts are presented at market value plus periodic payments receivable (payable), which is comprised of unrealized appreciation, unrealized depreciation, upfront payments and upfront receipts. |
| (d) | In some instances, the actual collateral received and/or pledged may be more than the amount shown due to overcollateralization. |
| (e) | Represents the net amount due from/(to) counterparties in the event of default. |
Security transactions
Security transactions are accounted for on the trade date. Cost is determined and gains (losses) are based upon the specific identification method for both financial statement and federal income tax purposes.
The trade date for senior loans purchased in the primary market is the date on which the loan is allocated. The trade date for senior loans purchased in the secondary market is the date on which the transaction is entered into.
Income recognition
Interest income is recorded on an accrual basis. Market premiums and discounts, including original issue discounts, are amortized and accreted, respectively, over the expected life of the security on all debt securities, unless otherwise noted. The Fund classifies gains and losses realized on prepayments received on mortgage-backed securities as adjustments to interest income.
The Fund may place a debt security on non-accrual status and reduce related interest income when it becomes probable that the interest will not be collected and the amount of uncollectible interest can be reasonably estimated. A defaulted debt security is removed from non-accrual status when the issuer resumes interest payments or when collectibility of interest is reasonably assured.
Corporate actions and dividend income are generally recorded net of any non-reclaimable tax withholdings, on the ex-dividend date or upon receipt of ex-dividend notification in the case of certain foreign securities.
The Fund may receive distributions from holdings in equity securities, business development companies (BDCs), exchange-traded funds (ETFs), limited partnerships (LPs), other regulated investment companies (RICs), and real estate investment trusts (REITs), which report information on the tax character of their distributions annually. These distributions are allocated to dividend income, capital gain and return of capital based on actual information reported. Return of capital is recorded as a reduction of the cost basis of securities held. If the Fund no longer owns the applicable securities, return of capital is recorded as a realized gain. With respect to REITs, to the extent actual information has not yet been reported, estimates for return of capital are made by the Fund’s management. Management’s estimates are subsequently adjusted when the actual character of the distributions is disclosed by the REITs, which could result in a proportionate change in return of capital to shareholders.
Awards from class action litigation are recorded as a reduction of cost basis if the Fund still owns the applicable securities on the payment date. If the Fund no longer owns the applicable securities, the proceeds are recorded as realized gains.
The value of additional securities received as an income payment through a payment in kind, if any, is recorded as interest income and increases the cost basis of such securities.
The Fund may receive other income from senior loans, including amendment fees, consent fees and commitment fees. These fees are recorded as income when received by the Fund. These amounts are included in Interest Income in the Statement of Operations.
Expenses
General expenses of the Trust are allocated to the Fund and other funds of the Trust based upon relative net assets or other expense allocation methodologies determined by the nature of the expense. Expenses directly attributable to the Fund are charged to the Fund. Expenses directly attributable to a specific class of shares are charged to that share class.
| 70 | Columbia Strategic Income Fund | Annual Report 2019 |
Notes to Financial Statements (continued)
August 31, 2019
Determination of class net asset value
All income, expenses (other than class-specific expenses, which are charged to that share class, as shown in the Statement of Operations) and realized and unrealized gains (losses) are allocated to each class of the Fund on a daily basis, based on the relative net assets of each class, for purposes of determining the net asset value of each class.
Federal income tax status
The Fund intends to qualify each year as a regulated investment company under Subchapter M of the Internal Revenue Code, as amended, and will distribute substantially all of its investment company taxable income and net capital gain, if any, for its tax year, and as such will not be subject to federal income taxes. In addition, the Fund intends to distribute in each calendar year substantially all of its ordinary income, capital gain net income and certain other amounts, if any, such that the Fund should not be subject to federal excise tax. Therefore, no federal income or excise tax provision is recorded.
Foreign taxes
The Fund may be subject to foreign taxes on income, gains on investments or currency repatriation, a portion of which may be recoverable. The Fund will accrue such taxes and recoveries, as applicable, based upon its current interpretation of tax rules and regulations that exist in the markets in which it invests.
Realized gains in certain countries may be subject to foreign taxes at the Fund level, based on statutory rates. The Fund accrues for such foreign taxes on realized and unrealized gains at the appropriate rate for each jurisdiction, as applicable. The amount, if any, is disclosed as a liability on the Statement of Assets and Liabilities.
Distributions to shareholders
Distributions from net investment income, if any, are declared and paid monthly. Net realized capital gains, if any, are distributed at least annually. Income distributions and capital gain distributions are determined in accordance with federal income tax regulations, which may differ from GAAP.
Guarantees and indemnifications
Under the Trust’s organizational documents and, in some cases, by contract, its officers and trustees are indemnified against certain liabilities arising out of the performance of their duties to the Trust or its funds. In addition, certain of the Fund’s contracts with its service providers contain general indemnification clauses. The Fund’s maximum exposure under these arrangements is unknown since the amount of any future claims that may be made against the Fund cannot be determined, and the Fund has no historical basis for predicting the likelihood of any such claims.
Recent accounting pronouncements
Accounting Standards Update 2017-08 Premium Amortization on Purchased Callable Debt Securities
In March 2017, the Financial Accounting Standards Board issued Accounting Standards Update (ASU) No. 2017-08 Premium Amortization on Purchased Callable Debt Securities. ASU No. 2017-08 updates the accounting standards to shorten the amortization period for certain purchased callable debt securities, held at a premium, to be amortized to the earliest call date. The update applies to securities with explicit, noncontingent call features that are callable at fixed prices and on preset dates. The standard is effective for annual periods beginning after December 15, 2018 and interim periods within those fiscal years. Management does not expect the implementation of this guidance to have a material impact on the financial statement amounts and footnote disclosures.
Accounting Standards Update 2018-13 Disclosure Framework - Changes to the Disclosure Requirements for Fair Value Measurement
In August 2018, the Financial Accounting Standards Board issued Accounting Standards Update (ASU) No. 2018-13 Disclosure Framework - Changes to the Disclosure Requirements for Fair Value Measurement. The standard is effective for annual periods beginning after December 15, 2019 and interim periods within those fiscal years, with early adoption permitted. After evaluation, management determined to adopt the ASU effective for the period ended August 31, 2019 and all subsequent periods. As a result of the amendments, management implemented disclosure changes which include removal
Columbia Strategic Income Fund | Annual Report 2019
| 71 |
Notes to Financial Statements (continued)
August 31, 2019
of the amount and reasons for transfers between Level 1 and Level 2 of the fair value hierarchy, removal of the policy for the timing of transfers between levels, removal of the description of the Level 3 valuation processes, as well as modifications to the measurement uncertainty disclosure.
Disclosure Update and Simplification
In September 2018, the Securities and Exchange Commission (SEC) released Final Rule 33-10532, Disclosure Update and Simplification, which amends certain financial statement disclosure requirements that the SEC determined to be redundant, outdated, or superseded in light of other SEC disclosure requirements, GAAP, or changes in the information environment. As a result of the amendments, management implemented disclosure changes which included removing the components of distributable earnings presented on the Statement of Assets and Liabilities and combining income and gain distributions paid to shareholders as presented on the Statement of Changes in Net Assets. Any values presented to meet prior year requirements were left unchanged. The amendments had no effect on the Fund’s net assets or results of operation.
Note 3. Fees and other transactions with affiliates
Management services fees
The Fund has entered into a Management Agreement with Columbia Management Investment Advisers, LLC (the Investment Manager), a wholly-owned subsidiary of Ameriprise Financial, Inc. (Ameriprise Financial). Under the Management Agreement, the Investment Manager provides the Fund with investment research and advice, as well as administrative and accounting services. The management services fee is an annual fee that is equal to a percentage of the Fund’s daily net assets that declines from 0.600% to 0.393% as the Fund’s net assets increase. The effective management services fee rate for the year ended August 31, 2019 was 0.560% of the Fund’s average daily net assets.
Compensation of board members
Members of the Board of Trustees who are not officers or employees of the Investment Manager or Ameriprise Financial are compensated for their services to the Fund as disclosed in the Statement of Operations. These members of the Board of Trustees may participate in a Deferred Compensation Plan (the Deferred Plan) which may be terminated at any time. Obligations of the Deferred Plan will be paid solely out of the Fund’s assets, and all amounts payable under the Deferred Plan constitute a general unsecured obligation of the Fund.
Compensation of Chief Compliance Officer
The Board of Trustees has appointed a Chief Compliance Officer to the Fund in accordance with federal securities regulations. As disclosed in the Statement of Operations, a portion of the Chief Compliance Officer’s total compensation is allocated to the Fund, along with other allocations to affiliated registered investment companies managed by the Investment Manager and its affiliates, based on relative net assets.
Transfer agency fees
Under a Transfer and Dividend Disbursing Agent Agreement, Columbia Management Investment Services Corp. (the Transfer Agent), an affiliate of the Investment Manager and a wholly-owned subsidiary of Ameriprise Financial, is responsible for providing transfer agency services to the Fund. The Transfer Agent has contracted with DST Asset Manager Solutions, Inc. (DST) to serve as sub-transfer agent. The Transfer Agent pays the fees of DST for services as sub-transfer agent and DST is not entitled to reimbursement for such fees from the Fund (with the exception of out-of-pocket fees).
The Fund pays the Transfer Agent a monthly transfer agency fee based on the number or the average value of accounts, depending on the type of account. In addition, the Fund pays the Transfer Agent a fee for shareholder services based on the number of accounts or on a percentage of the average aggregate value of the Fund’s shares maintained in omnibus accounts up to the lesser of the amount charged by the financial intermediary or a cap established by the Board of Trustees from time to time.
| 72 | Columbia Strategic Income Fund | Annual Report 2019 |
Notes to Financial Statements (continued)
August 31, 2019
The Transfer Agent also receives compensation from the Fund for various shareholder services and reimbursements for certain out-of-pocket fees. Total transfer agency fees for Institutional 2 Class and Institutional 3 Class shares are subject to an annual limitation of not more than 0.07% and 0.02%, respectively, of the average daily net assets attributable to each share class.
For the year ended August 31, 2019, the Fund’s effective transfer agency fee rates as a percentage of average daily net assets of each class were as follows:
| | Effective rate (%) |
| Class A | 0.10 |
| Advisor Class | 0.10 |
| Class C | 0.10 |
| Institutional Class | 0.10 |
| Institutional 2 Class | 0.06 |
| Institutional 3 Class | 0.01 |
| Class R | 0.10 |
| Class T | 0.02(a) |
An annual minimum account balance fee of $20 may apply to certain accounts with a value below the applicable share class’s initial minimum investment requirements to reduce the impact of small accounts on transfer agency fees. These minimum account balance fees are remitted to the Fund and recorded as part of expense reductions in the Statement of Operations. For the year ended August 31, 2019, no minimum account balance fees were charged by the Fund.
Distribution and service fees
The Fund has entered into an agreement with Columbia Management Investment Distributors, Inc. (the Distributor), an affiliate of the Investment Manager and a wholly-owned subsidiary of Ameriprise Financial, for distribution and shareholder services. The Board of Trustees has approved, and the Fund has adopted, distribution and shareholder service plans (the Plans) applicable to certain share classes, which set the distribution and service fees for the Fund. These fees are calculated daily and are intended to compensate the Distributor and/or eligible selling and/or servicing agents for selling shares of the Fund and providing services to investors.
Under the Plans, the Fund pays a monthly service fee to the Distributor at the maximum annual rate of 0.25% of the average daily net assets attributable to Class A, Class C and Class T shares of the Fund. Also under the Plans, the Fund pays a monthly distribution fee to the Distributor at the maximum annual rates of 0.75%, 0.50% and 0.25% of the average daily net assets attributable to Class C, Class R and Class T shares of the Fund, respectively. As a result of all Class T shares of the Fund being redeemed or converted to Class A shares, December 14, 2018 was the last day the Fund paid a distribution and shareholder services fee for Class T shares.
Although the Fund may have paid a distribution fee up to 0.25% of the Fund’s average daily net assets attributable to Class T shares and a service fee of up to 0.25% of the Fund’s average daily net assets attributable to Class T shares, the aggregate fee shall not exceed 0.25% of the Fund’s average daily net assets attributable to Class T shares.
Sales charges (unaudited)
Sales charges, including front-end charges and contingent deferred sales charges (CDSC), received by the Distributor for distributing Fund shares for the year ended August 31, 2019, if any, are listed below:
| | Front End (%) | CDSC (%) | Amount ($) |
| Class A | 4.75 | 0.50 - 1.00(a) | 1,234,181 |
| Class C | — | 1.00(b) | 27,566 |
| Class T | 2.50 | — | — |
| (a) | This charge is imposed on certain investments of between $1 million and $50 million redeemed within 18 months after purchase, as follows: 1.00% if redeemed within 12 months after purchase, and 0.50% if redeemed more than 12, but less than 18, months after purchase, with certain limited exceptions. |
| (b) | This charge applies to redemptions within 12 months after purchase, with certain limited exceptions. |
Columbia Strategic Income Fund | Annual Report 2019
| 73 |
Notes to Financial Statements (continued)
August 31, 2019
The Fund’s other share classes are not subject to sales charges.
Expenses waived/reimbursed by the Investment Manager and its affiliates
The Investment Manager and certain of its affiliates have contractually agreed to waive fees and/or reimburse expenses (excluding certain fees and expenses described below) for the period(s) disclosed below, unless sooner terminated at the sole discretion of the Board of Trustees, so that the Fund’s net operating expenses, after giving effect to fees waived/expenses reimbursed and any balance credits and/or overdraft charges from the Fund’s custodian, do not exceed the following annual rate(s) as a percentage of the class’ average daily net assets:
| | January 1, 2019
through
December 31, 2019 | Prior to
January 1, 2019 |
| Class A | 1.05% | 1.05% |
| Advisor Class | 0.80 | 0.80 |
| Class C | 1.80 | 1.80 |
| Institutional Class | 0.80 | 0.80 |
| Institutional 2 Class | 0.76 | 0.75 |
| Institutional 3 Class | 0.71 | 0.71 |
| Class R | 1.30 | 1.30 |
Under the agreement governing these fee waivers and/or expense reimbursement arrangements, the following fees and expenses are excluded from the waiver/reimbursement commitment, and therefore will be paid by the Fund, if applicable: taxes (including foreign transaction taxes), expenses associated with investments in affiliated and non-affiliated pooled investment vehicles (including mutual funds and exchange-traded funds), transaction costs and brokerage commissions, costs related to any securities lending program, dividend expenses associated with securities sold short, inverse floater program fees and expenses, transaction charges and interest on borrowed money, interest, infrequent and/or unusual expenses and any other expenses the exclusion of which is specifically approved by the Board of Trustees. This agreement may be modified or amended only with approval from the Investment Manager, certain of its affiliates and the Fund. Any fees waived and/or expenses reimbursed under the expense reimbursement arrangements described above are not recoverable by the Investment Manager or its affiliates in future periods.
Note 4. Federal tax information
The timing and character of income and capital gain distributions are determined in accordance with income tax regulations, which may differ from GAAP because of temporary or permanent book to tax differences.
At August 31, 2019, these differences were primarily due to differing treatment for deferral/reversal of wash sale losses, trustees’ deferred compensation, derivative investments, tax straddles, capital loss carryforward, swap investments, principal and/or interest of fixed income securities, distribution reclassifications, foreign capital gains tax, investments in partnerships, and foreign currency transactions. To the extent these differences were permanent, reclassifications were made among the components of the Fund’s net assets. Temporary differences do not require reclassifications.
The following reclassifications were made:
Undistributed net
investment
income ($) | Accumulated
net realized
(loss) ($) | Paid in
capital ($) |
| (30,636,356) | 30,636,356 | — |
Net investment income (loss) and net realized gains (losses), as disclosed in the Statement of Operations, and net assets were not affected by this reclassification.
| 74 | Columbia Strategic Income Fund | Annual Report 2019 |
Notes to Financial Statements (continued)
August 31, 2019
The tax character of distributions paid during the years indicated was as follows:
| Year Ended August 31, 2019 | Year Ended August 31, 2018 |
Ordinary
income ($) | Long-term
capital gains ($) | Total ($) | Ordinary
income ($) | Long-term
capital gains ($) | Total ($) |
| 208,796,886 | — | 208,796,886 | 166,123,050 | 17,932,427 | 184,055,477 |
Short-term capital gain distributions, if any, are considered ordinary income distributions for tax purposes.
At August 31, 2019, the components of distributable earnings on a tax basis were as follows:
Undistributed
ordinary income ($) | Undistributed
long-term
capital gains ($) | Capital loss
carryforwards ($) | Net unrealized
appreciation ($) |
| 12,983,996 | — | (38,721,549) | 72,928,911 |
At August 31, 2019, the cost of all investments for federal income tax purposes along with the aggregate gross unrealized appreciation and depreciation based on that cost was:
Federal
tax cost ($) | Gross unrealized
appreciation ($) | Gross unrealized
(depreciation) ($) | Net unrealized
appreciation ($) |
| 5,438,255,548 | 207,725,138 | (134,796,227) | 72,928,911 |
Tax cost of investments and unrealized appreciation/(depreciation) may also include timing differences that do not constitute adjustments to tax basis.
The following capital loss carryforwards, determined at August 31, 2019, may be available to reduce taxable income arising from future net realized gains on investments, if any, to the extent permitted by the Internal Revenue Code. Capital loss carryforwards with no expiration are required to be utilized prior to any capital losses which carry an expiration date. As a result of this ordering rule, capital loss carryforwards which carry an expiration date may be more likely to expire unused. In addition, for the year ended August 31, 2019, capital loss carryforwards utilized and expired unused, if any, were as follows:
No expiration
short-term ($) | No expiration
long-term ($) | Total ($) | Utilized ($) | Expired ($) |
| (4,812,609) | (33,908,940) | (38,721,549) | — | — |
Management of the Fund has concluded that there are no significant uncertain tax positions in the Fund that would require recognition in the financial statements. However, management’s conclusion may be subject to review and adjustment at a later date based on factors including, but not limited to, new tax laws, regulations, and administrative interpretations (including relevant court decisions). Generally, the Fund’s federal tax returns for the prior three fiscal years remain subject to examination by the Internal Revenue Service.
Note 5. Portfolio information
The cost of purchases and proceeds from sales of securities, excluding short-term investments and derivatives, if any, aggregated to $9,199,353,840 and $8,388,717,671, respectively, for the year ended August 31, 2019, of which $6,265,924,951 and $5,990,481,863, respectively, were U.S. government securities. The amount of purchase and sale activity impacts the portfolio turnover rate reported in the Financial Highlights.
Note 6. Affiliated money market fund
The Fund invests in Columbia Short-Term Cash Fund, an affiliated money market fund established for the exclusive use by the Fund and other affiliated funds (the Affiliated MMF). The income earned by the Fund from such investments is included as Dividends - affiliated issuers in the Statement of Operations. As an investing fund, the Fund indirectly bears its proportionate share of the expenses of the Affiliated MMF. The Affiliated MMF prices its shares with a floating net asset value. In addition,
Columbia Strategic Income Fund | Annual Report 2019
| 75 |
Notes to Financial Statements (continued)
August 31, 2019
the Board of Trustees of the Affiliated MMF may impose a fee on redemptions (sometimes referred to as a liquidity fee) or temporarily suspend redemptions (sometimes referred to as imposing a redemption gate) in the event its liquidity falls below regulatory limits.
Note 7. Interfund lending
Pursuant to an exemptive order granted by the Securities and Exchange Commission, the Fund participates in a program (the Interfund Program) allowing each participating Columbia Fund (each, a Participating Fund) to lend money directly to and, except for closed-end funds and money market funds, borrow money directly from other Participating Funds for temporary purposes. The amounts eligible for borrowing and lending under the Interfund Program are subject to certain restrictions.
Interfund loans are subject to the risk that the borrowing fund could be unable to repay the loan when due, and a delay in repayment to the lending fund could result in lost opportunities and/or additional lending costs. The exemptive order is subject to conditions intended to mitigate conflicts of interest arising from the Investment Manager’s relationship with each Participating Fund.
The Fund did not borrow or lend money under the Interfund Program during the year ended August 31, 2019.
Note 8. Line of credit
The Fund has access to a revolving credit facility with a syndicate of banks led by Citibank, N.A., HSBC Bank USA, N.A. and JPMorgan Chase Bank, N.A. whereby the Fund may borrow for the temporary funding of shareholder redemptions or for other temporary or emergency purposes. The credit facility, which is a collective agreement between the Fund and certain other funds managed by the Investment Manager or an affiliated investment manager, severally and not jointly, permits collective borrowings up to $1 billion. Interest is charged to each participating fund based on its borrowings at a rate equal to the higher of (i) the federal funds effective rate, (ii) the one-month LIBOR rate and (iii) the overnight bank funding rate, plus in each case, 1.00%. Each borrowing under the credit facility matures no later than 60 days after the date of borrowing. The Fund also pays a commitment fee equal to its pro rata share of the unused amount of the credit facility at a rate of 0.15% per annum. The commitment fee is included in other expenses in the Statement of Operations. This agreement expires annually in December unless extended or renewed.
The Fund had no borrowings during the year ended August 31, 2019.
Note 9. Significant risks
Credit risk
Credit risk is the risk that the value of debt securities in the Fund’s portfolio may decline because the issuer defaults or otherwise becomes unable or unwilling, or is perceived to be unable or unwilling, to honor its financial obligations, such as making payments to the Fund when due. Rating agencies assign credit ratings to certain debt instruments to indicate their credit risk. Lower rated or unrated debt instruments held by the Fund may present increased credit risk as compared to higher-rated debt instruments.
Derivatives risk
Losses involving derivative instruments may be substantial, because a relatively small movement in the underlying reference (which is generally the price, rate or other economic indicator associated with a security(ies), commodity, currency or index or other instrument or asset) may result in a substantial loss for the Fund. In addition to the potential for increased losses, the use of derivative instruments may lead to increased volatility within the Fund. Derivatives will typically increase the Fund’s exposure to principal risks to which it is otherwise exposed, and may expose the Fund to additional risks, including correlation risk, counterparty risk, hedging risk, leverage risk, liquidity risk and pricing risk.
Foreign securities and emerging market countries risk
Investing in foreign securities may involve certain risks not typically associated with investing in U.S. securities, such as increased currency volatility and risks associated with political, regulatory, economic, social, diplomatic and other conditions or events occurring in the country or region, which may result in significant market volatility. In addition, certain foreign
| 76 | Columbia Strategic Income Fund | Annual Report 2019 |
Notes to Financial Statements (continued)
August 31, 2019
securities may not be as liquid as U.S. securities. Investing in emerging markets may increase these risks and expose the Fund to elevated risks associated with increased inflation, deflation or currency devaluation. To the extent that the Fund concentrates its investment exposure to any one or a few specific countries, the Fund will be particularly susceptible to the risks associated with the conditions, events or other factors impacting those countries or regions and may, therefore, have a greater risk than that of a fund that is more geographically diversified.
High-yield investments risk
Securities and other debt instruments held by the Fund that are rated below investment grade (commonly called "high-yield" or "junk" bonds) and unrated debt instruments of comparable quality expose the Fund to a greater risk of loss of principal and income than a fund that invests solely or primarily in investment grade debt instruments. In addition, these investments have greater price fluctuations, are less liquid and are more likely to experience a default than higher-rated debt instruments. High-yield debt instruments are considered to be predominantly speculative with respect to the issuer’s capacity to pay interest and repay principal.
Interest rate risk
Interest rate risk is the risk of losses attributable to changes in interest rates. In general, if prevailing interest rates rise, the values of debt securities tend to fall, and if interest rates fall, the values of debt securities tend to rise. Actions by governments and central banking authorities can result in increases in interest rates. Increasing interest rates may negatively affect the value of debt securities held by the Fund, resulting in a negative impact on the Fund’s performance and net asset value per share. In general, the longer the maturity or duration of a debt security, the greater its sensitivity to changes in interest rates.
Liquidity risk
Liquidity risk is the risk associated with a lack of marketability of investments which may make it difficult to sell the investment at a desirable time or price. Changing regulatory, market or other conditions or environments (for example, the interest rate or credit environments) may adversely affect the liquidity of the Fund’s investments. The Fund may have to accept a lower selling price for the holding, sell other investments, or forego another, more appealing investment opportunity. Generally, the less liquid the market at the time the Fund sells a portfolio investment, the greater the risk of loss or decline of value to the Fund. A less liquid market can lead to an increase in Fund redemptions, which may negatively impact Fund performance and net asset value per share, including, for example, if the Fund is forced to sell securities in a down market.
Mortgage- and other asset-backed securities risk
The value of any mortgage-backed and other asset-backed securities held by the Fund may be affected by, among other things, changes or perceived changes in: interest rates; factors concerning the interests in and structure of the issuer or the originator of the mortgages or other assets; the creditworthiness of the entities that provide any supporting letters of credit, surety bonds or other credit enhancements; or the market’s assessment of the quality of underlying assets. Payment of principal and interest on some mortgage-backed securities (but not the market value of the securities themselves) may be guaranteed by the full faith and credit of a particular U.S. Government agency, authority, enterprise or instrumentality, and some, but not all, are also insured or guaranteed by the U.S. Government. Mortgage-backed securities issued by non-governmental issuers (such as commercial banks, savings and loan institutions, private mortgage insurance companies, mortgage bankers and other secondary market issuers) may entail greater risk than obligations guaranteed by the U.S. Government. Mortgage- and other asset-backed securities are subject to liquidity risk and prepayment risk. A decline or flattening of housing values may cause delinquencies in the mortgages (especially sub-prime or non-prime mortgages) underlying mortgage-backed securities and thereby adversely affect the ability of the mortgage-backed securities issuer to make principal and/or interest payments to mortgage-backed securities holders, including the Fund. Rising or high interest rates tend to extend the duration of mortgage- and other asset-backed securities, making their prices more volatile and more sensitive to changes in interest rates.
Shareholder concentration risk
At August 31, 2019, one unaffiliated shareholder of record owned 11.9% of the outstanding shares of the Fund in one or more accounts. The Fund has no knowledge about whether any portion of those shares was owned beneficially. Affiliated shareholders of record owned 29.1% of the outstanding shares of the Fund in one or more accounts. Subscription and
Columbia Strategic Income Fund | Annual Report 2019
| 77 |
Notes to Financial Statements (continued)
August 31, 2019
redemption activity by concentrated accounts may have a significant effect on the operations of the Fund. In the case of a large redemption, the Fund may be forced to sell investments at inopportune times, including its liquid positions, which may result in Fund losses and the Fund holding a higher percentage of less liquid positions. Large redemptions could result in decreased economies of scale and increased operating expenses for non-redeeming Fund shareholders.
Note 10. Subsequent events
Management has evaluated the events and transactions that have occurred through the date the financial statements were issued and noted no items requiring adjustment of the financial statements or additional disclosure.
Note 11. Information regarding pending and settled legal proceedings
Ameriprise Financial and certain of its affiliates have historically been involved in a number of legal, arbitration and regulatory proceedings, including routine litigation, class actions, and governmental actions, concerning matters arising in connection with the conduct of their business activities. Ameriprise Financial believes that the Fund is not currently the subject of, and that neither Ameriprise Financial nor any of its affiliates are the subject of, any pending legal, arbitration or regulatory proceedings that are likely to have a material adverse effect on the Fund or the ability of Ameriprise Financial or its affiliates to perform under their contracts with the Fund. Ameriprise Financial is required to make quarterly (10-Q), annual (10-K) and, as necessary, 8-K filings with the Securities and Exchange Commission (SEC) on legal and regulatory matters that relate to Ameriprise Financial and its affiliates. Copies of these filings may be obtained by accessing the SEC website at www.sec.gov.
There can be no assurance that these matters, or the adverse publicity associated with them, will not result in increased Fund redemptions, reduced sale of Fund shares or other adverse consequences to the Fund. Further, although we believe proceedings are not likely to have a material adverse effect on the Fund or the ability of Ameriprise Financial or its affiliates to perform under their contracts with the Fund, these proceedings are subject to uncertainties and, as such, we are unable to estimate the possible loss or range of loss that may result. An adverse outcome in one or more of these proceedings could result in adverse judgments, settlements, fines, penalties or other relief that could have a material adverse effect on the consolidated financial condition or results of operations of Ameriprise Financial.
| 78 | Columbia Strategic Income Fund | Annual Report 2019 |
Report of Independent Registered Public Accounting Firm
To the Board of Trustees of Columbia Funds Series Trust I and Shareholders of Columbia Strategic Income Fund
Opinion on the Financial Statements
We have audited the accompanying statement of assets and liabilities, including the portfolio of investments, of Columbia Strategic Income Fund (one of the funds constituting Columbia Funds Series Trust I, hereafter referred to as the “Fund”) as of August 31, 2019, the related statement of operations for the year ended August 31, 2019, the statement of changes in net assets for each of the two years in the period ended August 31, 2019, including the related notes, and the financial highlights for each of the periods indicated therein (collectively referred to as the “financial statements”). In our opinion, the financial statements present fairly, in all material respects, the financial position of the Fund as of August 31, 2019, the results of its operations for the year then ended, the changes in its net assets for each of the two years in the period ended August 31, 2019 and the financial highlights for each of the periods indicated therein in conformity with accounting principles generally accepted in the United States of America.
Basis for Opinion
These financial statements are the responsibility of the Fund’s management. Our responsibility is to express an opinion on the Fund’s financial statements based on our audits. We are a public accounting firm registered with the Public Company Accounting Oversight Board (United States) (PCAOB) and are required to be independent with respect to the Fund in accordance with the U.S. federal securities laws and the applicable rules and regulations of the Securities and Exchange Commission and the PCAOB.
We conducted our audits of these financial statements in accordance with the standards of the PCAOB. Those standards require that we plan and perform the audit to obtain reasonable assurance about whether the financial statements are free of material misstatement, whether due to error or fraud.
Our audits included performing procedures to assess the risks of material misstatement of the financial statements, whether due to error or fraud, and performing procedures that respond to those risks. Such procedures included examining, on a test basis, evidence regarding the amounts and disclosures in the financial statements. Our audits also included evaluating the accounting principles used and significant estimates made by management, as well as evaluating the overall presentation of the financial statements. Our procedures included confirmation of securities owned as of August 31, 2019, by correspondence with the custodian, transfer agent, agent banks, and brokers; when replies were not received from brokers, we performed other audit procedures. We believe that our audits provide a reasonable basis for our opinion.
/s/PricewaterhouseCoopers LLP
Minneapolis, Minnesota
October 24, 2019
We have served as the auditor of one or more investment companies within the Columbia Funds Complex since 1977.
Columbia Strategic Income Fund | Annual Report 2019
| 79 |
TRUSTEES AND OFFICERS
The Board oversees the Fund’s operations and appoints officers who are responsible for day-to-day business decisions based on policies set by the Board. The following table provides basic biographical information about the Fund’s Trustees as of the printing of this report, including their principal occupations during the past five years, although specific titles for individuals may have varied over the period. The year set forth beneath Length of Service in the table below is the year in which the Trustee was first appointed or elected as Trustee to any Fund currently in the Columbia Funds Complex or a predecessor thereof. Under current Board policy, members serve terms of indefinite duration.
Independent trustees
| Name, address, year of birth | Position held with the Trust and length of service | Principal occupation(s) during the past five years and other relevant professional experience | Number of Funds in the Columbia Fund Complex overseen | Other directorships held by Trustee during the past five years |
Janet Langford Carrig
c/o Columbia Management
Investment Advisers, LLC
225 Franklin Street
Mail Drop BX32 05228
Boston, MA 02110
1957 | Trustee
1996 | Senior Vice President, General Counsel and Corporate Secretary, ConocoPhillips (independent energy company), September 2007-October 2018 | 70 | None |
Douglas A. Hacker
c/o Columbia Management
Investment Advisers, LLC
225 Franklin Street
Mail Drop BX32 05228
Boston, MA 02110
1955 | Trustee and Chairman of the Board
1996 | Independent business executive since May 2006; Executive Vice President — Strategy of United Airlines, December 2002-May 2006; President of UAL Loyalty Services (airline marketing company), September 2001-December 2002; Executive Vice President and Chief Financial Officer of United Airlines, July 1999-September 2001 | 70 | Spartan Nash Company, (food distributor); former Director, Nash Finch Company (food distributor), 2005-2013; Aircastle Limited (aircraft leasing); former Director, SeaCube Container Leasing Ltd. (container leasing), 2010-2013; and Travelport Worldwide Limited (travel information technology) |
Nancy T. Lukitsh
c/o Columbia Management
Investment Advisers, LLC
225 Franklin Street
Mail Drop BX32 05228
Boston, MA 02110
1956 | Trustee
2011 | Senior Vice President, Partner and Director of Marketing, Wellington Management Company, LLP (investment adviser), 1997-2010; Chair, Wellington Management Portfolios (commingled non-U.S. investment pools), 2007-2010; Director, Wellington Trust Company, NA and other Wellington affiliates, 1997-2010 | 70 | None |
David M. Moffett
c/o Columbia Management
Investment Advisers, LLC
225 Franklin Street
Mail Drop BX32 05228
Boston, MA 02110
1952 | Trustee
2011 | Retired. Consultant to Bridgewater and Associates | 70 | Director, CSX Corporation (transportation suppliers); Genworth Financial, Inc. (financial and insurance products and services); PayPal Holdings Inc. (payment and data processing services); Trustee, University of Oklahoma Foundation; former Director, eBay Inc. (online trading community), 2007-2015; and former Director, CIT Bank, CIT Group Inc. (commercial and consumer finance), 2010-2016 |
| 80 | Columbia Strategic Income Fund | Annual Report 2019 |
TRUSTEES AND OFFICERS (continued)
Independent trustees (continued)
| Name, address, year of birth | Position held with the Trust and length of service | Principal occupation(s) during the past five years and other relevant professional experience | Number of Funds in the Columbia Fund Complex overseen | Other directorships held by Trustee during the past five years |
John J. Neuhauser
c/o Columbia Management
Investment Advisers, LLC
225 Franklin Street
Mail Drop BX32 05228
Boston, MA 02110
1943 | Trustee
1984 | President, Saint Michael’s College, August 2007-June 2018; Director or Trustee of several non-profit organizations, including University of Vermont Medical Center; Academic Vice President and Dean of Faculties, Boston College, August 1999-October 2005; University Professor, Boston College, November 2005-August 2007 | 70 | Liberty All-Star Equity Fund and Liberty All- Star Growth Fund (closed-end funds) |
Patrick J. Simpson
c/o Columbia Management
Investment Advisers, LLC
225 Franklin Street
Mail Drop BX32 05228
Boston, MA 02110
1944 | Trustee
2000 | Of Counsel, Perkins Coie LLP (law firm) since 2015; Partner, Perkins Coie LLP, 1988-2014 | 70 | Former Director, M Fund, Inc. (M Funds mutual fund family), July 2018-July 2019 |
Anne-Lee Verville
c/o Columbia Management
Investment Advisers, LLC
225 Franklin Street
Mail Drop BX32 05228
Boston, MA 02110
1945 | Trustee
1998 | Retired. General Manager, Global Education Industry, 1994-1997, President – Application Systems Division, 1991-1994, Chief Financial Officer – US Marketing & Services, 1988-1991, and Chief Information Officer, 1987-1988, IBM Corporation (computer and technology) | 70 | Former Director, Enesco Group, Inc. (producer of giftware and home and garden decor products), 2001-2006 |
Consultants to the Independent Trustees*
| Name, address, year of birth | Position held with the Trust and length of service | Principal occupation(s) during the past five years and other relevant professional experience | Number of Funds in the Columbia Funds complex overseen | Other directorships held by Trustee during the past five years |
J. Kevin Connaughton
c/o Columbia
Management Investment
Advisers, LLC,
225 Franklin Street
Mail Drop BX32 05228,
Boston, MA 02110
1964 | Independent Trustee Consultant
2016 | Independent Trustee Consultant, Columbia Funds since March 2016; Adjunct Professor of Finance, Bentley University since November 2017; Managing Director and General Manager of Mutual Fund Products, Columbia Management Investment Advisers, LLC, May 2010-February 2015; President, Columbia Funds, 2009-2015; and senior officer of Columbia Funds and affiliated funds, 2003-2015 | 70 | Director, The Autism Project since March 2015; former Trustee, New Century Portfolios, March 2015-December 2017; formerly on Board of Governors, Gateway Healthcare, January 2016 – December 2017 |
Columbia Strategic Income Fund | Annual Report 2019
| 81 |
TRUSTEES AND OFFICERS (continued)
Consultants to the Independent Trustees* (continued)
| Name, address, year of birth | Position held with the Trust and length of service | Principal occupation(s) during the past five years and other relevant professional experience | Number of Funds in the Columbia Funds complex overseen | Other directorships held by Trustee during the past five years |
Olive Darragh
c/o Columbia
Management Investment
Advisers, LLC,
225 Franklin Street,
Mail Drop BX32 05228,
Boston, MA 02110
1962 | Independent Trustee Consultant 2019 | Independent Trustee Consultant, Columbia Funds since June 2019; Managing Director of Darragh Inc. (a strategy and talent management consulting firm) since 2010; Founder and CEO, Zolio (an investment management talent identification platform) since 2004; Partner, Tudor Investments, 2004-2010; Senior Partner, McKinsey & Company, 2001-2004 | 70 | Director, University of Edinburgh Business School; former Director, Boston Public Library Foundation |
Natalie A. Trunow
c/o Columbia
Management Investment
Advisers, LLC,
225 Franklin Street
Mail Drop BX32 05228,
Boston, MA 02110
1967 | Independent Trustee Consultant
2016 | Independent Trustee Consultant, Columbia Funds since September 2016; Chief Executive Officer, Millennial Portfolio Solutions LLC (asset management and consulting services) since January 2016; Director of Investments, Casey Family Programs, April 2016-September 2016; Senior Vice President and Chief Investment Officer, Calvert Investments, August 2008-January 2016; Section Head and Portfolio Manager, General Motors Asset Management, June 1997-August 2008 | 70 | Director, Health Services for Children with Special Needs, Inc.; Director, Consumer Credit Counseling Services (formerly Guidewell Financial Solutions) |
| * | J. Kevin Connaughton was appointed consultant to the Independent Trustees effective March 1, 2016. Olive Darragh was appointed consultant to the Independent Trustees effective June 10, 2019. Natalie A. Trunow was appointed consultant to the Independent Trustees effective September 1, 2016. Shareholders of the Funds are expected to be asked to elect each of Mr. Connaughton, Ms. Darragh and Ms. Trunow as a Trustee at a future shareholder meeting. |
Interested trustee affiliated with Investment Manager*
| Name, address, year of birth | Position held with the Trust and length of service | Principal occupation(s) during the past five years and other relevant professional experience | Number of Funds in the Columbia Funds Complex overseen | Other directorships held by Trustee during the past five years |
William F. Truscott
c/o Columbia Management
Investment Advisers, LLC
225 Franklin Street
Boston, MA 02110
1960 | Trustee
2012 | Chairman of the Board and President, Columbia Management Investment Advisers, LLC since May 2010 and February 2012, respectively; Chief Executive Officer, Global Asset Management, Ameriprise Financial, Inc. since September 2012 (previously Chief Executive Officer, U.S. Asset Management & President, Annuities, May 2010-September 2012); Director and Chief Executive Officer, Columbia Management Investment Distributors, Inc. since May 2010 and February 2012, respectively; Chairman of the Board and Chief Executive Officer, RiverSource Distributors, Inc. since 2006; Director, Threadneedle Asset Management Holdings, SARL since 2014; President and Chief Executive Officer, Ameriprise Certificate Company, 2006-August 2012 | 192 | Chairman of the Board, Columbia Management Investment Advisers, LLC since May 2010; Director, Columbia Management Investment Distributors, Inc. since May 2010; former Director, Ameriprise Certificate Company, August 2006 - January 2013 |
| * | Interested person (as defined under the 1940 Act) by reason of being an officer, director, security holder and/or employee of the Investment Manager or Ameriprise Financial. |
The Statement of Additional Information has additional information about the Fund’s Board members and is available, without charge, upon request by calling 800.345.6611, visiting columbiathreadneedleus.com/investor/ or contacting your financial intermediary.
| 82 | Columbia Strategic Income Fund | Annual Report 2019 |
TRUSTEES AND OFFICERS (continued)
The Board has appointed officers who are responsible for day-to-day business decisions based on policies it has established. The officers serve at the pleasure of the Board. The following table provides basic information about the Officers of the Fund as of the printing of this report, including principal occupations during the past five years, although their specific titles may have varied over the period. In addition to Mr. Truscott, who is Senior Vice President, the Fund’s other officers are:
Fund officers
Name,
address and
year of birth | Position and year
first appointed to
position for any Fund
in the Columbia
Funds complex or a
predecessor thereof | Principal occupation(s) during past five years |
Christopher O. Petersen
5228 Ameriprise
Financial Center
Minneapolis, MN 55474
Born 1970 | President and Principal Executive Officer (2015) | Vice President and Lead Chief Counsel, Ameriprise Financial, Inc. since January 2015 (previously Vice President and Chief Counsel, January 2010 - December 2014; officer of Columbia Funds and affiliated funds since 2007. |
Michael G. Clarke
225 Franklin Street
Boston, MA 02110
Born 1969 | Chief Financial Officer (Principal Financial Officer) (2009) and Senior Vice President (2019) | Vice President, Head of North American Operations, and Co-Head of Global Operations, Columbia Management Investment Advisers, LLC, since June 2019 (previously Vice President – Accounting and Tax, May 2010 - May 2019); senior officer of Columbia Funds and affiliated funds since 2002 (previously Treasurer and Chief Accounting Officer, January 2009 - January 2019 and December 2015 - January 2019, respectively). |
Joseph Beranek
5890 Ameriprise
Financial Center
Minneapolis, MN 55474
Born 1965 | Treasurer and Chief Accounting Officer (Principal Accounting Officer) (2019) | Vice President — Mutual Fund Accounting and Financial Reporting, Columbia Management Investment Advisers, LLC, since December 2018 and March 2017, respectively (previously Vice President — Pricing and Corporate Actions, May 2010 - March 2017). |
Paul B. Goucher
485 Lexington Avenue
New York, NY 10017
Born 1968 | Senior Vice President (2011) and Assistant Secretary (2008) | Senior Vice President and Assistant General Counsel, Ameriprise Financial, Inc. since January 2017 (previously Vice President and Lead Chief Counsel, November 2008 - January 2017 and January 2013 - January 2017, respectively); Vice President, Chief Legal Officer and Assistant Secretary, Columbia Management Investment Advisers, LLC since March 2015 (previously Vice President and Assistant Secretary, May 2010 – March 2015). |
Thomas P. McGuire
225 Franklin Street
Boston, MA 02110
Born 1972 | Senior Vice President and Chief Compliance Officer (2012) | Vice President — Asset Management Compliance, Ameriprise Financial, Inc., since May 2010; Chief Compliance Officer, Ameriprise Certificate Company since September 2010. |
Colin Moore
225 Franklin Street
Boston, MA 02110
Born 1958 | Senior Vice President (2010) | Executive Vice President and Global Chief Investment Officer, Ameriprise Financial, Inc., since July 2013; Executive Vice President and Global Chief Investment Officer, Columbia Management Investment Advisers, LLC since July 2013. |
Ryan C. Larrenaga
225 Franklin Street
Boston, MA 02110
Born 1970 | Senior Vice President (2017), Chief Legal Officer (2017), and Secretary (2015) | Vice President and Chief Counsel, Ameriprise Financial, Inc. since August 2018 (previously Vice President and Group Counsel, August 2011 - August 2018); officer of Columbia Funds and affiliated funds since 2005. |
Michael E. DeFao
225 Franklin Street
Boston, MA 02110
Born 1968 | Vice President (2011) and Assistant Secretary (2010) | Vice President and Chief Counsel, Ameriprise Financial, Inc. since May 2010. |
Lyn Kephart-Strong
5228 Ameriprise
Financial Center
Minneapolis, MN 55474
Born 1960 | Vice President (2015) | President, Columbia Management Investment Services Corp. since October 2014; Vice President & Resolution Officer, Ameriprise Trust Company since August 2009. |
Columbia Strategic Income Fund | Annual Report 2019
| 83 |
Board Consideration and Approval of Management
Agreement
On June 12, 2019, the Board of Trustees (the Board) and the Trustees who are not interested persons (as defined in the Investment Company Act of 1940) (the Independent Trustees) of Columbia Funds Series Trust I (the Trust) unanimously approved the continuation of the Management Agreement (the Management Agreement) with Columbia Management Investment Advisers, LLC (the Investment Manager) with respect to Columbia Strategic Income Fund (the Fund), a series of the Trust. As detailed below, the Board’s Advisory Fees and Expenses Committee (the Committee) and the Board met on multiple occasions to review and discuss, among themselves, with the management team of the Investment Manager and with an independent fee consultant, materials provided by the Investment Manager, the independent fee consultant and others before determining to approve the continuation of the Management Agreement.
In connection with their deliberations regarding the continuation of the Management Agreement, the Committee and the Board evaluated materials requested from the Investment Manager regarding the Fund and the Management Agreement, and discussed these materials with representatives of the Investment Manager at Committee meetings held on March 5, 2019, April 25, 2019 and June 11, 2019 and at Board meetings held on March 6, 2019 and June 12, 2019. In addition, the Board and its various committees consider matters bearing on the Management Agreement at other meetings throughout the year and in prior years and meet regularly with senior management of the Trust and the Investment Manager. Through the Board’s Investment Oversight Committees, Trustees also meet with selected portfolio managers of the funds the Trustees oversee and with other investment personnel at various times throughout the year. The Committee and the Board also consulted with the independent fee consultant, Fund counsel and the Independent Trustees’ independent legal counsel, who advised on various matters with respect to the Committee’s and the Board’s considerations and otherwise assisted the Committee and the Board in their deliberations. On June 11, 2019, the Committee recommended that the Board approve the continuation of the Management Agreement. On June 12, 2019, the Board, including the Independent Trustees, voting separately, unanimously approved the continuation of the Management Agreement for the Fund.
The Committee and the Board considered all information that they, their legal counsel or the Investment Manager believed reasonably necessary to evaluate and to determine whether to recommend for approval or approve the continuation of the Management Agreement. The information and factors considered by the Committee and the Board in recommending for approval or approving the continuation of the Management Agreement for the Fund included the following:
| • | Information on the investment performance of the Fund relative to the performance of a group of mutual funds determined to be comparable to the Fund by an independent third-party data provider, as well as performance relative to benchmarks; |
| • | Information on the Fund’s management fees and total expenses, including information comparing the Fund’s expenses to those of a group of comparable mutual funds, as determined by the independent third-party data provider; |
| • | The Investment Manager’s agreement to contractually limit or cap total operating expenses for the Fund through December 31, 2020 so that total operating expenses (excluding certain fees and expenses, such as transaction costs and certain other investment related expenses, interest, taxes, acquired fund fees and expenses, and infrequent and/or unusual expenses) would not exceed a specified annual rate, as a percentage of the Fund’s net assets; |
| • | The terms and conditions of the Management Agreement; |
| • | The current and proposed terms and conditions of other agreements and arrangements with affiliates of the Investment Manager relating to the operations of the Fund, including agreements with respect to the provision of distribution, transfer agency and shareholder services to the Fund; |
| • | Descriptions of various functions performed by the Investment Manager under the Management Agreement, including portfolio management and portfolio trading practices; |
| • | Information regarding the management fees of similarly-managed portfolios of other clients of the Investment Manager, including institutional accounts and collective trusts; |
| • | Information regarding the reputation, regulatory history and resources of the Investment Manager, including information regarding senior management, portfolio managers and other personnel; |
| 84 | Columbia Strategic Income Fund | Annual Report 2019 |
Board Consideration and Approval of Management
Agreement (continued)
| • | Information regarding the capabilities of the Investment Manager with respect to compliance monitoring services, including an assessment of the Investment Manager’s compliance system by the Fund’s Chief Compliance Officer; and |
| • | The profitability to the Investment Manager and its affiliates from their relationships with the Fund. |
Nature, extent and quality of services provided under the Management Agreement
The Committee and the Board considered the nature, extent and quality of services provided to the Fund by the Investment Manager and its affiliates under the Management Agreement and under separate agreements for the provision of transfer agency and shareholder services, and the resources dedicated to the Fund and the other Columbia Funds by the Investment Manager and its affiliates. The Committee and the Board considered, among other things, the Investment Manager’s ability to attract, motivate and retain highly qualified research, advisory and supervisory investment professionals (including compensation programs for personnel involved in fund management, reputation and other attributes), the portfolio management services provided by those investment professionals, and the quality of the Investment Manager’s investment research capabilities and trade execution services. The Committee and the Board also considered the potential benefits to shareholders of investing in a mutual fund that is part of a fund complex offering exposure to a variety of asset classes and investment disciplines and providing a variety of fund and shareholder services.
The Committee and the Board also considered the professional experience and qualifications of the senior personnel of the Investment Manager, which included consideration of the Investment Manager’s experience with funds using an investment strategy similar to that used by the Investment Manager for the Fund. The Committee and the Board noted the compliance programs of and the compliance-related resources provided to the Fund by the Investment Manager and its affiliates and the resources dedicated by the Investment Manager and its affiliates to risk management, and considered the Investment Manager’s ability to provide administrative services to the Fund and coordinate the activities of the Fund’s other service providers. After reviewing these and related factors, the Committee and the Board concluded, within the context of their overall conclusions, that the nature, extent and quality of the services provided to the Fund under the Management Agreement supported the continuation of the Management Agreement.
Investment performance
The Committee and the Board reviewed information about the performance of the Fund over various time periods, including performance information relative to benchmarks, information that compared the performance of the Fund to the performance of a group of comparable mutual funds as determined by the independent third-party data provider, and information and analysis provided by the independent fee consultant. The Committee and the Board also reviewed a description of the third party’s methodology for identifying the Fund’s peer groups for purposes of performance and expense comparisons.
The Committee and the Board noted that, through December 31, 2018, the Fund’s performance was in the thirty-sixth, forty-eighth and twenty-sixth percentile (where the best performance would be in the first percentile) of its category selected by the independent third-party data provider for the purposes of performance comparisons for the one-, three- and five-year periods, respectively.
The Committee and the Board also considered the Investment Manager’s performance and reputation generally, the Investment Manager’s historical responsiveness to Board concerns about performance, and the Investment Manager’s willingness to take steps intended to improve performance. After reviewing these and related factors, the Committee and the Board concluded, within the context of their overall conclusions, that the performance of the Fund and the Investment Manager was sufficient, in light of other considerations, to support the continuation of the Management Agreement.
Investment management fee rates and other expenses
The Committee and the Board considered the management fees charged to the Fund under the Management Agreement as well as the total expenses incurred by the Fund. In assessing the reasonableness of the fees under the Management Agreement, the Committee and the Board considered, among other information, the Fund’s total expense ratio as a percentage of average daily net assets. The Committee and the Board considered data provided by the independent third-party data provider and the independent fee consultant. The Committee and the Board noted that, as of December 31, 2018, the Fund’s actual management fee and net total expense ratio were ranked in the third and second quintiles,
Columbia Strategic Income Fund | Annual Report 2019
| 85 |
Board Consideration and Approval of Management
Agreement (continued)
respectively, (where the lowest fees and expenses would be in the first quintile) against the Fund’s expense universe as determined by the independent third-party data provider for purposes of expense comparison. The Committee and the Board also took into account the fee waiver and expense limitation arrangements agreed to by the Investment Manager, as noted above.
The Committee and the Board also received and considered information about the management fees charged by the Investment Manager to institutional accounts. In considering the fees charged to those accounts, the Committee and the Board took into account, among other things, the Investment Manager’s representations about the differences between managing mutual funds as compared to other types of accounts, including differences in the services provided, differences in the risk profile of such business for the Investment Manager and the additional resources required to manage mutual funds effectively. The Committee and the Board also received and considered information about the fees charged by the Investment Manager for sub-advisory services it provides to comparable unaffiliated funds. In evaluating the Fund’s management fees, the Committee and the Board also took into account the demands, complexity and quality of the investment management of the Fund.
After reviewing these and related factors, the Committee and the Board concluded, within the context of their overall conclusions, that the management fee rates and expenses of the Fund, in light of other considerations, supported the continuation of the Management Agreement.
Costs of services provided and profitability
The Committee and the Board also took note of the costs the Investment Manager and its affiliates incur in connection with the services provided and the profitability to the Investment Manager and its affiliates from their relationships with the Fund, and the efforts undertaken by the Investment Manager and its affiliates to manage efficiently their costs to provide such services.
The Committee and the Board also considered the compensation directly or indirectly received by the Investment Manager’s affiliates in connection with their relationships with the Fund. The Committee and the Board reviewed information provided by management as to the profitability to the Investment Manager and its affiliates of their relationships with the Fund, information about the allocation of expenses used to calculate profitability, and comparisons of profitability levels realized in 2018 to profitability levels realized in 2017. When reviewing profitability, the Committee and the Board also considered court cases in which adviser profitability was an issue in whole or in part, the performance of similarly managed funds, the performance of the Fund, and the expense ratio of the Fund. In addition, the Committee and the Board considered information provided by the Investment Manager regarding the Investment Manager’s financial condition and comparing its profitability to that of other asset management firms that are, or are subsidiaries of, publicly traded companies. In this regard, the Committee and the Board also considered data provided by the independent fee consultant.
After reviewing these and related factors, the Committee and the Board concluded, within the context of their overall conclusions, that the costs of services provided and the profitability to the Investment Manager and its affiliates from their relationships with the Fund supported the continuation of the Management Agreement.
Economies of scale
The Committee and the Board considered the potential existence of economies of scale in the provision by the Investment Manager of services to the Fund, to groups of related funds, and to the Investment Manager’s investment advisory clients as a whole, and whether those economies of scale were shared with the Fund through breakpoints in investment management fees or other means, such as expense limitation arrangements and additional investments by the Investment Manager in investment, trading, compliance and other resources. The Committee and the Board noted that the management fee schedules for the Fund contained breakpoints that would reduce the fee rate on assets above specified threshold levels.
In considering these matters, the Committee and the Board also considered the costs of the services provided and the profitability to the Investment Manager and its affiliates from their relationships with the Fund, as noted above. After reviewing these and related factors, the Committee and the Board concluded, within the context of their overall conclusions, that the extent to which any economies of scale were expected to be shared with the Fund supported the continuation of the Management Agreement.
| 86 | Columbia Strategic Income Fund | Annual Report 2019 |
Board Consideration and Approval of Management
Agreement (continued)
Other benefits to the Investment Manager
The Committee and the Board received and considered information regarding “fall-out” or ancillary benefits received by the Investment Manager and its affiliates as a result of their relationships with the Fund, such as the engagement of the Investment Manager’s affiliates to provide distribution, transfer agency and shareholder services to the Fund. In this regard, among other matters, the Committee and the Board considered that the Fund’s distributor retains a portion of the distribution fees from the Fund and receives a portion of the sales charges on sales or redemptions of certain classes of shares of the Fund. The Committee and the Board also considered the benefits of research made available to the Investment Manager by reason of brokerage commissions generated by the Fund’s securities transactions, and reviewed information about the Investment Manager’s practices with respect to considering brokerage and research services when allocating portfolio transactions. In this connection, the Board also noted that the amount of research made available to the Investment Manager by reason of brokerage commissions had been declining over time, and may decline further. The Committee and the Board recognized that the Investment Manager’s profitability would be somewhat lower without these benefits.
Conclusion
The Committee and the Board reviewed all of the above considerations in reaching their decisions to recommend or approve the continuation of the Management Agreement. In their deliberations, the Trustees did not identify any particular information that was all-important or controlling, and individual Trustees may have attributed different weights to the various factors. Based on their evaluation of all factors that they deemed to be material, including those factors described above, and assisted by the advice of independent legal counsel, the Board, including the Independent Trustees, voting separately, unanimously approved the continuation of the Management Agreement.
Columbia Strategic Income Fund | Annual Report 2019
| 87 |
Columbia Strategic Income Fund
P.O. Box 219104
Kansas City, MO 64121-9104
Please read and consider the investment objectives, risks, charges and expenses for any fund carefully before investing. For a prospectus and summary prospectus, which contains this and other important information about the Fund, go to
columbiathreadneedleus.com/investor/. The Fund is distributed by Columbia Management Investment Distributors, Inc., member FINRA, and managed by Columbia Management Investment Advisers, LLC.
Columbia Threadneedle Investments (Columbia Threadneedle) is the global brand name of the Columbia and Threadneedle group of companies. All rights reserved.
© 2019 Columbia Management Investment Advisers, LLC.
columbiathreadneedleus.com/investor/

Annual Report
August 31, 2019
Multi-Manager International Equity Strategies Fund
Beginning on January 1, 2021, as permitted by regulations adopted by the Securities and Exchange Commission, paper copies of the Fund’s annual and semiannual shareholder reports like this one will no longer be sent by mail, unless you specifically request paper copies of the reports. Instead, the reports will be made available on the Fund’s website (columbiathreadneedleus.com/investor/), and each time a report is posted you will be notified by mail and provided with a website address to access the report.
If you have already elected to receive shareholder reports electronically, you will not be affected by this change and you need not take any action. You may elect to receive shareholder reports and other communications from the Fund electronically at any time by contacting your financial intermediary (such as a broker-dealer or bank) or, for Fund shares held directly with the Fund, by calling 800.345.6611 or by enrolling in “eDelivery” by logging into your account at columbiathreadneedleus.com/investor/.
You may elect to receive all future reports in paper free of charge. If you invest through a financial intermediary, you can contact your financial intermediary to request that you continue receiving paper copies of your shareholder reports. If you invest directly with the Fund, you can call 800.345.6611 to let the Fund know you wish to continue receiving paper copies of your shareholder reports. Your election to receive paper reports will apply to all Columbia Funds held in your account if you invest through a financial intermediary or all Columbia Funds held with the fund complex if you invest directly with the Fund.
Not FDIC Insured • No bank guarantee • May lose value
Multi-Manager International Equity Strategies Fund (the Fund) mails one shareholder report to each shareholder address, unless such shareholder elected to receive shareholder reports from the Fund electronically. If you would like more than one report, please call shareholder services at 800.345.6611 and additional reports will be sent to you.
Proxy voting policies and procedures
The policy of the Board of Trustees is to vote the proxies of the companies in which the Fund holds investments consistent with the procedures as stated in the Statement of Additional Information (SAI). You may obtain a copy of the SAI without charge by calling 800.345.6611; contacting your financial intermediary; visiting columbiathreadneedleus.com/investor/; or searching the website of the Securities and Exchange Commission (SEC) at sec.gov. Information regarding how the Fund voted proxies relating to portfolio securities is filed with the SEC by August 31st for the most recent 12-month period ending June 30th of that year, and is available without charge by visiting columbiathreadneedleus.com/investor/, or searching the website of the SEC at sec.gov.
Quarterly schedule of investments
The Fund files a complete schedule of portfolio holdings with the SEC for the first and third quarters of each fiscal year on Form N-PORT, and for reporting periods ended prior to March 31, 2019, on Form N-Q. The Fund’s Form N-Q and Form N-PORT filings are available on the SEC’s website at sec.gov. The Fund’s complete schedule of portfolio holdings, as filed on Form N-Q or Form N-PORT, can also be obtained without charge, upon request, by calling 800.345.6611.
Additional Fund information
For more information about the Fund, please visit columbiathreadneedleus.com/investor/ or call 800.345.6611. Customer Service Representatives are available to answer your questions Monday through Friday from 8 a.m. to 7 p.m. Eastern time.
Fund investment manager
Columbia Management Investment Advisers, LLC (the Investment Manager)
225 Franklin Street
Boston, MA 02110
Fund distributor
Columbia Management Investment Distributors, Inc.
225 Franklin Street
Boston, MA 02110
Fund transfer agent
Columbia Management Investment Services Corp.
P.O. Box 219104
Kansas City, MO 64121-9104
Multi-Manager International Equity Strategies Fund | Annual Report 2019
Investment objective
The Fund seeks long-term capital appreciation.
Portfolio management
Arrowstreet Capital, Limited Partnership
Peter Rathjens, Ph.D.
John Capeci, Ph.D.
Tuomo Vuolteenaho, Ph.D.
Manolis Liodakis, Ph.D., M.B
Baillie Gifford Overseas Limited
Donald Farquharson, CFA
Angus Franklin
Andrew Stobart
Jenny Tabberer
Tom Walsh, CFA
Causeway Capital Management LLC
Sarah Ketterer, M.B.A.
Harry Hartford
James Doyle, M.B.A.
Conor Muldoon, CFA, M.B.A
Alessandro Valentini, CFA, M.B.A.
Jonathan Eng, M.B.A.
Ellen Lee, M.B.A.
Morningstar style boxTM
The Morningstar Style Box is based on a fund’s portfolio holdings. For equity funds, the vertical axis shows the market capitalization of the stocks owned, and the horizontal axis shows investment style (value, blend, or growth). Information shown is based on the most recent data provided by Morningstar.
© 2019 Morningstar, Inc. All rights reserved. The Morningstar information contained herein: (1) is proprietary to Morningstar and/or its content providers; (2) may not be copied or distributed; and (3) is not warranted to be accurate, complete or timely. Neither Morningstar nor its content providers are responsible for any damages or losses arising from any use of this information.
| Average annual total returns (%) (for the period ended August 31, 2019) |
| | | Inception | 1 Year | Life |
| Institutional Class | 05/17/18 | -5.53 | -6.77 |
| MSCI EAFE Index (Net) | | -3.26 | -5.30 |
All results shown assume reinvestment of distributions during the period. Returns do not reflect the deduction of taxes that a shareholder may pay on Fund distributions or on the redemption of Fund shares. Performance results reflect the effect of any fee waivers or reimbursements of Fund expenses by Columbia Management Investment Advisers, LLC and/or any of its affiliates. Absent these fee waivers or expense reimbursement arrangements, performance results would have been lower.
The performance information shown represents past performance and is not a guarantee of future results. The investment return and principal value of your investment will fluctuate so that your shares, when redeemed, may be worth more or less than their original cost. Current performance may be lower or higher than the performance information shown. You may obtain performance information current to the most recent month-end by contacting your financial intermediary, visiting columbiathreadneedleus.com/investor/ or calling 800.345.6611.
The MSCI EAFE Index (Net) is a free float-adjusted market capitalization index that is designed to measure the equity market performance of developed markets, excluding the U.S. and Canada. The index is compiled from a composite of securities markets of Europe, Australasia and the Far East and is widely recognized by investors in foreign markets as the measurement index for portfolios of non-North American securities.
Indices are not available for investment, are not professionally managed and do not reflect sales charges, fees, brokerage commissions, taxes (except the MSCI EAFE Index (Net), which reflects reinvested dividends net of withholding taxes) or other expenses of investing. Securities in the Fund may not match those in an index.
Multi-Manager International Equity Strategies Fund | Annual Report 2019
| 3 |
Fund at a Glance (continued)
Performance of a hypothetical $10,000 investment (May 17, 2018 — August 31, 2019)
The chart above shows the change in value of a hypothetical $10,000 investment in Institutional Class shares of Multi-Manager International Equity Strategies Fund during the stated time period, and does not reflect the deduction of taxes that a shareholder may pay on Fund distributions or on the redemption of Fund shares.
| Top 10 holdings (%) (at August 31, 2019) |
| SAP SE (Germany) | 1.9 |
| Nestlé SA, Registered Shares (Switzerland) | 1.6 |
| Roche Holding AG, Genusschein Shares (Switzerland) | 1.5 |
| Prudential PLC (United Kingdom) | 1.4 |
| Volkswagen AG (Germany) | 1.4 |
| UniCredit SpA (Italy) | 1.3 |
| BASF SE (Germany) | 1.3 |
| Taiwan Semiconductor Manufacturing Co., Ltd., ADR (Taiwan) | 1.3 |
| Takeda Pharmaceutical Co., Ltd. (Japan) | 1.3 |
| MercadoLibre, Inc. (Argentina) | 1.2 |
Percentages indicated are based upon total investments excluding Money Market Funds and investments in derivatives, if any.
For further detail about these holdings, please refer to the section entitled “Portfolio of Investments.”
Fund holdings are as of the date given, are subject to change at any time, and are not recommendations to buy or sell any security.
| Equity sector breakdown (%) (at August 31, 2019) |
| Communication Services | 8.2 |
| Consumer Discretionary | 12.1 |
| Consumer Staples | 7.3 |
| Energy | 3.8 |
| Financials | 19.8 |
| Health Care | 9.2 |
| Industrials | 19.2 |
| Information Technology | 10.1 |
| Materials | 7.4 |
| Real Estate | 0.5 |
| Utilities | 2.4 |
| Total | 100.0 |
Percentages indicated are based upon total equity investments. The Fund’s portfolio composition is subject to change.
| 4 | Multi-Manager International Equity Strategies Fund | Annual Report 2019 |
Fund at a Glance (continued)
| Country breakdown (%) (at August 31, 2019) |
| Argentina | 1.2 |
| Australia | 3.0 |
| Austria | 0.0(a) |
| Belgium | 0.2 |
| Brazil | 0.6 |
| Canada | 3.5 |
| Chile | 0.0(a) |
| China | 3.6 |
| Colombia | 0.0(a) |
| Cyprus | 0.0(a) |
| Denmark | 1.5 |
| Finland | 0.9 |
| France | 6.6 |
| Germany | 11.5 |
| Greece | 0.0(a) |
| Guernsey | 0.0(a) |
| Hong Kong | 2.2 |
| Ireland | 1.9 |
| Israel | 0.2 |
| Italy | 2.8 |
| Japan | 15.4 |
| Jersey | 0.4 |
| Netherlands | 5.0 |
| New Zealand | 0.1 |
| Norway | 0.1 |
| Panama | 0.5 |
| Peru | 0.4 |
| Russian Federation | 1.1 |
| Singapore | 0.5 |
| South Africa | 1.0 |
| South Korea | 3.0 |
| Spain | 2.3 |
| Sweden | 1.5 |
| Switzerland | 7.1 |
| Taiwan | 1.3 |
| Turkey | 0.1 |
| United Kingdom | 19.0 |
| United States(b) | 1.5 |
| Virgin Islands | 0.0(a) |
| Total | 100.0 |
| (a) | Rounds to zero. |
| (b) | Includes investments in Money Market Funds. |
Country breakdown is based primarily on issuer’s place of organization/incorporation. Percentages indicated are based upon total investments excluding investments in derivatives, if any. The Fund’s portfolio composition is subject to change.
Multi-Manager International Equity Strategies Fund | Annual Report 2019
| 5 |
Manager Discussion of Fund Performance
The Fund is currently managed by three independent money management firms and each invests a portion of the portfolio’s assets. As of August 31, 2019, Arrowstreet Capital, Limited Partnership (Arrowstreet), Baillie Gifford Overseas Limited (Baillie Gifford) and Causeway Capital Management LLC (Causeway) managed approximately 30.6%, 36.7% and 32.7% of the portfolio, respectively.
For the 12-month period ended August 31, 2019, the Fund’s Institutional Class shares returned -5.53%. The Fund underperformed its benchmark, the MSCI EAFE Index (Net), which returned -3.26% for the same time period. The Fund’s value orientation contributed to underperformance as growth stocks continued their post-financial crisis strength.
Markets faced growth concerns, trade tensions
Global trade trended down in the second half of 2018, and markets saw a sell-off, but that trend reversed early in 2019 on signs of economic stability. GDP for the first quarter, for example, was better than expected in many developed economies and survey data showed manufacturing activity picking up from December levels. In addition, Chinese activity showed signs of resilience. There have been a few signs of improved economic stability in the Eurozone, but without any strong evidence of a rebound. Growth in the Asia Pacific region, meanwhile, has been steady, supported by a stabilization in global goods trade – albeit at weak levels. At the same time, renewed escalation of trade tensions between the U.S. and China reignited concerns of recession in major economies. Lower demand in foreign markets amid trade concerns pressured U.S. exports near the end of the period and hiring stalled, reflecting a deteriorating outlook for businesses.
Money management firms delivered results based on variety of strategies
Arrowstreet:As a quantitatively oriented manager, the primary determinant of our strategy’s success or failure tends to be the success of our expected return forecasting models. Our strategy underperformed the MSCI EAFE Index (Net) during the period primarily because our equity return forecasting performance was below our targets. In terms of signal groups that posed the biggest headwinds over the past year, value was the worst performing signal group in our basket model and price momentum was the worst performing signal group in our stock model.
Financials was the top contributing sector for the period, as the Fund benefited from favorable stock selection as well as an underweight position relative to the MSCI EAFE Index (Net) in the U.K. Utilities was also a top contributor, mainly due to an overweight to Italian utilities. Energy also contributed due to our opportunistic overweight allocation to Russian energy. However, one of the largest sector active overweights in our portion of the Fund’s portfolio, information technology, detracted from performance. An overweight allocation and weak stock selection within Japanese IT were the main drivers of underperformance in this sector. Allocation within consumer staples also hurt performance, mainly due to underweights to Switzerland and France.
Among individual countries, Italy, the largest country overweight in our portion of the Fund’s portfolio, was a top contributor for the period due to an overweight to Italian utilities. The U.K. also contributed, primarily due to positive stock selection in consumer staples and an underweight to financials as noted above. France, meanwhile, detracted from results, due in part to weak selection within consumer discretionary, as well as an underweight and weak selection within industrials. Australia was another country detractor, primarily due to an overweight and weak selection within health care.
Contributors to Fund performance included Enel SPA, an Italian utility; Gazprom, a Russian energy company; and Roche Holdings, a Swiss health care company. Detractors included Nestle, a Swiss consumer staples company; CSL Ltd., an Australian health care company; and in Japanese financials, Dai-Ichi Life Holdings.
During the period, we added to exposure to the U.K. in our portion of the Fund’s portfolio though an increase in our exposure to materials. We also increased exposure to Germany, mainly by increasing our position in German financials. On the other hand, the largest negative country shift in our portion of the Fund’s portfolio was within Japan, where we reduced exposure to both health care and materials. We also reduced exposure to the Netherlands in Dutch industrials and financials.
Baillie Gifford: Our portion of the Fund is managed against the MSCI ACWI ex-US Growth Index (Net), which it underperformed for the period. Strong stock selection in emerging markets was offset by poor stock selection in the U.K., while favorable stock selection in industrials was offset by sub-par performance in financials.
| 6 | Multi-Manager International Equity Strategies Fund | Annual Report 2019 |
Manager Discussion of Fund Performance (continued)
In addition to financials, consumer staples and utilities detracted from performance. The Fund was overweight in financials, underweight in consumer staples and had no positions in utilities. Stock selection in financials and asset allocation in consumer staples were the primary drivers of underperformance. Meanwhile, industrials, information technology and communication services all contributed to performance during the period. Stock selection was the primary driver of performance in all three sectors.
Among, holdings, MercadoLIbre, Endenred, and Constellation Software were leading contributors to Fund performance. MercadoLibre, the Latin American e-commerce retailer, has been investing heavily, and sensibly, in our opinion, in its logistic network. We trimmed our portion of the Fund’s position in the stock following a period of extremely strong performance. Edenred, the French prepaid corporate services business, has for some time been converting a sizable portion of its business to a digital platform. This allows the company to target smaller clients, while facilitating innovation in areas such as mobile payments and meal delivery services. Constellation Services, a Canadian software company, has proved itself to be an excellent allocator of capital, although some of the smaller deals it prefers have been harder to find.
Ryanair, ASOS, and Discovery were the largest detractors from performance during the period. Ryanair, the Irish low-cost airline, faced weak passenger demand in Europe, volatile oil prices and cost pressures. In the face of this, Ryanair has added capacity to increase pressure on its competitors. ASOS, the U.K. online fashion retailer, showed particular weakness in late 2018 and early 2019. In spite of this, the company has highlighted a number of positive developments since last year’s profit warning, including a new warehouse in Atlanta, which is delivering faster shipments to seven large U.S. cities. Discovery, the South African-based insurance company, has performed poorly despite impressive growth. While the company has reduced debt, forward guidance has been seen as insufficient or unachievable.
Additions to our portion of the Fund during the period included Holland-based ASML, a leading developer and manufacturer of lithography equipment. The company has consistently gained market share through innovation, at the expense of weaker competitors. Kuehne & Nagel, a Swiss freight forward company was also added to the Fund. While the market has worried about slowing global trade, we saw this as an opportunity to take a holding in what we consider a well-managed cash-generative business. Another purchase was Takeaway.com, a Dutch food delivery business. It has leading market positions in several European countries.
We sold our portion of the Fund’s position in Taiwan-based Hon Hai Precision Industry, better known as Foxconn, the world’s largest provider of outsourced electronics manufacturing services. While we admire the company’s willingness to invest for the long term and its ability to deliver on major new product introductions for electronics giants, it has become harder for the company to grow. We also sold Rolls Royce, a company whose long-term maintenance contracts makes up most of the value of the business, and one that we think needs to do more to deliver attractive operating margins. SGS, a Swiss testing, inspection and certification company whose clients include oil traders, clothing manufacturers, and governments, was also sold. The company has proved resilient at meeting challenging market environments, but we feel there are other stocks that can offer faster growth potential and lower valuations.
Causeway: Our portion of the Fund is managed against the MSCI EAFE Value Index (Net), which it underperformed for the period. The Fund’s underperformance relative to the MSCI EAFE Value Index (Net) was primarily due to stock selection. That said, the Fund’s value orientation has been out of favor for some time. Growth stocks have outperformed value stocks since the global financial crisis, resulting in the widest valuation gap between the two styles in decades. Some of the steepest multiple increases have come from companies expanding their revenues in excess of the competition, but delivering minimal, if any, earnings.
The top performing sectors for our portion of the Fund during the period were health care, materials, and consumer discretionary, as the portfolio benefited from stock selection in all three sectors. Our portion of the Fund maintained an overweight position in health care, an overweight position in materials, and an underweight position in consumer discretionary. Within the MSCI EAFE Value Index (Net), health care delivered positive absolute returns in local currency terms, while materials and consumer discretionary delivered negative absolute returns in local currency terms. The biggest detractors were communication services, energy, and utilities, due primarily to stock selection in communication services and energy, but also due to an underweight position in utilities.
Multi-Manager International Equity Strategies Fund | Annual Report 2019
| 7 |
Manager Discussion of Fund Performance (continued)
Leading contributors to Fund performance included AstraZeneca, Linde and Gildan Activewear. The British pharmaceutical company AstraZeneca successfully navigated a patent cliff and continued a pattern of new product launches. We continued to be optimistic regarding the company’s pipeline-driven margin expansion potential. Linde Plc, a German industrial gas company, completed a merger with U.S.-listed peer Praxair in 2018 and, we believe, has begun to extract synergies from the deal, as well as increased pricing in its operating regions, which should support higher margins. Gildan Activewear, a Canadian apparel manufacturer, consistently reported solid operating results during the period, including strong margins and growth drivers.
Top detractors included Encana, Baidu, and BASF SE. Encana, a Canadian oil and natural gas producer, made a poorly-received acquisition during the period of U.S.-listed Newfield Exploration. Despite providing some positive integration updates, Encana remains a “show me” story as the market awaits evidence of positive operating results in the Anadarko basin under Encana ownership. With the shares continuing to trade at an unattractive valuation, we believe the risk/reward profile remains compelling. Baidu, a Chinese internet services provider, underperformed as macroeconomic headwinds, driven by U.S.-China trade tensions, and aggressive investment led to weaker earnings figures. We continue to find the investment attractive as its core search business trades at a discount. BASF SE, the German diversified chemicals manufacturer, reported weaker earnings figures from softer global auto sales, a demand shortfall in China fueled by the trade conflict with the U.S., and a deteriorating outlook in Europe (partially related to Brexit concerns). We believe the potential for share buybacks and dividend increases could support the share price going forward.
Purchases during the period included Total, a French global oil and gas company, which has benefited from production growth, reduced operating costs, and a more favorable commodity price environment, all of which have bolstered the company’s free cash flow. Another purchase was Siemens, a German multinational industrial conglomerate. Siemens’s leading market share in automation allows the company to spend more on innovation relative to peers and we believe this cash generative business will give Siemens the opportunity to drive improvements in returns on invested capital. We also purchased Bayer, a German pharmaceutical and chemicals company. The share price declined shortly after Bayer’s acquisition of U.S.-based agrochemical company Monsanto due to litigation concerns from Monsanto’s glyphosate products’ alleged cancer risks. Though liability risk has increased, we believe combining Bayer’s legacy CropScience business with Monsanto’s seed franchise should drive cost and revenue synergies.
Sales during the period included Japan Airlines, which has benefited from solid earnings results driven by better pricing and lower fuel costs, offset by higher maintenance expenses. Capacity growth and improved revenue management from a new reservation system also supported the stock during the period, and we eliminated our exposure as a result. We also sold Canadian Pacific Railway, which has been transitioning from focusing on restoring its network and cost structure to profitable growth at low incremental cost. The strategy appears to be working and the stock has performed well. Another sale, Compagnie Financiere Richemont, a Switzerland-based luxury goods holding company, performed well during the period, driven by solid watch sales, and we sold it due to relative value considerations.
The MSCI ACWI ex-US Growth Index (Net) captures large- and mid-cap securities exhibiting overall growth style characteristics across 22 Developed Markets (DM) countries and 26 Emerging Markets (EM) countries.
The MSCI EAFE Value Index (Net) is a subset of the MSCI EAFE Index, and constituents of the index include securities from Europe, Australasia and the Far East. The index generally represents approximately 50% of the free float-adjusted market capitalization of the underlying MSCI EAFE Index.
It is not possible to invest directly in an index.
Market risk may affect a single issuer, sector of the economy, industry or the market as a whole. The Fund is managed bymultiple advisers independently of one another, which may result in contradicting trades (i.e., with no net benefit to the Fund), while increasing transaction costs.Foreign investments subject the fund to risks, including political, economic, market, social and others within a particular country, as well as to currency instabilities and less stringent financial and accounting standards generally applicable to U.S. issuers. Risks are enhanced foremerging market issuers.Value securities may be unprofitable if the market fails to recognize their intrinsic worth or the portfolio manager misgauged that worth.Growth securities, at times, may not perform as well as value securities or the stock market in general and may be out of favor with investors. The Fund may invest significantly in issuers within a particularsector, which may be negatively affected by market, economic or other conditions, making the Fund more vulnerable to unfavorable developments in the sector.Quantitative Model Risk Investments selected using quantitative methods may perform differently from the market as a whole. There can be no assurance that these methodologies will enable the Fund to achieve its objective. Investing inderivatives is a specialized activity that involves special risks, which may result in significant losses.See the Fund’s prospectus for more information on these and other risks.
| 8 | Multi-Manager International Equity Strategies Fund | Annual Report 2019 |
Manager Discussion of Fund Performance (continued)
The views expressed in this report reflect the current views of the respective parties. These views are not guarantees of future performance and involve certain risks, uncertainties and assumptions that are difficult to predict, so actual outcomes and results may differ significantly from the views expressed. These views are subject to change at any time based upon economic, market or other conditions and the respective parties disclaim any responsibility to update such views. These views may not be relied on as investment advice and, because investment decisions for a Columbia fund are based on numerous factors, may not be relied on as an indication of trading intent on behalf of any particular Columbia fund. References to specific securities should not be construed as a recommendation or investment advice.
Multi-Manager International Equity Strategies Fund | Annual Report 2019
| 9 |
Understanding Your Fund’s Expenses
(Unaudited)
As an investor, you incur two types of costs. There are shareholder transaction costs, which may include redemption fees. There are also ongoing fund costs, which generally include management fees, distribution and/or service fees, and other fund expenses. The following information is intended to help you understand your ongoing costs (in dollars) of investing in the Fund and to help you compare these costs with the ongoing costs of investing in other mutual funds.
Analyzing your Fund’s expenses
To illustrate these ongoing costs, we have provided examples and calculated the expenses paid by investors in each share class of the Fund during the period. The actual and hypothetical information in the table is based on an initial investment of $1,000 at the beginning of the period indicated and held for the entire period. Expense information is calculated two ways and each method provides you with different information. The amount listed in the “Actual” column is calculated using the Fund’s actual operating expenses and total return for the period. You may use the Actual information, together with the amount invested, to estimate the expenses that you paid over the period. Simply divide your account value by $1,000 (for example, an $8,600 account value divided by $1,000 = 8.6), then multiply the results by the expenses paid during the period under the “Actual” column. The amount listed in the “Hypothetical” column assumes a 5% annual rate of return before expenses (which is not the Fund’s actual return) and then applies the Fund’s actual expense ratio for the period to the hypothetical return. You should not use the hypothetical account values and expenses to estimate either your actual account balance at the end of the period or the expenses you paid during the period. See “Compare with other funds” below for details on how to use the hypothetical data.
Compare with other funds
Since all mutual funds are required to include the same hypothetical calculations about expenses in shareholder reports, you can use this information to compare the ongoing cost of investing in the Fund with other funds. To do so, compare the hypothetical example with the 5% hypothetical examples that appear in the shareholder reports of other funds. As you compare hypothetical examples of other funds, it is important to note that hypothetical examples are meant to highlight the ongoing costs of investing in a fund only and do not reflect any transaction costs, such as redemption or exchange fees. Therefore, the hypothetical calculations are useful in comparing ongoing costs only, and will not help you determine the relative total costs of owning different funds. If transaction costs were included in these calculations, your costs would be higher.
| March 1, 2019 — August 31, 2019 |
| | Account value at the
beginning of the
period ($) | Account value at the
end of the
period ($) | Expenses paid during
the period ($) | Fund’s annualized
expense ratio (%) |
| | Actual | Hypothetical | Actual | Hypothetical | Actual | Hypothetical | Actual |
| Institutional Class | 1,000.00 | 1,000.00 | 979.50 | 1,019.95 | 5.06 | 5.16 | 1.02 |
Expenses paid during the period are equal to the annualized expense ratio for each class as indicated above, multiplied by the average account value over the period and then multiplied by the number of days in the Fund’s most recent fiscal half year and divided by 365.
Expenses do not include fees and expenses incurred indirectly by the Fund from its investment in underlying funds, including affiliated and non-affiliated pooled investment vehicles, such as mutual funds and exchange-traded funds.
The Fund is offered only through certain wrap fee programs sponsored and/or managed by Ameriprise Financial, Inc. or its affiliates. Participants in wrap fee programs pay other fees that are not included in the above table. Please refer to the wrap program documents for information about the fees charged.
| 10 | Multi-Manager International Equity Strategies Fund | Annual Report 2019 |
Portfolio of Investments
August 31, 2019
(Percentages represent value of investments compared to net assets)
Investments in securities
| Common Stocks 97.0% |
| Issuer | Shares | Value ($) |
| Argentina 1.2% |
| MercadoLibre, Inc.(a) | 38,422 | 22,845,721 |
| Australia 3.0% |
| Accent Group Ltd. | 229,775 | 247,232 |
| Afterpay Touch Group Ltd.(a) | 23,375 | 487,303 |
| AGL Energy Ltd. | 94,869 | 1,209,378 |
| ALS Ltd. | 148,292 | 766,914 |
| Altium Ltd. | 5,488 | 135,497 |
| ASX Ltd. | 8,704 | 505,590 |
| Aurizon Holdings Ltd. | 413,814 | 1,645,213 |
| Austal Ltd. | 4,857 | 13,772 |
| BHP Group Ltd. | 163,523 | 4,014,062 |
| BHP Group Ltd., ADR | 83,877 | 4,123,393 |
| Brambles Ltd. | 197,558 | 1,501,572 |
| Brambles Ltd., ADR | 895 | 13,550 |
| CIMIC Group Ltd. | 6,296 | 131,380 |
| Cleanaway Waste Management Ltd. | 203,401 | 283,432 |
| Cochlear Ltd. | 60,473 | 8,853,676 |
| Coles Group Ltd. | 79,701 | 742,882 |
| Collins Foods Ltd. | 78,824 | 457,857 |
| Computershare Ltd. | 72,195 | 748,023 |
| CSL Ltd. | 50,337 | 8,153,786 |
| Domino’s Pizza Enterprises Ltd. | 2,596 | 74,866 |
| Downer EDI Ltd. | 125,939 | 653,388 |
| Estia Health | 145,494 | 263,416 |
| FlexiGroup Ltd. | 82,560 | 103,101 |
| Fortescue Metals Group Ltd. | 121,515 | 655,596 |
| Fortescue Metals Group Ltd., ADR | 9,100 | 97,689 |
| G8 Education Ltd. | 131,931 | 226,577 |
| Genworth Mortgage Insurance Australia Ltd. | 32,229 | 66,777 |
| Harvey Norman Holdings Ltd. | 22,859 | 67,404 |
| Hotel Property Investments | 12,222 | 28,610 |
| Insurance Australia Group Ltd. | 65,903 | 357,335 |
| IPH Ltd. | 76,683 | 480,378 |
| IRESS Ltd. | 66,175 | 555,929 |
| Japara Healthcare Ltd. | 58,437 | 43,880 |
| Karoon Energy Ltd.(a) | 67,086 | 56,004 |
| Common Stocks (continued) |
| Issuer | Shares | Value ($) |
| Link Administration Holdings Ltd. | 35,140 | 129,495 |
| Magellan Financial Group Ltd. | 21,330 | 728,423 |
| McMillan Shakespeare Ltd. | 28,245 | 302,791 |
| Medibank Pvt Ltd. | 544,569 | 1,334,224 |
| Metcash Ltd. | 182,540 | 356,502 |
| Monadelphous Group Ltd. | 51,817 | 555,188 |
| Navigator Global Investments Ltd. | 10,178 | 20,450 |
| Newcrest Mining Ltd. | 72,658 | 1,815,991 |
| nib holdings Ltd. | 61,307 | 304,980 |
| Pinnacle Investment Management Group Ltd. | 44,745 | 132,699 |
| QBE Insurance Group Ltd. | 356,465 | 3,004,060 |
| REA Group Ltd. | 4,143 | 290,969 |
| Reject Shop Ltd. (The) | 68,607 | 88,942 |
| Rio Tinto Ltd. | 32,593 | 1,922,097 |
| Rural Funds Group | 51,398 | 74,420 |
| South32 Ltd. | 197,950 | 349,788 |
| Steadfast Group Ltd. | 17,953 | 45,282 |
| Suncorp Group Ltd. | 36,431 | 338,218 |
| Tassal Group Ltd. | 25,482 | 74,027 |
| Vicinity Centres | 297,342 | 518,319 |
| Village Roadshow Ltd.(a) | 50,672 | 94,696 |
| Wesfarmers Ltd. | 99,153 | 2,611,341 |
| Woolworths Group Ltd. | 138,126 | 3,513,767 |
| Total | 56,372,131 |
| Austria 0.0% |
| Raiffeisen Bank International AG | 21,648 | 473,291 |
| Belgium 0.2% |
| Anheuser-Busch InBev SA/NV | 18,395 | 1,738,685 |
| Barco NV | 851 | 181,101 |
| Colruyt SA | 2,463 | 126,117 |
| Econocom Group SA/NV | 40,021 | 119,511 |
| Melexis NV | 7,036 | 446,769 |
| Proximus SADP | 5,938 | 175,617 |
| Telenet Group Holding NV | 2,175 | 108,433 |
| UCB SA | 21,700 | 1,621,855 |
| Total | 4,518,088 |
The accompanying Notes to Financial Statements are an integral part of this statement.
Multi-Manager International Equity Strategies Fund | Annual Report 2019
| 11 |
Portfolio of Investments (continued)
August 31, 2019
| Common Stocks (continued) |
| Issuer | Shares | Value ($) |
| Brazil 0.6% |
| B3 SA - Brasil Bolsa Balcao | 93,900 | 1,020,632 |
| Cielo SA | 26,000 | 48,095 |
| Cielo SA, ADR | 21,831 | 39,514 |
| Itaú Unibanco Holding SA, ADR | 677,213 | 5,580,235 |
| JBS SA | 13,300 | 95,872 |
| Kroton Educacional SA | 1,490,300 | 3,660,070 |
| Total | 10,444,418 |
| Canada 3.5% |
| Canadian Imperial Bank of Commerce | 62,633 | 4,851,541 |
| Canadian National Railway Co. | 17,630 | 1,624,428 |
| Constellation Software, Inc. | 15,702 | 15,292,880 |
| Encana Corp. | 2,091,317 | 9,267,516 |
| Fairfax Financial Holdings Ltd. | 26,941 | 12,004,468 |
| Gildan Activewear, Inc. | 280,463 | 10,281,958 |
| Magna International, Inc. | 28,229 | 1,414,555 |
| Manulife Financial Corp. | 374,002 | 6,205,276 |
| Ritchie Bros. Auctioneers, Inc. | 130,926 | 5,178,123 |
| Total | 66,120,745 |
| Chile 0.0% |
| Enel Americas SA | 299,800 | 49,108 |
| Enel Chile SA | 3,548,987 | 306,012 |
| Total | 355,120 |
| China 3.6% |
| Alibaba Group Holding Ltd., ADR(a) | 81,043 | 14,184,956 |
| Ausnutria Dairy Corp., Ltd.(a) | 160,000 | 226,299 |
| Baidu, Inc., ADR(a) | 103,911 | 10,855,582 |
| China Mobile Ltd. | 2,294,500 | 18,986,042 |
| China Mobile Ltd., ADR | 28,184 | 1,164,281 |
| China Petroleum & Chemical Corp., ADR | 11,044 | 642,430 |
| China Shenhua Energy Co., Ltd., ADR | 6,268 | 48,859 |
| Industrial & Commercial Bank of China Ltd., ADR | 18,511 | 231,850 |
| PetroChina Co., Ltd., ADR | 15,400 | 755,370 |
| Ping An Healthcare and Technology Co., Ltd.(a) | 282,100 | 1,666,851 |
| Sinopharm Group Co. Class H | 496,125 | 1,790,523 |
| SITC International Holdings Co., Ltd. | 335,000 | 346,813 |
| Tencent Holdings Ltd. | 266,400 | 10,998,466 |
| Tencent Music Entertainment Group, ADR(a) | 478,352 | 6,362,082 |
| Common Stocks (continued) |
| Issuer | Shares | Value ($) |
| VSTECS Holdings Ltd. | 102,000 | 51,807 |
| Total | 68,312,211 |
| Colombia 0.0% |
| Interconexion Electrica SA ESP | 101,814 | 534,704 |
| Cyprus 0.0% |
| Etalon Group PLC, GDR(b) | 37,995 | 74,014 |
| Denmark 1.4% |
| Carlsberg A/S, Class B | 25,347 | 3,743,948 |
| Carlsberg AS, ADR | 4,900 | 144,427 |
| DSV A/S | 108,232 | 10,739,378 |
| Nordic Waterproofing Holding AS(b) | 16,984 | 137,746 |
| Novo Nordisk A/S, ADR | 30,893 | 1,609,834 |
| Novo Nordisk A/S, Class B | 67,914 | 3,538,481 |
| Novozymes AS, Class B | 165,270 | 7,045,324 |
| Ørsted A/S | 3,110 | 296,807 |
| Pandora A/S | 4,475 | 190,382 |
| Total | 27,446,327 |
| Finland 0.9% |
| KONE OYJ, Class B | 203,716 | 11,788,812 |
| Nokia OYJ | 194,179 | 960,663 |
| Sampo OYJ, Class A | 117,220 | 4,657,277 |
| Tieto OYJ | 11,392 | 280,206 |
| Total | 17,686,958 |
| France 6.6% |
| Airbus Group SE | 39,592 | 5,455,516 |
| AXA SA | 213,841 | 4,903,495 |
| Beneteau SA | 4,938 | 46,489 |
| BNP Paribas SA | 370,619 | 16,705,984 |
| Carrefour SA | 455,920 | 7,770,064 |
| Cie de Saint-Gobain | 32,086 | 1,156,924 |
| Cie Generale des Etablissements Michelin CSA | 26,307 | 2,769,583 |
| CNP Assurances | 44,897 | 815,609 |
| Coface SA(a) | 43,569 | 514,581 |
| Danone SA | 128,207 | 11,485,978 |
| Dassault Systemes | 15,415 | 2,173,575 |
| Edenred | 343,644 | 16,733,441 |
| Electricite de France SA | 131,787 | 1,602,636 |
| Engie SA | 197,477 | 3,002,603 |
The accompanying Notes to Financial Statements are an integral part of this statement.
| 12 | Multi-Manager International Equity Strategies Fund | Annual Report 2019 |
Portfolio of Investments (continued)
August 31, 2019
| Common Stocks (continued) |
| Issuer | Shares | Value ($) |
| Groupe Crit | 119 | 8,632 |
| Kering SA | 8,306 | 4,024,661 |
| Legrand SA | 119,883 | 8,464,021 |
| L’Oreal SA | 7,646 | 2,087,788 |
| LVMH Moet Hennessy Louis Vuitton SE | 9,202 | 3,669,630 |
| Peugeot SA | 108,319 | 2,421,705 |
| Renault SA | 16,193 | 928,776 |
| Rexel SA | 16,496 | 174,955 |
| Safran SA | 7,024 | 1,020,178 |
| Sanofi | 47,975 | 4,121,421 |
| Sartorius Stedim Biotech | 2,654 | 410,787 |
| Societe BIC SA | 9,381 | 599,449 |
| Societe Generale SA | 65,175 | 1,649,882 |
| Societe Generale SA, ADR | 83,500 | 428,773 |
| STMicroelectronics NV | 35,006 | 620,587 |
| Total SA | 300,164 | 14,989,795 |
| Veolia Environnement SA | 49,471 | 1,183,050 |
| Vivendi SA | 108,652 | 3,038,347 |
| Worldline SA(a) | 4,846 | 334,695 |
| Total | 125,313,610 |
| Germany 10.0% |
| Adidas AG | 18,446 | 5,467,647 |
| Adidas AG, ADR | 2,084 | 309,609 |
| ADVA Optical Networking SE(a) | 7,726 | 49,504 |
| Allianz SE, Registered Shares | 71,788 | 15,843,893 |
| BASF SE | 357,710 | 23,668,583 |
| Bayer AG, Registered Shares | 123,433 | 9,174,008 |
| Continental AG | 51,083 | 6,164,605 |
| Covestro AG | 39,028 | 1,773,568 |
| Deutsche Boerse AG | 129,260 | 18,992,577 |
| Deutsche Lufthansa AG, ADR | 5,300 | 81,673 |
| Deutsche Lufthansa AG, Registered Shares | 38,549 | 594,168 |
| Deutsche Post AG | 387,423 | 12,713,517 |
| Deutsche Post AG, ADR | 5,000 | 164,275 |
| Deutsche Telekom AG, ADR | 29,900 | 497,536 |
| Deutsche Telekom AG, Registered Shares | 98,982 | 1,652,469 |
| E.ON SE | 185,025 | 1,721,415 |
| Hamburger Hafen und Logistik AG | 7,106 | 171,660 |
| Henkel AG & Co. KGaA, ADR | 4,500 | 112,410 |
| Common Stocks (continued) |
| Issuer | Shares | Value ($) |
| MTU Aero Engines AG | 37,301 | 10,207,396 |
| Muenchener Rueckversicherungs-Gesellschaft AG in Muenchen, Registered Shares | 18,561 | 4,444,004 |
| Muenchener Rueckversicherungs-Gesellschaft AG, ADR | 21,953 | 525,226 |
| New Work SE | 530 | 154,944 |
| Puma SE | 9,280 | 705,867 |
| SAP SE | 298,212 | 35,599,761 |
| SAP SE, ADR | 32,059 | 3,819,830 |
| Scout24 AG(a),(b) | 271,493 | 16,053,075 |
| Siemens AG, Registered Shares | 176,164 | 17,616,819 |
| Software AG | 27,207 | 733,831 |
| Talanx AG | 18,839 | 781,564 |
| Wacker Chemie AG | 352 | 27,545 |
| Total | 189,822,979 |
| Greece 0.0% |
| Holding Co. ADMIE IPTO SA | 15,503 | 36,568 |
| Guernsey 0.0% |
| Regional REIT Ltd.(b) | 5,294 | 6,696 |
| Hong Kong 2.1% |
| AIA Group Ltd. | 1,880,400 | 18,196,177 |
| Cafe de Coral Holdings Ltd. | 64,000 | 203,906 |
| China Merchants Port Holdings Co., Ltd. | 2,132,000 | 3,321,040 |
| Chow Tai Fook Jewellery Group Ltd. | 111,400 | 94,358 |
| CK Asset Holdings Ltd. | 11,000 | 74,496 |
| CNOOC Ltd., ADR | 2,802 | 415,368 |
| Hang Lung Group Ltd. | 106,000 | 263,067 |
| Hong Kong Exchanges and Clearing Ltd. | 347,380 | 10,601,635 |
| Hysan Development Co., Ltd. | 41,000 | 165,763 |
| Lenovo Group Ltd., ADR | 4,883 | 63,967 |
| Li & Fung Ltd. | 646,000 | 73,185 |
| Link REIT (The) | 124,500 | 1,395,685 |
| New World Development Co., Ltd. | 445,000 | 553,781 |
| Sands China Ltd. | 46,400 | 210,064 |
| Spring Real Estate Investment Trust | 1,008,000 | 417,626 |
| Sun Hung Kai Properties Ltd. | 96,500 | 1,364,032 |
| Sun Hung Kai Properties Ltd., ADR | 5,300 | 74,412 |
| Swire Pacific Ltd., Class A | 67,500 | 660,319 |
| Techtronic Industries Co., Ltd. | 106,000 | 731,159 |
The accompanying Notes to Financial Statements are an integral part of this statement.
Multi-Manager International Equity Strategies Fund | Annual Report 2019
| 13 |
Portfolio of Investments (continued)
August 31, 2019
| Common Stocks (continued) |
| Issuer | Shares | Value ($) |
| Valuetronics Holdings Ltd. | 229,800 | 101,539 |
| Vitasoy International Holdings Ltd. | 128,000 | 594,889 |
| WH Group Ltd. | 1,443,500 | 1,156,768 |
| Total | 40,733,236 |
| Ireland 1.9% |
| CRH PLC | 277,220 | 9,289,066 |
| Kingspan Group PLC | 216,893 | 9,902,146 |
| Ryanair Holdings PLC, ADR(a) | 305,390 | 17,498,847 |
| Total | 36,690,059 |
| Israel 0.2% |
| Bank Leumi Le-Israel BM | 221,841 | 1,511,594 |
| Check Point Software Technologies Ltd.(a) | 5,123 | 551,747 |
| NiCE Ltd.(a) | 801 | 122,657 |
| NiCE Ltd., ADR(a) | 9,200 | 1,409,900 |
| Total | 3,595,898 |
| Italy 2.8% |
| A2A SpA | 744,491 | 1,312,585 |
| Assicurazioni Generali SpA | 293,216 | 5,329,925 |
| ASTM SpA | 14,906 | 459,691 |
| Buzzi Unicem SpA | 19,560 | 280,669 |
| Cementir Holding SpA | 42,169 | 274,831 |
| Datalogic SpA | 11,302 | 161,504 |
| Enel SpA | 843,273 | 6,117,771 |
| ENI SpA | 205,968 | 3,108,773 |
| ENI SpA, ADR | 50,178 | 1,515,376 |
| Italgas SpA | 6,706 | 43,603 |
| Leonardo-Finmeccanica SpA | 17,109 | 210,226 |
| Mediobanca Banca di Credito Finanziario SpA | 142,942 | 1,420,603 |
| Piaggio & C SpA | 130,500 | 422,692 |
| Poste Italiane SpA | 35,954 | 387,721 |
| Reply SpA | 1,049 | 62,178 |
| Snam SpA | 640,621 | 3,248,867 |
| Telecom Italia SpA(a) | 1,408,948 | 753,212 |
| Terna Rete Elettrica Nazionale SpA | 223,824 | 1,410,337 |
| Tinexta SpA | 9,091 | 108,677 |
| UniCredit SpA | 2,215,229 | 24,639,396 |
| Unipol Gruppo SpA | 74,570 | 376,515 |
| Common Stocks (continued) |
| Issuer | Shares | Value ($) |
| UnipolSai SpA | 425,677 | 1,082,329 |
| Total | 52,727,481 |
| Japan 15.4% |
| Advantest Corp. | 21,800 | 892,491 |
| AGC, Inc. | 8,000 | 230,563 |
| Ahresty Corp. | 28,900 | 144,008 |
| Airport Facilities Co., Ltd. | 3,500 | 16,722 |
| Aisin Seiki Co., Ltd. | 500 | 14,795 |
| Alpha Corp. | 3,000 | 32,329 |
| Alpha Systems, Inc. | 15,800 | 386,516 |
| Amada Holdings Co., Ltd. | 39,100 | 406,437 |
| Amano Corp. | 8,600 | 256,651 |
| Argo Graphics, Inc. | 12,500 | 313,396 |
| Astellas Pharma, Inc. | 114,500 | 1,580,499 |
| Astellas Pharma, Inc., ADR | 27,188 | 374,515 |
| Bandai Namco Holdings, Inc. | 21,800 | 1,280,916 |
| Brother Industries Ltd. | 26,900 | 465,051 |
| CAC Holdings Corp. | 18,500 | 215,106 |
| Canon, Inc. | 43,500 | 1,127,762 |
| Central Glass Co., Ltd. | 19,900 | 412,226 |
| Central Japan Railway Co. | 7,400 | 1,463,164 |
| Dai-ichi Life Holdings, Inc. | 221,500 | 3,012,232 |
| Dainippon Sumitomo Pharma Co., Ltd. | 7,200 | 125,502 |
| Daiwa House Industry Co., Ltd. | 51,000 | 1,597,557 |
| Denso Corp. | 190,500 | 7,981,583 |
| Digital Arts, Inc. | 4,400 | 314,860 |
| Disco Corp. | 4,600 | 833,562 |
| Duskin Co., Ltd. | 5,800 | 148,830 |
| East Japan Railway Co. | 177,700 | 16,912,690 |
| Eisai Co., Ltd. | 18,600 | 949,176 |
| Elecom Co., Ltd. | 8,100 | 318,086 |
| ESPEC Corp. | 25,400 | 448,913 |
| FANUC Corp. | 126,000 | 21,819,738 |
| Fast Retailing Co., Ltd. | 3,400 | 1,989,039 |
| FUJIFILM Holdings Corp. | 85,000 | 3,635,483 |
| Fujitsu Ltd. | 34,600 | 2,668,298 |
| Glory Ltd. | 8,100 | 222,633 |
| Hakuto Co., Ltd. | 21,300 | 216,899 |
| Hankyu Hanshin Holdings, Inc. | 4,500 | 170,412 |
The accompanying Notes to Financial Statements are an integral part of this statement.
| 14 | Multi-Manager International Equity Strategies Fund | Annual Report 2019 |
Portfolio of Investments (continued)
August 31, 2019
| Common Stocks (continued) |
| Issuer | Shares | Value ($) |
| Hikari Tsushin, Inc. | 2,400 | 561,944 |
| Hino Motors Ltd. | 77,500 | 608,645 |
| Hirakawa Hewtech Corp. | 7,700 | 75,953 |
| Hitachi High-Technologies Corp. | 2,600 | 140,136 |
| Hitachi Ltd. | 141,200 | 4,816,663 |
| Hitachi Ltd., ADR | 800 | 54,372 |
| Honda Motor Co., Ltd. ADR | 21,800 | 515,788 |
| Hosokawa Micron Corp. | 500 | 17,453 |
| Hoya Corp. | 50,700 | 4,122,096 |
| Hoya Corp., ADR | 16,200 | 1,315,197 |
| Idec Corp. | 16,600 | 274,338 |
| Ines Corp. | 5,300 | 54,596 |
| ITOCHU Techno-Solutions Corp. | 53,600 | 1,475,110 |
| Japan Airlines Co., Ltd. | 5,600 | 174,785 |
| Japan Exchange Group, Inc. | 693,800 | 10,969,840 |
| JBCC Holdings, Inc. | 18,500 | 253,324 |
| JSR Corp. | 32,500 | 530,824 |
| JTEKT Corp. | 35,400 | 383,141 |
| Kamigumi Co., Ltd. | 14,000 | 327,855 |
| Kaneka Corp. | 1,800 | 53,876 |
| Kansai Electric Power Co., Inc. (The) | 1,900 | 23,102 |
| Kao Corp. | 29,900 | 2,157,549 |
| Kawasaki Heavy Industries Ltd. | 29,500 | 577,317 |
| KDDI Corp. | 796,300 | 21,210,105 |
| Keihanshin Building Co., Ltd. | 17,200 | 202,386 |
| Keio Corp. | 16,900 | 1,055,206 |
| Konica Minolta, Inc. | 74,900 | 531,906 |
| Kyocera Corp. | 37,600 | 2,231,649 |
| Kyocera Corp., ADR | 300 | 17,817 |
| Marubeni Corp. | 131,900 | 841,825 |
| Maruzen Showa Unyu Co., Ltd. | 2,800 | 81,619 |
| Max Co., Ltd. | 7,500 | 120,912 |
| Mazda Motor Corp., ADR | 22,000 | 91,080 |
| Mimaki Engineering Co., Ltd. | 23,900 | 111,354 |
| Mitsubishi Electric Corp. | 161,600 | 1,945,088 |
| Mitsubishi Estate Co., Ltd. | 22,200 | 424,689 |
| Mitsubishi Heavy Industries Ltd. | 17,100 | 641,917 |
| MS&AD Insurance Group Holdings, Inc. | 106,500 | 3,380,334 |
| Nachi-Fujikoshi Corp. | 6,800 | 271,606 |
| Common Stocks (continued) |
| Issuer | Shares | Value ($) |
| Nagano Keiki Co., Ltd. | 21,000 | 130,881 |
| NEC Networks & System Integration Corp. | 7,800 | 203,479 |
| NH Foods Ltd. | 10,100 | 387,657 |
| Nichirin Co., Ltd. | 6,500 | 74,610 |
| Nidec Corp. | 86,500 | 11,255,794 |
| Nikkon Holdings Co., Ltd. | 4,600 | 102,414 |
| Nikon Corp. | 6,300 | 77,888 |
| Nintendo Co., Ltd. | 1,000 | 378,401 |
| Nippon Express Co., Ltd. | 2,100 | 108,404 |
| Nippon Hume Corp. | 19,500 | 119,018 |
| Nippon Telegraph & Telephone Corp. | 81,000 | 3,882,969 |
| Nippon Telegraph & Telephone Corp., ADR | 3,200 | 153,200 |
| Nissan Motor Co., Ltd. | 22,800 | 140,869 |
| Nissin Foods Holdings Co., Ltd. | 10,100 | 700,017 |
| Nitto Denko Corp. | 13,500 | 627,523 |
| NS United Kaiun Kaisha Ltd. | 3,500 | 70,456 |
| NSD Co., Ltd. | 7,600 | 225,723 |
| NTT Data Corp. | 111,900 | 1,441,290 |
| NTT DoCoMo, Inc. | 167,300 | 4,220,289 |
| Obayashi Corp. | 58,400 | 537,452 |
| Okabe Co., Ltd. | 20,000 | 150,066 |
| Olympus Corp. | 34,800 | 406,920 |
| Olympus Corp., ADR | 10,800 | 125,874 |
| Omron Corp. | 26,600 | 1,313,573 |
| Oracle Corp. Japan | 100 | 8,600 |
| Organo Corp. | 4,300 | 164,367 |
| ORIX Corp. | 77,700 | 1,146,471 |
| Otsuka Corp. | 16,100 | 596,963 |
| Panasonic Corp. | 220,900 | 1,701,576 |
| PS Mitsubishi Construction Co., Ltd. | 17,100 | 109,380 |
| Recruit Holdings Co., Ltd. | 107,300 | 3,249,069 |
| Ricoh Co., Ltd. | 6,900 | 63,774 |
| Ryobi Ltd. | 9,000 | 135,031 |
| Ryoden Corp. | 23,900 | 360,477 |
| Sankyo Seiko Co., Ltd. | 11,200 | 51,554 |
| Sanwa Holdings Corp. | 43,800 | 486,596 |
| SCSK Corp. | 10,300 | 507,363 |
| Seibu Holdings, Inc. | 19,300 | 327,520 |
| Seiko Epson Corp. | 208,900 | 2,774,752 |
The accompanying Notes to Financial Statements are an integral part of this statement.
Multi-Manager International Equity Strategies Fund | Annual Report 2019
| 15 |
Portfolio of Investments (continued)
August 31, 2019
| Common Stocks (continued) |
| Issuer | Shares | Value ($) |
| Seiko Holdings Corp. | 13,800 | 289,555 |
| Senshu Electric Co., Ltd. | 2,000 | 48,771 |
| Shibaura Mechatronics Corp. | 4,100 | 107,772 |
| Shimano, Inc. | 64,600 | 9,278,561 |
| Shin-Etsu Chemical Co., Ltd. | 30,700 | 3,092,236 |
| Shin-Etsu Chemical Co., Ltd., ADR | 7,000 | 176,050 |
| Shin-Etsu Polymer Co., Ltd. | 12,700 | 81,874 |
| Shinko Shoji Co., Ltd. | 15,800 | 278,910 |
| Shinsho Corp. | 2,500 | 49,637 |
| Shionogi & Co., Ltd. | 46,400 | 2,483,579 |
| Sintokogio Ltd. | 5,100 | 43,293 |
| SMC Corp. | 28,600 | 10,782,317 |
| SMK Corp. | 1,900 | 47,777 |
| Soliton Systems KK | 8,100 | 71,940 |
| Sompo Holdings, Inc. | 305,300 | 12,170,908 |
| Sony Corp. | 149,600 | 8,521,582 |
| Sony Financial Holdings, Inc. | 40,700 | 938,156 |
| Subaru Corp. | 11,900 | 318,390 |
| Suminoe Textile Co., Ltd. | 3,400 | 89,140 |
| Sumitomo Corp. | 135,000 | 2,023,375 |
| Sumitomo Heavy Industries Ltd. | 10,200 | 292,686 |
| Sumitomo Mitsui Financial Group, Inc. | 243,000 | 7,962,685 |
| Sumitomo Mitsui Trust Holdings, Inc. | 209,800 | 6,845,777 |
| Sumitomo Warehouse Co., Ltd. (The) | 37,300 | 492,961 |
| Sun Corp. | 7,300 | 89,329 |
| Sun-Wa Technos Corp. | 3,600 | 25,290 |
| Suzuken Co., Ltd. | 2,100 | 112,749 |
| Systena Corp. | 23,200 | 345,667 |
| T&D Holdings, Inc. | 81,400 | 790,761 |
| Taiheiyo Cement Corp. | 14,300 | 360,524 |
| Takeda Pharmaceutical Co., Ltd. | 692,900 | 23,361,759 |
| Takisawa Machine Tool Co., Ltd. | 4,200 | 47,621 |
| Tatsuta Electric Wire and Cable Co., Ltd. | 18,000 | 72,667 |
| Toa Corp. | 5,900 | 67,998 |
| Tokio Marine Holdings, Inc. | 102,400 | 5,266,461 |
| Tokio Marine Holdings, Inc., ADR | 6,668 | 342,969 |
| Tokyo Electric Power Co. Holdings, Inc.(a) | 225,000 | 1,070,894 |
| Tokyo Electron Ltd. | 22,300 | 3,976,353 |
| Tokyo Gas Co., Ltd. | 900 | 22,734 |
| Common Stocks (continued) |
| Issuer | Shares | Value ($) |
| Tokyu Corp. | 33,800 | 603,984 |
| Toppan Printing Co., Ltd. | 32,200 | 512,905 |
| Toyo Corp./Chuo-ku | 19,500 | 190,353 |
| Toyo Seikan Group Holdings Ltd. | 23,900 | 347,782 |
| Toyo Suisan Kaisha Ltd. | 3,300 | 134,267 |
| Toyota Tsusho Corp. | 289,700 | 8,972,259 |
| Trend Micro, Inc. | 22,000 | 1,064,192 |
| Trend Micro, Inc., ADR | 800 | 38,724 |
| Uniden Holdings Corp. | 5,800 | 94,135 |
| Unipres Corp. | 10,400 | 161,508 |
| Ushio, Inc. | 30,900 | 395,745 |
| USS Co., Ltd. | 13,300 | 251,264 |
| Wellnet Corp. | 3,800 | 25,780 |
| West Japan Railway Co. | 22,400 | 1,887,179 |
| Yamaha Motor Co., Ltd. | 21,200 | 346,141 |
| Yamaichi Electronics Co., Ltd. | 6,900 | 72,108 |
| Yokowo Co., Ltd. | 1,500 | 37,763 |
| Yorozu Corp. | 8,300 | 97,740 |
| Total | 291,815,834 |
| Jersey 0.4% |
| boohoo Group PLC(a) | 2,510,663 | 7,408,816 |
| IWG PLC | 119,465 | 606,904 |
| Total | 8,015,720 |
| Netherlands 5.0% |
| Adyen NV(a) | 571 | 413,970 |
| Aegon NV | 471,922 | 1,796,449 |
| Aegon NV, Registered Shares | 11,900 | 44,982 |
| Akzo Nobel NV | 141,023 | 12,640,757 |
| ASML Holding NV | 38,046 | 8,461,686 |
| ASR Nederland NV | 9,258 | 323,733 |
| CNH Industrial NV | 93,655 | 966,632 |
| Heineken Holding NV | 109,072 | 10,794,485 |
| IMCD NV | 66,073 | 4,636,436 |
| ING Groep NV | 808,088 | 7,720,210 |
| Koninklijke Ahold Delhaize NV, ADR | 8,900 | 208,749 |
| Koninklijke KPN NV | 1,318,323 | 4,175,538 |
| Koninklijke Philips NV | 38,083 | 1,792,948 |
| Koninklijke Philips NV | 133,075 | 6,272,397 |
| NN Group NV | 73,143 | 2,450,941 |
The accompanying Notes to Financial Statements are an integral part of this statement.
| 16 | Multi-Manager International Equity Strategies Fund | Annual Report 2019 |
Portfolio of Investments (continued)
August 31, 2019
| Common Stocks (continued) |
| Issuer | Shares | Value ($) |
| NN Group NV, ADR | 4,000 | 66,760 |
| Randstad NV | 17,358 | 810,489 |
| Signify NV | 8,676 | 253,874 |
| STMicroelectronics NV, Registered Shares | 46,945 | 830,926 |
| Takeaway.com NV(a),(b) | 57,643 | 5,505,574 |
| Unilever NV | 25,147 | 1,561,377 |
| Unilever NV(a) | 318,708 | 19,775,284 |
| Wolters Kluwer NV | 51,015 | 3,672,350 |
| Wolters Kluwer NV, ADR | 2,100 | 151,284 |
| Total | 95,327,831 |
| New Zealand 0.1% |
| Freightways Ltd. | 1,550 | 7,778 |
| Xero Ltd.(a) | 20,654 | 879,154 |
| Total | 886,932 |
| Norway 0.1% |
| Fjordkraft Holding ASA(b) | 20,097 | 107,629 |
| Storebrand ASA | 148,668 | 854,504 |
| Telenor ASA | 43,001 | 882,538 |
| Total | 1,844,671 |
| Panama 0.5% |
| Copa Holdings SA, Class A | 90,216 | 9,308,487 |
| Peru 0.4% |
| Credicorp Ltd. | 38,296 | 7,931,867 |
| Russian Federation 1.1% |
| Gazprom PJSC | 1,279,550 | 4,451,285 |
| Gazprom PJSC, ADR | 43,500 | 301,179 |
| Lukoil PJSC | 46,537 | 3,756,798 |
| Magnit PJSC GDR(b) | 321,248 | 4,259,338 |
| MMC Norilsk Nickel PJSC, ADR | 4,022 | 98,257 |
| MMC Norilsk Nickel PJSC, ADR | 199,343 | 4,839,779 |
| Rosseti PJSC(a) | 23,801,000 | 418,485 |
| Sberbank of Russia PJSC | 346,190 | 1,163,707 |
| Sberbank of Russia PJSC, ADR | 5,000 | 68,625 |
| TCS Group Holding PLC, GDR(b) | 30,791 | 572,713 |
| Total | 19,930,166 |
| Singapore 0.5% |
| United Overseas Bank Ltd. | 550,300 | 9,881,703 |
| Common Stocks (continued) |
| Issuer | Shares | Value ($) |
| South Africa 1.0% |
| Discovery Ltd. | 777,489 | 5,898,627 |
| Investec Ltd. | 146,243 | 772,153 |
| Naspers Ltd., Class N | 51,421 | 11,701,662 |
| Total | 18,372,442 |
| South Korea 3.0% |
| Chosun Refractories Co., Ltd. | 301 | 21,215 |
| Dasan Networks, Inc.(a) | 20,008 | 113,526 |
| Eugene Technology Co., Ltd. | 12,300 | 125,044 |
| Hana Financial Group, Inc. | 44,584 | 1,197,594 |
| Jahwa Electronics Co., Ltd.(a) | 16,603 | 118,043 |
| KB Financial Group, Inc. | 29,627 | 968,005 |
| KB Financial Group, Inc., ADR | 3,985 | 129,552 |
| KC Tech Co., Ltd. | 10,617 | 135,206 |
| Kyeryong Construction Industrial Co., Ltd. | 3,444 | 65,060 |
| NAVER Corp. | 45,720 | 5,538,488 |
| Samsung Electronics Co., Ltd. | 458,065 | 16,677,680 |
| Samsung Electronics Co., Ltd. GDR | 17,360 | 15,926,588 |
| SK Innovation Co., Ltd. | 18,785 | 2,564,295 |
| SK Telecom Co., Ltd. | 67,928 | 13,428,155 |
| TechWing, Inc. | 9,956 | 76,269 |
| Tovis Co., Ltd.(a) | 48,927 | 265,332 |
| WiSoL Co., Ltd. | 14,017 | 166,757 |
| Total | 57,516,809 |
| Spain 2.2% |
| Aena SME SA | 8,555 | 1,544,669 |
| Amadeus IT Group SA, ADR | 1,259 | 93,859 |
| Amadeus IT Group SA, Class A | 41,805 | 3,117,433 |
| Banco Santander SA, ADR | 184,332 | 691,245 |
| Bankinter SA | 954,579 | 5,562,599 |
| CaixaBank SA | 2,703,326 | 6,134,310 |
| Grifols SA | 175,055 | 5,555,740 |
| Grupo Catalana Occidente SA, ADR, Class A | 4,604 | 154,837 |
| Iberdrola SA | 510,814 | 5,258,325 |
| Industria de Diseno Textil SA | 292,422 | 9,048,661 |
| International Consolidated Airlines Group SA, ADR | 2,800 | 28,630 |
| Mapfre SA | 293,936 | 766,011 |
| Naturgy Energy Group SA | 12,960 | 339,641 |
The accompanying Notes to Financial Statements are an integral part of this statement.
Multi-Manager International Equity Strategies Fund | Annual Report 2019
| 17 |
Portfolio of Investments (continued)
August 31, 2019
| Common Stocks (continued) |
| Issuer | Shares | Value ($) |
| Telefonica SA | 441,342 | 3,066,204 |
| Total | 41,362,164 |
| Sweden 1.5% |
| Atlas Copco AB, Class B | 431,250 | 11,507,093 |
| Cellavision AB | 6,119 | 226,347 |
| Epiroc AB, Class B | 769,804 | 7,642,594 |
| Essity AB, Class B | 47,279 | 1,476,916 |
| Evolution Gaming Group AB | 11,289 | 212,355 |
| Fortnox AB | 5,960 | 92,910 |
| Hennes & Mauritz | 152,796 | 2,928,094 |
| Hexagon AB, ADR | 9,400 | 417,125 |
| Hexagon AB, Class B | 11,275 | 502,151 |
| Telefonaktiebolaget LM Ericsson, ADR | 103,419 | 810,805 |
| Telefonaktiebolaget LM Ericsson, Class B | 239,414 | 1,873,457 |
| Volvo AB | 4,243 | 58,643 |
| Total | 27,748,490 |
| Switzerland 7.0% |
| ABB Ltd. | 1,064,622 | 20,245,019 |
| Belimo Holding AG, Registered Shares | 55 | 278,066 |
| Cie Financiere Richemont SA, ADR | 12,200 | 94,306 |
| Cie Financiere Richemont SA, Class A, Registered Shares | 134,935 | 10,484,668 |
| Coca-Cola HBC AG(a) | 47,613 | 1,584,182 |
| Credit Suisse Group AG, Registered Shares(a) | 555,993 | 6,505,204 |
| Kuehne & Nagel International AG | 62,052 | 9,040,603 |
| Nestle SA, ADR | 13,838 | 1,555,599 |
| Nestlé SA, Registered Shares | 265,844 | 29,874,070 |
| Novartis AG, ADR | 60,175 | 5,422,369 |
| Novartis AG, Registered Shares | 204,535 | 18,439,796 |
| Roche Holding AG | 468 | 127,503 |
| Roche Holding AG, ADR | 68,141 | 2,331,785 |
| Roche Holding AG, Genusschein Shares | 99,605 | 27,218,088 |
| Temenos AG(a) | 1,128 | 190,045 |
| Temenos AG, ADR | 1,003 | 168,805 |
| Total | 133,560,108 |
| Common Stocks (continued) |
| Issuer | Shares | Value ($) |
| Taiwan 1.3% |
| Anpec Electronics Corp. | 133,000 | 254,100 |
| Ardentec Corp. | 109,000 | 94,823 |
| Globe Union Industrial Corp. | 26,000 | 13,403 |
| Shane Global Holding, Inc. | 31,000 | 126,840 |
| Taiwan FU Hsing Industrial Co., Ltd. | 83,000 | 117,833 |
| Taiwan Semiconductor Manufacturing Co., Ltd., ADR | 553,663 | 23,602,654 |
| TSC Auto ID Technology Co., Ltd. | 6,100 | 49,442 |
| Total | 24,259,095 |
| Turkey 0.1% |
| Akbank T.A.S.(a) | 1,518,257 | 1,804,677 |
| United Kingdom 18.9% |
| 3i Group PLC | 250,628 | 3,350,523 |
| Abcam PLC | 10,481 | 147,681 |
| Admiral Group PLC | 29,329 | 768,584 |
| Aggreko PLC | 113,631 | 1,060,497 |
| Anglo American PLC | 45,799 | 992,442 |
| Ashmore Group PLC | 84,658 | 466,399 |
| Ashtead Group PLC | 66,403 | 1,843,496 |
| ASOS PLC(a) | 168,271 | 4,882,288 |
| Associated British Foods PLC | 56,610 | 1,566,194 |
| AstraZeneca PLC | 184,664 | 16,494,455 |
| AstraZeneca PLC, ADR | 71,696 | 3,228,471 |
| Avast PLC | 220,557 | 1,022,834 |
| Aveva Group PLC | 16,093 | 726,049 |
| Aviva PLC | 1,925,729 | 8,313,647 |
| BAE Systems PLC | 169,315 | 1,125,967 |
| Barclays Bank PLC | 9,979,234 | 16,623,686 |
| Barratt Developments PLC | 55,901 | 431,536 |
| BHP Group PLC | 224,627 | 4,859,490 |
| BHP Group PLC, ADR | 67,102 | 2,898,135 |
| BP PLC | 2,434,434 | 14,826,324 |
| Brewin Dolphin Holdings PLC | 46,241 | 171,842 |
| British American Tobacco PLC | 491,249 | 17,232,196 |
| BT Group PLC | 669,952 | 1,349,695 |
| BT Group PLC, ADR | 66,171 | 661,710 |
| Burberry Group PLC | 305,126 | 8,075,530 |
| Carnival PLC | 112,043 | 4,719,804 |
The accompanying Notes to Financial Statements are an integral part of this statement.
| 18 | Multi-Manager International Equity Strategies Fund | Annual Report 2019 |
Portfolio of Investments (continued)
August 31, 2019
| Common Stocks (continued) |
| Issuer | Shares | Value ($) |
| Centrica PLC | 463,353 | 393,476 |
| Compass Group PLC | 120,039 | 3,044,472 |
| Compass Group PLC, ADR | 27,236 | 690,705 |
| DFS Furniture PLC | 71,675 | 189,255 |
| Diageo PLC, ADR | 29,142 | 4,991,442 |
| Direct Line Insurance Group PLC | 92,639 | 319,664 |
| Dunelm Group PLC | 64,048 | 682,698 |
| Experian PLC | 505,839 | 15,557,394 |
| Experian PLC, ADR | 18,372 | 565,398 |
| Ferguson PLC | 18,747 | 1,382,622 |
| Galiform PLC | 725,500 | 4,759,444 |
| GlaxoSmithKline PLC, ADR | 86,434 | 3,593,926 |
| Glencore PLC(a) | 799,612 | 2,294,351 |
| Go-Ahead Group PLC (The) | 7,829 | 198,148 |
| GoCo Group PLC | 301,247 | 276,861 |
| Greggs PLC | 40,285 | 1,037,328 |
| Halma PLC | 71,615 | 1,717,637 |
| Hammerson PLC | 177,884 | 491,340 |
| Hargreaves Lansdown PLC | 440,864 | 10,119,251 |
| Hays PLC | 122,921 | 209,813 |
| IG Group Holdings PLC | 72,450 | 477,148 |
| Imperial Brands PLC, ADR | 8,500 | 220,490 |
| Inchcape PLC | 43,143 | 304,092 |
| Indivior PLC(a) | 62,615 | 45,958 |
| InterContinental Hotels Group PLC | 18,664 | 1,168,181 |
| Intermediate Capital Group PLC | 60,150 | 982,189 |
| International Consolidated Airlines Group SA | 157,340 | 808,939 |
| Johnson Matthey PLC | 186,213 | 6,620,659 |
| Jupiter Fund Management PLC | 263,718 | 1,099,269 |
| Just Eat PLC(a) | 640,568 | 6,131,594 |
| Kingfisher PLC | 150,836 | 357,130 |
| Kingfisher PLC, ADR | 27,200 | 128,792 |
| Land Securities Group PLC | 49,050 | 463,302 |
| Linde PLC | 103,555 | 19,496,822 |
| Lloyds Banking Group PLC | 13,545,611 | 8,241,378 |
| Lookers PLC | 228,187 | 129,389 |
| Meggitt PLC | 85,992 | 649,011 |
| Micro Focus International PLC | 435,566 | 5,948,096 |
| Micro Focus International PLC, ADR | 4,200 | 57,960 |
| Common Stocks (continued) |
| Issuer | Shares | Value ($) |
| National Grid PLC, ADR | 49,700 | 2,599,807 |
| Persimmon PLC | 37,678 | 874,868 |
| Prudential PLC | 1,602,324 | 26,707,667 |
| Prudential PLC, ADR | 48,313 | 1,613,171 |
| Reckitt Benckiser Group PLC, ADR | 18,417 | 290,344 |
| Redrow PLC | 42,759 | 288,056 |
| RELX PLC | 166,210 | 3,988,418 |
| RELX PLC | 133,429 | 3,190,421 |
| Renishaw PLC | 3,379 | 146,306 |
| Rio Tinto PLC | 343,528 | 17,411,990 |
| Rio Tinto PLC, ADR | 118,907 | 6,014,316 |
| Rolls-Royce Holdings PLC(a) | 1,694,354 | 15,924,010 |
| Rotork PLC | 131,002 | 495,238 |
| Royal Dutch Shell PLC, Class B | 526,790 | 14,586,730 |
| Saga PLC | 164,188 | 82,151 |
| Sage Group PLC (The) | 349,228 | 2,987,137 |
| Scottish & Southern Energy PLC | 836,735 | 11,738,853 |
| Senior PLC | 242,289 | 596,710 |
| Smith & Nephew PLC | 170,873 | 4,094,613 |
| St. James’s Place PLC | 385,784 | 4,327,103 |
| Taylor Wimpey PLC | 403,955 | 718,952 |
| Unilever PLC, ADR | 31,549 | 1,993,266 |
| Vesuvius PLC | 41,679 | 236,129 |
| Victrex PLC | 15,768 | 400,681 |
| Vodafone Group PLC | 7,752,143 | 14,667,191 |
| Whitbread PLC | 9,675 | 515,904 |
| Total | 360,175,131 |
| United States 0.5% |
| Spotify Technology SA(a) | 65,094 | 8,784,435 |
| Virgin Islands 0.0% |
| Hollysys Automation Technologies Ltd. | 41,799 | 654,154 |
Total Common Stocks
(Cost $1,982,771,746) | 1,843,290,971 |
|
| Exchange-Traded Funds 0.2% |
| | Shares | Value ($) |
| United States 0.2% |
| iShares MSCI EAFE ETF | 47,072 | 2,975,421 |
Total Exchange-Traded Funds
(Cost $3,038,471) | 2,975,421 |
The accompanying Notes to Financial Statements are an integral part of this statement.
Multi-Manager International Equity Strategies Fund | Annual Report 2019
| 19 |
Portfolio of Investments (continued)
August 31, 2019
| Participation Notes 0.0% |
| Issuer | | | Shares | Value ($) |
| United Kingdom 0.0% |
| HSBC Bank PLC |
| (linked to common shares of Alinma Bank) |
| 01/19/2021 | | | 42,005 | 246,707 |
Total Participation Notes
(Cost $242,409) | 246,707 |
| Preferred Stocks 1.6% |
| Issuer | | Shares | Value ($) |
| Colombia 0.0% |
| Grupo de Inversiones Suramericana SA | | 10,796 | 96,462 |
| Germany 1.5% |
| Henkel AG & Co. KGaA | | 13,795 | 1,384,337 |
| Porsche Automobil Holding SE | | 18,743 | 1,177,256 |
| Schaeffler AG | | 6,869 | 46,681 |
| Volkswagen AG | | 162,199 | 26,103,977 |
| Total | 28,712,251 |
| Preferred Stocks (continued) |
| Issuer | | Shares | Value ($) |
| Russian Federation 0.0% |
| Tatneft PJSC | | 21,770 | 207,313 |
| Spain 0.1% |
| Grifols SA | | 101,328 | 2,161,005 |
Total Preferred Stocks
(Cost $34,868,240) | 31,177,031 |
| Money Market Funds 0.8% |
| | Shares | Value ($) |
| Columbia Short-Term Cash Fund, 2.208%(c),(d) | 15,669,041 | 15,667,474 |
Total Money Market Funds
(Cost $15,667,474) | 15,667,474 |
Total Investments in Securities
(Cost $2,036,588,340) | 1,893,357,604 |
| Other Assets & Liabilities, Net | | 7,774,794 |
| Net Assets | $1,901,132,398 |
Notes to Portfolio of Investments
| (a) | Non-income producing investment. |
| (b) | Represents privately placed and other securities and instruments exempt from Securities and Exchange Commission registration (collectively, private placements), such as Section 4(a)(2) and Rule 144A eligible securities, which are often sold only to qualified institutional buyers. The Fund may invest in private placements determined to be liquid as well as those determined to be illiquid. Private placements may be determined to be liquid under guidelines established by the Fund’s Board of Trustees. At August 31, 2019, the total value of these securities amounted to $26,716,785, which represents 1.41% of total net assets. |
| (c) | The rate shown is the seven-day current annualized yield at August 31, 2019. |
| (d) | As defined in the Investment Company Act of 1940, an affiliated company is one in which the Fund owns 5% or more of the company’s outstanding voting securities, or a company which is under common ownership or control with the Fund. Holdings and transactions in these affiliated companies during the year ended August 31, 2019 are as follows: |
| Issuer | Beginning
shares | Shares
purchased | Shares
sold | Ending
shares | Realized gain
(loss) —
affiliated
issuers ($) | Net change in
unrealized
appreciation
(depreciation) —
affiliated
issuers ($) | Dividends —
affiliated
issuers ($) | Value —
affiliated
issuers
at end of
period ($) |
| Columbia Short-Term Cash Fund, 2.208% |
| | 25,677,255 | 383,686,242 | (393,694,456) | 15,669,041 | (273) | — | 524,753 | 15,667,474 |
Abbreviation Legend
| ADR | American Depositary Receipt |
| GDR | Global Depositary Receipt |
Fair value measurements
The Fund categorizes its fair value measurements according to a three-level hierarchy that maximizes the use of observable inputs and minimizes the use of unobservable inputs by prioritizing that the most observable input be used when available. Observable inputs are those that market participants would use in pricing an investment based on market data obtained from sources independent of the reporting entity. Unobservable inputs are those that reflect the Fund’s assumptions about the information market participants would use in pricing an investment. An investment’s level within the fair value hierarchy is based on the lowest level of any input that is deemed significant to the asset’s or liability’s fair value measurement. The input levels are not necessarily an indication of the risk or liquidity associated with investments at that level. For example, certain U.S. government securities are generally high quality and liquid, however, they are reflected as Level 2 because the inputs used to determine fair value may not always be quoted prices in an active market.
The accompanying Notes to Financial Statements are an integral part of this statement.
| 20 | Multi-Manager International Equity Strategies Fund | Annual Report 2019 |
Portfolio of Investments (continued)
August 31, 2019
Fair value measurements (continued)
Fair value inputs are summarized in the three broad levels listed below:
| ■ | Level 1 — Valuations based on quoted prices for investments in active markets that the Fund has the ability to access at the measurement date. Valuation adjustments are not applied to Level 1 investments. |
| ■ | Level 2 — Valuations based on other significant observable inputs (including quoted prices for similar securities, interest rates, prepayment speeds, credit risks, etc.). |
| ■ | Level 3 — Valuations based on significant unobservable inputs (including the Fund’s own assumptions and judgment in determining the fair value of investments). |
Inputs that are used in determining fair value of an investment may include price information, credit data, volatility statistics, and other factors. These inputs can be either observable or unobservable. The availability of observable inputs can vary between investments, and is affected by various factors such as the type of investment, and the volume and level of activity for that investment or similar investments in the marketplace. The inputs will be considered by the Investment Manager, along with any other relevant factors in the calculation of an investment’s fair value. The Fund uses prices and inputs that are current as of the measurement date, which may include periods of market dislocations. During these periods, the availability of prices and inputs may be reduced for many investments. This condition could cause an investment to be reclassified between the various levels within the hierarchy.
Foreign equity securities actively traded in markets where there is a significant delay in the local close relative to the New York Stock Exchange are classified as Level 2. The values of these securities may include an adjustment to reflect the impact of significant market movements following the close of local trading, as described in Note 2 to the financial statements – Security valuation.
Investments falling into the Level 3 category are primarily supported by quoted prices from brokers and dealers participating in the market for those investments. However, these may be classified as Level 3 investments due to lack of market transparency and corroboration to support these quoted prices. Additionally, valuation models may be used as the pricing source for any remaining investments classified as Level 3. These models may rely on one or more significant unobservable inputs and/or significant assumptions by the Investment Manager. Inputs used in valuations may include, but are not limited to, financial statement analysis, capital account balances, discount rates and estimated cash flows, and comparable company data.
Under the direction of the Fund’s Board of Trustees (the Board), the Investment Manager’s Valuation Committee (the Committee) is responsible for overseeing the valuation procedures approved by the Board. The Committee consists of voting and non-voting members from various groups within the Investment Manager’s organization, including operations and accounting, trading and investments, compliance, risk management and legal.
The Committee meets at least monthly to review and approve valuation matters, which may include a description of specific valuation determinations, data regarding pricing information received from approved pricing vendors and brokers and the results of Board-approved valuation control policies and procedures (the Policies). The Policies address, among other things, instances when market quotations are or are not readily available, including recommendations of third party pricing vendors and a determination of appropriate pricing methodologies; events that require specific valuation determinations and assessment of fair value techniques; securities with a potential for stale pricing, including those that are illiquid, restricted, or in default; and the effectiveness of third party pricing vendors, including periodic reviews of vendors. The Committee meets more frequently, as needed, to discuss additional valuation matters, which may include the need to review back-testing results, review time-sensitive information or approve related valuation actions. The Committee reports to the Board, with members of the Committee meeting with the Board at each of its regularly scheduled meetings to discuss valuation matters and actions during the period, similar to those described earlier.
The following table is a summary of the inputs used to value the Fund’s investments at August 31, 2019:
| | Level 1 ($) | Level 2 ($) | Level 3 ($) | Total ($) |
| Investments in Securities | | | | |
| Common Stocks | | | | |
| Argentina | 22,845,721 | — | — | 22,845,721 |
| Australia | 4,123,393 | 52,248,738 | — | 56,372,131 |
| Austria | — | 473,291 | — | 473,291 |
| Belgium | — | 4,518,088 | — | 4,518,088 |
| Brazil | 10,404,904 | 39,514 | — | 10,444,418 |
| Canada | 66,120,745 | — | — | 66,120,745 |
| Chile | 355,120 | — | — | 355,120 |
| China | 33,964,701 | 34,347,510 | — | 68,312,211 |
| Colombia | 534,704 | — | — | 534,704 |
| Cyprus | — | 74,014 | — | 74,014 |
| Denmark | 1,609,834 | 25,836,493 | — | 27,446,327 |
| Finland | — | 17,686,958 | — | 17,686,958 |
| France | — | 125,313,610 | — | 125,313,610 |
| Germany | 3,819,830 | 186,003,149 | — | 189,822,979 |
| Greece | — | 36,568 | — | 36,568 |
| Guernsey | — | 6,696 | — | 6,696 |
| Hong Kong | 415,368 | 40,317,868 | — | 40,733,236 |
| Ireland | 17,498,847 | 19,191,212 | — | 36,690,059 |
| Israel | 1,961,647 | 1,634,251 | — | 3,595,898 |
| Italy | 1,515,376 | 51,212,105 | — | 52,727,481 |
| Japan | 515,788 | 291,300,046 | — | 291,815,834 |
| Jersey | — | 8,015,720 | — | 8,015,720 |
| Netherlands | 4,230,233 | 91,097,598 | — | 95,327,831 |
| New Zealand | — | 886,932 | — | 886,932 |
| Norway | — | 1,844,671 | — | 1,844,671 |
The accompanying Notes to Financial Statements are an integral part of this statement.
Multi-Manager International Equity Strategies Fund | Annual Report 2019
| 21 |
Portfolio of Investments (continued)
August 31, 2019
Fair value measurements (continued)
| | Level 1 ($) | Level 2 ($) | Level 3 ($) | Total ($) |
| Panama | 9,308,487 | — | — | 9,308,487 |
| Peru | 7,931,867 | — | — | 7,931,867 |
| Russian Federation | — | 19,930,166 | — | 19,930,166 |
| Singapore | — | 9,881,703 | — | 9,881,703 |
| South Africa | — | 18,372,442 | — | 18,372,442 |
| South Korea | 129,552 | 57,387,257 | — | 57,516,809 |
| Spain | 691,245 | 40,670,919 | — | 41,362,164 |
| Sweden | 810,805 | 26,937,685 | — | 27,748,490 |
| Switzerland | 5,422,369 | 128,137,739 | — | 133,560,108 |
| Taiwan | 23,602,654 | 656,441 | — | 24,259,095 |
| Turkey | — | 1,804,677 | — | 1,804,677 |
| United Kingdom | 27,652,204 | 332,522,927 | — | 360,175,131 |
| United States | 8,784,435 | — | — | 8,784,435 |
| Virgin Islands | 654,154 | — | — | 654,154 |
| Total Common Stocks | 254,903,983 | 1,588,386,988 | — | 1,843,290,971 |
| Exchange-Traded Funds | 2,975,421 | — | — | 2,975,421 |
| Participation Notes | — | 246,707 | — | 246,707 |
| Preferred Stocks | | | | |
| Colombia | 96,462 | — | — | 96,462 |
| Germany | — | 28,712,251 | — | 28,712,251 |
| Russian Federation | — | 207,313 | — | 207,313 |
| Spain | — | 2,161,005 | — | 2,161,005 |
| Total Preferred Stocks | 96,462 | 31,080,569 | — | 31,177,031 |
| Money Market Funds | 15,667,474 | — | — | 15,667,474 |
| Total Investments in Securities | 273,643,340 | 1,619,714,264 | — | 1,893,357,604 |
See the Portfolio of Investments for all investment classifications not indicated in the table.
The Fund’s assets assigned to the Level 2 input category are generally valued using the market approach, in which a security’s value is determined through reference to prices and information from market transactions for similar or identical assets. These assets include certain foreign securities for which a third party statistical pricing service may be employed for purposes of fair market valuation. The model utilized by such third party statistical pricing service takes into account a security’s correlation to available market data including, but not limited to, intraday index, ADR, and exchange-traded fund movements.
The accompanying Notes to Financial Statements are an integral part of this statement.
| 22 | Multi-Manager International Equity Strategies Fund | Annual Report 2019 |
Statement of Assets and Liabilities
August 31, 2019
| Assets | |
| Investments in securities, at value | |
| Unaffiliated issuers (cost $2,020,920,866) | $1,877,690,130 |
| Affiliated issuers (cost $15,667,474) | 15,667,474 |
| Foreign currency (cost $747,122) | 746,362 |
| Receivable for: | |
| Investments sold | 6,035,600 |
| Capital shares sold | 2,449,314 |
| Dividends | 5,994,206 |
| Foreign tax reclaims | 2,339,936 |
| Prepaid expenses | 12,683 |
| Trustees’ deferred compensation plan | 15,513 |
| Total assets | 1,910,951,218 |
| Liabilities | |
| Due to custodian | 3,085 |
| Payable for: | |
| Investments purchased | 6,481,662 |
| Capital shares purchased | 2,753,735 |
| Management services fees | 41,432 |
| Transfer agent fees | 233,703 |
| Compensation of chief compliance officer | 124 |
| Other expenses | 289,566 |
| Trustees’ deferred compensation plan | 15,513 |
| Total liabilities | 9,818,820 |
| Net assets applicable to outstanding capital stock | $1,901,132,398 |
| Represented by | |
| Paid in capital | 2,095,584,031 |
| Total distributable earnings (loss) (Note 2) | (194,451,633) |
| Total - representing net assets applicable to outstanding capital stock | $1,901,132,398 |
| Institutional Class | |
| Net assets | $1,901,132,398 |
| Shares outstanding | 209,884,422 |
| Net asset value per share | $9.06 |
The accompanying Notes to Financial Statements are an integral part of this statement.
Multi-Manager International Equity Strategies Fund | Annual Report 2019
| 23 |
Statement of Operations
Year Ended August 31, 2019
| Net investment income | |
| Income: | |
| Dividends — unaffiliated issuers | $72,358,218 |
| Dividends — affiliated issuers | 524,753 |
| Interest | 3,026 |
| Foreign taxes withheld | (5,577,165) |
| Total income | 67,308,832 |
| Expenses: | |
| Management services fees | 15,100,870 |
| Transfer agent fees | |
| Institutional Class | 3,114,501 |
| Compensation of board members | 39,980 |
| Custodian fees | 301,790 |
| Printing and postage fees | 224,053 |
| Registration fees | 290,593 |
| Audit fees | 33,800 |
| Legal fees | 38,650 |
| Interest on interfund lending | 296 |
| Compensation of chief compliance officer | 833 |
| Other | 165,830 |
| Total expenses | 19,311,196 |
| Net investment income | 47,997,636 |
| Realized and unrealized gain (loss) — net | |
| Net realized gain (loss) on: | |
| Investments — unaffiliated issuers | (80,530,089) |
| Investments — affiliated issuers | (273) |
| Foreign currency translations | 188,840 |
| Net realized loss | (80,341,522) |
| Net change in unrealized appreciation (depreciation) on: | |
| Investments — unaffiliated issuers | (86,242,626) |
| Foreign currency translations | (34,653) |
| Net change in unrealized appreciation (depreciation) | (86,277,279) |
| Net realized and unrealized loss | (166,618,801) |
| Net decrease in net assets resulting from operations | $(118,621,165) |
The accompanying Notes to Financial Statements are an integral part of this statement.
| 24 | Multi-Manager International Equity Strategies Fund | Annual Report 2019 |
Statement of Changes in Net Assets
| | Year Ended
August 31, 2019 | Year Ended
August 31, 2018(a) |
| Operations | | |
| Net investment income | $47,997,636 | $7,950,267 |
| Net realized loss | (80,341,522) | (12,802,605) |
| Net change in unrealized appreciation (depreciation) | (86,277,279) | (56,976,251) |
| Net decrease in net assets resulting from operations | (118,621,165) | (61,828,589) |
| Distributions to shareholders | | |
| Net investment income and net realized gains | | |
| Institutional Class | (14,001,879) | — |
| Total distributions to shareholders (Note 2) | (14,001,879) | — |
| Increase (decrease) in net assets from capital stock activity | (9,518,669) | 2,105,082,700 |
| Total increase (decrease) in net assets | (142,141,713) | 2,043,254,111 |
| Net assets at beginning of year | 2,043,274,111 | 20,000 |
| Net assets at end of year | $1,901,132,398 | $2,043,274,111 |
| Undistributed net investment income | $42,675,032 | $8,207,568 |
| | Year Ended | Year Ended |
| | August 31, 2019 | August 31, 2018(a) |
| | Shares | Dollars ($) | Shares | Dollars ($) |
| Capital stock activity |
| Institutional Class | | | | |
| Subscriptions | 44,454,811 | 408,309,500 | 219,285,195 | 2,183,577,392 |
| Distributions reinvested | 1,678,866 | 14,001,741 | — | — |
| Redemptions | (47,483,266) | (431,829,910) | (8,053,184) | (78,494,692) |
| Net increase (decrease) | (1,349,589) | (9,518,669) | 211,232,011 | 2,105,082,700 |
| Total net increase (decrease) | (1,349,589) | (9,518,669) | 211,232,011 | 2,105,082,700 |
| (a) | Based on operations from May 17, 2018 (fund commencement of operations) through the stated period end. |
The accompanying Notes to Financial Statements are an integral part of this statement.
Multi-Manager International Equity Strategies Fund | Annual Report 2019
| 25 |
The following table is intended to help you understand the Fund’s financial performance. Certain information reflects financial results for a single share of a class held for the periods shown. Per share net investment income (loss) amounts are calculated based on average shares outstanding during the period. Total return assumes reinvestment of all dividends and distributions, if any. Total return does not reflect payment of sales charges, if any. Total return and portfolio turnover are not annualized for periods of less than one year. The portfolio turnover rate is calculated without regard to purchase and sales transactions of short-term instruments and certain derivatives, if any. If such transactions were included, the Fund’s portfolio turnover rate may be higher.
| Institutional Class | Year Ended August 31, |
| 2019 | 2018(a) |
| Per share data | | |
| Net asset value, beginning of period | $9.67 | $10.00 |
| Income (loss) from investment operations: | | |
| Net investment income | 0.23 | 0.04 |
| Net realized and unrealized loss | (0.77) | (0.37) |
| Total from investment operations | (0.54) | (0.33) |
| Distributions to shareholders | | |
| Distributions from net investment income | (0.07) | — |
| Total distributions to shareholders | (0.07) | — |
| Net asset value, end of period | $9.06 | $9.67 |
| Total return | (5.53%) | (3.30%) |
| Ratios to average net assets | | |
| Total gross expenses(b) | 1.02%(c) | 1.05%(d) |
| Total net expenses(b),(e) | 1.02%(c) | 1.05%(d) |
| Net investment income | 2.54% | 1.51%(d) |
| Supplemental data | | |
| Net assets, end of period (in thousands) | $1,901,132 | $2,043,274 |
| Portfolio turnover | 63% | 17% |
| Notes to Financial Highlights |
| (a) | The Fund commenced operations on May 17, 2018. Per share data and total return reflect activity from that date. |
| (b) | In addition to the fees and expenses that the Fund bears directly, the Fund indirectly bears a pro rata share of the fees and expenses of any other funds in which it invests. Such indirect expenses are not included in the Fund’s reported expense ratios. |
| (c) | Ratios include interfund lending expense which is less than 0.01%. |
| (d) | Annualized. |
| (e) | Total net expenses include the impact of certain fee waivers/expense reimbursements made by the Investment Manager and certain of its affiliates, if applicable. |
The accompanying Notes to Financial Statements are an integral part of this statement.
| 26 | Multi-Manager International Equity Strategies Fund | Annual Report 2019 |
Notes to Financial Statements
August 31, 2019
Note 1. Organization
Multi-Manager International Equity Strategies Fund (the Fund), a series of Columbia Funds Series Trust I (the Trust), is a diversified fund. The Trust is registered under the Investment Company Act of 1940, as amended (the 1940 Act), as an open-end management investment company organized as a Massachusetts business trust.
Fund shares
The Trust may issue an unlimited number of shares (without par value). The Fund is offered only through certain wrap fee programs sponsored and/or managed by Ameriprise Financial, Inc. (Ameriprise Financial) or its affiliates. The Fund offers each of the share classes listed in the Statement of Assets and Liabilities which are not subject to any front-end sales charge or contingent deferred sales charge.
Note 2. Summary of significant accounting policies
Basis of preparation
The Fund is an investment company that applies the accounting and reporting guidance in the Financial Accounting Standards Board (FASB) Accounting Standards Codification Topic 946,Financial Services - Investment Companies (ASC 946). The financial statements are prepared in accordance with U.S. generally accepted accounting principles (GAAP), which requires management to make certain estimates and assumptions that affect the reported amounts of assets and liabilities, the disclosure of contingent assets and liabilities at the date of the financial statements and the reported amounts of income and expenses during the reporting period. Actual results could differ from those estimates.
The following is a summary of significant accounting policies followed by the Fund in the preparation of its financial statements.
Security valuation
All equity securities and exchange-traded funds are valued at the close of business of the New York Stock Exchange. Equity securities and exchange-traded funds are valued at the official closing price on the principal exchange or market on which they trade. Unlisted securities or listed securities for which there were no sales during the day are valued at the mean of the latest quoted bid and ask prices on such exchanges or markets.
Foreign equity securities are valued based on the closing price on the foreign exchange in which such securities are primarily traded. If any foreign equity security closing prices are not readily available, the securities are valued at the mean of the latest quoted bid and ask prices on such exchanges or markets. Foreign currency exchange rates are determined at the scheduled closing time of the New York Stock Exchange. Many securities markets and exchanges outside the U.S. close prior to the close of the New York Stock Exchange; therefore, the closing prices for securities in such markets or on such exchanges may not fully reflect events that occur after such close but before the close of the New York Stock Exchange. In those situations, foreign securities will be fair valued pursuant to a policy adopted by the Board of Trustees. Under the policy, the Fund may utilize a third party pricing service to determine these fair values. The third-party pricing service takes into account multiple factors, including, but not limited to, movements in the U.S. securities markets, certain depositary receipts, futures contracts and foreign exchange rates that have occurred subsequent to the close of the foreign exchange or market, to determine a good faith estimate that reasonably reflects the current market conditions as of the close of the New York Stock Exchange. The fair value of a security is likely to be different from the quoted or published price, if available.
Participation Notes are valued at the market price of the underlying equity security. Counterparty risk is regularly reviewed and considered for valuation.
Investments in open-end investment companies, including money market funds, are valued at their latest net asset value.
Investments for which market quotations are not readily available, or that have quotations which management believes are not reflective of market value or reliable, are valued at fair value as determined in good faith under procedures approved by and under the general supervision of the Board of Trustees. If a security or class of securities (such as foreign securities) is valued at fair value, such value is likely to be different from the quoted or published price for the security.
Multi-Manager International Equity Strategies Fund | Annual Report 2019
| 27 |
Notes to Financial Statements (continued)
August 31, 2019
The determination of fair value often requires significant judgment. To determine fair value, management may use assumptions including but not limited to future cash flows and estimated risk premiums. Multiple inputs from various sources may be used to determine fair value.
GAAP requires disclosure regarding the inputs and valuation techniques used to measure fair value and any changes in valuation inputs or techniques. In addition, investments shall be disclosed by major category. This information is disclosed following the Fund’s Portfolio of Investments.
Foreign currency transactions and translations
The values of all assets and liabilities denominated in foreign currencies are generally translated into U.S. dollars at exchange rates determined at the close of regular trading on the New York Stock Exchange. Net realized and unrealized gains (losses) on foreign currency transactions and translations include gains (losses) arising from the fluctuation in exchange rates between trade and settlement dates on securities transactions, gains (losses) arising from the disposition of foreign currency and currency gains (losses) between the accrual and payment dates on dividends, interest income and foreign withholding taxes.
For financial statement purposes, the Fund does not distinguish that portion of gains (losses) on investments which is due to changes in foreign exchange rates from that which is due to changes in market prices of the investments. Such fluctuations are included with the net realized and unrealized gains (losses) on investments in the Statement of Operations.
Participation notes
The Fund invests in Participation Notes (P-Notes), which are a type of equity-linked note. P-Notes are issued by a bank or broker-dealer that entitles the Fund to a return measured by the change in value of a single equity security, basket of equity securities or an index of equity securities (each, an Underlying Equity). P-Notes are typically used when a direct investment in the Underlying Equity is restricted due to country-specific regulations. Investment in a P-Note is not the same as investment in the constituent shares of the company (or other issuer type) to which the Underlying Equity is economically tied. A P-Note represents only an obligation of the company or other issuer type to provide the Fund the economic performance equivalent to holding shares of the Underlying Equity. The holder of a P-Note is entitled to receive from the bank or broker-dealer any dividends or other distributions paid on the Underlying Equity. Income received from P-Notes is recorded as dividend income in the Statement of Operations. A P-Note does not provide any beneficial or equitable entitlement or interest in the relevant Underlying Equity. In other words, shares of the Underlying Equity are not in any way owned by the Fund. Risks associated with P-Notes include the possible failure of a counterparty (i.e., the issuing bank or broker-dealer) to perform in accordance with the terms of the agreement, inability to transfer or liquidate the notes, potential delays or an inability to redeem the notes before maturity under certain market conditions, and limited legal recourse against the issuer of the underlying common stock.
Security transactions
Security transactions are accounted for on the trade date. Cost is determined and gains (losses) are based upon the specific identification method for both financial statement and federal income tax purposes.
Income recognition
Interest income is recorded on an accrual basis.
Corporate actions and dividend income are generally recorded net of any non-reclaimable tax withholdings, on the ex-dividend date or upon receipt of ex-dividend notification in the case of certain foreign securities.
The Fund may receive distributions from holdings in equity securities, business development companies (BDCs), exchange-traded funds (ETFs), limited partnerships (LPs), other regulated investment companies (RICs), and real estate investment trusts (REITs), which report information on the tax character of their distributions annually. These distributions are allocated to dividend income, capital gain and return of capital based on actual information reported. Return of capital is recorded as a reduction of the cost basis of securities held. If the Fund no longer owns the applicable securities, return of capital is recorded as a realized gain. With respect to REITs, to the extent actual information has not yet been reported,
| 28 | Multi-Manager International Equity Strategies Fund | Annual Report 2019 |
Notes to Financial Statements (continued)
August 31, 2019
estimates for return of capital are made by the Fund’s management. Management’s estimates are subsequently adjusted when the actual character of the distributions is disclosed by the REITs, which could result in a proportionate change in return of capital to shareholders.
Awards from class action litigation are recorded as a reduction of cost basis if the Fund still owns the applicable securities on the payment date. If the Fund no longer owns the applicable securities, the proceeds are recorded as realized gains.
Expenses
General expenses of the Trust are allocated to the Fund and other funds of the Trust based upon relative net assets or other expense allocation methodologies determined by the nature of the expense. Expenses directly attributable to the Fund are charged to the Fund. Expenses directly attributable to a specific class of shares are charged to that share class.
Determination of class net asset value
All income, expenses (other than class-specific expenses, which are charged to that share class, as shown in the Statement of Operations) and realized and unrealized gains (losses) are allocated to each class of the Fund on a daily basis, based on the relative net assets of each class, for purposes of determining the net asset value of each class.
Federal income tax status
The Fund intends to qualify each year as a regulated investment company under Subchapter M of the Internal Revenue Code, as amended, and will distribute substantially all of its investment company taxable income and net capital gain, if any, for its tax year, and as such will not be subject to federal income taxes. In addition, the Fund intends to distribute in each calendar year substantially all of its ordinary income, capital gain net income and certain other amounts, if any, such that the Fund should not be subject to federal excise tax. Therefore, no federal income or excise tax provision is recorded.
Foreign taxes
The Fund may be subject to foreign taxes on income, gains on investments or currency repatriation, a portion of which may be recoverable. The Fund will accrue such taxes and recoveries, as applicable, based upon its current interpretation of tax rules and regulations that exist in the markets in which it invests.
Realized gains in certain countries may be subject to foreign taxes at the Fund level, based on statutory rates. The Fund accrues for such foreign taxes on realized and unrealized gains at the appropriate rate for each jurisdiction, as applicable. The amount, if any, is disclosed as a liability on the Statement of Assets and Liabilities.
Distributions to shareholders
Distributions from net investment income, if any, are declared and paid annually. Net realized capital gains, if any, are distributed at least annually. Income distributions and capital gain distributions are determined in accordance with federal income tax regulations, which may differ from GAAP.
Guarantees and indemnifications
Under the Trust’s organizational documents and, in some cases, by contract, its officers and trustees are indemnified against certain liabilities arising out of the performance of their duties to the Trust or its funds. In addition, certain of the Fund’s contracts with its service providers contain general indemnification clauses. The Fund’s maximum exposure under these arrangements is unknown since the amount of any future claims that may be made against the Fund cannot be determined, and the Fund has no historical basis for predicting the likelihood of any such claims.
Recent accounting pronouncements
Accounting Standards Update 2017-08 Premium Amortization on Purchased Callable Debt Securities
In March 2017, the Financial Accounting Standards Board issued Accounting Standards Update (ASU) No. 2017-08 Premium Amortization on Purchased Callable Debt Securities. ASU No. 2017-08 updates the accounting standards to shorten the amortization period for certain purchased callable debt securities, held at a premium, to be amortized to the earliest call date. The update applies to securities with explicit, noncontingent call features that are callable at fixed prices and on preset
Multi-Manager International Equity Strategies Fund | Annual Report 2019
| 29 |
Notes to Financial Statements (continued)
August 31, 2019
dates. The standard is effective for annual periods beginning after December 15, 2018 and interim periods within those fiscal years. Management does not expect the implementation of this guidance to have a material impact on the financial statement amounts and footnote disclosures.
Accounting Standards Update 2018-13 Disclosure Framework - Changes to the Disclosure Requirements for Fair Value Measurement
In August 2018, the Financial Accounting Standards Board issued Accounting Standards Update (ASU) No. 2018-13 Disclosure Framework - Changes to the Disclosure Requirements for Fair Value Measurement. The standard is effective for annual periods beginning after December 15, 2019 and interim periods within those fiscal years, with early adoption permitted. After evaluation, management determined to adopt the ASU effective for the period ended August 31, 2019 and all subsequent periods. As a result of the amendments, management implemented disclosure changes which include removal of the amount and reasons for transfers between Level 1 and Level 2 of the fair value hierarchy, removal of the policy for the timing of transfers between levels, removal of the description of the Level 3 valuation processes, as well as modifications to the measurement uncertainty disclosure.
Disclosure Update and Simplification
In September 2018, the Securities and Exchange Commission (SEC) released Final Rule 33-10532, Disclosure Update and Simplification, which amends certain financial statement disclosure requirements that the SEC determined to be redundant, outdated, or superseded in light of other SEC disclosure requirements, GAAP, or changes in the information environment. As a result of the amendments, management implemented disclosure changes which included removing the components of distributable earnings presented on the Statement of Assets and Liabilities and combining income and gain distributions paid to shareholders as presented on the Statement of Changes in Net Assets. Any values presented to meet prior year requirements were left unchanged. The amendments had no effect on the Fund’s net assets or results of operation.
Note 3. Fees and other transactions with affiliates
Management services fees
The Fund has entered into a Management Agreement with Columbia Management Investment Advisers, LLC (the Investment Manager), a wholly-owned subsidiary of Ameriprise Financial, Inc. (Ameriprise Financial). Under the Management Agreement, the Investment Manager provides the Fund with investment research and advice, as well as administrative and accounting services. The Investment Manager is responsible for the ultimate oversight of investments made by the Fund. The Fund’s subadvisers (see Subadvisory agreements below) have the primary responsibility for the day-to-day portfolio management of their portion of the Fund. The management services fee is an annual fee that is equal to a percentage of the Fund’s daily net assets that declines from 0.87% to 0.67% as the Fund’s net assets increase. The effective management services fee rate for the year ended August 31, 2019 was 0.80% of the Fund’s average daily net assets.
Subadvisory agreements
The Investment Manager has entered into Subadvisory Agreements with Arrowstreet Capital, Limited Partnership (Arrowstreet), Baillie Gifford Overseas Limited (Baillie Gifford) and Causeway Capital Management LLC (Causeway) to subadvise a portion of the Fund. The Investment Manager compensates Arrowstreet, Baillie Gifford and Causeway to manage the investments of a portion of the Fund’s assets.
Other expenses
Other expenses include offering costs which were incurred prior to the shares of the Fund being offered. Offering costs include, among other things, state registration filing fees and printing costs. The Fund amortizes offering costs over a period of 12 months from the commencement of operations.
| 30 | Multi-Manager International Equity Strategies Fund | Annual Report 2019 |
Notes to Financial Statements (continued)
August 31, 2019
Compensation of board members
Members of the Board of Trustees who are not officers or employees of the Investment Manager or Ameriprise Financial are compensated for their services to the Fund as disclosed in the Statement of Operations. These members of the Board of Trustees may participate in a Deferred Compensation Plan (the Deferred Plan) which may be terminated at any time. Obligations of the Deferred Plan will be paid solely out of the Fund’s assets, and all amounts payable under the Deferred Plan constitute a general unsecured obligation of the Fund.
Compensation of Chief Compliance Officer
The Board of Trustees has appointed a Chief Compliance Officer to the Fund in accordance with federal securities regulations. As disclosed in the Statement of Operations, a portion of the Chief Compliance Officer’s total compensation is allocated to the Fund, along with other allocations to affiliated registered investment companies managed by the Investment Manager and its affiliates, based on relative net assets.
Transfer agency fees
Under a Transfer and Dividend Disbursing Agent Agreement, Columbia Management Investment Services Corp. (the Transfer Agent), an affiliate of the Investment Manager and a wholly-owned subsidiary of Ameriprise Financial, is responsible for providing transfer agency services to the Fund. The Transfer Agent has contracted with DST Asset Manager Solutions, Inc. (DST) to serve as sub-transfer agent. The Transfer Agent pays the fees of DST for services as sub-transfer agent and DST is not entitled to reimbursement for such fees from the Fund (with the exception of out-of-pocket fees).
The Fund pays the Transfer Agent a monthly transfer agency fee based on the number or the average value of accounts, depending on the type of account. In addition, the Fund pays the Transfer Agent a fee for shareholder services based on the number of accounts or on a percentage of the average aggregate value of the Fund’s shares maintained in omnibus accounts up to the lesser of the amount charged by the financial intermediary or a cap established by the Board of Trustees from time to time.
The Transfer Agent also receives compensation from the Fund for various shareholder services and reimbursements for certain out-of-pocket fees.
For the year ended August 31, 2019, the Fund’s effective transfer agency fee rates as a percentage of average daily net assets of each class were as follows:
| | Effective rate (%) |
| Institutional Class | 0.16 |
Distribution and service fees
The Fund has an agreement with Columbia Management Investment Distributors, Inc. (the Distributor), an affiliate of the Investment Manager and a wholly-owned subsidiary of Ameriprise Financial, for distribution and shareholder services. The Fund does not pay the Distributor a fee for the distribution services it provides to the Fund.
Expenses waived/reimbursed by the Investment Manager and its affiliates
The Investment Manager and certain of its affiliates have contractually agreed to waive fees and/or reimburse expenses (excluding certain fees and expenses described below) for the period(s) disclosed below, unless sooner terminated at the sole discretion of the Board of Trustees, so that the Fund’s net operating expenses, after giving effect to fees waived/expenses reimbursed and any balance credits and/or overdraft charges from the Fund’s custodian, do not exceed the following annual rate(s) as a percentage of the class’ average daily net assets:
| | Fee rate(s) contractual
through
December 31, 2019 |
| Institutional Class | 1.07 |
Multi-Manager International Equity Strategies Fund | Annual Report 2019
| 31 |
Notes to Financial Statements (continued)
August 31, 2019
Under the agreement governing these fee waivers and/or expense reimbursement arrangements, the following fees and expenses are excluded from the waiver/reimbursement commitment, and therefore will be paid by the Fund, if applicable: taxes (including foreign transaction taxes), expenses associated with investments in affiliated and non-affiliated pooled investment vehicles (including mutual funds and exchange-traded funds), transaction costs and brokerage commissions, costs related to any securities lending program, dividend expenses associated with securities sold short, inverse floater program fees and expenses, transaction charges and interest on borrowed money, interest, infrequent and/or unusual expenses and any other expenses the exclusion of which is specifically approved by the Board of Trustees. This agreement may be modified or amended only with approval from the Investment Manager, certain of its affiliates and the Fund. Any fees waived and/or expenses reimbursed under the expense reimbursement arrangements described above are not recoverable by the Investment Manager or its affiliates in future periods.
Note 4. Federal tax information
The timing and character of income and capital gain distributions are determined in accordance with income tax regulations, which may differ from GAAP because of temporary or permanent book to tax differences.
At August 31, 2019, these differences were primarily due to differing treatment for deferral/reversal of wash sale losses, trustees’ deferred compensation, non-deductible expenses, capital loss carryforward, foreign currency transactions, and passive foreign investment company (PFIC) holdings. To the extent these differences were permanent, reclassifications were made among the components of the Fund’s net assets. Temporary differences do not require reclassifications.
The following reclassifications were made:
Undistributed net
investment
income ($) | Accumulated
net realized
(loss) ($) | Paid in
capital ($) |
| 471,707 | (471,707) | — |
Net investment income (loss) and net realized gains (losses), as disclosed in the Statement of Operations, and net assets were not affected by this reclassification.
The tax character of distributions paid during the years indicated was as follows:
| Year Ended August 31, 2019 | Year Ended August 31, 2018 |
Ordinary
income ($) | Long-term
capital gains ($) | Total ($) | Ordinary
income ($) | Long-term
capital gains ($) | Total ($) |
| 14,001,879 | — | 14,001,879 | — | — | — |
Short-term capital gain distributions, if any, are considered ordinary income distributions for tax purposes.
At August 31, 2019, the components of distributable earnings on a tax basis were as follows:
Undistributed
ordinary income ($) | Undistributed
long-term
capital gains ($) | Capital loss
carryforwards ($) | Net unrealized
(depreciation) ($) |
| 43,099,366 | — | (81,466,281) | (156,039,729) |
At August 31, 2019, the cost of all investments for federal income tax purposes along with the aggregate gross unrealized appreciation and depreciation based on that cost was:
Federal
tax cost ($) | Gross unrealized
appreciation ($) | Gross unrealized
(depreciation) ($) | Net unrealized
(depreciation) ($) |
| 2,049,397,333 | 97,964,827 | (254,004,556) | (156,039,729) |
Tax cost of investments and unrealized appreciation/(depreciation) may also include timing differences that do not constitute adjustments to tax basis.
| 32 | Multi-Manager International Equity Strategies Fund | Annual Report 2019 |
Notes to Financial Statements (continued)
August 31, 2019
The following capital loss carryforwards, determined at August 31, 2019, may be available to reduce taxable income arising from future net realized gains on investments, if any, to the extent permitted by the Internal Revenue Code. Capital loss carryforwards with no expiration are required to be utilized prior to any capital losses which carry an expiration date. As a result of this ordering rule, capital loss carryforwards which carry an expiration date may be more likely to expire unused. In addition, for the year ended August 31, 2019, capital loss carryforwards utilized and expired unused, if any, were as follows:
No expiration
short-term ($) | No expiration
long-term ($) | Total ($) | Utilized ($) | Expired ($) |
| (72,854,354) | (8,611,927) | (81,466,281) | — | — |
Management of the Fund has concluded that there are no significant uncertain tax positions in the Fund that would require recognition in the financial statements. However, management’s conclusion may be subject to review and adjustment at a later date based on factors including, but not limited to, new tax laws, regulations, and administrative interpretations (including relevant court decisions). Generally, the Fund’s federal tax returns for the prior three fiscal years remain subject to examination by the Internal Revenue Service.
Note 5. Portfolio information
The cost of purchases and proceeds from sales of securities, excluding short-term investments and derivatives, if any, aggregated to $1,221,631,796 and $1,190,838,730, respectively, for the year ended August 31, 2019. The amount of purchase and sale activity impacts the portfolio turnover rate reported in the Financial Highlights.
Note 6. Affiliated money market fund
The Fund invests in Columbia Short-Term Cash Fund, an affiliated money market fund established for the exclusive use by the Fund and other affiliated funds (the Affiliated MMF). The income earned by the Fund from such investments is included as Dividends - affiliated issuers in the Statement of Operations. As an investing fund, the Fund indirectly bears its proportionate share of the expenses of the Affiliated MMF. The Affiliated MMF prices its shares with a floating net asset value. In addition, the Board of Trustees of the Affiliated MMF may impose a fee on redemptions (sometimes referred to as a liquidity fee) or temporarily suspend redemptions (sometimes referred to as imposing a redemption gate) in the event its liquidity falls below regulatory limits.
Note 7. Interfund lending
Pursuant to an exemptive order granted by the Securities and Exchange Commission, the Fund participates in a program (the Interfund Program) allowing each participating Columbia Fund (each, a Participating Fund) to lend money directly to and, except for closed-end funds and money market funds, borrow money directly from other Participating Funds for temporary purposes. The amounts eligible for borrowing and lending under the Interfund Program are subject to certain restrictions.
Interfund loans are subject to the risk that the borrowing fund could be unable to repay the loan when due, and a delay in repayment to the lending fund could result in lost opportunities and/or additional lending costs. The exemptive order is subject to conditions intended to mitigate conflicts of interest arising from the Investment Manager’s relationship with each Participating Fund.
The Fund’s activity in the Interfund Program during the year ended August 31, 2019 was as follows:
| Borrower or lender | Average loan
balance ($) | Weighted average
interest rate (%) | Days
outstanding |
| Borrower | 950,000 | 2.81 | 4 |
Interest expense incurred by the Fund is recorded as Interfund lending in the Statement of Operations. The Fund had no outstanding interfund loans at August 31, 2019.
Multi-Manager International Equity Strategies Fund | Annual Report 2019
| 33 |
Notes to Financial Statements (continued)
August 31, 2019
Note 8. Line of credit
The Fund has access to a revolving credit facility with a syndicate of banks led by Citibank, N.A., HSBC Bank USA, N.A. and JPMorgan Chase Bank, N.A. whereby the Fund may borrow for the temporary funding of shareholder redemptions or for other temporary or emergency purposes. The credit facility, which is a collective agreement between the Fund and certain other funds managed by the Investment Manager or an affiliated investment manager, severally and not jointly, permits collective borrowings up to $1 billion. Interest is charged to each participating fund based on its borrowings at a rate equal to the higher of (i) the federal funds effective rate, (ii) the one-month LIBOR rate and (iii) the overnight bank funding rate, plus in each case, 1.00%. Each borrowing under the credit facility matures no later than 60 days after the date of borrowing. The Fund also pays a commitment fee equal to its pro rata share of the unused amount of the credit facility at a rate of 0.15% per annum. The commitment fee is included in other expenses in the Statement of Operations. This agreement expires annually in December unless extended or renewed.
The Fund had no borrowings during the year ended August 31, 2019.
Note 9. Significant risks
Foreign securities and emerging market countries risk
Investing in foreign securities may involve certain risks not typically associated with investing in U.S. securities, such as increased currency volatility and risks associated with political, regulatory, economic, social, diplomatic and other conditions or events occurring in the country or region, which may result in significant market volatility. In addition, certain foreign securities may not be as liquid as U.S. securities. Investing in emerging markets may increase these risks and expose the Fund to elevated risks associated with increased inflation, deflation or currency devaluation. To the extent that the Fund concentrates its investment exposure to any one or a few specific countries, the Fund will be particularly susceptible to the risks associated with the conditions, events or other factors impacting those countries or regions and may, therefore, have a greater risk than that of a fund that is more geographically diversified.
Geographic focus risk
The Fund may be particularly susceptible to economic, political, regulatory or other events or conditions affecting issuers and countries within the specific geographic regions in which the Fund invests. Currency devaluations could occur in countries that have not yet experienced currency devaluation to date, or could continue to occur in countries that have already experienced such devaluations. As a result the Fund’s NAV may be more volatile than the NAV of a more geographically diversified fund.
Shareholder concentration risk
At August 31, 2019, affiliated shareholders of record owned 100.0% of the outstanding shares of the Fund in one or more accounts. Subscription and redemption activity by concentrated accounts may have a significant effect on the operations of the Fund. In the case of a large redemption, the Fund may be forced to sell investments at inopportune times, including its liquid positions, which may result in Fund losses and the Fund holding a higher percentage of less liquid positions. Large redemptions could result in decreased economies of scale and increased operating expenses for non-redeeming Fund shareholders.
Note 10. Subsequent events
Management has evaluated the events and transactions that have occurred through the date the financial statements were issued and noted no items requiring adjustment of the financial statements or additional disclosure.
Note 11. Information regarding pending and settled legal proceedings
Ameriprise Financial and certain of its affiliates have historically been involved in a number of legal, arbitration and regulatory proceedings, including routine litigation, class actions, and governmental actions, concerning matters arising in connection with the conduct of their business activities. Ameriprise Financial believes that the Fund is not currently the subject of, and that neither Ameriprise Financial nor any of its affiliates are the subject of, any pending legal, arbitration or regulatory proceedings that are likely to have a material adverse effect on the Fund or the ability of Ameriprise Financial or its affiliates
| 34 | Multi-Manager International Equity Strategies Fund | Annual Report 2019 |
Notes to Financial Statements (continued)
August 31, 2019
to perform under their contracts with the Fund. Ameriprise Financial is required to make quarterly (10-Q), annual (10-K) and, as necessary, 8-K filings with the Securities and Exchange Commission (SEC) on legal and regulatory matters that relate to Ameriprise Financial and its affiliates. Copies of these filings may be obtained by accessing the SEC website at www.sec.gov.
There can be no assurance that these matters, or the adverse publicity associated with them, will not result in increased Fund redemptions, reduced sale of Fund shares or other adverse consequences to the Fund. Further, although we believe proceedings are not likely to have a material adverse effect on the Fund or the ability of Ameriprise Financial or its affiliates to perform under their contracts with the Fund, these proceedings are subject to uncertainties and, as such, we are unable to estimate the possible loss or range of loss that may result. An adverse outcome in one or more of these proceedings could result in adverse judgments, settlements, fines, penalties or other relief that could have a material adverse effect on the consolidated financial condition or results of operations of Ameriprise Financial.
Multi-Manager International Equity Strategies Fund | Annual Report 2019
| 35 |
Report of Independent Registered Public Accounting Firm
To the Board of Trustees of Columbia Funds Series Trust I and Shareholders of Multi-Manager International Equity Strategies Fund
Opinion on the Financial Statements
We have audited the accompanying statement of assets and liabilities, including the portfolio of investments, of Multi-Manager International Equity Strategies Fund (one of the funds constituting Columbia Funds Series Trust I, hereafter referred to as the “Fund”) as of August 31, 2019, the related statement of operations for the year ended August 31, 2019 and the statement of changes in net assets and the financial highlights for the year ended August 31, 2019 and for the period May 17, 2018 (commencement of operations) through August 31, 2018, including the related notes (collectively referred to as the “financial statements”). In our opinion, the financial statements present fairly, in all material respects, the financial position of the Fund as of August 31, 2019, the results of its operations for the year ended August 31, 2019, and the changes in its net assets and the financial highlights for the year ended August 31, 2019 and for the period May 17, 2018 (commencement of operations) through August 31, 2018 in conformity with accounting principles generally accepted in the United States of America.
Basis for Opinion
These financial statements are the responsibility of the Fund’s management. Our responsibility is to express an opinion on the Fund’s financial statements based on our audits. We are a public accounting firm registered with the Public Company Accounting Oversight Board (United States) (PCAOB) and are required to be independent with respect to the Fund in accordance with the U.S. federal securities laws and the applicable rules and regulations of the Securities and Exchange Commission and the PCAOB.
We conducted our audits of these financial statements in accordance with the standards of the PCAOB. Those standards require that we plan and perform the audit to obtain reasonable assurance about whether the financial statements are free of material misstatement, whether due to error or fraud.
Our audits included performing procedures to assess the risks of material misstatement of the financial statements, whether due to error or fraud, and performing procedures that respond to those risks. Such procedures included examining, on a test basis, evidence regarding the amounts and disclosures in the financial statements. Our audits also included evaluating the accounting principles used and significant estimates made by management, as well as evaluating the overall presentation of the financial statements. Our procedures included confirmation of securities owned as of August 31, 2019, by correspondence with the custodian, transfer agent, and brokers; when replies were not received from brokers, we performed other audit procedures. We believe that our audits provides a reasonable basis for our opinion.
/s/PricewaterhouseCoopers LLP
Minneapolis, Minnesota
October 24, 2019
We have served as the auditor of one or more investment companies within the Columbia Funds Complex since 1977.
| 36 | Multi-Manager International Equity Strategies Fund | Annual Report 2019 |
Federal Income Tax Information
(Unaudited)
The Fund hereby designates the following tax attributes for the fiscal year ended August 31, 2019. Shareholders will be notified in early 2020 of the amounts for use in preparing 2019 income tax returns.
Qualified
dividend
income | Dividends
received
deduction | Foreign
taxes paid
to foreign
countries | Foreign
taxes paid
per share
to foreign
countries | Foreign
source
income | Foreign
source
income per
share |
| 100.00% | 0.11% | $5,546,742 | $0.03 | $67,769,177 | $0.32 |
Qualified dividend income. For taxable, non-corporate shareholders, the percentage of ordinary income distributed during the fiscal year that represents qualified dividend income subject to reduced tax rates.
Dividends received deduction. The percentage of ordinary income distributed during the fiscal year that qualifies for the corporate dividends received deduction.
Foreign taxes. The Fund makes the election to pass through to shareholders the foreign taxes paid. Eligible shareholders may claim a foreign tax credit. These taxes, and the corresponding foreign source income, are provided.
TRUSTEES AND OFFICERS
The Board oversees the Fund’s operations and appoints officers who are responsible for day-to-day business decisions based on policies set by the Board. The following table provides basic biographical information about the Fund’s Trustees as of the printing of this report, including their principal occupations during the past five years, although specific titles for individuals may have varied over the period. The year set forth beneath Length of Service in the table below is the year in which the Trustee was first appointed or elected as Trustee to any Fund currently in the Columbia Funds Complex or a predecessor thereof. Under current Board policy, members serve terms of indefinite duration.
Independent trustees
| Name, address, year of birth | Position held with the Trust and length of service | Principal occupation(s) during the past five years and other relevant professional experience | Number of Funds in the Columbia Fund Complex overseen | Other directorships held by Trustee during the past five years |
Janet Langford Carrig
c/o Columbia Management
Investment Advisers, LLC
225 Franklin Street
Mail Drop BX32 05228
Boston, MA 02110
1957 | Trustee
1996 | Senior Vice President, General Counsel and Corporate Secretary, ConocoPhillips (independent energy company), September 2007-October 2018 | 70 | None |
Douglas A. Hacker
c/o Columbia Management
Investment Advisers, LLC
225 Franklin Street
Mail Drop BX32 05228
Boston, MA 02110
1955 | Trustee and Chairman of the Board
1996 | Independent business executive since May 2006; Executive Vice President — Strategy of United Airlines, December 2002-May 2006; President of UAL Loyalty Services (airline marketing company), September 2001-December 2002; Executive Vice President and Chief Financial Officer of United Airlines, July 1999-September 2001 | 70 | Spartan Nash Company, (food distributor); former Director, Nash Finch Company (food distributor), 2005-2013; Aircastle Limited (aircraft leasing); former Director, SeaCube Container Leasing Ltd. (container leasing), 2010-2013; and Travelport Worldwide Limited (travel information technology) |
Multi-Manager International Equity Strategies Fund | Annual Report 2019
| 37 |
TRUSTEES AND OFFICERS (continued)
Independent trustees (continued)
| Name, address, year of birth | Position held with the Trust and length of service | Principal occupation(s) during the past five years and other relevant professional experience | Number of Funds in the Columbia Fund Complex overseen | Other directorships held by Trustee during the past five years |
Nancy T. Lukitsh
c/o Columbia Management
Investment Advisers, LLC
225 Franklin Street
Mail Drop BX32 05228
Boston, MA 02110
1956 | Trustee
2011 | Senior Vice President, Partner and Director of Marketing, Wellington Management Company, LLP (investment adviser), 1997-2010; Chair, Wellington Management Portfolios (commingled non-U.S. investment pools), 2007-2010; Director, Wellington Trust Company, NA and other Wellington affiliates, 1997-2010 | 70 | None |
David M. Moffett
c/o Columbia Management
Investment Advisers, LLC
225 Franklin Street
Mail Drop BX32 05228
Boston, MA 02110
1952 | Trustee
2011 | Retired. Consultant to Bridgewater and Associates | 70 | Director, CSX Corporation (transportation suppliers); Genworth Financial, Inc. (financial and insurance products and services); PayPal Holdings Inc. (payment and data processing services); Trustee, University of Oklahoma Foundation; former Director, eBay Inc. (online trading community), 2007-2015; and former Director, CIT Bank, CIT Group Inc. (commercial and consumer finance), 2010-2016 |
John J. Neuhauser
c/o Columbia Management
Investment Advisers, LLC
225 Franklin Street
Mail Drop BX32 05228
Boston, MA 02110
1943 | Trustee
1984 | President, Saint Michael’s College, August 2007-June 2018; Director or Trustee of several non-profit organizations, including University of Vermont Medical Center; Academic Vice President and Dean of Faculties, Boston College, August 1999-October 2005; University Professor, Boston College, November 2005-August 2007 | 70 | Liberty All-Star Equity Fund and Liberty All- Star Growth Fund (closed-end funds) |
Patrick J. Simpson
c/o Columbia Management
Investment Advisers, LLC
225 Franklin Street
Mail Drop BX32 05228
Boston, MA 02110
1944 | Trustee
2000 | Of Counsel, Perkins Coie LLP (law firm) since 2015; Partner, Perkins Coie LLP, 1988-2014 | 70 | Former Director, M Fund, Inc. (M Funds mutual fund family), July 2018-July 2019 |
Anne-Lee Verville
c/o Columbia Management
Investment Advisers, LLC
225 Franklin Street
Mail Drop BX32 05228
Boston, MA 02110
1945 | Trustee
1998 | Retired. General Manager, Global Education Industry, 1994-1997, President – Application Systems Division, 1991-1994, Chief Financial Officer – US Marketing & Services, 1988-1991, and Chief Information Officer, 1987-1988, IBM Corporation (computer and technology) | 70 | Former Director, Enesco Group, Inc. (producer of giftware and home and garden decor products), 2001-2006 |
| 38 | Multi-Manager International Equity Strategies Fund | Annual Report 2019 |
TRUSTEES AND OFFICERS (continued)
Consultants to the Independent Trustees*
| Name, address, year of birth | Position held with the Trust and length of service | Principal occupation(s) during the past five years and other relevant professional experience | Number of Funds in the Columbia Funds complex overseen | Other directorships held by Trustee during the past five years |
J. Kevin Connaughton
c/o Columbia
Management Investment
Advisers, LLC,
225 Franklin Street
Mail Drop BX32 05228,
Boston, MA 02110
1964 | Independent Trustee Consultant
2016 | Independent Trustee Consultant, Columbia Funds since March 2016; Adjunct Professor of Finance, Bentley University since November 2017; Managing Director and General Manager of Mutual Fund Products, Columbia Management Investment Advisers, LLC, May 2010-February 2015; President, Columbia Funds, 2009-2015; and senior officer of Columbia Funds and affiliated funds, 2003-2015 | 70 | Director, The Autism Project since March 2015; former Trustee, New Century Portfolios, March 2015-December 2017; formerly on Board of Governors, Gateway Healthcare, January 2016 – December 2017 |
Olive Darragh
c/o Columbia
Management Investment
Advisers, LLC,
225 Franklin Street,
Mail Drop BX32 05228,
Boston, MA 02110
1962 | Independent Trustee Consultant 2019 | Independent Trustee Consultant, Columbia Funds since June 2019; Managing Director of Darragh Inc. (a strategy and talent management consulting firm) since 2010; Founder and CEO, Zolio (an investment management talent identification platform) since 2004; Partner, Tudor Investments, 2004-2010; Senior Partner, McKinsey & Company, 2001-2004 | 70 | Director, University of Edinburgh Business School; former Director, Boston Public Library Foundation |
Natalie A. Trunow
c/o Columbia
Management Investment
Advisers, LLC,
225 Franklin Street
Mail Drop BX32 05228,
Boston, MA 02110
1967 | Independent Trustee Consultant
2016 | Independent Trustee Consultant, Columbia Funds since September 2016; Chief Executive Officer, Millennial Portfolio Solutions LLC (asset management and consulting services) since January 2016; Director of Investments, Casey Family Programs, April 2016-September 2016; Senior Vice President and Chief Investment Officer, Calvert Investments, August 2008-January 2016; Section Head and Portfolio Manager, General Motors Asset Management, June 1997-August 2008 | 70 | Director, Health Services for Children with Special Needs, Inc.; Director, Consumer Credit Counseling Services (formerly Guidewell Financial Solutions) |
| * | J. Kevin Connaughton was appointed consultant to the Independent Trustees effective March 1, 2016. Olive Darragh was appointed consultant to the Independent Trustees effective June 10, 2019. Natalie A. Trunow was appointed consultant to the Independent Trustees effective September 1, 2016. Shareholders of the Funds are expected to be asked to elect each of Mr. Connaughton, Ms. Darragh and Ms. Trunow as a Trustee at a future shareholder meeting. |
Interested trustee affiliated with Investment Manager*
| Name, address, year of birth | Position held with the Trust and length of service | Principal occupation(s) during the past five years and other relevant professional experience | Number of Funds in the Columbia Funds Complex overseen | Other directorships held by Trustee during the past five years |
William F. Truscott
c/o Columbia Management
Investment Advisers, LLC
225 Franklin Street
Boston, MA 02110
1960 | Trustee
2012 | Chairman of the Board and President, Columbia Management Investment Advisers, LLC since May 2010 and February 2012, respectively; Chief Executive Officer, Global Asset Management, Ameriprise Financial, Inc. since September 2012 (previously Chief Executive Officer, U.S. Asset Management & President, Annuities, May 2010-September 2012); Director and Chief Executive Officer, Columbia Management Investment Distributors, Inc. since May 2010 and February 2012, respectively; Chairman of the Board and Chief Executive Officer, RiverSource Distributors, Inc. since 2006; Director, Threadneedle Asset Management Holdings, SARL since 2014; President and Chief Executive Officer, Ameriprise Certificate Company, 2006-August 2012 | 192 | Chairman of the Board, Columbia Management Investment Advisers, LLC since May 2010; Director, Columbia Management Investment Distributors, Inc. since May 2010; former Director, Ameriprise Certificate Company, August 2006 - January 2013 |
Multi-Manager International Equity Strategies Fund | Annual Report 2019
| 39 |
TRUSTEES AND OFFICERS (continued)
| * | Interested person (as defined under the 1940 Act) by reason of being an officer, director, security holder and/or employee of the Investment Manager or Ameriprise Financial. |
The Statement of Additional Information has additional information about the Fund’s Board members and is available, without charge, upon request by calling 800.345.6611, visiting columbiathreadneedleus.com/investor/ or contacting your financial intermediary.
The Board has appointed officers who are responsible for day-to-day business decisions based on policies it has established. The officers serve at the pleasure of the Board. The following table provides basic information about the Officers of the Fund as of the printing of this report, including principal occupations during the past five years, although their specific titles may have varied over the period. In addition to Mr. Truscott, who is Senior Vice President, the Fund’s other officers are:
Name,
address and
year of birth | Position and year
first appointed to
position for any Fund
in the Columbia
Funds complex or a
predecessor thereof | Principal occupation(s) during past five years |
Christopher O. Petersen
5228 Ameriprise
Financial Center
Minneapolis, MN 55474
Born 1970 | President and Principal Executive Officer (2015) | Vice President and Lead Chief Counsel, Ameriprise Financial, Inc. since January 2015 (previously Vice President and Chief Counsel, January 2010 - December 2014; officer of Columbia Funds and affiliated funds since 2007. |
Michael G. Clarke
225 Franklin Street
Boston, MA 02110
Born 1969 | Chief Financial Officer (Principal Financial Officer) (2009) and Senior Vice President (2019) | Vice President, Head of North American Operations, and Co-Head of Global Operations, Columbia Management Investment Advisers, LLC, since June 2019 (previously Vice President – Accounting and Tax, May 2010 - May 2019); senior officer of Columbia Funds and affiliated funds since 2002 (previously Treasurer and Chief Accounting Officer, January 2009 - January 2019 and December 2015 - January 2019, respectively). |
Joseph Beranek
5890 Ameriprise
Financial Center
Minneapolis, MN 55474
Born 1965 | Treasurer and Chief Accounting Officer (Principal Accounting Officer) (2019) | Vice President — Mutual Fund Accounting and Financial Reporting, Columbia Management Investment Advisers, LLC, since December 2018 and March 2017, respectively (previously Vice President — Pricing and Corporate Actions, May 2010 - March 2017). |
Paul B. Goucher
485 Lexington Avenue
New York, NY 10017
Born 1968 | Senior Vice President (2011) and Assistant Secretary (2008) | Senior Vice President and Assistant General Counsel, Ameriprise Financial, Inc. since January 2017 (previously Vice President and Lead Chief Counsel, November 2008 - January 2017 and January 2013 - January 2017, respectively); Vice President, Chief Legal Officer and Assistant Secretary, Columbia Management Investment Advisers, LLC since March 2015 (previously Vice President and Assistant Secretary, May 2010 – March 2015). |
Thomas P. McGuire
225 Franklin Street
Boston, MA 02110
Born 1972 | Senior Vice President and Chief Compliance Officer (2012) | Vice President — Asset Management Compliance, Ameriprise Financial, Inc., since May 2010; Chief Compliance Officer, Ameriprise Certificate Company since September 2010. |
Colin Moore
225 Franklin Street
Boston, MA 02110
Born 1958 | Senior Vice President (2010) | Executive Vice President and Global Chief Investment Officer, Ameriprise Financial, Inc., since July 2013; Executive Vice President and Global Chief Investment Officer, Columbia Management Investment Advisers, LLC since July 2013. |
Ryan C. Larrenaga
225 Franklin Street
Boston, MA 02110
Born 1970 | Senior Vice President (2017), Chief Legal Officer (2017), and Secretary (2015) | Vice President and Chief Counsel, Ameriprise Financial, Inc. since August 2018 (previously Vice President and Group Counsel, August 2011 - August 2018); officer of Columbia Funds and affiliated funds since 2005. |
Michael E. DeFao
225 Franklin Street
Boston, MA 02110
Born 1968 | Vice President (2011) and Assistant Secretary (2010) | Vice President and Chief Counsel, Ameriprise Financial, Inc. since May 2010. |
Lyn Kephart-Strong
5228 Ameriprise
Financial Center
Minneapolis, MN 55474
Born 1960 | Vice President (2015) | President, Columbia Management Investment Services Corp. since October 2014; Vice President & Resolution Officer, Ameriprise Trust Company since August 2009. |
| 40 | Multi-Manager International Equity Strategies Fund | Annual Report 2019 |
Board Consideration and Approval of Management
and Subadvisory Agreements
On June 12, 2019, the Board of Trustees (the Board) and the Trustees who are not interested persons (as defined in the Investment Company Act of 1940) (the Independent Trustees) of Columbia Funds Series Trust I (the Trust) unanimously approved the continuation of the Management Agreement (the Management Agreement) with Columbia Management Investment Advisers, LLC (the Investment Manager) and the Subadvisory Agreements (the Subadvisory Agreements) between the Investment Manager and Threadneedle International Limited, Arrowstreet Capital, Limited Partnership, Baillie Gifford Overseas Limited and Causeway Capital Management LLC (the Subadvisers) with respect to Multi-Manager International Equity Strategies Fund (the Fund), a series of the Trust. As detailed below, the Board’s Advisory Fees and Expenses Committee (the Committee) and the Board met on multiple occasions to review and discuss, among themselves, with the management team of the Investment Manager and with an independent fee consultant, materials provided by the Investment Manager, the independent fee consultant and others before determining to approve the continuation of the Management Agreement and the Subadvisory Agreements (collectively, the Agreements).
In connection with their deliberations regarding the continuation of the Management Agreement and the Subadvisory Agreements, the Committee and the Board evaluated materials requested from the Investment Manager regarding the Fund and the Agreements, and discussed these materials with representatives of the Investment Manager at Committee meetings held on March 5, 2019, April 25, 2019 and June 11, 2019 and at Board meetings held on March 6, 2019 and June 12, 2019. In addition, the Board and its various committees consider matters bearing on the Agreements at other meetings throughout the year and in prior years and meet regularly with senior management of the Trust and the Investment Manager. Through the Board’s Investment Oversight Committees, Trustees also meet with selected portfolio managers of the funds the Trustees oversee and with other investment personnel at various times throughout the year. The Committee and the Board also consulted with the independent fee consultant, Fund counsel and the Independent Trustees’ independent legal counsel, who advised on various matters with respect to the Committee’s and the Board’s considerations and otherwise assisted the Committee and the Board in their deliberations. On June 11, 2019, the Committee recommended that the Board approve the continuation of the Management Agreement and the Subadvisory Agreements. On June 12, 2019, the Board, including the Independent Trustees, voting separately, unanimously approved the continuation of the Management Agreement and the Subadvisory Agreements for the Fund.
The Committee and the Board considered all information that they, their legal counsel or the Investment Manager believed reasonably necessary to evaluate and to determine whether to recommend for approval or approve the continuation of the Management Agreement and the Subadvisory Agreements. The information and factors considered by the Committee and the Board in recommending for approval or approving the continuation of the Management Agreement and the Subadvisory Agreements for the Fund included the following:
| • | Information on the investment performance of the Fund relative to the performance of a group of mutual funds determined to be comparable to the Fund by an independent third-party data provider, as well as performance relative to benchmarks; |
| • | Information on the Fund’s management fees and total expenses, including information comparing the Fund’s expenses to those of a group of comparable mutual funds, as determined by the independent third-party data provider; |
| • | The Investment Manager’s agreement to contractually limit or cap total operating expenses for the Fund through December 31, 2020 so that total operating expenses (excluding certain fees and expenses, such as transaction costs and certain other investment related expenses, interest, taxes, acquired fund fees and expenses, and infrequent and/or unusual expenses) would not exceed a specified annual rate, as a percentage of the Fund’s net assets; |
| • | The terms and conditions of the Agreements; |
| • | The subadvisory fees payable by the Investment Manager under the Subadvisory Agreements; |
| • | The current and proposed terms and conditions of other agreements and arrangements with affiliates of the Investment Manager relating to the operations of the Fund, including agreements with respect to the provision of transfer agency and shareholder services to the Fund; |
| • | Descriptions of various functions performed by the Investment Manager and the Subadvisers under the Agreements, including portfolio management and portfolio trading practices; |
Multi-Manager International Equity Strategies Fund | Annual Report 2019
| 41 |
Board Consideration and Approval of Management
and Subadvisory Agreements (continued)
| • | Information regarding the management fees of similarly-managed portfolios of other clients of the Investment Manager, including institutional accounts and collective trusts; |
| • | Information regarding the reputation, regulatory history and resources of the Investment Manager and Subadvisers, including information regarding senior management, portfolio managers and other personnel; |
| • | Information regarding the capabilities of the Investment Manager and the Subadvisers with respect to compliance monitoring services, including an assessment of the Investment Manager’s and the Subadvisers’ compliance systems by the Fund’s Chief Compliance Officer; and |
| • | The profitability to the Investment Manager and its affiliates from their relationships with the Fund. |
Nature, extent and quality of services provided under the agreements
The Committee and the Board considered the nature, extent and quality of services provided to the Fund by the Investment Manager, the Subadvisers and the Investment Manager’s affiliates under the Agreements and under separate agreements for the provision of transfer agency and shareholder services, and the resources dedicated to the Fund and the other Columbia Funds by the Investment Manager, the Subadvisers and the Investment Manager’s affiliates. The Committee and the Board considered, among other things, the Investment Manager’s ability to attract, motivate and retain highly qualified research, advisory and supervisory investment professionals (including compensation programs for personnel involved in fund management, reputation and other attributes), the portfolio management services provided by those investment professionals, and the quality of the Investment Manager’s and the Subadvisers’ investment research capabilities and trade execution services. The Committee and the Board also considered the potential benefits to shareholders of investing in a mutual fund that is part of a fund complex offering exposure to a variety of asset classes and investment disciplines and providing a variety of fund and shareholder services.
The Committee and the Board also considered the professional experience and qualifications of the senior personnel of the Investment Manager and the Subadvisers, which included consideration of the Investment Manager’s and the Subadvisers’ experience with funds using an investment strategy similar to that used by the Investment Manager and the Subadvisers for the Fund. The Committee and the Board noted the compliance programs of and the compliance-related resources provided to the Fund by the Investment Manager and its affiliates and the resources dedicated by the Investment Manager and its affiliates to risk management, and considered the Investment Manager’s ability to provide administrative services to the Fund and coordinate the activities of the Fund’s other service providers. The Board also noted that, based on information provided by the Investment Manager, the Board had approved each Subadviser’s code of ethics and compliance program, and that the Chief Compliance Officer of the Funds reports to the Trustees on each Subadviser’s compliance program.
The Committee and the Board considered the diligence and selection process undertaken by the Investment Manager to select each Subadviser, including the Investment Manager’s rationale for recommending the continuation of the Subadvisory Agreements, and the process for monitoring each Subadviser’s ongoing performance of services for the Fund. As part of these deliberations, the Committee and the Board considered the ability of the Investment Manager, subject to the approval of the Board, to modify or enter into new subadvisory agreements without a shareholder vote pursuant to an exemptive order of the Securities and Exchange Commission. The Committee and the Board also considered the scope of services provided to the Fund by the Investment Manager that are distinct from and in addition to those provided by the Subadvisers, including cash flow management, treasury services, risk oversight, investment oversight and Subadviser selection, oversight and transition management. After reviewing these and related factors, the Committee and the Board concluded, within the context of their overall conclusions, that the nature, extent and quality of the services provided to the Fund under the Agreements supported the continuation of the Management Agreement and the Subadvisory Agreements.
Investment performance
The Committee and the Board reviewed information about the performance of the Fund over various time periods, including performance information relative to benchmarks, information that compared the performance of the Fund to the performance of a group of comparable mutual funds as determined by the independent third-party data provider, and information and analysis provided by the independent fee consultant. The Committee and the Board also reviewed a description of the third party’s methodology for identifying the Fund’s peer groups for purposes of performance and expense comparisons.
| 42 | Multi-Manager International Equity Strategies Fund | Annual Report 2019 |
Board Consideration and Approval of Management
and Subadvisory Agreements (continued)
The Committee and the Board noted that, through December 31, 2018, the Fund’s performance was in the twenty-fifth percentile (where the best performance would be in the first percentile) of its category selected by the independent third-party data provider for the purposes of performance comparisons for the since-inception period.
The Committee and the Board also considered the Investment Manager’s and Subadvisers’ performance and reputation generally, the Investment Manager’s evaluation of each Subadviser’s contribution to the Fund’s broader investment mandate, the Investment Manager’s historical responsiveness to Board concerns about performance, and the Investment Manager’s willingness to take steps intended to improve performance. After reviewing these and related factors, the Committee and the Board concluded, within the context of their overall conclusions, that the performance of the Fund, the Investment Manager and the Subadvisers were sufficient, in light of other considerations, to support the continuation of the Management Agreement and the Subadvisory Agreements.
Investment management fee rates and other expenses
The Committee and the Board considered the management fees charged to the Fund under the Management Agreement and the Subadvisory Agreements, as well as the total expenses incurred by the Fund. In assessing the reasonableness of the fees under the Management Agreement, the Committee and the Board considered, among other information, the Fund’s total expense ratio as a percentage of average daily net assets. The Committee and the Board considered data provided by the independent third-party data provider and the independent fee consultant. The Committee and the Board noted that, as of December 31, 2018, the Fund’s actual management fee and net total expense ratio were ranked in the third and fourth quintiles, respectively, (where the lowest fees and expenses would be in the first quintile) against the Fund’s expense universe as determined by the independent third-party data provider for purposes of expense comparison. The Committee and the Board also considered the fees that the Subadvisers charge to their other clients, to the extent publicly available, and noted that the Investment Manager pays the fees of the Subadvisers. The Committee and the Board noted that Threadneedle International Limited was not currently expected to manage any assets under its respective Subadvisory Agreement, but that the Investment Manager could, in the future, allocate investments to be managed by Threadneedle International Limited. The Committee and the Board also took into account the fee waiver and expense limitation arrangements agreed to by the Investment Manager, as noted above.
The Committee and the Board also received and considered information about the management fees charged by the Investment Manager to institutional accounts. In considering the fees charged to those accounts, the Committee and the Board took into account, among other things, the Investment Manager’s representations about the differences between managing mutual funds as compared to other types of accounts, including differences in the services provided, differences in the risk profile of such business for the Investment Manager and the additional resources required to manage mutual funds effectively. The Committee and the Board also received and considered information about the fees charged by the Investment Manager for sub-advisory services it provides to comparable unaffiliated funds. In evaluating the Fund’s management fees, the Committee and the Board also took into account the demands, complexity and quality of the investment management of the Fund.
After reviewing these and related factors, the Committee and the Board concluded, within the context of their overall conclusions, that the management fee rates and expenses of the Fund, in light of other considerations, supported the continuation of the Management Agreement and the Subadvisory Agreements.
Costs of services provided and profitability
The Committee and the Board also took note of the costs the Investment Manager and its affiliates incur in connection with the services provided and the profitability to the Investment Manager and its affiliates from their relationships with the Fund, and the efforts undertaken by the Investment Manager and its affiliates to manage efficiently their costs to provide such services.
The Committee and the Board also considered the compensation directly or indirectly received by the Investment Manager’s affiliates in connection with their relationships with the Fund. The Committee and the Board reviewed information provided by management as to the profitability to the Investment Manager and its affiliates of their relationships with the Fund, including with respect to funds for which unaffiliated subadvisers provide services, information about the allocation of expenses used to calculate profitability, and comparisons of profitability levels realized in 2018 to profitability levels realized in 2017. When
Multi-Manager International Equity Strategies Fund | Annual Report 2019
| 43 |
Board Consideration and Approval of Management
and Subadvisory Agreements (continued)
reviewing profitability, the Committee and the Board also considered court cases in which adviser profitability was an issue in whole or in part, the performance of similarly managed funds, the performance of the Fund, and the expense ratio of the Fund. In addition, the Committee and the Board considered information provided by the Investment Manager regarding the Investment Manager’s financial condition and comparing its profitability to that of other asset management firms that are, or are subsidiaries of, publicly traded companies. In this regard, the Committee and the Board also considered data provided by the independent fee consultant. Because the Subadvisory Agreements were negotiated at arms-length by the Investment Manager, which is responsible for payments to the Subadvisers thereunder, the Committee and the Board did not consider the profitability to each Subadviser from its relationship with the Fund.
After reviewing these and related factors, the Committee and the Board concluded, within the context of their overall conclusions, that the costs of services provided and the profitability to the Investment Manager and its affiliates from their relationships with the Fund supported the continuation of the Management Agreement and the Subadvisory Agreements.
Economies of scale
The Committee and the Board considered the potential existence of economies of scale in the provision by the Investment Manager of services to the Fund, to groups of related funds, and to the Investment Manager’s investment advisory clients as a whole, and whether those economies of scale were shared with the Fund through breakpoints in investment management fees or other means, such as expense limitation arrangements and additional investments by the Investment Manager in investment, trading, compliance and other resources. The Committee and the Board noted that the management fee schedules for the Fund contained breakpoints that would reduce the fee rate on assets above specified threshold levels.
The Committee and the Board noted that the breakpoints in the Subadvisory Agreements did not occur at the same levels as the breakpoints in the Management Agreement. The Committee and the Board noted that absent a shareholder vote, the Investment Manager would bear any increase in fees payable under the Subadvisory Agreements. The Committee and the Board also noted the potential challenges of seeking to tailor the Management Agreement breakpoints to those of a subadvisory agreement in this context, and the effect that capacity constraints on a subadviser’s ability to manage assets could potentially have on the ability of the Investment Manager to achieve economies of scale, as new subadvisers may need to be added as the Fund grows, increasing the Investment Manager’s cost of compensating and overseeing the Fund’s subadvisers.
In considering these matters, the Committee and the Board also considered the costs of the services provided and the profitability to the Investment Manager and its affiliates from their relationships with the Fund, as noted above. After reviewing these and related factors, the Committee and the Board concluded, within the context of their overall conclusions, that the extent to which any economies of scale were expected to be shared with the Fund supported the continuation of the Management Agreement and the Subadvisory Agreements.
Other benefits to the Investment Manager and Subadvisers
The Committee and the Board received and considered information regarding “fall-out” or ancillary benefits received by the Investment Manager and its affiliates as a result of their relationships with the Fund, such as the engagement of the Investment Manager’s affiliates to provide transfer agency and shareholder services to the Fund. The Committee and the Board also considered the benefits of research made available to the Investment Manager and the Subadvisers by reason of brokerage commissions generated by the Fund’s securities transactions, and reviewed information about the Investment Manager’s practices with respect to considering brokerage and research services when allocating portfolio transactions. In this connection, the Board also noted that the amount of research made available to the Investment Manager by reason of brokerage commissions had been declining over time, and may decline further. The Committee and the Board recognized that the Investment Manager’s profitability would be somewhat lower without these benefits.
Conclusion
The Committee and the Board reviewed all of the above considerations in reaching their decisions to recommend or approve the continuation of the Management Agreement and the Subadvisory Agreements. In their deliberations, the Trustees did not identify any particular information that was all-important or controlling, and individual Trustees may have attributed different weights to the various factors. Based on their evaluation of all factors that they deemed to be material, including those
| 44 | Multi-Manager International Equity Strategies Fund | Annual Report 2019 |
Board Consideration and Approval of Management
and Subadvisory Agreements (continued)
factors described above, and assisted by the advice of independent legal counsel, the Board, including the Independent Trustees, voting separately, unanimously approved the continuation of the Management Agreement and the Subadvisory Agreements.
Multi-Manager International Equity Strategies Fund | Annual Report 2019
| 45 |
[THIS PAGE INTENTIONALLY LEFT BLANK]
[THIS PAGE INTENTIONALLY LEFT BLANK]
Multi-Manager International Equity Strategies Fund
P.O. Box 219104
Kansas City, MO 64121-9104
Please read and consider the investment objectives, risks, charges and expenses for any fund carefully before investing. For a prospectus and summary prospectus, which contains this and other important information about the Fund, go to
columbiathreadneedleus.com/investor/. The Fund is distributed by Columbia Management Investment Distributors, Inc., member FINRA, and managed by Columbia Management Investment Advisers, LLC.
Columbia Threadneedle Investments (Columbia Threadneedle) is the global brand name of the Columbia and Threadneedle group of companies. All rights reserved.
© 2019 Columbia Management Investment Advisers, LLC.
columbiathreadneedleus.com/investor/
Item 2. Code of Ethics.
| | (a) | The registrant has adopted a code of ethics that applies to the registrant’s principal executive officer, principal financial officer, principal accounting officer or controller, or persons performing similar functions, regardless of whether these individuals are employed by the registrant or a third party. |
| | (b) | During the period covered by this report, there were not any amendments to a provision of the code of ethics that applies to the registrant’s principal executive officer, principal financial officer, principal accounting officer or controller, or persons performing similar functions, regardless of whether these individuals are employed by the registrant or a third party, and that relates to any element of the code of ethics definition enumerated in paragraph (b) of this Item. |
| | (c) | During the period covered by this report, there were no waivers, including any implicit waivers, from a provision of the code of ethics to the registrant’s principal executive officer, principal financial officer, principal accounting officer or controller, or persons performing similar functions, regardless of whether these individuals are employed by the registrant or a third party that relates to one or more of the items set forth in paragraph (b) of this Item. |
Item 3. Audit Committee Financial Expert.
The registrant’s Board of Trustees has determined that Douglas A. Hacker, David M. Moffett andAnne-Lee Verville, each of whom are members of the registrant’s Board of Trustees and Audit Committee, each qualify as an audit committee financial expert. Mr. Hacker, Mr. Moffett and Ms. Verville are each independent trustees, as defined in paragraph (a)(2) of this item’s instructions.
Item 4. Principal Accountant Fees and Services.
Fee information below is disclosed for the fifteen series of the registrant whose report to stockholders are included in this annual filing.
(a)Audit Fees. Aggregate Audit Fees billed by the principal accountant for professional services rendered during the fiscal years ended August 31, 2019 and August 31, 2018 are approximately as follows:
| | |
| 2019 | | 2018 |
$501,000 | | $511,800 |
Audit Fees include amounts related to the audit of the registrant’s annual financial statements or services that are normally provided by the accountant in connection with statutory and regulatory filings or engagements for those fiscal years.
(b)Audit-Related Fees.Aggregate Audit-Related Fees billed to the registrant by the principal accountant for professional services rendered during the fiscal years ended August 31, 2019 and August 31, 2018 are approximately as follows:
Audit-Related Fees include amounts for assurance and related services by the principal accountant that are reasonably related to the performance of the audit of the registrant’s financial statements and are not reported in Audit Fees above.
During the fiscal years ended August 31, 2019 and August 31, 2018, there were no Audit-Related Fees billed by the registrant’s principal accountant to the registrant’s investment adviser (not including anysub-adviser whose role is primarily portfolio management and is subcontracted with or overseen by another investment adviser) and any entity controlling, controlled by, or under common control with the adviser that provides ongoing services to the registrant for an engagement that related directly to the operations and financial reporting of the registrant.
(c)Tax Fees. Aggregate Tax Fees billed by the principal accountant to the registrant for professional services rendered during the fiscal years ended August 31, 2019 and August 31, 2018 are approximately as follows:
| | |
| 2019 | | 2018 |
$138,000 | | $121,300 |
Tax Fees include amounts for the review of annual tax returns, the review of required shareholder distribution calculations and typically include amounts for professional services by the principal accountant for tax compliance, tax advice and tax planning. Fiscal years 2019 and 2018 include Tax Fees for foreign tax filings.
During the fiscal years ended August 31, 2019 and August 31, 2018, there were no Tax Fees billed by the registrant’s principal accountant to the registrant’s investment adviser (not including anysub-adviser whose role is primarily portfolio management and is subcontracted with or overseen by another investment adviser) and any entity controlling, controlled by, or under common control with the adviser that provides ongoing services to the registrant for an engagement that related directly to the operations and financial reporting of the registrant.
(d) All Other Fees. Aggregate All Other Fees billed by the principal accountant to the registrant for professional services rendered during the fiscal years ended August 31, 2019 and August 31, 2018 are approximately as follows:
All Other Fees include amounts for products and services provided by the principal accountant, other than the services reported in paragraphs (a) through (c) above.
Aggregate All Other Fees billed by the registrant’s principal accountant to the registrant’s investment adviser (not including anysub-adviser whose role is primarily portfolio management and is subcontracted with or overseen by another investment adviser) and any entity controlling, controlled by, or under common control with the adviser that provides ongoing services to the registrant for an engagement that related directly to the operations and financial reporting of the registrant during the fiscal years ended August 31, 2019 and August 31, 2018 are approximately as follows:
| | |
| 2019 | | 2018 |
$242,500 | | $242,500 |
In fiscal years 2019 and 2018, All Other Fees primarily consists of fees billed for internal control examinations of the registrant’s transfer agent and investment adviser.
(e)(1) Audit CommitteePre-Approval Policies and Procedures
The registrant’s Audit Committee is required topre-approve the engagement of the registrant’s independent auditors to provide audit andnon-audit services to the registrant andnon-audit services to its investment adviser (excluding anysub-adviser whose role is primarily portfolio management and issub-contracted or overseen by another investment adviser (the “Adviser”) or any entity controlling, controlled by or under common control with the Adviser that provides ongoing services to the Fund (a “Control Affiliate”) if the engagement relates directly to the operations and financial reporting of the registrant.
The Audit Committee has adopted a Policy for Engagement of Independent Auditors for Audit andNon-Audit Services (the “Policy”). The Policy sets forth the understanding of the Audit Committee regarding the engagement of the registrant’s independent accountants to provide (i) audit and permissible audit-related, tax and other services to the registrant (“Fund Services”); (ii)non-audit services to the registrant’s Adviser and any Control Affiliates, that relates directly to the operations and financial reporting of a Fund (“Fund-related Adviser Services”); and (iii) certain other audit andnon-audit services to the registrant’s Adviser and its Control Affiliates. A service will require specificpre-approval by the Audit Committee if it is to be provided by the Fund’s independent auditor; provided, however, thatpre-approval ofnon-audit services to the Fund, the Adviser or Control Affiliates August be waived if certain de minimis requirements set forth in the SEC’s rules are met.
Under the Policy, the Audit Committee August delegatepre-approval authority to anypre-designated member or members who are independent board members. The member(s) to whom such authority is delegated must report, for informational purposes only, anypre-approval decisions to the Audit Committee at its next regular meeting. The Audit Committee’s responsibilities with respect to thepre-approval of services performed by the independent auditor August not be delegated to management.
On an annual basis, at a regularly scheduled Audit Committee meeting, the Fund’s Treasurer or other Fund officer shall submit to the Audit Committee a schedule of the types of Fund Services and Fund-related Adviser Services that are subject to specificpre-approval. This schedule will provide a description of each type of service that is subject to specificpre-approval, along with total projected fees for each service. Thepre-approval will generally cover aone-year period. The Audit Committee will review and approve the types of services and the projected fees for the nextone-year period and August add to, or subtract from, the list ofpre-approved services from time to time, based on subsequent determinations. This specific approval acknowledges that the Audit Committee is in agreement with the specific types of services that the independent auditor will be permitted to perform and the projected fees for each service.
The Fund’s Treasurer or other Fund officer shall report to the Audit Committee at each of its regular meetings regarding all Fund Services or Fund-related Adviser Services provided since the last such report was rendered, including a description of the services, by category, with forecasted fees for the annual reporting period, proposed changes requiring specificpre-approval and a description of services provided by the independent auditor, by category, with actual fees during the current reporting period.
*****
(e)(2) 100% of the services performed for items (b) through (d) above during 2019 and 2018 werepre-approved by the registrant’s Audit Committee.
(f) Not applicable.
(g) The aggregatenon-audit fees billed by the registrant’s accountant for services rendered to the registrant, and rendered to the registrant’s investment adviser (not including anysub-adviser whose role is primarily portfolio management and is subcontracted with or overseen by another investment adviser), and any entity controlling, controlled by, or under common control with the adviser that provides ongoing services to the registrant during the fiscal years ended August 31, 2019 and August 31, 2018 are approximately as follows:
| | |
| 2019 | | 2018 |
$380,600 | | $363,800 |
(h) The registrant’s Audit Committee of the Board of Directors has considered whether the provision ofnon-audit services that were rendered to the registrant’s adviser (not including anysub-adviser whose role is primarily portfolio management and is subcontracted with or overseen by another investment adviser), and any entity controlling, controlled by, or under common control with the investment adviser that provides ongoing services to the registrant that were notpre-approved pursuant to paragraph (c)(7)(ii) of Rule2-01 of RegulationS-X, is compatible with maintaining the principal accountant’s independence.
Item 5. Audit Committee of Listed Registrants.
Not applicable.
Item 6. Investments
| | (a) | The registrant’s “Schedule I – Investments in securities of unaffiliated issuers” (as set forth in 17 CFR210.12-12) is included in Item 1 of this FormN-CSR. |
Item 7. Disclosure of Proxy Voting Policies and Procedures forClosed-End Management Investment Companies.
Not applicable.
Item 8. Portfolio Managers ofClosed-End Management Investment Companies.
Not applicable.
Item 9. Purchases of Equity Securities byClosed-End Management Investment Company and Affiliated Purchasers.
Not applicable.
Item 10. Submission of Matters to a Vote of Security Holders.
There were no material changes to the procedures by which shareholders August recommend nominees to the registrant’s board of directors.
Item 11. Controls and Procedures.
| | (a) | The registrant’s principal executive officer and principal financial officer, based on their evaluation of the registrant’s disclosure controls and procedures as of a date within 90 days of the filing of this report, have concluded that such controls and procedures are adequately designed to ensure that information required to be disclosed by the registrant in FormN-CSR is accumulated and communicated to the registrant’s management, including the principal executive officer and principal financial officer, or persons performing similar functions, as appropriate to allow timely decisions regarding required disclosure. |
| | (b) | There was no change in the registrant’s internal control over financial reporting that occurred during the period covered by this report that has materially affected, or is reasonably likely to materially affect, the registrant’s internal control over financial reporting. |
Item 12. Disclosure of Securities Lending Activities forClosed-End Management Investment Companies
Not applicable.
Item 13. Exhibits.
(a)(1) Code of ethics required to be disclosed under Item 2 of FormN-CSR attached hereto as Exhibit 99.CODE ETH.
(a)(2) Certifications pursuant to Rule30a-2(a) under the Investment Company Act of 1940 (17 CFR270.30a-2(a)) attached hereto as Exhibit 99.CERT.
(a)(3) Not applicable.
(b) Certification pursuant to Rule30a-2(b) under the Investment Company Act of 1940 (17 CFR270.30a-2(b)) attached hereto as Exhibit 99.906CERT.
SIGNATURES
Pursuant to the requirements of the Securities Exchange Act of 1934 and the Investment Company Act of 1940, the registrant has duly caused this report to be signed on its behalf by the undersigned, thereunto duly authorized.
| | |
| (registrant) | | Columbia Funds Series Trust I |
| | |
| By (Signature and Title) | | /s/ Christopher O. Petersen |
| | Christopher O. Petersen, President and Principal Executive Officer |
Pursuant to the requirements of the Securities Exchange Act of 1934 and the Investment Company Act of 1940, this report has been signed below by the following persons on behalf of the registrant and in the capacities and on the dates indicated.
| | |
| By (Signature and Title) | | /s/ Christopher O. Petersen |
| | Christopher O. Petersen, President and Principal Executive Officer |
| | |
| |
By (Signature and Title) | | /s/ Michael G. Clarke |
| | Michael G. Clarke, Chief Financial Officer |