UNITED STATES
SECURITIES AND EXCHANGE COMMISSION
FORM N-CSR
CERTIFIED SHAREHOLDER REPORT OF REGISTERED MANAGEMENT INVESTMENT COMPANIES
Investment Company Act file number811-04367
Columbia Funds Series Trust I
(Exact name of registrant as specified in charter)
290 Congress Street
Boston, MA 02210
(Address of principal executive offices) (Zip code)
Daniel J. Beckman
c/o Columbia Management Investment Advisers, LLC
290 Congress Street
Boston, MA 02210
Ryan C. Larrenaga, Esq.
c/o Columbia Management Investment Advisers, LLC
290 Congress Street
Boston, MA 02210
(Name and address of agent for service)
Registrant's telephone number, including area code: (800) 345-6611
Date of fiscal year end: May 31
Date of reporting period: May 31, 2022
Form N-CSR is to be used by management investment companies to file reports with the Commission not later than 10 days after the transmission to stockholders of any report that is required to be transmitted to stockholders under Rule 30e-1 under the Investment Company Act of 1940 (17 CFR 270.30e-1). The Commission may use the information provided on Form N-CSR in its regulatory, disclosure review, inspection, and policymaking roles.
A registrant is required to disclose the information specified by Form N-CSR, and the Commission will make this information public. A registrant is not required to respond to the collection of information contained in Form N-CSR unless the Form displays a currently valid Office of Management and Budget ("OMB") control number. Please direct comments concerning the accuracy of the information collection burden estimate and any suggestions for reducing the burden to Secretary, Securities and Exchange Commission, 100 F Street, NE, Washington, DC 20549. The OMB has reviewed this collection of information under the clearance requirements of 44 U.S.C. § 3507.
Item 1. Reports to Stockholders.

Annual Report
May 31, 2022
Columbia Adaptive Risk Allocation Fund
Not FDIC or NCUA Insured • No Financial Institution Guarantee • May Lose Value
If you elect to receive the shareholder report for Columbia Adaptive Risk Allocation Fund (the Fund) in paper, mailed to you, the Fund mails one shareholder report to each shareholder address, unless such shareholder elects to receive shareholder reports from the Fund electronically via e-mail or by having a paper notice mailed to you (Postcard Notice) that your Fund’s shareholder report is available at the Columbia funds’ website (columbiathreadneedleus.com/investor/). If you would like more than one report in paper to be mailed to you, or would like to elect to receive reports via e-mail or access them through Postcard Notice, please call shareholder services at 800.345.6611 and additional reports will be sent to you.
Proxy voting policies and procedures
The policy of the Board of Trustees is to vote the proxies of the companies in which the Fund holds investments consistent with the procedures as stated in the Statement of Additional Information (SAI). You may obtain a copy of the SAI without charge by calling 800.345.6611; contacting your financial intermediary; visiting columbiathreadneedleus.com/investor/; or searching the website of the Securities and Exchange Commission (SEC) at sec.gov. Information regarding how the Fund voted proxies relating to portfolio securities is filed with the SEC by August 31st for the most recent 12-month period ending June 30th of that year, and is available without charge by visiting columbiathreadneedleus.com/investor/, or searching the website of the SEC at sec.gov.
Quarterly schedule of investments
The Fund files a complete schedule of portfolio holdings with the SEC for the first and third quarters of each fiscal year on Form N-PORT. The Fund’s Form N-PORT is available on the SEC’s website at sec.gov. The Fund’s complete schedule of portfolio holdings, as filed on Form N-PORT, can also be obtained without charge, upon request, by calling 800.345.6611.
Additional Fund information
For more information about the Fund, please visit columbiathreadneedleus.com/investor/ or call 800.345.6611. Customer Service Representatives are available to answer your questions Monday through Friday from 8 a.m. to 7 p.m. Eastern time.
You may obtain the current net asset value (NAV) of Fund shares at no cost by calling 800.345.6611 or by sending an e-mail to serviceinquiries@columbiathreadneedle.com.
Fund investment manager
Columbia Management Investment Advisers, LLC (the Investment Manager)
290 Congress Street
Boston, MA 02210
Fund distributor
Columbia Management Investment Distributors, Inc.
290 Congress Street
Boston, MA 02210
Fund transfer agent
Columbia Management Investment Services Corp.
P.O. Box 219104
Kansas City, MO 64121-9104
Columbia Adaptive Risk Allocation Fund | Annual Report 2022
Fund at a Glance
(Unaudited)
Investment objective
The Fund pursues consistent total returns by seeking to allocate risks across multiple asset classes.
Portfolio management
Joshua Kutin, CFA
Lead Portfolio Manager
Managed Fund since 2015
Alexander Wilkinson, CFA, CAIA
Portfolio Manager
Managed Fund since 2018
| Average annual total returns (%) (for the period ended May 31, 2022) |
| | | Inception | 1 Year | 5 Years | Life |
| Class A | Excluding sales charges | 06/19/12 | -3.62 | 5.81 | 5.11 |
| | Including sales charges | | -9.17 | 4.57 | 4.49 |
| Advisor Class* | 10/01/14 | -3.36 | 6.06 | 5.31 |
| Class C | Excluding sales charges | 06/19/12 | -4.39 | 4.99 | 4.31 |
| | Including sales charges | | -5.19 | 4.99 | 4.31 |
| Institutional Class | 06/19/12 | -3.37 | 6.06 | 5.37 |
| Institutional 2 Class | 06/19/12 | -3.36 | 6.06 | 5.41 |
| Institutional 3 Class* | 10/01/14 | -3.40 | 6.10 | 5.37 |
| Class R | 06/19/12 | -3.91 | 5.53 | 4.85 |
| Modified Blended Benchmark | | -9.29 | 5.61 | 6.17 |
| New Blended Benchmark | | -4.83 | 6.69 | 7.75 |
| FTSE Three-Month U.S. Treasury Bill Index | | 0.13 | 1.09 | 0.61 |
Returns for Class A shares are shown with and without the maximum initial sales charge of 5.75%. Returns for Class C shares are shown with and without the 1.00% contingent deferred sales charge for the first year only. The Fund’s other share classes are not subject to sales charges and have limited eligibility. Please see the Fund’s prospectus for details. Performance for different share classes will vary based on differences in sales charges and fees associated with each share class. All results shown assume reinvestment of distributions during the period. Returns do not reflect the deduction of taxes that a shareholder may pay on Fund distributions or on the redemption of Fund shares. Performance results reflect the effect of any fee waivers or reimbursements of Fund expenses by Columbia Management Investment Advisers, LLC and/or any of its affiliates. Absent these fee waivers or expense reimbursement arrangements, performance results would have been lower.
The performance information shown represents past performance and is not a guarantee of future results. The investment return and principal value of your investment will fluctuate so that your shares, when redeemed, may be worth more or less than their original cost. Current performance may be lower or higher than the performance information shown. You may obtain performance information current to the most recent month-end by contacting your financial intermediary, visiting columbiathreadneedleus.com/investor/ or calling 800.345.6611.
| * | The returns shown for periods prior to the share class inception date (including returns for the Life of the Fund, if shown, which are since Fund inception) include the returns of the Fund’s oldest share class. Since the Fund launched more than one share class at its inception, Class A shares were used. These returns are adjusted to reflect any higher class-related operating expenses of the newer share classes, as applicable. Please visit columbiathreadneedleus.com/investor/investment-products/mutual-funds/appended-performance for more information. |
The Modified Blended Benchmark consists of 60% MSCI ACWI (Net) and 40% Bloomberg Global Aggregate Bond Index.
The New Blended Benchmark consists of 60% MSCI ACWI (Net) Hedged to DM Currencies and 40% Bloomberg Global Aggregate Bond Hedged Index.
The Bloomberg Global Aggregate Bond Index is a broad-based benchmark that measures the global investment-grade fixed-rate debt markets.
The Bloomberg Global Aggregate Bond Hedged Index is an unmanaged index that is comprised of several other Bloomberg indexes that measure fixed income performance of regions around the world while hedging the currency back to the US dollar.
The MSCI ACWI (Net) is a free float-adjusted market capitalization index that is designed to measure equity market performance in the global developed and emerging markets. The MSCI ACWI (Net) captures large, mid, small and micro cap representation across 23 developed markets countries and large, mid and small cap representation across 23 emerging markets countries.
The MSCI ACWI (Net) Hedged to DM Currencies Index represents a close estimation of the performance that can be achieved by hedging the currency exposures of all developed market exposures of its parent index, the MSCI ACWI, to the USD, the “home” currency for the hedged index. The index is 100% hedged to the USD of developed market currencies by selling each foreign currency forward at the one-month Forward weight. The parent index is composed of large and mid cap stocks across 23 Developed Markets (DM) countries and 24 Emerging Markets (EM) countries.
The FTSE Three-Month U.S. Treasury Bill Index is an unmanaged index that represents the performance of three-month Treasury bills and reflects reinvestment of all distributions and changes in market prices.
Effective August 24, 2021, the Bloomberg Barclays indices were re-branded as the Bloomberg indices.
Columbia Adaptive Risk Allocation Fund | Annual Report 2022
| 3 |
Fund at a Glance (continued)
(Unaudited)
Indices are not available for investment, are not professionally managed and do not reflect sales charges, fees, brokerage commissions, taxes (except the MSCI ACWI Index (Net) and MSCI ACWI Index (Net) Hedged to DM Currencies, which reflect reinvested dividends net of withholding taxes) or other expenses of investing. Securities in the Fund may not match those in an index.
| 4 | Columbia Adaptive Risk Allocation Fund | Annual Report 2022 |
Fund at a Glance (continued)
(Unaudited)
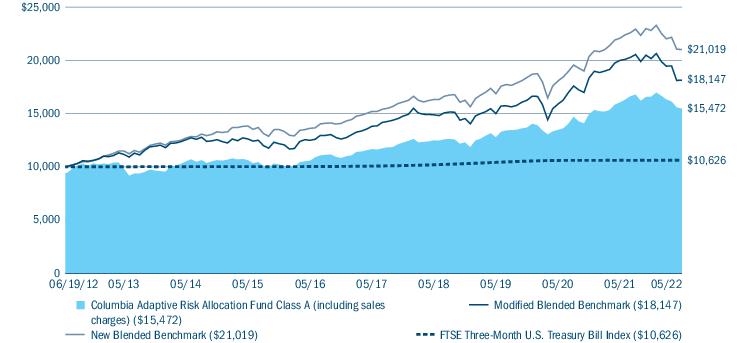
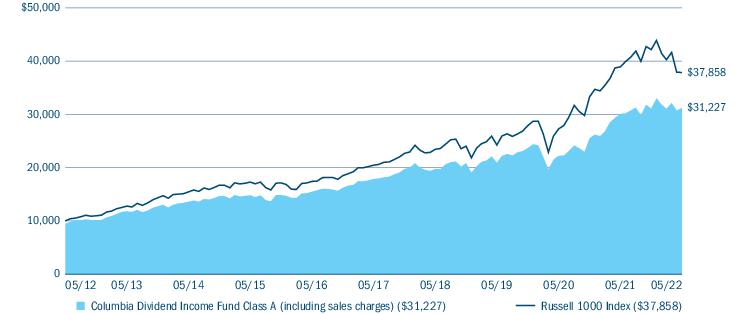
Performance of a hypothetical $10,000 investment (June 19, 2012 — May 31, 2022)
The chart above shows the change in value of a hypothetical $10,000 investment in Class A shares of Columbia Adaptive Risk Allocation Fund during the stated time period, and does not reflect the deduction of taxes that a shareholder may pay on Fund distributions or on the redemption of Fund shares.
| Portfolio breakdown (%) (at May 31, 2022) |
| Alternative Strategies Funds | 3.8 |
| Common Stocks | 1.8 |
| Foreign Government Obligations | 17.8 |
| Inflation-Indexed Bonds | 13.1 |
| Money Market Funds(a) | 34.1 |
| Multi-Asset/Tactical Strategies Funds | 0.2 |
| Residential Mortgage-Backed Securities - Agency | 5.9 |
| U.S. Treasury Obligations | 23.3 |
| Total | 100.0 |
| (a) | Includes investments in Money Market Funds which have been segregated to cover obligations relating to the Fund’s investment in derivatives as part of its tactical allocation strategy. For a description of the Fund’s investments in derivatives, see Investments in derivatives following the Portfolio of Investments and Note 2 to the Notes to Financial Statements. |
Percentages indicated are based upon total investments excluding investments in derivatives, if any. The Fund’s portfolio composition is subject to change.
| Market exposure by asset class categories (%)(a) (at May 31, 2022) |
| Equity Assets | 14.1 |
| Inflation-Hedging Assets | 17.5 |
| Spread Assets | 14.4 |
| Interest Rate Assets | 67.0 |
(a) Percentages are based upon net assets. The percentages do not equal 100% due to the effects of leverage within the Fund’s portfolio. Leverage exists when the Fund purchases or sells an instrument or enters into a transaction without investing cash in an amount equal to the full economic exposure of the instrument or transaction. The Fund’s portfolio composition and its market exposure are subject to change. Inflation-Hedging Assets may include, but are not limited to, direct or indirect investments in commodity-related investments, including certain types of commodities-linked derivatives and notes, and U.S. and non-U.S. inflation-linked bonds. Interest Rate Assets generally include fixed-income securities issued by U.S. and non-U.S. governments. Spread Assets generally include any other fixed-income securities.
Columbia Adaptive Risk Allocation Fund | Annual Report 2022
| 5 |
Manager Discussion of Fund Performance
(Unaudited)
For the 12-month period that ended May 31, 2022, Class A shares of Columbia Adaptive Risk Allocation Fund returned -3.62% excluding sales charges. The Fund outperformed its Modified Blended Benchmark (consisting of 60% MSCI ACWI Index (Net) and 40% Bloomberg Global Aggregate Bond Index), which returned -9.29% for the same time period. The Fund also outperformed its New Blended Benchmark (consisting of 60% MSCI ACWI Index (Net) Hedged to DM Currencies and 40% Bloomberg Global Aggregate Bond Hedged Index), which returned -4.83% for the same time period. To compare, the FTSE Three-Month U.S. Treasury Bill Index returned 0.13% during the annual period. The Fund takes a risk-based approach to allocating assets across four primary segments of global capital markets – global equities, interest rate related fixed income, spread related fixed income, and inflation-hedged assets.
Market overview
U.S. equities reversed course during the last half of the 12-month period ending May 31, 2022, falling from record highs and ending three consecutive years of robust gains. Commodity-related markets were the exception, significantly outperforming the overall equity market as measured by the S&P 500 Index. During the first quarter of 2022, for example, the broad-based commodity benchmark, the Bloomberg Commodity Index, outperformed the broad equity market by more than 30%.
Lingering Omicron-related worries were a headwind during the last half of the period, as were fears around inflation, durability of growth and the end of more than a decade of easy monetary policy coming from the U.S. Federal Reserve (Fed) and other global central banks. Volatility and risk-off sentiment spiked as investor concerns expanded to include ramifications of the Russia-Ukraine conflict. Commodity prices surged, particularly for oil and wheat, as the conflict in eastern Europe escalated into war and further complicated global supply chains. Oil prices, which already were elevated on supply-demand imbalances, shot through a decade-high of more than $120 per barrel before retreating somewhat.
Despite occasional hints of peaceful resolution to the Russia-Ukraine conflict, as well as mostly resilient corporate earnings reports, equities continued a choppy decline until the Fed raised interest rates by 25 basis points in a widely anticipated move at its March meeting. (A basis point is 1/100 of a percent.) Although the announcement and accompanying projections of six additional hikes were hawkish, Fed Chairman Jerome Powell seemingly calmed investors with a more neutral tone and his assessment that the U.S. economy is generally strong and well-positioned to handle tighter monetary policy.
Any positive sentiment faded at the end of the period, however, as investors increasingly focused on persistent inflation and slowing economic growth, which were exacerbated by yet more supply-chain snarls.
The Fund’s notable contributors during the period
| • | The largest contributor to relative performance over the past year came from the adaptive market state classification design feature associated with the investment strategy. |
| ○ | The adaptive feature – where a market state is determined between either capital preservation, neutral, bullish, or highly bullish states – is estimated to have delivered over 1.5% of excess return for the strategy, versus a static neutral policy risk allocation. |
| ○ | The market state classification centered in the capital preservation market state for four out of the first five months of calendar year 2022, and the more conservative asset allocation positioning associated with this market state helped deliver a sizable portion of the excess relative returns witnessed over the period. |
| • | Other notable contributors to relative performance during the period came from exposure to inflation-hedged assets. |
| ○ | In particular, exposure to both commodities and real estate related securities proved beneficial for investors during the period. |
| ○ | Furthermore, the Fund maintained a tactical overweight to commodities throughout a significant majority of the period. Over the past year, the Bloomberg Commodity Index (a broad-based proxy for commodity market performance) generated an eye-popping total return of 41.85%. |
The Fund’s notable detractors during the period
| • | Detractors from relative returns came from overweight allocation to global treasury inflation-protected securities (TIPS) and corporate credit. |
| 6 | Columbia Adaptive Risk Allocation Fund | Annual Report 2022 |
Manager Discussion of Fund Performance (continued)
(Unaudited)
| • | An underweight allocation to interest rate related fixed income served as a tactical contributor to relative returns but the overall exposure to interest rates (e.g. global government bonds) detracted noticeably from absolute returns. In fact, given the rising interest rate environment, especially over the course of the past several months, interest rate related fixed income allocations served as the single largest detractor from absolute performance over the period. Over the period, 10-year US Treasury Bond yields moved from a level near 1.62% (June ’21) to around 2.85% (May 31, 2022). This type of rise in yields puts downside pressure on bond prices with heavy interest rate sensitivity, thus the Bloomberg U.S. Treasury 7-10 Year Bond Index suffered a total return loss of -8.83% over the trailing 1-year period. |
Derivative usage
During the annual period, the Fund used futures (including bond, currency, equity, index and interest rate futures), currency forwards and swaps (including credit default, credit default swap index, interest rate and total return swaps). The Fund used derivatives for both hedging and non-hedging purposes, including, for example, seeking to enhance returns or as a substitute for a position in an underlying asset. The Fund also used derivatives to manage its overall risk exposure and to obtain leverage (market exposure in excess of the Fund’s assets) within certain asset classes and during certain market environments in seeking to maintain attractive expected risk-adjusted returns while adhering to the Fund’s risk allocation framework. The use of derivatives allows the Fund to pursue its risk allocation objectives. On a stand-alone basis, the net usage of derivatives during the period had a positive impact on Fund performance.
Market risk may affect a single issuer, sector of the economy, industry or the market as a whole. The Fund’s investment in other funds subjects it to the investment performance (positive or negative), risks and expenses of these underlying funds. Asset allocation does not assure a profit or protect against loss. Investing in derivatives is a specialized activity that involves special risks that subject the Fund to significant loss potential, including when used as leverage, and may result in greater fluctuation in Fund value. Commodity investments may be affected by the overall market and industry- and commodity-specific factors, and may be more volatile and less liquid than other investments. Short positions (where the underlying asset is not owned) can create unlimited risk. International investing involves certain risks and volatility due to potential political, economic or currency instabilities and different financial and accounting standards. Risks are enhanced for emerging market issuers. Investment in or exposure to foreign currencies subjects the Fund to currency fluctuation and risk of loss. Investments in small- and mid-cap companies involve risks and volatility greater than investments in larger, more established companies. Fixed-income securities present issuer default risk. A rise in interest rates may result in a price decline of fixed-income instruments held by the Fund, negatively impacting its performance and NAV. Falling rates may result in the Fund investing in lower yielding debt instruments, lowering the Fund’s income and yield. These risks may be heightened for longer maturity and duration securities. Interest payments on inflation-protected securities may be more volatile than interest paid on ordinary bonds. In periods of deflation, these securities provide no income. As a non-diversified fund, fewer investments could have a greater effect on performance. Investments selected using quantitative methods may perform differently from the market as a whole and may not enable the Fund to achieve its objective. Market or other (e.g., interest rate) environments may adversely affect the liquidity of fund investments, negatively impacting their price. Generally, the less liquid the market at the time the Fund sells a holding, the greater the risk of loss or decline of value to the Fund. See the Fund’s prospectus for more information on these and other risks.
The views expressed in this report reflect the current views of the respective parties who have contributed to this report. These views are not guarantees of future performance and involve certain risks, uncertainties and assumptions that are difficult to predict, so actual outcomes and results may differ significantly from the views expressed. These views are subject to change at any time based upon economic, market or other conditions and the respective parties disclaim any responsibility to update such views. These views may not be relied on as investment advice and, because investment decisions for a Columbia fund are based on numerous factors, may not be relied on as an indication of trading intent on behalf of any particular Columbia fund. References to specific securities should not be construed as a recommendation or investment advice.
Columbia Adaptive Risk Allocation Fund | Annual Report 2022
| 7 |
Understanding Your Fund’s Expenses
(Unaudited)
As an investor, you incur two types of costs. There are shareholder transaction costs, which generally include sales charges on purchases and may include redemption fees. There are also ongoing fund costs, which generally include management fees, distribution and/or service fees, and other fund expenses. The following information is intended to help you understand your ongoing costs (in dollars) of investing in the Fund and to help you compare these costs with the ongoing costs of investing in other mutual funds.
Analyzing your Fund’s expenses
To illustrate these ongoing costs, we have provided examples and calculated the expenses paid by investors in each share class of the Fund during the period. The actual and hypothetical information in the table is based on an initial investment of $1,000 at the beginning of the period indicated and held for the entire period. Expense information is calculated two ways and each method provides you with different information. The amount listed in the “Actual” column is calculated using the Fund’s actual operating expenses and total return for the period. You may use the Actual information, together with the amount invested, to estimate the expenses that you paid over the period. Simply divide your account value by $1,000 (for example, an $8,600 account value divided by $1,000 = 8.6), then multiply the results by the expenses paid during the period under the “Actual” column. The amount listed in the “Hypothetical” column assumes a 5% annual rate of return before expenses (which is not the Fund’s actual return) and then applies the Fund’s actual expense ratio for the period to the hypothetical return. You should not use the hypothetical account values and expenses to estimate either your actual account balance at the end of the period or the expenses you paid during the period. See “Compare with other funds” below for details on how to use the hypothetical data.
Compare with other funds
Since all mutual funds are required to include the same hypothetical calculations about expenses in shareholder reports, you can use this information to compare the ongoing cost of investing in the Fund with other funds. To do so, compare the hypothetical example with the 5% hypothetical examples that appear in the shareholder reports of other funds. As you compare hypothetical examples of other funds, it is important to note that hypothetical examples are meant to highlight the ongoing costs of investing in a fund only and do not reflect any transaction costs, such as sales charges, or redemption or exchange fees. Therefore, the hypothetical calculations are useful in comparing ongoing costs only, and will not help you determine the relative total costs of owning different funds. If transaction costs were included in these calculations, your costs would be higher.
| December 1, 2021 — May 31, 2022 |
| | Account value at the
beginning of the
period ($) | Account value at the
end of the
period ($) | Expenses paid during
the period ($) | Fund’s annualized
expense ratio (%) |
| | Actual | Hypothetical | Actual | Hypothetical | Actual | Hypothetical | Actual |
| Class A | 1,000.00 | 1,000.00 | 933.00 | 1,019.90 | 4.87 | 5.09 | 1.01 |
| Advisor Class | 1,000.00 | 1,000.00 | 934.00 | 1,021.14 | 3.66 | 3.83 | 0.76 |
| Class C | 1,000.00 | 1,000.00 | 928.80 | 1,016.16 | 8.46 | 8.85 | 1.76 |
| Institutional Class | 1,000.00 | 1,000.00 | 933.90 | 1,021.14 | 3.66 | 3.83 | 0.76 |
| Institutional 2 Class | 1,000.00 | 1,000.00 | 934.10 | 1,021.09 | 3.71 | 3.88 | 0.77 |
| Institutional 3 Class | 1,000.00 | 1,000.00 | 933.80 | 1,021.29 | 3.52 | 3.68 | 0.73 |
| Class R | 1,000.00 | 1,000.00 | 931.30 | 1,018.65 | 6.07 | 6.34 | 1.26 |
Expenses paid during the period are equal to the annualized expense ratio for each class as indicated above, multiplied by the average account value over the period and then multiplied by the number of days in the Fund’s most recent fiscal half year and divided by 365.
Expenses do not include fees and expenses incurred indirectly by the Fund from its investment in underlying funds, including affiliated and non-affiliated pooled investment vehicles, such as mutual funds and exchange-traded funds.
| 8 | Columbia Adaptive Risk Allocation Fund | Annual Report 2022 |
Portfolio of Investments
May 31, 2022
(Percentages represent value of investments compared to net assets)
Investments in securities
| Alternative Strategies Funds 4.0% |
| | Shares | Value ($) |
| Columbia Commodity Strategy Fund, Institutional 3 Class(a) | 7,126,467 | 164,977,710 |
Total Alternative Strategies Funds
(Cost $131,697,109) | 164,977,710 |
|
| Common Stocks 1.8% |
| Issuer | Shares | Value ($) |
| Consumer Discretionary 0.0% |
| Hotels, Restaurants & Leisure 0.0% |
| Marriott International, Inc., Class A | 6,692 | 1,148,213 |
| Total Consumer Discretionary | 1,148,213 |
| Real Estate 1.8% |
| Equity Real Estate Investment Trusts (REITS) 1.8% |
| Alexandria Real Estate Equities, Inc. | 20,930 | 3,473,333 |
| American Homes 4 Rent, Class A | 26,862 | 992,820 |
| American Tower Corp. | 13,191 | 3,378,611 |
| Americold Realty Trust, Inc. | 56,197 | 1,556,095 |
| AvalonBay Communities, Inc. | 15,855 | 3,297,206 |
| Brixmor Property Group, Inc. | 104,915 | 2,557,828 |
| Camden Property Trust | 12,458 | 1,787,598 |
| Centerspace | 19,088 | 1,583,922 |
| Duke Realty Corp. | 72,444 | 3,827,217 |
| Equinix, Inc. | 6,814 | 4,681,831 |
| Equity LifeStyle Properties, Inc. | 50,353 | 3,811,722 |
| Extra Space Storage, Inc. | 14,852 | 2,646,626 |
| Federal Realty Investment Trust | 27,805 | 3,196,741 |
| First Industrial Realty Trust, Inc. | 44,259 | 2,352,366 |
| Gaming and Leisure Properties, Inc. | 48,332 | 2,262,904 |
| Healthpeak Properties, Inc. | 57,322 | 1,701,890 |
| Highwoods Properties, Inc. | 16,887 | 663,490 |
| Host Hotels & Resorts, Inc. | 129,470 | 2,588,105 |
| Invitation Homes, Inc. | 93,029 | 3,509,054 |
| Kilroy Realty Corp. | 29,826 | 1,810,438 |
| Life Storage, Inc. | 28,931 | 3,377,984 |
| Medical Properties Trust, Inc. | 109,196 | 2,028,862 |
| National Storage Affiliates Trust | 25,358 | 1,330,027 |
| Outfront Media, Inc. | 29,878 | 616,383 |
| Prologis, Inc. | 32,393 | 4,129,460 |
| Common Stocks (continued) |
| Issuer | Shares | Value ($) |
| SITE Centers Corp. | 58,018 | 912,043 |
| STORE Capital Corp. | 76,034 | 2,097,778 |
| Sun Communities, Inc. | 12,413 | 2,037,346 |
| Tanger Factory Outlet Centers, Inc. | 76,241 | 1,334,980 |
| Welltower, Inc. | 54,137 | 4,823,065 |
| Total | | 74,367,725 |
| Total Real Estate | 74,367,725 |
Total Common Stocks
(Cost $82,204,714) | 75,515,938 |
| Foreign Government Obligations(b),(c) 18.5% |
| Issuer | Coupon
Rate | | Principal
Amount ($) | Value ($) |
| Austria 2.7% |
| Republic of Austria Government Bond(d) |
| 10/20/2026 | 0.750% | EUR | 65,214,000 | 69,332,309 |
| 05/23/2034 | 2.400% | EUR | 13,773,000 | 15,853,836 |
| Republic of Austria Government Bond(d),(e) |
| 02/20/2030 | 0.000% | EUR | 26,752,000 | 25,658,989 |
| Total | 110,845,134 |
| Belgium 1.9% |
| Kingdom of Belgium Government Bond(d) |
| 06/22/2031 | 1.000% | EUR | 27,296,000 | 27,976,097 |
| 04/22/2033 | 1.250% | EUR | 16,075,000 | 16,612,834 |
| 03/28/2035 | 5.000% | EUR | 24,349,000 | 35,483,265 |
| Total | 80,072,196 |
| China 0.3% |
| China Government Bond |
| 11/21/2029 | 3.130% | CNY | 38,350,000 | 5,890,352 |
| 05/21/2030 | 2.680% | CNY | 52,200,000 | 7,755,820 |
| Total | 13,646,172 |
| France 2.1% |
| French Republic Government Bond OAT(d),(e) |
| 11/25/2030 | 0.000% | EUR | 41,936,000 | 39,806,608 |
| 11/25/2031 | 0.000% | EUR | 9,799,000 | 9,077,798 |
| French Republic Government Bond OAT(d) |
| 05/25/2036 | 1.250% | EUR | 25,317,000 | 25,056,996 |
| 05/25/2045 | 3.250% | EUR | 9,583,464 | 12,478,664 |
| Total | 86,420,066 |
The accompanying Notes to Financial Statements are an integral part of this statement.
Columbia Adaptive Risk Allocation Fund | Annual Report 2022
| 9 |
Portfolio of Investments (continued)
May 31, 2022
| Foreign Government Obligations(b),(c) (continued) |
| Issuer | Coupon
Rate | | Principal
Amount ($) | Value ($) |
| Italy 2.0% |
| Italy Buoni Poliennali Del Tesoro(d) |
| 05/01/2031 | 6.000% | EUR | 39,808,000 | 53,142,670 |
| 02/01/2037 | 4.000% | EUR | 24,378,000 | 28,494,950 |
| Total | 81,637,620 |
| Japan 4.3% |
| Japan Government 10-Year Bond |
| 06/20/2031 | 0.100% | JPY | 4,438,000,000 | 34,123,530 |
| Japan Government 20-Year Bond |
| 06/20/2041 | 0.400% | JPY | 3,894,000,000 | 28,463,951 |
| 09/20/2041 | 0.500% | JPY | 2,072,200,000 | 15,389,222 |
| Japan Government 30-Year Bond |
| 06/20/2050 | 0.600% | JPY | 2,118,000,000 | 14,868,872 |
| 06/20/2051 | 0.700% | JPY | 2,267,000,000 | 16,271,208 |
| 09/20/2051 | 0.700% | JPY | 1,454,400,000 | 10,418,482 |
| 12/20/2051 | 0.700% | JPY | 1,796,000,000 | 12,864,304 |
| Japan Government Thirty-Year Bond |
| 03/20/2052 | 1.000% | JPY | 2,450,650,000 | 18,942,821 |
| Japan Government Twenty-Year Bond |
| 03/20/2042 | 0.800% | JPY | 3,417,450,000 | 26,752,049 |
| Total | 178,094,439 |
| Netherlands 1.8% |
| Netherlands Government Bond(d) |
| 07/15/2026 | 0.500% | EUR | 46,228,000 | 48,893,546 |
| Netherlands Government Bond(d),(e) |
| 07/15/2031 | 0.000% | EUR | 27,200,000 | 25,970,806 |
| Total | 74,864,352 |
| Spain 3.0% |
| Spain Government Bond(e) |
| 01/31/2028 | 0.000% | EUR | 27,072,000 | 26,548,848 |
| Spain Government Bond(d) |
| 04/30/2030 | 0.500% | EUR | 35,595,000 | 34,406,856 |
| 10/31/2030 | 1.250% | EUR | 9,979,000 | 10,126,328 |
| 07/30/2035 | 1.850% | EUR | 18,340,000 | 18,385,831 |
| 07/30/2041 | 4.700% | EUR | 7,234,000 | 10,246,586 |
| Spain Government Bond |
| 07/30/2032 | 5.750% | EUR | 16,377,000 | 23,376,377 |
| Total | 123,090,826 |
| Foreign Government Obligations(b),(c) (continued) |
| Issuer | Coupon
Rate | | Principal
Amount ($) | Value ($) |
| United Kingdom 0.4% |
| United Kingdom Gilt(d) |
| 10/22/2028 | 1.625% | GBP | 10,885,000 | 13,609,227 |
| 01/22/2045 | 3.500% | GBP | 3,257,133 | 4,852,812 |
| Total | 18,462,039 |
Total Foreign Government Obligations
(Cost $905,511,001) | 767,132,844 |
|
| Inflation-Indexed Bonds(b) 13.5% |
| | | | |
| Australia 0.4% |
| Australia Government Bond(d) |
| 11/21/2027 | 0.750% | AUD | 4,377,922 | 3,210,383 |
| 08/21/2035 | 2.000% | AUD | 3,525,713 | 2,793,657 |
| 08/21/2040 | 1.250% | AUD | 2,162,065 | 1,526,156 |
| Australia Government Index-Linked Bond(d) |
| 09/20/2025 | 3.000% | AUD | 10,400,337 | 8,302,728 |
| Total | 15,832,924 |
| Canada 0.3% |
| Canadian Government Real Return Bond |
| 12/01/2031 | 4.000% | CAD | 5,354,242 | 5,515,930 |
| 12/01/2036 | 3.000% | CAD | 3,711,240 | 3,725,773 |
| 12/01/2041 | 2.000% | CAD | 3,044,431 | 2,774,810 |
| Total | 12,016,513 |
| France 1.6% |
| France Government Bond OAT(d) |
| 07/25/2030 | 0.700% | EUR | 19,679,589 | 24,483,696 |
| 07/25/2032 | 3.150% | EUR | 13,671,000 | 20,988,062 |
| French Republic Government Bond OAT(d) |
| 07/25/2024 | 0.250% | EUR | 8,348,044 | 9,676,125 |
| 07/25/2040 | 1.800% | EUR | 6,960,598 | 10,409,761 |
| Total | 65,557,644 |
| Germany 0.5% |
| Bundesrepublik Deutschland Bundesobligation Inflation-Linked Bond(d) |
| 04/15/2030 | 0.500% | EUR | 18,371,976 | 22,966,530 |
| Italy 1.3% |
| Italy Buoni Poliennali Del Tesoro(d) |
| 09/15/2026 | 3.100% | EUR | 18,026,849 | 22,607,751 |
| 05/15/2028 | 1.300% | EUR | 14,456,233 | 16,665,493 |
| 09/15/2035 | 2.350% | EUR | 7,607,315 | 9,601,961 |
| 09/15/2041 | 2.550% | EUR | 6,004,399 | 8,011,693 |
| Total | 56,886,898 |
The accompanying Notes to Financial Statements are an integral part of this statement.
| 10 | Columbia Adaptive Risk Allocation Fund | Annual Report 2022 |
Portfolio of Investments (continued)
May 31, 2022
| Inflation-Indexed Bonds(b) (continued) |
| Issuer | Coupon
Rate | | Principal
Amount ($) | Value ($) |
| Spain 0.5% |
| Spain Government Inflation-Linked Bond(d) |
| 11/30/2030 | 1.000% | EUR | 6,585,604 | 7,912,051 |
| 11/30/2033 | 0.700% | EUR | 10,585,957 | 12,146,420 |
| Total | 20,058,471 |
| United Kingdom 3.7% |
| United Kingdom Gilt Inflation-Linked Bond(d) |
| 03/22/2029 | 0.125% | GBP | 13,441,654 | 20,052,623 |
| 03/22/2034 | 0.750% | GBP | 13,155,681 | 22,130,110 |
| 11/22/2037 | 1.125% | GBP | 10,771,437 | 20,048,356 |
| 03/22/2044 | 0.125% | GBP | 12,434,405 | 21,048,944 |
| 11/22/2047 | 0.750% | GBP | 5,449,640 | 10,717,028 |
| 03/22/2052 | 0.250% | GBP | 14,503,698 | 26,575,143 |
| 11/22/2056 | 0.125% | GBP | 9,551,709 | 17,341,895 |
| 11/22/2065 | 0.125% | GBP | 5,311,586 | 10,625,945 |
| 03/22/2068 | 0.125% | GBP | 2,456,363 | 5,134,215 |
| Total | 153,674,259 |
| United States 5.2% |
| U.S. Treasury Inflation-Indexed Bond |
| 01/15/2024 | 0.625% | | 28,639,327 | 29,658,474 |
| 07/15/2027 | 0.375% | | 25,410,418 | 26,100,080 |
| 01/15/2028 | 0.500% | | 23,785,583 | 24,440,653 |
| 07/15/2028 | 0.750% | | 13,614,894 | 14,240,881 |
| 01/15/2029 | 0.875% | | 32,473,442 | 34,121,485 |
| 07/15/2029 | 0.250% | | 26,427,907 | 26,734,282 |
| 07/15/2030 | 0.125% | | 20,793,193 | 20,750,713 |
| 04/15/2032 | 3.375% | | 7,836,302 | 10,235,512 |
| 02/15/2042 | 0.750% | | 10,426,990 | 10,286,447 |
| 02/15/2043 | 0.625% | | 8,602,190 | 8,210,374 |
| 02/15/2045 | 0.750% | | 6,265,762 | 6,072,899 |
| 02/15/2048 | 1.000% | | 4,206,531 | 4,370,964 |
| Total | 215,222,764 |
Total Inflation-Indexed Bonds
(Cost $608,715,504) | 562,216,003 |
| Multi-Asset/Tactical Strategies Funds 0.2% |
| | Shares | Value ($) |
| Columbia Solutions Aggressive Portfolio(a) | 129,438 | 1,162,360 |
| Columbia Solutions Conservative Portfolio(a) | 670,954 | 6,313,677 |
Total Multi-Asset/Tactical Strategies Funds
(Cost $8,574,734) | 7,476,037 |
| Residential Mortgage-Backed Securities - Agency 6.2% |
| Issuer | Coupon
Rate | | Principal
Amount ($) | Value ($) |
| Government National Mortgage Association TBA(f) |
| 06/22/2052 | 3.000% | | 28,350,000 | 27,341,139 |
| 06/22/2052 | 3.500% | | 24,550,000 | 24,323,680 |
| 06/22/2052 | 4.000% | | 22,220,000 | 22,445,672 |
| Uniform Mortgage-Backed Security TBA(f) |
| 06/16/2037 | 2.500% | | 12,248,328 | 11,856,956 |
06/16/2037-
06/13/2052 | 3.000% | | 42,000,000 | 40,256,172 |
| 06/13/2052 | 3.500% | | 39,000,000 | 38,229,140 |
| 06/13/2052 | 4.000% | | 41,740,000 | 41,756,304 |
| 06/13/2052 | 4.500% | | 48,800,000 | 49,659,719 |
Total Residential Mortgage-Backed Securities - Agency
(Cost $252,423,920) | 255,868,782 |
|
| U.S. Treasury Obligations 24.2% |
| | | | |
| U.S. Treasury |
| 10/31/2026 | 1.125% | | 43,400,000 | 40,334,875 |
| 02/28/2027 | 1.875% | | 179,000,000 | 171,490,391 |
| 06/30/2028 | 1.250% | | 33,248,000 | 30,216,718 |
| 09/30/2028 | 1.250% | | 198,285,000 | 179,509,889 |
| 10/31/2028 | 1.375% | | 74,000,000 | 67,438,282 |
| 11/30/2028 | 1.500% | | 183,160,000 | 168,077,919 |
| 04/30/2029 | 2.875% | | 97,447,000 | 97,416,548 |
| 05/15/2029 | 2.375% | | 28,507,000 | 27,607,248 |
| 08/15/2029 | 1.625% | | 28,483,500 | 26,231,523 |
| 08/15/2030 | 0.625% | | 26,810,000 | 22,457,564 |
| 02/15/2031 | 1.125% | | 24,922,000 | 21,639,305 |
| 08/15/2031 | 1.250% | | 146,295,000 | 127,390,943 |
| 11/15/2031 | 1.375% | | 26,522,000 | 23,273,055 |
Total U.S. Treasury Obligations
(Cost $1,088,559,205) | 1,003,084,260 |
| Money Market Funds 35.4% |
| | Shares | Value ($) |
| Columbia Short-Term Cash Fund, 0.852%(a),(g) | 1,466,666,880 | 1,466,080,213 |
Total Money Market Funds
(Cost $1,466,223,653) | 1,466,080,213 |
Total Investments in Securities
(Cost: $4,543,909,840) | 4,302,351,787 |
| Other Assets & Liabilities, Net | | (158,572,715) |
| Net Assets | 4,143,779,072 |
At May 31, 2022, securities and/or cash totaling $75,414,375 were pledged as collateral.
The accompanying Notes to Financial Statements are an integral part of this statement.
Columbia Adaptive Risk Allocation Fund | Annual Report 2022
| 11 |
Portfolio of Investments (continued)
May 31, 2022
Investments in derivatives
| Forward foreign currency exchange contracts |
Currency to
be sold | Currency to
be purchased | Counterparty | Settlement
date | Unrealized
appreciation ($) | Unrealized
depreciation ($) |
| 30,381,000 CHF | 31,837,402 USD | Citi | 06/10/2022 | 149,136 | — |
| 4,501,000 CHF | 4,632,089 USD | Citi | 06/10/2022 | — | (62,584) |
| 68,622,000 CNY | 10,488,010 USD | Citi | 06/10/2022 | 184,836 | — |
| 786,259,300 EUR | 842,546,837 USD | Citi | 06/10/2022 | — | (1,919,238) |
| 23,526,000 HKD | 2,999,827 USD | Citi | 06/10/2022 | 1,120 | — |
| 57,992,000 SEK | 5,990,662 USD | Citi | 06/10/2022 | 50,789 | — |
| 4,321,611 USD | 4,145,000 CHF | Citi | 06/10/2022 | 1,744 | — |
| 42,151,219 USD | 39,652,000 EUR | Citi | 06/10/2022 | 436,218 | — |
| 121,383 USD | 2,489,000 MXN | Citi | 06/10/2022 | 4,874 | — |
| 2,182,512 USD | 21,980,000 SEK | Citi | 06/10/2022 | 68,806 | — |
| 56,816 USD | 550,000 SEK | Citi | 06/10/2022 | — | (482) |
| 28,868,298,000 IDR | 1,979,993 USD | Goldman Sachs International | 06/10/2022 | — | (1,238) |
| 10,396,000 NOK | 1,138,580 USD | Goldman Sachs International | 06/10/2022 | 29,312 | — |
| 2,001,269 USD | 28,868,298,000 IDR | Goldman Sachs International | 06/10/2022 | — | (20,037) |
| 8,789,187 USD | 82,399,000 NOK | Goldman Sachs International | 06/10/2022 | 2,907 | — |
| 12,597,761 USD | 115,026,000 NOK | Goldman Sachs International | 06/10/2022 | — | (324,319) |
| 4,589,000 EUR | 4,924,773 USD | HSBC | 06/10/2022 | — | (3,951) |
| 23,907,268,280 JPY | 187,154,961 USD | HSBC | 06/10/2022 | 1,382,290 | — |
| 6,547,279,000 JPY | 50,360,336 USD | HSBC | 06/10/2022 | — | (515,636) |
| 204,000 NZD | 134,497 USD | HSBC | 06/10/2022 | 1,587 | — |
| 5,376,000 SGD | 3,910,529 USD | HSBC | 06/10/2022 | — | (13,324) |
| 12,417,315 USD | 1,600,173,000 JPY | HSBC | 06/10/2022 | 16,913 | — |
| 13,870,000 ZAR | 876,418 USD | HSBC | 06/10/2022 | — | (9,235) |
| 28,211,000 CNY | 4,316,248 USD | Standard Chartered | 06/10/2022 | 80,540 | — |
| 40,917,000 AUD | 29,240,720 USD | UBS | 06/10/2022 | — | (127,402) |
| 39,354,000 CAD | 30,822,368 USD | UBS | 06/10/2022 | — | (289,891) |
| 18,171,000 DKK | 2,621,101 USD | UBS | 06/10/2022 | — | (2,205) |
| 180,723,097 GBP | 230,055,081 USD | UBS | 06/10/2022 | 2,316,268 | — |
| 18,891,000 NZD | 12,189,947 USD | UBS | 06/10/2022 | — | (117,918) |
| 3,241,995 USD | 4,517,000 AUD | UBS | 06/10/2022 | 75 | — |
| 39,435,439 USD | 50,403,000 CAD | UBS | 06/10/2022 | 411,875 | — |
| 19,423,205 USD | 15,461,000 GBP | UBS | 06/10/2022 | 60,026 | — |
| 12,454,666 USD | 18,891,000 NZD | UBS | 06/10/2022 | — | (146,801) |
| Total | | | | 5,199,316 | (3,554,261) |
| Long futures contracts |
| Description | Number of
contracts | Expiration
date | Trading
currency | Notional
amount | Value/Unrealized
appreciation ($) | Value/Unrealized
depreciation ($) |
| Euro-Bobl | 99 | 06/2022 | EUR | 12,522,510 | — | (736,734) |
| Euro-BTP | 562 | 06/2022 | EUR | 71,300,940 | — | (8,989,071) |
| Euro-Bund | 705 | 06/2022 | EUR | 106,856,850 | — | (9,923,848) |
| Euro-OAT | 596 | 06/2022 | EUR | 85,877,640 | — | (6,223,178) |
| FTSE 100 Index | 439 | 06/2022 | GBP | 33,300,345 | 11,681 | — |
| Long Gilt | 603 | 09/2022 | GBP | 69,929,910 | — | (1,429,352) |
| MSCI EAFE Index | 1,014 | 06/2022 | USD | 103,275,900 | — | (1,633,258) |
| MSCI Emerging Markets Index | 48 | 06/2022 | USD | 2,551,920 | 55,864 | — |
| MSCI Emerging Markets Index | 839 | 06/2022 | USD | 44,605,435 | — | (621,363) |
| S&P 500 Index E-mini | 1,430 | 06/2022 | USD | 295,384,375 | — | (7,750,052) |
| S&P/TSX 60 Index | 67 | 06/2022 | CAD | 16,796,900 | — | (439,193) |
| U.S. Treasury 10-Year Note | 775 | 09/2022 | USD | 92,576,172 | — | (491,903) |
| U.S. Treasury 5-Year Note | 4,693 | 09/2022 | USD | 530,089,016 | — | (1,548,338) |
| Total | | | | | 67,545 | (39,786,290) |
The accompanying Notes to Financial Statements are an integral part of this statement.
| 12 | Columbia Adaptive Risk Allocation Fund | Annual Report 2022 |
Portfolio of Investments (continued)
May 31, 2022
| Cleared credit default swap contracts - sell protection |
Reference
entity | Counterparty | Maturity
date | Receive
fixed
rate
(%) | Payment
frequency | Implied
credit
spread
(%)* | Notional
currency | Notional
amount | Value
($) | Upfront
payments
($) | Upfront
receipts
($) | Unrealized
appreciation
($) | Unrealized
depreciation
($) |
| Markit CDX Emerging Markets Index, Series 37 | Morgan Stanley | 06/20/2027 | 1.000 | Quarterly | 2.723 | USD | 90,692,000 | (1,496,921) | — | — | — | (1,496,921) |
| Markit CDX North America High Yield Index, Series 38 | Morgan Stanley | 06/20/2027 | 5.000 | Quarterly | 4.626 | USD | 164,576,000 | (3,232,646) | — | — | — | (3,232,646) |
| Markit CDX North America Investment Grade Index, Series 38 | Morgan Stanley | 06/20/2027 | 1.000 | Quarterly | 0.801 | USD | 83,738,000 | 292,750 | — | — | 292,750 | — |
| Total | | | | | | | | (4,436,817) | — | — | 292,750 | (4,729,567) |
| * | Implied credit spreads, represented in absolute terms, utilized in determining the market value of credit default swap agreements on corporate or sovereign issues as of period end serve as an indicator of the current status of the payment/performance risk and represent the likelihood or risk of default for the credit derivative. The implied credit spread of a particular referenced entity reflects the cost of buying/selling protection and may include upfront payments required to be made to enter into the agreement. Wider credit spreads represent a deterioration of the referenced entity’s credit soundness and a greater likelihood or risk of default or other credit event occurring as defined under the terms of the agreement. |
The accompanying Notes to Financial Statements are an integral part of this statement.
Columbia Adaptive Risk Allocation Fund | Annual Report 2022
| 13 |
Portfolio of Investments (continued)
May 31, 2022
Notes to Portfolio of Investments
| (a) | As defined in the Investment Company Act of 1940, as amended, an affiliated company is one in which the Fund owns 5% or more of the company’s outstanding voting securities, or a company which is under common ownership or control with the Fund. The value of the holdings and transactions in these affiliated companies during the year ended May 31, 2022 are as follows: |
| Affiliated issuers | Beginning
of period($) | Purchases($) | Sales($) | Net change in
unrealized
appreciation
(depreciation)($) | End of
period($) | Capital gain
distributions($) | Realized gain
(loss)($) | Dividends —
affiliated
issuers ($) | End of
period shares |
| Columbia Commodity Strategy Fund, Institutional 3 Class |
| | 373,852,606 | 746,611,216 | (900,758,231) | (54,727,881) | 164,977,710 | — | 76,397,769 | 107,622,216 | 7,126,467 |
| Columbia Short-Term Cash Fund, 0.852% |
| | 1,427,191,383 | 7,512,134,187 | (7,473,114,683) | (130,674) | 1,466,080,213 | — | (288,764) | 2,564,211 | 1,466,666,880 |
| Columbia Solutions Aggressive Portfolio |
| | 1,244,985 | 325,665 | — | (408,290) | 1,162,360 | 315,085 | — | 10,579 | 129,438 |
| Columbia Solutions Conservative Portfolio |
| | 6,754,982 | 421,163 | — | (862,468) | 6,313,677 | 353,941 | — | 67,223 | 670,954 |
| Total | 1,809,043,956 | | | (56,129,313) | 1,638,533,960 | 669,026 | 76,109,005 | 110,264,229 | |
| (b) | Principal amounts are denominated in United States Dollars unless otherwise noted. |
| (c) | Principal and interest may not be guaranteed by a governmental entity. |
| (d) | Represents privately placed and other securities and instruments exempt from Securities and Exchange Commission registration (collectively, private placements), such as Section 4(a)(2) and Rule 144A eligible securities, which are often sold only to qualified institutional buyers. At May 31, 2022, the total value of these securities amounted to $860,443,734, which represents 20.76% of total net assets. |
| (e) | Zero coupon bond. |
| (f) | Represents a security purchased on a when-issued basis. |
| (g) | The rate shown is the seven-day current annualized yield at May 31, 2022. |
Abbreviation Legend
Currency Legend
| AUD | Australian Dollar |
| CAD | Canada Dollar |
| CHF | Swiss Franc |
| CNY | China Yuan Renminbi |
| DKK | Danish Krone |
| EUR | Euro |
| GBP | British Pound |
| HKD | Hong Kong Dollar |
| IDR | Indonesian Rupiah |
| JPY | Japanese Yen |
| MXN | Mexican Peso |
| NOK | Norwegian Krone |
| NZD | New Zealand Dollar |
| SEK | Swedish Krona |
| SGD | Singapore Dollar |
| USD | US Dollar |
| ZAR | South African Rand |
The accompanying Notes to Financial Statements are an integral part of this statement.
| 14 | Columbia Adaptive Risk Allocation Fund | Annual Report 2022 |
Portfolio of Investments (continued)
May 31, 2022
Fair value measurements
The Fund categorizes its fair value measurements according to a three-level hierarchy that maximizes the use of observable inputs and minimizes the use of unobservable inputs by prioritizing that the most observable input be used when available. Observable inputs are those that market participants would use in pricing an investment based on market data obtained from sources independent of the reporting entity. Unobservable inputs are those that reflect the Fund’s assumptions about the information market participants would use in pricing an investment. An investment’s level within the fair value hierarchy is based on the lowest level of any input that is deemed significant to the asset’s or liability’s fair value measurement. The input levels are not necessarily an indication of the risk or liquidity associated with investments at that level. For example, certain U.S. government securities are generally high quality and liquid, however, they are reflected as Level 2 because the inputs used to determine fair value may not always be quoted prices in an active market.
Fair value inputs are summarized in the three broad levels listed below:
| ■ | Level 1 — Valuations based on quoted prices for investments in active markets that the Fund has the ability to access at the measurement date. Valuation adjustments are not applied to Level 1 investments. |
| ■ | Level 2 — Valuations based on other significant observable inputs (including quoted prices for similar securities, interest rates, prepayment speeds, credit risks, etc.). |
| ■ | Level 3 — Valuations based on significant unobservable inputs (including the Fund’s own assumptions and judgment in determining the fair value of investments). |
Inputs that are used in determining fair value of an investment may include price information, credit data, volatility statistics, and other factors. These inputs can be either observable or unobservable. The availability of observable inputs can vary between investments, and is affected by various factors such as the type of investment, and the volume and level of activity for that investment or similar investments in the marketplace. The inputs will be considered by the Investment Manager, along with any other relevant factors in the calculation of an investment’s fair value. The Fund uses prices and inputs that are current as of the measurement date, which may include periods of market dislocations. During these periods, the availability of prices and inputs may be reduced for many investments. This condition could cause an investment to be reclassified between the various levels within the hierarchy.
Certain investments that have been measured at fair value using the net asset value (NAV) per share (or its equivalent) are not categorized in the fair value hierarchy. The fair value amounts presented in the table are intended to reconcile the fair value hierarchy to the amounts presented in the Portfolio of Investments. The Columbia Solutions Portfolios serve as investment vehicles for the Columbia Adaptive Retirement Funds and each pursues consistent total returns by seeking to allocate risks across multiple asset classes. Investments in the Columbia Solutions Portfolios may be redeemed on a daily basis without restriction.
Investments falling into the Level 3 category are primarily supported by quoted prices from brokers and dealers participating in the market for those investments. However, these may be classified as Level 3 investments due to lack of market transparency and corroboration to support these quoted prices. Additionally, valuation models may be used as the pricing source for any remaining investments classified as Level 3. These models may rely on one or more significant unobservable inputs and/or significant assumptions by the Investment Manager. Inputs used in valuations may include, but are not limited to, financial statement analysis, capital account balances, discount rates and estimated cash flows, and comparable company data.
Under the direction of the Fund’s Board of Trustees (the Board), the Investment Manager’s Valuation Committee (the Committee) is responsible for overseeing the valuation procedures approved by the Board. The Committee consists of voting and non-voting members from various groups within the Investment Manager’s organization, including operations and accounting, trading and investments, compliance, risk management and legal.
The Committee meets at least monthly to review and approve valuation matters, which may include a description of specific valuation determinations, data regarding pricing information received from approved pricing vendors and brokers and the results of Board-approved valuation control policies and procedures (the Policies). The Policies address, among other things, instances when market quotations are or are not readily available, including recommendations of third party pricing vendors and a determination of appropriate pricing methodologies; events that require specific valuation determinations and assessment of fair value techniques; securities with a potential for stale pricing, including those that are illiquid, restricted, or in default; and the effectiveness of third party pricing vendors, including periodic reviews of vendors. The Committee meets more frequently, as needed, to discuss additional valuation matters, which may include the need to review back-testing results, review time-sensitive information or approve related valuation actions. The Committee reports to the Board, with members of the Committee meeting with the Board at each of its regularly scheduled meetings to discuss valuation matters and actions during the period, similar to those described earlier.
The following table is a summary of the inputs used to value the Fund’s investments at May 31, 2022:
| | Level 1 ($) | Level 2 ($) | Level 3 ($) | Assets at NAV ($) | Total ($) |
| Investments in Securities | | | | | |
| Alternative Strategies Funds | 164,977,710 | — | — | — | 164,977,710 |
| Common Stocks | | | | | |
| Consumer Discretionary | 1,148,213 | — | — | — | 1,148,213 |
| Real Estate | 74,367,725 | — | — | — | 74,367,725 |
| Total Common Stocks | 75,515,938 | — | — | — | 75,515,938 |
| Foreign Government Obligations | — | 767,132,844 | — | — | 767,132,844 |
| Inflation-Indexed Bonds | — | 562,216,003 | — | — | 562,216,003 |
| Multi-Asset/Tactical Strategies Funds | — | — | — | 7,476,037 | 7,476,037 |
| Residential Mortgage-Backed Securities - Agency | — | 255,868,782 | — | — | 255,868,782 |
| U.S. Treasury Obligations | 1,003,084,260 | — | — | — | 1,003,084,260 |
| Money Market Funds | 1,466,080,213 | — | — | — | 1,466,080,213 |
| Total Investments in Securities | 2,709,658,121 | 1,585,217,629 | — | 7,476,037 | 4,302,351,787 |
| Investments in Derivatives | | | | | |
| Asset | | | | | |
| Forward Foreign Currency Exchange Contracts | — | 5,199,316 | — | — | 5,199,316 |
| Futures Contracts | 67,545 | — | — | — | 67,545 |
| Swap Contracts | — | 292,750 | — | — | 292,750 |
The accompanying Notes to Financial Statements are an integral part of this statement.
Columbia Adaptive Risk Allocation Fund | Annual Report 2022
| 15 |
Portfolio of Investments (continued)
May 31, 2022
Fair value measurements (continued)
| | Level 1 ($) | Level 2 ($) | Level 3 ($) | Assets at NAV ($) | Total ($) |
| Liability | | | | | |
| Forward Foreign Currency Exchange Contracts | — | (3,554,261) | — | — | (3,554,261) |
| Futures Contracts | (39,786,290) | — | — | — | (39,786,290) |
| Swap Contracts | — | (4,729,567) | — | — | (4,729,567) |
| Total | 2,669,939,376 | 1,582,425,867 | — | 7,476,037 | 4,259,841,280 |
See the Portfolio of Investments for all investment classifications not indicated in the table.
The Fund’s assets assigned to the Level 2 input category are generally valued using the market approach, in which a security’s value is determined through reference to prices and information from market transactions for similar or identical assets.
Derivative instruments are valued at unrealized appreciation (depreciation).
The accompanying Notes to Financial Statements are an integral part of this statement.
| 16 | Columbia Adaptive Risk Allocation Fund | Annual Report 2022 |
Statement of Assets and Liabilities
May 31, 2022
| Assets | |
| Investments in securities, at value | |
| Unaffiliated issuers (cost $2,937,414,344) | $2,663,817,827 |
| Affiliated issuers (cost $1,606,495,496) | 1,638,533,960 |
| Foreign currency (cost $6,498,491) | 6,537,407 |
| Margin deposits on: | |
| Futures contracts | 46,062,029 |
| Swap contracts | 29,352,345 |
| Unrealized appreciation on forward foreign currency exchange contracts | 5,199,316 |
| Receivable for: | |
| Investments sold | 10,000,000 |
| Investments sold on a delayed delivery basis | 8,488,665 |
| Capital shares sold | 5,635,001 |
| Dividends | 918,954 |
| Interest | 7,822,493 |
| Foreign tax reclaims | 542,610 |
| Variation margin for futures contracts | 669,908 |
| Prepaid expenses | 30,541 |
| Trustees’ deferred compensation plan | 147,054 |
| Total assets | 4,423,758,110 |
| Liabilities | |
| Unrealized depreciation on forward foreign currency exchange contracts | 3,554,261 |
| Payable for: | |
| Investments purchased on a delayed delivery basis | 261,291,746 |
| Capital shares purchased | 5,106,863 |
| Variation margin for futures contracts | 8,651,482 |
| Variation margin for swap contracts | 585,075 |
| Management services fees | 317,739 |
| Distribution and/or service fees | 15,595 |
| Transfer agent fees | 159,943 |
| Compensation of board members | 36,061 |
| Other expenses | 113,219 |
| Trustees’ deferred compensation plan | 147,054 |
| Total liabilities | 279,979,038 |
| Net assets applicable to outstanding capital stock | $4,143,779,072 |
| Represented by | |
| Paid in capital | 4,544,573,226 |
| Total distributable earnings (loss) | (400,794,154) |
| Total - representing net assets applicable to outstanding capital stock | $4,143,779,072 |
The accompanying Notes to Financial Statements are an integral part of this statement.
Columbia Adaptive Risk Allocation Fund | Annual Report 2022
| 17 |
Statement of Assets and Liabilities (continued)
May 31, 2022
| Class A | |
| Net assets | $185,112,388 |
| Shares outstanding | 19,107,081 |
| Net asset value per share | $9.69 |
| Maximum sales charge | 5.75% |
| Maximum offering price per share (calculated by dividing the net asset value per share by 1.0 minus the maximum sales charge for Class A shares) | $10.28 |
| Advisor Class | |
| Net assets | $86,570,137 |
| Shares outstanding | 8,915,122 |
| Net asset value per share | $9.71 |
| Class C | |
| Net assets | $94,069,243 |
| Shares outstanding | 10,241,766 |
| Net asset value per share | $9.18 |
| Institutional Class | |
| Net assets | $3,693,808,535 |
| Shares outstanding | 380,744,044 |
| Net asset value per share | $9.70 |
| Institutional 2 Class | |
| Net assets | $63,728,731 |
| Shares outstanding | 6,546,000 |
| Net asset value per share | $9.74 |
| Institutional 3 Class | |
| Net assets | $19,579,460 |
| Shares outstanding | 2,010,142 |
| Net asset value per share | $9.74 |
| Class R | |
| Net assets | $910,578 |
| Shares outstanding | 95,231 |
| Net asset value per share | $9.56 |
The accompanying Notes to Financial Statements are an integral part of this statement.
| 18 | Columbia Adaptive Risk Allocation Fund | Annual Report 2022 |
Statement of Operations
Year Ended May 31, 2022
| Net investment income | |
| Income: | |
| Dividends — unaffiliated issuers | $6,319,269 |
| Dividends — affiliated issuers | 110,264,229 |
| Interest | 52,732,013 |
| Foreign taxes withheld | (74,135) |
| Total income | 169,241,376 |
| Expenses: | |
| Management services fees | 29,704,707 |
| Distribution and/or service fees | |
| Class A | 470,177 |
| Class C | 1,122,719 |
| Class R | 4,031 |
| Transfer agent fees | |
| Class A | 88,406 |
| Advisor Class | 37,494 |
| Class C | 52,522 |
| Institutional Class | 1,853,370 |
| Institutional 2 Class | 37,774 |
| Institutional 3 Class | 4,403 |
| Class R | 380 |
| Compensation of board members | 63,692 |
| Custodian fees | 227,688 |
| Printing and postage fees | 131,138 |
| Registration fees | 277,411 |
| Audit fees | 54,750 |
| Legal fees | 51,257 |
| Interest on collateral | 405,056 |
| Compensation of chief compliance officer | 1,333 |
| Other | 52,855 |
| Total expenses | 34,641,163 |
| Net investment income | 134,600,213 |
| Realized and unrealized gain (loss) — net | |
| Net realized gain (loss) on: | |
| Investments — unaffiliated issuers | 32,724,292 |
| Investments — affiliated issuers | 76,109,005 |
| Capital gain distributions from underlying affiliated funds | 669,026 |
| Foreign currency translations | (576,234) |
| Forward foreign currency exchange contracts | 149,563,905 |
| Futures contracts | 39,555,895 |
| Swap contracts | 3,830,017 |
| Net realized gain | 301,875,906 |
| Net change in unrealized appreciation (depreciation) on: | |
| Investments — unaffiliated issuers | (395,177,361) |
| Investments — affiliated issuers | (56,129,313) |
| Foreign currency translations | (414,680) |
| Forward foreign currency exchange contracts | 12,881,103 |
| Futures contracts | (125,060,325) |
| Swap contracts | (22,653,891) |
| Net change in unrealized appreciation (depreciation) | (586,554,467) |
| Net realized and unrealized loss | (284,678,561) |
| Net decrease in net assets resulting from operations | $(150,078,348) |
The accompanying Notes to Financial Statements are an integral part of this statement.
Columbia Adaptive Risk Allocation Fund | Annual Report 2022
| 19 |
Statement of Changes in Net Assets
| | Year Ended
May 31, 2022 | Year Ended
May 31, 2021 |
| Operations | | |
| Net investment income | $134,600,213 | $5,845,344 |
| Net realized gain | 301,875,906 | 463,916,290 |
| Net change in unrealized appreciation (depreciation) | (586,554,467) | 196,658,755 |
| Net increase (decrease) in net assets resulting from operations | (150,078,348) | 666,420,389 |
| Distributions to shareholders | | |
| Net investment income and net realized gains | | |
| Class A | (32,135,555) | (1,548,063) |
| Advisor Class | (15,402,896) | (1,159,036) |
| Class C | (19,874,747) | (616,774) |
| Institutional Class | (688,785,814) | (75,347,293) |
| Institutional 2 Class | (10,298,112) | (1,180,953) |
| Institutional 3 Class | (3,879,770) | (435,933) |
| Class R | (143,242) | (2,542) |
| Total distributions to shareholders | (770,520,136) | (80,290,594) |
| Increase in net assets from capital stock activity | 796,520,568 | 505,297,035 |
| Total increase (decrease) in net assets | (124,077,916) | 1,091,426,830 |
| Net assets at beginning of year | 4,267,856,988 | 3,176,430,158 |
| Net assets at end of year | $4,143,779,072 | $4,267,856,988 |
The accompanying Notes to Financial Statements are an integral part of this statement.
| 20 | Columbia Adaptive Risk Allocation Fund | Annual Report 2022 |
Statement of Changes in Net Assets (continued)
| | Year Ended | Year Ended |
| | May 31, 2022 | May 31, 2021 |
| | Shares | Dollars ($) | Shares | Dollars ($) |
| Capital stock activity |
| Class A | | | | |
| Subscriptions | 5,594,187 | 60,975,090 | 3,511,911 | 39,359,283 |
| Distributions reinvested | 2,892,709 | 30,402,371 | 129,351 | 1,481,063 |
| Redemptions | (3,845,595) | (41,535,809) | (2,932,206) | (33,082,610) |
| Net increase | 4,641,301 | 49,841,652 | 709,056 | 7,757,736 |
| Advisor Class | | | | |
| Subscriptions | 4,316,404 | 50,176,542 | 3,605,975 | 41,235,461 |
| Distributions reinvested | 1,464,052 | 15,401,823 | 101,116 | 1,158,793 |
| Redemptions | (1,956,212) | (21,388,286) | (2,600,008) | (29,970,824) |
| Net increase | 3,824,244 | 44,190,079 | 1,107,083 | 12,423,430 |
| Class C | | | | |
| Subscriptions | 1,315,151 | 14,422,781 | 1,740,304 | 18,919,109 |
| Distributions reinvested | 1,938,855 | 19,369,165 | 54,694 | 601,087 |
| Redemptions | (2,798,883) | (28,824,303) | (1,666,684) | (18,196,912) |
| Net increase | 455,123 | 4,967,643 | 128,314 | 1,323,284 |
| Institutional Class | | | | |
| Subscriptions | 81,121,176 | 911,145,226 | 99,516,165 | 1,122,158,944 |
| Distributions reinvested | 63,639,272 | 668,848,747 | 6,403,075 | 73,315,210 |
| Redemptions | (80,310,337) | (897,830,976) | (64,186,723) | (733,957,702) |
| Net increase | 64,450,111 | 682,162,997 | 41,732,517 | 461,516,452 |
| Institutional 2 Class | | | | |
| Subscriptions | 4,439,815 | 49,138,569 | 4,384,916 | 50,120,358 |
| Distributions reinvested | 976,124 | 10,298,112 | 102,870 | 1,180,952 |
| Redemptions | (4,172,968) | (47,429,487) | (2,922,457) | (33,482,213) |
| Net increase | 1,242,971 | 12,007,194 | 1,565,329 | 17,819,097 |
| Institutional 3 Class | | | | |
| Subscriptions | 142,545 | 1,630,519 | 481,381 | 5,302,208 |
| Distributions reinvested | 367,700 | 3,879,234 | 37,934 | 435,867 |
| Redemptions | (258,132) | (2,731,456) | (121,776) | (1,372,157) |
| Net increase | 252,113 | 2,778,297 | 397,539 | 4,365,918 |
| Class R | | | | |
| Subscriptions | 50,566 | 577,024 | 10,730 | 117,004 |
| Distributions reinvested | 13,745 | 142,672 | 223 | 2,525 |
| Redemptions | (13,213) | (146,990) | (2,663) | (28,411) |
| Net increase | 51,098 | 572,706 | 8,290 | 91,118 |
| Total net increase | 74,916,961 | 796,520,568 | 45,648,128 | 505,297,035 |
The accompanying Notes to Financial Statements are an integral part of this statement.
Columbia Adaptive Risk Allocation Fund | Annual Report 2022
| 21 |
The following table is intended to help you understand the Fund’s financial performance. Certain information reflects financial results for a single share of a class held for the periods shown. Per share net investment income (loss) amounts are calculated based on average shares outstanding during the period. Total return assumes reinvestment of all dividends and distributions, if any. Total return does not reflect payment of sales charges, if any. Total return and portfolio turnover are not annualized for periods of less than one year. The portfolio turnover rate is calculated without regard to purchase and sales transactions of short-term instruments and certain derivatives, if any. If such transactions were included, the Fund’s portfolio turnover rate may be higher.
| | Net asset value,
beginning of
period | Net
investment
income
(loss) | Net
realized
and
unrealized
gain (loss) | Total from
investment
operations | Distributions
from net
investment
income | Distributions
from net
realized
gains | Total
distributions to
shareholders |
| Class A |
| Year Ended 5/31/2022 | $12.10 | 0.32 | (0.59) | (0.27) | (0.42) | (1.72) | (2.14) |
| Year Ended 5/31/2021 | $10.25 | (0.01) | 1.97 | 1.96 | (0.04) | (0.07) | (0.11) |
| Year Ended 5/31/2020 | $10.44 | 0.08 | 0.51 | 0.59 | (0.26) | (0.52) | (0.78) |
| Year Ended 5/31/2019 | $10.81 | 0.20 | 0.01 | 0.21 | (0.35) | (0.23) | (0.58) |
| Year Ended 5/31/2018 | $10.83 | 0.04 | 0.72 | 0.76 | — | (0.78) | (0.78) |
| Advisor Class |
| Year Ended 5/31/2022 | $12.12 | 0.38 | (0.62) | (0.24) | (0.44) | (1.73) | (2.17) |
| Year Ended 5/31/2021 | $10.37 | 0.02 | 1.98 | 2.00 | (0.10) | (0.15) | (0.25) |
| Year Ended 5/31/2020 | $10.55 | 0.10 | 0.53 | 0.63 | (0.29) | (0.52) | (0.81) |
| Year Ended 5/31/2019 | $10.92 | 0.23 | 0.01 | 0.24 | (0.38) | (0.23) | (0.61) |
| Year Ended 5/31/2018 | $10.92 | 0.07 | 0.71 | 0.78 | (0.00)(e) | (0.78) | (0.78) |
| Class C |
| Year Ended 5/31/2022 | $11.57 | 0.23 | (0.57) | (0.34) | (0.37) | (1.68) | (2.05) |
| Year Ended 5/31/2021 | $9.85 | (0.09) | 1.87 | 1.78 | — | (0.06) | (0.06) |
| Year Ended 5/31/2020 | $10.05 | 0.00(e) | 0.50 | 0.50 | (0.18) | (0.52) | (0.70) |
| Year Ended 5/31/2019 | $10.42 | 0.11 | 0.02 | 0.13 | (0.27) | (0.23) | (0.50) |
| Year Ended 5/31/2018 | $10.55 | (0.04) | 0.69 | 0.65 | — | (0.78) | (0.78) |
| Institutional Class |
| Year Ended 5/31/2022 | $12.11 | 0.35 | (0.59) | (0.24) | (0.44) | (1.73) | (2.17) |
| Year Ended 5/31/2021 | $10.36 | 0.02 | 1.98 | 2.00 | (0.10) | (0.15) | (0.25) |
| Year Ended 5/31/2020 | $10.55 | 0.11 | 0.51 | 0.62 | (0.29) | (0.52) | (0.81) |
| Year Ended 5/31/2019 | $10.91 | 0.22 | 0.03 | 0.25 | (0.38) | (0.23) | (0.61) |
| Year Ended 5/31/2018 | $10.91 | 0.06 | 0.72 | 0.78 | (0.00)(e) | (0.78) | (0.78) |
| Institutional 2 Class |
| Year Ended 5/31/2022 | $12.15 | 0.32 | (0.56) | (0.24) | (0.44) | (1.73) | (2.17) |
| Year Ended 5/31/2021 | $10.39 | 0.02 | 1.98 | 2.00 | (0.10) | (0.14) | (0.24) |
| Year Ended 5/31/2020 | $10.57 | 0.10 | 0.53 | 0.63 | (0.29) | (0.52) | (0.81) |
| Year Ended 5/31/2019 | $10.93 | 0.22 | 0.03 | 0.25 | (0.38) | (0.23) | (0.61) |
| Year Ended 5/31/2018 | $10.93 | 0.06 | 0.72 | 0.78 | (0.00)(e) | (0.78) | (0.78) |
The accompanying Notes to Financial Statements are an integral part of this statement.
| 22 | Columbia Adaptive Risk Allocation Fund | Annual Report 2022 |
Financial Highlights (continued)
| | Net
asset
value,
end of
period | Total
return | Total gross
expense
ratio to
average
net assets(a) | Total net
expense
ratio to
average
net assets(a),(b) | Net investment
income (loss)
ratio to
average
net assets | Portfolio
turnover | Net
assets,
end of
period
(000’s) |
| Class A |
| Year Ended 5/31/2022 | $9.69 | (3.62%) | 1.00%(c) | 1.00%(c) | 2.82% | 260% | $185,112 |
| Year Ended 5/31/2021 | $12.10 | 19.17% | 1.00%(c) | 1.00%(c) | (0.06%) | 227% | $175,015 |
| Year Ended 5/31/2020 | $10.25 | 5.41% | 1.01%(c) | 1.01%(c),(d) | 0.74% | 314% | $141,074 |
| Year Ended 5/31/2019 | $10.44 | 2.33% | 1.00% | 1.00%(d) | 1.87% | 203% | $120,147 |
| Year Ended 5/31/2018 | $10.81 | 7.07% | 0.99% | 0.99%(d) | 0.33% | 210% | $132,920 |
| Advisor Class |
| Year Ended 5/31/2022 | $9.71 | (3.36%) | 0.75%(c) | 0.75%(c) | 3.39% | 260% | $86,570 |
| Year Ended 5/31/2021 | $12.12 | 19.38% | 0.75%(c) | 0.75%(c) | 0.20% | 227% | $61,716 |
| Year Ended 5/31/2020 | $10.37 | 5.71% | 0.76%(c) | 0.76%(c),(d) | 0.98% | 314% | $41,312 |
| Year Ended 5/31/2019 | $10.55 | 2.58% | 0.75% | 0.75%(d) | 2.14% | 203% | $30,420 |
| Year Ended 5/31/2018 | $10.92 | 7.26% | 0.74% | 0.74%(d) | 0.59% | 210% | $19,764 |
| Class C |
| Year Ended 5/31/2022 | $9.18 | (4.39%) | 1.75%(c) | 1.75%(c) | 2.11% | 260% | $94,069 |
| Year Ended 5/31/2021 | $11.57 | 18.14% | 1.75%(c) | 1.75%(c) | (0.80%) | 227% | $113,245 |
| Year Ended 5/31/2020 | $9.85 | 4.73% | 1.76%(c) | 1.76%(c),(d) | 0.00% | 314% | $95,090 |
| Year Ended 5/31/2019 | $10.05 | 1.56% | 1.75% | 1.75%(d) | 1.10% | 203% | $94,648 |
| Year Ended 5/31/2018 | $10.42 | 6.19% | 1.74% | 1.74%(d) | (0.43%) | 210% | $109,335 |
| Institutional Class |
| Year Ended 5/31/2022 | $9.70 | (3.37%) | 0.75%(c) | 0.75%(c) | 3.08% | 260% | $3,693,809 |
| Year Ended 5/31/2021 | $12.11 | 19.40% | 0.75%(c) | 0.75%(c) | 0.19% | 227% | $3,831,565 |
| Year Ended 5/31/2020 | $10.36 | 5.62% | 0.76%(c) | 0.76%(c),(d) | 1.00% | 314% | $2,845,593 |
| Year Ended 5/31/2019 | $10.55 | 2.67% | 0.75% | 0.75%(d) | 2.11% | 203% | $2,618,924 |
| Year Ended 5/31/2018 | $10.91 | 7.26% | 0.74% | 0.74%(d) | 0.59% | 210% | $2,782,662 |
| Institutional 2 Class |
| Year Ended 5/31/2022 | $9.74 | (3.36%) | 0.76%(c) | 0.76%(c) | 2.78% | 260% | $63,729 |
| Year Ended 5/31/2021 | $12.15 | 19.38% | 0.76%(c) | 0.76%(c) | 0.17% | 227% | $64,418 |
| Year Ended 5/31/2020 | $10.39 | 5.69% | 0.77%(c) | 0.77%(c) | 0.95% | 314% | $38,829 |
| Year Ended 5/31/2019 | $10.57 | 2.65% | 0.76% | 0.76% | 2.10% | 203% | $22,397 |
| Year Ended 5/31/2018 | $10.93 | 7.24% | 0.75% | 0.75% | 0.57% | 210% | $16,033 |
The accompanying Notes to Financial Statements are an integral part of this statement.
Columbia Adaptive Risk Allocation Fund | Annual Report 2022
| 23 |
Financial Highlights (continued)
| | Net asset value,
beginning of
period | Net
investment
income
(loss) | Net
realized
and
unrealized
gain (loss) | Total from
investment
operations | Distributions
from net
investment
income | Distributions
from net
realized
gains | Total
distributions to
shareholders |
| Institutional 3 Class |
| Year Ended 5/31/2022 | $12.16 | 0.36 | (0.61) | (0.25) | (0.44) | (1.73) | (2.17) |
| Year Ended 5/31/2021 | $10.41 | 0.03 | 1.99 | 2.02 | (0.11) | (0.16) | (0.27) |
| Year Ended 5/31/2020 | $10.59 | 0.11 | 0.52 | 0.63 | (0.29) | (0.52) | (0.81) |
| Year Ended 5/31/2019 | $10.95 | 0.32 | (0.07)(f) | 0.25 | (0.38) | (0.23) | (0.61) |
| Year Ended 5/31/2018 | $10.95 | 0.07 | 0.72 | 0.79 | (0.01) | (0.78) | (0.79) |
| Class R |
| Year Ended 5/31/2022 | $11.97 | 0.30 | (0.60) | (0.30) | (0.40) | (1.71) | (2.11) |
| Year Ended 5/31/2021 | $10.13 | (0.03) | 1.93 | 1.90 | — | (0.06) | (0.06) |
| Year Ended 5/31/2020 | $10.32 | 0.05 | 0.52 | 0.57 | (0.24) | (0.52) | (0.76) |
| Year Ended 5/31/2019 | $10.69 | 0.16 | 0.02 | 0.18 | (0.32) | (0.23) | (0.55) |
| Year Ended 5/31/2018 | $10.75 | (0.01) | 0.73 | 0.72 | — | (0.78) | (0.78) |
| Notes to Financial Highlights |
| (a) | In addition to the fees and expenses that the Fund bears directly, the Fund indirectly bears a pro rata share of the fees and expenses of any other funds in which it invests. Such indirect expenses are not included in the Fund’s reported expense ratios. |
| (b) | Total net expenses include the impact of certain fee waivers/expense reimbursements made by the Investment Manager and certain of its affiliates, if applicable. |
| (c) | Ratios include interest on collateral expense. For the periods indicated below, if interest on collateral expense had been excluded, expenses would have been lower by: |
| Class | 5/31/2022 | 5/31/2021 | 5/31/2020 |
| Class A | 0.01% | less than 0.01% | less than 0.01% |
| Advisor Class | 0.01% | less than 0.01% | less than 0.01% |
| Class C | 0.01% | less than 0.01% | less than 0.01% |
| Institutional Class | 0.01% | less than 0.01% | less than 0.01% |
| Institutional 2 Class | 0.01% | less than 0.01% | less than 0.01% |
| Institutional 3 Class | 0.01% | less than 0.01% | less than 0.01% |
| Class R | 0.01% | less than 0.01% | less than 0.01% |
| (d) | The benefits derived from expense reductions had an impact of less than 0.01%. |
| (e) | Rounds to zero. |
| (f) | Calculation of the net gain (loss) per share (both realized and unrealized) does not correlate to the aggregate realized and unrealized gain (loss) presented in the Statement of Operations due to the timing of subscriptions and redemptions of Fund shares in relation to fluctuations in the market value of the portfolio. |
The accompanying Notes to Financial Statements are an integral part of this statement.
| 24 | Columbia Adaptive Risk Allocation Fund | Annual Report 2022 |
Financial Highlights (continued)
| | Net
asset
value,
end of
period | Total
return | Total gross
expense
ratio to
average
net assets(a) | Total net
expense
ratio to
average
net assets(a),(b) | Net investment
income (loss)
ratio to
average
net assets | Portfolio
turnover | Net
assets,
end of
period
(000’s) |
| Institutional 3 Class |
| Year Ended 5/31/2022 | $9.74 | (3.40%) | 0.72%(c) | 0.72%(c) | 3.13% | 260% | $19,579 |
| Year Ended 5/31/2021 | $12.16 | 19.53% | 0.71%(c) | 0.71%(c) | 0.23% | 227% | $21,369 |
| Year Ended 5/31/2020 | $10.41 | 5.73% | 0.72%(c) | 0.72%(c) | 1.04% | 314% | $14,168 |
| Year Ended 5/31/2019 | $10.59 | 2.67% | 0.71% | 0.71% | 3.02% | 203% | $13,063 |
| Year Ended 5/31/2018 | $10.95 | 7.29% | 0.69% | 0.69% | 0.65% | 210% | $3 |
| Class R |
| Year Ended 5/31/2022 | $9.56 | (3.91%) | 1.25%(c) | 1.25%(c) | 2.69% | 260% | $911 |
| Year Ended 5/31/2021 | $11.97 | 18.82% | 1.25%(c) | 1.25%(c) | (0.31%) | 227% | $528 |
| Year Ended 5/31/2020 | $10.13 | 5.22% | 1.26%(c) | 1.26%(c),(d) | 0.51% | 314% | $363 |
| Year Ended 5/31/2019 | $10.32 | 2.07% | 1.25% | 1.25%(d) | 1.54% | 203% | $424 |
| Year Ended 5/31/2018 | $10.69 | 6.75% | 1.25% | 1.25%(d) | (0.08%) | 210% | $325 |
The accompanying Notes to Financial Statements are an integral part of this statement.
Columbia Adaptive Risk Allocation Fund | Annual Report 2022
| 25 |
Notes to Financial Statements
May 31, 2022
Note 1. Organization
Columbia Adaptive Risk Allocation Fund (the Fund), a series of Columbia Funds Series Trust I (the Trust), is a diversified fund. The Trust is registered under the Investment Company Act of 1940, as amended (the 1940 Act), as an open-end management investment company organized as a Massachusetts business trust.
The Fund invests significantly in shares of affiliated funds managed by Columbia Management Investment Advisers, LLC (the Investment Manager), a wholly-owned subsidiary of Ameriprise Financial, Inc. (Ameriprise Financial), or its affiliates as well as third-party advised (unaffiliated) funds, including exchange-traded funds (collectively, Underlying Funds).
For information on the Underlying Funds, please refer to the Fund’s current prospectus and the prospectuses of the Underlying Funds, which are available, free of charge, from the Securities and Exchange Commission website at www.sec.gov.
Fund shares
The Trust may issue an unlimited number of shares (without par value). The Fund offers each of the share classes listed in the Statement of Assets and Liabilities. Although all share classes generally have identical voting, dividend and liquidation rights, each share class votes separately when required by the Trust’s organizational documents or by law. Each share class has its own expense and sales charge structure. Different share classes may have different minimum initial investment amounts and pay different net investment income distribution amounts to the extent the expenses of distributing such share classes vary. Distributions to shareholders in a liquidation will be proportional to the net asset value of each share class.
As described in the Fund’s prospectus, Class A and Class C shares are offered to the general public for investment. Class C shares automatically convert to Class A shares after 8 years. Advisor Class, Institutional Class, Institutional 2 Class, Institutional 3 Class and Class R shares are available for purchase through authorized investment professionals to omnibus retirement plans or to institutional investors and to certain other investors as also described in the Fund’s prospectus.
Note 2. Summary of significant accounting policies
Basis of preparation
The Fund is an investment company that applies the accounting and reporting guidance in the Financial Accounting Standards Board (FASB) Accounting Standards Codification Topic 946, Financial Services - Investment Companies (ASC 946). The financial statements are prepared in accordance with U.S. generally accepted accounting principles (GAAP), which requires management to make certain estimates and assumptions that affect the reported amounts of assets and liabilities, the disclosure of contingent assets and liabilities at the date of the financial statements and the reported amounts of income and expenses during the reporting period. Actual results could differ from those estimates.
The following is a summary of significant accounting policies followed by the Fund in the preparation of its financial statements.
Security valuation
Equity securities listed on an exchange are valued at the closing price or last trade price on their primary exchange at the close of business of the New York Stock Exchange. Securities with a closing price not readily available or not listed on any exchange are valued at the mean between the closing bid and ask prices. Listed preferred stocks convertible into common stocks are valued using an evaluated price from a pricing service.
Debt securities generally are valued by pricing services approved by the Board of Trustees based upon market transactions for normal, institutional-size trading units of similar securities. The services may use various pricing techniques that take into account, as applicable, factors such as yield, quality, coupon rate, maturity, type of issue, trading characteristics and other data, as well as approved independent broker-dealer quotes. Debt securities for which quotations are not readily available or not believed to be reflective of market value may also be valued based upon a bid quote from an approved independent broker-dealer. Debt securities maturing in 60 days or less are valued primarily at amortized market value, unless this method results in a valuation that management believes does not approximate fair value.
| 26 | Columbia Adaptive Risk Allocation Fund | Annual Report 2022 |
Notes to Financial Statements (continued)
May 31, 2022
Asset- and mortgage-backed securities are generally valued by pricing services, which utilize pricing models that incorporate the securities’ cash flow and loan performance data. These models also take into account available market data, including trades, market quotations, and benchmark yield curves for identical or similar securities. Factors used to identify similar securities may include, but are not limited to, issuer, collateral type, vintage, prepayment speeds, collateral performance, credit ratings, credit enhancement and expected life. Asset-backed securities for which quotations are readily available may also be valued based upon an over-the-counter or exchange bid quote from an approved independent broker-dealer. Debt securities maturing in 60 days or less are valued primarily at amortized market value, unless this method results in a valuation that management believes does not approximate fair value.
Investments in the Underlying Funds (other than exchange-traded funds (ETFs)), are valued at the latest net asset value reported by those companies as of the valuation time.
Forward foreign currency exchange contracts are marked-to-market based upon foreign currency exchange rates provided by a pricing service.
Futures and options on futures contracts are valued based upon the settlement price at the close of regular trading on their principal exchanges or, in the absence of a settlement price, at the mean of the latest quoted bid and ask prices.
Swap transactions are valued through an independent pricing service or broker, or if neither is available, through an internal model based upon observable inputs.
Investments for which market quotations are not readily available, or that have quotations which management believes are not reflective of market value or reliable, are valued at fair value as determined in good faith under procedures approved by and under the general supervision of the Board of Trustees. If a security or class of securities (such as foreign securities) is valued at fair value, such value is likely to be different from the quoted or published price for the security, if available.
The determination of fair value often requires significant judgment. To determine fair value, management may use assumptions including but not limited to future cash flows and estimated risk premiums. Multiple inputs from various sources may be used to determine fair value.
GAAP requires disclosure regarding the inputs and valuation techniques used to measure fair value and any changes in valuation inputs or techniques. In addition, investments shall be disclosed by major category. This information is disclosed following the Fund’s Portfolio of Investments.
Foreign currency transactions and translations
The values of all assets and liabilities denominated in foreign currencies are generally translated into U.S. dollars at exchange rates determined at the close of regular trading on the New York Stock Exchange. Net realized and unrealized gains (losses) on foreign currency transactions and translations include gains (losses) arising from the fluctuation in exchange rates between trade and settlement dates on securities transactions, gains (losses) arising from the disposition of foreign currency and currency gains (losses) between the accrual and payment dates on dividends, interest income and foreign withholding taxes.
For financial statement purposes, the Fund does not distinguish that portion of gains (losses) on investments which is due to changes in foreign exchange rates from that which is due to changes in market prices of the investments. Such fluctuations are included with the net realized and unrealized gains (losses) on investments in the Statement of Operations.
Derivative instruments
The Fund invests in certain derivative instruments, as detailed below, in seeking to meet its investment objectives. Derivatives are instruments whose values depend on, or are derived from, in whole or in part, the value of one or more securities, currencies, commodities, indices, or other assets or instruments. Derivatives may be used to increase investment flexibility (including to maintain cash reserves while maintaining desired exposure to certain assets), for risk management (hedging) purposes, to facilitate trading, to reduce transaction costs and to pursue higher investment returns. The Fund may also use derivative instruments to mitigate certain investment risks, such as foreign currency exchange rate risk, interest rate risk and credit risk. Derivatives may involve various risks, including the potential inability of the counterparty to fulfill its
Columbia Adaptive Risk Allocation Fund | Annual Report 2022
| 27 |
Notes to Financial Statements (continued)
May 31, 2022
obligations under the terms of the contract, the potential for an illiquid secondary market (making it difficult for the Fund to sell or terminate, including at favorable prices) and the potential for market movements which may expose the Fund to gains or losses in excess of the amount shown in the Statement of Assets and Liabilities. The notional amounts of derivative instruments, if applicable, are not recorded in the financial statements.
A derivative instrument may suffer a marked-to-market loss if the value of the contract decreases due to an unfavorable change in the market rates or values of the underlying instrument. Losses can also occur if the counterparty does not perform its obligations under the contract. The Fund’s risk of loss from counterparty credit risk on over-the-counter derivatives is generally limited to the aggregate unrealized gain netted against any collateral held by the Fund and the amount of any variation margin held by the counterparty, plus any replacement costs or related amounts. With exchange-traded or centrally cleared derivatives, there is reduced counterparty credit risk to the Fund since the clearinghouse or central counterparty (CCP) provides some protection in the case of clearing member default. The clearinghouse or CCP stands between the buyer and the seller of the contract; therefore, failure of the clearinghouse or CCP may pose additional counterparty credit risk. However, credit risk still exists in exchange-traded or centrally cleared derivatives with respect to initial and variation margin that is held in a broker’s customer account. While clearing brokers are required to segregate customer margin from their own assets, in the event that a clearing broker becomes insolvent or goes into bankruptcy and at that time there is a shortfall in the aggregate amount of margin held by the clearing broker for all its clients and such shortfall is remedied by the CCP or otherwise, U.S. bankruptcy laws will typically allocate that shortfall on a pro-rata basis across all the clearing broker’s customers (including the Fund), potentially resulting in losses to the Fund.
In order to better define its contractual rights and to secure rights that will help the Fund mitigate its counterparty risk, the Fund may enter into an International Swaps and Derivatives Association, Inc. Master Agreement (ISDA Master Agreement) or similar agreement with its derivatives counterparties. An ISDA Master Agreement is an agreement between the Fund and a counterparty that governs over-the-counter derivatives and foreign exchange forward contracts and contains, among other things, collateral posting terms and netting provisions in the event of a default and/or termination event. Under an ISDA Master Agreement, the Fund may, under certain circumstances, offset with the counterparty certain derivative instruments’ payables and/or receivables with collateral held and/or posted and create one single net payment. The provisions of the ISDA Master Agreement typically permit a single net payment in the event of default (close-out netting), including the bankruptcy or insolvency of the counterparty. Note, however, that bankruptcy or insolvency laws of a particular jurisdiction may impose restrictions on or prohibitions against the right of offset or netting in bankruptcy, insolvency or other events.
Collateral (margin) requirements differ by type of derivative. Margin requirements are established by the clearinghouse or CCP for exchange-traded and centrally cleared derivatives. Brokers can ask for margin in excess of the minimum in certain circumstances. Collateral terms for most over-the-counter derivatives are subject to regulatory requirements to exchange variation margin with trading counterparties and may have contract specific margin terms as well. For over-the-counter derivatives traded under an ISDA Master Agreement, the collateral requirements are typically calculated by netting the marked-to-market amount for each transaction under such agreement and comparing that amount to the value of any variation margin currently pledged by the Fund and/or the counterparty. Generally, the amount of collateral due from or to a party has to exceed a minimum transfer amount threshold (e.g., $250,000) before a transfer has to be made. To the extent amounts due to the Fund from its counterparties are not fully collateralized, contractually or otherwise, the Fund bears the risk of loss from counterparty nonperformance. The Fund may also pay interest expense on cash collateral received from the broker. Any interest expense paid by the Fund is shown in the Statement of Operations. The Fund attempts to mitigate counterparty risk by only entering into agreements with counterparties that it believes have the financial resources to honor their obligations and by monitoring the financial stability of those counterparties.
Certain ISDA Master Agreements allow counterparties of over-the-counter derivatives transactions to terminate derivatives contracts prior to maturity in the event the Fund’s net asset value declines by a stated percentage over a specified time period or if the Fund fails to meet certain terms of the ISDA Master Agreement, which would cause the Fund to accelerate payment of any net liability owed to the counterparty. The Fund also has termination rights if the counterparty fails to meet certain terms of the ISDA Master Agreement. In determining whether to exercise such termination rights, the Fund would consider, in addition to counterparty credit risk, whether termination would result in a net liability owed from the counterparty.
For financial reporting purposes, the Fund does not offset derivative assets and derivative liabilities that are subject to netting arrangements in the Statement of Assets and Liabilities.
| 28 | Columbia Adaptive Risk Allocation Fund | Annual Report 2022 |
Notes to Financial Statements (continued)
May 31, 2022
Forward foreign currency exchange contracts
Forward foreign currency exchange contracts are over-the-counter agreements between two parties to buy and sell a currency at a set price on a future date. The Fund utilized forward foreign currency exchange contracts to hedge the currency exposure associated with some or all of the Fund’s securities, to shift foreign currency exposure back to U.S. dollars, to shift U.S. dollar exposure to achieve a representative weighted mix of major currencies in its benchmark and to generate total return through long and short positions versus the U.S. dollar. These instruments may be used for other purposes in future periods.
The values of forward foreign currency exchange contracts fluctuate daily with changes in foreign currency exchange rates. Changes in the value of these contracts are recorded as unrealized appreciation or depreciation until the contract is exercised or has expired. The Fund will realize a gain or loss when the forward foreign currency exchange contract is closed or expires. Non-deliverable forward foreign currency exchange contracts are settled with the counterparty in U.S. dollars without delivery of foreign currency.
The use of forward foreign currency exchange contracts does not eliminate fluctuations in the prices of the Fund’s portfolio securities. The risks of forward foreign currency exchange contracts include movement in the values of the foreign currencies relative to the U.S. dollar (or other foreign currencies) and the possibility that counterparties will not complete their contractual obligations, which may be in excess of the amount reflected, if any, in the Statement of Assets and Liabilities.
Futures contracts
Futures contracts are exchange-traded and represent commitments for the future purchase or sale of an asset at a specified price on a specified date. The Fund bought and sold futures contracts to manage the duration and yield curve exposure of the Fund versus the benchmark, to manage exposure to movements in interest rates, and to maintain appropriate equity market exposure while keeping sufficient cash to accommodate daily redemptions. These instruments may be used for other purposes in future periods. Upon entering into futures contracts, the Fund bears risks that it may not achieve the anticipated benefits of the futures contracts and may realize a loss. Additional risks include counterparty credit risk, the possibility of an illiquid market, and that a change in the value of the contract or option may not correlate with changes in the value of the underlying asset.
Upon entering into a futures contract, the Fund deposits cash or securities with the broker, known as a futures commission merchant (FCM), in an amount sufficient to meet the initial margin requirement. The initial margin deposit must be maintained at an established level over the life of the contract. Cash deposited as initial margin is recorded in the Statement of Assets and Liabilities as margin deposits. Securities deposited as initial margin are designated in the Portfolio of Investments. Subsequent payments (variation margin) are made or received by the Fund each day. The variation margin payments are equal to the daily change in the contract value and are recorded as variation margin receivable or payable and are offset in unrealized gains or losses. The Fund generally expects to earn interest income on its margin deposits. The Fund recognizes a realized gain or loss when the contract is closed or expires. Futures contracts involve, to varying degrees, risk of loss in excess of the variation margin disclosed in the Statement of Assets and Liabilities.
Swap contracts
Swap contracts are negotiated in the over-the-counter market and may be entered into as a bilateral contract or centrally cleared (centrally cleared swap contract). In a centrally cleared swap contract, immediately following execution of the swap contract with a broker, the swap contract is novated to a central counterparty (the CCP) and the CCP becomes the Fund’s counterparty to the centrally cleared swap contract. The Fund is required to deposit initial margin with the futures commission merchant (FCM), which pledges it through to the CCP in the form of cash or securities in an amount that varies depending on the size and risk profile of the particular swap contract. Securities deposited as initial margin are designated in the Portfolio of Investments and cash deposited is recorded in the Statement of Assets and Liabilities as margin deposits. For a bilateral swap contract, the Fund has credit exposure to the broker, but exchanges daily variation margin with the broker based on the mark-to-market value of the swap contract to minimize that exposure. For centrally cleared swap contracts, the Fund has minimal credit exposure to the FCM because the CCP stands between the Fund and the relevant buyer/seller on the other side of the contract. Swap contracts are marked-to-market daily and changes in value are recorded as unrealized appreciation (depreciation). The daily change in valuation of centrally cleared swap contracts, if any, is recorded as a receivable or payable for variation margin in the Statement of Assets and Liabilities.
Columbia Adaptive Risk Allocation Fund | Annual Report 2022
| 29 |
Notes to Financial Statements (continued)
May 31, 2022
Entering into these contracts involves, to varying degrees, elements of interest, liquidity and counterparty credit risk in excess of the amounts recognized in the Statement of Assets and Liabilities. Such risks involve the possibility that there may be unfavorable changes in interest rates, market conditions or other conditions, that it may be difficult to initiate a swap transaction or liquidate a position at an advantageous time or price which may result in significant losses, and that the FCM or CCP may not fulfill its obligation under the contract.
Credit default swap contracts
The Fund entered into credit default swap contracts to increase or decrease its credit exposure to an index and to manage credit risk exposure. These instruments may be used for other purposes in future periods. Credit default swap contracts are transactions in which one party pays fixed periodic payments to a counterparty in consideration for an agreement from the counterparty to make a specific payment should a specified credit event(s) take place. Although specified credit events are contract specific, credit events are typically bankruptcy, failure to pay, restructuring, obligation acceleration, obligation default, or repudiation/moratorium.
As the purchaser of a credit default swap contract, the Fund purchases protection by paying a periodic interest rate on the notional amount to the counterparty. The interest amount is accrued daily as a component of unrealized appreciation (depreciation) and is recorded as a realized loss upon payment. If a credit event as specified in the contract occurs, the Fund may have the option either to deliver the reference obligation to the seller in exchange for a cash payment of its par amount, or to receive a net cash settlement equal to the par amount less an agreed-upon value of the reference obligation as of the date of the credit event. The difference between the value of the obligation or cash delivered and the notional amount received will be recorded as a realized gain (loss).
As the seller of a credit default swap contract, the Fund sells protection to a buyer and will generally receive a periodic interest rate on a notional amount. The interest amount is accrued daily as a component of unrealized appreciation (depreciation) and is recorded as a realized gain upon receipt of the payment. If a credit event as specified in the contract with the counterparty occurs, the Fund may either be required to accept the reference obligation from the buyer in exchange for a cash payment of its notional amount, or to pay the buyer a net cash settlement equal to the notional amount less an agreed-upon value of the reference obligation (recovery value) as of the date of the credit event. The difference between the value of the obligation or cash received and the notional amount paid will be recorded as a realized gain (loss). The maximum potential amount of undiscounted future payments the Fund could be required to make as the seller of protection under a credit default swap contract is equal to the notional amount of the reference obligation. These potential amounts may be partially offset by any recovery values of the respective reference obligations or upfront receipts upon entering into the agreement. The notional amounts and market values of all credit default swap contracts in which the Fund is the seller of protection, if any, are disclosed in the Credit Default Swap Contracts Outstanding schedule following the Portfolio of Investments.
As a protection seller, the Fund bears the risk of loss from the credit events specified in the contract with the counterparty. For credit default swap contracts on credit indices, quoted market prices and resulting market values serve as an indicator of the current status of the payment/performance risk. Increasing market values, in absolute terms when compared to the notional amount of the swap, represent a deterioration of the reference entity’s credit soundness and a greater likelihood or risk of default or other credit event occurring as defined under the terms of the contract.
Any upfront payment or receipt by the Fund upon entering into a credit default swap contract is recorded as an asset or liability, respectively, and amortized daily as a component of realized gain (loss) in the Statement of Operations. Credit default swap contracts are valued daily, and the change in value is recorded as unrealized appreciation (depreciation) until the termination of the swap, at which time a realized gain (loss) is recorded.
Credit default swap contracts can involve greater risks than if a fund had invested in the reference obligation directly since, in addition to general market risks, credit default swaps are subject to counterparty credit risk, leverage risk, hedging risk, correlation risk and liquidity risk.
| 30 | Columbia Adaptive Risk Allocation Fund | Annual Report 2022 |
Notes to Financial Statements (continued)
May 31, 2022
Interest rate and inflation rate swap contracts
The Fund entered into interest rate swap transactions and/or inflation rate swap contracts to manage interest rate and market risk exposure to produce incremental earnings, to gain exposure to or protect itself from market rate changes and to synthetically add or subtract principal exposure to a market. These instruments may be used for other purposes in future periods. An interest rate swap or inflation rate swap, as applicable, is an agreement between two parties where there are two flows and payments are made between the two counterparties and the payments are dependent upon changes in an interest rate, inflation rate or inflation index calculated on a nominal amount. Interest rate swaps are agreements between two parties that involve the exchange of one type of interest rate for another type of interest rate cash flow on specified dates in the future, based on a predetermined, specified notional amount. Certain interest rate swaps are considered forward-starting, whereby the accrual for the exchange of cash flows does not begin until a specified date in the future. The net cash flow for a standard interest rate swap transaction is generally the difference between a floating market interest rate versus a fixed interest rate.
Interest rate swaps are valued daily and unrealized appreciation (depreciation) is recorded. Certain interest rate swaps may accrue periodic interest on a daily basis as a component of unrealized appreciation (depreciation); the Fund will realize a gain or loss upon the payment or receipt of accrued interest. The Fund will realize a gain or a loss when the interest rate swap is terminated.
Effects of derivative transactions in the financial statements
The following tables are intended to provide additional information about the effect of derivatives on the financial statements of the Fund, including: the fair value of derivatives by risk category and the location of those fair values in the Statement of Assets and Liabilities; and the impact of derivative transactions over the period in the Statement of Operations, including realized and unrealized gains (losses). The derivative instrument schedules following the Portfolio of Investments present additional information regarding derivative instruments outstanding at the end of the period, if any.
The following table is a summary of the fair value of derivative instruments (not considered to be hedging instruments for accounting disclosure purposes) at May 31, 2022:
| | Asset derivatives | |
Risk exposure
category | Statement
of assets and liabilities
location | Fair value ($) |
| Credit risk | Component of total distributable earnings (loss) — unrealized appreciation on swap contracts | 292,750* |
| Equity risk | Component of total distributable earnings (loss) — unrealized appreciation on futures contracts | 67,545* |
| Foreign exchange risk | Unrealized appreciation on forward foreign currency exchange contracts | 5,199,316 |
| Total | | 5,559,611 |
| | Liability derivatives | |
Risk exposure
category | Statement
of assets and liabilities
location | Fair value ($) |
| Credit risk | Component of total distributable earnings (loss) — unrealized depreciation on swap contracts | 4,729,567* |
| Equity risk | Component of total distributable earnings (loss) — unrealized depreciation on futures contracts | 10,443,866* |
| Foreign exchange risk | Unrealized depreciation on forward foreign currency exchange contracts | 3,554,261 |
| Interest rate risk | Component of total distributable earnings (loss) — unrealized depreciation on futures contracts | 29,342,424* |
| Total | | 48,070,118 |
| * | Includes cumulative appreciation (depreciation) as reported in the tables following the Portfolio of Investments. Only the current day’s variation margin is reported in receivables or payables in the Statement of Assets and Liabilities. |
Columbia Adaptive Risk Allocation Fund | Annual Report 2022
| 31 |
Notes to Financial Statements (continued)
May 31, 2022
The following table indicates the effect of derivative instruments (not considered to be hedging instruments for accounting disclosure purposes) in the Statement of Operations for the year ended May 31, 2022:
| Amount of realized gain (loss) on derivatives recognized in income |
| Risk exposure category | Forward
foreign
currency
exchange
contracts
($) | Futures
contracts
($) | Swap
contracts
($) | Total
($) |
| Credit risk | — | — | 1,295,307 | 1,295,307 |
| Equity risk | — | 80,224,178 | ��� | 80,224,178 |
| Foreign exchange risk | 149,563,905 | — | — | 149,563,905 |
| Interest rate risk | — | (40,668,283) | 2,534,710 | (38,133,573) |
| Total | 149,563,905 | 39,555,895 | 3,830,017 | 192,949,817 |
| |
| Change in unrealized appreciation (depreciation) on derivatives recognized in income |
| Risk exposure category | Forward
foreign
currency
exchange
contracts
($) | Futures
contracts
($) | Swap
contracts
($) | Total
($) |
| Credit risk | — | — | (22,653,891) | (22,653,891) |
| Equity risk | — | (94,390,218) | — | (94,390,218) |
| Foreign exchange risk | 12,881,103 | — | — | 12,881,103 |
| Interest rate risk | — | (30,670,107) | — | (30,670,107) |
| Total | 12,881,103 | (125,060,325) | (22,653,891) | (134,833,113) |
The following table is a summary of the average outstanding volume by derivative instrument for the year ended May 31, 2022:
| Derivative instrument | Average notional
amounts ($) |
| Futures contracts — long | 2,262,415,510* |
| Credit default swap contracts — buy protection | 7,275,228** |
| Credit default swap contracts — sell protection | 1,029,964,961* |
| Derivative instrument | Average unrealized
appreciation ($) | Average unrealized
depreciation ($) |
| Forward foreign currency exchange contracts | 7,970,369* | (3,963,308)* |
| Interest rate swap contracts | 376,818** | (40,970)** |
| * | Based on the ending quarterly outstanding amounts for the year ended May 31, 2022. |
| ** | Based on the ending daily outstanding amounts for the year ended May 31, 2022. |
Asset- and mortgage-backed securities
The Fund may invest in asset-backed and mortgage-backed securities. The maturity dates shown represent the original maturity of the underlying obligation. Actual maturity may vary based upon prepayment activity on these obligations. All, or a portion, of the obligation may be prepaid at any time because the underlying asset may be prepaid. As a result, decreasing market interest rates could result in an increased level of prepayment. An increased prepayment rate will have the effect of shortening the maturity of the security. Unless otherwise noted, the coupon rates presented are fixed rates.
| 32 | Columbia Adaptive Risk Allocation Fund | Annual Report 2022 |
Notes to Financial Statements (continued)
May 31, 2022
Delayed delivery securities
The Fund may trade securities on other than normal settlement terms, including securities purchased or sold on a “when-issued” or "forward commitment" basis. This may increase risk to the Fund since the other party to the transaction may fail to deliver, which could cause the Fund to subsequently invest at less advantageous prices. The Fund designates cash or liquid securities in an amount equal to the delayed delivery commitment.
To be announced securities
The Fund may trade securities on a To Be Announced (TBA) basis. As with other delayed-delivery transactions, a seller agrees to issue a TBA security at a future date. However, the seller does not specify the particular securities to be delivered. Instead, the Fund agrees to accept any security that meets specified terms.
In some cases, Master Securities Forward Transaction Agreements (MSFTAs) may be used to govern transactions of certain forward-settling agency mortgage-backed securities, such as delayed-delivery and TBAs, between the Fund and counterparty. The MSFTA maintains provisions for, among other things, initiation and confirmation, payment and transfer, events of default, termination, and maintenance of collateral relating to such transactions.
Treasury inflation protected securities
The Fund may invest in treasury inflation protected securities (TIPS). The principal amount of TIPS is adjusted periodically and is increased for inflation or decreased for deflation based on a monthly published index. These adjustments are recorded as interest income in the Statement of Operations. Coupon payments are based on the adjusted principal at the time the interest is paid.
Offsetting of assets and liabilities
The following table presents the Fund’s gross and net amount of assets and liabilities available for offset under netting arrangements as well as any related collateral received or pledged by the Fund as of May 31, 2022:
| | Citi ($) | Goldman
Sachs
International ($) | HSBC ($) | Morgan
Stanley ($) | Standard
Chartered ($) | UBS ($) | Total ($) |
| Assets | | | | | | | |
| Forward foreign currency exchange contracts | 897,523 | 32,219 | 1,400,790 | - | 80,540 | 2,788,244 | 5,199,316 |
| Liabilities | | | | | | | |
| Centrally cleared credit default swap contracts (a) | - | - | - | 585,075 | - | - | 585,075 |
| Forward foreign currency exchange contracts | 1,982,304 | 345,594 | 542,146 | - | - | 684,217 | 3,554,261 |
| Total liabilities | 1,982,304 | 345,594 | 542,146 | 585,075 | - | 684,217 | 4,139,336 |
| Total financial and derivative net assets | (1,084,781) | (313,375) | 858,644 | (585,075) | 80,540 | 2,104,027 | 1,059,980 |
| Total collateral received (pledged) (b) | - | - | - | (585,075) | - | - | (585,075) |
| Net amount (c) | (1,084,781) | (313,375) | 858,644 | - | 80,540 | 2,104,027 | 1,645,055 |
| (a) | Centrally cleared swaps are included within payable/receivable for variation margin on the Statement of Assets and Liabilities. |
| (b) | In some instances, the actual collateral received and/or pledged may be more than the amount shown due to overcollateralization. |
| (c) | Represents the net amount due from/(to) counterparties in the event of default. |
Security transactions
Security transactions are accounted for on the trade date. Cost is determined and gains (losses) are based upon the specific identification method for both financial statement and federal income tax purposes.
Income recognition
Interest income is recorded on an accrual basis. Market premiums and discounts, including original issue discounts, are amortized and accreted, respectively, over the expected life of the security on all debt securities, unless otherwise noted. The Fund classifies gains and losses realized on prepayments received on mortgage-backed securities as adjustments to interest income.
Columbia Adaptive Risk Allocation Fund | Annual Report 2022
| 33 |
Notes to Financial Statements (continued)
May 31, 2022
The Fund may place a debt security on non-accrual status and reduce related interest income when it becomes probable that the interest will not be collected and the amount of uncollectible interest can be reasonably estimated. A defaulted debt security is removed from non-accrual status when the issuer resumes interest payments or when collectability of interest is reasonably assured.
Corporate actions and dividend income are recorded on the ex-dividend date.
The Fund may receive distributions from holdings in equity securities, business development companies (BDCs), exchange-traded funds (ETFs), limited partnerships (LPs), other regulated investment companies (RICs), and real estate investment trusts (REITs), which report information as to the tax character of their distributions annually. These distributions are allocated to dividend income, capital gain and return of capital based on actual information reported. Return of capital is recorded as a reduction of the cost basis of securities held. If the Fund no longer owns the applicable securities, return of capital is recorded as a realized gain. With respect to REITs, to the extent actual information has not yet been reported, estimates for return of capital are made by Columbia Management Investment Advisers, LLC (the Investment Manager), a wholly-owned subsidiary of Ameriprise Financial, Inc. (Ameriprise Financial). The Investment Manager’s estimates are subsequently adjusted when the actual character of the distributions is disclosed by the REITs, which could result in a proportionate change in return of capital to shareholders.
Awards from class action litigation are recorded as a reduction of cost basis if the Fund still owns the applicable securities on the payment date. If the Fund no longer owns the applicable securities on the payment date, the proceeds are recorded as realized gains.
Income and capital gain distributions from the Underlying Funds, if any, are recorded on the ex-dividend date.
Expenses
General expenses of the Trust are allocated to the Fund and other funds of the Trust based upon relative net assets or other expense allocation methodologies determined by the nature of the expense. Expenses directly attributable to the Fund are charged to the Fund. Expenses directly attributable to a specific class of shares are charged to that share class.
Determination of class net asset value
All income, expenses (other than class-specific expenses, which are charged to that share class, as shown in the Statement of Operations) and realized and unrealized gains (losses) are allocated to each class of the Fund on a daily basis, based on the relative net assets of each class, for purposes of determining the net asset value of each class.
Federal income tax status
The Fund intends to qualify each year as a regulated investment company under Subchapter M of the Internal Revenue Code, as amended, and will distribute substantially all of its investment company taxable income and net capital gain, if any, for its tax year, and as such will not be subject to federal income taxes. In addition, the Fund intends to distribute in each calendar year substantially all of its ordinary income, capital gain net income and certain other amounts, if any, such that the Fund should not be subject to federal excise tax. Therefore, no federal income or excise tax provision is recorded.
Foreign taxes
The Fund may be subject to foreign taxes on income, gains on investments or currency repatriation, a portion of which may be recoverable. The Fund will accrue such taxes and recoveries, as applicable, based upon its current interpretation of tax rules and regulations that exist in the markets in which it invests.
Realized gains in certain countries may be subject to foreign taxes at the Fund level, based on statutory rates. The Fund accrues for such foreign taxes on realized and unrealized gains at the appropriate rate for each jurisdiction, as applicable. The amount, if any, is disclosed as a liability in the Statement of Assets and Liabilities.
| 34 | Columbia Adaptive Risk Allocation Fund | Annual Report 2022 |
Notes to Financial Statements (continued)
May 31, 2022
Distributions to shareholders
Distributions from net investment income, if any, are declared and paid annually. Net realized capital gains, if any, are distributed at least annually. Income distributions and capital gain distributions are determined in accordance with federal income tax regulations, which may differ from GAAP.
Guarantees and indemnifications
Under the Trust’s organizational documents and, in some cases, by contract, its officers and trustees are indemnified against certain liabilities arising out of the performance of their duties to the Trust or its funds. In addition, certain of the Fund’s contracts with its service providers contain general indemnification clauses. The Fund’s maximum exposure under these arrangements is unknown since the amount of any future claims that may be made against the Fund cannot be determined, and the Fund has no historical basis for predicting the likelihood of any such claims.
Note 3. Fees and other transactions with affiliates
Management services fees
The Fund has entered into a Management Agreement with Columbia Management Investment Advisers, LLC (the Investment Manager). Under the Management Agreement, the Investment Manager provides the Fund with investment research and advice, as well as administrative and accounting services. The management services fee is an annual fee that is a blend of (i) a fee that declines from 0.06% to 0.03%, depending on asset levels, on assets invested in affiliated mutual funds, exchange-traded funds and closed-end funds that pay a management fee (or advisory fee, as applicable) to the Investment Manager, (ii) a fee that declines from 0.16% to 0.13%, depending on asset levels, on assets invested in exchange-traded funds and mutual funds that are not managed by the Investment Manager or its affiliates and (iii) a fee that declines from 0.76% to 0.63%, depending on asset levels, on assets invested in securities, instruments and other assets not described above, including affiliated mutual funds, exchange-traded funds and closed-end funds advised by the Investment Manager that do not pay a management fee, third party closed-end funds, derivatives and individual securities. The effective management services fee rate for the year ended May 31, 2022 was 0.67% of the Fund’s average daily net assets.
In addition to the fees and expenses which the Fund bears directly, the Fund indirectly bears a pro rata share of the fees and expenses of the Underlying Funds (also referred to as "acquired funds") in which the Fund invests. Because the Underlying Funds have varied expense and fee levels and the Fund may own different proportions of Underlying Funds at different times, the amount of fees and expenses incurred indirectly by the Fund will vary.
Compensation of board members
Members of the Board of Trustees who are not officers or employees of the Investment Manager or Ameriprise Financial are compensated for their services to the Fund as disclosed in the Statement of Operations. Under a Deferred Compensation Plan (the Deferred Plan), these members of the Board of Trustees may elect to defer payment of up to 100% of their compensation. Deferred amounts are treated as though equivalent dollar amounts had been invested in shares of certain funds managed by the Investment Manager. The Fund’s liability for these amounts is adjusted for market value changes and remains in the Fund until distributed in accordance with the Deferred Plan. All amounts payable under the Deferred Plan constitute a general unsecured obligation of the Fund. The expense for the Deferred Plan, which includes Trustees’ fees deferred during the current period as well as any gains or losses on the Trustees’ deferred compensation balances as a result of market fluctuations, is included in "Compensation of board members" in the Statement of Operations.
Compensation of Chief Compliance Officer
The Board of Trustees has appointed a Chief Compliance Officer for the Fund in accordance with federal securities regulations. As disclosed in the Statement of Operations, a portion of the Chief Compliance Officer’s total compensation is allocated to the Fund, along with other allocations to affiliated registered investment companies managed by the Investment Manager and its affiliates, based on relative net assets.
Columbia Adaptive Risk Allocation Fund | Annual Report 2022
| 35 |
Notes to Financial Statements (continued)
May 31, 2022
Transfer agency fees
Under a Transfer and Dividend Disbursing Agent Agreement, Columbia Management Investment Services Corp. (the Transfer Agent), an affiliate of the Investment Manager and a wholly-owned subsidiary of Ameriprise Financial, is responsible for providing transfer agency services to the Fund. The Transfer Agent has contracted with DST Asset Manager Solutions, Inc. (DST) to serve as sub-transfer agent. The Transfer Agent pays the fees of DST for services as sub-transfer agent and DST is not entitled to reimbursement for such fees from the Fund (with the exception of out-of-pocket fees).
The Fund pays the Transfer Agent a monthly transfer agency fee based on the number or the average value of accounts, depending on the type of account. In addition, the Fund pays the Transfer Agent a fee for shareholder services based on the number of accounts or on a percentage of the average aggregate value of the Fund’s shares maintained in omnibus accounts up to the lesser of the amount charged by the financial intermediary or a cap established by the Board of Trustees from time to time.
The Transfer Agent also receives compensation from the Fund for various shareholder services and reimbursements for certain out-of-pocket fees. Total transfer agency fees for Institutional 2 Class and Institutional 3 Class shares are subject to an annual limitation of not more than 0.07% and 0.02%, respectively, of the average daily net assets attributable to each share class.
For the year ended May 31, 2022, the Fund’s effective transfer agency fee rates as a percentage of average daily net assets of each class were as follows:
| | Effective rate (%) |
| Class A | 0.05 |
| Advisor Class | 0.05 |
| Class C | 0.05 |
| Institutional Class | 0.05 |
| Institutional 2 Class | 0.06 |
| Institutional 3 Class | 0.02 |
| Class R | 0.05 |
An annual minimum account balance fee of $20 may apply to certain accounts with a value below the applicable share class’s initial minimum investment requirements to reduce the impact of small accounts on transfer agency fees. These minimum account balance fees are remitted to the Fund and recorded as part of expense reductions in the Statement of Operations. For the year ended May 31, 2022, no minimum account balance fees were charged by the Fund.
Distribution and service fees
The Fund has entered into an agreement with Columbia Management Investment Distributors, Inc. (the Distributor), an affiliate of the Investment Manager and a wholly-owned subsidiary of Ameriprise Financial, for distribution and shareholder services. The Board of Trustees has approved, and the Fund has adopted, distribution and shareholder service plans (the Plans) applicable to certain share classes, which set the distribution and service fees for the Fund. These fees are calculated daily and are intended to compensate the Distributor and/or eligible selling and/or servicing agents for selling shares of the Fund and providing services to investors.
Under the Plans, the Fund pays a monthly service fee to the Distributor at the maximum annual rate of 0.25% of the average daily net assets attributable to Class A and Class C shares of the Fund. Also under the Plans, the Fund pays a monthly distribution fee to the Distributor at the maximum annual rates of 0.10%, 0.75% and 0.50% of the average daily net assets attributable to Class A, Class C and Class R shares of the Fund, respectively.
Although the Fund may pay distribution and service fees up to a maximum annual rate of 0.35% of the Fund’s average daily net assets attributable to Class A shares (comprised of up to 0.10% for distribution services and up to 0.25% for shareholder services), the Fund currently limits such fees to an aggregate fee of not more than 0.25% of the Fund’s average daily net assets attributable to Class A shares.
| 36 | Columbia Adaptive Risk Allocation Fund | Annual Report 2022 |
Notes to Financial Statements (continued)
May 31, 2022
Sales charges (unaudited)
Sales charges, including front-end charges and contingent deferred sales charges (CDSCs), received by the Distributor for distributing Fund shares for the year ended May 31, 2022, if any, are listed below:
| | Front End (%) | CDSC (%) | Amount ($) |
| Class A | 5.75 | 0.50 - 1.00(a) | 320,150 |
| Class C | — | 1.00(b) | 8,206 |
| (a) | This charge is imposed on certain investments of between $1 million and $50 million redeemed within 18 months after purchase, as follows: 1.00% if redeemed within 12 months after purchase, and 0.50% if redeemed more than 12, but less than 18, months after purchase, with certain limited exceptions. |
| (b) | This charge applies to redemptions within 12 months after purchase, with certain limited exceptions. |
The Fund’s other share classes are not subject to sales charges.
Expenses waived/reimbursed by the Investment Manager and its affiliates
The Investment Manager and certain of its affiliates have contractually agreed to waive fees and/or reimburse expenses (excluding certain fees and expenses described below) for the period(s) disclosed below, unless sooner terminated at the sole discretion of the Board of Trustees, so that the Fund’s net operating expenses, including indirect expenses of the Underlying Funds, after giving effect to fees waived/expenses reimbursed and any balance credits and/or overdraft charges from the Fund’s custodian, do not exceed the following annual rate(s) as a percentage of the classes’ average daily net assets:
| | Fee rate(s) contractual
through
September 30, 2022 |
| Class A | 1.25% |
| Advisor Class | 1.00 |
| Class C | 2.00 |
| Institutional Class | 1.00 |
| Institutional 2 Class | 1.01 |
| Institutional 3 Class | 0.96 |
| Class R | 1.50 |
Under the agreement governing these fee waivers and/or expense reimbursement arrangements, the following fees and expenses are excluded from the waiver/reimbursement commitment, and therefore will be paid by the Fund, if applicable: taxes (including foreign transaction taxes), transaction costs and brokerage commissions, costs related to any securities lending program, dividend expenses associated with securities sold short, inverse floater program fees and expenses, transaction charges and interest on borrowed money, interest, costs associated with shareholder meetings, infrequent and/or unusual expenses and any other expenses the exclusion of which is specifically approved by the Board of Trustees. This agreement may be modified or amended only with approval from the Investment Manager, certain of its affiliates and the Fund. Any fees waived and/or expenses reimbursed under the expense reimbursement arrangements described above are not recoverable by the Investment Manager or its affiliates in future periods.
Note 4. Federal tax information
The timing and character of income and capital gain distributions are determined in accordance with income tax regulations, which may differ from GAAP because of temporary or permanent book to tax differences.
At May 31, 2022, these differences were primarily due to differing treatment for deferral/reversal of wash sale losses, trustees’ deferred compensation, derivative investments, tax straddles, post-October capital losses, re-characterization of distributions for investments, swap investments, principal and/or interest of fixed income securities, foreign capital gains tax, earnings and profits distributed to shareholders on the redemption of shares and foreign currency transactions. To the extent these differences were permanent, reclassifications were made among the components of the Fund’s net assets. Temporary differences do not require reclassifications.
Columbia Adaptive Risk Allocation Fund | Annual Report 2022
| 37 |
Notes to Financial Statements (continued)
May 31, 2022
The following reclassifications were made:
Undistributed net
investment
income ($) | Accumulated
net realized
(loss) ($) | Paid in
capital ($) |
| 135,050,731 | (139,829,475) | 4,778,744 |
Net investment income (loss) and net realized gains (losses), as disclosed in the Statement of Operations, and net assets were not affected by this reclassification.
The tax character of distributions paid during the years indicated was as follows:
| Year Ended May 31, 2022 | Year Ended May 31, 2021 |
Ordinary
income ($) | Long-term
capital gains ($) | Total ($) | Ordinary
income ($) | Long-term
capital gains ($) | Total ($) |
| 455,778,260 | 314,741,876 | 770,520,136 | 58,672,674 | 21,617,920 | 80,290,594 |
Short-term capital gain distributions, if any, are considered ordinary income distributions for tax purposes.
At May 31, 2022, the components of distributable earnings on a tax basis were as follows:
Undistributed
ordinary income ($) | Undistributed
long-term
capital gains ($) | Capital loss
carryforwards ($) | Net unrealized
(depreciation) ($) |
| 59,858,783 | — | — | (264,558,865) |
At May 31, 2022, the cost of all investments for federal income tax purposes along with the aggregate gross unrealized appreciation and depreciation based on that cost was:
Federal
tax cost ($) | Gross unrealized
appreciation ($) | Gross unrealized
(depreciation) ($) | Net unrealized
(depreciation) ($) |
| 4,524,400,145 | 40,104,085 | (304,662,950) | (264,558,865) |
Tax cost of investments and unrealized appreciation/(depreciation) may also include timing differences that do not constitute adjustments to tax basis.
Under current tax rules, regulated investment companies can elect to treat certain late-year ordinary losses incurred and post-October capital losses (capital losses realized after October 31) as arising on the first day of the following taxable year. As of May 31, 2022, the Fund will elect to treat the following late-year ordinary losses and post-October capital losses as arising on June 1, 2022.
Late year
ordinary losses ($) | Post-October
capital losses ($) |
| — | 195,817,778 |
Management of the Fund has concluded that there are no significant uncertain tax positions in the Fund that would require recognition in the financial statements. However, management’s conclusion may be subject to review and adjustment at a later date based on factors including, but not limited to, new tax laws, regulations, and administrative interpretations (including relevant court decisions). Generally, the Fund’s federal tax returns for the prior three fiscal years remain subject to examination by the Internal Revenue Service.
Note 5. Portfolio information
The cost of purchases and proceeds from sales of securities, excluding short-term investments and derivatives, if any, aggregated to $7,829,221,432 and $7,507,501,704, respectively, for the year ended May 31, 2022, of which $5,158,322,703 and $4,695,934,327, respectively, were U.S. government securities. The amount of purchase and sale activity impacts the portfolio turnover rate reported in the Financial Highlights.
| 38 | Columbia Adaptive Risk Allocation Fund | Annual Report 2022 |
Notes to Financial Statements (continued)
May 31, 2022
Note 6. Affiliated money market fund
The Fund invests in Columbia Short-Term Cash Fund, an affiliated money market fund established for the exclusive use by the Fund and other affiliated funds (the Affiliated MMF). The income earned by the Fund from such investments is included as Dividends - affiliated issuers in the Statement of Operations. As an investing fund, the Fund indirectly bears its proportionate share of the expenses of the Affiliated MMF. The Affiliated MMF prices its shares with a floating net asset value. In addition, the Board of Trustees of the Affiliated MMF may impose a fee on redemptions (sometimes referred to as a liquidity fee) or temporarily suspend redemptions (sometimes referred to as imposing a redemption gate) in the event its liquidity falls below regulatory limits.
Note 7. Interfund lending
Pursuant to an exemptive order granted by the Securities and Exchange Commission, the Fund participates in a program (the Interfund Program) allowing each participating Columbia Fund (each, a Participating Fund) to lend money directly to and, except for closed-end funds and money market funds, borrow money directly from other Participating Funds for temporary purposes. The amounts eligible for borrowing and lending under the Interfund Program are subject to certain restrictions.
Interfund loans are subject to the risk that the borrowing fund could be unable to repay the loan when due, and a delay in repayment to the lending fund could result in lost opportunities and/or additional lending costs. The exemptive order is subject to conditions intended to mitigate conflicts of interest arising from the Investment Manager’s relationship with each Participating Fund.
The Fund did not borrow or lend money under the Interfund Program during the year ended May 31, 2022.
Note 8. Line of credit
The Fund has access to a revolving credit facility with a syndicate of banks led by JPMorgan Chase Bank, N.A., Citibank, N.A. and Wells Fargo Bank, N.A. whereby the Fund may borrow for the temporary funding of shareholder redemptions or for other temporary or emergency purposes. Pursuant to an October 28, 2021 amendment and restatement, the credit facility, which is an agreement between the Fund and certain other funds managed by the Investment Manager or an affiliated investment manager, severally and not jointly, permits aggregate borrowings up to $950 million. Interest is currently charged to each participating fund based on its borrowings at a rate equal to the higher of (i) the federal funds effective rate, (ii) the secured overnight financing rate plus 0.11448% and (iii) the overnight bank funding rate, plus in each case, 1.00%. Each borrowing under the credit facility matures no later than 60 days after the date of borrowing. The Fund also pays a commitment fee equal to its pro rata share of the unused amount of the credit facility at a rate of 0.15% per annum. The commitment fee is included in other expenses in the Statement of Operations. This agreement expires annually in October unless extended or renewed. Prior to the October 28, 2021 amendment and restatement, the Fund had access to a revolving credit facility with a syndicate of banks led by JPMorgan Chase Bank, N.A., Citibank, N.A. and Wells Fargo Bank, N.A. which permitted collective borrowings up to $950 million. Interest was charged to each participating fund based on its borrowings at a rate equal to the higher of (i) the federal funds effective rate, (ii) the one-month London Interbank Offered Rate (LIBOR) rate and (iii) the overnight bank funding rate, plus in each case, 1.25%.
The Fund had no borrowings during the year ended May 31, 2022.
Note 9. Significant risks
Credit risk
Credit risk is the risk that the value of debt instruments in the Fund’s portfolio may decline because the issuer defaults or otherwise becomes unable or unwilling, or is perceived to be unable or unwilling, to honor its financial obligations, such as making payments to the Fund when due. Credit rating agencies assign credit ratings to certain debt instruments to indicate their credit risk. Lower-rated or unrated debt instruments held by the Fund may present increased credit risk as compared to higher-rated debt instruments.
Columbia Adaptive Risk Allocation Fund | Annual Report 2022
| 39 |
Notes to Financial Statements (continued)
May 31, 2022
Derivatives risk
Losses involving derivative instruments may be substantial, because a relatively small movement in the underlying reference (which is generally the price, rate or other economic indicator associated with a security(ies), commodity, currency, index or other instrument or asset) may result in a substantial loss for the Fund. In addition to the potential for increased losses, the use of derivative instruments may lead to increased volatility within the Fund. Derivatives will typically increase the Fund’s exposure to principal risks to which it is otherwise exposed, and may expose the Fund to additional risks, including correlation risk, counterparty risk, hedging risk, leverage risk, liquidity risk and pricing risk.
Foreign currency risk
The performance of the Fund may be materially affected positively or negatively by foreign currency strength or weakness relative to the U.S. dollar, particularly if the Fund invests a significant percentage of its assets in foreign securities or other assets denominated in currencies other than the U.S. dollar. Currency rates in foreign countries may fluctuate significantly over short or long periods of time for a number of reasons, including changes in interest rates, imposition of currency controls and economic or political developments in the U.S. or abroad. The Fund may also incur currency conversion costs when converting foreign currencies into U.S. dollars and vice versa.
Foreign securities and emerging market countries risk
Investing in foreign securities may involve certain risks not typically associated with investing in U.S. securities, such as increased currency volatility and risks associated with political, regulatory, economic, social, diplomatic and other conditions or events occurring in the country or region, which may result in significant market volatility. In addition, certain foreign securities may not be as liquid as U.S. securities. Investing in emerging markets may increase these risks and expose the Fund to elevated risks associated with increased inflation, deflation or currency devaluation. To the extent that the Fund concentrates its investment exposure to any one or a few specific countries, the Fund will be particularly susceptible to the risks associated with the conditions, events or other factors impacting those countries or regions and may, therefore, have a greater risk than that of a fund that is more geographically diversified.
Geographic focus risk
The Fund may be particularly susceptible to risks related to economic, political, regulatory or other events or conditions affecting issuers and countries within the specific geographic regions in which the Fund invests. The Fund’s net asset value may be more volatile than the net asset value of a more geographically diversified fund.
Europe. The Fund is particularly susceptible to risks related to economic, political, regulatory or other events or conditions, including acts of war or other conflicts in the region, affecting issuers and countries in Europe. Countries in Europe are often closely connected and interdependent, and events in one European country can have an adverse impact on, and potentially spread to, other European countries. In addition, significant private and public sectors’ debt problems of a single European Union (EU) country can pose economic risks to the EU as a whole. As a result, the Fund’s net asset value may be more volatile than the net asset value of a more geographically diversified fund. If securities of issuers in Europe fall out of favor, it may cause the Fund to underperform other funds that do not focus their investments in this region of the world. The departure of the United Kingdom (UK) from the EU single market became effective January 1, 2021 with the end of the Brexit transition period and the post-Brexit trade deal between the UK and EU taking effect on December 31, 2020. The impact of Brexit on the UK and European economies and the broader global economy could be significant, resulting in negative impacts on currency and financial markets generally, such as increased volatility and illiquidity, and potentially lower economic growth in markets in Europe, which may adversely affect the value of your investment in the Fund.
Interest rate risk
Interest rate risk is the risk of losses attributable to changes in interest rates. In general, if prevailing interest rates rise, the values of debt instruments tend to fall, and if interest rates fall, the values of debt instruments tend to rise. Actions by governments and central banking authorities can result in increases or decreases in interest rates. Higher periods of inflation could lead such authorities to raise interest rates. Increasing interest rates may negatively affect the value of debt securities held by the Fund, resulting in a negative impact on the Fund’s performance and net asset value per share. In general, the longer the maturity or duration of a debt security, the greater its sensitivity to changes in interest rates. The Fund is subject to the risk that the income generated by its investments may not keep pace with inflation.
| 40 | Columbia Adaptive Risk Allocation Fund | Annual Report 2022 |
Notes to Financial Statements (continued)
May 31, 2022
Liquidity risk
Liquidity risk is the risk associated with a lack of marketability of investments which may make it difficult to sell the investment at a desirable time or price. Changing regulatory, market or other conditions or environments (for example, the interest rate or credit environments) may adversely affect the liquidity of the Fund’s investments. The Fund may have to accept a lower selling price for the holding, sell other investments, or forego another, more appealing investment opportunity. Generally, the less liquid the market at the time the Fund sells a portfolio investment, the greater the risk of loss or decline of value to the Fund. A less liquid market can lead to an increase in Fund redemptions, which may negatively impact Fund performance and net asset value per share, including, for example, if the Fund is forced to sell securities in a down market.
Market risk
The Fund may incur losses due to declines in the value of one or more securities in which it invests. These declines may be due to factors affecting a particular issuer, or the result of, among other things, political, regulatory, market, economic or social developments affecting the relevant market(s) more generally. In addition, turbulence in financial markets and reduced liquidity in equity, credit and/or fixed income markets may negatively affect many issuers, which could adversely affect the Fund’s ability to price or value hard-to-value assets in thinly traded and closed markets and could cause significant redemptions and operational challenges. Global economies and financial markets are increasingly interconnected, and conditions and events in one country, region or financial market may adversely impact issuers in a different country, region or financial market. These risks may be magnified if certain events or developments adversely interrupt the global supply chain; in these and other circumstances, such risks might affect companies worldwide. As a result, local, regional or global events such as terrorism, war, natural disasters, disease/virus outbreaks and epidemics or other public health issues, recessions, depressions or other events – or the potential for such events – could have a significant negative impact on global economic and market conditions.
The large-scale invasion of Ukraine by Russia in February 2022 has resulted in sanctions and market disruptions, including declines in regional and global stock, unusual volatility in global commodity markets and significant devaluations of Russian currency. The extent and duration of the military action are impossible to predict but could be significant. Market disruption caused by the Russian military action, and any counter measures or responses thereto (including international sanctions, a downgrade in the country’s credit rating, purchasing and financing restrictions, boycotts, tariffs, changes in consumer or purchaser preferences, cyberattacks and espionage) could have severe adverse impacts on regional and/or global securities and commodities markets, including markets for oil and natural gas. These impacts may include reduced market liquidity, distress in credit markets, further disruption of global supply chains, increased risk of inflation, and limited access to investments in certain international markets and/or issuers. These developments and other related events could negatively impact Fund performance.
The pandemic caused by coronavirus disease 2019 and its variants (COVID-19) has resulted in, and may continue to result in, significant global economic and societal disruption and market volatility due to disruptions in market access, resource availability, facilities operations, imposition of tariffs, export controls and supply chain disruption, among others. Such disruptions may be caused, or exacerbated by, quarantines and travel restrictions, workforce displacement and loss in human and other resources. The uncertainty surrounding the magnitude, duration, reach, costs and effects of the global pandemic, as well as actions that have been or could be taken by governmental authorities or other third parties, present unknowns that are yet to unfold. The impacts, as well as the uncertainty over impacts to come, of COVID-19 – and any other infectious illness outbreaks, epidemics and pandemics that may arise in the future – could negatively affect global economies and markets in ways that cannot necessarily be foreseen. In addition, the impact of infectious illness outbreaks and epidemics in emerging market countries may be greater due to generally less established healthcare systems, governments and financial markets. Public health crises caused by the COVID-19 outbreak may exacerbate other pre-existing political, social and economic risks in certain countries or globally. The disruptions caused by COVID-19 could prevent the Fund from executing advantageous investment decisions in a timely manner and negatively impact the Fund’s ability to achieve its investment objective. Any such events could have a significant adverse impact on the value and risk profile of the Fund.
Columbia Adaptive Risk Allocation Fund | Annual Report 2022
| 41 |
Notes to Financial Statements (continued)
May 31, 2022
Money market fund investment risk
An investment in a money market fund is not a bank deposit and is not insured or guaranteed by any bank, the FDIC or any other government agency. Certain money market funds float their net asset value while others seek to preserve the value of investments at a stable net asset value (typically, $1.00 per share). An investment in a money market fund, even an investment in a fund seeking to maintain a stable net asset value per share, is not guaranteed and it is possible for the Fund to lose money by investing in these and other types of money market funds. If the liquidity of a money market fund’s portfolio deteriorates below certain levels, the money market fund may suspend redemptions (i.e., impose a redemption gate) and thereby prevent the Fund from selling its investment in the money market fund or impose a fee of up to 2% on amounts the Fund redeems from the money market fund (i.e., impose a liquidity fee). These measures may result in an investment loss or prohibit the Fund from redeeming shares when the Investment Manager would otherwise redeem shares. In addition to the fees and expenses that the Fund directly bears, the Fund indirectly bears the fees and expenses of any money market funds in which it invests, including affiliated money market funds. By investing in a money market fund, the Fund will be exposed to the investment risks of the money market fund in direct proportion to such investment. To the extent the Fund invests in instruments such as derivatives, the Fund may hold investments, which may be significant, in money market fund shares to cover its obligations resulting from the Fund’s investments in such instruments. Money market funds and the securities they invest in are subject to comprehensive regulations. The enactment of new legislation or regulations, as well as changes in interpretation and enforcement of current laws, may affect the manner of operation, performance and/or yield of money market funds.
Shareholder concentration risk
At May 31, 2022, affiliated shareholders of record owned 83.3% of the outstanding shares of the Fund in one or more accounts. Subscription and redemption activity by concentrated accounts may have a significant effect on the operations of the Fund. In the case of a large redemption, the Fund may be forced to sell investments at inopportune times, including its liquid positions, which may result in Fund losses and the Fund holding a higher percentage of less liquid positions. Large redemptions could result in decreased economies of scale and increased operating expenses for non-redeeming Fund shareholders.
Note 10. Subsequent events
Management has evaluated the events and transactions that have occurred through the date the financial statements were issued and noted no items requiring adjustment of the financial statements or additional disclosure.
Note 11. Information regarding pending and settled legal proceedings
Ameriprise Financial and certain of its affiliates are involved in the normal course of business in legal proceedings which include regulatory inquiries, arbitration and litigation, including class actions concerning matters arising in connection with the conduct of its activities as a diversified financial services firm. Ameriprise Financial believes that the Fund is not currently the subject of, and that neither Ameriprise Financial nor any of its affiliates are the subject of, any pending legal, arbitration or regulatory proceedings that are likely to have a material adverse effect on the Fund or the ability of Ameriprise Financial or its affiliates to perform under their contracts with the Fund. Ameriprise Financial is required to make quarterly (10-Q), annual (10-K) and, as necessary, 8-K filings with the Securities and Exchange Commission (SEC) on legal and regulatory matters that relate to Ameriprise Financial and its affiliates. Copies of these filings may be obtained by accessing the SEC website at www.sec.gov.
There can be no assurance that these matters, or the adverse publicity associated with them, will not result in increased Fund redemptions, reduced sale of Fund shares or other adverse consequences to the Fund. Further, although we believe proceedings are not likely to have a material adverse effect on the Fund or the ability of Ameriprise Financial or its affiliates to perform under their contracts with the Fund, these proceedings are subject to uncertainties and, as such, we are unable to estimate the possible loss or range of loss that may result. An adverse outcome in one or more of these proceedings could result in adverse judgments, settlements, fines, penalties or other relief that could have a material adverse effect on the consolidated financial condition or results of operations of Ameriprise Financial or one or more of its affiliates that provides services to the Fund.
| 42 | Columbia Adaptive Risk Allocation Fund | Annual Report 2022 |
Report of Independent Registered Public Accounting Firm
To the Board of Trustees of Columbia Funds Series Trust I and Shareholders of Columbia Adaptive Risk Allocation Fund
Opinion on the Financial Statements
We have audited the accompanying statement of assets and liabilities, including the portfolio of investments, of Columbia Adaptive Risk Allocation Fund (one of the funds constituting Columbia Funds Series Trust I, referred to hereafter as the "Fund") as of May 31, 2022, the related statement of operations for the year ended May 31, 2022, the statement of changes in net assets for each of the two years in the period ended May 31, 2022, including the related notes, and the financial highlights for each of the five years in the period ended May 31, 2022 (collectively referred to as the "financial statements"). In our opinion, the financial statements present fairly, in all material respects, the financial position of the Fund as of May 31, 2022, the results of its operations for the year then ended, the changes in its net assets for each of the two years in the period ended May 31, 2022 and the financial highlights for each of the five years in the period ended May 31, 2022 in conformity with accounting principles generally accepted in the United States of America.
Basis for Opinion
These financial statements are the responsibility of the Fund’s management. Our responsibility is to express an opinion on the Fund’s financial statements based on our audits. We are a public accounting firm registered with the Public Company Accounting Oversight Board (United States) (PCAOB) and are required to be independent with respect to the Fund in accordance with the U.S. federal securities laws and the applicable rules and regulations of the Securities and Exchange Commission and the PCAOB.
We conducted our audits of these financial statements in accordance with the standards of the PCAOB. Those standards require that we plan and perform the audit to obtain reasonable assurance about whether the financial statements are free of material misstatement, whether due to error or fraud.
Our audits included performing procedures to assess the risks of material misstatement of the financial statements, whether due to error or fraud, and performing procedures that respond to those risks. Such procedures included examining, on a test basis, evidence regarding the amounts and disclosures in the financial statements. Our audits also included evaluating the accounting principles used and significant estimates made by management, as well as evaluating the overall presentation of the financial statements. Our procedures included confirmation of securities owned as of May 31, 2022 by correspondence with the custodian, transfer agent and brokers; when replies were not received from brokers, we performed other auditing procedures. We believe that our audits provide a reasonable basis for our opinion.
/s/PricewaterhouseCoopers LLP
Minneapolis, Minnesota
July 21, 2022
We have served as the auditor of one or more investment companies within the Columbia Funds Complex since 1977.
Columbia Adaptive Risk Allocation Fund | Annual Report 2022
| 43 |
Federal Income Tax Information
(Unaudited)
The Fund hereby designates the following tax attributes for the fiscal year ended May 31, 2022. Shareholders will be notified in early 2023 of the amounts for use in preparing 2022 income tax returns.
Section
199A
dividends | Capital
gain
dividend |
| 1.06% | $124,271,789 |
Section 199A dividends. For taxable, non-corporate shareholders, the percentage of ordinary income distributed during the fiscal year that represents Section 199A dividends potentially eligible for a 20% deduction.
Capital gain dividend. The Fund designates as a capital gain dividend the amount reflected above, or if subsequently determined to be different, the net capital gain of such fiscal period.
TRUSTEES AND OFFICERS
(Unaudited)
The Board oversees the Fund’s operations and appoints officers who are responsible for day-to-day business decisions based on policies set by the Board. The following table provides basic biographical information about the Fund’s Trustees as of the printing of this report, including their principal occupations during the past five years, although specific titles for individuals may have varied over the period. The year set forth beneath Length of Service in the table below is the year in which the Trustee was first appointed or elected as Trustee to any Fund currently in the Columbia Funds Complex or a predecessor thereof. Under current Board policy, each Trustee generally serves until December 31 of the year such Trustee turns seventy-five (75).
Independent trustees
Name,
address,
year of birth | Position held
with the Columbia Funds and
length of service | Principal occupation(s)
during past five years
and other relevant
professional experience | Number of
Funds in the
Columbia Funds
Complex*
overseen | Other directorships
held by Trustee
during the past
five years |
George S. Batejan
c/o Columbia Management
Investment Advisers, LLC
290 Congress Street
Boston, MA 02210
1953 | Trustee since 2017 | Executive Vice President, Global Head of Technology and Operations, Janus Capital Group, Inc., 2010-2016 | 176 | Former Chairman of the Board, NICSA (National Investment Company Services Association) (Executive Committee, Nominating Committee and Governance Committee), 2014-2016; former Director, Intech Investment Management, 2011-2016; former Board Member, Metro Denver Chamber of Commerce, 2015-2016; former Advisory Board Member, University of Colorado Business School, 2015-2018 |
| 44 | Columbia Adaptive Risk Allocation Fund | Annual Report 2022 |
TRUSTEES AND OFFICERS (continued)
(Unaudited)
Independent trustees (continued)
Name,
address,
year of birth | Position held
with the Columbia Funds and
length of service | Principal occupation(s)
during past five years
and other relevant
professional experience | Number of
Funds in the
Columbia Funds
Complex*
overseen | Other directorships
held by Trustee
during the past
five years |
Kathleen Blatz
c/o Columbia Management
Investment Advisers, LLC
290 Congress Street
Boston, MA 02210
1954 | Trustee since 2006 | Attorney, specializing in arbitration and mediation; Chief Justice, Minnesota Supreme Court, 1998-2006; Associate Justice, Minnesota Supreme Court, 1996-1998; Fourth Judicial District Court Judge, Hennepin County, 1994-1996; Attorney in private practice and public service, 1984-1993; State Representative, Minnesota House of Representatives, 1979-1993, which included service on the Tax and Financial Institutions and Insurance Committees; Member and Interim Chair, Minnesota Sports Facilities Authority, January 2017-July 2017; Interim President and Chief Executive Officer, Blue Cross and Blue Shield of Minnesota (health care insurance), February-July 2018, April-October 2021 | 176 | Former Trustee, Blue Cross and Blue Shield of Minnesota, 2009-2021 (Chair of the Business Development Committee, 2014-2017; Chair of the Governance Committee, 2017-2019); former Member and Chair of the Board, Minnesota Sports Facilities Authority, January 2017-July 2017; former Director, Robina Foundation, 2009-2020 (Chair, 2014-2020); Director, Schulze Family Foundation, since 2021 |
Pamela G. Carlton
c/o Columbia Management
Investment Advisers, LLC
290 Congress Street
Boston, MA 02210
1954 | Trustee since 2007 | President, Springboard — Partners in Cross Cultural Leadership (consulting company) since 2003; Managing Director of US Equity Research, JP Morgan Chase, 1999-2003; Director of US Equity Research, Chase Asset Management, 1996-1999; Co-Director Latin America Research, 1993-1996, COO Global Research, 1992-1996, Co-Director of US Research, 1991-1992, Investment Banker, 1982-1991, Morgan Stanley; Attorney, Cleary Gottlieb Steen & Hamilton LLP, 1980-1982 | 176 | Trustee, New York Presbyterian Hospital Board (Executive Committee and Chair of People Committee) since 1996; Director, DR Bank (Audit Committee) since 2017; Director, Evercore Inc. (Audit Committee) since 2019; Director, Apollo Commercial Real Estate Finance, Inc. since 2021; the Governing Council of the Independent Directors Council (IDC), since 2021 |
Janet Langford Carrig
c/o Columbia Management
Investment Advisers, LLC
290 Congress Street
Boston, MA 02210
1957 | Trustee since 1996 | Senior Vice President, General Counsel and Corporate Secretary, ConocoPhillips (independent energy company), September 2007-October 2018 | 174 | Director, EQT Corporation (natural gas producer) since 2019 |
J. Kevin Connaughton
c/o Columbia Management
Investment Advisers, LLC
290 Congress Street
Boston, MA 02210
1964 | Trustee since 2020 | Member, FINRA National Adjudicatory Council since January 2020; Adjunct Professor of Finance, Bentley University since January 2018; Consultant to Independent Trustees of CFVIT and CFST I from March 2016 to June 2020 with respect to CFVIT and to December 2020 with respect to CFST I; Managing Director and General Manager of Mutual Fund Products, Columbia Management Investment Advisers, LLC, May 2010-February 2015; President, Columbia Funds, 2008-2015; and senior officer of Columbia Funds and affiliated funds, 2003-2015 | 174 | Former Director, The Autism Project, March 2015-December 2021; former Member of the Investment Committee, St. Michael’s College, November 2015-February 2020; former Trustee, St. Michael’s College, June 2017-September 2019; former Trustee, New Century Portfolios, January 2015-December 2017 |
Columbia Adaptive Risk Allocation Fund | Annual Report 2022
| 45 |
TRUSTEES AND OFFICERS (continued)
(Unaudited)
Independent trustees (continued)
Name,
address,
year of birth | Position held
with the Columbia Funds and
length of service | Principal occupation(s)
during past five years
and other relevant
professional experience | Number of
Funds in the
Columbia Funds
Complex*
overseen | Other directorships
held by Trustee
during the past
five years |
Olive M. Darragh
c/o Columbia Management
Investment Advisers, LLC
290 Congress Street
Boston, MA 02210
1962 | Trustee since 2020 | Managing Director of Darragh Inc. (strategy and talent management consulting firm) since 2010; Founder and CEO, Zolio, Inc. (investment management talent identification platform) since 2004; Consultant to Independent Trustees of CFVIT and CFST I from June 2019 to June 2020 with respect to CFVIT and to December 2020 with respect to CFST I; Partner, Tudor Investments, 2004-2010; Senior Partner, McKinsey & Company (consulting), 1990-2004; Touche Ross CPA, 1985-1988 | 174 | Former Director, University of Edinburgh Business School (Member of US Board); former Director, Boston Public Library Foundation |
Patricia M. Flynn
c/o Columbia Management
Investment Advisers, LLC
290 Congress Street
Boston, MA 02210
1950 | Trustee since 2004 | Trustee Professor of Economics and Management, Bentley University since 1976 (also teaches and conducts research on corporate governance); Dean, McCallum Graduate School of Business, Bentley University, 1992-2002 | 176 | Trustee, MA Taxpayers Foundation since 1997; former Board of Governors, Innovation Institute, MA Technology Collaborative, 2010-2020; former Board of Directors, The MA Business Roundtable, 2003-2019 |
Brian J. Gallagher
c/o Columbia Management
Investment Advisers, LLC
290 Congress Street
Boston, MA 02210
1954 | Trustee since 2017 | Retired; Partner with Deloitte & Touche LLP and its predecessors, 1977-2016 | 176 | Trustee, Catholic Schools Foundation since 2004 |
Douglas A. Hacker
c/o Columbia Management
Investment Advisers, LLC
290 Congress Street
Boston, MA 02210
1955 | Co-Chair since 2021; Chair of CFST I and CFVIT since 2014; Trustee of CFST I and CFVIT since 1996 and CFST, CFST II, CFVST II, CET I and CET II since 2021 | Independent business executive since May 2006; Executive Vice President – Strategy of United Airlines, December 2002 - May 2006; President of UAL Loyalty Services (airline marketing company), September 2001-December 2002; Executive Vice President and Chief Financial Officer of United Airlines, July 1999-September 2001 | 176 | Director, Spartan Nash Company (food distributor); Director, Aircastle Limited (Chair of Audit Committee) (aircraft leasing); former Director, Nash Finch Company (food distributor), 2005-2013; former Director, SeaCube Container Leasing Ltd. (container leasing), 2010-2013; and former Director, Travelport Worldwide Limited (travel information technology), 2014-2019 |
Nancy T. Lukitsh
c/o Columbia Management
Investment Advisers, LLC
290 Congress Street
Boston, MA 02210
1956 | Trustee since 2011 | Senior Vice President, Partner and Director of Marketing, Wellington Management Company, LLP (investment adviser), 1997-2010; Chair, Wellington Management Portfolios (commingled non-U.S. investment pools), 2007 -2010; Director, Wellington Trust Company, NA and other Wellington affiliates, 1997-2010 | 174 | None |
| 46 | Columbia Adaptive Risk Allocation Fund | Annual Report 2022 |
TRUSTEES AND OFFICERS (continued)
(Unaudited)
Independent trustees (continued)
Name,
address,
year of birth | Position held
with the Columbia Funds and
length of service | Principal occupation(s)
during past five years
and other relevant
professional experience | Number of
Funds in the
Columbia Funds
Complex*
overseen | Other directorships
held by Trustee
during the past
five years |
David M. Moffett
c/o Columbia Management
Investment Advisers, LLC
290 Congress Street
Boston, MA 02210
1952 | Trustee since 2011 | Retired; Consultant to Bridgewater and Associates | 174 | Director, CSX Corporation (transportation suppliers); Director, Genworth Financial, Inc. (financial and insurance products and services); Director, PayPal Holdings Inc. (payment and data processing services); Trustee, University of Oklahoma Foundation; former Director, eBay Inc. (online trading community), 2007-2015; and former Director, CIT Bank, CIT Group Inc. (commercial and consumer finance), 2010-2016 |
Catherine James Paglia
c/o Columbia Management
Investment Advisers, LLC
290 Congress Street
Boston, MA 02210
1952 | Co-Chair since 2021; Chair of CFST, CFST II, CFVST II, CET I and CET II since 2020; Trustee of CFST, CFST II and CFVST II since 2004 and CFST I and CFVIT since 2021 | Director, Enterprise Asset Management, Inc. (private real estate and asset management company) since September 1998; Managing Director and Partner, Interlaken Capital, Inc., 1989-1997; Vice President, 1982-1985, Principal, 1985-1987, Managing Director, 1987-1989, Morgan Stanley; Vice President, Investment Banking, 1980-1982, Associate, Investment Banking, 1976-1980, Dean Witter Reynolds, Inc. | 176 | Director, Valmont Industries, Inc. (irrigation systems manufacturer) since 2012; Trustee, Carleton College (on the Investment Committee); Trustee, Carnegie Endowment for International Peace (on the Investment Committee) |
Minor M. Shaw
c/o Columbia Management
Investment Advisers, LLC
290 Congress Street
Boston, MA 02210
1947 | Trustee since 2003 | President, Micco LLC (private investments) since 2011; President, Micco Corp. (family investment business), 1998-2011 | 176 | Director, Blue Cross Blue Shield of South Carolina (Chair of Compensation Committee) since April 2008; Trustee, Hollingsworth Funds (on the Investment Committee) since 2016 (previously Board Chair from 2016-2019); Former Advisory Board member, Duke Energy Corp., 2016-2020; Chair of the Duke Endowment; Chair of Greenville – Spartanburg Airport Commission; former Trustee, BofA Funds Series Trust (11 funds), 2003-2011; former Director, Piedmont Natural Gas, 2004-2016; former Director, National Association of Corporate Directors, Carolinas Chapter, 2013-2018; Chair, Daniel-Mickel Foundation since 1998 |
Columbia Adaptive Risk Allocation Fund | Annual Report 2022
| 47 |
TRUSTEES AND OFFICERS (continued)
(Unaudited)
Independent trustees (continued)
Name,
address,
year of birth | Position held
with the Columbia Funds and
length of service | Principal occupation(s)
during past five years
and other relevant
professional experience | Number of
Funds in the
Columbia Funds
Complex*
overseen | Other directorships
held by Trustee
during the past
five years |
Natalie A. Trunow
c/o Columbia Management
Investment Advisers, LLC
290 Congress Street
Boston, MA 02210
1967 | Trustee since 2020 | Chief Executive Officer, Millennial Portfolio Solutions LLC (asset management and consulting services), January 2016-January 2021; Non-executive Member of the Investment Committee and Valuation Committee, Sarona Asset Management Inc. (private equity firm) since September 2019; Advisor, Horizon Investments (asset management and consulting services), August 2018-January 2021; Advisor, Paradigm Asset Management, November 2016-December 2021; Consultant to Independent Trustees of CFVIT and CFST I from September 2016 to June 2020 with respect to CFVIT and to December 2020 with respect to CFST I; Director of Investments/Consultant, Casey Family Programs, April 2016-November 2016; Senior Vice President and Chief Investment Officer, Calvert Investments, August 2008-January 2016; Section Head and Portfolio Manager, General Motors Asset Management, June 1997-August 2008 | 174 | Former Director, Investment Committee, Health Services for Children with Special Needs, Inc., 2012-2019; Director, Chair of Audit Committee, Consumer Credit Counseling Services (formerly Guidewell Financial Solutions), since 2019; Independent Director, Investment Committee and Valuation Committee, Sarona Asset Management, since 2019 |
Sandra L. Yeager
c/o Columbia Management
Investment Advisers, LLC
290 Congress Street
Boston, MA 02210
1964 | Trustee since 2017 | Retired; President and founder, Hanoverian Capital, LLC (SEC registered investment advisor firm), 2008-2016; Managing Director, DuPont Capital, 2006-2008; Managing Director, Morgan Stanley Investment Management, 2004-2006; Senior Vice President, Alliance Bernstein, 1990-2004 | 176 | Former Director, NAPE Education Foundation, October 2016-October 2020 |
| * | The term “Columbia Funds Complex” as used herein includes Columbia Seligman Premium Technology Growth Fund, Tri-Continental Corporation and each series of Columbia Fund Series Trust (CFST), Columbia Funds Series Trust I (CFST I), Columbia Funds Series Trust II (CFST II), Columbia ETF Trust I (CET I), Columbia ETF Trust II (CET II), Columbia Funds Variable Insurance Trust (CFVIT) and Columbia Funds Variable Series Trust II (CFVST II). Messrs. Batejan, Beckman, Gallagher and Hacker and Mses. Blatz, Carlton, Flynn, Paglia, Shaw and Yeager serve as Directors of Columbia Seligman Premium Technology Growth Fund and Tri-Continental Corporation. |
Interested trustee affiliated with Investment Manager*
Name,
address,
year of birth | Position held with the Columbia Funds and length of service | Principal occupation(s) during the
past five years and other relevant
professional experience | Number of
Funds in the
Columbia Funds
Complex overseen | Other directorships
held by Trustee
during the past
five years |
Daniel J. Beckman
c/o Columbia Management
Investment Advisers, LLC
290 Congress Street
Boston, MA 02210
1962 | Trustee since November 2021 and President since June 2021 | Vice President – Head of North America Product, Columbia Management Investment Advisers, LLC since April 2015; President and Principal Executive Officer of the Columbia Funds since June 2021; officer of Columbia Funds and affiliated funds, 2020-2021 | 176 | Director, Ameriprise Trust Company, since October 2016; Director, Columbia Management Investment Distributors, Inc. since November 2018; Board of Governors, Columbia Wanger Asset Management, LLC since January 2022 |
| * | Interested person (as defined under the 1940 Act) by reason of being an officer, director, security holder and/or employee of the Investment Manager or Ameriprise Financial. |
The Statement of Additional Information has additional information about the Fund’s Board members and is available, without charge, upon request by calling 800.345.6611, visiting columbiathreadneedleus.com/investor/ or contacting your financial intermediary.
| 48 | Columbia Adaptive Risk Allocation Fund | Annual Report 2022 |
TRUSTEES AND OFFICERS (continued)
(Unaudited)
The Board has appointed officers who are responsible for day-to-day business decisions based on policies it has established. The officers serve at the pleasure of the Board. The following table provides basic information about the Officers of the Fund as of the printing of this report, including principal occupations during the past five years, although their specific titles may have varied over the period. In addition to Mr. Beckman, who is President and Principal Executive Officer, the Fund’s other officers are:
Fund officers
Name,
address and
year of birth | Position and year
first appointed to
position for any Fund
in the Columbia
Funds Complex or a
predecessor thereof | Principal occupation(s) during past five years |
Michael G. Clarke
290 Congress Street
Boston, MA 02210
1969 | Chief Financial Officer and Principal Financial Officer (2009) and Senior Vice President (2019) | Senior Vice President and Head of Global Operations & Investor Services, Columbia Management Investment Advisers, LLC, since March 2022 (previously Vice President, Head of North American Operations, and Co-Head of Global Operations, June 2019 to February 2022 and Vice President – Accounting and Tax, May 2010 - May 2019); senior officer of Columbia Funds and affiliated funds since 2002. |
Joseph Beranek
5890 Ameriprise
Financial Center
Minneapolis, MN 55474
1965 | Treasurer and Chief Accounting Officer (Principal Accounting Officer) (2019) and Principal Financial Officer (2020), CFST, CFST I, CFST II, CFVIT and CFVST II; Assistant Treasurer, CET I and CET II | Vice President – Mutual Fund Accounting and Financial Reporting, Columbia Management Investment Advisers, LLC, since December 2018 and March 2017, respectively (previously Vice President – Pricing and Corporate Actions, May 2010 - March 2017). |
Marybeth Pilat
290 Congress Street
Boston, MA 02210
1968 | Treasurer and Chief Accounting Officer (Principal Accounting Officer) and Principal Financial Officer (2020) for CET I and CET II; Assistant Treasurer, CFST, CFST I, CFST II, CFVIT and CFVST II | Vice President – Product Pricing and Administration, Columbia Management Investment Advisers, LLC, since May 2017; Director - Fund Administration, Calvert Investments, August 2015 – March 2017; Vice President - Fund Administration, Legg Mason, May 2015 - July 2015; Vice President - Fund Administration, Columbia Management Investment Advisers, LLC, May 2010 - April 2015. |
William F. Truscott
290 Congress Street
Boston, MA 02210
1960 | Senior Vice President (2001) | Formerly, Trustee/Director of Columbia Funds Complex or legacy funds, November 2001-January 1, 2021; Chief Executive Officer, Global Asset Management, Ameriprise Financial, Inc. since September 2012; Chairman of the Board and President, Columbia Management Investment Advisers, LLC since July 2004 and February 2012, respectively; Chairman of the Board and Chief Executive Officer, Columbia Management Investment Distributors, Inc. since November 2008 and February 2012, respectively; Chairman of the Board and Director, Threadneedle Asset Management Holdings, Sàrl since March 2013 and December 2008, respectively; senior executive of various entities affiliated with Columbia Threadneedle. |
Christopher O. Petersen
5228 Ameriprise Financial Center
Minneapolis, MN 55474
1970 | Senior Vice President and Assistant Secretary (2021) | Formerly, Trustee/Director of funds within the Columbia Funds Complex, July 1, 2020 - November 22, 2021; Senior Vice President and Assistant General Counsel, Ameriprise Financial, Inc. since September 2021 (previously Vice President and Lead Chief Counsel, January 2015 - September 2021); formerly, President and Principal Executive Officer of the Columbia Funds, 2015 - 2021; officer of Columbia Funds and affiliated funds since 2007. |
Thomas P. McGuire
290 Congress Street
Boston, MA 02210
1972 | Senior Vice President and Chief Compliance Officer (2012) | Vice President – Asset Management Compliance, Ameriprise Financial, Inc., since May 2010; Chief Compliance Officer, Columbia Acorn/Wanger Funds since December 2015; formerly, Chief Compliance Officer, Ameriprise Certificate Company, September 2010 – September 2020. |
Ryan C. Larrenaga
290 Congress Street
Boston, MA 02210
1970 | Senior Vice President (2017), Chief Legal Officer (2017), and Secretary (2015) | Vice President and Chief Counsel, Ameriprise Financial, Inc. since August 2018 (previously Vice President and Group Counsel, August 2011 - August 2018); Chief Legal Officer, Columbia Acorn/Wanger Funds, since September 2020; officer of Columbia Funds and affiliated funds since 2005. |
Columbia Adaptive Risk Allocation Fund | Annual Report 2022
| 49 |
TRUSTEES AND OFFICERS (continued)
(Unaudited)
Fund officers (continued)
Name,
address and
year of birth | Position and year
first appointed to
position for any Fund
in the Columbia
Funds Complex or a
predecessor thereof | Principal occupation(s) during past five years |
Michael E. DeFao
290 Congress Street
Boston, MA 02210
1968 | Vice President (2011) and Assistant Secretary (2010) | Vice President and Chief Counsel, Ameriprise Financial, Inc. since May 2010; Vice President, Chief Legal Officer and Assistant Secretary, Columbia Management Investment Advisers, LLC since October 2021 (previously Vice President and Assistant Secretary, May 2010 – September 2021). |
Lyn Kephart-Strong
5228 Ameriprise
Financial Center
Minneapolis, MN 55474
1960 | Vice President (2015) | President, Columbia Management Investment Services Corp. since October 2014; Vice President & Resolution Officer, Ameriprise Trust Company since August 2009. |
Liquidity Risk Management Program
(Unaudited)
Pursuant to Rule 22e-4 under the 1940 Act, the Fund has adopted a liquidity risk management program (Program). The Program’s principal objectives include assessing, managing and periodically reviewing the Fund’s liquidity risk. Liquidity risk is defined as the risk that the Fund could not meet redemption requests without significant dilution of remaining investors’ interests in the Fund.
The Board has appointed the Investment Manager as the program administrator for the Fund’s Program. The Investment Manager has delegated oversight of the Program to its Liquidity Risk Management Committee (the Committee). At a board meeting during the fiscal period, the Committee provided the Board with a report addressing the operations of the program and assessing its adequacy and effectiveness of implementation for the period January 1, 2021, through December 31, 2021, including:
| • | the Fund had sufficient liquidity to both meet redemptions and operate effectively on behalf of shareholders; |
| • | there were no material changes to the Program during the period; |
| • | the implementation of the Program was effective to manage the Fund’s liquidity risk; and |
| • | the Program operated adequately during the period. |
There can be no assurance that the Program will achieve its objectives in the future. Please refer to the Fund’s prospectus for more information regarding the Fund’s exposure to liquidity risk and other principal risks to which an investment in the Fund may be subject.
| 50 | Columbia Adaptive Risk Allocation Fund | Annual Report 2022 |
[THIS PAGE INTENTIONALLY LEFT BLANK]
Columbia Adaptive Risk Allocation Fund
P.O. Box 219104
Kansas City, MO 64121-9104
Please read and consider the investment objectives, risks, charges and expenses for any fund carefully before investing. For a prospectus and summary prospectus, which contains this and other important information about the Fund, go to
columbiathreadneedleus.com/investor/. The Fund is distributed by Columbia Management Investment Distributors, Inc., member FINRA, and managed by Columbia Management Investment Advisers, LLC.
Columbia Threadneedle Investments (Columbia Threadneedle) is the global brand name of the Columbia and Threadneedle group of companies. All rights reserved.
© 2022 Columbia Management Investment Advisers, LLC.
columbiathreadneedleus.com/investor/

Annual Report
May 31, 2022
Columbia Multi Strategy Alternatives Fund
Not FDIC or NCUA Insured • No Financial Institution Guarantee • May Lose Value
If you elect to receive the shareholder report for Columbia Multi Strategy Alternatives Fund (the Fund) in paper, mailed to you, the Fund mails one shareholder report to each shareholder address, unless such shareholder elects to receive shareholder reports from the Fund electronically via e-mail or by having a paper notice mailed to you (Postcard Notice) that your Fund’s shareholder report is available at the Columbia funds’ website (columbiathreadneedleus.com/investor/). If you would like more than one report in paper to be mailed to you, or would like to elect to receive reports via e-mail or access them through Postcard Notice, please call shareholder services at 800.345.6611 and additional reports will be sent to you.
Proxy voting policies and procedures
The policy of the Board of Trustees is to vote the proxies of the companies in which the Fund holds investments consistent with the procedures as stated in the Statement of Additional Information (SAI). You may obtain a copy of the SAI without charge by calling 800.345.6611; contacting your financial intermediary; visiting columbiathreadneedleus.com/investor/; or searching the website of the Securities and Exchange Commission (SEC) at sec.gov. Information regarding how the Fund voted proxies relating to portfolio securities is filed with the SEC by August 31st for the most recent 12-month period ending June 30th of that year, and is available without charge by visiting columbiathreadneedleus.com/investor/, or searching the website of the SEC at sec.gov.
Quarterly schedule of investments
The Fund files a complete schedule of portfolio holdings with the SEC for the first and third quarters of each fiscal year on Form N-PORT. The Fund’s Form N-PORT is available on the SEC’s website at sec.gov. The Fund’s complete schedule of portfolio holdings, as filed on Form N-PORT, can also be obtained without charge, upon request, by calling 800.345.6611.
Additional Fund information
For more information about the Fund, please visit columbiathreadneedleus.com/investor/ or call 800.345.6611. Customer Service Representatives are available to answer your questions Monday through Friday from 8 a.m. to 7 p.m. Eastern time.
You may obtain the current net asset value (NAV) of Fund shares at no cost by calling 800.345.6611 or by sending an e-mail to serviceinquiries@columbiathreadneedle.com.
Fund investment manager
Columbia Management Investment Advisers, LLC (the Investment Manager)
290 Congress Street
Boston, MA 02210
Fund distributor
Columbia Management Investment Distributors, Inc.
290 Congress Street
Boston, MA 02210
Fund transfer agent
Columbia Management Investment Services Corp.
P.O. Box 219104
Kansas City, MO 64121-9104
Columbia Multi Strategy Alternatives Fund | Annual Report 2022
Fund at a Glance
(Unaudited)
Investment objective
The Fund seeks to provide shareholders with absolute (positive) returns over a complete market cycle.
Portfolio management
Columbia Management Investment Advisers, LLC
Marc Khalamayzer, CFA
Joshua Kutin, CFA
Matthew Ferrelli, CFA
Dan Boncarosky, CFA
Brian Virginia
Corey Lorenzen, CFA
Jason Callan
Tom Heuer, CFA
Ryan Osborn, CFA
AQR Capital Management, LLC
Jordan Brooks, Ph.D.
Jonathan Fader
Lars Nielsen
Yao Hua Ooi
Ashwin Thapar
PGIM Quantitative Solutions LLC
Marco Aiolfi, Ph.D.
Yesim Tokat-Acikel, Ph.D.
| Average annual total returns (%) (for the period ended May 31, 2022) |
| | | Inception | 1 Year | 5 Years | Life |
| Class A | Excluding sales charges | 01/28/15 | -3.54 | -4.84 | -4.05 |
| | Including sales charges | | -9.09 | -5.96 | -4.82 |
| Advisor Class | 01/28/15 | -3.34 | -4.60 | -3.81 |
| Class C | Excluding sales charges | 01/28/15 | -4.29 | -5.55 | -4.76 |
| | Including sales charges | | -5.23 | -5.55 | -4.76 |
| Institutional Class | 01/28/15 | -3.32 | -4.61 | -3.83 |
| Institutional 2 Class | 01/28/15 | -3.29 | -4.52 | -3.74 |
| Institutional 3 Class | 01/28/15 | -3.21 | -4.48 | -3.68 |
| Class R | 01/28/15 | -3.83 | -5.08 | -4.29 |
| FTSE One-Month U.S. Treasury Bill Index | | 0.09 | 1.03 | 0.76 |
| HFRX Global Hedge Fund Index | | -3.01 | 2.35 | 1.78 |
Returns for Class A shares are shown with and without the maximum initial sales charge of 5.75%. Returns for Class C shares are shown with and without the 1.00% contingent deferred sales charge for the first year only. The Fund’s other share classes are not subject to sales charges and have limited eligibility. Please see the Fund’s prospectus for details. Performance for different share classes will vary based on differences in sales charges and fees associated with each share class. All results shown assume reinvestment of distributions during the period. Returns do not reflect the deduction of taxes that a shareholder may pay on Fund distributions or on the redemption of Fund shares. Performance results reflect the effect of any fee waivers or reimbursements of Fund expenses by Columbia Management Investment Advisers, LLC and/or any of its affiliates. Absent these fee waivers or expense reimbursement arrangements, performance results would have been lower.
The performance information shown represents past performance and is not a guarantee of future results. The investment return and principal value of your investment will fluctuate so that your shares, when redeemed, may be worth more or less than their original cost. Current performance may be lower or higher than the performance information shown. You may obtain performance information current to the most recent month-end by contacting your financial intermediary, visiting columbiathreadneedleus.com/investor/ or calling 800.345.6611.
The Fund’s performance prior to October 1, 2019 reflects returns achieved by the Investment Manager according to different principal investment strategies. If the Fund’s current management and strategies had been in place for the prior periods, results shown may have been different.
The FTSE One-Month U.S. Treasury Bill Index is an unmanaged index that represents the performance of one-month Treasury bills and reflects reinvestment of all distributions and changes in market prices.
HFRX Global Hedge Fund Index is designed to be representative of the overall composition of the hedge fund universe.
Indices are not available for investment, are not professionally managed and do not reflect sales charges, fees, brokerage commissions, taxes or other expenses of investing. Securities in the Fund may not match those in an index.
Columbia Multi Strategy Alternatives Fund | Annual Report 2022
| 3 |
Fund at a Glance (continued)
(Unaudited)
Performance of a hypothetical $10,000 investment (January 28, 2015 — May 31, 2022)
The chart above shows the change in value of a hypothetical $10,000 investment in Class A shares of Columbia Multi Strategy Alternatives Fund during the stated time period, and does not reflect the deduction of taxes that a shareholder may pay on Fund distributions or on the redemption of Fund shares.
| Portfolio breakdown (%) (at May 31, 2022) |
| Asset-Backed Securities — Non-Agency | 5.8 |
| Commercial Mortgage-Backed Securities - Agency | 0.1 |
| Commercial Mortgage-Backed Securities - Non-Agency | 4.8 |
| Money Market Funds | 40.5 |
| Options Purchased Calls | 0.1 |
| Options Purchased Puts | 0.1 |
| Residential Mortgage-Backed Securities - Agency | 12.6 |
| Residential Mortgage-Backed Securities - Non-Agency | 15.8 |
| Treasury Bills | 20.2 |
| Total | 100.0 |
Percentages indicated are based upon total investments including options purchased and excluding all other investments in derivatives, if any. The Fund’s portfolio composition is subject to change.
| Market exposure through derivatives investments (% of notional exposure) (at May 31, 2022)(a) |
| | Long | Short | Net |
| Fixed Income Derivative Contracts | 507.5 | (566.6) | (59.1) |
| Commodities Derivative Contracts | 13.0 | (9.6) | 3.4 |
| Equity Derivative Contracts | 88.2 | (103.2) | (15.0) |
| Foreign Currency Derivative Contracts | 523.5 | (552.8) | (29.3) |
| Total Notional Market Value of Derivative Contracts | 1,132.2 | (1,232.2) | (100.0) |
(a) The Fund has market exposure (long and/or short) to fixed income, commodity and equity asset classes and foreign currency through its investments in derivatives. The notional exposure of a financial instrument is the nominal or face amount that is used to calculate payments made on that instrument and/or changes in value for the instrument. The notional exposure is a hypothetical underlying quantity upon which payment obligations are computed. Notional exposures provide a gauge for how the Fund may behave given changes in individual markets. For a description of the Fund’s investments in derivatives, see Investments in derivatives following the Consolidated Portfolio of Investments, and Note 2 of the Notes to Consolidated Financial Statements.
| 4 | Columbia Multi Strategy Alternatives Fund | Annual Report 2022 |
Manager Discussion of Fund Performance
(Unaudited)
Columbia Management Investment Advisers, LLC (CMIA) serves as the investment manager for the Fund and attempts to achieve the Fund’s objective by managing a portion of the Fund’s assets and selecting one or more subadvisers to manage other sleeves independently of each other and CMIA. Portions of the Fund’s assets are subadvised by AQR Capital Management, LLC (AQR) and PGIM Quantitative Solutions LLC (PGIM Quantitative Solutions) (formerly known as QMA LLC). As of May 31, 2022, CMIA, AQR and PGIM Quantitative Solutions managed approximately 48.2%, 26.9% and 24.9% of the portfolio, respectively.
For the 12-month period that ended May 31, 2022, Class A shares of Columbia Multi Strategy Alternatives Fund returned -3.54% excluding sales charges. To compare, the FTSE One-Month U.S. Treasury Bill Index returned 0.09% and the HFRX Global Hedge Fund Index returned -3.01% over the same time period. As an absolute return fund, it employs a benchmark agnostic strategy and therefore comparisons to the FTSE One-Month U.S. Treasury Bill Index and the HFRX Global Hedge Fund Index are for informational purposes only.
Market overview
U.S. equities reversed course during the last half of the 12-month period ending May 31, 2022, falling from record highs and ending three consecutive years of robust gains. Energy stocks were the exception, significantly outperforming the overall equity market as measured by the S&P 500 Index. During the first quarter of 2022, for example, the energy sector outperformed the broad market by the largest quarterly margin on record.
Lingering Omicron-related worries were a headwind during the last half of the period, as were fears around inflation, durability of growth and the end of more than a decade of easy monetary policy coming from the Federal Reserve (Fed) and other global central banks. Volatility and risk-off sentiment spiked as investor concerns expanded to include ramifications of the Russia-Ukraine conflict. Commodity prices surged, particularly for oil and wheat, as the conflict in eastern Europe escalated into war and further complicated global supply chains. Oil prices, which already were elevated on supply-demand imbalances, shot through a decade-high of more than $120 per barrel before retreating somewhat.
Despite occasional hints of peaceful resolution to the Russia-Ukraine conflict, as well as mostly resilient corporate earnings reports, equities continued a choppy decline until the Fed raised interest rates by 25 basis points in a widely anticipated move at its March meeting. (A basis point is 1/100 of a percent.) Although the announcement and accompanying projections of six additional hikes were hawkish, Fed Chairman Jerome Powell seemingly calmed investors with a more neutral tone and his assessment that the U.S. economy is generally strong and well-positioned to handle tighter monetary policy.
Any positive sentiment faded at the end of the period, however, as investors increasingly focused on persistent inflation and slowing economic growth, which were exacerbated by yet more supply-chain snarls.
CMIA
We employ the following strategies in separate sleeves to manage our portion of the Fund’s portfolio: G10 Currency (this strategy typically invests in short-term debt obligations and currency-linked derivatives); Global Tactical Asset Allocation (GTAA) (this strategy typically invests in stocks and bonds across traditional asset classes and markets through the use of derivatives such as futures and swaps); Mortgage Opportunities (this strategy typically invests in mortgage and other asset-backed securities); as well as a Liquidity sleeve (this strategy typically invests in U.S. government securities, high-quality short-term debt instruments, ETFs and futures).
Notable contributors in the CMIA portion of the Fund during the period
| • | Short positions in foreign currencies in our G10 currency strategy contributed to performance during the period and offset some of the detraction from the strategy’s long positions. |
| ○ | Short positions in Japanese Yen (JPY) and Euro (EUR), along with long positions in the Canadian Dollar (CAD) and New Zealand Dollar (NZD), contributed positively during the period. |
| • | Within the GTAA strategy, underweights (short positions) in U.S. equity helped equity performance. |
Columbia Multi Strategy Alternatives Fund | Annual Report 2022
| 5 |
Manager Discussion of Fund Performance (continued)
(Unaudited)
Notable detractors in the CMIA portion of the Fund during the period
| • | The most significant detractor from total returns during the period came from the Mortgage Opportunities non-traditional bond strategy held within our portion of the portfolio. |
| ○ | This sleeve tends to historically focus on exposures related to high-quality agency mortgage-backed securities, higher yielding non-agency residential and commercial mortgage-backed securities, and asset-backed securities. |
| ○ | In a volatile environment marked with a risk-off sentiment, concerns surrounding extension risk and a slowing housing market, the sleeve did experience some meaningful downside over the past year. |
| ○ | In response to the changing landscape, where volatility has increased across a large swath of the sleeve’s investable universe, its managers have shifted higher the sleeve’s overall credit quality. |
| • | Negative performance in our G10 currency strategy during the period was driven by long positions in foreign currencies that detracted from returns. |
| ○ | During this period, the G10 foreign exchange (FX) strategy was generally positively correlated to risk assets and commodities, and negatively correlated to the U.S. Dollar. |
| ○ | On average, long positions in the Norwegian Krone (NOK), Swedish Krona (SEK), and British Pound (GBP) and short positions in the Australian Dollar (AUD) and Swiss Franc (CHF) contributed negatively to the overall performance. |
| • | Finally, the GTAA strategy, which invests on a long/short basis across both equity and fixed-income markets, experienced another challenging year. Some of the key drivers of returns for the GTAA strategy over the period were as follows: |
| ○ | Both equity and fixed-income positioning hurt performance in our portion of the Fund during the 12-month period. |
| ○ | Relative overweights (long positions) in emerging market equity and European equity hurt performance in the period. |
| ○ | Relative short positions in Australian and European fixed-income-related markets detracted from returns. |
AQR
Our portion of the Fund’s portfolio delivered positive results during the period, surpassing the returns of the FTSE One-Month U.S. Treasury Bill Index and the HFRX Global Hedge Fund Index.
The global macro strategy we use to manage our portion of the Fund’s portfolio aims to determine appropriate positioning based on a broad set of inputs, encompassing both systematic analysis of large quantities of economic and financial data as well as discretionary analysis of qualitative information. The strategy is implemented using derivative instruments, as we believe derivatives offer the most liquid, lowest cost and efficient way to gain diversified exposure across asset classes. The strategy primarily invests in liquid derivatives including global developed and emerging market exchange-traded futures, futures-related instruments, forward contracts, and interest rate swaps across four major asset classes: commodities, currencies, fixed income (including government bonds and interest rates) and equities.
Notable contributors in the AQR portion of the Fund during the period
| • | For systematic views, positions in commodities and equities contributed positively over the reporting period. |
| • | Notable contributors among these asset classes include directional metals commodity market strategies and emerging market equity strategies. |
| • | From a factor perspective, price momentum and fundamental momentum drove positive performance for our portion of the Fund. |
| • | In emerging equities, the relative value and directional strategies both contributed positively to performance. |
| 6 | Columbia Multi Strategy Alternatives Fund | Annual Report 2022 |
Manager Discussion of Fund Performance (continued)
(Unaudited)
| • | In the relative value strategy, gains were driven by short exposure to Chinese H shares and long exposure to Taiwan equities. |
| ○ | Chinese equity markets have consistently underperformed the cross section of emerging markets over the last twelve months, beginning with a regulatory crackdown on large market-weight companies and more recently due to a sharp slowdown in growth as a result of virus-related activity curbs. |
| ○ | Taiwan has outperformed the cross-section as the heavy market weight of semiconductors companies in the index benefitted from strong global demand. |
| • | Short exposure to Korean equities also drove positive performance in the directional strategy. Korean equities struggled over the period given the continued slowing in growth in China – the country’s main trading partner. |
| • | In the metals directional strategy, long exposure to nickel drove gains. Nickel prices spiked with the Russian invasion of Ukraine, as the market expected that Russia’s position as a major nickel exporter would tighten global supplies. |
| • | For discretionary views, positive performance was driven by fixed income with equities and commodities also adding to gains. |
| ○ | A directional short position in U.S. 5-year Treasury futures was the main contributor to fixed income outperformance. Bonds performed poorly over the period as inflation continued to accelerate and the Fed began its steepest rate hiking cycle in over twenty years. |
| ○ | A directional short position in the NASDAQ in 2022 has been the most profitable position in the discretionary equities strategies. Longer duration tech companies that came into the year with demanding multiples have underperformed with the rise in bond yields. |
| • | At the country level, exposures to Brazil, Russia, and Japan were the top three contributors. |
| ○ | Short exposure to Brazilian equity markets added to returns in the fourth quarter of 2021 as markets began to worry that the government would breach their fiscal spending limit ahead of the election. This led to higher bond yields and weighed on the relative attractiveness of equities for domestic investors. |
| ○ | Short positions in the Russian ruble contributed to returns in the first quarter of 2022 as the invasion of Ukraine weighed broadly on Russian assets. |
| ○ | Relative long positions in Japanese bonds have proven profitable throughout the reporting period, but particularly in 2022 as the Bank of Japan has committed to its accommodative policy stance while other central banks tighten policy. |
Notable detractors in the AQR portion of the Fund during the period
| • | For systematic views, positions in currencies were the largest detractor with fixed income also detracting. |
| ○ | Notable detractors among these asset classes include developed currency strategies, yield curve, and developed interest rates relative value strategies. |
| ○ | From a factor perspective, carry (notably in fixed income) and value (mostly in equity and commodity strategies) detracted. |
| • | Within developed currency strategies, long exposure to the Swedish Krona was the main detractor over the period. While many central banks were moving towards more hawkish rhetoric and starting to raise interest rates, the Riksbank remained dovish, only hiking their policy rate for the first time this cycle at their April 2022 meeting. |
| • | Within yield curve strategies, relative positioning of 2s10s UK steepeners and Euro flatteners in the second half of 2021 was the main detractor over the period. (A steepener is a type of interest rate swap that seeks to benefit from rising yield differences as a result of an increase in the yield curve of two T-bonds of different maturities, in this case the difference between the yield on the 10-year Gilt and the 2-year Gilt.) |
Columbia Multi Strategy Alternatives Fund | Annual Report 2022
| 7 |
Manager Discussion of Fund Performance (continued)
(Unaudited)
| ○ | The Bank of England became one of the first developed market central banks to raise rates, surprising markets with a 15 basis point rate hike at its December 2021 meeting, and leading to the pricing-in of more rate increases. (A basis point is 1/100 of a percent.) |
| ○ | The European Central Bank (ECB), on the other hand, pushed back against market expectations of interest rate hikes, and continued its asset purchase programs despite well-above-target inflation. |
| • | Within developed interest rate relative value strategies, long exposure to New Zealand 2-year interest rate swaps and short Euro 2-year interest rate swaps was the main detractor over the period. |
| ○ | Long positions in New Zealand weighed on returns in mid-2021 as the Reserve Bank of New Zealand increased hawkish rhetoric before raising interest rates at its October meeting. |
| ○ | Relative long positions in the Euro area underperformed on continued ECB dovishness despite high inflation in the second half of 2021. |
PGIM Quantitative Solutions
Our portion of the Fund outperformed the FTSE One-Month U.S. Treasury Bill Index during the reporting period. We believe that persistent return opportunities are generated by risk premia and mis-pricings. Further, we believe that a systematic framework using a mix of fundamental and market-based factors can identify those investment opportunities. We utilize a fundamental understanding of the drivers of returns to determine the most suitable set of factors for each asset class. In our Global Macro strategy, we have developed 6 independent absolute return strategies to harvest these investment opportunities. We believe our approach is sustainable and robust consistent with the regular variation in prices relative to fundamentals that occur over a business cycle.
Notable contributors in the PGIM Quantitative Solutions portion of the Fund during the period
| • | Our portion of the Fund benefited from relative value positioning in commodity futures, including net long positioning in the energy sector. |
| ○ | Our strategy gained from overweights in heating oil, nickel and WTI (West Texas Intermediate) crude oil. |
| ○ | The strategy benefited from the strong factor performance across the board, particularly sentiment and risk factors. |
| • | Our directional strategies, which take views across asset classes, contributed during the period, primarily driven by our overweight in commodities markets, underweight in global equities, and net long U.S. Dollar positioning. |
| • | Opportunistic strategies also contributed, mainly coming from positioning in the slope of the U.S. Treasury yield curve and in U.S. Equities. |
| • | The top performing country allocation in our portion of the Fund was short positioning in the New Zealand Dollar followed by positioning in the British Pound and UK Gilts. |
| ○ | We were short the New Zealand Dollar for the majority of the period, flipping from a short to a small long in December 2021 and turning short again in February 2022. The New Zealand Dollar was generally down over the reporting period. Our positioning was mainly driven by carry and growth factors. |
| ○ | We were short the British Pound for the full period based on negative readings of the growth environment and risk sentiment. The Pound depreciated versus the U.S. Dollar over the reporting period due to diverging monetary policies and deterioration in risk appetite |
| ○ | We were short UK Gilts over almost the full reporting period. We flipped from short to neutral at the end of May 2022. UK Gilts were down over the full period, due to rising rates driven by inflation concerns and anticipated monetary policy tightening. |
| 8 | Columbia Multi Strategy Alternatives Fund | Annual Report 2022 |
Manager Discussion of Fund Performance (continued)
(Unaudited)
Notable detractors in the PGIM Quantitative Solutions portion of the Fund during the period
| • | Positioning in our currency and sovereign bond relative value strategies detracted from performance in our portion of the Fund during the period. |
| • | The largest detractor was our relative value global currency sub-strategy. The losses were mainly driven by overweights in the Swedish Krona, Norwegian Krone and Japanese Yen. Carry and value factors were the main drivers of underperformance. |
| • | Our relative value global government bond sub-strategy also detracted, primarily driven by long positioning in Australian, French, and Canadian government bonds. In this case our carry and growth factors were the main detractors. |
| • | The largest detracting international country positions over the period were Australian bonds, the Swedish Krona and the Norwegian Krone. |
| ○ | We were long Australian bonds for the full period on the back of favorable carry and growth factors and trimmed the position in April 2022. Australian bonds lost value due to inflationary concerns and monetary policy tightening. |
| ○ | We were long the Swedish Krona for the majority of the reporting period. We trimmed our long exposure in March 2022 and flipped to a short position in April 2022. The Swedish Krona depreciated versus the U.S. Dollar over the full period, with the majority of the losses coming in 2021 due to diverging monetary policies. |
| ○ | We began the period with a short position in the Norwegian Krone, reduced our exposure to roughly flat in June 2021 and flipped to a long position in September 2021. The Norwegian Krone depreciated versus the U.S. Dollar over the period due to diverging monetary policies and deterioration in risk appetite, and losses were overall equally distributed in 2021 and in 2022. |
Market risk may affect a single issuer, sector of the economy, industry or the market as a whole. Alternative investments cover a broad range of strategies and structures designed to be low or non-correlated to traditional equity and fixed-income markets and involve substantial risks and are more volatile than traditional investments, making them more suitable for investors with an above average-tolerance for risk. The Fund’s use of leverage allows for investment exposure in excess of net assets, thereby magnifying volatility of returns and risk of loss. Commodity investments may be affected by the overall market and industry- and commodity-specific factors, and may be more volatile and less liquid than other investments. Investing in derivatives is a specialized activity that involves special risks that subject the Fund to significant loss potential, including when used as leverage, and may result in greater fluctuation in fund value. Foreign investments subject the Fund to risks, including political, economic, market, social and others within a particular country, as well as to currency instabilities and less stringent financial and accounting standards generally applicable to U.S. issuers. The sales price the Fund (or its underlying investments) could receive for any particular investment may differ from the Fund’s (or underlying investments’) valuation of the investment. As a non-diversified fund, fewer investments could have a greater effect on performance. See the Fund’s prospectus for more information on these and other risks.
The views expressed in this report reflect the current views of the respective parties who have contributed to this report. These views are not guarantees of future performance and involve certain risks, uncertainties and assumptions that are difficult to predict, so actual outcomes and results may differ significantly from the views expressed. These views are subject to change at any time based upon economic, market or other conditions and the respective parties disclaim any responsibility to update such views. These views may not be relied on as investment advice and, because investment decisions for a Columbia fund are based on numerous factors, may not be relied on as an indication of trading intent on behalf of any particular Columbia fund. References to specific securities should not be construed as a recommendation or investment advice.
Columbia Multi Strategy Alternatives Fund | Annual Report 2022
| 9 |
Understanding Your Fund’s Expenses
(Unaudited)
As an investor, you incur two types of costs. There are shareholder transaction costs, which generally include sales charges on purchases and may include redemption fees. There are also ongoing fund costs, which generally include management fees, distribution and/or service fees, and other fund expenses. The following information is intended to help you understand your ongoing costs (in dollars) of investing in the Fund and to help you compare these costs with the ongoing costs of investing in other mutual funds.
Analyzing your Fund’s expenses
To illustrate these ongoing costs, we have provided examples and calculated the expenses paid by investors in each share class of the Fund during the period. The actual and hypothetical information in the table is based on an initial investment of $1,000 at the beginning of the period indicated and held for the entire period. Expense information is calculated two ways and each method provides you with different information. The amount listed in the “Actual” column is calculated using the Fund’s actual operating expenses and total return for the period. You may use the Actual information, together with the amount invested, to estimate the expenses that you paid over the period. Simply divide your account value by $1,000 (for example, an $8,600 account value divided by $1,000 = 8.6), then multiply the results by the expenses paid during the period under the “Actual” column. The amount listed in the “Hypothetical” column assumes a 5% annual rate of return before expenses (which is not the Fund’s actual return) and then applies the Fund’s actual expense ratio for the period to the hypothetical return. You should not use the hypothetical account values and expenses to estimate either your actual account balance at the end of the period or the expenses you paid during the period. See “Compare with other funds” below for details on how to use the hypothetical data.
Compare with other funds
Since all mutual funds are required to include the same hypothetical calculations about expenses in shareholder reports, you can use this information to compare the ongoing cost of investing in the Fund with other funds. To do so, compare the hypothetical example with the 5% hypothetical examples that appear in the shareholder reports of other funds. As you compare hypothetical examples of other funds, it is important to note that hypothetical examples are meant to highlight the ongoing costs of investing in a fund only and do not reflect any transaction costs, such as sales charges, or redemption or exchange fees. Therefore, the hypothetical calculations are useful in comparing ongoing costs only, and will not help you determine the relative total costs of owning different funds. If transaction costs were included in these calculations, your costs would be higher.
| December 1, 2021 — May 31, 2022 |
| | Account value at the
beginning of the
period ($) | Account value at the
end of the
period ($) | Expenses paid during
the period ($) | Fund’s annualized
expense ratio (%) |
| | Actual | Hypothetical | Actual | Hypothetical | Actual | Hypothetical | Actual |
| Class A | 1,000.00 | 1,000.00 | 1,013.10 | 1,018.35 | 6.63 | 6.64 | 1.32 |
| Advisor Class | 1,000.00 | 1,000.00 | 1,014.30 | 1,019.60 | 5.37 | 5.39 | 1.07 |
| Class C | 1,000.00 | 1,000.00 | 1,009.40 | 1,014.66 | 10.32 | 10.35 | 2.06 |
| Institutional Class | 1,000.00 | 1,000.00 | 1,014.20 | 1,019.60 | 5.37 | 5.39 | 1.07 |
| Institutional 2 Class | 1,000.00 | 1,000.00 | 1,014.60 | 1,019.80 | 5.17 | 5.19 | 1.03 |
| Institutional 3 Class | 1,000.00 | 1,000.00 | 1,014.90 | 1,020.04 | 4.92 | 4.94 | 0.98 |
| Class R | 1,000.00 | 1,000.00 | 1,011.80 | 1,017.10 | 7.87 | 7.90 | 1.57 |
Expenses paid during the period are equal to the annualized expense ratio for each class as indicated above, multiplied by the average account value over the period and then multiplied by the number of days in the Fund’s most recent fiscal half year and divided by 365.
Expenses do not include fees and expenses incurred indirectly by the Fund from its investment in underlying funds, including affiliated and non-affiliated pooled investment vehicles, such as mutual funds and exchange-traded funds.
Had Columbia Management Investment Advisers, LLC and/or certain of its affiliates not waived/reimbursed certain fees and expenses, account value at the end of the period would have been reduced.
| 10 | Columbia Multi Strategy Alternatives Fund | Annual Report 2022 |
Consolidated Portfolio of Investments
May 31, 2022
(Percentages represent value of investments compared to net assets)
Investments in securities
| Asset-Backed Securities — Non-Agency 5.7% |
| Issuer | Coupon
Rate | | Principal
Amount ($) | Value ($) |
| ARES XLIV CLO Ltd.(a),(b) |
| Series 2017-44A Class DR |
3-month USD LIBOR + 6.870%
Floor 6.870%
04/15/2034 | 7.914% | | 1,500,000 | 1,417,211 |
| Bain Capital Credit CLO Ltd.(a),(b) |
| Series 2020-4A Class E |
3-month USD LIBOR + 7.950%
Floor 7.950%
10/20/2033 | 9.013% | | 900,000 | 861,728 |
| Carlyle Global Market Strategies(a),(b) |
| Series 2021-5A Class E |
3-month USD LIBOR + 6.250%
Floor 6.250%
07/20/2034 | 7.313% | | 1,000,000 | 904,644 |
| Carlyle US CLO Ltd.(a),(b) |
| Series 2016-4A Class A2R |
3-month USD LIBOR + 1.450%
Floor 1.450%
10/20/2027 | 2.513% | | 3,100,000 | 2,994,073 |
| Consumer Loan Underlying Bond Credit Trust(a),(c),(d) |
| Subordinated Series 2018-P1 Class CERT |
| 07/15/2025 | 0.000% | | 100,000 | 1,085,000 |
| Subordinated Series 2018-P2 Class CERT |
| 10/15/2025 | 0.000% | | 100,000 | 980,000 |
| Consumer Underlying Bond Securitization(a) |
| Series 2018-1 Class A |
| 02/17/2026 | 4.790% | | 32,915 | 32,915 |
| Dryden 86 CLO Ltd.(a),(b) |
| Series 2020-86A Class ER |
3-month USD LIBOR + 6.500%
Floor 6.500%
07/17/2034 | 7.544% | | 1,400,000 | 1,299,327 |
| ENVA LLC(a) |
| Series 2019-A Class C |
| 06/22/2026 | 7.620% | | 214,407 | 214,874 |
| Exeter Automobile Receivables Trust(a) |
| Subordinated Series 2021-2A Class E |
| 07/17/2028 | 2.900% | | 900,000 | 843,060 |
| Freed ABS Trust(a) |
| Subordinated Series 2021-1CP Class C |
| 03/20/2028 | 2.830% | | 700,000 | 690,168 |
| LendingClub Receivables Trust(a),(c),(d) |
| Series 2020-2 Class R |
| 02/15/2046 | 0.000% | | 85,000 | 323,000 |
| LendingClub Receivables Trust(a),(c),(d),(e) |
| Series 2020-JPSL Class R |
| 02/15/2025 | 0.000% | | 50,000 | 1,234,000 |
| Asset-Backed Securities — Non-Agency (continued) |
| Issuer | Coupon
Rate | | Principal
Amount ($) | Value ($) |
| LendingPoint Asset Securitization Trust(a),(d) |
| Subordinated Series 2021-1 Class C |
| 04/15/2027 | 4.935% | | 1,150,000 | 1,131,313 |
| Subordinated Series 2021-1 Class D |
| 04/15/2027 | 7.226% | | 1,000,000 | 980,000 |
| LendingPoint Asset Securitization Trust(a) |
| Subordinated Series 2021-A Class C |
| 12/15/2028 | 2.750% | | 2,000,000 | 1,934,608 |
| Subordinated Series 2022-A Class D |
| 06/15/2029 | 4.540% | | 1,700,000 | 1,642,138 |
| LP LMS Asset Securitization Trust(a) |
| Series 2021-2A Class A |
| 01/15/2029 | 1.750% | | 844,985 | 832,728 |
| LP LMS Asset Securitization Trust(a),(d) |
| Subordinated Series 2021-2A Class B |
| 01/15/2029 | 2.330% | | 500,000 | 478,750 |
| Madison Park Funding XLVII Ltd.(a),(b) |
| Series 2020-47A Class E |
3-month USD LIBOR + 7.460%
Floor 7.460%
01/19/2034 | 8.504% | | 500,000 | 476,469 |
| Madison Park Funding XXIV Ltd.(a),(b) |
| Series 2016-24A Class BR |
3-month USD LIBOR + 1.750%
10/20/2029 | 2.813% | | 7,000,000 | 6,880,685 |
| Marlette Funding Trust(a) |
| Series 2021-1A Class D |
| 06/16/2031 | 2.470% | | 100,000 | 95,889 |
| Octagon Investment Partners 47 Ltd.(a),(b) |
| Series 2020-1A Class ER |
3-month USD LIBOR + 6.250%
Floor 6.250%
07/20/2034 | 7.313% | | 750,000 | 662,367 |
| Pagaya AI Debt Selection Trust(a),(d) |
| Series 2020-2 Class NOTE |
| 12/15/2027 | 7.500% | | 325,187 | 322,748 |
| Pagaya AI Debt Selection Trust(a),(c),(d) |
| Series 2020-3 Class CERT |
| 05/17/2027 | 0.000% | | 3,200,000 | 896,106 |
| Series 2021-1 Class CERT |
| 11/15/2027 | 0.000% | | 1,846,200 | 1,384,650 |
| Subordinated Series 2021-5 Class |
| 08/15/2029 | 0.000% | | 865,000 | 968,800 |
| Pagaya AI Debt Selection Trust(a) |
| Series 2021-2 Class NOTE |
| 01/25/2029 | 3.000% | | 678,581 | 659,659 |
The accompanying Notes to Consolidated Financial Statements are an integral part of this statement.
Columbia Multi Strategy Alternatives Fund | Annual Report 2022
| 11 |
Consolidated Portfolio of Investments (continued)
May 31, 2022
| Asset-Backed Securities — Non-Agency (continued) |
| Issuer | Coupon
Rate | | Principal
Amount ($) | Value ($) |
| Series 2021-5 Class A |
| 08/15/2029 | 1.530% | | 373,324 | 363,397 |
| Subordinated Series 2021-3 Class C |
| 05/15/2029 | 3.270% | | 1,064,942 | 986,751 |
| Subordinated Series 2021-5 Class C |
| 08/15/2029 | 3.930% | | 1,500,000 | 1,361,115 |
| Palmer Square Loan Funding Ltd.(a),(b) |
| Series 2020-4A Class D |
3-month USD LIBOR + 7.050%
Floor 7.050%
11/25/2028 | 8.574% | | 1,000,000 | 951,310 |
| Prosper Pass-Through Trust(a),(d) |
| Series 2019-ST2 Class A |
| 11/15/2025 | 3.750% | | 316,564 | 319,730 |
| Research-Driven Pagaya Motor Asset Trust IV(a) |
| Series 2021-2A Class A |
| 03/25/2030 | 2.650% | | 941,089 | 901,349 |
| RR 16 Ltd.(a),(b) |
| Series 2021-16A Class D |
3-month USD LIBOR + 6.250%
Floor 6.250%
07/15/2036 | 7.294% | | 1,000,000 | 914,779 |
| SoFi Consumer Loan Program LLC(a),(c),(d),(e) |
| Series 2016-4 Class R |
| 11/25/2025 | 0.000% | | 100,000 | 729,985 |
| Theorem Funding Trust(a) |
| Series 2020-1A Class C |
| 10/15/2026 | 6.250% | | 2,300,000 | 2,305,226 |
| Subordinated Series 2021-1A Class B |
| 12/15/2027 | 1.840% | | 1,000,000 | 921,812 |
| Upstart Pass-Through Trust(a),(d) |
| Series 2020-ST4 Class A |
| 11/20/2026 | 3.250% | | 454,588 | 449,545 |
| Upstart Pass-Through Trust(a) |
| Series 2021-ST1 Class A |
| 02/20/2027 | 2.750% | | 394,309 | 384,240 |
| Series 2021-ST7 Class A |
| 09/20/2029 | 1.850% | | 357,255 | 342,149 |
| Upstart Securitization Trust(a) |
| Subordinated Series 2021-3 Class C |
| 07/20/2031 | 3.280% | | 1,200,000 | 1,140,640 |
| Subordinated Series 2021-5 Class C |
| 11/20/2031 | 4.150% | | 1,200,000 | 1,135,142 |
| US Auto Funding(a) |
| Subordinated Series 2021-1A Class D |
| 03/15/2027 | 4.360% | | 1,125,000 | 1,045,208 |
Total Asset-Backed Securities — Non-Agency
(Cost $49,365,135) | 46,479,288 |
|
| Commercial Mortgage-Backed Securities - Agency 0.1% |
| Issuer | Coupon
Rate | | Principal
Amount ($) | Value ($) |
| Government National Mortgage Association(f),(g) |
| Series 2019-102 Class IB |
| 03/16/2060 | 0.828% | | 1,380,831 | 87,906 |
| Series 2019-109 Class IO |
| 04/16/2060 | 0.805% | | 2,472,762 | 155,238 |
| Series 2019-131 Class IO |
| 07/16/2061 | 0.802% | | 2,734,939 | 167,627 |
| Series 2020-19 Class IO |
| 12/16/2061 | 0.699% | | 1,803,828 | 108,677 |
| Series 2020-3 Class IO |
| 02/16/2062 | 0.627% | | 2,056,555 | 112,512 |
Total Commercial Mortgage-Backed Securities - Agency
(Cost $1,509,518) | 631,960 |
|
| Commercial Mortgage-Backed Securities - Non-Agency 4.7% |
| | | | |
| BAMLL Commercial Mortgage Securities Trust(a),(f) |
| Subordinated Series 2013-WBRK Class E |
| 03/10/2037 | 3.534% | | 500,000 | 431,691 |
| BAMLL Commercial Mortgage Securities Trust(a),(b) |
| Subordinated Series 2018-DSNY Class D |
1-month USD LIBOR + 1.700%
Floor 1.700%
09/15/2034 | 2.575% | | 2,065,000 | 1,977,047 |
| Subordinated Series 2019-RLJ Class C |
1-month USD LIBOR + 1.600%
Floor 1.600%
04/15/2036 | 2.475% | | 1,250,000 | 1,211,827 |
| BBCMS Trust(a),(b) |
| Series 2018-BXH Class A |
1-month USD LIBOR + 1.000%
Floor 1.000%
10/15/2037 | 1.875% | | 207,394 | 200,213 |
| BFLD Trust(a),(b) |
| Series 2019-DPLO Class F |
1-month USD LIBOR + 2.540%
Floor 2.540%
10/15/2034 | 3.415% | | 300,000 | 284,958 |
| Series 2019-DPLO Class G |
1-month USD LIBOR + 3.190%
Floor 3.190%
10/15/2034 | 4.065% | | 1,000,000 | 964,147 |
| Braemar Hotels & Resorts Trust(a),(b) |
| Series 2018-PRME Class E |
1-month USD LIBOR + 2.400%
Floor 2.400%
06/15/2035 | 3.275% | | 1,000,000 | 937,268 |
| BX Commercial Mortgage Trust(a),(b) |
| Subordinated Series 2021-MFM1 Class G |
1-month USD LIBOR + 3.900%
Floor 3.900%
01/15/2034 | 4.775% | | 100,000 | 93,319 |
The accompanying Notes to Consolidated Financial Statements are an integral part of this statement.
| 12 | Columbia Multi Strategy Alternatives Fund | Annual Report 2022 |
Consolidated Portfolio of Investments (continued)
May 31, 2022
| Commercial Mortgage-Backed Securities - Non-Agency (continued) |
| Issuer | Coupon
Rate | | Principal
Amount ($) | Value ($) |
| BX Trust(a) |
| Series 2019-OC11 Class A |
| 12/09/2041 | 3.202% | | 1,000,000 | 904,624 |
| Series 2019-OC11 Class E |
| 12/09/2041 | 4.076% | | 300,000 | 249,184 |
| BXP Trust(a),(f) |
| Subordinated Series 2021-601L Class E |
| 01/15/2044 | 2.776% | | 1,500,000 | 997,155 |
| CHT Mortgage Trust(a),(b) |
| Series 2017-CSMO Class C |
1-month USD LIBOR + 1.500%
Floor 1.350%
11/15/2036 | 2.375% | | 1,000,000 | 1,000,000 |
| Series 2017-CSMO Class D |
1-month USD LIBOR + 2.250%
Floor 2.100%
11/15/2036 | 3.125% | | 1,000,000 | 1,000,000 |
| CLNY Trust(a),(b) |
| Series 2019-IKPR Class E |
1-month USD LIBOR + 2.721%
Floor 2.721%
11/15/2038 | 3.596% | | 900,000 | 832,612 |
| Series 2019-IKPR Class F |
1-month USD LIBOR + 3.417%
Floor 3.417%
11/15/2038 | 4.292% | | 1,350,000 | 1,228,702 |
| Cold Storage Trust(a),(b) |
| Subordinated Series 2020-ICE5 Class F |
1-month USD LIBOR + 3.492%
Floor 3.333%
11/15/2037 | 4.367% | | 638,944 | 608,636 |
| COMM Mortgage Trust(a),(f) |
| Series 2020-CBM Class F |
| 02/10/2037 | 3.633% | | 2,200,000 | 1,928,560 |
| Cosmopolitan Hotel Mortgage Trust(a),(b) |
| Subordinated Series 2017-CSMO Class F |
1-month USD LIBOR + 3.741%
Floor 3.741%
11/15/2036 | 4.616% | | 2,550,000 | 2,455,210 |
| Credit Suisse Mortgage Capital Certificates OA LLC(a) |
| Subordinated Series 2014-USA Class D |
| 09/15/2037 | 4.373% | | 645,000 | 547,661 |
| Subordinated Series 2014-USA Class E |
| 09/15/2037 | 4.373% | | 4,600,000 | 3,702,207 |
| CSMC Trust(a),(f) |
| Subordinated Series 2019-UVIL Class E |
| 12/15/2041 | 3.283% | | 600,000 | 456,987 |
| Hilton USA Trust(a),(f) |
| Series 2016-HHV Class F |
| 11/05/2038 | 4.194% | | 3,000,000 | 2,627,200 |
| Commercial Mortgage-Backed Securities - Non-Agency (continued) |
| Issuer | Coupon
Rate | | Principal
Amount ($) | Value ($) |
| Hilton USA Trust(a) |
| Subordinated Series 2016-SFP Class F |
| 11/05/2035 | 6.155% | | 1,700,000 | 1,640,700 |
| Home Partners of America Trust(a) |
| Series 2019-2 Class F |
| 10/19/2039 | 3.866% | | 333,682 | 299,050 |
| JPMorgan Chase Commercial Mortgage Securities Trust(a),(b) |
| Subordinated Series 2021-HTL5 Class E |
1-month USD LIBOR + 3.515%
Floor 3.515%
11/15/2038 | 4.390% | | 650,000 | 613,497 |
| Subordinated Series 2021-HTL5 Class F |
1-month USD LIBOR + 4.265%
Floor 4.265%
11/15/2038 | 5.140% | | 550,000 | 517,054 |
| Morgan Stanley Capital I Trust(a),(f) |
| Series 2019-MEAD Class E |
| 11/10/2036 | 3.177% | | 600,000 | 537,816 |
| Progress Residential Trust(a) |
| Series 2020-SFR1 Class F |
| 04/17/2037 | 3.431% | | 575,000 | 536,529 |
| Subordinated Series 2019-SFR3 Class E |
| 09/17/2036 | 3.369% | | 1,000,000 | 966,369 |
| Subordinated Series 2019-SFR3 Class F |
| 09/17/2036 | 3.867% | | 6,700,000 | 6,513,428 |
| Subordinated Series 2020-SFR2 Class F |
| 06/18/2037 | 6.152% | | 500,000 | 480,827 |
| Wells Fargo Commercial Mortgage Trust(a),(b) |
| Series 2017-SMP Class A |
1-month USD LIBOR + 0.875%
Floor 0.875%
12/15/2034 | 1.750% | | 1,000,000 | 987,736 |
| Series 2020-SDAL Class E |
1-month USD LIBOR + 2.740%
Floor 2.740%, Cap 4.500%
02/15/2037 | 3.627% | | 500,000 | 466,105 |
Total Commercial Mortgage-Backed Securities - Non-Agency
(Cost $39,532,861) | 38,198,319 |
|
| Residential Mortgage-Backed Securities - Agency(h) 12.6% |
| | | | |
| Federal Home Loan Mortgage Corp. |
| 05/01/2052 | 3.000% | | 3,500,000 | 3,349,053 |
| Federal Home Loan Mortgage Corp.(b),(g) |
| CMO Series 2013-101 Class HS |
-1.0 x 1-month USD LIBOR + 6.500%
Cap 6.500%
10/25/2043 | 5.494% | | 826,184 | 135,157 |
The accompanying Notes to Consolidated Financial Statements are an integral part of this statement.
Columbia Multi Strategy Alternatives Fund | Annual Report 2022
| 13 |
Consolidated Portfolio of Investments (continued)
May 31, 2022
| Residential Mortgage-Backed Securities - Agency(h) (continued) |
| Issuer | Coupon
Rate | | Principal
Amount ($) | Value ($) |
| CMO Series 4987 Class KS |
-1.0 x 1-month USD LIBOR + 6.080%
Cap 6.080%
06/25/2050 | 5.074% | | 1,406,851 | 279,260 |
| CMO Series 4993 Class MS |
-1.0 x 1-month USD LIBOR + 6.050%
Cap 6.050%
07/25/2050 | 5.044% | | 2,004,451 | 410,679 |
| Federal Home Loan Mortgage Corp. REMICS(b),(g) |
| CMO Series 4606 Class SL |
-1.0 x 1-month USD LIBOR + 6.000%
Cap 6.000%
12/15/2044 | 5.125% | | 4,296,296 | 617,863 |
| Federal Home Loan Mortgage Corp. REMICS(g) |
| CMO Series 5105 Class ID |
| 05/25/2051 | 3.000% | | 2,943,197 | 587,126 |
| CMO Series 5125 Class IT |
| 09/25/2048 | 2.500% | | 6,063,521 | 828,699 |
| Federal National Mortgage Association(b),(g) |
| CMO Series 2016-53 Class AS |
-1.0 x 1-month USD LIBOR + 6.000%
Cap 6.000%
08/25/2046 | 4.994% | | 15,755,093 | 3,253,112 |
| CMO Series 2020-38 Class WS |
-1.0 x 1-month USD LIBOR + 5.000%
Cap 5.000%
06/25/2050 | 3.994% | | 3,288,627 | 435,480 |
| Federal National Mortgage Association(g) |
| CMO Series 2021-3 Class TI |
| 02/25/2051 | 2.500% | | 5,323,379 | 947,627 |
| CMO Series 2021-4 Class IO |
| 02/25/2051 | 2.500% | | 5,389,542 | 925,278 |
| Federal National Mortgage Association REMICS(g) |
| CMO Series 2021-22 Class LI |
| 04/25/2051 | 3.000% | | 2,987,413 | 539,007 |
| Freddie Mac STACR REMIC Trust(a),(b) |
| Subordinated CMO Series 2021-HQA2 Class B2 |
30-day Average SOFR + 5.450%
12/25/2033 | 6.035% | | 800,000 | 668,663 |
| Government National Mortgage Association(b),(g) |
| CMO Series 2019-103 Class SA |
-1.0 x 1-month USD LIBOR + 6.050%
Cap 6.050%
08/20/2049 | 5.123% | | 2,464,536 | 337,299 |
| Residential Mortgage-Backed Securities - Agency(h) (continued) |
| Issuer | Coupon
Rate | | Principal
Amount ($) | Value ($) |
| CMO Series 2019-120 Class CS |
-1.0 x 1-month USD LIBOR + 3.400%
Cap 3.400%
09/20/2049 | 2.473% | | 21,696,164 | 1,227,363 |
| CMO Series 2019-120 Class SA |
-1.0 x 1-month USD LIBOR + 3.400%
Cap 3.400%
09/20/2049 | 2.473% | | 2,540,889 | 143,702 |
| CMO Series 2019-92 Class SD |
-1.0 x 1-month USD LIBOR + 6.100%
Cap 6.100%
07/20/2049 | 5.173% | | 3,081,394 | 395,322 |
| CMO Series 2019-98 Class SB |
-1.0 x 1-month USD LIBOR + 6.100%
Cap 6.100%
08/20/2049 | 5.173% | | 9,063,142 | 1,111,646 |
| CMO Series 2020-104 Class SA |
-1.0 x 1-month USD LIBOR + 6.200%
07/20/2050 | 5.273% | | 1,611,616 | 204,594 |
| CMO Series 2020-133 Class DS |
-1.0 x 1-month USD LIBOR + 6.300%
Cap 6.300%
09/20/2050 | 5.373% | | 6,338,099 | 1,023,406 |
| CMO Series 2021-122 Class SB |
-1.0 x 30-day Average SOFR + 2.600%
Cap 2.600%
07/20/2051 | 2.101% | | 8,281,116 | 415,690 |
| CMO Series 2021-122 Class SG |
1-month USD LIBOR + 6.300%
Cap 6.300%
07/20/2051 | 5.373% | | 4,342,588 | 684,295 |
| CMO Series 2021-156 Class SA |
-1.0 x 1-month USD LIBOR + 6.300%
Cap 6.300%
09/20/2051 | 5.373% | | 4,187,102 | 748,892 |
| CMO Series 2021-160 Class S |
-1.0 x 30-day Average SOFR + 2.650%
Cap 2.650%
09/20/2051 | 2.151% | | 6,343,205 | 340,047 |
| CMO Series 2021-193 Class ES |
30-day Average SOFR + 1.700%
11/20/2051 | 1.201% | | 23,091,118 | 181,614 |
The accompanying Notes to Consolidated Financial Statements are an integral part of this statement.
| 14 | Columbia Multi Strategy Alternatives Fund | Annual Report 2022 |
Consolidated Portfolio of Investments (continued)
May 31, 2022
| Residential Mortgage-Backed Securities - Agency(h) (continued) |
| Issuer | Coupon
Rate | | Principal
Amount ($) | Value ($) |
| CMO Series 2021-96 Class US |
-1.0 x 30-day Average SOFR + 3.250%
Cap 3.250%
06/20/2051 | 2.751% | | 3,816,884 | 275,805 |
| CMO Series 2021-97 Class CS |
-1.0 x 1-month USD LIBOR + 6.300%
Cap 6.300%
06/20/2051 | 5.373% | | 3,985,417 | 642,143 |
| Government National Mortgage Association(g) |
| CMO Series 2019-129 Class AI |
| 10/20/2049 | 3.500% | | 1,958,961 | 320,523 |
| CMO Series 2020-104 Class IY |
| 07/20/2050 | 3.000% | | 2,873,170 | 478,620 |
| CMO Series 2020-129 Class GI |
| 09/20/2050 | 3.000% | | 2,816,097 | 457,106 |
| CMO Series 2020-129 Class YI |
| 09/20/2050 | 2.500% | | 3,555,453 | 501,238 |
| CMO Series 2020-138 Class JI |
| 09/20/2050 | 2.500% | | 5,245,047 | 776,112 |
| CMO Series 2020-148 Class AI |
| 10/20/2050 | 2.500% | | 8,028,095 | 1,016,293 |
| CMO Series 2020-153 Class CI |
| 10/20/2050 | 2.500% | | 3,462,587 | 512,955 |
| CMO Series 2020-160 Class IA |
| 10/20/2050 | 2.500% | | 4,433,878 | 659,440 |
| CMO Series 2020-164 Class CI |
| 11/20/2050 | 3.000% | | 2,492,967 | 377,465 |
| CMO Series 2020-175 Class KI |
| 11/20/2050 | 2.500% | | 3,595,062 | 538,112 |
| CMO Series 2020-181 Class BI |
| 12/20/2050 | 2.500% | | 5,288,331 | 676,722 |
| CMO Series 2020-185 Class KI |
| 12/20/2050 | 2.500% | | 5,027,394 | 657,790 |
| CMO Series 2020-187 Class AI |
| 12/20/2050 | 2.500% | | 5,076,210 | 650,072 |
| CMO Series 2020-188 Class KI |
| 12/20/2050 | 2.500% | | 6,272,965 | 923,844 |
| CMO Series 2020-191 Class UC |
| 12/20/2050 | 4.000% | | 2,491,899 | 400,523 |
| CMO Series 2021-1 Class IT |
| 01/20/2051 | 3.000% | | 3,949,709 | 591,183 |
| CMO Series 2021-107 Class IW |
| 06/20/2051 | 3.500% | | 3,179,428 | 561,396 |
| CMO Series 2021-158 Class VI |
| 09/20/2051 | 3.000% | | 2,673,378 | 436,903 |
| Residential Mortgage-Backed Securities - Agency(h) (continued) |
| Issuer | Coupon
Rate | | Principal
Amount ($) | Value ($) |
| CMO Series 2021-160 Class CI |
| 09/20/2051 | 2.500% | | 5,364,772 | 798,421 |
| CMO Series 2021-160 Class IA |
| 09/20/2051 | 3.000% | | 2,021,564 | 324,217 |
| CMO Series 2021-161 Class UI |
| 09/20/2051 | 3.000% | | 3,546,372 | 564,499 |
| CMO Series 2021-188 Class IN |
| 10/20/2051 | 2.500% | | 2,950,444 | 481,307 |
| CMO Series 2021-24 Class MI |
| 02/20/2051 | 3.000% | | 2,382,975 | 369,243 |
| CMO Series 2021-25 Class GI |
| 02/20/2051 | 2.500% | | 4,692,928 | 715,012 |
| CMO Series 2021-7 Class IT |
| 01/16/2051 | 3.000% | | 1,886,991 | 402,095 |
| CMO Series 2021-9 Class MI |
| 01/20/2051 | 2.500% | | 851,459 | 116,528 |
| Uniform Mortgage-Backed Security TBA(i) |
| 06/13/2052 | 3.500% | | 17,000,000 | 16,663,984 |
| 06/13/2052 | 4.000% | | 50,000,000 | 50,019,531 |
Total Residential Mortgage-Backed Securities - Agency
(Cost $103,374,745) | 101,699,956 |
|
| Residential Mortgage-Backed Securities - Non-Agency 15.8% |
| | | | |
| 510 Asset Backed Trust(a),(f) |
| CMO Series 2021-NPL2 Class A1 |
| 06/25/2061 | 2.116% | | 914,958 | 874,903 |
| Ajax Mortgage Loan Trust(a),(f) |
| CMO Series 2021-C Class A |
| 01/25/2061 | 2.115% | | 369,794 | 362,486 |
| Angel Oak Mortgage Trust(a),(f) |
| CMO Series 2021-5 Class A3 |
| 07/25/2066 | 1.311% | | 452,665 | 414,338 |
| Angel Oak Mortgage Trust I LLC(a),(f) |
| Subordinated CMO Series 2019-2 Class B2 |
| 03/25/2049 | 6.286% | | 2,700,000 | 2,557,584 |
| Bellemeade Re Ltd.(a),(b) |
| CMO Series 2019-1A Class M1B |
1-month USD LIBOR + 1.750%
Floor 1.750%
03/25/2029 | 2.756% | | 241,476 | 240,908 |
| CMO Series 2019-4A Class M1C |
1-month USD LIBOR + 2.500%
Floor 2.500%
10/25/2029 | 3.506% | | 200,000 | 196,912 |
| CMO Series 2020-2A Class M2 |
1-month USD LIBOR + 6.000%
Floor 6.000%
08/26/2030 | 7.006% | | 1,700,000 | 1,752,662 |
The accompanying Notes to Consolidated Financial Statements are an integral part of this statement.
Columbia Multi Strategy Alternatives Fund | Annual Report 2022
| 15 |
Consolidated Portfolio of Investments (continued)
May 31, 2022
| Residential Mortgage-Backed Securities - Non-Agency (continued) |
| Issuer | Coupon
Rate | | Principal
Amount ($) | Value ($) |
| CMO Series 2020-3A Class M2 |
1-month USD LIBOR + 4.850%
Floor 4.850%
10/25/2030 | 5.856% | | 650,000 | 660,650 |
| CMO Series 2020-4A Class M2B |
1-month USD LIBOR + 3.600%
Floor 3.600%
06/25/2030 | 4.606% | | 344,969 | 346,962 |
| Subordinated CMO Series 2018-1A Class B1 |
1-month USD LIBOR + 4.250%
04/25/2028 | 4.918% | | 400,000 | 394,412 |
| Subordinated CMO Series 2019-4A Class B1 |
1-month USD LIBOR + 3.850%
Floor 3.850%
10/25/2029 | 4.856% | | 950,000 | 905,924 |
| BRAVO Residential Funding Trust(a),(f) |
| CMO Series 2019-NQM2 Class B1 |
| 11/25/2059 | 3.954% | | 1,000,000 | 925,088 |
| CMO Series 2020-NQM1 Class B1 |
| 05/25/2060 | 5.086% | | 300,000 | 294,361 |
| CMO Series 2020-NQM1 Class B2 |
| 05/25/2060 | 5.583% | | 430,000 | 420,224 |
| Subordinated CMO Series 2021-NQM2 Class B1 |
| 03/25/2060 | 3.044% | | 200,000 | 184,142 |
| Subordinated CMO Series 2021-NQM2 Class B2 |
| 03/25/2060 | 4.099% | | 300,000 | 281,667 |
| BRAVO Residential Funding Trust(a),(b) |
| CMO Series 2021-HE2 Class B1 |
30-day Average SOFR + 2.400%
11/25/2069 | 2.689% | | 338,000 | 332,340 |
| Subordinated CMO Series 2021-HE2 Class B2 |
30-day Average SOFR + 3.400%
11/25/2069 | 3.133% | | 353,000 | 346,145 |
| BVRT Financing Trust(a),(b),(d) |
| CMO Series 2020-CRT1 Class M3 |
1-month USD LIBOR + 4.000%
07/10/2032 | 4.077% | | 321,456 | 323,063 |
| CMO Series 2021-2F Class M2 |
30-day Average SOFR + 2.500%
Floor 2.500%
01/10/2032 | 2.717% | | 561,229 | 563,806 |
| CMO Series 2021-3F Class M2 |
30-day Average SOFR + 2.900%
Floor 2.900%
07/12/2033 | 3.126% | | 3,000,000 | 3,000,000 |
| BVRT Financing Trust(a),(b),(d),(e) |
| CMO Series 2021-CRT1 Class M4 |
1-month USD LIBOR + 3.500%
Floor 3.500%
07/10/2032 | 3.589% | | 1,875,000 | 1,835,297 |
| Residential Mortgage-Backed Securities - Non-Agency (continued) |
| Issuer | Coupon
Rate | | Principal
Amount ($) | Value ($) |
| CHL GMSR Issuer Trust(a),(b) |
| CMO Series 2018-GT1 Class A |
1-month USD LIBOR + 1.000%
05/25/2023 | 3.756% | | 370,000 | 366,351 |
| CIM Trust(a),(f) |
| CMO Series 2021-NR4 Class A1 |
| 10/25/2061 | 2.816% | | 569,108 | 537,895 |
| COLT Mortgage Loan Trust(a),(f) |
| CMO Series 2020-2 Class M1 |
| 03/25/2065 | 5.250% | | 200,000 | 197,602 |
| CMO Series 2021-3 Class A3 |
| 09/27/2066 | 1.419% | | 627,199 | 564,255 |
| Subordinated CMO Series 2021-4 Class B1 |
| 10/25/2066 | 3.764% | | 400,000 | 305,221 |
| Subordinated Series 2021-3 Class B1 |
| 09/27/2066 | 3.059% | | 200,000 | 161,694 |
| Connecticut Avenue Securities Trust(a),(b) |
| CMO Series 2019-HRP1 Class M2 |
1-month USD LIBOR + 2.150%
11/25/2039 | 3.156% | | 456,369 | 449,605 |
| Subordinated CMO Series 2018-R07 Class 1B1 |
1-month USD LIBOR + 4.350%
04/25/2031 | 5.356% | | 450,000 | 452,640 |
| Subordinated CMO Series 2019-R01 Class 2B1 |
1-month USD LIBOR + 4.350%
Floor 4.350%
07/25/2031 | 5.356% | | 950,000 | 948,159 |
| Subordinated CMO Series 2021-R03 Class 1B2 |
30-day Average SOFR + 5.500%
Floor 5.500%
12/25/2041 | 6.085% | | 1,200,000 | 1,000,673 |
| Subordinated CMO Series 2022-R01 Class 1B2 |
30-day Average SOFR + 6.000%
12/25/2041 | 6.585% | | 3,500,000 | 2,993,369 |
| Subordinated CMO Series 2022-R02 Class 2B2 |
30-day Average SOFR + 7.650%
01/25/2042 | 8.235% | | 2,600,000 | 2,376,043 |
| Subordinated CMO Series 2022-R03 Class 1B1 |
30-day Average SOFR + 6.250%
03/25/2042 | 6.835% | | 200,000 | 197,234 |
| Subordinated CMO Series 2022-R04 Class 1B1 |
30-day Average SOFR + 5.250%
03/25/2042 | 5.835% | | 900,000 | 858,806 |
| Subordinated CMO Series 2022-R04 Class 1B2 |
30-day Average SOFR + 9.500%
03/25/2042 | 10.085% | | 950,000 | 930,354 |
| Credit Suisse Mortgage Trust(a),(f) |
| CMO Series 2022-JR1 Class A1 |
| 10/25/2066 | 4.267% | | 2,271,383 | 2,258,882 |
The accompanying Notes to Consolidated Financial Statements are an integral part of this statement.
| 16 | Columbia Multi Strategy Alternatives Fund | Annual Report 2022 |
Consolidated Portfolio of Investments (continued)
May 31, 2022
| Residential Mortgage-Backed Securities - Non-Agency (continued) |
| Issuer | Coupon
Rate | | Principal
Amount ($) | Value ($) |
| CSMC Trust(a),(f) |
| CMO Series 2020-RPL2 Class A12 |
| 02/25/2060 | 3.418% | | 1,537,842 | 1,487,672 |
| CMO Series 2021-JR2 Class A1 |
| 11/25/2061 | 2.215% | | 540,915 | 521,022 |
| Deephaven Residential Mortgage Trust(a),(f) |
| CMO Series 2020-2 Class B2 |
| 05/25/2065 | 5.838% | | 600,000 | 601,906 |
| Eagle Re Ltd.(a),(b) |
| CMO Series 2018-1 Class M1 |
1-month USD LIBOR + 1.700%
Floor 1.700%
11/25/2028 | 2.706% | | 1,825,512 | 1,819,128 |
| CMO Series 2019-1 Class M1B |
1-month USD LIBOR + 1.800%
04/25/2029 | 2.806% | | 481,252 | 477,343 |
| CMO Series 2019-1 Class M2 |
1-month USD LIBOR + 3.300%
04/25/2029 | 4.306% | | 1,500,000 | 1,488,542 |
| Fannie Mae Connecticut Avenue Securities(a),(b) |
| Subordinated CMO Series 2021-R02 Class 2B2 |
30-day Average SOFR + 6.200%
11/25/2041 | 6.785% | | 1,100,000 | 920,941 |
| Freddie Mac STACR(a),(b) |
| Subordinated CMO Series 2019-HQA3 Class B1 |
1-month USD LIBOR + 3.000%
09/25/2049 | 4.006% | | 1,250,000 | 1,170,680 |
| Freddie Mac STACR REMIC Trust(a),(b) |
| CMO Series 2022-HQA1 Class M2 |
30-day Average SOFR + 5.250%
03/25/2042 | 5.835% | | 800,000 | 773,002 |
| Subordinated CMO Series 2020-DNA4 Class B1 |
1-month USD LIBOR + 6.000%
08/25/2050 | 7.006% | | 1,600,000 | 1,682,247 |
| Subordinated CMO Series 2020-DNA6 Class B2 |
30-day Average SOFR + 5.650%
12/25/2050 | 6.235% | | 1,000,000 | 916,558 |
| Subordinated CMO Series 2020-HQA1 Class B1 |
1-month USD LIBOR + 2.350%
01/25/2050 | 3.356% | | 1,942,000 | 1,832,665 |
| Subordinated CMO Series 2020-HQA3 Class B1 |
1-month USD LIBOR + 5.750%
07/25/2050 | 6.756% | | 1,000,000 | 1,043,390 |
| Subordinated CMO Series 2020-HQA4 Class B1 |
1-month USD LIBOR + 5.250%
09/25/2050 | 6.256% | | 2,400,000 | 2,451,319 |
| Subordinated CMO Series 2021-DNA1 Class B2 |
30-day Average SOFR + 4.750%
01/25/2051 | 5.335% | | 1,750,000 | 1,385,371 |
| Residential Mortgage-Backed Securities - Non-Agency (continued) |
| Issuer | Coupon
Rate | | Principal
Amount ($) | Value ($) |
| Subordinated CMO Series 2021-DNA5 Class B2 |
30-day Average SOFR + 5.500%
01/25/2034 | 6.085% | | 3,250,000 | 2,642,184 |
| Subordinated CMO Series 2021-DNA6 Class B2 |
30-day Average SOFR + 7.500%
10/25/2041 | 7.789% | | 900,000 | 819,451 |
| Subordinated CMO Series 2021-HQA4 Class B2 |
30-day Average SOFR + 7.000%
12/25/2041 | 7.585% | | 1,000,000 | 866,451 |
| Subordinated CMO Series 2022-DNA1 Class B2 |
30-day Average SOFR + 7.100%
01/25/2042 | 7.685% | | 1,650,000 | 1,407,873 |
| Subordinated CMO Series 2022-HQA1 Class B2 |
30-day Average SOFR + 11.000%
03/25/2042 | 11.585% | | 2,750,000 | 2,724,795 |
| Freddie Mac STACR Trust(a),(b) |
| Subordinated CMO Series 2019-HQA2 Class B1 |
1-month USD LIBOR + 4.100%
04/25/2049 | 5.106% | | 1,500,000 | 1,470,792 |
| Freddie Mac Structured Agency Credit Risk Debt Notes(b) |
| CMO Series 2014-DN1 Class M3 |
1-month USD LIBOR + 4.500%
02/25/2024 | 5.506% | | 372,219 | 373,865 |
| Freddie Mac Structured Agency Credit Risk Debt Notes(a),(b) |
| Subordinated CMO Series 2020-DNA3 Class B1 |
1-month USD LIBOR + 5.100%
06/25/2050 | 6.106% | | 1,821,428 | 1,868,872 |
| Subordinated CMO Series 2020-HQA5 Class B2 |
30-day Average SOFR + 7.400%
11/25/2050 | 7.985% | | 1,800,000 | 1,833,327 |
| Subordinated CMO Series 2021-DNA7 Class B2 |
30-day Average SOFR + 7.800%
11/25/2041 | 8.089% | | 2,950,000 | 2,693,763 |
| Freddie Mac Structured Agency Credit Risk Debt Notes(a),(f) |
| Subordinated CMO Series 2022-DNA2 Class B2 |
| 02/25/2042 | 9.085% | | 1,600,000 | 1,482,379 |
| GCAT Trust(a),(f) |
| CMO Series 2019-NQM3 Class M1 |
| 11/25/2059 | 3.450% | | 600,000 | 575,927 |
| Genworth Mortgage Insurance Corp.(a),(b) |
| CMO Series 2021-1 Class M2 |
1-month USD LIBOR + 3.900%
Floor 3.900%
08/25/2033 | 4.906% | | 250,000 | 247,776 |
| CMO Series 2021-3 Class M1B |
30-day Average SOFR + 2.900%
Floor 2.900%
02/25/2034 | 3.189% | | 2,000,000 | 1,932,817 |
The accompanying Notes to Consolidated Financial Statements are an integral part of this statement.
Columbia Multi Strategy Alternatives Fund | Annual Report 2022
| 17 |
Consolidated Portfolio of Investments (continued)
May 31, 2022
| Residential Mortgage-Backed Securities - Non-Agency (continued) |
| Issuer | Coupon
Rate | | Principal
Amount ($) | Value ($) |
| Subordinated CMO Series 2021-3 Class B1 |
30-day Average SOFR + 4.950%
Floor 4.950%
02/25/2034 | 5.239% | | 500,000 | 458,901 |
| Glebe Funding Trust (The)(a),(d) |
| CMO Series 2021-1 Class PT |
| 10/27/2023 | 3.000% | | 824,114 | 807,632 |
| Home Re Ltd.(a),(b) |
| CMO Series 2018-1 Class M2 |
1-month USD LIBOR + 3.000%
10/25/2028 | 4.006% | | 750,000 | 742,453 |
| CMO Series 2020-1 Class M1C |
1-month USD LIBOR + 4.150%
Floor 4.150%
10/25/2030 | 5.156% | | 250,000 | 251,444 |
| CMO Series 2020-1 Class M2 |
1-month USD LIBOR + 5.250%
Floor 5.250%
10/25/2030 | 6.256% | | 1,200,000 | 1,205,896 |
| Homeward Opportunities Fund I Trust(a),(f) |
| Subordinated CMO Series 2020-2 Class B1 |
| 05/25/2065 | 5.450% | | 250,000 | 251,154 |
| Homeward Opportunities Fund Trust(a),(f) |
| CMO Series 2020-BPL1 Class A2 |
| 08/25/2025 | 5.438% | | 1,327,766 | 1,315,724 |
| Imperial Fund Mortgage Trust(a),(f) |
| Subordinated CMO Series 2021-NQM3 Class B1 |
| 11/25/2056 | 4.184% | | 500,000 | 385,725 |
| Legacy Mortgage Asset Trust(a),(f) |
| CMO Series 2021-GS1 Class A1 |
| 10/25/2066 | 1.892% | | 424,306 | 407,968 |
| CMO Series 2021-SL2 Class A |
| 10/25/2068 | 1.875% | | 858,721 | 828,136 |
| Loan Revolving Advance Investment Trust(a),(b),(d),(e) |
| CMO Series 2021-2 Class A1X |
1-month USD LIBOR + 2.750%
Floor 2.750%
06/30/2023 | 3.625% | | 3,000,000 | 2,996,541 |
| Mortgage Acquisition Trust I LLC(a),(d) |
| CMO Series 2021-1 Class PT |
| 11/29/2023 | 3.500% | | 724,814 | 722,096 |
| Oaktown Re II Ltd.(a),(b) |
| Subordinated CMO Series 2018-1A Class B1 |
1-month USD LIBOR + 4.050%
07/25/2028 | 5.056% | | 600,000 | 601,531 |
| Subordinated CMO Series 2018-1A Class M2 |
1-month USD LIBOR + 2.850%
07/25/2028 | 3.856% | | 3,017,857 | 3,003,418 |
| Residential Mortgage-Backed Securities - Non-Agency (continued) |
| Issuer | Coupon
Rate | | Principal
Amount ($) | Value ($) |
| Oaktown Re III Ltd.(a),(b) |
| CMO Series 2019-1A Class M2 |
1-month USD LIBOR + 2.550%
Floor 2.550%
07/25/2029 | 3.556% | | 1,000,000 | 977,231 |
| Oaktown Re V Ltd.(a),(b) |
| CMO Series 2020-2A Class M2 |
1-month USD LIBOR + 5.250%
Floor 5.250%
10/25/2030 | 6.256% | | 1,000,000 | 1,027,843 |
| Oaktown Re VI Ltd.(a),(b) |
| CMO Series 2021-1A Class M2 |
30-day Average SOFR + 3.950%
Floor 3.950%
10/25/2033 | 4.535% | | 500,000 | 474,459 |
| PMT Credit Risk Transfer Trust(a),(b) |
| Series 2019-2R Class A |
1-month USD LIBOR + 2.750%
Floor 2.750%
05/27/2023 | 3.773% | | 801,671 | 757,718 |
| PNMAC GMSR Issuer Trust(a),(b) |
| CMO Series 2018-FT1 Class A |
1-month USD LIBOR + 2.350%
04/25/2023 | 3.356% | | 500,000 | 494,806 |
| CMO Series 2018-GT1 Class A |
1-month USD LIBOR + 2.850%
Floor 2.850%
02/25/2023 | 3.856% | | 2,750,000 | 2,733,292 |
| CMO Series 2018-GT2 Class A |
1-month USD LIBOR + 2.650%
08/25/2025 | 3.656% | | 4,250,000 | 4,195,841 |
| Point Securitization Trust(a),(f) |
| CMO Series 2021-1 Class A1 |
| 02/25/2052 | 3.228% | | 1,107,400 | 1,104,559 |
| Preston Ridge Partners Mortgage(a),(f) |
| CMO Series 2021-2 Class A2 |
| 03/25/2026 | 3.770% | | 1,000,000 | 957,234 |
| CMO Series 2021-4 Class A2 |
| 04/25/2026 | 3.474% | | 400,000 | 371,908 |
| Preston Ridge Partners Mortgage LLC(a),(f) |
| CMO Series 2020-6 Class A2 |
| 11/25/2025 | 4.703% | | 200,000 | 191,844 |
| Preston Ridge Partners Mortgage Trust(a),(f) |
| CMO Series 2021-1 Class A1 |
| 01/25/2026 | 2.115% | | 809,237 | 777,262 |
| CMO Series 2021-1 Class A2 |
| 01/25/2026 | 3.720% | | 3,250,000 | 3,078,082 |
| CMO Series 2021-10 Class A1 |
| 10/25/2026 | 2.487% | | 1,017,221 | 967,265 |
The accompanying Notes to Consolidated Financial Statements are an integral part of this statement.
| 18 | Columbia Multi Strategy Alternatives Fund | Annual Report 2022 |
Consolidated Portfolio of Investments (continued)
May 31, 2022
| Residential Mortgage-Backed Securities - Non-Agency (continued) |
| Issuer | Coupon
Rate | | Principal
Amount ($) | Value ($) |
| CMO Series 2021-3 Class A1 |
| 04/25/2026 | 1.867% | | 800,287 | 761,201 |
| CMO Series 2021-5 Class A2 |
| 06/25/2026 | 3.721% | | 700,000 | 663,076 |
| CMO Series 2021-7 Class A1 |
| 08/25/2026 | 1.867% | | 1,440,482 | 1,361,820 |
| Pretium Mortgage Credit Partners(a),(f) |
| CMO Series 2022-NPL1 Class A1 |
| 01/25/2052 | 2.981% | | 899,123 | 857,780 |
| Pretium Mortgage Credit Partners LLC(a),(f) |
| CMO Series 2021-NPL6 Class A2 |
| 07/25/2051 | 5.071% | | 400,000 | 374,801 |
| CMO Series 2021-RN2 Class A1 |
| 07/25/2051 | 1.744% | | 486,151 | 457,745 |
| Radnor Re Ltd.(a),(b) |
| CMO Series 2020-2 Class M2 |
1-month USD LIBOR + 5.600%
Floor 5.600%
10/25/2030 | 6.268% | | 257,627 | 257,417 |
| Residential Mortgage Loan Trust(a),(f) |
| CMO Series 2019-3 Class M1 |
| 09/25/2059 | 3.257% | | 700,000 | 673,819 |
| STACR Trust(a),(b) |
| Subordinated CMO Series 2018-HRP1 Class B1 |
1-month USD LIBOR + 3.750%
04/25/2043 | 4.756% | | 2,000,000 | 1,971,678 |
| Stanwich Mortgage Loan Co. LLC(a),(f) |
| CMO Series 2021-NPB1 Class A1 |
| 10/16/2026 | 2.735% | | 2,271,315 | 2,198,780 |
| Starwood Mortgage Residential Trust(a),(f) |
| CMO Series 2020-3 Class B1 |
| 04/25/2065 | 4.750% | | 250,000 | 243,540 |
| CMO Series 2021-3 Class A1 |
| 06/25/2056 | 1.127% | | 375,046 | 349,307 |
| Stonnington Mortgage Trust(a),(d),(e),(f) |
| CMO Series 2020-1 Class A |
| 07/28/2024 | 3.500% | | 447,210 | 447,210 |
| Toorak Mortgage Corp., Ltd.(a),(d),(e),(f) |
| CMO Series 2020-1 Class M1 |
| 03/25/2023 | 5.000% | | 1,400,000 | 1,379,000 |
| Toorak Mortgage Corp., Ltd.(a),(f) |
| CMO Series 2021-1 Class A1 |
| 06/25/2024 | 2.240% | | 800,000 | 768,989 |
| Triangle Re Ltd.(a),(b) |
| CMO Series 2020-1 Class M1C |
1-month USD LIBOR + 4.500%
Floor 4.500%
10/25/2030 | 5.168% | | 753,994 | 757,065 |
| Residential Mortgage-Backed Securities - Non-Agency (continued) |
| Issuer | Coupon
Rate | | Principal
Amount ($) | Value ($) |
| CMO Series 2020-1 Class M2 |
1-month USD LIBOR + 5.600%
Floor 5.600%
10/25/2030 | 6.268% | | 1,000,000 | 1,011,492 |
| CMO Series 2021-1 Class M1C |
1-month USD LIBOR + 3.400%
Floor 3.400%
08/25/2033 | 4.406% | | 422,653 | 423,196 |
| Subordinated CMO Series 2021-1 Class B1 |
1-month USD LIBOR + 4.500%
Floor 4.500%
08/25/2033 | 5.506% | | 1,500,000 | 1,500,092 |
| Subordinated CMO Series 2021-2 Class B1 |
1-month USD LIBOR + 7.500%
Floor 7.500%
10/25/2033 | 8.506% | | 650,000 | 623,561 |
| VCAT Asset Securitization LLC(a),(f) |
| CMO Series 2021-NPL3 Class A2 |
| 05/25/2051 | 3.967% | | 300,000 | 279,187 |
| CMO Series 2021-NPL6 Class A1 |
| 09/25/2051 | 1.917% | | 1,073,114 | 1,014,662 |
| Vericrest Opportunity Loan Transferee(a),(f) |
| CMO Series 2021-NPL4 Class A1 |
| 03/27/2051 | 2.240% | | 845,199 | 824,730 |
| Verus Securitization Trust(a) |
| CMO Series 2020-INV1 Class B1 |
| 03/25/2060 | 5.750% | | 150,000 | 145,994 |
| CMO Series 2020-INV1 Class M1 |
| 03/25/2060 | 5.500% | | 550,000 | 544,153 |
| Subordinated CMO Series 2020-INV1 Class B2 |
| 03/25/2060 | 6.000% | | 150,000 | 144,711 |
| Verus Securitization Trust(a),(f) |
| CMO Series 2020-NPL1 Class A2 |
| 08/25/2050 | 5.682% | | 1,250,000 | 1,249,505 |
| Subordinated CMO Series 2019-4 Class B1 |
| 11/25/2059 | 3.860% | | 500,000 | 492,507 |
| Subordinated CMO Series 2020-4 Class B1 |
| 05/25/2065 | 5.046% | | 150,000 | 146,506 |
| Subordinated CMO Series 2020-4 Class B2 |
| 05/25/2065 | 5.600% | | 327,000 | 314,481 |
| Subordinated Series 2021-5 Class B1 |
| 09/25/2066 | 3.037% | | 300,000 | 239,312 |
| Subordinated Series 2021-5 Class B2 |
| 09/25/2066 | 3.941% | | 250,000 | 187,140 |
| Visio Trust(a),(f) |
| CMO Series 2019-2 Class B1 |
| 11/25/2054 | 3.910% | | 100,000 | 95,227 |
| CMO Series 2019-2 Class M1 |
| 11/25/2054 | 3.260% | | 200,000 | 192,255 |
The accompanying Notes to Consolidated Financial Statements are an integral part of this statement.
Columbia Multi Strategy Alternatives Fund | Annual Report 2022
| 19 |
Consolidated Portfolio of Investments (continued)
May 31, 2022
| Residential Mortgage-Backed Securities - Non-Agency (continued) |
| Issuer | Coupon
Rate | | Principal
Amount ($) | Value ($) |
| Vista Point Securitization Trust(a),(f) |
| Subordinated CMO Series 2020-1 Class B1 |
| 03/25/2065 | 5.375% | | 800,000 | 795,272 |
Total Residential Mortgage-Backed Securities - Non-Agency
(Cost $131,557,571) | 127,159,889 |
|
| Treasury Bills 20.2% |
| Issuer | Yield | | Principal
Amount ($) | Value ($) |
| United States 20.2% |
| U.S. Treasury Bills(j) |
| 09/08/2022 | 1.120% | | 90,000,000 | 89,723,556 |
| U.S. Treasury Bills |
| 01/26/2023 | 1.710% | | 74,000,000 | 73,177,530 |
| Total | 162,901,086 |
Total Treasury Bills
(Cost $163,460,142) | 162,901,086 |
| Options Purchased Calls 0.1% |
| | | | | Value ($) |
| (Cost $1,813,770) | 1,169,255 |
|
| Options Purchased Puts 0.1% |
| | | | |
| (Cost $275,000) | 580,885 |
| Money Market Funds 40.4% |
| | Shares | Value ($) |
| Columbia Short-Term Cash Fund, 0.852%(k),(l) | 325,858,790 | 325,728,447 |
Total Money Market Funds
(Cost $325,769,438) | 325,728,447 |
Total Investments in Securities
(Cost: $816,658,180) | 804,549,085 |
| Other Assets & Liabilities, Net | | 2,069,898 |
| Net Assets | 806,618,983 |
At May 31, 2022, securities and/or cash totaling $83,489,983 were pledged as collateral.
Investments in derivatives
| Forward foreign currency exchange contracts |
Currency to
be sold | Currency to
be purchased | Counterparty | Settlement
date | Unrealized
appreciation ($) | Unrealized
depreciation ($) |
| 62,078,604 USD | 598,215,000 NOK | Barclays | 06/29/2022 | 1,763,240 | — |
| 44,514,000 AUD | 31,329,119 USD | Citi | 06/15/2022 | — | (623,493) |
| 7,737,000 BRL | 1,629,065 USD | Citi | 06/15/2022 | 7,342 | — |
| 136,674,332 BRL | 27,031,967 USD | Citi | 06/15/2022 | — | (1,615,813) |
| 58,981,000 CAD | 45,921,879 USD | Citi | 06/15/2022 | — | (705,752) |
| 23,158,000 CHF | 24,790,279 USD | Citi | 06/15/2022 | 628,668 | — |
| 9,854,000 CHF | 10,054,613 USD | Citi | 06/15/2022 | — | (226,435) |
| 11,738,582,750 CLP | 14,534,852 USD | Citi | 06/15/2022 | 319,358 | — |
| 2,194,186,250 CLP | 2,601,239 USD | Citi | 06/15/2022 | — | (55,934) |
| 175,835,438 CNH | 27,067,522 USD | Citi | 06/15/2022 | 738,382 | — |
| 49,414,000 CNH | 7,282,397 USD | Citi | 06/15/2022 | — | (116,727) |
| 67,250,425,000 COP | 16,659,415 USD | Citi | 06/15/2022 | — | (1,149,305) |
| 186,562,000 CZK | 8,151,125 USD | Citi | 06/15/2022 | 63,100 | — |
| 145,220,000 CZK | 6,036,032 USD | Citi | 06/15/2022 | — | (259,693) |
| 97,035,750 EUR | 107,587,326 USD | Citi | 06/15/2022 | 3,338,909 | — |
| 22,466,250 EUR | 23,714,294 USD | Citi | 06/15/2022 | — | (421,872) |
| 30,805,000 GBP | 40,614,955 USD | Citi | 06/15/2022 | 1,794,905 | — |
| 15,355,000 GBP | 19,254,770 USD | Citi | 06/15/2022 | — | (95,397) |
| 8,981,793,000 HUF | 25,706,216 USD | Citi | 06/15/2022 | 1,451,755 | — |
| 158,227,000 HUF | 426,142 USD | Citi | 06/15/2022 | — | (1,135) |
| 32,699,950,000 IDR | 2,266,042 USD | Citi | 06/15/2022 | 20,863 | — |
| 30,747,000 ILS | 9,533,736 USD | Citi | 06/15/2022 | 262,795 | — |
| 16,491,000 ILS | 4,838,493 USD | Citi | 06/15/2022 | — | (133,930) |
| 2,456,270,000 INR | 32,054,867 USD | Citi | 06/15/2022 | 463,101 | — |
| 405,055,000 INR | 5,202,283 USD | Citi | 06/15/2022 | — | (7,406) |
| 8,343,587,000 JPY | 69,936,947 USD | Citi | 06/15/2022 | 5,088,820 | — |
The accompanying Notes to Consolidated Financial Statements are an integral part of this statement.
| 20 | Columbia Multi Strategy Alternatives Fund | Annual Report 2022 |
Consolidated Portfolio of Investments (continued)
May 31, 2022
| Forward foreign currency exchange contracts (continued) |
Currency to
be sold | Currency to
be purchased | Counterparty | Settlement
date | Unrealized
appreciation ($) | Unrealized
depreciation ($) |
| 32,429,184,000 KRW | 26,912,369 USD | Citi | 06/15/2022 | 749,606 | — |
| 10,539,022,000 KRW | 8,311,848 USD | Citi | 06/15/2022 | — | (190,677) |
| 824,006,000 MXN | 40,482,963 USD | Citi | 06/15/2022 | — | (1,271,596) |
| 326,115,000 NOK | 33,807,326 USD | Citi | 06/15/2022 | — | (991,260) |
| 49,072,000 NZD | 32,632,644 USD | Citi | 06/15/2022 | 663,708 | — |
| 26,300,000 NZD | 16,737,943 USD | Citi | 06/15/2022 | — | (395,718) |
| 286,498,000 PHP | 5,506,208 USD | Citi | 06/15/2022 | 46,060 | — |
| 7,429,000 PHP | 140,880 USD | Citi | 06/15/2022 | — | (704) |
| 21,374,750 PLN | 5,133,474 USD | Citi | 06/15/2022 | 136,386 | — |
| 139,960,250 PLN | 31,744,277 USD | Citi | 06/15/2022 | — | (976,279) |
| 289,550,500 RUB | 3,697,025 USD | Citi | 06/15/2022 | — | (796,648) |
| 263,170,000 SEK | 27,542,488 USD | Citi | 06/15/2022 | 582,316 | — |
| 156,306,000 SEK | 15,719,534 USD | Citi | 06/15/2022 | — | (293,068) |
| 1,028,000 SGD | 757,880 USD | Citi | 06/15/2022 | 7,571 | — |
| 5,715,000 SGD | 4,131,773 USD | Citi | 06/15/2022 | — | (39,449) |
| 283,966,000 TWD | 10,185,799 USD | Citi | 06/15/2022 | 389,850 | — |
| 10,790,000 TWD | 367,472 USD | Citi | 06/15/2022 | — | (4,749) |
| 4,685,970 USD | 6,630,000 AUD | Citi | 06/15/2022 | 73,113 | — |
| 28,007,123 USD | 37,884,000 AUD | Citi | 06/15/2022 | — | (813,597) |
| 26,354,267 USD | 136,119,332 BRL | Citi | 06/15/2022 | 2,177,183 | — |
| 1,745,998 USD | 8,292,000 BRL | Citi | 06/15/2022 | — | (7,944) |
| 37,556,333 USD | 47,809,000 CAD | Citi | 06/15/2022 | 239,236 | — |
| 8,917,144 USD | 11,172,000 CAD | Citi | 06/15/2022 | — | (85,082) |
| 29,929,505 USD | 29,079,000 CHF | Citi | 06/15/2022 | 409,707 | — |
| 4,270,606 USD | 3,933,000 CHF | Citi | 06/15/2022 | — | (167,160) |
| 2,093,867 USD | 1,810,611,000 CLP | Citi | 06/15/2022 | 98,794 | — |
| 14,901,481 USD | 12,122,158,000 CLP | Citi | 06/15/2022 | — | (221,475) |
| 23,097,351 USD | 154,566,000 CNH | Citi | 06/15/2022 | 46,959 | — |
| 11,097,376 USD | 70,683,438 CNH | Citi | 06/15/2022 | — | (513,422) |
| 17,041,022 USD | 67,250,425,000 COP | Citi | 06/15/2022 | 767,697 | — |
| 5,568,457 USD | 130,881,000 CZK | Citi | 06/15/2022 | 105,629 | — |
| 8,953,826 USD | 200,901,000 CZK | Citi | 06/15/2022 | — | (244,162) |
| 72,806,726 USD | 68,882,500 EUR | Citi | 06/15/2022 | 1,195,810 | — |
| 55,855,031 USD | 50,619,500 EUR | Citi | 06/15/2022 | — | (1,472,983) |
| 26,495,599 USD | 21,127,000 GBP | Citi | 06/15/2022 | 128,365 | — |
| 33,668,717 USD | 25,033,000 GBP | Citi | 06/15/2022 | — | (2,122,464) |
| 1,037,743 USD | 386,018,000 HUF | Citi | 06/15/2022 | 4,662 | — |
| 25,603,983 USD | 8,754,002,000 HUF | Citi | 06/15/2022 | — | (1,964,649) |
| 506,129 USD | 7,406,672,000 IDR | Citi | 06/15/2022 | 2,414 | — |
| 1,754,154 USD | 25,293,278,000 IDR | Citi | 06/15/2022 | — | (17,517) |
| 7,541,965 USD | 25,266,000 ILS | Citi | 06/15/2022 | 76,325 | — |
| 6,767,079 USD | 21,972,000 ILS | Citi | 06/15/2022 | — | (142,006) |
| 803,668 USD | 62,631,000 INR | Citi | 06/15/2022 | 1,872 | — |
| 36,409,800 USD | 2,798,694,000 INR | Citi | 06/15/2022 | — | (413,885) |
| 25,447,738 USD | 3,289,071,000 JPY | Citi | 06/15/2022 | 115,619 | — |
| 41,536,184 USD | 5,054,516,000 JPY | Citi | 06/15/2022 | — | (2,251,414) |
| 17,934,840 USD | 22,796,224,000 KRW | Citi | 06/15/2022 | 456,379 | — |
| 16,649,477 USD | 20,171,982,000 KRW | Citi | 06/15/2022 | — | (375,408) |
| 40,066,834 USD | 824,006,000 MXN | Citi | 06/15/2022 | 1,687,725 | — |
| 12,115,648 USD | 116,739,000 NOK | Citi | 06/15/2022 | 341,161 | — |
| 23,436,059 USD | 209,376,000 NOK | Citi | 06/15/2022 | — | (1,094,281) |
| 32,381,140 USD | 50,844,000 NZD | Citi | 06/15/2022 | 742,201 | — |
| 16,849,636 USD | 24,528,000 NZD | Citi | 06/15/2022 | — | (870,380) |
| 2,724,115 USD | 144,125,000 PHP | Citi | 06/15/2022 | 22,654 | — |
| 2,894,187 USD | 149,802,000 PHP | Citi | 06/15/2022 | — | (39,225) |
| 28,749,830 USD | 125,295,625 PLN | Citi | 06/15/2022 | 542,362 | — |
| 8,831,921 USD | 36,039,375 PLN | Citi | 06/15/2022 | — | (406,469) |
| 2,835,891 USD | 289,550,500 RUB | Citi | 06/15/2022 | 1,657,782 | — |
The accompanying Notes to Consolidated Financial Statements are an integral part of this statement.
Columbia Multi Strategy Alternatives Fund | Annual Report 2022
| 21 |
Consolidated Portfolio of Investments (continued)
May 31, 2022
| Forward foreign currency exchange contracts (continued) |
Currency to
be sold | Currency to
be purchased | Counterparty | Settlement
date | Unrealized
appreciation ($) | Unrealized
depreciation ($) |
| 9,976,262 USD | 99,923,000 SEK | Citi | 06/15/2022 | 260,244 | — |
| 33,802,200 USD | 319,553,000 SEK | Citi | 06/15/2022 | — | (1,065,931) |
| 4,993,783 USD | 6,743,000 SGD | Citi | 06/15/2022 | — | (72,252) |
| 8,705,559 USD | 257,911,500 TWD | Citi | 06/15/2022 | 191,590 | — |
| 2,464,128 USD | 39,170,000 ZAR | Citi | 06/15/2022 | 35,328 | — |
| 15,520,993 USD | 235,050,000 ZAR | Citi | 06/15/2022 | — | (522,343) |
| 119,888,000 ZAR | 7,923,330 USD | Citi | 06/15/2022 | 273,221 | — |
| 154,332,000 ZAR | 9,668,878 USD | Citi | 06/15/2022 | — | (179,119) |
| 59,267,000 EUR | 63,245,124 USD | Citi | 06/29/2022 | — | (476,976) |
| 671,000 AUD | 473,704 USD | Citi | 09/21/2022 | — | (8,474) |
| 13,008,000 BRL | 2,550,627 USD | Citi | 09/21/2022 | — | (100,437) |
| 9,885,000 CAD | 7,696,751 USD | Citi | 09/21/2022 | — | (114,936) |
| 30,262,000 CHF | 31,343,122 USD | Citi | 09/21/2022 | — | (432,202) |
| 1,165,533,000 CLP | 1,369,003 USD | Citi | 09/21/2022 | — | (16,083) |
| 174,482,000 CNH | 25,990,866 USD | Citi | 09/21/2022 | — | (78,151) |
| 32,921,860,000 COP | 8,092,030 USD | Citi | 09/21/2022 | — | (487,374) |
| 7,069,500 EUR | 7,641,235 USD | Citi | 09/21/2022 | 2,774 | — |
| 57,603,500 EUR | 61,196,352 USD | Citi | 09/21/2022 | — | (1,043,136) |
| 19,476,000 GBP | 24,469,130 USD | Citi | 09/21/2022 | — | (96,890) |
| 1,363,036,000 HUF | 3,704,458 USD | Citi | 09/21/2022 | 73,812 | — |
| 2,781,609,000 IDR | 188,574 USD | Citi | 09/21/2022 | — | (1,885) |
| 27,952,000 ILS | 8,391,634 USD | Citi | 09/21/2022 | — | (86,891) |
| 7,438,000 INR | 94,747 USD | Citi | 09/21/2022 | 94 | — |
| 230,560,000 JPY | 1,818,516 USD | Citi | 09/21/2022 | 16,794 | — |
| 25,404,574,000 KRW | 19,988,148 USD | Citi | 09/21/2022 | — | (482,273) |
| 91,318,000 MXN | 4,497,002 USD | Citi | 09/21/2022 | — | (40,820) |
| 92,563,000 NOK | 9,590,492 USD | Citi | 09/21/2022 | — | (302,624) |
| 51,157,000 NZD | 32,540,412 USD | Citi | 09/21/2022 | — | (724,598) |
| 115,678,000 PHP | 2,185,736 USD | Citi | 09/21/2022 | 3,802 | — |
| 7,534,000 PLN | 1,723,625 USD | Citi | 09/21/2022 | — | (13,307) |
| 257,911,500 TWD | 8,771,682 USD | Citi | 09/21/2022 | — | (201,840) |
| 29,726,499 USD | 42,130,000 AUD | Citi | 09/21/2022 | 547,951 | — |
| 2,460,561 USD | 12,290,332 BRL | Citi | 09/21/2022 | 44,240 | — |
| 24,606,413 USD | 31,538,000 CAD | Citi | 09/21/2022 | 316,702 | — |
| 15,883,834 USD | 15,253,000 CHF | Citi | 09/21/2022 | 131,929 | — |
| 2,384,125 USD | 2,046,577,250 CLP | Citi | 09/21/2022 | 47,970 | — |
| 344,107 USD | 288,931,750 CLP | Citi | 09/21/2022 | — | (749) |
| 8,237,972 USD | 33,406,377,000 COP | Citi | 09/21/2022 | 467,696 | — |
| 5,083,559 USD | 118,606,000 CZK | Citi | 09/21/2022 | — | (2,394) |
| 26,343,893 USD | 24,892,250 EUR | Citi | 09/21/2022 | 551,710 | — |
| 1,799,453 USD | 1,664,750 EUR | Citi | 09/21/2022 | — | (723) |
| 3,688,071 USD | 2,940,000 GBP | Citi | 09/21/2022 | 20,293 | — |
| 438,048 USD | 163,305,000 HUF | Citi | 09/21/2022 | — | (3,061) |
| 26 USD | 383,000 IDR | Citi | 09/21/2022 | — | — |
| 2,264,977 USD | 177,726,000 INR | Citi | 09/21/2022 | — | (3,298) |
| 4,055,262 USD | 514,777,000 JPY | Citi | 09/21/2022 | — | (32,512) |
| 3,856,961 USD | 4,929,717,000 KRW | Citi | 09/21/2022 | 115,291 | — |
| 9,808,949 USD | 199,153,000 MXN | Citi | 09/21/2022 | 87,468 | — |
| 31,214,110 USD | 301,075,000 NOK | Citi | 09/21/2022 | 964,727 | — |
| 227,705 USD | 354,000 NZD | Citi | 09/21/2022 | 2,485 | — |
| 1,938,839 USD | 102,417,000 PHP | Citi | 09/21/2022 | — | (7,035) |
| 595,428 USD | 2,605,000 PLN | Citi | 09/21/2022 | 5,144 | — |
| 14,569,351 USD | 144,313,000 SEK | Citi | 09/21/2022 | 265,618 | — |
| 6,493,275 USD | 8,948,000 SGD | Citi | 09/21/2022 | 40,446 | — |
| 9,010,311 USD | 145,249,000 ZAR | Citi | 09/21/2022 | 160,043 | — |
| 57,969,000 ZAR | 3,602,401 USD | Citi | 09/21/2022 | — | (57,494) |
| 386,749,000 NOK | 42,357,133 USD | Goldman Sachs International | 06/10/2022 | 1,090,450 | — |
| 48,992,289 USD | 45,663,000 EUR | Goldman Sachs International | 06/10/2022 | 51,143 | — |
The accompanying Notes to Consolidated Financial Statements are an integral part of this statement.
| 22 | Columbia Multi Strategy Alternatives Fund | Annual Report 2022 |
Consolidated Portfolio of Investments (continued)
May 31, 2022
| Forward foreign currency exchange contracts (continued) |
Currency to
be sold | Currency to
be purchased | Counterparty | Settlement
date | Unrealized
appreciation ($) | Unrealized
depreciation ($) |
| 60,870,000 CHF | 63,165,318 USD | Goldman Sachs International | 06/29/2022 | — | (395,216) |
| 8,149,100,000 JPY | 63,896,190 USD | Goldman Sachs International | 06/29/2022 | 521,764 | — |
| 7,750,000 AUD | 5,836,631 USD | Morgan Stanley | 06/15/2022 | 273,601 | — |
| 44,335,000 BRL | 8,480,785 USD | Morgan Stanley | 06/15/2022 | — | (812,104) |
| 42,950,000 CAD | 33,509,837 USD | Morgan Stanley | 06/15/2022 | — | (444,433) |
| 22,350,000 CHF | 23,824,094 USD | Morgan Stanley | 06/15/2022 | 505,500 | — |
| 13,600,000 EUR | 14,897,092 USD | Morgan Stanley | 06/15/2022 | 286,204 | — |
| 28,700,000 GBP | 37,679,437 USD | Morgan Stanley | 06/15/2022 | 1,512,080 | — |
| 480,000,000 JPY | 4,157,877 USD | Morgan Stanley | 06/15/2022 | 427,215 | — |
| 27,068,405,000 KRW | 21,998,342 USD | Morgan Stanley | 06/15/2022 | 160,473 | — |
| 108,015,000 MXN | 5,339,875 USD | Morgan Stanley | 06/15/2022 | — | (133,530) |
| 65,400,000 NZD | 45,113,285 USD | Morgan Stanley | 06/15/2022 | 2,507,147 | — |
| 31,170,000 PLN | 7,367,053 USD | Morgan Stanley | 06/15/2022 | 79,986 | — |
| 5,670,000 PLN | 1,242,059 USD | Morgan Stanley | 06/15/2022 | — | (83,500) |
| 488,750,000 SEK | 51,815,997 USD | Morgan Stanley | 06/15/2022 | 1,746,521 | — |
| 138,170,000 TRY | 8,630,897 USD | Morgan Stanley | 06/15/2022 | 348,510 | — |
| 31,554,484 USD | 43,650,000 AUD | Morgan Stanley | 06/15/2022 | — | (222,063) |
| 8,974,677 USD | 43,450,000 BRL | Morgan Stanley | 06/15/2022 | 132,711 | — |
| 55,165,287 USD | 68,950,000 CAD | Morgan Stanley | 06/15/2022 | — | (656,628) |
| 20,424,387 USD | 18,850,000 CHF | Morgan Stanley | 06/15/2022 | — | (757,474) |
| 447,944 USD | 400,000 EUR | Morgan Stanley | 06/15/2022 | — | (18,212) |
| 4,996,534 USD | 389,250,000 INR | Morgan Stanley | 06/15/2022 | 9,876 | — |
| 7,868,818 USD | 599,840,000 INR | Morgan Stanley | 06/15/2022 | — | (153,866) |
| 16,261,594 USD | 1,980,000,000 JPY | Morgan Stanley | 06/15/2022 | — | (872,614) |
| 11,246,880 USD | 244,650,000 MXN | Morgan Stanley | 06/15/2022 | 1,150,182 | — |
| 48,072,813 USD | 426,000,000 NOK | Morgan Stanley | 06/15/2022 | — | (2,615,849) |
| 16,925,141 USD | 168,000,000 SEK | Morgan Stanley | 06/15/2022 | 285,441 | — |
| 21,378,569 USD | 328,515,000 ZAR | Morgan Stanley | 06/15/2022 | — | (415,874) |
| 95,638,000 NZD | 62,088,190 USD | UBS | 06/29/2022 | — | (203,709) |
| 63,385,604 USD | 80,256,000 CAD | UBS | 06/29/2022 | 56,369 | — |
| 63,296,660 USD | 50,382,000 GBP | UBS | 06/29/2022 | 198,767 | — |
| 61,878,742 USD | 95,638,000 NZD | UBS | 06/29/2022 | 413,156 | — |
| Total | | | | 45,794,852 | (38,037,443) |
| Long futures contracts |
| Description | Number of
contracts | Expiration
date | Trading
currency | Notional
amount | Value/Unrealized
appreciation ($) | Value/Unrealized
depreciation ($) |
| Amsterdam Index | 1 | 06/2022 | EUR | 142,482 | 3,034 | — |
| Australian 10-Year Bond | 176 | 06/2022 | AUD | 21,510,354 | — | (1,014,452) |
| Australian 10-Year Bond | 344 | 06/2022 | AUD | 42,042,964 | — | (1,921,665) |
| Bist 30 Index | 3,202 | 06/2022 | TRY | 95,035,360 | 278,918 | — |
| Brent Crude | 7 | 06/2022 | USD | 809,200 | 36,177 | — |
| Brent Crude | 37 | 10/2022 | USD | 3,909,790 | 540,989 | — |
| CAC40 Index | 223 | 06/2022 | EUR | 14,397,995 | 259,511 | — |
| CAC40 Index | 64 | 06/2022 | EUR | 4,132,160 | 80,990 | — |
| Copper | 1 | 07/2022 | USD | 107,400 | 1,635 | — |
| Copper | 21 | 07/2022 | USD | 2,255,400 | — | (4,204) |
| Copper | 4 | 09/2022 | USD | 944,900 | 1,267 | — |
| DAX Index | 40 | 06/2022 | EUR | 14,377,000 | 281,027 | — |
| EURO STOXX 50 Index | 590 | 06/2022 | EUR | 22,325,600 | 1,019,274 | — |
| EURO STOXX 50 Index | 586 | 06/2022 | EUR | 22,174,240 | — | (218,347) |
| Euro-Bund | 330 | 06/2022 | EUR | 50,018,100 | — | (1,371,701) |
| Euro-Bund | 178 | 09/2022 | EUR | 27,043,540 | — | (124,281) |
| Euro-OAT | 185 | 06/2022 | EUR | 26,656,650 | — | (525,873) |
| Euro-Schatz | 9 | 06/2022 | EUR | 991,080 | — | (1,513) |
| FTSE 100 Index | 391 | 06/2022 | GBP | 29,659,305 | 852,769 | — |
| FTSE 100 Index | 64 | 06/2022 | GBP | 4,854,720 | 49,279 | — |
The accompanying Notes to Consolidated Financial Statements are an integral part of this statement.
Columbia Multi Strategy Alternatives Fund | Annual Report 2022
| 23 |
Consolidated Portfolio of Investments (continued)
May 31, 2022
| Long futures contracts (continued) |
| Description | Number of
contracts | Expiration
date | Trading
currency | Notional
amount | Value/Unrealized
appreciation ($) | Value/Unrealized
depreciation ($) |
| FTSE/JSE Top 40 Index | 395 | 06/2022 | ZAR | 258,807,950 | 32,796 | — |
| FTSE/MIB Index | 67 | 06/2022 | EUR | 8,210,180 | 376,644 | — |
| FTSE/MIB Index | 52 | 06/2022 | EUR | 6,372,080 | 237,668 | — |
| Gold 100 oz. | 7 | 08/2022 | USD | 1,293,880 | — | (6,807) |
| IBEX 35 Index | 118 | 06/2022 | EUR | 10,410,786 | 478,684 | — |
| Japanese 10-Year Government Bond | 38 | 06/2022 | JPY | 5,686,700,000 | 62,420 | — |
| Japanese 10-Year Government Bond | 23 | 06/2022 | JPY | 3,441,950,000 | 5,752 | — |
| Long Gilt | 10 | 09/2022 | GBP | 1,159,700 | — | (30,206) |
| Long Gilt | 313 | 09/2022 | GBP | 36,298,610 | — | (741,936) |
| Natural Gas | 35 | 06/2022 | USD | 2,850,750 | 248,056 | — |
| NY Harbor ULSD Heat Oil | 29 | 06/2022 | USD | 4,792,830 | 315,818 | — |
| NY Harbor ULSD Heat Oil | 1 | 06/2022 | USD | 165,270 | 11,388 | — |
| OMXS30 Index | 247 | 06/2022 | SEK | 50,474,450 | 61,692 | — |
| OMXS30 Index | 15 | 06/2022 | SEK | 3,065,250 | 1,858 | — |
| Primary Aluminum | 17 | 06/2022 | USD | 1,174,594 | — | (7,518) |
| Primary Aluminum | 9 | 09/2022 | USD | 627,975 | — | (35,139) |
| RBOB Gasoline | 12 | 06/2022 | USD | 1,973,765 | 165,901 | — |
| RBOB Gasoline | 1 | 06/2022 | USD | 164,480 | 12,846 | — |
| Silver | 35 | 07/2022 | USD | 3,795,400 | — | (49,056) |
| Soybean | 24 | 07/2022 | USD | 2,019,900 | — | (13,771) |
| SPI 200 Index | 322 | 06/2022 | AUD | 58,056,600 | — | (595,999) |
| Sugar #11 | 30 | 06/2022 | USD | 651,840 | 22,659 | — |
| Thai SET50 Index | 129 | 06/2022 | THB | 25,748,400 | 13,960 | — |
| TOPIX Index | 110 | 06/2022 | JPY | 2,099,900,000 | 79,940 | — |
| U.S. Treasury 10-Year Note | 1,070 | 09/2022 | USD | 127,814,844 | 49,314 | — |
| U.S. Treasury 10-Year Note | 46 | 09/2022 | USD | 5,494,844 | — | (25,529) |
| U.S. Ultra Treasury Bond | 95 | 09/2022 | USD | 14,796,250 | — | (274,684) |
| WIG 20 Index | 701 | 06/2022 | PLN | 25,908,960 | — | (173,039) |
| WTI Crude | 49 | 06/2022 | USD | 5,618,830 | 600,832 | — |
| WTI Crude | 17 | 06/2022 | USD | 1,949,390 | 39,649 | — |
| Zinc | 41 | 06/2022 | USD | 4,027,225 | 41,205 | — |
| Zinc | 3 | 09/2022 | USD | 293,625 | 16,366 | — |
| Total | | | | | 6,280,318 | (7,135,720) |
| Short futures contracts |
| Description | Number of
contracts | Expiration
date | Trading
currency | Notional
amount | Value/Unrealized
appreciation ($) | Value/Unrealized
depreciation ($) |
| Australian 3-Year Bond | (107) | 06/2022 | AUD | (11,636,851) | 188,114 | — |
| Canadian Government 10-Year Bond | (386) | 09/2022 | CAD | (49,025,860) | 324,344 | — |
| Canadian Government 10-Year Bond | (73) | 09/2022 | CAD | (9,271,730) | 75,713 | — |
| Coffee | (18) | 07/2022 | USD | (1,560,938) | — | (181,949) |
| Corn | (97) | 07/2022 | USD | (3,654,475) | 259,194 | — |
| Corn | (44) | 07/2022 | USD | (1,657,700) | 61,917 | — |
| Cotton | (38) | 07/2022 | USD | (2,640,620) | 111,962 | — |
| DAX Index | (80) | 06/2022 | EUR | (28,754,000) | — | (288,670) |
| DJIA Index E-mini | (9) | 06/2022 | USD | (1,483,695) | 26,647 | — |
| EURO STOXX 50 Index | (35) | 06/2022 | EUR | (1,324,400) | — | (55,033) |
| Euro-Bobl | (4) | 06/2022 | EUR | (505,960) | 4,178 | — |
| Euro-Bobl | (1) | 09/2022 | EUR | (125,220) | 310 | — |
| Euro-BTP | (109) | 06/2022 | EUR | (13,828,830) | 266,857 | — |
| Euro-Bund | (76) | 06/2022 | EUR | (11,519,320) | 204,847 | — |
| Euro-Buxl 30-Year | (3) | 09/2022 | EUR | (521,640) | 5,150 | — |
| Euro-OAT | (19) | 09/2022 | EUR | (2,695,720) | 11,197 | — |
| FTSE 100 Index | (226) | 06/2022 | GBP | (17,143,230) | — | (847,946) |
| FTSE China A50 Index | (594) | 06/2022 | USD | (8,052,264) | — | (312,390) |
| FTSE Taiwan Index | (3) | 06/2022 | USD | (174,000) | — | (5,884) |
| FTSE Taiwan Index | (90) | 06/2022 | USD | (5,220,000) | — | (185,354) |
The accompanying Notes to Consolidated Financial Statements are an integral part of this statement.
| 24 | Columbia Multi Strategy Alternatives Fund | Annual Report 2022 |
Consolidated Portfolio of Investments (continued)
May 31, 2022
| Short futures contracts (continued) |
| Description | Number of
contracts | Expiration
date | Trading
currency | Notional
amount | Value/Unrealized
appreciation ($) | Value/Unrealized
depreciation ($) |
| FTSE/JSE Top 40 Index | (179) | 06/2022 | ZAR | (117,282,590) | — | (347,013) |
| Gold 100 oz. | (3) | 08/2022 | USD | (554,520) | — | (1,956) |
| IBEX 35 Index | (14) | 06/2022 | EUR | (1,235,178) | — | (46,197) |
| KLCI Index | (39) | 06/2022 | MYR | (3,040,050) | — | (7,453) |
| KOSPI 200 Index | (68) | 06/2022 | KRW | (6,020,550,000) | — | (62,242) |
| Lead | (4) | 09/2022 | USD | (218,800) | — | (1,811) |
| Lean Hogs | (26) | 06/2022 | USD | (1,122,940) | — | (28,387) |
| Live Cattle | (69) | 08/2022 | USD | (3,598,350) | 65,936 | — |
| Long Gilt | (530) | 09/2022 | GBP | (61,464,100) | 1,371,614 | — |
| Mexican Bolsa IPC Index | (8) | 06/2022 | MXN | (4,143,040) | 6,033 | — |
| Mexican Bolsa IPC Index | (153) | 06/2022 | MXN | (79,235,640) | 3,200 | — |
| MSCI EAFE Index | (4) | 06/2022 | USD | (407,400) | — | (848) |
| MSCI Emerging Markets Index | (342) | 06/2022 | USD | (18,182,430) | — | (231,368) |
| MSCI Singapore Index | (48) | 06/2022 | SGD | (1,441,440) | — | (18,924) |
| NASDAQ 100 Index E-mini | (29) | 06/2022 | USD | (7,334,970) | 395,836 | — |
| Natural Gas | (10) | 06/2022 | USD | (814,500) | 24,842 | — |
| Nickel | (12) | 06/2022 | USD | (2,041,056) | 153,560 | — |
| Nickel | (7) | 09/2022 | USD | (1,193,682) | — | (91,800) |
| Nikkei 225 Index | (11) | 06/2022 | JPY | (299,860,000) | — | (144,489) |
| Russell 2000 Index E-mini | (19) | 06/2022 | USD | (1,768,805) | 133,967 | — |
| S&P 500 Index E-mini | (364) | 06/2022 | USD | (75,188,750) | 5,167,908 | — |
| S&P 500 Index E-mini | (132) | 06/2022 | USD | (27,266,250) | 84,191 | — |
| S&P Mid 400 Index E-mini | (4) | 06/2022 | USD | (1,005,280) | 16,181 | — |
| S&P/TSX 60 Index | (105) | 06/2022 | CAD | (26,323,500) | 264,179 | — |
| S&P/TSX 60 Index | (15) | 06/2022 | CAD | (3,760,500) | 58,530 | — |
| S&P/TSX 60 Index | (28) | 06/2022 | CAD | (7,019,600) | — | (74,186) |
| SGX CNX Nifty Index | (123) | 06/2022 | USD | (4,073,760) | — | (110,024) |
| SGX CNX Nifty Index | (456) | 06/2022 | USD | (15,102,720) | — | (346,181) |
| Silver | (2) | 07/2022 | USD | (216,880) | 23,566 | — |
| Soybean | (32) | 07/2022 | USD | (2,693,200) | — | (42,368) |
| Soybean Meal | (45) | 07/2022 | USD | (1,866,600) | 47,076 | — |
| Soybean Oil | (1) | 07/2022 | USD | (46,752) | 2,291 | — |
| Soybean Oil | (1) | 07/2022 | USD | (46,752) | 703 | — |
| SPI 200 Index | (11) | 06/2022 | AUD | (1,983,300) | — | (20,971) |
| TOPIX Index | (89) | 06/2022 | JPY | (1,699,010,000) | — | (87,995) |
| U.S. Long Bond | (27) | 09/2022 | USD | (3,764,813) | 43,873 | — |
| U.S. Treasury 10-Year Note | (484) | 09/2022 | USD | (57,815,313) | 341,786 | — |
| U.S. Treasury 2-Year Note | (143) | 09/2022 | USD | (30,187,523) | 22,344 | — |
| U.S. Treasury 5-Year Note | (309) | 09/2022 | USD | (34,902,516) | 124,467 | — |
| U.S. Treasury 5-Year Note | (844) | 09/2022 | USD | (95,332,438) | — | (101,331) |
| U.S. Ultra Treasury Bond | (87) | 09/2022 | USD | (13,550,250) | 231,950 | — |
| Wheat | (80) | 07/2022 | USD | (4,350,000) | 164,768 | — |
| Wheat | (13) | 07/2022 | USD | (706,875) | 23,183 | — |
| Total | | | | | 10,312,414 | (3,642,770) |
| Put option contracts purchased |
| Description | Counterparty | Trading
currency | Notional
amount | Number of
contracts | Exercise
price/Rate | Expiration
date | Cost ($) | Value ($) |
| 10-Year OTC interest rate swap with Morgan Stanley to receive SOFR and pay exercise rate | Morgan Stanley | USD | 12,500,000 | 12,500,000 | 2.25 | 09/30/2022 | 275,000 | 580,885 |
The accompanying Notes to Consolidated Financial Statements are an integral part of this statement.
Columbia Multi Strategy Alternatives Fund | Annual Report 2022
| 25 |
Consolidated Portfolio of Investments (continued)
May 31, 2022
| Call option contracts purchased |
| Description | Counterparty | Trading
currency | Notional
amount | Number of
contracts | Exercise
price/Rate | Expiration
date | Cost ($) | Value ($) |
| 10-Year OTC interest rate swap with Citi to receive exercise rate and pay 3-Month USD LIBOR BBA | Citi | USD | 17,500,000 | 17,500,000 | 1.00 | 07/08/2022 | 178,500 | 2 |
| 10-Year OTC interest rate swap with Citi to receive exercise rate and pay SOFR | Citi | USD | 7,450,000 | 7,450,000 | 2.25 | 04/27/2023 | 178,800 | 114,524 |
| 10-Year OTC interest rate swap with Citi to receive exercise rate and pay SOFR | Citi | USD | 14,160,000 | 14,160,000 | 2.50 | 05/12/2023 | 423,384 | 335,211 |
| 10-Year OTC interest rate swap with Morgan Stanley to receive exercise rate and pay SOFR | Morgan Stanley | USD | 25,000,000 | 25,000,000 | 2.25 | 04/27/2023 | 596,250 | 384,307 |
| 10-Year OTC interest rate swap with Morgan Stanley to receive exercise rate and pay SOFR | Morgan Stanley | USD | 14,160,000 | 14,160,000 | 2.50 | 05/12/2023 | 436,836 | 335,211 |
| Total | | | | | | | 1,813,770 | 1,169,255 |
| Put option contracts written |
| Description | Counterparty | Trading
currency | Notional
amount | Number of
contracts | Exercise
price/Rate | Expiration
date | Premium
received ($) | Value ($) |
| 10-Year OTC interest rate swap with Citi to receive exercise rate and pay SOFR | Citi | USD | (15,000,000) | (15,000,000) | 2.55 | 07/13/2022 | (240,000) | (286,701) |
| 10-Year OTC interest rate swap with Morgan Stanley to receive exercise rate and pay SOFR | Morgan Stanley | USD | (30,000,000) | (30,000,000) | 2.65 | 07/14/2022 | (510,000) | (427,398) |
| 5-Year OTC interest rate swap with Citi to receive exercise rate and pay 3-Month USD LIBOR BBA | Citi | USD | (13,200,000) | (13,200,000) | 1.75 | 07/05/2022 | (102,300) | (700,374) |
| 5-Year OTC interest rate swap with Citi to receive exercise rate and pay 3-Month USD LIBOR BBA | Citi | USD | (22,900,000) | (22,900,000) | 1.85 | 07/07/2022 | (206,100) | (1,112,313) |
| 5-Year OTC interest rate swap with Citi to receive exercise rate and pay 3-Month USD LIBOR BBA | Citi | USD | (25,000,000) | (25,000,000) | 2.00 | 08/03/2022 | (225,000) | (1,061,590) |
| 5-Year OTC interest rate swap with Citi to receive exercise rate and pay 3-Month USD LIBOR BBA | Citi | USD | (32,000,000) | (32,000,000) | 2.10 | 08/10/2022 | (384,000) | (1,224,486) |
| Total | | | | | | | (1,667,400) | (4,812,862) |
| Cleared interest rate swap contracts |
| Fund receives | Fund pays | Payment
frequency | Counterparty | Maturity
date | Notional
currency | Notional
amount | Value
($) | Upfront
payments
($) | Upfront
receipts
($) | Unrealized
appreciation
($) | Unrealized
depreciation
($) |
| 3-Month NZD LIBOR | Fixed rate of 2.500% | Receives Quarterly, Pays SemiAnnually | JPMorgan | 06/12/2024 | NZD | 26,700,000 | 368,486 | — | — | 368,486 | — |
| 3-Month NZD LIBOR | Fixed rate of 3.000% | Receives Quarterly, Pays SemiAnnually | JPMorgan | 06/12/2024 | NZD | 10,900,000 | 145,601 | — | — | 145,601 | — |
| Fixed rate of 1.500% | 3-Month AUD BBSW | Receives SemiAnnually, Pays Quarterly | JPMorgan | 06/13/2024 | AUD | 45,300,000 | (775,890) | — | — | — | (775,890) |
| SONIA | Fixed rate of 0.500% | Receives Annually, Pays Annually | JPMorgan | 06/15/2024 | GBP | 189,400,000 | 2,543,411 | — | — | 2,543,411 | — |
| SOFR | Fixed rate of 0.500% | Receives Annually, Pays Annually | JPMorgan | 06/15/2024 | USD | 74,600,000 | 1,563,861 | — | — | 1,563,861 | — |
| Fixed rate of -0.500% | 6-Month EURIBOR | Receives Annually, Pays SemiAnnually | JPMorgan | 06/15/2024 | EUR | 108,900,000 | (2,059,859) | — | — | — | (2,059,859) |
| 3-Month NZD LIBOR | Fixed rate of 3.500% | Receives Quarterly, Pays SemiAnnually | JPMorgan | 09/11/2024 | NZD | 1,000,000 | 5,531 | — | — | 5,531 | — |
| Fixed rate of 4.000% | 3-Month NZD LIBOR | Receives SemiAnnually, Pays Quarterly | JPMorgan | 09/11/2024 | NZD | 19,700,000 | (53,763) | — | — | — | (53,763) |
| 6-Month AUD BBSW | Fixed rate of 3.000% | Receives SemiAnnually, Pays SemiAnnually | JPMorgan | 09/12/2024 | AUD | 49,400,000 | 246,335 | — | — | 246,335 | — |
| 6-Month AUD BBSW | Fixed rate of 3.500% | Receives Quarterly, Pays Quarterly | JPMorgan | 09/12/2024 | AUD | 29,200,000 | (80,768) | — | — | — | (80,768) |
| Fixed rate of 2.000% | 3-Month AUD BBSW | Receives Quarterly, Pays Quarterly | JPMorgan | 09/12/2024 | AUD | 14,800,000 | (159,311) | — | — | — | (159,311) |
The accompanying Notes to Consolidated Financial Statements are an integral part of this statement.
| 26 | Columbia Multi Strategy Alternatives Fund | Annual Report 2022 |
Consolidated Portfolio of Investments (continued)
May 31, 2022
| Cleared interest rate swap contracts (continued) |
| Fund receives | Fund pays | Payment
frequency | Counterparty | Maturity
date | Notional
currency | Notional
amount | Value
($) | Upfront
payments
($) | Upfront
receipts
($) | Unrealized
appreciation
($) | Unrealized
depreciation
($) |
| 3-Month SEK STIBOR | Fixed rate of 2.500% | Receives Quarterly, Pays Quarterly | JPMorgan | 09/18/2024 | SEK | 16,300,000 | 55 | — | — | 55 | — |
| 3-Month SEK STIBOR | Fixed rate of 2.000% | Receives Quarterly, Pays Annually | JPMorgan | 09/18/2024 | SEK | 68,600,000 | 24 | — | — | 24 | — |
| 6-Month NOK NIBOR | Fixed rate of 0.030% | Receives SemiAnnually, Pays Annually | JPMorgan | 09/18/2024 | NOK | 355,700,000 | (29,190) | — | — | — | (29,190) |
| Fixed rate of 1.500% | 3-Month SEK STIBOR | Receives Annually, Pays Quarterly | JPMorgan | 09/18/2024 | SEK | 230,300,000 | (361,247) | — | — | — | (361,247) |
| Fixed rate of 2.500% | 6-Month NOK NIBOR | Receives Annually, Pays SemiAnnually | JPMorgan | 09/18/2024 | NOK | 624,000,000 | (524,942) | — | — | — | (524,942) |
| Fixed rate of 1.000% | 3-Month SEK STIBOR | Receives Annually, Pays Quarterly | JPMorgan | 09/18/2024 | SEK | 600,800,000 | (1,253,888) | — | — | — | (1,253,888) |
| 3-Month CAD Canada Bankers’ Acceptances | Fixed rate of 2.000% | Receives Quarterly, Pays SemiAnnually | JPMorgan | 09/19/2024 | CAD | 75,800,000 | 25,840 | — | — | 25,840 | — |
| 3-Month CAD Canada Bankers’ Acceptances | Fixed rate of 2.000% | Receives Quarterly, Pays SemiAnnually | JPMorgan | 09/19/2024 | CAD | 33,100,000 | (12,007) | — | — | — | (12,007) |
| SONIA | Fixed rate of 0.020% | Receives Annually, Pays Annually | JPMorgan | 09/21/2024 | GBP | 190,400,000 | 964,058 | — | — | 964,058 | — |
| SONIA | Fixed rate of 1.000% | Receives Annually, Pays Annually | JPMorgan | 09/21/2024 | GBP | 37,900,000 | 701,425 | — | — | 701,425 | — |
| SOFR | Fixed rate of 1.000% | Receives Annually, Pays Annually | JPMorgan | 09/21/2024 | USD | 8,600,000 | 186,401 | — | — | 186,401 | — |
| SOFR | Fixed rate of 2.000% | Receives Annually, Pays Annually | JPMorgan | 09/21/2024 | USD | 22,400,000 | 1,567 | — | — | 1,567 | — |
| Fixed rate of -0.250% | 6-Month EURIBOR | Receives Annually, Pays SemiAnnually | JPMorgan | 09/21/2024 | EUR | 23,200,000 | (474,003) | — | — | — | (474,003) |
| SOFR | Fixed rate of 2.000% | Receives Annually, Pays Annually | JPMorgan | 09/21/2024 | USD | 227,200,000 | (548,307) | — | — | — | (548,307) |
| Fixed rate of 0.005% | 6-Month EURIBOR | Receives Annually, Pays SemiAnnually | JPMorgan | 09/21/2024 | EUR | 219,400,000 | (1,137,832) | — | — | — | (1,137,832) |
| Fixed rate of 4.000% | 3-Month NZD LIBOR | Receives SemiAnnually, Pays Quarterly | JPMorgan | 12/11/2024 | NZD | 19,100,000 | (39,261) | — | — | — | (39,261) |
| 6-Month EURIBOR | Fixed rate of 0.750% | Receives SemiAnnually, Pays Annually | JPMorgan | 12/21/2024 | EUR | 5,000,000 | 21,830 | — | — | 21,830 | — |
| SOFR | Fixed rate of 2.000% | Receives Annually, Pays Annually | JPMorgan | 12/21/2024 | USD | 11,700,000 | 18,716 | — | — | 18,716 | — |
| SONIA | Fixed rate of 2.000% | Receives Annually, Pays Annually | JPMorgan | 12/21/2024 | GBP | 2,300,000 | 16,782 | — | — | 16,782 | — |
| 6-Month AUD BBSW | Fixed rate of 2.000% | Receives SemiAnnually, Pays SemiAnnually | JPMorgan | 06/10/2032 | AUD | 13,200,000 | 868,445 | — | — | 868,445 | — |
| Fixed rate of 1.250% | SOFR | Receives Annually, Pays Annually | JPMorgan | 06/15/2032 | USD | 2,700,000 | (204,066) | — | — | — | (204,066) |
| Fixed rate of 0.750% | SONIA | Receives Annually, Pays Annually | JPMorgan | 06/15/2032 | GBP | 14,400,000 | (1,014,259) | — | — | — | (1,014,259) |
| Fixed rate of 2.500% | 6-Month AUD BBSW | Receives SemiAnnually, Pays SemiAnnually | JPMorgan | 09/09/2032 | AUD | 800,000 | (8,025) | — | — | — | (8,025) |
| Fixed rate of 3.500% | 6-Month AUD BBSW | Receives SemiAnnually, Pays SemiAnnually | JPMorgan | 09/09/2032 | AUD | 1,700,000 | (28,168) | — | — | — | (28,168) |
| Fixed rate of 3.000% | 6-Month AUD BBSW | Receives SemiAnnually, Pays SemiAnnually | JPMorgan | 09/09/2032 | AUD | 1,400,000 | (40,885) | — | — | — | (40,885) |
| 3-Month SEK STIBOR | Fixed rate of 1.500% | Receives Quarterly, Pays Annually | JPMorgan | 09/15/2032 | SEK | 91,400,000 | 651,859 | — | — | 651,859 | — |
The accompanying Notes to Consolidated Financial Statements are an integral part of this statement.
Columbia Multi Strategy Alternatives Fund | Annual Report 2022
| 27 |
Consolidated Portfolio of Investments (continued)
May 31, 2022
| Cleared interest rate swap contracts (continued) |
| Fund receives | Fund pays | Payment
frequency | Counterparty | Maturity
date | Notional
currency | Notional
amount | Value
($) | Upfront
payments
($) | Upfront
receipts
($) | Unrealized
appreciation
($) | Unrealized
depreciation
($) |
| Fixed rate of 3.000% | 6-Month NOK NIBOR | Receives Annually, Pays SemiAnnually | JPMorgan | 09/15/2032 | NOK | 9,700,000 | 5,769 | — | — | 5,769 | — |
| Fixed rate of 3.000% | 3-Month NZD LIBOR | Receives SemiAnnually, Pays Quarterly | JPMorgan | 09/15/2032 | NZD | 300,000 | (13,473) | — | — | — | (13,473) |
| Fixed rate of 2.300% | 3-Month CAD Canada Bankers’ Acceptances | Receives SemiAnnually, Pays Quarterly | JPMorgan | 09/19/2032 | CAD | 11,000,000 | (108,112) | — | — | — | (108,112) |
| 6-Month EURIBOR | Fixed rate of 0.010% | Receives SemiAnnually, Pays Annually | JPMorgan | 09/21/2032 | EUR | 30,800,000 | 1,147,608 | — | — | 1,147,608 | — |
| 6-Month EURIBOR | Fixed rate of 0.250% | Receives SemiAnnually, Pays Annually | JPMorgan | 09/21/2032 | EUR | 1,900,000 | 145,753 | — | — | 145,753 | — |
| Fixed rate of 2.000% | SOFR | Receives Annually, Pays Annually | JPMorgan | 09/21/2032 | USD | 5,800,000 | 119,640 | — | — | 119,640 | — |
| 6-Month EURIBOR | Fixed rate of 0.010% | Receives SemiAnnually, Pays Annually | JPMorgan | 09/21/2032 | EUR | 5,800,000 | (88,356) | — | — | — | (88,356) |
| Fixed rate of 1.500% | SOFR | Receives Annually, Pays Annually | JPMorgan | 09/21/2032 | USD | 1,800,000 | (150,604) | — | — | — | (150,604) |
| Fixed rate of 2.000% | SOFR | Receives Annually, Pays Annually | JPMorgan | 09/21/2032 | USD | 21,300,000 | (471,840) | — | — | — | (471,840) |
| Fixed rate of 0.750% | SONIA | Receives Annually, Pays Annually | JPMorgan | 09/21/2032 | GBP | 8,200,000 | (644,183) | — | — | — | (644,183) |
| Fixed rate of 1.500% | SONIA | Receives Annually, Pays Annually | JPMorgan | 09/21/2032 | GBP | 20,700,000 | (1,052,445) | — | — | — | (1,052,445) |
| Fixed rate of 3.500% | 6-Month AUD BBSW | Receives SemiAnnually, Pays SemiAnnually | JPMorgan | 12/09/2032 | AUD | 1,700,000 | (16,847) | — | — | — | (16,847) |
| Fixed rate of 1.500% | SONIA | Receives Annually, Pays Annually | JPMorgan | 12/21/2032 | GBP | 500,000 | (14,119) | — | — | — | (14,119) |
| Fixed rate of 2.000% | SOFR | Receives Annually, Pays Annually | JPMorgan | 12/21/2032 | USD | 2,200,000 | (14,325) | — | — | — | (14,325) |
| Fixed rate of 1.750% | SOFR | Receives Annually, Pays Annually | JPMorgan | 09/21/2052 | USD | 2,000,000 | 17,319 | — | — | 17,319 | — |
| Fixed rate of 1.750% | SOFR | Receives Annually, Pays Annually | JPMorgan | 09/21/2052 | USD | 3,300,000 | (61,946) | — | — | — | (61,946) |
| Fixed rate of 0.108% | ESTR | Receives Annually, Pays Annually | Morgan Stanley | 01/05/2032 | EUR | 36,124,000 | (4,915,139) | — | — | — | (4,915,139) |
| 3-Month NZD LIBOR | Fixed rate of 2.744% | Receives Quarterly, Pays SemiAnnually | Morgan Stanley | 01/07/2032 | NZD | 41,822,537 | 2,380,257 | — | — | 2,380,257 | — |
| Fixed rate of 0.280% | ESTR | Receives Annually, Pays Annually | Morgan Stanley | 02/03/2032 | EUR | 9,600,000 | (1,161,120) | — | — | — | (1,161,120) |
| 3-Month CAD Canada Bankers’ Acceptances | Fixed rate of 2.240% | Receives SemiAnnually, Pays SemiAnnually | Morgan Stanley | 03/01/2032 | CAD | 18,170,000 | 1,349,378 | — | — | 1,349,378 | — |
| SOFR | Fixed rate of 1.631% | Receives Annually, Pays SemiAnnually | Morgan Stanley | 03/03/2032 | USD | 22,900,000 | 1,936,378 | — | — | 1,936,378 | — |
| 3-Month NZD LIBOR | Fixed rate of 3.025% | Receives Quarterly, Pays SemiAnnually | Morgan Stanley | 03/03/2032 | NZD | 24,500,000 | 1,134,337 | — | — | 1,134,337 | — |
| TONA | Fixed rate of 0.188% | Receives Annually, Pays Annually | Morgan Stanley | 03/03/2032 | JPY | 654,200,000 | 81,893 | — | — | 81,893 | — |
| Fixed rate of 0.497% | ESTR | Receives Annually, Pays Annually | Morgan Stanley | 03/03/2032 | EUR | 11,970,000 | (1,213,735) | — | — | — | (1,213,735) |
| SONIA | Fixed rate of 1.694% | Receives Annually, Pays Annually | Morgan Stanley | 04/01/2032 | GBP | 13,219,000 | 657,862 | — | — | 657,862 | — |
The accompanying Notes to Consolidated Financial Statements are an integral part of this statement.
| 28 | Columbia Multi Strategy Alternatives Fund | Annual Report 2022 |
Consolidated Portfolio of Investments (continued)
May 31, 2022
| Cleared interest rate swap contracts (continued) |
| Fund receives | Fund pays | Payment
frequency | Counterparty | Maturity
date | Notional
currency | Notional
amount | Value
($) | Upfront
payments
($) | Upfront
receipts
($) | Unrealized
appreciation
($) | Unrealized
depreciation
($) |
| 3-Month CAD Canada Bankers’ Acceptances | Fixed rate of 2.951% | Receives SemiAnnually, Pays SemiAnnually | Morgan Stanley | 04/01/2032 | CAD | 7,489,000 | 202,431 | — | — | 202,431 | — |
| Fixed rate of 1.910% | 3-Month SEK STIBOR | Receives Annually, Pays Quarterly | Morgan Stanley | 04/05/2032 | SEK | 174,854,000 | (912,026) | — | — | — | (912,026) |
| 6-Month AUD BBSW | Fixed rate of 3.674% | Receives SemiAnnually, Pays SemiAnnually | Morgan Stanley | 05/04/2032 | AUD | 29,000,000 | (21,612) | — | — | — | (21,612) |
| Fixed rate of 1.445% | ESTR | Receives Annually, Pays Annually | Morgan Stanley | 05/04/2032 | EUR | 29,517,000 | (335,223) | — | — | — | (335,223) |
| Fixed rate of 2.395% | 3-Month SEK STIBOR | Receives Annually, Pays Quarterly | Morgan Stanley | 05/05/2032 | SEK | 400,481,000 | (435,886) | — | — | — | (435,886) |
| 3-Month NZD LIBOR | Fixed rate of 4.140% | Receives Quarterly, Pays SemiAnnually | Morgan Stanley | 05/06/2032 | NZD | 40,300,000 | (455,750) | — | — | — | (455,750) |
| Total | | | | | | | (3,383,560) | — | — | 17,508,852 | (20,892,412) |
| Credit default swap contracts - sell protection |
Reference
entity | Counterparty | Maturity
date | Receive
fixed
rate
(%) | Payment
frequency | Implied
credit
spread
(%)* | Notional
currency | Notional
amount | Value
($) | Periodic
payments
receivable
(payable)
($) | Upfront
payments
($) | Upfront
receipts
($) | Unrealized
appreciation
($) | Unrealized
depreciation
($) |
| Markit CMBX North America Index, Series 13 BBB- | Goldman Sachs International | 12/16/2072 | 3.000 | Monthly | 5.703 | USD | 700,000 | (104,125) | 408 | — | (37,647) | — | (66,070) |
| Markit CMBX North America Index, Series 10 BBB- | Morgan Stanley | 11/17/2059 | 3.000 | Monthly | 6.799 | USD | 5,000,000 | (681,250) | 2,917 | — | (963,827) | 285,494 | — |
| Markit CMBX North America Index, Series 10 BBB- | Morgan Stanley | 11/17/2059 | 3.000 | Monthly | 6.799 | USD | 3,000,000 | (408,750) | 1,750 | — | (677,450) | 270,450 | — |
| Markit CMBX North America Index, Series 10 BBB- | Morgan Stanley | 11/17/2059 | 3.000 | Monthly | 6.799 | USD | 3,500,000 | (476,875) | 2,042 | — | (658,048) | 183,215 | — |
| Markit CMBX North America Index, Series 10 BBB- | Morgan Stanley | 11/17/2059 | 3.000 | Monthly | 6.799 | USD | 2,000,000 | (272,500) | 1,167 | — | (437,703) | 166,370 | — |
| Markit CMBX North America Index, Series 10 BBB- | Morgan Stanley | 11/17/2059 | 3.000 | Monthly | 6.799 | USD | 2,500,000 | (340,625) | 1,458 | — | (496,597) | 157,430 | — |
| Markit CMBX North America Index, Series 10 BBB- | Morgan Stanley | 11/17/2059 | 3.000 | Monthly | 6.799 | USD | 1,200,000 | (163,500) | 700 | — | (279,297) | 116,497 | — |
| Markit CMBX North America Index, Series 10 BBB- | Morgan Stanley | 11/17/2059 | 3.000 | Monthly | 6.799 | USD | 2,000,000 | (272,500) | 1,166 | — | (316,414) | 45,080 | — |
| Markit CMBX North America Index, Series 10 BBB- | Morgan Stanley | 11/17/2059 | 3.000 | Monthly | 6.799 | USD | 750,000 | (102,187) | 437 | — | (122,788) | 21,038 | — |
| Markit CMBX North America Index, Series 10 BBB- | Morgan Stanley | 11/17/2059 | 3.000 | Monthly | 6.799 | USD | 5,000,000 | (681,250) | 2,917 | — | (574,984) | — | (103,349) |
| Markit CMBX North America Index, Series 11 BBB- | Morgan Stanley | 11/18/2054 | 3.000 | Monthly | 5.807 | USD | 4,000,000 | (482,500) | 2,334 | — | (764,812) | 284,646 | — |
The accompanying Notes to Consolidated Financial Statements are an integral part of this statement.
Columbia Multi Strategy Alternatives Fund | Annual Report 2022
| 29 |
Consolidated Portfolio of Investments (continued)
May 31, 2022
| Credit default swap contracts - sell protection (continued) |
Reference
entity | Counterparty | Maturity
date | Receive
fixed
rate
(%) | Payment
frequency | Implied
credit
spread
(%)* | Notional
currency | Notional
amount | Value
($) | Periodic
payments
receivable
(payable)
($) | Upfront
payments
($) | Upfront
receipts
($) | Unrealized
appreciation
($) | Unrealized
depreciation
($) |
| Markit CMBX North America Index, Series 12 BBB- | Morgan Stanley | 08/17/2061 | 3.000 | Monthly | 5.813 | USD | 3,000,000 | (406,875) | 1,750 | — | (433,376) | 28,251 | — |
| Markit CMBX North America Index, Series 13 BBB- | Morgan Stanley | 12/16/2072 | 3.000 | Monthly | 5.703 | USD | 2,000,000 | (297,500) | 1,167 | — | (181,925) | — | (114,408) |
| Markit CMBX North America Index, Series 13 BBB- | Morgan Stanley | 12/16/2072 | 3.000 | Monthly | 5.703 | USD | 1,500,000 | (223,125) | 875 | — | (76,591) | — | (145,659) |
| Markit CMBX North America Index, Series 13 BBB- | Morgan Stanley | 12/16/2072 | 3.000 | Monthly | 5.703 | USD | 1,500,000 | (223,125) | 875 | — | (75,100) | — | (147,150) |
| Markit CMBX North America Index, Series 13 BBB- | Morgan Stanley | 12/16/2072 | 3.000 | Monthly | 5.703 | USD | 2,000,000 | (297,500) | 1,167 | — | (128,723) | — | (167,610) |
| Markit CMBX North America Index, Series 13 BBB- | Morgan Stanley | 12/16/2072 | 3.000 | Monthly | 5.703 | USD | 2,000,000 | (297,500) | 1,167 | — | (115,984) | — | (180,349) |
| Total | | | | | | | | (5,731,687) | 24,297 | — | (6,341,266) | 1,558,471 | (924,595) |
| * | Implied credit spreads, represented in absolute terms, utilized in determining the market value of credit default swap agreements on corporate or sovereign issues as of period end serve as an indicator of the current status of the payment/performance risk and represent the likelihood or risk of default for the credit derivative. The implied credit spread of a particular referenced entity reflects the cost of buying/selling protection and may include upfront payments required to be made to enter into the agreement. Wider credit spreads represent a deterioration of the referenced entity’s credit soundness and a greater likelihood or risk of default or other credit event occurring as defined under the terms of the agreement. |
| Total return swap contracts |
| Fund receives | Fund pays | Payment
frequency | Counterparty | Maturity
date | Notional
currency | Notional
amount | Value
($) | Periodic
payments
receivable
(payable)
($) | Upfront
payments
($) | Upfront
receipts
($) | Unrealized
appreciation
($) | Unrealized
depreciation
($) |
| Total return on MSCI Spain Net Return EUR Index | ESTR minus 0.003% | Monthly | JPMorgan | 06/15/2022 | EUR | 957,739 | 42,731 | 310 | — | — | 43,041 | — |
| Total return on MSCI Italy Net Return EUR Index | 3-Month EURIBOR minus 0.006% | Monthly | JPMorgan | 06/15/2022 | EUR | 1,316,285 | 42,218 | 579 | — | — | 42,797 | — |
| Total return on MSCI Netherlands Net Return EUR Index | 1-Month EURIBOR plus 0.001% | Monthly | JPMorgan | 06/15/2022 | EUR | 457,605 | 19,395 | 95 | — | — | 19,490 | — |
| SORA minus 0.002% | Total return on MSCI Singapore Net Return SGD Index | Monthly | JPMorgan | 06/15/2022 | SGD | 116,993 | (945) | 21 | — | — | — | (924) |
| 28-Day MXN TIIE-Banxico minus 0.004% | Total return on MSCI Mexico Net Return MXN Index | Monthly | JPMorgan | 06/15/2022 | MXN | 2,345,230 | (4,123) | 293 | — | — | — | (3,830) |
| 28-Day MXN TIIE-Banxico minus 0.004% | Total return on MSCI Mexico Net Return MXN Index | Monthly | JPMorgan | 06/15/2022 | MXN | 2,452,095 | (4,311) | 306 | — | — | — | (4,005) |
The accompanying Notes to Consolidated Financial Statements are an integral part of this statement.
| 30 | Columbia Multi Strategy Alternatives Fund | Annual Report 2022 |
Consolidated Portfolio of Investments (continued)
May 31, 2022
| Total return swap contracts (continued) |
| Fund receives | Fund pays | Payment
frequency | Counterparty | Maturity
date | Notional
currency | Notional
amount | Value
($) | Periodic
payments
receivable
(payable)
($) | Upfront
payments
($) | Upfront
receipts
($) | Unrealized
appreciation
($) | Unrealized
depreciation
($) |
| 28-Day MXN TIIE-Banxico minus 0.004% | Total return on MSCI Mexico Net Return MXN Index | Monthly | JPMorgan | 06/15/2022 | MXN | 2,909,758 | (5,115) | 363 | — | — | — | (4,752) |
| 1-Month ZAR JIBAR plus 0.006% | Total return on MSCI South Africa Net Return ZAR Index | Monthly | JPMorgan | 06/15/2022 | ZAR | 3,876,227 | (10,628) | 414 | — | — | — | (10,214) |
| Overnight BRL CDI minus 0.007% | Total return on MSCI Brazil Net Return BRL Index | Monthly | JPMorgan | 06/15/2022 | BRL | 5,725,549 | (59,989) | 5,133 | — | — | — | (54,856) |
| Total | | | | | | | 19,233 | 7,514 | — | — | 105,328 | (78,581) |
| Total return swap contracts on futures |
| Reference instrument* | Counterparty | Expiration
date | Trading
currency | Notional amount
long(short) | Upfront
payments ($) | Upfront
receipts ($) | Value/Unrealized
appreciation
($) | Value/Unrealized
depreciation
($) |
| DTOP Index June 22 | Goldman Sachs | 06/2022 | ZAR | (1,405,030) | — | — | — | (3,254) |
| TAIEX Index June 22 | Goldman Sachs | 06/2022 | TWD | 50,043,000 | — | — | 75,075 | — |
| WIG 20 Index June 22 | Goldman Sachs | 06/2022 | PLN | (1,589,280) | — | — | — | (4,858) |
| Ibovespa Index June 22 | Morgan Stanley | 06/2022 | BRL | (52,429,910) | — | — | 599,389 | — |
| KOSPI 200 Index Jun 2022 | Morgan Stanley | 06/2022 | KRW | 5,400,787,500 | — | — | 45,067 | — |
| Swiss Federal Bond Jun 2022 | Morgan Stanley | 06/2022 | CHF | (14,265,540) | — | — | — | (274,968) |
| Swiss Market Index June 22 | Morgan Stanley | 06/2022 | CHF | 10,090,260 | — | — | 21,762 | — |
| TAIEX Index June 22 | Morgan Stanley | 06/2022 | TWD | 60,051,600 | — | — | 88,481 | — |
| Total | | | | | — | — | 829,774 | (283,080) |
| * | If the notional amount of the swap contract is long and the swap contract’s value is positive (negative), the Fund will receive (pay) the total return. If the notional amount of the swap contract is short and the swap contract’s value is positive (negative), the Fund will pay (receive) the total return. Receipts and payments occur upon termination of the contract. |
| Reference index and values for swap contracts as of period end |
| Reference index | | Reference rate |
| 1-Month EURIBOR | Euro Interbank Offered Rate | (0.546%) |
| 1-Month ZAR JIBAR | Johannesburg Interbank Average Rate | 4.792% |
| 28-Day MXN TIIE-Banxico | Interbank Equilibrium Interest Rate | 7.225% |
| 3-Month AUD BBSW | Bank Bill Swap Rate | 1.177% |
| 3-Month CAD Canada Bankers’ Acceptances | Canada Bankers’ Acceptances | 1.947% |
| 3-Month EURIBOR | Euro Interbank Offered Rate | (0.338%) |
| 3-Month NZD LIBOR | London Interbank Offered Rate | 2.465% |
| 3-Month SEK STIBOR | Stockholm Interbank Offered Rate | 0.477% |
| 6-Month AUD BBSW | Bank Bill Swap Rate | 1.925% |
| 6-Month EURIBOR | Euro Interbank Offered Rate | (0.045%) |
| 6-Month NOK NIBOR | Norwegian Interbank Offered Rate | 1.620% |
| ESTR | Euro Short Term Rate | (0.589%) |
| Overnight BRL CDI | Interbank Certificate of Deposit | 0.479% |
| SOFR | Secured Overnight Financing Rate | 0.780% |
| SONIA | Sterling Overnight Index Average | 0.941% |
The accompanying Notes to Consolidated Financial Statements are an integral part of this statement.
Columbia Multi Strategy Alternatives Fund | Annual Report 2022
| 31 |
Consolidated Portfolio of Investments (continued)
May 31, 2022
| Reference index and values for swap contracts as of period end (continued) |
| Reference index | | Reference rate |
| SORA | Singapore Overnight Rate Average | 0.719% |
| TONA | Tokyo Overnight Average Rate | (0.026%) |
Notes to Consolidated Portfolio of Investments
| (a) | Represents privately placed and other securities and instruments exempt from Securities and Exchange Commission registration (collectively, private placements), such as Section 4(a)(2) and Rule 144A eligible securities, which are often sold only to qualified institutional buyers. At May 31, 2022, the total value of these securities amounted to $212,132,294, which represents 26.30% of total net assets. |
| (b) | Variable rate security. The interest rate shown was the current rate as of May 31, 2022. |
| (c) | Security represents a pool of loans that generate cash payments generally over fixed periods of time. Such securities entitle the security holders to receive distributions (i.e. principal and interest, net of fees and expenses) that are tied to the payments made by the borrower on the underlying loans. Due to the structure of the security the cash payments received are not known until the time of payment. The interest rate shown is the stated coupon rate as of May 31, 2022 and is not reflective of the cash flow payments. |
| (d) | Valuation based on significant unobservable inputs. |
| (e) | Represents fair value as determined in good faith under procedures approved by the Board of Trustees. At May 31, 2022, the total value of these securities amounted to $8,622,033, which represents 1.07% of total net assets. |
| (f) | Variable or floating rate security, the interest rate of which adjusts periodically based on changes in current interest rates and prepayments on the underlying pool of assets. The interest rate shown was the current rate as of May 31, 2022. |
| (g) | Represents interest only securities which have the right to receive the monthly interest payments on an underlying pool of mortgage loans. |
| (h) | Includes comparable securities held to satisfy future delivery requirements of the following open forward sale commitments at May 31, 2022: |
| Security description | Principal
amount ($) | Settlement
date | Proceeds
receivable ($) | Value ($) |
| Uniform Mortgage-Backed Security TBA | | | | |
| 06/13/2052 2.500% | (40,000,000) | 06/13/2022 | (36,079,688) | (36,806,250) |
| (i) | Represents a security purchased on a when-issued basis. |
| (j) | This security or a portion of this security has been pledged as collateral in connection with derivative contracts. |
| (k) | The rate shown is the seven-day current annualized yield at May 31, 2022. |
| (l) | As defined in the Investment Company Act of 1940, as amended, an affiliated company is one in which the Fund owns 5% or more of the company’s outstanding voting securities, or a company which is under common ownership or control with the Fund. The value of the holdings and transactions in these affiliated companies during the year ended May 31, 2022 are as follows: |
| Affiliated issuers | Beginning
of period($) | Purchases($) | Sales($) | Net change in
unrealized
appreciation
(depreciation)($) | End of
period($) | Realized gain
(loss)($) | Dividends($) | End of
period shares |
| Columbia Short-Term Cash Fund, 0.852% |
| | 308,299,190 | 721,230,153 | (703,766,092) | (34,804) | 325,728,447 | (62,508) | 588,107 | 325,858,790 |
Abbreviation Legend
| CMO | Collateralized Mortgage Obligation |
| LIBOR | London Interbank Offered Rate |
| SOFR | Secured Overnight Financing Rate |
| TBA | To Be Announced |
Currency Legend
| AUD | Australian Dollar |
| BRL | Brazilian Real |
| CAD | Canada Dollar |
| CHF | Swiss Franc |
| CLP | Chilean Peso |
| CNH | Yuan Offshore Renminbi |
| COP | Colombian Peso |
The accompanying Notes to Consolidated Financial Statements are an integral part of this statement.
| 32 | Columbia Multi Strategy Alternatives Fund | Annual Report 2022 |
Consolidated Portfolio of Investments (continued)
May 31, 2022
Currency Legend (continued)
| CZK | Czech Koruna |
| EUR | Euro |
| GBP | British Pound |
| HUF | Hungarian Forint |
| IDR | Indonesian Rupiah |
| ILS | Israeli Shekel |
| INR | Indian Rupee |
| JPY | Japanese Yen |
| KRW | South Korean Won |
| MXN | Mexican Peso |
| MYR | Malaysian Ringgit |
| NOK | Norwegian Krone |
| NZD | New Zealand Dollar |
| PHP | Philippine Peso |
| PLN | Polish Zloty |
| RUB | Russian Ruble |
| SEK | Swedish Krona |
| SGD | Singapore Dollar |
| THB | Thailand Baht |
| TRY | Turkish Lira |
| TWD | New Taiwan Dollar |
| USD | US Dollar |
| ZAR | South African Rand |
Fair value measurements
The Fund categorizes its fair value measurements according to a three-level hierarchy that maximizes the use of observable inputs and minimizes the use of unobservable inputs by prioritizing that the most observable input be used when available. Observable inputs are those that market participants would use in pricing an investment based on market data obtained from sources independent of the reporting entity. Unobservable inputs are those that reflect the Fund’s assumptions about the information market participants would use in pricing an investment. An investment’s level within the fair value hierarchy is based on the lowest level of any input that is deemed significant to the asset’s or liability’s fair value measurement. The input levels are not necessarily an indication of the risk or liquidity associated with investments at that level. For example, certain U.S. government securities are generally high quality and liquid, however, they are reflected as Level 2 because the inputs used to determine fair value may not always be quoted prices in an active market.
Fair value inputs are summarized in the three broad levels listed below:
| ■ | Level 1 — Valuations based on quoted prices for investments in active markets that the Fund has the ability to access at the measurement date. Valuation adjustments are not applied to Level 1 investments. |
| ■ | Level 2 — Valuations based on other significant observable inputs (including quoted prices for similar securities, interest rates, prepayment speeds, credit risks, etc.). |
| ■ | Level 3 — Valuations based on significant unobservable inputs (including the Fund’s own assumptions and judgment in determining the fair value of investments). |
Inputs that are used in determining fair value of an investment may include price information, credit data, volatility statistics, and other factors. These inputs can be either observable or unobservable. The availability of observable inputs can vary between investments, and is affected by various factors such as the type of investment, and the volume and level of activity for that investment or similar investments in the marketplace. The inputs will be considered by the Investment Manager, along with any other relevant factors in the calculation of an investment’s fair value. The Fund uses prices and inputs that are current as of the measurement date, which may include periods of market dislocations. During these periods, the availability of prices and inputs may be reduced for many investments. This condition could cause an investment to be reclassified between the various levels within the hierarchy.
Investments falling into the Level 3 category are primarily supported by quoted prices from brokers and dealers participating in the market for those investments. However, these may be classified as Level 3 investments due to lack of market transparency and corroboration to support these quoted prices. Additionally, valuation models may be used as the pricing source for any remaining investments classified as Level 3. These models may rely on one or more significant unobservable inputs and/or significant assumptions by the Investment Manager. Inputs used in valuations may include, but are not limited to, financial statement analysis, capital account balances, discount rates and estimated cash flows, and comparable company data.
Under the direction of the Fund’s Board of Trustees (the Board), the Investment Manager’s Valuation Committee (the Committee) is responsible for overseeing the valuation procedures approved by the Board. The Committee consists of voting and non-voting members from various groups within the Investment Manager’s organization, including operations and accounting, trading and investments, compliance, risk management and legal.
The Committee meets at least monthly to review and approve valuation matters, which may include a description of specific valuation determinations, data regarding pricing information received from approved pricing vendors and brokers and the results of Board-approved valuation control policies and procedures (the Policies). The Policies address, among other things, instances when market quotations are or are not readily available, including recommendations of third party pricing vendors and a determination of appropriate pricing methodologies; events that require specific valuation determinations and assessment of fair value techniques; securities with a potential for stale pricing, including those that are illiquid, restricted, or in default; and the effectiveness of third party pricing vendors, including periodic reviews of vendors. The Committee meets more frequently, as needed, to discuss
The accompanying Notes to Consolidated Financial Statements are an integral part of this statement.
Columbia Multi Strategy Alternatives Fund | Annual Report 2022
| 33 |
Consolidated Portfolio of Investments (continued)
May 31, 2022
Fair value measurements (continued)
additional valuation matters, which may include the need to review back-testing results, review time-sensitive information or approve related valuation actions. The Committee reports to the Board, with members of the Committee meeting with the Board at each of its regularly scheduled meetings to discuss valuation matters and actions during the period, similar to those described earlier.
The following table is a summary of the inputs used to value the Fund’s investments at May 31, 2022:
| | Level 1 ($) | Level 2 ($) | Level 3 ($) | Total ($) |
| Investments in Securities | | | | |
| Asset-Backed Securities — Non-Agency | — | 35,195,661 | 11,283,627 | 46,479,288 |
| Commercial Mortgage-Backed Securities - Agency | — | 631,960 | — | 631,960 |
| Commercial Mortgage-Backed Securities - Non-Agency | — | 38,198,319 | — | 38,198,319 |
| Residential Mortgage-Backed Securities - Agency | — | 101,699,956 | — | 101,699,956 |
| Residential Mortgage-Backed Securities - Non-Agency | — | 115,085,244 | 12,074,645 | 127,159,889 |
| Treasury Bills | 162,901,086 | — | — | 162,901,086 |
| Options Purchased Calls | — | 1,169,255 | — | 1,169,255 |
| Options Purchased Puts | — | 580,885 | — | 580,885 |
| Money Market Funds | 325,728,447 | — | — | 325,728,447 |
| Total Investments in Securities | 488,629,533 | 292,561,280 | 23,358,272 | 804,549,085 |
| Forward Sale Commitments | — | (36,806,250) | — | (36,806,250) |
| Investments in Derivatives | | | | |
| Asset | | | | |
| Forward Foreign Currency Exchange Contracts | — | 45,794,852 | — | 45,794,852 |
| Futures Contracts | 16,592,732 | — | — | 16,592,732 |
| Swap Contracts | — | 20,002,425 | — | 20,002,425 |
| Liability | | | | |
| Forward Foreign Currency Exchange Contracts | — | (38,037,443) | — | (38,037,443) |
| Futures Contracts | (10,778,490) | — | — | (10,778,490) |
| Options Contracts Written | — | (4,812,862) | — | (4,812,862) |
| Swap Contracts | — | (22,178,668) | — | (22,178,668) |
| Total | 494,443,775 | 256,523,334 | 23,358,272 | 774,325,381 |
See the Consolidated Portfolio of Investments for all investment classifications not indicated in the table.
The Fund’s assets assigned to the Level 2 input category are generally valued using the market approach, in which a security’s value is determined through reference to prices and information from market transactions for similar or identical assets.
Forward foreign currency exchange contracts, futures contracts and swap contracts are valued at unrealized appreciation (depreciation).
The following table is a reconciliation of Level 3 assets for which significant observable and unobservable inputs were used to determine fair value:
| | Balance
as of
05/31/2021
($) | Increase
(decrease)
in accrued
discounts/
premiums
($) | Realized
gain (loss)
($) | Change
in unrealized
appreciation
(depreciation)(a)
($) | Purchases
($) | Sales
($) | Transfers
into
Level 3
($) | Transfers
out of
Level 3
($) | Balance
as of
05/31/2022
($) |
| Asset-Backed Securities — Non-Agency | 15,808,703 | (5,523,631) | — | 538,753 | 1,823,347 | (1,363,545) | — | — | 11,283,627 |
| Residential Mortgage-Backed Securities — Non-Agency | 6,731,785 | 4,910 | 238,783 | (127,990) | 7,828,214 | (4,810,367) | 2,209,310 | — | 12,074,645 |
| Total | 22,540,488 | (5,518,721) | 238,783 | 410,763 | 9,651,561 | (6,173,912) | 2,209,310 | — | 23,358,272 |
(a) Change in unrealized appreciation (depreciation) relating to securities held at May 31, 2022 was $533,490, which is comprised of Asset-Backed Securities — Non-Agency of $538,753 and Residential Mortgage-Backed Securities - Non-Agency of $(5,263).
The Fund’s assets assigned to the Level 3 category are valued utilizing the valuation technique deemed the most appropriate in the circumstances. Certain residential and asset-backed securities classified as Level 3 securities are valued using the market approach and utilize single market quotations from broker dealers which may have included, but were not limited to, observable transactions for identical or similar assets in the market and the distressed nature of the security. The appropriateness of fair values for these securities is monitored on an ongoing basis which may include results of back testing, manual price reviews and other control procedures. Significant increases (decreases) to any of these inputs would have resulted in a significantly higher (lower) fair value measurement.
Financial assets were transferred from Level 2 to Level 3 due to utilizing a single market quotation from a broker dealer. As a result, management concluded that the market input(s) were generally unobservable.
The accompanying Notes to Consolidated Financial Statements are an integral part of this statement.
| 34 | Columbia Multi Strategy Alternatives Fund | Annual Report 2022 |
Consolidated Statement of Assets and Liabilities
May 31, 2022
| Assets | |
| Investments in securities, at value | |
| Unaffiliated issuers (cost $488,799,972) | $477,070,498 |
| Affiliated issuers (cost $325,769,438) | 325,728,447 |
| Options purchased (cost $2,088,770) | 1,750,140 |
| Foreign currency (cost $8,366,725) | 8,425,521 |
| Cash collateral held at broker for: | |
| Forward foreign currency exchange contracts | 2,420,000 |
| Swap contracts | 3,580,000 |
| Options contracts written | 3,372,000 |
| TBA | 218,000 |
| Other(a) | 5,269,000 |
| Margin deposits on: | |
| Futures contracts | 36,991,272 |
| Swap contracts | 9,947,586 |
| Unrealized appreciation on forward foreign currency exchange contracts | 45,794,852 |
| Unrealized appreciation on swap contracts | 2,493,573 |
| Receivable for: | |
| Investments sold | 1,380,994 |
| Investments sold on a delayed delivery basis | 36,113,021 |
| Capital shares sold | 1,116,276 |
| Dividends | 201,391 |
| Interest | 1,020,473 |
| Variation margin for futures contracts | 7,013,805 |
| Variation margin for swap contracts | 3,911,010 |
| Expense reimbursement due from Investment Manager | 11,459 |
| Prepaid expenses | 5,892 |
| Trustees’ deferred compensation plan | 70,430 |
| Total assets | 973,905,640 |
| Liabilities | |
| Option contracts written, at value (premiums received $1,667,400) | 4,812,862 |
| Forward sale commitments, at value (proceeds receivable $36,079,688) | 36,806,250 |
| Due to custodian | 46,397 |
| Unrealized depreciation on forward foreign currency exchange contracts | 38,037,443 |
| Unrealized depreciation on swap contracts | 1,286,256 |
| Upfront receipts on swap contracts | 6,341,266 |
| Cash collateral due to broker for: | |
| Foreign forward currency exchange contracts | 2,050,000 |
| Swap contracts | 970,000 |
| Payable for: | |
| Investments purchased | 413,792 |
| Investments purchased on a delayed delivery basis | 65,740,250 |
| Capital shares purchased | 842,685 |
| Variation margin for futures contracts | 6,474,032 |
| Variation margin for swap contracts | 3,112,507 |
| Interest on forward sale commitments | 33,333 |
| Management services fees | 84,621 |
| Distribution and/or service fees | 1,469 |
| Transfer agent fees | 74,594 |
| Compensation of board members | 13,428 |
| Other expenses | 75,042 |
| Trustees’ deferred compensation plan | 70,430 |
| Total liabilities | 167,286,657 |
| Net assets applicable to outstanding capital stock | $806,618,983 |
| Represented by | |
| Paid in capital | 951,305,873 |
| Total distributable earnings (loss) | (144,686,890) |
| Total - representing net assets applicable to outstanding capital stock | $806,618,983 |
The accompanying Notes to Consolidated Financial Statements are an integral part of this statement.
Columbia Multi Strategy Alternatives Fund | Annual Report 2022
| 35 |
Consolidated Statement of Assets and Liabilities (continued)
May 31, 2022
| Class A | |
| Net assets | $2,137,843 |
| Shares outstanding | 76,364 |
| Net asset value per share | $28.00 |
| Maximum sales charge | 5.75% |
| Maximum offering price per share (calculated by dividing the net asset value per share by 1.0 minus the maximum sales charge for Class A shares) | $29.71 |
| Advisor Class | |
| Net assets | $317,817 |
| Shares outstanding | 11,209 |
| Net asset value per share | $28.35 |
| Class C | |
| Net assets | $12,869,261 |
| Shares outstanding | 476,764 |
| Net asset value per share | $26.99 |
| Institutional Class | |
| Net assets | $790,615,303 |
| Shares outstanding | 27,936,692 |
| Net asset value per share | $28.30 |
| Institutional 2 Class | |
| Net assets | $664,712 |
| Shares outstanding | 23,375 |
| Net asset value per share | $28.44 |
| Institutional 3 Class | |
| Net assets | $7,134 |
| Shares outstanding | 250 |
| Net asset value per share | $28.54 |
| Class R | |
| Net assets | $6,913 |
| Shares outstanding | 250 |
| Net asset value per share | $27.65 |
| (a) | Includes collateral related to option contracts and swap contracts. |
The accompanying Notes to Consolidated Financial Statements are an integral part of this statement.
| 36 | Columbia Multi Strategy Alternatives Fund | Annual Report 2022 |
Consolidated Statement of Operations
Year Ended May 31, 2022
| Net investment income | |
| Income: | |
| Dividends — unaffiliated issuers | $503,219 |
| Dividends — affiliated issuers | 588,107 |
| Interest | 17,894,333 |
| Total income | 18,985,659 |
| Expenses: | |
| Management services fees | 8,136,161 |
| Distribution and/or service fees | |
| Class A | 4,430 |
| Class C | 12,604 |
| Class R | 36 |
| Transfer agent fees | |
| Class A | 2,000 |
| Advisor Class | 492 |
| Class C | 1,466 |
| Institutional Class | 953,363 |
| Institutional 2 Class | 516 |
| Institutional 3 Class | 1 |
| Class R | 7 |
| Compensation of board members | 23,368 |
| Custodian fees | 141,380 |
| Printing and postage fees | 95,215 |
| Registration fees | 141,574 |
| Audit fees | 52,000 |
| Legal fees | 18,015 |
| Interest on collateral | 316,454 |
| Compensation of chief compliance officer | 251 |
| Other | 26,337 |
| Total expenses | 9,925,670 |
| Fees waived or expenses reimbursed by Investment Manager and its affiliates | (982,907) |
| Expense reduction | (20) |
| Total net expenses | 8,942,743 |
| Net investment income | 10,042,916 |
| Realized and unrealized gain (loss) — net | |
| Net realized gain (loss) on: | |
| Investments — unaffiliated issuers | 336,744 |
| Investments — affiliated issuers | (62,508) |
| Foreign currency translations | (6,379,176) |
| Forward foreign currency exchange contracts | (12,107,249) |
| Futures contracts | 11,089,830 |
| Options purchased | 3,886,275 |
| Options contracts written | (2,344,970) |
| Swap contracts | (12,673,962) |
| Net realized loss | (18,255,016) |
| Net change in unrealized appreciation (depreciation) on: | |
| Investments — unaffiliated issuers | (20,929,571) |
| Investments — affiliated issuers | (34,804) |
| Foreign currency translations | (547,557) |
| Forward sale commitments | (726,562) |
| Forward foreign currency exchange contracts | 8,680,717 |
| Futures contracts | 9,262,871 |
| Options purchased | (5,594,468) |
| Options contracts written | (3,115,981) |
| Swap contracts | (6,299,183) |
| Net change in unrealized appreciation (depreciation) | (19,304,538) |
| Net realized and unrealized loss | (37,559,554) |
| Net decrease in net assets resulting from operations | $(27,516,638) |
The accompanying Notes to Consolidated Financial Statements are an integral part of this statement.
Columbia Multi Strategy Alternatives Fund | Annual Report 2022
| 37 |
Consolidated Statement of Changes in Net Assets
| | Year Ended
May 31, 2022 | Year Ended
May 31, 2021 |
| Operations | | |
| Net investment income | $10,042,916 | $6,992,315 |
| Net realized gain (loss) | (18,255,016) | 23,796,528 |
| Net change in unrealized appreciation (depreciation) | (19,304,538) | 15,440,772 |
| Net increase (decrease) in net assets resulting from operations | (27,516,638) | 46,229,615 |
| Distributions to shareholders | | |
| Net investment income and net realized gains | | |
| Class A | (36,833) | — |
| Advisor Class | (7,417) | — |
| Class C | (1,331) | — |
| Institutional Class | (19,479,617) | — |
| Institutional 2 Class | (16,578) | — |
| Institutional 3 Class | (176) | — |
| Class R | (132) | — |
| Total distributions to shareholders | (19,542,084) | — |
| Increase in net assets from capital stock activity | 44,080,394 | 131,298,431 |
| Total increase (decrease) in net assets | (2,978,328) | 177,528,046 |
| Net assets at beginning of year | 809,597,311 | 632,069,265 |
| Net assets at end of year | $806,618,983 | $809,597,311 |
The accompanying Notes to Consolidated Financial Statements are an integral part of this statement.
| 38 | Columbia Multi Strategy Alternatives Fund | Annual Report 2022 |
Consolidated Statement of Changes in Net Assets (continued)
| | Year Ended | Year Ended |
| | May 31, 2022 | May 31, 2021 |
| | Shares | Dollars ($) | Shares(a) | Dollars ($) |
| Capital stock activity |
| Class A | | | | |
| Subscriptions | 32,274 | 917,058 | 9,549 | 278,887 |
| Distributions reinvested | 1,319 | 36,684 | — | — |
| Redemptions | (15,870) | (452,919) | (27,239) | (794,935) |
| Net increase (decrease) | 17,723 | 500,823 | (17,690) | (516,048) |
| Advisor Class | | | | |
| Subscriptions | 21,107 | 632,532 | 4,185 | 122,324 |
| Distributions reinvested | 257 | 7,231 | — | — |
| Redemptions | (17,689) | (523,259) | (1,364) | (39,438) |
| Net increase | 3,675 | 116,504 | 2,821 | 82,886 |
| Class C | | | | |
| Subscriptions | 480,979 | 13,056,328 | — | — |
| Distributions reinvested | 46 | 1,237 | — | — |
| Redemptions | (8,252) | (224,277) | (4,132) | (118,675) |
| Net increase (decrease) | 472,773 | 12,833,288 | (4,132) | (118,675) |
| Institutional Class | | | | |
| Subscriptions | 7,526,146 | 219,144,305 | 9,373,060 | 275,195,663 |
| Distributions reinvested | 693,364 | 19,476,610 | — | — |
| Redemptions | (7,193,911) | (207,819,869) | (4,352,530) | (128,547,132) |
| Net increase | 1,025,599 | 30,801,046 | 5,020,530 | 146,648,531 |
| Institutional 2 Class | | | | |
| Subscriptions | 4,876 | 144,203 | 49,488 | 1,450,617 |
| Distributions reinvested | 581 | 16,407 | — | — |
| Redemptions | (11,164) | (331,877) | (24,820) | (739,212) |
| Net increase (decrease) | (5,707) | (171,267) | 24,668 | 711,405 |
| Institutional 3 Class | | | | |
| Redemptions | — | — | (528,890) | (15,509,668) |
| Net decrease | — | — | (528,890) | (15,509,668) |
| Total net increase | 1,514,063 | 44,080,394 | 4,497,307 | 131,298,431 |
| (a) | Share activity has been adjusted on a retroactive basis to reflect a 4 to 1 reverse stock split completed after the close of business on September 11, 2020. |
The accompanying Notes to Consolidated Financial Statements are an integral part of this statement.
Columbia Multi Strategy Alternatives Fund | Annual Report 2022
| 39 |
Consolidated Financial Highlights
The following table is intended to help you understand the Fund’s financial performance. Certain information reflects financial results for a single share of a class held for the periods shown. Per share net investment income (loss) amounts are calculated based on average shares outstanding during the period. Total return assumes reinvestment of all dividends and distributions, if any. Total return does not reflect payment of sales charges, if any. Total return and portfolio turnover are not annualized for periods of less than one year. The portfolio turnover rate is calculated without regard to purchase and sales transactions of short-term instruments and certain derivatives, if any. If such transactions were included, the Fund’s portfolio turnover rate may be higher.
| | Net asset value,
beginning of
period | Net
investment
income
(loss) | Net
realized
and
unrealized
gain (loss) | Total from
investment
operations | Distributions
from net
investment
income | Total
distributions to
shareholders |
| Class A(c) |
| Year Ended 5/31/2022 | $29.65 | 0.47 | (1.52) | (1.05) | (0.60) | (0.60) |
| Year Ended 5/31/2021 | $27.84 | 0.19 | 1.62 | 1.81 | — | — |
| Year Ended 5/31/2020 | $29.79 | 0.28 | (2.23) | (1.95) | — | — |
| Year Ended 5/31/2019 | $34.63 | 0.32 | (5.16) | (4.84) | — | — |
| Year Ended 5/31/2018 | $37.44 | 0.04 | (2.01) | (1.97) | (0.84) | (0.84) |
| Advisor Class(c) |
| Year Ended 5/31/2022 | $30.03 | 0.20 | (1.21) | (1.01) | (0.67) | (0.67) |
| Year Ended 5/31/2021 | $28.12 | 0.28 | 1.63 | 1.91 | — | — |
| Year Ended 5/31/2020 | $30.01 | 0.32 | (2.21) | (1.89) | — | — |
| Year Ended 5/31/2019 | $34.78 | 0.36 | (5.13) | (4.77) | — | — |
| Year Ended 5/31/2018 | $37.55 | 0.16 | (2.05) | (1.89) | (0.88) | (0.88) |
| Class C(c) |
| Year Ended 5/31/2022 | $28.59 | 6.57 | (7.80) | (1.23) | (0.37) | (0.37) |
| Year Ended 5/31/2021 | $27.05 | (0.04) | 1.58 | 1.54 | — | — |
| Year Ended 5/31/2020 | $29.16 | 0.04 | (2.15) | (2.11) | — | — |
| Year Ended 5/31/2019 | $34.15 | 0.08 | (5.07) | (4.99) | — | — |
| Year Ended 5/31/2018 | $37.10 | (0.24) | (1.99) | (2.23) | (0.72) | (0.72) |
| Institutional Class(c) |
| Year Ended 5/31/2022 | $29.97 | 0.34 | (1.34) | (1.00) | (0.67) | (0.67) |
| Year Ended 5/31/2021 | $28.07 | 0.28 | 1.62 | 1.90 | — | — |
| Year Ended 5/31/2020 | $29.96 | 0.32 | (2.21) | (1.89) | — | — |
| Year Ended 5/31/2019 | $34.73 | 0.40 | (5.17) | (4.77) | — | — |
| Year Ended 5/31/2018 | $37.50 | 0.12 | (2.01) | (1.89) | (0.88) | (0.88) |
| Institutional 2 Class(c) |
| Year Ended 5/31/2022 | $30.12 | 0.33 | (1.33) | (1.00) | (0.68) | (0.68) |
| Year Ended 5/31/2021 | $28.19 | 0.34 | 1.59 | 1.93 | — | — |
| Year Ended 5/31/2020 | $30.07 | 0.40 | (2.28) | (1.88) | — | — |
| Year Ended 5/31/2019 | $34.84 | 0.44 | (5.21) | (4.77) | — | — |
| Year Ended 5/31/2018 | $37.58 | 0.20 | (2.06) | (1.86) | (0.88) | (0.88) |
The accompanying Notes to Consolidated Financial Statements are an integral part of this statement.
| 40 | Columbia Multi Strategy Alternatives Fund | Annual Report 2022 |
Consolidated Financial Highlights (continued)
| | Net
asset
value,
end of
period | Total
return | Total gross
expense
ratio to
average
net assets(a) | Total net
expense
ratio to
average
net assets(a),(b) | Net investment
income (loss)
ratio to
average
net assets | Portfolio
turnover | Net
assets,
end of
period
(000’s) |
| Class A(c) |
| Year Ended 5/31/2022 | $28.00 | (3.54%) | 1.42%(d) | 1.30%(d),(e) | 1.62% | 352% | $2,138 |
| Year Ended 5/31/2021 | $29.65 | 6.50% | 1.40%(d),(f) | 1.27%(d),(f) | 0.66% | 555% | $1,739 |
| Year Ended 5/31/2020 | $27.84 | (6.58%) | 1.42%(d),(f) | 1.25%(d),(f) | 0.94% | 789% | $2,125 |
| Year Ended 5/31/2019 | $29.79 | (13.97%) | 1.45%(d) | 1.24%(d) | 0.98% | 0% | $3,103 |
| Year Ended 5/31/2018 | $34.63 | (5.49%) | 1.49%(d) | 1.28%(d) | 0.06% | 0% | $4,343 |
| Advisor Class(c) |
| Year Ended 5/31/2022 | $28.35 | (3.34%) | 1.16%(d) | 1.05%(d),(e) | 0.66% | 352% | $318 |
| Year Ended 5/31/2021 | $30.03 | 6.79% | 1.16%(d),(f) | 1.02%(d),(f) | 0.97% | 555% | $226 |
| Year Ended 5/31/2020 | $28.12 | (6.27%) | 1.17%(d),(f) | 0.99%(d),(f) | 1.15% | 789% | $133 |
| Year Ended 5/31/2019 | $30.01 | (13.79%) | 1.20%(d) | 1.01%(d) | 1.07% | 0% | $216 |
| Year Ended 5/31/2018 | $34.78 | (5.27%) | 1.24%(d) | 1.03%(d) | 0.41% | 0% | $4,433 |
| Class C(c) |
| Year Ended 5/31/2022 | $26.99 | (4.29%) | 2.17%(d) | 2.06%(d),(e) | 24.79% | 352% | $12,869 |
| Year Ended 5/31/2021 | $28.59 | 5.73% | 2.15%(d),(f) | 2.02%(d),(f) | (0.14%) | 555% | $114 |
| Year Ended 5/31/2020 | $27.05 | (7.27%) | 2.17%(d),(f) | 1.99%(d),(f) | 0.21% | 789% | $220 |
| Year Ended 5/31/2019 | $29.16 | (14.64%) | 2.20%(d) | 1.99%(d) | 0.22% | 0% | $493 |
| Year Ended 5/31/2018 | $34.15 | (6.15%) | 2.24%(d) | 2.03%(d) | (0.68%) | 0% | $838 |
| Institutional Class(c) |
| Year Ended 5/31/2022 | $28.30 | (3.32%) | 1.17%(d) | 1.05%(d),(e) | 1.15% | 352% | $790,615 |
| Year Ended 5/31/2021 | $29.97 | 6.73% | 1.16%(d),(f) | 1.02%(d),(f) | 0.95% | 555% | $806,627 |
| Year Ended 5/31/2020 | $28.07 | (6.28%) | 1.17%(d),(f) | 1.00%(d),(f) | 1.17% | 789% | $614,500 |
| Year Ended 5/31/2019 | $29.96 | (13.71%) | 1.20%(d) | 0.99%(d) | 1.23% | 0% | $587,203 |
| Year Ended 5/31/2018 | $34.73 | (5.35%) | 1.24%(d) | 1.03%(d) | 0.34% | 0% | $706,826 |
| Institutional 2 Class(c) |
| Year Ended 5/31/2022 | $28.44 | (3.29%) | 1.12%(d) | 1.01%(d) | 1.11% | 352% | $665 |
| Year Ended 5/31/2021 | $30.12 | 6.81% | 1.11%(d),(f) | 0.98%(d),(f) | 1.14% | 555% | $876 |
| Year Ended 5/31/2020 | $28.19 | (6.25%) | 1.10%(d),(f) | 0.92%(d),(f) | 1.28% | 789% | $124 |
| Year Ended 5/31/2019 | $30.07 | (13.66%) | 1.11%(d) | 0.90%(d) | 1.32% | 0% | $667 |
| Year Ended 5/31/2018 | $34.84 | (5.08%) | 1.11%(d) | 0.90%(d) | 0.48% | 0% | $825 |
The accompanying Notes to Consolidated Financial Statements are an integral part of this statement.
Columbia Multi Strategy Alternatives Fund | Annual Report 2022
| 41 |
Consolidated Financial Highlights (continued)
| | Net asset value,
beginning of
period | Net
investment
income
(loss) | Net
realized
and
unrealized
gain (loss) | Total from
investment
operations | Distributions
from net
investment
income | Total
distributions to
shareholders |
| Institutional 3 Class(c) |
| Year Ended 5/31/2022 | $30.22 | 0.39 | (1.37) | (0.98) | (0.70) | (0.70) |
| Year Ended 5/31/2021 | $28.27 | 0.23 | 1.72 | 1.95 | — | — |
| Year Ended 5/31/2020 | $30.14 | 0.36 | (2.23) | (1.87) | — | — |
| Year Ended 5/31/2019 | $34.89 | 0.44 | (5.19) | (4.75) | — | — |
| Year Ended 5/31/2018 | $37.63 | 0.20 | (2.02) | (1.82) | (0.92) | (0.92) |
| Class R(c) |
| Year Ended 5/31/2022 | $29.30 | 0.21 | (1.33) | (1.12) | (0.53) | (0.53) |
| Year Ended 5/31/2021 | $27.57 | 0.13 | 1.60 | 1.73 | — | — |
| Year Ended 5/31/2020 | $29.56 | 0.20 | (2.19) | (1.99) | — | — |
| Year Ended 5/31/2019 | $34.44 | 0.24 | (5.12) | (4.88) | — | — |
| Year Ended 5/31/2018 | $37.30 | (0.08) | (1.98) | (2.06) | (0.80) | (0.80) |
| Notes to Consolidated Financial Highlights |
| (a) | In addition to the fees and expenses that the Fund bears directly, the Fund indirectly bears a pro rata share of the fees and expenses of any other funds in which it invests. Such indirect expenses are not included in the Fund’s reported expense ratios. |
| (b) | Total net expenses include the impact of certain fee waivers/expense reimbursements made by the Investment Manager and certain of its affiliates, if applicable. |
| (c) | Per share amounts have been adjusted on a retroactive basis to reflect a 4 to 1 reverse stock split completed after the close of business on September 11, 2020. |
| (d) | Ratios include interest on collateral expense. For the periods indicated below, if interest on collateral expense had been excluded, expenses would have been lower by: |
| Class | 5/31/2022 | 5/31/2021 | 5/31/2020 | 5/31/2019 | 5/31/2018 |
| Class A | 0.04% | 0.01% | 0.01% | 0.02% | 0.01% |
| Advisor Class | 0.04% | 0.01% | 0.01% | 0.02% | 0.01% |
| Class C | 0.04% | 0.01% | 0.01% | 0.02% | 0.01% |
| Institutional Class | 0.04% | 0.01% | 0.01% | 0.02% | 0.01% |
| Institutional 2 Class | 0.04% | 0.01% | 0.01% | 0.02% | 0.01% |
| Institutional 3 Class | 0.04% | less than 0.01% | 0.01% | 0.02% | 0.01% |
| Class R | 0.04% | 0.01% | 0.01% | 0.02% | 0.01% |
| (e) | The benefits derived from expense reductions had an impact of less than 0.01%. |
| (f) | Ratios include line of credit interest expense which is less than 0.01%. |
The accompanying Notes to Consolidated Financial Statements are an integral part of this statement.
| 42 | Columbia Multi Strategy Alternatives Fund | Annual Report 2022 |
Consolidated Financial Highlights (continued)
| | Net
asset
value,
end of
period | Total
return | Total gross
expense
ratio to
average
net assets(a) | Total net
expense
ratio to
average
net assets(a),(b) | Net investment
income (loss)
ratio to
average
net assets | Portfolio
turnover | Net
assets,
end of
period
(000’s) |
| Institutional 3 Class(c) |
| Year Ended 5/31/2022 | $28.54 | (3.21%) | 1.07%(d) | 0.96%(d) | 1.32% | 352% | $7 |
| Year Ended 5/31/2021 | $30.22 | 6.86% | 1.03%(d),(f) | 0.90%(d),(f) | 0.79% | 555% | $8 |
| Year Ended 5/31/2020 | $28.27 | (6.11%) | 1.05%(d),(f) | 0.88%(d),(f) | 1.30% | 789% | $14,960 |
| Year Ended 5/31/2019 | $30.14 | (13.65%) | 1.06%(d) | 0.84%(d) | 1.38% | 0% | $17,670 |
| Year Ended 5/31/2018 | $34.89 | (5.16%) | 1.05%(d) | 0.84%(d) | 0.50% | 0% | $20,459 |
| Class R(c) |
| Year Ended 5/31/2022 | $27.65 | (3.83%) | 1.66%(d) | 1.55%(d),(e) | 0.74% | 352% | $7 |
| Year Ended 5/31/2021 | $29.30 | 6.31% | 1.63%(d),(f) | 1.51%(d),(f) | 0.45% | 555% | $7 |
| Year Ended 5/31/2020 | $27.57 | (6.77%) | 1.63%(d),(f) | 1.47%(d),(f) | 0.71% | 789% | $7 |
| Year Ended 5/31/2019 | $29.56 | (14.17%) | 1.69%(d) | 1.48%(d) | 0.75% | 0% | $7 |
| Year Ended 5/31/2018 | $34.44 | (5.80%) | 1.74%(d) | 1.53%(d) | (0.19%) | 0% | $9 |
The accompanying Notes to Consolidated Financial Statements are an integral part of this statement.
Columbia Multi Strategy Alternatives Fund | Annual Report 2022
| 43 |
Notes to Consolidated Financial Statements
May 31, 2022
Note 1. Organization
Columbia Multi Strategy Alternatives Fund (the Fund), a series of Columbia Funds Series Trust I (the Trust), is a diversified fund. The Trust is registered under the Investment Company Act of 1940, as amended (the 1940 Act), as an open-end management investment company organized as a Massachusetts business trust.
The Fund’s Board of Trustees approved reverse stock splits of the issued and outstanding shares of the Fund (the Reverse Stock Split). The Reverse Stock Split was completed after the close of business on September 11, 2020. The impact of the Reverse Stock Split was to decrease the number of shares outstanding and increase the net asset value per share for each share class of the Fund by the ratio of 4 to 1, resulting in no effect on the net assets of each share class or the value of each affected shareholder’s investment. Capital stock share activity reflected in the Consolidated Statement of Changes in Net Assets and per share data in the Consolidated Financial Highlights have been adjusted on a retroactive basis to reflect the impact of the Reverse Stock Split.
Basis for consolidation
CMSAF1 Offshore Fund, Ltd., CMSAF2 Offshore Fund, Ltd. and CMSAF3 Offshore Fund, Ltd. (each, a Subsidiary) are each a Cayman Islands exempted company and wholly-owned subsidiary of the Fund. Each Subsidiary acts as an investment vehicle in order to effect certain investment strategies consistent with the Fund’s investment objective and policies as stated in its current prospectus and statement of additional information. In accordance with the Memorandum and Articles of Association of each Subsidiary (the Articles), the Fund owns the sole issued share of each Subsidiary and retains all rights associated with such share, including the right to receive notice of, attend and vote at general meetings of the Subsidiaries, rights in a winding-up or repayment of capital and the right to participate in the profits or assets of the Subsidiaries. The consolidated financial statements (financial statements) include the accounts of the consolidated Fund and each respective Subsidiary. Subsequent references to the Fund within the Notes to Consolidated Financial Statements collectively refer to the Fund and each Subsidiary. All intercompany transactions and balances have been eliminated in the consolidation process.
At May 31, 2022, the Subsidiary financial statement information is as follows:
| | CMSAF1 Offshore Fund, Ltd. | CMSAF2 Offshore Fund, Ltd. | CMSAF3 Offshore Fund, Ltd. |
| % of consolidated fund net assets | 0.01% | 5.15% | 3.24% |
| Net assets | $45,247 | $41,536,561 | $26,144,487 |
| Net investment income (loss) | (10,749) | (404,731) | (228,904) |
| Net realized gain (loss) | (1) | 8,382,703 | 11,491,006 |
| Net change in unrealized appreciation (depreciation) | (9) | (1,032,366) | 1,898,321 |
The financial statements present the portfolio holdings, financial position and results of operations of the Fund and the Subsidiaries on a consolidated basis.
Fund shares
The Trust may issue an unlimited number of shares (without par value). The Fund offers each of the share classes listed in the Consolidated Statement of Assets and Liabilities. Although all share classes generally have identical voting, dividend and liquidation rights, each share class votes separately when required by the Trust’s organizational documents or by law. Each share class has its own expense and sales charge structure. Different share classes may have different minimum initial investment amounts and pay different net investment income distribution amounts to the extent the expenses of distributing such share classes vary. Distributions to shareholders in a liquidation will be proportional to the net asset value of each share class.
As described in the Fund’s prospectus, Class A and Class C shares are offered to the general public for investment. Class C shares automatically convert to Class A shares after 8 years. Advisor Class, Institutional Class, Institutional 2 Class, Institutional 3 Class and Class R shares are available for purchase through authorized investment professionals to omnibus retirement plans or to institutional investors and to certain other investors as also described in the Fund’s prospectus.
| 44 | Columbia Multi Strategy Alternatives Fund | Annual Report 2022 |
Notes to Consolidated Financial Statements (continued)
May 31, 2022
Note 2. Summary of significant accounting policies
Basis of preparation
The Fund is an investment company that applies the accounting and reporting guidance in the Financial Accounting Standards Board (FASB) Accounting Standards Codification Topic 946, Financial Services - Investment Companies (ASC 946). The financial statements are prepared in accordance with U.S. generally accepted accounting principles (GAAP), which requires management to make certain estimates and assumptions that affect the reported amounts of assets and liabilities, the disclosure of contingent assets and liabilities at the date of the financial statements and the reported amounts of income and expenses during the reporting period. Actual results could differ from those estimates.
The following is a summary of significant accounting policies followed by the Fund in the preparation of its financial statements.
Security valuation
Debt securities generally are valued by pricing services approved by the Board of Trustees based upon market transactions for normal, institutional-size trading units of similar securities. The services may use various pricing techniques that take into account, as applicable, factors such as yield, quality, coupon rate, maturity, type of issue, trading characteristics and other data, as well as approved independent broker-dealer quotes. Debt securities for which quotations are not readily available or not believed to be reflective of market value may also be valued based upon a bid quote from an approved independent broker-dealer. Debt securities maturing in 60 days or less are valued primarily at amortized market value, unless this method results in a valuation that management believes does not approximate fair value.
Asset- and mortgage-backed securities are generally valued by pricing services, which utilize pricing models that incorporate the securities’ cash flow and loan performance data. These models also take into account available market data, including trades, market quotations, and benchmark yield curves for identical or similar securities. Factors used to identify similar securities may include, but are not limited to, issuer, collateral type, vintage, prepayment speeds, collateral performance, credit ratings, credit enhancement and expected life. Asset-backed securities for which quotations are readily available may also be valued based upon an over-the-counter or exchange bid quote from an approved independent broker-dealer. Debt securities maturing in 60 days or less are valued primarily at amortized market value, unless this method results in a valuation that management believes does not approximate fair value.
Investments in open-end investment companies (other than exchange-traded funds (ETFs)), are valued at the latest net asset value reported by those companies as of the valuation time.
Forward foreign currency exchange contracts are marked-to-market based upon foreign currency exchange rates provided by a pricing service.
Futures and options on futures contracts are valued based upon the settlement price at the close of regular trading on their principal exchanges or, in the absence of a settlement price, at the mean of the latest quoted bid and ask prices.
Option contracts are valued at the mean of the latest quoted bid and ask prices on their primary exchanges. Option contracts, including over-the-counter option contracts, with no readily available market quotations are valued using mid-market evaluations from independent third-party vendors.
Swap transactions are valued through an independent pricing service or broker, or if neither is available, through an internal model based upon observable inputs.
Investments for which market quotations are not readily available, or that have quotations which management believes are not reflective of market value or reliable, are valued at fair value as determined in good faith under procedures approved by and under the general supervision of the Board of Trustees. If a security or class of securities (such as foreign securities) is valued at fair value, such value is likely to be different from the quoted or published price for the security, if available.
Columbia Multi Strategy Alternatives Fund | Annual Report 2022
| 45 |
Notes to Consolidated Financial Statements (continued)
May 31, 2022
The determination of fair value often requires significant judgment. To determine fair value, management may use assumptions including but not limited to future cash flows and estimated risk premiums. Multiple inputs from various sources may be used to determine fair value.
GAAP requires disclosure regarding the inputs and valuation techniques used to measure fair value and any changes in valuation inputs or techniques. In addition, investments shall be disclosed by major category. This information is disclosed following the Fund’s Consolidated Portfolio of Investments.
Foreign currency transactions and translations
The values of all assets and liabilities denominated in foreign currencies are generally translated into U.S. dollars at exchange rates determined at the close of regular trading on the New York Stock Exchange. Net realized and unrealized gains (losses) on foreign currency transactions and translations include gains (losses) arising from the fluctuation in exchange rates between trade and settlement dates on securities transactions, gains (losses) arising from the disposition of foreign currency and currency gains (losses) between the accrual and payment dates on dividends, interest income and foreign withholding taxes.
For financial statement purposes, the Fund does not distinguish that portion of gains (losses) on investments which is due to changes in foreign exchange rates from that which is due to changes in market prices of the investments. Such fluctuations are included with the net realized and unrealized gains (losses) on investments in the Consolidated Statement of Operations.
Derivative instruments
The Fund invests in certain derivative instruments, as detailed below, in seeking to meet its investment objectives. Derivatives are instruments whose values depend on, or are derived from, in whole or in part, the value of one or more securities, currencies, commodities, indices, or other assets or instruments. Derivatives may be used to increase investment flexibility (including to maintain cash reserves while maintaining desired exposure to certain assets), for risk management (hedging) purposes, to facilitate trading, to reduce transaction costs and to pursue higher investment returns. The Fund may also use derivative instruments to mitigate certain investment risks, such as foreign currency exchange rate risk, interest rate risk and credit risk. Derivatives may involve various risks, including the potential inability of the counterparty to fulfill its obligations under the terms of the contract, the potential for an illiquid secondary market (making it difficult for the Fund to sell or terminate, including at favorable prices) and the potential for market movements which may expose the Fund to gains or losses in excess of the amount shown in the Consolidated Statement of Assets and Liabilities. The notional amounts of derivative instruments, if applicable, are not recorded in the financial statements.
A derivative instrument may suffer a marked-to-market loss if the value of the contract decreases due to an unfavorable change in the market rates or values of the underlying instrument. Losses can also occur if the counterparty does not perform its obligations under the contract. The Fund’s risk of loss from counterparty credit risk on over-the-counter derivatives is generally limited to the aggregate unrealized gain netted against any collateral held by the Fund and the amount of any variation margin held by the counterparty, plus any replacement costs or related amounts. With exchange-traded or centrally cleared derivatives, there is reduced counterparty credit risk to the Fund since the clearinghouse or central counterparty (CCP) provides some protection in the case of clearing member default. The clearinghouse or CCP stands between the buyer and the seller of the contract; therefore, failure of the clearinghouse or CCP may pose additional counterparty credit risk. However, credit risk still exists in exchange-traded or centrally cleared derivatives with respect to initial and variation margin that is held in a broker’s customer account. While clearing brokers are required to segregate customer margin from their own assets, in the event that a clearing broker becomes insolvent or goes into bankruptcy and at that time there is a shortfall in the aggregate amount of margin held by the clearing broker for all its clients and such shortfall is remedied by the CCP or otherwise, U.S. bankruptcy laws will typically allocate that shortfall on a pro-rata basis across all the clearing broker’s customers (including the Fund), potentially resulting in losses to the Fund.
In order to better define its contractual rights and to secure rights that will help the Fund mitigate its counterparty risk, the Fund may enter into an International Swaps and Derivatives Association, Inc. Master Agreement (ISDA Master Agreement) or similar agreement with its derivatives counterparties. An ISDA Master Agreement is an agreement between the Fund and a counterparty that governs over-the-counter derivatives and foreign exchange forward contracts and contains, among other things, collateral posting terms and netting provisions in the event of a default and/or termination event. Under an ISDA
| 46 | Columbia Multi Strategy Alternatives Fund | Annual Report 2022 |
Notes to Consolidated Financial Statements (continued)
May 31, 2022
Master Agreement, the Fund may, under certain circumstances, offset with the counterparty certain derivative instruments’ payables and/or receivables with collateral held and/or posted and create one single net payment. The provisions of the ISDA Master Agreement typically permit a single net payment in the event of default (close-out netting), including the bankruptcy or insolvency of the counterparty. Note, however, that bankruptcy or insolvency laws of a particular jurisdiction may impose restrictions on or prohibitions against the right of offset or netting in bankruptcy, insolvency or other events.
Collateral (margin) requirements differ by type of derivative. Margin requirements are established by the clearinghouse or CCP for exchange-traded and centrally cleared derivatives. Brokers can ask for margin in excess of the minimum in certain circumstances. Collateral terms for most over-the-counter derivatives are subject to regulatory requirements to exchange variation margin with trading counterparties and may have contract specific margin terms as well. For over-the-counter derivatives traded under an ISDA Master Agreement, the collateral requirements are typically calculated by netting the marked-to-market amount for each transaction under such agreement and comparing that amount to the value of any variation margin currently pledged by the Fund and/or the counterparty. Generally, the amount of collateral due from or to a party has to exceed a minimum transfer amount threshold (e.g., $250,000) before a transfer has to be made. To the extent amounts due to the Fund from its counterparties are not fully collateralized, contractually or otherwise, the Fund bears the risk of loss from counterparty nonperformance. The Fund may also pay interest expense on cash collateral received from the broker. Any interest expense paid by the Fund is shown in the Consolidated Statement of Operations. The Fund attempts to mitigate counterparty risk by only entering into agreements with counterparties that it believes have the financial resources to honor their obligations and by monitoring the financial stability of those counterparties.
Certain ISDA Master Agreements allow counterparties of over-the-counter derivatives transactions to terminate derivatives contracts prior to maturity in the event the Fund’s net asset value declines by a stated percentage over a specified time period or if the Fund fails to meet certain terms of the ISDA Master Agreement, which would cause the Fund to accelerate payment of any net liability owed to the counterparty. The Fund also has termination rights if the counterparty fails to meet certain terms of the ISDA Master Agreement. In determining whether to exercise such termination rights, the Fund would consider, in addition to counterparty credit risk, whether termination would result in a net liability owed from the counterparty.
For financial reporting purposes, the Fund does not offset derivative assets and derivative liabilities that are subject to netting arrangements in the Consolidated Statement of Assets and Liabilities.
Forward foreign currency exchange contracts
Forward foreign currency exchange contracts are over-the-counter agreements between two parties to buy and sell a currency at a set price on a future date. The Fund utilized forward foreign currency exchange contracts to hedge the currency exposure associated with some or all of the Fund’s securities, to shift investment exposure from one currency to another and to generate total return through long and short positions versus the U.S. dollar. These instruments may be used for other purposes in future periods.
The values of forward foreign currency exchange contracts fluctuate daily with changes in foreign currency exchange rates. Changes in the value of these contracts are recorded as unrealized appreciation or depreciation until the contract is exercised or has expired. The Fund will realize a gain or loss when the forward foreign currency exchange contract is closed or expires. Non-deliverable forward foreign currency exchange contracts are settled with the counterparty in U.S. dollars without delivery of foreign currency.
The use of forward foreign currency exchange contracts does not eliminate fluctuations in the prices of the Fund’s portfolio securities. The risks of forward foreign currency exchange contracts include movement in the values of the foreign currencies relative to the U.S. dollar (or other foreign currencies) and the possibility that counterparties will not complete their contractual obligations, which may be in excess of the amount reflected, if any, in the Consolidated Statement of Assets and Liabilities.
Futures contracts
Futures contracts are exchange-traded and represent commitments for the future purchase or sale of an asset at a specified price on a specified date. The Fund bought and sold futures contracts to produce incremental earnings, to manage the duration and yield curve exposure of the Fund versus the benchmark, to manage exposure to movements in interest rates, to manage exposure to the securities market and to generate total return through long and short positions. These instruments
Columbia Multi Strategy Alternatives Fund | Annual Report 2022
| 47 |
Notes to Consolidated Financial Statements (continued)
May 31, 2022
may be used for other purposes in future periods. Upon entering into futures contracts, the Fund bears risks that it may not achieve the anticipated benefits of the futures contracts and may realize a loss. Additional risks include counterparty credit risk, the possibility of an illiquid market, and that a change in the value of the contract or option may not correlate with changes in the value of the underlying asset.
Upon entering into a futures contract, the Fund deposits cash or securities with the broker, known as a futures commission merchant (FCM), in an amount sufficient to meet the initial margin requirement. The initial margin deposit must be maintained at an established level over the life of the contract. Cash deposited as initial margin is recorded in the Consolidated Statement of Assets and Liabilities as margin deposits. Securities deposited as initial margin are designated in the Consolidated Portfolio of Investments. Subsequent payments (variation margin) are made or received by the Fund each day. The variation margin payments are equal to the daily change in the contract value and are recorded as variation margin receivable or payable and are offset in unrealized gains or losses. The Fund generally expects to earn interest income on its margin deposits. The Fund recognizes a realized gain or loss when the contract is closed or expires. Futures contracts involve, to varying degrees, risk of loss in excess of the variation margin disclosed in the Consolidated Statement of Assets and Liabilities.
Options contracts
Options are contracts which entitle the holder to purchase or sell securities or other identified assets at a specified price, or in the case of index option contracts, to receive or pay the difference between the index value and the strike price of the index option contract. Option contracts can be either exchange-traded or over-the-counter. The Fund purchased and has written option contracts to manage exposure to fluctuations in interest rates. These instruments may be used for other purposes in future periods. Completion of transactions for option contracts traded in the over-the-counter market depends upon the performance of the other party. Collateral may be collected or posted by the Fund to secure over-the-counter option contract trades. Collateral held or posted by the Fund for such option contract trades must be returned to the broker or the Fund upon closure, exercise or expiration of the contract.
Options contracts purchased are recorded as investments. When the Fund writes an options contract, the premium received is recorded as an asset and an amount equivalent to the premium is recorded as a liability in the Consolidated Statement of Assets and Liabilities and is subsequently adjusted to reflect the current fair value of the option written. Changes in the fair value of the written option are recorded as unrealized appreciation or depreciation until the contract is exercised or has expired. The Fund realizes a gain or loss when the option contract is closed or expires. When option contracts are exercised, the proceeds on sales for a written call or purchased put option contract, or the purchase cost for a written put or purchased call option contract, is adjusted by the amount of premium received or paid.
For over-the-counter options purchased, the Fund bears the risk of loss of the amount of the premiums paid plus the positive change in market values net of any collateral held by the Fund should the counterparty fail to perform under the contracts. Option contracts written by the Fund do not typically give rise to significant counterparty credit risk, as options written generally obligate the Fund and not the counterparty to perform. The risk in writing a call option contract is that the Fund gives up the opportunity for profit if the market price of the security increases above the strike price and the option contract is exercised. The risk in writing a put option contract is that the Fund may incur a loss if the market price of the security decreases below the strike price and the option contract is exercised. Exercise of a written option could result in the Fund purchasing or selling a security or foreign currency when it otherwise would not, or at a price different from the current market value. In purchasing and writing options, the Fund bears the risk of an unfavorable change in the value of the underlying instrument or the risk that the Fund may not be able to enter into a closing transaction due to an illiquid market.
Interest rate swaption contracts
Interest rate swaption contracts entered into by the Fund typically represent an option that gives the purchaser the right, but not the obligation, to enter into an interest rate swap contract on a future date. Each interest rate swaption contract will specify if the buyer is entitled to receive the fixed or floating rate if the interest rate is exercised. Changes in the value of a purchased interest rate swaption contracts are reported as unrealized appreciation or depreciation on options in the Consolidated Statement of Assets and Liabilities. Gain or loss is recognized in the Consolidated Statement of Operations when the interest rate swaption contract is closed or expires.
| 48 | Columbia Multi Strategy Alternatives Fund | Annual Report 2022 |
Notes to Consolidated Financial Statements (continued)
May 31, 2022
When the Fund writes an interest rate swaption contract, the premium received is recorded as an asset and an amount equivalent to the premium is recorded as a liability in the Consolidated Statement of Assets and Liabilities and is subsequently adjusted to reflect the current fair value of the interest rate swaption contract written. Premiums received from writing interest rate swaption contracts that expire unexercised are recorded by the Fund on the expiration date as realized gains from options written in the Consolidated Statement of Operations. The difference between the premium and the amount paid on effecting a closing purchase transaction, including brokerage commissions, is also recorded as realized gain, or if the premium is less than the amount paid for the closing purchase, as realized loss. These amounts are reflected as net realized gain (loss) on options written in the Consolidated Statement of Operations.
Swap contracts
Swap contracts are negotiated in the over-the-counter market and may be entered into as a bilateral contract or centrally cleared (centrally cleared swap contract). In a centrally cleared swap contract, immediately following execution of the swap contract with a broker, the swap contract is novated to a central counterparty (the CCP) and the CCP becomes the Fund’s counterparty to the centrally cleared swap contract. The Fund is required to deposit initial margin with the futures commission merchant (FCM), which pledges it through to the CCP in the form of cash or securities in an amount that varies depending on the size and risk profile of the particular swap contract. Securities deposited as initial margin are designated in the Consolidated Portfolio of Investments and cash deposited is recorded in the Consolidated Statement of Assets and Liabilities as margin deposits. For a bilateral swap contract, the Fund has credit exposure to the broker, but exchanges daily variation margin with the broker based on the mark-to-market value of the swap contract to minimize that exposure. For centrally cleared swap contracts, the Fund has minimal credit exposure to the FCM because the CCP stands between the Fund and the relevant buyer/seller on the other side of the contract. Swap contracts are marked-to-market daily and changes in value are recorded as unrealized appreciation (depreciation). The daily change in valuation of centrally cleared swap contracts, if any, is recorded as a receivable or payable for variation margin in the Consolidated Statement of Assets and Liabilities.
Entering into these contracts involves, to varying degrees, elements of interest, liquidity and counterparty credit risk in excess of the amounts recognized in the Consolidated Statement of Assets and Liabilities. Such risks involve the possibility that there may be unfavorable changes in interest rates, market conditions or other conditions, that it may be difficult to initiate a swap transaction or liquidate a position at an advantageous time or price which may result in significant losses, and that the FCM or CCP may not fulfill its obligation under the contract.
Credit default swap contracts
The Fund entered into credit default swap contracts to increase or decrease its credit exposure to an index. These instruments may be used for other purposes in future periods. Credit default swap contracts are transactions in which one party pays fixed periodic payments to a counterparty in consideration for an agreement from the counterparty to make a specific payment should a specified credit event(s) take place. Although specified credit events are contract specific, credit events are typically bankruptcy, failure to pay, restructuring, obligation acceleration, obligation default, or repudiation/moratorium.
As the purchaser of a credit default swap contract, the Fund purchases protection by paying a periodic interest rate on the notional amount to the counterparty. The interest amount is accrued daily as a component of unrealized appreciation (depreciation) and is recorded as a realized loss upon payment. If a credit event as specified in the contract occurs, the Fund may have the option either to deliver the reference obligation to the seller in exchange for a cash payment of its par amount, or to receive a net cash settlement equal to the par amount less an agreed-upon value of the reference obligation as of the date of the credit event. The difference between the value of the obligation or cash delivered and the notional amount received will be recorded as a realized gain (loss).
As the seller of a credit default swap contract, the Fund sells protection to a buyer and will generally receive a periodic interest rate on a notional amount. The interest amount is accrued daily as a component of unrealized appreciation (depreciation) and is recorded as a realized gain upon receipt of the payment. If a credit event as specified in the contract with the counterparty occurs, the Fund may either be required to accept the reference obligation from the buyer in exchange for a cash payment of its notional amount, or to pay the buyer a net cash settlement equal to the notional amount less an agreed-upon value of the reference obligation (recovery value) as of the date of the credit event. The difference between the value of the obligation or cash received and the notional amount paid will be recorded as a realized gain (loss). The maximum
Columbia Multi Strategy Alternatives Fund | Annual Report 2022
| 49 |
Notes to Consolidated Financial Statements (continued)
May 31, 2022
potential amount of undiscounted future payments the Fund could be required to make as the seller of protection under a credit default swap contract is equal to the notional amount of the reference obligation. These potential amounts may be partially offset by any recovery values of the respective reference obligations or upfront receipts upon entering into the agreement. The notional amounts and market values of all credit default swap contracts in which the Fund is the seller of protection, if any, are disclosed in the Credit Default Swap Contracts Outstanding schedule following the Consolidated Portfolio of Investments.
As a protection seller, the Fund bears the risk of loss from the credit events specified in the contract with the counterparty. For credit default swap contracts on credit indices, quoted market prices and resulting market values serve as an indicator of the current status of the payment/performance risk. Increasing market values, in absolute terms when compared to the notional amount of the swap, represent a deterioration of the reference entity’s credit soundness and a greater likelihood or risk of default or other credit event occurring as defined under the terms of the contract.
Any upfront payment or receipt by the Fund upon entering into a credit default swap contract is recorded as an asset or liability, respectively, and amortized daily as a component of realized gain (loss) in the Consolidated Statement of Operations. Credit default swap contracts are valued daily, and the change in value is recorded as unrealized appreciation (depreciation) until the termination of the swap, at which time a realized gain (loss) is recorded.
Credit default swap contracts can involve greater risks than if a fund had invested in the reference obligation directly since, in addition to general market risks, credit default swaps are subject to counterparty credit risk, leverage risk, hedging risk, correlation risk and liquidity risk.
Interest rate and inflation rate swap contracts
The Fund entered into interest rate swap transactions and/or inflation rate swap contracts to manage interest rate and market risk exposure to produce incremental earnings, to gain exposure to or protect itself from market rate changes, to synthetically add or subtract principal exposure to a market and to manage long or short exposure to the total return on a reference index in return for periodic payments based on a fixed or variable interest rate. These instruments may be used for other purposes in future periods. An interest rate swap or inflation rate swap, as applicable, is an agreement between two parties where there are two flows and payments are made between the two counterparties and the payments are dependent upon changes in an interest rate, inflation rate or inflation index calculated on a nominal amount. Interest rate swaps are agreements between two parties that involve the exchange of one type of interest rate for another type of interest rate cash flow on specified dates in the future, based on a predetermined, specified notional amount. Certain interest rate swaps are considered forward-starting, whereby the accrual for the exchange of cash flows does not begin until a specified date in the future. The net cash flow for a standard interest rate swap transaction is generally the difference between a floating market interest rate versus a fixed interest rate.
Interest rate swaps are valued daily and unrealized appreciation (depreciation) is recorded. Certain interest rate swaps may accrue periodic interest on a daily basis as a component of unrealized appreciation (depreciation); the Fund will realize a gain or loss upon the payment or receipt of accrued interest. The Fund will realize a gain or a loss when the interest rate swap is terminated.
Total return swap contracts
The Fund entered into total return swap contracts to manage long or short exposure to the total return on a reference security index in return for periodic payments based on a fixed or variable interest rate. These instruments may be used for other purposes in future periods. Total return swap contracts may be used to obtain exposure to an underlying reference security, instrument, or other asset or index or market without owning, taking physical custody of, or short selling any such security, instrument or asset in a market.
Total return swap contracts are valued daily, and the change in value is recorded as unrealized appreciation (depreciation) until the termination of the swap, at which time the Fund will realize a gain (loss). Periodic payments received (or made) by the Fund over the term of the contract are recorded as realized gains (losses). Total return swap contracts are subject to the risk associated with the investment in the underlying reference security, instrument or asset. The risk in the case of short total return swap contracts is unlimited based on the potential for unlimited increases in the market value of the underlying
| 50 | Columbia Multi Strategy Alternatives Fund | Annual Report 2022 |
Notes to Consolidated Financial Statements (continued)
May 31, 2022
reference security, instrument or asset. This risk may be offset if the Fund holds any of the underlying reference security, instrument or asset. The risk in the case of long total return swap contracts is limited to the current notional amount of the total return swap contract.
Effects of derivative transactions in the financial statements
The following tables are intended to provide additional information about the effect of derivatives on the financial statements of the Fund, including: the fair value of derivatives by risk category and the location of those fair values in the Consolidated Statement of Assets and Liabilities; and the impact of derivative transactions over the period in the Consolidated Statement of Operations, including realized and unrealized gains (losses). The derivative instrument schedules following the Consolidated Portfolio of Investments present additional information regarding derivative instruments outstanding at the end of the period, if any.
The following table is a summary of the fair value of derivative instruments (not considered to be hedging instruments for accounting disclosure purposes) at May 31, 2022:
| | Asset derivatives | |
Risk exposure
category | Consolidated statement
of assets and liabilities
location | Fair value ($) |
| Credit risk | Component of total distributable earnings (loss) — unrealized appreciation on swap contracts | 1,558,471* |
| Equity risk | Component of total distributable earnings (loss) — unrealized appreciation on futures contracts | 10,264,716* |
| Equity risk | Component of total distributable earnings (loss) — unrealized appreciation on swap contracts | 935,102* |
| Foreign exchange risk | Unrealized appreciation on forward foreign currency exchange contracts | 45,794,852 |
| Interest rate risk | Component of total distributable earnings (loss) — unrealized appreciation on futures contracts | 3,334,230* |
| Interest rate risk | Investments, at value — Options purchased | 1,750,140 |
| Interest rate risk | Component of total distributable earnings (loss) — unrealized appreciation on swap contracts | 17,508,852* |
| Commodity-related investment risk | Component of total distributable earnings (loss) — unrealized appreciation on futures contracts | 2,993,786* |
| Total | | 84,140,149 |
| | Liability derivatives | |
Risk exposure
category | Consolidated statement
of assets and liabilities
location | Fair value ($) |
| Credit risk | Component of total distributable earnings (loss) — unrealized depreciation on swap contracts | 924,595* |
| Credit risk | Upfront receipts on swap contracts | 6,341,266 |
| Equity risk | Component of total distributable earnings (loss) — unrealized depreciation on futures contracts | 4,180,553* |
| Equity risk | Component of total distributable earnings (loss) — unrealized depreciation on swap contracts | 361,661* |
| Foreign exchange risk | Unrealized depreciation on forward foreign currency exchange contracts | 38,037,443 |
| Interest rate risk | Component of total distributable earnings (loss) — unrealized depreciation on futures contracts | 6,133,171* |
| Interest rate risk | Options contracts written, at value | 4,812,862 |
| Interest rate risk | Component of total distributable earnings (loss) — unrealized depreciation on swap contracts | 20,892,412* |
| Commodity-related investment risk | Component of total distributable earnings (loss) — unrealized depreciation on futures contracts | 464,766* |
| Total | | 82,148,729 |
| * | Includes cumulative appreciation (depreciation) as reported in the tables following the Consolidated Portfolio of Investments. Only the current day’s variation margin is reported in receivables or payables in the Consolidated Statement of Assets and Liabilities. |
Columbia Multi Strategy Alternatives Fund | Annual Report 2022
| 51 |
Notes to Consolidated Financial Statements (continued)
May 31, 2022
The following table indicates the effect of derivative instruments (not considered to be hedging instruments for accounting disclosure purposes) in the Consolidated Statement of Operations for the year ended May 31, 2022:
| Amount of realized gain (loss) on derivatives recognized in income |
| Risk exposure category | Forward
foreign
currency
exchange
contracts
($) | Futures
contracts
($) | Options
contracts
written
($) | Options
contracts
purchased
($) | Swap
contracts
($) | Total
($) |
| Commodity-related investment risk | — | 19,260,182 | — | — | 619,080 | 19,879,262 |
| Credit risk | — | — | — | — | 2,070,387 | 2,070,387 |
| Equity risk | — | (8,483,769) | — | — | (3,676,695) | (12,160,464) |
| Foreign exchange risk | (12,107,249) | — | — | — | — | (12,107,249) |
| Interest rate risk | — | 313,417 | (2,344,970) | 3,886,275 | (11,686,734) | (9,832,012) |
| Total | (12,107,249) | 11,089,830 | (2,344,970) | 3,886,275 | (12,673,962) | (12,150,076) |
| |
| Change in unrealized appreciation (depreciation) on derivatives recognized in income |
| Risk exposure category | Forward
foreign
currency
exchange
contracts
($) | Futures
contracts
($) | Options
contracts
written
($) | Options
contracts
purchased
($) | Swap
contracts
($) | Total
($) |
| Commodity-related investment risk | — | 1,835,494 | — | — | (933,714) | 901,780 |
| Credit risk | — | — | — | — | (2,242,970) | (2,242,970) |
| Equity risk | — | 9,948,642 | — | — | 1,167,738 | 11,116,380 |
| Foreign exchange risk | 8,680,717 | — | — | — | — | 8,680,717 |
| Interest rate risk | — | (2,521,265) | (3,115,981) | (5,594,468) | (4,290,237) | (15,521,951) |
| Total | 8,680,717 | 9,262,871 | (3,115,981) | (5,594,468) | (6,299,183) | 2,933,956 |
The following table is a summary of the average outstanding volume by derivative instrument for the year ended May 31, 2022:
| Derivative instrument | Average notional
amounts ($) |
| Futures contracts — long | 675,985,548* |
| Futures contracts — short | 920,597,020* |
| Credit default swap contracts — buy protection | 6,754,076** |
| Credit default swap contracts — sell protection | 39,350,000* |
| Derivative instrument | Average
value ($)* |
| Options contracts — purchased | 1,632,489 |
| Options contracts — written | (2,384,432) |
| Derivative instrument | Average unrealized
appreciation ($)* | Average unrealized
depreciation ($)* |
| Forward foreign currency exchange contracts | 39,925,852 | (42,041,826) |
| Interest rate swap contracts | 7,853,696 | (8,756,896) |
| Total return swap contracts | 1,318,317 | (1,575,067) |
| * | Based on the ending quarterly outstanding amounts for the year ended May 31, 2022. |
| ** | Based on the ending daily outstanding amounts for the year ended May 31, 2022. |
| 52 | Columbia Multi Strategy Alternatives Fund | Annual Report 2022 |
Notes to Consolidated Financial Statements (continued)
May 31, 2022
Asset- and mortgage-backed securities
The Fund may invest in asset-backed and mortgage-backed securities. The maturity dates shown represent the original maturity of the underlying obligation. Actual maturity may vary based upon prepayment activity on these obligations. All, or a portion, of the obligation may be prepaid at any time because the underlying asset may be prepaid. As a result, decreasing market interest rates could result in an increased level of prepayment. An increased prepayment rate will have the effect of shortening the maturity of the security. Unless otherwise noted, the coupon rates presented are fixed rates.
Delayed delivery securities
The Fund may trade securities on other than normal settlement terms, including securities purchased or sold on a “when-issued” or "forward commitment" basis. This may increase risk to the Fund since the other party to the transaction may fail to deliver, which could cause the Fund to subsequently invest at less advantageous prices. The Fund designates cash or liquid securities in an amount equal to the delayed delivery commitment.
To be announced securities
The Fund may trade securities on a To Be Announced (TBA) basis. As with other delayed-delivery transactions, a seller agrees to issue a TBA security at a future date. However, the seller does not specify the particular securities to be delivered. Instead, the Fund agrees to accept any security that meets specified terms.
In some cases, Master Securities Forward Transaction Agreements (MSFTAs) may be used to govern transactions of certain forward-settling agency mortgage-backed securities, such as delayed-delivery and TBAs, between the Fund and counterparty. The MSFTA maintains provisions for, among other things, initiation and confirmation, payment and transfer, events of default, termination, and maintenance of collateral relating to such transactions.
Forward sale commitments
The Fund may enter into forward sale commitments to hedge its portfolio positions or to sell mortgage-backed securities it owns under delayed delivery arrangements. Proceeds of forward sale commitments are not received until the contractual settlement date. While a forward sale commitment is outstanding, equivalent deliverable securities or an offsetting forward purchase commitment deliverable on or before the sale commitment date are used to satisfy the commitment.
Unsettled forward sale commitments are valued at the current market value of the underlying securities, generally according to the procedures described under “Security valuation” above. The forward sale commitment is “marked-to-market” daily and the change in market value is recorded by the Fund as an unrealized gain or loss. If the forward sale commitment is closed through the acquisition of an offsetting purchase commitment, the Fund realizes a gain or loss. If the Fund delivers securities under the commitment, the Fund realizes a gain or a loss from the sale of the securities based upon the market price established at the date the commitment was entered into.
Mortgage dollar roll transactions
The Fund may enter into mortgage “dollar rolls” in which the Fund sells securities for delivery in the current month and simultaneously contracts with the same counterparty to repurchase similar but not identical securities (same type, coupon and maturity) on a specified future date. During the roll period, the Fund loses the right to receive principal and interest paid on the securities sold. However, the Fund may benefit because it receives negotiated amounts in the form of reductions of the purchase price for the future purchase plus the interest earned on the cash proceeds of the securities sold until the settlement date of the forward purchase. The Fund records the incremental difference between the forward purchase and sale of each forward roll as a realized gain or loss. Unless any realized gains exceed the income, capital appreciation, and gain or loss due to mortgage prepayments that would have been realized on the securities sold as part of the mortgage dollar roll, the use of this technique may diminish the investment performance of the Fund compared to what the performance would have been without the use of mortgage dollar rolls. All cash proceeds will be invested in instruments that are permissible investments for the Fund. The Fund identifies cash or liquid securities in an amount equal to the forward purchase price.
Columbia Multi Strategy Alternatives Fund | Annual Report 2022
| 53 |
Notes to Consolidated Financial Statements (continued)
May 31, 2022
For financial reporting and tax purposes, the Fund treats “to be announced” mortgage dollar rolls as two separate transactions, one involving the purchase of a security and a separate transaction involving a sale. These transactions may increase the Fund’s portfolio turnover rate. The Fund does not currently enter into mortgage dollar rolls that are accounted for as financing transactions.
Mortgage dollar rolls involve the risk that the market value of the securities the Fund is obligated to repurchase may decline below the repurchase price, or that the counterparty may default on its obligations.
Interest only and principal only securities
The Fund may invest in Interest Only (IO) or Principal Only (PO) securities. IOs are stripped securities entitled to receive all of the security’s interest, but none of its principal. IOs are particularly sensitive to changes in interest rates and therefore subject to greater fluctuations in price than typical interest bearing debt securities. IOs are also subject to credit risk because the Fund may not receive all or part of the interest payments if the issuer, obligor, guarantor or counterparty defaults on its obligation. Payments received for IOs are included in interest income in the Consolidated Statement of Operations. Because no principal will be received at the maturity of an IO, adjustments are made to the cost of the security on a monthly basis until maturity. These adjustments are included in interest income in the Consolidated Statement of Operations. POs are stripped securities entitled to receive the principal from the underlying obligation, but not the interest. POs are particularly sensitive to changes in interest rates and therefore are subject to fluctuations in price. POs are also subject to credit risk because the Fund may not receive all or part of its principal if the issuer, obligor, guarantor or counterparty defaults on its obligation. The Fund may also invest in IO or PO stripped mortgage-backed securities. Payments received for POs are treated as reductions to the cost and par value of the securities.
| 54 | Columbia Multi Strategy Alternatives Fund | Annual Report 2022 |
Offsetting of assets and liabilities
The following table presents the Fund’s gross and net amount of assets and liabilities available for offset under netting arrangements as well as any related collateral received or pledged by the Fund as of May 31, 2022:
| | Barclays
($) | Citi
($)(a) | Citi
($)(a) | Goldman
Sachs
($) | Goldman
Sachs
International
($) | JPMorgan
($)(a) | JPMorgan
($)(a) | Morgan
Stanley
($)(a) | Morgan
Stanley
($)(a) | Morgan
Stanley
($)(a) | Morgan
Stanley
($)(a) | UBS
($) | Total
($) |
| Assets | | | | | | | | | | | | | |
| Centrally cleared interest rate swap contracts (b) | - | - | - | - | - | - | 2,389,687 | - | - | - | 1,521,323 | - | 3,911,010 |
| Forward foreign currency exchange contracts | 1,763,240 | 32,274,516 | - | - | 1,663,357 | - | - | - | 9,425,447 | - | - | 668,292 | 45,794,852 |
| Options purchased calls | - | - | 449,737 | - | - | - | - | - | - | 719,518 | - | - | 1,169,255 |
| Options purchased puts | - | - | - | - | - | - | - | - | - | 580,885 | - | - | 580,885 |
| OTC credit default swap contracts (c) | - | - | - | - | - | - | - | - | - | 1,558,471 | - | - | 1,558,471 |
| OTC total return swap contracts (c) | - | - | - | - | - | 105,328 | - | - | - | - | - | - | 105,328 |
| OTC total return swap contracts on futures (c) | - | - | - | 75,075 | - | - | - | 711,259 | 43,440 | - | - | - | 829,774 |
| Total assets | 1,763,240 | 32,274,516 | 449,737 | 75,075 | 1,663,357 | 105,328 | 2,389,687 | 711,259 | 9,468,887 | 2,858,874 | 1,521,323 | 668,292 | 53,949,575 |
| Liabilities | | | | | | | | | | | | | |
| Centrally cleared interest rate swap contracts (b) | - | - | - | - | - | - | 2,251,228 | - | - | - | 861,279 | - | 3,112,507 |
| Forward foreign currency exchange contracts | - | 29,775,395 | 476,976 | - | 395,216 | - | - | - | 7,186,147 | - | - | 203,709 | 38,037,443 |
| Options contracts written | - | - | 4,385,464 | - | - | - | - | - | - | 427,398 | - | - | 4,812,862 |
| OTC credit default swap contracts (c) | - | - | - | - | 103,717 | - | - | - | - | 7,162,144 | - | - | 7,265,861 |
| OTC total return swap contracts (c) | - | - | - | - | - | 78,581 | - | - | - | - | - | - | 78,581 |
| OTC total return swap contracts on futures (c) | - | - | - | 8,112 | - | - | - | 6,997 | 267,971 | - | - | - | 283,080 |
| Total liabilities | - | 29,775,395 | 4,862,440 | 8,112 | 498,933 | 78,581 | 2,251,228 | 6,997 | 7,454,118 | 7,589,542 | 861,279 | 203,709 | 53,590,334 |
| Total financial and derivative net assets | 1,763,240 | 2,499,121 | (4,412,703) | 66,963 | 1,164,424 | 26,747 | 138,459 | 704,262 | 2,014,769 | (4,730,668) | 660,044 | 464,583 | 359,241 |
| Total collateral received (pledged) (d) | - | - | (3,372,000) | - | | - | - | - | - | (4,730,668) | - | - | (8,102,668) |
| Net amount (e) | 1,763,240 | 2,499,121 | (1,040,703) | 66,963 | 1,164,424 | 26,747 | 138,459 | 704,262 | 2,014,769 | - | 660,044 | 464,583 | 8,461,909 |
| (a) | Exposure can only be netted across transactions governed under the same master agreement with the same legal entity. |
| (b) | Centrally cleared swaps are included within payable/receivable for variation margin in the Consolidated Statement of Assets and Liabilities. |
| (c) | Over-the-Counter (OTC) swap contracts are presented at market value plus periodic payments receivable (payable), which is comprised of unrealized appreciation, unrealized depreciation, upfront payments and upfront receipts. |
| (d) | In some instances, the actual collateral received and/or pledged may be more than the amount shown due to overcollateralization. |
| (e) | Represents the net amount due from/(to) counterparties in the event of default. |
Notes to Consolidated Financial Statements (continued)
May 31, 2022
Columbia Multi Strategy Alternatives Fund | Annual Report 2022
| 55 |
Notes to Consolidated Financial Statements (continued)
May 31, 2022
Security transactions
Security transactions are accounted for on the trade date. Cost is determined and gains (losses) are based upon the specific identification method for both financial statement and federal income tax purposes.
Income recognition
Interest income is recorded on an accrual basis. Market premiums and discounts, including original issue discounts, are amortized and accreted, respectively, over the expected life of the security on all debt securities, unless otherwise noted. The Fund classifies gains and losses realized on prepayments received on mortgage-backed securities as adjustments to interest income.
The Fund may place a debt security on non-accrual status and reduce related interest income when it becomes probable that the interest will not be collected and the amount of uncollectible interest can be reasonably estimated. A defaulted debt security is removed from non-accrual status when the issuer resumes interest payments or when collectability of interest is reasonably assured.
Dividend income is recorded on the ex-dividend date.
Expenses
General expenses of the Trust are allocated to the Fund and other funds of the Trust based upon relative net assets or other expense allocation methodologies determined by the nature of the expense. Expenses directly attributable to the Fund are charged to the Fund. Expenses directly attributable to a specific class of shares are charged to that share class.
Determination of class net asset value
All income, expenses (other than class-specific expenses, which are charged to that share class, as shown in the Consolidated Statement of Operations) and realized and unrealized gains (losses) are allocated to each class of the Fund on a daily basis, based on the relative net assets of each class, for purposes of determining the net asset value of each class.
Federal income tax status
The Fund intends to qualify each year as a regulated investment company under Subchapter M of the Internal Revenue Code, as amended, and will distribute substantially all of its investment company taxable income and net capital gain, if any, for its tax year, and as such will not be subject to federal income taxes. In addition, the Fund intends to distribute in each calendar year substantially all of its ordinary income, capital gain net income and certain other amounts, if any, such that the Fund should not be subject to federal excise tax. Therefore, no federal income or excise tax provision is recorded.
Distributions to shareholders
Distributions from net investment income, if any, are declared and paid annually. Net realized capital gains, if any, are distributed at least annually. Income distributions and capital gain distributions are determined in accordance with federal income tax regulations, which may differ from GAAP.
Guarantees and indemnifications
Under the Trust’s organizational documents and, in some cases, by contract, its officers and trustees are indemnified against certain liabilities arising out of the performance of their duties to the Trust or its funds. In addition, certain of the Fund’s contracts with its service providers contain general indemnification clauses. The Fund’s maximum exposure under these arrangements is unknown since the amount of any future claims that may be made against the Fund cannot be determined, and the Fund has no historical basis for predicting the likelihood of any such claims.
| 56 | Columbia Multi Strategy Alternatives Fund | Annual Report 2022 |
Notes to Consolidated Financial Statements (continued)
May 31, 2022
Note 3. Fees and other transactions with affiliates
Management services fees
The Fund has entered into a Management Agreement with Columbia Management Investment Advisers, LLC (the Investment Manager), a wholly-owned subsidiary of Ameriprise Financial, Inc. (Ameriprise Financial). Under the Management Agreement, the Investment Manager provides the Fund with investment research and advice, as well as administrative and accounting services. The Investment Manager is responsible for the ultimate oversight of investments made by the Fund. The Fund’s subadvisers (see Subadvisory agreements below) have the primary responsibility for the day-to-day portfolio management of their portion of the Fund. The management services fee is an annual fee that is equal to a percentage of the Fund’s daily net assets that declines from 0.96% to 0.93% as the Fund’s net assets increase. The effective management services fee rate for the year ended May 31, 2022 was 0.96% of the Fund’s average daily net assets.
Subadvisory agreements
The Investment Manager has entered into Subadvisory Agreements with AQR Capital Management, LLC and PGIM Quantitative Solutions LLC, each of which subadvises a portion of the assets of the Fund. Prior to September 28, 2021, PGIM Quantitative Solutions LLC was known as QMA LLC. New investments in the Fund, net of any redemptions, are allocated in accordance with the Investment Manager’s determination. Each subadviser’s proportionate share of investments in the Fund will vary due to market fluctuations. The Investment Manager compensates each subadviser to manage the investment of the Fund’s assets.
In addition, the Fund’s Board of Trustees has approved a Subadvisory Agreement between the Investment Manager and Threadneedle International Limited (Threadneedle), an affiliate of the Investment Manager and an indirect wholly-owned subsidiary of Ameriprise Financial. As of May 31, 2022, Threadneedle is not providing services to the Fund pursuant to the Subadvisory Agreement.
Compensation of board members
Members of the Board of Trustees who are not officers or employees of the Investment Manager or Ameriprise Financial are compensated for their services to the Fund as disclosed in the Consolidated Statement of Operations. Under a Deferred Compensation Plan (the Deferred Plan), these members of the Board of Trustees may elect to defer payment of up to 100% of their compensation. Deferred amounts are treated as though equivalent dollar amounts had been invested in shares of certain funds managed by the Investment Manager. The Fund’s liability for these amounts is adjusted for market value changes and remains in the Fund until distributed in accordance with the Deferred Plan. All amounts payable under the Deferred Plan constitute a general unsecured obligation of the Fund. The expense for the Deferred Plan, which includes Trustees’ fees deferred during the current period as well as any gains or losses on the Trustees’ deferred compensation balances as a result of market fluctuations, is included in "Compensation of board members" in the Consolidated Statement of Operations.
Compensation of Chief Compliance Officer
The Board of Trustees has appointed a Chief Compliance Officer for the Fund in accordance with federal securities regulations. As disclosed in the Consolidated Statement of Operations, a portion of the Chief Compliance Officer’s total compensation is allocated to the Fund, along with other allocations to affiliated registered investment companies managed by the Investment Manager and its affiliates, based on relative net assets.
Transfer agency fees
Under a Transfer and Dividend Disbursing Agent Agreement, Columbia Management Investment Services Corp. (the Transfer Agent), an affiliate of the Investment Manager and a wholly-owned subsidiary of Ameriprise Financial, is responsible for providing transfer agency services to the Fund. The Transfer Agent has contracted with DST Asset Manager Solutions, Inc. (DST) to serve as sub-transfer agent. The Transfer Agent pays the fees of DST for services as sub-transfer agent and DST is not entitled to reimbursement for such fees from the Fund (with the exception of out-of-pocket fees).
Columbia Multi Strategy Alternatives Fund | Annual Report 2022
| 57 |
Notes to Consolidated Financial Statements (continued)
May 31, 2022
The Fund pays the Transfer Agent a monthly transfer agency fee based on the number or the average value of accounts, depending on the type of account. In addition, the Fund pays the Transfer Agent a fee for shareholder services based on the number of accounts or on a percentage of the average aggregate value of the Fund’s shares maintained in omnibus accounts up to the lesser of the amount charged by the financial intermediary or a cap established by the Board of Trustees from time to time.
The Transfer Agent also receives compensation from the Fund for various shareholder services and reimbursements for certain out-of-pocket fees. Total transfer agency fees for Institutional 2 Class and Institutional 3 Class shares are subject to an annual limitation of not more than 0.07% and 0.02%, respectively, of the average daily net assets attributable to each share class.
For the year ended May 31, 2022, the Fund’s effective transfer agency fee rates as a percentage of average daily net assets of each class were as follows:
| | Effective rate (%) |
| Class A | 0.11 |
| Advisor Class | 0.11 |
| Class C | 0.11 |
| Institutional Class | 0.11 |
| Institutional 2 Class | 0.07 |
| Institutional 3 Class | 0.02 |
| Class R | 0.10 |
An annual minimum account balance fee of $20 may apply to certain accounts with a value below the applicable share class’s initial minimum investment requirements to reduce the impact of small accounts on transfer agency fees. These minimum account balance fees are remitted to the Fund and recorded as part of expense reductions in the Consolidated Statement of Operations. For the year ended May 31, 2022, these minimum account balance fees reduced total expenses of the Fund by $20.
Distribution and service fees
The Fund has entered into an agreement with Columbia Management Investment Distributors, Inc. (the Distributor), an affiliate of the Investment Manager and a wholly-owned subsidiary of Ameriprise Financial, for distribution and shareholder services. The Board of Trustees has approved, and the Fund has adopted, distribution and shareholder service plans (the Plans) applicable to certain share classes, which set the distribution and service fees for the Fund. These fees are calculated daily and are intended to compensate the Distributor and/or eligible selling and/or servicing agents for selling shares of the Fund and providing services to investors.
Under the Plans, the Fund pays a monthly service fee to the Distributor at the maximum annual rate of 0.25% of the average daily net assets attributable to Class A and Class C shares of the Fund. Also under the Plans, the Fund pays a monthly distribution fee to the Distributor at the maximum annual rates of 0.75% and 0.50% of the average daily net assets attributable to Class C and Class R shares of the Fund, respectively.
Sales charges (unaudited)
Sales charges, including front-end charges and contingent deferred sales charges (CDSCs), received by the Distributor for distributing Fund shares for the year ended May 31, 2022, if any, are listed below:
| | Front End (%) | CDSC (%) | Amount ($) |
| Class A | 5.75 | 0.50 - 1.00(a) | 2,303 |
| Class C | — | 1.00(b) | — |
| (a) | This charge is imposed on certain investments of between $1 million and $50 million redeemed within 18 months after purchase, as follows: 1.00% if redeemed within 12 months after purchase, and 0.50% if redeemed more than 12, but less than 18, months after purchase, with certain limited exceptions. |
| (b) | This charge applies to redemptions within 12 months after purchase, with certain limited exceptions. |
The Fund’s other share classes are not subject to sales charges.
| 58 | Columbia Multi Strategy Alternatives Fund | Annual Report 2022 |
Notes to Consolidated Financial Statements (continued)
May 31, 2022
Expenses waived/reimbursed by the Investment Manager and its affiliates
The Investment Manager and certain of its affiliates have contractually agreed to waive fees and/or reimburse expenses (excluding certain fees and expenses described below) for the period(s) disclosed below, unless sooner terminated at the sole discretion of the Board of Trustees, so that the Fund’s net operating expenses, after giving effect to fees waived/expenses reimbursed and any balance credits and/or overdraft charges from the Fund’s custodian, do not exceed the following annual rate(s) as a percentage of the classes’ average daily net assets:
| | October 1, 2021
through
September 30, 2022 | Prior to
October 1, 2021 |
| Class A | 1.27% | 1.27% |
| Advisor Class | 1.02 | 1.02 |
| Class C | 2.02 | 2.02 |
| Institutional Class | 1.02 | 1.02 |
| Institutional 2 Class | 0.98 | 0.96 |
| Institutional 3 Class | 0.93 | 0.90 |
| Class R | 1.52 | 1.52 |
Under the agreement governing these fee waivers and/or expense reimbursement arrangements, the following fees and expenses are excluded from the waiver/reimbursement commitment, and therefore will be paid by the Fund, if applicable: taxes (including foreign transaction taxes), expenses associated with investments in affiliated and non-affiliated pooled investment vehicles (including mutual funds and exchange-traded funds), transaction costs and brokerage commissions, costs related to any securities lending program, dividend expenses associated with securities sold short, inverse floater program fees and expenses, transaction charges and interest on borrowed money, interest, costs associated with shareholder meetings, infrequent and/or unusual expenses and any other expenses the exclusion of which is specifically approved by the Board of Trustees. This agreement may be modified or amended only with approval from the Investment Manager, certain of its affiliates and the Fund. In addition to the contractual agreement, the Investment Manager and certain of its affiliates have voluntarily agreed to waive fees and/or reimburse Fund expenses (excluding certain fees and expenses described above) so that Fund level expenses (expenses directly attributable to the Fund and not to a specific share class) are waived proportionately across all share classes. This arrangement may be revised or discontinued at any time. Any fees waived and/or expenses reimbursed under the expense reimbursement arrangements described above are not recoverable by the Investment Manager or its affiliates in future periods.
Note 4. Federal tax information
The timing and character of income and capital gain distributions are determined in accordance with income tax regulations, which may differ from GAAP because of temporary or permanent book to tax differences.
At May 31, 2022, these differences were primarily due to differing treatment for trustees’ deferred compensation, derivative investments, tax straddles, late-year ordinary losses, non-deductible expenses, capital loss carryforward, swap investments, principal and/or interest of fixed income securities, investments in partnerships, foreign currency transactions and investments in commodity subsidiaries. To the extent these differences were permanent, reclassifications were made among the components of the Fund’s net assets. Temporary differences do not require reclassifications.
The following reclassifications were made:
Excess of distributions
over net investment
income ($) | Accumulated
net realized
(loss) ($) | Paid in
capital ($) |
| (49,525,986) | 47,266,059 | 2,259,927 |
Net investment income (loss) and net realized gains (losses), as disclosed in the Consolidated Statement of Operations, and net assets were not affected by this reclassification.
Columbia Multi Strategy Alternatives Fund | Annual Report 2022
| 59 |
Notes to Consolidated Financial Statements (continued)
May 31, 2022
The tax character of distributions paid during the years indicated was as follows:
| Year Ended May 31, 2022 | Year Ended May 31, 2021 |
Ordinary
income ($) | Long-term
capital gains ($) | Total ($) | Ordinary
income ($) | Long-term
capital gains ($) | Total ($) |
| 19,542,084 | — | 19,542,084 | — | — | — |
Short-term capital gain distributions, if any, are considered ordinary income distributions for tax purposes.
At May 31, 2022, the components of distributable earnings on a tax basis were as follows:
Undistributed
ordinary income ($) | Undistributed
long-term
capital gains ($) | Capital loss
carryforwards ($) | Net unrealized
(depreciation) ($) |
| — | — | (54,307,065) | (71,852,150) |
At May 31, 2022, the cost of all investments for federal income tax purposes along with the aggregate gross unrealized appreciation and depreciation based on that cost was:
Federal
tax cost ($) | Gross unrealized
appreciation ($) | Gross unrealized
(depreciation) ($) | Net unrealized
(depreciation) ($) |
| 855,164,489 | — | (71,852,150) | (71,852,150) |
Tax cost of investments and unrealized appreciation/(depreciation) may also include timing differences that do not constitute adjustments to tax basis.
The following capital loss carryforwards, determined at May 31, 2022, may be available to reduce future net realized gains on investments, if any, to the extent permitted by the Internal Revenue Code. In addition, for the year ended May 31, 2022, capital loss carryforwards utilized, if any, were as follows:
No expiration
short-term ($) | No expiration
long-term ($) | Total ($) | Utilized ($) |
| (39,650,304) | (14,656,761) | (54,307,065) | 16,391,278 |
Under current tax rules, regulated investment companies can elect to treat certain late-year ordinary losses incurred and post-October capital losses (capital losses realized after October 31) as arising on the first day of the following taxable year. As of May 31, 2022, the Fund will elect to treat the following late-year ordinary losses and post-October capital losses as arising on June 1, 2022.
Late year
ordinary losses ($) | Post-October
capital losses ($) |
| 13,205,099 | — |
Management of the Fund has concluded that there are no significant uncertain tax positions in the Fund that would require recognition in the financial statements. However, management’s conclusion may be subject to review and adjustment at a later date based on factors including, but not limited to, new tax laws, regulations, and administrative interpretations (including relevant court decisions). Generally, the Fund’s federal tax returns for the prior three fiscal years remain subject to examination by the Internal Revenue Service.
Note 5. Portfolio information
The cost of purchases and proceeds from sales of securities, excluding short-term investments and derivatives, if any, aggregated to $1,215,853,220 and $1,240,729,633, respectively, for the year ended May 31, 2022, of which $1,111,207,637 and $1,159,132,148, respectively, were U.S. government securities. The amount of purchase and sale activity impacts the portfolio turnover rate reported in the Consolidated Financial Highlights.
| 60 | Columbia Multi Strategy Alternatives Fund | Annual Report 2022 |
Notes to Consolidated Financial Statements (continued)
May 31, 2022
Note 6. Affiliated money market fund
The Fund invests significantly in Columbia Short-Term Cash Fund, an affiliated money market fund established for the exclusive use by the Fund and other affiliated funds (the Affiliated MMF). The income earned by the Fund from such investments is included as Dividends - affiliated issuers in the Consolidated Statement of Operations. As an investing fund, the Fund indirectly bears its proportionate share of the expenses of the Affiliated MMF. The Affiliated MMF prices its shares with a floating net asset value. In addition, the Board of Trustees of the Affiliated MMF may impose a fee on redemptions (sometimes referred to as a liquidity fee) or temporarily suspend redemptions (sometimes referred to as imposing a redemption gate) in the event its liquidity falls below regulatory limits.
Note 7. Interfund lending
Pursuant to an exemptive order granted by the Securities and Exchange Commission, the Fund participates in a program (the Interfund Program) allowing each participating Columbia Fund (each, a Participating Fund) to lend money directly to and, except for closed-end funds and money market funds, borrow money directly from other Participating Funds for temporary purposes. The amounts eligible for borrowing and lending under the Interfund Program are subject to certain restrictions.
Interfund loans are subject to the risk that the borrowing fund could be unable to repay the loan when due, and a delay in repayment to the lending fund could result in lost opportunities and/or additional lending costs. The exemptive order is subject to conditions intended to mitigate conflicts of interest arising from the Investment Manager’s relationship with each Participating Fund.
The Fund did not borrow or lend money under the Interfund Program during the year ended May 31, 2022.
Note 8. Line of credit
The Fund has access to a revolving credit facility with a syndicate of banks led by JPMorgan Chase Bank, N.A., Citibank, N.A. and Wells Fargo Bank, N.A. whereby the Fund may borrow for the temporary funding of shareholder redemptions or for other temporary or emergency purposes. Pursuant to an October 28, 2021 amendment and restatement, the credit facility, which is an agreement between the Fund and certain other funds managed by the Investment Manager or an affiliated investment manager, severally and not jointly, permits aggregate borrowings up to $950 million. Interest is currently charged to each participating fund based on its borrowings at a rate equal to the higher of (i) the federal funds effective rate, (ii) the secured overnight financing rate plus 0.11448% and (iii) the overnight bank funding rate, plus in each case, 1.00%. Each borrowing under the credit facility matures no later than 60 days after the date of borrowing. The Fund also pays a commitment fee equal to its pro rata share of the unused amount of the credit facility at a rate of 0.15% per annum. The commitment fee is included in other expenses in the Consolidated Statement of Operations. This agreement expires annually in October unless extended or renewed. Prior to the October 28, 2021 amendment and restatement, the Fund had access to a revolving credit facility with a syndicate of banks led by JPMorgan Chase Bank, N.A., Citibank, N.A. and Wells Fargo Bank, N.A. which permitted collective borrowings up to $950 million. Interest was charged to each participating fund based on its borrowings at a rate equal to the higher of (i) the federal funds effective rate, (ii) the one-month London Interbank Offered Rate (LIBOR) rate and (iii) the overnight bank funding rate, plus in each case, 1.25%.
The Fund had no borrowings during the year ended May 31, 2022.
Note 9. Significant risks
Alternative strategies investment risk
An investment in alternative investment strategies (Alternative Strategies) involves risks, which may be significant. Alternative Strategies may include strategies, instruments or other assets, such as derivatives, that seek investment returns uncorrelated with the broad equity and fixed income/debt markets, as well as those providing exposure to other markets (such as commodity markets), including but not limited to absolute (positive) return strategies. Alternative Strategies may fail to achieve their desired performance, market or other exposure, or their returns (or lack thereof) may be more correlated with the broad equity and/or fixed income/debt markets than was anticipated, and the Fund may lose money.
Columbia Multi Strategy Alternatives Fund | Annual Report 2022
| 61 |
Notes to Consolidated Financial Statements (continued)
May 31, 2022
Credit risk
Credit risk is the risk that the value of debt instruments in the Fund’s portfolio may decline because the issuer defaults or otherwise becomes unable or unwilling, or is perceived to be unable or unwilling, to honor its financial obligations, such as making payments to the Fund when due. Credit rating agencies assign credit ratings to certain debt instruments to indicate their credit risk. Lower-rated or unrated debt instruments held by the Fund may present increased credit risk as compared to higher-rated debt instruments.
Derivatives risk
Losses involving derivative instruments may be substantial, because a relatively small movement in the underlying reference (which is generally the price, rate or other economic indicator associated with a security(ies), commodity, currency, index or other instrument or asset) may result in a substantial loss for the Fund. In addition to the potential for increased losses, the use of derivative instruments may lead to increased volatility within the Fund. Derivatives will typically increase the Fund’s exposure to principal risks to which it is otherwise exposed, and may expose the Fund to additional risks, including correlation risk, counterparty risk, hedging risk, leverage risk, liquidity risk and pricing risk.
Foreign currency risk
The performance of the Fund may be materially affected positively or negatively by foreign currency strength or weakness relative to the U.S. dollar, particularly if the Fund invests a significant percentage of its assets in foreign securities or other assets denominated in currencies other than the U.S. dollar. Currency rates in foreign countries may fluctuate significantly over short or long periods of time for a number of reasons, including changes in interest rates, imposition of currency controls and economic or political developments in the U.S. or abroad. The Fund may also incur currency conversion costs when converting foreign currencies into U.S. dollars and vice versa.
Interest rate risk
Interest rate risk is the risk of losses attributable to changes in interest rates. In general, if prevailing interest rates rise, the values of debt instruments tend to fall, and if interest rates fall, the values of debt instruments tend to rise. Actions by governments and central banking authorities can result in increases or decreases in interest rates. Higher periods of inflation could lead such authorities to raise interest rates. Increasing interest rates may negatively affect the value of debt securities held by the Fund, resulting in a negative impact on the Fund’s performance and net asset value per share. In general, the longer the maturity or duration of a debt security, the greater its sensitivity to changes in interest rates. The Fund is subject to the risk that the income generated by its investments may not keep pace with inflation.
Leverage risk
Leverage occurs when the Fund increases its assets available for investment using borrowings, short sales, derivatives, or similar instruments or techniques. The use of leverage may produce volatility and may exaggerate changes in the NAV of Fund shares and in the return on the Fund’s portfolio, which may increase the risk that the Fund will lose more than it has invested. Because short sales involve borrowing securities and then selling them, the Fund’s short sales effectively leverage the Fund’s assets. The Fund’s assets that are used as collateral to secure the Fund’s obligations to return the securities sold short may decrease in value while the short positions are outstanding, which may force the Fund to use its other assets to increase the collateral. Leverage can create an interest expense that may lower the Fund’s overall returns. Leverage presents the opportunity for increased net income and capital gains, but may also exaggerate the Fund’s volatility and risk of loss. There can be no guarantee that a leveraging strategy will be successful.
LIBOR replacement risk
The elimination of London Inter-Bank Offered Rate (LIBOR), among other "inter-bank offered" reference rates, may adversely affect the interest rates on, and value of, certain Fund investments for which the value is tied to LIBOR. The U.K. Financial Conduct Authority and the ICE Benchmark Administration have announced that a majority of U.S. dollar LIBOR settings will cease publication after June 30, 2023. A subset of non-U.S. dollar LIBOR settings are continuing to be published on a “synthetic” basis and it is possible that a subset of U.S. dollar LIBOR settings will also be published after June 30, 2023 on a “synthetic” basis. Any such publications are, or would be considered, non-representative of the underlying market. Markets are slowly developing in response to the elimination of LIBOR. Uncertainty related to the liquidity impact of the change in
| 62 | Columbia Multi Strategy Alternatives Fund | Annual Report 2022 |
Notes to Consolidated Financial Statements (continued)
May 31, 2022
rates, and how to appropriately adjust these rates at the time of transition, poses risks for the Fund. These risks are likely to persist until new reference rates and fallbacks for both legacy and new instruments and contracts are commercially accepted and market practices become more settled. Alternatives to LIBOR have been established or are in development in most major currencies, including the Secured Overnight Financing Rate (SOFR), which the U.S. Federal Reserve is promoting as the alternative reference rate to U.S. dollar LIBOR.
Liquidity risk
Liquidity risk is the risk associated with a lack of marketability of investments which may make it difficult to sell the investment at a desirable time or price. Changing regulatory, market or other conditions or environments (for example, the interest rate or credit environments) may adversely affect the liquidity of the Fund’s investments. The Fund may have to accept a lower selling price for the holding, sell other investments, or forego another, more appealing investment opportunity. Generally, the less liquid the market at the time the Fund sells a portfolio investment, the greater the risk of loss or decline of value to the Fund. A less liquid market can lead to an increase in Fund redemptions, which may negatively impact Fund performance and net asset value per share, including, for example, if the Fund is forced to sell securities in a down market.
Market risk
The Fund may incur losses due to declines in the value of one or more securities in which it invests. These declines may be due to factors affecting a particular issuer, or the result of, among other things, political, regulatory, market, economic or social developments affecting the relevant market(s) more generally. In addition, turbulence in financial markets and reduced liquidity in equity, credit and/or fixed income markets may negatively affect many issuers, which could adversely affect the Fund’s ability to price or value hard-to-value assets in thinly traded and closed markets and could cause significant redemptions and operational challenges. Global economies and financial markets are increasingly interconnected, and conditions and events in one country, region or financial market may adversely impact issuers in a different country, region or financial market. These risks may be magnified if certain events or developments adversely interrupt the global supply chain; in these and other circumstances, such risks might affect companies worldwide. As a result, local, regional or global events such as terrorism, war, natural disasters, disease/virus outbreaks and epidemics or other public health issues, recessions, depressions or other events – or the potential for such events – could have a significant negative impact on global economic and market conditions.
The large-scale invasion of Ukraine by Russia in February 2022 has resulted in sanctions and market disruptions, including declines in regional and global stock, unusual volatility in global commodity markets and significant devaluations of Russian currency. The extent and duration of the military action are impossible to predict but could be significant. Market disruption caused by the Russian military action, and any counter measures or responses thereto (including international sanctions, a downgrade in the country’s credit rating, purchasing and financing restrictions, boycotts, tariffs, changes in consumer or purchaser preferences, cyberattacks and espionage) could have severe adverse impacts on regional and/or global securities and commodities markets, including markets for oil and natural gas. These impacts may include reduced market liquidity, distress in credit markets, further disruption of global supply chains, increased risk of inflation, and limited access to investments in certain international markets and/or issuers. These developments and other related events could negatively impact Fund performance.
The pandemic caused by coronavirus disease 2019 and its variants (COVID-19) has resulted in, and may continue to result in, significant global economic and societal disruption and market volatility due to disruptions in market access, resource availability, facilities operations, imposition of tariffs, export controls and supply chain disruption, among others. Such disruptions may be caused, or exacerbated by, quarantines and travel restrictions, workforce displacement and loss in human and other resources. The uncertainty surrounding the magnitude, duration, reach, costs and effects of the global pandemic, as well as actions that have been or could be taken by governmental authorities or other third parties, present unknowns that are yet to unfold. The impacts, as well as the uncertainty over impacts to come, of COVID-19 – and any other infectious illness outbreaks, epidemics and pandemics that may arise in the future – could negatively affect global economies and markets in ways that cannot necessarily be foreseen. In addition, the impact of infectious illness outbreaks and epidemics in emerging market countries may be greater due to generally less established healthcare systems, governments and financial markets. Public health crises caused by the COVID-19 outbreak may exacerbate other pre-existing
Columbia Multi Strategy Alternatives Fund | Annual Report 2022
| 63 |
Notes to Consolidated Financial Statements (continued)
May 31, 2022
political, social and economic risks in certain countries or globally. The disruptions caused by COVID-19 could prevent the Fund from executing advantageous investment decisions in a timely manner and negatively impact the Fund’s ability to achieve its investment objective. Any such events could have a significant adverse impact on the value and risk profile of the Fund.
Money market fund investment risk
An investment in a money market fund is not a bank deposit and is not insured or guaranteed by any bank, the FDIC or any other government agency. Certain money market funds float their net asset value while others seek to preserve the value of investments at a stable net asset value (typically, $1.00 per share). An investment in a money market fund, even an investment in a fund seeking to maintain a stable net asset value per share, is not guaranteed and it is possible for the Fund to lose money by investing in these and other types of money market funds. If the liquidity of a money market fund’s portfolio deteriorates below certain levels, the money market fund may suspend redemptions (i.e., impose a redemption gate) and thereby prevent the Fund from selling its investment in the money market fund or impose a fee of up to 2% on amounts the Fund redeems from the money market fund (i.e., impose a liquidity fee). These measures may result in an investment loss or prohibit the Fund from redeeming shares when the Investment Manager would otherwise redeem shares. In addition to the fees and expenses that the Fund directly bears, the Fund indirectly bears the fees and expenses of any money market funds in which it invests, including affiliated money market funds. By investing in a money market fund, the Fund will be exposed to the investment risks of the money market fund in direct proportion to such investment. To the extent the Fund invests in instruments such as derivatives, the Fund may hold investments, which may be significant, in money market fund shares to cover its obligations resulting from the Fund’s investments in such instruments. Money market funds and the securities they invest in are subject to comprehensive regulations. The enactment of new legislation or regulations, as well as changes in interpretation and enforcement of current laws, may affect the manner of operation, performance and/or yield of money market funds.
Mortgage- and other asset-backed securities risk
The value of any mortgage-backed and other asset-backed securities including collateralized debt obligations, if any, held by the Fund may be affected by, among other things, changes or perceived changes in: interest rates; factors concerning the interests in and structure of the issuer or the originator of the mortgages or other assets; the creditworthiness of the entities that provide any supporting letters of credit, surety bonds or other credit enhancements; or the market’s assessment of the quality of underlying assets. Payment of principal and interest on some mortgage-backed securities (but not the market value of the securities themselves) may be guaranteed by the full faith and credit of a particular U.S. Government agency, authority, enterprise or instrumentality, and some, but not all, are also insured or guaranteed by the U.S. Government. Mortgage-backed securities issued by non-governmental issuers (such as commercial banks, savings and loan institutions, private mortgage insurance companies, mortgage bankers and other secondary market issuers) may entail greater risk than obligations guaranteed by the U.S. Government. Mortgage- and other asset-backed securities are subject to liquidity risk and prepayment risk. A decline or flattening of housing values may cause delinquencies in mortgages (especially sub-prime or non-prime mortgages) underlying mortgage-backed securities and thereby adversely affect the ability of the mortgage-backed securities issuer to make principal and/or interest payments to mortgage-backed securities holders, including the Fund. Rising or high interest rates tend to extend the duration of mortgage- and other asset-backed securities, making their prices more volatile and more sensitive to changes in interest rates.
Shareholder concentration risk
At May 31, 2022, affiliated shareholders of record owned 94.2% of the outstanding shares of the Fund in one or more accounts. Subscription and redemption activity by concentrated accounts may have a significant effect on the operations of the Fund. In the case of a large redemption, the Fund may be forced to sell investments at inopportune times, including its liquid positions, which may result in Fund losses and the Fund holding a higher percentage of less liquid positions. Large redemptions could result in decreased economies of scale and increased operating expenses for non-redeeming Fund shareholders.
Note 10. Subsequent events
Management has evaluated the events and transactions that have occurred through the date the financial statements were issued and noted no items requiring adjustment of the financial statements or additional disclosure.
| 64 | Columbia Multi Strategy Alternatives Fund | Annual Report 2022 |
Notes to Consolidated Financial Statements (continued)
May 31, 2022
Note 11. Information regarding pending and settled legal proceedings
Ameriprise Financial and certain of its affiliates are involved in the normal course of business in legal proceedings which include regulatory inquiries, arbitration and litigation, including class actions concerning matters arising in connection with the conduct of its activities as a diversified financial services firm. Ameriprise Financial believes that the Fund is not currently the subject of, and that neither Ameriprise Financial nor any of its affiliates are the subject of, any pending legal, arbitration or regulatory proceedings that are likely to have a material adverse effect on the Fund or the ability of Ameriprise Financial or its affiliates to perform under their contracts with the Fund. Ameriprise Financial is required to make quarterly (10-Q), annual (10-K) and, as necessary, 8-K filings with the Securities and Exchange Commission (SEC) on legal and regulatory matters that relate to Ameriprise Financial and its affiliates. Copies of these filings may be obtained by accessing the SEC website at www.sec.gov.
There can be no assurance that these matters, or the adverse publicity associated with them, will not result in increased Fund redemptions, reduced sale of Fund shares or other adverse consequences to the Fund. Further, although we believe proceedings are not likely to have a material adverse effect on the Fund or the ability of Ameriprise Financial or its affiliates to perform under their contracts with the Fund, these proceedings are subject to uncertainties and, as such, we are unable to estimate the possible loss or range of loss that may result. An adverse outcome in one or more of these proceedings could result in adverse judgments, settlements, fines, penalties or other relief that could have a material adverse effect on the consolidated financial condition or results of operations of Ameriprise Financial or one or more of its affiliates that provides services to the Fund.
Columbia Multi Strategy Alternatives Fund | Annual Report 2022
| 65 |
Report of Independent Registered Public Accounting Firm
To the Board of Trustees of Columbia Funds Series Trust I and Shareholders of Columbia Multi Strategy Alternatives Fund
Opinion on the Financial Statements
We have audited the accompanying consolidated statement of assets and liabilities, including the consolidated portfolio of investments, of Columbia Multi Strategy Alternatives Fund and its subsidiaries (one of the funds constituting Columbia Funds Series Trust I, referred to hereafter as the "Fund") as of May 31, 2022, the related consolidated statement of operations for the year ended May 31, 2022, the consolidated statement of changes in net assets for each of the two years in the period ended May 31, 2022, including the related notes, and the consolidated financial highlights for each of the five years in the period ended May 31, 2022 (collectively referred to as the "consolidated financial statements"). In our opinion, the consolidated financial statements present fairly, in all material respects, the financial position of the Fund as of May 31, 2022, the results of its operations for the year then ended, the changes in its net assets for each of the two years in the period ended May 31, 2022 and the financial highlights for each of the five years in the period ended May 31, 2022 in conformity with accounting principles generally accepted in the United States of America.
Basis for Opinion
These consolidated financial statements are the responsibility of the Fund’s management. Our responsibility is to express an opinion on the Fund’s consolidated financial statements based on our audits. We are a public accounting firm registered with the Public Company Accounting Oversight Board (United States) (PCAOB) and are required to be independent with respect to the Fund in accordance with the U.S. federal securities laws and the applicable rules and regulations of the Securities and Exchange Commission and the PCAOB.
We conducted our audits of these consolidated financial statements in accordance with the standards of the PCAOB. Those standards require that we plan and perform the audit to obtain reasonable assurance about whether the consolidated financial statements are free of material misstatement, whether due to error or fraud.
Our audits included performing procedures to assess the risks of material misstatement of the consolidated financial statements, whether due to error or fraud, and performing procedures that respond to those risks. Such procedures included examining, on a test basis, evidence regarding the amounts and disclosures in the consolidated financial statements. Our audits also included evaluating the accounting principles used and significant estimates made by management, as well as evaluating the overall presentation of the consolidated financial statements. Our procedures included confirmation of securities owned as of May 31, 2022 by correspondence with the custodian, transfer agent and brokers; when replies were not received from brokers, we performed other auditing procedures. We believe that our audits provide a reasonable basis for our opinion.
/s/PricewaterhouseCoopers LLP
Minneapolis, Minnesota
July 21, 2022
We have served as the auditor of one or more investment companies within the Columbia Funds Complex since 1977.
| 66 | Columbia Multi Strategy Alternatives Fund | Annual Report 2022 |
TRUSTEES AND OFFICERS
(Unaudited)
The Board oversees the Fund’s operations and appoints officers who are responsible for day-to-day business decisions based on policies set by the Board. The following table provides basic biographical information about the Fund’s Trustees as of the printing of this report, including their principal occupations during the past five years, although specific titles for individuals may have varied over the period. The year set forth beneath Length of Service in the table below is the year in which the Trustee was first appointed or elected as Trustee to any Fund currently in the Columbia Funds Complex or a predecessor thereof. Under current Board policy, each Trustee generally serves until December 31 of the year such Trustee turns seventy-five (75).
Independent trustees
Name,
address,
year of birth | Position held
with the Columbia Funds and
length of service | Principal occupation(s)
during past five years
and other relevant
professional experience | Number of
Funds in the
Columbia Funds
Complex*
overseen | Other directorships
held by Trustee
during the past
five years |
George S. Batejan
c/o Columbia Management
Investment Advisers, LLC
290 Congress Street
Boston, MA 02210
1953 | Trustee since 2017 | Executive Vice President, Global Head of Technology and Operations, Janus Capital Group, Inc., 2010-2016 | 176 | Former Chairman of the Board, NICSA (National Investment Company Services Association) (Executive Committee, Nominating Committee and Governance Committee), 2014-2016; former Director, Intech Investment Management, 2011-2016; former Board Member, Metro Denver Chamber of Commerce, 2015-2016; former Advisory Board Member, University of Colorado Business School, 2015-2018 |
Kathleen Blatz
c/o Columbia Management
Investment Advisers, LLC
290 Congress Street
Boston, MA 02210
1954 | Trustee since 2006 | Attorney, specializing in arbitration and mediation; Chief Justice, Minnesota Supreme Court, 1998-2006; Associate Justice, Minnesota Supreme Court, 1996-1998; Fourth Judicial District Court Judge, Hennepin County, 1994-1996; Attorney in private practice and public service, 1984-1993; State Representative, Minnesota House of Representatives, 1979-1993, which included service on the Tax and Financial Institutions and Insurance Committees; Member and Interim Chair, Minnesota Sports Facilities Authority, January 2017-July 2017; Interim President and Chief Executive Officer, Blue Cross and Blue Shield of Minnesota (health care insurance), February-July 2018, April-October 2021 | 176 | Former Trustee, Blue Cross and Blue Shield of Minnesota, 2009-2021 (Chair of the Business Development Committee, 2014-2017; Chair of the Governance Committee, 2017-2019); former Member and Chair of the Board, Minnesota Sports Facilities Authority, January 2017-July 2017; former Director, Robina Foundation, 2009-2020 (Chair, 2014-2020); Director, Schulze Family Foundation, since 2021 |
Pamela G. Carlton
c/o Columbia Management
Investment Advisers, LLC
290 Congress Street
Boston, MA 02210
1954 | Trustee since 2007 | President, Springboard — Partners in Cross Cultural Leadership (consulting company) since 2003; Managing Director of US Equity Research, JP Morgan Chase, 1999-2003; Director of US Equity Research, Chase Asset Management, 1996-1999; Co-Director Latin America Research, 1993-1996, COO Global Research, 1992-1996, Co-Director of US Research, 1991-1992, Investment Banker, 1982-1991, Morgan Stanley; Attorney, Cleary Gottlieb Steen & Hamilton LLP, 1980-1982 | 176 | Trustee, New York Presbyterian Hospital Board (Executive Committee and Chair of People Committee) since 1996; Director, DR Bank (Audit Committee) since 2017; Director, Evercore Inc. (Audit Committee) since 2019; Director, Apollo Commercial Real Estate Finance, Inc. since 2021; the Governing Council of the Independent Directors Council (IDC), since 2021 |
Columbia Multi Strategy Alternatives Fund | Annual Report 2022
| 67 |
TRUSTEES AND OFFICERS (continued)
(Unaudited)
Independent trustees (continued)
Name,
address,
year of birth | Position held
with the Columbia Funds and
length of service | Principal occupation(s)
during past five years
and other relevant
professional experience | Number of
Funds in the
Columbia Funds
Complex*
overseen | Other directorships
held by Trustee
during the past
five years |
Janet Langford Carrig
c/o Columbia Management
Investment Advisers, LLC
290 Congress Street
Boston, MA 02210
1957 | Trustee since 1996 | Senior Vice President, General Counsel and Corporate Secretary, ConocoPhillips (independent energy company), September 2007-October 2018 | 174 | Director, EQT Corporation (natural gas producer) since 2019 |
J. Kevin Connaughton
c/o Columbia Management
Investment Advisers, LLC
290 Congress Street
Boston, MA 02210
1964 | Trustee since 2020 | Member, FINRA National Adjudicatory Council since January 2020; Adjunct Professor of Finance, Bentley University since January 2018; Consultant to Independent Trustees of CFVIT and CFST I from March 2016 to June 2020 with respect to CFVIT and to December 2020 with respect to CFST I; Managing Director and General Manager of Mutual Fund Products, Columbia Management Investment Advisers, LLC, May 2010-February 2015; President, Columbia Funds, 2008-2015; and senior officer of Columbia Funds and affiliated funds, 2003-2015 | 174 | Former Director, The Autism Project, March 2015-December 2021; former Member of the Investment Committee, St. Michael’s College, November 2015-February 2020; former Trustee, St. Michael’s College, June 2017-September 2019; former Trustee, New Century Portfolios, January 2015-December 2017 |
Olive M. Darragh
c/o Columbia Management
Investment Advisers, LLC
290 Congress Street
Boston, MA 02210
1962 | Trustee since 2020 | Managing Director of Darragh Inc. (strategy and talent management consulting firm) since 2010; Founder and CEO, Zolio, Inc. (investment management talent identification platform) since 2004; Consultant to Independent Trustees of CFVIT and CFST I from June 2019 to June 2020 with respect to CFVIT and to December 2020 with respect to CFST I; Partner, Tudor Investments, 2004-2010; Senior Partner, McKinsey & Company (consulting), 1990-2004; Touche Ross CPA, 1985-1988 | 174 | Former Director, University of Edinburgh Business School (Member of US Board); former Director, Boston Public Library Foundation |
Patricia M. Flynn
c/o Columbia Management
Investment Advisers, LLC
290 Congress Street
Boston, MA 02210
1950 | Trustee since 2004 | Trustee Professor of Economics and Management, Bentley University since 1976 (also teaches and conducts research on corporate governance); Dean, McCallum Graduate School of Business, Bentley University, 1992-2002 | 176 | Trustee, MA Taxpayers Foundation since 1997; former Board of Governors, Innovation Institute, MA Technology Collaborative, 2010-2020; former Board of Directors, The MA Business Roundtable, 2003-2019 |
Brian J. Gallagher
c/o Columbia Management
Investment Advisers, LLC
290 Congress Street
Boston, MA 02210
1954 | Trustee since 2017 | Retired; Partner with Deloitte & Touche LLP and its predecessors, 1977-2016 | 176 | Trustee, Catholic Schools Foundation since 2004 |
| 68 | Columbia Multi Strategy Alternatives Fund | Annual Report 2022 |
TRUSTEES AND OFFICERS (continued)
(Unaudited)
Independent trustees (continued)
Name,
address,
year of birth | Position held
with the Columbia Funds and
length of service | Principal occupation(s)
during past five years
and other relevant
professional experience | Number of
Funds in the
Columbia Funds
Complex*
overseen | Other directorships
held by Trustee
during the past
five years |
Douglas A. Hacker
c/o Columbia Management
Investment Advisers, LLC
290 Congress Street
Boston, MA 02210
1955 | Co-Chair since 2021; Chair of CFST I and CFVIT since 2014; Trustee of CFST I and CFVIT since 1996 and CFST, CFST II, CFVST II, CET I and CET II since 2021 | Independent business executive since May 2006; Executive Vice President – Strategy of United Airlines, December 2002 - May 2006; President of UAL Loyalty Services (airline marketing company), September 2001-December 2002; Executive Vice President and Chief Financial Officer of United Airlines, July 1999-September 2001 | 176 | Director, Spartan Nash Company (food distributor); Director, Aircastle Limited (Chair of Audit Committee) (aircraft leasing); former Director, Nash Finch Company (food distributor), 2005-2013; former Director, SeaCube Container Leasing Ltd. (container leasing), 2010-2013; and former Director, Travelport Worldwide Limited (travel information technology), 2014-2019 |
Nancy T. Lukitsh
c/o Columbia Management
Investment Advisers, LLC
290 Congress Street
Boston, MA 02210
1956 | Trustee since 2011 | Senior Vice President, Partner and Director of Marketing, Wellington Management Company, LLP (investment adviser), 1997-2010; Chair, Wellington Management Portfolios (commingled non-U.S. investment pools), 2007 -2010; Director, Wellington Trust Company, NA and other Wellington affiliates, 1997-2010 | 174 | None |
David M. Moffett
c/o Columbia Management
Investment Advisers, LLC
290 Congress Street
Boston, MA 02210
1952 | Trustee since 2011 | Retired; Consultant to Bridgewater and Associates | 174 | Director, CSX Corporation (transportation suppliers); Director, Genworth Financial, Inc. (financial and insurance products and services); Director, PayPal Holdings Inc. (payment and data processing services); Trustee, University of Oklahoma Foundation; former Director, eBay Inc. (online trading community), 2007-2015; and former Director, CIT Bank, CIT Group Inc. (commercial and consumer finance), 2010-2016 |
Catherine James Paglia
c/o Columbia Management
Investment Advisers, LLC
290 Congress Street
Boston, MA 02210
1952 | Co-Chair since 2021; Chair of CFST, CFST II, CFVST II, CET I and CET II since 2020; Trustee of CFST, CFST II and CFVST II since 2004 and CFST I and CFVIT since 2021 | Director, Enterprise Asset Management, Inc. (private real estate and asset management company) since September 1998; Managing Director and Partner, Interlaken Capital, Inc., 1989-1997; Vice President, 1982-1985, Principal, 1985-1987, Managing Director, 1987-1989, Morgan Stanley; Vice President, Investment Banking, 1980-1982, Associate, Investment Banking, 1976-1980, Dean Witter Reynolds, Inc. | 176 | Director, Valmont Industries, Inc. (irrigation systems manufacturer) since 2012; Trustee, Carleton College (on the Investment Committee); Trustee, Carnegie Endowment for International Peace (on the Investment Committee) |
Columbia Multi Strategy Alternatives Fund ��| Annual Report 2022
| 69 |
TRUSTEES AND OFFICERS (continued)
(Unaudited)
Independent trustees (continued)
Name,
address,
year of birth | Position held
with the Columbia Funds and
length of service | Principal occupation(s)
during past five years
and other relevant
professional experience | Number of
Funds in the
Columbia Funds
Complex*
overseen | Other directorships
held by Trustee
during the past
five years |
Minor M. Shaw
c/o Columbia Management
Investment Advisers, LLC
290 Congress Street
Boston, MA 02210
1947 | Trustee since 2003 | President, Micco LLC (private investments) since 2011; President, Micco Corp. (family investment business), 1998-2011 | 176 | Director, Blue Cross Blue Shield of South Carolina (Chair of Compensation Committee) since April 2008; Trustee, Hollingsworth Funds (on the Investment Committee) since 2016 (previously Board Chair from 2016-2019); Former Advisory Board member, Duke Energy Corp., 2016-2020; Chair of the Duke Endowment; Chair of Greenville – Spartanburg Airport Commission; former Trustee, BofA Funds Series Trust (11 funds), 2003-2011; former Director, Piedmont Natural Gas, 2004-2016; former Director, National Association of Corporate Directors, Carolinas Chapter, 2013-2018; Chair, Daniel-Mickel Foundation since 1998 |
Natalie A. Trunow
c/o Columbia Management
Investment Advisers, LLC
290 Congress Street
Boston, MA 02210
1967 | Trustee since 2020 | Chief Executive Officer, Millennial Portfolio Solutions LLC (asset management and consulting services), January 2016-January 2021; Non-executive Member of the Investment Committee and Valuation Committee, Sarona Asset Management Inc. (private equity firm) since September 2019; Advisor, Horizon Investments (asset management and consulting services), August 2018-January 2021; Advisor, Paradigm Asset Management, November 2016-December 2021; Consultant to Independent Trustees of CFVIT and CFST I from September 2016 to June 2020 with respect to CFVIT and to December 2020 with respect to CFST I; Director of Investments/Consultant, Casey Family Programs, April 2016-November 2016; Senior Vice President and Chief Investment Officer, Calvert Investments, August 2008-January 2016; Section Head and Portfolio Manager, General Motors Asset Management, June 1997-August 2008 | 174 | Former Director, Investment Committee, Health Services for Children with Special Needs, Inc., 2012-2019; Director, Chair of Audit Committee, Consumer Credit Counseling Services (formerly Guidewell Financial Solutions), since 2019; Independent Director, Investment Committee and Valuation Committee, Sarona Asset Management, since 2019 |
Sandra L. Yeager
c/o Columbia Management
Investment Advisers, LLC
290 Congress Street
Boston, MA 02210
1964 | Trustee since 2017 | Retired; President and founder, Hanoverian Capital, LLC (SEC registered investment advisor firm), 2008-2016; Managing Director, DuPont Capital, 2006-2008; Managing Director, Morgan Stanley Investment Management, 2004-2006; Senior Vice President, Alliance Bernstein, 1990-2004 | 176 | Former Director, NAPE Education Foundation, October 2016-October 2020 |
| * | The term “Columbia Funds Complex” as used herein includes Columbia Seligman Premium Technology Growth Fund, Tri-Continental Corporation and each series of Columbia Fund Series Trust (CFST), Columbia Funds Series Trust I (CFST I), Columbia Funds Series Trust II (CFST II), Columbia ETF Trust I (CET I), Columbia ETF Trust II (CET II), Columbia Funds Variable Insurance Trust (CFVIT) and Columbia Funds Variable Series Trust II (CFVST II). Messrs. Batejan, Beckman, Gallagher and Hacker and Mses. Blatz, Carlton, Flynn, Paglia, Shaw and Yeager serve as Directors of Columbia Seligman Premium Technology Growth Fund and Tri-Continental Corporation. |
| 70 | Columbia Multi Strategy Alternatives Fund | Annual Report 2022 |
TRUSTEES AND OFFICERS (continued)
(Unaudited)
Interested trustee affiliated with Investment Manager*
Name,
address,
year of birth | Position held with the Columbia Funds and length of service | Principal occupation(s) during the
past five years and other relevant
professional experience | Number of
Funds in the
Columbia Funds
Complex overseen | Other directorships
held by Trustee
during the past
five years |
Daniel J. Beckman
c/o Columbia Management
Investment Advisers, LLC
290 Congress Street
Boston, MA 02210
1962 | Trustee since November 2021 and President since June 2021 | Vice President – Head of North America Product, Columbia Management Investment Advisers, LLC since April 2015; President and Principal Executive Officer of the Columbia Funds since June 2021; officer of Columbia Funds and affiliated funds, 2020-2021 | 176 | Director, Ameriprise Trust Company, since October 2016; Director, Columbia Management Investment Distributors, Inc. since November 2018; Board of Governors, Columbia Wanger Asset Management, LLC since January 2022 |
| * | Interested person (as defined under the 1940 Act) by reason of being an officer, director, security holder and/or employee of the Investment Manager or Ameriprise Financial. |
The Statement of Additional Information has additional information about the Fund’s Board members and is available, without charge, upon request by calling 800.345.6611, visiting columbiathreadneedleus.com/investor/ or contacting your financial intermediary.
The Board has appointed officers who are responsible for day-to-day business decisions based on policies it has established. The officers serve at the pleasure of the Board. The following table provides basic information about the Officers of the Fund as of the printing of this report, including principal occupations during the past five years, although their specific titles may have varied over the period. In addition to Mr. Beckman, who is President and Principal Executive Officer, the Fund’s other officers are:
Fund officers
Name,
address and
year of birth | Position and year
first appointed to
position for any Fund
in the Columbia
Funds Complex or a
predecessor thereof | Principal occupation(s) during past five years |
Michael G. Clarke
290 Congress Street
Boston, MA 02210
1969 | Chief Financial Officer and Principal Financial Officer (2009) and Senior Vice President (2019) | Senior Vice President and Head of Global Operations & Investor Services, Columbia Management Investment Advisers, LLC, since March 2022 (previously Vice President, Head of North American Operations, and Co-Head of Global Operations, June 2019 to February 2022 and Vice President – Accounting and Tax, May 2010 - May 2019); senior officer of Columbia Funds and affiliated funds since 2002. |
Joseph Beranek
5890 Ameriprise
Financial Center
Minneapolis, MN 55474
1965 | Treasurer and Chief Accounting Officer (Principal Accounting Officer) (2019) and Principal Financial Officer (2020), CFST, CFST I, CFST II, CFVIT and CFVST II; Assistant Treasurer, CET I and CET II | Vice President – Mutual Fund Accounting and Financial Reporting, Columbia Management Investment Advisers, LLC, since December 2018 and March 2017, respectively (previously Vice President – Pricing and Corporate Actions, May 2010 - March 2017). |
Marybeth Pilat
290 Congress Street
Boston, MA 02210
1968 | Treasurer and Chief Accounting Officer (Principal Accounting Officer) and Principal Financial Officer (2020) for CET I and CET II; Assistant Treasurer, CFST, CFST I, CFST II, CFVIT and CFVST II | Vice President – Product Pricing and Administration, Columbia Management Investment Advisers, LLC, since May 2017; Director - Fund Administration, Calvert Investments, August 2015 – March 2017; Vice President - Fund Administration, Legg Mason, May 2015 - July 2015; Vice President - Fund Administration, Columbia Management Investment Advisers, LLC, May 2010 - April 2015. |
Columbia Multi Strategy Alternatives Fund | Annual Report 2022
| 71 |
TRUSTEES AND OFFICERS (continued)
(Unaudited)
Fund officers (continued)
Name,
address and
year of birth | Position and year
first appointed to
position for any Fund
in the Columbia
Funds Complex or a
predecessor thereof | Principal occupation(s) during past five years |
William F. Truscott
290 Congress Street
Boston, MA 02210
1960 | Senior Vice President (2001) | Formerly, Trustee/Director of Columbia Funds Complex or legacy funds, November 2001-January 1, 2021; Chief Executive Officer, Global Asset Management, Ameriprise Financial, Inc. since September 2012; Chairman of the Board and President, Columbia Management Investment Advisers, LLC since July 2004 and February 2012, respectively; Chairman of the Board and Chief Executive Officer, Columbia Management Investment Distributors, Inc. since November 2008 and February 2012, respectively; Chairman of the Board and Director, Threadneedle Asset Management Holdings, Sàrl since March 2013 and December 2008, respectively; senior executive of various entities affiliated with Columbia Threadneedle. |
Christopher O. Petersen
5228 Ameriprise Financial Center
Minneapolis, MN 55474
1970 | Senior Vice President and Assistant Secretary (2021) | Formerly, Trustee/Director of funds within the Columbia Funds Complex, July 1, 2020 - November 22, 2021; Senior Vice President and Assistant General Counsel, Ameriprise Financial, Inc. since September 2021 (previously Vice President and Lead Chief Counsel, January 2015 - September 2021); formerly, President and Principal Executive Officer of the Columbia Funds, 2015 - 2021; officer of Columbia Funds and affiliated funds since 2007. |
Thomas P. McGuire
290 Congress Street
Boston, MA 02210
1972 | Senior Vice President and Chief Compliance Officer (2012) | Vice President – Asset Management Compliance, Ameriprise Financial, Inc., since May 2010; Chief Compliance Officer, Columbia Acorn/Wanger Funds since December 2015; formerly, Chief Compliance Officer, Ameriprise Certificate Company, September 2010 – September 2020. |
Ryan C. Larrenaga
290 Congress Street
Boston, MA 02210
1970 | Senior Vice President (2017), Chief Legal Officer (2017), and Secretary (2015) | Vice President and Chief Counsel, Ameriprise Financial, Inc. since August 2018 (previously Vice President and Group Counsel, August 2011 - August 2018); Chief Legal Officer, Columbia Acorn/Wanger Funds, since September 2020; officer of Columbia Funds and affiliated funds since 2005. |
Michael E. DeFao
290 Congress Street
Boston, MA 02210
1968 | Vice President (2011) and Assistant Secretary (2010) | Vice President and Chief Counsel, Ameriprise Financial, Inc. since May 2010; Vice President, Chief Legal Officer and Assistant Secretary, Columbia Management Investment Advisers, LLC since October 2021 (previously Vice President and Assistant Secretary, May 2010 – September 2021). |
Lyn Kephart-Strong
5228 Ameriprise
Financial Center
Minneapolis, MN 55474
1960 | Vice President (2015) | President, Columbia Management Investment Services Corp. since October 2014; Vice President & Resolution Officer, Ameriprise Trust Company since August 2009. |
Liquidity Risk Management Program
(Unaudited)
Pursuant to Rule 22e-4 under the 1940 Act, the Fund has adopted a liquidity risk management program (Program). The Program’s principal objectives include assessing, managing and periodically reviewing the Fund’s liquidity risk. Liquidity risk is defined as the risk that the Fund could not meet redemption requests without significant dilution of remaining investors’ interests in the Fund.
The Board has appointed the Investment Manager as the program administrator for the Fund’s Program. The Investment Manager has delegated oversight of the Program to its Liquidity Risk Management Committee (the Committee). At a board meeting during the fiscal period, the Committee provided the Board with a report addressing the operations of the program and assessing its adequacy and effectiveness of implementation for the period January 1, 2021, through December 31, 2021, including:
| • | the Fund had sufficient liquidity to both meet redemptions and operate effectively on behalf of shareholders; |
| 72 | Columbia Multi Strategy Alternatives Fund | Annual Report 2022 |
Liquidity Risk Management Program (continued)
(Unaudited)
| • | there were no material changes to the Program during the period; |
| • | the implementation of the Program was effective to manage the Fund’s liquidity risk; and |
| • | the Program operated adequately during the period. |
There can be no assurance that the Program will achieve its objectives in the future. Please refer to the Fund’s prospectus for more information regarding the Fund’s exposure to liquidity risk and other principal risks to which an investment in the Fund may be subject.
Columbia Multi Strategy Alternatives Fund | Annual Report 2022
| 73 |
[THIS PAGE INTENTIONALLY LEFT BLANK]
[THIS PAGE INTENTIONALLY LEFT BLANK]
Columbia Multi Strategy Alternatives Fund
P.O. Box 219104
Kansas City, MO 64121-9104
Please read and consider the investment objectives, risks, charges and expenses for any fund carefully before investing. For a prospectus and summary prospectus, which contains this and other important information about the Fund, go to
columbiathreadneedleus.com/investor/. The Fund is distributed by Columbia Management Investment Distributors, Inc., member FINRA, and managed by Columbia Management Investment Advisers, LLC.
Columbia Threadneedle Investments (Columbia Threadneedle) is the global brand name of the Columbia and Threadneedle group of companies. All rights reserved.
© 2022 Columbia Management Investment Advisers, LLC.
columbiathreadneedleus.com/investor/

Annual Report
May 31, 2022
Columbia High Yield Municipal Fund
Not FDIC or NCUA Insured • No Financial Institution Guarantee • May Lose Value
If you elect to receive the shareholder report for Columbia High Yield Municipal Fund (the Fund) in paper, mailed to you, the Fund mails one shareholder report to each shareholder address, unless such shareholder elects to receive shareholder reports from the Fund electronically via e-mail or by having a paper notice mailed to you (Postcard Notice) that your Fund’s shareholder report is available at the Columbia funds’ website (columbiathreadneedleus.com/investor/). If you would like more than one report in paper to be mailed to you, or would like to elect to receive reports via e-mail or access them through Postcard Notice, please call shareholder services at 800.345.6611 and additional reports will be sent to you.
Proxy voting policies and procedures
The policy of the Board of Trustees is to vote the proxies of the companies in which the Fund holds investments consistent with the procedures as stated in the Statement of Additional Information (SAI). You may obtain a copy of the SAI without charge by calling 800.345.6611; contacting your financial intermediary; visiting columbiathreadneedleus.com/investor/; or searching the website of the Securities and Exchange Commission (SEC) at sec.gov. Information regarding how the Fund voted proxies relating to portfolio securities is filed with the SEC by August 31st for the most recent 12-month period ending June 30th of that year, and is available without charge by visiting columbiathreadneedleus.com/investor/, or searching the website of the SEC at sec.gov.
Quarterly schedule of investments
The Fund files a complete schedule of portfolio holdings with the SEC for the first and third quarters of each fiscal year on Form N-PORT. The Fund’s Form N-PORT filings are available on the SEC’s website at sec.gov. The Fund’s complete schedule of portfolio holdings, as filed on Form N-PORT, can also be obtained without charge, upon request, by calling 800.345.6611.
Additional Fund information
For more information about the Fund, please visit columbiathreadneedleus.com/investor/ or call 800.345.6611. Customer Service Representatives are available to answer your questions Monday through Friday from 8 a.m. to 7 p.m. Eastern time.
Fund investment manager
Columbia Management Investment Advisers, LLC (the Investment Manager)
290 Congress Street
Boston, MA 02210
Fund distributor
Columbia Management Investment Distributors, Inc.
290 Congress Street
Boston, MA 02210
Fund transfer agent
Columbia Management Investment Services Corp.
P.O. Box 219104
Kansas City, MO 64121-9104
Columbia High Yield Municipal Fund | Annual Report 2022
Fund at a Glance
(Unaudited)
Investment objective
The Fund seeks total return, consisting of current income exempt from federal income tax and capital appreciation.
Portfolio management
Douglas White, CFA
Lead Portfolio Manager
Managed Fund since 2018
Catherine Stienstra
Portfolio Manager
Managed Fund since 2016
| Average annual total returns (%) (for the period ended May 31, 2022) |
| | | Inception | 1 Year | 5 Years | 10 Years |
| Class A | Excluding sales charges | 07/31/00 | -8.75 | 2.20 | 3.47 |
| | Including sales charges | | -11.48 | 1.57 | 3.16 |
| Advisor Class* | 03/19/13 | -8.47 | 2.42 | 3.69 |
| Class C | Excluding sales charges | 07/15/02 | -9.30 | 1.55 | 2.82 |
| | Including sales charges | | -10.18 | 1.55 | 2.82 |
| Institutional Class | 03/05/84 | -8.56 | 2.42 | 3.68 |
| Institutional 2 Class* | 11/08/12 | -8.54 | 2.46 | 3.75 |
| Institutional 3 Class* | 03/01/17 | -8.46 | 2.52 | 3.73 |
| New Blended Benchmark | | -6.38 | 3.77 | 4.39 |
| Bloomberg High Yield Municipal Bond Index | | -6.27 | 4.26 | 4.84 |
| Former Blended Benchmark | | -6.48 | 3.28 | 3.93 |
Returns for Class A shares are shown with and without the maximum initial sales charge of 3.00%. Returns for Class C shares are shown with and without the 1.00% contingent deferred sales charge for the first year only. The Fund’s other share classes are not subject to sales charges and have limited eligibility. Please see the Fund’s prospectus for details. Performance for different share classes will vary based on differences in sales charges and fees associated with each share class. All results shown assume reinvestment of distributions during the period. Returns do not reflect the deduction of taxes that a shareholder may pay on Fund distributions or on the redemption of Fund shares. Performance results reflect the effect of any fee waivers or reimbursements of Fund expenses by Columbia Management Investment Advisers, LLC and/or any of its affiliates. Absent these fee waivers or expense reimbursement arrangements, performance results would have been lower.
The performance information shown represents past performance and is not a guarantee of future results. The investment return and principal value of your investment will fluctuate so that your shares, when redeemed, may be worth more or less than their original cost. Current performance may be lower or higher than the performance information shown. You may obtain performance information current to the most recent month-end by contacting your financial intermediary, visiting columbiathreadneedleus.com/investor/ or calling 800.345.6611.
| * | The returns shown for periods prior to the share class inception date (including returns for the Life of the Fund, if shown, which are since Fund inception) include the returns of the Fund’s oldest share class. These returns are adjusted to reflect any higher class-related operating expenses of the newer share classes, as applicable. Please visit columbiathreadneedleus.com/investor/investment-products/mutual-funds/appended-performance for more information. |
Effective November 24, 2021, the Fund compares its performance to that of an index consisting of 80% Bloomberg High Yield Municipal Bond Index and 20% Bloomberg Municipal Bond Index (the New Blended Benchmark). Prior to this date, the Fund compared its performance to that of an index consisting of 60% Bloomberg High Yield Municipal Bond Index and 40% Bloomberg Municipal Bond Index (the Former Blended Benchmark). The Fund continues to also compare its performance to that of the Bloomberg High Yield Municipal Bond Index. The Fund’s investment manager believes that the New Blended Benchmark and the Bloomberg High Yield Municipal Bond Index provide a more appropriate basis for comparing the Fund’s performance in light of the enhancements made to the Fund’s principal investment strategies. Information on the Former Blended Benchmark will be included for a one-year transition period. Effective August 24, 2021, the Bloomberg Barclays High Yield Municipal Bond Index and Bloomberg Barclays Municipal Bond Index were re-branded as the Bloomberg High Yield Municipal Bond Index and Bloomberg Municipal Bond Index.
The Bloomberg High Yield Municipal Bond Index is comprised of bonds with maturities greater than one-year, having a par value of at least $3 million issued as part of a transaction size greater than $20 million, and rated no higher than “BB+” or equivalent by any of the three principal rating agencies.
The Bloomberg Municipal Bond Index is considered representative of the broad market for investment-grade, tax-exempt bonds with a maturity of at least one year.
The Former Blended Benchmark, established by the Investment Manager, consists of a 60% weighting of the Bloomberg High Yield Municipal Bond Index and a 40% weighting of the Bloomberg Municipal Bond Index.
Indices are not available for investment, are not professionally managed and do not reflect sales charges, fees, brokerage commissions, taxes or other expenses of investing. Securities in the Fund may not match those in an index.
Columbia High Yield Municipal Fund | Annual Report 2022
| 3 |
Fund at a Glance (continued)
(Unaudited)
Performance of a hypothetical $10,000 investment (May 31, 2012 — May 31, 2022)
The chart above shows the change in value of a hypothetical $10,000 investment in Class A shares of Columbia High Yield Municipal Fund during the stated time period, and does not reflect the deduction of taxes that a shareholder may pay on Fund distributions or on the redemption of Fund shares.
| Quality breakdown (%) (at May 31, 2022) |
| AAA rating | 3.0 |
| AA rating | 1.5 |
| A rating | 9.5 |
| BBB rating | 20.8 |
| BB rating | 11.2 |
| B rating | 1.7 |
| CCC rating | 0.3 |
| D rating | 1.5 |
| Not rated | 50.5 |
| Total | 100.0 |
Percentages indicated are based upon total fixed income investments.
Bond ratings apply to the underlying holdings of the Fund and not the Fund itself and are divided into categories ranging from highest to lowest credit quality, determined by using the middle rating of Moody’s, S&P and Fitch, after dropping the highest and lowest available ratings. When ratings are available from only two rating agencies, the lower rating is used. When a rating is available from only one rating agency, that rating is used. If a security is not rated but has a rating by Kroll and/or DBRS, the same methodology is applied to those bonds that would otherwise be not rated. When a bond is not rated by any rating agency, it is designated as “Not rated.” Credit quality ratings assigned by a rating agency are subjective opinions, not statements of fact, and are subject to change, including daily. The ratings assigned by credit rating agencies are but one of the considerations that the Investment Manager and/or Fund’s subadviser incorporates into its credit analysis process, along with such other issuer-specific factors as cash flows, capital structure and leverage ratios, ability to de-leverage (repay) through free cash flow, quality of management, market positioning and access to capital, as well as such security-specific factors as the terms of the security (e.g., interest rate and time to maturity) and the amount and type of any collateral.
Top Ten States/Territories (%)
(at May 31, 2022) |
| Illinois | 9.9 |
| Florida | 8.0 |
| Colorado | 7.8 |
| Texas | 6.9 |
| Puerto Rico | 6.4 |
| California | 5.2 |
| Wisconsin | 4.4 |
| Washington | 4.3 |
| New York | 4.2 |
| New Jersey | 3.6 |
Percentages indicated are based upon total investments excluding Money Market Funds and investments in derivatives, if any.
For further detail about these holdings, please refer to the section entitled “Portfolio of Investments.”
Fund holdings are as of the date given, are subject to change at any time, and are not recommendations to buy or sell any security.
| 4 | Columbia High Yield Municipal Fund | Annual Report 2022 |
Manager Discussion of Fund Performance
(Unaudited)
For the 12-month period that ended May 31, 2022, Class A shares of Columbia High Yield Municipal Fund returned -8.75% excluding sales charges. The Fund underperformed the -6.38% return of the Blended Benchmark and the -6.27% return for the Bloomberg High Yield Municipal Bond Index. The Fund’s former Blended Benchmark returned -6.48% for the same time period.
Market overview
Consistent with trends across the fixed-income market, municipal bonds posted negative returns in the 12 months ended May 31, 2022. An unfavorable shift in U.S. Federal Reserve (Fed) policy was the primary reason for the downturn. Rising inflation prompted the Fed to begin tightening monetary policy by raising short-term interest rates and winding down its stimulative quantitative easing program. More importantly, Fed communications indicated that several more interest rate increases were likely on the way before the end of 2022. Yields rose sharply for all segments of the bond market in response, reflecting a decline in prices.
Russia’s invasion of Ukraine in early 2022 further contributed to the weakness across the financial markets, and municipal bonds were no exception. Investors grew concerned not only about the uncertainty surrounding the military conflict, but also rising commodity prices, a new round of disruptions in global supply chains, and the potential for additional inflationary pressures.
Although price action was weak in the municipal bond market, credit fundamentals remained firm. The combination of increased federal spending and rising tax revenues put many municipal issuers in healthy fiscal positions compared to two years ago. Rating upgrades continued to outpace downgrades, and defaults were exceptionally low even in the riskiest segments of the market. Investor demand for municipals was also quite strong through 2021 and the early part of 2022. The market downturn led to significant outflows from February onward, however, exacerbating the impact of the sell-off. On the positive side, new-issue supply in high yield was relatively light over the full 12-month period, and the deals that came to the market were well received.
The Fund’s most notable detractors
| • | In the aggregate, our portfolio activity was focused on identifying opportunities in higher yielding, longer duration issues. While these bonds generally produce higher income, they were hurt by their greater interest-rate sensitivity. Additionally, since high-yield spreads narrowed close to historic lows during the year, we sought to adopt a defensive posture by overweighting lower rated investment-grade bonds—mainly those rated BBB—and underweighting high-yield issues. However, since BBB rated securities in fact underperformed high yield, this aspect of our strategy detracted from results. |
| ○ | We maintained the overweight in longer dated bonds, since they lagged to such an extent that their valuations became more attractive. In addition, the municipal yield curve typically flattens (indicating outperformance for longer term bonds) when the Fed begins raising interest rates. |
| ○ | We maintained the overweight in BBB rated securities as well, also on the basis of valuation. |
The Fund’s notable contributors during the period
| • | Security selection in the housing sector contributed to performance. Housing was one of the market’s worst performing sectors primarily due to the prevalence of lower coupons, a symptom of the large amount of issuance that occurred when rates were low in previous years. Once yields rose sharply in early 2022, these low coupons—and the accompanying longer durations—caused the prices of these bonds to decline more quickly than the market as a whole. (Duration is a measure of interest-rate sensitivity.) In this environment, the Fund benefited from its positions in housing issues that were structured in ways that led to outperformance versus the broader sector. |
| • | Selection in the leasing and state general obligation sectors contributed to performance, as did an overweight and selection in pre-refunded bonds. Pre-refunded bonds are typically short duration and backed by U.S. Treasury securities, and are thus a more defensive investment – a positive in a declining market. |
Columbia High Yield Municipal Fund | Annual Report 2022
| 5 |
Manager Discussion of Fund Performance (continued)
(Unaudited)
Fixed-income securities present issuer default risk. The Fund invests substantially in municipal securities and will be affected by tax, legislative, regulatory, demographic or political changes, as well as changes impacting a state’s financial, economic or other conditions. A relatively small number of tax-exempt issuers may necessitate the Fund investing more heavily in a single issuer and, therefore, be more exposed to the risk of loss than a fund that invests more broadly. Prepayment and extension risk exists because the timing of payments on a loan, bond or other investment may accelerate when interest rates fall or decelerate when interest rates rise which may reduce investment opportunities and potential returns. A rise in interest rates may result in a price decline of fixed-income instruments held by the Fund, negatively impacting its performance and NAV. Falling rates may result in the Fund investing in lower yielding debt instruments, lowering the Fund’s income and yield. These risks may be heightened for longer maturity and duration securities. Non-investment-grade (high-yield or junk) securities present greater price volatility and more risk to principal and income than higher rated securities. Market risk may affect a single issuer, sector of the economy, industry or the market as a whole. Federal and state tax rules apply to capital gain distributions and any gains or losses on sales. Income may be subject to state, local or alternative minimum taxes. Market or other (e.g., interest rate) environments may adversely affect the liquidity of Fund investments, negatively impacting their price. Generally, the less liquid the market at the time the Fund sells a holding, the greater the risk of loss or decline of value to the Fund. See the Fund’s prospectus for more information on these and other risks.
The views expressed in this report reflect the current views of the respective parties who have contributed to this report. These views are not guarantees of future performance and involve certain risks, uncertainties and assumptions that are difficult to predict, so actual outcomes and results may differ significantly from the views expressed. These views are subject to change at any time based upon economic, market or other conditions and the respective parties disclaim any responsibility to update such views. These views may not be relied on as investment advice and, because investment decisions for a Columbia fund are based on numerous factors, may not be relied on as an indication of trading intent on behalf of any particular Columbia fund. References to specific securities should not be construed as a recommendation or investment advice.
| 6 | Columbia High Yield Municipal Fund | Annual Report 2022 |
Understanding Your Fund’s Expenses
(Unaudited)
As an investor, you incur two types of costs. There are shareholder transaction costs, which generally include sales charges on purchases and may include redemption fees. There are also ongoing fund costs, which generally include management fees, distribution and/or service fees, and other fund expenses. The following information is intended to help you understand your ongoing costs (in dollars) of investing in the Fund and to help you compare these costs with the ongoing costs of investing in other mutual funds.
Analyzing your Fund’s expenses
To illustrate these ongoing costs, we have provided examples and calculated the expenses paid by investors in each share class of the Fund during the period. The actual and hypothetical information in the table is based on an initial investment of $1,000 at the beginning of the period indicated and held for the entire period. Expense information is calculated two ways and each method provides you with different information. The amount listed in the “Actual” column is calculated using the Fund’s actual operating expenses and total return for the period. You may use the Actual information, together with the amount invested, to estimate the expenses that you paid over the period. Simply divide your account value by $1,000 (for example, an $8,600 account value divided by $1,000 = 8.6), then multiply the results by the expenses paid during the period under the “Actual” column. The amount listed in the “Hypothetical” column assumes a 5% annual rate of return before expenses (which is not the Fund’s actual return) and then applies the Fund’s actual expense ratio for the period to the hypothetical return. You should not use the hypothetical account values and expenses to estimate either your actual account balance at the end of the period or the expenses you paid during the period. See “Compare with other funds” below for details on how to use the hypothetical data.
Compare with other funds
Since all mutual funds are required to include the same hypothetical calculations about expenses in shareholder reports, you can use this information to compare the ongoing cost of investing in the Fund with other funds. To do so, compare the hypothetical example with the 5% hypothetical examples that appear in the shareholder reports of other funds. As you compare hypothetical examples of other funds, it is important to note that hypothetical examples are meant to highlight the ongoing costs of investing in a fund only and do not reflect any transaction costs, such as sales charges, or redemption or exchange fees. Therefore, the hypothetical calculations are useful in comparing ongoing costs only, and will not help you determine the relative total costs of owning different funds. If transaction costs were included in these calculations, your costs would be higher.
| December 1, 2021 — May 31, 2022 |
| | Account value at the
beginning of the
period ($) | Account value at the
end of the
period ($) | Expenses paid during
the period ($) | Fund’s annualized
expense ratio (%) |
| | Actual | Hypothetical | Actual | Hypothetical | Actual | Hypothetical | Actual |
| Class A | 1,000.00 | 1,000.00 | 895.10 | 1,020.69 | 4.02 | 4.28 | 0.85 |
| Advisor Class | 1,000.00 | 1,000.00 | 897.00 | 1,021.69 | 3.07 | 3.28 | 0.65 |
| Class C | 1,000.00 | 1,000.00 | 892.40 | 1,017.70 | 6.84 | 7.29 | 1.45 |
| Institutional Class | 1,000.00 | 1,000.00 | 896.90 | 1,021.69 | 3.07 | 3.28 | 0.65 |
| Institutional 2 Class | 1,000.00 | 1,000.00 | 896.90 | 1,021.89 | 2.88 | 3.07 | 0.61 |
| Institutional 3 Class | 1,000.00 | 1,000.00 | 896.60 | 1,022.09 | 2.70 | 2.87 | 0.57 |
Expenses paid during the period are equal to the annualized expense ratio for each class as indicated above, multiplied by the average account value over the period and then multiplied by the number of days in the Fund’s most recent fiscal half year and divided by 365.
Expenses do not include fees and expenses incurred indirectly by the Fund from its investment in underlying funds, including affiliated and non-affiliated pooled investment vehicles, such as mutual funds and exchange-traded funds.
Had Columbia Management Investment Advisers, LLC and/or certain of its affiliates not waived/reimbursed certain fees and expenses, account value at the end of the period would have been reduced.
Columbia High Yield Municipal Fund | Annual Report 2022
| 7 |
Portfolio of Investments
May 31, 2022
(Percentages represent value of investments compared to net assets)
Investments in securities
| Municipal Bonds 98.6% |
| Issue Description | Coupon
Rate | | Principal
Amount ($) | Value ($) |
| Alaska 0.1% |
| Northern Tobacco Securitization Corp.(a) |
| Refunding Revenue Bonds |
| Series 2021B-2 |
| 06/01/2066 | 0.000% | | 5,000,000 | 705,752 |
| Arizona 2.8% |
| Arizona Industrial Development Authority(b) |
| Revenue Bonds |
| Legacy Cares, Inc. Project |
| Series 2020 |
| 07/01/2050 | 7.750% | | 3,000,000 | 3,421,388 |
| Series 2021A |
| 07/01/2051 | 6.000% | | 500,000 | 516,107 |
| Pinecrest Academy of Northern Nevada Project |
| Series 2022 |
| 07/15/2029 | 4.500% | | 2,500,000 | 2,461,016 |
| Industrial Development Authority of the City of Phoenix (The) |
| Revenue Bonds |
| Downtown Phoenix Student Housing II LLC - Arizona State University Project |
| Series 2019 |
| 07/01/2059 | 5.000% | | 1,000,000 | 1,019,059 |
| Industrial Development Authority of the County of Pima (The)(b) |
| Refunding Revenue Bonds |
| American Leadership Academy |
| Series 2022 |
| 06/15/2057 | 4.000% | | 4,000,000 | 3,320,948 |
| La Paz County Industrial Development Authority |
| Revenue Bonds |
| Charter School Solutions - Harmony Public Schools Project |
| Series 2016 |
| 02/15/2036 | 5.000% | | 1,200,000 | 1,243,630 |
| 02/15/2046 | 5.000% | | 1,500,000 | 1,540,623 |
| Series 2018 |
| 02/15/2048 | 5.000% | | 230,000 | 238,808 |
| Maricopa County Industrial Development Authority(b),(c) |
| Revenue Bonds |
| Commercial Metals Co. |
| Series 2022 |
| 10/15/2047 | 4.000% | | 5,000,000 | 4,581,372 |
| Total | 18,342,951 |
| California 5.1% |
| California County Tobacco Securitization Agency |
| Refunding Revenue Bonds |
| Subordinated Series 2020B-1 |
| 06/01/2049 | 5.000% | | 500,000 | 528,324 |
| Municipal Bonds (continued) |
| Issue Description | Coupon
Rate | | Principal
Amount ($) | Value ($) |
| California Municipal Finance Authority |
| Revenue Bonds |
| National University |
| Series 2019A |
| 04/01/2040 | 5.000% | | 1,275,000 | 1,408,125 |
| 04/01/2041 | 5.000% | | 250,000 | 274,968 |
| California Municipal Finance Authority(b),(c),(d) |
| Revenue Bonds |
| UTS Renewable Energy-Waste Water Facilities |
| Series 2011 |
| 12/01/2032 | 0.000% | | 1,835,000 | 36,700 |
| California Statewide Communities Development Authority |
| Refunding Revenue Bonds |
| 899 Charleston Project |
| Series 2014A |
| 11/01/2044 | 5.250% | | 1,500,000 | 1,461,372 |
| Revenue Bonds |
| Loma Linda University Medical Center |
| Series 2014 |
| 12/01/2054 | 5.500% | | 3,000,000 | 3,086,043 |
| California Statewide Communities Development Authority(b) |
| Revenue Bonds |
| Loma Linda University Medical Center |
| Series 2018 |
| 12/01/2058 | 5.500% | | 1,000,000 | 1,033,644 |
| City of Carson |
| Special Assessment Bonds |
| Assessment District No. 92-1 |
| Series 1992 |
| 09/02/2022 | 7.375% | | 10,000 | 10,121 |
| City of Long Beach Marina System |
| Revenue Bonds |
| Series 2015 |
| 05/15/2045 | 5.000% | | 500,000 | 514,842 |
| CMFA Special Finance Agency(b) |
| Revenue Bonds |
| Junior Bonds - Latitude33 |
| Series 2021A |
| 12/01/2045 | 4.000% | | 1,000,000 | 818,326 |
| Junior Bonds - Solana at Grand |
| Series 2021A-2 |
| 08/01/2045 | 4.000% | | 4,000,000 | 3,301,409 |
| Compton Unified School District(a) |
| Unlimited General Obligation Bonds |
| Election of 2002 - Capital Appreciation |
| Series 2006C |
| 06/01/2025 | 0.000% | | 2,310,000 | 2,125,252 |
The accompanying Notes to Financial Statements are an integral part of this statement.
| 8 | Columbia High Yield Municipal Fund | Annual Report 2022 |
Portfolio of Investments (continued)
May 31, 2022
| Municipal Bonds (continued) |
| Issue Description | Coupon
Rate | | Principal
Amount ($) | Value ($) |
| CSCDA Community Improvement Authority(b) |
| Revenue Bonds |
| Social Bonds - Mezzanine Lien - Westgate Phase 1-Pasadena |
| Series 2021 |
| 06/01/2057 | 4.000% | | 2,000,000 | 1,543,828 |
| Social Bonds - Millennium South Bay-Hawthorne |
| Series 2021 |
| 07/01/2058 | 4.000% | | 2,000,000 | 1,508,874 |
| Golden State Tobacco Securitization Corp.(a) |
| Refunding Revenue Bonds |
| Subordinated Series 2021B-2 |
| 06/01/2066 | 0.000% | | 40,000,000 | 5,270,524 |
| Hastings Campus Housing Finance Authority |
| Revenue Bonds |
| Green Bonds |
| Series 2020A |
| 07/01/2061 | 5.000% | | 1,000,000 | 1,043,160 |
| Hastings Campus Housing Finance Authority(a),(b) |
| Revenue Bonds |
| Green Bonds |
| Subordinated Series 2020A |
| 07/01/2061 | 0.000% | | 3,000,000 | 1,463,008 |
| M-S-R Energy Authority |
| Revenue Bonds |
| Series 2009B |
| 11/01/2039 | 6.500% | | 5,000,000 | 6,397,033 |
| Palomar Health |
| Refunding Revenue Bonds |
| Series 2016 |
| 11/01/2036 | 5.000% | | 1,845,000 | 1,945,906 |
| Total | 33,771,459 |
| Colorado 7.7% |
| Aerotropolis Regional Transportation Authority |
| Revenue Bonds |
| Series 2021 |
| 12/01/2052 | 4.375% | | 4,000,000 | 3,348,518 |
| Aurora Crossroads Metropolitan District No. 2 |
| Limited General Obligation Bonds |
| Senior Series 2020A |
| 12/01/2050 | 5.000% | | 1,000,000 | 949,108 |
| Colorado Bridge Enterprise(c) |
| Revenue Bonds |
| Central 70 Project |
| Series 2017 |
| 06/30/2051 | 4.000% | | 6,000,000 | 5,944,949 |
| Colorado Educational & Cultural Facilities Authority(b) |
| Refunding Revenue Bonds |
| New Summit Charter Academy Project |
| Series 2021 |
| 07/01/2051 | 4.000% | | 715,000 | 588,315 |
| 07/01/2061 | 4.000% | | 1,225,000 | 957,978 |
| Municipal Bonds (continued) |
| Issue Description | Coupon
Rate | | Principal
Amount ($) | Value ($) |
| Colorado Health Facilities Authority |
| Improvement Refunding Revenue Bonds |
| Christian Living Neighborhoods |
| Series 2021 |
| 01/01/2042 | 4.000% | | 1,000,000 | 871,479 |
| Refunding Revenue Bonds |
| CommonSpirit Health |
| Series 2019A |
| 08/01/2049 | 4.000% | | 3,250,000 | 3,171,778 |
| Revenue Bonds |
| Aberdeen Ridge |
| Series 2021A |
| 05/15/2058 | 5.000% | | 3,250,000 | 2,845,822 |
| NJH-SJH Center for Outpatient Health Project |
| Series 2019 |
| 01/01/2045 | 3.000% | | 5,000,000 | 4,182,781 |
| Eagle Brook Meadows Metropolitan District No. 3 |
| Limited General Obligation Bonds |
| Series 2021 |
| 12/01/2051 | 5.000% | | 1,500,000 | 1,331,985 |
| Fiddlers Business Improvement District(b),(e) |
| Unlimited General Obligation Refunding Bonds |
| Series 2022 |
| 12/01/2047 | 5.550% | | 3,000,000 | 3,192,076 |
| Fitzsimons Village Metropolitan District No. 3 |
| Limited General Obligation Refunding Bonds |
| Series 2021A-1 |
| 12/01/2055 | 4.250% | | 2,000,000 | 1,596,194 |
| Jefferson Center Metropolitan District No. 1 |
| Refunding Revenue Bonds |
| Subordinated Series 2020B |
| 12/15/2050 | 5.750% | | 4,000,000 | 4,017,040 |
| Lanterns Metropolitan District No. 2 |
| Limited General Obligation Bonds |
| Series 2021A |
| 12/01/2050 | 4.500% | | 2,830,000 | 2,245,093 |
| Peak Metropolitan District No. 1(b) |
| Limited General Obligation Bonds |
| Series 2021A |
| 12/01/2051 | 5.000% | | 1,150,000 | 1,064,974 |
| Rampart Range Metropolitan District No. 5 |
| Revenue Bonds |
| Series 2021 |
| 12/01/2051 | 4.000% | | 2,500,000 | 1,986,460 |
| RRC Metropolitan District No. 2 |
| Limited General Obligation Bonds |
| Series 2021 |
| 12/01/2051 | 5.250% | | 2,500,000 | 2,148,108 |
The accompanying Notes to Financial Statements are an integral part of this statement.
Columbia High Yield Municipal Fund | Annual Report 2022
| 9 |
Portfolio of Investments (continued)
May 31, 2022
| Municipal Bonds (continued) |
| Issue Description | Coupon
Rate | | Principal
Amount ($) | Value ($) |
| Senac South Metropolitan District No. 1 |
| Limited General Obligation Bonds |
| Series 2021A |
| 12/01/2051 | 5.250% | | 3,000,000 | 2,649,776 |
| Transport Metropolitan District No. 3 |
| Limited General Obligation Bonds |
| Series 2021A-1 |
| 12/01/2051 | 5.000% | | 3,000,000 | 2,968,033 |
| Waterfront at Foster Lake Metropolitan District No. 2 |
| Revenue Bonds |
| Series 2022 |
| 12/01/2028 | 4.625% | | 2,000,000 | 1,871,013 |
| Windler Public Improvement Authority |
| Revenue Bonds |
| Series 2021A-1 |
| 12/01/2051 | 4.125% | | 4,000,000 | 3,168,659 |
| Total | 51,100,139 |
| Connecticut 0.4% |
| Connecticut State Health & Educational Facility Authority(b) |
| Revenue Bonds |
| Church Home of Hartford, Inc. Project |
| Series 2016 |
| 09/01/2053 | 5.000% | | 1,750,000 | 1,757,171 |
| State of Connecticut |
| Unlimited General Obligation Bonds |
| Series 2018E |
| 09/15/2037 | 5.000% | | 500,000 | 556,037 |
| Total | 2,313,208 |
| District of Columbia 0.4% |
| District of Columbia |
| Revenue Bonds |
| KIPP DC Project |
| Series 2019 |
| 07/01/2049 | 4.000% | | 680,000 | 644,419 |
| Metropolitan Washington Airports Authority Dulles Toll Road |
| Refunding Revenue Bonds |
| Dulles Metrorail |
| Subordinated Series 2019 |
| 10/01/2049 | 4.000% | | 2,275,000 | 2,166,405 |
| Total | 2,810,824 |
| Florida 7.9% |
| Capital Trust Agency, Inc.(b) |
| 04/27/2021 |
| 07/01/2056 | 5.000% | | 4,000,000 | 4,031,790 |
| Revenue Bonds |
| WFCS Portfolio Projects |
| Series 2021A |
| 01/01/2031 | 3.300% | | 250,000 | 218,557 |
| 01/01/2056 | 5.000% | | 1,000,000 | 942,679 |
| Municipal Bonds (continued) |
| Issue Description | Coupon
Rate | | Principal
Amount ($) | Value ($) |
| Capital Trust Agency, Inc.(b),(d) |
| Revenue Bonds |
| 1st Mortgage - Tapestry Walden Senior Housing Project |
| Series 2017 |
| 07/01/2052 | 0.000% | | 3,400,000 | 1,020,000 |
| 1st Mortgage Tallahassee Tapestry Senior Housing Project |
| Series 2015 |
| 12/01/2050 | 0.000% | | 3,550,000 | 1,100,500 |
| Capital Trust Agency, Inc.(a),(b) |
| Subordinated |
| 07/01/2061 | 0.000% | | 30,000,000 | 1,694,763 |
| City of Atlantic Beach |
| Revenue Bonds |
| Fleet Landing Project |
| Series 2018A |
| 11/15/2053 | 5.000% | | 1,500,000 | 1,565,459 |
| City of Pompano Beach |
| Revenue Bonds |
| John Knox Village Project |
| Series 2021A |
| 09/01/2056 | 4.000% | | 1,835,000 | 1,586,557 |
| City of Tampa(a) |
| Revenue Bonds |
| Series 2020A |
| 09/01/2053 | 0.000% | | 1,800,000 | 479,747 |
| County of Broward Airport System(c) |
| Revenue Bonds |
| Series 2019A |
| 10/01/2049 | 4.000% | | 700,000 | 696,710 |
| County of Miami-Dade(a) |
| Revenue Bonds |
| Capital Appreciation |
| Subordinated Series 2009B |
| 10/01/2041 | 0.000% | | 10,000,000 | 4,468,213 |
| County of Osceola Transportation(a) |
| Refunding Revenue Bonds |
| Osceola Parkway Toll Facility |
| Series 2019A-2 |
| 10/01/2049 | 0.000% | | 1,700,000 | 491,816 |
| Series 2020A-2 |
| 10/01/2046 | 0.000% | | 3,175,000 | 1,063,056 |
| 10/01/2048 | 0.000% | | 2,000,000 | 606,940 |
| Florida Development Finance Corp. |
| Prerefunded 06/15/23 Revenue Bonds |
| Renaissance Charter School |
| Series 2013A |
| 06/15/2044 | 8.500% | | 3,000,000 | 3,206,735 |
| Florida Development Finance Corp.(b) |
| Refunding Revenue Bonds |
| Glenridge on Palmer Ranch Project (The) |
| Series 2021 |
| 06/01/2051 | 5.000% | | 2,000,000 | 1,748,929 |
The accompanying Notes to Financial Statements are an integral part of this statement.
| 10 | Columbia High Yield Municipal Fund | Annual Report 2022 |
Portfolio of Investments (continued)
May 31, 2022
| Municipal Bonds (continued) |
| Issue Description | Coupon
Rate | | Principal
Amount ($) | Value ($) |
| Mayflower Retirement Community Project (The) |
| Series 2021 |
| 06/01/2055 | 4.000% | | 1,500,000 | 1,185,846 |
| Renaissance Charter School |
| Series 2020 |
| 09/15/2050 | 5.000% | | 2,200,000 | 2,234,536 |
| Revenue Bonds |
| Discovery High School Project |
| Series 2020 |
| 06/01/2055 | 5.000% | | 2,000,000 | 1,940,279 |
| Renaissance Charter School |
| Series 2015 |
| 06/15/2046 | 6.125% | | 4,900,000 | 5,132,006 |
| Florida Development Finance Corp.(b),(c) |
| Revenue Bonds |
| Green Bonds - Brightline Florida Passenger Rail Project |
| Series 2020 |
| 01/01/2049 | 7.375% | | 2,000,000 | 2,019,975 |
| Lee County Industrial Development Authority |
| Revenue Bonds |
| Cypress Cove at HealthPark Florida, Inc. Project |
| Series 2022 |
| 10/01/2057 | 5.250% | | 3,000,000 | 2,961,761 |
| Palm Beach County Health Facilities Authority |
| Prerefunded 06/01/22 Revenue Bonds |
| Sinai Residences Boca Raton |
| Series 2014 |
| 06/01/2049 | 7.500% | | 1,250,000 | 1,275,000 |
| Refunding Revenue Bonds |
| Toby & Leon Cooperman Sinai Residences of Boca Raton |
| Series 2022 |
| 06/01/2056 | 4.250% | | 4,000,000 | 3,664,230 |
| Polk County Industrial Development Authority |
| Refunding Revenue Bonds |
| Carpenter’s Home Estates, Inc. |
| Series 2019 |
| 01/01/2055 | 5.000% | | 2,615,000 | 2,658,148 |
| Seminole County Industrial Development Authority |
| Refunding Revenue Bonds |
| Legacy Pointe at UCF Project |
| Series 2019 |
| 11/15/2054 | 5.750% | | 2,525,000 | 2,414,350 |
| Seminole County Industrial Development Authority(b) |
| Revenue Bonds |
| Galileo Schools for Gifted Learning Project |
| Series 2021 |
| 06/15/2051 | 4.000% | | 830,000 | 726,550 |
| 06/15/2056 | 4.000% | | 1,410,000 | 1,200,851 |
| Municipal Bonds (continued) |
| Issue Description | Coupon
Rate | | Principal
Amount ($) | Value ($) |
| Westridge Community Development District |
| Special Assessment Bonds |
| Series 2005 |
| 05/01/2037 | 5.800% | | 285,000 | 285,057 |
| Total | 52,621,040 |
| Georgia 1.9% |
| Floyd County Development Authority |
| Revenue Bonds |
| Spires Berry College Project |
| Series 2018 |
| 12/01/2048 | 6.250% | | 1,500,000 | 1,409,773 |
| Georgia State Road & Tollway Authority(b),(f) |
| Prerefunded 06/01/24 Revenue Bonds |
| I-75 S Expressway |
| Series 2014S |
| 06/01/2049 | 0.000% | | 4,600,000 | 4,630,998 |
| Glynn-Brunswick Memorial Hospital Authority |
| Revenue Bonds |
| SE Georgia Health System Anticipation Certificates |
| Series 2017 |
| 08/01/2047 | 5.000% | | 355,000 | 367,638 |
| Oconee County Industrial Development Authority |
| Revenue Bonds |
| Presbyterian Village Athens Project |
| Series 2018 |
| 12/01/2053 | 6.375% | | 3,000,000 | 2,447,918 |
| Savannah Economic Development Authority |
| Prerefunded 01/01/24 Revenue Bonds |
| Marshes Skidaway Island Project |
| Series 2013 |
| 01/01/2049 | 7.250% | | 3,500,000 | 3,785,682 |
| Total | 12,642,009 |
| Idaho 0.8% |
| Idaho Health Facilities Authority |
| Revenue Bonds |
| Terraces of Boise Project |
| Series 2014 |
| 10/01/2056 | 4.550% | | 4,000,000 | 3,131,452 |
| Spring Valley Community Infrastructure District No. 1(b) |
| Special Assessment Bonds |
| Series 2021 |
| 09/01/2051 | 3.750% | | 3,000,000 | 2,330,955 |
| Total | 5,462,407 |
| Illinois 9.7% |
| Chicago Board of Education(b) |
| Unlimited General Obligation Bonds |
| Dedicated |
| Series 2017A |
| 12/01/2046 | 7.000% | | 3,000,000 | 3,394,378 |
The accompanying Notes to Financial Statements are an integral part of this statement.
Columbia High Yield Municipal Fund | Annual Report 2022
| 11 |
Portfolio of Investments (continued)
May 31, 2022
| Municipal Bonds (continued) |
| Issue Description | Coupon
Rate | | Principal
Amount ($) | Value ($) |
| Chicago Board of Education |
| Unlimited General Obligation Bonds |
| Dedicated |
| Series 2017H |
| 12/01/2036 | 5.000% | | 1,665,000 | 1,737,101 |
| Project |
| Series 2015C |
| 12/01/2039 | 5.250% | | 2,000,000 | 2,057,651 |
| Series 2012A |
| 12/01/2042 | 5.000% | | 1,000,000 | 1,000,827 |
| Series 2016B |
| 12/01/2046 | 6.500% | | 1,500,000 | 1,643,901 |
| Series 2018D |
| 12/01/2046 | 5.000% | | 5,000,000 | 5,026,956 |
| Series 2022A |
| 12/01/2047 | 4.000% | | 6,000,000 | 5,616,781 |
| Unlimited General Obligation Refunding Bonds |
| Series 2018A (AGM) |
| 12/01/2035 | 5.000% | | 500,000 | 551,495 |
| Chicago O’Hare International Airport(c) |
| Revenue Bonds |
| TriPs Obligated Group |
| Series 2018 |
| 07/01/2048 | 5.000% | | 800,000 | 835,934 |
| City of Chicago |
| Unlimited General Obligation Bonds |
| Series 2017A |
| 01/01/2038 | 6.000% | | 3,235,000 | 3,524,882 |
| Unlimited General Obligation Refunding Bonds |
| Series 2007F |
| 01/01/2042 | 5.500% | | 1,000,000 | 1,038,016 |
| City of Chicago Wastewater Transmission |
| Refunding Revenue Bonds |
| 2nd Lien |
| Series 2015C |
| 01/01/2035 | 5.000% | | 1,000,000 | 1,045,908 |
| Du Page County Special Service Area No. 31 |
| Special Tax Bonds |
| Monarch Landing Project |
| Series 2006 |
| 03/01/2036 | 5.625% | | 648,000 | 648,161 |
| Metropolitan Pier & Exposition Authority |
| Refunding Revenue Bonds |
| McCormick Place Expansion Project |
| Series 2020 |
| 06/15/2042 | 5.000% | | 2,500,000 | 2,644,074 |
| 06/15/2050 | 4.000% | | 1,200,000 | 1,132,323 |
| Revenue Bonds |
| McCormick Place Expansion Project |
| Series 2017 |
| 06/15/2057 | 5.000% | | 1,250,000 | 1,324,237 |
| Municipal Bonds (continued) |
| Issue Description | Coupon
Rate | | Principal
Amount ($) | Value ($) |
| Metropolitan Pier & Exposition Authority(a) |
| Refunding Revenue Bonds |
| McCormick Place Expansion Project |
| Series 2022 |
| 12/15/2037 | 0.000% | | 2,700,000 | 1,405,251 |
| 06/15/2038 | 0.000% | | 3,000,000 | 1,520,528 |
| State of Illinois |
| Unlimited General Obligation Bonds |
| Series 2016 |
| 01/01/2041 | 5.000% | | 3,830,000 | 3,917,362 |
| Series 2017A |
| 12/01/2035 | 5.000% | | 1,345,000 | 1,398,840 |
| 12/01/2038 | 5.000% | | 3,000,000 | 3,111,745 |
| Series 2018A |
| 05/01/2032 | 5.000% | | 2,500,000 | 2,643,151 |
| 05/01/2040 | 5.000% | | 4,000,000 | 4,148,258 |
| 05/01/2041 | 5.000% | | 3,910,000 | 4,050,475 |
| 05/01/2043 | 5.000% | | 3,000,000 | 3,091,933 |
| Series 2020 |
| 05/01/2039 | 5.500% | | 570,000 | 617,047 |
| 05/01/2045 | 5.750% | | 750,000 | 818,588 |
| Unlimited General Obligation Refunding Bonds |
| Series 2018B |
| 10/01/2033 | 5.000% | | 1,000,000 | 1,049,680 |
| State of Illinois(e) |
| Unlimited General Obligation Bonds |
| Series 2022A |
| 03/01/2047 | 5.500% | | 2,700,000 | 2,943,000 |
| Village of Lincolnshire |
| Special Tax Bonds |
| Sedgebrook Project |
| Series 2004 |
| 03/01/2034 | 6.250% | | 557,000 | 541,391 |
| Total | 64,479,874 |
| Indiana 0.3% |
| Indiana Finance Authority(b),(c) |
| Revenue Bonds |
| RES Polyflow Indiana Project Green Bonds |
| Series 2019 |
| 03/01/2039 | 7.000% | | 2,000,000 | 1,668,951 |
| Iowa 3.0% |
| Iowa Finance Authority(f) |
| Prerefunded 11/15/24 Revenue Bonds |
| Deerfield Retirement Community |
| Series 2014 |
| 11/15/2046 | 5.400% | | 1,970,736 | 2,115,287 |
The accompanying Notes to Financial Statements are an integral part of this statement.
| 12 | Columbia High Yield Municipal Fund | Annual Report 2022 |
Portfolio of Investments (continued)
May 31, 2022
| Municipal Bonds (continued) |
| Issue Description | Coupon
Rate | | Principal
Amount ($) | Value ($) |
| Iowa Finance Authority |
| Refunding Revenue Bonds |
| Iowa Fertilizer Co. Project |
| Series 2022 |
| 12/01/2050 | 5.000% | | 2,700,000 | 2,853,638 |
| Lifespace Communities, Inc. |
| Series 2021 |
| 05/15/2053 | 4.000% | | 4,000,000 | 3,187,494 |
| Revenue Bonds |
| Lifespace Communities, Inc. |
| Series 2018A |
| 05/15/2043 | 5.000% | | 1,740,000 | 1,749,044 |
| PHS Council Bluffs, Inc. Project |
| Series 2018 |
| 08/01/2055 | 5.250% | | 3,200,000 | 2,810,514 |
| Iowa Tobacco Settlement Authority(a) |
| Refunding Revenue Bonds |
| Series 2021B-2 |
| 06/01/2065 | 0.000% | | 50,000,000 | 6,904,540 |
| Total | 19,620,517 |
| Kansas 0.9% |
| City of Overland Park |
| Revenue Bonds |
| Prairiefire-Lionsgate Project |
| Series 2012 |
| 12/15/2032 | 6.000% | | 6,000,000 | 2,684,682 |
| Wyandotte County-Kansas City Unified Government |
| Revenue Bonds |
| Legends Village West Project |
| Series 2006 |
| 10/01/2028 | 4.875% | | 3,155,000 | 3,009,027 |
| Total | 5,693,709 |
| Kentucky 0.8% |
| City of Henderson(b),(c) |
| Revenue Bonds |
| Pratt Paper LLC Project |
| Series 2022 |
| 01/01/2052 | 4.700% | | 4,000,000 | 4,015,175 |
| Kentucky Economic Development Finance Authority |
| Refunding Revenue Bonds |
| Owensboro Health |
| Series 2017A |
| 06/01/2045 | 5.000% | | 1,000,000 | 1,037,331 |
| Total | 5,052,506 |
| Municipal Bonds (continued) |
| Issue Description | Coupon
Rate | | Principal
Amount ($) | Value ($) |
| Louisiana 1.3% |
| Louisiana Public Facilities Authority |
| Prerefunded 05/15/26 Revenue Bonds |
| Ochsner Clinic Foundation Project |
| Series 2016 |
| 05/15/2034 | 5.000% | | 25,000 | 27,524 |
| Louisiana Public Facilities Authority(c) |
| Revenue Bonds |
| Impala Warehousing LLC Project |
| Series 2013 |
| 07/01/2036 | 6.500% | | 4,420,000 | 4,507,327 |
| Parish of St. James(b) |
| Revenue Bonds |
| NuStar Logistics LP Project |
| Series 2020-2 |
| 07/01/2040 | 6.350% | | 3,750,000 | 4,290,137 |
| Total | 8,824,988 |
| Maine 0.4% |
| Finance Authority of Maine(b),(c) |
| Revenue Bonds |
| Green Bonds Go Lab Madison LLC Project |
| Series 2021 |
| 12/01/2051 | 8.000% | | 3,000,000 | 2,501,414 |
| Maryland 1.3% |
| Howard County Housing Commission |
| Revenue Bonds |
| Woodfield Oxford Square Apartments |
| Series 2017 |
| 12/01/2037 | 5.000% | | 4,000,000 | 4,316,812 |
| Maryland Economic Development Corp.(c) |
| Revenue Bonds |
| Green Bonds - Purple Line Light Rail Project |
| Series 2022 |
| 06/30/2055 | 5.250% | | 2,000,000 | 2,099,418 |
| Maryland Economic Development Corp. |
| Tax Allocation Bonds |
| Port Covington Project |
| Series 2020 |
| 09/01/2050 | 4.000% | | 2,700,000 | 2,319,194 |
| Total | 8,735,424 |
| Massachusetts 1.0% |
| Massachusetts Development Finance Agency(b) |
| Refunding Revenue Bonds |
| NewBridge on the Charles, Inc. |
| Series 2017 |
| 10/01/2057 | 5.000% | | 2,000,000 | 2,110,969 |
The accompanying Notes to Financial Statements are an integral part of this statement.
Columbia High Yield Municipal Fund | Annual Report 2022
| 13 |
Portfolio of Investments (continued)
May 31, 2022
| Municipal Bonds (continued) |
| Issue Description | Coupon
Rate | | Principal
Amount ($) | Value ($) |
| Revenue Bonds |
| Linden Ponds, Inc. Facility |
| Series 2018 |
| 11/15/2046 | 5.125% | | 2,000,000 | 2,120,832 |
| Massachusetts Educational Financing Authority(c) |
| Refunding Revenue Bonds |
| Issue K |
| Subordinated Series 2017B |
| 07/01/2046 | 4.250% | | 1,500,000 | 1,520,006 |
| Series 2018B |
| 07/01/2034 | 3.625% | | 840,000 | 827,055 |
| Total | 6,578,862 |
| Michigan 0.8% |
| Michigan Finance Authority(a) |
| Refunding Revenue Bonds |
| Senior Series 2020B-2 Class 2 |
| 06/01/2065 | 0.000% | | 37,500,000 | 4,542,596 |
| Michigan Finance Authority |
| Revenue Bonds |
| Henry Ford Health System |
| Series 2019A |
| 11/15/2050 | 4.000% | | 600,000 | 590,828 |
| Michigan State Hospital Finance Authority |
| Refunding Revenue Bonds |
| Ascension Health Senior Care Group |
| Series 2010F-4 |
| 11/15/2047 | 5.000% | | 415,000 | 449,959 |
| Total | 5,583,383 |
| Minnesota 1.2% |
| City of Blaine |
| Refunding Revenue Bonds |
| Crest View Senior Community Project |
| Series 2015 |
| 07/01/2045 | 6.125% | | 3,500,000 | 2,782,849 |
| 07/01/2050 | 6.125% | | 1,500,000 | 1,162,709 |
| City of Crookston |
| Revenue Bonds |
| Riverview Health Project |
| Series 2019 |
| 05/01/2044 | 5.000% | | 500,000 | 487,619 |
| 05/01/2051 | 5.000% | | 1,500,000 | 1,432,368 |
| St. Cloud Housing & Redevelopment Authority(d) |
| Revenue Bonds |
| Sanctuary St. Cloud Project |
| Series 2016A |
| 08/01/2036 | 0.000% | | 2,245,000 | 1,908,250 |
| Total | 7,773,795 |
| Municipal Bonds (continued) |
| Issue Description | Coupon
Rate | | Principal
Amount ($) | Value ($) |
| Missouri 1.4% |
| Kansas City Industrial Development Authority(b) |
| Revenue Bonds |
| Platte Purchase Project |
| Series 2019A |
| 07/01/2040 | 5.000% | | 1,900,000 | 1,689,039 |
| Kirkwood Industrial Development Authority |
| Refunding Revenue Bonds |
| Aberdeen Heights Project |
| Series 2017 |
| 05/15/2050 | 5.250% | | 4,500,000 | 4,365,185 |
| St. Louis County Industrial Development Authority |
| Refunding Revenue Bonds |
| St. Andrews Residence for Seniors |
| Series 2015 |
| 12/01/2045 | 5.125% | | 3,000,000 | 3,046,471 |
| Total | 9,100,695 |
| Montana 0.3% |
| City of Kalispell |
| Refunding Revenue Bonds |
| Immanuel Lutheran Corp. Project |
| Series 2017 |
| 05/15/2047 | 5.250% | | 2,200,000 | 2,208,494 |
| Nevada 1.0% |
| City of Carson City |
| Revenue Bonds |
| Carson Tahoe Regional Medical Center |
| Series 2017 |
| 09/01/2047 | 5.000% | | 455,000 | 478,424 |
| City of Reno(a),(b) |
| Refunding Revenue Bonds |
| Retrac-Reno Transportation Rail Access Corridor Project |
| Series 2018 |
| 07/01/2058 | 0.000% | | 17,500,000 | 2,057,923 |
| State of Nevada Department of Business & Industry(b) |
| Revenue Bonds |
| Somerset Academy |
| Series 2015A |
| 12/15/2045 | 5.125% | | 2,515,000 | 2,584,010 |
| Series 2018A |
| 12/15/2048 | 5.000% | | 1,500,000 | 1,533,585 |
| Total | 6,653,942 |
| New Hampshire 0.7% |
| New Hampshire Business Finance Authority(b) |
| Revenue Bonds |
| The Vista Project |
| Series 2019A |
| 07/01/2054 | 5.750% | | 3,750,000 | 3,749,673 |
The accompanying Notes to Financial Statements are an integral part of this statement.
| 14 | Columbia High Yield Municipal Fund | Annual Report 2022 |
Portfolio of Investments (continued)
May 31, 2022
| Municipal Bonds (continued) |
| Issue Description | Coupon
Rate | | Principal
Amount ($) | Value ($) |
| New Hampshire Health and Education Facilities Authority Act(d) |
| Revenue Bonds |
| Hillside Village |
| Series 2017A |
| 07/01/2052 | 0.000% | | 2,500,000 | 1,000,000 |
| Total | 4,749,673 |
| New Jersey 3.5% |
| Middlesex County Improvement Authority(d) |
| Revenue Bonds |
| Heldrich Center Hotel |
| Series 2005C |
| 01/01/2037 | 0.000% | | 1,250,000 | 13 |
| New Jersey Economic Development Authority |
| Prerefunded 06/15/24 Revenue Bonds |
| School Facilities Construction |
| Series 2014UU |
| 06/15/2040 | 5.000% | | 280,000 | 297,035 |
| Prerefunded 06/15/25 Revenue Bonds |
| Series 2015WW |
| 06/15/2040 | 5.250% | | 25,000 | 27,335 |
| Revenue Bonds |
| School Facilities Construction |
| Series 2019 |
| 06/15/2044 | 5.000% | | 1,200,000 | 1,296,199 |
| Unrefunded Revenue Bonds |
| School Facilities Construction |
| Series 2014UU |
| 06/15/2040 | 5.000% | | 1,220,000 | 1,251,722 |
| Series 2015WW |
| 06/15/2040 | 5.250% | | 350,000 | 365,825 |
| New Jersey Economic Development Authority(c) |
| Revenue Bonds |
| UMM Energy Partners LLC |
| Series 2012A |
| 06/15/2043 | 5.125% | | 2,000,000 | 2,002,390 |
| New Jersey Higher Education Student Assistance Authority(c) |
| Revenue Bonds |
| Subordinated Series 2013-1B |
| 12/01/2043 | 4.750% | | 5,000,000 | 5,027,760 |
| New Jersey Transportation Trust Fund Authority |
| Refunding Revenue Bonds |
| Transportation System |
| Series 2018A |
| 12/15/2036 | 5.000% | | 2,500,000 | 2,704,826 |
| Series 2019 |
| 12/15/2039 | 5.000% | | 640,000 | 696,892 |
| Revenue Bonds |
| Transportation Program |
| Series 2015AA |
| 06/15/2045 | 5.000% | | 1,750,000 | 1,805,818 |
| Municipal Bonds (continued) |
| Issue Description | Coupon
Rate | | Principal
Amount ($) | Value ($) |
| Series 2019 |
| 06/15/2046 | 5.000% | | 5,000,000 | 5,323,463 |
| South Jersey Port Corp.(c) |
| Revenue Bonds |
| Marine Terminal |
| Subordinated Series 2017B |
| 01/01/2048 | 5.000% | | 600,000 | 620,615 |
| Tobacco Settlement Financing Corp. |
| Refunding Revenue Bonds |
| Series 2018A |
| 06/01/2046 | 5.000% | | 835,000 | 885,528 |
| Subordinated Series 2018B |
| 06/01/2046 | 5.000% | | 1,025,000 | 1,053,845 |
| Total | 23,359,266 |
| New York 4.1% |
| Build NYC Resource Corp. |
| Revenue Bonds |
| International Leadership Charter School |
| Series 2013 |
| 07/01/2043 | 6.000% | | 4,330,000 | 4,366,625 |
| Build NYC Resource Corp.(b) |
| Revenue Bonds |
| International Leadership Charter School |
| Series 2016 |
| 07/01/2046 | 6.250% | | 765,000 | 788,488 |
| Glen Cove Local Economic Assistance Corp.(f) |
| Revenue Bonds |
| Garvies Point |
| Series 2016 CABS |
| 01/01/2055 | 0.000% | | 2,500,000 | 2,324,853 |
| Huntington Local Development Corp. |
| Revenue Bonds |
| Fountaingate Garden Project |
| Series 2021A |
| 07/01/2056 | 5.250% | | 250,000 | 243,414 |
| Jefferson County Industrial Development Agency(b),(c) |
| Revenue Bonds |
| ReEnergy Black River LLC P |
| Series 2019 |
| 01/01/2024 | 5.250% | | 1,620,000 | 1,547,888 |
| Metropolitan Transportation Authority |
| Revenue Bonds |
| Green Bonds |
| Series 2020C-1 |
| 11/15/2055 | 5.250% | | 4,000,000 | 4,317,857 |
| Nassau County Tobacco Settlement Corp.(a) |
| Asset-Backed Revenue Bonds |
| Capital Appreciation |
| Third Series 2006D |
| 06/01/2060 | 0.000% | | 25,000,000 | 1,503,745 |
The accompanying Notes to Financial Statements are an integral part of this statement.
Columbia High Yield Municipal Fund | Annual Report 2022
| 15 |
Portfolio of Investments (continued)
May 31, 2022
| Municipal Bonds (continued) |
| Issue Description | Coupon
Rate | | Principal
Amount ($) | Value ($) |
| New York Transportation Development Corp.(c) |
| Refunding Revenue Bonds |
| John F. Kennedy International Airport Project |
| Series 2020 |
| 08/01/2036 | 5.375% | | 1,250,000 | 1,356,457 |
| Revenue Bonds |
| Delta Air Lines, Inc. LaGuardia |
| Series 2020 |
| 10/01/2040 | 5.000% | | 5,500,000 | 5,689,382 |
| 10/01/2045 | 4.375% | | 2,500,000 | 2,402,599 |
| Westchester County Local Development Corp.(b) |
| Revenue Bonds |
| Purchase Senior Learning Community |
| Series 2021 |
| 07/01/2056 | 5.000% | | 3,000,000 | 2,800,561 |
| Total | 27,341,869 |
| North Carolina 2.4% |
| Durham Housing Authority |
| Prerefunded 01/31/23 Revenue Bonds |
| Magnolia Pointe Apartments |
| Series 2005 |
| 02/01/2038 | 5.650% | | 2,834,316 | 2,906,842 |
| North Carolina Medical Care Commission |
| Refunding Revenue Bonds |
| Sharon Towers |
| Series 2019 |
| 07/01/2049 | 5.000% | | 3,500,000 | 3,564,595 |
| United Methodist Retirement Homes |
| Series 2016 |
| 10/01/2035 | 5.000% | | 1,000,000 | 1,049,895 |
| Revenue Bonds |
| Lutheran Services for the Aging |
| Series 2021 |
| 03/01/2051 | 4.000% | | 1,500,000 | 1,162,464 |
| Novant Health Obligated Group |
| Series 2019A |
| 11/01/2052 | 4.000% | | 2,815,000 | 2,824,473 |
| North Carolina Turnpike Authority |
| Revenue Bonds |
| Senior Lien - Triangle Expressway |
| Series 2019 |
| 01/01/2049 | 5.000% | | 2,000,000 | 2,113,763 |
| Triangle Expressway System Senior Lien Turnpike |
| Series 2019 |
| 01/01/2055 | 4.000% | | 1,400,000 | 1,304,252 |
| North Carolina Turnpike Authority(a) |
| Revenue Bonds |
| Triangle Expressway System Appropriation |
| Series 2019 |
| 01/01/2049 | 0.000% | | 2,500,000 | 841,596 |
| Total | 15,767,880 |
| Municipal Bonds (continued) |
| Issue Description | Coupon
Rate | | Principal
Amount ($) | Value ($) |
| Ohio 3.5% |
| Buckeye Tobacco Settlement Financing Authority |
| Refunding Senior Revenue Bonds |
| Series 2020B-2 |
| 06/01/2055 | 5.000% | | 16,670,000 | 16,922,315 |
| County of Marion |
| Refunding Revenue Bonds |
| United Church Homes, Inc. |
| Series 2019 |
| 12/01/2049 | 5.125% | | 1,875,000 | 1,876,753 |
| Hickory Chase Community Authority(b) |
| Refunding Revenue Bonds |
| Hickory Chase Project |
| Series 2019 |
| 12/01/2040 | 5.000% | | 1,395,000 | 1,340,444 |
| Lake County Port & Economic Development Authority(b),(d) |
| Revenue Bonds |
| 1st Mortgage - Tapestry Wickliffe LLC |
| Series 2017 |
| 12/01/2052 | 0.000% | | 5,600,000 | 1,904,000 |
| Ohio Air Quality Development Authority(c) |
| Revenue Bonds |
| Ohio Valley Electric Crop. |
| Series 2019 (Mandatory Put 10/01/29) |
| 06/01/2041 | 2.600% | | 500,000 | 464,481 |
| Ohio Air Quality Development Authority(b),(c) |
| Revenue Bonds |
| Pratt Paper LLC Project |
| Series 2017 |
| 01/15/2048 | 4.500% | | 500,000 | 500,962 |
| Total | 23,008,955 |
| Oregon 1.0% |
| Clackamas County Hospital Facility Authority |
| Revenue Bonds |
| Mary’s Woods at Marylhurst, Inc. |
| Series 2018 |
| 05/15/2052 | 5.000% | | 1,000,000 | 928,342 |
| Hospital Facilities Authority of Multnomah County |
| Refunding Revenue Bonds |
| Mirabella at South Waterfront |
| Series 2014A |
| 10/01/2049 | 5.500% | | 3,115,000 | 3,170,561 |
| State of Oregon Housing & Community Services Department |
| Revenue Bonds |
| Single Family Mortgage Program |
| Series 2018C |
| 07/01/2043 | 3.950% | | 965,000 | 976,960 |
The accompanying Notes to Financial Statements are an integral part of this statement.
| 16 | Columbia High Yield Municipal Fund | Annual Report 2022 |
Portfolio of Investments (continued)
May 31, 2022
| Municipal Bonds (continued) |
| Issue Description | Coupon
Rate | | Principal
Amount ($) | Value ($) |
| Yamhill County Hospital Authority |
| Refunding Revenue Bonds |
| Friendsview |
| Series 2021A |
| 11/15/2056 | 5.000% | | 1,500,000 | 1,367,452 |
| Total | 6,443,315 |
| Pennsylvania 3.4% |
| Allentown Neighborhood Improvement Zone Development Authority(b),(e) |
| Revenue Bonds |
| City Center Project |
| Subordinated Series 2022 |
| 05/01/2042 | 5.250% | | 3,000,000 | 3,015,945 |
| Commonwealth Financing Authority |
| Revenue Bonds |
| Tobacco Master Settlement Payment |
| Series 2018 (AGM) |
| 06/01/2039 | 4.000% | | 1,365,000 | 1,398,795 |
| Commonwealth of Pennsylvania |
| Refunding Certificate of Participation |
| Series 2018A |
| 07/01/2046 | 4.000% | | 2,500,000 | 2,484,338 |
| Dauphin County Industrial Development Authority(c) |
| Revenue Bonds |
| Dauphin Consolidated Water Supply |
| Series 1992A |
| 06/01/2024 | 6.900% | | 3,200,000 | 3,487,855 |
| Franklin County Industrial Development Authority |
| Refunding Revenue Bonds |
| Menno-Haven, Inc. Project |
| Series 2018 |
| 12/01/2053 | 5.000% | | 1,900,000 | 1,821,566 |
| Montgomery County Industrial Development Authority |
| Refunding Revenue Bonds |
| Meadowood Senior Living Project |
| Series 2018 |
| 12/01/2048 | 5.000% | | 1,000,000 | 1,040,400 |
| Northampton County Industrial Development Authority |
| Refunding Revenue Bonds |
| Morningstar Senior Living, Inc. Project |
| Series 2019 |
| 11/01/2049 | 5.000% | | 1,600,000 | 1,535,409 |
| Pennsylvania Economic Development Financing Authority(b),(d) |
| Refunding Revenue Bonds |
| Tapestry Moon Senior Housing Project |
| Series 2018 |
| 12/01/2053 | 0.000% | | 2,750,000 | 1,100,000 |
| Pennsylvania Economic Development Financing Authority(c) |
| Revenue Bonds |
| PA Bridges Finco LP |
| Series 2015 |
| 12/31/2038 | 5.000% | | 1,650,000 | 1,710,656 |
| Municipal Bonds (continued) |
| Issue Description | Coupon
Rate | | Principal
Amount ($) | Value ($) |
| Philadelphia Authority for Industrial Development |
| Revenue Bonds |
| 1st Philadelphia Preparatory Charter School |
| Series 2014 |
| 06/15/2033 | 7.000% | | 1,870,000 | 2,009,348 |
| Scranton School District |
| Limited General Obligation Refunding Bonds |
| Series 2017D (NPFGC) |
| 06/01/2037 | 4.250% | | 1,750,000 | 1,790,150 |
| Series 2017E (BAM) |
| 12/01/2037 | 4.000% | | 1,000,000 | 1,031,484 |
| Total | 22,425,946 |
| Puerto Rico 6.3% |
| Commonwealth of Puerto Rico(a),(g) |
| Revenue Notes |
| Subordinated Series 2022 |
| 11/01/2043 | 0.000% | | 2,514,727 | 1,301,371 |
| Unlimited General Obligation Bonds |
| Series 2021A |
| 07/01/2024 | 0.000% | | 259,072 | 238,079 |
| Commonwealth of Puerto Rico(g) |
| Unlimited General Obligation Bonds |
| Series 2021-A1 |
| 07/01/2031 | 5.750% | | 1,631,118 | 1,843,965 |
| 07/01/2033 | 4.000% | | 503,640 | 492,590 |
| 07/01/2035 | 4.000% | | 452,705 | 436,575 |
| 07/01/2037 | 4.000% | | 388,540 | 374,563 |
| 07/01/2041 | 4.000% | | 528,266 | 499,850 |
| 07/01/2046 | 4.000% | | 1,719,389 | 1,601,382 |
| Puerto Rico Commonwealth Aqueduct & Sewer Authority(g) |
| Refunding Revenue Bonds |
| Senior Lien |
| Series 2020A |
| 07/01/2047 | 5.000% | | 3,000,000 | 3,110,856 |
| Puerto Rico Electric Power Authority(d),(g) |
| Revenue Bonds |
| Series 2007TT |
| 07/01/2037 | 0.000% | | 2,000,000 | 1,855,000 |
| Series 2010XX |
| 07/01/2040 | 0.000% | | 8,500,000 | 7,926,250 |
| Puerto Rico Highway & Transportation Authority(d),(g) |
| Revenue Bonds |
| Series 2005K |
| 07/01/2030 | 0.000% | | 1,000,000 | 550,000 |
| Series 2007M |
| 07/01/2037 | 0.000% | | 3,055,000 | 1,680,250 |
| Unrefunded Revenue Bonds |
| Series 2003G |
| 07/01/2042 | 0.000% | | 1,000,000 | 550,000 |
The accompanying Notes to Financial Statements are an integral part of this statement.
Columbia High Yield Municipal Fund | Annual Report 2022
| 17 |
Portfolio of Investments (continued)
May 31, 2022
| Municipal Bonds (continued) |
| Issue Description | Coupon
Rate | | Principal
Amount ($) | Value ($) |
| Puerto Rico Sales Tax Financing Corp.(a),(g) |
| Revenue Bonds |
| Series 2018A-1 |
| 07/01/2046 | 0.000% | | 44,000,000 | 13,332,946 |
| Puerto Rico Sales Tax Financing Corp.(g) |
| Revenue Bonds |
| Series 2019A1 |
| 07/01/2058 | 5.000% | | 6,000,000 | 6,100,294 |
| Total | 41,893,971 |
| South Carolina 2.2% |
| South Carolina Jobs-Economic Development Authority |
| Prerefunded 11/01/24 Revenue Bonds |
| York Preparatory Academy Project |
| Series 2014A |
| 11/01/2045 | 7.250% | | 4,000,000 | 4,470,862 |
| Revenue Bonds |
| Lutheran Homes of South Carolina, Inc. Obligation Group |
| Series 2013 |
| 05/01/2043 | 5.000% | | 750,000 | 664,528 |
| 05/01/2048 | 5.125% | | 1,500,000 | 1,319,523 |
| South Carolina Jobs-Economic Development Authority(b),(c) |
| Revenue Bonds |
| Green Bonds - Last Step Recycling Project |
| Series 2021 |
| 06/01/2051 | 6.500% | | 3,000,000 | 2,524,564 |
| South Carolina Public Service Authority |
| Revenue Bonds |
| Series 2022A |
| 12/01/2052 | 4.000% | | 6,000,000 | 5,878,923 |
| Total | 14,858,400 |
| Tennessee 0.5% |
| Shelby County Health Educational & Housing Facilities Board |
| Revenue Bonds |
| Farms at Bailey Station Project (The) |
| Series 2019 |
| 10/01/2059 | 5.750% | | 3,750,000 | 3,380,692 |
| Texas 6.8% |
| Angelina & Neches River Authority(b),(c) |
| Revenue Bonds |
| Jefferson Enterprise Energy LLC Project |
| Series 2021 |
| 12/01/2045 | 7.500% | | 3,000,000 | 2,522,594 |
| Arlington Higher Education Finance Corp. |
| Refunding Revenue Bonds |
| Legacy Traditional Schools |
| Series 2021 |
| 02/15/2056 | 4.500% | | 2,330,000 | 1,839,303 |
| Municipal Bonds (continued) |
| Issue Description | Coupon
Rate | | Principal
Amount ($) | Value ($) |
| Revenue Bonds |
| Brooks Academies of Texas |
| Series 2021 |
| 01/15/2051 | 5.000% | | 2,625,000 | 2,471,885 |
| City of Houston Airport System(c) |
| Refunding Revenue Bonds |
| United Airlines, Inc. Airport Improvement Projects |
| Series 2020 |
| 07/15/2027 | 5.000% | | 2,350,000 | 2,432,359 |
| Revenue Bonds |
| United Airlines, Inc. Terminal Improvement Projects |
| Series 2021 |
| 07/15/2041 | 4.000% | | 2,850,000 | 2,537,117 |
| Clifton Higher Education Finance Corp. |
| Revenue Bonds |
| International Leadership of Texas |
| Series 2015 |
| 08/15/2045 | 5.750% | | 3,500,000 | 3,657,543 |
| New Hope Cultural Education Facilities Finance Corp.(d) |
| Revenue Bonds |
| Bridgemoor Plano Project |
| Series 2018 |
| 12/01/2053 | 0.000% | | 3,500,000 | 3,150,000 |
| Cardinal Bay, Inc. - Village on the Park/Carriage Inn Project |
| Series 2016 |
| 07/01/2046 | 0.000% | | 1,630,000 | 896,500 |
| Series 2016A-1 |
| 07/01/2046 | 0.000% | | 950,000 | 712,500 |
| New Hope Cultural Education Facilities Finance Corp.(b) |
| Revenue Bonds |
| Cumberland Academy Project |
| Series 2020A |
| 08/15/2050 | 5.000% | | 1,000,000 | 1,009,346 |
| New Hope Cultural Education Facilities Finance Corp. |
| Revenue Bonds |
| NCCD-College Station Properties LLC |
| Series 2015 |
| 07/01/2035 | 5.000% | | 1,000,000 | 950,000 |
| Series 2015A |
| 07/01/2047 | 5.000% | | 1,000,000 | 950,000 |
| Westminster Project |
| Series 2021 |
| 11/01/2055 | 4.000% | | 500,000 | 450,610 |
| Port Beaumont Navigation District(b),(c) |
| Refunding Revenue Bonds |
| Jefferson Gulf Coast Energy Project |
| Series 2020A |
| 01/01/2050 | 4.000% | | 2,000,000 | 1,665,766 |
The accompanying Notes to Financial Statements are an integral part of this statement.
| 18 | Columbia High Yield Municipal Fund | Annual Report 2022 |
Portfolio of Investments (continued)
May 31, 2022
| Municipal Bonds (continued) |
| Issue Description | Coupon
Rate | | Principal
Amount ($) | Value ($) |
| Revenue Bonds |
| Jefferson Gulf Coast Energy Project |
| Series 2021 |
| 01/01/2050 | 3.000% | | 1,750,000 | 1,162,355 |
| Pottsboro Higher Education Finance Corp. |
| Revenue Bonds |
| Series 2016A |
| 08/15/2046 | 5.000% | | 1,000,000 | 1,002,555 |
| Red River Health Facilities Development Corp. |
| Prerefunded 11/15/24 Revenue Bonds |
| MRC Crossings Project |
| Series 2014A |
| 11/15/2049 | 8.000% | | 2,000,000 | 2,276,256 |
| Sanger Industrial Development Corp.(b),(c),(d) |
| Revenue Bonds |
| Texas Pellets Project |
| Series 2012B |
| 07/01/2038 | 0.000% | | 4,950,000 | 1,237,500 |
| Tarrant County Cultural Education Facilities Finance Corp.(d) |
| Revenue Bonds |
| CC Young Memorial Home |
| Series 2009A |
| 02/15/2038 | 0.000% | | 3,000,000 | 2,010,000 |
| Texas Private Activity Bond Surface Transportation Corp.(c) |
| Revenue Bonds |
| Segment 3C Project |
| Series 2019 |
| 06/30/2058 | 5.000% | | 6,300,000 | 6,562,538 |
| Senior Lien - Blueridge Transportation Group LLC |
| Series 2016 |
| 12/31/2040 | 5.000% | | 1,250,000 | 1,290,830 |
| 12/31/2055 | 5.000% | | 3,515,000 | 3,600,792 |
| Texas Transportation Commission |
| Revenue Bonds |
| State Highway 249 System Toll |
| Series 2019 |
| 08/01/2057 | 5.000% | | 500,000 | 523,108 |
| Total | 44,911,457 |
| Utah 1.9% |
| Black Desert Public Infrastructure District(b) |
| Limited General Obligation Bonds |
| Senior Bonds |
| Series 2021A |
| 03/01/2051 | 4.000% | | 3,000,000 | 2,468,145 |
| Mida Golf and Equestrian Center Public Infrastructure District(b) |
| Limited General Obligation Bonds |
| Series 2021 |
| 06/01/2057 | 4.625% | | 3,000,000 | 2,403,005 |
| Municipal Bonds (continued) |
| Issue Description | Coupon
Rate | | Principal
Amount ($) | Value ($) |
| Red Bridge Public Infrastructure District No. 1(b) |
| Limited General Obligation Bonds |
| Series 2021-1A |
| 02/01/2041 | 4.125% | | 500,000 | 421,769 |
| 02/01/2051 | 4.375% | | 1,100,000 | 910,012 |
| Subordinated Series 2021B |
| 08/15/2051 | 7.375% | | 600,000 | 513,551 |
| UIPA Crossroads Public Infrastructure District(b) |
| Tax Allocation Bonds |
| Series 2021 |
| 06/01/2052 | 4.375% | | 4,000,000 | 3,317,063 |
| Utah Charter School Finance Authority(b) |
| Revenue Bonds |
| Ascent Academies Charter Schools |
| Series 2022 |
| 06/15/2057 | 5.000% | | 3,000,000 | 2,678,789 |
| Total | 12,712,334 |
| Virginia 3.3% |
| City of Chesapeake Expressway Toll Road(f) |
| Refunding Revenue Bonds |
| Transportation System |
| Series 2012 |
| 07/15/2040 | 0.000% | | 7,530,000 | 7,687,589 |
| Hanover County Economic Development Authority |
| Refunding Revenue Bonds |
| Covenant Woods |
| Series 2018 |
| 07/01/2051 | 5.000% | | 1,200,000 | 1,219,851 |
| Tobacco Settlement Financing Corp. |
| Revenue Bonds |
| Senior Series 2007B-1 |
| 06/01/2047 | 5.000% | | 5,000,000 | 5,007,935 |
| Virginia Small Business Financing Authority(c) |
| Revenue Bonds |
| Transform 66 P3 Project |
| Series 2017 |
| 12/31/2052 | 5.000% | | 7,925,000 | 8,223,695 |
| Total | 22,139,070 |
| Washington 4.2% |
| King County Housing Authority |
| Refunding Revenue Bonds |
| Series 2018 |
| 05/01/2038 | 3.750% | | 3,295,000 | 3,332,807 |
| King County Public Hospital District No. 4 |
| Revenue Bonds |
| Series 2015A |
| 12/01/2035 | 6.000% | | 1,250,000 | 1,307,171 |
| 12/01/2045 | 6.250% | | 2,500,000 | 2,626,524 |
The accompanying Notes to Financial Statements are an integral part of this statement.
Columbia High Yield Municipal Fund | Annual Report 2022
| 19 |
Portfolio of Investments (continued)
May 31, 2022
| Municipal Bonds (continued) |
| Issue Description | Coupon
Rate | | Principal
Amount ($) | Value ($) |
| Tacoma Consolidated Local Improvement Districts |
| Special Assessment Bonds |
| No. 65 |
| Series 2013 |
| 04/01/2043 | 5.750% | | 1,220,000 | 1,203,813 |
| Washington State Convention Center Public Facilities District |
| Revenue Bonds |
| Junior Lodging Tax Green Notes |
| Series 2021 |
| 07/01/2031 | 4.000% | | 6,000,000 | 5,731,953 |
| Washington State Housing Finance Commission(b) |
| Prerefunded 10/03/22 Revenue Bonds |
| Nonprofit Housing-Mirabella |
| Series 2012 |
| 10/01/2047 | 6.750% | | 5,000,000 | 5,086,923 |
| Revenue Bonds |
| Heron’s Key |
| Series 2015A |
| 07/01/2050 | 7.000% | | 4,850,000 | 5,084,034 |
| Transforming Age Projects |
| Series 2019A |
| 01/01/2055 | 5.000% | | 3,800,000 | 3,507,957 |
| Total | 27,881,182 |
| Wisconsin 4.3% |
| Public Finance Authority |
| Refunding Revenue Bonds |
| Friends Homes |
| Series 2019 |
| 09/01/2054 | 5.000% | | 2,665,000 | 2,652,101 |
| WakeMed Hospital |
| Series 2019A |
| 10/01/2049 | 4.000% | | 4,310,000 | 4,185,313 |
| Public Finance Authority(b) |
| Refunding Revenue Bonds |
| Mary’s Woods at Marylhurst, Inc. |
| Series 2017 |
| 05/15/2052 | 5.250% | | 2,300,000 | 2,209,450 |
| Revenue Bonds |
| Wonderful Foundations Charter School Portfolio Projects |
| Series 2020 |
| 01/01/2055 | 5.000% | | 2,500,000 | 2,343,705 |
| Public Finance Authority(c) |
| Revenue Bonds |
| Sky Harbour Capital LLC Aviation Facilities Project |
| Series 2021 |
| 07/01/2054 | 4.250% | | 5,000,000 | 4,398,745 |
| Municipal Bonds (continued) |
| Issue Description | Coupon
Rate | | Principal
Amount ($) | Value ($) |
| Wisconsin Center District(a) |
| Revenue Bonds |
| Junior Dedicated |
| Series 2020D (AGM) |
| 12/15/2060 | 0.000% | | 18,000,000 | 3,317,803 |
| Wisconsin Health & Educational Facilities Authority |
| Refunding Revenue Bonds |
| Cedar Crest, Inc. Project |
| Series 2022 |
| 04/01/2057 | 5.125% | | 3,000,000 | 2,637,751 |
| St. Camillus Health System, Inc. |
| Series 2019 |
| 11/01/2054 | 5.000% | | 3,000,000 | 2,943,210 |
| Revenue Bonds |
| Covenant Communities, Inc. Project |
| Series 2018B |
| 07/01/2053 | 5.000% | | 900,000 | 653,741 |
| PHW Muskego, Inc. Project |
| Series 2021 |
| 10/01/2061 | 4.000% | | 4,000,000 | 3,122,336 |
| Total | 28,464,155 |
Total Municipal Bonds
(Cost $700,852,392) | 653,584,508 |
| Money Market Funds 0.7% |
| | Shares | Value ($) |
| Dreyfus Tax Exempt Cash Management Fund, Institutional Shares, 0.666%(h) | 105,406 | 105,395 |
| JPMorgan Institutional Tax Free Money Market Fund, Institutional Shares, 0.606%(h) | 4,516,860 | 4,516,860 |
Total Money Market Funds
(Cost $4,622,266) | 4,622,255 |
Total Investments in Securities
(Cost $705,474,658) | 658,206,763 |
| Other Assets & Liabilities, Net | | 4,635,400 |
| Net Assets | $662,842,163 |
At May 31, 2022, securities and/or cash totaling $813,561 were pledged as collateral.
The accompanying Notes to Financial Statements are an integral part of this statement.
| 20 | Columbia High Yield Municipal Fund | Annual Report 2022 |
Portfolio of Investments (continued)
May 31, 2022
Investments in derivatives
| Short futures contracts |
| Description | Number of
contracts | Expiration
date | Trading
currency | Notional
amount | Value/Unrealized
appreciation ($) | Value/Unrealized
depreciation ($) |
| U.S. Treasury 10-Year Note | (416) | 09/2022 | USD | (49,692,500) | 109,862 | — |
Notes to Portfolio of Investments
| (a) | Zero coupon bond. |
| (b) | Represents privately placed and other securities and instruments exempt from Securities and Exchange Commission registration (collectively, private placements), such as Section 4(a)(2) and Rule 144A eligible securities, which are often sold only to qualified institutional buyers. At May 31, 2022, the total value of these securities amounted to $149,507,250, which represents 22.56% of total net assets. |
| (c) | Income from this security may be subject to alternative minimum tax. |
| (d) | Represents securities that have defaulted on payment of interest. The Fund has stopped accruing interest on these securities. At May 31, 2022, the total value of these securities amounted to $28,637,463, which represents 4.32% of total net assets. |
| (e) | Represents a security purchased on a when-issued basis. |
| (f) | Represents a variable rate security with a step coupon where the rate adjusts according to a schedule for a series of periods, typically lower for an initial period and then increasing to a higher coupon rate thereafter. The interest rate shown was the current rate as of May 31, 2022. |
| (g) | Municipal obligations include debt obligations issued by or on behalf of territories, possessions, or sovereign nations within the territorial boundaries of the United States. At May 31, 2022, the total value of these securities amounted to $41,893,971, which represents 6.32% of total net assets. |
| (h) | The rate shown is the seven-day current annualized yield at May 31, 2022. |
Abbreviation Legend
| AGM | Assured Guaranty Municipal Corporation |
| BAM | Build America Mutual Assurance Co. |
| NPFGC | National Public Finance Guarantee Corporation |
Currency Legend
Fair value measurements
The Fund categorizes its fair value measurements according to a three-level hierarchy that maximizes the use of observable inputs and minimizes the use of unobservable inputs by prioritizing that the most observable input be used when available. Observable inputs are those that market participants would use in pricing an investment based on market data obtained from sources independent of the reporting entity. Unobservable inputs are those that reflect the Fund’s assumptions about the information market participants would use in pricing an investment. An investment’s level within the fair value hierarchy is based on the lowest level of any input that is deemed significant to the asset’s or liability’s fair value measurement. The input levels are not necessarily an indication of the risk or liquidity associated with investments at that level. For example, certain U.S. government securities are generally high quality and liquid, however, they are reflected as Level 2 because the inputs used to determine fair value may not always be quoted prices in an active market.
Fair value inputs are summarized in the three broad levels listed below:
| ■ | Level 1 — Valuations based on quoted prices for investments in active markets that the Fund has the ability to access at the measurement date. Valuation adjustments are not applied to Level 1 investments. |
| ■ | Level 2 — Valuations based on other significant observable inputs (including quoted prices for similar securities, interest rates, prepayment speeds, credit risks, etc.). |
| ■ | Level 3 — Valuations based on significant unobservable inputs (including the Fund’s own assumptions and judgment in determining the fair value of investments). |
Inputs that are used in determining fair value of an investment may include price information, credit data, volatility statistics, and other factors. These inputs can be either observable or unobservable. The availability of observable inputs can vary between investments, and is affected by various factors such as the type of investment, and the volume and level of activity for that investment or similar investments in the marketplace. The inputs will be considered by the Investment Manager, along with any other relevant factors in the calculation of an investment’s fair value. The Fund uses prices and inputs that are current as of the measurement date, which may include periods of market dislocations. During these periods, the availability of prices and inputs may be reduced for many investments. This condition could cause an investment to be reclassified between the various levels within the hierarchy.
Investments falling into the Level 3 category are primarily supported by quoted prices from brokers and dealers participating in the market for those investments. However, these may be classified as Level 3 investments due to lack of market transparency and corroboration to support these quoted prices. Additionally, valuation models may be used as the pricing source for any remaining investments classified as Level 3. These models may rely on one or more significant unobservable inputs and/or significant assumptions by the Investment Manager. Inputs used in valuations may include, but are not limited to, financial statement analysis, capital account balances, discount rates and estimated cash flows, and comparable company data.
Under the direction of the Fund’s Board of Trustees (the Board), the Investment Manager’s Valuation Committee (the Committee) is responsible for overseeing the valuation procedures approved by the Board. The Committee consists of voting and non-voting members from various groups within the Investment Manager’s organization, including operations and accounting, trading and investments, compliance, risk management and legal.
The accompanying Notes to Financial Statements are an integral part of this statement.
Columbia High Yield Municipal Fund | Annual Report 2022
| 21 |
Portfolio of Investments (continued)
May 31, 2022
Fair value measurements (continued)
The Committee meets at least monthly to review and approve valuation matters, which may include a description of specific valuation determinations, data regarding pricing information received from approved pricing vendors and brokers and the results of Board-approved valuation control policies and procedures (the Policies). The Policies address, among other things, instances when market quotations are or are not readily available, including recommendations of third party pricing vendors and a determination of appropriate pricing methodologies; events that require specific valuation determinations and assessment of fair value techniques; securities with a potential for stale pricing, including those that are illiquid, restricted, or in default; and the effectiveness of third party pricing vendors, including periodic reviews of vendors. The Committee meets more frequently, as needed, to discuss additional valuation matters, which may include the need to review back-testing results, review time-sensitive information or approve related valuation actions. The Committee reports to the Board, with members of the Committee meeting with the Board at each of its regularly scheduled meetings to discuss valuation matters and actions during the period, similar to those described earlier.
The following table is a summary of the inputs used to value the Fund’s investments at May 31, 2022:
| | Level 1 ($) | Level 2 ($) | Level 3 ($) | Total ($) |
| Investments in Securities | | | | |
| Municipal Bonds | — | 653,584,508 | — | 653,584,508 |
| Money Market Funds | 4,622,255 | — | — | 4,622,255 |
| Total Investments in Securities | 4,622,255 | 653,584,508 | — | 658,206,763 |
| Investments in Derivatives | | | | |
| Asset | | | | |
| Futures Contracts | 109,862 | — | — | 109,862 |
| Total | 4,732,117 | 653,584,508 | — | 658,316,625 |
See the Portfolio of Investments for all investment classifications not indicated in the table.
The Fund’s assets assigned to the Level 2 input category are generally valued using the market approach, in which a security’s value is determined through reference to prices and information from market transactions for similar or identical assets.
The accompanying Notes to Financial Statements are an integral part of this statement.
| 22 | Columbia High Yield Municipal Fund | Annual Report 2022 |
Statement of Assets and Liabilities
May 31, 2022
| Assets | |
| Investments in securities, at value | |
| Unaffiliated issuers (cost $705,474,658) | $658,206,763 |
| Cash | 14,320 |
| Margin deposits on: | |
| Futures contracts | 813,561 |
| Receivable for: | |
| Investments sold | 3,961 |
| Capital shares sold | 8,336,817 |
| Interest | 10,047,950 |
| Variation margin for futures contracts | 286,000 |
| Expense reimbursement due from Investment Manager | 1,892 |
| Prepaid expenses | 5,706 |
| Trustees’ deferred compensation plan | 168,760 |
| Total assets | 677,885,730 |
| Liabilities | |
| Payable for: | |
| Investments purchased | 1,700,000 |
| Investments purchased on a delayed delivery basis | 8,845,530 |
| Capital shares purchased | 1,692,120 |
| Distributions to shareholders | 2,503,898 |
| Management services fees | 38,528 |
| Distribution and/or service fees | 6,295 |
| Transfer agent fees | 45,698 |
| Compensation of board members | 13,042 |
| Other expenses | 29,696 |
| Trustees’ deferred compensation plan | 168,760 |
| Total liabilities | 15,043,567 |
| Net assets applicable to outstanding capital stock | $662,842,163 |
| Represented by | |
| Paid in capital | 715,692,712 |
| Total distributable earnings (loss) | (52,850,549) |
| Total - representing net assets applicable to outstanding capital stock | $662,842,163 |
The accompanying Notes to Financial Statements are an integral part of this statement.
Columbia High Yield Municipal Fund | Annual Report 2022
| 23 |
Statement of Assets and Liabilities (continued)
May 31, 2022
| Class A | |
| Net assets | $170,633,760 |
| Shares outstanding | 17,548,563 |
| Net asset value per share | $9.72 |
| Maximum sales charge | 3.00% |
| Maximum offering price per share (calculated by dividing the net asset value per share by 1.0 minus the maximum sales charge for Class A shares) | $10.02 |
| Advisor Class | |
| Net assets | $6,317,907 |
| Shares outstanding | 648,968 |
| Net asset value per share | $9.74 |
| Class C | |
| Net assets | $31,323,563 |
| Shares outstanding | 3,221,509 |
| Net asset value per share | $9.72 |
| Institutional Class | |
| Net assets | $435,399,675 |
| Shares outstanding | 44,770,007 |
| Net asset value per share | $9.73 |
| Institutional 2 Class | |
| Net assets | $15,595,574 |
| Shares outstanding | 1,605,115 |
| Net asset value per share | $9.72 |
| Institutional 3 Class | |
| Net assets | $3,571,684 |
| Shares outstanding | 366,428 |
| Net asset value per share | $9.75 |
The accompanying Notes to Financial Statements are an integral part of this statement.
| 24 | Columbia High Yield Municipal Fund | Annual Report 2022 |
Statement of Operations
Year Ended May 31, 2022
| Net investment income | |
| Income: | |
| Dividends — unaffiliated issuers | $71,920 |
| Interest | 32,152,750 |
| Total income | 32,224,670 |
| Expenses: | |
| Management services fees | 4,108,904 |
| Distribution and/or service fees | |
| Class A | 372,147 |
| Class C | 316,341 |
| Transfer agent fees | |
| Class A | 167,905 |
| Advisor Class | 10,746 |
| Class C | 33,492 |
| Institutional Class | 447,901 |
| Institutional 2 Class | 16,271 |
| Institutional 3 Class | 274 |
| Compensation of board members | 22,494 |
| Custodian fees | 15,588 |
| Printing and postage fees | 40,123 |
| Registration fees | 114,414 |
| Audit fees | 39,500 |
| Legal fees | 17,279 |
| Interest on interfund lending | 174 |
| Compensation of chief compliance officer | 238 |
| Other | 19,265 |
| Total expenses | 5,743,056 |
| Fees waived or expenses reimbursed by Investment Manager and its affiliates | (130,076) |
| Fees waived by distributor | |
| Class C | (19,939) |
| Expense reduction | (280) |
| Total net expenses | 5,592,761 |
| Net investment income | 26,631,909 |
| Realized and unrealized gain (loss) — net | |
| Net realized gain (loss) on: | |
| Investments — unaffiliated issuers | 4,060,284 |
| Futures contracts | (1,274,415) |
| Swap contracts | 44,000 |
| Net realized gain | 2,829,869 |
| Net change in unrealized appreciation (depreciation) on: | |
| Investments — unaffiliated issuers | (95,396,489) |
| Futures contracts | 109,862 |
| Net change in unrealized appreciation (depreciation) | (95,286,627) |
| Net realized and unrealized loss | (92,456,758) |
| Net decrease in net assets resulting from operations | $(65,824,849) |
The accompanying Notes to Financial Statements are an integral part of this statement.
Columbia High Yield Municipal Fund | Annual Report 2022
| 25 |
Statement of Changes in Net Assets
| | Year Ended
May 31, 2022 | Year Ended
May 31, 2021 |
| Operations | | |
| Net investment income | $26,631,909 | $25,776,900 |
| Net realized gain | 2,829,869 | 5,262,437 |
| Net change in unrealized appreciation (depreciation) | (95,286,627) | 70,691,298 |
| Net increase (decrease) in net assets resulting from operations | (65,824,849) | 101,730,635 |
| Distributions to shareholders | | |
| Net investment income and net realized gains | | |
| Class A | (6,545,320) | (5,872,368) |
| Advisor Class | (419,048) | (244,663) |
| Class C | (1,074,895) | (1,151,080) |
| Institutional Class | (18,387,335) | (17,593,184) |
| Institutional 2 Class | (1,078,421) | (704,547) |
| Institutional 3 Class | (116,993) | (86,549) |
| Total distributions to shareholders | (27,622,012) | (25,652,391) |
| Decrease in net assets from capital stock activity | (5,620,316) | (26,348,088) |
| Total increase (decrease) in net assets | (99,067,177) | 49,730,156 |
| Net assets at beginning of year | 761,909,340 | 712,179,184 |
| Net assets at end of year | $662,842,163 | $761,909,340 |
The accompanying Notes to Financial Statements are an integral part of this statement.
| 26 | Columbia High Yield Municipal Fund | Annual Report 2022 |
Statement of Changes in Net Assets (continued)
| | Year Ended | Year Ended |
| | May 31, 2022 | May 31, 2021 |
| | Shares | Dollars ($) | Shares | Dollars ($) |
| Capital stock activity |
| Class A | | | | |
| Subscriptions | 6,216,597 | 65,029,652 | 2,853,563 | 30,387,629 |
| Distributions reinvested | 530,683 | 5,630,466 | 480,604 | 5,121,662 |
| Redemptions | (5,688,814) | (58,747,218) | (3,354,098) | (35,485,829) |
| Net increase (decrease) | 1,058,466 | 11,912,900 | (19,931) | 23,462 |
| Advisor Class | | | | |
| Subscriptions | 898,273 | 9,787,737 | 919,240 | 9,941,448 |
| Distributions reinvested | 38,944 | 419,016 | 22,882 | 244,663 |
| Redemptions | (1,413,842) | (15,196,417) | (373,222) | (3,980,176) |
| Net increase (decrease) | (476,625) | (4,989,664) | 568,900 | 6,205,935 |
| Class C | | | | |
| Subscriptions | 579,322 | 6,155,222 | 294,753 | 3,140,014 |
| Distributions reinvested | 97,650 | 1,036,790 | 103,367 | 1,100,565 |
| Redemptions | (961,237) | (10,125,881) | (1,168,626) | (12,470,240) |
| Net decrease | (284,265) | (2,933,869) | (770,506) | (8,229,661) |
| Institutional Class | | | | |
| Subscriptions | 11,383,196 | 119,964,905 | 7,319,362 | 78,209,787 |
| Distributions reinvested | 880,460 | 9,357,049 | 806,706 | 8,595,131 |
| Redemptions | (12,574,266) | (131,029,954) | (11,425,971) | (121,783,718) |
| Net decrease | (310,610) | (1,708,000) | (3,299,903) | (34,978,800) |
| Institutional 2 Class | | | | |
| Subscriptions | 2,156,284 | 23,347,547 | 1,388,611 | 14,909,617 |
| Distributions reinvested | 100,582 | 1,077,861 | 65,998 | 704,467 |
| Redemptions | (3,171,988) | (33,446,833) | (512,393) | (5,411,970) |
| Net increase (decrease) | (915,122) | (9,021,425) | 942,216 | 10,202,114 |
| Institutional 3 Class | | | | |
| Subscriptions | 215,594 | 2,197,273 | 80,150 | 864,660 |
| Distributions reinvested | 10,868 | 115,100 | 7,986 | 85,449 |
| Redemptions | (116,383) | (1,192,631) | (49,186) | (521,247) |
| Net increase | 110,079 | 1,119,742 | 38,950 | 428,862 |
| Total net decrease | (818,077) | (5,620,316) | (2,540,274) | (26,348,088) |
The accompanying Notes to Financial Statements are an integral part of this statement.
Columbia High Yield Municipal Fund | Annual Report 2022
| 27 |
The following table is intended to help you understand the Fund’s financial performance. Certain information reflects financial results for a single share of a class held for the periods shown. Per share net investment income (loss) amounts are calculated based on average shares outstanding during the period. Total return assumes reinvestment of all dividends and distributions, if any. Total return does not reflect payment of sales charges, if any. Total return and portfolio turnover are not annualized for periods of less than one year. The portfolio turnover rate is calculated without regard to purchase and sales transactions of short-term instruments and certain derivatives, if any. If such transactions were included, the Fund’s portfolio turnover rate may be higher.
| | Net asset value,
beginning of
period | Net
investment
income | Net
realized
and
unrealized
gain (loss) | Total from
investment
operations | Distributions
from net
investment
income | Total
distributions to
shareholders |
| Class A |
| Year Ended 5/31/2022 | $11.04 | 0.37 | (1.31) | (0.94) | (0.38) | (0.38) |
| Year Ended 5/31/2021 | $9.96 | 0.36 | 1.08 | 1.44 | (0.36) | (0.36) |
| Year Ended 5/31/2020 | $10.74 | 0.42 | (0.77) | (0.35) | (0.43) | (0.43) |
| Year Ended 5/31/2019 | $10.56 | 0.43 | 0.23 | 0.66 | (0.48) | (0.48) |
| Year Ended 5/31/2018 | $10.64 | 0.43 | (0.05) | 0.38 | (0.46) | (0.46) |
| Advisor Class |
| Year Ended 5/31/2022 | $11.05 | 0.38 | (1.29) | (0.91) | (0.40) | (0.40) |
| Year Ended 5/31/2021 | $9.97 | 0.38 | 1.08 | 1.46 | (0.38) | (0.38) |
| Year Ended 5/31/2020 | $10.76 | 0.44 | (0.78) | (0.34) | (0.45) | (0.45) |
| Year Ended 5/31/2019 | $10.57 | 0.46 | 0.23 | 0.69 | (0.50) | (0.50) |
| Year Ended 5/31/2018 | $10.65 | 0.45 | (0.05) | 0.40 | (0.48) | (0.48) |
| Class C |
| Year Ended 5/31/2022 | $11.04 | 0.30 | (1.30) | (1.00) | (0.32) | (0.32) |
| Year Ended 5/31/2021 | $9.96 | 0.30 | 1.07 | 1.37 | (0.29) | (0.29) |
| Year Ended 5/31/2020 | $10.74 | 0.35 | (0.77) | (0.42) | (0.36) | (0.36) |
| Year Ended 5/31/2019 | $10.56 | 0.37 | 0.22 | 0.59 | (0.41) | (0.41) |
| Year Ended 5/31/2018 | $10.64 | 0.36 | (0.05) | 0.31 | (0.39) | (0.39) |
| Institutional Class |
| Year Ended 5/31/2022 | $11.05 | 0.39 | (1.31) | (0.92) | (0.40) | (0.40) |
| Year Ended 5/31/2021 | $9.96 | 0.38 | 1.09 | 1.47 | (0.38) | (0.38) |
| Year Ended 5/31/2020 | $10.75 | 0.44 | (0.78) | (0.34) | (0.45) | (0.45) |
| Year Ended 5/31/2019 | $10.56 | 0.46 | 0.23 | 0.69 | (0.50) | (0.50) |
| Year Ended 5/31/2018 | $10.64 | 0.45 | (0.05) | 0.40 | (0.48) | (0.48) |
| Institutional 2 Class |
| Year Ended 5/31/2022 | $11.04 | 0.39 | (1.30) | (0.91) | (0.41) | (0.41) |
| Year Ended 5/31/2021 | $9.95 | 0.39 | 1.08 | 1.47 | (0.38) | (0.38) |
| Year Ended 5/31/2020 | $10.74 | 0.44 | (0.77) | (0.33) | (0.46) | (0.46) |
| Year Ended 5/31/2019 | $10.55 | 0.46 | 0.23 | 0.69 | (0.50) | (0.50) |
| Year Ended 5/31/2018 | $10.63 | 0.45 | (0.04) | 0.41 | (0.49) | (0.49) |
The accompanying Notes to Financial Statements are an integral part of this statement.
| 28 | Columbia High Yield Municipal Fund | Annual Report 2022 |
Financial Highlights (continued)
| | Net
asset
value,
end of
period | Total
return | Total gross
expense
ratio to
average
net assets(a) | Total net
expense
ratio to
average
net assets(a),(b) | Net investment
income
ratio to
average
net assets | Portfolio
turnover | Net
assets,
end of
period
(000’s) |
| Class A |
| Year Ended 5/31/2022 | $9.72 | (8.75%) | 0.86%(c) | 0.85%(c),(d) | 3.39% | 30% | $170,634 |
| Year Ended 5/31/2021 | $11.04 | 14.64% | 0.87%(e) | 0.85%(d),(e) | 3.41% | 22% | $182,125 |
| Year Ended 5/31/2020 | $9.96 | (3.41%) | 0.88%(c),(e) | 0.87%(c),(d),(e) | 3.98% | 46% | $164,388 |
| Year Ended 5/31/2019 | $10.74 | 6.42% | 0.88% | 0.85%(d) | 4.16% | 35% | $172,655 |
| Year Ended 5/31/2018 | $10.56 | 3.68% | 0.88% | 0.85%(d) | 4.04% | 16% | $132,807 |
| Advisor Class |
| Year Ended 5/31/2022 | $9.74 | (8.47%) | 0.66%(c) | 0.65%(c),(d) | 3.46% | 30% | $6,318 |
| Year Ended 5/31/2021 | $11.05 | 14.86% | 0.68%(e) | 0.65%(d),(e) | 3.61% | 22% | $12,442 |
| Year Ended 5/31/2020 | $9.97 | (3.30%) | 0.68%(c),(e) | 0.67%(c),(d),(e) | 4.17% | 46% | $5,549 |
| Year Ended 5/31/2019 | $10.76 | 6.73% | 0.68% | 0.65%(d) | 4.35% | 35% | $5,318 |
| Year Ended 5/31/2018 | $10.57 | 3.89% | 0.68% | 0.65%(d) | 4.24% | 16% | $4,752 |
| Class C |
| Year Ended 5/31/2022 | $9.72 | (9.30%) | 1.52%(c) | 1.45%(c),(d) | 2.77% | 30% | $31,324 |
| Year Ended 5/31/2021 | $11.04 | 13.94% | 1.62%(e) | 1.47%(d),(e),(f) | 2.80% | 22% | $38,720 |
| Year Ended 5/31/2020 | $9.96 | (4.04%) | 1.63%(c),(e) | 1.52%(c),(d),(e),(f) | 3.34% | 46% | $42,578 |
| Year Ended 5/31/2019 | $10.74 | 5.73% | 1.63% | 1.50%(d),(f) | 3.50% | 35% | $51,214 |
| Year Ended 5/31/2018 | $10.56 | 3.01% | 1.63% | 1.50%(d),(f) | 3.39% | 16% | $49,519 |
| Institutional Class |
| Year Ended 5/31/2022 | $9.73 | (8.56%) | 0.66%(c) | 0.65%(c),(d) | 3.58% | 30% | $435,400 |
| Year Ended 5/31/2021 | $11.05 | 14.97% | 0.67%(e) | 0.66%(d),(e) | 3.61% | 22% | $497,969 |
| Year Ended 5/31/2020 | $9.96 | (3.31%) | 0.68%(c),(e) | 0.67%(c),(d),(e) | 4.19% | 46% | $481,793 |
| Year Ended 5/31/2019 | $10.75 | 6.73% | 0.68% | 0.65%(d) | 4.35% | 35% | $548,850 |
| Year Ended 5/31/2018 | $10.56 | 3.88% | 0.68% | 0.65%(d) | 4.24% | 16% | $562,972 |
| Institutional 2 Class |
| Year Ended 5/31/2022 | $9.72 | (8.54%) | 0.63%(c) | 0.61%(c) | 3.54% | 30% | $15,596 |
| Year Ended 5/31/2021 | $11.04 | 15.03% | 0.64%(e) | 0.62%(e) | 3.64% | 22% | $27,815 |
| Year Ended 5/31/2020 | $9.95 | (3.28%) | 0.64%(c),(e) | 0.63%(c),(e) | 4.13% | 46% | $15,702 |
| Year Ended 5/31/2019 | $10.74 | 6.78% | 0.63% | 0.60% | 4.40% | 35% | $10,868 |
| Year Ended 5/31/2018 | $10.55 | 3.92% | 0.63% | 0.59% | 4.30% | 16% | $7,767 |
The accompanying Notes to Financial Statements are an integral part of this statement.
Columbia High Yield Municipal Fund | Annual Report 2022
| 29 |
Financial Highlights (continued)
| | Net asset value,
beginning of
period | Net
investment
income | Net
realized
and
unrealized
gain (loss) | Total from
investment
operations | Distributions
from net
investment
income | Total
distributions to
shareholders |
| Institutional 3 Class |
| Year Ended 5/31/2022 | $11.07 | 0.40 | (1.31) | (0.91) | (0.41) | (0.41) |
| Year Ended 5/31/2021 | $9.98 | 0.39 | 1.09 | 1.48 | (0.39) | (0.39) |
| Year Ended 5/31/2020 | $10.77 | 0.45 | (0.78) | (0.33) | (0.46) | (0.46) |
| Year Ended 5/31/2019 | $10.58 | 0.47 | 0.23 | 0.70 | (0.51) | (0.51) |
| Year Ended 5/31/2018 | $10.66 | 0.46 | (0.04) | 0.42 | (0.50) | (0.50) |
| Notes to Financial Highlights |
| (a) | In addition to the fees and expenses that the Fund bears directly, the Fund indirectly bears a pro rata share of the fees and expenses of any other funds in which it invests. Such indirect expenses are not included in the Fund’s reported expense ratios. |
| (b) | Total net expenses include the impact of certain fee waivers/expense reimbursements made by the Investment Manager and certain of its affiliates, if applicable. |
| (c) | Ratios include interfund lending expense which is less than 0.01%. |
| (d) | The benefits derived from expense reductions had an impact of less than 0.01%. |
| (e) | Ratios include interest and fee expense related to the participation in certain inverse floater programs. If interest and fee expense related to the participation in certain inverse floater programs had been excluded, expenses would have been lower by 0.01%. Due to an equal increase in interest income from fixed rate municipal bonds held in trust, there is no impact on the Fund’s net assets, net asset value per share, total return or net investment income. |
| (f) | Ratios include the impact of voluntary waivers paid by the Investment Manager. For the periods indicated below, if the Investment Manager had not paid these voluntary waivers, the Fund’s net expense ratio would increase by: |
| | 5/31/2021 | 5/31/2020 | 5/31/2019 | 5/31/2018 |
| Class C | 0.03% | 0.10% | 0.10% | 0.10% |
The accompanying Notes to Financial Statements are an integral part of this statement.
| 30 | Columbia High Yield Municipal Fund | Annual Report 2022 |
Financial Highlights (continued)
| | Net
asset
value,
end of
period | Total
return | Total gross
expense
ratio to
average
net assets(a) | Total net
expense
ratio to
average
net assets(a),(b) | Net investment
income
ratio to
average
net assets | Portfolio
turnover | Net
assets,
end of
period
(000’s) |
| Institutional 3 Class |
| Year Ended 5/31/2022 | $9.75 | (8.46%) | 0.58%(c) | 0.57%(c) | 3.69% | 30% | $3,572 |
| Year Ended 5/31/2021 | $11.07 | 15.05% | 0.59%(e) | 0.57%(e) | 3.69% | 22% | $2,838 |
| Year Ended 5/31/2020 | $9.98 | (3.21%) | 0.59%(c),(e) | 0.58%(c),(e) | 4.26% | 46% | $2,170 |
| Year Ended 5/31/2019 | $10.77 | 6.83% | 0.59% | 0.56% | 4.45% | 35% | $1,933 |
| Year Ended 5/31/2018 | $10.58 | 3.99% | 0.59% | 0.55% | 4.41% | 16% | $1,533 |
The accompanying Notes to Financial Statements are an integral part of this statement.
Columbia High Yield Municipal Fund | Annual Report 2022
| 31 |
Notes to Financial Statements
May 31, 2022
Note 1. Organization
Columbia High Yield Municipal Fund (the Fund), a series of Columbia Funds Series Trust I (the Trust), is a diversified fund. The Trust is registered under the Investment Company Act of 1940, as amended (the 1940 Act), as an open-end management investment company organized as a Massachusetts business trust.
Fund shares
The Trust may issue an unlimited number of shares (without par value). The Fund offers each of the share classes listed in the Statement of Assets and Liabilities. Although all share classes generally have identical voting, dividend and liquidation rights, each share class votes separately when required by the Trust’s organizational documents or by law. Each share class has its own expense and sales charge structure. Different share classes may have different minimum initial investment amounts and pay different net investment income distribution amounts to the extent the expenses of distributing such share classes vary. Distributions to shareholders in a liquidation will be proportional to the net asset value of each share class.
As described in the Fund’s prospectus, Class A and Class C shares are offered to the general public for investment. Class C shares automatically convert to Class A shares after 8 years. Advisor Class, Institutional Class, Institutional 2 Class and Institutional 3 Class shares are available for purchase through authorized investment professionals to omnibus retirement plans or to institutional investors and to certain other investors as also described in the Fund’s prospectus.
Note 2. Summary of significant accounting policies
Basis of preparation
The Fund is an investment company that applies the accounting and reporting guidance in the Financial Accounting Standards Board (FASB) Accounting Standards Codification Topic 946, Financial Services - Investment Companies (ASC 946). The financial statements are prepared in accordance with U.S. generally accepted accounting principles (GAAP), which requires management to make certain estimates and assumptions that affect the reported amounts of assets and liabilities, the disclosure of contingent assets and liabilities at the date of the financial statements and the reported amounts of income and expenses during the reporting period. Actual results could differ from those estimates.
The following is a summary of significant accounting policies followed by the Fund in the preparation of its financial statements.
Security valuation
Debt securities generally are valued by pricing services approved by the Board of Trustees based upon market transactions for normal, institutional-size trading units of similar securities. The services may use various pricing techniques that take into account, as applicable, factors such as yield, quality, coupon rate, maturity, type of issue, trading characteristics and other data, as well as approved independent broker-dealer quotes. Debt securities for which quotations are not readily available or not believed to be reflective of market value may also be valued based upon a bid quote from an approved independent broker-dealer. Debt securities maturing in 60 days or less are valued primarily at amortized market value, unless this method results in a valuation that management believes does not approximate fair value.
Investments in open-end investment companies (other than exchange-traded funds (ETFs)), are valued at the latest net asset value reported by those companies as of the valuation time.
Futures and options on futures contracts are valued based upon the settlement price at the close of regular trading on their principal exchanges or, in the absence of a settlement price, at the mean of the latest quoted bid and ask prices.
Investments for which market quotations are not readily available, or that have quotations which management believes are not reflective of market value or reliable, are valued at fair value as determined in good faith under procedures approved by and under the general supervision of the Board of Trustees. If a security or class of securities (such as foreign securities) is valued at fair value, such value is likely to be different from the quoted or published price for the security, if available.
| 32 | Columbia High Yield Municipal Fund | Annual Report 2022 |
Notes to Financial Statements (continued)
May 31, 2022
The determination of fair value often requires significant judgment. To determine fair value, management may use assumptions including but not limited to future cash flows and estimated risk premiums. Multiple inputs from various sources may be used to determine fair value.
GAAP requires disclosure regarding the inputs and valuation techniques used to measure fair value and any changes in valuation inputs or techniques. In addition, investments shall be disclosed by major category. This information is disclosed following the Fund’s Portfolio of Investments.
Derivative instruments
The Fund invests in certain derivative instruments, as detailed below, in seeking to meet its investment objectives. Derivatives are instruments whose values depend on, or are derived from, in whole or in part, the value of one or more securities, currencies, commodities, indices, or other assets or instruments. Derivatives may be used to increase investment flexibility (including to maintain cash reserves while maintaining desired exposure to certain assets), for risk management (hedging) purposes, to facilitate trading, to reduce transaction costs and to pursue higher investment returns. The Fund may also use derivative instruments to mitigate certain investment risks, such as foreign currency exchange rate risk, interest rate risk and credit risk. Derivatives may involve various risks, including the potential inability of the counterparty to fulfill its obligations under the terms of the contract, the potential for an illiquid secondary market (making it difficult for the Fund to sell or terminate, including at favorable prices) and the potential for market movements which may expose the Fund to gains or losses in excess of the amount shown in the Statement of Assets and Liabilities. The notional amounts of derivative instruments, if applicable, are not recorded in the financial statements.
A derivative instrument may suffer a marked-to-market loss if the value of the contract decreases due to an unfavorable change in the market rates or values of the underlying instrument. Losses can also occur if the counterparty does not perform its obligations under the contract. The Fund’s risk of loss from counterparty credit risk on over-the-counter derivatives is generally limited to the aggregate unrealized gain netted against any collateral held by the Fund and the amount of any variation margin held by the counterparty, plus any replacement costs or related amounts. With exchange-traded or centrally cleared derivatives, there is reduced counterparty credit risk to the Fund since the clearinghouse or central counterparty (CCP) provides some protection in the case of clearing member default. The clearinghouse or CCP stands between the buyer and the seller of the contract; therefore, failure of the clearinghouse or CCP may pose additional counterparty credit risk. However, credit risk still exists in exchange-traded or centrally cleared derivatives with respect to initial and variation margin that is held in a broker’s customer account. While clearing brokers are required to segregate customer margin from their own assets, in the event that a clearing broker becomes insolvent or goes into bankruptcy and at that time there is a shortfall in the aggregate amount of margin held by the clearing broker for all its clients and such shortfall is remedied by the CCP or otherwise, U.S. bankruptcy laws will typically allocate that shortfall on a pro-rata basis across all the clearing broker’s customers (including the Fund), potentially resulting in losses to the Fund.
In order to better define its contractual rights and to secure rights that will help the Fund mitigate its counterparty risk, the Fund may enter into an International Swaps and Derivatives Association, Inc. Master Agreement (ISDA Master Agreement) or similar agreement with its derivatives counterparties. An ISDA Master Agreement is an agreement between the Fund and a counterparty that governs over-the-counter derivatives and foreign exchange forward contracts and contains, among other things, collateral posting terms and netting provisions in the event of a default and/or termination event. Under an ISDA Master Agreement, the Fund may, under certain circumstances, offset with the counterparty certain derivative instruments’ payables and/or receivables with collateral held and/or posted and create one single net payment. The provisions of the ISDA Master Agreement typically permit a single net payment in the event of default (close-out netting), including the bankruptcy or insolvency of the counterparty. Note, however, that bankruptcy or insolvency laws of a particular jurisdiction may impose restrictions on or prohibitions against the right of offset or netting in bankruptcy, insolvency or other events.
Collateral (margin) requirements differ by type of derivative. Margin requirements are established by the clearinghouse or CCP for exchange-traded and centrally cleared derivatives. Brokers can ask for margin in excess of the minimum in certain circumstances. Collateral terms for most over-the-counter derivatives are subject to regulatory requirements to exchange variation margin with trading counterparties and may have contract specific margin terms as well. For over-the-counter derivatives traded under an ISDA Master Agreement, the collateral requirements are typically calculated by netting the marked-to-market amount for each transaction under such agreement and comparing that amount to the value of any variation margin currently pledged by the Fund and/or the counterparty. Generally, the amount of collateral due from or to a
Columbia High Yield Municipal Fund | Annual Report 2022
| 33 |
Notes to Financial Statements (continued)
May 31, 2022
party has to exceed a minimum transfer amount threshold (e.g., $250,000) before a transfer has to be made. To the extent amounts due to the Fund from its counterparties are not fully collateralized, contractually or otherwise, the Fund bears the risk of loss from counterparty nonperformance. The Fund may also pay interest expense on cash collateral received from the broker. Any interest expense paid by the Fund is shown in the Statement of Operations. The Fund attempts to mitigate counterparty risk by only entering into agreements with counterparties that it believes have the financial resources to honor their obligations and by monitoring the financial stability of those counterparties.
Certain ISDA Master Agreements allow counterparties of over-the-counter derivatives transactions to terminate derivatives contracts prior to maturity in the event the Fund’s net asset value declines by a stated percentage over a specified time period or if the Fund fails to meet certain terms of the ISDA Master Agreement, which would cause the Fund to accelerate payment of any net liability owed to the counterparty. The Fund also has termination rights if the counterparty fails to meet certain terms of the ISDA Master Agreement. In determining whether to exercise such termination rights, the Fund would consider, in addition to counterparty credit risk, whether termination would result in a net liability owed from the counterparty.
For financial reporting purposes, the Fund does not offset derivative assets and derivative liabilities that are subject to netting arrangements in the Statement of Assets and Liabilities.
Futures contracts
Futures contracts are exchange-traded and represent commitments for the future purchase or sale of an asset at a specified price on a specified date. The Fund bought and sold futures contracts to manage exposure to movements in interest rates. These instruments may be used for other purposes in future periods. Upon entering into futures contracts, the Fund bears risks that it may not achieve the anticipated benefits of the futures contracts and may realize a loss. Additional risks include counterparty credit risk, the possibility of an illiquid market, and that a change in the value of the contract or option may not correlate with changes in the value of the underlying asset.
Upon entering into a futures contract, the Fund deposits cash or securities with the broker, known as a futures commission merchant (FCM), in an amount sufficient to meet the initial margin requirement. The initial margin deposit must be maintained at an established level over the life of the contract. Cash deposited as initial margin is recorded in the Statement of Assets and Liabilities as margin deposits. Securities deposited as initial margin are designated in the Portfolio of Investments. Subsequent payments (variation margin) are made or received by the Fund each day. The variation margin payments are equal to the daily change in the contract value and are recorded as variation margin receivable or payable and are offset in unrealized gains or losses. The Fund generally expects to earn interest income on its margin deposits. The Fund recognizes a realized gain or loss when the contract is closed or expires. Futures contracts involve, to varying degrees, risk of loss in excess of the variation margin disclosed in the Statement of Assets and Liabilities.
Swap contracts
Swap contracts are negotiated in the over-the-counter market and may be entered into as a bilateral contract or centrally cleared (centrally cleared swap contract). In a centrally cleared swap contract, immediately following execution of the swap contract with a broker, the swap contract is novated to a central counterparty (the CCP) and the CCP becomes the Fund’s counterparty to the centrally cleared swap contract. The Fund is required to deposit initial margin with the futures commission merchant (FCM), which pledges it through to the CCP in the form of cash or securities in an amount that varies depending on the size and risk profile of the particular swap contract. Securities deposited as initial margin are designated in the Portfolio of Investments and cash deposited is recorded in the Statement of Assets and Liabilities as margin deposits. For a bilateral swap contract, the Fund has credit exposure to the broker, but exchanges daily variation margin with the broker based on the mark-to-market value of the swap contract to minimize that exposure. For centrally cleared swap contracts, the Fund has minimal credit exposure to the FCM because the CCP stands between the Fund and the relevant buyer/seller on the other side of the contract. Swap contracts are marked-to-market daily and changes in value are recorded as unrealized appreciation (depreciation). The daily change in valuation of centrally cleared swap contracts, if any, is recorded as a receivable or payable for variation margin in the Statement of Assets and Liabilities.
| 34 | Columbia High Yield Municipal Fund | Annual Report 2022 |
Notes to Financial Statements (continued)
May 31, 2022
Entering into these contracts involves, to varying degrees, elements of interest, liquidity and counterparty credit risk in excess of the amounts recognized in the Statement of Assets and Liabilities. Such risks involve the possibility that there may be unfavorable changes in interest rates, market conditions or other conditions, that it may be difficult to initiate a swap transaction or liquidate a position at an advantageous time or price which may result in significant losses, and that the FCM or CCP may not fulfill its obligation under the contract.
Interest rate and inflation rate swap contracts
The Fund entered into interest rate swap transactions and/or inflation rate swap contracts to hedge the portfolio risk associated with some or all of the Fund’s securities. These instruments may be used for other purposes in future periods. An interest rate swap or inflation rate swap, as applicable, is an agreement between two parties where there are two flows and payments are made between the two counterparties and the payments are dependent upon changes in an interest rate, inflation rate or inflation index calculated on a nominal amount. Interest rate swaps are agreements between two parties that involve the exchange of one type of interest rate for another type of interest rate cash flow on specified dates in the future, based on a predetermined, specified notional amount. Certain interest rate swaps are considered forward-starting, whereby the accrual for the exchange of cash flows does not begin until a specified date in the future. The net cash flow for a standard interest rate swap transaction is generally the difference between a floating market interest rate versus a fixed interest rate.
Interest rate swaps are valued daily and unrealized appreciation (depreciation) is recorded. Certain interest rate swaps may accrue periodic interest on a daily basis as a component of unrealized appreciation (depreciation); the Fund will realize a gain or loss upon the payment or receipt of accrued interest. The Fund will realize a gain or a loss when the interest rate swap is terminated.
Effects of derivative transactions in the financial statements
The following tables are intended to provide additional information about the effect of derivatives on the financial statements of the Fund, including: the fair value of derivatives by risk category and the location of those fair values in the Statement of Assets and Liabilities; and the impact of derivative transactions over the period in the Statement of Operations, including realized and unrealized gains (losses). The derivative instrument schedules following the Portfolio of Investments present additional information regarding derivative instruments outstanding at the end of the period, if any.
The following table is a summary of the fair value of derivative instruments (not considered to be hedging instruments for accounting disclosure purposes) at May 31, 2022:
| | Asset derivatives | |
Risk exposure
category | Statement
of assets and liabilities
location | Fair value ($) |
| Interest rate risk | Component of total distributable earnings (loss) — unrealized appreciation on futures contracts | 109,862* |
| * | Includes cumulative appreciation (depreciation) as reported in the tables following the Portfolio of Investments. Only the current day’s variation margin is reported in receivables or payables in the Statement of Assets and Liabilities. |
The following table indicates the effect of derivative instruments (not considered to be hedging instruments for accounting disclosure purposes) in the Statement of Operations for the year ended May 31, 2022:
| Amount of realized gain (loss) on derivatives recognized in income |
| Risk exposure category | Futures
contracts
($) | Swap
contracts
($) | Total
($) |
| Interest rate risk | (1,274,415) | 44,000 | (1,230,415) |
| Change in unrealized appreciation (depreciation) on derivatives recognized in income |
| Risk exposure category | Futures
contracts
($) |
| Interest rate risk | 109,862 |
Columbia High Yield Municipal Fund | Annual Report 2022
| 35 |
Notes to Financial Statements (continued)
May 31, 2022
The following table is a summary of the average outstanding volume by derivative instrument for the year ended May 31, 2022:
| Derivative instrument | Average notional
amounts ($)* |
| Futures contracts — short | 22,458,828 |
| Derivative instrument | Average unrealized
appreciation ($)** | Average unrealized
depreciation ($)** |
| Interest rate swap contracts | 752 | (3,828) |
| * | Based on the ending quarterly outstanding amounts for the year ended May 31, 2022. |
| ** | Based on the ending daily outstanding amounts for the year ended May 31, 2022. |
Delayed delivery securities
The Fund may trade securities on other than normal settlement terms, including securities purchased or sold on a “when-issued” or "forward commitment" basis. This may increase risk to the Fund since the other party to the transaction may fail to deliver, which could cause the Fund to subsequently invest at less advantageous prices. The Fund designates cash or liquid securities in an amount equal to the delayed delivery commitment.
Security transactions
Security transactions are accounted for on the trade date. Cost is determined and gains (losses) are based upon the specific identification method for both financial statement and federal income tax purposes.
Income recognition
Interest income is recorded on an accrual basis. Market premiums and discounts, including original issue discounts, are amortized and accreted, respectively, over the expected life of the security on all debt securities, unless otherwise noted.
The Fund may place a debt security on non-accrual status and reduce related interest income when it becomes probable that the interest will not be collected and the amount of uncollectible interest can be reasonably estimated. A defaulted debt security is removed from non-accrual status when the issuer resumes interest payments or when collectability of interest is reasonably assured.
Dividend income is recorded on the ex-dividend date.
Expenses
General expenses of the Trust are allocated to the Fund and other funds of the Trust based upon relative net assets or other expense allocation methodologies determined by the nature of the expense. Expenses directly attributable to the Fund are charged to the Fund. Expenses directly attributable to a specific class of shares are charged to that share class.
Determination of class net asset value
All income, expenses (other than class-specific expenses, which are charged to that share class, as shown in the Statement of Operations) and realized and unrealized gains (losses) are allocated to each class of the Fund on a daily basis, based on the relative net assets of each class, for purposes of determining the net asset value of each class.
Federal income tax status
The Fund intends to qualify each year as a regulated investment company under Subchapter M of the Internal Revenue Code, as amended, and will distribute substantially all of its net tax-exempt and investment company taxable income and net capital gain, if any, for its tax year, and as such will not be subject to federal income taxes. In addition, the Fund intends to distribute in each calendar year substantially all of its ordinary income, capital gain net income and certain other amounts, if any, such that the Fund should not be subject to federal excise tax. Therefore, no federal income or excise tax provision is recorded.
| 36 | Columbia High Yield Municipal Fund | Annual Report 2022 |
Notes to Financial Statements (continued)
May 31, 2022
Distributions to shareholders
Distributions from net investment income, if any, are declared daily and paid monthly. Net realized capital gains, if any, are distributed at least annually. Income distributions and capital gain distributions are determined in accordance with federal income tax regulations, which may differ from GAAP.
Guarantees and indemnifications
Under the Trust’s organizational documents and, in some cases, by contract, its officers and trustees are indemnified against certain liabilities arising out of the performance of their duties to the Trust or its funds. In addition, certain of the Fund’s contracts with its service providers contain general indemnification clauses. The Fund’s maximum exposure under these arrangements is unknown since the amount of any future claims that may be made against the Fund cannot be determined, and the Fund has no historical basis for predicting the likelihood of any such claims.
Note 3. Fees and other transactions with affiliates
Management services fees
The Fund has entered into a Management Agreement with Columbia Management Investment Advisers, LLC (the Investment Manager), a wholly-owned subsidiary of Ameriprise Financial, Inc. (Ameriprise Financial). Under the Management Agreement, the Investment Manager provides the Fund with investment research and advice, as well as administrative and accounting services. The management services fee is an annual fee that is equal to a percentage of the Fund’s daily net assets that declines from 0.54% to 0.34% as the Fund’s net assets increase. The effective management services fee rate for the year ended May 31, 2022 was 0.54% of the Fund’s average daily net assets.
Compensation of board members
Members of the Board of Trustees who are not officers or employees of the Investment Manager or Ameriprise Financial are compensated for their services to the Fund as disclosed in the Statement of Operations. Under a Deferred Compensation Plan (the Deferred Plan), these members of the Board of Trustees may elect to defer payment of up to 100% of their compensation. Deferred amounts are treated as though equivalent dollar amounts had been invested in shares of certain funds managed by the Investment Manager. The Fund’s liability for these amounts is adjusted for market value changes and remains in the Fund until distributed in accordance with the Deferred Plan. All amounts payable under the Deferred Plan constitute a general unsecured obligation of the Fund. The expense for the Deferred Plan, which includes Trustees’ fees deferred during the current period as well as any gains or losses on the Trustees’ deferred compensation balances as a result of market fluctuations, is included in "Compensation of board members" in the Statement of Operations.
Compensation of Chief Compliance Officer
The Board of Trustees has appointed a Chief Compliance Officer for the Fund in accordance with federal securities regulations. As disclosed in the Statement of Operations, a portion of the Chief Compliance Officer’s total compensation is allocated to the Fund, along with other allocations to affiliated registered investment companies managed by the Investment Manager and its affiliates, based on relative net assets.
Transfer agency fees
Under a Transfer and Dividend Disbursing Agent Agreement, Columbia Management Investment Services Corp. (the Transfer Agent), an affiliate of the Investment Manager and a wholly-owned subsidiary of Ameriprise Financial, is responsible for providing transfer agency services to the Fund. The Transfer Agent has contracted with DST Asset Manager Solutions, Inc. (DST) to serve as sub-transfer agent. The Transfer Agent pays the fees of DST for services as sub-transfer agent and DST is not entitled to reimbursement for such fees from the Fund (with the exception of out-of-pocket fees).
The Fund pays the Transfer Agent a monthly transfer agency fee based on the number or the average value of accounts, depending on the type of account. In addition, the Fund pays the Transfer Agent a fee for shareholder services based on the number of accounts or on a percentage of the average aggregate value of the Fund’s shares maintained in omnibus accounts up to the lesser of the amount charged by the financial intermediary or a cap established by the Board of Trustees from time to time.
Columbia High Yield Municipal Fund | Annual Report 2022
| 37 |
Notes to Financial Statements (continued)
May 31, 2022
The Transfer Agent also receives compensation from the Fund for various shareholder services and reimbursements for certain out-of-pocket fees. Total transfer agency fees for Institutional 2 Class and Institutional 3 Class shares are subject to an annual limitation of not more than 0.07% and 0.02%, respectively, of the average daily net assets attributable to each share class.
For the year ended May 31, 2022, the Fund’s effective transfer agency fee rates as a percentage of average daily net assets of each class were as follows:
| | Effective rate (%) |
| Class A | 0.09 |
| Advisor Class | 0.09 |
| Class C | 0.09 |
| Institutional Class | 0.09 |
| Institutional 2 Class | 0.06 |
| Institutional 3 Class | 0.01 |
An annual minimum account balance fee of $20 may apply to certain accounts with a value below the applicable share class’s initial minimum investment requirements to reduce the impact of small accounts on transfer agency fees. These minimum account balance fees are remitted to the Fund and recorded as part of expense reductions in the Statement of Operations. For the year ended May 31, 2022, these minimum account balance fees reduced total expenses of the Fund by $280.
Distribution and service fees
The Fund has entered into an agreement with Columbia Management Investment Distributors, Inc. (the Distributor), an affiliate of the Investment Manager and a wholly-owned subsidiary of Ameriprise Financial, for distribution and shareholder services. The Board of Trustees has approved, and the Fund has adopted, distribution and shareholder service plans (the Plans) applicable to certain share classes, which set the distribution and service fees for the Fund. These fees are calculated daily and are intended to compensate the Distributor and/or eligible selling and/or servicing agents for selling shares of the Fund and providing services to investors.
Under the Plans, the Fund pays a monthly service fee to the Distributor at the maximum annual rate of 0.20% of the average daily net assets attributable to Class A and Class C shares of the Fund. Also under the Plans, the Fund pays a monthly distribution fee to the Distributor at the maximum annual rate of 0.75% of the average daily net assets attributable to Class C shares of the Fund.
Effective October 1, 2021, the Distributor has reduced the distribution fee for Class C shares to 0.60% annually of the average daily net assets attributable to Class C shares. Prior to October 1, 2021, the Distributor contractually waived a portion of the distribution fee for Class C shares so that the distribution fee did not exceed 0.60% annually of the average daily net assets attributable to Class C shares. This arrangement could have been modified or terminated at the sole discretion of the Board of Trustees.
Sales charges (unaudited)
Sales charges, including front-end charges and contingent deferred sales charges (CDSCs), received by the Distributor for distributing Fund shares for the year ended May 31, 2022, if any, are listed below:
| | Front End (%) | CDSC (%) | Amount ($) |
| Class A | 3.00 | 0.75(a) | 148,855 |
| Class C | — | 1.00(b) | 3,150 |
| (a) | This charge is imposed on certain investments of $500,000 or more if redeemed within 12 months after purchase. |
| (b) | This charge applies to redemptions within 12 months after purchase, with certain limited exceptions. |
The Fund’s other share classes are not subject to sales charges.
| 38 | Columbia High Yield Municipal Fund | Annual Report 2022 |
Notes to Financial Statements (continued)
May 31, 2022
Expenses waived/reimbursed by the Investment Manager and its affiliates
The Investment Manager and certain of its affiliates have contractually agreed to waive fees and/or reimburse expenses (excluding certain fees and expenses described below) for the period(s) disclosed below, unless sooner terminated at the sole discretion of the Board of Trustees, so that the Fund’s net operating expenses, after giving effect to fees waived/expenses reimbursed and any balance credits and/or overdraft charges from the Fund’s custodian, do not exceed the following annual rate(s) as a percentage of the classes’ average daily net assets:
| | October 1, 2021
through
September 30, 2022 | Prior to
October 1, 2021 |
| Class A | 0.85% | 0.85% |
| Advisor Class | 0.65 | 0.65 |
| Class C | 1.45 | 1.60 |
| Institutional Class | 0.65 | 0.65 |
| Institutional 2 Class | 0.62 | 0.61 |
| Institutional 3 Class | 0.57 | 0.56 |
Under the agreement governing these fee waivers and/or expense reimbursement arrangements, the following fees and expenses are excluded from the waiver/reimbursement commitment, and therefore will be paid by the Fund, if applicable: taxes (including foreign transaction taxes), expenses associated with investments in affiliated and non-affiliated pooled investment vehicles (including mutual funds and exchange-traded funds), transaction costs and brokerage commissions, costs related to any securities lending program, dividend expenses associated with securities sold short, inverse floater program fees and expenses, transaction charges and interest on borrowed money, interest, costs associated with shareholder meetings, infrequent and/or unusual expenses and any other expenses the exclusion of which is specifically approved by the Board of Trustees. This agreement may be modified or amended only with approval from the Investment Manager, certain of its affiliates and the Fund. In addition to the contractual agreement, the Investment Manager and certain of its affiliates have voluntarily agreed to waive fees and/or reimburse Fund expenses (excluding certain fees and expenses described above) so that Fund level expenses (expenses directly attributable to the Fund and not to a specific share class) are waived proportionately across all share classes. This arrangement may be revised or discontinued at any time. Prior to October 1, 2021, Class C distribution fees waived by the Distributor, as discussed above, were in addition to the waiver/reimbursement commitment under the agreement. Any fees waived and/or expenses reimbursed under the expense reimbursement arrangements described above are not recoverable by the Investment Manager or its affiliates in future periods.
Note 4. Federal tax information
The timing and character of income and capital gain distributions are determined in accordance with income tax regulations, which may differ from GAAP because of temporary or permanent book to tax differences.
At May 31, 2022, these differences were primarily due to differing treatment for trustees’ deferred compensation, tax straddles, distributions, capital loss carryforward and principal and/or interest of fixed income securities. To the extent these differences were permanent, reclassifications were made among the components of the Fund’s net assets. Temporary differences do not require reclassifications.
The following reclassifications were made:
Undistributed net
investment
income ($) | Accumulated
net realized
(loss) ($) | Paid in
capital ($) |
| 866,841 | (866,841) | — |
Net investment income (loss) and net realized gains (losses), as disclosed in the Statement of Operations, and net assets were not affected by this reclassification.
Columbia High Yield Municipal Fund | Annual Report 2022
| 39 |
Notes to Financial Statements (continued)
May 31, 2022
The tax character of distributions paid during the years indicated was as follows:
| Year Ended May 31, 2022 | Year Ended May 31, 2021 |
Ordinary
income ($) | Tax-exempt
income ($) | Long-term
capital gains ($) | Total ($) | Ordinary
income ($) | Tax-exempt
income ($) | Long-term
capital gains ($) | Total ($) |
| 166,117 | 27,455,895 | — | 27,622,012 | 91,385 | 25,561,006 | — | 25,652,391 |
Short-term capital gain distributions, if any, are considered ordinary income distributions for tax purposes.
At May 31, 2022, the components of distributable earnings on a tax basis were as follows:
Undistributed
ordinary income ($) | Undistributed tax-
exempt income ($) | Undistributed
long-term
capital gains ($) | Capital loss
carryforwards ($) | Net unrealized
(depreciation) ($) |
| — | 12,241,601 | — | (7,393,456) | (55,014,699) |
At May 31, 2022, the cost of all investments for federal income tax purposes along with the aggregate gross unrealized appreciation and depreciation based on that cost was:
Federal
tax cost ($) | Gross unrealized
appreciation ($) | Gross unrealized
(depreciation) ($) | Net unrealized
(depreciation) ($) |
| 713,331,324 | 16,461,143 | (71,475,842) | (55,014,699) |
Tax cost of investments and unrealized appreciation/(depreciation) may also include timing differences that do not constitute adjustments to tax basis.
The following capital loss carryforwards, determined at May 31, 2022, may be available to reduce future net realized gains on investments, if any, to the extent permitted by the Internal Revenue Code. In addition, for the year ended May 31, 2022, capital loss carryforwards utilized, if any, were as follows:
No expiration
short-term ($) | No expiration
long-term ($) | Total ($) | Utilized ($) |
| (2,409,939) | (4,983,517) | (7,393,456) | 1,474,715 |
Management of the Fund has concluded that there are no significant uncertain tax positions in the Fund that would require recognition in the financial statements. However, management’s conclusion may be subject to review and adjustment at a later date based on factors including, but not limited to, new tax laws, regulations, and administrative interpretations (including relevant court decisions). Generally, the Fund’s federal tax returns for the prior three fiscal years remain subject to examination by the Internal Revenue Service.
Note 5. Portfolio information
The cost of purchases and proceeds from sales of securities, excluding short-term investments and derivatives, if any, aggregated to $224,266,080 and $229,804,435, respectively, for the year ended May 31, 2022. The amount of purchase and sale activity impacts the portfolio turnover rate reported in the Financial Highlights.
Note 6. Interfund lending
Pursuant to an exemptive order granted by the Securities and Exchange Commission, the Fund participates in a program (the Interfund Program) allowing each participating Columbia Fund (each, a Participating Fund) to lend money directly to and, except for closed-end funds and money market funds, borrow money directly from other Participating Funds for temporary purposes. The amounts eligible for borrowing and lending under the Interfund Program are subject to certain restrictions.
Interfund loans are subject to the risk that the borrowing fund could be unable to repay the loan when due, and a delay in repayment to the lending fund could result in lost opportunities and/or additional lending costs. The exemptive order is subject to conditions intended to mitigate conflicts of interest arising from the Investment Manager’s relationship with each Participating Fund.
| 40 | Columbia High Yield Municipal Fund | Annual Report 2022 |
Notes to Financial Statements (continued)
May 31, 2022
The Fund’s activity in the Interfund Program during the year ended May 31, 2022 was as follows:
| Borrower or lender | Average loan
balance ($) | Weighted average
interest rate (%) | Number of days
with outstanding loans |
| Borrower | 2,633,333 | 0.96 | 3 |
Interest expense incurred by the Fund is recorded as Interfund lending in the Statement of Operations. The Fund had no outstanding interfund loans at May 31, 2022.
Note 7. Line of credit
The Fund has access to a revolving credit facility with a syndicate of banks led by JPMorgan Chase Bank, N.A., Citibank, N.A. and Wells Fargo Bank, N.A. whereby the Fund may borrow for the temporary funding of shareholder redemptions or for other temporary or emergency purposes. Pursuant to an October 28, 2021 amendment and restatement, the credit facility, which is an agreement between the Fund and certain other funds managed by the Investment Manager or an affiliated investment manager, severally and not jointly, permits aggregate borrowings up to $950 million. Interest is currently charged to each participating fund based on its borrowings at a rate equal to the higher of (i) the federal funds effective rate, (ii) the secured overnight financing rate plus 0.11448% and (iii) the overnight bank funding rate, plus in each case, 1.00%. Each borrowing under the credit facility matures no later than 60 days after the date of borrowing. The Fund also pays a commitment fee equal to its pro rata share of the unused amount of the credit facility at a rate of 0.15% per annum. The commitment fee is included in other expenses in the Statement of Operations. This agreement expires annually in October unless extended or renewed. Prior to the October 28, 2021 amendment and restatement, the Fund had access to a revolving credit facility with a syndicate of banks led by JPMorgan Chase Bank, N.A., Citibank, N.A. and Wells Fargo Bank, N.A. which permitted collective borrowings up to $950 million. Interest was charged to each participating fund based on its borrowings at a rate equal to the higher of (i) the federal funds effective rate, (ii) the one-month London Interbank Offered Rate (LIBOR) rate and (iii) the overnight bank funding rate, plus in each case, 1.25%.
The Fund had no borrowings during the year ended May 31, 2022.
Note 8. Significant risks
Credit risk
Credit risk is the risk that the value of debt instruments in the Fund’s portfolio may decline because the issuer defaults or otherwise becomes unable or unwilling, or is perceived to be unable or unwilling, to honor its financial obligations, such as making payments to the Fund when due. Credit rating agencies assign credit ratings to certain debt instruments to indicate their credit risk. Lower-rated or unrated debt instruments held by the Fund may present increased credit risk as compared to higher-rated debt instruments.
High-yield investments risk
Securities and other debt instruments held by the Fund that are rated below investment grade (commonly called "high-yield" or "junk" bonds) and unrated debt instruments of comparable quality expose the Fund to a greater risk of loss of principal and income than a fund that invests solely or primarily in investment grade debt instruments. In addition, these investments have greater price fluctuations, are less liquid and are more likely to experience a default than higher-rated debt instruments. High-yield debt instruments are considered to be predominantly speculative with respect to the issuer’s capacity to pay interest and repay principal.
Interest rate risk
Interest rate risk is the risk of losses attributable to changes in interest rates. In general, if prevailing interest rates rise, the values of debt instruments tend to fall, and if interest rates fall, the values of debt instruments tend to rise. Actions by governments and central banking authorities can result in increases or decreases in interest rates. Higher periods of inflation could lead such authorities to raise interest rates. Increasing interest rates may negatively affect the value of debt securities held by the Fund, resulting in a negative impact on the Fund’s performance and net asset value per share. In general, the longer the maturity or duration of a debt security, the greater its sensitivity to changes in interest rates. The Fund is subject to the risk that the income generated by its investments may not keep pace with inflation.
Columbia High Yield Municipal Fund | Annual Report 2022
| 41 |
Notes to Financial Statements (continued)
May 31, 2022
Liquidity risk
Liquidity risk is the risk associated with a lack of marketability of investments which may make it difficult to sell the investment at a desirable time or price. Changing regulatory, market or other conditions or environments (for example, the interest rate or credit environments) may adversely affect the liquidity of the Fund’s investments. The Fund may have to accept a lower selling price for the holding, sell other investments, or forego another, more appealing investment opportunity. Generally, the less liquid the market at the time the Fund sells a portfolio investment, the greater the risk of loss or decline of value to the Fund. A less liquid market can lead to an increase in Fund redemptions, which may negatively impact Fund performance and net asset value per share, including, for example, if the Fund is forced to sell securities in a down market.
Market risk
The Fund may incur losses due to declines in the value of one or more securities in which it invests. These declines may be due to factors affecting a particular issuer, or the result of, among other things, political, regulatory, market, economic or social developments affecting the relevant market(s) more generally. In addition, turbulence in financial markets and reduced liquidity in equity, credit and/or fixed income markets may negatively affect many issuers, which could adversely affect the Fund’s ability to price or value hard-to-value assets in thinly traded and closed markets and could cause significant redemptions and operational challenges. Global economies and financial markets are increasingly interconnected, and conditions and events in one country, region or financial market may adversely impact issuers in a different country, region or financial market. These risks may be magnified if certain events or developments adversely interrupt the global supply chain; in these and other circumstances, such risks might affect companies worldwide. As a result, local, regional or global events such as terrorism, war, natural disasters, disease/virus outbreaks and epidemics or other public health issues, recessions, depressions or other events – or the potential for such events – could have a significant negative impact on global economic and market conditions.
The large-scale invasion of Ukraine by Russia in February 2022 has resulted in sanctions and market disruptions, including declines in regional and global stock, unusual volatility in global commodity markets and significant devaluations of Russian currency. The extent and duration of the military action are impossible to predict but could be significant. Market disruption caused by the Russian military action, and any counter measures or responses thereto (including international sanctions, a downgrade in the country’s credit rating, purchasing and financing restrictions, boycotts, tariffs, changes in consumer or purchaser preferences, cyberattacks and espionage) could have severe adverse impacts on regional and/or global securities and commodities markets, including markets for oil and natural gas. These impacts may include reduced market liquidity, distress in credit markets, further disruption of global supply chains, increased risk of inflation, and limited access to investments in certain international markets and/or issuers. These developments and other related events could negatively impact Fund performance.
The pandemic caused by coronavirus disease 2019 and its variants (COVID-19) has resulted in, and may continue to result in, significant global economic and societal disruption and market volatility due to disruptions in market access, resource availability, facilities operations, imposition of tariffs, export controls and supply chain disruption, among others. Such disruptions may be caused, or exacerbated by, quarantines and travel restrictions, workforce displacement and loss in human and other resources. The uncertainty surrounding the magnitude, duration, reach, costs and effects of the global pandemic, as well as actions that have been or could be taken by governmental authorities or other third parties, present unknowns that are yet to unfold. The impacts, as well as the uncertainty over impacts to come, of COVID-19 – and any other infectious illness outbreaks, epidemics and pandemics that may arise in the future – could negatively affect global economies and markets in ways that cannot necessarily be foreseen. In addition, the impact of infectious illness outbreaks and epidemics in emerging market countries may be greater due to generally less established healthcare systems, governments and financial markets. Public health crises caused by the COVID-19 outbreak may exacerbate other pre-existing political, social and economic risks in certain countries or globally. The disruptions caused by COVID-19 could prevent the Fund from executing advantageous investment decisions in a timely manner and negatively impact the Fund’s ability to achieve its investment objective. Any such events could have a significant adverse impact on the value and risk profile of the Fund.
| 42 | Columbia High Yield Municipal Fund | Annual Report 2022 |
Notes to Financial Statements (continued)
May 31, 2022
Municipal securities risk
Municipal securities are debt obligations generally issued to obtain funds for various public purposes, including general financing for state and local governments, or financing for a specific project or public facility, and include obligations of the governments of the U.S. territories, commonwealths and possessions such as Guam, Puerto Rico and the U.S. Virgin Islands to the extent such obligations are exempt from state and U.S. federal income taxes. The value of municipal securities can be significantly affected by actual or expected political and legislative changes at the federal or state level. Municipal securities may be fully or partially backed by the taxing authority of the local government, by the credit of a private issuer, by the current or anticipated revenues from a specific project or specific assets or by domestic or foreign entities providing credit support, such as letters of credit, guarantees or insurance, and are generally classified into general obligation bonds and special revenue obligations. Because many municipal securities are issued to finance projects in sectors such as education, health care, transportation and utilities, conditions in those sectors can affect the overall municipal market.
Issuers in a state, territory, commonwealth or possession in which the Fund invests may experience significant financial difficulties for various reasons, including as the result of events that cannot be reasonably anticipated or controlled such as economic downturns or similar periods of economic stress, social conflict or unrest, labor disruption and natural disasters. Such financial difficulties may lead to credit rating downgrades or defaults of such issuers which in turn, could affect the market values and marketability of many or all municipal obligations of issuers in such state, territory, commonwealth or possession. The value of the Fund’s shares will be negatively impacted to the extent it invests in such securities. The Fund’s annual and semiannual reports show the Fund’s investment exposures at a point in time. The risk of investing in the Fund is directly correlated to the Fund’s investment exposures.
Securities issued by a particular state and its instrumentalities are subject to the risk of unfavorable developments in such state. A municipal security can be significantly affected by adverse tax, legislative, regulatory, demographic or political changes as well as changes in a particular state’s (state and its instrumentalities’) financial, economic or other condition and prospects.
Shareholder concentration risk
At May 31, 2022, two unaffiliated shareholders of record owned 43.1% of the outstanding shares of the Fund in one or more accounts. The Fund has no knowledge about whether any portion of those shares was owned beneficially. Affiliated shareholders of record owned 17.0% of the outstanding shares of the Fund in one or more accounts. Subscription and redemption activity by concentrated accounts may have a significant effect on the operations of the Fund. In the case of a large redemption, the Fund may be forced to sell investments at inopportune times, including its liquid positions, which may result in Fund losses and the Fund holding a higher percentage of less liquid positions. Large redemptions could result in decreased economies of scale and increased operating expenses for non-redeeming Fund shareholders.
Note 9. Subsequent events
Management has evaluated the events and transactions that have occurred through the date the financial statements were issued and noted no items requiring adjustment of the financial statements or additional disclosure.
Note 10. Information regarding pending and settled legal proceedings
Ameriprise Financial and certain of its affiliates are involved in the normal course of business in legal proceedings which include regulatory inquiries, arbitration and litigation, including class actions concerning matters arising in connection with the conduct of its activities as a diversified financial services firm. Ameriprise Financial believes that the Fund is not currently the subject of, and that neither Ameriprise Financial nor any of its affiliates are the subject of, any pending legal, arbitration or regulatory proceedings that are likely to have a material adverse effect on the Fund or the ability of Ameriprise Financial or its affiliates to perform under their contracts with the Fund. Ameriprise Financial is required to make quarterly (10-Q), annual (10-K) and, as necessary, 8-K filings with the Securities and Exchange Commission (SEC) on legal and regulatory matters that relate to Ameriprise Financial and its affiliates. Copies of these filings may be obtained by accessing the SEC website at www.sec.gov.
Columbia High Yield Municipal Fund | Annual Report 2022
| 43 |
Notes to Financial Statements (continued)
May 31, 2022
There can be no assurance that these matters, or the adverse publicity associated with them, will not result in increased Fund redemptions, reduced sale of Fund shares or other adverse consequences to the Fund. Further, although we believe proceedings are not likely to have a material adverse effect on the Fund or the ability of Ameriprise Financial or its affiliates to perform under their contracts with the Fund, these proceedings are subject to uncertainties and, as such, we are unable to estimate the possible loss or range of loss that may result. An adverse outcome in one or more of these proceedings could result in adverse judgments, settlements, fines, penalties or other relief that could have a material adverse effect on the consolidated financial condition or results of operations of Ameriprise Financial or one or more of its affiliates that provides services to the Fund.
| 44 | Columbia High Yield Municipal Fund | Annual Report 2022 |
Report of Independent Registered Public Accounting Firm
To the Board of Trustees of Columbia Funds Series Trust I and Shareholders of Columbia High Yield Municipal Fund
Opinion on the Financial Statements
We have audited the accompanying statement of assets and liabilities, including the portfolio of investments, of Columbia High Yield Municipal Fund (one of the funds constituting Columbia Funds Series Trust I, referred to hereafter as the "Fund") as of May 31, 2022, the related statement of operations for the year ended May 31, 2022, the statement of changes in net assets for each of the two years in the period ended May 31, 2022, including the related notes, and the financial highlights for each of the five years in the period ended May 31, 2022 (collectively referred to as the "financial statements"). In our opinion, the financial statements present fairly, in all material respects, the financial position of the Fund as of May 31, 2022, the results of its operations for the year then ended, the changes in its net assets for each of the two years in the period ended May 31, 2022 and the financial highlights for each of the five years in the period ended May 31, 2022 in conformity with accounting principles generally accepted in the United States of America.
Basis for Opinion
These financial statements are the responsibility of the Fund’s management. Our responsibility is to express an opinion on the Fund’s financial statements based on our audits. We are a public accounting firm registered with the Public Company Accounting Oversight Board (United States) (PCAOB) and are required to be independent with respect to the Fund in accordance with the U.S. federal securities laws and the applicable rules and regulations of the Securities and Exchange Commission and the PCAOB.
We conducted our audits of these financial statements in accordance with the standards of the PCAOB. Those standards require that we plan and perform the audit to obtain reasonable assurance about whether the financial statements are free of material misstatement, whether due to error or fraud.
Our audits included performing procedures to assess the risks of material misstatement of the financial statements, whether due to error or fraud, and performing procedures that respond to those risks. Such procedures included examining, on a test basis, evidence regarding the amounts and disclosures in the financial statements. Our audits also included evaluating the accounting principles used and significant estimates made by management, as well as evaluating the overall presentation of the financial statements. Our procedures included confirmation of securities owned as of May 31, 2022 by correspondence with the custodian and brokers; when replies were not received from brokers, we performed other auditing procedures. We believe that our audits provide a reasonable basis for our opinion.
/s/PricewaterhouseCoopers LLP
Minneapolis, Minnesota
July 21, 2022
We have served as the auditor of one or more investment companies within the Columbia Funds Complex since 1977.
Columbia High Yield Municipal Fund | Annual Report 2022
| 45 |
Federal Income Tax Information
(Unaudited)
The Fund hereby designates the following tax attributes for the fiscal year ended May 31, 2022. Shareholders will be notified in early 2023 of the amounts for use in preparing 2022 income tax returns.
Exempt-
interest
dividends | |
| 99.40% | |
Exempt-interest dividends. The percentage of net investment income distributed during the fiscal year that qualifies as exempt-interest dividends for federal income tax purposes. A portion of the income may be subject to federal alternative minimum tax.
TRUSTEES AND OFFICERS
(Unaudited)
The Board oversees the Fund’s operations and appoints officers who are responsible for day-to-day business decisions based on policies set by the Board. The following table provides basic biographical information about the Fund’s Trustees as of the printing of this report, including their principal occupations during the past five years, although specific titles for individuals may have varied over the period. The year set forth beneath Length of Service in the table below is the year in which the Trustee was first appointed or elected as Trustee to any Fund currently in the Columbia Funds Complex or a predecessor thereof. Under current Board policy, each Trustee generally serves until December 31 of the year such Trustee turns seventy-five (75).
Independent trustees
Name,
address,
year of birth | Position held
with the Columbia Funds and
length of service | Principal occupation(s)
during past five years
and other relevant
professional experience | Number of
Funds in the
Columbia Funds
Complex*
overseen | Other directorships
held by Trustee
during the past
five years |
George S. Batejan
c/o Columbia Management
Investment Advisers, LLC
290 Congress Street
Boston, MA 02210
1953 | Trustee since 2017 | Executive Vice President, Global Head of Technology and Operations, Janus Capital Group, Inc., 2010-2016 | 176 | Former Chairman of the Board, NICSA (National Investment Company Services Association) (Executive Committee, Nominating Committee and Governance Committee), 2014-2016; former Director, Intech Investment Management, 2011-2016; former Board Member, Metro Denver Chamber of Commerce, 2015-2016; former Advisory Board Member, University of Colorado Business School, 2015-2018 |
| 46 | Columbia High Yield Municipal Fund | Annual Report 2022 |
TRUSTEES AND OFFICERS (continued)
(Unaudited)
Independent trustees (continued)
Name,
address,
year of birth | Position held
with the Columbia Funds and
length of service | Principal occupation(s)
during past five years
and other relevant
professional experience | Number of
Funds in the
Columbia Funds
Complex*
overseen | Other directorships
held by Trustee
during the past
five years |
Kathleen Blatz
c/o Columbia Management
Investment Advisers, LLC
290 Congress Street
Boston, MA 02210
1954 | Trustee since 2006 | Attorney, specializing in arbitration and mediation; Chief Justice, Minnesota Supreme Court, 1998-2006; Associate Justice, Minnesota Supreme Court, 1996-1998; Fourth Judicial District Court Judge, Hennepin County, 1994-1996; Attorney in private practice and public service, 1984-1993; State Representative, Minnesota House of Representatives, 1979-1993, which included service on the Tax and Financial Institutions and Insurance Committees; Member and Interim Chair, Minnesota Sports Facilities Authority, January 2017-July 2017; Interim President and Chief Executive Officer, Blue Cross and Blue Shield of Minnesota (health care insurance), February-July 2018, April-October 2021 | 176 | Former Trustee, Blue Cross and Blue Shield of Minnesota, 2009-2021 (Chair of the Business Development Committee, 2014-2017; Chair of the Governance Committee, 2017-2019); former Member and Chair of the Board, Minnesota Sports Facilities Authority, January 2017-July 2017; former Director, Robina Foundation, 2009-2020 (Chair, 2014-2020); Director, Schulze Family Foundation, since 2021 |
Pamela G. Carlton
c/o Columbia Management
Investment Advisers, LLC
290 Congress Street
Boston, MA 02210
1954 | Trustee since 2007 | President, Springboard — Partners in Cross Cultural Leadership (consulting company) since 2003; Managing Director of US Equity Research, JP Morgan Chase, 1999-2003; Director of US Equity Research, Chase Asset Management, 1996-1999; Co-Director Latin America Research, 1993-1996, COO Global Research, 1992-1996, Co-Director of US Research, 1991-1992, Investment Banker, 1982-1991, Morgan Stanley; Attorney, Cleary Gottlieb Steen & Hamilton LLP, 1980-1982 | 176 | Trustee, New York Presbyterian Hospital Board (Executive Committee and Chair of People Committee) since 1996; Director, DR Bank (Audit Committee) since 2017; Director, Evercore Inc. (Audit Committee) since 2019; Director, Apollo Commercial Real Estate Finance, Inc. since 2021; the Governing Council of the Independent Directors Council (IDC), since 2021 |
Janet Langford Carrig
c/o Columbia Management
Investment Advisers, LLC
290 Congress Street
Boston, MA 02210
1957 | Trustee since 1996 | Senior Vice President, General Counsel and Corporate Secretary, ConocoPhillips (independent energy company), September 2007-October 2018 | 174 | Director, EQT Corporation (natural gas producer) since 2019 |
J. Kevin Connaughton
c/o Columbia Management
Investment Advisers, LLC
290 Congress Street
Boston, MA 02210
1964 | Trustee since 2020 | Member, FINRA National Adjudicatory Council since January 2020; Adjunct Professor of Finance, Bentley University since January 2018; Consultant to Independent Trustees of CFVIT and CFST I from March 2016 to June 2020 with respect to CFVIT and to December 2020 with respect to CFST I; Managing Director and General Manager of Mutual Fund Products, Columbia Management Investment Advisers, LLC, May 2010-February 2015; President, Columbia Funds, 2008-2015; and senior officer of Columbia Funds and affiliated funds, 2003-2015 | 174 | Former Director, The Autism Project, March 2015-December 2021; former Member of the Investment Committee, St. Michael’s College, November 2015-February 2020; former Trustee, St. Michael’s College, June 2017-September 2019; former Trustee, New Century Portfolios, January 2015-December 2017 |
Columbia High Yield Municipal Fund | Annual Report 2022
| 47 |
TRUSTEES AND OFFICERS (continued)
(Unaudited)
Independent trustees (continued)
Name,
address,
year of birth | Position held
with the Columbia Funds and
length of service | Principal occupation(s)
during past five years
and other relevant
professional experience | Number of
Funds in the
Columbia Funds
Complex*
overseen | Other directorships
held by Trustee
during the past
five years |
Olive M. Darragh
c/o Columbia Management
Investment Advisers, LLC
290 Congress Street
Boston, MA 02210
1962 | Trustee since 2020 | Managing Director of Darragh Inc. (strategy and talent management consulting firm) since 2010; Founder and CEO, Zolio, Inc. (investment management talent identification platform) since 2004; Consultant to Independent Trustees of CFVIT and CFST I from June 2019 to June 2020 with respect to CFVIT and to December 2020 with respect to CFST I; Partner, Tudor Investments, 2004-2010; Senior Partner, McKinsey & Company (consulting), 1990-2004; Touche Ross CPA, 1985-1988 | 174 | Former Director, University of Edinburgh Business School (Member of US Board); former Director, Boston Public Library Foundation |
Patricia M. Flynn
c/o Columbia Management
Investment Advisers, LLC
290 Congress Street
Boston, MA 02210
1950 | Trustee since 2004 | Trustee Professor of Economics and Management, Bentley University since 1976 (also teaches and conducts research on corporate governance); Dean, McCallum Graduate School of Business, Bentley University, 1992-2002 | 176 | Trustee, MA Taxpayers Foundation since 1997; former Board of Governors, Innovation Institute, MA Technology Collaborative, 2010-2020; former Board of Directors, The MA Business Roundtable, 2003-2019 |
Brian J. Gallagher
c/o Columbia Management
Investment Advisers, LLC
290 Congress Street
Boston, MA 02210
1954 | Trustee since 2017 | Retired; Partner with Deloitte & Touche LLP and its predecessors, 1977-2016 | 176 | Trustee, Catholic Schools Foundation since 2004 |
Douglas A. Hacker
c/o Columbia Management
Investment Advisers, LLC
290 Congress Street
Boston, MA 02210
1955 | Co-Chair since 2021; Chair of CFST I and CFVIT since 2014; Trustee of CFST I and CFVIT since 1996 and CFST, CFST II, CFVST II, CET I and CET II since 2021 | Independent business executive since May 2006; Executive Vice President – Strategy of United Airlines, December 2002 - May 2006; President of UAL Loyalty Services (airline marketing company), September 2001-December 2002; Executive Vice President and Chief Financial Officer of United Airlines, July 1999-September 2001 | 176 | Director, Spartan Nash Company (food distributor); Director, Aircastle Limited (Chair of Audit Committee) (aircraft leasing); former Director, Nash Finch Company (food distributor), 2005-2013; former Director, SeaCube Container Leasing Ltd. (container leasing), 2010-2013; and former Director, Travelport Worldwide Limited (travel information technology), 2014-2019 |
Nancy T. Lukitsh
c/o Columbia Management
Investment Advisers, LLC
290 Congress Street
Boston, MA 02210
1956 | Trustee since 2011 | Senior Vice President, Partner and Director of Marketing, Wellington Management Company, LLP (investment adviser), 1997-2010; Chair, Wellington Management Portfolios (commingled non-U.S. investment pools), 2007 -2010; Director, Wellington Trust Company, NA and other Wellington affiliates, 1997-2010 | 174 | None |
| 48 | Columbia High Yield Municipal Fund | Annual Report 2022 |
TRUSTEES AND OFFICERS (continued)
(Unaudited)
Independent trustees (continued)
Name,
address,
year of birth | Position held
with the Columbia Funds and
length of service | Principal occupation(s)
during past five years
and other relevant
professional experience | Number of
Funds in the
Columbia Funds
Complex*
overseen | Other directorships
held by Trustee
during the past
five years |
David M. Moffett
c/o Columbia Management
Investment Advisers, LLC
290 Congress Street
Boston, MA 02210
1952 | Trustee since 2011 | Retired; Consultant to Bridgewater and Associates | 174 | Director, CSX Corporation (transportation suppliers); Director, Genworth Financial, Inc. (financial and insurance products and services); Director, PayPal Holdings Inc. (payment and data processing services); Trustee, University of Oklahoma Foundation; former Director, eBay Inc. (online trading community), 2007-2015; and former Director, CIT Bank, CIT Group Inc. (commercial and consumer finance), 2010-2016 |
Catherine James Paglia
c/o Columbia Management
Investment Advisers, LLC
290 Congress Street
Boston, MA 02210
1952 | Co-Chair since 2021; Chair of CFST, CFST II, CFVST II, CET I and CET II since 2020; Trustee of CFST, CFST II and CFVST II since 2004 and CFST I and CFVIT since 2021 | Director, Enterprise Asset Management, Inc. (private real estate and asset management company) since September 1998; Managing Director and Partner, Interlaken Capital, Inc., 1989-1997; Vice President, 1982-1985, Principal, 1985-1987, Managing Director, 1987-1989, Morgan Stanley; Vice President, Investment Banking, 1980-1982, Associate, Investment Banking, 1976-1980, Dean Witter Reynolds, Inc. | 176 | Director, Valmont Industries, Inc. (irrigation systems manufacturer) since 2012; Trustee, Carleton College (on the Investment Committee); Trustee, Carnegie Endowment for International Peace (on the Investment Committee) |
Minor M. Shaw
c/o Columbia Management
Investment Advisers, LLC
290 Congress Street
Boston, MA 02210
1947 | Trustee since 2003 | President, Micco LLC (private investments) since 2011; President, Micco Corp. (family investment business), 1998-2011 | 176 | Director, Blue Cross Blue Shield of South Carolina (Chair of Compensation Committee) since April 2008; Trustee, Hollingsworth Funds (on the Investment Committee) since 2016 (previously Board Chair from 2016-2019); Former Advisory Board member, Duke Energy Corp., 2016-2020; Chair of the Duke Endowment; Chair of Greenville – Spartanburg Airport Commission; former Trustee, BofA Funds Series Trust (11 funds), 2003-2011; former Director, Piedmont Natural Gas, 2004-2016; former Director, National Association of Corporate Directors, Carolinas Chapter, 2013-2018; Chair, Daniel-Mickel Foundation since 1998 |
Columbia High Yield Municipal Fund | Annual Report 2022
| 49 |
TRUSTEES AND OFFICERS (continued)
(Unaudited)
Independent trustees (continued)
Name,
address,
year of birth | Position held
with the Columbia Funds and
length of service | Principal occupation(s)
during past five years
and other relevant
professional experience | Number of
Funds in the
Columbia Funds
Complex*
overseen | Other directorships
held by Trustee
during the past
five years |
Natalie A. Trunow
c/o Columbia Management
Investment Advisers, LLC
290 Congress Street
Boston, MA 02210
1967 | Trustee since 2020 | Chief Executive Officer, Millennial Portfolio Solutions LLC (asset management and consulting services), January 2016-January 2021; Non-executive Member of the Investment Committee and Valuation Committee, Sarona Asset Management Inc. (private equity firm) since September 2019; Advisor, Horizon Investments (asset management and consulting services), August 2018-January 2021; Advisor, Paradigm Asset Management, November 2016-December 2021; Consultant to Independent Trustees of CFVIT and CFST I from September 2016 to June 2020 with respect to CFVIT and to December 2020 with respect to CFST I; Director of Investments/Consultant, Casey Family Programs, April 2016-November 2016; Senior Vice President and Chief Investment Officer, Calvert Investments, August 2008-January 2016; Section Head and Portfolio Manager, General Motors Asset Management, June 1997-August 2008 | 174 | Former Director, Investment Committee, Health Services for Children with Special Needs, Inc., 2012-2019; Director, Chair of Audit Committee, Consumer Credit Counseling Services (formerly Guidewell Financial Solutions), since 2019; Independent Director, Investment Committee and Valuation Committee, Sarona Asset Management, since 2019 |
Sandra L. Yeager
c/o Columbia Management
Investment Advisers, LLC
290 Congress Street
Boston, MA 02210
1964 | Trustee since 2017 | Retired; President and founder, Hanoverian Capital, LLC (SEC registered investment advisor firm), 2008-2016; Managing Director, DuPont Capital, 2006-2008; Managing Director, Morgan Stanley Investment Management, 2004-2006; Senior Vice President, Alliance Bernstein, 1990-2004 | 176 | Former Director, NAPE Education Foundation, October 2016-October 2020 |
| * | The term “Columbia Funds Complex” as used herein includes Columbia Seligman Premium Technology Growth Fund, Tri-Continental Corporation and each series of Columbia Fund Series Trust (CFST), Columbia Funds Series Trust I (CFST I), Columbia Funds Series Trust II (CFST II), Columbia ETF Trust I (CET I), Columbia ETF Trust II (CET II), Columbia Funds Variable Insurance Trust (CFVIT) and Columbia Funds Variable Series Trust II (CFVST II). Messrs. Batejan, Beckman, Gallagher and Hacker and Mses. Blatz, Carlton, Flynn, Paglia, Shaw and Yeager serve as Directors of Columbia Seligman Premium Technology Growth Fund and Tri-Continental Corporation. |
Interested trustee affiliated with Investment Manager*
Name,
address,
year of birth | Position held with the Columbia Funds and length of service | Principal occupation(s) during the
past five years and other relevant
professional experience | Number of
Funds in the
Columbia Funds
Complex overseen | Other directorships
held by Trustee
during the past
five years |
Daniel J. Beckman
c/o Columbia Management
Investment Advisers, LLC
290 Congress Street
Boston, MA 02210
1962 | Trustee since November 2021 and President since June 2021 | Vice President – Head of North America Product, Columbia Management Investment Advisers, LLC since April 2015; President and Principal Executive Officer of the Columbia Funds since June 2021; officer of Columbia Funds and affiliated funds, 2020-2021 | 176 | Director, Ameriprise Trust Company, since October 2016; Director, Columbia Management Investment Distributors, Inc. since November 2018; Board of Governors, Columbia Wanger Asset Management, LLC since January 2022 |
| * | Interested person (as defined under the 1940 Act) by reason of being an officer, director, security holder and/or employee of the Investment Manager or Ameriprise Financial. |
The Statement of Additional Information has additional information about the Fund’s Board members and is available, without charge, upon request by calling 800.345.6611, visiting columbiathreadneedleus.com/investor/ or contacting your financial intermediary.
| 50 | Columbia High Yield Municipal Fund | Annual Report 2022 |
TRUSTEES AND OFFICERS (continued)
(Unaudited)
The Board has appointed officers who are responsible for day-to-day business decisions based on policies it has established. The officers serve at the pleasure of the Board. The following table provides basic information about the Officers of the Fund as of the printing of this report, including principal occupations during the past five years, although their specific titles may have varied over the period. In addition to Mr. Beckman, who is President and Principal Executive Officer, the Fund’s other officers are:
Fund officers
Name,
address and
year of birth | Position and year
first appointed to
position for any Fund
in the Columbia
Funds Complex or a
predecessor thereof | Principal occupation(s) during past five years |
Michael G. Clarke
290 Congress Street
Boston, MA 02210
1969 | Chief Financial Officer and Principal Financial Officer (2009) and Senior Vice President (2019) | Senior Vice President and Head of Global Operations & Investor Services, Columbia Management Investment Advisers, LLC, since March 2022 (previously Vice President, Head of North American Operations, and Co-Head of Global Operations, June 2019 to February 2022 and Vice President – Accounting and Tax, May 2010 - May 2019); senior officer of Columbia Funds and affiliated funds since 2002. |
Joseph Beranek
5890 Ameriprise
Financial Center
Minneapolis, MN 55474
1965 | Treasurer and Chief Accounting Officer (Principal Accounting Officer) (2019) and Principal Financial Officer (2020), CFST, CFST I, CFST II, CFVIT and CFVST II; Assistant Treasurer, CET I and CET II | Vice President – Mutual Fund Accounting and Financial Reporting, Columbia Management Investment Advisers, LLC, since December 2018 and March 2017, respectively (previously Vice President – Pricing and Corporate Actions, May 2010 - March 2017). |
Marybeth Pilat
290 Congress Street
Boston, MA 02210
1968 | Treasurer and Chief Accounting Officer (Principal Accounting Officer) and Principal Financial Officer (2020) for CET I and CET II; Assistant Treasurer, CFST, CFST I, CFST II, CFVIT and CFVST II | Vice President – Product Pricing and Administration, Columbia Management Investment Advisers, LLC, since May 2017; Director - Fund Administration, Calvert Investments, August 2015 – March 2017; Vice President - Fund Administration, Legg Mason, May 2015 - July 2015; Vice President - Fund Administration, Columbia Management Investment Advisers, LLC, May 2010 - April 2015. |
William F. Truscott
290 Congress Street
Boston, MA 02210
1960 | Senior Vice President (2001) | Formerly, Trustee/Director of Columbia Funds Complex or legacy funds, November 2001-January 1, 2021; Chief Executive Officer, Global Asset Management, Ameriprise Financial, Inc. since September 2012; Chairman of the Board and President, Columbia Management Investment Advisers, LLC since July 2004 and February 2012, respectively; Chairman of the Board and Chief Executive Officer, Columbia Management Investment Distributors, Inc. since November 2008 and February 2012, respectively; Chairman of the Board and Director, Threadneedle Asset Management Holdings, Sàrl since March 2013 and December 2008, respectively; senior executive of various entities affiliated with Columbia Threadneedle. |
Christopher O. Petersen
5228 Ameriprise Financial Center
Minneapolis, MN 55474
1970 | Senior Vice President and Assistant Secretary (2021) | Formerly, Trustee/Director of funds within the Columbia Funds Complex, July 1, 2020 - November 22, 2021; Senior Vice President and Assistant General Counsel, Ameriprise Financial, Inc. since September 2021 (previously Vice President and Lead Chief Counsel, January 2015 - September 2021); formerly, President and Principal Executive Officer of the Columbia Funds, 2015 - 2021; officer of Columbia Funds and affiliated funds since 2007. |
Thomas P. McGuire
290 Congress Street
Boston, MA 02210
1972 | Senior Vice President and Chief Compliance Officer (2012) | Vice President – Asset Management Compliance, Ameriprise Financial, Inc., since May 2010; Chief Compliance Officer, Columbia Acorn/Wanger Funds since December 2015; formerly, Chief Compliance Officer, Ameriprise Certificate Company, September 2010 – September 2020. |
Ryan C. Larrenaga
290 Congress Street
Boston, MA 02210
1970 | Senior Vice President (2017), Chief Legal Officer (2017), and Secretary (2015) | Vice President and Chief Counsel, Ameriprise Financial, Inc. since August 2018 (previously Vice President and Group Counsel, August 2011 - August 2018); Chief Legal Officer, Columbia Acorn/Wanger Funds, since September 2020; officer of Columbia Funds and affiliated funds since 2005. |
Columbia High Yield Municipal Fund | Annual Report 2022
| 51 |
TRUSTEES AND OFFICERS (continued)
(Unaudited)
Fund officers (continued)
Name,
address and
year of birth | Position and year
first appointed to
position for any Fund
in the Columbia
Funds Complex or a
predecessor thereof | Principal occupation(s) during past five years |
Michael E. DeFao
290 Congress Street
Boston, MA 02210
1968 | Vice President (2011) and Assistant Secretary (2010) | Vice President and Chief Counsel, Ameriprise Financial, Inc. since May 2010; Vice President, Chief Legal Officer and Assistant Secretary, Columbia Management Investment Advisers, LLC since October 2021 (previously Vice President and Assistant Secretary, May 2010 – September 2021). |
Lyn Kephart-Strong
5228 Ameriprise
Financial Center
Minneapolis, MN 55474
1960 | Vice President (2015) | President, Columbia Management Investment Services Corp. since October 2014; Vice President & Resolution Officer, Ameriprise Trust Company since August 2009. |
Liquidity Risk Management Program
(Unaudited)
Pursuant to Rule 22e-4 under the 1940 Act, the Fund has adopted a liquidity risk management program (Program). The Program’s principal objectives include assessing, managing and periodically reviewing the Fund’s liquidity risk. Liquidity risk is defined as the risk that the Fund could not meet redemption requests without significant dilution of remaining investors’ interests in the Fund.
The Board has appointed the Investment Manager as the program administrator for the Fund’s Program. The Investment Manager has delegated oversight of the Program to its Liquidity Risk Management Committee (the Committee). At a board meeting during the fiscal period, the Committee provided the Board with a report addressing the operations of the program and assessing its adequacy and effectiveness of implementation for the period January 1, 2021, through December 31, 2021, including:
| • | the Fund had sufficient liquidity to both meet redemptions and operate effectively on behalf of shareholders; |
| • | there were no material changes to the Program during the period; |
| • | the implementation of the Program was effective to manage the Fund’s liquidity risk; and |
| • | the Program operated adequately during the period. |
There can be no assurance that the Program will achieve its objectives in the future. Please refer to the Fund’s prospectus for more information regarding the Fund’s exposure to liquidity risk and other principal risks to which an investment in the Fund may be subject.
| 52 | Columbia High Yield Municipal Fund | Annual Report 2022 |
[THIS PAGE INTENTIONALLY LEFT BLANK]
[THIS PAGE INTENTIONALLY LEFT BLANK]
[THIS PAGE INTENTIONALLY LEFT BLANK]
Columbia High Yield Municipal Fund
P.O. Box 219104
Kansas City, MO 64121-9104
Please read and consider the investment objectives, risks, charges and expenses for any fund carefully before investing. For a prospectus and summary prospectus, which contains this and other important information about the Fund, go to
columbiathreadneedleus.com/investor/. The Fund is distributed by Columbia Management Investment Distributors, Inc., member FINRA, and managed by Columbia Management Investment Advisers, LLC.
Columbia Threadneedle Investments (Columbia Threadneedle) is the global brand name of the Columbia and Threadneedle group of companies. All rights reserved.
© 2022 Columbia Management Investment Advisers, LLC.
columbiathreadneedleus.com/investor/

Annual Report
May 31, 2022
Columbia Dividend Income Fund
Not FDIC or NCUA Insured • No Financial Institution Guarantee • May Lose Value
If you elect to receive the shareholder report for Columbia Dividend Income Fund (the Fund) in paper, mailed to you, the Fund mails one shareholder report to each shareholder address, unless such shareholder elects to receive shareholder reports from the Fund electronically via e-mail or by having a paper notice mailed to you (Postcard Notice) that your Fund’s shareholder report is available at the Columbia funds’ website (columbiathreadneedleus.com/investor/). If you would like more than one report in paper to be mailed to you, or would like to elect to receive reports via e-mail or access them through Postcard Notice, please call shareholder services at 800.345.6611 and additional reports will be sent to you.
Proxy voting policies and procedures
The policy of the Board of Trustees is to vote the proxies of the companies in which the Fund holds investments consistent with the procedures as stated in the Statement of Additional Information (SAI). You may obtain a copy of the SAI without charge by calling 800.345.6611; contacting your financial intermediary; visiting columbiathreadneedleus.com/investor/; or searching the website of the Securities and Exchange Commission (SEC) at sec.gov. Information regarding how the Fund voted proxies relating to portfolio securities is filed with the SEC by August 31st for the most recent 12-month period ending June 30th of that year, and is available without charge by visiting columbiathreadneedleus.com/investor/, or searching the website of the SEC at sec.gov.
Quarterly schedule of investments
The Fund files a complete schedule of portfolio holdings with the SEC for the first and third quarters of each fiscal year on Form N-PORT. The Fund’s Form N-PORT filings are available on the SEC’s website at sec.gov. The Fund’s complete schedule of portfolio holdings, as filed on Form N-PORT, can also be obtained without charge, upon request, by calling 800.345.6611.
Additional Fund information
For more information about the Fund, please visit columbiathreadneedleus.com/investor/ or call 800.345.6611. Customer Service Representatives are available to answer your questions Monday through Friday from 8 a.m. to 7 p.m. Eastern time.
Fund investment manager
Columbia Management Investment Advisers, LLC (the Investment Manager)
290 Congress Street
Boston, MA 02210
Fund distributor
Columbia Management Investment Distributors, Inc.
290 Congress Street
Boston, MA 02210
Fund transfer agent
Columbia Management Investment Services Corp.
P.O. Box 219104
Kansas City, MO 64121-9104
Columbia Dividend Income Fund | Annual Report 2022
Fund at a Glance
(Unaudited)
Investment objective
The Fund seeks total return, consisting of current income and capital appreciation.
Portfolio management
Scott Davis*
Co-Lead Portfolio Manager
Managed Fund since 2001
Michael Barclay, CFA
Co-Lead Portfolio Manager
Managed Fund since 2011
Tara Gately, CFA
Portfolio Manager
Managed Fund since September 2021
* Mr. Davis has announced that he plans to retire from the Investment Manager, effective June 30, 2023.
Morningstar style boxTM
The Morningstar Style Box is based on a fund’s portfolio holdings. For equity funds, the vertical axis shows the market capitalization of the stocks owned, and the horizontal axis shows investment style (value, blend, or growth). Information shown is based on the most recent data provided by Morningstar.
© 2022 Morningstar, Inc. All rights reserved. The Morningstar information contained herein: (1) is proprietary to Morningstar and/or its content providers; (2) may not be copied or distributed; and (3) is not warranted to be accurate, complete or timely. Neither Morningstar nor its content providers are responsible for any damages or losses arising from any use of this information.
| Average annual total returns (%) (for the period ended May 31, 2022) |
| | | Inception | 1 Year | 5 Years | 10 Years |
| Class A | Excluding sales charges | 11/25/02 | 3.80 | 11.83 | 12.72 |
| | Including sales charges | | -2.17 | 10.51 | 12.06 |
| Advisor Class* | 11/08/12 | 4.08 | 12.10 | 13.01 |
| Class C | Excluding sales charges | 11/25/02 | 3.01 | 10.98 | 11.88 |
| | Including sales charges | | 2.01 | 10.98 | 11.88 |
| Institutional Class | 03/04/98 | 4.09 | 12.11 | 13.01 |
| Institutional 2 Class* | 11/08/12 | 4.16 | 12.19 | 13.12 |
| Institutional 3 Class* | 11/08/12 | 4.20 | 12.25 | 13.18 |
| Class R | 03/28/08 | 3.56 | 11.55 | 12.45 |
| Class V | Excluding sales charges | 03/04/98 | 3.83 | 11.83 | 12.71 |
| | Including sales charges | | -2.14 | 10.51 | 12.05 |
| Russell 1000 Index | | -2.71 | 13.12 | 14.24 |
Returns for Class A shares and Class V shares are shown with and without the maximum initial sales charge of 5.75%. Returns for Class C shares are shown with and without the 1.00% contingent deferred sales charge for the first year only. The Fund’s other share classes are not subject to sales charges and have limited eligibility. Please see the Fund’s prospectus for details. Performance for different share classes will vary based on differences in sales charges and fees associated with each share class. All results shown assume reinvestment of distributions during the period. Returns do not reflect the deduction of taxes that a shareholder may pay on Fund distributions or on the redemption of Fund shares. Performance results reflect the effect of any fee waivers or reimbursements of Fund expenses by Columbia Management Investment Advisers, LLC and/or any of its affiliates. Absent these fee waivers or expense reimbursement arrangements, performance results would have been lower.
The performance information shown represents past performance and is not a guarantee of future results. The investment return and principal value of your investment will fluctuate so that your shares, when redeemed, may be worth more or less than their original cost. Current performance may be lower or higher than the performance information shown. You may obtain performance information current to the most recent month-end by contacting your financial intermediary, visiting columbiathreadneedleus.com/investor/ or calling 800.345.6611.
| * | The returns shown for periods prior to the share class inception date (including returns for the Life of the Fund, if shown, which are since Fund inception) include the returns of the Fund’s oldest share class. Since the Fund launched more than one share class at its inception, Institutional Class shares were used. These returns are adjusted to reflect any higher class-related operating expenses of the newer share classes, as applicable. Please visit columbiathreadneedleus.com/investor/investment-products/mutual-funds/appended-performance for more information. |
The Russell 1000 Index measures the performance of the large-cap segment of the U.S. equity universe. It is a subset of the Russell 3000 Index and includes approximately 1000 of the largest securities based on a combination of their market cap and current index membership. The Russell 1000 Index represents approximately 92% of the U.S. market.
Indices are not available for investment, are not professionally managed and do not reflect sales charges, fees, brokerage commissions, taxes or other expenses of investing. Securities in the Fund may not match those in an index.
Columbia Dividend Income Fund | Annual Report 2022
| 3 |
Fund at a Glance (continued)
(Unaudited)
Performance of a hypothetical $10,000 investment (May 31, 2012 — May 31, 2022)
The chart above shows the change in value of a hypothetical $10,000 investment in Class A shares of Columbia Dividend Income Fund during the stated time period, and does not reflect the deduction of taxes that a shareholder may pay on Fund distributions or on the redemption of Fund shares.
| Portfolio breakdown (%) (at May 31, 2022) |
| Common Stocks | 97.7 |
| Money Market Funds | 2.3 |
| Total | 100.0 |
Percentages indicated are based upon total investments excluding investments in derivatives, if any. The Fund’s portfolio composition is subject to change.
| Equity sector breakdown (%) (at May 31, 2022) |
| Communication Services | 3.0 |
| Consumer Discretionary | 6.2 |
| Consumer Staples | 8.0 |
| Energy | 8.4 |
| Financials | 15.5 |
| Health Care | 17.6 |
| Industrials | 13.0 |
| Information Technology | 17.3 |
| Materials | 2.3 |
| Real Estate | 3.0 |
| Utilities | 5.7 |
| Total | 100.0 |
Percentages indicated are based upon total equity investments. The Fund’s portfolio composition is subject to change.
| 4 | Columbia Dividend Income Fund | Annual Report 2022 |
Manager Discussion of Fund Performance
(Unaudited)
For the 12-month period that ended May 31, 2022, Class A shares of Columbia Dividend Income Fund returned 3.80% excluding sales charges. The Fund outperformed its benchmark, the Russell 1000 Index, which returned -2.71% for the same time period.
Market overview
U.S. equities reversed course during the last half of the 12-month period ending May 31, 2022, falling from record highs and ending three consecutive years of robust gains. Energy stocks were the exception, significantly outperforming the overall equity market as measured by the S&P 500 Index. During the first quarter of 2022, for example, the overall sector outperformed the broad market by the largest quarterly margin on record.
Lingering Omicron-related worries were a continual headwind during the last half of the period, as were fears around inflation, durability of growth and the end of more than a decade of zero interest rate policy. Volatility and risk-off sentiment spiked as investor anxiety expanded to include ramifications of the Russia-Ukraine conflict that erupted several months before period-end. Commodity prices surged, particularly for oil and wheat, as the conflict escalated into war and further complicated global supply chains. Oil prices, which already were elevated on supply-demand imbalances, shot through a decade-high of more than $120 per barrel before retreating somewhat.
Despite occasional hints of peaceful resolution to the Russia-Ukraine conflict, as well as a series of strong earnings reports, equities continued a choppy decline until the Federal Reserve (Fed) raised interest rates by 25 basis points in a widely anticipated move at its March meeting. (A basis point is 1/100 of a percent.) Although the announcement and accompanying projections of six additional rate hikes were hawkish as expected, Fed Chairman Jerome Powell seemingly calmed investors with a more neutral tone and his assessment that the U.S. economy was strong and well-positioned to handle tighter monetary policy.
Any positive sentiment faded at the end of the period, however, as investors increasingly focused on persistent inflation and slowing economic growth, which were exacerbated by yet more supply-chain snarls resulting from China’s zero-COVID lockdown policies.
Six of the eleven sectors in the benchmark ended the period in negative territory. The energy sector, delivered the benchmark’s strongest performance, with a return in excess of 75%. The utilities sector also delivered double-digit positive results. The bottom-performing sectors for the period were the communication services, consumer discretionary and industrials sectors.
The Fund’s notable contributors during the period
| • | The Fund’s outperformance of its benchmark during the period was driven by allocation decisions and broad-based stock selection. |
| • | The health care sector was the Fund’s strongest area of performance, primarily the result of stock selection with a modest contribution from an overweight allocation to the sector as compared to the benchmark. |
| • | Stock selection within the industrials and information technology sectors was additive. |
| • | Underweight allocations to the communication services and consumer discretionary sectors also benefited performance. |
| • | Top individual contributors included Chevron Corp., EOG Resources, Inc., Eli Lilly & Co. and Broadcom, Inc. |
| • | Within the energy sector, oil and gas companies Chevron and EOG Resources both benefited from the surge in energy prices during the period. |
| • | Within the health care sector, an overweight to pharmaceutical company Eli Lilly benefited Fund performance as the company’s stock price climbed throughout the year. Reporting strong earnings that surpassed expectations, the company received breakthrough therapy approval from the FDA for its new Alzheimer’s treatment and also received approval for its drug to treat diabetes and obesity. |
Columbia Dividend Income Fund | Annual Report 2022
| 5 |
Manager Discussion of Fund Performance (continued)
(Unaudited)
| • | Within information technology, semiconductor and infrastructure software provider Broadcom was among the Fund’s top contributors for the period. Broadcom has held a dominant position in the data center and networking end markets along with a very profitable software business. The company has been reporting strong sales in high-growth markets which, combined with a very strong margin structure, has produced above average growth and consistent profitability. |
| • | A lack of exposure to Amazon.com and Facebook’s parent, Meta, proved beneficial. Both are non-dividend-paying stocks that preclude them as candidates for the portfolio. |
The Fund’s notable detractors during the period
| • | Stock selection within the financial sector detracted from relative performance. |
| • | An overweight allocation to the poor-performing industrials sector also weighed on relative results. |
| • | Top individual detractors included Target Corp., Allstate Corp., Comcast Corp., JPMorgan Chase & Co. and Lam Research Corp. |
| • | Within the consumer discretionary sector, multiline retailer Target struggled with inventory issues as customers curtailed discretionary spending in the face of rising inflation. |
| • | An overweight during the period to insurer Allstate weighed on performance. Allstate had seen results for its auto insurance business pressured by an increase in miles driven and associated accident claims as the economy reopened, along with higher used vehicle prices and repair costs caused by supply chain issues. These factors led to a period of margin compression that we believed would likely persist. We exited Allstate in the fourth quarter of 2021. |
| • | The Fund’s position in broadband provider Comcast also constrained performance during the period. The company’s share price declined as its cable subscriber customer base shrank and its balance sheet remained leveraged. We believe the company has benefited, however, from strength in its internet subscriber base and momentum in its wireless business. |
| • | Within financials, the Fund’s position in JPMorgan Chase detracted. As longer term interest rates stabilized or drifted lower, investors sold off bank stocks on the outlook for weaker profits from lending. |
| • | Within information technology, an overweight to LAM Research weighed on Fund results during the period. LAM is one of a handful of companies that makes equipment necessary for the increasingly complex process of manufacturing semiconductors. LAM’s stock price has benefited from strong equipment orders from the biggest chip producers. After a positive run in the stock, it appeared that LAM sold off on profit taking as investors waited for more guidance about 2022 equipment orders. |
| • | Not owning tech giant Apple also detracted from results relative to the benchmark. |
Market risk may affect a single issuer, sector of the economy, industry or the market as a whole. Value securities may be unprofitable if the market fails to recognize their intrinsic worth or the portfolio manager misgauged that worth. Foreign investments subject the Fund to risks, including political, economic, market, social and others within a particular country, as well as to currency instabilities and less stringent financial and accounting standards generally applicable to U.S. issuers. Dividend payments are not guaranteed and the amount, if any, can vary over time. A rise in interest rates may result in a price decline of fixed-income instruments held by the Fund, negatively impacting its performance and net asset value. Falling rates may result in the Fund investing in lower yielding debt instruments, lowering the Fund’s income and yield. These risks may be heightened for longer maturity and duration securities. The Fund may invest significantly in issuers within a particular sector, which may be negatively affected by market, economic or other conditions, making the Fund more vulnerable to unfavorable developments in the sector. See the Fund’s prospectus for more information on these and other risks.
The views expressed in this report reflect the current views of the respective parties who contributed to this report. These views are not guarantees of future performance and involve certain risks, uncertainties and assumptions that are difficult to predict, so actual outcomes and results may differ significantly from the views expressed. These views are subject to change at any time based upon economic, market or other conditions and the respective parties disclaim any responsibility to update such views. These views may not be relied on as investment advice and, because investment decisions for a Columbia fund are based on numerous factors, may not be relied on as an indication of trading intent on behalf of any particular Columbia fund. References to specific securities should not be construed as a recommendation or investment advice.
| 6 | Columbia Dividend Income Fund | Annual Report 2022 |
Understanding Your Fund’s Expenses
(Unaudited)
As an investor, you incur two types of costs. There are shareholder transaction costs, which generally include sales charges on purchases and may include redemption fees. There are also ongoing fund costs, which generally include management fees, distribution and/or service fees, and other fund expenses. The following information is intended to help you understand your ongoing costs (in dollars) of investing in the Fund and to help you compare these costs with the ongoing costs of investing in other mutual funds.
Analyzing your Fund’s expenses
To illustrate these ongoing costs, we have provided examples and calculated the expenses paid by investors in each share class of the Fund during the period. The actual and hypothetical information in the table is based on an initial investment of $1,000 at the beginning of the period indicated and held for the entire period. Expense information is calculated two ways and each method provides you with different information. The amount listed in the “Actual” column is calculated using the Fund’s actual operating expenses and total return for the period. You may use the Actual information, together with the amount invested, to estimate the expenses that you paid over the period. Simply divide your account value by $1,000 (for example, an $8,600 account value divided by $1,000 = 8.6), then multiply the results by the expenses paid during the period under the “Actual” column. The amount listed in the “Hypothetical” column assumes a 5% annual rate of return before expenses (which is not the Fund’s actual return) and then applies the Fund’s actual expense ratio for the period to the hypothetical return. You should not use the hypothetical account values and expenses to estimate either your actual account balance at the end of the period or the expenses you paid during the period. See “Compare with other funds” below for details on how to use the hypothetical data.
Compare with other funds
Since all mutual funds are required to include the same hypothetical calculations about expenses in shareholder reports, you can use this information to compare the ongoing cost of investing in the Fund with other funds. To do so, compare the hypothetical example with the 5% hypothetical examples that appear in the shareholder reports of other funds. As you compare hypothetical examples of other funds, it is important to note that hypothetical examples are meant to highlight the ongoing costs of investing in a fund only and do not reflect any transaction costs, such as sales charges, or redemption or exchange fees. Therefore, the hypothetical calculations are useful in comparing ongoing costs only, and will not help you determine the relative total costs of owning different funds. If transaction costs were included in these calculations, your costs would be higher.
| December 1, 2021 — May 31, 2022 |
| | Account value at the
beginning of the
period ($) | Account value at the
end of the
period ($) | Expenses paid during
the period ($) | Fund’s annualized
expense ratio (%) |
| | Actual | Hypothetical | Actual | Hypothetical | Actual | Hypothetical | Actual |
| Class A | 1,000.00 | 1,000.00 | 1,005.10 | 1,020.44 | 4.50 | 4.53 | 0.90 |
| Advisor Class | 1,000.00 | 1,000.00 | 1,006.20 | 1,021.69 | 3.25 | 3.28 | 0.65 |
| Class C | 1,000.00 | 1,000.00 | 1,001.00 | 1,016.70 | 8.23 | 8.30 | 1.65 |
| Institutional Class | 1,000.00 | 1,000.00 | 1,006.30 | 1,021.69 | 3.25 | 3.28 | 0.65 |
| Institutional 2 Class | 1,000.00 | 1,000.00 | 1,006.50 | 1,021.94 | 3.00 | 3.02 | 0.60 |
| Institutional 3 Class | 1,000.00 | 1,000.00 | 1,006.70 | 1,022.19 | 2.75 | 2.77 | 0.55 |
| Class R | 1,000.00 | 1,000.00 | 1,003.80 | 1,019.20 | 5.75 | 5.79 | 1.15 |
| Class V | 1,000.00 | 1,000.00 | 1,005.10 | 1,020.44 | 4.50 | 4.53 | 0.90 |
Expenses paid during the period are equal to the annualized expense ratio for each class as indicated above, multiplied by the average account value over the period and then multiplied by the number of days in the Fund’s most recent fiscal half year and divided by 365.
Expenses do not include fees and expenses incurred indirectly by the Fund from its investment in underlying funds, including affiliated and non-affiliated pooled investment vehicles, such as mutual funds and exchange-traded funds.
Columbia Dividend Income Fund | Annual Report 2022
| 7 |
Portfolio of Investments
May 31, 2022
(Percentages represent value of investments compared to net assets)
Investments in securities
| Common Stocks 97.5% |
| Issuer | Shares | Value ($) |
| Communication Services 2.9% |
| Diversified Telecommunication Services 1.1% |
| Verizon Communications, Inc. | 7,774,725 | 398,765,645 |
| Media 1.8% |
| Comcast Corp., Class A | 15,441,897 | 683,767,199 |
| Total Communication Services | 1,082,532,844 |
| Consumer Discretionary 6.0% |
| Hotels, Restaurants & Leisure 1.3% |
| McDonald’s Corp. | 1,919,313 | 484,069,932 |
| Internet & Direct Marketing Retail 0.6% |
| eBay, Inc. | 4,900,629 | 238,513,613 |
| Multiline Retail 1.6% |
| Target Corp. | 3,814,908 | 617,557,307 |
| Specialty Retail 2.5% |
| Home Depot, Inc. (The) | 3,097,700 | 937,828,675 |
| Total Consumer Discretionary | 2,277,969,527 |
| Consumer Staples 7.8% |
| Beverages 2.8% |
| Coca-Cola Co. (The) | 8,672,703 | 549,675,916 |
| PepsiCo, Inc. | 2,927,693 | 491,120,501 |
| Total | | 1,040,796,417 |
| Food & Staples Retailing 0.6% |
| Walmart, Inc. | 1,817,642 | 233,803,290 |
| Food Products 1.2% |
| Hershey Co. (The) | 999,097 | 211,518,826 |
| Mondelez International, Inc., Class A | 4,033,504 | 256,369,514 |
| Total | | 467,888,340 |
| Household Products 2.1% |
| Procter & Gamble Co. (The) | 5,236,927 | 774,436,765 |
| Tobacco 1.1% |
| Philip Morris International, Inc. | 3,879,478 | 412,194,538 |
| Total Consumer Staples | 2,929,119,350 |
| Common Stocks (continued) |
| Issuer | Shares | Value ($) |
| Energy 8.2% |
| Oil, Gas & Consumable Fuels 8.2% |
| Chevron Corp. | 5,479,647 | 957,075,145 |
| ConocoPhillips Co. | 4,028,052 | 452,591,923 |
| EOG Resources, Inc. | 4,363,744 | 597,658,378 |
| Exxon Mobil Corp. | 7,990,887 | 767,125,152 |
| Valero Energy Corp. | 2,523,960 | 327,105,216 |
| Total | | 3,101,555,814 |
| Total Energy | 3,101,555,814 |
| Financials 15.1% |
| Banks 7.9% |
| Bank of America Corp. | 23,244,860 | 864,708,792 |
| JPMorgan Chase & Co. | 7,978,735 | 1,055,028,129 |
| PNC Financial Services Group, Inc. (The) | 2,416,790 | 423,929,134 |
| U.S. Bancorp | 8,663,063 | 459,748,754 |
| Wells Fargo & Co. | 4,036,061 | 184,730,512 |
| Total | | 2,988,145,321 |
| Capital Markets 3.7% |
| BlackRock, Inc. | 520,464 | 348,232,053 |
| CME Group, Inc. | 2,026,402 | 402,909,510 |
| Morgan Stanley | 3,137,288 | 270,245,988 |
| Northern Trust Corp. | 3,561,896 | 398,041,878 |
| Total | | 1,419,429,429 |
| Insurance 3.5% |
| Chubb Ltd. | 2,622,054 | 554,013,790 |
| Marsh & McLennan Companies, Inc. | 4,712,931 | 753,833,313 |
| Total | | 1,307,847,103 |
| Total Financials | 5,715,421,853 |
| Health Care 17.2% |
| Biotechnology 2.1% |
| AbbVie, Inc. | 5,404,287 | 796,429,775 |
| Health Care Equipment & Supplies 3.1% |
| Abbott Laboratories | 3,438,743 | 403,914,753 |
| Becton Dickinson and Co. | 1,247,771 | 319,179,822 |
| Medtronic PLC | 4,617,170 | 462,409,575 |
| Total | | 1,185,504,150 |
The accompanying Notes to Financial Statements are an integral part of this statement.
| 8 | Columbia Dividend Income Fund | Annual Report 2022 |
Portfolio of Investments (continued)
May 31, 2022
| Common Stocks (continued) |
| Issuer | Shares | Value ($) |
| Health Care Providers & Services 4.0% |
| Anthem, Inc. | 851,870 | 434,121,471 |
| UnitedHealth Group, Inc. | 2,122,197 | 1,054,265,025 |
| Total | | 1,488,386,496 |
| Pharmaceuticals 8.0% |
| Bristol-Myers Squibb Co. | 4,045,369 | 305,223,091 |
| Eli Lilly & Co. | 2,182,487 | 684,078,725 |
| Johnson & Johnson | 6,940,079 | 1,245,952,383 |
| Merck & Co., Inc. | 8,450,721 | 777,719,854 |
| Total | | 3,012,974,053 |
| Total Health Care | 6,483,294,474 |
| Industrials 12.7% |
| Aerospace & Defense 2.8% |
| Lockheed Martin Corp. | 922,645 | 406,065,291 |
| Northrop Grumman Corp. | 1,376,096 | 643,971,645 |
| Total | | 1,050,036,936 |
| Air Freight & Logistics 1.4% |
| United Parcel Service, Inc., Class B | 2,860,461 | 521,319,017 |
| Building Products 0.8% |
| Trane Technologies PLC | 2,112,337 | 291,629,246 |
| Commercial Services & Supplies 1.3% |
| Waste Management, Inc. | 3,023,567 | 479,265,605 |
| Electrical Equipment 0.8% |
| Eaton Corp. PLC | 2,162,433 | 299,713,214 |
| Industrial Conglomerates 1.6% |
| Honeywell International, Inc. | 3,166,815 | 613,158,721 |
| Machinery 2.3% |
| Cummins, Inc. | 1,201,809 | 251,322,298 |
| Deere & Co. | 896,018 | 320,577,320 |
| Parker-Hannifin Corp. | 1,066,435 | 290,251,614 |
| Total | | 862,151,232 |
| Road & Rail 1.7% |
| Union Pacific Corp. | 3,033,254 | 666,648,564 |
| Total Industrials | 4,783,922,535 |
| Information Technology 16.9% |
| Communications Equipment 1.7% |
| Cisco Systems, Inc. | 14,368,695 | 647,309,710 |
| Common Stocks (continued) |
| Issuer | Shares | Value ($) |
| IT Services 3.3% |
| Accenture PLC, Class A | 1,675,280 | 500,004,069 |
| Automatic Data Processing, Inc. | 2,012,558 | 448,679,681 |
| International Business Machines Corp. | 2,184,017 | 303,228,920 |
| Total | | 1,251,912,670 |
| Semiconductors & Semiconductor Equipment 9.2% |
| Analog Devices, Inc. | 3,356,462 | 565,228,201 |
| Broadcom, Inc. | 1,722,624 | 999,345,861 |
| KLA Corp. | 1,505,225 | 549,181,341 |
| Lam Research Corp. | 1,036,110 | 538,808,283 |
| QUALCOMM, Inc. | 1,071,202 | 153,417,550 |
| Texas Instruments, Inc. | 3,703,877 | 654,697,299 |
| Total | | 3,460,678,535 |
| Software 2.7% |
| Microsoft Corp. | 3,724,430 | 1,012,560,784 |
| Total Information Technology | 6,372,461,699 |
| Materials 2.2% |
| Chemicals 1.3% |
| Linde PLC | 1,213,333 | 393,944,959 |
| PPG Industries, Inc. | 837,011 | 105,873,521 |
| Total | | 499,818,480 |
| Containers & Packaging 0.9% |
| Avery Dennison Corp. | 1,231,555 | 212,517,131 |
| Packaging Corp. of America | 873,324 | 137,356,398 |
| Total | | 349,873,529 |
| Total Materials | 849,692,009 |
| Real Estate 2.9% |
| Equity Real Estate Investment Trusts (REITS) 2.9% |
| AvalonBay Communities, Inc. | 1,266,537 | 263,389,035 |
| Crown Castle International Corp. | 1,418,730 | 269,062,144 |
| Digital Realty Trust, Inc. | 2,302,742 | 321,439,756 |
| Extra Space Storage, Inc. | 1,411,824 | 251,587,037 |
| Total | | 1,105,477,972 |
| Total Real Estate | 1,105,477,972 |
The accompanying Notes to Financial Statements are an integral part of this statement.
Columbia Dividend Income Fund | Annual Report 2022
| 9 |
Portfolio of Investments (continued)
May 31, 2022
| Common Stocks (continued) |
| Issuer | Shares | Value ($) |
| Utilities 5.6% |
| Electric Utilities 3.3% |
| American Electric Power Co., Inc. | 2,589,439 | 264,200,461 |
| Entergy Corp. | 1,901,671 | 228,809,055 |
| Eversource Energy | 2,236,194 | 206,445,430 |
| NextEra Energy, Inc. | 3,816,361 | 288,860,364 |
| Xcel Energy, Inc. | 3,316,674 | 249,878,219 |
| Total | | 1,238,193,529 |
| Multi-Utilities 2.3% |
| Ameren Corp. | 2,528,804 | 240,716,853 |
| CMS Energy Corp. | 2,778,646 | 197,395,012 |
| DTE Energy Co. | 1,226,812 | 162,810,220 |
| WEC Energy Group, Inc. | 2,594,725 | 272,627,756 |
| Total | | 873,549,841 |
| Total Utilities | 2,111,743,370 |
Total Common Stocks
(Cost $24,294,926,963) | 36,813,191,447 |
|
| Money Market Funds 2.3% |
| | Shares | Value ($) |
| Columbia Short-Term Cash Fund, 0.852%(a),(b) | 862,854,830 | 862,509,688 |
Total Money Market Funds
(Cost $862,802,022) | 862,509,688 |
Total Investments in Securities
(Cost: $25,157,728,985) | 37,675,701,135 |
| Other Assets & Liabilities, Net | | 74,346,110 |
| Net Assets | 37,750,047,245 |
Notes to Portfolio of Investments
| (a) | The rate shown is the seven-day current annualized yield at May 31, 2022. |
| (b) | As defined in the Investment Company Act of 1940, as amended, an affiliated company is one in which the Fund owns 5% or more of the company’s outstanding voting securities, or a company which is under common ownership or control with the Fund. The value of the holdings and transactions in these affiliated companies during the year ended May 31, 2022 are as follows: |
| Affiliated issuers | Beginning
of period($) | Purchases($) | Sales($) | Net change in
unrealized
appreciation
(depreciation)($) | End of
period($) | Realized gain
(loss)($) | Dividends($) | End of
period shares |
| Columbia Short-Term Cash Fund, 0.852% |
| | 1,112,436,439 | 3,530,987,787 | (3,780,799,185) | (115,353) | 862,509,688 | (68,856) | 1,330,517 | 862,854,830 |
Fair value measurements
The Fund categorizes its fair value measurements according to a three-level hierarchy that maximizes the use of observable inputs and minimizes the use of unobservable inputs by prioritizing that the most observable input be used when available. Observable inputs are those that market participants would use in pricing an investment based on market data obtained from sources independent of the reporting entity. Unobservable inputs are those that reflect the Fund’s assumptions about the information market participants would use in pricing an investment. An investment’s level within the fair value hierarchy is based on the lowest level of any input that is deemed significant to the asset’s or liability’s fair value measurement. The input levels are not necessarily an indication of the risk or liquidity associated with investments at that level. For example, certain U.S. government securities are generally high quality and liquid, however, they are reflected as Level 2 because the inputs used to determine fair value may not always be quoted prices in an active market.
Fair value inputs are summarized in the three broad levels listed below:
| ■ | Level 1 — Valuations based on quoted prices for investments in active markets that the Fund has the ability to access at the measurement date. Valuation adjustments are not applied to Level 1 investments. |
| ■ | Level 2 — Valuations based on other significant observable inputs (including quoted prices for similar securities, interest rates, prepayment speeds, credit risks, etc.). |
| ■ | Level 3 — Valuations based on significant unobservable inputs (including the Fund’s own assumptions and judgment in determining the fair value of investments). |
The accompanying Notes to Financial Statements are an integral part of this statement.
| 10 | Columbia Dividend Income Fund | Annual Report 2022 |
Portfolio of Investments (continued)
May 31, 2022
Fair value measurements (continued)
Inputs that are used in determining fair value of an investment may include price information, credit data, volatility statistics, and other factors. These inputs can be either observable or unobservable. The availability of observable inputs can vary between investments, and is affected by various factors such as the type of investment, and the volume and level of activity for that investment or similar investments in the marketplace. The inputs will be considered by the Investment Manager, along with any other relevant factors in the calculation of an investment’s fair value. The Fund uses prices and inputs that are current as of the measurement date, which may include periods of market dislocations. During these periods, the availability of prices and inputs may be reduced for many investments. This condition could cause an investment to be reclassified between the various levels within the hierarchy.
Investments falling into the Level 3 category are primarily supported by quoted prices from brokers and dealers participating in the market for those investments. However, these may be classified as Level 3 investments due to lack of market transparency and corroboration to support these quoted prices. Additionally, valuation models may be used as the pricing source for any remaining investments classified as Level 3. These models may rely on one or more significant unobservable inputs and/or significant assumptions by the Investment Manager. Inputs used in valuations may include, but are not limited to, financial statement analysis, capital account balances, discount rates and estimated cash flows, and comparable company data.
Under the direction of the Fund’s Board of Trustees (the Board), the Investment Manager’s Valuation Committee (the Committee) is responsible for overseeing the valuation procedures approved by the Board. The Committee consists of voting and non-voting members from various groups within the Investment Manager’s organization, including operations and accounting, trading and investments, compliance, risk management and legal.
The Committee meets at least monthly to review and approve valuation matters, which may include a description of specific valuation determinations, data regarding pricing information received from approved pricing vendors and brokers and the results of Board-approved valuation control policies and procedures (the Policies). The Policies address, among other things, instances when market quotations are or are not readily available, including recommendations of third party pricing vendors and a determination of appropriate pricing methodologies; events that require specific valuation determinations and assessment of fair value techniques; securities with a potential for stale pricing, including those that are illiquid, restricted, or in default; and the effectiveness of third party pricing vendors, including periodic reviews of vendors. The Committee meets more frequently, as needed, to discuss additional valuation matters, which may include the need to review back-testing results, review time-sensitive information or approve related valuation actions. The Committee reports to the Board, with members of the Committee meeting with the Board at each of its regularly scheduled meetings to discuss valuation matters and actions during the period, similar to those described earlier.
The following table is a summary of the inputs used to value the Fund’s investments at May 31, 2022:
| | Level 1 ($) | Level 2 ($) | Level 3 ($) | Total ($) |
| Investments in Securities | | | | |
| Common Stocks | | | | |
| Communication Services | 1,082,532,844 | — | — | 1,082,532,844 |
| Consumer Discretionary | 2,277,969,527 | — | — | 2,277,969,527 |
| Consumer Staples | 2,929,119,350 | — | — | 2,929,119,350 |
| Energy | 3,101,555,814 | — | — | 3,101,555,814 |
| Financials | 5,715,421,853 | — | — | 5,715,421,853 |
| Health Care | 6,483,294,474 | — | — | 6,483,294,474 |
| Industrials | 4,783,922,535 | — | — | 4,783,922,535 |
| Information Technology | 6,372,461,699 | — | — | 6,372,461,699 |
| Materials | 849,692,009 | — | — | 849,692,009 |
| Real Estate | 1,105,477,972 | — | — | 1,105,477,972 |
| Utilities | 2,111,743,370 | — | — | 2,111,743,370 |
| Total Common Stocks | 36,813,191,447 | — | — | 36,813,191,447 |
| Money Market Funds | 862,509,688 | — | — | 862,509,688 |
| Total Investments in Securities | 37,675,701,135 | — | — | 37,675,701,135 |
See the Portfolio of Investments for all investment classifications not indicated in the table.
The accompanying Notes to Financial Statements are an integral part of this statement.
Columbia Dividend Income Fund | Annual Report 2022
| 11 |
Statement of Assets and Liabilities
May 31, 2022
| Assets | |
| Investments in securities, at value | |
| Unaffiliated issuers (cost $24,294,926,963) | $36,813,191,447 |
| Affiliated issuers (cost $862,802,022) | 862,509,688 |
| Cash | 1 |
| Receivable for: | |
| Capital shares sold | 32,849,860 |
| Dividends | 75,950,911 |
| Interfund lending | 3,100,000 |
| Prepaid expenses | 215,776 |
| Trustees’ deferred compensation plan | 909,049 |
| Total assets | 37,788,726,732 |
| Liabilities | |
| Payable for: | |
| Capital shares purchased | 31,339,501 |
| Management services fees | 2,205,415 |
| Distribution and/or service fees | 286,012 |
| Transfer agent fees | 3,238,403 |
| Compensation of board members | 234,876 |
| Other expenses | 466,231 |
| Trustees’ deferred compensation plan | 909,049 |
| Total liabilities | 38,679,487 |
| Net assets applicable to outstanding capital stock | $37,750,047,245 |
| Represented by | |
| Paid in capital | 24,780,289,491 |
| Total distributable earnings (loss) | 12,969,757,754 |
| Total - representing net assets applicable to outstanding capital stock | $37,750,047,245 |
The accompanying Notes to Financial Statements are an integral part of this statement.
| 12 | Columbia Dividend Income Fund | Annual Report 2022 |
Statement of Assets and Liabilities (continued)
May 31, 2022
| Class A | |
| Net assets | $4,392,791,816 |
| Shares outstanding | 147,554,900 |
| Net asset value per share | $29.77 |
| Maximum sales charge | 5.75% |
| Maximum offering price per share (calculated by dividing the net asset value per share by 1.0 minus the maximum sales charge for Class A shares) | $31.59 |
| Advisor Class | |
| Net assets | $3,338,904,148 |
| Shares outstanding | 109,983,663 |
| Net asset value per share | $30.36 |
| Class C | |
| Net assets | $1,350,124,667 |
| Shares outstanding | 46,985,445 |
| Net asset value per share | $28.73 |
| Institutional Class | |
| Net assets | $17,707,132,571 |
| Shares outstanding | 594,011,638 |
| Net asset value per share | $29.81 |
| Institutional 2 Class | |
| Net assets | $2,972,324,440 |
| Shares outstanding | 98,009,725 |
| Net asset value per share | $30.33 |
| Institutional 3 Class | |
| Net assets | $7,668,907,326 |
| Shares outstanding | 252,466,480 |
| Net asset value per share | $30.38 |
| Class R | |
| Net assets | $229,025,023 |
| Shares outstanding | 7,689,092 |
| Net asset value per share | $29.79 |
| Class V | |
| Net assets | $90,837,254 |
| Shares outstanding | 3,049,708 |
| Net asset value per share | $29.79 |
| Maximum sales charge | 5.75% |
| Maximum offering price per share (calculated by dividing the net asset value per share by 1.0 minus the maximum sales charge for Class V shares) | $31.61 |
The accompanying Notes to Financial Statements are an integral part of this statement.
Columbia Dividend Income Fund | Annual Report 2022
| 13 |
Statement of Operations
Year Ended May 31, 2022
| Net investment income | |
| Income: | |
| Dividends — unaffiliated issuers | $867,913,215 |
| Dividends — affiliated issuers | 1,330,517 |
| Interfund lending | 484 |
| Total income | 869,244,216 |
| Expenses: | |
| Management services fees | 200,847,639 |
| Distribution and/or service fees | |
| Class A | 11,159,672 |
| Class C | 13,656,007 |
| Class R | 1,169,371 |
| Class V | 238,284 |
| Transfer agent fees | |
| Class A | 5,135,934 |
| Advisor Class | 3,912,921 |
| Class C | 1,571,157 |
| Institutional Class | 20,407,280 |
| Institutional 2 Class | 1,803,187 |
| Institutional 3 Class | 436,769 |
| Class R | 269,088 |
| Class V | 109,683 |
| Compensation of board members | 443,504 |
| Custodian fees | 165,579 |
| Printing and postage fees | 1,208,767 |
| Registration fees | 1,336,789 |
| Audit fees | 29,500 |
| Legal fees | 369,854 |
| Compensation of chief compliance officer | 11,573 |
| Other | 442,108 |
| Total expenses | 264,724,666 |
| Expense reduction | (1,727) |
| Total net expenses | 264,722,939 |
| Net investment income | 604,521,277 |
| Realized and unrealized gain (loss) — net | |
| Net realized gain (loss) on: | |
| Investments — unaffiliated issuers | 452,145,284 |
| Investments — affiliated issuers | (68,856) |
| Net realized gain | 452,076,428 |
| Net change in unrealized appreciation (depreciation) on: | |
| Investments — unaffiliated issuers | 406,021,204 |
| Investments — affiliated issuers | (115,353) |
| Net change in unrealized appreciation (depreciation) | 405,905,851 |
| Net realized and unrealized gain | 857,982,279 |
| Net increase in net assets resulting from operations | $1,462,503,556 |
The accompanying Notes to Financial Statements are an integral part of this statement.
| 14 | Columbia Dividend Income Fund | Annual Report 2022 |
Statement of Changes in Net Assets
| | Year Ended
May 31, 2022 | Year Ended
May 31, 2021 |
| Operations | | |
| Net investment income | $604,521,277 | $455,046,695 |
| Net realized gain | 452,076,428 | 760,814,304 |
| Net change in unrealized appreciation (depreciation) | 405,905,851 | 7,244,491,260 |
| Net increase in net assets resulting from operations | 1,462,503,556 | 8,460,352,259 |
| Distributions to shareholders | | |
| Net investment income and net realized gains | | |
| Class A | (124,980,544) | (49,428,431) |
| Advisor Class | (101,221,238) | (38,780,396) |
| Class C | (29,165,217) | (9,791,341) |
| Institutional Class | (540,399,033) | (218,145,747) |
| Institutional 2 Class | (99,465,229) | (35,895,357) |
| Institutional 3 Class | (231,722,717) | (92,843,269) |
| Class R | (6,024,068) | (2,142,487) |
| Class V | (2,666,349) | (1,260,258) |
| Total distributions to shareholders | (1,135,644,395) | (448,287,286) |
| Increase in net assets from capital stock activity | 2,311,117,128 | 6,543,776,661 |
| Total increase in net assets | 2,637,976,289 | 14,555,841,634 |
| Net assets at beginning of year | 35,112,070,956 | 20,556,229,322 |
| Net assets at end of year | $37,750,047,245 | $35,112,070,956 |
The accompanying Notes to Financial Statements are an integral part of this statement.
Columbia Dividend Income Fund | Annual Report 2022
| 15 |
Statement of Changes in Net Assets (continued)
| | Year Ended | Year Ended |
| | May 31, 2022 | May 31, 2021 |
| | Shares | Dollars ($) | Shares | Dollars ($) |
| Capital stock activity |
| Class A | | | | |
| Subscriptions | 29,845,816 | 900,339,496 | 50,007,846 | 1,275,884,602 |
| Distributions reinvested | 3,486,547 | 105,441,363 | 1,733,693 | 42,293,367 |
| Redemptions | (29,779,035) | (899,331,555) | (29,316,546) | (733,623,440) |
| Net increase | 3,553,328 | 106,449,304 | 22,424,993 | 584,554,529 |
| Advisor Class | | | | |
| Subscriptions | 38,790,900 | 1,192,233,253 | 56,024,623 | 1,450,944,181 |
| Distributions reinvested | 3,265,878 | 100,532,706 | 1,536,627 | 38,480,661 |
| Redemptions | (36,553,500) | (1,127,088,618) | (25,844,863) | (684,176,868) |
| Net increase | 5,503,278 | 165,677,341 | 31,716,387 | 805,247,974 |
| Class C | | | | |
| Subscriptions | 9,101,820 | 265,699,953 | 13,152,585 | 323,629,018 |
| Distributions reinvested | 854,445 | 25,139,789 | 359,266 | 8,423,071 |
| Redemptions | (8,146,924) | (237,516,776) | (16,855,240) | (416,157,334) |
| Net increase (decrease) | 1,809,341 | 53,322,966 | (3,343,389) | (84,105,245) |
| Institutional Class | | | | |
| Subscriptions | 152,870,803 | 4,612,757,750 | 220,345,007 | 5,539,486,775 |
| Distributions reinvested | 15,623,440 | 472,403,308 | 7,665,184 | 187,915,195 |
| Redemptions | (128,602,883) | (3,888,570,214) | (107,476,146) | (2,734,627,580) |
| Net increase | 39,891,360 | 1,196,590,844 | 120,534,045 | 2,992,774,390 |
| Institutional 2 Class | | | | |
| Subscriptions | 28,189,723 | 863,966,863 | 58,480,496 | 1,519,686,930 |
| Distributions reinvested | 3,177,985 | 97,637,694 | 1,398,857 | 35,068,200 |
| Redemptions | (36,383,818) | (1,124,641,415) | (18,371,200) | (477,014,670) |
| Net increase (decrease) | (5,016,110) | (163,036,858) | 41,508,153 | 1,077,740,460 |
| Institutional 3 Class | | | | |
| Subscriptions | 72,446,071 | 2,228,533,037 | 83,621,634 | 2,163,505,618 |
| Distributions reinvested | 4,950,475 | 152,421,625 | 2,205,212 | 55,272,501 |
| Redemptions | (46,594,347) | (1,434,309,179) | (40,939,428) | (1,076,820,451) |
| Net increase | 30,802,199 | 946,645,483 | 44,887,418 | 1,141,957,668 |
| Class R | | | | |
| Subscriptions | 1,619,319 | 48,845,688 | 2,530,274 | 65,037,850 |
| Distributions reinvested | 198,217 | 6,012,034 | 86,943 | 2,126,132 |
| Redemptions | (1,499,767) | (45,215,627) | (1,467,115) | (37,298,861) |
| Net increase | 317,769 | 9,642,095 | 1,150,102 | 29,865,121 |
| Class V | | | | |
| Subscriptions | 22,295 | 670,913 | 40,333 | 1,011,908 |
| Distributions reinvested | 71,346 | 2,158,582 | 41,771 | 1,016,120 |
| Redemptions | (231,428) | (7,003,542) | (249,686) | (6,286,264) |
| Net decrease | (137,787) | (4,174,047) | (167,582) | (4,258,236) |
| Total net increase | 76,723,378 | 2,311,117,128 | 258,710,127 | 6,543,776,661 |
The accompanying Notes to Financial Statements are an integral part of this statement.
| 16 | Columbia Dividend Income Fund | Annual Report 2022 |
[THIS PAGE INTENTIONALLY LEFT BLANK]
Columbia Dividend Income Fund | Annual Report 2022
| 17 |
The following table is intended to help you understand the Fund’s financial performance. Certain information reflects financial results for a single share of a class held for the periods shown. Per share net investment income (loss) amounts are calculated based on average shares outstanding during the period. Total return assumes reinvestment of all dividends and distributions, if any. Total return does not reflect payment of sales charges, if any. Total return and portfolio turnover are not annualized for periods of less than one year. The portfolio turnover rate is calculated without regard to purchase and sales transactions of short-term instruments and certain derivatives, if any. If such transactions were included, the Fund’s portfolio turnover rate may be higher.
| | Net asset value,
beginning of
period | Net
investment
income | Net
realized
and
unrealized
gain | Total from
investment
operations | Distributions
from net
investment
income | Distributions
from net
realized
gains | Total
distributions to
shareholders |
| Class A |
| Year Ended 5/31/2022 | $29.50 | 0.42 | 0.71 | 1.13 | (0.41) | (0.45) | (0.86) |
| Year Ended 5/31/2021 | $22.13 | 0.38 | 7.37 | 7.75 | (0.38) | — | (0.38) |
| Year Ended 5/31/2020 | $21.45 | 0.41 | 0.93 | 1.34 | (0.40) | (0.26) | (0.66) |
| Year Ended 5/31/2019 | $21.63 | 0.39 | 0.88 | 1.27 | (0.38) | (1.07) | (1.45) |
| Year Ended 5/31/2018 | $20.46 | 0.36 | 1.75 | 2.11 | (0.34) | (0.60) | (0.94) |
| Advisor Class |
| Year Ended 5/31/2022 | $30.06 | 0.51 | 0.72 | 1.23 | (0.48) | (0.45) | (0.93) |
| Year Ended 5/31/2021 | $22.54 | 0.45 | 7.51 | 7.96 | (0.44) | — | (0.44) |
| Year Ended 5/31/2020 | $21.84 | 0.48 | 0.94 | 1.42 | (0.46) | (0.26) | (0.72) |
| Year Ended 5/31/2019 | $22.00 | 0.45 | 0.89 | 1.34 | (0.43) | (1.07) | (1.50) |
| Year Ended 5/31/2018 | $20.80 | 0.42 | 1.78 | 2.20 | (0.40) | (0.60) | (1.00) |
| Class C |
| Year Ended 5/31/2022 | $28.49 | 0.19 | 0.68 | 0.87 | (0.18) | (0.45) | (0.63) |
| Year Ended 5/31/2021 | $21.38 | 0.18 | 7.14 | 7.32 | (0.21) | — | (0.21) |
| Year Ended 5/31/2020 | $20.73 | 0.23 | 0.91 | 1.14 | (0.23) | (0.26) | (0.49) |
| Year Ended 5/31/2019 | $20.95 | 0.22 | 0.84 | 1.06 | (0.21) | (1.07) | (1.28) |
| Year Ended 5/31/2018 | $19.84 | 0.19 | 1.70 | 1.89 | (0.18) | (0.60) | (0.78) |
| Institutional Class |
| Year Ended 5/31/2022 | $29.53 | 0.50 | 0.71 | 1.21 | (0.48) | (0.45) | (0.93) |
| Year Ended 5/31/2021 | $22.15 | 0.44 | 7.38 | 7.82 | (0.44) | — | (0.44) |
| Year Ended 5/31/2020 | $21.48 | 0.47 | 0.92 | 1.39 | (0.46) | (0.26) | (0.72) |
| Year Ended 5/31/2019 | $21.66 | 0.44 | 0.88 | 1.32 | (0.43) | (1.07) | (1.50) |
| Year Ended 5/31/2018 | $20.48 | 0.41 | 1.77 | 2.18 | (0.40) | (0.60) | (1.00) |
| Institutional 2 Class |
| Year Ended 5/31/2022 | $30.03 | 0.52 | 0.73 | 1.25 | (0.50) | (0.45) | (0.95) |
| Year Ended 5/31/2021 | $22.52 | 0.46 | 7.51 | 7.97 | (0.46) | — | (0.46) |
| Year Ended 5/31/2020 | $21.83 | 0.49 | 0.94 | 1.43 | (0.48) | (0.26) | (0.74) |
| Year Ended 5/31/2019 | $21.99 | 0.47 | 0.89 | 1.36 | (0.45) | (1.07) | (1.52) |
| Year Ended 5/31/2018 | $20.78 | 0.44 | 1.79 | 2.23 | (0.42) | (0.60) | (1.02) |
The accompanying Notes to Financial Statements are an integral part of this statement.
| 18 | Columbia Dividend Income Fund | Annual Report 2022 |
Financial Highlights (continued)
| | Net
asset
value,
end of
period | Total
return | Total gross
expense
ratio to
average
net assets(a) | Total net
expense
ratio to
average
net assets(a),(b) | Net investment
income
ratio to
average
net assets | Portfolio
turnover | Net
assets,
end of
period
(000’s) |
| Class A |
| Year Ended 5/31/2022 | $29.77 | 3.80% | 0.90% | 0.90%(c) | 1.38% | 16% | $4,392,792 |
| Year Ended 5/31/2021 | $29.50 | 35.42% | 0.92% | 0.92%(c) | 1.49% | 11% | $4,247,346 |
| Year Ended 5/31/2020 | $22.13 | 6.26% | 0.94% | 0.94%(c) | 1.80% | 14% | $2,689,884 |
| Year Ended 5/31/2019 | $21.45 | 6.10% | 0.96% | 0.96%(c) | 1.77% | 13% | $2,094,539 |
| Year Ended 5/31/2018 | $21.63 | 10.35% | 0.97% | 0.97%(c) | 1.66% | 15% | $1,834,772 |
| Advisor Class |
| Year Ended 5/31/2022 | $30.36 | 4.08% | 0.65% | 0.65%(c) | 1.63% | 16% | $3,338,904 |
| Year Ended 5/31/2021 | $30.06 | 35.76% | 0.67% | 0.67%(c) | 1.74% | 11% | $3,140,636 |
| Year Ended 5/31/2020 | $22.54 | 6.53% | 0.69% | 0.69%(c) | 2.07% | 14% | $1,640,078 |
| Year Ended 5/31/2019 | $21.84 | 6.35% | 0.71% | 0.71%(c) | 2.04% | 13% | $815,017 |
| Year Ended 5/31/2018 | $22.00 | 10.60% | 0.72% | 0.72%(c) | 1.93% | 15% | $564,834 |
| Class C |
| Year Ended 5/31/2022 | $28.73 | 3.01% | 1.65% | 1.65%(c) | 0.63% | 16% | $1,350,125 |
| Year Ended 5/31/2021 | $28.49 | 34.43% | 1.67% | 1.67%(c) | 0.75% | 11% | $1,286,989 |
| Year Ended 5/31/2020 | $21.38 | 5.44% | 1.69% | 1.69%(c) | 1.05% | 14% | $1,037,413 |
| Year Ended 5/31/2019 | $20.73 | 5.29% | 1.71% | 1.71%(c) | 1.02% | 13% | $856,621 |
| Year Ended 5/31/2018 | $20.95 | 9.53% | 1.72% | 1.72%(c) | 0.91% | 15% | $809,269 |
| Institutional Class |
| Year Ended 5/31/2022 | $29.81 | 4.09% | 0.65% | 0.65%(c) | 1.63% | 16% | $17,707,133 |
| Year Ended 5/31/2021 | $29.53 | 35.76% | 0.67% | 0.67%(c) | 1.74% | 11% | $16,364,361 |
| Year Ended 5/31/2020 | $22.15 | 6.50% | 0.69% | 0.69%(c) | 2.06% | 14% | $9,604,530 |
| Year Ended 5/31/2019 | $21.48 | 6.36% | 0.71% | 0.71%(c) | 2.02% | 13% | $5,966,124 |
| Year Ended 5/31/2018 | $21.66 | 10.67% | 0.72% | 0.72%(c) | 1.89% | 15% | $4,781,049 |
| Institutional 2 Class |
| Year Ended 5/31/2022 | $30.33 | 4.16% | 0.59% | 0.59% | 1.69% | 16% | $2,972,324 |
| Year Ended 5/31/2021 | $30.03 | 35.84% | 0.61% | 0.61% | 1.79% | 11% | $3,093,985 |
| Year Ended 5/31/2020 | $22.52 | 6.57% | 0.62% | 0.62% | 2.13% | 14% | $1,385,364 |
| Year Ended 5/31/2019 | $21.83 | 6.44% | 0.63% | 0.63% | 2.11% | 13% | $772,924 |
| Year Ended 5/31/2018 | $21.99 | 10.76% | 0.63% | 0.63% | 2.00% | 15% | $605,285 |
The accompanying Notes to Financial Statements are an integral part of this statement.
Columbia Dividend Income Fund | Annual Report 2022
| 19 |
Financial Highlights (continued)
| | Net asset value,
beginning of
period | Net
investment
income | Net
realized
and
unrealized
gain | Total from
investment
operations | Distributions
from net
investment
income | Distributions
from net
realized
gains | Total
distributions to
shareholders |
| Institutional 3 Class |
| Year Ended 5/31/2022 | $30.08 | 0.54 | 0.73 | 1.27 | (0.52) | (0.45) | (0.97) |
| Year Ended 5/31/2021 | $22.55 | 0.48 | 7.52 | 8.00 | (0.47) | — | (0.47) |
| Year Ended 5/31/2020 | $21.86 | 0.50 | 0.94 | 1.44 | (0.49) | (0.26) | (0.75) |
| Year Ended 5/31/2019 | $22.02 | 0.48 | 0.89 | 1.37 | (0.46) | (1.07) | (1.53) |
| Year Ended 5/31/2018 | $20.80 | 0.46 | 1.78 | 2.24 | (0.42) | (0.60) | (1.02) |
| Class R |
| Year Ended 5/31/2022 | $29.51 | 0.35 | 0.71 | 1.06 | (0.33) | (0.45) | (0.78) |
| Year Ended 5/31/2021 | $22.14 | 0.31 | 7.38 | 7.69 | (0.32) | — | (0.32) |
| Year Ended 5/31/2020 | $21.46 | 0.35 | 0.94 | 1.29 | (0.35) | (0.26) | (0.61) |
| Year Ended 5/31/2019 | $21.64 | 0.33 | 0.88 | 1.21 | (0.32) | (1.07) | (1.39) |
| Year Ended 5/31/2018 | $20.47 | 0.30 | 1.76 | 2.06 | (0.29) | (0.60) | (0.89) |
| Class V |
| Year Ended 5/31/2022 | $29.51 | 0.42 | 0.72 | 1.14 | (0.41) | (0.45) | (0.86) |
| Year Ended 5/31/2021 | $22.14 | 0.38 | 7.37 | 7.75 | (0.38) | — | (0.38) |
| Year Ended 5/31/2020 | $21.46 | 0.41 | 0.93 | 1.34 | (0.40) | (0.26) | (0.66) |
| Year Ended 5/31/2019 | $21.64 | 0.39 | 0.88 | 1.27 | (0.38) | (1.07) | (1.45) |
| Year Ended 5/31/2018 | $20.47 | 0.36 | 1.75 | 2.11 | (0.34) | (0.60) | (0.94) |
| Notes to Financial Highlights |
| (a) | In addition to the fees and expenses that the Fund bears directly, the Fund indirectly bears a pro rata share of the fees and expenses of any other funds in which it invests. Such indirect expenses are not included in the Fund’s reported expense ratios. |
| (b) | Total net expenses include the impact of certain fee waivers/expense reimbursements made by the Investment Manager and certain of its affiliates, if applicable. |
| (c) | The benefits derived from expense reductions had an impact of less than 0.01%. |
The accompanying Notes to Financial Statements are an integral part of this statement.
| 20 | Columbia Dividend Income Fund | Annual Report 2022 |
Financial Highlights (continued)
| | Net
asset
value,
end of
period | Total
return | Total gross
expense
ratio to
average
net assets(a) | Total net
expense
ratio to
average
net assets(a),(b) | Net investment
income
ratio to
average
net assets | Portfolio
turnover | Net
assets,
end of
period
(000’s) |
| Institutional 3 Class |
| Year Ended 5/31/2022 | $30.38 | 4.20% | 0.55% | 0.55% | 1.74% | 16% | $7,668,907 |
| Year Ended 5/31/2021 | $30.08 | 35.95% | 0.56% | 0.56% | 1.85% | 11% | $6,667,177 |
| Year Ended 5/31/2020 | $22.55 | 6.62% | 0.57% | 0.57% | 2.17% | 14% | $3,986,971 |
| Year Ended 5/31/2019 | $21.86 | 6.48% | 0.58% | 0.58% | 2.15% | 13% | $2,955,434 |
| Year Ended 5/31/2018 | $22.02 | 10.84% | 0.59% | 0.59% | 2.08% | 15% | $2,587,372 |
| Class R |
| Year Ended 5/31/2022 | $29.79 | 3.56% | 1.15% | 1.15%(c) | 1.13% | 16% | $229,025 |
| Year Ended 5/31/2021 | $29.51 | 35.08% | 1.17% | 1.17%(c) | 1.24% | 11% | $217,516 |
| Year Ended 5/31/2020 | $22.14 | 5.97% | 1.19% | 1.19%(c) | 1.54% | 14% | $137,720 |
| Year Ended 5/31/2019 | $21.46 | 5.83% | 1.21% | 1.21%(c) | 1.52% | 13% | $113,166 |
| Year Ended 5/31/2018 | $21.64 | 10.07% | 1.22% | 1.22%(c) | 1.41% | 15% | $104,036 |
| Class V |
| Year Ended 5/31/2022 | $29.79 | 3.83% | 0.90% | 0.90%(c) | 1.38% | 16% | $90,837 |
| Year Ended 5/31/2021 | $29.51 | 35.40% | 0.92% | 0.92%(c) | 1.50% | 11% | $94,062 |
| Year Ended 5/31/2020 | $22.14 | 6.26% | 0.94% | 0.94%(c) | 1.78% | 14% | $74,269 |
| Year Ended 5/31/2019 | $21.46 | 6.10% | 0.96% | 0.96%(c) | 1.76% | 13% | $76,067 |
| Year Ended 5/31/2018 | $21.64 | 10.35% | 0.97% | 0.97%(c) | 1.66% | 15% | $81,875 |
The accompanying Notes to Financial Statements are an integral part of this statement.
Columbia Dividend Income Fund | Annual Report 2022
| 21 |
Notes to Financial Statements
May 31, 2022
Note 1. Organization
Columbia Dividend Income Fund (the Fund), a series of Columbia Funds Series Trust I (the Trust), is a diversified fund. The Trust is registered under the Investment Company Act of 1940, as amended (the 1940 Act), as an open-end management investment company organized as a Massachusetts business trust.
Fund shares
The Trust may issue an unlimited number of shares (without par value). The Fund offers each of the share classes listed in the Statement of Assets and Liabilities. Although all share classes generally have identical voting, dividend and liquidation rights, each share class votes separately when required by the Trust’s organizational documents or by law. Each share class has its own expense and sales charge structure. Different share classes may have different minimum initial investment amounts and pay different net investment income distribution amounts to the extent the expenses of distributing such share classes vary. Distributions to shareholders in a liquidation will be proportional to the net asset value of each share class.
As described in the Fund’s prospectus, Class A and Class C shares are offered to the general public for investment. Class C shares automatically convert to Class A shares after 8 years. Advisor Class, Institutional Class, Institutional 2 Class, Institutional 3 Class and Class R shares are available for purchase through authorized investment professionals to omnibus retirement plans or to institutional investors and to certain other investors as also described in the Fund’s prospectus. Class V shares are available only to investors who received (and who continuously held) Class V shares in connection with previous fund reorganizations.
Effective November 1, 2021, the Fund was closed to new investors, other than those who invest in the Fund through certain financial intermediaries selected by Columbia Management Investment Distributors, Inc. (the Distributor) and retirement plans currently invested and those approved by the Distributor to invest in the Fund. Effective December 1, 2021, the Fund was closed to all new investors. Current retirement plans can remain open to the Fund for existing participants if the Fund had been selected as an option in the retirement plan by December 1, 2021, and initial funding occurred prior to March 1, 2022.
Note 2. Summary of significant accounting policies
Basis of preparation
The Fund is an investment company that applies the accounting and reporting guidance in the Financial Accounting Standards Board (FASB) Accounting Standards Codification Topic 946, Financial Services - Investment Companies (ASC 946). The financial statements are prepared in accordance with U.S. generally accepted accounting principles (GAAP), which requires management to make certain estimates and assumptions that affect the reported amounts of assets and liabilities, the disclosure of contingent assets and liabilities at the date of the financial statements and the reported amounts of income and expenses during the reporting period. Actual results could differ from those estimates.
The following is a summary of significant accounting policies followed by the Fund in the preparation of its financial statements.
Security valuation
Equity securities listed on an exchange are valued at the closing price or last trade price on their primary exchange at the close of business of the New York Stock Exchange. Securities with a closing price not readily available or not listed on any exchange are valued at the mean between the closing bid and ask prices. Listed preferred stocks convertible into common stocks are valued using an evaluated price from a pricing service.
Foreign equity securities are valued based on the closing price or last trade price on their primary exchange at the close of business of the New York Stock Exchange. If any foreign equity security closing prices are not readily available, the securities are valued at the mean of the latest quoted bid and ask prices on such exchanges or markets. Foreign currency exchange rates are determined at the scheduled closing time of the New York Stock Exchange. Many securities markets and exchanges outside the U.S. close prior to the close of the New York Stock Exchange; therefore, the closing prices for securities in such markets or on such exchanges may not fully reflect events that occur after such close but before the close of the New York Stock Exchange. In those situations, foreign securities will be fair valued pursuant to a policy adopted by the
| 22 | Columbia Dividend Income Fund | Annual Report 2022 |
Notes to Financial Statements (continued)
May 31, 2022
Board of Trustees. Under the policy, the Fund may utilize a third-party pricing service to determine these fair values. The third-party pricing service takes into account multiple factors, including, but not limited to, movements in the U.S. securities markets, certain depositary receipts, futures contracts and foreign exchange rates that have occurred subsequent to the close of the foreign exchange or market, to determine a good faith estimate that reasonably reflects the current market conditions as of the close of the New York Stock Exchange. The fair value of a security is likely to be different from the quoted or published price, if available.
Investments in open-end investment companies (other than exchange-traded funds (ETFs)), are valued at the latest net asset value reported by those companies as of the valuation time.
Investments for which market quotations are not readily available, or that have quotations which management believes are not reflective of market value or reliable, are valued at fair value as determined in good faith under procedures approved by and under the general supervision of the Board of Trustees. If a security or class of securities (such as foreign securities) is valued at fair value, such value is likely to be different from the quoted or published price for the security, if available.
The determination of fair value often requires significant judgment. To determine fair value, management may use assumptions including but not limited to future cash flows and estimated risk premiums. Multiple inputs from various sources may be used to determine fair value.
GAAP requires disclosure regarding the inputs and valuation techniques used to measure fair value and any changes in valuation inputs or techniques. In addition, investments shall be disclosed by major category. This information is disclosed following the Fund’s Portfolio of Investments.
Security transactions
Security transactions are accounted for on the trade date. Cost is determined and gains (losses) are based upon the specific identification method for both financial statement and federal income tax purposes.
Income recognition
Corporate actions and dividend income are generally recorded net of any non-reclaimable tax withholdings, on the ex-dividend date or upon receipt of an ex-dividend notification in the case of certain foreign securities.
The Fund may receive distributions from holdings in equity securities, business development companies (BDCs), exchange-traded funds (ETFs), limited partnerships (LPs), other regulated investment companies (RICs), and real estate investment trusts (REITs), which report information as to the tax character of their distributions annually. These distributions are allocated to dividend income, capital gain and return of capital based on actual information reported. Return of capital is recorded as a reduction of the cost basis of securities held. If the Fund no longer owns the applicable securities, return of capital is recorded as a realized gain. With respect to REITs, to the extent actual information has not yet been reported, estimates for return of capital are made by Columbia Management Investment Advisers, LLC (the Investment Manager), a wholly-owned subsidiary of Ameriprise Financial, Inc. (Ameriprise Financial). The Investment Manager’s estimates are subsequently adjusted when the actual character of the distributions is disclosed by the REITs, which could result in a proportionate change in return of capital to shareholders.
Awards from class action litigation are recorded as a reduction of cost basis if the Fund still owns the applicable securities on the payment date. If the Fund no longer owns the applicable securities on the payment date, the proceeds are recorded as realized gains.
Expenses
General expenses of the Trust are allocated to the Fund and other funds of the Trust based upon relative net assets or other expense allocation methodologies determined by the nature of the expense. Expenses directly attributable to the Fund are charged to the Fund. Expenses directly attributable to a specific class of shares are charged to that share class.
Columbia Dividend Income Fund | Annual Report 2022
| 23 |
Notes to Financial Statements (continued)
May 31, 2022
Determination of class net asset value
All income, expenses (other than class-specific expenses, which are charged to that share class, as shown in the Statement of Operations) and realized and unrealized gains (losses) are allocated to each class of the Fund on a daily basis, based on the relative net assets of each class, for purposes of determining the net asset value of each class.
Federal income tax status
The Fund intends to qualify each year as a regulated investment company under Subchapter M of the Internal Revenue Code, as amended, and will distribute substantially all of its investment company taxable income and net capital gain, if any, for its tax year, and as such will not be subject to federal income taxes. In addition, the Fund intends to distribute in each calendar year substantially all of its ordinary income, capital gain net income and certain other amounts, if any, such that the Fund should not be subject to federal excise tax. Therefore, no federal income or excise tax provision is recorded.
Distributions to shareholders
Distributions from net investment income, if any, are declared and paid each calendar quarter. Net realized capital gains, if any, are distributed at least annually. Income distributions and capital gain distributions are determined in accordance with federal income tax regulations, which may differ from GAAP.
Guarantees and indemnifications
Under the Trust’s organizational documents and, in some cases, by contract, its officers and trustees are indemnified against certain liabilities arising out of the performance of their duties to the Trust or its funds. In addition, certain of the Fund’s contracts with its service providers contain general indemnification clauses. The Fund’s maximum exposure under these arrangements is unknown since the amount of any future claims that may be made against the Fund cannot be determined, and the Fund has no historical basis for predicting the likelihood of any such claims.
Note 3. Fees and other transactions with affiliates
Management services fees
The Fund has entered into a Management Agreement with Columbia Management Investment Advisers, LLC (the Investment Manager), a wholly-owned subsidiary of Ameriprise Financial, Inc. (Ameriprise Financial). Under the Management Agreement, the Investment Manager provides the Fund with investment research and advice, as well as administrative and accounting services. Effective July 1, 2021, the management services fee is an annual fee that is equal to a percentage of the Fund’s daily net assets that declines from 0.72% to 0.505% as the Fund’s net assets increase. Prior to July 1, 2021, the management services fee was equal to a percentage of the Fund’s daily net assets that declined from 0.72% to 0.52% as the Fund’s net assets increased. Effective July 1, 2022, the management services fee is an annual fee that is equal to a percentage of the Fund’s daily net assets that declines from 0.72% to 0.5025% as the Fund’s net assets increase. The effective management services fee rate for the year ended May 31, 2022 was 0.529% of the Fund’s average daily net assets.
Compensation of board members
Members of the Board of Trustees who are not officers or employees of the Investment Manager or Ameriprise Financial are compensated for their services to the Fund as disclosed in the Statement of Operations. Under a Deferred Compensation Plan (the Deferred Plan), these members of the Board of Trustees may elect to defer payment of up to 100% of their compensation. Deferred amounts are treated as though equivalent dollar amounts had been invested in shares of certain funds managed by the Investment Manager. The Fund’s liability for these amounts is adjusted for market value changes and remains in the Fund until distributed in accordance with the Deferred Plan. All amounts payable under the Deferred Plan constitute a general unsecured obligation of the Fund. The expense for the Deferred Plan, which includes Trustees’ fees deferred during the current period as well as any gains or losses on the Trustees’ deferred compensation balances as a result of market fluctuations, is included in "Compensation of board members" in the Statement of Operations.
| 24 | Columbia Dividend Income Fund | Annual Report 2022 |
Notes to Financial Statements (continued)
May 31, 2022
Compensation of Chief Compliance Officer
The Board of Trustees has appointed a Chief Compliance Officer for the Fund in accordance with federal securities regulations. As disclosed in the Statement of Operations, a portion of the Chief Compliance Officer’s total compensation is allocated to the Fund, along with other allocations to affiliated registered investment companies managed by the Investment Manager and its affiliates, based on relative net assets.
Transfer agency fees
Under a Transfer and Dividend Disbursing Agent Agreement, Columbia Management Investment Services Corp. (the Transfer Agent), an affiliate of the Investment Manager and a wholly-owned subsidiary of Ameriprise Financial, is responsible for providing transfer agency services to the Fund. The Transfer Agent has contracted with DST Asset Manager Solutions, Inc. (DST) to serve as sub-transfer agent. The Transfer Agent pays the fees of DST for services as sub-transfer agent and DST is not entitled to reimbursement for such fees from the Fund (with the exception of out-of-pocket fees).
The Fund pays the Transfer Agent a monthly transfer agency fee based on the number or the average value of accounts, depending on the type of account. In addition, the Fund pays the Transfer Agent a fee for shareholder services based on the number of accounts or on a percentage of the average aggregate value of the Fund’s shares maintained in omnibus accounts up to the lesser of the amount charged by the financial intermediary or a cap established by the Board of Trustees from time to time.
The Transfer Agent also receives compensation from the Fund for various shareholder services and reimbursements for certain out-of-pocket fees. Total transfer agency fees for Institutional 2 Class and Institutional 3 Class shares are subject to an annual limitation of not more than 0.07% and 0.02%, respectively, of the average daily net assets attributable to each share class.
For the year ended May 31, 2022, the Fund’s effective transfer agency fee rates as a percentage of average daily net assets of each class were as follows:
| | Effective rate (%) |
| Class A | 0.12 |
| Advisor Class | 0.12 |
| Class C | 0.12 |
| Institutional Class | 0.12 |
| Institutional 2 Class | 0.06 |
| Institutional 3 Class | 0.01 |
| Class R | 0.12 |
| Class V | 0.12 |
An annual minimum account balance fee of $20 may apply to certain accounts with a value below the applicable share class’s initial minimum investment requirements to reduce the impact of small accounts on transfer agency fees. These minimum account balance fees are remitted to the Fund and recorded as part of expense reductions in the Statement of Operations. For the year ended May 31, 2022, these minimum account balance fees reduced total expenses of the Fund by $1,727.
Distribution and service fees
The Fund has entered into an agreement with Columbia Management Investment Distributors, Inc. (the Distributor), an affiliate of the Investment Manager and a wholly-owned subsidiary of Ameriprise Financial, for distribution and shareholder services. The Board of Trustees has approved, and the Fund has adopted, distribution and shareholder service plans (the Plans) applicable to certain share classes, which set the distribution and service fees for the Fund. These fees are calculated daily and are intended to compensate the Distributor and/or eligible selling and/or servicing agents for selling shares of the Fund and providing services to investors.
Columbia Dividend Income Fund | Annual Report 2022
| 25 |
Notes to Financial Statements (continued)
May 31, 2022
Under the Plans, the Fund pays a monthly service fee to the Distributor at the maximum annual rate of 0.25% of the average daily net assets attributable to Class A and Class C shares of the Fund. Also under the Plans, the Fund pays a monthly distribution fee to the Distributor at the maximum annual rates of 0.10%, 0.75% and 0.50% of the average daily net assets attributable to Class A, Class C and Class R shares of the Fund, respectively.
Although the Fund may pay distribution and service fees up to a maximum annual rate of 0.35% of the Fund’s average daily net assets attributable to Class A shares (comprised of up to 0.10% for distribution services and up to 0.25% for shareholder services), the Fund currently limits such fees to an aggregate fee of not more than 0.25% of the Fund’s average daily net assets attributable to Class A shares.
Shareholder services fees
The Fund has adopted a shareholder services plan that permits it to pay for certain services provided to Class V shareholders by their selling and/or servicing agents. The Fund may pay shareholder servicing fees up to an aggregate annual rate of 0.50% of the Fund’s average daily net assets attributable to Class V shares (comprised of up to 0.25% for shareholder services and up to 0.25% for administrative support services). These fees are currently limited to an aggregate annual rate of not more than 0.25% of the Fund’s average daily net assets attributable to Class V shares.
Sales charges (unaudited)
Sales charges, including front-end charges and contingent deferred sales charges (CDSCs), received by the Distributor for distributing Fund shares for the year ended May 31, 2022, if any, are listed below:
| | Front End (%) | CDSC (%) | Amount ($) |
| Class A | 5.75 | 0.50 - 1.00(a) | 4,575,197 |
| Class C | — | 1.00(b) | 104,919 |
| Class V | 5.75 | 0.50 - 1.00(a) | 253 |
| (a) | This charge is imposed on certain investments of between $1 million and $50 million redeemed within 18 months after purchase, as follows: 1.00% if redeemed within 12 months after purchase, and 0.50% if redeemed more than 12, but less than 18, months after purchase, with certain limited exceptions. |
| (b) | This charge applies to redemptions within 12 months after purchase, with certain limited exceptions. |
The Fund’s other share classes are not subject to sales charges.
Expenses waived/reimbursed by the Investment Manager and its affiliates
The Investment Manager and certain of its affiliates have contractually agreed to waive fees and/or reimburse expenses (excluding certain fees and expenses described below) for the period(s) disclosed below, unless sooner terminated at the sole discretion of the Board of Trustees, so that the Fund’s net operating expenses, after giving effect to fees waived/expenses reimbursed and any balance credits and/or overdraft charges from the Fund’s custodian, do not exceed the following annual rate(s) as a percentage of the classes’ average daily net assets:
| | October 1, 2021
through
September 30, 2022 | Prior to
October 1, 2021 |
| Class A | 1.10% | 1.13% |
| Advisor Class | 0.85 | 0.88 |
| Class C | 1.85 | 1.88 |
| Institutional Class | 0.85 | 0.88 |
| Institutional 2 Class | 0.79 | 0.81 |
| Institutional 3 Class | 0.74 | 0.76 |
| Class R | 1.35 | 1.38 |
| Class V | 1.10 | 1.13 |
Under the agreement governing these fee waivers and/or expense reimbursement arrangements, the following fees and expenses are excluded from the waiver/reimbursement commitment, and therefore will be paid by the Fund, if applicable: taxes (including foreign transaction taxes), expenses associated with investments in affiliated and non-affiliated pooled investment vehicles (including mutual funds and exchange-traded funds), transaction costs and brokerage
| 26 | Columbia Dividend Income Fund | Annual Report 2022 |
Notes to Financial Statements (continued)
May 31, 2022
commissions, costs related to any securities lending program, dividend expenses associated with securities sold short, inverse floater program fees and expenses, transaction charges and interest on borrowed money, interest, costs associated with shareholder meetings, infrequent and/or unusual expenses and any other expenses the exclusion of which is specifically approved by the Board of Trustees. This agreement may be modified or amended only with approval from the Investment Manager, certain of its affiliates and the Fund. Any fees waived and/or expenses reimbursed under the expense reimbursement arrangements described above are not recoverable by the Investment Manager or its affiliates in future periods.
Note 4. Federal tax information
The timing and character of income and capital gain distributions are determined in accordance with income tax regulations, which may differ from GAAP because of temporary or permanent book to tax differences.
At May 31, 2022, these differences were primarily due to differing treatment for deferral/reversal of wash sale losses, trustees’ deferred compensation and re-characterization of distributions for investments. To the extent these differences were permanent, reclassifications were made among the components of the Fund’s net assets. Temporary differences do not require reclassifications.
The following reclassifications were made:
Undistributed net
investment
income ($) | Accumulated
net realized
gain ($) | Paid in
capital ($) |
| (12,008,000) | 12,008,000 | — |
Net investment income (loss) and net realized gains (losses), as disclosed in the Statement of Operations, and net assets were not affected by this reclassification.
The tax character of distributions paid during the years indicated was as follows:
| Year Ended May 31, 2022 | Year Ended May 31, 2021 |
Ordinary
income ($) | Long-term
capital gains ($) | Total ($) | Ordinary
income ($) | Long-term
capital gains ($) | Total ($) |
| 582,376,416 | 553,267,979 | 1,135,644,395 | 448,287,286 | — | 448,287,286 |
Short-term capital gain distributions, if any, are considered ordinary income distributions for tax purposes.
At May 31, 2022, the components of distributable earnings on a tax basis were as follows:
Undistributed
ordinary income ($) | Undistributed
long-term
capital gains ($) | Capital loss
carryforwards ($) | Net unrealized
appreciation ($) |
| 73,282,985 | 383,084,090 | — | 12,514,519,349 |
At May 31, 2022, the cost of all investments for federal income tax purposes along with the aggregate gross unrealized appreciation and depreciation based on that cost was:
Federal
tax cost ($) | Gross unrealized
appreciation ($) | Gross unrealized
(depreciation) ($) | Net unrealized
appreciation ($) |
| 25,161,181,786 | 12,706,078,068 | (191,558,719) | 12,514,519,349 |
Tax cost of investments and unrealized appreciation/(depreciation) may also include timing differences that do not constitute adjustments to tax basis.
Columbia Dividend Income Fund | Annual Report 2022
| 27 |
Notes to Financial Statements (continued)
May 31, 2022
Management of the Fund has concluded that there are no significant uncertain tax positions in the Fund that would require recognition in the financial statements. However, management’s conclusion may be subject to review and adjustment at a later date based on factors including, but not limited to, new tax laws, regulations, and administrative interpretations (including relevant court decisions). Generally, the Fund’s federal tax returns for the prior three fiscal years remain subject to examination by the Internal Revenue Service.
Note 5. Portfolio information
The cost of purchases and proceeds from sales of securities, excluding short-term investments and derivatives, if any, aggregated to $7,636,532,801 and $5,767,337,475, respectively, for the year ended May 31, 2022. The amount of purchase and sale activity impacts the portfolio turnover rate reported in the Financial Highlights.
Note 6. Affiliated money market fund
The Fund invests in Columbia Short-Term Cash Fund, an affiliated money market fund established for the exclusive use by the Fund and other affiliated funds (the Affiliated MMF). The income earned by the Fund from such investments is included as Dividends - affiliated issuers in the Statement of Operations. As an investing fund, the Fund indirectly bears its proportionate share of the expenses of the Affiliated MMF. The Affiliated MMF prices its shares with a floating net asset value. In addition, the Board of Trustees of the Affiliated MMF may impose a fee on redemptions (sometimes referred to as a liquidity fee) or temporarily suspend redemptions (sometimes referred to as imposing a redemption gate) in the event its liquidity falls below regulatory limits.
Note 7. Interfund lending
Pursuant to an exemptive order granted by the Securities and Exchange Commission, the Fund participates in a program (the Interfund Program) allowing each participating Columbia Fund (each, a Participating Fund) to lend money directly to and, except for closed-end funds and money market funds, borrow money directly from other Participating Funds for temporary purposes. The amounts eligible for borrowing and lending under the Interfund Program are subject to certain restrictions.
Interfund loans are subject to the risk that the borrowing fund could be unable to repay the loan when due, and a delay in repayment to the lending fund could result in lost opportunities and/or additional lending costs. The exemptive order is subject to conditions intended to mitigate conflicts of interest arising from the Investment Manager’s relationship with each Participating Fund.
The Fund’s activity in the Interfund Program during the year ended May 31, 2022 was as follows:
| Borrower or lender | Average loan
balance ($) | Weighted average
interest rate (%) | Number of days
with outstanding loans |
| Lender | 1,585,714 | 0.80 | 14 |
Interest income earned by the Fund is recorded as Interfund lending in the Statement of Operations. The Fund had an outstanding interfund loan balance at May 31, 2022 as shown in the Statement of Assets and Liabilities. The loans are unsecured.
Note 8. Line of credit
The Fund has access to a revolving credit facility with a syndicate of banks led by JPMorgan Chase Bank, N.A., Citibank, N.A. and Wells Fargo Bank, N.A. whereby the Fund may borrow for the temporary funding of shareholder redemptions or for other temporary or emergency purposes. Pursuant to an October 28, 2021 amendment and restatement, the credit facility, which is an agreement between the Fund and certain other funds managed by the Investment Manager or an affiliated investment manager, severally and not jointly, permits aggregate borrowings up to $950 million. Interest is currently charged to each participating fund based on its borrowings at a rate equal to the higher of (i) the federal funds effective rate, (ii) the secured overnight financing rate plus 0.11448% and (iii) the overnight bank funding rate, plus in each case, 1.00%. Each borrowing under the credit facility matures no later than 60 days after the date of borrowing. The Fund also pays a commitment fee equal to its pro rata share of the unused amount of the credit facility at a rate of 0.15% per annum. The commitment fee is included in other expenses in the Statement of Operations. This agreement expires annually in October unless extended or
| 28 | Columbia Dividend Income Fund | Annual Report 2022 |
Notes to Financial Statements (continued)
May 31, 2022
renewed. Prior to the October 28, 2021 amendment and restatement, the Fund had access to a revolving credit facility with a syndicate of banks led by JPMorgan Chase Bank, N.A., Citibank, N.A. and Wells Fargo Bank, N.A. which permitted collective borrowings up to $950 million. Interest was charged to each participating fund based on its borrowings at a rate equal to the higher of (i) the federal funds effective rate, (ii) the one-month London Interbank Offered Rate (LIBOR) rate and (iii) the overnight bank funding rate, plus in each case, 1.25%.
The Fund had no borrowings during the year ended May 31, 2022.
Note 9. Significant risks
Market risk
The Fund may incur losses due to declines in the value of one or more securities in which it invests. These declines may be due to factors affecting a particular issuer, or the result of, among other things, political, regulatory, market, economic or social developments affecting the relevant market(s) more generally. In addition, turbulence in financial markets and reduced liquidity in equity, credit and/or fixed income markets may negatively affect many issuers, which could adversely affect the Fund’s ability to price or value hard-to-value assets in thinly traded and closed markets and could cause significant redemptions and operational challenges. Global economies and financial markets are increasingly interconnected, and conditions and events in one country, region or financial market may adversely impact issuers in a different country, region or financial market. These risks may be magnified if certain events or developments adversely interrupt the global supply chain; in these and other circumstances, such risks might affect companies worldwide. As a result, local, regional or global events such as terrorism, war, natural disasters, disease/virus outbreaks and epidemics or other public health issues, recessions, depressions or other events – or the potential for such events – could have a significant negative impact on global economic and market conditions.
The large-scale invasion of Ukraine by Russia in February 2022 has resulted in sanctions and market disruptions, including declines in regional and global stock, unusual volatility in global commodity markets and significant devaluations of Russian currency. The extent and duration of the military action are impossible to predict but could be significant. Market disruption caused by the Russian military action, and any counter measures or responses thereto (including international sanctions, a downgrade in the country’s credit rating, purchasing and financing restrictions, boycotts, tariffs, changes in consumer or purchaser preferences, cyberattacks and espionage) could have severe adverse impacts on regional and/or global securities and commodities markets, including markets for oil and natural gas. These impacts may include reduced market liquidity, distress in credit markets, further disruption of global supply chains, increased risk of inflation, and limited access to investments in certain international markets and/or issuers. These developments and other related events could negatively impact Fund performance.
The pandemic caused by coronavirus disease 2019 and its variants (COVID-19) has resulted in, and may continue to result in, significant global economic and societal disruption and market volatility due to disruptions in market access, resource availability, facilities operations, imposition of tariffs, export controls and supply chain disruption, among others. Such disruptions may be caused, or exacerbated by, quarantines and travel restrictions, workforce displacement and loss in human and other resources. The uncertainty surrounding the magnitude, duration, reach, costs and effects of the global pandemic, as well as actions that have been or could be taken by governmental authorities or other third parties, present unknowns that are yet to unfold. The impacts, as well as the uncertainty over impacts to come, of COVID-19 – and any other infectious illness outbreaks, epidemics and pandemics that may arise in the future – could negatively affect global economies and markets in ways that cannot necessarily be foreseen. In addition, the impact of infectious illness outbreaks and epidemics in emerging market countries may be greater due to generally less established healthcare systems, governments and financial markets. Public health crises caused by the COVID-19 outbreak may exacerbate other pre-existing political, social and economic risks in certain countries or globally. The disruptions caused by COVID-19 could prevent the Fund from executing advantageous investment decisions in a timely manner and negatively impact the Fund’s ability to achieve its investment objective. Any such events could have a significant adverse impact on the value and risk profile of the Fund.
Columbia Dividend Income Fund | Annual Report 2022
| 29 |
Notes to Financial Statements (continued)
May 31, 2022
Shareholder concentration risk
At May 31, 2022, two unaffiliated shareholders of record owned 29.3% of the outstanding shares of the Fund in one or more accounts. The Fund has no knowledge about whether any portion of those shares was owned beneficially. Affiliated shareholders of record owned 12.7% of the outstanding shares of the Fund in one or more accounts. Subscription and redemption activity by concentrated accounts may have a significant effect on the operations of the Fund. In the case of a large redemption, the Fund may be forced to sell investments at inopportune times, including its liquid positions, which may result in Fund losses and the Fund holding a higher percentage of less liquid positions. Large redemptions could result in decreased economies of scale and increased operating expenses for non-redeeming Fund shareholders.
Note 10. Subsequent events
Management has evaluated the events and transactions that have occurred through the date the financial statements were issued and noted no items requiring adjustment of the financial statements or additional disclosure.
Note 11. Information regarding pending and settled legal proceedings
Ameriprise Financial and certain of its affiliates are involved in the normal course of business in legal proceedings which include regulatory inquiries, arbitration and litigation, including class actions concerning matters arising in connection with the conduct of its activities as a diversified financial services firm. Ameriprise Financial believes that the Fund is not currently the subject of, and that neither Ameriprise Financial nor any of its affiliates are the subject of, any pending legal, arbitration or regulatory proceedings that are likely to have a material adverse effect on the Fund or the ability of Ameriprise Financial or its affiliates to perform under their contracts with the Fund. Ameriprise Financial is required to make quarterly (10-Q), annual (10-K) and, as necessary, 8-K filings with the Securities and Exchange Commission (SEC) on legal and regulatory matters that relate to Ameriprise Financial and its affiliates. Copies of these filings may be obtained by accessing the SEC website at www.sec.gov.
There can be no assurance that these matters, or the adverse publicity associated with them, will not result in increased Fund redemptions, reduced sale of Fund shares or other adverse consequences to the Fund. Further, although we believe proceedings are not likely to have a material adverse effect on the Fund or the ability of Ameriprise Financial or its affiliates to perform under their contracts with the Fund, these proceedings are subject to uncertainties and, as such, we are unable to estimate the possible loss or range of loss that may result. An adverse outcome in one or more of these proceedings could result in adverse judgments, settlements, fines, penalties or other relief that could have a material adverse effect on the consolidated financial condition or results of operations of Ameriprise Financial or one or more of its affiliates that provides services to the Fund.
| 30 | Columbia Dividend Income Fund | Annual Report 2022 |
Report of Independent Registered Public Accounting Firm
To the Board of Trustees of Columbia Funds Series Trust I and Shareholders of Columbia Dividend Income Fund
Opinion on the Financial Statements
We have audited the accompanying statement of assets and liabilities, including the portfolio of investments, of Columbia Dividend Income Fund (one of the funds constituting Columbia Funds Series Trust I, referred to hereafter as the "Fund") as of May 31, 2022, the related statement of operations for the year ended May 31, 2022, the statement of changes in net assets for each of the two years in the period ended May 31, 2022, including the related notes, and the financial highlights for each of the five years in the period ended May 31, 2022 (collectively referred to as the "financial statements"). In our opinion, the financial statements present fairly, in all material respects, the financial position of the Fund as of May 31, 2022, the results of its operations for the year then ended, the changes in its net assets for each of the two years in the period ended May 31, 2022 and the financial highlights for each of the five years in the period ended May 31, 2022 in conformity with accounting principles generally accepted in the United States of America.
Basis for Opinion
These financial statements are the responsibility of the Fund’s management. Our responsibility is to express an opinion on the Fund’s financial statements based on our audits. We are a public accounting firm registered with the Public Company Accounting Oversight Board (United States) (PCAOB) and are required to be independent with respect to the Fund in accordance with the U.S. federal securities laws and the applicable rules and regulations of the Securities and Exchange Commission and the PCAOB.
We conducted our audits of these financial statements in accordance with the standards of the PCAOB. Those standards require that we plan and perform the audit to obtain reasonable assurance about whether the financial statements are free of material misstatement, whether due to error or fraud.
Our audits included performing procedures to assess the risks of material misstatement of the financial statements, whether due to error or fraud, and performing procedures that respond to those risks. Such procedures included examining, on a test basis, evidence regarding the amounts and disclosures in the financial statements. Our audits also included evaluating the accounting principles used and significant estimates made by management, as well as evaluating the overall presentation of the financial statements. Our procedures included confirmation of securities owned as of May 31, 2022 by correspondence with the custodian and transfer agent. We believe that our audits provide a reasonable basis for our opinion.
/s/PricewaterhouseCoopers LLP
Minneapolis, Minnesota
July 21, 2022
We have served as the auditor of one or more investment companies within the Columbia Funds Complex since 1977.
Columbia Dividend Income Fund | Annual Report 2022
| 31 |
Federal Income Tax Information
(Unaudited)
The Fund hereby designates the following tax attributes for the fiscal year ended May 31, 2022. Shareholders will be notified in early 2023 of the amounts for use in preparing 2022 income tax returns.
Qualified
dividend
income | Dividends
received
deduction | Capital
gain
dividend |
| 100.00% | 100.00% | $487,828,649 |
Qualified dividend income. For taxable, non-corporate shareholders, the percentage of ordinary income distributed during the fiscal year that represents qualified dividend income subject to reduced tax rates.
Dividends received deduction. The percentage of ordinary income distributed during the fiscal year that qualifies for the corporate dividends received deduction.
Capital gain dividend. The Fund designates as a capital gain dividend the amount reflected above, or if subsequently determined to be different, the net capital gain of such fiscal period.
TRUSTEES AND OFFICERS
(Unaudited)
The Board oversees the Fund’s operations and appoints officers who are responsible for day-to-day business decisions based on policies set by the Board. The following table provides basic biographical information about the Fund’s Trustees as of the printing of this report, including their principal occupations during the past five years, although specific titles for individuals may have varied over the period. The year set forth beneath Length of Service in the table below is the year in which the Trustee was first appointed or elected as Trustee to any Fund currently in the Columbia Funds Complex or a predecessor thereof. Under current Board policy, each Trustee generally serves until December 31 of the year such Trustee turns seventy-five (75).
Independent trustees
Name,
address,
year of birth | Position held
with the Columbia Funds and
length of service | Principal occupation(s)
during past five years
and other relevant
professional experience | Number of
Funds in the
Columbia Funds
Complex*
overseen | Other directorships
held by Trustee
during the past
five years |
George S. Batejan
c/o Columbia Management
Investment Advisers, LLC
290 Congress Street
Boston, MA 02210
1953 | Trustee since 2017 | Executive Vice President, Global Head of Technology and Operations, Janus Capital Group, Inc., 2010-2016 | 176 | Former Chairman of the Board, NICSA (National Investment Company Services Association) (Executive Committee, Nominating Committee and Governance Committee), 2014-2016; former Director, Intech Investment Management, 2011-2016; former Board Member, Metro Denver Chamber of Commerce, 2015-2016; former Advisory Board Member, University of Colorado Business School, 2015-2018 |
| 32 | Columbia Dividend Income Fund | Annual Report 2022 |
TRUSTEES AND OFFICERS (continued)
(Unaudited)
Independent trustees (continued)
Name,
address,
year of birth | Position held
with the Columbia Funds and
length of service | Principal occupation(s)
during past five years
and other relevant
professional experience | Number of
Funds in the
Columbia Funds
Complex*
overseen | Other directorships
held by Trustee
during the past
five years |
Kathleen Blatz
c/o Columbia Management
Investment Advisers, LLC
290 Congress Street
Boston, MA 02210
1954 | Trustee since 2006 | Attorney, specializing in arbitration and mediation; Chief Justice, Minnesota Supreme Court, 1998-2006; Associate Justice, Minnesota Supreme Court, 1996-1998; Fourth Judicial District Court Judge, Hennepin County, 1994-1996; Attorney in private practice and public service, 1984-1993; State Representative, Minnesota House of Representatives, 1979-1993, which included service on the Tax and Financial Institutions and Insurance Committees; Member and Interim Chair, Minnesota Sports Facilities Authority, January 2017-July 2017; Interim President and Chief Executive Officer, Blue Cross and Blue Shield of Minnesota (health care insurance), February-July 2018, April-October 2021 | 176 | Former Trustee, Blue Cross and Blue Shield of Minnesota, 2009-2021 (Chair of the Business Development Committee, 2014-2017; Chair of the Governance Committee, 2017-2019); former Member and Chair of the Board, Minnesota Sports Facilities Authority, January 2017-July 2017; former Director, Robina Foundation, 2009-2020 (Chair, 2014-2020); Director, Schulze Family Foundation, since 2021 |
Pamela G. Carlton
c/o Columbia Management
Investment Advisers, LLC
290 Congress Street
Boston, MA 02210
1954 | Trustee since 2007 | President, Springboard — Partners in Cross Cultural Leadership (consulting company) since 2003; Managing Director of US Equity Research, JP Morgan Chase, 1999-2003; Director of US Equity Research, Chase Asset Management, 1996-1999; Co-Director Latin America Research, 1993-1996, COO Global Research, 1992-1996, Co-Director of US Research, 1991-1992, Investment Banker, 1982-1991, Morgan Stanley; Attorney, Cleary Gottlieb Steen & Hamilton LLP, 1980-1982 | 176 | Trustee, New York Presbyterian Hospital Board (Executive Committee and Chair of People Committee) since 1996; Director, DR Bank (Audit Committee) since 2017; Director, Evercore Inc. (Audit Committee) since 2019; Director, Apollo Commercial Real Estate Finance, Inc. since 2021; the Governing Council of the Independent Directors Council (IDC), since 2021 |
Janet Langford Carrig
c/o Columbia Management
Investment Advisers, LLC
290 Congress Street
Boston, MA 02210
1957 | Trustee since 1996 | Senior Vice President, General Counsel and Corporate Secretary, ConocoPhillips (independent energy company), September 2007-October 2018 | 174 | Director, EQT Corporation (natural gas producer) since 2019 |
J. Kevin Connaughton
c/o Columbia Management
Investment Advisers, LLC
290 Congress Street
Boston, MA 02210
1964 | Trustee since 2020 | Member, FINRA National Adjudicatory Council since January 2020; Adjunct Professor of Finance, Bentley University since January 2018; Consultant to Independent Trustees of CFVIT and CFST I from March 2016 to June 2020 with respect to CFVIT and to December 2020 with respect to CFST I; Managing Director and General Manager of Mutual Fund Products, Columbia Management Investment Advisers, LLC, May 2010-February 2015; President, Columbia Funds, 2008-2015; and senior officer of Columbia Funds and affiliated funds, 2003-2015 | 174 | Former Director, The Autism Project, March 2015-December 2021; former Member of the Investment Committee, St. Michael’s College, November 2015-February 2020; former Trustee, St. Michael’s College, June 2017-September 2019; former Trustee, New Century Portfolios, January 2015-December 2017 |
Columbia Dividend Income Fund | Annual Report 2022
| 33 |
TRUSTEES AND OFFICERS (continued)
(Unaudited)
Independent trustees (continued)
Name,
address,
year of birth | Position held
with the Columbia Funds and
length of service | Principal occupation(s)
during past five years
and other relevant
professional experience | Number of
Funds in the
Columbia Funds
Complex*
overseen | Other directorships
held by Trustee
during the past
five years |
Olive M. Darragh
c/o Columbia Management
Investment Advisers, LLC
290 Congress Street
Boston, MA 02210
1962 | Trustee since 2020 | Managing Director of Darragh Inc. (strategy and talent management consulting firm) since 2010; Founder and CEO, Zolio, Inc. (investment management talent identification platform) since 2004; Consultant to Independent Trustees of CFVIT and CFST I from June 2019 to June 2020 with respect to CFVIT and to December 2020 with respect to CFST I; Partner, Tudor Investments, 2004-2010; Senior Partner, McKinsey & Company (consulting), 1990-2004; Touche Ross CPA, 1985-1988 | 174 | Former Director, University of Edinburgh Business School (Member of US Board); former Director, Boston Public Library Foundation |
Patricia M. Flynn
c/o Columbia Management
Investment Advisers, LLC
290 Congress Street
Boston, MA 02210
1950 | Trustee since 2004 | Trustee Professor of Economics and Management, Bentley University since 1976 (also teaches and conducts research on corporate governance); Dean, McCallum Graduate School of Business, Bentley University, 1992-2002 | 176 | Trustee, MA Taxpayers Foundation since 1997; former Board of Governors, Innovation Institute, MA Technology Collaborative, 2010-2020; former Board of Directors, The MA Business Roundtable, 2003-2019 |
Brian J. Gallagher
c/o Columbia Management
Investment Advisers, LLC
290 Congress Street
Boston, MA 02210
1954 | Trustee since 2017 | Retired; Partner with Deloitte & Touche LLP and its predecessors, 1977-2016 | 176 | Trustee, Catholic Schools Foundation since 2004 |
Douglas A. Hacker
c/o Columbia Management
Investment Advisers, LLC
290 Congress Street
Boston, MA 02210
1955 | Co-Chair since 2021; Chair of CFST I and CFVIT since 2014; Trustee of CFST I and CFVIT since 1996 and CFST, CFST II, CFVST II, CET I and CET II since 2021 | Independent business executive since May 2006; Executive Vice President – Strategy of United Airlines, December 2002 - May 2006; President of UAL Loyalty Services (airline marketing company), September 2001-December 2002; Executive Vice President and Chief Financial Officer of United Airlines, July 1999-September 2001 | 176 | Director, Spartan Nash Company (food distributor); Director, Aircastle Limited (Chair of Audit Committee) (aircraft leasing); former Director, Nash Finch Company (food distributor), 2005-2013; former Director, SeaCube Container Leasing Ltd. (container leasing), 2010-2013; and former Director, Travelport Worldwide Limited (travel information technology), 2014-2019 |
Nancy T. Lukitsh
c/o Columbia Management
Investment Advisers, LLC
290 Congress Street
Boston, MA 02210
1956 | Trustee since 2011 | Senior Vice President, Partner and Director of Marketing, Wellington Management Company, LLP (investment adviser), 1997-2010; Chair, Wellington Management Portfolios (commingled non-U.S. investment pools), 2007 -2010; Director, Wellington Trust Company, NA and other Wellington affiliates, 1997-2010 | 174 | None |
| 34 | Columbia Dividend Income Fund | Annual Report 2022 |
TRUSTEES AND OFFICERS (continued)
(Unaudited)
Independent trustees (continued)
Name,
address,
year of birth | Position held
with the Columbia Funds and
length of service | Principal occupation(s)
during past five years
and other relevant
professional experience | Number of
Funds in the
Columbia Funds
Complex*
overseen | Other directorships
held by Trustee
during the past
five years |
David M. Moffett
c/o Columbia Management
Investment Advisers, LLC
290 Congress Street
Boston, MA 02210
1952 | Trustee since 2011 | Retired; Consultant to Bridgewater and Associates | 174 | Director, CSX Corporation (transportation suppliers); Director, Genworth Financial, Inc. (financial and insurance products and services); Director, PayPal Holdings Inc. (payment and data processing services); Trustee, University of Oklahoma Foundation; former Director, eBay Inc. (online trading community), 2007-2015; and former Director, CIT Bank, CIT Group Inc. (commercial and consumer finance), 2010-2016 |
Catherine James Paglia
c/o Columbia Management
Investment Advisers, LLC
290 Congress Street
Boston, MA 02210
1952 | Co-Chair since 2021; Chair of CFST, CFST II, CFVST II, CET I and CET II since 2020; Trustee of CFST, CFST II and CFVST II since 2004 and CFST I and CFVIT since 2021 | Director, Enterprise Asset Management, Inc. (private real estate and asset management company) since September 1998; Managing Director and Partner, Interlaken Capital, Inc., 1989-1997; Vice President, 1982-1985, Principal, 1985-1987, Managing Director, 1987-1989, Morgan Stanley; Vice President, Investment Banking, 1980-1982, Associate, Investment Banking, 1976-1980, Dean Witter Reynolds, Inc. | 176 | Director, Valmont Industries, Inc. (irrigation systems manufacturer) since 2012; Trustee, Carleton College (on the Investment Committee); Trustee, Carnegie Endowment for International Peace (on the Investment Committee) |
Minor M. Shaw
c/o Columbia Management
Investment Advisers, LLC
290 Congress Street
Boston, MA 02210
1947 | Trustee since 2003 | President, Micco LLC (private investments) since 2011; President, Micco Corp. (family investment business), 1998-2011 | 176 | Director, Blue Cross Blue Shield of South Carolina (Chair of Compensation Committee) since April 2008; Trustee, Hollingsworth Funds (on the Investment Committee) since 2016 (previously Board Chair from 2016-2019); Former Advisory Board member, Duke Energy Corp., 2016-2020; Chair of the Duke Endowment; Chair of Greenville – Spartanburg Airport Commission; former Trustee, BofA Funds Series Trust (11 funds), 2003-2011; former Director, Piedmont Natural Gas, 2004-2016; former Director, National Association of Corporate Directors, Carolinas Chapter, 2013-2018; Chair, Daniel-Mickel Foundation since 1998 |
Columbia Dividend Income Fund | Annual Report 2022
| 35 |
TRUSTEES AND OFFICERS (continued)
(Unaudited)
Independent trustees (continued)
Name,
address,
year of birth | Position held
with the Columbia Funds and
length of service | Principal occupation(s)
during past five years
and other relevant
professional experience | Number of
Funds in the
Columbia Funds
Complex*
overseen | Other directorships
held by Trustee
during the past
five years |
Natalie A. Trunow
c/o Columbia Management
Investment Advisers, LLC
290 Congress Street
Boston, MA 02210
1967 | Trustee since 2020 | Chief Executive Officer, Millennial Portfolio Solutions LLC (asset management and consulting services), January 2016-January 2021; Non-executive Member of the Investment Committee and Valuation Committee, Sarona Asset Management Inc. (private equity firm) since September 2019; Advisor, Horizon Investments (asset management and consulting services), August 2018-January 2021; Advisor, Paradigm Asset Management, November 2016-December 2021; Consultant to Independent Trustees of CFVIT and CFST I from September 2016 to June 2020 with respect to CFVIT and to December 2020 with respect to CFST I; Director of Investments/Consultant, Casey Family Programs, April 2016-November 2016; Senior Vice President and Chief Investment Officer, Calvert Investments, August 2008-January 2016; Section Head and Portfolio Manager, General Motors Asset Management, June 1997-August 2008 | 174 | Former Director, Investment Committee, Health Services for Children with Special Needs, Inc., 2012-2019; Director, Chair of Audit Committee, Consumer Credit Counseling Services (formerly Guidewell Financial Solutions), since 2019; Independent Director, Investment Committee and Valuation Committee, Sarona Asset Management, since 2019 |
Sandra L. Yeager
c/o Columbia Management
Investment Advisers, LLC
290 Congress Street
Boston, MA 02210
1964 | Trustee since 2017 | Retired; President and founder, Hanoverian Capital, LLC (SEC registered investment advisor firm), 2008-2016; Managing Director, DuPont Capital, 2006-2008; Managing Director, Morgan Stanley Investment Management, 2004-2006; Senior Vice President, Alliance Bernstein, 1990-2004 | 176 | Former Director, NAPE Education Foundation, October 2016-October 2020 |
| * | The term “Columbia Funds Complex” as used herein includes Columbia Seligman Premium Technology Growth Fund, Tri-Continental Corporation and each series of Columbia Fund Series Trust (CFST), Columbia Funds Series Trust I (CFST I), Columbia Funds Series Trust II (CFST II), Columbia ETF Trust I (CET I), Columbia ETF Trust II (CET II), Columbia Funds Variable Insurance Trust (CFVIT) and Columbia Funds Variable Series Trust II (CFVST II). Messrs. Batejan, Beckman, Gallagher and Hacker and Mses. Blatz, Carlton, Flynn, Paglia, Shaw and Yeager serve as Directors of Columbia Seligman Premium Technology Growth Fund and Tri-Continental Corporation. |
Interested trustee affiliated with Investment Manager*
Name,
address,
year of birth | Position held with the Columbia Funds and length of service | Principal occupation(s) during the
past five years and other relevant
professional experience | Number of
Funds in the
Columbia Funds
Complex overseen | Other directorships
held by Trustee
during the past
five years |
Daniel J. Beckman
c/o Columbia Management
Investment Advisers, LLC
290 Congress Street
Boston, MA 02210
1962 | Trustee since November 2021 and President since June 2021 | Vice President – Head of North America Product, Columbia Management Investment Advisers, LLC since April 2015; President and Principal Executive Officer of the Columbia Funds since June 2021; officer of Columbia Funds and affiliated funds, 2020-2021 | 176 | Director, Ameriprise Trust Company, since October 2016; Director, Columbia Management Investment Distributors, Inc. since November 2018; Board of Governors, Columbia Wanger Asset Management, LLC since January 2022 |
| * | Interested person (as defined under the 1940 Act) by reason of being an officer, director, security holder and/or employee of the Investment Manager or Ameriprise Financial. |
The Statement of Additional Information has additional information about the Fund’s Board members and is available, without charge, upon request by calling 800.345.6611, visiting columbiathreadneedleus.com/investor/ or contacting your financial intermediary.
| 36 | Columbia Dividend Income Fund | Annual Report 2022 |
TRUSTEES AND OFFICERS (continued)
(Unaudited)
The Board has appointed officers who are responsible for day-to-day business decisions based on policies it has established. The officers serve at the pleasure of the Board. The following table provides basic information about the Officers of the Fund as of the printing of this report, including principal occupations during the past five years, although their specific titles may have varied over the period. In addition to Mr. Beckman, who is President and Principal Executive Officer, the Fund’s other officers are:
Fund officers
Name,
address and
year of birth | Position and year
first appointed to
position for any Fund
in the Columbia
Funds Complex or a
predecessor thereof | Principal occupation(s) during past five years |
Michael G. Clarke
290 Congress Street
Boston, MA 02210
1969 | Chief Financial Officer and Principal Financial Officer (2009) and Senior Vice President (2019) | Senior Vice President and Head of Global Operations & Investor Services, Columbia Management Investment Advisers, LLC, since March 2022 (previously Vice President, Head of North American Operations, and Co-Head of Global Operations, June 2019 to February 2022 and Vice President – Accounting and Tax, May 2010 - May 2019); senior officer of Columbia Funds and affiliated funds since 2002. |
Joseph Beranek
5890 Ameriprise
Financial Center
Minneapolis, MN 55474
1965 | Treasurer and Chief Accounting Officer (Principal Accounting Officer) (2019) and Principal Financial Officer (2020), CFST, CFST I, CFST II, CFVIT and CFVST II; Assistant Treasurer, CET I and CET II | Vice President – Mutual Fund Accounting and Financial Reporting, Columbia Management Investment Advisers, LLC, since December 2018 and March 2017, respectively (previously Vice President – Pricing and Corporate Actions, May 2010 - March 2017). |
Marybeth Pilat
290 Congress Street
Boston, MA 02210
1968 | Treasurer and Chief Accounting Officer (Principal Accounting Officer) and Principal Financial Officer (2020) for CET I and CET II; Assistant Treasurer, CFST, CFST I, CFST II, CFVIT and CFVST II | Vice President – Product Pricing and Administration, Columbia Management Investment Advisers, LLC, since May 2017; Director - Fund Administration, Calvert Investments, August 2015 – March 2017; Vice President - Fund Administration, Legg Mason, May 2015 - July 2015; Vice President - Fund Administration, Columbia Management Investment Advisers, LLC, May 2010 - April 2015. |
William F. Truscott
290 Congress Street
Boston, MA 02210
1960 | Senior Vice President (2001) | Formerly, Trustee/Director of Columbia Funds Complex or legacy funds, November 2001-January 1, 2021; Chief Executive Officer, Global Asset Management, Ameriprise Financial, Inc. since September 2012; Chairman of the Board and President, Columbia Management Investment Advisers, LLC since July 2004 and February 2012, respectively; Chairman of the Board and Chief Executive Officer, Columbia Management Investment Distributors, Inc. since November 2008 and February 2012, respectively; Chairman of the Board and Director, Threadneedle Asset Management Holdings, Sàrl since March 2013 and December 2008, respectively; senior executive of various entities affiliated with Columbia Threadneedle. |
Christopher O. Petersen
5228 Ameriprise Financial Center
Minneapolis, MN 55474
1970 | Senior Vice President and Assistant Secretary (2021) | Formerly, Trustee/Director of funds within the Columbia Funds Complex, July 1, 2020 - November 22, 2021; Senior Vice President and Assistant General Counsel, Ameriprise Financial, Inc. since September 2021 (previously Vice President and Lead Chief Counsel, January 2015 - September 2021); formerly, President and Principal Executive Officer of the Columbia Funds, 2015 - 2021; officer of Columbia Funds and affiliated funds since 2007. |
Thomas P. McGuire
290 Congress Street
Boston, MA 02210
1972 | Senior Vice President and Chief Compliance Officer (2012) | Vice President – Asset Management Compliance, Ameriprise Financial, Inc., since May 2010; Chief Compliance Officer, Columbia Acorn/Wanger Funds since December 2015; formerly, Chief Compliance Officer, Ameriprise Certificate Company, September 2010 – September 2020. |
Ryan C. Larrenaga
290 Congress Street
Boston, MA 02210
1970 | Senior Vice President (2017), Chief Legal Officer (2017), and Secretary (2015) | Vice President and Chief Counsel, Ameriprise Financial, Inc. since August 2018 (previously Vice President and Group Counsel, August 2011 - August 2018); Chief Legal Officer, Columbia Acorn/Wanger Funds, since September 2020; officer of Columbia Funds and affiliated funds since 2005. |
Columbia Dividend Income Fund | Annual Report 2022
| 37 |
TRUSTEES AND OFFICERS (continued)
(Unaudited)
Fund officers (continued)
Name,
address and
year of birth | Position and year
first appointed to
position for any Fund
in the Columbia
Funds Complex or a
predecessor thereof | Principal occupation(s) during past five years |
Michael E. DeFao
290 Congress Street
Boston, MA 02210
1968 | Vice President (2011) and Assistant Secretary (2010) | Vice President and Chief Counsel, Ameriprise Financial, Inc. since May 2010; Vice President, Chief Legal Officer and Assistant Secretary, Columbia Management Investment Advisers, LLC since October 2021 (previously Vice President and Assistant Secretary, May 2010 – September 2021). |
Lyn Kephart-Strong
5228 Ameriprise
Financial Center
Minneapolis, MN 55474
1960 | Vice President (2015) | President, Columbia Management Investment Services Corp. since October 2014; Vice President & Resolution Officer, Ameriprise Trust Company since August 2009. |
Liquidity Risk Management Program
(Unaudited)
Pursuant to Rule 22e-4 under the 1940 Act, the Fund has adopted a liquidity risk management program (Program). The Program’s principal objectives include assessing, managing and periodically reviewing the Fund’s liquidity risk. Liquidity risk is defined as the risk that the Fund could not meet redemption requests without significant dilution of remaining investors’ interests in the Fund.
The Board has appointed the Investment Manager as the program administrator for the Fund’s Program. The Investment Manager has delegated oversight of the Program to its Liquidity Risk Management Committee (the Committee). At a board meeting during the fiscal period, the Committee provided the Board with a report addressing the operations of the program and assessing its adequacy and effectiveness of implementation for the period January 1, 2021, through December 31, 2021, including:
| • | the Fund had sufficient liquidity to both meet redemptions and operate effectively on behalf of shareholders; |
| • | there were no material changes to the Program during the period; |
| • | the implementation of the Program was effective to manage the Fund’s liquidity risk; and |
| • | the Program operated adequately during the period. |
There can be no assurance that the Program will achieve its objectives in the future. Please refer to the Fund’s prospectus for more information regarding the Fund’s exposure to liquidity risk and other principal risks to which an investment in the Fund may be subject.
| 38 | Columbia Dividend Income Fund | Annual Report 2022 |
[THIS PAGE INTENTIONALLY LEFT BLANK]
Columbia Dividend Income Fund
P.O. Box 219104
Kansas City, MO 64121-9104
Please read and consider the investment objectives, risks, charges and expenses for any fund carefully before investing. For a prospectus and summary prospectus, which contains this and other important information about the Fund, go to
columbiathreadneedleus.com/investor/. The Fund is distributed by Columbia Management Investment Distributors, Inc., member FINRA, and managed by Columbia Management Investment Advisers, LLC.
Columbia Threadneedle Investments (Columbia Threadneedle) is the global brand name of the Columbia and Threadneedle group of companies. All rights reserved.
© 2022 Columbia Management Investment Advisers, LLC.
columbiathreadneedleus.com/investor/
Form N-CSR Items – period ended 5/31/2022
Columbia Funds Series Trust I
Item 1. Reports to Stockholders.
[Insert shareholder report.]
Item 2. Code of Ethics.
(a) | The registrant has adopted a code of ethics that applies to the registrant’s principal executive officer, principal financial officer, principal accounting officer or controller, or persons performing similar functions, regardless of whether these individuals are employed by the registrant or a third party. |
(b) | During the period covered by this report, there were not any amendments to a provision of the code of ethics that applies to the registrant’s principal executive officer, principal financial officer, principal accounting officer or controller, or persons performing similar functions, regardless of whether these individuals are employed by the registrant or a third party, and that relates to any element of the code of ethics definition enumerated in paragraph (b) of this Item. |
(c) | During the period covered by this report, there were no waivers, including any implicit waivers, from a provision of the code of ethics to the registrant’s principal executive officer, principal financial officer, principal accounting officer or controller, or persons performing similar functions, regardless of whether these individuals are employed by the registrant or a third party that relates to one or more of the items set forth in paragraph (b) of this Item. |
Item 3. Audit Committee Financial Expert.
The registrant’s Board of Trustees has determined that David M. Moffett, Brian J. Gallagher, J. Kevin Connaughton, and Sandra L. Yeager, each of whom are members of the registrant’s Board of Trustees and Audit Committee, each qualify as an audit committee financial expert. Mr. Moffett, Mr. Gallagher, Mr. Connaughton, and Ms. Yeager are each independent trustees, as defined in paragraph (a)(2) of this item’s instructions.
Item 4. Principal Accountant Fees and Services.
Fee information below is disclosed for the four series of the registrant whose reports to stockholders are included in this annual filing.
(a) Audit Fees. Aggregate Audit Fees billed by the principal accountant for professional services rendered during the fiscal years ended May 31, 2022 and May 31, 2021 are approximately as follows:
| |
2022 | 2021 |
$168,000 | $168,000 |
Audit Fees include amounts related to the audit of the registrant’s annual financial statements or services that are normally provided by the accountant in connection with statutory and regulatory filings or engagements for those fiscal years.
(b) Audit-Related Fees. Aggregate Audit-Related Fees billed to the registrant by the principal accountant for professional services rendered during the fiscal years ended May 31, 2022 and May 31, 2021 are approximately as follows:
Audit-Related Fees include amounts for assurance and related services by the principal accountant that are reasonably related to the performance of the audit of the registrant’s financial statements and are not reported in Audit Fees above.
During the fiscal years ended May 31, 2022 and May 31, 2021, there were no Audit-Related Fees billed by the registrant’s principal accountant to the registrant’s investment adviser (not including any sub-adviser whose role is primarily portfolio management and is subcontracted with or overseen by another investment adviser) and any entity controlling, controlled by, or under common control with the adviser that provides ongoing services to the registrant for an engagement that related directly to the operations and financial reporting of the registrant.
(c) Tax Fees. Aggregate Tax Fees billed by the principal accountant to the registrant for professional services rendered during the fiscal years ended May 31, 2022 and May 31, 2021 are approximately as follows:
Tax Fees include amounts for the review of annual tax returns, the review of required shareholder distribution calculations and typically include amounts for professional services by the principal accountant for tax compliance, tax advice and tax planning.
During the fiscal years ended May 31, 2022 and May 31, 2021, there were no Tax Fees billed by the registrant’s principal accountant to the registrant’s investment adviser (not including any sub-adviser whose role is primarily portfolio management and is subcontracted with or overseen by another investment adviser) and any entity controlling, controlled by, or under common control with the adviser that provides ongoing services to the registrant for an engagement that related directly to the operations and financial reporting of the registrant.
(d) All Other Fees. Aggregate All Other Fees billed by the principal accountant to the registrant for professional services rendered during the fiscal years ended May 31, 2022 and May 31, 2021 are approximately as follows:
All Other Fees include amounts for products and services provided by the principal accountant, other than the services reported in paragraphs (a) through (c) above.
Aggregate All Other Fees billed by the registrant’s principal accountant to the registrant’s investment adviser (not including any sub-adviser whose role is primarily portfolio management and is subcontracted with or overseen by another investment adviser) and any entity controlling, controlled by, or under common control with the adviser that provides ongoing services to the registrant for an engagement that related directly to the operations and financial reporting of the registrant during the fiscal years ended May 31, 2022 and May 31, 2021 are approximately as follows:
| |
2022 | 2021 |
$520,000 | $520,000 |
In fiscal years 2022 and 2021, All Other Fees primarily consists of fees billed for internal control examinations of the registrant’s transfer agent and investment adviser.
(e)(1) Audit Committee Pre-Approval Policies and Procedures
The registrant’s Audit Committee is required to pre-approve the engagement of the registrant’s independent auditors to provide audit and non-audit services to the registrant and non-audit services to its investment adviser (excluding any sub-adviser whose role is primarily portfolio management and is sub-contracted or overseen by another investment adviser (the “Adviser”) or any entity controlling, controlled by or under common control with the Adviser that provides ongoing services to the Fund (a “Control Affiliate”) if the engagement relates directly to the operations and financial reporting of the registrant.
The Audit Committee has adopted a Policy for Engagement of Independent Auditors for Audit and Non-Audit Services (the “Policy”). The Policy sets forth the understanding of the Audit Committee regarding the engagement of the registrant’s independent accountants to provide (i) audit and permissible audit-related, tax and other services to the registrant (“Fund Services”); (ii) non-audit services to the registrant’s Adviser and any Control Affiliates, that relates directly to the operations and financial reporting of a Fund (“Fund-related Adviser Services”); and (iii) certain other audit and non-audit services to the registrant’s Adviser and its Control Affiliates. A service will require specific pre-approval by the Audit Committee if it is to be provided by the Fund’s independent auditor; provided, however, that pre-approval of non-audit services to the Fund, the Adviser or Control Affiliates may be waived if certain de minimis requirements set forth in the SEC’s rules are met.
Under the Policy, the Audit Committee may delegate pre-approval authority to any pre-designated member or members who are independent board members. The member(s) to whom such authority is delegated must report, for informational purposes only, any pre-approval decisions to the Audit Committee at its next regular meeting. The Audit Committee's responsibilities with respect to the pre-approval of services performed by the independent auditor may not be delegated to management.
| On an annual basis, at a regularly scheduled Audit Committee meeting, the Fund’s Treasurer or other Fund officer shall submit to the Audit Committee a schedule of the types of Fund Services and Fund-related Adviser Services that are subject to specific pre-approval. This schedule will provide a description of each type of service that is subject to specific pre-approval, along with total projected fees for each service. The pre-approval will generally cover a one-year period. The Audit Committee will review and approve the types of services and the projected fees for the next one-year period and may add to, or subtract from, the list of pre-approved services from time to time, based on subsequent determinations. This specific approval acknowledges that the Audit Committee is in agreement with the specific types of services that the independent auditor will be permitted to perform and the projected fees for each service. |
The Fund’s Treasurer or other Fund officer shall report to the Audit Committee at each of its regular meetings regarding all Fund Services or Fund-related Adviser Services provided since the last such report was rendered, including a description of the services, by category, with forecasted fees for the annual reporting period, proposed changes requiring specific pre-approval and a description of services provided by the independent auditor, by category, with actual fees during the current reporting period.
*****
(e)(2) None, or 0%, of the Audit-Related Fees, Tax Fees and All Other Fees paid by the Fund or affiliated entities relating directly to the operations and financial reporting of the Registrant disclosed above were approved by the audit committee pursuant to paragraphs (c)(7)(i)(C) of Rule 2-01 of Regulation S-X (which permits audit committee approval after the start of the engagement with respect to services other than audit, review or attest services, if certain conditions are satisfied).
(f) Not applicable.
(g) The aggregate non-audit fees billed by the registrant’s accountant for services rendered to the registrant, and rendered to the registrant’s investment adviser (not including any sub-adviser whose role is primarily portfolio management and is subcontracted with or overseen by another investment adviser), and any entity controlling, controlled by, or under common control with the adviser that provides ongoing services to the registrant for the fiscal years ended May 31, 2022 and May 31, 2021 are approximately as follows:
| |
2022 | 2021 |
$527,800 | $520,000 |
(h) The registrant’s Audit Committee of the Board of Directors has considered whether the provision of non-audit services that were rendered to the registrant’s adviser (not including any sub-adviser whose role is primarily portfolio management and is subcontracted with or overseen by another investment adviser), and any entity controlling, controlled by, or under common control with the investment adviser that provides ongoing services to the registrant that were not pre-approved pursuant to paragraph (c)(7)(ii) of Rule 2-01 of Regulation S-X, is compatible with maintaining the principal accountant’s independence.
Item 5. Audit Committee of Listed Registrants.
Not applicable.
Item 6. Investments
(a) | The registrant’s “Schedule I – Investments in securities of unaffiliated issuers” (as set forth in 17 CFR 210.12-12) is included in Item 1 of this Form N-CSR. |
Item 7. Disclosure of Proxy Voting Policies and Procedures for Closed-End Management Investment Companies.
Not applicable.
Item 8. Portfolio Managers of Closed-End Management Investment Companies.
Not applicable.
Item 9. Purchases of Equity Securities by Closed-End Management Investment Company and Affiliated Purchasers.
Not applicable.
Item 10. Submission of Matters to a Vote of Security Holders.
There were no material changes to the procedures by which shareholders may recommend nominees to the registrant's board of directors.
Item 11. Controls and Procedures.
(c) | The registrant’s principal executive officer and principal financial officer, based on their evaluation of the registrant’s disclosure controls and procedures as of a date within 90 days of the filing of this report, have concluded that such controls and procedures are adequately designed to ensure that information required to be disclosed by the registrant in Form N-CSR is accumulated and communicated to the registrant’s management, including the principal executive officer and principal financial officer, or persons performing similar functions, as appropriate to allow timely decisions regarding required disclosure. |
(d) | There was no change in the registrant's internal control over financial reporting that occurred during the period covered by this report that has materially affected, or is reasonably likely to materially affect, the registrant's internal control over financial reporting. |
Item 12. Disclosure of Securities Lending Activities for Closed-End Management Investment Companies
Not applicable.
Item 13. Exhibits.
(a)(1) Code of ethics required to be disclosed under Item 2 of Form N-CSR attached hereto as Exhibit 99.CODE ETH.
(a)(2) Certifications pursuant to Rule 30a-2(a) under the Investment Company Act of 1940 (17 CFR 270.30a-2(a)) attached hereto as Exhibit 99.CERT.
(b) Certification pursuant to Rule 30a-2(b) under the Investment Company Act of 1940 (17 CFR 270.30a-2(b)) attached hereto as Exhibit 99.906CERT.
SIGNATURES
Pursuant to the requirements of the Securities Exchange Act of 1934 and the Investment Company Act of 1940, the registrant has duly caused this report to be signed on its behalf by the undersigned, thereunto duly
authorized. | | |
(registrant) | | Columbia Funds Series Trust I | |
By (Signature and Title) | /s/ Daniel J. Beckman | |
| | | Daniel J. Beckman, President and Principal Executive Officer | |
Date | | July 21, 2022 | |
Pursuant to the requirements of the Securities Exchange Act of 1934 and the Investment Company Act of 1940, this report has been signed below by the following persons on behalf of the registrant and in the capacities and on the dates indicated.
| | | | |
By (Signature and Title) | /s/ Daniel J. Beckman |
| | Daniel J. Beckman, President and Principal Executive Officer |
Date | | July 21, 2022 | |
By (Signature and Title) | /s/ Michael G. Clarke |
| | Michael G. Clarke, Chief Financial Officer, Principal Financial Officer |
| | and Senior Vice President |
Date | | July 21, 2022 | |
By (Signature and Title) | /s/ Joseph Beranek |
| | Joseph Beranek, Treasurer, Chief Accounting Officer and Principal |
| | Financial Officer |
Date | | July 21, 2022 | |